

Form 10-K GLACIER BANCORP, INC. For: Dec 31
 Tweet
Tweet Share
ShareUNITED STATES
SECURITIES AND EXCHANGE COMMISSION
Washington, D.C. 20549
________________________________________________________________________________________________________________________
FORM 10-K
________________________________________________________________________________________________________________________
For the fiscal year ended December 31 , 2020
For the transition period from __________ to __________
Commission file number 000-18911
________________________________________________________________________________________________________________________
(Exact name of registrant as specified in its charter)
________________________________________________________________________________________________________________________
| (State or other jurisdiction of incorporation or organization) | (IRS Employer Identification No.) | ||||||||||
| (Address of principal executive offices) | (Zip Code) | ||||||||||
| (Registrant’s telephone number, including area code) | |||||||||||
________________________________________________________________________________________________________________________
Securities registered pursuant to Section 12(b) of the Act:
| Title of each class | Trading Symbol(s) | Name of each exchange on which registered | ||||||
Indicate by check mark if the registrant is a well-known seasoned issuer, as defined in Rule 405 of the Securities Act. ☒ Yes ☐ No
Indicate by check mark if the registrant is not required to file reports pursuant to Section 13 or Section 15(d) of the Act. ☐ Yes ☒ No
Indicate by check mark whether the registrant (1) has filed all reports required to be filed by Section 13 or 15(d) of the Securities Exchange Act of 1934 during the preceding 12 months (or for such shorter period that the registrant was required to file such reports), and (2) has been subject to such filing requirements for the past 90 days. ☒ Yes ☐ No
Indicate by check mark whether the registrant has submitted electronically every Interactive Data File required to be submitted pursuant to Rule 405 of Regulation S-T (§ 232.405 of this Chapter) during the preceding 12 months (or for such shorter period that the registrant was required to submit such files). ☒ Yes ☐ No
Indicate by check mark whether the registrant is a large accelerated filer, an accelerated filer, a non-accelerated filer, a smaller reporting company, or an emerging growth company. See the definitions of “large accelerated filer,” “accelerated filer,” “smaller reporting company,” and “emerging growth company” in Rule 12b-2 of the Exchange Act.
| ☒ | Accelerated filer | ☐ | ||||||||||||
| Non-accelerated filer | ☐ | Smaller reporting company | ||||||||||||
| Emerging growth company | ||||||||||||||
If an emerging growth company, indicate by check mark if the registrant has elected not to use the extended transition period for complying with any new or revised financial accounting standards provided pursuant to Section 13(a) of the Exchange Act. ☐
Indicate by check mark whether the registrant has filed a report on and attestation to its management’s assessment of the effectiveness of its internal control over financial reporting under Section 404(b) of the Sarbanes-Oxley Act (15 U.S.C. 7262(b)) by the registered public accounting firm that prepared or issued its audit report. ☒
Indicate by check mark whether the registrant is a shell company (as defined in Rule 12b-2 of the Act). ☐ Yes ☒ No
The aggregate market value of the voting common equity held by non-affiliates at June 30, 2020 (the last business day of the registrant’s most recently completed second fiscal quarter), was $3,355,430,758 (based on the average bid and asked price as quoted on the NASDAQ Global Select Market as of the close of business on that date).
The number of shares of registrant’s common stock outstanding on February 2, 2021 was 95,426,364 . No preferred shares are issued or outstanding.
Document Incorporated by Reference
TABLE OF CONTENTS
| Page | ||||||||
| PART I | ||||||||
| Item 1 | ||||||||
| Item 1A | ||||||||
| Item 1B | ||||||||
| Item 2 | ||||||||
| Item 3 | ||||||||
| Item 4 | ||||||||
| PART II | ||||||||
| Item 5 | ||||||||
| Item 6 | ||||||||
| Item 7 | ||||||||
| Item 7A | ||||||||
| Item 8 | ||||||||
| Item 9 | ||||||||
| Item 9A | ||||||||
| Item 9B | ||||||||
| PART III | ||||||||
| Item 10 | ||||||||
| Item 11 | ||||||||
| Item 12 | ||||||||
| Item 13 | ||||||||
| Item 14 | ||||||||
| PART IV | ||||||||
| Item 15 | ||||||||
| Item 16 | ||||||||
| SIGNATURES | ||||||||
ABBREVIATIONS/ACRONYMS
ACL – allowance for credit losses | GAAP – accounting principles generally accepted in the | ||||
ALCO – Asset Liability Committee | United States of America | ||||
ARRC – Alternative Reference Rates Committee | GDP - Gross domestic product | ||||
ASC – Accounting Standards CodificationTM | Ginnie Mae – Government National Mortgage Association | ||||
ASU – Accounting Standards Update | GLBA – Gramm-Leach-Bliley Financial Services | ||||
ATM – automated teller machine | Modernization Act of 1999 | ||||
Bank – Glacier Bank | Heritage – Heritage Bancorp and its subsidiary, Heritage Bank of Nevada | ||||
Basel III – third installment of the Basel Accords | HTM - Held-to-maturity | ||||
BHCA – Bank Holding Company Act of 1956, as amended | Interest rate locks – residential real estate derivatives for commitments | ||||
Board – Glacier Bancorp, Inc.’s Board of Directors | Interstate Act – Riegle-Neal Interstate Banking and Branching | ||||
bp or bps – basis point(s) | Efficiency Act of 1994 | ||||
BSA – Bank Secrecy Act | IRS – Internal Revenue Service | ||||
CARES Act - Coronavirus Aid, Relief, and Economic Security Act | KWB NASDAQ Regional Banking Index - KBW Regional | ||||
CDE – Certified Development Entity | Banking Index | ||||
CDFI Fund – Community Development Financial Institutions Fund | LIBOR – London Interbank Offered Rate | ||||
CEO – Chief Executive Officer | LIHTC – Low-Income Housing Tax Credit | ||||
CECL – current expected credit losses | MT Division of Banking – Montana Department of Administration’s | ||||
CFO – Chief Financial Officer | Division of Banking and Financial Institutions | ||||
CFPB – Consumer Financial Protection Bureau | NII – net interest income | ||||
Collegiate – Columbine Capital Corp. and its subsidiary, | NMTC – New Markets Tax Credits | ||||
| Collegiate Peaks Bank | NOW – negotiable order of withdrawal | ||||
Company – Glacier Bancorp, Inc. | NRSRO – Nationally Recognized Statistical Rating Organizations | ||||
COSO – Committee of Sponsoring Organizations of the | OCI – other comprehensive income | ||||
| Treadway Commission | OREO – other real estate owned | ||||
COVID-19 – coronavirus disease of 2019 | Patriot Act – Uniting and Strengthening America by Providing Appropriate | ||||
CRA – Community Reinvestment Act of 1977 | Tools Required to Intercept and Obstruct Terrorism Act of 2001 | ||||
DDA – demand deposit account | PCAOB – Public Company Accounting Oversight Board (United States) | ||||
DIF – federal Deposit Insurance Fund | PCD – purchased credit-deteriorated | ||||
Dodd-Frank Act – Dodd-Frank Wall Street Reform and | PPP – Paycheck Protection Program | ||||
| Consumer Protection Act of 2010 | Proxy Statement – the 2021 Annual Meeting Proxy Statement | ||||
EGRRC Act – Economic Growth, Regulatory Relief, and Consumer | Repurchase agreements – securities sold under agreements | ||||
| Protection Act | to repurchase | ||||
Fannie Mae – Federal National Mortgage Association | ROU – right-of-use | ||||
FASB – Financial Accounting Standards Board | S&P – Standard and Poor’s | ||||
FDIC – Federal Deposit Insurance Corporation | SBA – United States Small Business Administration | ||||
FHLB – Federal Home Loan Bank | SBAZ – State Bank Corp. and its subsidiary, State Bank of Arizona | ||||
Final Rules – final rules implemented by the federal banking | SEC – United States Securities and Exchange Commission | ||||
| agencies that amended regulatory risk-based capital rules | SERP – Supplemental Executive Retirement Plan | ||||
FNB – FNB Bancorp and its subsidiary, The First National Bank | SOFR – Secured Overnight Financing Rate | ||||
| of Layton | SOX Act – Sarbanes-Oxley Act of 2002 | ||||
FRB – Federal Reserve Bank | Tax Act – The Tax Cuts and Jobs Act | ||||
Freddie Mac – Federal Home Loan Mortgage Corporation | TBA – to-be-announced | ||||
FSB – Inter-Mountain Bancorp., Inc., and its subsidiary, | TDR – troubled debt restructuring | ||||
| First Security Bank | VIE – variable interest entity | ||||
PART I
Item 1. Business
General
Glacier Bancorp, Inc., headquartered in Kalispell, Montana, is a Montana corporation incorporated in 2004 as a successor corporation to the Delaware corporation originally incorporated in 1990. The terms “Company,” "we," "us" and "our" mean Glacier Bancorp, Inc. and its subsidiaries, when appropriate. The Company is a publicly-traded company and its common stock trades on the NASDAQ Global Select Market under the symbol GBCI. We provide a full range of banking services to individuals and businesses from 193 locations in Montana, Idaho, Utah, Washington, Wyoming, Colorado, Arizona and Nevada through our wholly-owned bank subsidiary, Glacier Bank (“Bank”). We offer a wide range of banking products and services, including: 1) retail banking; 2) business banking; 3) real estate, commercial, agriculture and consumer loans; and 4) mortgage origination and loan servicing. We serve individuals, small to medium-sized businesses, community organizations and public entities. For information regarding our lending, investment and funding activities, see “Item 7. Management’s Discussion and Analysis of Financial Condition and Results of Operations.”
The Company includes the parent holding company and the Bank. As of December 31, 2020, the Bank consists of sixteen bank divisions and a corporate division. The bank divisions operate under separate names, management teams and advisory directors and include the following:
•Glacier Bank (Kalispell, Montana) with operations in Montana;
•First Security Bank of Missoula (Missoula, Montana) with operations in Montana;
•Valley Bank of Helena (Helena, Montana) with operations in Montana;
•First Security Bank (Bozeman, Montana) with operations in Montana;
•Western Security Bank (Billings, Montana) with operations in Montana;
•First Bank of Montana (Lewistown, Montana) with operations in Montana;
•Mountain West Bank (Coeur d’Alene, Idaho) with operations in Idaho and Washington;
•Citizens Community Bank (Pocatello, Idaho) with operations in Idaho;
•First Bank (Powell, Wyoming) with operations in Wyoming;
•First State Bank (Wheatland, Wyoming) with operations in Wyoming;
•North Cascades Bank (Chelan, Washington) with operations in Washington;
•Bank of the San Juans (Durango, Colorado) with operations in Colorado;
•Collegiate Peaks Bank (Buena Vista, Colorado) with operations in Colorado;
•The Foothills Bank (Yuma, Arizona) with operations in Arizona;
•First Community Bank Utah (Layton, Utah) with operations in Utah; and
•Heritage Bank of Nevada (Reno, NV) with operations in Nevada.
The corporate division includes the Bank’s investment portfolio and wholesale borrowings, and other centralized functions. We consider the Bank to be our sole operating segment.
The Bank has subsidiary interests in variable interest entities (“VIE”) for which the Bank has both the power to direct the VIE’s significant activities and the obligation to absorb losses or right to receive benefits of the VIE that could potentially be significant to the VIE. These subsidiary interests are included in the Company’s consolidated financial statements. The Bank also has subsidiary interests in VIEs for which the Bank does not have a controlling financial interest and is not the primary beneficiary. These subsidiary interests are not included in the Company’s consolidated financial statements.
The parent holding company owns non-bank subsidiaries that have issued trust preferred securities which qualify as Tier 2 regulatory capital instruments. The trust subsidiaries are not included in our consolidated financial statements. Our investments in the trust subsidiaries are included in other assets on our statements of financial condition.
As of December 31, 2020, the Company and its subsidiaries were not engaged in any operations in foreign countries.
4
Recent Acquisitions
Our strategy is to profitably grow our business through internal growth and selective acquisitions. We continue to look for profitable expansion opportunities primarily in existing and new markets in the Rocky Mountain and Western states. We have completed the following acquisitions during the last five years:
| (Dollars in thousands) | Date | Total Assets | Gross Loans | Total Deposits | |||||||||||||||||||
| State Bank Corp. and its wholly-owned subsidiary, State Bank of Arizona (collectively, "SBAZ") | February 29, 2020 | $ | 745,420 | 451,702 | 603,289 | ||||||||||||||||||
| Heritage Bancorp and its wholly-owned subsidiary, Heritage Bank of Nevada (collectively, "Heritage") | July 31, 2019 | $ | 977,944 | 615,279 | 722,220 | ||||||||||||||||||
| FNB Bancorp and its wholly-owned subsidiary, The First National Bank of Layton (collectively, "FNB") | April 30, 2019 | 379,155 | 245,485 | 274,646 | |||||||||||||||||||
Inter-Mountain Bancorp., Inc. and its wholly-owned subsidiary, First Security Bank (collectively, “FSB”) | February 28, 2018 | 1,109,684 | 627,767 | 877,586 | |||||||||||||||||||
Columbine Capital Corp., and its wholly-owned subsidiary, Collegiate Peaks Bank (collectively, “Collegiate”) | January 31, 2018 | 551,198 | 354,252 | 437,171 | |||||||||||||||||||
TFB Bancorp, Inc. and its subsidiary, The Foothills Bank | April 30, 2017 | 385,839 | 292,529 | 296,760 | |||||||||||||||||||
| Treasure State Bank | August 31, 2016 | 76,165 | 51,875 | 58,364 | |||||||||||||||||||
See Note 23 in the Consolidated Financial Statements in “Item 8. Financial Statements and Supplementary Data” for additional information regarding the 2020 and 2019 acquisitions.
Market Area and Competition
We have 193 locations, which consists of 172 branches and 21 loan or administration offices, in 71 counties within 8 states including Montana, Idaho, Utah, Washington, Wyoming, Colorado, Arizona and Nevada. The market area’s economic base primarily focuses on tourism, construction, mining, energy, manufacturing, agriculture, service industry, and health care. The tourism industry is highly influenced by national parks, ski resorts, significant lakes and rural scenic areas.
Commercial banking is a highly competitive business and operates in a rapidly changing environment. There are a large number of depository institutions including savings and loans, commercial banks, and credit unions in the markets in which we have locations. Competition is also increasing for deposit and lending services from internet-based competitors. Non-depository financial service institutions, primarily in the securities, insurance and retail industries, have also become competitors for retail savings, investment funds and lending activities. In addition to offering competitive interest rates, the principal methods used by the Bank to attract deposits include the offering of a variety of services including on-line banking, mobile banking and convenient office locations and business hours. The primary factors in competing for loans are interest rates and rate adjustment provisions, loan maturities, loan fees, relationships with customers and the quality of service.
The following table summarizes our number of locations, the number of counties we serve and the percentage of Federal Deposit Insurance Corporation (“FDIC”) insured deposits we have in those counties for each of the eight states we operate in. Percent of deposits are based on the FDIC summary of deposits survey as of June 30, 2020.
| Number of Locations | Number of Counties Served | Percent of Deposits | |||||||||||||||
| Montana | 72 | 18 | 24.9 | % | |||||||||||||
| Idaho | 28 | 9 | 7.8 | % | |||||||||||||
| Utah | 10 | 5 | 0.1 | % | |||||||||||||
| Washington | 16 | 7 | 2.4 | % | |||||||||||||
| Wyoming | 18 | 9 | 15.1 | % | |||||||||||||
| Colorado | 26 | 13 | 1.5 | % | |||||||||||||
| Arizona | 16 | 7 | 0.7 | % | |||||||||||||
| Nevada | 7 | 3 | 6.0 | % | |||||||||||||
| 193 | 71 | ||||||||||||||||
5
Human Capital
As of December 31, 2020, we employed 3,032 persons, 2,837 of whom were employed full time. No employees were represented by a collective bargaining group. We believe our employees are united by our commitment to serve our customers and communities and that our customers are best served by a staff of competent, caring employees who are customer oriented. Our employees are one of our most valuable assets. We consider our employee relations to be excellent.
We strive to provide a safe and gratifying workplace for our employees. We promote and support a work environment free from any form of harassment, discrimination, bullying, or retaliation, and we are committed to principles of equal employment opportunity and to taking affirmative steps to hire and advance qualified minorities, women, individuals with disabilities, and protected veterans. We also encourage employee growth and development in a variety of ways, including through formal and informal training, relationships with colleagues and internal mentors, and by making a variety of resources available.
The Company has established a Training Committee charged with creating company-wide training expectations for employees to encourage adherence to internal policies and procedures and compliance with the variety of laws and regulations applicable to our operations. We also strive to offer multidisciplinary educational opportunities for employees to improve their knowledge and skills for their current positions, as well as to create opportunities to advance within the organization. Other targeted development opportunities are available for group leaders and promising employees, such as tuition support for employees seeking additional degrees or certifications through our Tuition Reimbursement program.
Our employee’s overall health and well-being is a top priority. It is our goal for all employees to work hard and experience a high quality work life, but we also encourage employees to be active participants in our communities, and to enjoy quality time with their families and cultivate their independent interests. We have developed several programs to encourage a safe and healthy workplace, including:
• GBCI Injury and Illness Prevention Program
• Work-life Balance Employee Assistance Program (EAP)
• WellSteps program offering assessments, goal setting tools, activities, incentives, and rewards
• The appointment of Safety & Wellness Ambassadors
• Quarterly Wellness Campaigns
• Workstation Ergonomics Assessments
Through our Injury and Illness Prevention Program, we have established protocols for minimizing work place injuries and incidents. Instilling safety as a standard of practice is facilitated by a Safety Committee at each of our banking divisions and by Safety & Wellness Ambassadors at each location.
We also believe employee retention is critical to our success, and we are proud of our track record when it comes to retaining employees, including many employees at institutions we acquire. Retention strategies are woven into all our compensation and retirement programs, and even our efforts at expansion. We provide our qualifying employees with a comprehensive benefit program, including health, dental and vision insurance, life and accident insurance, short- and long-term disability coverage, vacation and sick leave. In addition we offer a Profit Sharing and 401(k) Plan, stock-based compensation plan, deferred compensation plans, and a supplemental executive retirement plan for certain employees (“SERP”). For select management-level employees, we also offer our Short and Long-Term Incentive Plans, which are cash and equity-based compensation plans, respectively, that are designed to encourage achievement of short and long-term financial goals as our determined by our Board of Directors from time to time, and to further retention through long-term vesting of certain awards earned. See Note 14 in the Consolidated Financial Statements in “Item 8. Financial Statements and Supplementary Data” for detailed information regarding employee benefit plans and eligibility requirements.
We adapted quickly during the COVID-19 pandemic, to ensure that our employees were able to continue to work, receive a paycheck and to assist those who could not work. We quickly provided work from home capabilities for those employees who were able to do their jobs remotely. This action helped to create space for our employees and help slow the spread of the virus. We established a special time off benefit provided to those due to virus exposure or childcare issues so that they could remain at home, receive their pay and not exhaust their usual time off benefits. In addition we moved our vacation accrual caps to allow additional accruals for employees who continued to work during the pandemic. For employees who continued to work on site, we implemented safety protocols to mitigate risk of exposure. In addition, we expanded the scope of our EAP and regularly provided resources to employees to encourage wellness during the course of the pandemic.
Board of Directors and Committees
The Company's Board of Directors (“Board”) has the ultimate authority and responsibility for overseeing risk management at the Company. Some aspects of risk oversight are fulfilled at the Board level, and the Board delegates other aspects of its risk oversight function to its committees. The Board has established, among others, an Audit Committee, a Compensation Committee, a Nominating/Corporate Governance Committee, a Compliance Committee, and a Risk Oversight Committee. Additional information regarding Board committees is set forth under the heading “Meetings and Committees of the Board of Directors - Committee Membership” in the Company’s 2021 Annual Meeting Proxy Statement (“Proxy Statement”) and is incorporated herein by reference.
6
Website Access
Copies of our Annual Report on Form 10-K, Quarterly Reports on Form 10-Q, Current Reports on Form 8-K and amendments to those reports filed or furnished pursuant to Section 13(a) or 15(d) of the Securities Exchange Act of 1934 are available free of charge through our website (www.glacierbancorp.com) as soon as reasonably practicable after we have filed the material with, or furnished it to, the United States Securities and Exchange Commission (“SEC”). Copies can also be obtained by accessing the SEC’s website (www.sec.gov).
Supervision and Regulation
We are subject to extensive regulation under federal and state laws. This section provides a general overview of the federal and state regulatory framework applicable to us. In general, this regulatory framework is designed to protect depositors, the federal Deposit Insurance Fund (“DIF”), and the federal and state banking system as a whole, rather than specifically for the protection of shareholders. Note that this section is not intended to summarize all laws and regulations applicable to us. Descriptions of statutory or regulatory provisions do not purport to be complete and are qualified by reference to those provisions.
These statutes and regulations, as well as related policies, continue to be subject to change by Congress, state legislatures, and federal and state regulators. Changes in statutes, regulations, or regulatory policies applicable to us (including their interpretation or implementation) cannot be predicted and could have a material effect on our business and operations. Numerous changes to the statutes, regulations, and regulatory policies applicable to us have been made or proposed in recent years. Continued efforts to monitor and comply with new regulatory requirements add to the complexity and cost of our business and operations.
The Company is subject to regulation and supervision by the Federal Reserve and the Montana Department of Administration’s Division of Banking and Financial Institutions (“MT Division of Banking”) and regulation generally by the State of Montana. The Company is also subject to the disclosure and regulatory requirements of the Securities Act of 1933, as amended, and the Securities Exchange Act of 1934, as amended, which are both administered by the SEC. The Bank is subject to regulation and supervision by the FDIC, the MT Division of Banking, and, with respect to Bank branches outside of the State of Montana, the respective regulators in those states.
Federal and State Bank Holding Company Regulation
General. The Company is a bank holding company under the Bank Holding Company Act of 1956, as amended (“BHCA”), due to its ownership of and control over the Bank. As a bank holding company, the Company is subject to regulation, supervision, and examination by the Federal Reserve. Further, because the Bank is a “regional banking organization” under Montana law, the Company (as a bank holding company of the Bank) is also subject to regulation, supervision and examination by the MT Division of Banking. In general, the BHCA limits the business of a bank holding company to owning or controlling banks and engaging in, or retaining or acquiring shares in a company engaged in, other activities closely related to the business of banking. In addition, the Company must also file reports with and provide additional information to the Federal Reserve.
Holding Company Bank Ownership. The BHCA requires every bank holding company to obtain the prior approval of the Federal Reserve before: 1) acquiring, directly or indirectly, ownership or control of any voting shares of another bank or bank holding company if, after such acquisition, it would own or control more than 5 percent of such shares; 2) acquiring all or substantially all of the assets of another bank or bank holding company; or 3) merging or consolidating with another bank holding company.
Holding Company Control of Non-banks. With some exceptions, the BHCA prohibits a bank holding company from acquiring or retaining direct or indirect ownership or control of more than 5 percent of the voting shares of any company that is not a bank or bank holding company, or from engaging directly or indirectly in activities other than those of banking, managing or controlling banks, or providing services for its subsidiaries. The principal exceptions to these prohibitions involve certain non-bank activities that, by federal statute, agency regulation, or order, have been identified as activities closely related to the business of banking or managing or controlling banks.
Transactions with Affiliates. Bank subsidiaries of a bank holding company are subject to restrictions imposed by the Federal Reserve Act on extensions of credit to the holding company or its subsidiaries, on investments in securities, and on the use of securities as collateral for loans to any borrower. The Dodd-Frank Wall Street Reform and Consumer Protection Act of 2010 (“Dodd-Frank Act”) further extended the definition of an “affiliate” and treats credit exposure arising from derivative transactions, securities lending, and borrowing transactions as covered transactions under the regulations. It also 1) expands the scope of covered transactions required to be collateralized; 2) requires collateral to be maintained at all times for covered transactions required to be collateralized; and 3) places limits on acceptable collateral. These regulations and restrictions may limit the Company’s ability to obtain funds from the Bank for its cash needs, including funds for payments of dividends, interest, and operational expenses.
Tying Arrangements. We are also prohibited from engaging in certain tie-in arrangements in connection with any extension of credit, sale or lease of property, or furnishing of services. For example, with certain exceptions, we may not condition an extension of credit
7
to a customer on either 1) a requirement that the customer obtain additional services provided by us; or 2) an agreement by the customer to refrain from obtaining other services from a competitor.
Support of Bank Subsidiaries. Under Federal Reserve policy and the Dodd-Frank Act, the Company is required to act as a source of financial and managerial strength to the Bank. This means that the Company is required to commit, as necessary, capital and resources to support the Bank, including at times when the Company may not be in a financial position to provide such resources or when it may not be in the Company's or its shareholders' best interests to do so. Any capital loans a bank holding company makes to its bank subsidiaries are subordinate to deposits and to certain other indebtedness of the bank subsidiaries.
State Law Restrictions under Corporate Law. As a Montana corporation, the Company is subject to certain limitations and restrictions under applicable Montana corporate law. For example, Montana corporate law includes limitations and restrictions relating to indemnification of directors, distributions to shareholders, transactions involving directors, officers, or interested shareholders, maintenance of books, records, and minutes, and observance of certain corporate formalities.
Federal and State Regulation of the Bank
General. Deposits in the Bank are insured by the FDIC. The Bank is subject to primary supervision, periodic examination, and regulation of the FDIC and the MT Division of Banking. These agencies have the authority to prohibit the Bank from engaging in what they believe constitute unsafe or unsound banking practices. The federal laws that apply to the Bank regulate, among other things, the scope of its business, its investments, its reserves against deposits, the timing of the availability of deposited funds, and the nature and amount of and collateral for loans. Federal laws also regulate community reinvestment and insider credit transactions and impose safety and soundness standards. In addition to federal law and the laws of the State of Montana, with respect to the Bank's branches in Idaho, Utah, Washington, Wyoming, Colorado, Arizona and Nevada, the Bank is also subject to the various laws and regulations governing its activities in those states.
Consumer Protection. The Bank is subject to a variety of federal and state consumer protection laws and regulations that govern its relationships and interactions with consumers, including laws and regulations that impose certain disclosure requirements and that govern the manner in which the Bank takes deposits, makes and collects loans, and provides other services. In recent years, examination and enforcement by federal and state banking agencies for non-compliance with consumer protection laws and regulations have increased and become more intense. Failure to comply with these laws and regulations may subject the Bank to various penalties, including but not limited to enforcement actions, injunctions, fines, civil monetary penalties, criminal penalties, punitive damages, and the loss of certain contractual rights. The Bank has established a comprehensive compliance system to ensure consumer protection.
Community Reinvestment. The Community Reinvestment Act of 1977 (“CRA”) requires that, in connection with examinations of financial institutions within their jurisdictions, federal bank regulators evaluate the record of financial institutions in meeting the credit needs of their local communities, including low and moderate-income neighborhoods, consistent with the safe and sound operation of those institutions. A bank’s community reinvestment record is also considered by the applicable banking agencies in evaluating mergers, acquisitions, and applications to open a branch or facility. In some cases, a bank's failure to comply with the CRA, or CRA protests filed by interested parties during applicable comment periods, can result in the denial or delay of such transactions. The Bank received a “satisfactory” rating in its most recent CRA examination.
Insider Credit Transactions. Banks are subject to certain restrictions on extensions of credit to executive officers, directors, principal shareholders, and their related interests. These extensions of credit 1) must be made on substantially the same terms (including interest rates and collateral) and follow credit underwriting procedures that are at least as stringent as those prevailing at the time for comparable transactions with persons not related to the lending bank; and 2) must not involve more than the normal risk of repayment or present other unfavorable features. Banks are also subject to certain lending limits and restrictions on overdrafts to insiders. A violation of these restrictions may result in the assessment of substantial civil monetary penalties, regulatory enforcement actions, and other regulatory sanctions. The Dodd-Frank Act and federal regulations place additional restrictions on loans to insiders and generally prohibit loans to senior officers other than for certain specified purposes.
Regulation of Management. Federal law 1) sets forth circumstances under which officers or directors of a bank may be removed by the bank's federal supervisory agency; 2) as discussed above, places restraints on lending by a bank to its executive officers, directors, principal shareholders, and their related interests; and 3) generally prohibits management personnel of a bank from serving as directors or in other management positions of another financial institution whose assets exceed a specified amount or which has an office within a specified geographic area.
Safety and Soundness Standards. Certain non-capital safety and soundness standards are also imposed upon banks. These standards cover, among other things, internal controls, information systems and internal audit systems, loan documentation, credit underwriting, interest rate exposure, asset growth, compensation, fees and benefits, such other operational and managerial standards as the agency determines to be appropriate, and standards for asset quality, earnings, and stock valuation. In addition, each insured depository
8
institution must implement a comprehensive written information security program that includes administrative, technical, and physical safeguards appropriate to the institution’s size and complexity and the nature and scope of its activities. The information security program must be designed to ensure the security and confidentiality of customer information, protect against unauthorized access to or use of such information, and ensure the proper disposal of customer and consumer information. An institution that fails to meet these standards may be required to submit a compliance plan, or be subject to regulatory sanctions, including restrictions on growth. The Bank has established comprehensive policies and risk management procedures to ensure the safety and soundness of the Bank.
Interstate Banking and Branching
The Dodd-Frank Act eliminated interstate branching restrictions that were implemented as part of the Riegle-Neal Interstate Banking and Branching Efficiency Act of 1994 ("Interstate Act"), and removed many restrictions on de novo interstate branching by state and federally chartered banks. Federal regulators have authority to approve applications by such banks to establish de novo branches in states other than the bank's home state if the host state's banks could establish a branch at the same location. The Interstate Act requires regulators to consult with community organizations before permitting an interstate institution to close a branch in a low-income area. Federal bank regulations prohibit banks from using their interstate branches primarily for deposit production and federal bank regulatory agencies have implemented a loan-to-deposit ratio screen to ensure compliance with this prohibition.
Dividends
A principal source of the Company’s cash is from dividends received from the Bank, which are subject to regulation and limitation. As a general rule, regulatory authorities may prohibit banks and bank holding companies from paying dividends in a manner that would constitute an unsafe or unsound banking practice. For example, regulators have stated that paying dividends that deplete an institution's capital base to an inadequate level would be an unsafe and unsound banking practice and that an institution should generally pay dividends only out of current operating earnings. In addition, a bank may not pay cash dividends if that payment could reduce the amount of its capital below that necessary to meet minimum applicable regulatory capital requirements. Current guidance from the Federal Reserve provides, among other things, that dividends per share on the Company’s common stock generally should not exceed earnings per share, measured over the previous four fiscal quarters. In certain circumstances, Montana law also places limits or restrictions on a bank’s ability to declare and pay dividends.
Rules adopted in accordance with the third installment of the Basel Accords (“Basel III”) also impose limitations on the Bank's ability to pay dividends. In general, these rules limit the Bank's ability to pay dividends unless the Bank's common equity conservation buffer exceeds the minimum required capital ratio by at least 2.5 percent of risk-weighted assets.
The Federal Reserve has also issued a policy statement on the payment of cash dividends by bank holding companies. In general, the policy statement expresses the view that although no specific regulations restrict dividend payments by bank holding companies other than state corporate laws, a bank holding company should not pay cash dividends unless the bank holding company’s earnings for the past year are sufficient to cover both the cash dividends and a prospective rate of earnings retention that is consistent with the bank holding company’s capital needs, asset quality, and overall financial condition. A bank holding company's ability to pay dividends may also be restricted if a subsidiary bank becomes undercapitalized. These various regulatory policies may affect our ability to pay dividends or otherwise engage in capital distributions.
The Dodd-Frank Act
General. The Dodd-Frank Act significantly changed the bank regulatory structure and has affected the lending, deposit, investment, trading, and operating activities of banks and bank holding companies. Some of the provisions of the Dodd-Frank Act that may impact our business and operations are summarized below.
Corporate Governance. The Dodd-Frank Act requires publicly traded companies to provide their shareholders with 1) a non-binding shareholder vote on executive compensation; 2) a non-binding shareholder vote on the frequency of such vote; 3) disclosure of “golden parachute” arrangements in connection with specified change in control transactions; and 4) a non-binding shareholder vote on golden parachute arrangements in connection with these change in control transactions. The SEC adopted a rule mandated by the Dodd-Frank Act that requires a public company to disclose the ratio of the compensation of its Chief Executive Officer (“CEO”) to the median compensation of its employees. This rule is intended to provide shareholders with information that they can use to evaluate a CEO’s compensation.
Prohibition Against Charter Conversions of Financial Institutions. The Dodd-Frank Act generally prohibits a depository institution from converting from a state to federal charter, or vice versa, while it is the subject to an enforcement action unless the depository institution seeks prior approval from its primary regulator and complies with specified procedures to ensure compliance with the enforcement action.
Repeal of Demand Deposit Interest Prohibition. The Dodd-Frank Act repealed the federal prohibitions on the payment of interest on demand deposits, thereby permitting depository institutions to pay interest on business transaction and other accounts.
9
Consumer Financial Protection Bureau. The Dodd-Frank Act established the Consumer Financial Protection Bureau (“CFPB”) and empowered it to exercise broad rulemaking, supervision, and enforcement authority for a wide range of consumer protection laws. Because our total consolidated assets exceed $10 billion, we are subject to the direct supervision of the CFPB. The CFPB has issued and continues to issue numerous regulations under which we will continue to incur additional expense in connection with our ongoing compliance obligations. Significant recent CFPB developments that may affect operations and compliance costs include:
•positions taken by the CFPB on fair lending, including applying the disparate impact theory which could make it more difficult for lenders to charge different rates or to apply different terms to loans to different customers;
•the CFPB's final rule amending Regulation C, which implements the Home Mortgage Disclosure Act, requiring most lenders to report expanded information in order for the CFPB to more effectively monitor fair lending concerns and other information shortcomings identified by the CFPB;
•positions taken by the CFPB regarding the Electronic Fund Transfer Act and Regulation E, which require companies to obtain consumer authorizations before automatically debiting a consumer’s account for pre-authorized electronic funds transfers; and
•focused efforts on enforcing certain compliance obligations the CFPB deems a priority, such as automobile and student loan servicing, debt collection, mortgage origination and servicing, remittances, and fair lending, among others.
Interchange Fees. Under the Durbin Amendment to the Dodd-Frank Act, the Federal Reserve adopted rules establishing standards for assessing whether the interchange fees that may be charged with respect to certain electronic transactions are "reasonable and proportional" to the costs incurred by issuers for processing such transactions. Notably, the Federal Reserve's rules set a maximum permissible interchange fee, among other requirements. Because our total consolidated assets exceeded $10 billion during the first quarter of 2018, we became subject to the interchange fee cap beginning July 1, 2019 on a go-forward basis.
Stress Testing
In May 2018, the Economic Growth, Regulatory Relief, and Consumer Protection Act (“EGRRC Act”) was signed into law, which is bipartisan legislation that rolled back certain provisions of the Dodd-Frank Act to provide regulatory relief to certain financial institutions. In relevant part, the EGRRC Act raised the applicability threshold for company-run stress testing required under the Dodd-Frank Act by exempting bank holding companies under $100 billion in total assets and raising the asset threshold for covered banks from $10 billion to $250 billion. In November of 2019, the FDIC adopted a final rule to implement these changes. As a result, we are not currently subject to the Dodd-Frank Act stress testing requirements.
Capital Adequacy
Banks and bank holding companies are subject to various regulatory capital requirements administered by state and federal regulatory agencies, which involve quantitative measures of assets, liabilities, and certain off-balance sheet items calculated under regulatory guidelines. Capital amounts and classifications are also subject to qualitative judgments by regulators about components, risk weighting, and other factors. The capital requirements are intended to ensure that institutions have adequate capital given the risk levels of assets and off-balance sheet financial instruments and are applied separately to the Company and the Bank.
Federal regulations require insured depository institutions and bank holding companies to meet several minimum capital standards, including: 1) a common equity Tier 1 capital to risk-based assets ratio of 4.5 percent; 2) a Tier 1 capital to risk-based assets ratio of 6 percent; 3) a total capital to risk-based assets ratio of 8 percent; and 4) a 4 percent Tier 1 capital to total assets leverage ratio. These minimum capital requirements became effective in January 2015 and were the result of final rules implementing certain regulatory amendments based on the recommendation of the Basel Committee on Banking Supervision and certain requirements of the Dodd-Frank Act ("Final Rules").
The Final Rules also require a capital conservation buffer designed to absorb losses during periods of economic stress. Failure to comply with this buffer requirement may result in constraints on capital distributions (e.g., dividends, equity repurchases, and certain bonus compensation for executive officers). The Final Rules change the risk-weights of certain assets for purposes of the risk-based capital ratios and phase out certain instruments as qualifying capital. For additional information regarding trust preferred securities and their impact to regulatory capital, see Note 10 to the Consolidated Financial Statements in “Item 8. Financial Statements and Supplementary Data.”
The Final Rules also contain revisions to the prompt corrective action framework, which is designed to place restrictions on an insured depository institution if its capital levels begin to show signs of weakness. Under the prompt corrective action requirements, which are designed to complement the capital conservation buffer, insured depository institutions will be required to meet the following increased capital level requirements to qualify as “well capitalized”: 1) a Tier 1 common equity capital ratio of at least 6.5 percent; 2) a Tier 1 capital ratio of at least 8 percent; 3) a total capital ratio of at least 10 percent; 4) a Tier 1 leverage ratio of at least 5 percent; and 5) not be subject to any order or written directive requiring a specific capital level. The FDIC’s rules (as amended by the Final Rules) contain other capital classification categories, such as “adequately capitalized,” “undercapitalized,” “significantly undercapitalized,” and “critically undercapitalized,” each of which are based on certain capital ratios. Undercapitalized institutions are subject to certain mandatory restrictions, including on capital distributions and growth. Significantly undercapitalized and critically
10
undercapitalized institutions are subject to additional restrictions. An institution may be downgraded to a category lower than indicated by its capital ratios if it is determined to be in an unsafe or unsound condition, or if the institution receives an unsatisfactory examination rating.
The application of the Final Rules may result in lower returns on invested capital, require the raising of additional capital or require regulatory action if the Bank were unable to comply with such requirements. In addition, management may be required to modify its business strategy due to the changes to the asset risk-weights for risk-based capital calculations and the requirement to meet the capital conservation buffers. The imposition of liquidity requirements in connection with these rules could also cause the Bank to increase its holdings of liquid assets, change its business strategy, and make other changes to the terms of its funding.
Regulatory Oversight and Examination
Inspections. The Federal Reserve conducts periodic inspections of bank holding companies. In general, the objectives of the Federal Reserve's inspection program are to ascertain whether the financial strength of a bank holding company is maintained on an ongoing basis and to determine the effects or consequences of transactions between a bank holding company or its non-banking subsidiaries and its bank subsidiaries. The inspection type and frequency typically varies depending on asset size, complexity of the organization, and the bank holding company’s rating at its last inspection.
Examinations. Banks are subject to periodic examinations by their primary regulators. In assessing a bank's condition, bank examinations have evolved from reliance on transaction testing to a risk-focused approach. These examinations are extensive and cover the entire breadth of the operations of a bank. Generally, safety and soundness examinations occur on an 18-month cycle for banks under $3 billion in total assets that are well capitalized and without regulatory issues, and 12-months otherwise. Examinations alternate between the federal and state bank regulatory agencies, and in some cases they may occur on a combined schedule. The frequency of consumer compliance and CRA examinations is linked to the size of the institution and its compliance and CRA ratings at its most recent examinations. However, the examination authority of the Federal Reserve and the FDIC allows them to examine supervised institutions as frequently as deemed necessary based on the condition of the institution or as a result of certain triggering events. Because our total consolidated assets exceed $10 billion, we are also subject to the direct supervision of the CFPB.
Commercial Real Estate Ratios. The federal banking regulators recently issued guidance reminding financial institutions to reexamine the existing regulations regarding concentrations in commercial real estate lending. The purpose of the guidance is to guide banks in developing risk management practices and capital levels commensurate with the level and nature of real estate concentrations. The banking regulators are directed to examine each bank’s exposure to commercial real estate loans that are dependent on cash flow from the real estate held as collateral and to focus their supervisory resources on institutions that may have significant commercial real estate loan concentration risk. The guidance provides that the strength of an institution’s lending and risk management practices with respect to such concentrations will be taken into account in evaluating capital adequacy and does not specifically limit a bank’s commercial real estate lending to a specified concentration level.
Corporate Governance and Accounting
The Sarbanes-Oxley Act of 2002 (“SOX Act”) addressed, among other things, corporate governance, auditing and accounting, enhanced and timely disclosure of corporate information, and penalties for non-compliance. In general, the SOX Act among other matters 1) requires chief executive officers and chief financial officers to certify to the accuracy and completeness of periodic reports filed with the SEC and to certain matters relating to disclosure and accounting controls at public companies; 2) imposes specific and enhanced corporate disclosure requirements; 3) accelerates the time frame for reporting insider transactions and periodic disclosures by public companies; and 4) requires companies to adopt and disclose information about corporate governance practices. As a publicly reporting company with the SEC, the Company is subject to the requirements of the SOX Act and related rules and regulations issued by the SEC and NASDAQ.
Anti-Money Laundering and Anti-Terrorism
The Bank Secrecy Act (“BSA”) requires all financial institutions to establish a risk-based system of internal controls reasonably designed to prevent money laundering and the financing of terrorism. The BSA also sets forth various recordkeeping and reporting requirements (such as reporting suspicious activities that might signal criminal activity) and certain due diligence and "know your customer" documentation requirements.
The Uniting and Strengthening America by Providing Appropriate Tools Required to Intercept and Obstruct Terrorism Act of 2001 (“Patriot Act”), intended to combat terrorism, was renewed with certain amendments in 2006. In relevant part, the Patriot Act 1) prohibits banks from providing correspondent accounts directly to foreign shell banks; 2) imposes due diligence requirements on banks opening or holding accounts for foreign financial institutions or wealthy foreign individuals; 3) requires financial institutions to establish an anti-money laundering compliance program; and 4) eliminates civil liability for persons who file suspicious activity reports. The Patriot Act also includes provisions providing the government with power to investigate terrorism, including expanded government access to bank account records. Regulators are directed to consider a bank holding company’s and a bank’s effectiveness
11
in combating money laundering when reviewing and ruling on applications under the BHCA and the Bank Merger Act. We have established comprehensive compliance programs designed to comply with the requirements of the BSA and Patriot Act.
Financial Services Modernization
The Gramm-Leach-Bliley Financial Services Modernization Act of 1999 (“GLBA”) brought about significant changes to the laws affecting banks and bank holding companies. Generally, the GLBA 1) repeals historical restrictions on preventing banks from affiliating with securities firms; 2) provides a uniform framework for the activities of banks, savings institutions, and their holding companies; 3) broadens the activities that may be conducted by national banks and banking subsidiaries of bank holding companies; 4) provides an enhanced framework for protecting the privacy of consumer information and requires notification to consumers of bank privacy policies; and 5) addresses a variety of other legal and regulatory issues affecting both day-to-day operations and long-term activities of financial institutions. The Bank is subject to FDIC regulations implementing the privacy provisions of the GLBA. These regulations require a bank to disclose its privacy policy, including informing consumers of the bank's information sharing practices and their right to opt out of certain practices.
Deposit Insurance
FDIC Insured Deposits. The Bank's deposits are insured under the Federal Deposit Insurance Act, up to the maximum applicable limits and are subject to deposit insurance assessments by the FDIC, which are designed to tie what banks pay for deposit insurance to the risks they pose. The Dodd-Frank Act redefined the assessment base used for calculating deposit insurance assessments by requiring the FDIC to determine assessments based on the average consolidated total assets less average tangible equity capital of a financial institution. Under the FDIC’s assessment system for determining payments to the DIF, insured depository institutions with more than $10 billion in assets are assessed under a “scorecard” methodology that seeks to capture both the probability that such an institution will fail and the magnitude of the impact on the DIF if such a failure occurs. In addition, the Dodd-Frank Act 1) raised the minimum designated reserve ratio (the FDIC is required to set the reserve ratio each year) of the DIF from 1.15 percent to 1.35 percent; 2) required that the DIF reserve ratio meet 1.35 percent by 2020; and 3) eliminated the requirement that the FDIC pay dividends to insured depository institutions when the reserve ratio exceeds certain thresholds. The Dodd-Frank Act made banks with $10 billion or more in total assets responsible for the increase from 1.15 percent to 1.35 percent by imposing a surcharge on those institutions. The surcharge continued through September of 2018 when the DIF reserve ratio reached 1.36 percent, which was ahead of the Dodd-Frank Act’s 2020 deadline to meet the 1.35 percent reserve ratio. No institution may pay a dividend if it is in default on its federal deposit insurance assessment. The FDIC may also prohibit any insured institution from engaging in any activity determined by regulation or order to pose a serious risk to the DIF.
Safety and Soundness. The FDIC may terminate the deposit insurance of any insured depository institution if the FDIC determines after a hearing that the institution has engaged or is engaging in unsafe or unsound practices, is in an unsafe or unsound condition to continue operations, or has violated any applicable law, regulation, order, or any condition imposed by an agreement with the FDIC. Management is not aware of any existing circumstances that would result in termination of the Bank's deposit insurance.
Insurance of Deposit Accounts. The Dodd-Frank Act permanently increased FDIC deposit insurance from $100,000 to $250,000 per depositor. The FDIC insurance coverage limit applies per depositor, per insured depository institution for each account ownership category.
Recent and Proposed Legislation
The economic and political environment of the past several years has led to a number of proposed legislative, governmental, and regulatory initiatives that may significantly impact the banking industry. Other regulatory initiatives by federal and state government agencies may also significantly impact our business. We cannot predict whether these or any other proposals will be enacted or the ultimate impact of any such initiatives on our operations, competitive situation, financial conditions, or results of operations. Recent history has demonstrated that new legislation or changes to existing laws or regulations typically result in a greater compliance burden (and therefore increase the general costs of doing business), and the new administration under President Biden has demonstrated a general intent to regulate the financial services industry more strictly than the administration of his predecessor.
Effects of Federal Government Monetary Policy
The Company’s earnings and growth are affected not only by general economic conditions, but also by the fiscal and monetary policies of the federal government, particularly the Federal Reserve. The Federal Reserve implements national monetary policy to promote maximum employment, stable prices, and moderate long-term interest rates. Through its open market operations in U.S. government securities, control of the discount rate applicable to borrowings, establishment of reserve requirements against certain deposits, and control of the interest rate applicable to excess reserve balances and reverse repurchase agreements, the Federal Reserve influences the availability and cost of money and credit and, ultimately, a range of economic variables including employment, output, and the prices of goods and services. The nature and impact of future changes in monetary policies and their impact on us cannot be predicted with certainty.
12
Heightened Requirements for Large Bank Holding Companies and Banks
As mentioned above, the Dodd-Frank Act imposed heightened requirements on large bank holding companies and banks, and the EGRRC Act has rolled back certain provisions of the Dodd-Frank Act. In particular, the EGRRC Act increased the asset threshold for certain rules that previously applied to bank holding companies and banks with at least $10 billion in total consolidated assets. As a result of the EGRRC Act and follow-up rules, we are not currently subject to several of those heightened requirements (e.g., stress testing and a dedicated risk committee), but we will remain subject to other requirements of the Dodd-Frank Act left unaffected by the EGRRC Act, such as the requirement that we be examined, primarily by the CFPB, for compliance with federal consumer protection laws. We have established a comprehensive compliance system to ensure compliance with these rules.
COVID-19 Legislation and Regulation
Governments at the federal, state, and local levels continue to take steps to address the impact of the COVID-19 pandemic. On March 27, 2020, the historic $2 trillion federal stimulus package known as the Coronavirus Aid, Relief, and Economic Security Act (the “CARES Act”) was signed into law, which included $350 billion in stimulus for small businesses under the so-called Paycheck Protection Program (“PPP”), along with direct stimulus payments (i.e., “economic impact payments” or “stimulus payments”) for many eligible Americans. The initial amounts available under the Paycheck Protection Program were quickly exhausted in less than two weeks, which prompted Congress to negotiate additional funding. On April 24, 2020, the Paycheck Protection Program and Health Care Enforcement Act was signed into law to replenish funding to the Paycheck Protection Program and to provide other spending for hospitals and virus testing. Further, on July 3, 2020, the President extended the deadline for potential borrowers to apply for Paycheck Protection Program funds until August 8, 2020. And recently, on December 21, 2020, Congress passed the Consolidated Appropriations Act, which was signed into law by the President on December 27th, and included another $284 billion to fund an expansion to the PPP, subject to certain changes in eligibility requirements and program design. The Bank is taking additional loan applications, and making new loans, under the program, as most recently updated. The legislative and regulatory landscape surrounding the COVID-19 pandemic is rapidly changing, and neither the Company nor the Bank can predict with certainty the impact it will have on our operations or business.
Item 1A. Risk Factors
The following is a discussion of what we believe are the most significant risks and uncertainties that may affect our business, financial condition and future results of operations. These risks are not the only ones that we face. Other risks and uncertainties not currently known to us or currently believed to be material may harm our future business, financial condition, results of operations and prospects.
Economy and Our Markets
The effects of the COVID-19 pandemic could adversely affect our customers’ future results of operations and/or the market price of our stock.
The COVID-19 pandemic continues to rapidly evolve, as do federal, state and local efforts to address it. Both the direct effects of the pandemic and the resulting U.S. governmental responses are of an unprecedented scope as it impacts both the health and the economy of our country and the world at large. No one can predict the extent or duration of the pandemic, or its effect on the markets that we serve. Further, the ongoing efforts and impact of the government in mitigating the health and the economic effects of the pandemic cannot currently be predicted, whether on our business or as to the economy as a whole. The pandemic has thus far resulted in significant volatility in international and U.S. markets, which could adversely affect the market price of our stock. To date, the pandemic has resulted in significant business disruption and volatility in the international and domestic markets, which has led to increased volatility in the market price of our stock and stocks in general.
The Company believes it is well positioned to mitigate the potential financial impact of the COVID-19 pandemic with a strong liquidity and capital position. The Company has implemented several measures to manage through the pandemic, including:
•launched a pandemic team that addresses the daily impact to our business;
•proactively reaching out to, and working with customers, to assess their needs and provide funding, flexible repayment options or modifications as necessary;
•designated a “command center” that supports employees so they can work with customers to provide the PPP loans;
•increased monitoring of credit quality and portfolio risk for industries determined to have elevated risk; and
•developed safety measures for the health of our employees including elimination of unnecessary business travel, social distancing precautions, additional wellness and education programs, and preventative cleaning practices.
Nonetheless, any future deterioration in economic conditions in the markets the Bank serves as a consequence of the pandemic, or a failure of the economy to recover from pandemic related disruptions as quickly as anticipated, could have a material adverse effect on our business, financial condition, results of operations and prospects.
13
Economic conditions in the market areas the Bank serves may adversely impact its earnings and could increase the credit risk associated with its loan portfolio and the value of its investment portfolio.
Substantially all of the Bank’s loans are to businesses and individuals in Montana, Idaho, Utah, Washington, Wyoming, Colorado, Arizona and Nevada, and a softening of the economies in these market areas could have a material adverse effect on its business, financial condition, results of operations and prospects. Any future deterioration in economic conditions in the markets the Bank serves could result in the following consequences, any of which could have an adverse impact, which could be material, on our business, financial condition, results of operations and prospects:
•loan delinquencies may increase;
•problem assets and foreclosures may increase;
•collateral for loans made may decline in value, in turn reducing customers’ borrowing power;
•certain securities within the investment portfolio could become other-than-temporarily impaired, requiring a write-down through earnings to fair value, thereby reducing equity;
•low cost or non-interest bearing deposits may decrease; and
•demand for loan and other products and services may decrease.
National and international economic and geopolitical conditions could adversely affect our future results of operations or market price of our stock.
Our business is impacted by factors such as economic, political and market conditions, broad trends in industry and finance, changes in government monetary and fiscal policies, inflation, and financial market volatility, all of which are beyond our control. National and global economies are constantly in flux, as evidenced by recent market volatility resulting from, among other things, global trade disputes and the associated imposition of tariffs in certain cases, the uncertain future relationship of the United Kingdom with the European Union (e.g., Brexit), and the ever-changing landscape of the energy and medical industries. Future economic conditions cannot be predicted, and any renewed deterioration in the economies of the nation as a whole or in our markets could have an adverse effect, which could be material, on its business, financial condition, results of operations and prospects, and could cause the market price of our stock to decline.
Competition in the Bank’s market areas may limit future success.
Commercial banking is a highly competitive business and a consolidating industry. The Bank competes with other commercial banks, credit unions, finance, insurance and other non-depository companies operating in its market areas. The Bank is subject to substantial competition for loans and deposits from other financial institutions. Some of its competitors are not subject to the same degree of regulation and restriction as the Bank while others have greater financial resources than the Bank. If the Bank is unable to effectively compete in its market areas, the Bank’s business, our results of operations and prospects could be adversely affected.
We may not be able to continue to grow organically or through acquisitions.
Historically, we have expanded through a combination of organic growth and acquisitions. If market and regulatory conditions change, we may be unable to grow organically or successfully compete for, complete, or integrate potential future acquisitions at the same pace. We have historically used our strong stock currency and capital resources to complete acquisitions. Downturns in the stock market and the market price of our stock could have an impact on future acquisitions. Furthermore, there can be no assurance that we can successfully complete such transactions, since they are subject to regulatory review and approval.
Growth through future acquisitions could, in some circumstances, adversely affect profitability or other performance measures.
In the past, we have been active in acquiring banks and we may in the future engage in selected acquisitions of additional financial institutions. There are risks associated with any such acquisitions that could adversely affect profitability and other performance measures. These risks include, among other things, incorrectly assessing the asset quality of a financial institution being acquired, discovering compliance or regulatory issues after the acquisition, encountering greater than anticipated cost and use of management time associated with integrating acquired businesses into our operations, and being unable to profitably deploy funds acquired in an acquisition. We may not be able to continue to grow through acquisitions, and if we do, there is a risk of negative impacts of such acquisitions on our operating results and financial condition.
Acquisitions may also cause business disruptions that cause the Bank to lose customers or cause customers to remove their accounts from the Bank and move to competing financial institutions. Further, acquisitions may also disrupt the Bank's ongoing businesses or create inconsistencies in standards, controls, procedures, and policies that adversely affect relationships with employees, clients, customers, and depositors. The loss of key employees during acquisitions may also adversely affect our business.
We anticipate that we might issue capital stock in connection with future acquisitions. Acquisitions and related issuances of stock may have a dilutive effect on earnings per share, book value per share, and the percentage ownership of current shareholders. In acquisitions involving the use of cash as consideration, there will be an impact on our capital position.
14
If goodwill recorded in connection with acquisitions becomes impaired, it could have an adverse impact on earnings and capital.
Accounting standards require us to account for acquisitions using the acquisition method of accounting. Under acquisition accounting, if the purchase price of an acquired company exceeds the fair value of its net assets, the excess is carried on the acquirer’s balance sheet as goodwill. In accordance with accounting principles generally accepted in the United States of America (“GAAP”), goodwill is not amortized but rather is evaluated for impairment on an annual basis or more frequently if events or circumstances indicate that a potential impairment exists. Our goodwill was not considered impaired as of December 31, 2020 and 2019; however, there can be no assurance that future evaluations of goodwill will not result in findings of impairment and write-downs, which could be material. Since we have $514 million in goodwill, representing 22 percent of our stockholders' equity, impairment of goodwill could have a material adverse effect on our business, financial condition and results of operations. Furthermore, even though it is a non-cash item, significant impairment of goodwill could subject us to regulatory limitations, including the ability to pay dividends on our common stock.
There can be no assurance we will be able to continue paying dividends on our common stock at recent levels.
We may not be able to continue paying quarterly dividends commensurate with recent levels given that our ability to pay dividends on our common stock depends on a variety of factors. The payment of dividends is subject to government regulation in that regulatory authorities may prohibit banks and bank holding companies from paying dividends that would constitute an unsafe or unsound banking practice. This is heavily based on our earnings and capital levels which currently are strong. Current guidance from the Federal Reserve provides, among other things, that dividends per share should not exceed earnings per share measured over the previous four fiscal quarters. In certain circumstances, Montana law also places limits or restrictions on a bank’s ability to declare and pay dividends. As a result, our future dividends will generally depend on the level of earnings at the Bank.
Credit and Asset Quality
The allowance for credit losses may not be adequate to cover actual loan losses, which could adversely affect earnings.
The Bank maintains an allowance for credit losses (“ACL” or “allowance”) in an amount that it believes is adequate to provide for losses in the loan portfolio. While the Bank strives to carefully manage and monitor credit quality and to identify loans that may become non-performing, at any time there are loans included in the portfolio that will result in losses, but that have not been identified as non-performing or potential problem loans. With respect to real estate loans and property taken in satisfaction of such loans (“other real estate owned” or “OREO”), the Bank can be required to recognize significant declines in the value of the underlying real estate collateral quite suddenly as values are updated through appraisals and evaluations (new or updated) performed in the normal course of monitoring the credit quality of the loans. There are many factors that can cause the value of real estate to decline, including declines in the general real estate market, changes in methodology applied by appraisers, and/or using a different appraiser than was used for the prior appraisal or evaluation. The Bank’s ability to recover on real estate loans by selling or disposing of the underlying real estate collateral is adversely impacted by declining values, which increases the likelihood the Bank will suffer losses on defaulted loans beyond the amounts provided for in the ACL. This, in turn, could require material increases in the Bank’s provision for credit losses and ACL. By closely monitoring credit quality, the Bank attempts to identify deteriorating loans before they become non-performing assets and adjust the ACL accordingly. However, because future events are uncertain, and if difficult economic conditions occur, there may be loans that deteriorate to a non-performing status in an accelerated time frame. As a result, future additions to the ACL may be necessary beyond the levels commensurate with any loan growth. Because the loan portfolio contains a number of loans with relatively large balances, the deterioration of one or a few of these loans may cause a significant increase in non-performing loans, requiring an increase to the ACL. Additionally, future significant additions to the ACL may be required based on changes in the mix of loans comprising the portfolio, changes in the financial condition of borrowers, which may result from changes in economic conditions, or changes in the assumptions used in determining the ACL. Additionally, federal and state banking regulators, as an integral part of their supervisory function, periodically review the Bank’s loan portfolio and the adequacy of the ACL. These regulatory authorities may require the Bank to recognize further provision for credit losses or charge-offs based upon their judgments, which may be different from the Bank’s judgments. Any increase in the ACL could have an adverse effect, which could be material, on our financial condition and results of operations.
The Bank’s loan portfolio mix increases the exposure to credit risks tied to deteriorating conditions.
The loan portfolio contains a high percentage of commercial, commercial real estate, real estate acquisition and development loans in relation to the total loans and total assets. These types of loans have historically been viewed as having more risk of default than residential real estate loans or certain other types of loans or investments. In fact, the FDIC has issued pronouncements alerting banks of its concern about banks with a heavy concentration of commercial real estate loans. These types of loans also typically are larger than residential real estate loans and other commercial loans. Because the Bank’s loan portfolio contains a significant number of commercial and commercial real estate loans with relatively large balances, the deterioration of one or more of these loans may cause a significant increase in non-performing loans. An increase in non-performing loans could result in a loss of earnings from these loans, an increase in the provision for credit losses, or an increase in charge-offs, which could have a material adverse impact on our results of operations and financial condition.
15
The Bank has a high concentration of loans secured by real estate, so any future deterioration in the real estate markets could require material increases in the ACL and adversely affect our financial condition and results of operations.
The Bank has a high degree of concentration in loans secured by real estate. Any future deterioration in the real estate markets could adversely impact borrowers’ ability to repay loans secured by real estate and the value of real estate collateral, thereby increasing the credit risk associated with the loan portfolio. The Bank’s ability to recover on these loans by selling or disposing of the underlying real estate collateral would be adversely impacted by any decline in real estate values, which increases the likelihood that the Bank will suffer losses on defaulted loans secured by real estate beyond the amounts provided for in the ACL. This, in turn, could require material increases in the ACL which would adversely affect our financial condition and results of operations.
Non-performing assets could increase, which could adversely affect our results of operations and financial condition.
The Bank may experience increases in non-performing assets in the future. Non-performing assets (which include OREO) adversely affect our financial condition and results of operations in various ways. The Bank does not record interest income on non-accrual loans or OREO, thereby adversely affecting its earnings. When the Bank takes collateral in foreclosures and similar proceedings, it is required to mark the related asset to the then fair value of the collateral, less estimated cost to sell, which may result in a charge-off of the value of the asset and lead the Bank to increase the provision for credit losses. An increase in the level of non-performing assets also increases the Bank’s risk profile and may impact the capital levels its regulators believe are appropriate in light of such risks. Further decreases in the value of these assets, or the underlying collateral, or in these borrowers’ performance or financial condition, whether or not due to economic and market conditions beyond the Bank’s control, could adversely affect our business, results of operations and financial condition, perhaps materially. In addition to the carrying costs to maintain OREO, the resolution of non-performing assets increases the Bank’s loan administration costs generally, and requires significant commitments of time from management and our directors, which reduces the time they have to focus on profitably growing our business.
A decline in the fair value of the Bank’s investment portfolio could adversely affect earnings and capital.
The fair value of the Bank’s debt securities could decline as a result of factors including changes in market interest rates, tax reform, credit quality and credit ratings, lack of market liquidity and other economic conditions. For debt securities in an unrealized loss position, the Company may be required to record an allowance for credit losses or write down the security depending on the type of security and the circumstances. Any such impairment charge would have an adverse effect, which could be material, on our results of operations and financial condition, including its capital.
While we believe that the terms of our debt securities have been kept relatively short, we are subject to elevated interest rate risk exposure if rates were to increase sharply. Further, debt securities present a different type of asset quality risk than the loan portfolio. While we believe a relatively conservative management approach has been applied to the investment portfolio, there is always potential loss exposure under changing economic conditions.
The Bank is subject to environmental liability risk associated with our lending activities.
A significant portion of our loan portfolio is secured by real estate, and we could become subject to environmental liabilities with respect to one or more of these properties. During the ordinary course of business, we may foreclose on and take title to properties securing defaulted loans. In doing so, there is a risk that hazardous or toxic substances could be found on these properties. If hazardous conditions or toxic substances are found on these properties, we may be liable for remediation costs, as well as for personal injury and property damage, civil fines and criminal penalties regardless of when the hazardous conditions or toxic substances first affected any particular property. Environmental laws may require us to incur substantial expenses to address unknown liabilities and may materially reduce the affected property’s value or limit our ability to use or sell the affected property. In addition, future laws or more stringent interpretations or enforcement policies with respect to existing laws may increase our exposure to environmental liability. Although we have policies and procedures to perform an environmental review before initiating any foreclosure on nonresidential real property, these reviews may not be sufficient to detect all potential environmental hazards. The remediation costs and any other financial liabilities associated with an environmental hazard could have a material adverse effect on us.
We face competition from technologies used to support and enable banking and financial services.
Emerging technologies and advances and the growth of e-commerce have lowered geographic and monetary barriers of other financial institutions, made it easier for non-depository institutions to offer products and services that traditionally were banking products and allowed non-traditional financial service providers and technology companies to compete with traditional financial service companies in providing electronic and internet-based financial solutions and services, including electronic securities trading, marketplace lending, financial data aggregation and payment processing, including real-time payment platforms. Further, clients may choose to conduct business with other market participants who engage in business or offer products in areas we deem speculative or risky, such as cryptocurrencies. Increased competition may negatively affect our earnings by creating pressure to lower prices or credit standards on our products and services requiring additional investment to improve the quality and delivery of our technology and/or reducing our market share, or affecting the willingness of our clients to do business with us.
16
Interest Rates, Operations and Risk Management
Fluctuating interest rates can adversely affect profitability.
The Bank’s profitability is dependent to a large extent upon net interest income, which is the difference (or “spread”) between the interest earned on loans, investment securities and other interest earning assets and interest paid on deposits, borrowings, and other interest bearing liabilities. Because of the differences in maturities and repricing characteristics of interest earning assets and interest bearing liabilities, changes in interest rates do not produce equivalent changes in interest income earned on interest earning assets and interest paid on interest bearing liabilities. Accordingly, fluctuations in interest rates could adversely affect the Bank’s interest rate spread, and, in turn, profitability. The Bank seeks to manage its interest rate risk within well established policies and guidelines. Generally, the Bank seeks an asset and liability structure that insulates net interest income from large deviations attributable to changes in market rates. However, the Bank’s structures and practices to manage interest rate risk may not be effective in a highly volatile rate environment. While the Federal Reserve increased the federal funds target range seven times in 2017 and 2018, the target rate was decreased three times in 2019 and 2020 saw a return to target rates at or near historical lows as part of the fiscal response to the pandemic.
We may be impacted by the retirement of London Interbank Offered Rate (“LIBOR”) as a reference rate.
In July 2017, the United Kingdom Financial Conduct Authority announced that LIBOR may no longer be published after 2021. LIBOR is used extensively in the U.S and globally as a “benchmark” or “reference rate” for various commercial and financial contracts. In response, the Alternative Reference Rates Committee (“ARRC”), made up of financial and capital market institutions, was convened to address the replacement of LIBOR in the U.S. The ARRC identified a potential successor to LIBOR in the Secured Overnight Financing Rate (“SOFR”) and crafted a plan to facilitate the transition. However, there are significant conceptual and technical differences between LIBOR and SOFR. The Financial Stability Oversight Committee has stated that the end or waning use of LIBOR has the potential to significantly disrupt trading in many important types of financial contracts.
At this time, no consensus exists as to what rate or rates may become acceptable alternatives to LIBOR and it is impossible to predict the effect of any such alternatives on the value of LIBOR-based securities and variable rate loans, subordinated debentures or other securities or financial arrangements. The replacement of LIBOR with one or more alternative rates may impact the availability and cost of hedging instruments and borrowings, including the rates we pay on our subordinated debentures and derivative financial instruments. If LIBOR rates are no longer available, and we are required to implement substitute indices for the calculation of interest rates under contracts or financial instruments to which we are a party, we may incur significant expenses in effecting the transition.
Our business is heavily dependent on the services of members of the senior management team.
We believe our success to date has been substantially dependent on its executive management team. In addition, our unique model relies upon the Presidents of our separate Bank divisions, particularly in light of our decentralized management structure in which such Bank divisions have significant local decision-making authority. The unexpected loss of any of these persons could have an adverse effect on our business and future growth prospects.
Our business is subject to the risks of earthquakes, floods, fires, and other natural catastrophes.
With Bank branches located in Montana, Idaho, Utah, Washington, Wyoming, Colorado, Arizona and Nevada, our business could be affected by a major natural catastrophe, such as a fire, flood, earthquake, or other natural disaster. The occurrence of any of these events may result in a prolonged interruption of our business, which could have a material adverse effect on our financial condition and operations.
Our future performance will depend on our ability to respond timely to technological change.
The financial services industry is experiencing rapid technological changes with frequent introductions of new technology-driven products and services. The effective use of technology increases efficiency and enables financial institutions to better serve customers and to reduce costs. Our future success will depend upon our ability to address the needs of our customers by using technology to provide products and services that will satisfy customer demands for convenience, as well as create additional efficiencies in our operations. We may not be able to effectively implement new technology-driven products or services, or be successful in marketing these products and services. Additionally, the implementation of technological changes and upgrades to maintain current systems and integrate new ones may cause services interruptions, transaction processing errors and system conversion delays and may cause us to fail to comply with applicable laws. There can be no assurance that we will be able to successfully manage the risks associated with increased dependency on technology.
A failure in or breach of the Bank’s operational or security systems, or those of the Bank’s third party service providers, including as a result of cyber attacks, could disrupt business, result in the disclosure or misuse of confidential or proprietary information, damage our reputation, increase costs and cause losses.
In the normal course of its business, the Bank collects, processes and retains sensitive and confidential customer information. Despite the security measures we have in place, our facilities may be vulnerable to cyber-attacks, security breaches, acts of vandalism, computer viruses, misplaced or lost data, programming or human errors, and other similar events.
17
Information security risks for financial institutions such as the Bank have increased recently in part because of new technologies, the use of the Internet and telecommunications technologies, including mobile devises, to conduct financial and other business transactions and the increased sophistication and activities of organized crime, perpetrators of fraud, hackers, terrorists and others. In addition to cyber attacks or other security breaches involving the theft of sensitive and confidential information, hackers have engaged in attacks against financial institutions designed to disrupt key business services such as customer-facing web sites. We are not able to anticipate or implement effective preventative measures against all security breaches of these types. Although the Bank employs detection and response mechanisms designed to contain and mitigate security incidents, early detection may be thwarted by sophisticated attacks and malware designed to avoid detection, which continue to evolve.
Additionally, the Bank faces the risk of operational disruption, failure, termination or capacity constraints of any of the third parties that facilitate its business activities, including exchanges, clearing agents, clearing houses or other financial intermediaries. Such parties could also be the source of an attack on, or breach of, the Bank’s operational systems.
Any failures, interruptions or security breaches in the Bank’s information systems could damage its reputation, result in a loss of customer business, result in a violation of privacy or other laws, or expose us to civil litigation, regulatory fines or losses not covered by insurance.
We could suffer operational, reputational and financial harm if we fail to properly anticipate and manage risk.
We use models and strategies to forecast losses, project revenue, measure and assess capital requirements for credit, market, operational and strategic risks, and assess and control our operations and financial condition. These models require oversight, ongoing monitoring, and periodic reassessment. Models are subject to inherent limitations due to the use of historical trends and simplifying assumptions, uncertainty regarding economic and financial outcomes, and emerging risks from the use of applications that may rely on artificial intelligence. Our models and strategies may not be adequate due to limited historical data and shocks caused by extreme or unanticipated market changes, especially during severe market downturns or stress events. Regardless of the steps we take to ensure effective controls, governance, monitoring and testing, and implement new risk management tools, we could suffer operational, reputational and financial harm if our models and strategies and other risk management tools fail to properly anticipate and manage current and evolving risks.
We have various anti-takeover measures that could impede a takeover.
Our articles of incorporation include certain provisions that could make it more difficult to acquire us by means of a tender offer, a proxy contest, merger or otherwise. These provisions include a requirement that any “Business Combination” (as defined in the articles of incorporation) be approved by at least 80 percent of the voting power of the then outstanding shares, unless it is either approved by our Board or certain price and procedural requirements are satisfied. In addition, the authorization of preferred stock, which is intended primarily as a financing tool and not as a defensive measure against takeovers, may potentially be used by management to make more difficult uninvited attempts to acquire control of us. These provisions may have the effect of lengthening the time required to acquire control of us through a tender offer, proxy contest or otherwise, and may deter any potentially unfriendly offers or other efforts to obtain control of us. This could deprive our shareholders of opportunities to realize a premium for their common stock in the Company, even in circumstances where such action is favored by a majority of our shareholders.
Regulatory Matters
We are subject to heightened regulatory requirements related to our having exceeded $10 billion in assets.
Because our total consolidated assets exceeded $10 billion during the first quarter of 2018, the Dodd-Frank Act and its implementing regulations impose additional requirements on bank holding companies with $10 billion or more in total assets, including compliance with specific sections of the Federal Reserve's prudential oversight requirements. The Durbin Amendment, which was passed as part of the Dodd-Frank Act, instructed the Federal Reserve to establish rules limiting the amount of interchange fees that can be charged to merchants for debit card processing. The Federal Reserve's Final rules contained several key pieces, including in relevant part an interchange fee cap, certain fraud prevention adjustments, and, most notably, an exemption from the interchange fee cap for small issuers. Issuers with less than $10 billion in total assets (as of the end of the previous calendar year) are exempt from the Federal Reserve's interchange fee cap. As our total assets exceeded $10 billion, the interchange fee cap of the Durbin Amendment negatively affected the interchange income the Bank receives from electronic payment transactions. The interchange fee cap became effective to us commencing in July of 2019.
In addition, banks with $10 billion or more in total assets are primarily examined by the CFPB with respect to compliance with various federal consumer financial protection laws and regulations. As a fairly new agency with evolving regulations and practices, it is uncertain as to how the CFPB's examinations and regulatory authority may impact our business.
Changes in accounting standards could materially impact our financial statements.
Periodically, the Financial Accounting Standards Board (“FASB”) and the SEC change the financial accounting and reporting standards that govern the preparation of our financial statements. These changes can materially impact how we record and report our
18
financial condition and results of operations. For information regarding the impact of recently issued accounting standards, see “Item 7. Management’s Discussion and Analysis of Financial Condition and Results of Operations.”
The FDIC has adopted a final rule to increase the federal Deposit Insurance Fund, including additional future premium increases and special assessments.
On March 15, 2016, the FDIC adopted a final rule to increase insurance premiums and has imposed special assessments to rebuild and maintain the DIF, and any additional future premium increases or special assessments could have a material adverse effect on our business, financial condition, and results of operations.
The Dodd-Frank Act broadened the base for FDIC insurance assessments. In addition, the Dodd-Frank Act established 1.35 percent as the minimum DIF reserve ratio. The FDIC has determined that the fund reserve ratio should be 2.0 percent (which is beyond what is required by law) and has adopted a plan under which it will meet the statutory minimum fund reserve ratio of 1.35 percent. The Dodd-Frank Act made banks with $10 billion or more in total assets responsible for the increase from 1.15 percent to 1.35 percent. The increase is effective for banks in the first quarter following four consecutive quarters of total consolidated assets exceeding $10 billion. Since the Bank exceeded the $10 billion asset threshold in the first quarter of 2018, the increase in deposit insurance assessments to be paid by the Bank was effective in the first quarter of 2019. Additionally, under the FDIC’s assessment system for determining payments to the DIF, insured depository institutions with more than $10 billion in assets are assessed under a “scorecard” system.
Additional information regarding this matter is set forth under the section captioned “Deposit Insurance” within “Supervision and Regulation” in “Item 1. Business.”
We operate in a highly regulated environment and changes or increases in, or supervisory enforcement of, banking or other laws and regulations or governmental fiscal or monetary policies could adversely affect us.
We are subject to extensive regulation, supervision and examination by federal and state banking regulators. In addition, as a publicly-traded company, we are subject to regulation by the SEC. Any change in applicable regulations or federal, state or local legislation or in policies or interpretations or regulatory approaches to compliance and enforcement, income tax laws and accounting principles could have a substantial impact on us and our operations. Changes in laws and regulations may also increase expenses by imposing additional fees or taxes or restrictions on operations. Additional legislation and regulations that could significantly affect powers, authority and operations may be enacted or adopted in the future, which could have a material adverse effect on our financial condition and results of operations. Failure to appropriately comply with any such laws, regulations or principles could result in sanctions by regulatory agencies or damage to our reputation, all of which could adversely affect our business, financial condition or results of operations.
Regulators have significant discretion and authority to prevent or remedy unsafe or unsound practices or violations of laws or regulations by financial institutions and bank holding companies in the performance of their supervisory and enforcement duties. Existing and proposed federal and state laws and regulations restrict, limit and govern all aspects of our activities and may affect our ability to expand our business over time, may result in an increase in our compliance costs, and may affect our ability to attract and retain qualified executive officers and employees. The exercise of regulatory authority may have a negative impact on our financial condition and results of operations, including limiting the types of financial services and products we may offer or increasing the ability of non-banks to offer competing financial services and products. Additionally, our business is affected significantly by the fiscal and monetary policies of the federal government and its agencies, including the Federal Reserve.
We cannot accurately predict the full effects of recent legislation or the various other governmental, regulatory, monetary and fiscal initiatives which have been and may be enacted on the financial markets and on us. The terms and costs of these activities, or the failure of these actions to help stabilize the financial markets, asset prices, market liquidity and a continuation or worsening of current financial market and economic conditions could materially and adversely affect our business, financial condition, results of operations, and the trading price of our common stock.
Item 1B. Unresolved Staff Comments
None
19
Item 2. Properties
The following schedule provides information on the Company’s 193 properties as of December 31, 2020:
| (Dollars in thousands) | Properties Leased | Properties Owned | Net Book Value | ||||||||||||||
| Montana | 10 | 62 | $ | 122,014 | |||||||||||||
| Idaho | 6 | 22 | 38,279 | ||||||||||||||
| Utah | 1 | 9 | 11,170 | ||||||||||||||
| Washington | 4 | 12 | 5,642 | ||||||||||||||
| Wyoming | 3 | 15 | 10,667 | ||||||||||||||
| Colorado | 5 | 21 | 31,118 | ||||||||||||||
| Arizona | 6 | 10 | 14,488 | ||||||||||||||
| Nevada | 1 | 6 | 11,116 | ||||||||||||||
| Total | 36 | 157 | $ | 244,494 | |||||||||||||
We believe that all of our facilities are well maintained, generally adequate and suitable for the current operations of our business, as well as fully utilized. In the normal course of business, new locations and facility upgrades occur as needed.
For additional information regarding the Company’s premises and equipment and lease obligations, see Note 4 to the Consolidated Financial Statements in “Item 8. Financial Statements and Supplementary Data.”
Item 3. Legal Proceedings
The Company is involved in various claims, legal actions and complaints which arise in the ordinary course of business. In our opinion, all such matters are adequately covered by insurance, are without merit or are of such kind, or involve such amounts, that unfavorable disposition would not have a material adverse effect on our financial condition or results of operations.
Item 4. Mine Safety Disclosures
Not Applicable
20
PART II
Item 5. Market for Registrant’s Common Equity, Related Stockholder Matters
and Issuer Purchases of Equity Securities
The Company’s stock trades on the NASDAQ Global Select Market under the symbol: GBCI. As of December 31, 2020, there were approximately 1,669 shareholders of record for the Company’s common stock. The market range of high and low market prices for the Company’s common stock for the periods indicated are shown below:
| 2020 | 2019 | ||||||||||||||||||||||
| High | Low | High | Low | ||||||||||||||||||||
| First quarter | $ | 46.10 | 26.66 | 45.47 | 37.58 | ||||||||||||||||||
| Second quarter | 46.54 | 30.30 | 43.44 | 38.65 | |||||||||||||||||||
| Third quarter | 38.13 | 30.05 | 42.61 | 37.70 | |||||||||||||||||||
| Fourth quarter | 47.05 | 31.29 | 46.51 | 38.99 | |||||||||||||||||||
The following table summarizes the Company’s dividends declared during the periods indicated:
| Years ended | |||||||||||
| December 31, 2020 | December 31, 2019 | ||||||||||
| First quarter | $ | 0.29 | 0.26 | ||||||||
| Second quarter | 0.29 | 0.27 | |||||||||
| Third quarter | 0.30 | 0.29 | |||||||||
| Fourth quarter | 0.30 | 0.29 | |||||||||
| Special | 0.15 | 0.20 | |||||||||
| Total | $ | 1.33 | 1.31 | ||||||||
Future cash dividends will depend on a variety of factors, including earnings, capital, asset quality, general economic conditions and regulatory considerations. Information regarding the regulation considerations is set forth under the heading “Supervision and Regulation” in “Item 1. Business.”
Issuer Stock Purchases
The Company made no stock repurchases during 2020.
21
Stock Performance Graph
The following graph compares the yearly cumulative total return of the Company’s common stock over a five-year measurement period with the yearly cumulative total return on the stocks included in 1) the Russell 2000 Index; and 2) the KBW NASDAQ Regional Banking Index (“KBW Regional Banking Index”). Total return includes appreciation in market value of the stock as well as the actual cash and stock dividends paid to shareholders. The graph assumes that the value of the each investment was $100 on December 31, 2015 and that all dividends were reinvested.
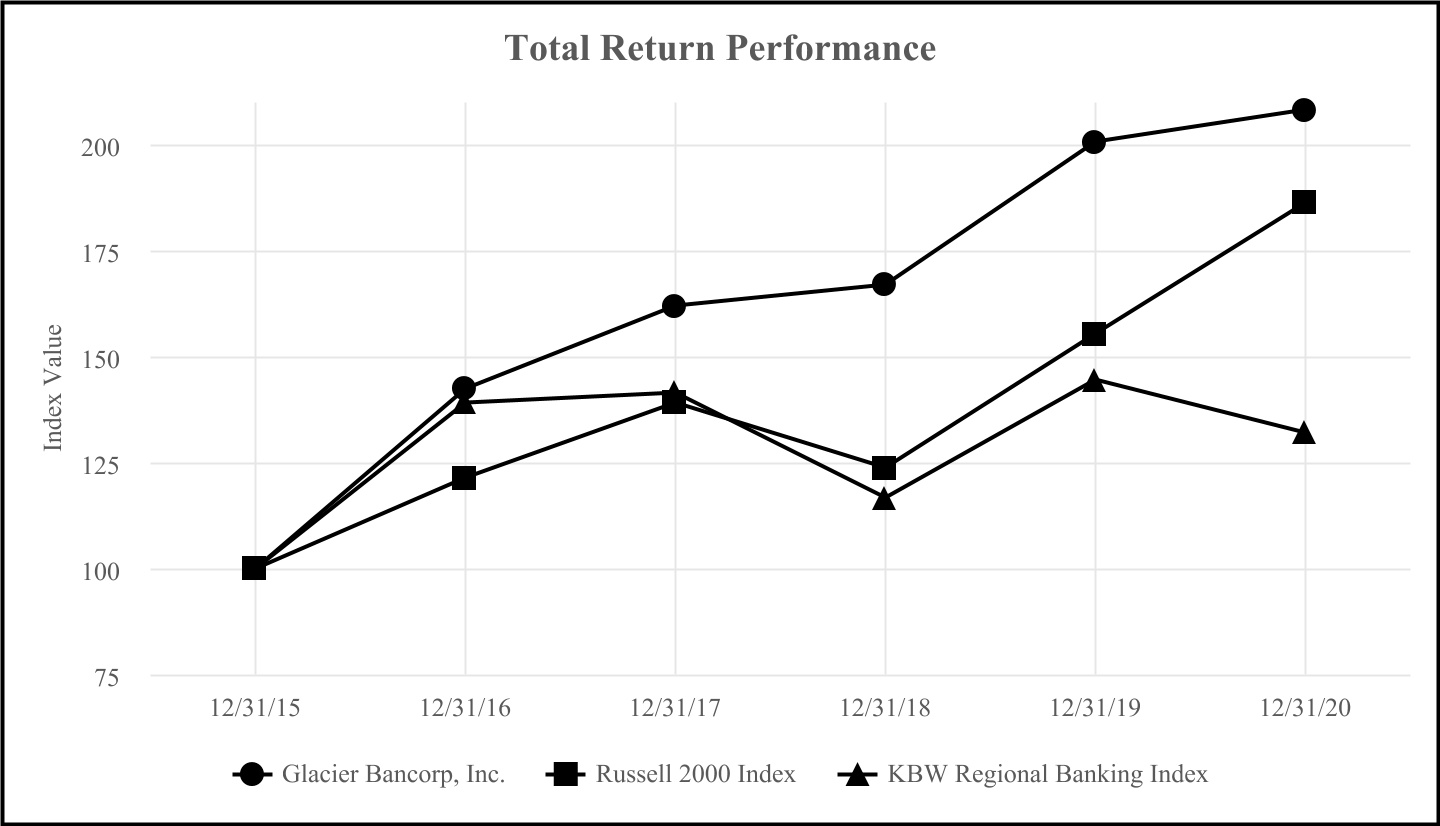
| Period Ending | |||||||||||||||||||||||||||||||||||
| 12/31/15 | 12/31/16 | 12/31/17 | 12/31/18 | 12/31/19 | 12/31/20 | ||||||||||||||||||||||||||||||
| Glacier Bancorp, Inc. | 100.00 | 142.27 | 162.05 | 167.03 | 200.59 | 208.22 | |||||||||||||||||||||||||||||
| Russell 2000 Index | 100.00 | 121.31 | 139.08 | 123.76 | 155.35 | 186.36 | |||||||||||||||||||||||||||||
| KBW Regional Banking Index | 100.00 | 139.02 | 141.45 | 116.70 | 144.49 | 131.91 | |||||||||||||||||||||||||||||
22
Item 6. Selected Financial Data
Non-GAAP Financial Measures
In addition to the results presented in accordance with GAAP, this Annual Report on Form 10-K contains certain non-GAAP financial measures. The Company believes that providing these non-GAAP financial measures provides investors with information useful in understanding and comparing the Company’s financial performance, performance trends, and financial position. While the Company uses these non-GAAP measures in its analysis of the Company’s performance, this information should not be considered an alternative to measurements required by GAAP. The following table provides a reconciliation of certain GAAP financial measures to non-GAAP financial measures.
| Year ended December 31, 2017 | |||||||||||||||||
| (Dollars in thousands, except per share data) | GAAP | Tax Act Adjustment | Non-GAAP | ||||||||||||||
| Federal and state income tax expense | $ | 64,625 | (19,699) | 44,926 | |||||||||||||
| Net income | $ | 116,377 | 19,699 | 136,076 | |||||||||||||
| Basic earnings per share | $ | 1.50 | 0.25 | 1.75 | |||||||||||||
| Diluted earnings per share | $ | 1.50 | 0.25 | 1.75 | |||||||||||||
| Return on average assets | 1.20 | % | 0.21 | % | 1.41 | % | |||||||||||
| Return on average equity | 9.80 | % | 1.66 | % | 11.46 | % | |||||||||||
| Dividend payout ratio | 76.00 | % | (10.86 | %) | 65.14 | % | |||||||||||
| Effective income tax rate | 35.70 | % | (10.88 | %) | 24.82 | % | |||||||||||
The reconciling item between the GAAP and non-GAAP financial measures was due to the one-time tax expense of $19.7 million during the year ended December 31, 2017. The one-time tax expense was driven by The Tax Cuts and Jobs Act (“Tax Act”) and the change in the federal marginal corporate income tax rate from 35 percent to 21 percent for 2018 and future years, which resulted in the revaluation of its deferred tax assets and deferred tax liabilities (“net deferred tax asset”). The Company believes the financial results are more comparable excluding the impact of the revaluation of the net deferred tax asset.
Basic earnings per share is calculated by dividing net income by average outstanding shares and diluted earnings per share is calculated by dividing net income by diluted average outstanding shares. The one-time tax expense of $19.7 million was included in determining income for both the GAAP basic earnings per share and the GAAP diluted earnings per share. Conversely, the one-time tax expense of $19.7 million was excluded in determining income for both the non-GAAP basic earnings per share and the non-GAAP diluted earnings per share. Average outstanding shares of 77,537,664 was used in the GAAP and non-GAAP basic earnings per share for the year ended December 31, 2017. Diluted average outstanding shares of 77,607,605 was used in the GAAP and non-GAAP diluted earnings per share for the year ended December 31, 2017.
The return on average assets ratio is calculated by dividing net income by average assets and the return on average equity ratio is calculated by dividing net income by average equity. The one-time tax expense of $19.7 million was included in determining income for both the GAAP return on average assets and the GAAP return on average equity. Conversely, the one-time tax expense of $19.7 million was excluded in determining income for both the non-GAAP return on average assets and the non-GAAP return on average equity. Average assets of $9.678 billion was used in the GAAP and non-GAAP return on average assets ratios for the year ended December 31, 2017. Average equity of $1.188 billion was used in the GAAP and non-GAAP return on average equity ratios for the year ended December 31, 2017.
The dividend payout ratio is calculated by dividing dividends declared per share by basic earnings per share. The non-GAAP dividend payout ratio uses the non-GAAP basic earnings per share for calculating the ratio.
The effective income tax rate is calculated by dividing federal and state income tax expense by income before income taxes. The non-GAAP effective income tax rate uses the non-GAAP federal and state income tax expense of $44.9 million for calculating the rate.
23
Selected Financial Data
The following financial data of the Company is derived from the Company’s historical audited financial statements and related notes. The information set forth below should be read in conjunction with “Item 7. Management’s Discussion and Analysis of Financial Condition and Results of Operations” and “Item 8. Financial Statements and Supplementary Data” contained elsewhere in this Annual Report on Form 10-K.
| December 31, | Compounded Annual Growth Rate | ||||||||||||||||||||||||||||||||||||||||
| (Dollars in thousands, except per share data) | 2020 | 2019 | 2018 | 2017 | 2016 | 1-Year | 5-Year | ||||||||||||||||||||||||||||||||||
Selected Statements of Financial Condition Information | |||||||||||||||||||||||||||||||||||||||||
| Total assets | $ | 18,504,206 | $ | 13,683,999 | $ | 12,115,484 | $ | 9,706,349 | $ | 9,450,600 | 35.2 % | 14.4 % | |||||||||||||||||||||||||||||
| Debt securities | 5,527,650 | 2,799,863 | 2,869,578 | 2,426,556 | 3,101,151 | 97.4 % | 12.3 % | ||||||||||||||||||||||||||||||||||
| Loans receivable, net | 10,964,453 | 9,388,320 | 8,156,310 | 6,448,256 | 5,554,891 | 16.8 % | 14.6 % | ||||||||||||||||||||||||||||||||||
| Allowance for credit losses | (158,243) | (124,490) | (131,239) | (129,568) | (129,572) | 27.1 % | 4.1 % | ||||||||||||||||||||||||||||||||||
| Goodwill and intangibles | 569,522 | 519,704 | 338,828 | 191,995 | 159,400 | 9.6 % | 29.0 % | ||||||||||||||||||||||||||||||||||
| Deposits | 14,797,529 | 10,776,457 | 9,493,767 | 7,579,747 | 7,372,279 | 37.3 % | 15.0 % | ||||||||||||||||||||||||||||||||||
| Federal Home Loan Bank advances | — | 38,611 | 440,175 | 353,995 | 251,749 | (100.0) | % | (100.0) | % | ||||||||||||||||||||||||||||||||
Securities sold under agreements to repurchase and other borrowed funds | 1,037,651 | 598,644 | 410,859 | 370,797 | 478,090 | 73.3 % | 16.8 % | ||||||||||||||||||||||||||||||||||
| Stockholders’ equity | 2,307,041 | 1,960,733 | 1,515,854 | 1,199,057 | 1,116,869 | 17.7 % | 15.6 % | ||||||||||||||||||||||||||||||||||
| Equity per share | 24.18 | 21.25 | 17.93 | 15.37 | 14.59 | 13.8 % | 10.6 % | ||||||||||||||||||||||||||||||||||
| Equity as a percentage of total assets | 12.5 % | 14.3 | % | 12.5 | % | 12.4 | % | 11.8 | % | (13.0) | % | 1.1 % | |||||||||||||||||||||||||||||
| Years ended December 31, | Compounded Annual Growth Rate | ||||||||||||||||||||||||||||||||||||||||
| (Dollars in thousands, except per share data) | 2020 | 2019 | 2018 | 2017 | 2016 | 1-Year | 5-Year | ||||||||||||||||||||||||||||||||||
| Summary Statements of Operations | |||||||||||||||||||||||||||||||||||||||||
| Interest income | $ | 627,064 | $ | 546,177 | $ | 468,996 | $ | 375,022 | $ | 344,153 | 14.8 % | 12.7 % | |||||||||||||||||||||||||||||
| Interest expense | 27,315 | 42,773 | 35,531 | 29,864 | 29,631 | (36.1) | % | (1.6) | % | ||||||||||||||||||||||||||||||||
| Net interest income | 599,749 | 503,404 | 433,465 | 345,158 | 314,522 | 19.1 % | 13.8 % | ||||||||||||||||||||||||||||||||||
| Provision for credit losses | 39,765 | 57 | 9,953 | 10,824 | 2,333 | 69,663.2 % | 76.3 % | ||||||||||||||||||||||||||||||||||
| Non-interest income | 172,867 | 130,774 | 118,824 | 112,239 | 107,318 | 32.2 % | 10.0 % | ||||||||||||||||||||||||||||||||||
| Non-interest expense | 404,811 | 374,927 | 320,127 | 265,571 | 258,714 | 8.0 % | 9.4 % | ||||||||||||||||||||||||||||||||||
| Income before income taxes | 328,040 | 259,194 | 222,209 | 181,002 | 160,793 | 26.6 % | 15.3 % | ||||||||||||||||||||||||||||||||||
Federal and state income tax expense 1 | 61,640 | 48,650 | 40,331 | 44,926 | 39,662 | 26.7 % | 9.2 % | ||||||||||||||||||||||||||||||||||
Net income 1 | $ | 266,400 | $ | 210,544 | $ | 181,878 | $ | 136,076 | $ | 121,131 | 26.5 % | 17.1 % | |||||||||||||||||||||||||||||
Basic earnings per share 1 | $ | 2.81 | $ | 2.39 | $ | 2.18 | $ | 1.75 | $ | 1.59 | 17.6 % | 12.1 % | |||||||||||||||||||||||||||||
Diluted earnings per share 1 | $ | 2.81 | $ | 2.38 | $ | 2.17 | $ | 1.75 | $ | 1.59 | 18.1 % | 12.1 % | |||||||||||||||||||||||||||||
| Dividends declared per share | $ | 1.33 | $ | 1.31 | $ | 1.31 | $ | 1.14 | $ | 1.10 | 1.5 % | 3.9 % | |||||||||||||||||||||||||||||
24
| At or for the Years ended December 31, | ||||||||||||||||||||||||||||||||
| (Dollars in thousands) | 2020 | 2019 | 2018 | 2017 | 2016 | |||||||||||||||||||||||||||
| Selected Ratios and Other Data | ||||||||||||||||||||||||||||||||
Return on average assets 1 | 1.62 | % | 1.64 | % | 1.59 | % | 1.41 | % | 1.32 | % | ||||||||||||||||||||||
Return on average equity 1 | 12.15 | % | 12.01 | % | 12.56 | % | 11.46 | % | 10.79 | % | ||||||||||||||||||||||
Dividend payout ratio 1 | 47.33 | % | 54.81 | % | 60.09 | % | 65.14 | % | 69.18 | % | ||||||||||||||||||||||
| Average equity to average asset ratio | 13.35 | % | 13.69 | % | 12.67 | % | 12.27 | % | 12.27 | % | ||||||||||||||||||||||
Total capital (to risk-weighted assets) | 14.63 | % | 14.95 | % | 14.70 | % | 15.64 | % | 16.38 | % | ||||||||||||||||||||||
Tier 1 capital (to risk-weighted assets) | 12.42 | % | 13.76 | % | 13.37 | % | 14.39 | % | 15.12 | % | ||||||||||||||||||||||
Common Equity Tier 1 (to risk-weighted assets) | 12.42 | % | 12.58 | % | 12.10 | % | 12.81 | % | 13.42 | % | ||||||||||||||||||||||
Tier 1 capital (to average assets) | 9.12 | % | 11.65 | % | 11.35 | % | 11.90 | % | 11.90 | % | ||||||||||||||||||||||
Net interest margin on average earning assets (tax-equivalent) | 4.09 | % | 4.39 | % | 4.21 | % | 4.12 | % | 4.02 | % | ||||||||||||||||||||||
Efficiency ratio 2 | 49.97 | % | 57.78 | % | 54.73 | % | 53.94 | % | 55.88 | % | ||||||||||||||||||||||
Allowance for credit losses as a percent of loans | 1.42 | % | 1.31 | % | 1.58 | % | 1.97 | % | 2.28 | % | ||||||||||||||||||||||
Allowance for credit losses as a percent of nonperforming loans | 470 | % | 385 | % | 266 | % | 255 | % | 257 | % | ||||||||||||||||||||||
Non-performing assets as a percentage of subsidiary assets | 0.19 | % | 0.27 | % | 0.47 | % | 0.68 | % | 0.76 | % | ||||||||||||||||||||||
| Non-performing assets | $ | 35,433 | 37,437 | 56,750 | 65,179 | 71,385 | ||||||||||||||||||||||||||
| Loans originated and acquired | $ | 7,934,881 | 4,607,536 | 4,301,678 | 3,629,493 | 3,474,000 | ||||||||||||||||||||||||||
Number of full time equivalent employees | 2,970 | 2,826 | 2,623 | 2,278 | 2,222 | |||||||||||||||||||||||||||
| Number of locations | 193 | 181 | 167 | 145 | 142 | |||||||||||||||||||||||||||
______________________________
1 Excludes a one-time revaluation of the deferred tax assets and deferred tax liabilities as a result of the Tax Act for the year ended December 31, 2017. For additional information on the revaluation, see the “Non-GAAP Financial Measures” section.
2 Non-interest expense before OREO expenses, core deposit intangibles amortization, goodwill impairment charges, and non-recurring expense items as a percentage of tax-equivalent net interest income and non-interest income, excluding gains or losses on sale of investments, OREO income, and non-recurring income items.
25
Item 7. Management’s Discussion and Analysis of Financial Condition and Results of Operations
The following discussion is intended to provide a more comprehensive review of the Company’s operating results and financial condition than can be obtained from reading the Consolidated Financial Statements alone. The discussion should be read in conjunction with the Consolidated Financial Statements and the notes thereto included in “Item 8. Financial Statements and Supplementary Data.”
CAUTIONARY NOTE REGARDING FORWARD-LOOKING STATEMENTS
This Annual Report on Form 10-K contains forward-looking statements within the meaning of the Private Securities Litigation Reform Act of 1995. These forward-looking statements include, but are not limited to, statements about the Company’s plans, objectives, expectations and intentions that are not historical facts, and other statements identified by words such as “expects,” “anticipates,” “intends,” “plans,” “believes,” “should,” “projects,” “seeks,” “estimates”, or the negative version of those words or other comparable words or phrases of a future or forward-looking nature. These forward-looking statements are based on current beliefs and expectations of management and are inherently subject to significant business, economic and competitive uncertainties and contingencies, many of which are beyond the Company’s control. In addition, these forward-looking statements are subject to assumptions with respect to future business strategies and decisions that are subject to change. The following factors, among others, could cause actual results to differ materially from the anticipated results (express or implied) or other expectations in the forward-looking statements, including those factors set forth under “Risk Factors” and in other sections in this Annual Report on Form 10-K, or the documents incorporated by reference:
•the risks associated with lending and potential adverse changes of the credit quality of loans in the Company’s portfolio;
•changes in trade, monetary and fiscal policies and laws, including interest rate policies of the Board of Governors of the Federal Reserve System, which could adversely affect the Company’s net interest income and profitability;
•changes in the cost and scope of insurance from the FDIC and other third parties;
•the scope, duration, and effects of the COVID-19 pandemic, including on the Company’s credit quality and operations as well as its impact on general economic conditions;
•legislative or regulatory changes, including actions taken by governmental authorities in response to the COVID-19 pandemic;
•ability to complete prospective future acquisitions;
•costs or difficulties related to the completion and integration of acquisitions;
•the goodwill the Company has recorded in connection with acquisitions could become impaired, which may have an adverse impact on earnings and capital;
•changes in interest rates, deposit flows, costs of funds, demand for loan products and the demand for financial services in each case as may be further affected by the COVID-19 pandemic;
•the reputation of banks and the financial services industry could deteriorate, which could adversely affect the Company's ability to obtain and maintain customers;
•competition among financial institutions in the Company's markets may increase significantly, including due to the entry of new participants that rely on emerging technologies to make loans and acquire deposits which may not be as heavily regulated as we are;
•the risks presented by continued public stock market volatility, which could adversely affect the market price of the Company’s common stock and the ability to grow the Company through acquisitions or raise capital in the future;
•the projected business and profitability of an expansion or the opening of a new branch could be lower than expected;
•consolidation in the financial services industry in the Company’s markets resulting in larger financial institutions with greater resources and decreasing opportunities to pursue acquisitions;
•dependence on the CEO, the senior management team and the Presidents of Glacier Bank divisions;
•material failure, potential interruption or breach in security of the Company’s systems or those of our vendors and technological changes or changes in actors and techniques used by cyber criminals which could expose us to new risks (e.g., cybersecurity), fraud or system failures;
•natural disasters, including fires, floods, earthquakes, and other unexpected events;
•the Company’s success in managing risks involved in the foregoing; and
•the effects of any reputational damage to the Company resulting from any of the foregoing.
Additional factors that could cause actual results to differ materially from those expressed in the forward-looking statements are discussed in “Item 1A. Risk Factors.” Please take into account that forward-looking statements speak only as of the date of this Annual Report on Form 10-K (or documents incorporated by reference, if applicable). Given the described uncertainties and risks, the Company cannot guarantee its future performance or results of operations and you should not place undue reliance on these forward-looking statements. The Company does not undertake any obligation to publicly correct, revise, or update any forward-looking statement if it later becomes aware that actual results are likely to differ materially from those expressed in such forward-looking statement, except as required under federal securities laws.
26
MANAGEMENT’S DISCUSSION AND ANALYSIS
OF FINANCIAL CONDITION AND RESULTS OF OPERATIONS
YEAR ENDED DECEMBER 31, 2020 COMPARED TO DECEMBER 31, 2019
Highlights and Overview
The Company’s oversight of strategy was salient following the onset of the COVID-19 pandemic. The Company worked diligently to assess the impact of the pandemic on all facets of the Company, examining financial impacts, the ability to meet customer needs, the effect of regulatory actions to combat the pandemic on our operations, measures taken to protect the health and safety of our employees and customers and our business continuity strategy. The Company remained engaged on each of these initiatives throughout the year by receiving regular updates from management and providing input and oversight. Through continuous monitoring, the Company was able to take actions to ensure that disruptions to customers were minimal while preventing any furloughs, layoffs, or reductions in compensation for our employees.
In order to meet the needs of its customers impacted by the pandemic, the Company provided funding, flexible repayment options or modifications if necessary. During the year, the Company modified 3,054 loans in the amount of $1.515 billion primarily with short-term payment deferrals under six months. As of year end, only $94.9 million of the modifications remain in the deferral period. In addition, the Company originated Small Business Association (“SBA”) Paycheck Protection Program (“PPP”) loans for small businesses in its communities. The Company originated 16,090 PPP in the amount of $1.472 billion during the current year of which $539 million, or 37 percent, were forgiven by the SBA during the year. In the coming year, the Company will continue to remain flexible in responding to changing conditions due to COVD-19 in the markets it serves and remains optimistic it can continue to deliver profitable results.
During 2020, the Company acquired all the outstanding stock of SBAZ, a community bank based in Lake Havasu City, Arizona with total assets of $745 million. SBAZ provides banking services to individuals and business in Arizona with ten locations in Bullhead City, Cottonwood, Kingman, Lake Havasu City, Phoenix, Prescott Valley and Prescott. Upon closing of the transaction, SBAZ was merged into the Company’s Foothills Bank division, which expanded the Company’s footprint in Arizona to cover all major markets and established it as a leading community bank in Arizona. See Note 23 in the Consolidated Financial Statements in “Item 8. Financial Statements and Supplementary Data” for additional information regarding these acquisitions.
The Company ended the year at $18.504 billion in assets, which was a 35 percent increase over the prior year and was driven primarily by the current year acquisition along with increases from the PPP loans and debt securities purchased as a result of excess liquidity. Organic loan growth was $1.158 billion, or 12 percent, during the current year and excluding the PPP loans, organic loan growth was $249 million, or 3 percent. The Company experienced another great year in core deposit which organically increased $3.433 billion, or 32 percent, with non-interest bearing deposits increasing $1.616 billion, or 44 percent, during the year.
Tangible stockholders’ equity increased $296 million, or $2.60 per share, as a result of earnings retention, an increase in other comprehensive income (“OCI”) and Company stock issued in connection with the current year acquisition. The Company increased its total regular quarterly dividends declared from $1.11 per share during 2019 to $1.18 per share in 2020. During the current year, S&P Dow Jones Indices selected the Company to transition from the S&P SmallCap 600® to the S&P MidCap 400®. The S&P MidCap 400® index consist of 400 companies that are chosen with regard to market capitalizing, liquidity and industry representation.
The Company continued to decrease its non-performing assets and ended the year at $35.4 million, or 0.19 percent of assets, which was a decrease of $2.0 million, or 5 percent, from the prior year end. In addition, early stage delinquencies (accruing 30-89 days past due) as a percentage of loans at December 31, 2020 was 0.20 percent compared to 0.24 percent at the prior year end.
The Company had record net income for the year of $266 million, which was an increase of $55.9 million, or 27 percent, over the prior year net income of $211 million. Diluted earnings per share for the year was $2.81, an increase of 18 percent, from the 2019 diluted earnings per share of $2.38. The improvement in net income for 2020 was due to recent acquisitions, organic growth, the significant increase in commercial interest income from the PPP loans and the record year for gain on sale of loans. The Company's net interest margin for 2020 was 4.09 percent, a 30 basis points decrease from the net interest margin of 4.39 percent from 2019 which was primarily driven by the low rate environment and the shift in the earning asset mix from higher yielding loans to lower yielding debt securities.
Looking forward, the Company’s future performance will depend on many factors including economic conditions in the markets the Company serves, interest rate changes, increasing competition for deposits and loans, loan quality and growth, the impact and successful integration of acquisitions, and managing regulatory burden.
27
Financial Highlights
| At or for the Years ended | |||||||||||
| (Dollars in thousands, except per share and market data) | December 31, 2020 | December 31, 2019 | |||||||||
| Operating results | |||||||||||
Net income | $ | 266,400 | 210,544 | ||||||||
Basic earnings per share | $ | 2.81 | 2.39 | ||||||||
Diluted earnings per share | $ | 2.81 | 2.38 | ||||||||
| Dividends declared per share | $ | 1.33 | 1.31 | ||||||||
| Market value per share | |||||||||||
| Closing | $ | 46.01 | 45.99 | ||||||||
| High | $ | 47.05 | 46.51 | ||||||||
| Low | $ | 26.66 | 37.58 | ||||||||
| Selected ratios and other data | |||||||||||
| Number of common stock shares outstanding | 95,426,364 | 92,289,750 | |||||||||
| Average outstanding shares - basic | 94,883,864 | 88,255,290 | |||||||||
| Average outstanding shares - diluted | 94,932,353 | 88,385,775 | |||||||||
Return on average assets (annualized) | 1.62 | % | 1.64 | % | |||||||
Return on average equity (annualized) | 12.15 | % | 12.01 | % | |||||||
| Efficiency ratio | 49.97 | % | 57.78 | % | |||||||
Dividend payout ratio | 47.33 | % | 54.81 | % | |||||||
| Loan to deposit ratio | 76.29 | % | 88.92 | % | |||||||
| Number of full time equivalent employees | 2,970 | 2,826 | |||||||||
| Number of locations | 193 | 181 | |||||||||
| Number of ATMs | 250 | 248 | |||||||||
Recent Acquisitions
The Company completed the following acquisitions during the last two years:
•State Bank Corp. and its wholly-owned subsidiary, State Bank of Arizona;
•Heritage Bancorp and its wholly-owned subsidiary, Heritage Bank of Nevada; and
•FNB Bancorp and its wholly-owned subsidiary, The First National Bank of Layton.
The business combinations were accounted for using the acquisition method with the results of operations included in the Company’s consolidated financial statements as of the acquisition dates. For additional information regarding acquisitions, see Note 23 to the Consolidated Financial Statements in “Item 8. Financial Statements and Supplementary Data.” The following table discloses the fair value of selected classifications of assets and liabilities acquired:
| (Dollars in thousands) | SBAZ February 29, 2020 | Heritage July 31, 2019 | FNB April 30, 2019 | ||||||||||||||
| Total assets | $ | 745,420 | 977,944 | 379,155 | |||||||||||||
| Debt securities | 142,174 | 103,231 | 47,247 | ||||||||||||||
| Loans receivable | 451,702 | 615,279 | 245,485 | ||||||||||||||
| Non-interest bearing deposits | 141,620 | 296,393 | 93,647 | ||||||||||||||
| Interest bearing deposits | 461,669 | 425,827 | 180,999 | ||||||||||||||
Borrowings | 10,904 | — | 7,273 | ||||||||||||||
28
Financial Condition Analysis
Assets
The following table summarizes the Company’s assets as of the dates indicated:
| (Dollars in thousands) | December 31, 2020 | December 31, 2019 | $ Change | % Change | |||||||||||||||||||
| Cash and cash equivalents | $ | 633,142 | $ | 330,961 | $ | 302,181 | 91 | % | |||||||||||||||
| Debt securities, available-for-sale | 5,337,814 | 2,575,252 | 2,762,562 | 107 | % | ||||||||||||||||||
| Debt securities, held-to-maturity | 189,836 | 224,611 | (34,775) | (15 | %) | ||||||||||||||||||
| Total debt securities | 5,527,650 | 2,799,863 | 2,727,787 | 97 | % | ||||||||||||||||||
| Loans receivable | |||||||||||||||||||||||
| Residential real estate | 802,508 | 926,388 | (123,880) | (13 | %) | ||||||||||||||||||
| Commercial real estate | 6,315,895 | 5,579,307 | 736,588 | 13 | % | ||||||||||||||||||
| Other commercial | 3,054,817 | 2,094,254 | 960,563 | 46 | % | ||||||||||||||||||
| Home equity | 636,405 | 617,201 | 19,204 | 3 | % | ||||||||||||||||||
| Other consumer | 313,071 | 295,660 | 17,411 | 6 | % | ||||||||||||||||||
| Loans receivable | 11,122,696 | 9,512,810 | 1,609,886 | 17 | % | ||||||||||||||||||
| Allowance for credit losses | (158,243) | (124,490) | (33,753) | 27 | % | ||||||||||||||||||
| Loans receivable, net | 10,964,453 | 9,388,320 | 1,576,133 | 17 | % | ||||||||||||||||||
| Other assets | 1,378,961 | 1,164,855 | 214,106 | 18 | % | ||||||||||||||||||
| Total assets | $ | 18,504,206 | $ | 13,683,999 | $ | 4,820,207 | 35 | % | |||||||||||||||
Total debt securities of $5.528 billion at December 31, 2020 increased $2.728 billion, or 97 percent, from the prior year end. During 2020, the Company purchased debt securities with excess liquidity from the increase in core deposits and SBA forgiveness of PPP loans. Debt securities represented 30 percent of total assets at December 31, 2020 compared to 20 percent of total assets at December 31, 2019. The loan portfolio of $11.123 billion increased $1.610 billion, or 17 percent during the current year. Excluding the PPP loans and the SBAZ acquisition, the loan portfolio increased $249 million, or 3 percent, from the prior year end with the largest increase in commercial real estate loans which increased $401 million, or 7 percent.
Liabilities
The following table summarizes the Company’s liabilities as of the dates indicated:
| (Dollars in thousands) | December 31, 2020 | December 31, 2019 | $ Change | % Change | |||||||||||||||||||
| Deposits | |||||||||||||||||||||||
| Non-interest bearing deposits | $ | 5,454,539 | $ | 3,696,627 | $ | 1,757,912 | 48 | % | |||||||||||||||
| NOW and DDA accounts | 3,698,559 | 2,645,404 | 1,053,155 | 40 | % | ||||||||||||||||||
| Savings accounts | 2,000,174 | 1,485,487 | 514,687 | 35 | % | ||||||||||||||||||
| Money market deposit accounts | 2,627,336 | 1,937,141 | 690,195 | 36 | % | ||||||||||||||||||
| Certificate accounts | 978,779 | 958,501 | 20,278 | 2 | % | ||||||||||||||||||
| Core deposits, total | 14,759,387 | 10,723,160 | 4,036,227 | 38 | % | ||||||||||||||||||
| Wholesale deposits | 38,142 | 53,297 | (15,155) | (28 | %) | ||||||||||||||||||
| Deposits, total | 14,797,529 | 10,776,457 | 4,021,072 | 37 | % | ||||||||||||||||||
| Securities sold under agreements to repurchase | 1,004,583 | 569,824 | 434,759 | 76 | % | ||||||||||||||||||
| Federal Home Loan Bank advances | — | 38,611 | (38,611) | (100 | %) | ||||||||||||||||||
| Other borrowed funds | 33,068 | 28,820 | 4,248 | 15 | % | ||||||||||||||||||
| Subordinated debentures | 139,959 | 139,914 | 45 | — | % | ||||||||||||||||||
| Other liabilities | 222,026 | 169,640 | 52,386 | 31 | % | ||||||||||||||||||
| Total liabilities | $ | 16,197,165 | $ | 11,723,266 | $ | 4,473,899 | 38 | % | |||||||||||||||
29
Excluding the SBAZ acquisition, core deposits increased $3.433 billion, or 32 percent, from the prior year end, with non-interest bearing deposits increasing $1.616 billion, or 44 percent. The current year significant increase in deposits was attributable to a number of factors including the PPP loan proceeds deposited by customers and the increase in customer savings. Non-interest bearing deposits were 37 percent of total core deposits at December 31, 2020 compared to 34 percent at December 31, 2019.
Wholesale deposits of $38.1 million at December 31, 2020 decreased $15.2 million, or 28 percent, from the prior year end. Federal Home Loan Bank (“FHLB”) advances were paid off in full as of December 31, 2020, which resulted in a decrease of $38.6 million from the prior year. The reduction in wholesale deposits and FHLB advances were the result of the significant increase in core deposits which funded loans and debt security growth. Wholesale deposits and FHLB advances will continue to fluctuate as necessary for balance sheet growth and to supplement liquidity needs of the Company.
Stockholders’ Equity
The following table summarizes the stockholders’ equity balances as of the dates indicated:
| (Dollars in thousands, except per share data) | December 31, 2020 | December 31, 2019 | $ Change | % Change | |||||||||||||||||||
| Common equity | $ | 2,163,951 | $ | 1,920,507 | $ | 243,444 | 13 | % | |||||||||||||||
Accumulated other comprehensive income | 143,090 | 40,226 | 102,864 | 256 | % | ||||||||||||||||||
| Total stockholders’ equity | 2,307,041 | 1,960,733 | 346,308 | 18 | % | ||||||||||||||||||
Goodwill and core deposit intangible, net | (569,522) | (519,704) | (49,818) | 10 | % | ||||||||||||||||||
| Tangible stockholders’ equity | $ | 1,737,519 | $ | 1,441,029 | $ | 296,490 | 21 | % | |||||||||||||||
| Stockholders’ equity to total assets | 12.47 | % | 14.33 | % | (13 | %) | |||||||||||||||||
Tangible stockholders’ equity to total tangible assets | 9.69 | % | 10.95 | % | (12 | %) | |||||||||||||||||
| Book value per common share | $ | 24.18 | $ | 21.25 | $ | 2.93 | 14 | % | |||||||||||||||
| Tangible book value per common share | $ | 18.21 | $ | 15.61 | $ | 2.60 | 17 | % | |||||||||||||||
Tangible stockholders’ equity increased $296 million over the prior year, which was the result of $112 million of Company stock issued for the acquisitions of SBAZ and an increase in other comprehensive income and earnings retention. These increases more than offset the increase in goodwill and core deposit intangible associated with the acquisition. The current year decrease in both the stockholders’ equity to total assets ratio and the tangible stockholders’ equity to total tangible assets ratio was primarily the result of adding $909 million of PPP loans and $2.7 billion in debt securities. Tangible book value per common share of $18.21 at the current year end increased $2.60 per share from a year ago.
30
Results of Operations
In this section, the Company’s results of operations are discussed for the year ended December 31, 2020 compared to the year ended December 31, 2019. For a discussion of the year ended December 31, 2019 compared to the year ended December 31, 2018, please refer to Part II, Item 7, "Management's Discussion and Analysis of Financial Condition and Results of Operations" in the Annual Report on Form 10-K for the year ended December 31, 2019.
Income Summary
The following table summarizes income for the periods indicated:
| Years ended | $ Change | % Change | |||||||||||||||||||||
| (Dollars in thousands) | December 31, 2020 | December 31, 2019 | |||||||||||||||||||||
| Net interest income | |||||||||||||||||||||||
| Interest income | $ | 627,064 | $ | 546,177 | $ | 80,887 | 15 | % | |||||||||||||||
| Interest expense | 27,315 | 42,773 | (15,458) | (36 | %) | ||||||||||||||||||
| Total net interest income | 599,749 | 503,404 | 96,345 | 19 | % | ||||||||||||||||||
| Non-interest income | |||||||||||||||||||||||
Service charges and other fees | 52,503 | 67,934 | (15,431) | (23 | %) | ||||||||||||||||||
| Miscellaneous loan fees and charges | 7,344 | 5,313 | 2,031 | 38 | % | ||||||||||||||||||
| Gain on sale of loans | 99,450 | 34,064 | 65,386 | 192 | % | ||||||||||||||||||
| Gain on sale of investments | 1,139 | 14,415 | (13,276) | (92 | %) | ||||||||||||||||||
| Other income | 12,431 | 9,048 | 3,383 | 37 | % | ||||||||||||||||||
| Total non-interest income | 172,867 | 130,774 | 42,093 | 32 | % | ||||||||||||||||||
| Total income | $ | 772,616 | $ | 634,178 | $ | 138,438 | 22 | % | |||||||||||||||
| Net interest margin (tax-equivalent) | 4.09 | % | 4.39 | % | |||||||||||||||||||
Net Interest Income
Net-interest income of $600 million for 2020 increased $96.3 million, or 19 percent, over 2019. Interest income of $627 million for the current year increased $80.9 million, or 15 percent, from the prior year and was primarily attributable to a $67.4 million increase in income from commercial loans, including $38.2 million from the PPP loans. Additionally, interest income on debt securities increased $14.1 million, or 17 percent, over the prior year which resulted from the increased volume of debt securities. Interest expense of $27.3 million for 2020 decreased $15.5 million, or 36 percent over the prior year primarily as a result of decreased higher cost FHLB advances combined with the decrease in the cost of deposits and borrowings. The total funding cost (including non-interest bearing deposits) for 2020 was 19 basis points, which decreased 20 basis points compared to 39 basis points in 2019.
The net interest margin as a percentage of earning assets, on a tax-equivalent basis, during 2020 was 4.09 percent, a 30 basis points decrease from the net interest margin of 4.39 percent for 2019. The core net interest margin, excluding 3 basis points of discount accretion and, 1 basis point of non-accrual interest, was 4.05 compared to a core margin of 4.30 percent in the prior year. Although the Company was successful in reducing the total, cost of funding, it was not enough to outpace the decrease in yields on loans and debt securities driven by the current interest rate environment and the shift in the earning asset mix from higher yielding loans to lower yielding debt securities.
Non-interest Income
Non-interest income of $173 million for 2020 increased $42.1 million, or 32 percent, over last year. Service charges and other fees of $52.5 million for 2020 decreased $15.4 million, or 23 percent, from the prior year as a result of a decrease in overdraft activity and the impact of the Durbin Amendment which outpaced the additional fees from increased customer accounts. As of July 1, 2019, the Company became subject to the Durbin Amendment which established limits on the amount of interchange fees that can be charged to merchants for debit card processing. Miscellaneous loan fees increased $2.0 million, or 38 percent, driven by increased activity primarily in residential real estate. Gain of $99.5 million on the sale of loans for 2020, increased $65.4 million, or 192 percent, compared to the prior year as a result of a significant increase in purchase and refinance activity driven by the decrease in interest rates. Other income increased $3.4 million from the prior year and was primarily the result of a gain of $2.4 million on the sale of a former branch building in the first quarter of 2020.
31
During the prior year third quarter, the Company terminated $260 million notional pay-fixed interest rate swaps and corresponding debt along with the sale of $308 million of available-for-sale debt securities. Sale of the investment securities resulted in a gain of $13.8 million in the prior year third quarter. Offsetting the gain was a $10 million loss recognized on the early termination of the interest swaps and a $3.5 million write-off of the remaining unamortized deferred prepayment penalties on FHLB borrowings.
Non-interest Expense
The following table summarizes non-interest expense for the periods indicated:
| Years ended | $ Change | % Change | |||||||||||||||||||||
| (Dollars in thousands) | December 31, 2020 | December 31, 2019 | |||||||||||||||||||||
| Compensation and employee benefits | $ | 253,047 | $ | 222,753 | $ | 30,294 | 14 | % | |||||||||||||||
| Occupancy and equipment | 37,673 | 34,497 | 3,176 | 9 | % | ||||||||||||||||||
| Advertising and promotions | 10,201 | 10,621 | (420) | (4 | %) | ||||||||||||||||||
| Data processing | 21,132 | 17,392 | 3,740 | 22 | % | ||||||||||||||||||
| Other real estate owned | 923 | 1,105 | (182) | (16 | %) | ||||||||||||||||||
Regulatory assessments and insurance | 4,656 | 3,771 | 885 | 23 | % | ||||||||||||||||||
| Loss on termination of hedging activities | — | 13,528 | (13,528) | (100 | %) | ||||||||||||||||||
| Core deposit intangible amortization | 10,370 | 8,485 | 1,885 | 22 | % | ||||||||||||||||||
| Other expenses | 66,809 | 62,775 | 4,034 | 6 | % | ||||||||||||||||||
| Total non-interest expense | $ | 404,811 | $ | 374,927 | $ | 29,884 | 8 | % | |||||||||||||||
Total non-interest expense of $405 million for 2020 increased $29.9 million, or 8 percent, over the prior year. Compensation and employee benefits for 2020 increased $30.3 million, or 14 percent, from last year due to the increased number of employees from acquisitions and organic growth, increased real estate commissions, increased performance-related compensation and annual salary increases which more than offset the $8.9 million deferral of compensation cost from the PPP loans in the current year and the $5.4 million of stock compensation expense in the prior year from the Heritage acquisition. Occupancy and equipment expense for current year increased $3.2 million, or 9 percent from the prior year primarily from increased cost from acquisitions. Data processing expense for the current year increased $3.7 million, or 22 percent, from the prior year as a result of the increased costs from acquisitions along with increased investment in technology infrastructure. Regulatory assessment and insurance for the current year increased $885 thousand from the prior year primarily due to $2.5 million in Small Bank Assessment credits applied in 2019 that more than offset the $530 thousand in Small Bank Assessment credits applied in 2020 and the current year waiver of the State of Montana regulatory assessment. Other expenses of $66.8 million, increased $4.0 million, or 6 percent, from the prior year, including $1.9 million for third party consulting regarding improvements in technology, product and service offerings. Acquisition-related expenses were $7.8 million in the current year compared to $8.5 million in the prior year.
The prior year $13.5 million loss on termination of hedging activities included a $3.5 million write-off of the remaining unamortized deferred prepayment penalties on FHLB debt and a $10 million loss on the termination of pay-fixed interest rate swaps with notional amount of $260 million in the prior year third quarter.
32
Provision for Credit Losses
The following table summarizes the provision for credit losses on the loan portfolio, net charge-offs and select ratios relating to the provision for credit losses on loans for the previous eight quarters:
| (Dollars in thousands) | Provision for Credit Losses on Loans | Net Charge-Offs | ACL as a Percent of Loans | Accruing Loans 30-89 Days Past Due as a Percent of Loans | Non-Performing Assets to Total Sub-sidiary Assets | ||||||||||||||||||||||||
| Fourth quarter 2020 | $ | (1,528) | $ | 4,781 | 1.42 | % | 0.20 | % | 0.19 | % | |||||||||||||||||||
| Third quarter 2020 | 2,869 | 826 | 1.42 | % | 0.15 | % | 0.25 | % | |||||||||||||||||||||
| Second quarter 2020 | 13,552 | 1,233 | 1.42 | % | 0.22 | % | 0.27 | % | |||||||||||||||||||||
| First quarter 2020 | 22,744 | 813 | 1.49 | % | 0.41 | % | 0.26 | % | |||||||||||||||||||||
| Fourth quarter 2019 | — | 1,045 | 1.31 | % | 0.24 | % | 0.27 | % | |||||||||||||||||||||
| Third quarter 2019 | — | 3,519 | 1.32 | % | 0.31 | % | 0.40 | % | |||||||||||||||||||||
| Second quarter 2019 | — | 732 | 1.46 | % | 0.43 | % | 0.41 | % | |||||||||||||||||||||
| First quarter 2019 | 57 | 1,510 | 1.56 | % | 0.44 | % | 0.42 | % | |||||||||||||||||||||
The provision for credit losses was $39.8 million for 2020, including provision for credit losses of $37.6 million on the loan portfolio, $2.1 million of provision for credit losses on unfunded loan commitments, and no provision for credit losses on debt securities. The provision for credit losses was $37.6 million in the current year compared to $57 thousand prior year provision for credit losses on the loan portfolio. The current year increase was primarily attributable to changes in the economic forecast related to COVID-19. Net charge-offs during the current year were $7.7 million compared to $6.8 million during the prior year.
Efficiency Ratio
The efficiency ratio was 49.97 percent for 2020. Excluding the impact from the PPP loans, the efficiency ratio would have been 53.70 percent. The prior year efficiency ratio was 57.78 and excluding the impact from the termination of the cash flow hedges and the accelerated stock compensation expense, the efficiency ratio would have been 54.79 percent. Excluding these adjustments, the current year efficiency ratio decreased 109 basis points from the prior year efficiency ratio which was driven primarily by the combined increased on gain on sale of loans and the increased net interest income that more than offset the decrease in service fee income from the Durbin Amendment and increased compensation expense.
33
ADDITIONAL MANAGEMENT’S DISCUSSION AND ANALYSIS
Investment Activity
The Company’s investment securities primarily consist of debt securities classified as available-for-sale or held-to-maturity. Non-marketable equity securities consist primarily of capital stock issued by the FHLB of Des Moines.
Debt Securities
In November 2018, the Company adopted FASB ASU 2017-12, Derivatives and Hedging, and in doing so redesignated state and local government securities with a carrying value of $270 million, from held-to-maturity classification to available-for-sale classification. The Company considers the available-for-sale classification of these debt securities to be appropriate since it no longer had the intent to hold them to maturity. Debt securities classified as available-for-sale are carried at estimated fair value and debt securities classified as held-to-maturity are carried at amortized cost. Unrealized gains or losses, net of tax, on available-for-sale debt securities are reflected as an adjustment to OCI. The Company’s debt securities are summarized below:
| December 31, 2020 | December 31, 2019 | December 31, 2018 | December 31, 2017 | December 31, 2016 | |||||||||||||||||||||||||||||||||||||||||||||||||||||||
| (Dollars in thousands) | Carrying Amount | Percent | Carrying Amount | Percent | Carrying Amount | Percent | Carrying Amount | Percent | Carrying Amount | Percent | |||||||||||||||||||||||||||||||||||||||||||||||||
Available-for-sale | |||||||||||||||||||||||||||||||||||||||||||||||||||||||||||
U.S. government and federal agency | $ | 38,588 | 1 | % | $ | 20,044 | 1 | % | $ | 23,649 | 1 | % | $ | 31,127 | 1 | % | $ | 39,407 | 1 | % | |||||||||||||||||||||||||||||||||||||||
U.S. government sponsored enterprises | 9,781 | 1 | % | 43,677 | 1 | % | 120,208 | 4 | % | 19,091 | 1 | % | 19,570 | 1 | % | ||||||||||||||||||||||||||||||||||||||||||||
State and local governments | 1,416,683 | 26 | % | 702,398 | 25 | % | 852,250 | 30 | % | 629,501 | 26 | % | 786,373 | 25 | % | ||||||||||||||||||||||||||||||||||||||||||||
| Corporate bonds | 349,098 | 6 | % | 157,602 | 6 | % | 290,817 | 10 | % | 216,762 | 9 | % | 471,951 | 15 | % | ||||||||||||||||||||||||||||||||||||||||||||
Residential mortgage-backed securities | 2,289,090 | 41 | % | 738,724 | 26 | % | 792,915 | 28 | % | 779,283 | 32 | % | 1,007,515 | 33 | % | ||||||||||||||||||||||||||||||||||||||||||||
Commercial mortgage-backed securities | 1,234,574 | 22 | % | 912,807 | 33 | % | 491,824 | 17 | % | 102,479 | 4 | % | 100,661 | 3 | % | ||||||||||||||||||||||||||||||||||||||||||||
Total available-for-sale | 5,337,814 | 97 | % | 2,575,252 | 92 | % | 2,571,663 | 90 | % | 1,778,243 | 73 | % | 2,425,477 | 78 | % | ||||||||||||||||||||||||||||||||||||||||||||
| Held-to-maturity | |||||||||||||||||||||||||||||||||||||||||||||||||||||||||||
State and local governments | 189,836 | 3 | % | 224,611 | 8 | % | 297,915 | 10 | % | 648,313 | 27 | % | 675,674 | 22 | % | ||||||||||||||||||||||||||||||||||||||||||||
| Total held-to-maturity | 189,836 | 3 | % | 224,611 | 8 | % | 297,915 | 10 | % | 648,313 | 27 | % | 675,674 | 22 | % | ||||||||||||||||||||||||||||||||||||||||||||
Total debt securities | $ | 5,527,650 | 100 | % | $ | 2,799,863 | 100 | % | $ | 2,869,578 | 100 | % | $ | 2,426,556 | 100 | % | $ | 3,101,151 | 100 | % | |||||||||||||||||||||||||||||||||||||||
The Company’s debt securities are primarily comprised of state and local government securities and mortgage-backed securities. State and local government securities are largely exempt from federal income tax and the Company’s federal statutory income tax rate of 21 percent is used in calculating the tax-equivalent yields on the tax-exempt securities. As a result of the Tax Act, the federal statutory income tax rate decreased from 35 percent in 2017 to 21 percent beginning in 2018. Mortgage-backed securities largely consists of short, weighted-average life U.S. agency guaranteed residential and commercial mortgage pass-through securities and to a lesser extent, short, weighted-average life U.S. agency guaranteed residential collateralized mortgage obligations. Combined, the mortgage-backed securities provide the Company with ongoing liquidity as scheduled and pre-paid principal is received on the securities.
State and local government securities carry different risks that are not as prevalent in other security types. The Company evaluates the investment grade quality of its securities in accordance with regulatory guidance. Investment grade securities are those where the issuer has an adequate capacity to meet the financial commitments under the security for the projected life of the investment. An issuer has an adequate capacity to meet financial commitments if the risk of default by the obligor is low and the full and timely payment of principal and interest are expected. In assessing credit risk, the Company may use credit ratings from Nationally Recognized Statistical Rating Organizations (“NRSROx”) such as Standard and Poor’s (“S&P”) and Moody’s, as support for the evaluation; however, they are not solely relied upon. There have been no significant differences in the Company’s internal evaluation of the creditworthiness of any issuer when compared with the ratings assigned by the NRSROs.
34
The following table stratifies the state and local government securities by the associated NRSRO ratings. The highest issued rating was used to categorize the securities in the table for those securities where the NRSRO ratings were not at the same level.
| December 31, 2020 | December 31, 2019 | ||||||||||||||||||||||
| (Dollars in thousands) | Amortized Cost | Fair Value | Amortized Cost | Fair Value | |||||||||||||||||||
S&P: AAA / Moody’s: Aaa | $ | 385,773 | 420,646 | 251,101 | 259,690 | ||||||||||||||||||
S&P: AA+, AA, AA- / Moody’s: Aa1, Aa2, Aa3 | 1,015,634 | 1,080,972 | 523,150 | 539,758 | |||||||||||||||||||
S&P: A+, A, A- / Moody’s: A1, A2, A3 | 101,494 | 109,504 | 113,275 | 120,048 | |||||||||||||||||||
| S&P: BBB+, BBB, BBB- / Moody’s: Baa1, Baa2, Baa3 | 3,217 | 3,230 | 3,217 | 3,302 | |||||||||||||||||||
Not rated by either entity | 5,481 | 5,547 | 13,451 | 13,795 | |||||||||||||||||||
Below investment grade | — | — | 201 | 201 | |||||||||||||||||||
Total | $ | 1,511,599 | 1,619,899 | 904,395 | 936,794 | ||||||||||||||||||
State and local government securities largely consist of both taxable and tax-exempt general obligation and revenue bonds. The following table stratifies the state and local government securities by the associated security type.
| December 31, 2020 | December 31, 2019 | ||||||||||||||||||||||
| (Dollars in thousands) | Amortized Cost | Fair Value | Amortized Cost | Fair Value | |||||||||||||||||||
General obligation - unlimited | $ | 625,660 | 672,610 | 445,584 | 465,066 | ||||||||||||||||||
General obligation - limited | 121,886 | 129,250 | 119,884 | 124,939 | |||||||||||||||||||
| Revenue | 745,908 | 798,188 | 325,331 | 332,354 | |||||||||||||||||||
Certificate of participation | 14,098 | 15,636 | 8,003 | 8,815 | |||||||||||||||||||
Other | 4,047 | 4,215 | 5,593 | 5,620 | |||||||||||||||||||
Total | $ | 1,511,599 | 1,619,899 | 904,395 | 936,794 | ||||||||||||||||||
The following table outlines the five states in which the Company owns the highest concentrations of state and local government securities.
| December 31, 2020 | December 31, 2019 | ||||||||||||||||||||||
| (Dollars in thousands) | Amortized Cost | Fair Value | Amortized Cost | Fair Value | |||||||||||||||||||
| New York | $ | 235,036 | 254,976 | 14,701 | 14,870 | ||||||||||||||||||
| California | 148,564 | 166,311 | 23,482 | 24,406 | |||||||||||||||||||
| Texas | 143,421 | 154,511 | 112,397 | 121,641 | |||||||||||||||||||
| Michigan | 139,836 | 148,544 | 141,131 | 116,581 | |||||||||||||||||||
| Washington | 99,699 | 106,012 | 116,458 | 146,538 | |||||||||||||||||||
All other states | 745,043 | 789,545 | 496,226 | 512,758 | |||||||||||||||||||
Total | $ | 1,511,599 | 1,619,899 | 904,395 | 936,794 | ||||||||||||||||||
35
The following table presents the carrying amount and weighted-average yield of available-for-sale and held-to-maturity debt securities by contractual maturity at December 31, 2020. Weighted-average yields are based upon the amortized cost of securities and are calculated using the interest method which takes into consideration premium amortization, discount accretion and mortgage-backed securities’ prepayment provisions. Weighted-average yields on tax-exempt debt securities exclude the federal income tax benefit.
| One Year or Less | After One through Five Years | After Five through Ten Years | After Ten Years | Mortgage-Backed Securities 1 | Total | ||||||||||||||||||||||||||||||||||||||||||||||||||||||||||||||||||
| (Dollars in thousands) | Amount | Yield | Amount | Yield | Amount | Yield | Amount | Yield | Amount | Yield | Amount | Yield | |||||||||||||||||||||||||||||||||||||||||||||||||||||||||||
Available-for-sale | |||||||||||||||||||||||||||||||||||||||||||||||||||||||||||||||||||||||
U.S. government and federal agency | $ | 4 | 1.69 | % | $ | 2,499 | 1.31 | % | $ | 12,398 | 1.56 | % | $ | 23,687 | 1.53 | % | $ | — | — | % | $ | 38,588 | 1.53 | % | |||||||||||||||||||||||||||||||||||||||||||||||
U.S. government sponsored enterprises | 9,002 | 1.05 | % | 779 | 0.95 | % | — | — | % | — | — | % | — | — | % | 9,781 | 1.05 | % | |||||||||||||||||||||||||||||||||||||||||||||||||||||
State and local governments | 9,255 | 2.31 | % | 32,196 | 2.60 | % | 252,176 | 3.52 | % | 1,123,056 | 3.05 | % | — | — | % | 1,416,683 | 3.12 | % | |||||||||||||||||||||||||||||||||||||||||||||||||||||
Corporate bonds | 111,085 | 3.46 | % | 222,566 | 3.27 | % | 15,447 | 3.76 | % | — | — | % | — | — | % | 349,098 | 3.35 | % | |||||||||||||||||||||||||||||||||||||||||||||||||||||
Residential mortgage-backed securities | — | — | % | — | — | % | — | — | % | — | — | % | 2,289,090 | 1.17 | % | 2,289,090 | 1.17 | % | |||||||||||||||||||||||||||||||||||||||||||||||||||||
Commercial mortgage-backed securities | — | — | % | — | — | % | — | — | % | — | — | % | 1,234,574 | 2.38 | % | 1,234,574 | 2.38 | % | |||||||||||||||||||||||||||||||||||||||||||||||||||||
Total available-for-sale | 129,346 | 3.21 | % | 258,040 | 3.16 | % | 280,021 | 3.44 | % | 1,146,743 | 3.02 | % | 3,523,664 | 1.59 | % | 5,337,814 | 2.09 | % | |||||||||||||||||||||||||||||||||||||||||||||||||||||
Held-to-maturity | |||||||||||||||||||||||||||||||||||||||||||||||||||||||||||||||||||||||
State and local governments | 484 | 1.82 | % | 22,032 | 2.60 | % | 67,678 | 2.75 | % | 99,642 | 3.08 | % | — | — | % | 189,836 | 2.90 | % | |||||||||||||||||||||||||||||||||||||||||||||||||||||
Total held-to-maturity | 484 | 1.82 | % | 22,032 | 2.60 | % | 67,678 | 2.75 | % | 99,642 | 3.08 | % | — | — | % | 189,836 | 2.90 | % | |||||||||||||||||||||||||||||||||||||||||||||||||||||
Total debt securities | $ | 129,830 | 3.20 | % | $ | 280,072 | 3.12 | % | $ | 347,699 | 3.30 | % | $ | 1,246,385 | 3.02 | % | $ | 3,523,664 | 1.59 | % | $ | 5,527,650 | 2.12 | % | |||||||||||||||||||||||||||||||||||||||||||||||
______________________________
1 Mortgage-backed securities, which have prepayment provisions, are not assigned to maturity categories due to fluctuations in their prepayment speeds.
Based on an analysis of its available-for-sale debt securities with unrealized losses as of December 31, 2020, the Company determined their decline in value was unrelated to credit loss and was primarily the result of interest rate changes and market spreads subsequent to acquisition. The fair value of the debt securities is expected to recover as payments are received and the debt securities approach maturity. In addition, the Company determined an insignificant amount of credit loss is expected on the held-to-maturity debt securities portfolio; therefore, no ACL has been recognized at December 31, 2020.
For additional information on debt securities, see Notes 1 and 2 to the Consolidated Financial Statements in “Item 8. Financial Statements and Supplementary Data.”
36
Lending Activity
The Company focuses its lending activities primarily on the following types of loans: 1) first-mortgage, conventional loans secured by residential properties, particularly single-family; 2) commercial lending, including agriculture and public entities; and 3) installment lending for consumer purposes (e.g., home equity, automobile, etc.). Supplemental information regarding the Company’s loan portfolio and credit quality based on regulatory classification is provided in the section captioned “Loans by Regulatory Classification” included in “Part I. Item 2. Management’s Discussion and Analysis of Financial Condition and Results of Operations.” The regulatory classification of loans is based primarily on the type of collateral for the loans. Loan information included in “Part I. Item 2. Management’s Discussion and Analysis of Financial Condition and Results of Operations” is based on the Company’s loan segments and classes, which are based on the purpose of the loan, unless otherwise noted as a regulatory classification. The following table summarizes the Company’s loan portfolio as of the dates indicated:
| December 31, 2020 | December 31, 2019 | December 31, 2018 | December 31, 2017 | December 31, 2016 | |||||||||||||||||||||||||||||||||||||||||||||||||||||||
| (Dollars in thousands) | Amount | Percent | Amount | Percent | Amount | Percent | Amount | Percent | Amount | Percent | |||||||||||||||||||||||||||||||||||||||||||||||||
Residential real estate loans | $ | 802,508 | 7 | % | $ | 926,388 | 10 | % | $ | 887,742 | 11 | % | $ | 720,728 | 11 | % | $ | 674,347 | 12 | % | |||||||||||||||||||||||||||||||||||||||
| Commercial loans | |||||||||||||||||||||||||||||||||||||||||||||||||||||||||||
| Real estate | 6,315,895 | 58 | % | 5,579,307 | 59 | % | 4,657,561 | 57 | % | 3,577,139 | 55 | % | 2,990,141 | 54 | % | ||||||||||||||||||||||||||||||||||||||||||||
| Other commercial | 3,054,817 | 28 | % | 2,094,254 | 22 | % | 1,911,171 | 23 | % | 1,579,353 | 25 | % | 1,342,250 | 24 | % | ||||||||||||||||||||||||||||||||||||||||||||
| Total | 9,370,712 | 86 | % | 7,673,561 | 81 | % | 6,568,732 | 80 | % | 5,156,492 | 80 | % | 4,332,391 | 78 | % | ||||||||||||||||||||||||||||||||||||||||||||
Consumer and other loans | |||||||||||||||||||||||||||||||||||||||||||||||||||||||||||
| Home equity | 636,405 | 6 | % | 617,201 | 7 | % | 544,688 | 7 | % | 457,918 | 7 | % | 434,774 | 8 | % | ||||||||||||||||||||||||||||||||||||||||||||
| Other consumer | 313,071 | 3 | % | 295,660 | 3 | % | 286,387 | 4 | % | 242,686 | 4 | % | 242,951 | 4 | % | ||||||||||||||||||||||||||||||||||||||||||||
| Total | 949,476 | 9 | % | 912,861 | 10 | % | 831,075 | 11 | % | 700,604 | 11 | % | 677,725 | 12 | % | ||||||||||||||||||||||||||||||||||||||||||||
| Loans receivable | 11,122,696 | 102 | % | 9,512,810 | 101 | % | 8,287,549 | 102 | % | 6,577,824 | 102 | % | 5,684,463 | 102 | % | ||||||||||||||||||||||||||||||||||||||||||||
ACL | (158,243) | (2 | %) | (124,490) | (1 | %) | (131,239) | (2 | %) | (129,568) | (2 | %) | (129,572) | (2 | %) | ||||||||||||||||||||||||||||||||||||||||||||
Loans receivable, net | $ | 10,964,453 | 100 | % | $ | 9,388,320 | 100 | % | $ | 8,156,310 | 100 | % | $ | 6,448,256 | 100 | % | $ | 5,554,891 | 100 | % | |||||||||||||||||||||||||||||||||||||||
The stated maturities or first repricing term (if applicable) for the loan portfolio at December 31, 2020 was as follows:
| (Dollars in thousands) | Residential Real Estate | Commercial | Consumer and Other | Total | |||||||||||||||||||
| Variable rate maturing or repricing | |||||||||||||||||||||||
| In one year or less | $ | 210,290 | 1,943,066 | 336,277 | 2,489,633 | ||||||||||||||||||
| After one year through five years | 294,636 | 3,213,553 | 287,725 | 3,795,914 | |||||||||||||||||||
| Thereafter | 40,752 | 253,689 | 5,584 | 300,025 | |||||||||||||||||||
| Fixed rate maturing | |||||||||||||||||||||||
| In one year or less | 126,330 | 1,829,434 | 103,140 | 2,058,904 | |||||||||||||||||||
| After one year through five years | 114,965 | 1,647,208 | 180,312 | 1,942,485 | |||||||||||||||||||
| Thereafter | 15,535 | 483,762 | 36,438 | 535,735 | |||||||||||||||||||
| Total | $ | 802,508 | 9,370,712 | 949,476 | 11,122,696 | ||||||||||||||||||
Residential Real Estate Lending
The Company’s lending activities consist of the origination of both construction and permanent loans on residential real estate. The Company actively solicits residential real estate loan applications from real estate brokers, contractors, existing customers, customer referrals, and on-line applications. The Company’s lending policies generally limit the maximum loan-to-value ratio on residential mortgage loans to 80 percent of the lesser of the appraised value or purchase price. Policies allow for higher loan-to-values with appropriate risk mitigation such as documented compensating factors, credit enhancement, etc. For loans held for sale, the Company complies with each investor’s loan-to-value guidelines. The Company also provides interim construction financing for single-family dwellings. These loans are supported by a term take-out commitment.
37
Consumer Land or Lot Loans
The Company originates land and lot acquisition loans to borrowers who intend to construct their primary residence on the respective land or lot. These loans are generally for a term of three to five years and are secured by the developed land or lot with the loan-to-value limited to the lesser of 75 percent of the appraised value or 75 percent of the cost.
Unimproved Land and Land Development Loans
Although the Company has originated very few unimproved land and land development loans since the economic downturn in 2008, the Company may originate such loans on properties intended for residential and commercial use where improved real estate market conditions have occurred. These loans are typically made for a term of 18 months to two years and are secured by the developed property with a loan-to-value not to exceed the lesser of 75 percent of cost or 65 percent of the appraised discounted bulk sale value upon completion of the improvements. The projects under development are inspected on a regular basis and advances are made on a percentage-of-completion basis. The loans are made to borrowers with real estate development experience and appropriate financial strength. Generally, the Company requires that a certain percentage of the development be pre-sold or that construction and term take-out commitments are in place prior to funding the loan. Loans made on unimproved land are generally made for a term of five to ten years with a loan-to-value not to exceed the lesser of 50 percent of appraised value or 50 percent of cost.
Residential Builder Guidance Lines
The Company provides Builder Guidance Lines that are comprised of pre-sold and spec-home construction and lot acquisition loans. The spec-home construction and lot acquisition loans are limited to a specific number and maximum amount. Generally, the individual loans will not exceed a one year maturity. The homes under construction are inspected on a regular basis and advances made on a percentage-of-completion basis.
Construction Loans
During the construction loan term, all construction loan collateral properties are inspected at least monthly, or more frequently as needed, until completion. Draws on construction loans are predicated upon the results of the inspection and advanced based upon a percentage-of-completion basis versus original budget percentages. When construction loans become non-performing and the associated project is not complete, the Company on a case-by-case basis makes the decision to advance additional funds or to initiate collection/foreclosure proceedings. Such decision includes obtaining “as-is” and “at completion” appraisals for consideration of potential increases or decreases in the collateral’s value. The Company also considers the increased costs of monitoring progress to completion, and the related collection/holding period costs should collateral ownership be transferred to the Company.
Commercial Real Estate Loans
Loans are made to purchase, construct and finance commercial real estate properties. These loans are generally made to borrowers who will own and occupy the property, but may include loans to finance investment or income properties. Commercial real estate loans generally have a loan-to-value up to the lesser of 75 percent of the appraised value or 75 percent of the cost and require a minimum 1.2 times debt service coverage margin.
Agricultural Lending
Agricultural lending is conducted on a conservative basis and consists of operating credits, term real estate loans for the acquisition or refinance of agricultural real estate or equipment, and term livestock loans for the acquisition or refinance of livestock. Loan-to-value on equipment, livestock and agricultural real estate is generally limited to 75 percent.
PPP Loans
A PPP loan is a small business loan designed to assist qualifying businesses in keeping workers on the payroll during the Covid-19 pandemic. The program commenced on April 3, 2020 with June 30, 2020 (subsequently changed to August 8, 2020) as the last day to apply for and receive a PPP loan. As originally enacted, each PPP loan is 100% guaranteed by the SBA, has a 1% interest rate, 2-year maturity and 6-month payment deferral period starting from the loan disbursement date. The PPP program was further amended as of June 5, 2020 under the Paycheck Protection Program Flexibility Act with the primary changes to extend the period of qualifying expenditures from 8 weeks to 24 weeks, reduce the required use of funds for payroll expenses from 75% to 60%, change the deferral date from 6 months to the date of forgiveness, and extend the maturity from 2 years to 5 years for loans originated after the June 5, 2020 enactment date.
Home Equity Loans
The Company’s home equity loans of $636 million and $617 million as of December 31, 2020 and 2019, respectively, consist of 1-4 family junior lien mortgages and first and junior lien lines of credit secured by residential real estate. At December 31, 2020, the home equity loan portfolio consisted of 97 percent variable interest rate and 3 percent fixed interest rate loans. Approximately 58 percent of the home equity loans were in a first lien status with the remaining 42 percent in junior lien status. Approximately 3 percent of the home equity loans were closed-end amortizing loans and 97 percent were open-end, revolving home equity lines of credit. At December 31, 2019, the home equity loan portfolio consisted of 92 percent variable interest rate and 8 percent fixed interest rate loans. Approximately 56 percent of the home equity loans were in a first lien status with the remaining 44 percent in junior lien
38
status. Approximately 5 percent of the home equity loans were closed-end amortizing loans and 95 percent were open-end, revolving home equity lines of credit.
Home equity lines of credit are generally originated with maturity terms of 15 years. At origination, borrowers can choose a variable interest rate that changes quarterly, or after the first 3, 5 or 10 years from the origination date. The draw period for home equity lines of credit usually exists from origination to maturity. During the draw period, the Company has home equity lines of credit where the borrowers pay interest only and home equity lines of credit where borrowers pay principal and interest.
Consumer Lending
The majority of consumer loans are secured by real estate, automobiles, or other assets. The Company intends to continue making such loans because of their short-term nature, generally between three months and five years. Moreover, interest rates on consumer loans are generally higher than on residential mortgage loans.
States and Political Subdivisions Lending
The Company lends directly to state and local political subdivisions. The loans are typically secured by the full faith and credit of the municipality or a specific revenue stream such as water or sewer fees. In general, state and local political subdivision loans carry a low risk of default and offer other complementary business opportunities such as deposits and cash management. The loans are generally long-term in nature and interest on many of these loans is tax-exempt for federal income tax purposes.
Credit Risk Management
The Company is committed to a conservative management of the credit risk within the loan portfolio, including the early recognition of problem loans. The Company’s credit risk management includes stringent credit policies, individual loan approval limits, limits on concentrations of credit, and committee approval of larger loan requests. Management practices also include regular internal and external credit examinations, identification and review of individual loans and leases experiencing deterioration of credit quality, procedures for the collection of non-performing assets, quarterly monitoring of the loan portfolio, semi-annual review of loans by industry, and periodic stress testing of the loans secured by real estate. Federal and state regulatory safety and soundness examinations are conducted annually.
The Company’s loan policy and credit administration practices establish standards and limits for all extensions of credit that are secured by interests in or liens on real estate, or made for the purpose of financing the construction of real property or other improvements. Ongoing monitoring and review of the loan portfolio is based on current information, including: the borrowers’ and guarantors’ creditworthiness, value of the real estate and other collateral, the project’s performance against projections, and monthly inspections by Company employees or external parties until the real estate project is complete.
Monitoring of the junior lien and home equity lines of credit portfolios includes evaluating payment delinquency, collateral values, bankruptcy notices and foreclosure filings. Additionally, the Company places junior lien mortgages and junior lien home equity lines of credit on non-accrual status when there is evidence that the associated senior lien is 90 days past due or is in the process of foreclosure, regardless of the junior lien delinquency status.
Loan Approval Limits
Individual loan approval limits have been established for each lender based on the loan types and experience of the individual. There are four additional loan approval levels: 1) the Bank divisions’ Officer Loan Committees, consisting of senior lenders and members of senior management; 2) the Bank divisions’ advisory boards; 3) the Bank’s Executive Loan Committee, consisting of the Bank divisions’ senior loan officers and the Company’s Chief Credit Administrator; and 4) Bank’s Board of Directors. Under banking laws, loans-to-one-borrower and related entities are limited to a prescribed percentage of the unimpaired capital and surplus of the Bank.
Interest Reserves
Interest reserves are used to periodically advance loan funds to pay interest charges on the outstanding balance of the related loan. As with any extension of credit, the decision to establish a loan-funded interest reserve upon origination of construction loans, including residential construction and land, lot and other construction loans, is based on prudent underwriting, including the feasibility of the project, expected cash flow, creditworthiness of the borrower and guarantors, and the protection provided by the real estate and other underlying collateral. Interest reserves provide an effective means for addressing the cash flow characteristics of construction loans. In response to the downturn in the housing market and potential impact upon construction lending, the Company discourages the creation or continued use of interest reserves.
Interest reserves are advanced provided the related construction loan is performing as expected. Loans with interest reserves may be extended, renewed or restructured only when the related loan continues to perform as expected and meets the prudent underwriting standards identified above. Such renewals, extension or restructuring are not permitted in order to keep the related loan current.
39
In monitoring the performance and credit quality of a construction loan, the Company assesses the adequacy of any remaining interest reserve, and whether the use of an interest reserve remains appropriate in the presence of emerging weakness and associated risks in the construction loan.
The ongoing accrual and recognition of uncollected interest as income continues only when facts and circumstances continue to reasonably support the contractual payment of principal or interest. Loans are typically designated as non-accrual when the collection of the contractual principal or interest is unlikely and has remained unpaid for ninety days or more. For such loans, the accrual of interest and its capitalization into the loan balance will be discontinued.
The Company had $155 million and $240 million of loans with remaining interest reserves of $6.2 million and $8.6 million as of December 31, 2020 and 2019, respectively. During 2020 and 2019, the Company extended, renewed or restructured 6 loans and 42 loans, respectively, with interest reserves. Such loans had an aggregate outstanding principal balance of $12.2 million and $30.4 million as of December 31, 2020 and 2019, respectively. As of December 31, 2020, the Company had no construction loans with interest reserves that are currently non-performing or which are potential problem loans.
Loan Purchases, Sales, and Servicing
Fixed rate, long-term mortgage loans are generally sold in the secondary market. The Company is active in the secondary market, primarily through the origination of conventional, Rural Development, Federal Housing Administration and Department of Veterans Affairs residential mortgages. The sale of loans in the secondary mortgage market reduces the Company’s risk of holding long-term, fixed rate loans during periods of rising interest rates. In connection with conventional loan sales, the Company typically sells the majority of mortgage loans originated with servicing released. In certain circumstances, the Company strategically retains servicing and in the current year has been more active in retaining the servicing. For the loans that are sold with servicing retained, the Company records a servicing right asset that is subsequently amortized over the life of the loan. The servicing assets are also evaluated for impairment based on the fair value of the servicing asset compared to the carrying value.
The Company has also been very active in generating commercial Small Business Administration (“SBA”) loans, and other commercial loans, with a portion of those loans sold to investors. The Company has not originated any type of subprime mortgages, either for the loan portfolio or for sale to investors. In addition, the Company has not purchased debt securities collateralized with subprime mortgages. The Company does not actively purchase loans from other financial institutions, and substantially all of the Company’s loans receivable are with customers in the Company’s geographic market areas.
Loan Origination and Other Fees
In addition to interest earned on loans, the Company receives fees for originating loans. Loan fees generally are a percentage of the principal amount of the loan and are charged to the borrower, and are normally deducted from the proceeds of the loan. Loan origination fees are generally 1.0 to 1.5 percent on residential mortgages and 0.5 to 1.5 percent on commercial loans, excluding PPP loans. Consumer loans generally require a fixed fee amount. The Company also receives other fees and charges relating to existing loans, which include charges and fees collected in connection with loan modifications.
As enticement to financial institutions to administer the program, the SBA reimburses PPP lenders for processing a PPP loan via loan fees. The fee structure has changed with the new program with the following covering the fee structure for each program:
•5% for loans of not more than $350,000.
•3% for loans of more than $350,000 and less than $2 million.
•1% for loans of $2 million up to a maximum loan of $10 million that were available under the original PPP.
Appraisal and Evaluation Process
The Company’s loan policy and credit administration practices have adopted and implemented the applicable legal and regulatory requirements, which establishes criteria for obtaining appraisals or evaluations (new or updated), including transactions that are otherwise exempt from the appraisal requirements.
Each of the Bank divisions monitor conditions, including supply and demand factors, in the real estate markets served so they can react quickly to changing market conditions to mitigate potential losses from specific credit exposures within the loan portfolio. Evidence of the following real estate market conditions and trends is obtained from lending personnel and third party sources:
•demographic indicators, including employment and population trends;
•foreclosures, vacancy, construction and absorption rates;
•property sales prices, rental rates, and lease terms;
•current tax assessments;
•economic indicators, including trends within the lending areas; and
•valuation trends, including discount and capitalization rates.
40
Third party information sources include federal, state, and local governments and agencies thereof, private sector economic data vendors, real estate brokers, licensed agents, sales, rental and foreclosure data tracking services.
The time between ordering an appraisal or evaluation and receipt from third party vendors is typically two to six weeks for residential property depending on geographic market and four to six weeks for non-residential property. For real estate properties that are of highly specialized or limited use, significantly complex or large, additional time beyond the typical times may be required for new appraisals or evaluations (new or updated).
As part of the Company’s credit administration and portfolio monitoring practices, the Company’s regular internal and external credit examinations review a significant number of individual loan files. Appraisals and evaluations (new or updated) are reviewed to determine whether the timeliness, methods, assumptions, and findings are reasonable and in compliance with the Company’s loan policy and credit administration practices. Such reviews include the adequacy of the steps taken by the Company to ensure that the individuals who perform appraisals and evaluations (new or updated) are appropriately qualified and are not subject to conflicts of interest. If there are any deficiencies noted in the reviews, they are reported to Bank management and prompt corrective action is taken.
41
Non-performing Assets
The following table summarizes information regarding non-performing assets at the dates indicated:
| At or for the Years ended | |||||||||||||||||||||||||||||
| (Dollars in thousands) | December 31, 2020 | December 31, 2019 | December 31, 2018 | December 31, 2017 | December 31, 2016 | ||||||||||||||||||||||||
| Other real estate owned | $ | 1,744 | 5,142 | 7,480 | 14,269 | 20,954 | |||||||||||||||||||||||
| Accruing loans 90 days or more past due | |||||||||||||||||||||||||||||
| Residential real estate | 934 | 753 | 788 | 2,366 | 266 | ||||||||||||||||||||||||
| Commercial | 231 | 64 | — | 609 | 145 | ||||||||||||||||||||||||
| Other commercial | 293 | 143 | 492 | 2,973 | 283 | ||||||||||||||||||||||||
| Home equity | 135 | — | 428 | — | 192 | ||||||||||||||||||||||||
| Other consumer | 132 | 452 | 310 | 129 | 213 | ||||||||||||||||||||||||
| Total | 1,725 | 1,412 | 2,018 | 6,077 | 1,099 | ||||||||||||||||||||||||
| Non-accrual loans | |||||||||||||||||||||||||||||
| Residential real estate | 3,403 | 4,715 | 8,021 | 4,924 | 4,528 | ||||||||||||||||||||||||
| Commercial | 15,817 | 15,650 | 27,264 | 27,331 | 30,216 | ||||||||||||||||||||||||
| Other commercial | 9,509 | 6,592 | 8,619 | 8,298 | 8,817 | ||||||||||||||||||||||||
| Home equity | 2,713 | 3,266 | 2,575 | 3,338 | 5,240 | ||||||||||||||||||||||||
| Other consumer | 522 | 660 | 773 | 942 | 531 | ||||||||||||||||||||||||
| Total | 31,964 | 30,883 | 47,252 | 44,833 | 49,332 | ||||||||||||||||||||||||
Total non-performing assets | $ | 35,433 | 37,437 | 56,750 | 65,179 | 71,385 | |||||||||||||||||||||||
Non-performing assets as a percentage of subsidiary assets | 0.19 | % | 0.27 | % | 0.47 | % | 0.68 | % | 0.76 | % | |||||||||||||||||||
ACL as a percentage of non-performing loans | 470 | % | 385 | % | 266 | % | 255 | % | 257 | % | |||||||||||||||||||
| Accruing loans 30-89 days past due | $ | 22,721 | 23,192 | 33,567 | 37,687 | 25,617 | |||||||||||||||||||||||
Accruing troubled debt restructurings | $ | 42,003 | 34,055 | 25,833 | 38,491 | 52,077 | |||||||||||||||||||||||
| Non-accrual troubled debt restructurings | $ | 3,507 | 3,346 | 10,660 | 23,709 | 21,693 | |||||||||||||||||||||||
U.S. government guarantees included in non-performing assets | $ | 3,011 | 1,786 | 4,811 | 2,513 | 1,746 | |||||||||||||||||||||||
Interest income 1 | $ | 1,545 | 1,603 | 2,340 | 2,162 | 2,364 | |||||||||||||||||||||||
______________________________
1Amounts represent estimated interest income that would have been recognized on loans accounted for on a non-accrual basis as of the end of each period had such loans performed pursuant to contractual terms.
Non-performing assets of $35.4 million at December 31, 2020 decreased $2.0 million, or 5 percent, over the prior year. Non-performing assets as a percentage of subsidiary assets at December 31, 2020 was 0.19 percent. Excluding the government guaranteed PPP loans, the non-performing assets as a percentage of subsidiary assets at December 31, 2020 was 0.20 percent, a decrease of 7 basis points from the prior year end. Early stage delinquencies (accruing loans 30-89 days past due) of $22.7 million at December 31, 2020 decreased $471 thousand from the prior year end. Early stage delinquencies as a percentage of loans at December 31, 2020 was 0.20 percent, which was a decrease of 4 basis points from prior year end. Excluding PPP loans, early stage delinquencies as a percentage of loans at December 31, 2020 was 0.22 percent, which was a 2 basis points decrease from prior year end.
Most of the Company’s non-performing assets are secured by real estate, and based on the most current information available to management, including updated appraisals or evaluations (new or updated), the Company believes the value of the underlying real estate collateral is adequate to minimize significant charge-offs or losses to the Company. Through pro-active credit administration, the Company works closely with its borrowers to seek favorable resolution to the extent possible, thereby attempting to minimize net charge-offs or losses to the Company. With very limited exceptions, the Company does not disburse additional funds on non-
42
performing loans. Instead, the Company proceeds to collection and foreclosure actions in order to reduce the Company’s exposure to loss on such loans.
For additional information on accounting policies relating to non-performing assets, see Note 1 to the Consolidated Financial Statements in “Item 8. Financial Statements and Supplementary Data.”
Restructured Loans
A restructured loan is considered a troubled debt restructuring (“TDR”) if the creditor, for economic or legal reasons related to the debtor’s financial difficulties, grants a concession to the debtor that it would not otherwise consider. Each restructured debt is separately negotiated with the borrower and includes terms and conditions that reflect the borrower’s prospective ability to service the debt as modified. The Company discourages the use of the multiple loan strategy when restructuring loans regardless of whether or not the loans are designated as TDRs. The Company’s TDR loans were $45.5 million and $37.4 million as of December 31, 2020 and December 31, 2019, respectively.
On March 27, 2020, the CARES Act was signed into law which includes many provisions that impact the Company and its customers. The banking regulatory agencies have encouraged banks to work with borrowers who have been impacted by the COVID-19 pandemic, and the CARES Act, along with related regulatory guidance, allows the Bank to not designate certain modifications as TDRs that otherwise may have been classified as TDRs. For additional information on modifications related to the COVID-19 pandemic, see the COVID-19 Bank Loan Modifications and COVID-19 Higher Risk Industries - Enhanced Monitoring sections under “Additional Management’s Discussion and Analysis” below.
Other Real Estate Owned
The book value of loans prior to the acquisition of collateral and transfer of the loans into OREO during 2020 was $2.3 million. The fair value of the loan collateral acquired in foreclosure during 2020 was $2.1 million. The following table sets forth the changes in OREO for the periods indicated:
| Years ended | |||||||||||||||||||||||||||||
| (Dollars in thousands) | December 31, 2020 | December 31, 2019 | December 31, 2018 | December 31, 2017 | December 31, 2016 | ||||||||||||||||||||||||
| Balance at beginning of period | $ | 5,142 | 7,480 | 14,269 | 20,954 | 26,815 | |||||||||||||||||||||||
| Acquisitions | 307 | — | 187 | 96 | 882 | ||||||||||||||||||||||||
| Additions | 2,076 | 2,349 | 4,924 | 4,466 | 5,198 | ||||||||||||||||||||||||
| Capital improvements | 145 | 63 | 21 | — | 149 | ||||||||||||||||||||||||
| Write-downs | (451) | (766) | (2,727) | (604) | (1,821) | ||||||||||||||||||||||||
| Sales | (5,475) | (3,984) | (9,194) | (10,643) | (10,269) | ||||||||||||||||||||||||
| Balance at end of period | $ | 1,744 | 5,142 | 7,480 | 14,269 | 20,954 | |||||||||||||||||||||||
43
PPP, COVID-19 Bank Loan Modifications, and Higher Risk Industries
The following table summarizes information regarding PPP loans:
| December 31, 2020 | |||||||||||||||||||||||
| (Dollars in thousands) | Number of PPP Loans | Amount of PPP Loans | Total Loans Receivable, Net of PPP Loans | PPP Loans (Amount) as a Percent of Total Loans Receivable, Net of PPP Loans | |||||||||||||||||||
| Residential real estate | — | $ | — | 802,508 | — | % | |||||||||||||||||
| Commercial real estate and other commercial | |||||||||||||||||||||||
| Real estate rental and leasing | 896 | 37,285 | 3,484,537 | 1.07 | % | ||||||||||||||||||
| Accommodation and food services | 1,200 | 108,273 | 657,770 | 16.46 | % | ||||||||||||||||||
| Healthcare | 1,389 | 210,349 | 835,642 | 25.17 | % | ||||||||||||||||||
| Manufacturing | 594 | 43,798 | 182,565 | 23.99 | % | ||||||||||||||||||
| Retail and wholesale trade | 1,166 | 99,504 | 471,282 | 21.11 | % | ||||||||||||||||||
| Construction | 1,607 | 128,101 | 758,308 | 16.89 | % | ||||||||||||||||||
| Other | 4,532 | 281,863 | 2,071,435 | 13.61 | % | ||||||||||||||||||
| Home equity and other consumer | — | — | 949,476 | — | % | ||||||||||||||||||
| Total | 11,384 | $ | 909,173 | 10,213,523 | 8.90 | % | |||||||||||||||||
The Company originated SBA PPP loans primarily for small businesses in its communities. During the current year, the Company originated 16,090 PPP loans in the amount of $1.472 billion. During the fourth quarter of 2020, the Company actively worked with its customers to submit applications to the SBA for PPP loan forgiveness which resulted in a decrease of $539 million, or 37 percent, of the PPP loans.
The PPP loan originations generated $55.2 million of SBA processing fees, or an average of 3.75 percent, and $8.9 million of deferred compensation costs for total net deferred fees of $46.3 million. The Company recognized $38.2 million of interest income (including deferred fees and costs) from the PPP loans in 2020, which included $14.0 million acceleration of net deferred fees in interest income resulting from the SBA forgiveness of loans. Net deferred fees remaining on the balance of PPP loans at December 31, 2020 were $17.6 million, which will be recognized into interest income over the remaining life of the loans or when the loans are forgiven in whole or in part by the SBA.
COVID-19 Bank Loan Modifications
In response to COVID-19, the Company modified 3,054 loans in the amount of $1.515 billion during the second quarter of 2020. These modifications were primarily short-term payment deferrals under six months. During the second half of 2020, the majority of the modified loan deferral periods expired, and the loans returned to regular payment status. As of December 31, 2020, $94.9 million of the modifications, or 93 basis points of the $10.214 billion of loans, net of the PPP loans, remain in the deferral period, a reduction of $1.420 billion from the $1.515 billion of the original loan modifications in the second quarter.
In addition to the Bank loan modifications presented above, the state of Montana created the Montana Loan Deferment Program for only Montana-based businesses that was implemented only in the third quarter. Cares Act funds were used to provide interest payments upfront and directly to lenders on behalf of participating borrowers to convert existing commercial loans to interest only status, resulting in the deferral of principal and interest for a period of six to twelve months. None of the interest payments are required to be repaid by the borrowers, thus providing a grant to the borrowers. This program was unique to Montana, had minimal qualification requirements, and required that participating lenders modify eligible loans to conform to the program in order for borrowers to qualify for the grant. As of December 31, 2020, the Company had $278 million in eligible loans benefiting from this grant program, which was 2.8 percent of total loans receivable, net of PPP loans.
44
COVID-19 Higher Risk Industries - Enhanced Monitoring
The Company has certain industries it has identified as at higher risk from COVID-19. The following table summarizes information regarding these higher risk loans:
| December 31, 2020 | |||||||||||||||||||||||
| (Dollars in thousands) | Enhanced Monitoring Total Loans Receivable, Net of PPP Loans | Percent of Total Loans Receivable, Net of PPP Loans | Amount of Loan Modifications | Loan Modifications (Amount) as a Percent of Enhanced Monitoring Loans Receivable, Net of PPP Loans | |||||||||||||||||||
| Hotel and motel | $ | 428,868 | 4.20 | % | 14,032 | 3.27 | % | ||||||||||||||||
| Restaurant | 154,055 | 1.51 | % | 7,999 | 5.19 | % | |||||||||||||||||
| Travel and tourism | 22,018 | 0.22 | % | — | — | % | |||||||||||||||||
| Gaming | 14,220 | 0.14 | % | — | — | % | |||||||||||||||||
| Oil and gas | 23,158 | 0.23 | % | 1,435 | 6.20 | % | |||||||||||||||||
| Total | $ | 642,319 | 6.29 | % | 23,466 | 3.65 | % | ||||||||||||||||
Excluding the PPP loans, the Company has $642 million, or 6 percent, of its total loan portfolio, with direct exposure to industries for which it has identified as higher risk, requiring enhanced monitoring. During the year, the Company modified $400 million of the loans in the higher risk industries. As of December 31, 2020, only $23.5 million, or 3.65 percent, of the loans in the higher risk industries have continuing modifications. The Company continues to conduct enhanced portfolio reviews and monitoring for potential credit deterioration within these industries.
Allowance for Credit Losses - Loans Receivable
On January 1, 2020, the Company adopted Financial Accounting Standards Board (“FASB”) Accounting Standards Updates (“ASU”) 2016-13, Financial Instruments - Credit Losses, which significantly changed the allowance for credit loss accounting policies. The following allowance for credit loss discussion was presented under Accounting Standards Codification™ (“ASC”) Topic 326, whereas prior periods are presented in accordance with the incurred loss model as disclosed in the Company’s 2019 Annual Report on Form 10-K.
The following table summarizes the allocation of the ACL as of the dates indicated:
| December 31, 2020 | December 31, 2019 | December 31, 2018 | December 31, 2017 | December 31, 2016 | |||||||||||||||||||||||||||||||||||||||||||||||||||||||
| (Dollars in thousands) | ACL | Percent of Loans in Category | ACL | Percent of Loans in Category | ACL | Percent of Loans in Category | ACL | Percent of Loans in Category | ACL | Percent of Loans in Category | |||||||||||||||||||||||||||||||||||||||||||||||||
Residential real estate | $ | 9,604 | 7 | % | $ | 10,111 | 10 | % | $ | 10,631 | 11 | % | $ | 10,798 | 11 | % | $ | 12,436 | 12 | % | |||||||||||||||||||||||||||||||||||||||
Commercial real estate | 86,999 | 57 | % | 69,496 | 59 | % | 72,448 | 56 | % | 68,515 | 54 | % | 65,773 | 52 | % | ||||||||||||||||||||||||||||||||||||||||||||
Other commercial | 49,133 | 27 | % | 36,129 | 22 | % | 38,160 | 23 | % | 39,303 | 24 | % | 37,823 | 24 | % | ||||||||||||||||||||||||||||||||||||||||||||
| Home equity | 8,182 | 6 | % | 4,937 | 6 | % | 5,811 | 7 | % | 6,204 | 7 | % | 7,572 | 8 | % | ||||||||||||||||||||||||||||||||||||||||||||
Other consumer | 4,325 | 3 | % | 3,817 | 3 | % | 4,189 | 3 | % | 4,748 | 4 | % | 5,968 | 4 | % | ||||||||||||||||||||||||||||||||||||||||||||
| Total | $ | 158,243 | 100 | % | $ | 124,490 | 100 | % | $ | 131,239 | 100 | % | $ | 129,568 | 100 | % | $ | 129,572 | 100 | % | |||||||||||||||||||||||||||||||||||||||
45
The following table summarizes the ACL experience for the periods indicated:
| At or for the Years ended | |||||||||||||||||||||||||||||
| (Dollars in thousands) | December 31, 2020 | December 31, 2019 | December 31, 2018 | December 31, 2017 | December 31, 2016 | ||||||||||||||||||||||||
| Balance at beginning of period | $ | 124,490 | 131,239 | 129,568 | 129,572 | 129,697 | |||||||||||||||||||||||
| Impact of adopting CECL | 3,720 | — | — | — | — | ||||||||||||||||||||||||
| Acquisitions | 49 | — | — | — | — | ||||||||||||||||||||||||
| Provision for credit losses | 37,637 | 57 | 9,953 | 10,824 | 2,333 | ||||||||||||||||||||||||
| Charge-offs | |||||||||||||||||||||||||||||
| Residential real estate | (21) | (608) | (728) | (199) | (464) | ||||||||||||||||||||||||
| Commercial real estate | (3,497) | (2,460) | (3,469) | (6,188) | (3,082) | ||||||||||||||||||||||||
| Other commercial | (4,860) | (4,189) | (5,044) | (2,856) | (1,144) | ||||||||||||||||||||||||
| Home equity | (384) | (90) | (210) | (488) | (1,185) | ||||||||||||||||||||||||
| Other consumer | (5,046) | (7,831) | (8,356) | (9,600) | (5,621) | ||||||||||||||||||||||||
| Total charge-offs | (13,808) | (15,178) | (17,807) | (19,331) | (11,496) | ||||||||||||||||||||||||
| Recoveries | |||||||||||||||||||||||||||||
| Residential real estate | 61 | 251 | 87 | 82 | 207 | ||||||||||||||||||||||||
| Commercial real estate | 1,094 | 2,212 | 3,058 | 1,778 | 3,664 | ||||||||||||||||||||||||
| Other commercial | 1,811 | 2,181 | 1,986 | 1,791 | 1,607 | ||||||||||||||||||||||||
| Home equity | 256 | 79 | 289 | 224 | 279 | ||||||||||||||||||||||||
| Other consumer | 2,933 | 3,649 | 4,105 | 4,628 | 3,282 | ||||||||||||||||||||||||
| Total recoveries | 6,155 | 8,372 | 9,525 | 8,503 | 9,039 | ||||||||||||||||||||||||
| Charge-offs, net of recoveries | (7,653) | (6,806) | (8,282) | (10,828) | (2,457) | ||||||||||||||||||||||||
| Balance at end of period | $ | 158,243 | $ | 124,490 | $ | 131,239 | $ | 129,568 | $ | 129,573 | |||||||||||||||||||
ACL as a percentage of total loans | 1.42 | % | 1.31 | % | 1.58 | % | 1.97 | % | 2.28 | % | |||||||||||||||||||
Net charge-offs as a percentage of average loans | 0.07 | % | 0.08 | % | 0.11 | % | 0.17 | % | 0.05 | % | |||||||||||||||||||
The ACL as a percentage of total loans outstanding at December 31, 2020 was 1.42 percent compared to 1.31 percent at the prior year end. The Company’s ACL of $158 million is considered adequate to absorb the estimated credit losses from any segment of its loan portfolio. For the periods ended December 31, 2020 and 2019, the Company believes the ACL is commensurate with the risk in the Company’s loan portfolio and is directionally consistent with the change in the quality of the Company’s loan portfolio. During 2020, provision for credit losses exceeded the charge-offs, net of recoveries by $30.0 million. During the same period in 2019, the charge-offs, net of recoveries exceeded provision for credit losses by $6.7 million.
While the Company has incorporated its estimate of the impact of the COVID-19 pandemic into its calculation of the allowance based on assumptions and forecasts that existed as of the reporting period end, the current economic environment remains volatile and the Company cannot predict whether additional credit losses will be sustained as a result of the COVID-19 pandemic if assumptions and forecasts change in the future.
At the end of each quarter, the Company analyzes its loan portfolio and maintains an ACL at a level that is determined determined to be appropriate in accordance with accounting principles generally accepted in the United States of America (“GAAP”). Determining the adequacy of the ACL involves a high degree of judgment and is inevitably imprecise as the risk of loss is difficult to quantify. The ACL methodology is designed to reasonably estimate the probable credit losses within the Company’s loan portfolio. Accordingly, the ACL is maintained within a range of estimated losses. The determination of the ACL on loans, including provision for credit losses and net charge-offs, is a critical accounting estimate that involves management’s judgments about the loan portfolio that impact credit losses, including the credit risk inherent in the loan portfolio, economic forecasts nationally and in the local markets in which the Company operates, trends and changes in collateral values, delinquencies, non-performing assets, net charge-offs, credit-related policies and personnel, and other environmental factors.
46
In determining the ACL, the loan portfolio is separated into pools of loans that share similar risk characteristics which are the Company’s loan segments. The Company then derives estimated loss assumptions from its model by loan segment which is further segregated by the credit quality indicators. The loss assumptions are then applied to each segment of loan to estimate the ACL on the pooled loans. For any loans that do not share similar risk characteristics, the estimated credit losses are determined on an individual loan basis and such loans primarily consist of non-accrual loans. An estimated credit loss is recorded on individually reviewed loans when the fair value of a collateral-dependent loan or the present value of the loan’s expected future cash flows (discounted at the loans original effective interest rate) is less than the amortized cost of the loan.
The Company provides commercial banking services to individuals, small to medium-sized businesses, community organizations and public entities from 193 locations, including 172 branches, across Montana, Idaho, Utah, Washington, Wyoming, Colorado, Arizona and Nevada. The states in which the Company operates have diverse economies and markets that are tied to commodities (crops, livestock, minerals, oil and natural gas), tourism, real estate and land development and an assortment of industries, both manufacturing and service-related. Thus, the changes in the global, national, and local economies are not uniform across the Company’s geographic locations. The geographic dispersion of these market areas helps to mitigate the risk of credit loss. The Company’s model of sixteen bank divisions with separate management teams is also a significant benefit in mitigating and managing the Company’s credit risk. This model provides substantial local oversight to the lending and credit management function and requires multiple reviews of larger loans before credit is extended.
The primary responsibility for credit risk assessment and identification of problem loans rests with the loan officer of the account. This continuous process of identifying non-performing loans is necessary to support management’s evaluation of the ACL adequacy. An independent loan review function verifying credit risk ratings evaluates the loan officer and management’s evaluation of the loan portfolio credit quality. The ACL evaluation is well documented and approved by the Company’s Board. In addition, the policy and procedures for determining the balance of the ACL are reviewed annually by the Company’s Board, the internal audit department, independent credit reviewers and state and federal bank regulatory agencies.
Although the Company continues to actively monitor economic trends and regulatory developments, no assurance can be given that the Company will not, in any particular period, sustain losses that are significant relative to the ACL amount, or that subsequent evaluations of the loan portfolio applying management’s judgment about then current factors will not require significant changes in the ACL. Under such circumstances, additional provision for credit losses could result.
For additional information regarding the ACL, its relation to the provision for credit losses on loans and risk related to asset quality, see Note 3 to the Consolidated Financial Statements in “Item 8. Financial Statements and Supplementary Data.”
47
Loans by Regulatory Classification
Supplemental information regarding identification of the Company’s loan portfolio and credit quality based on regulatory classification is provided in the following tables. The regulatory classification of loans is based primarily on the type of collateral for the loans. There may be differences when compared to loan tables and loan amounts appearing elsewhere which reflect the Company’s internal loan segments and classes which are based on the purpose of the loan.
The following table summarizes the Company’s loan portfolio by regulatory classification:
| (Dollars in thousands) | December 31, 2020 | December 31, 2019 | $ Change | % Change | |||||||||||||||||||
Custom and owner occupied construction | $ | 157,529 | $ | 143,479 | $ | 14,050 | 10 | % | |||||||||||||||
| Pre-sold and spec construction | 148,845 | 180,539 | (31,694) | (18 | %) | ||||||||||||||||||
| Total residential construction | 306,374 | 324,018 | (17,644) | (5 | %) | ||||||||||||||||||
| Land development | 102,930 | 101,592 | 1,338 | 1 | % | ||||||||||||||||||
| Consumer land or lots | 123,747 | 125,759 | (2,012) | (2 | %) | ||||||||||||||||||
| Unimproved land | 59,500 | 62,563 | (3,063) | (5 | %) | ||||||||||||||||||
| Developed lots for operative builders | 30,449 | 17,390 | 13,059 | 75 | % | ||||||||||||||||||
| Commercial lots | 60,499 | 46,408 | 14,091 | 30 | % | ||||||||||||||||||
| Other construction | 555,375 | 478,368 | 77,007 | 16 | % | ||||||||||||||||||
Total land, lot, and other construction | 932,500 | 832,080 | 100,420 | 12 | % | ||||||||||||||||||
| Owner occupied | 1,945,686 | 1,667,526 | 278,160 | 17 | % | ||||||||||||||||||
| Non-owner occupied | 2,290,512 | 2,017,375 | 273,137 | 14 | % | ||||||||||||||||||
| Total commercial real estate | 4,236,198 | 3,684,901 | 551,297 | 15 | % | ||||||||||||||||||
| Commercial and industrial | 1,850,197 | 991,580 | 858,617 | 87 | % | ||||||||||||||||||
| Agriculture | 721,490 | 701,363 | 20,127 | 3 | % | ||||||||||||||||||
| 1st lien | 1,228,867 | 1,186,889 | 41,978 | 4 | % | ||||||||||||||||||
| Junior lien | 41,641 | 53,571 | (11,930) | (22 | %) | ||||||||||||||||||
| Total 1-4 family | 1,270,508 | 1,240,460 | 30,048 | 2 | % | ||||||||||||||||||
| Multifamily residential | 391,895 | 342,498 | 49,397 | 14 | % | ||||||||||||||||||
| Home equity lines of credit | 657,626 | 617,900 | 39,726 | 6 | % | ||||||||||||||||||
| Other consumer | 190,186 | 174,643 | 15,543 | 9 | % | ||||||||||||||||||
| Total consumer | 847,812 | 792,543 | 55,269 | 7 | % | ||||||||||||||||||
| States and political subdivisions | 575,647 | 533,023 | 42,624 | 8 | % | ||||||||||||||||||
| Other | 156,647 | 139,538 | 17,109 | 12 | % | ||||||||||||||||||
| Total loans receivable, including loans held for sale | 11,289,268 | 9,582,004 | 1,707,264 | 18 | % | ||||||||||||||||||
Less loans held for sale 1 | (166,572) | (69,194) | (97,378) | 141 | % | ||||||||||||||||||
| Total loans receivable | $ | 11,122,696 | $ | 9,512,810 | $ | 1,609,886 | 17 | % | |||||||||||||||
______________________________
1 Loans held for sale are primarily 1st lien 1-4 family loans.
48
The following table summarizes the Company’s non-performing assets by regulatory classification:
| Non-performing Assets, by Loan Type | Non- Accruing Loans | Accruing Loans 90 Days or More Past Due | OREO | ||||||||||||||||||||||||||
| (Dollars in thousands) | December 31, 2020 | December 31, 2019 | December 31, 2020 | December 31, 2020 | December 31, 2020 | ||||||||||||||||||||||||
Custom and owner occupied construction | $ | 247 | 185 | 247 | — | — | |||||||||||||||||||||||
Pre-sold and spec construction | — | 743 | — | — | — | ||||||||||||||||||||||||
Total residential construction | 247 | 928 | 247 | — | — | ||||||||||||||||||||||||
| Land development | 342 | 852 | 93 | — | 249 | ||||||||||||||||||||||||
| Consumer land or lots | 201 | 330 | 74 | — | 127 | ||||||||||||||||||||||||
| Unimproved land | 294 | 1,181 | 214 | 34 | 46 | ||||||||||||||||||||||||
Developed lots for operative builders | — | — | — | — | — | ||||||||||||||||||||||||
| Commercial lots | 368 | 529 | — | — | 368 | ||||||||||||||||||||||||
| Other construction | — | — | — | — | — | ||||||||||||||||||||||||
Total land, lot and other construction | 1,205 | 2,892 | 381 | 34 | 790 | ||||||||||||||||||||||||
| Owner occupied | 6,725 | 4,608 | 6,605 | — | 120 | ||||||||||||||||||||||||
| Non-owner occupied | 4,796 | 8,229 | 4,607 | 189 | — | ||||||||||||||||||||||||
Total commercial real estate | 11,521 | 12,837 | 11,212 | 189 | 120 | ||||||||||||||||||||||||
Commercial and industrial | 6,689 | 5,297 | 5,982 | 152 | 555 | ||||||||||||||||||||||||
| Agriculture | 6,313 | 2,288 | 6,164 | 149 | — | ||||||||||||||||||||||||
| 1st lien | 5,353 | 8,671 | 4,419 | 934 | — | ||||||||||||||||||||||||
| Junior lien | 301 | 569 | 301 | — | — | ||||||||||||||||||||||||
| Total 1-4 family | 5,654 | 9,240 | 4,720 | 934 | — | ||||||||||||||||||||||||
Multifamily residential | — | 201 | — | — | — | ||||||||||||||||||||||||
Home equity lines of credit | 2,939 | 2,618 | 2,531 | 135 | 273 | ||||||||||||||||||||||||
| Other consumer | 572 | 837 | 466 | 100 | 6 | ||||||||||||||||||||||||
| Total consumer | 3,511 | 3,455 | 2,997 | 235 | 279 | ||||||||||||||||||||||||
| Other | 293 | 299 | 261 | 32 | — | ||||||||||||||||||||||||
| Total | $ | 35,433 | 37,437 | 31,964 | 1,725 | 1,744 | |||||||||||||||||||||||
49
The following table summarizes the Company’s accruing loans 30-89 days past due by regulatory classification:
| Accruing 30-89 Days Delinquent Loans, by Loan Type | |||||||||||||||||||||||
| (Dollars in thousands) | December 31, 2020 | December 31, 2019 | $ Change | % Change | |||||||||||||||||||
| Custom and owner occupied construction | $ | 788 | $ | 637 | $ | 151 | 24 | % | |||||||||||||||
| Pre-sold and spec construction | — | 148 | (148) | (100 | %) | ||||||||||||||||||
| Total residential construction | 788 | 785 | 3 | — | % | ||||||||||||||||||
| Land development | 202 | — | 202 | n/m | |||||||||||||||||||
| Consumer land or lots | 71 | 672 | (601) | (89 | %) | ||||||||||||||||||
| Unimproved land | 357 | 558 | (201) | (36 | %) | ||||||||||||||||||
| Developed lots for operative builders | 306 | 2 | 304 | 15,200 | % | ||||||||||||||||||
| Total land, lot and other construction | 936 | 1,232 | (296) | (24 | %) | ||||||||||||||||||
| Owner occupied | 3,432 | 3,052 | 380 | 12 | % | ||||||||||||||||||
| Non-owner occupied | 149 | 1,834 | (1,685) | (92 | %) | ||||||||||||||||||
| Total commercial real estate | 3,581 | 4,886 | (1,305) | (27 | %) | ||||||||||||||||||
| Commercial and industrial | 1,814 | 2,036 | (222) | (11 | %) | ||||||||||||||||||
| Agriculture | 1,553 | 4,298 | (2,745) | (64 | %) | ||||||||||||||||||
| 1st lien | 6,677 | 4,711 | 1,966 | 42 | % | ||||||||||||||||||
| Junior lien | 55 | 624 | (569) | (91 | %) | ||||||||||||||||||
| Total 1-4 family | 6,732 | 5,335 | 1,397 | 26 | % | ||||||||||||||||||
| Home equity lines of credit | 2,840 | 2,352 | 488 | 21 | % | ||||||||||||||||||
| Other consumer | 1,054 | 1,187 | (133) | (11 | %) | ||||||||||||||||||
| Total consumer | 3,894 | 3,539 | 355 | 10 | % | ||||||||||||||||||
| States and political subdivisions | 2,358 | — | 2,358 | n/m | |||||||||||||||||||
| Other | 1,065 | 1,081 | (16) | (1 | %) | ||||||||||||||||||
| Total | $ | 22,721 | $ | 23,192 | $ | (471) | (2 | %) | |||||||||||||||
_________________
n/m - not measurable
50
The following table summarizes the Company’s charge-offs and recoveries by regulatory classification:
| Net Charge-Offs (Recoveries), Years ended, By Loan Type | Charge-Offs | Recoveries | |||||||||||||||||||||
| (Dollars in thousands) | December 31, 2020 | December 31, 2019 | December 31, 2020 | December 31, 2020 | |||||||||||||||||||
| Custom and owner occupied construction | $ | (9) | 98 | — | 9 | ||||||||||||||||||
| Pre-sold and spec construction | (24) | (18) | — | 24 | |||||||||||||||||||
| Total residential construction | (33) | 80 | — | 33 | |||||||||||||||||||
| Land development | (106) | (30) | — | 106 | |||||||||||||||||||
| Consumer land or lots | (221) | (138) | 7 | 228 | |||||||||||||||||||
| Unimproved land | (489) | (311) | — | 489 | |||||||||||||||||||
| Developed lots for operative builders | — | (18) | — | — | |||||||||||||||||||
| Commercial lots | (55) | (6) | 22 | 77 | |||||||||||||||||||
| Other construction | — | (142) | — | — | |||||||||||||||||||
| Total land, lot and other construction | (871) | (645) | 29 | 900 | |||||||||||||||||||
| Owner occupied | (168) | (479) | 57 | 225 | |||||||||||||||||||
| Non-owner occupied | 3,030 | 2,015 | 3,086 | 56 | |||||||||||||||||||
| Total commercial real estate | 2,862 | 1,536 | 3,143 | 281 | |||||||||||||||||||
| Commercial and industrial | 1,533 | 1,472 | 2,278 | 745 | |||||||||||||||||||
| Agriculture | 337 | 21 | 345 | 8 | |||||||||||||||||||
| 1st lien | 69 | (12) | 127 | 58 | |||||||||||||||||||
| Junior lien | (211) | (303) | 27 | 238 | |||||||||||||||||||
| Total 1-4 family | (142) | (315) | 154 | 296 | |||||||||||||||||||
| Multifamily residential | (244) | — | — | 244 | |||||||||||||||||||
| Home equity lines of credit | 101 | 19 | 350 | 249 | |||||||||||||||||||
| Other consumer | 307 | 603 | 604 | 297 | |||||||||||||||||||
| Total consumer | 408 | 622 | 954 | 546 | |||||||||||||||||||
| Other | 3,803 | 4,035 | 6,905 | 3,102 | |||||||||||||||||||
| Total | $ | 7,653 | 6,806 | 13,808 | 6,155 | ||||||||||||||||||
51
Sources of Funds
The Company’s deposits have traditionally been the principal source of funds for use in lending and other business purposes. The Company also obtains funds from repayment of loans and debt securities, securities sold under agreements to repurchase (“repurchase agreements”), wholesale deposits, advances from FHLB and other borrowings. Loan repayments are a relatively stable source of funds, while interest bearing deposit inflows and outflows are significantly influenced by general interest rate levels and market conditions. Borrowings and advances may be used on a short-term basis to compensate for reductions in normal sources of funds such as deposit inflows at less than projected levels. Borrowings also may be used on a long-term basis to support expanded activities, match maturities of longer-term assets or manage interest rate risk.
Deposits
The Company has several deposit programs designed to attract both short-term and long-term deposits from the general public by providing a wide selection of accounts and rates. These programs include non-interest bearing deposit accounts and interest bearing deposit accounts such as NOW, DDA, savings, money market deposits, fixed rate certificates of deposit with maturities ranging from three months to five years, negotiated-rate jumbo certificates, and individual retirement accounts. These deposits are obtained primarily from individual and business residents in the Bank’s geographic market areas. Wholesale deposits are obtained through various programs and include brokered deposits classified as NOW, DDA, money market deposit and certificate accounts. The Company’s deposits are summarized below:
| December 31, 2020 | December 31, 2019 | December 31, 2018 | December 31, 2017 | December 31, 2016 | |||||||||||||||||||||||||||||||||||||||||||||||||||||||
| (Dollars in thousands) | Amount | Percent | Amount | Percent | Amount | Percent | Amount | Percent | Amount | Percent | |||||||||||||||||||||||||||||||||||||||||||||||||
Non-interest bearing deposits | $ | 5,454,539 | 37 | % | $ | 3,696,627 | 34 | % | $ | 3,001,178 | 32 | % | $ | 2,311,902 | 31 | % | $ | 2,041,852 | 28 | % | |||||||||||||||||||||||||||||||||||||||
| NOW and DDA accounts | 3,698,559 | 25 | % | 2,645,404 | 25 | % | 2,391,307 | 25 | % | 1,695,246 | 22 | % | 1,588,550 | 22 | % | ||||||||||||||||||||||||||||||||||||||||||||
| Savings accounts | 2,000,174 | 13 | % | 1,485,487 | 14 | % | 1,346,790 | 14 | % | 1,082,604 | 14 | % | 996,061 | 13 | % | ||||||||||||||||||||||||||||||||||||||||||||
Money market deposit accounts | 2,627,336 | 18 | % | 1,937,141 | 18 | % | 1,684,284 | 18 | % | 1,512,693 | 20 | % | 1,464,415 | 20 | % | ||||||||||||||||||||||||||||||||||||||||||||
| Certificate accounts | 978,779 | 7 | % | 958,501 | 9 | % | 901,484 | 9 | % | 817,259 | 11 | % | 948,714 | 13 | % | ||||||||||||||||||||||||||||||||||||||||||||
| Wholesale deposits | 38,142 | — | % | 53,297 | — | % | 168,724 | 2 | % | 160,043 | 2 | % | 332,687 | 4 | % | ||||||||||||||||||||||||||||||||||||||||||||
Total interest bearing deposits | 9,342,990 | 63 | % | 7,079,830 | 66 | % | 6,492,589 | 68 | % | 5,267,845 | 69 | % | 5,330,427 | 72 | % | ||||||||||||||||||||||||||||||||||||||||||||
| Total deposits | $ | 14,797,529 | 100 | % | $ | 10,776,457 | 100 | % | $ | 9,493,767 | 100 | % | $ | 7,579,747 | 100 | % | $ | 7,372,279 | 100 | % | |||||||||||||||||||||||||||||||||||||||
The following table summarizes the amounts outstanding at December 31, 2020 for deposits of $100,000 and greater, according to the time remaining to maturity. Excluded from the table are brokered demand deposits of $38 million.
| (Dollars in thousands) | Certificates of Deposit | Demand Deposits | Total | ||||||||||||||
| Within three months | $ | 155,889 | 9,881,831 | 10,037,720 | |||||||||||||
| Three months to six months | 147,335 | — | 147,335 | ||||||||||||||
| Seven months to twelve months | 139,984 | — | 139,984 | ||||||||||||||
| Over twelve months | 157,237 | — | 157,237 | ||||||||||||||
| Total | $ | 600,445 | 9,881,831 | 10,482,276 | |||||||||||||
For additional information on deposits, see Note 8 to the Consolidated Financial Statements in “Item 8. Financial Statements and Supplementary Data.”
52
Securities Sold Under Agreements to Repurchase, Federal Home Loan Bank Advances and Other Borrowings
The Company borrows money through repurchase agreements. This process involves the selling of one or more of the securities in the Company’s investment portfolio and simultaneously entering into an agreement to repurchase the same securities at an agreed upon later date, typically overnight. A rate of interest is paid for the agreed period of time. The Bank enters into repurchase agreements with local municipalities, and certain customers, and has adopted procedures designed to ensure proper transfer of title and safekeeping of the underlying securities. In addition to retail repurchase agreements, the Company periodically enters into wholesale repurchase agreements as additional funding sources. The Company has not entered into reverse repurchase agreements.
The Bank is a member of the FHLB of Des Moines, which is one of eleven banks that comprise the FHLB system. The Bank is required to maintain a certain level of activity-based stock in order to borrow or to engage in other transactions with the FHLB of Des Moines. Additionally, the Bank is subject to a membership capital stock requirement that is based upon an annual calibration tied to the total assets of the Bank. The borrowings are collateralized by eligible categories of loans and debt securities (principally, securities which are obligations of, or guaranteed by, the U.S. government and its agencies), provided certain standards related to credit-worthiness have been met. Advances are made pursuant to several different credit programs, each of which has its own interest rates and range of maturities. The Bank’s maximum amount of FHLB advances is limited to the lesser of a fixed percentage of the Bank’s total assets or the discounted value of eligible collateral. FHLB advances fluctuate to meet seasonal and other withdrawals of deposits and to expand lending or investment opportunities of the Company.
Additionally, the Company has other sources of secured and unsecured borrowing lines from various sources that may be used from time to time.
For additional information concerning the Company’s borrowings, see Note 9 to the Consolidated Financial Statements in “Item 8. Financial Statements and Supplementary Data.”
Short-term borrowings
A critical component of the Company’s liquidity and capital resources is access to short-term borrowings to fund its operations. Short-term borrowings are accompanied by increased risks managed by the Bank’s Asset Liability Committee (“ALCO”) such as rate increases or unfavorable change in terms which would make it more costly to obtain future short-term borrowings. The Company’s short-term borrowing sources include FHLB advances, federal funds purchased and retail and wholesale repurchase agreements. The Company also has access to the short-term discount window borrowing programs (i.e., primary credit) of the Federal Reserve Bank (“FRB”). FHLB advances and certain other short-term borrowings may be renewed as long-term borrowings to decrease certain risks such as liquidity or interest rate risk; however, the reduction in risks are weighed against the increased cost of funds and other risks.
The following table provides information relating to significant short-term borrowings, which consists of borrowings that mature within one year of period end:
| At or for the Years ended | |||||||||||||||||
| (Dollars in thousands) | December 31, 2020 | December 31, 2019 | December 31, 2018 | ||||||||||||||
| Repurchase agreements | |||||||||||||||||
| Amount outstanding at end of period | $ | 1,004,583 | 569,824 | 396,151 | |||||||||||||
| Weighted interest rate on outstanding amount | 0.33 | % | 0.74 | % | 0.87 | % | |||||||||||
| Maximum outstanding at any month end | $ | 1,004,583 | 569,824 | 408,754 | |||||||||||||
| Average balance | $ | 783,100 | 470,351 | 383,791 | |||||||||||||
| Weighted-average interest rate | 0.46 | % | 0.79 | % | 0.59 | % | |||||||||||
53
Subordinated Debentures
In addition to funds obtained in the ordinary course of business, the Company formed or has acquired financing subsidiaries for the purpose of issuing trust preferred securities that entitle the investor to receive cumulative cash distributions thereon. Subordinated debentures were issued in conjunction with the trust preferred securities and the terms of the subordinated debentures and trust preferred securities are the same. Provisions of the Dodd-Frank Act require that once a depository institution holding company exceeds $15 billion in total consolidated assets and consummates a subsequent acquisition, then trust preferred securities are to be excluded from Tier 1 capital beginning in the period in which the acquisition occurred. During the current year, the Company’s total consolidated assets exceeded $15 billion and the Company consummated the acquisition of SBAZ; accordingly the trust preferred securities were included in Tier 2 capital instead of Tier 1. The Company also has subordinated debt that qualifies as Tier 2 capital. The subordinated debentures outstanding as of December 31, 2020 were $140 million, including fair value adjustments from acquisitions. For additional information regarding the subordinated debentures, see Note 10 to the Consolidated Financial Statements in “Item 8. Financial Statements and Supplementary Data.”
Contractual Obligations and Off-Balance Sheet Arrangements
In the normal course of business, there may be various outstanding commitments to obtain funding and to extend credit, such as letters of credit and unfunded loan commitments, which are not reflected in the accompanying condensed consolidated financial statements. The Company assessed the off-balance sheet credit exposures as of December 31, 2020 and determined its ACL of $16.1 million was adequate to absorb the estimated credit losses associated with its off-balance sheet arrangements.
Off-balance sheet arrangements also include any obligation related to a variable interest held in an unconsolidated entity. The Company does not anticipate any material losses as a result of these transactions. For additional information regarding the Company’s interests in unconsolidated VIEs, see Note 7 to the Consolidated Financial Statements in “Item 8. Financial Statements and Supplementary Data.”
The following table represents the Company’s contractual obligations as of December 31, 2020:
| Payments Due by Period | |||||||||||||||||||||||||||||||||||||||||||||||
| (Dollars in thousands) | Total | Indeter-minate Maturity 1 | 2021 | 2022 | 2023 | 2024 | 2025 | Thereafter | |||||||||||||||||||||||||||||||||||||||
| Deposits | $ | 14,797,529 | 13,818,751 | 707,026 | 134,255 | 50,947 | 28,639 | 57,847 | 64 | ||||||||||||||||||||||||||||||||||||||
| Repurchase agreements | 1,004,583 | — | 1,004,583 | — | — | — | — | — | |||||||||||||||||||||||||||||||||||||||
| Other borrowed funds | 27,177 | — | — | 526 | 1,224 | 7,009 | 10,068 | 8,350 | |||||||||||||||||||||||||||||||||||||||
| Subordinated debentures | 139,959 | — | — | — | — | — | — | 139,959 | |||||||||||||||||||||||||||||||||||||||
| Finance lease liabilities | 8,099 | — | 260 | 266 | 272 | 280 | 285 | 6,736 | |||||||||||||||||||||||||||||||||||||||
Operating lease liabilities | 68,378 | — | 4,639 | 4,407 | 3,979 | 3,987 | 3,931 | 47,435 | |||||||||||||||||||||||||||||||||||||||
| Total | $ | 16,045,725 | 13,818,751 | 1,716,508 | 139,454 | 56,422 | 39,915 | 72,131 | 202,544 | ||||||||||||||||||||||||||||||||||||||
______________________________
1 Represents non-interest bearing deposits and NOW, DDA, savings, and money market accounts.
54
Liquidity Risk
Liquidity risk is the possibility that the Company will not be able to fund present and future obligations as they come due because of an inability to liquidate assets or obtain adequate funding at a reasonable cost. The objective of liquidity management is to maintain cash flows adequate to meet current and future needs for credit demand, deposit withdrawals, maturing liabilities and corporate operating expenses. Effective liquidity management entails three elements:
1.assessing on an ongoing basis, the current and expected future needs for funds, and ensuring that sufficient funds or access to funds exist to meet those needs at the appropriate time;
2.providing for an adequate cushion of liquidity to meet unanticipated cash flow needs that may arise from potential adverse circumstances ranging from high probability/low severity events to low probability/high severity; and
3.balancing the benefits between providing for adequate liquidity to mitigate potential adverse events and the cost of that liquidity.
The Company has a wide range of versatility in managing the liquidity and asset/liability mix. The Bank’s ALCO meets regularly to assess liquidity risk, among other matters. The Company monitors liquidity and contingency funding alternatives through management reports of liquid assets (e.g., debt securities), both unencumbered and pledged, as well as borrowing capacity, both secured and unsecured, including off-balance sheet funding sources. The Company evaluates its potential funding needs across alternative scenarios and maintains contingency funding plans consistent with the Company’s access to diversified sources of contingent funding.
The following table identifies certain liquidity sources and capacity available to the Company as of the dates indicated:
| (Dollars in thousands) | December 31, 2020 | December 31, 2019 | |||||||||
| FHLB advances | |||||||||||
| Borrowing capacity | $ | 2,446,759 | 2,360,599 | ||||||||
| Amount utilized | — | (38,589) | |||||||||
| Letters of credit | (1,498) | — | |||||||||
| Amount available | $ | 2,445,261 | $ | 2,322,010 | |||||||
| FRB discount window | |||||||||||
| Borrowing capacity | $ | 1,269,778 | 1,061,872 | ||||||||
| Amount utilized | — | — | |||||||||
| Amount available | $ | 1,269,778 | 1,061,872 | ||||||||
| Unsecured lines of credit available | $ | 635,000 | 230,000 | ||||||||
| Unencumbered debt securities | |||||||||||
| U.S. government and federal agency | $ | 38,588 | 19,540 | ||||||||
| U.S. government sponsored enterprises | 9,781 | 7,416 | |||||||||
| State and local governments | 185,680 | 527,348 | |||||||||
| Corporate bonds | 99,764 | 157,602 | |||||||||
| Residential mortgage-backed securities | 1,994,927 | 210,356 | |||||||||
| Commercial mortgage-backed securities | 1,028,944 | 401,849 | |||||||||
| Total unencumbered debt securities | $ | 3,357,684 | 1,324,111 | ||||||||
55
Capital Resources
Maintaining capital strength continues to be a long-term objective of the Company. Abundant capital is necessary to sustain growth, provide protection against unanticipated declines in asset values, and to safeguard the funds of depositors. Capital is also a source of funds for loan demand and enables the Company to effectively manage its assets and liabilities. The Company has the capacity to issue 117,187,500 shares of common stock of which 95,426,364 have been issued as of December 31, 2020. The Company also has the capacity to issue 1,000,000 shares of preferred stock of which none have been issued as of December 31, 2020. Conversely, the Company may decide to utilize a portion of its strong capital position, as it has done in the past, to repurchase shares of its outstanding common stock, depending on market price and other relevant considerations.
The Federal Reserve has adopted capital adequacy guidelines that are used to assess the adequacy of capital in supervising a bank holding company. The federal banking agencies issued final rules (“Final Rules”) that established a comprehensive regulatory capital framework based on the recommendation of the Basel Committee on Banking Supervision and certain requirements of the Dodd-Frank Wall Street Reform and Consumer Protection Act. The Final Rules require the Company to hold a 2.5 percent capital conservation buffer designed to absorb losses during periods of economic stress. As of December 31, 2020, management believes the Company and Bank meet all capital adequacy requirements to which they are subject and there are no conditions or events subsequent to this date that management believes have changed the Company’s or Bank’s risk-based capital category.
The following table illustrates the Bank’s regulatory capital ratios and the Federal Reserve’s capital adequacy guidelines as of December 31, 2020:
| Total Capital (To Risk-Weighted Assets) | Tier 1 Capital (To Risk-Weighted Assets) | Common Equity Tier 1 (To Risk-Weighted Assets) | Leverage Ratio/ Tier 1 Capital (To Average Assets) | ||||||||||||||||||||
Glacier Bank actual regulatory ratios | 14.06 | % | 12.91 | % | 12.91 | % | 9.56 | % | |||||||||||||||
Minimum capital requirements | 8.00 | % | 6.00 | % | 4.50 | % | 4.00 | % | |||||||||||||||
Minimum capital requirements plus capital conservation buffer | 10.50 | % | 8.50 | % | 7.00 | % | N/A | ||||||||||||||||
Well capitalized requirements | 10.00 | % | 8.00 | % | 6.50 | % | 5.00 | % | |||||||||||||||
On January 1, 2020, the Company adopted the CECL accounting standard that requires management’s estimate of credit losses over the expected contractual lives of the Company's relevant financial assets. On March 27, 2020, in response to the COVID-19 pandemic, federal banking regulators issued an interim final rule to delay for two years the initial adoption impact of CECL on regulatory capital, followed by a three-year transition period to phase out the aggregate amount of the capital benefit provided during 2020 and 2021 (i.e., a five-year transition period). The Company has elected to utilize the five-year transition period. During the two-year delay, the Company will add back to Common Tier 1 capital 100 percent of the initial adoption impact of CECL plus 25 percent of the cumulative quarterly changes in ACL (i.e., quarterly transitional amounts). Starting on January 1, 2022, the quarterly transitional amounts along with the initial adoption impact of CECL will be phased out of Common Tier 1 capital evenly over the three-year period.
For additional information regarding regulatory capital, see Note 12 to the Consolidated Financial Statements in “Item 8. Financial Statements and Supplementary Data.”
56
Federal and State Income Taxes
The Company files a consolidated federal income tax return using the accrual method of accounting. All required tax returns have been timely filed. Financial institutions are subject to the provisions of the Internal Revenue Code of 1986, as amended, in the same general manner as other corporations. The federal statutory corporate income tax rate is 21 percent.
Within in the Company’s geographic footprint, Montana, Idaho, Utah, Colorado and Arizona law, financial institutions are subject to a corporation income tax, which incorporates or is substantially similar to applicable provisions of the Internal Revenue Code. The corporation income tax is imposed on federal taxable income, subject to certain adjustments. State taxes are incurred at the rate of 6.75 percent in Montana, 6.925 percent in Idaho, 4.95 percent in Utah, 4.6 percent in Colorado and 4.9 percent in Arizona. Washington, Wyoming and Nevada do not impose a corporate income tax. The Company is also required to file in states other than the eight states in which it has properties.
Income tax expense for the years ended December 31, 2020 and 2019 was $61.6 million and $48.7 million, respectively. The Company’s effective income tax rate for the years ended December 31, 2020 and 2019 was 18.8 percent and 18.8 percent, respectively. The current and prior year’s low effective income tax rates are due to income from tax-exempt debt securities, municipal loans and leases and benefits from federal income tax credits. Income from tax-exempt debt securities, loans and leases was $62.5 million and $49.2 million for the years ended December 31, 2020 and 2019, respectively. Benefits from federal income tax credits were $14.9 million and $11.4 million for the years ended December 31, 2020 and 2019, respectively.
The Company has equity investments in Certified Development Entities (“CDE”) which have received allocations of New Markets Tax Credits (“NMTC”). Administered by the Community Development Financial Institutions Fund (“CDFI Fund”) of the U.S. Department of the Treasury, the NMTC program is aimed at stimulating economic and community development and job creation in low-income communities. The federal income tax credits received are claimed over a seven-year credit allowance period. The Company also has equity investments in Low-Income Housing Tax Credits (“LIHTC”) which are indirect federal subsidies used to finance the development of affordable rental housing for low-income households. The federal income tax credits are claimed over a ten-year credit allowance period. The Company has investments of $25.9 million in Qualified School Construction bonds whereby the Company receives quarterly federal income tax credits in lieu of taxable interest income. The federal income tax credits on these debt securities are subject to federal and state income tax.
Following is a list of expected federal income tax credits to be received in the years indicated.
| (Dollars in thousands) | New Markets Tax Credits | Low-Income Housing Tax Credits | Debt Securities Tax Credits | Total | |||||||||||||||||||
| 2021 | $ | 5,642 | 10,233 | 763 | 16,638 | ||||||||||||||||||
| 2022 | 4,994 | 11,476 | 664 | 17,134 | |||||||||||||||||||
| 2023 | 4,398 | 11,516 | 631 | 16,545 | |||||||||||||||||||
| 2024 | 2,466 | 11,375 | 595 | 14,436 | |||||||||||||||||||
| 2025 | 720 | 11,217 | 451 | 12,388 | |||||||||||||||||||
| Thereafter | — | 38,379 | 452 | 38,831 | |||||||||||||||||||
| $ | 18,220 | 94,196 | 3,556 | 115,972 | |||||||||||||||||||
For additional information on income taxes, see Note 16 to the Consolidated Financial Statements in “Item 8. Financial Statements and Supplementary Data”.
Average Balance Sheet
The following schedule provides 1) the total dollar amount of interest and dividend income of the Company for earning assets and the average yields; 2) the total dollar amount of interest expense on interest bearing liabilities and the average rates; 3) net interest and dividend income and interest rate spread; and 4) net interest margin (tax-equivalent).
57
| Years ended | |||||||||||||||||||||||||||||||||||||||||||||||||||||
| December 31, 2020 | December 31, 2019 | December 31, 2018 | |||||||||||||||||||||||||||||||||||||||||||||||||||
| (Dollars in thousands) | Average Balance | Interest and Dividends | Average Yield/ Rate | Average Balance | Interest and Dividends | Average Yield/ Rate | Average Balance | Interest and Dividends | Average Yield/ Rate | ||||||||||||||||||||||||||||||||||||||||||||
| Assets | |||||||||||||||||||||||||||||||||||||||||||||||||||||
| Residential real estate loans | $ | 1,006,001 | $ | 46,392 | 4.61 | % | $ | 965,553 | $ | 46,899 | 4.86 | % | $ | 868,467 | $ | 40,041 | 4.61 | % | |||||||||||||||||||||||||||||||||||
Commercial loans 1 | 9,057,210 | 441,762 | 4.88 | % | 7,084,753 | 373,888 | 5.28 | % | 6,134,018 | 308,263 | 5.03 | % | |||||||||||||||||||||||||||||||||||||||||
| Consumer and other loans | 948,379 | 44,559 | 4.70 | % | 881,726 | 44,667 | 5.07 | % | 774,813 | 38,292 | 4.94 | % | |||||||||||||||||||||||||||||||||||||||||
Total loans 2 | 11,011,590 | 532,713 | 4.84 | % | 8,932,032 | 465,454 | 5.21 | % | 7,777,298 | 386,596 | 4.97 | % | |||||||||||||||||||||||||||||||||||||||||
Tax-exempt investment securities 3 | 1,306,640 | 52,201 | 4.00 | % | 917,454 | 38,195 | 4.16 | % | 1,083,999 | 50,239 | 4.63 | % | |||||||||||||||||||||||||||||||||||||||||
Taxable investment securities 4 | 2,746,855 | 59,027 | 2.15 | % | 1,935,215 | 56,258 | 2.91 | % | 1,802,704 | 47,771 | 2.65 | % | |||||||||||||||||||||||||||||||||||||||||
| Total earning assets | 15,065,085 | 643,941 | 4.27 | % | 11,784,701 | 559,907 | 4.75 | % | 10,664,001 | 484,606 | 4.54 | % | |||||||||||||||||||||||||||||||||||||||||
| Goodwill and intangibles | 564,603 | 410,561 | 311,321 | ||||||||||||||||||||||||||||||||||||||||||||||||||
| Non-earning assets | 784,075 | 611,788 | 453,394 | ||||||||||||||||||||||||||||||||||||||||||||||||||
| Total assets | $ | 16,413,763 | $ | 12,807,050 | $ | 11,428,716 | |||||||||||||||||||||||||||||||||||||||||||||||
| Liabilities | |||||||||||||||||||||||||||||||||||||||||||||||||||||
| Non-interest bearing deposits | $ | 4,772,386 | $ | — | — | % | $ | 3,323,641 | $ | — | — | % | $ | 2,829,916 | $ | — | — | % | |||||||||||||||||||||||||||||||||||
| NOW and DDA accounts | 3,094,675 | 2,849 | 0.09 | % | 2,447,037 | 4,196 | 0.17 | % | 2,242,935 | 3,862 | 0.17 | % | |||||||||||||||||||||||||||||||||||||||||
| Savings accounts | 1,737,272 | 742 | 0.04 | % | 1,420,682 | 1,022 | 0.07 | % | 1,298,985 | 862 | 0.07 | % | |||||||||||||||||||||||||||||||||||||||||
Money market deposit accounts | 2,356,508 | 5,077 | 0.22 | % | 1,787,149 | 5,385 | 0.30 | % | 1,704,269 | 3,377 | 0.20 | % | |||||||||||||||||||||||||||||||||||||||||
| Certificate accounts | 986,126 | 8,568 | 0.87 | % | 923,840 | 9,257 | 1.00 | % | 919,356 | 6,497 | 0.71 | % | |||||||||||||||||||||||||||||||||||||||||
Wholesale deposits 5 | 78,283 | 384 | 0.49 | % | 137,442 | 3,420 | 2.49 | % | 156,022 | 3,761 | 2.41 | % | |||||||||||||||||||||||||||||||||||||||||
| FHLB advances | 79,277 | 733 | 0.91 | % | 265,712 | 9,023 | 3.35 | % | 231,158 | 8,880 | 3.79 | % | |||||||||||||||||||||||||||||||||||||||||
Repurchase agreements and other borrowed funds | 955,205 | 8,962 | 0.94 | % | 625,242 | 10,470 | 1.67 | % | 526,623 | 8,292 | 1.57 | % | |||||||||||||||||||||||||||||||||||||||||
Total interest bearing liabilities | 14,059,732 | 27,315 | 0.19 | % | 10,930,745 | 42,773 | 0.39 | % | 9,909,264 | 35,531 | 0.36 | % | |||||||||||||||||||||||||||||||||||||||||
| Other liabilities | 162,079 | 123,002 | 71,901 | ||||||||||||||||||||||||||||||||||||||||||||||||||
| Total liabilities | 14,221,811 | 11,053,747 | 9,981,165 | ||||||||||||||||||||||||||||||||||||||||||||||||||
| Stockholders’ Equity | |||||||||||||||||||||||||||||||||||||||||||||||||||||
| Common stock | 949 | 883 | 836 | ||||||||||||||||||||||||||||||||||||||||||||||||||
| Paid-in capital | 1,474,359 | 1,208,772 | 1,014,559 | ||||||||||||||||||||||||||||||||||||||||||||||||||
| Retained earnings | 604,796 | 510,601 | 452,996 | ||||||||||||||||||||||||||||||||||||||||||||||||||
Accumulated other comprehensive income (loss) | 111,848 | 33,047 | (20,840) | ||||||||||||||||||||||||||||||||||||||||||||||||||
| Total stockholders’ equity | 2,191,952 | 1,753,303 | 1,447,551 | ||||||||||||||||||||||||||||||||||||||||||||||||||
Total liabilities and stockholders’ equity | $ | 16,413,763 | $ | 12,807,050 | $ | 11,428,716 | |||||||||||||||||||||||||||||||||||||||||||||||
Net interest income (tax-equivalent) | $ | 616,626 | $ | 517,134 | $ | 449,075 | |||||||||||||||||||||||||||||||||||||||||||||||
Net interest spread (tax-equivalent) | 4.08 | % | 4.36 | % | 4.18 | % | |||||||||||||||||||||||||||||||||||||||||||||||
Net interest margin (tax-equivalent) | 4.09 | % | 4.39 | % | 4.21 | % | |||||||||||||||||||||||||||||||||||||||||||||||
______________________________
1Includes tax effect of $5.3 million, $4.8 million and $4.1 million on tax-exempt municipal loan and lease income for the years ended December 31, 2020, 2019 and 2018, respectively.
2Total loans are gross of the allowance for credit losses, net of unearned income and include loans held for sale. Non-accrual loans were included in the average volume for the entire period.
3Includes tax effect of $10.5 million, $7.8 million and $10.3 million on tax-exempt debt securities income for the years ended December 31, 2020, 2019 and 2018, respectively.
4Includes tax effect of $1.1 million, $1.1 million and $1.2 million on federal income tax credits for the years ended December 31, 2020, 2019 and 2018, respectively.
5Wholesale deposits include brokered deposits classified as NOW, DDA, money market deposit and certificate accounts.
58
Rate/Volume Analysis
Net interest income can be evaluated from the perspective of relative dollars of change in each period. Interest income and interest expense, which are the components of net interest income, are shown in the following table on the basis of the amount of any increases (or decreases) attributable to changes in the dollar levels of the Company’s interest earning assets and interest bearing liabilities (“volume”) and the yields earned and paid on such assets and liabilities (“rate”). The change in interest income and interest expense attributable to changes in both volume and rates has been allocated proportionately to the change due to volume and the change due to rate.
| Year ended December 31, | Year ended December 31, | ||||||||||||||||||||||||||||||||||
| 2020 vs. 2019 | 2019 vs. 2018 | ||||||||||||||||||||||||||||||||||
| Increase (Decrease) Due to: | Increase (Decrease) Due to: | ||||||||||||||||||||||||||||||||||
| (Dollars in thousands) | Volume | Rate | Net | Volume | Rate | Net | |||||||||||||||||||||||||||||
| Interest income | |||||||||||||||||||||||||||||||||||
| Residential real estate loans | $ | 1,964 | (2,471) | (507) | 4,476 | 2,382 | 6,858 | ||||||||||||||||||||||||||||
| Commercial loans (tax-equivalent) | 105,403 | (37,528) | 67,875 | 47,779 | 17,846 | 65,625 | |||||||||||||||||||||||||||||
| Consumer and other loans | 3,508 | (3,616) | (108) | 5,284 | 1,091 | 6,375 | |||||||||||||||||||||||||||||
| Investment securities (tax-equivalent) | 39,760 | (22,987) | 16,773 | (1,156) | (2,401) | (3,557) | |||||||||||||||||||||||||||||
| Total interest income | 150,635 | (66,602) | 84,033 | 56,383 | 18,918 | 75,301 | |||||||||||||||||||||||||||||
| Interest expense | |||||||||||||||||||||||||||||||||||
| NOW and DDA accounts | 1,125 | (2,471) | (1,346) | 351 | (17) | 334 | |||||||||||||||||||||||||||||
| Savings accounts | 231 | (511) | (280) | 81 | 79 | 160 | |||||||||||||||||||||||||||||
| Money market deposit accounts | 1,735 | (2,043) | (308) | 164 | 1,844 | 2,008 | |||||||||||||||||||||||||||||
| Certificate accounts | 651 | (1,340) | (689) | 32 | 2,728 | 2,760 | |||||||||||||||||||||||||||||
| Wholesale deposits | (1,467) | (1,570) | (3,037) | (448) | 107 | (341) | |||||||||||||||||||||||||||||
| FHLB advances | (6,324) | (1,966) | (8,290) | 1,327 | (1,184) | 143 | |||||||||||||||||||||||||||||
Repurchase agreements and other borrowed funds | 5,569 | (7,077) | (1,508) | 1,553 | 625 | 2,178 | |||||||||||||||||||||||||||||
| Total interest expense | 1,520 | (16,978) | (15,458) | 3,060 | 4,182 | 7,242 | |||||||||||||||||||||||||||||
Net interest income (tax-equivalent) | $ | 149,115 | (49,624) | 99,491 | 53,323 | 14,736 | 68,059 | ||||||||||||||||||||||||||||
Net interest income (tax-equivalent) increased $99.5 million for the year ended December 31, 2020 compared to the same period in 2019. The interest income for 2020 increased over the same period last year primarily from increased growth in commercial loans and investment securities. The growth in the commercial loan portfolio was driven by the PPP loans new for 2020. The growth in the investment securities was the result of security purchases utilizing excess liquidity from the increase in core deposits. Total interest expense decreased from the prior year primarily from the decreased rates on deposits and borrowings combined with a decreased amount of FHLB advances and wholesale deposits.
Net interest income (tax-equivalent) increased $68.1 million for the year ended December 31, 2019 compared to 2018. The interest income for 2019 increased over the same period last year primarily from increased loan growth in all categories, with the largest increase in the Company’s commercial loan portfolio. Consistent with the 2018, increases in interest rates on existing variable rate loans and new loans also increased the loan interest income. Total interest expense increased from 2018 primarily from the increase in money market deposit accounts, certificate accounts and repurchase agreements driven by both rate and volume increases.
Effect of inflation and changing prices
GAAP often requires the measurement of financial position and operating results in terms of historical dollars, without consideration for change in relative purchasing power over time due to inflation. Virtually all assets of the Company are monetary in nature; therefore, interest rates generally have a more significant impact on a company’s performance than does the effect of inflation.
Cyber Risk
A failure in or breach of the Company’s operational or security systems, or those of the Company’s third party service providers, including as a result of cyber-attacks, could disrupt business, result in the disclosure or misuse of confidential or proprietary information, damage our reputation, increase costs and cause losses. The Company employs detection and response mechanisms designed to contain and mitigate these risks. The Company maintains a robust information security program that is regularly reviewed, tested, and updated. This includes vulnerability and patch management programs, incident response planning, security
59
monitoring, employee training, and security awareness testing. The Board's Risk Oversight Committee is responsible for monitoring the Company’s cyber risk management profile and related programs. The Board is responsible for approval of related policies.
Critical Accounting Policies
The preparation of consolidated financial statements in conformity with GAAP often requires management to use significant judgments as well as subjective and/or complex measurements in making estimates and assumptions that affect the reported amounts of assets, liabilities, income and expenses. The Company considers its accounting policies for the ACL, goodwill and fair value measurements to be critical accounting policies. The application of these policies has a significant impact on the Company’s consolidated financial statements and financial results could differ significantly if different judgments or estimates were applied.
Allowance for Credit Losses
For information regarding the ACL, its relation to the provision for credit losses and risk related to asset quality, see the section captioned “Allowance for Credit Losses - Loans Receivable” included in “Item 7. Management’s Discussion and Analysis of Financial Condition and Results of Operations” and Notes 1 and 3 to the Consolidated Financial Statements in “Item 8. Financial Statements and Supplementary Data.”
Goodwill
For information on goodwill, see Notes 1 and 5 to the Consolidated Financial Statements in “Item 8. Financial Statements and Supplementary Data.”
Fair Value Measurements
For information on fair value measurements, see Note 21 to the Consolidated Financial Statements in “Item 8. Financial Statements and Supplementary Data.”
Impact of Recently Issued Accounting Standards
Authoritative accounting guidance that may have had a material impact on the Company that became effective during 2020 or 2019 includes amendments to:
•FASB ASC Topic 326, Financial Instruments - Credit Losses
•FASB ASC Topic 350, Simplifying the Test for Goodwill;
•FASB Accounting Standards CodificationTM (“ASC”) Subtopic 310-20, Receivables - Nonrefundable Fees and Other Costs;
•FASB ASC Topic 842, Leases;
There is no authoritative accounting guidance which is pending adoption at December 31, 2020, that is expected to have a material impact on the Company.
For additional information on the topics and the impact on the Company see Note 1 to the Consolidated Financial Statements in “Item 8. Financial Statements and Supplementary Data.”
Item 7A. Quantitative and Qualitative Disclosures about Market Risk
The disclosures set forth in this item are qualified by the section captioned “Forward-Looking Statements” included in “Item 7. Management’s Discussion and Analysis of Financial Condition and Results of Operations.” Market risk is the risk of loss in a financial instrument arising from adverse changes in market rates/prices such as interest rates, foreign currency exchange rates, commodity prices, and equity prices. The Company’s primary market risk exposure is interest rate risk.
Interest Rate Risk
Interest rate risk is the potential for loss of future earnings resulting from adverse changes in the level of interest rates. Interest rate risk results from many factors and could have a significant impact on the Company’s net interest income, which is the Company’s primary source of net income. Net interest income is affected by changes in interest rates, the relationship between rates on interest bearing assets and liabilities, the impact of the interest fluctuations on asset prepayments and the mix of interest bearing assets and liabilities.
Although interest rate risk is inherent in the banking industry, banks are expected to have sound risk management practices in place to measure, monitor and control interest rate exposures. The objective of interest rate risk management is to contain the risks associated with interest rate fluctuations. The process involves identification and management of the sensitivity of net interest income to changing interest rates.
The ongoing monitoring and management of this risk is an important component of the Company’s asset/liability management process which is governed by policies established by the Company’s Board that are reviewed and approved annually. The Board delegates
60
responsibility for carrying out the asset/liability management policies to ALCO. In this capacity, ALCO develops guidelines and strategies impacting the Company’s asset/liability management-related activities based upon estimated market risk sensitivity, policy limits and overall market interest rate levels and trends. The Company’s goal of its asset and liability management practices is to maintain or increase the level of net interest income within an acceptable level of interest rate risk.
Net interest income simulation
The Company uses a detailed and dynamic simulation model to quantify the estimated exposure of net interest income (“NII”) to sustained interest rate changes. While ALCO routinely monitors simulated NII sensitivity over rolling two-year and five-year horizons, it also utilizes additional tools to monitor potential longer-term interest rate risk. The simulation model captures the impact of changing interest rates on the interest income received and interest expense paid on all assets and liabilities reflected on the Company’s statements of financial condition. This sensitivity analysis is compared to ALCO policy limits which specify a maximum tolerance level for NII exposure over a one year and two year horizon, assuming no balance sheet growth. The ALCO policy rate scenarios include upward and downward shifts in interest rates for 100 bps, 200 bps, 300 bps, and 400 bps scenarios with instantaneous and parallel changes in current market yield curves. The ALCO policy also includes 200 bps and 400 bps rate scenarios with gradual parallel shifts in interest rates over 12-month and 24-month periods, respectively. Given the historically low rate environment, the Company only models and reports for a downward shift in interest rates of 100 bps. Other non-parallel rate movement scenarios are also modeled to determine the potential impact on net interest income. The additional scenarios are adjusted as the economic environment changes and provide ALCO additional interest rate risk monitoring tools to evaluate current market conditions.
The following is indicative of the Company’s overall NII sensitivity analysis as of December 31, 2020. The Company’s NII sensitivity remained within policy limits at December 31, 2020.
| Estimated Sensitivity | ||||||||||||||
| Rate Scenarios | One Year | Two Years | ||||||||||||
| -100 bps Rate shock | (4.77 | %) | (6.04 | %) | ||||||||||
| +100 bps Rate shock | 1.14 | % | 3.33 | % | ||||||||||
| +200 bps Rate shock | 1.13 | % | 5.55 | % | ||||||||||
| +200 bps Rate ramp | 0.69 | % | 2.97 | % | ||||||||||
| +300 bps Rate shock | 1.32 | % | 8.06 | % | ||||||||||
| +400 bps Rate shock | 1.24 | % | 10.17 | % | ||||||||||
| +400 bps Rate ramp | 1.33 | % | 2.70 | % | ||||||||||
The preceding sensitivity analysis does not represent a forecast and should not be relied upon as being indicative of expected operating results. These hypothetical estimates are based upon numerous assumptions including: the nature and timing of interest rate levels including, but not limited to, yield curve shape, prepayments on loans and securities, deposit decay rates, pricing decisions on loans and deposits and reinvestment/replacement of asset and liability cash flows. While assumptions are developed based upon current economic and local market conditions, the Company cannot make any assurances as to the predictive nature of these assumptions including how customer preferences or competitor influences might change. Also, as market conditions vary from those assumed in the sensitivity analysis, actual results will also differ due to prepayment/refinancing levels likely deviating from those assumed, the varying impact of interest rate caps or floors on adjustable rate assets, the potential effect of changing debt service levels on customers with adjustable rate loans, depositor early withdrawals and product preference changes, and other internal and external variables. Furthermore, the sensitivity analysis does not reflect actions that ALCO might take in responding to or anticipating changes in interest rates.
Item 8. Financial Statements and Supplementary Data
61
Report of Independent Registered Public Accounting Firm
Stockholders, Board of Directors and Audit Committee
Glacier Bancorp, Inc.
Kalispell, Montana
Opinion on the Financial Statements
We have audited the accompanying consolidated statements of financial condition of Glacier Bancorp, Inc. (the Company) as of December 31, 2020 and 2019, the related consolidated statements of operations, comprehensive income, changes in stockholders’ equity and cash flows for each of the years in the three-year period ended December 31, 2020, and the related notes (collectively referred to as the “financial statements”). In our opinion, the consolidated financial statements referred to above present fairly, in all material respects, the financial position of the Company as of December 31, 2020 and 2019, and the results of its operations and its cash flows for each of the years in the three-year period ended December 31, 2020, in conformity with accounting principles generally accepted in the United States of America.
We also have audited, in accordance with the standards of the Public Company Accounting Oversight Board (United States) (PCAOB), the Company’s internal control over financial reporting as of December 31, 2020, based on criteria established in Internal Control – Integrated Framework (2013), issued by the Committee of Sponsoring Organizations of the Treadway Commission (COSO), and our report dated March 1, 2021, expressed an unqualified opinion thereon.
Adoption of New Accounting Standard
As discussed in Notes 1, 2 and 3 to the consolidated financial statements, the Company changed its method for accounting for credit losses on investments, loans and unfunded loan commitments in 2020 due to the adoption of ASC Topic 326. As discussed below, the allowance for credit losses is considered a critical audit matter.
Basis for Opinion
These financial statements are the responsibility of the Company’s management. Our responsibility is to express an opinion on the Company’s financial statements based on our audits.
We are a public accounting firm registered with the PCAOB and are required to be independent with respect to the Company in accordance with the U.S. federal securities laws and the applicable rules and regulations of the Securities and Exchange Commission and the PCAOB.
62
Stockholders, Board of Directors and Audit Committee
Glacier Bancorp, Inc.
Page 2
We conducted our audits in accordance with the standards of the PCAOB. Those standards require that we plan and perform the audits to obtain reasonable assurance about whether the financial statements are free of material misstatement, whether due to error or fraud. Our audits included performing procedures to assess the risks of material misstatement of the financial statements, whether due to error or fraud, and performing procedures that respond to those risks. Such procedures include examining, on a test basis, evidence regarding the amounts and disclosures in the financial statements. Our audits also included evaluating the accounting principles used and significant estimates made by management, as well as evaluating the overall presentation of the financial statements. We believe that our audits provide a reasonable basis for our opinion.
Critical Audit Matters
The critical audit matters communicated below are matters arising from the current period audit of the financial statements that were communicated or required to be communicated to the audit committee and that: (1) relate to accounts or disclosures that are material to the financial statements and (2) involved our especially challenging, subjective or complex judgments. The communication of critical audit matters does not alter in any way our opinion on the financial statements, taken as a whole, and we are not, by communicating the critical audit matters below, providing separate opinions on the critical audit matters or on the accounts or disclosures to which they relate.
Allowance for Credit Losses
As described in Notes 1 and 3 to the consolidated financial statements, the Company adopted the Financial Accounting Standards Board (FAB) Accounting Standards Update (ASU) No. 2016-13, Topic 326, Financial Instruments – Credit Losses, on January 1, 2020, which significantly changed the loan and allowance for credit losses (ACL) accounting and related financial statement disclosures. The Company’s consolidated ACL was approximately $158 million at December 31, 2020. The ACL is an estimate of probable credit losses related to specifically identified loans and for losses inherent in the portfolio that the Company is unlikely to recover. The determination of the ACL includes a quantitative portion that calculates historical average loss rates and uses forecast assumptions and other inputs to project credit losses over the life of the loan portfolio. Additionally, the ACL requires management to exercise significant judgment and consider numerous subjective factors, including determining qualitative factors utilized to adjust the ACL for projected credit losses that the quantitative allocations portion does not factor into its consideration. As disclosed by management, different assumptions and conditions could result in a materially different amount for the ACL.
We identified the valuation of the ACL as a critical audit matter. Auditing the allowance for credit loss involved a high degree of subjectivity in evaluating management’s estimates, such as evaluating management’s identification of credit quality indicators, assessment of economic conditions and other environmental factors, evaluating the adequacy of specific allowances associated with individually evaluated loans and assessing the appropriateness of loan grades and non-accrual, collateral dependent, and individually evaluated designations.
63
Stockholders, Board of Directors and Audit Committee
Glacier Bancorp, Inc.
Page 3
The primary procedures we performed to address this critical audit matter included:
•Testing the effectiveness of controls, including those related to technology over the ACL including data completeness and accuracy, classifications of loan segments, historical data, the calculation of baseline loss rates, the establishment of qualitative adjustments, identification of individually evaluated loans and risk classification of individual loans and/or loan relationships, establishment of specific reserves on individually evaluated loans and management’s review controls over the ACL balance as a whole;
•Testing of completeness and accuracy of the information utilized in the ACL through testing of year-end loan balances, non-accrual and individually evaluated loan designations, gross charge-offs and recoveries;
•Testing of the Company’s ACL narrative supporting the overall ACL process in place and adjusted loss factors applied to various loan segments;
•Testing of the economic inputs utilized to generate the economic forecast multipliers utilized within the quantitative portion of the ACL;
•Testing the Company’s ACL model for computational accuracy;
•Evaluating the qualitative adjustments to the loan segments, including assessing the basis for the adjustments and the reasonableness of the significant assumptions, including; management’s COVID-19 qualitative factor adjustments;
•Testing the loan review functions and evaluating the accuracy of loan grades, specific reserve calculations, and non-accrual and collateral-dependent identifications;
•Utilizing internal subject matter experts in the area of loan review to assist us in evaluating the appropriateness of loan grades, non-accrual and collateral dependent loan identifications and to assess the reasonableness of specific impairments allocated to impaired loans;
•Evaluating the overall reasonableness of assumptions used by considering the past performance of the Company and evaluating to trends identified within the banking industry, including, but not limited to the following:
◦Timing and frequency of improvements noted in key lending ratios that are indicative of potential credit risk in the overall loan portfolio and banking industry
◦Observation of trends in the Company’s overall qualitative factors to ensure directional consistency, the overall economic climate and risk trends identified in the loan portfolio
◦Evaluating the relevance and reliability of the data and data sources
Merger and Acquisition
As described in Note 23 to the consolidated financial statements, the Company consummated the acquisition of a bank holding company during the year ended December 31, 2020, resulting in the expansion of the Company’s operating footprint and additional goodwill of approximately $58 million being recognized on the Company’s consolidated statement of financial condition. As part of the acquisition consummated during the year, management determined that the acquisition qualified as a business and accordingly all identifiable assets and liabilities acquired were valued at fair value as part of the purchase price allocation as of the acquisition date. The identification and valuation of such acquired assets and assumed liabilities requires management to exercise significant judgment and consider the use of outside vendors to estimate the fair value allocations.
64
Stockholders, Board of Directors and Audit Committee
Glacier Bancorp, Inc.
Page 4
We identified the acquisition and the valuation of acquired assets and assumed liabilities as a critical audit matter. Auditing the acquired net assets and acquisition related considerations involved a high degree of subjectivity in evaluating management’s operational assumptions of the newly acquired division, fair value estimates, purchase price allocations and assessing the appropriateness of outside vendor valuation models.
The primary procedures we performed to address this critical audit matter included:
•Obtaining and reviewing executed Plan and Agreement of Merger document to gain an understanding of the underlying terms of the consummated acquisition;
•Obtaining and reviewing management’s purchase accounting checklist to gain an understanding of procedures performed to identify and value the acquired assets and liabilities;
•Testing management’s purchase accounting analysis, focusing on the completeness and accuracy of the balance sheet acquired and related fair value purchase price allocations made to the identified assets acquired and liabilities assumed;
•Obtaining valuation estimates prepared by the Company’s valuation specialist and challenging management’s analysis of the appropriateness of the valuations allocated to assets acquired and liabilities assumed; including but not limited to, testing of critical inputs, assumptions applied and valuation models utilized by the Company’s valuation specialist;
•Utilization of BKD’s internal valuation specialists to assist with evaluating the related fair value purchase price allocations made to the identified assets acquired and liabilities assumed;
•Testing the goodwill calculation resulting from the acquisition consummated, which is the difference between the total net consideration paid and the fair value of the net assets acquired;
•Reviewing and evaluating the adequacy of the disclosures made in the footnotes of the Company’s SEC filings.
Emphasis of a Matter
As discussed in Note 1 to the financial statements, on January 1, 2020, the Company adopted new accounting guidance for accounting for credit losses. Our opinion is not modified with respect to this matter.
We have served as the Company’s auditor since 2005.
/s/ BKD, LLP
Denver, Colorado
March 1, 2021
65
Report of Independent Registered Public Accounting Firm
Stockholders, Board of Directors and Audit Committee
Glacier Bancorp, Inc.
Kalispell, Montana
Opinion on Internal Control Over Financial Reporting
We have audited Glacier Bancorp, Inc.’s (the Company) internal control over financial reporting as of December 31, 2020, based on criteria established in Internal Control – Integrated Framework (2013) issued by the Committee of Sponsoring Organizations of the Treadway Commission (COSO).
In our opinion, the Company maintained, in all material respects, effective internal control over financial reporting as of December 31, 2020, based on criteria established in Internal Control – Integrated Framework (2013) issued by the Committee of Sponsoring Organizations of the Treadway Commission (COSO).
We also have audited, in accordance with the standards of the Public Company Accounting Oversight Board (United States) (PCAOB), the consolidated financial statements of the Company and our report dated March 1, 2021 expressed an unqualified opinion thereon.
Basis for Opinion
The Company’s management is responsible for maintaining effective internal control over financial reporting and for its assessment of the effectiveness of internal control over financial reporting, included in the accompanying Management’s Report on Internal Control Over Financial Reporting. Our responsibility is to express an opinion on the Company’s internal control over financial reporting based on our audit.
We are a public accounting firm registered with the PCAOB and are required to be independent with respect to the Company in accordance with the U.S. federal securities laws and the applicable rules and regulations of the Securities and Exchange Commission and the PCAOB.
We conducted our audit in accordance with the standards of the PCAOB. Those standards require that we plan and perform the audit to obtain reasonable assurance about whether effective internal control over financial reporting was maintained in all material respects.
Our audit included obtaining an understanding of internal control over financial reporting, assessing the risk that a material weakness exists and testing and evaluating the design and operating effectiveness of internal control based on the assessed risk. Our audit also included performing such other procedures as we considered necessary in the circumstances. We believe that our audit provides a reasonable basis for our opinion.
66
Stockholders, Board of Directors and Audit Committee
Glacier Bancorp, Inc.
Page 2
Definitions and Limitations of Internal Control Over Financial Reporting
A Company’s internal control over financial reporting is a process designed to provide reasonable assurance regarding the reliability of financial reporting and the preparation of reliable financial statements for external purposes in accordance with generally accepted accounting principles. A Company’s internal control over financial reporting includes those policies and procedures that (1) pertain to the maintenance of records that, in reasonable detail, accurately and fairly reflect the transactions and dispositions of the assets of the Company; (2) provide reasonable assurance that transactions are recorded as necessary to permit preparation of financial statements in accordance with generally accepted accounting principles, and that receipts and expenditures of the Company are being made only in accordance with authorizations of management and directors of the Company; and (3) provide reasonable assurance regarding prevention or timely detection of unauthorized acquisition, use or disposition of the Company’s assets that could have a material effect on the financial statements.
Because of its inherent limitations, internal control over financial reporting may not prevent or detect misstatements. Also, projections of any evaluation of effectiveness to future periods are subject to the risk that controls may become inadequate because of changes in conditions or that the degree of compliance with the policies or procedures may deteriorate.
/s/ BKD, LLP
Denver, Colorado
March 1, 2021
67
GLACIER BANCORP, INC.
CONSOLIDATED STATEMENTS OF FINANCIAL CONDITION
| (Dollars in thousands, except per share data) | December 31, 2020 | December 31, 2019 | |||||||||
| Assets | |||||||||||
| Cash on hand and in banks | $ | ||||||||||
| Interest bearing cash deposits | |||||||||||
| Cash and cash equivalents | |||||||||||
| Debt securities, available-for-sale | |||||||||||
| Debt securities, held-to-maturity | |||||||||||
| Total debt securities | |||||||||||
| Loans held for sale, at fair value | |||||||||||
| Loans receivable | |||||||||||
| Allowance for credit losses | ( | ( | |||||||||
| Loans receivable, net | |||||||||||
| Premises and equipment, net | |||||||||||
| Other real estate owned | |||||||||||
| Accrued interest receivable | |||||||||||
| Deferred tax asset | |||||||||||
| Core deposit intangible, net | |||||||||||
| Goodwill | |||||||||||
| Non-marketable equity securities | |||||||||||
| Bank-owned life insurance | |||||||||||
| Other assets | |||||||||||
| Total assets | $ | ||||||||||
| Liabilities | |||||||||||
| Non-interest bearing deposits | $ | ||||||||||
| Interest bearing deposits | |||||||||||
| Securities sold under agreements to repurchase | |||||||||||
| Federal Home Loan Bank advances | |||||||||||
| Other borrowed funds | |||||||||||
| Subordinated debentures | |||||||||||
| Accrued interest payable | |||||||||||
| Deferred tax liability | |||||||||||
| Other liabilities | |||||||||||
| Total liabilities | |||||||||||
| Commitments and Contingent Liabilities | |||||||||||
| Stockholders’ Equity | |||||||||||
Preferred shares, $ | |||||||||||
Common stock, $ | |||||||||||
| Paid-in capital | |||||||||||
| Retained earnings - substantially restricted | |||||||||||
| Accumulated other comprehensive income | |||||||||||
| Total stockholders’ equity | |||||||||||
| Total liabilities and stockholders’ equity | $ | ||||||||||
| Number of common stock shares issued and outstanding | |||||||||||
See accompanying notes to consolidated financial statements.
68
GLACIER BANCORP, INC.
CONSOLIDATED STATEMENTS OF OPERATIONS
| Years ended | |||||||||||||||||
| (Dollars in thousands, except per share data) | December 31, 2020 | December 31, 2019 | December 31, 2018 | ||||||||||||||
| Interest Income | |||||||||||||||||
| Investment securities | $ | ||||||||||||||||
| Residential real estate loans | |||||||||||||||||
| Commercial loans | |||||||||||||||||
| Consumer and other loans | |||||||||||||||||
| Total interest income | |||||||||||||||||
| Interest Expense | |||||||||||||||||
| Deposits | |||||||||||||||||
| Securities sold under agreements to repurchase | |||||||||||||||||
| Federal Home Loan Bank advances | |||||||||||||||||
Other borrowed funds | |||||||||||||||||
| Subordinated debentures | |||||||||||||||||
| Total interest expense | |||||||||||||||||
| Net Interest Income | |||||||||||||||||
| Provision for credit losses | |||||||||||||||||
Net interest income after provision for credit losses | |||||||||||||||||
| Non-Interest Income | |||||||||||||||||
| Service charges and other fees | |||||||||||||||||
| Miscellaneous loan fees and charges | |||||||||||||||||
| Gain on sale of loans | |||||||||||||||||
| Gain (loss) on sale of debt securities | ( | ||||||||||||||||
| Other income | |||||||||||||||||
| Total non-interest income | |||||||||||||||||
| Non-Interest Expense | |||||||||||||||||
| Compensation and employee benefits | |||||||||||||||||
| Occupancy and equipment | |||||||||||||||||
| Advertising and promotions | |||||||||||||||||
| Data processing | |||||||||||||||||
| Other real estate owned | |||||||||||||||||
| Regulatory assessments and insurance | |||||||||||||||||
| Loss on termination of hedging activities | |||||||||||||||||
| Core deposit intangible amortization | |||||||||||||||||
| Other expenses | |||||||||||||||||
| Total non-interest expense | |||||||||||||||||
| Income Before Income Taxes | |||||||||||||||||
| Federal and state income tax expense | |||||||||||||||||
| Net Income | $ | ||||||||||||||||
| Basic earnings per share | $ | ||||||||||||||||
| Diluted earnings per share | $ | ||||||||||||||||
| Dividends declared per share | $ | ||||||||||||||||
| Average outstanding shares - basic | |||||||||||||||||
| Average outstanding shares - diluted | |||||||||||||||||
See accompanying notes to consolidated financial statements.
69
GLACIER BANCORP, INC.
CONSOLIDATED STATEMENTS OF COMPREHENSIVE INCOME
| Years ended | |||||||||||||||||
| (Dollars in thousands) | December 31, 2020 | December 31, 2019 | December 31, 2018 | ||||||||||||||
| Net Income | $ | ||||||||||||||||
| Other Comprehensive Income, Net of Tax | |||||||||||||||||
| Unrealized gains (losses) on available-for-sale securities | ( | ||||||||||||||||
| Reclassification adjustment for (gains) losses included in net income | ( | ( | |||||||||||||||
| Net unrealized gains (losses) on available-for-sale securities | ( | ||||||||||||||||
| Tax effect | ( | ( | |||||||||||||||
| Net of tax amount | ( | ||||||||||||||||
| Unrealized (losses) gains on derivatives used for cash flow hedges | ( | ( | |||||||||||||||
| Reclassification adjustment for losses included in net income | |||||||||||||||||
Net unrealized gains (losses) on derivatives used for cash flow hedges | ( | ||||||||||||||||
| Tax effect | ( | ( | |||||||||||||||
| Net of tax amount | ( | ||||||||||||||||
| Total other comprehensive income (loss), net of tax | ( | ||||||||||||||||
| Total Comprehensive Income | $ | ||||||||||||||||
See accompanying notes to consolidated financial statements.
70
GLACIER BANCORP, INC.
CONSOLIDATED STATEMENTS OF CHANGES IN STOCKHOLDERS’ EQUITY
Years ended December 31, 2020, 2019 and 2018
| (Dollars in thousands, except per share data) | Common Stock | Paid-in Capital | Retained Earnings Substantially Restricted | Accumulated Other Comp-rehensive (Loss) Income | |||||||||||||||||||||||||||||||
| Shares | Amount | Total | |||||||||||||||||||||||||||||||||
| Balance at January 1, 2018 | $ | ( | |||||||||||||||||||||||||||||||||
| Net income | — | — | — | — | |||||||||||||||||||||||||||||||
| Other comprehensive loss | — | — | — | ( | ( | ||||||||||||||||||||||||||||||
Cash dividends declared ($ | — | — | — | ( | — | ( | |||||||||||||||||||||||||||||
| Stock issued in connection with acquisitions | — | — | |||||||||||||||||||||||||||||||||
Stock issuances under stock incentive plans | ( | — | — | ||||||||||||||||||||||||||||||||
Stock-based compensation and related taxes | — | — | — | — | |||||||||||||||||||||||||||||||
| Balance at December 31, 2018 | $ | ( | |||||||||||||||||||||||||||||||||
| Net income | — | — | — | — | |||||||||||||||||||||||||||||||
| Other comprehensive income | — | — | — | — | |||||||||||||||||||||||||||||||
Cash dividends declared ($ | — | — | — | ( | — | ( | |||||||||||||||||||||||||||||
Stock issued in connection with acquisitions | — | — | |||||||||||||||||||||||||||||||||
Stock issuances under stock incentive plans | ( | — | — | ||||||||||||||||||||||||||||||||
Stock-based compensation and related taxes | — | — | — | — | |||||||||||||||||||||||||||||||
| Cumulative-effect of accounting changes | — | $ | — | — | ( | — | ( | ||||||||||||||||||||||||||||
| Balance at December 31, 2019 | |||||||||||||||||||||||||||||||||||
| Net income | — | — | — | — | |||||||||||||||||||||||||||||||
| Other comprehensive income | — | — | — | — | |||||||||||||||||||||||||||||||
Cash dividends declared ($ | — | — | — | ( | — | ( | |||||||||||||||||||||||||||||
Stock issued in connection with acquisitions | — | — | |||||||||||||||||||||||||||||||||
Stock issuances under stock incentive plans | ( | — | — | ||||||||||||||||||||||||||||||||
Stock-based compensation and related taxes | — | — | — | — | |||||||||||||||||||||||||||||||
| Cumulative-effect of accounting changes | — | — | — | ( | — | ( | |||||||||||||||||||||||||||||
| Balance at December 31, 2020 | $ | ||||||||||||||||||||||||||||||||||
See accompanying notes to consolidated financial statements.
71
GLACIER BANCORP, INC.
CONSOLIDATED STATEMENTS OF CASH FLOWS
| Years ended | |||||||||||||||||
| (Dollars in thousands) | December 31, 2020 | December 31, 2019 | December 31, 2018 | ||||||||||||||
| Operating Activities | |||||||||||||||||
| Net income | $ | ||||||||||||||||
Adjustments to reconcile net income to net cash provided by operating activities: | |||||||||||||||||
| Provision for credit losses | |||||||||||||||||
| Net amortization of debt securities | |||||||||||||||||
| Net accretion of purchase accounting adjustments and deferred loan fees and costs | ( | ( | ( | ||||||||||||||
| Amortization of debt modification costs | |||||||||||||||||
| Origination of loans held for sale | ( | ( | ( | ||||||||||||||
| Proceeds from loans held for sale | |||||||||||||||||
| Gain on sale of loans | ( | ( | ( | ||||||||||||||
| (Gain) loss on sale of debt securities | ( | ( | |||||||||||||||
| Bank-owned life insurance income, net | ( | ( | ( | ||||||||||||||
| Stock-based compensation, net of tax benefits | |||||||||||||||||
| Depreciation and amortization of premises and equipment | |||||||||||||||||
| Loss on sale and write-downs of other real estate owned, net | |||||||||||||||||
| Deferred tax (benefit) expense | ( | ( | |||||||||||||||
| Amortization of core deposit intangibles | |||||||||||||||||
| Amortization of investments in variable interest entities | |||||||||||||||||
| Net (increase) decrease in accrued interest receivable | ( | ( | |||||||||||||||
| Net (increase) decrease in other assets | ( | ||||||||||||||||
| Net (decrease) increase in accrued interest payable | ( | ||||||||||||||||
| Net increase in other liabilities | |||||||||||||||||
| Net cash provided by operating activities | |||||||||||||||||
| Investing Activities | |||||||||||||||||
| Sales of available-for-sale debt securities | |||||||||||||||||
| Maturities, prepayments and calls of available-for-sale debt securities | |||||||||||||||||
| Purchases of available-for-sale debt securities | ( | ( | ( | ||||||||||||||
| Maturities, prepayments and calls of held-to-maturity debt securities | |||||||||||||||||
| Principal collected on loans | |||||||||||||||||
| Loan originations | ( | ( | ( | ||||||||||||||
| Net additions to premises and equipment | ( | ( | ( | ||||||||||||||
| Proceeds from sale of other real estate owned | |||||||||||||||||
| Proceeds from redemption of non-marketable equity securities | |||||||||||||||||
| Purchases of non-marketable equity securities | ( | ( | ( | ||||||||||||||
| Proceeds from bank-owned life insurance | |||||||||||||||||
| Investments in variable interest entities | ( | ( | ( | ||||||||||||||
| Net cash received from acquisitions | |||||||||||||||||
| Net cash used in investing activities | ( | ( | ( | ||||||||||||||
See accompanying notes to consolidated financial statements.
72
GLACIER BANCORP, INC.
CONSOLIDATED STATEMENTS OF CASH FLOWS (Continued)
| Years ended | |||||||||||||||||
| (Dollars in thousands) | December 31, 2020 | December 31, 2019 | December 31, 2018 | ||||||||||||||
| Financing Activities | |||||||||||||||||
| Net increase in deposits | $ | ||||||||||||||||
| Net increase in securities sold under agreements to repurchase | |||||||||||||||||
| Net (decrease) increase in short-term Federal Home Loan Bank advances | ( | ( | |||||||||||||||
| Proceeds from long-term Federal Home Loan Bank advances | |||||||||||||||||
| Repayments of long-term Federal Home Loan Bank advances | ( | ( | ( | ||||||||||||||
| Net increase (decrease) in other borrowed funds | ( | ||||||||||||||||
| Cash dividends paid | ( | ( | ( | ||||||||||||||
| Tax withholding payments for stock-based compensation | ( | ( | ( | ||||||||||||||
| Proceeds from stock option exercises | |||||||||||||||||
| Net cash provided by (used in) financing activities | ( | ||||||||||||||||
| Net increase in cash, cash equivalents and restricted cash | |||||||||||||||||
| Cash, cash equivalents and restricted cash at beginning of period | |||||||||||||||||
| Cash, cash equivalents and restricted cash at end of period | $ | ||||||||||||||||
| Supplemental Disclosure of Cash Flow Information | |||||||||||||||||
| Cash paid during the period for interest | $ | ||||||||||||||||
| Cash paid during the period for income taxes | |||||||||||||||||
| Supplemental Disclosure of Non-Cash Investing Activities | |||||||||||||||||
Transfer of debt securities from held-to-maturity to available-for-sale | $ | ||||||||||||||||
| Sale and refinancing of other real estate owned | |||||||||||||||||
| Transfer of loans to other real estate owned | |||||||||||||||||
| Right-of-use assets obtained in exchange for operating lease liabilities | |||||||||||||||||
| Dividends declared during the period but not paid | |||||||||||||||||
| Acquisitions | |||||||||||||||||
| Fair value of common stock shares issued | |||||||||||||||||
| Cash consideration | |||||||||||||||||
| Effective settlement of pre-existing receivable | |||||||||||||||||
| Fair value of assets acquired | |||||||||||||||||
| Liabilities assumed | |||||||||||||||||
See accompanying notes to consolidated financial statements.
73
GLACIER BANCORP, INC.
NOTES TO CONSOLIDATED FINANCIAL STATEMENTS
Note 1. Nature of Operations and Summary of Significant Accounting Policies
General
Glacier Bancorp, Inc. (“Company”) is a Montana corporation headquartered in Kalispell, Montana. The Company provides a full range of banking services to individuals and businesses in Montana, Idaho, Utah, Washington, Wyoming, Colorado, Arizona and Nevada through its wholly-owned bank subsidiary, Glacier Bank (“Bank”). The Company offers a wide range of banking products and services, including: 1) retail banking; 2) business banking; 3) real estate, commercial, agriculture and consumer loans; and 4) mortgage origination and loan servicing. The Company serves individuals, small to medium-sized businesses, community organizations and public entities.
The preparation of financial statements in conformity with accounting principles generally accepted in the United States of America (“GAAP”) requires management to make estimates and assumptions that affect the reported amounts of assets and liabilities and disclosure of contingent assets and liabilities at the date of the financial statements and the reported amounts of income and expenses during the reporting period. Actual results could differ from those estimates.
Material estimates that are particularly susceptible to significant change include: 1) the determination of the allowance for credit losses (“ACL” or “allowance”) on loans; 2) the valuation of debt securities; 3) the valuation of real estate acquired in connection with foreclosures or in satisfaction of loans; and 4) the evaluation of goodwill impairment. For the determination of the ACL on loans and real estate valuation estimates, management obtains independent appraisals (new or updated) for significant items. Estimates relating to investment valuations are obtained from independent third parties. Estimates relating to the evaluation of goodwill for impairment are determined based on internal calculations using independent party inputs.
Principles of Consolidation
The consolidated financial statements of the Company include the parent holding company and the Bank, which consists of sixteen bank divisions and a corporate division. The corporate division includes the Bank’s investment portfolio, wholesale borrowings and other centralized functions. The Bank divisions operate under separate names, management teams and advisory directors. The Company considers the Bank to be its sole operating segment as the Bank 1) engages in similar bank business activity from which it earns revenues and incurs expenses; 2) the operating results of the Bank are regularly reviewed by the Chief Executive Officer (“CEO”) (i.e., the chief operating decision maker) who makes decisions about resources to be allocated to the Bank; and 3) financial information is available for the Bank. All significant inter-company transactions have been eliminated in consolidation.
The Bank has subsidiary interests in variable interest entities (“VIE”) for which the Bank has both the power to direct the VIE’s significant activities and the obligation to absorb losses or right to receive benefits of the VIE that could potentially be significant to the VIE. These subsidiary interests are included in the Company’s consolidated financial statements. The Bank also has subsidiary interests in VIEs for which the Bank does not have a controlling financial interest and is not the primary beneficiary. These subsidiary interests are not included in the Company’s consolidated financial statements.
The parent holding company owns non-bank subsidiaries that have issued trust preferred securities. The trust subsidiaries are not included in the Company’s consolidated financial statements. The Company's investments in the trust subsidiaries are included in other assets on the Company's statements of financial condition.
On February 29, 2020, the Company completed the acquisition of State Bank Corp., the bank holding company for State Bank of Arizona, a community bank based in Lake Havasu City, Arizona (collectively, “SBAZ”). In July 2019, the Company completed the acquisition of Heritage Bancorp, the bank holding company for Heritage Bank of Nevada, a community bank based in Reno, Nevada (collectively, “Heritage”). In April 2019, the Company completed the acquisition of FNB Bancorp, the holding company for The First National Bank of Layton, a community bank based in Layton, Utah (collectively, “FNB”). In February 2018, the Company completed its acquisition of Inter-Mountain Bancorp., Inc. and its wholly-owned subsidiary, First Security Bank, a community bank based in Bozeman, Montana (collectively, “FSB”). In January 2018, the Company completed its acquisition of Columbine Capital Corp., and its wholly-owned subsidiary, Collegiate Peaks Bank, a community bank based in Buena Vista, Colorado (collectively, “Collegiate”). The business combinations were accounted for using the acquisition method, with the results of operations included in the Company’s consolidated financial statements as of the acquisition dates. For additional information relating to recent mergers and acquisitions, see Note 23.
74
Debt Securities
On January 1, 2020, the Company adopted Financial Accounting Standards Board (“FASB”) Accounting Standards Update (“ASU”) 2016-13, Financial Instruments - Credit Losses, which significantly changed the allowance for credit loss accounting policies for debt securities. The following debt securities and allowance for credit loss accounting policies are presented under Accounting Standards Codification™ (“ASC”) Topic 326, whereas prior periods are presented as described in the Company’s 2019 Annual Report on Form 10-K.
Debt securities for which the Company has the positive intent and ability to hold to maturity are classified as held-to-maturity and are carried at amortized cost. Debt securities held primarily for the purpose of selling in the near term are classified as trading securities and are reported at fair value, with unrealized gains and losses included in income. Debt securities not classified as held-to-maturity or trading are classified as available-for-sale and are reported at fair value with unrealized gains and losses, net of income taxes, as a separate component of other comprehensive income (“OCI”). Premiums and discounts on debt securities are amortized or accreted into income using a method that approximates the interest method. The objective of the interest method is to calculate periodic interest income at a constant effective yield. The Company does not have any debt securities classified as trading securities. When the Company acquires another entity, it designates all debt securities as available-for-sale at acquisition date and records the debt securities at fair value.
The Company reviews and analyzes the various risks that may be present within the investment portfolio on an ongoing basis, including market risk, credit risk and liquidity risk. Market risk is the risk to an entity’s financial condition resulting from adverse changes in the value of its holdings arising from movements in interest rates, foreign exchange rates, equity prices or commodity prices. The Company assesses the market risk of individual debt securities as well as the investment portfolio as a whole. Credit risk, broadly defined, is the risk that an issuer or counterparty will fail to perform on an obligation. The credit rating of a security is considered the primary credit quality indicator for debt securities. Liquidity risk refers to the risk that a security will not have an active and efficient market in which the security can be sold.
A debt security is investment grade if the issuer has adequate capacity to meet its commitment over the expected life of the investment, i.e., the risk of default is low and full and timely repayment of interest and principal is expected. To determine investment grade status for debt securities, the Company conducts due diligence of the creditworthiness of the issuer or counterparty prior to acquisition and ongoing thereafter consistent with the risk characteristics of the security and the overall risk of the investment portfolio. Credit quality due diligence takes into account the extent to which a security is guaranteed by the U.S. government and other agencies of the U.S. government. The depth of the due diligence is based on the complexity of the structure, the size of the security, and takes into account material positions and specific groups of securities or stratifications for analysis and review of similar risk positions. The due diligence includes consideration of payment performance, collateral adequacy, internal analyses, third party research and analytics, external credit ratings and default statistics.
The Company has acquired debt securities through acquisitions and if the securities have more than insignificant credit deterioration since origination, they are designated as purchased credit-deteriorated (“PCD”) securities. An ACL is determined using the same methodology as with other debt securities. The sum of a PCD security’s fair value and associated ACL becomes its initial amortized cost basis. The difference between the initial amortized cost basis and the par value of the debt security is a noncredit discount or premium, which is amortized into interest income over the life of the security. Subsequent changes to the ACL are recorded through provision for credit losses.
For additional information relating to debt securities, see Note 2.
Allowance for Credit Losses - Available-for-Sale Debt Securities
For available-for-sale debt securities in an unrealized loss position, the Company first assesses whether it intends to sell, or it is more-likely-than-not that it will be required to sell the security before recovery of its amortized cost basis. If either of the criteria regarding intent or requirement to sell is met, the security’s amortized cost basis is written down to fair value through other expense. For the available-for-sale securities that do not meet the aforementioned criteria, the Company evaluates whether the decline in fair value has resulted from credit losses or other factors. In such assessment, the Company considers the extent to which fair value is less than amortized cost, if there are any changes to the investment grade of the security by a rating agency, and if there any adverse conditions that impact the security. If this assessment indicates a credit loss exists, the present value of the cash flows expected to be collected from the security is compared to the amortized cost basis of the security. If the present value of the cash flows expected to be collected is less than the amortized cost basis, a potential credit loss exists and an ACL is recorded for the credit loss, limited by the
75
amount that the fair value is less than the amortized cost. Any estimated credit losses that have not been recorded through an ACL are recognized in OCI.
The Company has elected to exclude accrued interest from the estimate of credit losses for available-for-sale debt securities. As part of its non-accrual policy, the Company charges-off uncollectable interest at the time it is determined to be uncollectable.
Allowance for Credit Losses - Held-to-Maturity Debt Securities
For estimating the allowance for held-to-maturity (“HTM”) debt securities that share similar risk characteristics with other securities, such securities are pooled based on major security type. For pools of such securities with similar risk characteristics, the historical lifetime probability of default and severity of loss in the event of default is derived or obtained from external sources and adjusted for the expected effects of reasonable and supportable forecasts over the expected lives of the securities on those historical credit losses. Expected credit losses on securities in the held-to-maturity portfolio that do not share similar risk characteristics with any of the pools of debt securities are individually measured based on net realizable value, or the difference between the discounted value of the expected future cash flows, based on the original effective interest rate, and the recorded amortized cost basis of the securities.
Loans Receivable
On January 1, 2020, the Company adopted FASB ASU 2016-13, Financial Instruments - Credit Losses, which significantly changed the loan and allowance for credit loss accounting policies. The following loan and allowance for credit loss accounting policies are presented under ASC Topic 326, whereas prior periods are presented in accordance with the incurred loss model as disclosed in the Company’s 2019 Annual Report on Form 10-K.
The Company’s loan segments or classes are based on the purpose of the loan and consist of residential real estate, commercial real estate, other commercial, home equity, and other consumer loans. Loans that are intended to be held-to-maturity are reported at the unpaid principal balance less net charge-offs and adjusted for deferred fees and costs on originated loans and unamortized premiums or discounts on acquired loans. Interest income is accrued on the unpaid principal balance. Fees and costs on originated loans and premiums or discounts on acquired loans are deferred and subsequently amortized or accreted as a yield adjustment over the expected life of the loan utilizing the interest or straight-line methods. The interest method is utilized for loans with scheduled payment terms and the objective is to calculate periodic interest income at a constant effective yield. The straight-line method is utilized for revolving lines of credit or loans with no scheduled payment terms. When a loan is paid off prior to maturity, the remaining unamortized fees and costs on originated loans and unamortized premiums or discounts on acquired loans are immediately recognized into interest income.
Loans that are thirty days or more past due based on payments received and applied to the loan are considered delinquent. Loans are designated non-accrual and the accrual of interest is discontinued when the collection of the contractual principal or interest is unlikely. A loan is typically placed on non-accrual when principal or interest is due and has remained unpaid for ninety days or more. When a loan is placed on non-accrual status, interest previously accrued but not collected is reversed against current period interest income. Subsequent payments on non-accrual loans are applied to the outstanding principal balance if doubt remains as to the ultimate collectability of the loan. Interest accruals are not resumed on partially charged-off impaired loans. For other loans on non-accrual, interest accruals are resumed on such loans only when they are brought fully current with respect to interest and principal and when, in the judgment of management, the loans are estimated to be fully collectible as to both principal and interest.
The Company has acquired loans through acquisitions, some of which have experienced more than insignificant credit deterioration since origination. The Company considers all acquired non-accrual loans to be PCD loans. In addition, the Company considers loans accruing ninety days or more past due with estimated credit losses or substandard loans with estimated credit losses to be PCD loans. An ACL is determined using the same methodology as other loans held for investment. The ACL determined on a collective basis is allocated to individual loans. The sum of a loan’s fair value and ACL becomes the initial amortized cost basis. The difference between the initial amortized cost basis and the par value of the loan is a noncredit discount or premium, which is amortized into interest income over the life of the loan. Subsequent changes to the ACL are recorded through provision for credit losses.
For additional information relating to loans, see Note 3.
76
Allowance for Credit Losses - Loans Receivable
The allowance for credit losses for loans receivable represents management’s estimate of credit losses over the expected contractual life of the loan portfolio. The estimate is determined based on the amortized cost of the loan portfolio including the loan balance adjusted for charge-offs, recoveries, deferred fees and costs, and loan discount and premiums. Recoveries are included only to the extent that such amounts were previously charged-off. The Company has elected to exclude accrued interest from the estimate of credit losses for loans. Determining the adequacy of the allowance is complex and requires a high degree of judgment by management about the effect of matters that are inherently uncertain. Subsequent evaluations of the then-existing loan portfolio, in light of the factors then prevailing, may result in significant changes in the allowance in future periods.
The allowance is increased for estimated credit losses which are recorded as expense. The portion of loans and overdraft balances determined by management to be uncollectable are charged-off as a reduction to the allowance and recoveries of amounts previously charged-off increase the allowance. The Company’s charge-off policy is consistent with bank regulatory standards. Consumer loans generally are charged-off when the loan becomes over 120 days delinquent. Real estate acquired as a result of foreclosure or by deed-in-lieu of foreclosure is classified as other real estate owned (“OREO”) until such time as it is sold.
The expected credit loss estimate process involves procedures to consider the unique characteristics of each of the Company’s loan portfolio segments, which consist of residential real estate, commercial real estate, other commercial, home equity, and other consumer loans. When computing the allowance levels, credit loss assumptions are estimated using a model that categorizes loan pools based on loss history, credit and risk characteristics, including current conditions and reasonable and supportable forecasts about the future. The Company has determined a four consecutive quarter forecasting period is a reasonable and supportable period. Expected credit loss for periods beyond reasonable and supportable forecast periods are determined based on a reversion method which reverts back to historical loss estimate over a four consecutive quarter period on a straight-line basis.
Credit quality is assessed and monitored by evaluating various attributes and the results of those evaluations are utilized in underwriting new loans and the process for estimating the expected credit losses. The following paragraphs describe the risk characteristics relevant to each portfolio segment.
Residential Real Estate. Residential real estate loans are secured by owner-occupied 1-4 family residences. Repayment of these loans is primarily dependent on the personal income and credit rating of the borrowers. Credit risk in these loans is impacted by economic conditions within the Company’s market areas that affect the value of the residential property securing the loans and affect the borrowers' personal incomes. Mitigating risk factors for this loan segment include a large number of borrowers, geographic dispersion of market areas and the loans are originated for relatively smaller amounts.
Commercial Real Estate. Commercial real estate loans typically involve larger principal amounts, and repayment of these loans is generally dependent on the successful operation of the property securing the loan and/or the business conducted on the property securing the loan. Credit risk in these loans is impacted by the creditworthiness of a borrower, valuation of the property securing the loan and conditions within the local economies in the Company’s diverse, geographic market areas.
Commercial. Commercial loans consist of loans to commercial customers for use in financing working capital needs, equipment purchases and business expansions. The loans in this category are repaid primarily from the cash flow of a borrower’s principal business operation. Credit risk in these loans is driven by creditworthiness of a borrower and the economic conditions that impact the cash flow stability from business operations across the Company’s diverse, geographic market areas.
Home Equity. Home equity loans consist of junior lien mortgages and first and junior lien lines of credit (revolving open-end and amortizing closed-end) secured by owner-occupied 1-4 family residences. Repayment of these loans is primarily dependent on the personal income and credit rating of the borrowers. Credit risk in these loans is impacted by economic conditions within the Company’s market areas that affect the value of the residential property securing the loans and affect the borrowers' personal incomes. Mitigating risk factors for this loan segment are a large number of borrowers, geographic dispersion of market areas and the loans are originated for terms that range from 10 to 15 years .
Other Consumer. The other consumer loan portfolio consists of various short-term loans such as automobile loans and loans for other personal purposes. Repayment of these loans is primarily dependent on the personal income of the borrowers. Credit risk is driven by consumer economic factors (such as unemployment and general economic conditions in the Company’s diverse, geographic market area) and the creditworthiness of a borrower.
The allowance is impacted by loan volumes, delinquency status, credit ratings, historical loss experiences, estimated prepayment speeds, weighted average lives and other conditions influencing loss expectations, such as reasonable and supportable forecasts of economic conditions. The methodology for estimating the amount of expected credit losses reported in the allowance has two basic components: 1) individual loans that do not share similar risk characteristics with other loans and the measurement of expected credit losses for such individual loans; and 2) the expected credit losses for pools of loans that share similar risk characteristics.
77
Loans that do not Share Similar Risk Characteristics with Other Loans. For a loan that does not share similar risk characteristics with other loans, expected credit loss is measured based on the net realizable value, that is, the difference between the discounted value of the expected future cash flows, based on the original effective interest rate, and the amortized cost basis of the loan. For these loans, the expected credit loss is equal to the amount by which the net realizable value of the loan is less than the amortized cost basis of the loan (which is net of previous charge-offs and deferred loan fees and costs), except when the loan is collateral-dependent, that is, when foreclosure is probable or the borrower is experiencing financial difficulty and repayment is expected to be provided substantially through the operation or sale of the collateral. In these cases, expected credit loss is measured as the difference between the amortized cost basis of the loan and the fair value of the collateral. The fair value of the collateral is adjusted for the estimated cost to sell if repayment or satisfaction of a loan is dependent on the sale (rather than only on the operation) of the collateral. The Company has determined that non-accrual loans do not share similar risk characteristics with other loans and these loans are individually evaluated for estimated allowance for credit losses. The Company, through its credit monitoring process, may also identify other loans that do no share similar risk characteristics and individually evaluate such loans. The starting point for determining the fair value of collateral is to obtain external appraisals or evaluations (new or updated). The valuation techniques used in preparing appraisals or evaluations (new or updated) include the cost approach, income approach, sales comparison approach, or a combination of the preceding valuation techniques. The Company’s credit department reviews appraisals, giving consideration to the highest and best use of the collateral. The appraisals or evaluations (new or updated) are reviewed at least quarterly and more frequently based on current market conditions, including deterioration in a borrower’s financial condition and when property values may be subject to significant volatility. Adjustments may be made to the fair value of the collateral after review and acceptance of the collateral appraisal or evaluation (new or updated).
Loans that Share Similar Risk Characteristics with other Loans. For estimating the allowance for loans that share similar risk characteristics with other loans, such loans are segregated into loan segments. Loans are designated into loan segments based on loans pooled by product types and similar risk characteristics or areas of risk concentration. In determining the ACL, the Company derives an estimated credit loss assumption from a model that categorizes loan pools based on loan type which is further segregated by the credit quality indicators. This model calculates an expected loss percentage for each loan segment by considering the non-discounted simple annual average historical loss rate of each loan segment (calculated through an “open pool” method), multiplying the loss rate by the amortized loan balance and incorporating that segment’s internally generated prepayment speed assumption and contractually scheduled remaining principal pay downs on a loan level basis. The annual historical loss rates are adjusted over a reasonable economic forecast period by a multiplier that is calculated based upon current national economic forecasts as a proportion of each segment’s historical average loss levels. The Company will then revert from the economic forecast period back to the historical average loss rate in a straight-line basis. After the reversion period, the loans will be assumed to experience their historical loss rate for the remainder of their contractual lives. The model applies the expected loss rate over the projected cash flows at the individual loan level and then aggregates the losses by loan segment in determining their quantitative allowance. The Company will also include qualitative adjustments to adjust the ACL on loan segments to the extent the current or future market conditions are believed to vary substantially from historical conditions in regards to:
•lending policies and procedures;
•international, national, regional and local economic business conditions and developments that affect the collectability of the portfolio, including the condition of various markets;
•the nature and volume of the loan portfolio including the terms of the loans;
•the experience, ability, and depth of the lending management and other relevant staff;
•the volume and severity of past due and adversely classified or graded loans and the volume of non-accrual loans;
•the quality of our loan review system;
•the value of underlying collateral for collateralized loans;
•the existence and effect of any concentrations of credit, and changes in the level of concentrations; and
•the effect of external factors such as competition and legal and regulatory requirements on the level of estimated credit losses in the existing portfolio.
The Company regularly reviews loans in the portfolio to assess credit quality indicators and to determine the appropriate loan classification and grading in accordance with applicable bank regulations. The primary credit quality indicator for residential, home equity and other consumer loans is the days past due status, which consists of the following categories: 1) performing loans; 2) 30 to 89 days past due loans; and 3) non-accrual and ninety days or more past due loans. The primary credit quality indicator for commercial real estate and commercial loans is the Company’s internal risk rating system, which includes the following categories: 1) pass loans; 2) special mention loans; 3) substandard loans; and 4) doubtful or loss loans. Such credit quality indicators are regularly monitored and incorporated into the Company’s allowance estimate. The following paragraphs further define the internal risk ratings for commercial real estate and commercial loans.
Pass Loans. These ratings represent loans that are of acceptable, good or excellent quality with very limited to no risk. Loans that do not have one of the following ratings are considered pass loans.
78
Special Mention Loans. These ratings represent loans that are designated as special mention per the regulatory definition. Special mention loans are currently protected but are potentially weak. The credit risk may be relatively minor yet constitute an undue and unwarranted risk in light of the circumstances surrounding a specific loan. The rating may be used to identify credit with potential weaknesses that if not corrected may weaken the loan to the point of inadequately protecting the Bank’s credit position. Examples include a lack of supervision, inadequate loan agreement, condition, or control of collateral, incomplete, or improper documentation, deviations from lending policy, and adverse trends in operations or economic conditions.
Substandard Loans. This rating represents loans that are inadequately protected by the current sound worth and paying capacity of the obligor or of the collateral pledged. A loan so classified must have a well-defined weakness that jeopardizes the liquidation of the debt. These loans are characterized by the distinct possibility that the Bank will sustain some loss if the deficiencies are not corrected. Loss potential, while existing in the aggregated amount of substandard loans, does not have to exist in an individual loan classified substandard.
Doubtful/Loss Loans. A loan classified as doubtful has the characteristics that make collection in full, on the basis of currently existing facts, conditions, and values, highly improbable. The possibility of loss is extremely high, but because of pending factors, which may work to the advantage and strengthening of the loan, its classification as loss is deferred until its more exact status may be determined. Pending factors include proposed merger, acquisition, or liquidation procedures, capital injection, perfecting liens on additional collateral and refinancing plans. Loans are classified as loss when they are deemed to be not collectible and of such little value that continuance as an active asset of the Bank is not warranted. Loans classified as loss must be charged-off. Assignment of this classification does not mean that an asset has absolutely no recovery or salvage value, but that it is not practical or desirable to defer writing off a basically worthless asset, even though partial recovery may be attained in the future.
Restructured Loans
A restructured loan is considered a troubled debt restructuring (“TDR”) if the creditor, for economic or legal reasons related to the debtor’s financial difficulties, grants a concession to the debtor that it would not otherwise consider. The Company periodically enters into restructure agreements with borrowers whereby the loans were previously identified as TDRs. When such circumstances occur, the Company carefully evaluates the facts of the subsequent restructure to determine the appropriate accounting and under certain circumstances it may be acceptable not to account for the subsequently restructured loan as a TDR. When assessing whether a concession has been granted by the Company, any prior forgiveness on a cumulative basis is considered a continuing concession. The Company has made the following types of loan modifications, some of which were considered a TDR:
•reduction of the stated interest rate for the remaining term of the debt;
•extension of the maturity date(s) at a stated rate of interest lower than the current market rate for newly originated debt having similar risk characteristics; and
•reduction of the face amount of the debt as stated in the debt agreements.
The Company recognizes that while borrowers may experience deterioration in their financial condition, many continue to be creditworthy borrowers who have the willingness and capacity for debt repayment. In determining whether non-restructured or performing loans issued to a single or related party group of borrowers should continue to accrue interest when the borrower has other loans that are non-performing or are TDRs, the Company, on a quarterly or more frequent basis, performs an updated and comprehensive assessment of the willingness and capacity of the borrowers to timely and ultimately repay their total debt obligations, including contingent obligations. Such analysis takes into account current financial information about the borrowers and financially responsible guarantors, if any, including for example:
•analysis of global, i.e., aggregate debt service for total debt obligations;
•assessment of the value and security protection of collateral pledged using current market conditions and alternative market assumptions across a variety of potential future situations; and
•loan structures and related covenants.
On March 27, 2020, the Coronavirus Aid, Relief, and Economic Security Act (“CARES Act”) was signed into law which includes many provisions that impact the Company and its customers. The banking regulatory agencies have encouraged banks to work with borrowers who have been impacted by the coronavirus disease of 2019 (“COVID-19”) and the CARES Act, along with related regulatory guidance, allows banks to not designate certain modifications as TDRs that otherwise may have been classified as TDRs. In general, in order to qualify for such treatment, the modifications need to be short-term and made on a good faith basis in response to the COVID-19 pandemic to borrowers who were previously deemed current as outlined in the regulatory guidance. The Company has made such modifications to assist borrowers impacted by the COVID-19 pandemic.
The allowance for credit losses on a TDR is measured using the same method as all other loans held for investment. For a TDR that is individually reviewed and not collateral-dependent, the value of the concession can only be measured using the discounted cash flow method. When the value of a concession is measured using the discounted cash flow method, the ACL is determined by discounting the expected future cash flows at the original interest of the loan.
79
Allowance for Credit Losses - Off-Balance Sheet Credit Exposures
The Company maintains a separate allowance for off-balance sheet credit exposures, including unfunded loan commitments, which is included in other liabilities on the Company’s statements of financial condition. The Company estimates the amount of expected losses by calculating a commitment usage factor over the contractual period for exposures and applying the loss factors used in the allowance for credit loss methodology to the results of the usage calculation to estimate the liability for credit losses related to unfunded commitments for each loan segment. No credit loss estimate is reported for off-balance sheet credit exposures that are unconditionally cancellable by the Bank or for unfunded amounts under such arrangements that may be drawn prior to the cancellation of the arrangement.
Provision for Credit Losses
Leases
The Company leases certain land, premises and equipment from third parties. A lessee lease is classified as an operating lease unless it meets certain criteria (e.g., lease contains option to purchase that Company is reasonably certain to exercise), in which case it is classified as a finance lease. Effective January 1, 2019, operating leases are included in net premises and equipment and other liabilities on the Company’s statements of financial condition and lease expense for lease payments is recognized on a straight-line basis over the lease term. Finance leases are included in net premises and equipment and other borrowed funds on the Company’s statements of financial condition. Right-of-use (“ROU”) assets and liabilities are recognized at the lease commencement date based on the present value of lease payments over the lease term. An ROU asset represents the right to use the underlying asset for the lease term and also includes any direct costs and payments made prior to lease commencement and excludes lease incentives. When an implicit rate is not available, an incremental borrowing rate based on the information available at commencement date is used in determining the present value of the lease payments. A lease term may include an option to extend or terminate the lease when it is reasonably certain the option will be exercised. The Company accounts for lease and nonlease components (e.g., common-area maintenance) together as a single combined lease component for all asset classes. Short-term leases of 12 months or less are excluded from accounting guidance; as a result, the lease payments are recognized on a straight-line basis over the lease term and the leases are not reflected on the Company’s statements of financial condition. Renewal and termination options are considered when determining short-term leases. Leases are accounted for on an individual lease level.
Other Real Estate Owned
Property acquired by foreclosure or deed-in-lieu of foreclosure is initially recorded at fair value, less estimated selling cost, at acquisition date (i.e., cost of the property). The Company is considered to have received physical possession of residential real estate property collateralizing a consumer mortgage loan upon the occurrence of either the Company obtaining legal title to the property or the borrower conveying all interest in the property through a deed-in-lieu or similar agreement. Fair value is determined as the amount that could be reasonably expected in a current sale between a willing buyer and a willing seller in an orderly transaction between market participants at the measurement date. Subsequent to the initial acquisition, if the fair value of the asset, less estimated selling cost, is less than the cost of the property, a loss is recognized in other expense and the asset carrying value is reduced. Gain or loss on disposition of OREO is recorded in non-interest income or non-interest expense, respectively. In determining the fair value of the properties on the date of transfer and any subsequent estimated losses of net realizable value, the fair value of other real estate acquired by foreclosure or deed-in-lieu of foreclosure is determined primarily based upon appraisal or evaluation of the underlying property value.
80
Business Combinations and Intangible Assets
Acquisition accounting requires the total purchase price to be allocated to the estimated fair values of assets acquired and liabilities assumed, including certain intangible assets. Goodwill is recorded if the purchase price exceeds the net fair value of assets acquired and a bargain purchase gain is recorded in other income if the net fair value of assets acquired exceeds the purchase price.
Adjustment of the allocated purchase price may be related to fair value estimates for which all information has not been obtained of the acquired entity known or discovered during the allocation period, the period of time required to identify and measure the fair values of the assets and liabilities acquired in the business combination. The allocation period is generally limited to one year following consummation of a business combination.
Core deposit intangible represents the intangible value of depositor relationships resulting from deposit liabilities assumed in acquisitions and is amortized using an accelerated method based on an estimated runoff of the related deposits. The core deposit intangible is evaluated for impairment and recoverability whenever events or changes in circumstances indicate that its carrying amount may not be recoverable, with any changes in estimated useful life accounted for prospectively over the revised remaining life. For additional information relating to core deposit intangibles, see Note 5.
The Company tests goodwill for impairment at the reporting unit level annually during the third quarter. The Company has identified that each of the Bank divisions are reporting units (i.e., components of the Glacier Bank operating segment) given that each division has a separate management team that regularly reviews its respective division financial information; however, the reporting units are aggregated into a single reporting unit due to the reporting units having similar economic characteristics.
The goodwill of a reporting unit is tested for impairment between annual tests if an event occurs or circumstances change that would more-likely-than-not reduce the fair value of a reporting unit below its carrying amount. Examples of events and circumstances that could trigger the need for interim impairment testing include:
•a significant change in legal factors or in the business climate;
•an adverse action or assessment by a regulator;
•unanticipated competition;
•a loss of key personnel;
•a more-likely-than-not expectation that a reporting unit or a significant portion of a reporting unit will be sold or otherwise disposed of; and
•the testing for recoverability of a significant asset group within a reporting unit.
Loan Servicing Rights
For residential real estate loans that are sold with servicing retained, servicing rights are initially recorded at fair value in other assets and gain on sale of loans. Fair value is based on on market prices for comparable mortgage servicing contracts. The servicing asset is subsequently measured using the amortization method which requires the servicing rights to be amortized into non-interest income in proportion to, and over the period of, the estimated future net servicing income of the underlying loans.
Loan servicing rights are evaluated for impairment based upon the fair value of the servicing rights compared to the carrying value. Impairment is recognized through a valuation allowance, to the extent that fair value is less than the carrying value. If the Company later determines that all or a portion of the impairment no longer exists, a reduction in the valuation allowance may be recorded. Changes in the valuation allowance are recorded in other income. The fair value of the servicing assets are subject to significant fluctuations as a result of changes in estimated actual prepayment speeds and default rates and losses.
81
Equity Securities
Non-marketable equity securities primarily consist of Federal Home Loan Bank (“FHLB”) stock. FHLB stock is restricted because such stock may only be sold to FHLB at its par value. Due to restrictive terms, and the lack of a readily determinable fair value, FHLB stock is carried at cost and evaluated for impairment. The investments in FHLB stock are required investments related to the Company’s borrowings from FHLB. FHLB obtains its funding primarily through issuance of consolidated obligations of the FHLB system. The U.S. government does not guarantee these obligations, and each of the regional FHLBs is jointly and severally liable for repayment of each other’s debt.
Derivatives and Hedging Activities
The Company is exposed to certain risks relating to its ongoing operations. The primary risk managed by using derivative instruments is interest risk. Interest rate caps and interest rate swaps have been entered into to manage interest rate risk associated with variable rate borrowings and were designated as cash flow hedges. The Company does not enter into derivative instruments for trading or speculative purposes.
These cash flow hedges were recognized as assets or liabilities on the Company’s statements of financial condition and were measured at fair value. Cash flows resulting from the interest rate derivative financial instruments that were accounted for as hedges of assets and liabilities were classified in the Company’s cash flow statement in the same category as the cash flows of the items being hedged. For additional information relating to the interest rate caps and interest rate swap agreements, see Note 11.
Revenue Recognition
The Company recognizes revenue when services or products are transferred to customers in an amount that reflects the consideration to which the Company expects to be entitled. The Company’s principal source of revenue is interest income from debt securities and loans. Revenue from contracts with customers within the scope of ASC Topic 606 was $54,520,000 , $69,877,000 , and $76,664,000 for the years ended December 31, 2020, 2019, and 2018, respectively, and largely consisted of revenue from service charges and other fees from deposits (e.g., overdraft fees, ATM fees, debit card fees). Due to the short-term nature of the Company’s contracts with customers, an insignificant amount of receivables related to such revenue was recorded at December 31, 2020 and 2019 and there were no
Service Charges. Revenue from service charges consists of service charges and fees on deposit accounts under depository agreements with customers to provide access to deposited funds and, when applicable, pay interest on deposits. Service charges on deposit accounts may be transactional or non-transactional in nature. Transactional service charges occur in the form of a service or penalty and are charged upon the occurrence of an event (e.g., overdraft fees, ATM fees, wire transfer fees). Transactional service charges are recognized as services are delivered to and consumed by the customer, or as penalty fees are charged. Non-transactional service charges are charges that are based on a broader service, such as account maintenance fees and dormancy fees, and are recognized on a monthly basis.
82
Advertising and Promotion
Advertising and promotion costs are recognized in the period incurred.
Income Taxes
The Company’s income tax expense consists of current and deferred income tax expense. Current income tax expense reflects taxes to be paid or refunded for the current period by applying the provisions of enacted tax law to earnings or losses. Deferred income tax expense results from changes in deferred tax assets and liabilities between periods. The Company recognizes interest and penalties related to income tax matters in income tax expense.
Deferred tax assets and liabilities are recognized for estimated future income tax consequences attributable to differences between the financial statement carrying amounts of assets and liabilities and their respective tax bases. The effect on deferred tax assets and liabilities of a change in income tax rates is recognized in income in the period that includes the enactment date of applicable laws.
Reclassifications
Certain reclassifications have been made to the 2019 and 2018 financial statements to conform to the 2020 presentation.
Accounting Guidance Adopted in 2020
The ASC is the FASB officially recognized source of authoritative GAAP applicable to all public and non-public non-governmental entities. Rules and interpretive releases of the Securities and Exchange Commission (“SEC”) under the authority of the federal securities laws are also sources of authoritative GAAP for the Company as an SEC registrant. All other accounting literature is non-authoritative. The following paragraphs provide descriptions of recently adopted ASU’s that may have had a material effect on the Company’s financial position or results of operations.
ASU 2017-04 - Intangibles - Goodwill and Other. In January 2017, FASB amended ASC Topic 350 to simplify the measurement of goodwill by eliminating Step 2 from the goodwill impairment test. Instead, under these amendments, an entity should perform its annual, or interim, goodwill impairment test by comparing the fair value of a reporting unit with its carrying amount. An entity should recognize an impairment charge for the amount by which the carrying amount exceeds the reporting unit’s fair value; however, the loss should not exceed the total amount of goodwill allocated to that reporting unit. The amendments were effective for public business entities for the first interim and annual reporting periods beginning after December 15, 2019. The Company has goodwill from prior business combinations and performs an annual impairment test or more frequently if changes or circumstances occur that would more-likely-than-not reduce the fair value of the reporting unit below its carrying value. Although the Company cannot anticipate future goodwill impairment assessments, based on the most recent assessment, it is unlikely that an impairment amount
83
would need to be calculated and, therefore, at adoption there was no impact from these amendments to the Company’s financial position and results of operations. In addition, the current accounting policies and processes were not changed, except for the elimination of the Step 2 analysis. For additional information regarding goodwill impairment testing, see Note 5.
- Financial Instruments - Credit Losses. In June 2016, FASB amended ASC Topic 326 to replace the incurred loss model with a methodology that reflects current expected credit losses (“CECL”) over the life of the loan and requires consideration of a broader range of reasonable and supportable information to calculate credit loss estimates. The amendments were effective for public business entities for the first interim and annual reporting periods beginning after December 15, 2019. The Company adopted the amendments on January 1, 2020 using the modified retrospective approach. The financial statement results and accounting policies beginning January 1, 2020 are presented under ASC Topic 326, whereas prior periods continue to be reported in accordance with previously applicable GAAP. The Company recorded a net reduction of $12,347,000 in retained earnings due to the adoption of the amendments. The transition adjustment included an increase in the ACL on loans of $3,720,000 , an increase in the ACL on off-balance sheet credit exposures of $12,817,000 , and a corresponding increase in deferred tax assets of $4,190,000 . The Company developed internal implementation controls over the development of the ACL model and resulting financial statement disclosures. The Company has adjusted its processes and procedures to calculate the ACL, including changes in assumptions and estimates to consider expected credit losses over the life of the loan versus the prior accounting practice that utilized the incurred loss model. Further, the Company revised procedures and accounting policies for determining an ACL related to held-to-maturity debt securities and off-balance sheet arrangements for other-than-temporary impairment on available-for-sale debt securities which utilize an allowance approach. The Company engaged a third-party vendor solution to evaluate the new methodology, including model validation, adjusting assumptions utilized, and to review the accuracy of the financial statement disclosures. For additional information on the allowances for credit losses, see Notes 2 and 3.
Accounting Guidance Pending Adoption at December 31, 2020
The are no newly issued but not yet effective ASUs that could have a material effect on the Company’s financial position or results of operations.
84
Note 2. Debt Securities
The following tables present the amortized cost, the gross unrealized gains and losses and the fair value of the Company’s debt securities:
| December 31, 2020 | |||||||||||||||||||||||
| Amortized Cost | Gross Unrealized | Fair Value | |||||||||||||||||||||
| (Dollars in thousands) | Gains | Losses | |||||||||||||||||||||
| Available-for-sale | |||||||||||||||||||||||
| U.S. government and federal agency | $ | ( | |||||||||||||||||||||
| U.S. government sponsored enterprises | |||||||||||||||||||||||
| State and local governments | ( | ||||||||||||||||||||||
| Corporate bonds | ( | ||||||||||||||||||||||
| Residential mortgage-backed securities | ( | ||||||||||||||||||||||
| Commercial mortgage-backed securities | ( | ||||||||||||||||||||||
| Total available-for-sale | ( | ||||||||||||||||||||||
| Held-to-maturity | |||||||||||||||||||||||
| State and local governments | |||||||||||||||||||||||
| Total held-to-maturity | |||||||||||||||||||||||
| Total debt securities | $ | ( | |||||||||||||||||||||
| December 31, 2019 | |||||||||||||||||||||||
| Amortized Cost | Gross Unrealized | Fair Value | |||||||||||||||||||||
| (Dollars in thousands) | Gains | Losses | |||||||||||||||||||||
| Available-for-sale | |||||||||||||||||||||||
| U.S. government and federal agency | $ | ( | |||||||||||||||||||||
| U.S. government sponsored enterprises | |||||||||||||||||||||||
| State and local governments | ( | ||||||||||||||||||||||
| Corporate bonds | ( | ||||||||||||||||||||||
| Residential mortgage-backed securities | ( | ||||||||||||||||||||||
| Commercial mortgage-backed securities | ( | ||||||||||||||||||||||
| Total available-for-sale | ( | ||||||||||||||||||||||
| Held-to-maturity | |||||||||||||||||||||||
| State and local governments | |||||||||||||||||||||||
| Total held-to-maturity | |||||||||||||||||||||||
| Total debt securities | $ | ( | |||||||||||||||||||||
85
Maturity Analysis
The following table presents the amortized cost and fair value of available-for-sale and held-to-maturity debt securities by contractual maturity at December 31, 2020. Actual maturities may differ from expected or contractual maturities since some issuers have the right to prepay obligations with or without prepayment penalties.
| December 31, 2020 | |||||||||||||||||||||||
| Available-for-Sale | Held-to-Maturity | ||||||||||||||||||||||
| (Dollars in thousands) | Amortized Cost | Fair Value | Amortized Cost | Fair Value | |||||||||||||||||||
| Due within one year | $ | ||||||||||||||||||||||
| Due after one year through five years | |||||||||||||||||||||||
| Due after five years through ten years | |||||||||||||||||||||||
| Due after ten years | |||||||||||||||||||||||
Mortgage-backed securities 1 | |||||||||||||||||||||||
| Total | $ | ||||||||||||||||||||||
______________________________
1 Mortgage-backed securities, which have prepayment provisions, are not assigned to maturity categories due to fluctuations in their prepayment speeds.
Sales and Calls of Debt Securities
Proceeds from sales and calls of debt securities and the associated gains and losses that have been included in earnings are listed below:
| Years ended | |||||||||||||||||
| (Dollars in thousands) | December 31, 2020 | December 31, 2019 | December 31, 2018 | ||||||||||||||
| Available-for-sale | |||||||||||||||||
| Proceeds from sales and calls of debt securities | $ | ||||||||||||||||
Gross realized gains 1 | |||||||||||||||||
Gross realized losses 1 | ( | ( | ( | ||||||||||||||
| Held-to-maturity | |||||||||||||||||
| Proceeds from calls of debt securities | |||||||||||||||||
Gross realized gains 1 | |||||||||||||||||
Gross realized losses 1 | ( | ( | |||||||||||||||
______________________________
1 The gain or loss on the sale or call of each debt security is determined by the specific identification method.
At December 31, 2020 and 2019, the Company had debt securities with carrying values of $2,169,967,000 and $1,475,752,000 , respectively, pledged as collateral for FHLB advances, FRB discount window borrowings, securities sold under agreements to repurchase (“repurchase agreements”), and deposits of several state and local government units.
86
Allowance for Credit Losses - Available-For-Sale Debt Securities
In assessing whether a credit loss existed on available-for-sale debt securities with unrealized losses, the Company compared the present value of cash flows expected to be collected from the debt securities with the amortized cost basis of the debt securities. In addition, the following factors were evaluated individually and collectively in determining the existence of potential credit losses:
•credit ratings from Nationally Recognized Statistical Rating Organizations (“NRSRO” entities such as Standard and Poor’s [“S&P”] and Moody’s);
•the extent to which the fair value is less than cost;
•adverse conditions, if any, specifically related to the securities, including the industry and geographic area;
•the overall deal and payment structure of the debt securities, including the investor entity’s position within the structure, underlying obligors, financial condition and near-term prospects of the issuer, including specific events which may affect the issuer’s operations or future earnings, and credit support or enhancements; and
•failure of the issuer and underlying obligors, if any, to make scheduled payments of interest and principal.
The following table summarizes available-for-sale debt securities that were in an unrealized loss position for which an ACL has not been recorded, based on the length of time the individual securities have been in an unrealized loss position. The number of available-for-sale debt securities in an unrealized loss position is also disclosed.
| December 31, 2020 | |||||||||||||||||||||||||||||||||||||||||
| Number | Less than 12 Months | 12 Months or More | Total | ||||||||||||||||||||||||||||||||||||||
| (Dollars in thousands) | of Securities | Fair Value | Unrealized Loss | Fair Value | Unrealized Loss | Fair Value | Unrealized Loss | ||||||||||||||||||||||||||||||||||
| Available-for-sale | |||||||||||||||||||||||||||||||||||||||||
U.S. government and federal agency | $ | ( | ( | ( | |||||||||||||||||||||||||||||||||||||
| State and local governments | ( | ( | |||||||||||||||||||||||||||||||||||||||
| Corporate bonds | ( | ( | |||||||||||||||||||||||||||||||||||||||
| Residential mortgage-backed securities | ( | ( | |||||||||||||||||||||||||||||||||||||||
| Commercial mortgage-backed securities | ( | ( | |||||||||||||||||||||||||||||||||||||||
Total available-for-sale | $ | ( | ( | ( | |||||||||||||||||||||||||||||||||||||
| December 31, 2019 | |||||||||||||||||||||||||||||||||||||||||
| Number | Less than 12 Months | 12 Months or More | Total | ||||||||||||||||||||||||||||||||||||||
| (Dollars in thousands) | of Securities | Fair Value | Unrealized Loss | Fair Value | Unrealized Loss | Fair Value | Unrealized Loss | ||||||||||||||||||||||||||||||||||
| Available-for-sale | |||||||||||||||||||||||||||||||||||||||||
U.S. government and federal agency | $ | ( | ( | ||||||||||||||||||||||||||||||||||||||
| State and local governments | ( | ( | |||||||||||||||||||||||||||||||||||||||
| Corporate bonds | ( | ( | |||||||||||||||||||||||||||||||||||||||
| Residential mortgage-backed securities | ( | ( | ( | ||||||||||||||||||||||||||||||||||||||
| Commercial mortgage-backed securities | ( | ( | ( | ||||||||||||||||||||||||||||||||||||||
Total available-for-sale | $ | ( | ( | ( | |||||||||||||||||||||||||||||||||||||
With respect to severity, the majority of available-for-sale debt securities with unrealized loss positions at December 31, 2020 have unrealized losses as a percentage of book value of less than five percent. A substantial portion of such securities were issued by Federal National Mortgage Association (“Fannie Mae”), Federal Home Loan Mortgage Corporation (“Freddie Mac”), Government National Mortgage Association (“Ginnie Mae”) and other agencies of the U.S. government or have credit ratings issued by one or more of the NRSRO entities in the four highest credit rating categories. All of the Company’s available-for-sale debt securities with unrealized loss positions at December 31, 2020 have been determined to be investment grade.
As of December 31, 2020, the Company did not have any past due available-for-sale debt securities. Accrued interest receivable on available-for-sale debt securities totaled $20,215,000 at December 31, 2020 and was excluded from the estimate of credit losses and there was no interest reversed during the year.
87
During the period ended December 31, 2020, the Company acquired available-for-sale debt securities from the secondary market and through the SBAZ acquisition. Such securities were evaluated and it was determined there were no PCD securities, so no allowance for credit losses was recorded.
Based on an analysis of its available-for-sale debt securities with unrealized losses as of December 31, 2020, the Company determined the decline in value was unrelated to credit losses and was primarily the result of changes in interest rates and market spreads subsequent to acquisition. The fair value of the debt securities is expected to recover as payments are received and the debt securities approach maturity. In addition, as of December 31, 2020, management determined it did not intend to sell available-for-sale debt securities with unrealized losses, and there was no expected requirement to sell such securities before recovery of their amortized cost. As a result, no ACL was recorded on available-for-sale debt securities at December 31, 2020. As part of this determination, the Company considered contractual obligations, regulatory constraints, liquidity, capital, asset/liability management and securities portfolio objectives and whether or not any of the Company’s investment securities were managed by third-party investment funds.
Allowance for Credit Losses - Held-To-Maturity Debt Securities
The Company measured expected credit losses on held-to-maturity debt securities on a collective basis by major security type and NRSRO credit ratings, which is the Company’s primary credit quality indicator for state and local government securities. The estimate of expected credit losses considered historical credit loss information that was adjusted for current conditions as well as reasonable and supportable forecasts. The following table summarizes the amortized cost of held-to-maturity debt securities aggregated by NRSRO credit rating:
| (Dollars in thousands) | December 31, 2020 | December 31, 2019 | |||||||||
| Held-to-maturity | |||||||||||
S&P: AAA / Moody’s: Aaa | $ | ||||||||||
S&P: AA+, AA, AA- / Moody’s: Aa1, Aa2, Aa3 | |||||||||||
S&P: A+, A, A- / Moody’s: A1, A2, A3 | |||||||||||
Not rated by either entity | |||||||||||
Total held-to-maturity | $ | ||||||||||
The Company’s held-to-maturity debt securities portfolio is primarily comprised of general obligation and revenue bonds with NRSRO ratings in the four highest credit rating categories. All of the Company’s held-to-maturity debt securities at December 31, 2020 have been determined to be investment grade.
As of December 31, 2020, the Company did not have any held-to-maturity debt securities past due. Accrued interest receivable on held-to-maturity debt securities totaled $1,728,000 at December 31, 2020 and was excluded from the estimate of credit losses.
Based on the Company’s evaluation, an insignificant amount of credit losses is expected on the held-to-maturity debt securities portfolio; therefore, no ACL was recorded at December 31, 2020.
88
Note 3. Loans Receivable, Net
On January 1, 2020, the Company adopted FASB ASU 2016-13, Financial Instruments - Credit Losses, which significantly changed the loan and allowance for credit loss accounting disclosures. The following loan and allowance for credit loss accounting disclosures are presented in accordance with ASC Topic 326, whereas prior periods are presented in accordance with the incurred loss model as disclosed in the Company’s 2019 Annual Report on Form 10-K.
The following table presents loans receivable for each portfolio segment of loans:
| (Dollars in thousands) | December 31, 2020 | December 31, 2019 | |||||||||
| Residential real estate | $ | ||||||||||
| Commercial real estate | |||||||||||
| Other commercial | |||||||||||
| Home equity | |||||||||||
| Other consumer | |||||||||||
| Loans receivable | |||||||||||
| Allowance for credit losses | ( | ( | |||||||||
| Loans receivable, net | $ | ||||||||||
| Net deferred origination (fees) costs included in loans receivable | $ | ( | ( | ||||||||
| Net purchase accounting (discounts) premiums included in loans receivable | $ | ( | ( | ||||||||
| Accrued interest receivable on loans | $ | ||||||||||
Substantially all of the Company’s loans receivable are with borrowers in the Company’s geographic market areas. Although the Company has a diversified loan portfolio, a substantial portion of borrowers’ ability to service their obligations is dependent upon the economic performance in the Company’s market areas.
Other than purchases through bank acquisitions, the Company had no significant purchases or sales of portfolio loans or reclassification of loans held for investment to loans held for sale during 2020, 2019 and 2018.
At December 31, 2020, the Company had loans of $6,707,315,000 pledged as collateral for FHLB advances and FRB discount window. The Company is subject to regulatory limits for the amount of loans to any individual borrower and the Company is in compliance with this regulation as of December 31, 2020 and 2019. No borrower had outstanding loans or commitments exceeding 10 percent of the Company’s consolidated stockholders’ equity as of December 31, 2020.
The Company has entered into transactions with its executive officers and directors and their affiliates. The aggregate amount of loans outstanding to such related parties at December 31, 2020 and 2019 was $77,634,000 and $57,825,000 , respectively. During 2020, net new loans to such related parties were $35,242,000 and repayments were $15,432,000 . In management’s opinion, such loans were made in the ordinary course of business and were made on substantially the same terms as those prevailing at the time for comparable transaction with other persons.
89
Allowance for Credit Losses - Loans Receivable
The ACL is a valuation account that is deducted from the amortized cost basis to present the net amount expected to be collected on loans. The following tables summarize the activity in the ACL:
| Year ended December 31, 2020 | |||||||||||||||||||||||||||||||||||
| (Dollars in thousands) | Total | Residential Real Estate | Commercial Real Estate | Other Commercial | Home Equity | Other Consumer | |||||||||||||||||||||||||||||
| Balance at beginning of period | $ | ||||||||||||||||||||||||||||||||||
| Impact of adopting CECL | ( | ( | |||||||||||||||||||||||||||||||||
| Acquisitions | |||||||||||||||||||||||||||||||||||
| Provision for credit losses | ( | ( | |||||||||||||||||||||||||||||||||
| Charge-offs | ( | ( | ( | ( | ( | ( | |||||||||||||||||||||||||||||
| Recoveries | |||||||||||||||||||||||||||||||||||
| Balance at end of period | $ | ||||||||||||||||||||||||||||||||||
| Year ended December 31, 2019 | |||||||||||||||||||||||||||||||||||
| (Dollars in thousands) | Total | Residential Real Estate | Commercial Real Estate | Other Commercial | Home Equity | Other Consumer | |||||||||||||||||||||||||||||
| Balance at beginning of period | $ | ||||||||||||||||||||||||||||||||||
| Provision for credit losses | ( | ( | ( | ( | |||||||||||||||||||||||||||||||
| Charge-offs | ( | ( | ( | ( | ( | ( | |||||||||||||||||||||||||||||
| Recoveries | |||||||||||||||||||||||||||||||||||
| Balance at end of period | $ | ||||||||||||||||||||||||||||||||||
| Year ended December 31, 2018 | |||||||||||||||||||||||||||||||||||
| (Dollars in thousands) | Total | Residential Real Estate | Commercial Real Estate | Other Commercial | Home Equity | Other Consumer | |||||||||||||||||||||||||||||
| Balance at beginning of period | $ | ||||||||||||||||||||||||||||||||||
| Provision for credit losses | ( | ||||||||||||||||||||||||||||||||||
| Charge-offs | ( | ( | ( | ( | ( | ( | |||||||||||||||||||||||||||||
| Recoveries | |||||||||||||||||||||||||||||||||||
| Balance at end of period | $ | ||||||||||||||||||||||||||||||||||
As a result of the adoption of the CECL accounting standard, the Company adjusted the January 1, 2020 ACL balances within each loan segment to reflect the changes from the incurred loss model to the current expected credit loss model which resulted in increases and decreases in each loan segment based on, among other factors, quantitative and qualitative assumptions and the economic forecast to estimate the provision for credit losses over the expected life of the loans. During the year ended December 31, 2020, primarily as a result of the COVID-19 pandemic, there was a significant increase in the overall ACL and increases and decreases within certain loan segments. In addition, the acquisition of SBAZ resulted in a $4,794,000 increase in the ACL due to the provision for credit losses recorded subsequent to the acquisition date. The COVID-19 pandemic significantly adjusted the economic forecast used in the ACL model including a significant increase in national and regional unemployment rates and a significant decrease in the gross domestic product (“GDP”).
90
The sizeable charge-offs in the other consumer loan segment is driven by deposit overdraft charge-offs which typically experience high charge-off rates and the amounts were comparable to historical trends. The other segments experience routine charge-offs and recoveries, with occasional large credit relationships charge-offs and recoveries that cause fluctuations from prior prior periods. During the year ended December 31, 2020, there have been no significant changes to the types of collateral securing collateral-dependent loans.
During the year ended December 31, 2020, the Company acquired loans through the SBAZ acquisition. Such loans were evaluated at acquisition date and it was determined there were PCD loans totaling $3,401,000 with an ACL of $49,000 . There was also a discount associated with such loans of $13,000 , which was attributable to changes in interest rates and other factors such as liquidity as of acquisition date.
Aging Analysis
The following tables present an aging analysis of the recorded investment in loans by loan class:
| December 31, 2020 | |||||||||||||||||||||||||||||||||||
| (Dollars in thousands) | Total | Residential Real Estate | Commercial Real Estate | Other Commercial | Home Equity | Other Consumer | |||||||||||||||||||||||||||||
| Accruing loans 30-59 days past due | $ | ||||||||||||||||||||||||||||||||||
| Accruing loans 60-89 days past due | |||||||||||||||||||||||||||||||||||
Accruing loans 90 days or more past due | |||||||||||||||||||||||||||||||||||
| Non-accrual loans with no ACL | |||||||||||||||||||||||||||||||||||
| Non-accrual loans with ACL | |||||||||||||||||||||||||||||||||||
Total past due and non-accrual loans | |||||||||||||||||||||||||||||||||||
| Current loans receivable | |||||||||||||||||||||||||||||||||||
| Total loans receivable | $ | ||||||||||||||||||||||||||||||||||
| December 31, 2019 | |||||||||||||||||||||||||||||||||||
| (Dollars in thousands) | Total | Residential Real Estate | Commercial Real Estate | Other Commercial | Home Equity | Other Consumer | |||||||||||||||||||||||||||||
| Accruing loans 30-59 days past due | $ | ||||||||||||||||||||||||||||||||||
| Accruing loans 60-89 days past due | |||||||||||||||||||||||||||||||||||
Accruing loans 90 days or more past due | |||||||||||||||||||||||||||||||||||
| Non-accrual loans | |||||||||||||||||||||||||||||||||||
Total past due and non-accrual loans | |||||||||||||||||||||||||||||||||||
| Current loans receivable | |||||||||||||||||||||||||||||||||||
| Total loans receivable | $ | ||||||||||||||||||||||||||||||||||
91
Collateral-Dependent Loans
A loan is considered collateral-dependent when the borrower is experiencing financial difficulty and repayment is expected to be provided substantially through the operation or sale of the collateral. The collateral on the loans is a significant portion of what secures the collateral-dependent loans and significant changes to the fair value of the collateral can impact the ACL. During 2020, there were no significant changes to the which the collateral secures the collateral-dependent loans, whether due to general deterioration or other reasons. The following table presents the amortized cost basis of collateral-dependent loans by collateral type:
| December 31, 2020 | |||||||||||||||||||||||||||||||||||
| (Dollars in thousands) | Total | Residential Real Estate | Commercial Real Estate | Other Commercial | Home Equity | Other Consumer | |||||||||||||||||||||||||||||
| Business assets | $ | ||||||||||||||||||||||||||||||||||
| Residential real estate | |||||||||||||||||||||||||||||||||||
| Other real estate | |||||||||||||||||||||||||||||||||||
| Other | |||||||||||||||||||||||||||||||||||
| Total | $ | ||||||||||||||||||||||||||||||||||
Restructured Loans
A restructured loan is considered a troubled debt restructuring if the creditor, for economic or legal reasons related to the debtor’s financial difficulties, grants a concession to the debtor that it would not otherwise consider. The following tables present TDRs that occurred during the periods presented and the TDRs that occurred within the previous twelve months that subsequently defaulted during the periods presented:
| Year ended December 31, 2020 | |||||||||||||||||||||||||||||||||||
| (Dollars in thousands) | Total | Residential Real Estate | Commercial Real Estate | Other Commercial | Home Equity | Other Consumer | |||||||||||||||||||||||||||||
| TDRs that occurred during the period | |||||||||||||||||||||||||||||||||||
| Number of loans | |||||||||||||||||||||||||||||||||||
Pre-modification recorded balance | $ | ||||||||||||||||||||||||||||||||||
Post-modification recorded balance | $ | ||||||||||||||||||||||||||||||||||
TDRs that subsequently defaulted | |||||||||||||||||||||||||||||||||||
| Number of loans | |||||||||||||||||||||||||||||||||||
| Recorded balance | $ | ||||||||||||||||||||||||||||||||||
| Year ended December 31, 2019 | |||||||||||||||||||||||||||||||||||
| (Dollars in thousands) | Total | Residential Real Estate | Commercial Real Estate | Other Commercial | Home Equity | Other Consumer | |||||||||||||||||||||||||||||
| TDRs that occurred during the period | |||||||||||||||||||||||||||||||||||
| Number of loans | |||||||||||||||||||||||||||||||||||
Pre-modification recorded balance | $ | ||||||||||||||||||||||||||||||||||
Post-modification recorded balance | $ | ||||||||||||||||||||||||||||||||||
TDRs that subsequently defaulted | |||||||||||||||||||||||||||||||||||
| Number of loans | |||||||||||||||||||||||||||||||||||
| Recorded balance | $ | ||||||||||||||||||||||||||||||||||
92
| Year ended December 31, 2018 | |||||||||||||||||||||||||||||||||||
| (Dollars in thousands) | Total | Residential Real Estate | Commercial Real Estate | Other Commercial | Home Equity | Other Consumer | |||||||||||||||||||||||||||||
| TDRs that occurred during the period | |||||||||||||||||||||||||||||||||||
| Number of loans | |||||||||||||||||||||||||||||||||||
Pre-modification recorded balance | $ | ||||||||||||||||||||||||||||||||||
Post-modification recorded balance | $ | ||||||||||||||||||||||||||||||||||
TDRs that subsequently defaulted | |||||||||||||||||||||||||||||||||||
| Number of loans | |||||||||||||||||||||||||||||||||||
| Recorded balance | $ | ||||||||||||||||||||||||||||||||||
The modifications for the loans designated as TDRs during the years ended December 31, 2020, 2019 and 2018 included one or a combination of the following: an extension of the maturity date, a reduction of the interest rate or a reduction in the principal amount.
In addition to the loans designated as TDRs during the period provided in the preceding tables, the Company had TDRs with pre-modification loan balances of $2,278,000 , $2,992,000 and $6,793,000 for the years ended December 31, 2020, 2019 and 2018, respectively, for which OREO was received in full or partial satisfaction of the loans. The majority of such TDRs were in commercial real estate for the year ended December 31, 2020, residential real estate for the year ended December 31, 2019, and, commercial real estate for the year ended December 31, 2018. At December 31, 2020 and 2019, the Company had $548,000 and $1,744,000 , respectively, of consumer mortgage loans secured by residential real estate properties for which formal foreclosure proceedings are in process. At December 31, 2020 and 2019, the Company had $273,000 and $1,504,000 , respectively, of OREO secured by residential real estate properties.
There were $817,000 and $3,933,000 of additional unfunded commitments on TDRs outstanding at December 31, 2020 and 2019, respectively. The amount of charge-offs on TDRs during 2020, 2019 and 2018 was $453,000 , $709,000 and $1,685,000 , respectively.
In the current year, the Company also modified loans under the CARES Act, along with related regulatory guidance, that were not classified as TDRs. In addition, the state of Montana created the Montana Loan Deferment Program for only Montana-based business that utilized Cares Act funds to provide interest payments upfront on behalf of participating borrowers. The Montana Loan Deferment Program provided modifications for customers under the CARES Act that were not classified as TDRs.
93
Credit Quality Indicators
The Company categorizes commercial real estate and other commercial loans into risk categories based on relevant information about the ability of borrowers to service their obligations. The following tables present the amortized cost in commercial real estate and other commercial loans based on the Company’s internal risk rating. The date of a modification, renewal or extension of a loan is considered for the year of origination if the terms of the loan are as favorable to the Company as the terms are for a comparable loan to other borrowers with similar credit risk.
| December 31, 2020 | |||||||||||||||||||||||||||||
| (Dollars in thousands) | Total | Pass | Special Mention | Substandard | Doubtful/ Loss | ||||||||||||||||||||||||
| Commercial real estate loans | |||||||||||||||||||||||||||||
Term loans by origination year | |||||||||||||||||||||||||||||
| 2020 | $ | ||||||||||||||||||||||||||||
| 2019 | |||||||||||||||||||||||||||||
| 2018 | |||||||||||||||||||||||||||||
| 2017 | |||||||||||||||||||||||||||||
| 2016 | |||||||||||||||||||||||||||||
| Prior | |||||||||||||||||||||||||||||
| Revolving loans | |||||||||||||||||||||||||||||
| Total | $ | ||||||||||||||||||||||||||||
Other commercial loans 1 | |||||||||||||||||||||||||||||
Term loans by origination year | |||||||||||||||||||||||||||||
| 2020 | $ | ||||||||||||||||||||||||||||
| 2019 | |||||||||||||||||||||||||||||
| 2018 | |||||||||||||||||||||||||||||
| 2017 | |||||||||||||||||||||||||||||
| 2016 | |||||||||||||||||||||||||||||
| Prior | |||||||||||||||||||||||||||||
| Revolving loans | |||||||||||||||||||||||||||||
| Total | $ | ||||||||||||||||||||||||||||
______________________________
1 Includes PPP loans.
94
For residential real estate, home equity and other consumer loan segments, the Company evaluates credit quality primarily on the aging status of the loan. The following tables present the amortized cost of residential real estate, home equity and other consumer loans based on payment performance:
| December 31, 2020 | |||||||||||||||||||||||
| (Dollars in thousands) | Total | Performing | 30-89 Days Past Due | Non-Accrual and 90 Days or More Past Due | |||||||||||||||||||
| Residential real estate loans | |||||||||||||||||||||||
Term loans by origination year | |||||||||||||||||||||||
| 2020 | $ | ||||||||||||||||||||||
| 2019 | |||||||||||||||||||||||
| 2018 | |||||||||||||||||||||||
| 2017 | |||||||||||||||||||||||
| 2016 | |||||||||||||||||||||||
| Prior | |||||||||||||||||||||||
| Revolving loans | |||||||||||||||||||||||
| Total | $ | ||||||||||||||||||||||
| Home equity loans | |||||||||||||||||||||||
Term loans by origination year | |||||||||||||||||||||||
| 2020 | $ | ||||||||||||||||||||||
| 2019 | |||||||||||||||||||||||
| 2018 | |||||||||||||||||||||||
| 2017 | |||||||||||||||||||||||
| 2016 | |||||||||||||||||||||||
| Prior | |||||||||||||||||||||||
| Revolving loans | |||||||||||||||||||||||
| Total | $ | ||||||||||||||||||||||
| Other consumer loans | |||||||||||||||||||||||
Term loans by origination year | |||||||||||||||||||||||
| 2020 | $ | ||||||||||||||||||||||
| 2019 | |||||||||||||||||||||||
| 2018 | |||||||||||||||||||||||
| 2017 | |||||||||||||||||||||||
| 2016 | |||||||||||||||||||||||
| Prior | |||||||||||||||||||||||
| Revolving loans | |||||||||||||||||||||||
| Total | $ | ||||||||||||||||||||||
95
Additional Disclosures
The implementation of FASB ASU 2016-13, Financial Instruments - Credit Losses significantly changed disclosures related to loans and, as a result, certain disclosures are no longer required. The following tables represent disclosures for the prior period presented that are no longer required as of January 1, 2020, but are included in this Annual Report on Form 10-K since the Company is required to disclose comparative information.
The following table disclosed the recorded investment in loans and the balance in the allowance separated by loans individually evaluated and collectively evaluated for impairment:
| December 31, 2019 | |||||||||||||||||||||||||||||||||||
| (Dollars in thousands) | Total | Residential Real Estate | Commercial Real Estate | Other Commercial | Home Equity | Other Consumer | |||||||||||||||||||||||||||||
| Loans receivable | |||||||||||||||||||||||||||||||||||
Individually evaluated for impairment | $ | ||||||||||||||||||||||||||||||||||
Collectively evaluated for impairment | |||||||||||||||||||||||||||||||||||
| Total loans receivable | $ | ||||||||||||||||||||||||||||||||||
Allowance for loan and lease losses | |||||||||||||||||||||||||||||||||||
Individually evaluated for impairment | $ | ||||||||||||||||||||||||||||||||||
Collectively evaluated for impairment | |||||||||||||||||||||||||||||||||||
Total allowance for loan and lease losses | $ | ||||||||||||||||||||||||||||||||||
The following table disclosed information related to impaired loans:
| At or for the Year ended December 31, 2019 | |||||||||||||||||||||||||||||||||||
| (Dollars in thousands) | Total | Residential Real Estate | Commercial Real Estate | Other Commercial | Home Equity | Other Consumer | |||||||||||||||||||||||||||||
Loans with a specific valuation allowance | |||||||||||||||||||||||||||||||||||
| Recorded balance | $ | ||||||||||||||||||||||||||||||||||
| Unpaid principal balance | |||||||||||||||||||||||||||||||||||
| Specific valuation allowance | |||||||||||||||||||||||||||||||||||
| Average balance | |||||||||||||||||||||||||||||||||||
Loans without a specific valuation allowance | |||||||||||||||||||||||||||||||||||
| Recorded balance | |||||||||||||||||||||||||||||||||||
| Unpaid principal balance | |||||||||||||||||||||||||||||||||||
| Average balance | |||||||||||||||||||||||||||||||||||
| Total | |||||||||||||||||||||||||||||||||||
| Recorded balance | $ | ||||||||||||||||||||||||||||||||||
| Unpaid principal balance | |||||||||||||||||||||||||||||||||||
| Specific valuation allowance | |||||||||||||||||||||||||||||||||||
| Average balance | |||||||||||||||||||||||||||||||||||
Interest income recognized on impaired loans for the year ended December 31, 2019 was not significant.
96
Note 4. Premises and Equipment
Premises and equipment, net of accumulated depreciation, consist of the following:
| (Dollars in thousands) | December 31, 2020 | December 31, 2019 | |||||||||
| Land | $ | ||||||||||
| Buildings and construction in progress | |||||||||||
| Furniture, fixtures and equipment | |||||||||||
| Leasehold improvements | |||||||||||
| Accumulated depreciation | ( | ( | |||||||||
| Net premises and equipment, excluding ROU assets | |||||||||||
| ROU assets | |||||||||||
| Net premises and equipment | $ | ||||||||||
Leases
The Company leases certain land, premises and equipment from third parties. Effective January 1, 2019, ROU assets for operating and finance leases are included in net premises and equipment and lease liabilities are included in and other borrowed funds, respectively, on the Company’s statements of financial condition. The following table summarizes the Company’s leases:
| December 31, 2020 | December 31, 2019 | ||||||||||||||||||||||
| (Dollars in thousands) | Finance Leases | Operating Leases | Finance Leases | Operating Leases | |||||||||||||||||||
| ROU assets | $ | ||||||||||||||||||||||
| Accumulated depreciation | ( | ( | |||||||||||||||||||||
| Net ROU assets | $ | ||||||||||||||||||||||
| Lease liabilities | $ | ||||||||||||||||||||||
| Weighted-average remaining lease term | |||||||||||||||||||||||
| Weighted-average discount rate | % | % | % | % | |||||||||||||||||||
97
Maturities of lease liabilities consist of the following:
| December 31, 2020 | |||||||||||
| (Dollars in thousands) | Finance Leases | Operating Leases | |||||||||
| Maturing within one year | $ | ||||||||||
| Maturing one year through two years | |||||||||||
| Maturing two years through three years | |||||||||||
| Maturing three years through four years | |||||||||||
| Maturing four years through five years | |||||||||||
| Thereafter | |||||||||||
| Total lease payments | |||||||||||
| Present value of lease payments | |||||||||||
| Short-term | |||||||||||
| Long-term | |||||||||||
| Total present value of lease payments | |||||||||||
| Difference between lease payments and present value of lease payments | $ | ||||||||||
The components of lease expense consist of the following:
| Year ended | |||||||||||
| (Dollars in thousands) | December 31, 2020 | December 31, 2019 | |||||||||
| Finance lease cost | |||||||||||
| Amortization of ROU assets | |||||||||||
| Interest on lease liabilities | |||||||||||
| Operating lease cost | |||||||||||
| Short-term lease cost | |||||||||||
| Variable lease cost | |||||||||||
| Sublease income | ( | ( | |||||||||
| Total lease expense | |||||||||||
Supplemental cash flow information related to leases is as follows:
| Year ended | |||||||||||||||||||||||
| December 31, 2020 | December 31, 2019 | ||||||||||||||||||||||
| (Dollars in thousands) | Finance Leases | Operating Leases | Finance Leases | Operating Leases | |||||||||||||||||||
Cash paid for amounts included in the measurement of lease liabilities | |||||||||||||||||||||||
| Operating cash flows | $ | ||||||||||||||||||||||
| Financing cash flows | N/A | N/A | |||||||||||||||||||||
______________________________
N/A - Not applicable
98
Note 5. Other Intangible Assets and Goodwill
The following table sets forth information regarding the Company’s core deposit intangibles:
| At or for the Years ended | |||||||||||||||||
| (Dollars in thousands) | December 31, 2020 | December 31, 2019 | December 31, 2018 | ||||||||||||||
| Gross carrying value | $ | ||||||||||||||||
| Accumulated amortization | ( | ( | ( | ||||||||||||||
| Net carrying value | $ | ||||||||||||||||
| Aggregate amortization expense | $ | ||||||||||||||||
| Estimated amortization expense for the years ending December 31, | |||||||||||||||||
| 2021 | $ | ||||||||||||||||
| 2022 | |||||||||||||||||
| 2023 | |||||||||||||||||
| 2024 | |||||||||||||||||
| 2025 | |||||||||||||||||
Core deposit intangibles increased $2,593,000 , $22,529,000 and $41,328,000 during 2020, 2019 and 2018, respectively, due to acquisitions. For additional information relating to acquisitions, see Note 23.
The following schedule discloses the changes in the carrying value of goodwill:
| Years ended | |||||||||||||||||
| (Dollars in thousands) | December 31, 2020 | December 31, 2019 | December 31, 2018 | ||||||||||||||
| Net carrying value at beginning of period | $ | ||||||||||||||||
| Acquisitions and adjustments | |||||||||||||||||
| Net carrying value at end of period | $ | ||||||||||||||||
The Company evaluates goodwill for possible impairment utilizing a control premium analysis. The analysis first calculates the market capitalization and then adjusts such value for a control premium range which results in an implied fair value. The control premium range is determined based on historical control premiums for acquisitions that are comparable to the Company and is obtained from an independent third party. The calculated implied fair value is then compared to the book value to determine whether the Company needs to proceed to step two of the goodwill impairment assessment. The Company performed its annual goodwill impairment test during the third quarter of 2020 and determined the fair value of the aggregated reporting units exceeded the carrying value, such that the Company’s goodwill was not considered impaired. In recognition there were no events or circumstances that occurred during the fourth quarter of 2020 that would more-likely-than-not reduce the fair value of a reporting unit below its carrying value, the Company did not perform interim testing at December 31, 2020. Changes in the economic environment, operations of the aggregated reporting units, or other factors could result in the decline in the fair value of the aggregated reporting units which could result in a goodwill impairment in the future. Accumulated impairment charges were $40,159,000
99
Note 6. Loan Servicing
Mortgage loans that are serviced for others are not reported as assets. The principal balances of these loans were $1,269,080,000 and $185,897,000 at December 31, 2020 and 2019, respectively. The fair value of servicing rights were $12,086,921 and $1,763,144 at December 31, 2020 and 2019. The following schedules discloses the change in the carrying value of mortgage servicing rights:
| Years ended | |||||||||||||||||
| (Dollars in thousands) | December 31, 2020 | December 31, 2019 | December 31, 2018 | ||||||||||||||
| Carrying value at beginning of period | $ | ||||||||||||||||
| Acquisitions | |||||||||||||||||
| Additions | |||||||||||||||||
| Amortization | ( | ( | ( | ||||||||||||||
| Carrying value at end of period | $ | ||||||||||||||||
Note 7. Variable Interest Entities
A VIE is a partnership, limited liability company, trust or other legal entity that meets one of the following criteria: 1) the entity’s equity investment at risk is not sufficient to permit the entity to finance its activities without additional subordinated financial support from other parties; 2) the holders of the equity investment at risk, as a group, lack the characteristics of a controlling financial interest; and 3) the voting rights of some holders of the equity investment at risk are disproportionate to their obligation to absorb losses or receive returns, and substantially all of the activities are conducted on behalf of the holder of equity investment at risk with disproportionately few voting rights. A VIE must be consolidated by the Company if it is deemed to be the primary beneficiary, which is the party involved with the VIE that has both: 1) the power to direct the activities of the VIE that most significantly affect the VIE’s economic performance; and 2) the obligation to absorb the losses of the VIE that could potentially be significant to the VIE or the right to receive benefits from the VIE that could potentially be significant to the VIE.
The Company’s VIEs are regularly monitored to determine if any reconsideration events have occurred that could cause the primary beneficiary status to change. A previously unconsolidated VIE is consolidated when the Company becomes the primary beneficiary. A previously consolidated VIE is deconsolidated when the Company ceases to be the primary beneficiary or the entity is no longer a VIE.
Consolidated Variable Interest Entities
The Company has equity investments in Certified Development Entities (“CDE”) which have received allocations of New Markets Tax Credits (“NMTC”). The NMTC program provides federal tax incentives to investors to make investments in distressed communities and promotes economic improvements through the development of successful businesses in these communities. The NMTC is available to investors over seven years and is subject to recapture if certain events occur during such period. The maximum exposure to loss in the CDEs is the amount of equity invested and credit extended by the Company. However, the Company has credit protection in the form of indemnification agreements, guarantees, and collateral arrangements. The Company has evaluated the variable interests held by the Company in each CDE (NMTC) investment and determined the Company does not individually meet the characteristics of a primary beneficiary; however, the related party group does meet the criteria as a group and substantially all of the activities of the CDEs either involve or are conducted on behalf of the Company. As a result, the Company is the primary beneficiary of the CDEs and their assets, liabilities, and results of operations are included in the Company’s consolidated financial statements. The primary activities of the CDEs are recognized in commercial loans interest income and other borrowed funds interest expense on the Company’s statements of operations and the federal income tax credit allocations from the investments are recognized in the Company’s statements of operations as a component of income tax expense. Such related cash flows are recognized in loans originated, principal collected on loans and change in other borrowed funds.
The Bank is also the sole member of certain tax credit funds that make direct investments in qualified affordable housing projects (e.g., Low-Income Housing Tax Credit [“LIHTC”] partnerships). As such, the Company is the primary beneficiary of these tax credit funds and their assets, liabilities, and results of operations are included in the Company’s consolidated financial statements.
100
The following table summarizes the carrying amounts of the consolidated VIEs’ assets and liabilities included in the Company’s statements of financial condition and are adjusted for intercompany eliminations. All assets presented can be used only to settle obligations of the consolidated VIEs and all liabilities presented consist of liabilities for which creditors and other beneficial interest holders therein have no recourse to the general credit of the Company.
| (Dollars in thousands) | December 31, 2020 | December 31, 2019 | |||||||||
| Assets | |||||||||||
| Loans receivable | $ | ||||||||||
| Accrued interest receivable | |||||||||||
| Other assets | |||||||||||
| Total assets | $ | ||||||||||
| Liabilities | |||||||||||
| Other borrowed funds | $ | ||||||||||
| Accrued interest payable | |||||||||||
| Other liabilities | |||||||||||
| Total liabilities | $ | ||||||||||
Unconsolidated Variable Interest Entities
The Company has equity investments in LIHTC partnerships, both directly and through tax credit funds, with carrying values of $45,953,000 and $41,521,000 as of December 31, 2020 and 2019, respectively. The LIHTCs are indirect federal subsidies to finance low-income housing and are used in connection with both newly constructed and renovated residential rental buildings. Once a project is placed in service, it is generally eligible for the tax credit for ten years . To continue generating the tax credit and to avoid tax credit recapture, a LIHTC building must satisfy specific low-income housing compliance rules for a full fifteen years . The maximum exposure to loss in the VIEs is the amount of equity invested and credit extended by the Company. However, the Company has credit protection in the form of indemnification agreements, guarantees, and collateral arrangements. The Company has evaluated the variable interests held by the Company in each LIHTC investment and determined that the Company does not have controlling financial interests in such investments, and is not the primary beneficiary. The Company reports the investments in the unconsolidated LIHTCs as other assets on the Company’s statements of financial condition. There were no Future unfunded contingent equity commitments related to the Company’s LIHTC investments at December 31, 2020 are as follows:
| (Dollars in thousands) | Amount | ||||
| Years ending December 31, | |||||
| 2021 | $ | ||||
| 2022 | |||||
| 2023 | |||||
| 2024 | |||||
| 2025 | |||||
| Thereafter | |||||
| Total | $ | ||||
The Company has elected to use the proportional amortization method, and more specifically, the practical expedient method, for the amortization of all eligible LIHTC investments and amortization expense is recognized as a component of income tax expense. The following table summarizes the amortization expense and the amount of tax credits and other tax benefits recognized for qualified affordable housing project investments during the periods presented.
| Years ended | |||||||||||||||||
| (Dollars in thousands) | December 31, 2020 | December 31, 2019 | December 31, 2018 | ||||||||||||||
Amortization expense | $ | ||||||||||||||||
Tax credits and other tax benefits recognized | |||||||||||||||||
101
Note 8. Deposits
Time deposits that meet or exceed the Federal Deposit Insurance Corporation Insurance (“FDIC”) limit of $250,000 at December 31, 2020 and 2019 were $297,975,000 and $281,054,000 , respectively.
The scheduled maturities of time deposits are as follows:
| (Dollars in thousands) | Amount | ||||
| Years ending December 31, | |||||
| 2021 | $ | ||||
| 2022 | |||||
| 2023 | |||||
| 2024 | |||||
| 2025 | |||||
| Thereafter | |||||
| $ | |||||
Note 9. Borrowings
The Company’s repurchase agreements totaled $1,004,583,000 and $569,824,000 at December 31, 2020 and 2019, respectively, and are secured by debt securities with carrying values of $1,151,264,000 and $711,210,000 , respectively. Securities are pledged to customers at the time of the transaction in an amount at least equal to the outstanding balance and are held in custody accounts by third parties. The fair value of collateral is continually monitored and additional collateral is provided as deemed appropriate. The following tables summarize the carrying value of the Company’s repurchase agreements by remaining contractual maturity and category of collateral:
| December 31, 2020 | December 31, 2019 | ||||||||||
| Remaining Contractual Maturity of the Agreements | |||||||||||
| (Dollars in thousands) | Overnight and Continuous | ||||||||||
| State and local governments | $ | ||||||||||
| Corporate bonds | |||||||||||
| Residential mortgage-backed securities | |||||||||||
| Commercial mortgage-backed securities | |||||||||||
| Total | $ | ||||||||||
102
FHLB advances are collateralized by specifically pledged loans and debt securities, FHLB stock owned by the Company, and a blanket assignment of the unpledged qualifying loans and investments. In September 2019, the Company implemented a balance sheet strategy to increase its net interest income and net interest margin. The strategy included early termination of the Company's pay-fixed interest rate swaps and corresponding debt, including FHLB advances. A $3,531,000 loss was recognized on the early payment of the FHLB advances and was reported in loss on termination of hedging activities on the Company’s statements of operations. During 2020, the Company paid down all FHLB advances and they were zero at year end, December 31, 2020. The scheduled maturities of FHLB advances for 2019 consisted of the following:
| December 31, 2019 | |||||||||||
| (Dollars in thousands) | Amount | Weighted Rate | |||||||||
| Maturing within one year | $ | % | |||||||||
| Maturing one year through two years | % | ||||||||||
| Maturing two years through three years | % | ||||||||||
| Maturing three years through four years | % | ||||||||||
| Maturing four years through five years | % | ||||||||||
| Thereafter | % | ||||||||||
| Total | $ | % | |||||||||
The Company’s other borrowings consisted of finance lease liabilities and other debt obligations through consolidation of certain VIEs. At December 31, 2020, the Company had $635,000,000 in unsecured lines of credit which are typically renewed on an annual basis with various correspondent entities.
Note 10. Subordinated Debentures
The Company’s subordinated debentures are reflected in the table below. The amounts include fair value adjustments from acquisitions.
| December 31, 2020 | Rate Structure | Maturity Date | |||||||||||||||||||||
| (Dollars in thousands) | Balance | Rate | |||||||||||||||||||||
Subordinated debentures owed to trust subsidiaries | |||||||||||||||||||||||
| First Company Statutory Trust 2001 | $ | % | 3 month LIBOR plus | 07/31/2031 | |||||||||||||||||||
| First Company Statutory Trust 2003 | % | 3 month LIBOR plus | 03/26/2033 | ||||||||||||||||||||
| Glacier Capital Trust II | % | 3 month LIBOR plus | 04/07/2034 | ||||||||||||||||||||
| Citizens (ID) Statutory Trust I | % | 3 month LIBOR plus | 06/17/2034 | ||||||||||||||||||||
| Glacier Capital Trust III | % | 3 month LIBOR plus | 04/07/2036 | ||||||||||||||||||||
| Glacier Capital Trust IV | % | 3 month LIBOR plus | 09/15/2036 | ||||||||||||||||||||
| Bank of the San Juans Bancorporation Trust I | % | 3 month LIBOR plus | 03/01/2037 | ||||||||||||||||||||
| FNB (UT) Statutory Trust I | % | 3 month LIBOR plus | 06/26/2033 | ||||||||||||||||||||
| FNB (UT) Statutory Trust II | % | 3 month LIBOR plus | 12/15/2036 | ||||||||||||||||||||
Total subordinated debentures owed to trust subsidiaries | |||||||||||||||||||||||
| Tier 2 subordinated debentures | % | Fixed | 10/01/2025 | ||||||||||||||||||||
| Total subordinated debentures | $ | ||||||||||||||||||||||
103
Subordinated Debentures Owed to Trust Subsidiaries
Trust preferred securities were issued by the Company’s trust subsidiaries, the common stock of which is wholly-owned by the Company, in conjunction with the Company issuing subordinated debentures to the trust subsidiaries. The terms of the subordinated debentures are the same as the terms of the trust preferred securities. The Company guaranteed the payment of distributions and payments for redemption or liquidation of the trust preferred securities to the extent of funds held by the trust subsidiaries. The obligations of the Company under the subordinated debentures together with the guarantee and other back-up obligations, in the aggregate, constitute a full and unconditional guarantee by the Company of the obligations of all trusts under the trust preferred securities.
The trust preferred securities are subject to mandatory redemption upon repayment of the subordinated debentures at their stated maturity date or the earlier redemption in an amount equal to their liquidation amount plus accumulated and unpaid distributions to the date of redemption. Interest distributions are payable quarterly. The Company may defer the payment of interest at any time for a period not exceeding 20 consecutive quarters provided that the deferral period does not extend past the stated maturity. During any such deferral period, distributions on the trust preferred securities will also be deferred and the Company’s ability to pay dividends on its common shares will be restricted.
Subject to prior approval by the FRB, the trust preferred securities may be redeemed at par prior to maturity at the Company’s option on or after the redemption date. All of the Company’s trust preferred securities have reached the redemption date and could be redeemed at the Company’s option. The trust preferred securities may also be redeemed at any time in whole (but not in part) for the Trusts in the event of unfavorable changes in laws or regulations that result in 1) subsidiary trusts becoming subject to federal income tax on income received on the subordinated debentures; 2) interest payable by the Company on the subordinated debentures becoming non-deductible for federal tax purposes; 3) the requirement for the trusts to register under the Investment Company Act of 1940, as amended; or 4) loss of the ability to treat the trust preferred securities as Tier 1 capital under the FRB capital adequacy guidelines.
Provisions of the Dodd-Frank Act require that if a depository institution holding company exceeds $15 billion due to an acquisition, then trust preferred securities are to be excluded from Tier 1 capital beginning in the period in which the transaction occurred. During the current year, the Company’s acquisition of SBAZ on February 29, 2020, resulted in total consolidated assets exceeding $15 billion; accordingly the trust preferred securities were included in Tier 2 capital instead of Tier 1.
Subordinated Debentures
The Company acquired subordinated debentures with the FSB acquisition that qualify as Tier 2 capital under the applicable capital adequacy rules and regulations promulgated by the FRB. The Tier 2 subordinated debentures are not deposits and are not insured by the FDIC or any other government agency. Such obligations are subordinated to the claims of general creditors, are unsecured and are ineligible as collateral. The principal amount is due at maturity and interest distributions are payable quarterly. The Tier 2 subordinated debentures shall not be prepaid prior to the fifth anniversary of the closing date, which is September 30, 2020, except in the event the obligation no longer qualifies as Tier 2 capital (“Tier 2 capital event”) or the interest payable is no longer deductible (“tax event”). Any prepayment made in connection with a Tier 2 capital event or a tax event will be subject to obtaining the prior approval of the FRB. The Company has the ability to prepay these obligations on or after the fifth anniversary of the closing date at any time with notice.
Note 11. Derivatives and Hedging Activities
Cash Flow Hedges
The Company is exposed to certain risk relating to its ongoing business operations. The primary risk managed by using derivative instruments is interest rate risk. Interest rate caps and interest rate swaps have been entered into to manage interest rate risk associated with forecasted variable rate borrowings.
Interest Rate Cap Derivatives. In March 2020, the Company purchased interest rate caps designated as cash flow hedges with notional amounts totaling $130,500,000 on its variable rate subordinated debentures and were determined to be fully effective during the year ended December 31, 2020. The interest rate caps require receipt of variable amounts from the counterparty when interest rates rise above the strike price in the contracts. The strike prices in the year term contracts range from 1.5 percent to 2 percent plus 3 month LIBOR. At December 31, 2020, the interest rate caps had a fair value of $201,000 and were reported as other assets on the Company’s statements of financial condition. Changes in fair value were recorded in OCI. Amortization recorded on the interest rate caps totaled $126,000 and was reported as a component of interest expense on subordinated debentures for the year ended December 31, 2020.
104
Interest Rate Swap Derivatives. In September 2019, the Company implemented a balance sheet strategy to increase its net interest income and net interest margin. The strategy included early termination of the Company’s pay-fixed interest rate swaps with notional amounts totaling $260,000,000 . A $9,997,000 loss was recognized on the early termination of the pay-fixed interest rate swaps and was reported in loss on termination of hedging activities on the Company’s statements of operations. The Company recognized interest rate swaps as other assets or liabilities at fair value in the statements of financial condition, after taking into account the effects of bilateral collateral and master netting agreements. These agreements allowed the Company to settle all interest rate swap agreements held with a single counterparty on a net basis, and to offset net interest rate swap derivative positions with related collateral, where applicable. Prior to termination, changes in fair value were recorded in OCI. The Company designated wholesale deposits and Federal Home Loan Bank (“FHLB”) advances for the cash flow hedge and these hedged items were determined to be fully effective during all periods. Interest expense recorded on the interest rate swaps totaled $0 , $5,532,000 and $8,013,000 during 2020, 2019 and 2018, respectively, and was reported as a component of interest expense on deposits and FHLB advances.
The interest rate swaps on variable rate borrowings were designated as cash flow hedges and were over-the-counter contracts. The contracts were entered into by the Company with a single counterparty, and the specific terms and conditions were negotiated, including forecasted notional amounts, interest rates and maturity dates. The Company was exposed to credit-related losses in the event of nonperformance by the counterparty to the agreements. The Company controlled the counterparty credit risk by maintaining bilateral collateral agreements and through monitoring policy and procedures. The Company only conducted business with primary dealers and believed that the credit risk inherent in these contracts was not significant.
The effect of cash flow hedge accounting on OCI for the periods ending December 31, 2020, 2019, and 2018 was as follows:
| Years ended | |||||||||||||||||
| (Dollars in thousands) | December 31, 2020 | December 31, 2019 | December 31, 2018 | ||||||||||||||
| Amount of (loss) gain recognized in OCI | $ | ( | ( | ||||||||||||||
| Amount of loss reclassified from OCI to interest expense | ( | ( | |||||||||||||||
Residential Real Estate Derivatives
105
Note 12. Regulatory Capital
The Federal Reserve has adopted capital adequacy guidelines that are used to assess the adequacy of capital in supervising a bank holding company. The federal banking agencies implemented final rules (“Final Rules”) to establish a new comprehensive regulatory capital framework with a phase-in period beginning on January 1, 2015 and ending on January 1, 2019. The Final Rules implemented certain regulatory amendments based on the recommendation of the Basel Committee on Banking Supervision and certain requirements of the Dodd-Frank Act and substantially amended the regulatory risk-based capital rules applicable to the Company. The Final Rules require the Company to hold a 2.5 percent capital conservation buffer designed to absorb losses during periods of economic stress. The Company has elected to opt-out of the requirement to include most components of accumulated other comprehensive income. As of December 31, 2020, management believes the Company and Bank meet all capital adequacy requirements to which they are subject.
Prompt corrective action regulations provide the following classifications: well capitalized, adequately capitalized, undercapitalized, significantly undercapitalized and critically undercapitalized. If undercapitalized, capital distributions (including payment of a dividend) are generally restricted, as is paying management fees to its bank holding company. Failure to meet minimum capital requirements set forth in the table below can initiate certain mandatory and possible additional discretionary actions by regulators that, if undertaken, could have a direct material effect on the Company’s and Bank’s financial condition. The Company’s and Bank’s capital amounts and classification are also subject to qualitative judgments by the regulators about components, risk weightings and other factors.
At December 31, 2020 and 2019, the most recent regulatory notifications categorized the Company and Bank as well capitalized under the regulatory framework for prompt corrective action. To be well capitalized, the Bank must maintain minimum total capital, Tier 1 capital, Common Tier 1 capital and Tier 1 Leverage ratios as set forth in the table below. There are no conditions or events since December 31, 2020 that management believes have changed the Company’s or Bank’s risk-based capital category.
Current guidance from the Federal Reserve provides, among other things, that dividends per share on the Company’s common stock generally should not exceed earnings per share, measured over the previous four fiscal quarters. In certain circumstances, Montana law also places limits or restrictions on a bank’s ability to declare and pay dividends.
106
The following tables illustrate the FRB’s adequacy guidelines and the Company’s and the Bank’s compliance with those guidelines:
| December 31, 2020 | |||||||||||||||||||||||||||||||||||
| Actual | Required for Capital Adequacy Purposes | To Be Well Capitalized Under Prompt Corrective Action Regulations | |||||||||||||||||||||||||||||||||
| (Dollars in thousands) | Amount | Ratio | Amount | Ratio | Amount | Ratio | |||||||||||||||||||||||||||||
| Total capital (to risk-weighted assets) | |||||||||||||||||||||||||||||||||||
| Consolidated | $ | % | $ | % | N/A | N/A | |||||||||||||||||||||||||||||
| Glacier Bank | % | % | $ | % | |||||||||||||||||||||||||||||||
| Tier 1 capital (to risk-weighted assets) | |||||||||||||||||||||||||||||||||||
| Consolidated | % | % | N/A | N/A | |||||||||||||||||||||||||||||||
| Glacier Bank | % | % | % | ||||||||||||||||||||||||||||||||
| Common Equity Tier 1 (to risk-weighted assets) | |||||||||||||||||||||||||||||||||||
| Consolidated | % | % | N/A | N/A | |||||||||||||||||||||||||||||||
| Glacier Bank | % | % | % | ||||||||||||||||||||||||||||||||
| Tier 1 capital (to average assets) | |||||||||||||||||||||||||||||||||||
| Consolidated | % | % | N/A | N/A | |||||||||||||||||||||||||||||||
| Glacier Bank | % | % | % | ||||||||||||||||||||||||||||||||
| December 31, 2019 | |||||||||||||||||||||||||||||||||||
| Actual | Required for Capital Adequacy Purposes | To Be Well Capitalized Under Prompt Corrective Action Regulations | |||||||||||||||||||||||||||||||||
| (Dollars in thousands) | Amount | Ratio | Amount | Ratio | Amount | Ratio | |||||||||||||||||||||||||||||
| Total capital (to risk-weighted assets) | |||||||||||||||||||||||||||||||||||
| Consolidated | $ | % | $ | % | N/A | N/A | |||||||||||||||||||||||||||||
| Glacier Bank | % | % | $ | % | |||||||||||||||||||||||||||||||
| Tier 1 capital (to risk-weighted assets) | |||||||||||||||||||||||||||||||||||
| Consolidated | % | % | N/A | N/A | |||||||||||||||||||||||||||||||
| Glacier Bank | % | % | % | ||||||||||||||||||||||||||||||||
| Common Equity Tier 1 (to risk-weighted assets) | |||||||||||||||||||||||||||||||||||
| Consolidated | % | % | N/A | N/A | |||||||||||||||||||||||||||||||
| Glacier Bank | % | % | % | ||||||||||||||||||||||||||||||||
| Tier 1 capital (to average assets) | |||||||||||||||||||||||||||||||||||
| Consolidated | % | % | N/A | N/A | |||||||||||||||||||||||||||||||
| Glacier Bank | % | % | % | ||||||||||||||||||||||||||||||||
______________________________
N/A - Not applicable
Note 13. Stock-based Compensation Plan
The Company’s stock-based compensation plan, The 2015 Stock Incentive Plan, provides incentives and awards to select employees and directors of the Company and permits the granting of stock options, share appreciation rights, restricted shares, restricted share units, unrestricted shares and performance awards. At December 31, 2020, the number of shares available to award to employees and directors under the 2015 Stock Incentive Plan was 1,929,578 .
During 2019 and 2018, the Company also assumed stock-based compensation plans through the Heritage and Collegiate acquisitions, respectively. No additional shares may be awarded from these plans.
Restricted Stock Units
The Company has awarded restricted stock units to select employees and directors under the 2015 Stock Incentive Plan. Common stock is issued as vesting restrictions lapse, which may be immediately or according to the terms of a vesting schedule. Restricted
107
stock units may not be sold, pledged or otherwise transferred until restrictions have lapsed. The recipient does not have the right to vote or to receive dividends until the restricted stock unit has vested. The fair value of the restricted stock unit is the closing price of the Company’s common stock on the award date.
Compensation expense related to restricted stock units for the years ended December 31, 2020, 2019 and 2018 was $4,489,000 , $3,803,000 and $3,684,000 , respectively, and the recognized income tax benefit related to this expense was $1,134,000 , $964,000 and $934,000 , respectively. As of December 31, 2020, total unrecognized compensation expense of $4,833,000 related to restricted stock units is expected to be recognized over a weighted-average period of 1.9 years.
The fair value of restricted stock units that vested during the years ended December 31, 2020, 2019 and 2018 was $4,048,000 , $3,536,000 and $3,319,000 , respectively, and the income tax benefit related to these awards was $1,089,000 , $1,124,000 and $1,126,000 , respectively. Upon vesting of restricted stock units, the shares are issued from the Company’s authorized stock balance.
The following table summarizes the restricted stock unit activity for the year ended December 31, 2020:
| Restricted Stock Units | Weighted- Average Grant Date Fair Value | ||||||||||
| Non-vested at December 31, 2019 | $ | ||||||||||
| Granted | |||||||||||
| Vested | ( | ||||||||||
| Forfeited | ( | ||||||||||
| Non-vested at December 31, 2020 | |||||||||||
The average remaining contractual term on non-vested restricted stock units at December 31, 2020 is 0.9 years. The aggregate intrinsic value of the non-vested restricted stock units at December 31, 2020 was $8,691,000 .
Stock Options
During 2019 and 2018, the Company assumed stock options through the Heritage and Collegiate acquisitions, respectively. All stock option shares and per share market values were adjusted at acquisition dates. The option price at which the Company's common stock may be purchased upon exercise of stock options granted under the plans must be at least equal to the per share market value of such stock at the date the option was granted. Upon exercise of the stock options, the shares are issued from the Company's authorized and unissued common stock. Prior to the Heritage and Collegiate stock options being assumed, there were no outstanding stock options and there were no stock options granted during 2020, 2019, or 2018.
Compensation expense related to stock options for the years ended December 31, 2020, 2019, and 2018 was $17,000 , $5,415,000 , and $19,000 , respectively, and the recognized income tax benefit related to this expense was $4,000 , $1,372,000 , and $5,000 . As of December 31, 2020, total unrecognized compensation expense of $6,000 related to stock options is expected to be recognized over a weighted-average period of 0.4 years.
The total intrinsic value of options exercised during the years ended December 31, 2020, 2019, and 2018 was $1,221,000 , $4,491,000 , and $13,000 , respectively, and the income tax benefit related to these exercises was $141,000 and $934,000 . Total cash received from options exercised during the years ended December 31, 2020 and 2019 was $993,000 and $2,896,000 , respectively.
Changes in shares granted for stock options for the year ended December 31, 2020 are summarized as follows:
| Stock Options | Weighted- Average Exercise Price | ||||||||||
| Outstanding at December 31, 2019 | $ | ||||||||||
| Acquisitions | |||||||||||
| Exercised | ( | ||||||||||
| Forfeited | |||||||||||
| Outstanding at December 31, 2020 | |||||||||||
| Exercisable at December 31, 2020 | |||||||||||
108
Note 14. Employee Benefit Plans
The Company provides its qualified employees with a comprehensive benefit program, including health, dental and vision insurance, life and accident insurance, short- and long-term disability coverage, vacation and sick leave, Profit Sharing and 401(k) Plan, stock-based compensation plan, deferred compensation plans, and supplemental executive retirement plan (“SERP”). The Company has elected to self-insure certain costs related to employee health, dental and vision benefit programs. Costs resulting from non-insured losses are expensed as incurred. The Company has purchased insurance that limits its exposure on an individual claim basis for the employee health benefit programs.
Profit Sharing and 401(k) Plan
The Company’s Profit Sharing and 401(k) Plan have safe harbor and employer discretionary components. To be eligible to participate in the plan, an employee must be at least 18 years of age and employed for full months. Employees are eligible to participate in the 401(k) plan the first day of the month once they have met the eligibility requirements. To be considered eligible for the employer discretionary contribution of the profit sharing plan, an employee must be 18 years of age, worked one full calendar quarter, worked 501 hours in the plan year and be employed as of the last day of the plan year. Participants are at all times fully vested in all contributions.
The profit sharing plan contributions consists of a 3 percent non-elective safe harbor contribution fully funded by the Company and an employer discretionary contribution. The employer discretionary contribution depends on the Company’s profitability. The total profit sharing plan expense for the years ended December 31, 2020, 2019, and 2018 was $22,047,000 , $17,227,000 and $15,406,000 , respectively.
The 401(k) plan allows eligible employees under the age of 50 to contribute up to 60 percent, and those 50 and older to contribute up to 100 percent of their eligible annual compensation up to the limit set annually by the Internal Revenue Service (“IRS”). The Company matches an amount equal to 50 percent of the first 6 percent of an employee’s contribution. The Company’s contribution to the 401(k) plan for the years ended December 31, 2020, 2019 and 2018 was $4,985,000 , $4,236,000 , and $4,037,000 , respectively.
Deferred Compensation Plans
The Company has non-funded deferred compensation plans for directors, senior officers and certain nonemployee service providers. The plans provide for participants’ elective deferral of cash payments of up to 50 percent of a participants’ salary and 100 percent of bonuses and directors fees. As of December 31, 2020 and 2019, the liability related to the plans was $9,276,000 and $8,660,000 , respectively, and was included in other liabilities. The total amount deferred for the plans was $1,109,000 , $766,000 , and $803,000 , for the years ending December 31, 2020, 2019, and 2018, respectively. The participant receives an earnings credit at a rate equal to 50 percent of the Company’s return on average equity. Total expense for the years ended December 31, 2020, 2019, and 2018 for the plans was $504,000 , $480,000 and $502,000 , respectively.
In connection with several acquisitions, the Company assumed the obligations of deferred compensation plans for certain key employees. As of December 31, 2020 and 2019, the liability related to the acquired plans was $17,321,000 and $17,661,000 , respectively, and was included in other liabilities. Total expense for the years ended December 31, 2020, 2019, and 2018 for the acquired plans was $971,000 , $992,000 and $801,000 , respectively.
Supplemental Executive Retirement Plan
The Company has SERP which is intended to supplement payments due to participants upon retirement under the Company’s other qualified plans. The Company credits the participant’s account on an annual basis for an amount equal to employer contributions that would have otherwise been allocated to the participant’s account under the tax-qualified plans were it not for limitations imposed by the IRS or the participation in the non-funded deferred compensation plan. Eligible employees include participants of the non-funded deferred compensation plan and employees whose benefits were limited as a result of IRS regulations. As of December 31, 2020 and 2019, the liability related to the SERP was $3,375,000 and $2,713,000 , respectively, and was included in other liabilities. The Company’s required contribution to the SERP for the years ended December 31, 2020, 2019 and 2018 was $910,000 , $662,000 , and $423,000 , respectively. The participant receives an earnings credit at a rate equal to 50 percent of the Company’s return on average equity. Total expense for the years ended December 31, 2020, 2019, and 2018 for the SERP was $199,000 , $120,000 , and $122,000 , respectively.
109
Note 15. Other Expenses
Other expenses consists of the following:
| Years ended | |||||||||||||||||
| (Dollars in thousands) | December 31, 2020 | December 31, 2019 | December 31, 2018 | ||||||||||||||
| Consulting and outside services | $ | ||||||||||||||||
| Mergers and acquisition expenses | |||||||||||||||||
| Telephone | |||||||||||||||||
| Debit card expenses | |||||||||||||||||
| Checking and operating expenses | |||||||||||||||||
| Loan expenses | |||||||||||||||||
| VIE amortization and other expenses | |||||||||||||||||
| Business development | |||||||||||||||||
| Printing and supplies | |||||||||||||||||
| Postage | |||||||||||||||||
| Employee expenses | |||||||||||||||||
| Accounting and audit fees | |||||||||||||||||
| Legal fees | |||||||||||||||||
| Other | |||||||||||||||||
| Total other expenses | $ | ||||||||||||||||
Note 16. Federal and State Income Taxes
The following table is a summary of consolidated income tax expense:
| Years ended | |||||||||||||||||
| (Dollars in thousands) | December 31, 2020 | December 31, 2019 | December 31, 2018 | ||||||||||||||
| Current | |||||||||||||||||
| Federal | $ | ||||||||||||||||
| State | |||||||||||||||||
| Total current income tax expense | |||||||||||||||||
Deferred 1 | |||||||||||||||||
| Federal | ( | ( | |||||||||||||||
| State | ( | ( | |||||||||||||||
| Total deferred income tax (benefit) expense | ( | ( | |||||||||||||||
| Total income tax expense | $ | ||||||||||||||||
______________________________
110
Combined federal and state income tax expense differs from that computed at the federal statutory corporate income tax rate as follows:
| Years ended | |||||||||||||||||
| December 31, 2020 | December 31, 2019 | December 31, 2018 | |||||||||||||||
| Federal statutory rate | % | % | % | ||||||||||||||
| State taxes, net of federal income tax benefit | % | % | % | ||||||||||||||
| Tax-exempt interest income | ( | %) | ( | %) | ( | %) | |||||||||||
| Tax credits | ( | %) | ( | %) | ( | %) | |||||||||||
| Other, net | % | % | % | ||||||||||||||
| Effective income tax rate | % | % | % | ||||||||||||||
The tax effect of temporary differences which give rise to a significant portion of deferred tax assets and deferred tax liabilities are as follows:
| (Dollars in thousands) | December 31, 2020 | December 31, 2019 | |||||||||
| Deferred tax assets | |||||||||||
| Allowance for credit losses | $ | ||||||||||
| Operating lease liabilities | |||||||||||
| Employee benefits | |||||||||||
| Deferred compensation | |||||||||||
| Acquisition fair market value adjustments | |||||||||||
| Net operating loss carryforwards | |||||||||||
| Other | |||||||||||
| Total gross deferred tax assets | |||||||||||
| Deferred tax liabilities | |||||||||||
| Available-for-sale debt securities | ( | ( | |||||||||
| Intangibles | ( | ( | |||||||||
| Depreciation of premises and equipment | ( | ( | |||||||||
| Operating lease ROU assets | ( | ( | |||||||||
| Deferred loan costs | ( | ( | |||||||||
| Mortgage servicing rights | ( | ( | |||||||||
| Other | ( | ( | |||||||||
| Total gross deferred tax liabilities | ( | ( | |||||||||
| Net deferred tax asset | $ | ( | |||||||||
The Company has federal net operating loss carryforwards of $6,739,071 expiring between 2024 and 2036. The Company has Colorado net operating loss carryforwards of $10,989,735 expiring between 2030 and 2035. The net operating loss carryforwards originated from acquisitions.
The Company and the Bank file consolidated income tax returns for the federal jurisdiction and several states that require consolidated income tax returns. Wyoming, Washington and Nevada do not impose a corporate income tax. All required income tax returns have been timely filed. The following schedule summarizes the years that remain subject to examination as of December 31, 2020:
111
| Years ended December 31, | |||||
| Federal | |||||
| Colorado | |||||
| Arizona & California | |||||
| Montana, Idaho, Utah, & North Dakota | |||||
| Alabama, Alaska, Arkansas, Connecticut, Florida, Georgia, Indiana, Kentucky, Louisiana, Massachusetts, Michigan, Minnesota, Missouri, New Jersey, New York, Pennsylvania, South Carolina, Tennessee, Texas, Virginia, & Wisconsin | |||||
The Company had no no
The Company has assessed the need for a valuation allowance and determined that a valuation allowance was no
Note 17. Accumulated Other Comprehensive Income (Loss)
The following table illustrates the activity within accumulated other comprehensive income (loss) by component, net of tax:
| (Dollars in thousands) | Gains (Losses) on Available-For-Sale Debt Securities | (Losses) Gains on Derivatives Used for Cash Flow Hedges | Total | ||||||||||||||
| Balance at January 1, 2018 | $ | ( | ( | ||||||||||||||
| Other comprehensive (loss) income before reclassifications | ( | ( | |||||||||||||||
| Reclassification adjustments for losses included in net income | |||||||||||||||||
| Net current period other comprehensive (loss) income | ( | ( | |||||||||||||||
| Balance at December 31, 2018 | $ | ( | ( | ( | |||||||||||||
| Other comprehensive income (loss) before reclassifications | ( | ||||||||||||||||
| Reclassification adjustments for (gains) losses included in net income | ( | ( | |||||||||||||||
| Net current period other comprehensive income | |||||||||||||||||
| Balance at December 31, 2019 | $ | ||||||||||||||||
| Other comprehensive income (loss) before reclassifications | ( | ||||||||||||||||
| Reclassification adjustments for gains included in net income | ( | ( | |||||||||||||||
| Net current period other comprehensive income (loss) | ( | ||||||||||||||||
| Balance at December 31, 2020 | $ | ( | |||||||||||||||
112
Note 18. Earnings Per Share
Basic earnings per share is computed by dividing net income by the weighted-average number of shares of common stock outstanding during the period presented. Diluted earnings per share is computed by including the net increase in shares as if dilutive outstanding restricted stock units were vested and stock options were exercised, using the treasury stock method.
Basic and diluted earnings per share has been computed based on the following:
| Years ended | |||||||||||||||||
| (Dollars in thousands, except per share data) | December 31, 2020 | December 31, 2019 | December 31, 2018 | ||||||||||||||
| Net income available to common stockholders, basic and diluted | $ | ||||||||||||||||
| Average outstanding shares - basic | |||||||||||||||||
| Add: dilutive restricted stock units and stock options | |||||||||||||||||
| Average outstanding shares - diluted | |||||||||||||||||
| Basic earnings per share | $ | ||||||||||||||||
| Diluted earnings per share | $ | ||||||||||||||||
Restricted stock units and stock options excluded from the diluted average outstanding share calculation 1 | |||||||||||||||||
______________________________
1 Anti-dilution occurs when the unrecognized compensation cost per share of a restricted stock units or the exercise price of a stock option exceeds the market price of the Company’s stock.
Note 19. Parent Holding Company Information (Condensed)
The following condensed financial information was the unconsolidated information for the parent holding company:
Condensed Statements of Financial Condition
| (Dollars in thousands) | December 31, 2020 | December 31, 2019 | |||||||||
| Assets | |||||||||||
| Cash on hand and in banks | $ | ||||||||||
| Interest bearing cash deposits | |||||||||||
| Cash and cash equivalents | |||||||||||
| Other assets | |||||||||||
| Investment in subsidiaries | |||||||||||
| Total assets | $ | ||||||||||
| Liabilities and Stockholders’ Equity | |||||||||||
| Dividends payable | $ | ||||||||||
| Subordinated debentures | |||||||||||
| Other liabilities | |||||||||||
| Total liabilities | |||||||||||
| Common stock | |||||||||||
| Paid-in capital | |||||||||||
| Retained earnings | |||||||||||
| Accumulated other comprehensive income (loss) | |||||||||||
| Total stockholders’ equity | |||||||||||
| Total liabilities and stockholders’ equity | $ | ||||||||||
113
Condensed Statements of Operations and Comprehensive Income
| Years ended | |||||||||||||||||
| (Dollars in thousands) | December 31, 2020 | December 31, 2019 | December 31, 2018 | ||||||||||||||
| Income | |||||||||||||||||
| Dividends from subsidiaries | $ | ||||||||||||||||
| Intercompany charges for services | |||||||||||||||||
| Other income | |||||||||||||||||
| Total income | |||||||||||||||||
| Expenses | |||||||||||||||||
| Compensation and employee benefits | |||||||||||||||||
| Other operating expenses | |||||||||||||||||
| Total expenses | |||||||||||||||||
Income before income tax benefit and equity in undistributed net income of subsidiaries | |||||||||||||||||
| Income tax benefit | |||||||||||||||||
Income before equity in undistributed net income of subsidiaries | |||||||||||||||||
| Equity in undistributed net income of subsidiaries | |||||||||||||||||
| Net Income | $ | ||||||||||||||||
| Comprehensive Income | $ | ||||||||||||||||
Condensed Statements of Cash Flows
| Years ended | |||||||||||||||||
| (Dollars in thousands) | December 31, 2020 | December 31, 2019 | December 31, 2018 | ||||||||||||||
| Operating Activities | |||||||||||||||||
| Net income | $ | ||||||||||||||||
Adjustments to reconcile net income to net cash provided by operating activities: | |||||||||||||||||
| Subsidiary income in excess of dividends distributed | ( | ( | ( | ||||||||||||||
| Stock-based compensation, net of tax benefits | |||||||||||||||||
| Net change in other assets and other liabilities | ( | ( | |||||||||||||||
| Net cash provided by operating activities | |||||||||||||||||
| Investing Activities | |||||||||||||||||
| Net additions of premises and equipment | ( | ( | ( | ||||||||||||||
| Proceeds from sale of marketable equity securities | |||||||||||||||||
| Equity contributions to subsidiaries | ( | ( | ( | ||||||||||||||
| Net cash used in investing activities | ( | ( | ( | ||||||||||||||
| Financing Activities | |||||||||||||||||
| Net decrease in other borrowed funds | ( | ||||||||||||||||
| Cash dividends paid | ( | ( | ( | ||||||||||||||
| Tax withholding payments for stock-based compensation | ( | ( | ( | ||||||||||||||
| Proceeds from stock option exercises | |||||||||||||||||
| Net cash used in financing activities | ( | ( | ( | ||||||||||||||
| Net increase (decrease) in cash, cash equivalents and restricted cash | ( | ||||||||||||||||
| Cash, cash equivalents and restricted cash at beginning of period | |||||||||||||||||
| Cash, cash equivalents and restricted cash at end of period | $ | ||||||||||||||||
114
Note 20. Unaudited Quarterly Financial Data (Condensed)
Summarized unaudited quarterly financial data is as follows:
| Quarters ended 2020 | |||||||||||||||||||||||
| (Dollars in thousands, except per share data) | March 31 | June 30 | September 30 | December 31 | |||||||||||||||||||
| Interest income | $ | ||||||||||||||||||||||
| Interest expense | |||||||||||||||||||||||
| Net interest income | |||||||||||||||||||||||
| Provision for credit losses | ( | ||||||||||||||||||||||
| Net interest income after provision for credit losses | |||||||||||||||||||||||
| Non-interest income | |||||||||||||||||||||||
| Non-interest expense | |||||||||||||||||||||||
| Income before income taxes | |||||||||||||||||||||||
| Federal and state income tax expense | |||||||||||||||||||||||
| Net income | $ | ||||||||||||||||||||||
| Basic earnings per share | $ | ||||||||||||||||||||||
| Diluted earnings per share | $ | ||||||||||||||||||||||
| Quarters ended 2019 | |||||||||||||||||||||||
| (Dollars in thousands, except per share data) | March 31 | June 30 | September 30 | December 31 | |||||||||||||||||||
| Interest income | $ | ||||||||||||||||||||||
| Interest expense | |||||||||||||||||||||||
| Net interest income | |||||||||||||||||||||||
| Provision for credit losses | |||||||||||||||||||||||
| Net interest income after provision for credit losses | |||||||||||||||||||||||
| Non-interest income | |||||||||||||||||||||||
| Non-interest expense | |||||||||||||||||||||||
| Income before income taxes | |||||||||||||||||||||||
| Federal and state income tax expense | |||||||||||||||||||||||
| Net income | $ | ||||||||||||||||||||||
| Basic earnings per share | $ | ||||||||||||||||||||||
| Diluted earnings per share | $ | ||||||||||||||||||||||
115
Note 21. Fair Value of Assets and Liabilities
Fair value is defined as the price that would be received to sell an asset or paid to transfer a liability in an orderly transaction between market participants at the measurement date. There is a fair value hierarchy which requires an entity to maximize the use of observable inputs and minimize the use of unobservable inputs when measuring fair value. The three levels of inputs that may be used to measure fair value are as follows:
Level 1 Quoted prices in active markets for identical assets or liabilities
Level 2 Observable inputs other than Level 1 prices, such as quoted prices for similar assets or liabilities; quoted prices in markets that are not active; or other inputs that are observable or can be corroborated by observable market data for substantially the full term of the assets or liabilities
Level 3 Unobservable inputs that are supported by little or no market activity and that are significant to the fair value of the assets or liabilities
Transfers in and out of Level 1 (quoted prices in active markets), Level 2 (significant other observable inputs) and Level 3 (significant unobservable inputs) are recognized on the actual transfer date. There were no
Recurring Measurements
The following is a description of the inputs and valuation methodologies used for assets and liabilities measured at fair value on a recurring basis, as well as the general classification of such assets and liabilities pursuant to the valuation hierarchy. There have been no significant changes in the valuation techniques during the period ended December 31, 2020.
Debt securities, available-for-sale. The fair value for available-for-sale debt securities is estimated by obtaining quoted market prices for identical assets, where available. If such prices are not available, fair value is based on independent asset pricing services and models, the inputs of which are market-based or independently sourced market parameters, including but not limited to, yield curves, interest rates, volatilities, market spreads, prepayments, defaults, recoveries, cumulative loss projections, and cash flows. Such securities are classified in Level 2 of the valuation hierarchy. Where Level 1 or Level 2 inputs are not available, such securities are classified as Level 3 within the hierarchy.
Fair value determinations of available-for-sale debt securities are the responsibility of the Company’s corporate accounting and treasury departments. The Company obtains fair value estimates from independent third party vendors on a monthly basis. The vendors’ pricing system methodologies, procedures and system controls are reviewed to ensure they are appropriately designed and operating effectively. The Company reviews the vendors’ inputs for fair value estimates and the recommended assignments of levels within the fair value hierarchy. The review includes the extent to which markets for debt securities are determined to have limited or no activity, or are judged to be active markets. The Company reviews the extent to which observable and unobservable inputs are used as well as the appropriateness of the underlying assumptions about risk that a market participant would use in active markets, with adjustments for limited or inactive markets. In considering the inputs to the fair value estimates, the Company places less reliance on quotes that are judged to not reflect orderly transactions, or are non-binding indications. In assessing credit risk, the Company reviews payment performance, collateral adequacy, third party research and analyses, credit rating histories and issuers’ financial statements. For those markets determined to be inactive or limited, the valuation techniques used are models for which management has verified that discount rates are appropriately adjusted to reflect illiquidity and credit risk.
Loans held for sale, at fair value. Loans held for sale measured at fair value, for which an active secondary market and readily available market prices exist, are initially valued at the transaction price and are subsequently valued by using quoted prices for similar assets, adjusted for specific attributes of that loan or other observable market data, such as outstanding commitments from third party investors. Loans held for sale measured at fair value are classified within Level 2. Included in gain on sale of loans were net losses of $5,368,000 , net gains of $661,000 and net gains of $155,000 for the years ended December 31, 2020, 2019 and 2018, respectively, from the changes in fair value of loans held for sale measured at fair value. Electing to measure loans held for sale at fair value reduces certain timing differences and better matches changes in fair value of these assets with changes in the value of the derivative instruments used to economically hedge them without the burden of complying with the requirements for hedge accounting.
Loan interest rate lock commitments. Fair value estimates for loan interest rate lock commitments were based upon the estimated sales price, origination fees, direct costs, interest rate changes, etc. and were obtained from an independent third party. The components of the valuation were observable or could be corroborated by observable market data and, therefore, were classified within Level 2 of the valuation hierarchy.
116
Forward commitments to sell TBA securities. Forward commitments to sell TBA securities are used to economically hedge the interest rate risk associated with certain loan commitments. The fair value estimates for the TBA commitments were based upon the estimated sale of the TBA hedge obtained from an independent third party. The components of the valuation were observable or could be corroborated by observable market data and, therefore, were classified within Level 2 of the valuation hierarchy.
Interest rate cap derivative financial instruments. Fair value estimates for interest rate cap derivative financial instruments were based upon the discounted cash flows of known payments plus the option value of each caplet which incorporates market rate forecasts and implied market volatilities. The components of the valuation were observable or could be corroborated by observable market data and, therefore, were classified within Level 2 of the valuation hierarchy. The Company also obtained and compared the reasonableness of the pricing from independent third party valuations.
The following tables disclose the fair value measurement of assets and liabilities measured at fair value on a recurring basis:
| Fair Value Measurements At the End of the Reporting Period Using | |||||||||||||||||||||||
| (Dollars in thousands) | Fair Value December 31, 2020 | Quoted Prices in Active Markets for Identical Assets (Level 1) | Significant Other Observable Inputs (Level 2) | Significant Unobservable Inputs (Level 3) | |||||||||||||||||||
| Debt securities, available-for-sale | |||||||||||||||||||||||
| U.S. government and federal agency | $ | ||||||||||||||||||||||
| U.S. government sponsored enterprises | |||||||||||||||||||||||
| State and local governments | |||||||||||||||||||||||
| Corporate bonds | |||||||||||||||||||||||
| Residential mortgage-backed securities | |||||||||||||||||||||||
| Commercial mortgage-backed securities | |||||||||||||||||||||||
| Loans held for sale, at fair value | |||||||||||||||||||||||
| Interest rate caps | |||||||||||||||||||||||
| Interest rate locks | |||||||||||||||||||||||
Total assets measured at fair value on a recurring basis | $ | ||||||||||||||||||||||
| TBA hedge | $ | ||||||||||||||||||||||
Total liabilities measured at fair value on a recurring basis | $ | ||||||||||||||||||||||
117
| Fair Value Measurements At the End of the Reporting Period Using | |||||||||||||||||||||||
| (Dollars in thousands) | Fair Value December 31, 2019 | Quoted Prices in Active Markets for Identical Assets (Level 1) | Significant Other Observable Inputs (Level 2) | Significant Unobservable Inputs (Level 3) | |||||||||||||||||||
| Debt securities, available-for-sale | |||||||||||||||||||||||
| U.S. government and federal agency | $ | ||||||||||||||||||||||
| U.S. government sponsored enterprises | |||||||||||||||||||||||
| State and local governments | |||||||||||||||||||||||
| Corporate bonds | |||||||||||||||||||||||
| Residential mortgage-backed securities | |||||||||||||||||||||||
| Commercial mortgage-backed securities | |||||||||||||||||||||||
| Loans held for sale, at fair value | |||||||||||||||||||||||
| Interest rate locks | |||||||||||||||||||||||
Total assets measured at fair value on a recurring basis | $ | ||||||||||||||||||||||
| TBA hedge | $ | ||||||||||||||||||||||
Total liabilities measured at fair value on a recurring basis | $ | ||||||||||||||||||||||
Non-recurring Measurements
The following is a description of the inputs and valuation methodologies used for assets recorded at fair value on a non-recurring basis, as well as the general classification of such assets pursuant to the valuation hierarchy. There have been no significant changes in the valuation techniques during the period ended December 31, 2020.
Other real estate owned. OREO is initially recorded at fair value less estimated cost to sell, establishing a new cost basis. OREO is subsequently accounted for at lower of cost or fair value less estimated cost to sell. Estimated fair value of OREO is based on appraisals or evaluations (new or updated). OREO is classified within Level 3 of the fair value hierarchy.
Collateral-dependent loans, net of ACL. Fair value estimates of collateral-dependent loans that are individually reviewed are based on the fair value of the collateral, less estimated cost to sell. Collateral-dependent individually reviewed loans are classified within Level 3 of the fair value hierarchy.
The Company’s credit department reviews appraisals for OREO and collateral-dependent loans, giving consideration to the highest and best use of the collateral. The appraisal or evaluation (new or updated) is considered the starting point for determining fair value. The valuation techniques used in preparing appraisals or evaluations (new or updated) include the cost approach, income approach, sales comparison approach, or a combination of the preceding valuation techniques. The key inputs used to determine the fair value of the collateral-dependent loans and OREO include selling costs, discounted cash flow rate or capitalization rate, and adjustment to comparables. Valuations and significant inputs obtained by independent sources are reviewed by the Company for accuracy and reasonableness. The Company also considers other factors and events in the environment that may affect the fair value. The appraisals or evaluations (new or updated) are reviewed at least quarterly and more frequently based on current market conditions, including deterioration in a borrower’s financial condition and when property values may be subject to significant volatility. After review and acceptance of the collateral appraisal or evaluation (new or updated), adjustments to the impaired loan or OREO may occur. The Company generally obtains appraisals or evaluations (new or updated) annually.
118
The following tables disclose the fair value measurement of assets with a recorded change during the period resulting from re-measuring the assets at fair value on a non-recurring basis:
| Fair Value Measurements At the End of the Reporting Period Using | |||||||||||||||||||||||
| (Dollars in thousands) | Fair Value December 31, 2020 | Quoted Prices in Active Markets for Identical Assets (Level 1) | Significant Other Observable Inputs (Level 2) | Significant Unobservable Inputs (Level 3) | |||||||||||||||||||
| Other real estate owned | $ | ||||||||||||||||||||||
| Collateral-dependent impaired loans, net of ACL | |||||||||||||||||||||||
Total assets measured at fair value on a non-recurring basis | $ | ||||||||||||||||||||||
| Fair Value Measurements At the End of the Reporting Period Using | |||||||||||||||||||||||
| (Dollars in thousands) | Fair Value December 31, 2019 | Quoted Prices in Active Markets for Identical Assets (Level 1) | Significant Other Observable Inputs (Level 2) | Significant Unobservable Inputs (Level 3) | |||||||||||||||||||
| Other real estate owned | $ | ||||||||||||||||||||||
| Collateral-dependent impaired loans, net of ACL | |||||||||||||||||||||||
Total assets measured at fair value on a non-recurring basis | $ | ||||||||||||||||||||||
Non-recurring Measurements Using Significant Unobservable Inputs (Level 3)
The following tables present additional quantitative information about assets measured at fair value on a non-recurring basis and for which the Company has utilized Level 3 inputs to determine fair value:
| Fair Value | Quantitative Information about Level 3 Fair Value Measurements | ||||||||||||||||||||||
| (Dollars in thousands) | December 31, 2020 | Valuation Technique | Unobservable Input | Range (Weighted- Average) 1 | |||||||||||||||||||
| Other real estate owned | $ | Sales comparison approach | Selling costs | ||||||||||||||||||||
| Collateral-dependent impaired loans, net of ACL | $ | Cost approach | Selling costs | ||||||||||||||||||||
| Sales comparison approach | Selling costs | ||||||||||||||||||||||
| Adjustment to comparables | |||||||||||||||||||||||
| Combined approach | Selling costs | ||||||||||||||||||||||
| Discount rate | |||||||||||||||||||||||
| $ | |||||||||||||||||||||||
119
| Fair Value | Quantitative Information about Level 3 Fair Value Measurements | ||||||||||||||||||||||
| (Dollars in thousands) | December 31, 2019 | Valuation Technique | Unobservable Input | Range (Weighted- Average) 1 | |||||||||||||||||||
| Other real estate owned | $ | Sales comparison approach | Selling costs | ||||||||||||||||||||
| Collateral-dependent impaired loans, net of ACL | $ | Cost approach | Selling costs | ||||||||||||||||||||
| Sales comparison approach | Adjustment to comparables | ||||||||||||||||||||||
| $ | |||||||||||||||||||||||
______________________________
1 The range for selling cost inputs represents reductions to the fair value of the assets.
Fair Value of Financial Instruments
The following tables present the carrying amounts, estimated fair values and the level within the fair value hierarchy of the Company’s financial instruments not carried at fair value. Receivables and payables due in one year or less, equity securities without readily determinable fair values and deposits with no defined or contractual maturities are excluded. There have been no significant changes in the valuation techniques during the period ended December 31, 2020.
Cash and cash equivalents: fair value is estimated at book value.
Debt securities, held-to-maturity: fair value for held-to-maturity debt securities is estimated in the same manner as available-for sale debt securities, which is described above.
Loans receivable, net of ACL: The loans were fair valued on an individual basis, with consideration given to the loans' underlying characteristics, including account types, remaining terms and balance, interest rates, past delinquencies, current market rates, etc. The model utilizes a discounted cash flow approach to estimate the fair value of the loans using various assumptions such as prepayment speeds, projected default probabilities, losses given defaults, etc. The discounted cash flow approach models the credit losses directly in the projected cash flows. The model applies various assumptions regarding credit, interest, and prepayment risks for the loans based on loan types, payment types and fixed or variable classifications.
Time Deposits: fair value of term deposits is estimated by discounting the future cash flows using rates of similar deposits with similar maturities. The market rates used were obtained from an independent third party based on current rates offered by the Company’s regional competitors.
Federal Home Loan Bank advances: fair value of non-callable FHLB advances is estimated by discounting the future cash flows using rates of similar advances with similar maturities. Such rates were obtained from current rates offered by FHLB.
Securities sold under agreements to repurchase and other borrowed funds: fair value of term repurchase agreements and other term borrowings is estimated based on current repurchase rates and borrowing rates currently available to the Company for repurchases and borrowings with similar terms and maturities. The estimated fair value for overnight repurchase agreements and other borrowings is book value.
Subordinated debentures: fair value of the subordinated debt is estimated by discounting the estimated future cash flows using current estimated market rates obtained from an independent third party.
Off-balance sheet financial instruments: unused lines of credit and letters of credit represent the principal categories of off-balance sheet financial instruments. The fair value of commitments is based on fees currently charged to enter into similar agreements, taking into account the remaining terms of the agreements and the counterparties’ credit standing. The fair value of unused lines of credit and letters of credit is not material; therefore, such commitments are not included in the following tables.
120
| Fair Value Measurements At the End of the Reporting Period Using | |||||||||||||||||||||||
| (Dollars in thousands) | Carrying Amount December 31, 2020 | Quoted Prices in Active Markets for Identical Assets (Level 1) | Significant Other Observable Inputs (Level 2) | Significant Unobservable Inputs (Level 3) | |||||||||||||||||||
| Financial assets | |||||||||||||||||||||||
| Cash and cash equivalents | $ | ||||||||||||||||||||||
| Debt securities, held-to-maturity | |||||||||||||||||||||||
| Loans receivable, net of ACL | |||||||||||||||||||||||
| Total financial assets | $ | ||||||||||||||||||||||
| Financial liabilities | |||||||||||||||||||||||
| Term deposits | $ | ||||||||||||||||||||||
Repurchase agreements and other borrowed funds | |||||||||||||||||||||||
| Subordinated debentures | |||||||||||||||||||||||
| Total financial liabilities | $ | ||||||||||||||||||||||
| Fair Value Measurements At the End of the Reporting Period Using | |||||||||||||||||||||||
| (Dollars in thousands) | Carrying Amount December 31, 2019 | Quoted Prices in Active Markets for Identical Assets (Level 1) | Significant Other Observable Inputs (Level 2) | Significant Unobservable Inputs (Level 3) | |||||||||||||||||||
| Financial assets | |||||||||||||||||||||||
| Cash and cash equivalents | $ | ||||||||||||||||||||||
| Debt securities, held-to-maturity | |||||||||||||||||||||||
| Loans receivable, net of ACL | |||||||||||||||||||||||
| Total financial assets | $ | ||||||||||||||||||||||
| Financial liabilities | |||||||||||||||||||||||
| Term deposits | $ | ||||||||||||||||||||||
| FHLB advances | |||||||||||||||||||||||
Repurchase agreements and other borrowed funds | |||||||||||||||||||||||
| Subordinated debentures | |||||||||||||||||||||||
| Total financial liabilities | $ | ||||||||||||||||||||||
121
Note 22. Commitments and Contingent Liabilities
The Company is a party to financial instruments with off-balance sheet risk in the normal course of business to meet the financing needs of its customers. These financial instruments include commitments to extend credit and letters of credit, and involve, to varying degrees, elements of credit risk. The Company’s exposure to credit loss in the event of nonperformance by the other party to the financial instrument for commitments to extend credit is represented by the contractual amount of those instruments. The Company uses the same credit policies in making off-balance sheet commitments and conditional obligations as it does for on-balance sheet instruments.
The Company had the following outstanding commitments:
| (Dollars in thousands) | December 31, 2020 | December 31, 2019 | |||||||||
| Unused lines of credit | $ | ||||||||||
| Letters of credit | |||||||||||
| Total outstanding commitments | $ | ||||||||||
The Company is a defendant in legal proceedings arising in the normal course of business. In the opinion of management, the disposition of pending litigation will not have a material affect on the Company’s consolidated financial position, results of operations or liquidity.
122
Note 23. Mergers and Acquisitions
The Company has completed the following acquisitions during the last two years:
•State Bank Corp. and its wholly-owned subsidiary, State Bank of Arizona
•Heritage Bancorp and its wholly-owned subsidiary, Heritage Bank of Nevada
•FNB Bancorp and its wholly-owned subsidiary, The First National Bank of Layton
The assets and liabilities of SBAZ, Heritage, and FNB were recorded on the Company’s consolidated statements of financial condition at their estimated fair values as of their acquisition dates and their results of operations have been included in the Company’s consolidated statements of operations since those dates. The following table discloses the fair value estimates of the consideration transferred, the total identifiable net assets acquired and the resulting goodwill arising from the acquisitions:
| (Dollars in thousands) | SBAZ February 29, 2020 | Heritage July 31, 2019 | FNB April 30, 2019 | ||||||||||||||
| Fair value of consideration transferred | |||||||||||||||||
| Fair value of Company shares issued | |||||||||||||||||
| Cash consideration | |||||||||||||||||
| Total fair value of consideration transferred | |||||||||||||||||
Recognized amounts of identifiable assets acquired and liabilities assumed | |||||||||||||||||
| Identifiable assets acquired | |||||||||||||||||
| Cash and cash equivalents | |||||||||||||||||
| Debt securities | |||||||||||||||||
| Loans receivable, net of ACL | |||||||||||||||||
Core deposit intangible 1 | |||||||||||||||||
| Accrued income and other assets | |||||||||||||||||
| Total identifiable assets acquired | |||||||||||||||||
| Liabilities assumed | |||||||||||||||||
| Deposits | |||||||||||||||||
Borrowings | |||||||||||||||||
| Accrued expenses and other liabilities | |||||||||||||||||
| Total liabilities assumed | |||||||||||||||||
| Total identifiable net assets | |||||||||||||||||
| Goodwill recognized | |||||||||||||||||
______________________________
1 The core deposit intangible for each acquisition was determined to have an estimated life of 10 .
123
2020 Acquisitions
On February 29, 2020, the Company acquired 100 percent of the outstanding common stock of State Bank Corp. and its wholly-owned subsidiary, State Bank of Arizona, a community bank based in Lake Havasu City, Arizona. SBAZ was merged into the Company and its banking operations were incorporated into The Foothills Bank division of Glacier Bank, continuing to provide banking services to individuals and businesses in Arizona with locations in Bullhead City, Cottonwood, Kingman, Lake Havasu City, Phoenix, Prescott Valley and Prescott. The preliminary value of the SBAZ acquisition was $125,854,000 and resulted in the Company issuing 3,007,044 shares of its common stock and paying $13,721,000 in cash in exchange for all of SBAZ’s outstanding common stock shares. The fair value of the Company shares issued was determined on the basis of the closing market price of the Company’s common stock on the February 29, 2020 acquisition date. The excess of the preliminary fair value of consideration transferred over total identifiable net assets was recorded as goodwill. The goodwill arising from the acquisition consists largely of the synergies and economies of scale expected from combining the operations of the Company and SBAZ. None of the goodwill is deductible for income tax purposes as the acquisition was accounted for as a tax-free exchange.
The fair values of SBAZ assets acquired include loans with fair value of $451,702,000 , respectively. The gross principal and contractual interest due under the contracts was $452,510,000 . The Company evaluated the principal and contractual interest due at the acquisition date and determined that insignificant amounts were not expected to be collectible.
The Company incurred $4,489,000 of expenses in connection with the acquisition, respectively, during the year ended December 31, 2020. Mergers and acquisition expenses are included in other expense in the Company's consolidated statements of operations and consist of third-party costs, conversion costs and employee retention and severance expenses.
Total income consisting of net interest income and non-interest income of the acquired operations of SBAZ was approximately $31,606,000 and net income was approximately $8,524,000 from February 29, 2020 to December 31, 2020. The following unaudited pro forma summary presents consolidated information of the Company as if the acquisition had occurred on January 1, 2019:
| Year ended | |||||||||||
| (Dollars in thousands) | December 31, 2020 | December 31, 2019 | |||||||||
| Net interest income and non-interest income | |||||||||||
| Net income | |||||||||||
2019 Acquisitions
On July 31, 2019, the Company acquired 100 percent of the outstanding common stock of Heritage Bancorp and its wholly-owned subsidiary, Heritage Bank of Nevada, a community bank based in Reno, Nevada. Heritage provides banking services to individuals and businesses throughout northern Nevada with locations in Carson City, Gardnerville, Reno and Sparks. The acquisition expanded the Company’s franchise footprint into Northern Nevada. Heritage operates as a new division of the Bank under its existing name and management team. The Heritage acquisition was valued at $245,805,000 and resulted in the Company issuing 5,473,276 shares of its common stock and paying $16,420,000 in cash in exchange for all of Heritage’s outstanding common stock shares. The fair value of the Company shares issued was determined on the basis of the closing market price of the Company’s common stock on the July 31, 2019 acquisition date. The excess of the fair value of consideration transferred over total identifiable net assets was recorded as goodwill. The goodwill arising from the acquisition consists largely of the synergies and economies of scale expected from combining the operations of the Company and Heritage. None of the goodwill is deductible for income tax purposes as the acquisition was accounted for as a tax-free exchange.
On April 30, 2019, the Company acquired 100 percent of the outstanding common stock of FNB Bancorp and its wholly-owned subsidiary, The First National Bank of Layton, a community bank based in Layton, Utah. FNB provides banking services to individuals and businesses throughout Utah with locations in Layton, Bountiful, Clearfield and Draper. The acquisition expanded the Company’s presence in Utah and sets the stage for future growth. The branches of FNB, along with the Bank’s branches operating in Utah, operate as a new division of the Bank under the name “First Community Bank Utah, division of Glacier Bank.” The FNB acquisition was valued at $87,157,000 and resulted in the Company issuing 2,046,341 shares of its common stock. The fair value of the Company shares issued was determined on the basis of the closing market price of the Company’s common stock on the April 30, 2019 acquisition date. The excess of the fair value of consideration transferred over total identifiable net assets was recorded as goodwill. The goodwill arising from the acquisition consists largely of the synergies and economies of scale expected from combining the operations of the Company and FNB. None of the goodwill is deductible for income tax purposes as the acquisition was accounted for as a tax-free exchange.
The fair values of the Heritage and FNB assets acquired include loans with fair values of $615,279,000 and $245,485,000 , respectively. The gross principal and contractual interest due under the Heritage and FNB contracts was $617,214,000 and
124
$248,226,000 , respectively. The Company evaluated the principal and contractual interest due at each of the acquisition dates and determined that insignificant amounts were not expected to be collectible.
The Company incurred $3,032,000 and $4,979,000 of expenses in connection with the Heritage and FNB acquisitions, respectively, during the year ended December 31, 2019. Mergers and acquisition expenses are included in other expense in the Company's consolidated statements of operations and consist of third-party costs, conversion costs and employee retention and severance expenses.
Total income consisting of net interest income and non-interest income of the acquired operations of Heritage was approximately $15,506,000 and net income was approximately $2,286,000 from July 31, 2019 to December 31, 2019. Total income consisting of net interest income and non-interest income of the acquired operations of FNB was approximately $12,607,000 and net income was approximately $249,000 from April 30, 2019 to December 31, 2019. The following unaudited pro forma summary presents consolidated information of the Company as if the Heritage and FNB acquisitions had occurred on January 1, 2018:
| Year ended | |||||||||||
| (Dollars in thousands) | December 31, 2019 | December 31, 2018 | |||||||||
| Net interest income and non-interest income | |||||||||||
| Net income | |||||||||||
125
Item 9. Changes in and Disagreements with Accountants on Accounting and Financial Disclosure
There have been no changes or disagreements with accountants on accounting and financial disclosure.
Item 9A. Controls and Procedures
Evaluation of Disclosure Controls and Procedures
An evaluation was carried out under the supervision and with the participation of the Company’s management, including the CEO and Chief Financial Officer (“CFO”), of the effectiveness of the disclosure controls and procedures. Based on that evaluation, the CEO and CFO have concluded that as of the end of the period covered by this report, the disclosure controls and procedures are effective to provide reasonable assurance that information required to be disclosed by the Company in reports that are filed or submitted under the Securities Exchange Act of 1934 are recorded, processed, summarized and timely reported as provided in the SEC’s rules and forms. As a result of this evaluation, there were no significant changes in the internal control over financial reporting during the year ended December 31, 2020 that have materially affected, or are reasonable likely to materially affect, the internal control over financial reporting.
Management’s Report on Internal Control Over Financial Reporting
Management is responsible for establishing and maintaining effective internal control over financial reporting as it relates to its financial statements presented in conformity with GAAP. The Company’s internal control system was designed to provide reasonable assurance to the Company’s management and Board of Directors regarding the preparation and fair presentation of published financial statements in accordance with GAAP. Internal control over financial reporting includes self monitoring mechanisms and actions are taken to correct deficiencies as they are identified.
There are inherent limitations in any internal control, no matter how well designed, misstatements due to error or fraud may occur and not be detected, including the possibility of circumvention or overriding of controls. Accordingly, even an effective internal control system can provide only reasonable assurance with respect to financial statement preparation. Further, because of changes in conditions, the effectiveness of an internal control system may vary over time.
Management assessed its internal control structure over financial reporting as of December 31, 2020. This assessment was based on criteria for effective internal control over financial reporting described in the “2013 Internal Control – Integrated Framework” issued by the Committee of Sponsoring Organizations of the Treadway Commission. Based on this assessment, management asserts that the Company maintained effective internal control over financial reporting as it relates to its financial statements presented in conformity with GAAP.
BKD, LLP, the independent registered public accounting firm that audited the financial statements for the year ended December 31, 2020, has issued an attestation report on the Company’s internal control over financial reporting. Such attestation report expresses an unqualified opinion on the effectiveness of the Company’s internal control over financial reporting as of December 31, 2020 and is included in “Item 8. Financial Statements and Supplementary Data.”
Item 9B. Other Information
None
126
PART III
Item 10. Directors, Executive Officers and Corporate Governance
Information regarding “Directors and Executive Officers” is set forth under the headings “Election of Directors” and “Management – Named Executive Officers Who Are Not Directors” of the Company’s 2021 Annual Meeting Proxy Statement (“Proxy Statement”) and is incorporated herein by reference.
Information regarding “Compliance with Section 16(a) of the Exchange Act” is set forth under the section “Delinquent Section 16(a) Reports” of the Company’s Proxy Statement and is incorporated herein by reference.
Information regarding the Company’s Corporate Governance, including the Audit Committee, is set forth under the headings of “Corporate Governance” and “Report of Audit Committee” in the Company’s Proxy Statement and is incorporated herein by reference.
The Company has adopted a Code of Ethics for Senior Financial Officers, a Director Code of Ethics and a Code of Ethics and Conduct applicable to all employees. Each of the codes is available electronically by visiting the Company’s website at www.glacierbancorp.com and clicking on “Governance Documents” or by writing to: Glacier Bancorp, Inc., Corporate Secretary, 49 Commons Loop, Kalispell, Montana 59901. Waivers of the applicable code for directors or executive officers are required to be approved by the Company’s Board of Directors. Information regarding any such waivers will be disclosed on a current report on Form 8-K within four business days after the waiver is approved.
Item 11. Executive Compensation
Information regarding “Executive Compensation” is set forth under the headings “Compensation of Directors,” “Executive Compensation,” “Compensation Discussion and Analysis” and “Executive Compensation Tables” of the Company’s Proxy Statement and is incorporated herein by reference.
Information regarding the “Compensation Committee Report” is set forth under the heading “Report of Compensation Committee” of the Company’s Proxy Statement and is incorporated herein by reference.
Item 12. Security Ownership of Certain Beneficial Owners and Management and Related Stockholder Matters
Information regarding “Security Ownership of Certain Beneficial Owners and Management and Related Stockholder Matters” is set forth under the headings “Voting Securities and Principal Holders Thereof,” “Compensation Discussion and Analysis,” “Compensation of Directors” and “Director Equity Compensation” of the Company’s Proxy Statement and is incorporated herein by reference.
Item 13. Certain Relationships and Related Transactions, and Director Independence
Information regarding “Certain Relationships and Related Transactions, and Director Independence” is set forth under the headings “Transactions with Management” and “Corporate Governance – Director Independence” of the Company’s Proxy Statement and is incorporated herein by reference.
Item 14. Principal Accounting Fees and Services
Information regarding “Principal Accounting Fees and Services” is set forth under the heading “Auditors – Fees Paid to Independent Registered Public Accounting Firm” of the Company’s Proxy Statement and is incorporated herein by reference.
127
PART IV
Item 15. Exhibits, Financial Statement Schedules
List of Financial Statements and Financial Statement Schedules
(a) The following documents are filed as a part of this report:
(1) Financial Statements and
(2) Financial Statement schedules required to be filed by Item 8 of this report.
(3) The following exhibits are required by Item 601 of Regulation S-K and are included as part of this Form 10-K:
| Exhibit No. | Description | |||||||
3(a) 1 | ||||||||
3(b) 1 | ||||||||
4(a) 1 | ||||||||
10(a) 1,2 | ||||||||
10(b) 1,2 | ||||||||
10(c) 1,2 | ||||||||
10(d) 1,2 | ||||||||
10(e) 1,2 | ||||||||
10(f) 1,2 | ||||||||
10(g) 1,2 | ||||||||
10(h) 1,2 | ||||||||
10(i) 1,2 | ||||||||
10(j) 1,2 | ||||||||
10(k) 1,2 | ||||||||
10(l) 1,2 | ||||||||
10(m) 1,2 | ||||||||
| 21 | Subsidiaries of the Company (See Item 1. Business, “General”) | |||||||
| 23 | ||||||||
| 31.1 | ||||||||
| 31.2 | ||||||||
| 32 | ||||||||
128
| Exhibit No. | Description | |||||||
| 101.INS | XBRL Instance Document - The instance document does not appear in the interactive data file because its XBRL tags are embedded within the inline XBRL document. | |||||||
| 101.SCH | XBRL Taxonomy Extension Schema Document | |||||||
| 101.CAL | XBRL Taxonomy Extension Calculation Linkbase Document | |||||||
| 101.DEF | XBRL Taxonomy Extension Definition Linkbase Document | |||||||
| 101.LAB | XBRL Taxonomy Extension Labels Linkbase Document | |||||||
| 101.PRE | XBRL Taxonomy Extension Presentation Linkbase Document | |||||||
| 104 | Cover Page Interactive Data File (formatted as Inline XBRL and contained in Exhibit 101) | |||||||
______________________________
1 Exhibit has been previously filed with the United States Securities and Exchange Commission and is incorporated herein as an exhibit by reference to the prior filing.
2 Compensatory Plan or Arrangement
All other financial statement schedules required by Regulation S-X are omitted because they are not applicable, not material or because the information is included in the consolidated financial statements or related notes.
Item 16. Form 10-K Summary
None
129
SIGNATURES
Pursuant to the requirements of Section 13 or 15(d) of the Securities Exchange Act of 1934, the Registrant has duly caused this report to be signed on its behalf by the undersigned, thereunto duly authorized on March 1, 2021.
| GLACIER BANCORP, INC. | |||||||||||
| By: /s/ Randall M. Chesler | |||||||||||
| Randall M. Chesler | |||||||||||
| President and CEO | |||||||||||
Pursuant to the requirements of the Securities Exchange Act of 1934, this report has been signed below on March 1, 2021, by the following persons on behalf of the registrant and in the capacities indicated.
| /s/ Randall M. Chesler | President, CEO, and Director | |||||||
| Randall M. Chesler | (Principal Executive Officer) | |||||||
| /s/ Ron J. Copher | Executive Vice President and CFO | |||||||
| Ron J. Copher | (Principal Financial and Accounting Officer) | |||||||
| Board of Directors | ||||||||
| /s/ Craig A. Langel | Chairman | |||||||
| Craig A. Langel | ||||||||
| /s/ David C. Boyles | Director | |||||||
| David C. Boyles | ||||||||
| /s/ Robert A. Cashell, Jr. | Director | |||||||
| Robert A. Cashell, Jr. | ||||||||
| /s/ Sherry L. Cladouhos | Director | |||||||
| Sherry L. Cladouhos | ||||||||
| /s/ James M. English | Director | |||||||
| James M. English | ||||||||
| /s/ Annie M. Goodwin | Director | |||||||
| Annie M. Goodwin | ||||||||
| /s/ Kristen L. Heck | Director | |||||||
| Kristen L. Heck | ||||||||
| /s/ Douglas J. McBride | Director | |||||||
| Douglas J. McBride | ||||||||
| /s/ John W. Murdoch | Director | |||||||
| John W. Murdoch | ||||||||
| /s/ George R. Sutton | Director | |||||||
| George R. Sutton | ||||||||
130
Serious News for Serious Traders! Try StreetInsider.com Premium Free!
You May Also Be Interested In
- Glacier Bancorp (GBCI) PT Lowered to $40 at Stephens
- ACNB Corporation Announces Second Quarter Cash Dividend
- Groupe Casino: BUT, Conforama, MDA Company, Casino Group and Intermarché end their technical goods purchasing partnership, Sirius Achats
Create E-mail Alert Related Categories
SEC FilingsSign up for StreetInsider Free!
Receive full access to all new and archived articles, unlimited portfolio tracking, e-mail alerts, custom newswires and RSS feeds - and more!
