

Form 10-K DATTO HOLDING CORP. For: Dec 31
 Tweet
Tweet Share
ShareUNITED STATES
SECURITIES AND EXCHANGE COMMISSION
Washington, D.C. 20549
FORM 10-K
| ANNUAL REPORT PURSUANT TO SECTION 13 OR 15(d) OF THE SECURITIES EXCHANGE ACT OF 1934 | |||||
For the fiscal year ended December 31 , 2020
OR
| TRANSITION REPORT PURSUANT TO SECTION 13 OR 15(d) OF THE SECURITIES EXCHANGE ACT OF 1934 | |||||
For the transition period from _____ to _____
Commission file number: 001-39637
(Exact name of registrant as specified in its charter)
(State or other jurisdiction of
incorporation)
(I.R.S. Employer
Identification No.)
(Address of principal executive offices and Zip Code)
(Registrant’s telephone number, including area code)
Not Applicable
(Former name or former address, if changed since last report.)
Securities registered pursuant to Section 12(b) of the Act:
| Title of each class | Trading Symbol(s) | Name of each exchange on which registered | ||||||||||||
Securities registered pursuant to Section 12(g) of the Act: None
Indicate by check mark if the registrant is a well-known seasoned issuer, as defined in Rule 405 of the Securities Act ☐ Yes ☒ No
Indicate by check mark if the registrant is not required to file reports pursuant to Section 13 or Section 15(d) of the Act. ☐ Yes ☒ No
Indicate by check mark whether the registrant: (1) has filed all reports required to be filed by Section 13 or 15(d) of the Securities Exchange Act of 1934 during the preceding 12 months (or for such shorter period that the registrant was required to file such reports), and (2) has been subject to such filing requirements for the past 90 days. ☒ Yes ☐ No
Indicate by check mark whether the registrant has submitted electronically every Interactive Data File required to be submitted pursuant to Rule 405 of Regulation S-T (§232.405 of this chapter) during the preceding 12 months (or for such shorter period that the registrant was required to submit such files). ☒ Yes ☐ No
Indicate by check mark whether the registrant is a large accelerated filer, an accelerated filer, a non-accelerated filer, a smaller reporting company or an emerging growth company. See the definitions of “large accelerated filer,” “accelerated filer”, “smaller reporting company” and “emerging growth company” in Rule 12b-2 of the Exchange Act.
Large accelerated filer ☐
Accelerated filer ☐
Smaller reporting company ☐
Emerging growth company ☒
If an emerging growth company, indicate by check mark if the registrant has elected not to use the extended transition period for complying with any new or revised financial accounting standards provided pursuant to Section 13(a) of the Exchange Act. ☐
Indicate by check mark whether the registrant has filed a report on and attestation to its management’s assessment of the effectiveness of its internal control over financial reporting under Section 404(b) of the Sarbanes-Oxley Act (15 U.S.C. 7262(b)) by the registered public accounting firm that prepared or issued its audit report. ☐
Indicate by check mark whether the registrant is a shell company (as defined in Rule 12b-2 of the Exchange Act). ☐ Yes ☒ No
The registrant was not a public company as of the last business day of its most recently completed second fiscal quarter and therefore, cannot calculate the aggregate market value of its common stock held by non-affiliates as of such date.
At February 26, 2021, there were 161,064,557 shares of the registrant’s Common Stock outstanding (excluding treasury shares of 362,126).
Documents Incorporated by Reference:
DATTO HOLDING CORP.
ANNUAL REPORT ON FORM 10-K
For the fiscal year ended December 31, 2020
TABLE OF CONTENTS
| Page | ||||||||
2
FORWARD-LOOKING STATEMENTS
This Annual Report on Form 10-K contains forward-looking statements that are subject to risks and uncertainties. All statements other than statements of historical fact included in this Annual Report on Form 10-K are forward-looking statements. Forward-looking statements give our current expectations and projections relating to our financial condition, results of operations, plans, objectives, future performance and business. You can identify forward-looking statements by the fact that they do not relate strictly to historical or current facts. These statements may include words such as “anticipate,” “estimate,” “expect,” “project,” “plan,” “intend,” “believe,” “may,” “will,” “should,” “can have,” “likely” and other words and terms of similar meaning in connection with any discussion of future operating or financial performance or other events. For example, all statements we make relating to our estimated and projected costs, expenditures, cash flows, growth rates and financial results or our plans and objectives for future operations, growth initiatives, or strategies are forward-looking statements. All forward-looking statements are subject to risks and uncertainties that may cause actual results to differ materially from those that we expected, including:
•the impact on our operations and financial condition from the effects of the current COVID-19 pandemic;
•our ability to effectively compete;
•fluctuations in our operating results;
•our ability to sustain cash flows and achieve profitability;
•our ability to attract new managed service provider (“MSP”) partners;
•our ability to sell additional products and subscriptions to our MSP partners;
•the recognition of revenue from our subscription offerings;
•the strength of the small and medium businesses (“SMB”) information technology ("IT") market;
•our ability to manage the ongoing growth of our business;
•the risks associated with our international operations;
•the impact of volatility in the global economy;
•the ability of our MSP partners to sell our products;
•the impact of natural disasters, terrorism or other catastrophic events;
•our ability to recruit, retain and develop key employees and management personnel;
•the impact of changes in SMBs’ IT needs and our ability to adapt our offerings;
•our ongoing ability to utilize the application programming interfaces of products such as Microsoft 365 and Google Workspace;
•our ability to realize benefits from our investment in research and development activities;
•the impact of any manufacturing and logistics delays or pricing fluctuations relating to our manufacturing partners;
•our ability to effectively manage our supply chain and inventory;
•our dependence on a limited number of manufacturers for certain components of our products;
•our ability to provide high quality technical support and the extent to which our MSP partners are able to provide satisfactory technical support to their SMB customers;
•the risks related to our use of open source software in certain of our products and subscription offerings;
•our ability to meet our contractual commitments related to response time and service level, and the quality of professional services we provide;
•the risks associated with indemnity provisions in some of our agreements;
•the risks and uncertainties associated with our limited operating history;
•the risks associated with past and future business acquisitions;
3
•our ability to make expenditures in order to support additional growth;
•possible data losses or breaches experienced by MSP partners or their SMB customers using our products or solutions;
•the risks associated with defects or vulnerabilities in our or our third-parties’ software, solutions, infrastructure and hardware;
•the risk of negative publicity, legal liability or other expenditures which could result from the material stored on our servers;
•the effects of interruptions or delays in services provided by our data centers or other third parties;
•our reliance on technology and intellectual property licensed from other parties;
•our ability to integrate our products with other operating systems, software applications, platforms and hardware;
•the impact of claims by others that we infringe upon their proprietary technology or other rights;
•the potential adverse impact of legal proceedings;
•the risks associated with our indemnification obligations and the limitations of our director and officer liability insurance;
•our ability to protect and enforce our intellectual property rights;
•the ability of our MSP partners to access high-speed internet and the continued reliability of the internet infrastructure;
•our ability to sustain market recognition of and loyalty to our brand;
•our ability to maintain our corporate culture;
•the impact of foreign currency exchange rate fluctuations;
•the impact of fluctuations in interest rates;
•our ability to remediate our existing material weakness in our internal control over financial reporting;
•our ability to develop and maintain proper and effective internal control over financial reporting;
•the impact of changes in financial accounting standards or practices;
•the accuracy of the estimates and judgments relating to our critical account policies;
•the impact of tax consequences related to our international operations;
•the impact of changes in tax laws or regulations affecting us or our partners;
•the impact of the Tax Cuts and Jobs Act of 2017;
•our ability to comply with governmental export controls and economic sanctions laws in connection with our international operations;
•our ability to comply with legal requirements, contractual obligations and industry standards relating to security, data protection and privacy;
•our ability to comply with the Health Insurance Portability and Accountability Act of 1996 (“HIPAA”);
•our ability to comply with the foreign corrupt practices act (“FCPA”) and similar laws associated with our activities outside of the United States;
•our ability to comply with the other government laws and regulations applicable to our business; and
•other factors disclosed in the section entitled “Risk Factors” and elsewhere in this filing.
We derive many of our forward-looking statements from our operating budgets and forecasts, which are based on many detailed assumptions. While we believe that our assumptions are reasonable, we caution that it is very difficult to predict the impact of known factors, and it is impossible for us to anticipate all factors that could affect our actual results. Important factors that could cause actual results to differ materially from our expectations, or cautionary statements, are disclosed under the sections entitled “Risk Factors” and “Management’s Discussion and Analysis of Financial Condition and Results of Operations” in this Annual Report on Form 10-K. All written and oral forward-looking statements attributable to us, or persons acting on our behalf, are expressly qualified in their entirety by these cautionary statements as well as other cautionary statements that are made from time to time in our other Security and Exchange
4
Commission filings and public communications. You should evaluate all forward-looking statements made in this Annual Report on Form 10-K in the context of these risks and uncertainties.
We caution you that the risks and uncertainties referenced above that may cause actual results to differ materially from those that we expected may not contain all of the factors that are important to you. In addition, we cannot assure you that we will realize the results or developments we expect or anticipate or, even if substantially realized, that they will result in the consequences or affect us or our operations in the way we expect. The forward-looking statements included in this filing are made only as of the date hereof. We undertake no obligation to update or revise any forward-looking statement as a result of new information, future events or otherwise, except as otherwise required by law.
5
PART I
ITEM 1. BUSINESS
General
Our Mission
Our mission is to create enterprise-grade technology for small and medium businesses ("SMBs") delivered through our growing, global network of managed service provider ("MSP") partners.
Overview
Datto Holding Corp. ("Datto Holding", "Datto", “we,” “us,” “our” and “the Company”) is the leading provider of cloud-based software and technology solutions purpose-built for delivery through the MSP channel to SMBs. MSPs represent the future of information technology ("IT") management for SMBs. Digital transformation is driving SMB adoption of modern software and technology, while regulatory and data protection requirements and proliferating security threats are increasing the complexity and risk of IT for SMBs. These trends have created an inflection point in SMB outsourcing to MSPs for IT management. MSPs are equipped with the IT resources and expertise SMBs lack, serving as a single provider to meet all of an SMB’s IT needs. MSPs are trusted to select, procure, implement and manage software and technology stacks that support their SMB customers’ business needs. The number of MSPs continues to grow, with approximately 125,000 MSPs providing this critical function to millions of SMBs worldwide today.
We are committed to the success of MSPs. It is the foundation of our strategy and culture. We empower our MSP partner channel, creating enormous sales and support leverage for us to efficiently address the large but fragmented SMB IT market. Our MSP-centric platform enables our partners to generate recurring revenue through the sale of our solutions to SMBs and to scale and effectively manage their own businesses. Our relationships are directly with our MSP partners. We are the leading pure-play vendor serving the MSP market, and believe our MSP-centric approach is highly differentiating as it aligns our mutual incentives, creates a motivated and engaged sales channel and reinforces our position as an integral component of our MSP partners’ businesses.
Our cloud-based offerings include Unified Continuity, Networking and Business Management software solutions. Our Unified Continuity and Networking offerings ensure the ongoing availability and security of mission-critical IT systems for SMBs on-premise, in private clouds and in the public cloud. These solutions are simple for MSPs to deploy, configure and manage across their SMB customers through a single portal. Our Business Management software provides critical operational tools to MSPs for efficient workflow management and delivery of end-to-end managed services. Our platform also includes a host of business development tools, training and content to help MSPs address the challenges of marketing and selling to SMB customers.
We employ a land-and-expand business model and grow as our MSP partners grow. We seek to deliver tools and resources that are easy to adopt and enable recurring revenue growth and margin efficiency for our MSP partners. Our partners can expand their footprint with us on a frictionless basis as they increase the number of SMB customers they serve and the number of Datto products that they sell through to their SMB customers. As of December 31, 2020 and 2019, our dollar-based net retention rate was 111% and 119%, respectively. See “Management’s Discussion and Analysis of Financial Condition and Results of Operations—Key Performance Metrics” for additional information regarding our dollar-based net retention rate.
We have a highly efficient go-to-market model, in which we leverage our sales force and the power of our brand to attract, retain and grow our MSP partners. As of December 31, 2020, we had over 17,000 MSP partners, of which over 1,100 accounted for annual run-rate revenue, or ARR, of $100,000 or more each. MSP partners with over $100,000 of ARR accounted for 47% of our total ARR as of December 31, 2020. As of December 31, 2020 our 10 largest partners represented approximately 3% of our ARR and no single partner represented more than 0.8% of our ARR. See “Management’s Discussion and Analysis of Financial Condition and Results of Operations—Key Performance Metrics” for additional information regarding ARR.
Our business has experienced rapid growth since inception and generates revenue that is highly recurring. As of December 31, 2020, our ARR was $542.8 million and our revenue for the year ended December 31, 2020 was $518.8 million, of which approximately 94% was recurring subscription revenue. As of December 31, 2019, our ARR was $474.8 million and our revenue for the year ended December 31, 2019 was $458.8 million, of which approximately 90% was recurring subscription revenue. For the year ended December 31, 2020, our net income was $22.5 million and our adjusted earnings before interest, taxes, depreciation and amortization ("Adjusted EBITDA") was $150.5 million. For the year ended December 31, 2019, our net loss was $31.2 million and our Adjusted EBITDA was $84.6 million. See “Management’s Discussion and Analysis of Financial Condition and Results of Operations—Non-GAAP Financial Measures—Adjusted EBITDA” for additional information regarding Adjusted EBITDA.
6
Industry Background
Significant industry trends are impacting the market for MSP-delivered IT, including:
•MSPs represent the future of IT management for SMBs. As dedicated technology experts, MSPs are equipped with the IT resources and expertise SMBs lack, providing a single source to meet all of an SMB’s IT needs. MSPs are trusted to select, procure and implement software and technology stacks for their SMB customers. After implementation, MSPs provide ongoing value to SMBs through strategic guidance, technical support, monitoring and maintenance of their full IT environments.
• IT providers are transitioning to a recurring managed services model. Globally, the number of MSPs continues to grow as organizations across the broader IT services landscape, including professional services providers, IT consultants, systems integrators and value-added resellers, transition to a managed services model.
A number of technology trends have created an inflection point in SMBs’ outsourcing to MSPs for IT management. These trends are greatly increasing the complexity of the IT challenges faced by SMBs and include:
•SMBs are increasingly adopting digital and cloud-based technologies. In response to competitive pressures and the demands of customers and employees, businesses are increasingly adopting digital and cloud-based technologies to help them transform their operations and compete in the marketplace. Even traditionally offline businesses are increasingly embracing technology to help them more efficiently market to, transact with and support customers, as well as to run their own operations. With the democratization of technology, SMBs are under pressure to adopt digital solutions with enterprise-grade capabilities or risk being disrupted by their competitors. We believe that new business challenges arising from the novel Coronavirus Disease 2019 ("COVID-19") pandemic are accelerating the digital transformation of SMBs. According to the International Data Corporation, a global research firm, by 2023, 67% of SMBs will have digital transformation as a key part of their IT strategy.
•Modern technologies are driving complexity in IT. The accelerating pace of technological advancement and proliferation of software and technology offerings are increasing the difficulty for businesses to evaluate, select and implement an optimal IT environment. With the adoption of modern technologies, IT systems have become increasingly linked to business operations and to each other through complex integrations, greatly heightening the importance of effective IT management.
•SMB exposure to security and regulatory risk is increasing. SMBs are increasingly collecting, generating and storing data to perform mission-critical functions. Recognizing the criticality and potential value of this data, bad actors are increasingly targeting SMBs to exploit their perceived security vulnerabilities. According to a survey of our MSP partners during 2020, 78% of MSPs reported ransomware attacks against their SMB customers over the last two years, including 60% reporting attacks in just the first six months of 2020. Cybersecurity Ventures, an IT research firm, predicts that ransomware attacks will cause nearly $20 billion in damage globally by 2021. Moreover, SMB data is potentially subject to various and ever-evolving regulatory regimes, creating the additional challenge of ensuring ongoing compliance.
•SMBs are not equipped to meet the expanding challenges of IT management. Despite requiring certain capabilities of enterprise-grade technology solutions, SMBs lack the time, resources and expertise to deploy, manage and maintain an enterprise-grade IT stack. Grappling with the day-to-day management of IT also takes time and resources away from advancing core business goals.
•The costs of downtime or data loss are meaningful and expanding. With increasingly digital operations, system downtime or data loss results in lost revenue, customer churn, negative brand perception and reduced employee productivity. For SMBs, these losses can be catastrophic, with the potential to result in significant business disruptions or even bankruptcy, driving the need for comprehensive and effective enterprise-grade continuity solutions.
Our Differentiated Approach
We are committed to the success of MSPs. It is the foundation of our strategy and culture. We believe our MSP-centric approach is highly differentiating because it aligns our mutual incentives, creates a motivated and engaged sales channel and ensures we become an integral component of our MSP partners’ businesses. Our approach, combined with our expansive platform, has helped to establish us as the leading pure-play vendor serving the MSP market, with an extensive network of more than 17,000 MSP partners. We empower our MSP partner channel, creating enormous sales and support leverage for us to efficiently address the large, but fragmented, SMB IT market.
Our Unified Continuity and Networking solutions generate recurring revenue for MSPs as part of their managed services for SMBs. MSPs integrate these solutions into managed services that they offer to their SMB customers on their own terms, including pricing, packaging, billing and solution-bundling giving MSPs greater control over growth and profitability of their managed services. We also provide visibility and predictability to our MSP partners by delivering our solutions on a subscription basis.
7
Our Business Management offerings further this overall value proposition, enabling MSPs to scale and optimize the workflows and business processes associated with managed services delivery. Our solutions are purpose-built to address the specific needs of MSPs, enabling them to improve customer satisfaction, increase productivity, decrease response times and reduce costs, enhancing the overall profitability of their businesses.
Our platform also features business development tools and content to help MSPs address the challenges of marketing and selling to SMBs. We do not directly market or sell to SMBs to avoid competing with our MSP partners. Instead, we offer MSPs tools for marketing automation and content for marketing programs, as well as training and certifications. We further cultivate the broader MSP ecosystem through our thought leadership efforts and industry-leading events. Our open ecosystem events, such as DattoCon, DattoCon EMEA and MSP Technology Days, are among the largest MSP events in the world.
Our singular dedication to our partners has enabled us to create a network of more than 17,000 MSPs that rely upon Datto solutions to serve over 1.5 million SMBs. Our model of distribution through this network of MSPs mitigates the challenges of addressing the SMB market and provides us with the following benefits:
•Sales leverage. The MSP channel creates enormous sales leverage for us to address the large but fragmented SMB IT market. With each of our sales representatives capable of reaching dozens of MSPs, who in turn can serve hundreds of SMBs, the reach of our sales force is greatly amplified.
•Recurring revenue durability. Our direct contractual relationships with MSP partners insulate us from SMB churn from bankruptcy, consolidation or other adverse events. In the event of SMB customer loss, the associated MSP will often maintain their revenue stream by migrating that customer’s Datto stack to a different customer.
•Natural revenue expansion. Once we are engaged with an MSP, our revenue expands naturally as that MSP adds existing and new SMB customers to our platform, upgrades service tiers or purchases more of our solutions to meet growing data protection or networking needs and cross-sells additional solutions into its customer base.
•Support and service leverage. We provide 24/7 direct-to-tech support to our MSP partners, who are responsible for providing higher touch implementation and ongoing support services to their SMB customers. This approach allows us to avoid the significant cost associated with providing support and service activities to over 1.5 million SMBs.
Key Strengths of Our Solutions
Datto is the largest pure-play vendor serving the MSP market with a unified, cloud-based platform that enables the end-to-end delivery of managed IT services to SMBs. Our platform combines mission-critical software, technologies and security solutions that MSPs sell to SMBs with business management software to help MSPs scale and grow their own businesses. Our solutions include Unified Continuity, Networking and Business Management.
Unified Continuity Solutions
Unified Continuity constitutes a suite of cloud-managed products and security solutions, including business continuity and disaster recovery, or BCDR, and SaaS protection. These products provide enterprise-grade data protection, ensure business uptime and establish a last line of defense against security threats by enabling the full image backup, virtualization, cloud replication and restoration of entire physical or virtual servers and PCs, whether on-premise at an SMB, remotely in a data center or in the cloud. The key differentiators of our Unified Continuity solutions include:
•Built for MSPs. We provide turnkey solutions that are remotely configurable out-of-the-box and are fast and easy to deploy. Once deployed, data automatically begins flowing into the private Datto cloud platform, or the Datto Cloud, and can be managed through the Datto partner portal, which provides MSPs with a multi-tenant view of all their SMB customers.
•Comprehensive protection for the full IT environment. Our solutions provide comprehensive protection of data and applications to efficiently prevent data loss, mitigate ransomware attacks and minimize downtime for MSPs’ SMB customers. This includes the ability to protect and quickly restore full physical, virtual or cloud environments to any point in time, in a hardware-agnostic manner, as well as the ability to seamlessly protect and recover data from public cloud SaaS applications. Our solutions are often a last line of defense when an SMB's firewalls are breached or a network is compromised through an employee clicking on a phishing email.
8
•Highly reliable and performant. Our solutions replicate environments across multiple locations to create redundancy and ensure partner-managed environments are fully protected. Our solutions continually validate that these environments can be fully restored through multiple layers of verification, including automated ransomware scanning, disk and service integrity checks and testing of the virtual machine. In an adverse event, our solutions are capable of providing near-instantaneous virtualization in our cloud, temporary failover and high-performance recovery to the local network to ensure ongoing continuity of the SMB’s systems, minimizing costly downtime.
Networking Solutions
Networking refers to our collection of integrated WiFi access points and connectivity offerings that enable MSPs to efficiently offer highly performant and reliable cloud-managed networking to their SMB customers. The key differentiators of our Networking solutions include:
•Built for MSPs. Our networking solutions are purpose-built to align with the needs of MSPs in delivering managed networking. Our solutions enable remote monitoring and management from the cloud, providing MSPs with a multi-tenant view of all networks and connected devices, with automated event alerts and visual indicators of each device’s status. They also enable efficient management through seamless native integration with critical MSP tools.
•Efficient deployment. Our solutions allow MSPs to preconfigure customer network settings, enabling the plug-and-play self-formation of entire networks. Configurations can be cloned from similar existing networks, enabling MSPs to quickly and easily deploy new customer networks in a standardized and pre-defined manner.
•Highly reliable and performant. Our solutions are specifically designed to provide highly reliable and performant networking to help MSPs maximize uptime for SMB customers. Our networking solutions feature automatic failover and failback, self-healing mesh and channel scanning mechanisms to ensure customer networks maintain and optimize performance, even in the event of a disruption to primary connections or hardwired network lines.
Business Management Solutions
Business Management refers to our suite of integrated SaaS products for MSPs, including Autotask Professional Services Automation, or PSA, and Remote Monitoring and Management, or RMM, that provide critical operational tools to manage workflows and the delivery of end-to-end IT services. Built from inception to run in the cloud, these offerings allow MSPs to manage their businesses through a centralized hub and to increase operational efficiency. The key differentiators of our Business Management solutions include:
•Built for MSPs. Our business management solutions provide a fully integrated solution for single pane of glass management of the critical operational workflows and business processes of MSPs, including device management, ticketing, project management, customer relationship management, invoicing, inventory management and resource management. Our solutions offer embedded integrations with over a hundred other MSP tools and technologies for the seamless and efficient delivery of managed services.
•Cloud and mobile enabled. Our business management solutions are built for the cloud and include mobile device support, enabling the efficient and effective management of IT service delivery. With mobile-enabled solutions, technicians can access critical tools and systems from the field, increasing productivity and reducing costs.
•Complete visibility and control. Our business management solutions provide MSPs with full visibility into SMB customer environments with complete control to remotely remediate IT issues. Through our unified PSA and RMM offerings, our solutions provide dashboards, alerts, actionable insights, analytics and automation to help MSPs drive operational efficiency.
Key Benefits to Our MSP Partners
MSPs choose Datto and develop longstanding relationships with us not only for our innovative solutions but also for our comprehensive platform, which delivers the following key benefits to our MSP partners:
•Enable shift to managed IT services. By providing solutions specifically designed for delivery in a bundled suite of critical managed services, we facilitate the shift of IT services organizations to a recurring managed services model. With our platform, MSPs generate recurring revenue through the sale of our software and technology to SMBs on a subscription basis and thereby gain clear visibility into and predictability of revenue. Our suite of products provides our MSP partners with multiple avenues to land new customers and expand recurring revenue over time.
9
•Increase retention of SMB customers. Any time an SMB experiences a security downtime or data loss event, an MSP runs the risk of losing that customer. For this reason, MSPs seek reliable solutions that reduce the risk of SMB downtime and data loss. With our solutions, MSPs gain a last line of defense against security threats that ensures ongoing availability and comprehensive data protection, providing their SMB customers with peace of mind. Datto solutions have proven to be very reliable for MSP partners in enabling the efficient management of their customer base, preventing downtime and recovering from cyberattacks and data loss events. As a result, the MSP’s role in securing SMBs’ mission-critical systems solidifies the MSP’s importance as a trusted partner to SMBs.
•Increase profit generation from SMB customers. Our solutions are competitively priced to enable our MSP partners to generate attractive profit margins. The pricing of our solutions for MSPs is generally based on a predetermined tier for a given solution, ensuring our MSP partners have visibility into delivery cost. The pricing of our solutions is not available to SMBs and our MSP partners have latitude to set the pricing, packaging and bundling of our solutions as a managed offering to their customers. As a result, our MSP partners can leverage our solutions to create reliable profit centers for their businesses.
•Avoid channel conflict. Unlike most technology and software vendors who sell to both MSPs and SMB customers, Datto does not compete with MSPs. Datto’s MSP-centric approach enables us to focus solely on the needs of MSPs, designing our platform and solutions for this market. We provide MSPs with the tools and support they need to create and sell managed services to their SMB customers and the assurance we will not compete directly for the business of SMBs.
•Reduce the cost of managing SMB customer IT environments. Our remote monitoring and management product enables the delivery of end-to-end managed IT services by allowing MSPs to perform proactive monitoring, preventative maintenance and remote remediation of customer systems, applications and devices in real-time with intelligent alerting, auto-response and auto-resolution. Our cloud-based solutions help MSPs achieve better resource utilization by reducing costly truck rolls for on-site service and freeing up resources to pursue higher value activities.
•Enable operational efficiency. Our business management tools are easy to implement and use, enabling MSPs to operate their own businesses more efficiently through centralized operations from a single pane of glass. These software solutions are optimized for the business needs of MSPs to enable workflow automation and deliver actionable insights, providing full visibility into customer IT environments. Our solutions have embedded integrations with other Datto products and other services and technologies to make it easier for an MSP to manage a heterogeneous technology stack.
•Drive business growth. In addition to our products, our platform also includes a range of sales and marketing content, training and other programs as well as technical certifications tailored to our MSP partners to help them more effectively grow their businesses, alleviating a major pain-point for IT professionals with limited sales and marketing experience.
Our Growth Strategy
We pursue numerous actions to drive our growth in subscription revenue. Key elements of our growth strategy include:
•Expand our partner base by adding new MSPs. We believe that there is substantial opportunity to increase our penetration among MSPs. We intend to continue leveraging the strong awareness of our brand as a trusted partner to the MSP community to add new MSPs in the markets we serve. Since December 31, 2018, we expanded our MSP partner base from approximately 14,400 to over 17,000 at December 31, 2020.
•Standardize MSP partners on our platform. Once an MSP partner joins our platform, our goal is to increase the penetration of our solutions across its existing SMB customer base. Typically, MSPs initially deploy our solutions to only a limited number of their SMB customers. Over time, MSPs often continue to migrate additional existing end-customers to our platform for the benefit of managing a single integrated solution stack. Our goal is to aid in this migration in order to increase our overall penetration into our MSP partners’ existing SMB customer base.
•Empower our MSP partners to attract more SMBs. As SMBs increasingly rely on MSPs for IT management, we seek to grow our revenue by helping our existing MSP partners attract additional SMB customers that may ultimately adopt our solutions. We plan to continue developing marketing automation tools and content for marketing, as well as offering training and certifications, in order to facilitate our MSP partners’ growth.
•Facilitate upsell and cross-sell activity with our MSP partners and their SMB customers. We intend to grow our sales teams in order to increase our sales with our MSP partners. Our sales teams upsell our MSP partners to higher service tier subscriptions as the data retention and bandwidth needs of their SMB customers grow. In addition, our sales teams upsell our MSP partners to increase their Business Management subscriptions as they grow. Our sales teams also actively cross-sell our products to our MSP partners, leveraging their positive experiences with our platform. Our dollar-based net retention rate, which was 111% as of December 31, 2020 and 119% as of December 31, 2019, demonstrates our ability to expand within existing MSP partners.
10
•Extend our product leadership and introduce new platform solutions. We continue to invest in new purpose-built product and service offerings to anticipate and meet the evolving demands of our MSP partners and their SMB customers. We will also continue to pursue opportunistic mergers and acquisitions to complement and enhance our current solution set.
•Expand our international footprint. We believe there is significant opportunity to expand into new international geographies, with approximately 73% of our revenue coming from the United States ("U.S.") in 2020. The maturity of the international SMB IT landscape varies; more mature markets represent growth opportunities in the near term, while less mature markets present a longer-term opportunity as MSPs develop within those markets.
Our Products
Our products include offerings in Unified Continuity, Networking and Business Management.
Unified Continuity Products
Datto Unified Continuity is a complete line of products that protect workloads — data, applications and configurations — located on laptops, workstations, physical and virtual servers and in the public cloud. There are five cloud-based products that together protect and restore workloads, reduce SMB downtime resulting from data or system loss and provide a last line of defense against security threats. These products include:
Business Continuity and Disaster Recovery. MSPs use our all-in-one BCDR products to efficiently protect servers and workstations and minimize downtime for SMBs. SIRIS, Datto’s flagship cloud-managed BCDR product, consists of a state-of-the-art physical or virtual device deployed by MSPs at a customer location or in a private data center, the agent software installed on protected servers and workstations and a cloud-based storage, virtualization and management system. SIRIS is available in service tiers ranging from one to 100 terabytes with a variety of data retention options.
Once an MSP deploys SIRIS, the agent software automatically transfers disk images of the protected machines to the SIRIS device at configurable intervals, as frequently as every five minutes. SIRIS verifies the integrity of every image, transfers a copy of that image to the secure Datto Cloud at selected intervals and can replicate that to a second geographically distributed data center if desired. In this manner, SIRIS establishes a last line of defense for all protected servers and workstations. In the event of a server or workstation security incident or outage, users can initiate a boot of the virtual image of the affected machines either in the SIRIS device or in the Datto Cloud in as little as six seconds.
In addition to SIRIS, BCDR products also include ALTO, a smaller capacity BCDR solution. Available in a 2 terabyte model, ALTO provides many of the same capabilities of SIRIS without local virtualization on the device. The same agents are used to collect server or workstation images and ALTO is managed from the same management portal in the Datto Cloud, but with ALTO all failover virtualization occurs only in the Datto Cloud.
Cloud Continuity. Cloud Continuity is the innovative all-in-one, image-based continuity solution for Windows-based PCs (laptops and desktops). Cloud Continuity takes an image of a protected PC and replicates it directly to the Datto Cloud without the need for a local device. Backup images include all PC files and data, as well as the configuration, settings and software. In the event of a ransomware attack, device loss or theft, or other event that renders the PC unusable, Cloud Continuity allows MSPs to quickly and easily restore to any PC hardware.
SaaS Protection. SaaS Protection is a reliable, automated and secure backup and restoration product for Microsoft 365 and Google Workspace data. Microsoft and Google currently recommend the use of a third-party backup service because Microsoft 365 and Google Workspace do not backup user data. MSPs deploy SaaS Protection seamlessly for their SMB customers in a few simple steps, and can quickly start to take regular backups of user emails, files and sites, storing these backups in the Datto Cloud. MSPs help end-users easily recover from data loss, including ransomware attacks, accidental or malicious deletion and cancelled employee accounts—all from our cloud management portal.
Workplace. Datto Workplace is a complete cloud-hosted file sync and share solution enabling end-users to synchronize files across platforms, including mobile devices. Workplace also serves as a collaboration platform allowing users to share and work together on any type of document in its native file format. Centralized cloud management and sophisticated administrative controls at the end-user and group levels give MSPs and their SMB customers control over file governance. Critical business files are also protected via the ransomware detection and management feature, which gives users the ability to immediately revert back to safe file copies from before an infection, undoing the ransomware encryption of user data.
File Protection. Datto File Protection is an MSP-managed, secure and scalable backup product that enables MSPs to efficiently protect and recover files and folders on workstations and laptops of all types. File and folder backups protect unstructured data from ever-present threats such as human error, hardware failure, ransomware and lost or stolen devices. Users can quickly and easily access
11
and restore their own files from the Datto Cloud, enabling them to recover from common data-loss scenarios without raising a support request, or MSPs can securely access customer accounts and restore data on their behalf.
Networking Products
Datto Networking delivers a suite of cloud-managed networking products for MSPs to efficiently deploy to their SMB customers.
Networking products currently include:
Access Points. Our WiFi access points deliver high-powered wireless mesh networks with seamless roaming. These 802.11AC Wave 2 access points include a quad-core processor to ensure all of the Wave 2 features have the necessary processing power to deliver the performance required by SMBs.
Switches. We offer switches with 8, 24 and 48 port options, switching capacity ranging from 20 Gbps to 104 Gbps, and mounting options ranging from fanless desktop to rack mounted. MSPs can choose the form factor, performance and mounting options most appropriate for a particular SMB customer.
Edge Routers. Our Edge Routers provide core functionality including intrusion detection and prevention and a firewall with stateful packet inspection, layer 7 DPI, port forwarding, DMZ host and VLAN segregation.
Business Management Products
Business Management consists of integrated SaaS offerings that enable MSPs to be more efficient at scale, including:
Autotask Professional Services Automation. Autotask PSA is a complete IT business management product that is purpose-built for MSPs and delivers the mission-critical tools an MSP needs to run its business. Continuing to deliver 99.99% uptime in 2020, Autotask PSA pioneered cloud-delivered PSA and provides dashboards that help MSPs turn data into actionable business insights. It enables partners to monitor their sales pipeline, track technician productivity and evaluate customer profitability. It includes device management, ticketing, project management, customer relationship management, invoicing, inventory management and resource management. In addition, our open architecture application programming interface ("API") has enabled more than 100 industry-leading vendors to integrate their business-critical applications with Autotask PSA to further simplify workflows for MSPs. Autotask PSA centralizes business operations and enables quick, data-driven decisions through rich dashboards, customizable alerts and business intelligence tools.
Remote Monitoring and Management. A key component of an MSP’s security best practices, Datto RMM is a remote monitoring and management product designed to assist MSPs with their IT service delivery. Built for MSPs as a multi-tenant solution to manage millions of SMB customer endpoints in an efficient manner, Datto RMM is a fully cloud-managed, scalable SaaS product with integrated endpoint ransomware detection. The underlying architecture provides MSPs with the ability to remotely audit, patch, manage, monitor, support and report on SMB customers’ local and public-cloud deployed endpoints. The platform offers a collection of tools for securely supporting thousands of devices without the need for extensive training. MSPs can use Datto RMM tools to create their own scripts, or easily plug in hundreds of pre-made scripts, to automate repetitive tasks like software patching or rapidly respond to security incidents with pre-defined actions. Integrations with Autotask PSA and other frequently-used solutions allow MSPs to seamlessly report on device status, issues and events. Using configurable dashboards, a simple menu system, remote takeover capability and the flexibility to operate from any internet-connected device, Datto RMM helps MSPs deliver better service and increase responsiveness for their SMB customers.
Our Technology
Unified Continuity, Networking and Business Management products are based on a two-level, multi-tenant, private, hybrid cloud architecture. Designed to provide ease of deployment and a high degree of flexibility, our technology enables MSP partners to deliver managed services across a broad range of scenarios at scale.
Key features of our technologies include:
•Easy to use enterprise-grade technology. Our products are designed to be simple to deploy and easy to manage and are built on the latest enterprise-grade technology. This technology includes Type 1 hypervisors, industry-standard scalable monitoring, converged infrastructure and extensive security features. We abstract this complex technology from our MSPs with simple graphical user interfaces. Further, smart defaults and pre-configuration capabilities in our cloud enable MSPs to configure our products, ship them to end-customers and deploy them with minimal effort. Once deployed and configured, our products then connect to the Datto Cloud and begin uploading data. In this way, MSPs can provide secure enterprise-grade technology to their SMB customers without the hassles of deploying, integrating and managing enterprise products.
12
•Datto product integrations. We pioneered an integrated product portfolio tailored uniquely for MSPs. While Autotask PSA and Datto RMM can be offered as stand-alone products, they are also integrated with each other, allowing technicians to move seamlessly between our PSA and RMM. Integration between Datto RMM and our Networking solutions allows rapid troubleshooting and problem resolution of network issues. Integration between BCDR and PSA allows the PSA to collect and report on deployed devices and manage related support tickets. These integrations encourage MSPs to standardize across our solutions.
•Third-party product integrations. Datto supports an open technology ecosystem for MSPs. MSPs value using different tools from multiple vendors to deliver their managed services, creating unique and often differentiating technology stacks. Datto products are externally integrated with other products to make it easier for an MSP to manage a heterogeneous technology stack. Leveraging open APIs, third party vendors have built more than 200 integrations with our business management products. This includes everything from security tools to competitive remote monitoring and management and professional services automation vendors.
•Two-level multi-tenant architecture. All of our products share a two-tier multi-tenant design, which facilitates MSP management of both their own and the SMBs’ environments. The first tier provides secure resource sharing among MSP partner accounts hosted on the Datto Cloud, while the second tier sits below each MSP account and provides a tenant-centric view of SMB customers for the MSP partner. Most other multi-tenant systems provide only a single level of tenant management.
•Private virtualization and storage cloud. Datto operates its own exabyte scale private cloud which provides us with control over the environment, efficient operating costs and flexibility to best support our partners. The Datto Cloud provides both compute and storage tiers at multiple geographically distributed data centers. This includes the option to replicate a second copy of SMB customer data to an alternative data center in region. We have developed a differentiated virtual machine ("VM") orchestration layer which allows shared management between our MSP partner and the Datto support organization.
•Proprietary work-flow engine. Autotask PSA incorporates a field-configurable business logic engine that allows the implementation of business processes without costly code customization. A single multi-tenant cloud architecture delivers scalable efficient deployment of custom workflows for each MSP partner, and enables partners to trigger actions and alerts based on real time internal data as well as data from third party products. This allows MSPs to deploy PSA to meet the needs of their business, rather than redesigning their business to meet the requirements of their chosen management software.
•Proprietary agent and agentless technology. We have developed several proprietary agents across our product lines, specifically BCDR, RMM and Cloud Continuity. Our Unified Continuity agents protect servers, workstations and PCs by deploying an endpoint resident software package or using an agentless approach for virtual machines and private clouds. We have developed both a robust agent and an agentless plugin that support virtual machine backup on Hyper-V and VMware. We have also developed RMM agents and API integrations that enable MSPs to monitor and manage SMB customer endpoints on premise and in the public cloud. By developing this proprietary technology, we can avoid reliance on third-party licensed backup agents.
•Proprietary remote access technology. Datto RMM incorporates near-instantaneous access to managed endpoints using 100% HTML5 technology with no local plugin required on the managed device. Not only is this technology secure and fast, it delivers cross browser compatibility. This enables technicians to address customer tickets from nearly any browser, including mobile devices and tablets. With better performance than third-party licensed options, Datto RMM also enables MSPs to deliver faster, more responsive service to their SMB customers.
•Proprietary virtual machine image verification technology. Our verification technology provides evidence that backups produced by our BCDR products are viable. This technology performs automated tests on every image for ransomware and disk integrity. “Screenshot” verification boots the virtual machine either on the device or in the cloud and performs additional automated testing for viability. This running instance of the protected virtual machine further allows the MSP partner to utilize our scripting API to run custom test scripts that validate functionality and data integrity beyond what can be normally evaluated through the built-in testing. This functionally is linked back through the multi-tenant portal and alerting system to provide the MSP partner with confirmation that their managed systems are protected.
•Cloud to cloud API-level connectivity. In addition to devices deployed on-premises, the Datto Cloud is designed to ingest data directly from SaaS applications hosted in public clouds. This API-level connectivity brokered through our multi-tenant portal provides the same level of management that our MSP partners expect from the hybrid cloud continuity products. We have worked with Microsoft and Google to make efficient use of Microsoft 365 and Google Workspace APIs and achieve efficient data ingest and restore services.
13
•Proprietary remote synchronization technology. Datto has developed proprietary synchronization technology across a wide range of use cases to allow SMB PCs and devices to efficiently and securely send data to the Datto Cloud without saturating local internet connections. This includes multi-pass synchronization technology that enables local workloads to continue to operate while a backup is taken and transmitted. It also includes file synchronization software, as well as differential assessment, transmission and verification capabilities to enable an MSP to control the transmission and verification of large data sets to the Datto Cloud.
•RMM integrated cloud-managed networking devices. By combining the network cloud API with RMM management dashboards, the Datto RMM engine is able to provide access to network configuration and runtime data that greatly exceeds off-the-shelf solutions reliant on SNMP for device connectivity. This cloud-level integration provides much greater control of Datto Networking devices than can be achieved by combining products from different networking and remote monitoring and management vendors. As a result, MSP technicians solving SMB customer tickets experience a seamless environment, increasing productivity and responsiveness.
•Proprietary embedded RMM Ransomware Detection. One of the largest security threats for MSPs and their SMB customers is ransomware, and Datto RMM now incorporates the first embedded ransomware detection algorithm into deployed RMM agents. On all Datto RMM managed devices, the agent now observes the local system for signs of crypto ransomware. When identified, the agent attempts to stop the encryption process and automatically isolates the system from the network, alerting the MSP to the infection. This allows MSPs to prevent the spread of ransomware, and proactively restore infected systems.
•Hyper-converged hybrid cloud connected edge device. Datto is differentiated in that it deploys a true hyper-converged continuity appliance that combines data storage with local compute capabilities. Alternative continuity systems generally only provide gateway functionality with virtualization occurring either exclusively in the cloud or on other equipment furnished by end-customers on-premises. Datto allows very flexible orchestration of VM instances in either the cloud or on the edge device.
Our Partners
Datto creates technology for MSPs, enabling them to deliver managed services to their SMB customers and also enabling MSPs to efficiently operate their own businesses. MSPs represent substantially all of our revenue and are referred to as our “partners.” Our MSP partners purchase our products on a subscription basis for their own use or for inclusion in managed services sold to their end-customers in a recurring revenue model. Our MSP partners range in size from very small to mid-sized, and primarily serve small and medium-sized businesses, often managing an SMB customer’s entire IT environment. In smaller MSPs, the business owner or CEO is typically the purchaser of Datto products, and in larger MSPs, the purchaser is often the Vice President of Product or CTO.
Our Business Management products are purchased by an MSP for their own use, with subscription fees based on their number of seats or by number of managed SMB devices. Our Unified Continuity and Networking products are purchased by an MSP for resale to their SMB customers, with subscription fees based on service tier and device count or the number of Microsoft 365 or Google Workspace employee accounts at the SMB domains that our MSP partners protect through our SaaS Protection products. Generally, an MSP first purchases a device or seats to assess our products and include them in their managed services. Following a successful initial assessment, the MSP typically purchases and deploys additional devices and seats for its customers over time.
As of December 31, 2020, we partnered with more than 17,000 MSPs serving over 1.5 million SMBs across more than 25 countries. We count partners as MSPs with active subscriptions for one or more of our products at the end of the measured period. Our revenue is highly diversified across our entire partner base, with no single partner making up more than 0.8% of our ARR. As of December 31, 2020, we had over 1,100 MSP partners that each contributed more than $100,000 of ARR.
Examples of use cases of MSP partners leveraging our solutions to deliver value to their SMB customers include:
•utilizing our BCDR solutions to help an SMB roll back its IT environment after a phishing e-mail and ransomware has compromised that SMB’s systems;
•upon a server failure, helping an SMB to switch over to our local device until that SMB’s environment has been restored;
•enabling an SMB to operate its environment in our cloud in the event of a natural disaster, such as a hurricane or earthquake;
•after an end-customer accidentally misplaces a laptop, helping the customer restore the lost environment onto new hardware;
•recovering data and files from our cloud when a customer accidentally deletes a file from Microsoft 365 or Google Workspace;
14
•utilizing Datto Networking solutions to provide production, point of sale, network connectivity and guest Wi-Fi services for a conference or event; and
•using the Datto partner portal to remotely diagnose and fix an SMB’s laptop issues.
Competition
We operate in a dynamic industry driven by the technology needs of SMBs and MSPs. Our competition is generally comprised of enterprise IT vendors and emerging innovators with niche point solutions. These competitors include:
•Continuity vendors that provide image-based backup solutions with on-premise only, cloud-only or hybrid infrastructure. The level of continuity provided by image-based backup vendors varies widely, from simple image copy to complex image orchestration, copy, failover and failback. Many vendors providing continuity solutions are not exclusively focused on serving MSPs.
•Networking vendors that sell a mix of edge routers, WiFi access points and switches to small, medium and large businesses. Typically, these vendors deliver either enterprise scale products at a high price point, or commodity products at a low price point. Enterprise scale products are designed for the many unique demands of large-scale enterprises and are complex to configure and manage. Commodity hardware vendors provide performant products with fewer features at a lower price point, often not designed for MSP deployment and management.
•Business management software vendors that focus a significant portion of their business on the MSP market provide vertically integrated service management platforms and tools to MSPs to help them operate more efficiently. Many of these vendors are not solely focused on the MSP market, and sell directly to end customers to augment their revenue.
Key competitive factors in our market include:
•reliability and performance of solutions that protect workloads — data, applications and configurations — and ensure uptime for SMBs;
•MSP-centric, turnkey product capabilities including reliability, multi-tenant cloud management, ease of deployment and manageability at scale;
•ability to provide recurring revenue and margin for MSPs;
•quality and availability of service and support;
•brand awareness, reputation and influence among MSPs; and
•programs, tools and content that help MSPs grow their businesses.
We believe that we compete favorably on these factors.
Marketing and Sales
Our marketing and sales approach begins with our leading content marketing programs that attract MSPs, nurturing these contacts and then efficiently delivering qualified leads to our sales team to close. Once a new MSP is added to our platform, our sales team works with them to help them grow. Using our go-to-market enablement programs, MSPs add new SMBs and sell additional Datto products to their existing SMB customers. Post-sales engagement with our service and success teams ensures partners are either effectively using or are enabled to resell our products, and ongoing relationship management at scale allows our partners to sell and cross-sell more of our products.
Marketing
Our marketing engine delivers industry-leading content, which drives our target audience—MSP business owners and decision makers—to request a demo or become a partner. We distribute our content through a number of digital marketing platforms (social, pay-per-click, search engine optimization, syndication, webinars), and we leverage demos to nurture and further qualify leads. Analytics of this process enable us to fine tune programs and content to drive more successful and qualified lead generation.
We categorize our leads based on propensity to buy using a real-time analytical model. We leverage high touch tactics to attract the higher scoring leads and rely on self-service at the low end. We market Datto as the MSP technology company, creating technology for SMBs delivered by MSPs. Once an MSP becomes a Datto partner, we help it grow with a variety of programs to ensure they are optimally using the products they purchased and are enabled to resell our products through to SMB customers. Our marketing programs
15
also help our partners attract new SMB customers. We leverage our in-depth knowledge and understanding of MSPs to design these free programs, which include a marketing automation tool, robust marketing content, sales training and certifications.
We also foster one of the largest MSP communities in the world through our numerous events. DattoCon, DattoCon EMEA and MSP Technology Days are among the largest MSP events in the world. Our dedicated community development team hosts over 100 Datto virtual and in-person events annually for our partners and prospects around the globe, educating them on best practices, refreshing them on the latest technology and providing insights they can use to grow their businesses. We also exhibit at third-party in person and virtual tradeshows where we continue to engage with MSPs and expand the Datto brand. We believe that fostering a cohesive MSP community and serving as a trusted thought leader for MSPs around the world helps drive MSP growth, which in turn drives Datto growth. These events, combined with our content and digital marketing strategies, help ensure that our partners stay in touch with our brand, maintaining our lead in the MSP market.
Sales
We believe that leveraging the MSP channel creates high levels of sales productivity at low customer acquisition costs, allowing us to efficiently reach SMBs. We add MSP partners to our platform primarily through our sales team. There are three sales teams pursuing new MSP partners and covering our existing partner base: Sales Development Representatives ("SDRs"), Territory Sales Representatives ("Hunters") and Channel Growth Representatives ("Farmers"). SDRs review leads from our marketing team and qualify new partner opportunities, and Hunters are responsible for pursuing and closing these opportunities, leading to a new MSP partner adopting one or more of our products. Farmers work with our partners after their first purchase and build relationships, focusing on upsell and cross-sell opportunities. Our sales teams are organized by geography, consisting of the Americas, EMEA and APAC.
Our MSP partners become multipliers to our sales team with our Unified Continuity and Networking products. With aligned incentives, our Farmers and our partners’ own sales teams work together at scale using a range of “sell with” tactics to help such partners grow their base of SMB customers purchasing managed services powered by Datto solutions and expand their footprint within those customers. Further, our Farmers support MSPs with the enablement and training resources available on our marketing platform to help new and existing partners grow their installed base across our products.
Services, Success and Support
Services and Success
Our services team onboards MSP partners, helps them properly configure and implement our solutions and trains them to use our products to their fullest potential. Our success team provides cross-functional support for partners to drive increased adoption, product usage and subscription renewals and is responsible for relationship and escalation management.
Support
Our support team includes experienced, trained resources located around the world to provide 24x7x365 technical support for all our products. Support is included in all our offerings as long as an MSP partner’s subscription is active. All support tiers offer maintenance releases, patches and access to our support services and portal, including a documentation and knowledge repository, how-to guides, videos and a community where our partners can ask questions and find answers. Our support is distinguished by our “direct to tech” support model whereby our expert technicians immediately answer support calls and speak directly with partners to resolve issues. This includes “code red” support where we work with an MSP partner during a disaster or other incident to minimize disruption to their customer’s business.
Similar to the sales leverage we gain through the MSP channel, our partners also are a multiplier for our support team because they perform first-level technical support with SMBs, only calling Datto when they are unable to resolve an issue. In complex situations such as multiple or repeat issues affecting an MSP, our success team may get involved in an escalation. Our executive leaders also regularly speak with partners as part of our commitment to openness and accessibility.
Product Development
Product development and innovation are at the core of our business. We not only invent technology, but we also reinvent it for MSPs. Our research and development teams are composed of product management, software development and infrastructure engineering functions. These groups are responsible for the design, development, testing and delivery of our solutions. We build our products from inception to serve the needs of MSPs and their SMB customers and continually seek to improve those products.
We have designed our development processes to be highly responsive and cost-efficient. Our diversified global footprint allows us to source from a large pool of talented resources by participating in multiple labor markets. We utilize an Agile development process and small Scrum teams, each dedicated to specific product modules that follow a standard set of best practices and a common set of development values.
16
Intellectual Property
We rely on a combination of patent, copyright, trademark and trade secret laws in the United States and other jurisdictions, as well as confidentiality and other contractual restrictions to protect our proprietary rights, including our proprietary technology, software, know-how and brands. As of December 31, 2020, we owned 20 issued U.S. patents, with expiration dates ranging from September 2025 to May 2039. We have also filed approximately 21 currently pending patent applications. We do not believe that we are materially dependent on any one of our patents, issued or pending.
We require our employees, consultants and other third parties to enter into confidentiality and proprietary rights agreements and we control and monitor access to our software, proprietary technology and documents and other confidential information. Our policy is to require all employees and independent contractors to sign agreements assigning to us any inventions, trade secrets, developments, processes and other intellectual property generated by them on our behalf and under which they agree to protect our confidential information.
Although we rely on intellectual property rights as well as contractual protections to establish and protect our proprietary rights, we believe that factors such as the technological and creative skills of our personnel, creation of new services, features and functionality and frequent enhancements to our platform are more essential to establishing and maintaining our technology leadership position.
Human Capital
As of December 31, 2020, we had 1,743 employees, of which 1,327 (76%) were employed in the United States and 416 (24%) were employed outside of the United States. We consider our current relationship with our employees to be good. We are not party to any collective bargaining agreements. However, for one of our foreign subsidiaries, a works council represents our employees. We believe that our ability to recruit, retain and develop highly skilled talent is critical to our future success and growth. We provide our employees with competitive compensation and benefits, including opportunities for equity ownership, a 401(k) plan with company matching contributions, healthcare and insurance benefits, health savings and flexible spending accounts, parental and family leave, and paid time off.
We strive to maintain an inclusive environment free from discrimination of any kind. We believe that fostering this environment builds a foundation on which our employees are empowered to do their life's work. Our employee resource groups ("ERGs") are company-sponsored groups of employees that promote and support certain objectives including inclusion and diversity, career development and networking. As of December 31, 2020, we had four ERGs including those supporting Women in Technology, the LGBTQ community, people of color and LatinX. We aim to ensure our employees are aware of different ways to notify management of inappropriate behavior, including through a confidential hotline. Any and all reports of inappropriate behavior are taken very seriously and thoroughly investigated and remediated.
In addition, we offer high-quality learning experiences across our global business. This includes an extensive onboarding program, robust sales, product and technical training, as well as a comprehensive professional skills curriculum focused on managerial and leadership skills. We also launched an internal networking and mentoring program intended to connect employees across Datto to foster relationships, development and exchange professional and personal experiences, skills, and career paths.
General Corporate Information
We were incorporated in 2017 as Merritt Topco, Inc., a Delaware corporation, and changed our name to Datto Holding Corp. in connection with our initial public offering in 2020. We are a holding company and all of our business operations are conducted through our subsidiaries. Our principal executive offices are located at 101 Merritt 7, Norwalk, Connecticut 06851. Our telephone number is 888-995-1431. Our website address is www.datto.com. The information contained on, or that can be accessed through, our website is not incorporated by reference into this Annual Report, and you should not consider any information contained on, or that can be accessed through, our website as part of this Annual Report on Form 10-K.
Other Available Information
Please note that in addition to filing our periodic and current reports, we may announce material business and financial information to our investors using filings we make with the Securities and Exchange Commission ("SEC"), webcasts, press releases, conference calls, and our investor relations website which can be found at www.investors.datto.com. The SEC maintains an internet site that contains reports, proxy and information statements, and other information regarding issuers that file electronically with the SEC at http://www.sec.gov. We use these mediums, including our website, to communicate with our stockholders and the public about our company. It is possible that the information that we make available through these mediums may be deemed to be material information. We therefore encourage investors and others interested in our company to review all such mediums.
17
Implications of Being an Emerging Growth Company
We qualify as an “emerging growth company” as defined in the Jumpstart Our Business Startups Act of 2012, or the JOBS Act. We will remain an emerging growth company until the earliest of (1) December 31, 2025, (2) the last day of the fiscal year in which we have total annual gross revenue of at least $1.07 billion, (3) the last day of the fiscal year in which we are deemed to be a large accelerated filer (this means the market value of common that is held by non-affiliates exceeds $700.0 million as of the end of the second quarter of that fiscal year) or (4) the date on which we have issued more than $1.0 billion in non-convertible debt securities during the prior three-year period.
An emerging growth company may take advantage of reduced reporting requirements that are otherwise applicable to public companies. These provisions include, but are not limited to:
•not being required to comply with the auditor attestation requirements of Section 404 of the Sarbanes-Oxley Act of 2002, as amended, or the Sarbanes-Oxley Act;
•reduced disclosure obligations regarding executive compensation in periodic reports, proxy statements and registration statements; and
•exemptions from the requirements of holding a nonbinding advisory vote on executive compensation and shareholder approval of any golden parachute payments not previously approved.
We have elected to take advantage of certain of the reduced disclosure obligations regarding financial statements and executive compensation in this Annual Report on Form 10-K and expect to elect to take advantage of other reduced burdens in future filings. As a result, the information that we provide to our shareholders may be different than you might receive from other public reporting companies in which you hold equity interests.
The JOBS Act also permits an emerging growth company like us to take advantage of an extended transition period to comply with new or revised accounting standards applicable to public companies. We have elected to opt-in to this extended transition period for complying with new or revised accounting standards and, therefore, we will not be subject to the same new or revised accounting standards as other public companies that comply with such new or revised accounting standards on a non-delayed basis.
18
ITEM 1A. RISK FACTORS
Our business, financial condition and operating results can be affected by a number of factors, whether currently known or unknown, including but not limited to those described below, any one or more of which could, directly or indirectly, cause our actual financial condition and operating results to vary materially from past, or from anticipated future, financial condition and operating results. Any of these factors, in whole or in part, could materially and adversely affect our business, financial condition, operating results and stock price.
Because of the following factors, as well as other factors affecting our financial condition and operating results, past financial performance should not be considered to be a reliable indicator of future performance, and investors should not use historical trends to anticipate results or trends in future periods.
Risk Factors Summary
The following is a summary of the principal risks that could adversely affect our business, operations and financial results:
Risks Related to the COVID-19 Pandemic
•our business could experience an adverse impact as a result of the COVID-19 pandemic;
Risks Related to Our Brand and Industry
•we face intense competition in our market;
•our competitive position will be harmed if we do not respond promptly to end-user needs in the rapidly evolving SMB IT market;
•we depend on growth in the SMB IT market;
Risks Related to our Operating Results
•our operating results may vary significantly from period to period and be unpredictable;
•we may not be able to achieve or sustain the same level of cash flows in the future;
•if we do not attract new MSP partners, our future results of operations could be harmed;
•we may be unable to sell additional products and subscriptions to our MSP partners;
•we may fail to manage our growth effectively;
•our business is susceptible to risks associated with international operations;
•volatility in the global economy could adversely impact our continued growth, operations and forecasts;
•our ability to sell our products and subscriptions will be very limited if our MSP partners fail to perform;
•our success depends on our ability to recruit, retain and develop key employees and management personnel;
•our operating results could be harmed if Microsoft or Google restrict access to the application programming interfaces we rely on in order to back up Microsoft 365 and Google Workspace;
•we invest in research and development activities which may achieve delayed, or lower than expected, benefits;
•manufacturing delays and pricing fluctuations could prevent us from shipping orders on time or on a cost-effective basis;
•insufficient inventory may cause lost sales opportunities, while excess inventory may harm our gross margins;
•some of the key components in our products come from limited sources of supply;
•our sales are dependent on the quality of our technical support services and those of our MSP partners;
•we could be obligated to provide credits for future service if we fail to meet contractual commitments related to response time governing our business management solutions;
•indemnity provisions in agreements potentially expose us to substantial liability for intellectual property infringement and other similar claims and losses;
•our software, website, hardware, hosted and internal systems may be subject to intentional or accidental disruption or penetration from external attackers or insiders;
•interruptions in services provided by our data centers or third parties could impair the delivery of our service;
•our products may become less competitive or obsolete if we fail to integrate our products with a variety of operating systems, software applications, platforms and hardware;
•intellectual property infringement or other similar claims asserted against us, could result in significant costs;
•the success of our business depends in part on our ability to protect and enforce our intellectual property rights;
•we could lose partners or fail to increase the number of our partners if we are unable to sustain our brand recognition or our reputation is harmed;
•our ability to effectively acquire or invest in companies and to successfully integrate acquired businesses;
19
•foreign currency exchange rate fluctuations could harm our financial results;
•we are subject to fluctuations in interest rates;
•we may not be able to accurately or timely report our financial condition or results of operations if we are unable to remediate a material weakness in our internal control over financial reporting;
•changes in tax laws or regulations could increase the costs of our solutions and harm our business;
•our ability to utilize our net operating loss carryforwards may be limited;
Risks Related to Regulatory Compliance
•our failure to comply with legal requirements, contractual obligations and industry standards regarding security, data protection and privacy could have an adverse effect on our reputation and business;
•we function as a HIPAA “business associate” for certain of our MSP partners and, as such, are subject to strict privacy and data security requirements;
•we could be subject to penalties and sanctions if we fail to comply with anti-corruption laws;
Risks Related to Our Indebtedness
•we could incur substantially more indebtedness or make certain restricted payments, which could further exacerbate the risks associated with our substantial indebtedness;
•we may not be able to generate sufficient cash flow to service all of our indebtedness;
•our 2020 Credit Agreement may restrict our ability to respond to changes or to take certain actions;
•a lowering or withdrawal of the ratings assigned to our debt securities by rating agencies may increase our future borrowing costs and reduce our access to capital;
Risks Related to Ownership of Our Common Stock
•Vista Equity Partners, or Vista, controls us, and its interests may conflict with ours or yours in the future;
•we are a “controlled company” and you do not have the same protections as those afforded to stockholders of companies that are subject to certain governance requirements;
•we are an “emerging growth company” and have reduced public company reporting requirements;
•we have no plans to pay regular cash dividends, and you may not receive any return on investment unless you sell your common stock for a price greater than that which you paid for it; and
•we may issue shares of preferred stock in the future, which could make it difficult for another company to acquire us or could depress the price of our common stock.
20
Risks Related to the COVID-19 Pandemic
The impact of the ongoing COVID-19 pandemic, including the resulting global economic downturn, is highly uncertain and difficult to predict at this time, but it may have a material adverse impact on our business, prospects, results of operations, financial condition, liquidity and cash flows.
In March 2020, the World Health Organization categorized COVID-19 as a pandemic, and the government of the United States declared the COVID-19 outbreak a national emergency. COVID-19 continues to spread throughout the United States and globally, and the duration, magnitude and severity of its effects and ultimate impact on the world’s population and the global economy are unknown. To attempt to mitigate the spread of the pandemic, many authorities, including state, local, and foreign governments, have put in place travel bans and restrictions, quarantines, shelter-in-place orders, shutdowns, and other government orders and restrictions. These restrictions and orders have resulted in business disruptions and closures, work stoppages, slowdowns and delays, supply chain disruptions, work-from-home policies, and cancellation or postponement of events, among other effects that could adversely impact our operations, including affecting the behavior and operations of our MSP partners, their SMB customers and our suppliers.
In response to these government actions and mandates, we have modified and may continue to modify our business practices, including, among others, directing almost all employees to work from home, substantially curtailing employee travel, cancelling or shifting events and conferences to virtual-only, increasing inventories of key device and cloud infrastructure components, and working with our network of suppliers to ensure future orders can be fulfilled. There is no certainty that the measures we or governmental authorities have taken will be sufficient to mitigate the risks posed by the pandemic, and our ability to operate normally could be harmed.
We are unable to predict the impact that the COVID-19 pandemic will ultimately have on our results of operations, financial condition, liquidity and cash flows because of numerous uncertainties, including the duration and severity of the pandemic and the impact of the various mitigation efforts. To date, we have experienced lower sales bookings, moderately slower ARR and subscription growth, and moderately slower and lower cash collections from existing MSP partners. The COVID-19 pandemic has caused a global economic downturn that could materially and adversely affect demand for our products and services as well as our results of operations and financial condition even after the pandemic is contained and global economic activity stabilizes. The COVID-19 pandemic, as well as intensified measures undertaken to contain the spread of COVID-19, could decrease the spending of our existing and potential new MSP partners or their SMB customers; cause our MSP partners to fail to renew, reduce, shorten, terminate, or renegotiate their subscriptions for our services; and continue to lengthen collection periods of accounts receivable. Some of our MSP partners or their SMB customers have experienced and may continue to experience financial hardships which could result in delayed or uncollectible payments. In particular, SMBs may be more susceptible to the adverse effects of economic fluctuations, including as a result of the COVID-19 pandemic. Any of these developments could adversely affect our business, results of operations, and financial condition. Additionally, concerns over the economic impact of the COVID-19 pandemic have caused extreme volatility in financial and other capital markets which may adversely impact our stock price.
While most of our operations can be performed remotely, there is no guarantee that we will be as effective while working remotely because our team is dispersed, many employees may have additional personal needs to attend to, and employees may become sick themselves and be unable to work. Decreased effectiveness of our team could adversely affect our results because of our inability to meet in person with potential MSP partners or customers, cancellation of and inability to participate in in-person conferences and other industry events that lead to sales generation, longer time periods to deploy software and support our products, or other decreases in productivity that could seriously harm our business. Significant management time and resources may be diverted from our ordinary business operations in order to develop, implement and manage workplace safety strategies and as we attempt to return to office workplaces, and to address other business issues related to the pandemic.
As a result of the COVID-19 pandemic, we may (1) decide to postpone or cancel planned investments in our business in response to changes in our business, or (2) experience difficulties in recruiting or retaining personnel, each of which may impact our ability to respond to our MSP partners’ needs and fulfill contractual obligations. In addition, as a result of financial or operational difficulties, our suppliers may experience delays or interruptions in their ability to provide services to us, if they are able to do so at all. Any disruptions to services provided to us by third parties that we rely upon to provide our solutions, including as a result of actions outside of our control, could significantly impact our continued performance.
Risks Related to Our Brand and Industry
We face intense competition in our market, especially from larger, well-established companies and vendors with an MSP focus, and we may not be able to maintain or improve our competitive position.
We operate in an intensely competitive and dynamic industry driven by the technology needs of SMBs and MSPs. We expect competition to increase in the future from established competitors and new market entrants. SMBs are increasingly turning to MSPs, to service their technology needs because of increasing complexity and enhanced regulatory and security risks. MSPs, as a result, are
21
constantly looking for the next service offering for their customers. Our competition is generally comprised of enterprise IT vendors and emerging innovators with niche point solutions, which include:
•Continuity vendors that provide image-based backup solutions with on-premise only, cloud-only or hybrid infrastructure. The level of continuity provided by image-based backup vendors varies widely, from simple image copy to complex image orchestration, copy, failover and failback. Many vendors providing continuity solutions are not exclusively focused on serving MSPs. Vendors in the continuity space include Barracuda, StorageCraft, Acronis and Veeam.
•Networking vendors that sell a mix of edge routers, WiFi access points and switches to small, medium and large businesses. Typically, these vendors deliver either enterprise scale products at a high price point, or commodity products at a low price point. Vendors in this space include Cisco Meraki, Ubiquiti and Aruba.
•Business management software vendors that focus a significant portion of their business on the MSP market, providing vertically integrated service management platforms and tools to MSPs to help them operate more efficiently. Many of these vendors are not solely focused on the MSP market, and sell directly to end customers to augment their revenue. ConnectWise, Kaseya and Solarwinds are examples of such vendors.
Many of our existing competitors have, and some of our potential competitors could have, substantial competitive advantages such as:
•greater name recognition and longer operating histories;
•broader distribution and established relationships with MSPs;
•larger sales and marketing budgets and resources;
•greater customer support resources;
•greater resources to make strategic acquisitions or enter into strategic partnerships;
•lower labor and development costs;
•larger and more mature intellectual property portfolios; and
•substantially greater financial, technical and other resources.
In addition, some of our larger competitors have substantially broader and more diverse product and services offerings, which may make them less susceptible to downturns in a particular market and allow them to leverage their relationships based on other products or incorporate functionality into existing products to grow their business in a manner that discourages users from purchasing our products and subscriptions, including through selling at zero or negative margins, offering concessions, product bundling or closed technology platforms. Many of our smaller competitors that specialize in one particular offering designed specifically for MSPs, such as network assessment utilities, documentation tools, management dashboards, monitoring agents, security solutions or cloud migration capabilities, are often able to deliver these specialized products to the market more quickly and cheaply than we can.
MSPs or SMBs that use legacy products and services of our competitors may believe that these products and services are sufficient to meet their IT needs or that our platform only serves the needs of a portion of the SMB IT market. Accordingly, these organizations may continue allocating their IT budgets for such legacy products and services and may not adopt our Unified Continuity, Networking and Business Management software, solutions and hardware. Further, many organizations have invested substantial personnel and financial resources to design and operate their networks and have established deep relationships with other providers of the products we offer. As a result, these organizations may prefer to purchase from their existing suppliers rather than to add or switch to a new supplier using our products and services, regardless of product performance, features or greater service offerings, or may be more willing to incrementally add solutions to their existing IT infrastructure from existing suppliers than to replace it wholesale with our solutions.
Conditions in our market could change rapidly and significantly as a result of technological advancements, partnering or acquisitions by our competitors, or continuing market consolidation. New start-up companies that innovate and large competitors that make significant investments in research and development may invent similar or superior products and technologies that compete with our products and subscriptions. Some of our competitors have made or could make acquisitions of businesses that may allow them to offer more directly competitive and comprehensive products than they had previously offered and adapt more quickly to new technologies and MSP or SMB needs. Our current and potential competitors may also establish cooperative relationships among themselves or with third parties that may further enhance their resources and better compete with our MSP partner network.
These competitive pressures in our market or our failure to compete effectively may result in price reductions, fewer orders, reduced revenue and gross margins and loss of market share. Any failure to meet and address these factors could seriously harm our business and operating results.
22
We depend on growth in the SMB IT market, and lack of growth or contraction in this market could have a material adverse effect on our sales and financial condition.
Demand for SMB IT is linked to growth in the amount of data generated and stored, demand for data retention and management (whether as a result of regulatory requirements or otherwise) and demand for and adoption of new storage devices and networking technologies. Because our software, solutions and hardware are concentrated within SMB IT, if the demand for unified continuity, networking or business management solutions declines or develops more slowly than we expect, our sales, results of operations and financial condition would be materially adversely affected. Segments of the IT services industry have in the past experienced significant economic downturns. The occurrence of any of these factors in the data and information management software market could materially adversely affect our sales, results of operations and financial condition.
Furthermore, the SMB IT market is dynamic and evolving. Our future financial performance will depend in large part on continued growth in the number of SMBs adopting IT management software for their computing environments through our MSP partners. The SMB IT market may not continue to grow at historic rates, or at all. If this market fails to grow or grows more slowly than we currently anticipate, our sales and results of operations could be adversely affected.
If we do not accurately predict, prepare for and respond promptly to rapidly evolving technological and market developments to meet changing end-user needs in the SMB IT market and the corresponding needs of MSPs, our competitive position and prospects will be harmed.
The SMB IT market has grown quickly and is expected to continue to evolve rapidly. Moreover, many of our users operate in markets characterized by rapidly changing technologies and business plans, which require them to adopt increasingly complex networks, incorporating a variety of hardware, software applications, operating systems and networking protocols. Our long-term growth depends on our ability to continually enhance and improve our existing products and develop or acquire new products that address the common problems encountered by technology professionals on a daily basis in an evolving IT services market. If we fail to accurately predict the changing needs of SMBs or MSPs and emerging technological trends in the SMB IT market, including in the areas of unified continuity, networking and business management, our business and operating results could be harmed. In particular, our continuity solutions represent a significant source of our revenue and any decrease in demand for these solutions due to competitors’ technologies or changing SMB needs would adversely impact our revenue and operating results.
The technology in our software solutions and hardware is especially complex because it needs to effectively enable MSPs to address and solve critical workflow and operational challenges of SMBs and to do so remotely and quickly with multiple SMB customers. Additionally, some of our new products’ features and related enhancements may require us to develop new hardware architectures that involve complex, expensive and time-consuming research and development processes. The development of our software, solutions and hardware is difficult and the timetable for commercial release and availability is uncertain as there can be long time periods between releases and availability of new features. If we experience unanticipated delays in the availability of new products, features and subscriptions, and fail to meet partner expectations for such availability, our competitive position and business prospects will be harmed.
Additionally, we must commit significant resources to developing new features before knowing whether our investments will result in products, subscriptions and features the market will accept. The development and introduction of new solutions involves a significant commitment of time and resources and are subject to a number of risks and challenges including but not limited to lengthy development cycles, evolving industry standards and technological developments by our competitors and partners, evolving platforms, operating systems and hardware products, related product and service interoperability challenges, entering into new or unproven markets, trade compliance difficulties and obtaining sufficient licenses to technology and technical access to operating system software. The success of new features depends on several factors, including appropriate new product definition, differentiation of new products, subscriptions and features from those of our competitors, and market acceptance of these products, subscriptions and features. Moreover, successful new product introduction and transition depends on a number of factors including our ability to manage the risks associated with new product production ramp-up issues, the availability of application software for new products, the effective management of purchase commitments and inventory, the availability of products in appropriate quantities and costs to meet anticipated demand and the risk that new products may have quality or other defects or deficiencies, especially in the early stages of introduction.
There can be no assurance that we will successfully identify opportunities for new products and subscriptions, develop and bring new products and subscriptions to market in a timely manner or achieve market acceptance of our products and subscriptions, or that products, subscriptions and features developed by others will not render our products, subscriptions, features or technologies obsolete or noncompetitive. The increasing prevalence of cloud and SaaS delivery models offered by us and our competitors may unfavorably impact pricing for both our on-premise and cloud-based offerings, as well as overall demand for our on-premise software and service offerings, which could reduce our revenues and harm our results of operations. Specifically, our Unified Continuity business line may be adversely affected by technological advances that allow similar services to be effectively provided through the public cloud, which could drastically reduce the demand for on-premise backup solutions. Currently, our on-premise offerings provide backup recovery services and response times that greatly exceed the offerings that can be provided by solely cloud-based providers. We are able to provide these
23
superior services in part due to the physical on-premise location of the devices that enable many of our business continuity and disaster recovery, or BCDR, solutions. Currently, the cloud technology cannot compete with our BCDR services due to transmission constraints and cost factors, as well as lack of control over data in the public cloud. However, if competitors were to develop affordable public cloud-based technologies that could provide similar BCDR response times and services, these competitors could replace the need for our hybrid on-premise offerings and solutions. If this public cloud-based technology were to develop and be offered to the market and we did not adequately adapt our own offerings, we would face the risk of MSPs and SMBs choosing our competitors’ cloud-based offerings in lieu of our offerings.
Risks Related to our Operating Results
Our operating results may vary significantly from period to period and be unpredictable, which could cause the market price of our common stock to decline.
While our operating results, in particular, our revenues, have historically been recurring and predictable from period to period, variation may occur as a result of a number of factors, many of which are outside of our control and may be difficult to predict, including:
•our ability to attract and retain new MSP partners or sell additional products and subscriptions to our existing MSP partners for internal use or resale to their SMB customers;
•our ability to expand our sales and marketing operations in order to achieve broader market penetration;
•a decline in subscription renewals;
•the budgeting cycles, seasonal buying patterns and purchasing practices of our MSP partners and their SMB customers;
•changes in MSPs’ and SMBs’ requirements or market needs;
•our ability to obtain, maintain, protect and enforce our intellectual property rights;
•price competition;
•the timing and success of new product and service introductions by us or our competitors or any other change in the competitive landscape of our industry, including consolidation among our competitors, MSP partners or SMBs and strategic partnerships entered into by and between our competitors;
•changes in the mix of our products and subscriptions, including changes in multi-year subscriptions;
•our ability to successfully and continuously expand our business domestically and internationally;
•changes in the growth rate of the enterprise-grade technology services market for SMBs;
•timing and amount of our investments to expand the capacity in our data center facilities;
•deferral of orders from MSP partners in anticipation of new products or product enhancements announced by us or our competitors;
•the timing, costs and effects related to the development or acquisition of technologies, businesses or strategic partnerships and their integration;
•decisions by potential SMBs to purchase software and technology from MSP partners other than those that offer our products and services;
•changes in SMB market penetration through MSP partners or renewal rates for our subscriptions;
•timing of revenue recognition and revenue deferrals;
•our ability to manage production and manufacturing related costs, global customer service organization costs, inventory excess and obsolescence costs and warranty costs;
•insolvency or credit difficulties confronting our MSP partners or their SMB customers, which could adversely affect our partners’ ability to purchase or pay for our products and subscription and support offerings;
•our inability to fulfill our MSP partners’ orders due to supply chain delays or events that impact our manufacturers or their suppliers;
24
•changes in regulatory or legal environments that may cause us to incur, among other elements, expenses associated with compliance;
•significant security breaches of, technical difficulties with, or interruptions to, the delivery and use of our products;
•future accounting pronouncements or changes in our accounting policies;
•future changes in tax rates in jurisdictions in which we operate;
•increases or decreases in our revenue and expenses caused by fluctuations in foreign currency exchange rates, as an increasing amount of our revenue and expenses is generated and incurred and paid in currencies other than the U.S. dollar;
•increases or decreases in our expenses caused by fluctuations in tariffs between the United States and countries in which we have supplier relationships;
•political, economic and social instability caused by the referendum in June 2016, in which voters in the United Kingdom, or U.K., approved an exit from the European Union, or E.U., and the U.K. government subsequently notified the E.U. of its withdrawal, which is commonly referred to as “Brexit,” continued hostilities in the Middle East, terrorist activities and any disruption these events may cause to the broader global industrial economy; and
•general macroeconomic conditions, both domestically and in our foreign markets that could impact some or all regions where we operate.
Any one of the factors above, or the cumulative effect of some of the factors referred to above, may result in significant fluctuations in our financial and other operating results. This variability and unpredictability could result in our failure to meet our revenue, margin or other operating result expectations or those of securities analysts or investors for a particular period. If we fail to meet or exceed such expectations for these or any other reasons, the market price of our common stock could fall substantially, and we could face costly lawsuits, including securities class action suits.
We may not be able to achieve or sustain the same level of cash flows in the future.
We expect our operating expenses may increase over the next several years as we hire additional personnel, expand our operations and infrastructure, both domestically and internationally, pursue business combinations and continue to develop our software, hardware and services. As a public company, we may incur additional legal, accounting and other expenses that we did not incur historically. If our revenue does not increase to offset these increases in our operating expenses, we will not be able to achieve or maintain profitability in future periods. While historically our total revenue has grown, not all components of our total revenue have grown consistently. Further, in future periods, our revenue growth could slow or our revenue could decline for a number of reasons, including slowing demand for our software, hardware or services, increasing competition, any failure to gain or retain or increase sales to MSP partners, a decrease in the growth of our overall market, our technology or services becoming obsolete due to technical advancements in the SMB IT market or our failure, for any reason, to continue to capitalize on growth opportunities. As a result, our past financial performance should not be considered indicative of our future performance. Any failure by us to achieve or sustain cash flows on a consistent basis could cause us to halt our expansion, not pursue strategic business combinations, default on payments due on existing contracts, fail to continue developing our software, hardware and services or result in other negative changes in our business.
If we are unable to attract new MSP partners, our future results of operations could be harmed.
To increase our revenue and achieve and maintain profitability, one important component is our ability to add new MSP partners to purchase our products both for their own use and for resale to their SMB customers. To do so, we must successfully convince MSP partners that, as they adopt and look to resell our software and technology, including Unified Continuity, Networking and Business Management products, our products provide significant advantages over legacy software and technology and are more marketable to SMBs. In addition, numerous other factors, many of which are out of our control, may now or in the future impact our ability to add new MSP partners, including potential MSP partners’ commitments to legacy software and technology providers and products, MSP preference for working with other providers of similar products, MSP partners’ and SMBs’ real or perceived switching costs, our failure to recruit, train, retain and motivate sufficient numbers of sales and marketing personnel, our failure to develop or expand relationships with our MSP partners or to attract new MSP partners, failure by us to help our MSP partners successfully deploy, troubleshoot and manage our solutions for their own use or on behalf of SMB customers, negative media or industry or financial analyst commentary regarding us or our solutions, litigation and deteriorating general economic conditions. If our efforts to attract new MSP partners are not successful, our revenue and rate of revenue growth may decline, we may not achieve profitability and our future results of operations could be materially harmed.
25
If we are unable to sell additional products and subscriptions to our MSP partners or they are unable to resell additional offerings to their SMB customers, our future revenue and operating results will be harmed.
Our future success depends, in part, on our ability to expand the deployment of our software and solutions with existing MSP partners, which are both the customers of our Business Management solutions and our primary channel for effectively reaching their SMB customers with our Unified Continuity and Networking solutions. Currently, all of our products are sold on a recurring subscription basis and we rely on SMB demand to drive MSP purchases of our Unified Continuity and Networking solutions. Therefore, our success may require increasingly sophisticated and costly sales efforts to collaborate with MSP partners that may not result in additional sales. The rate at which our MSP partners purchase additional products and subscriptions depends on a number of factors, including the perceived need of SMBs for additional or alternative software and technology, including our offerings, as well as general economic conditions.
We rely on revenue from subscription offerings, and because we recognize revenue from subscription over the term of the relevant service period, downturns or upturns in sales of these subscription offerings are not immediately reflected in full in our operating results.
All of our products are sold on a recurring subscription basis, with recurring revenue representing approximately 94% of total revenue for the year-ended December 31, 2020. Sales of new or renewal subscription contracts may decline and fluctuate as a result of a number of factors, including MSP partners’ and SMBs’ level of satisfaction with our products, subscriptions and customer support, the prices of our products and subscriptions, the prices of products and services offered by our competitors and reductions in our MSP partners’ and the SMBs’ spending levels. Accordingly, we must invest significant time and resources in providing ongoing value to our MSP partners and thereby indirectly to their SMB customers. If our sales of new or renewal subscription contracts decline, our total revenue and revenue growth rate may decline and our business will suffer. In addition, we recognize subscription revenue monthly over the term of the relevant service period, which is typically one to three years or monthly. As a result, a portion of the subscription revenue we report each fiscal quarter is the recognition of deferred revenue from subscription contracts entered into during previous fiscal quarters.
Further, existing MSP partners may opt not to renew their subscriptions after the completion of their initial contract period. Our MSP partners have no obligation to renew their subscriptions for our products after the expiration of their subscription period. Our MSP partners’ renewal rates may decline or fluctuate as a result of a number of factors, including their level of satisfaction and their SMB customers’ level of satisfaction with our subscriptions and our support offerings, the frequency and severity of subscription outages, our product uptime or latency and the pricing of our, or competing, subscriptions. Additionally, some MSP partners may renew their subscriptions for month-to-month terms or on other terms that are less economically beneficial to us. If our efforts to sell additional products and subscriptions to and through the MSP partners are not successful or our MSP partners do not renew their subscriptions or renew them on less favorable terms, our revenues may grow more slowly than expected or decline.
Consequently, a decline in new or renewed subscription contracts in any one fiscal quarter may not be fully or immediately reflected in revenue in that fiscal quarter and could negatively affect our revenue in future fiscal quarters. Also, it is difficult for us to rapidly increase our subscription revenue through additional subscription sales in any period, as revenue from new and renewal subscription contracts must be recognized over the applicable service period.
We have experienced substantial growth in recent years, and if we fail to manage our growth effectively, we may be unable to execute our business plan, maintain high levels of MSP partner satisfaction or adequately address competitive challenges, and our financial performance may be adversely affected.
Our business has rapidly grown, which has resulted in large increases in our number of employees, expansion of our infrastructure, new internal systems and other significant changes and additional complexities. We increased our total number of employees to 1,743 as of December 31, 2020, from 1,734 and 1,444 at December 31, 2019 and 2018, respectively. While we intend to further expand our overall business, partner base and number of employees, our historical growth rate is not necessarily indicative of the growth that we may achieve in the future. The growth in our business generally and our management of a growing workforce and MSP partner base geographically dispersed across the United States and internationally will require substantial management effort, infrastructure and operational capabilities. To support our growth, we must continue to improve our management resources and our operational and financial controls and systems, and these improvements may increase our expenses more than anticipated and result in a more complex business. We will also have to anticipate the necessary expansion of our relationship management, implementation, customer service and other personnel to support our growth and achieve high levels of customer service and satisfaction. Our success will depend on our ability to plan for and manage this growth effectively. If we fail to anticipate and manage our growth or are unable to provide high levels of customer service, our reputation, as well as our business, results of operations and financial condition, could be harmed.
26
Because our long-term success depends on our ability to operate our business internationally and increase sales of our products to MSP partners located outside of the United States, our business is susceptible to risks associated with international operations.
We have international operations in Australia, Canada, China, Denmark, Germany, the Netherlands, Singapore and the United Kingdom. We also expect to continue to expand our international operations for the foreseeable future. The continued international expansion of our operations requires significant management attention and financial resources and results in increased administrative and compliance costs. Although we continue to develop strategies to address international markets, our limited experience in operating our business in certain regions outside the United States increases the risk that our expansion efforts into those regions may not be successful. These risks include, but are not limited to:
•fluctuations in currency exchange rates;
•the complexity of, or changes in, foreign regulatory requirements, including more stringent regulations relating to privacy and data security and the unauthorized use of, or access to, commercial and personal information, particularly in Europe;
•difficulties in managing the staffing of international operations, including compliance with local labor and employment laws and regulations;
•potentially adverse tax consequences, including the complexities of foreign value added tax systems, overlapping tax regimes, restrictions on the repatriation of earnings and changes in tax rates, including the impact of Brexit;
•dependence on MSP partners to increase customer acquisition or drive localization efforts;
•the burdens of complying with a wide variety of foreign laws and different legal standards;
•the need to adapt and localize our products for specific countries;
•increased financial accounting and reporting burdens and complexities;
•longer payment cycles and difficulties in collecting accounts receivable;
•longer sales cycles;
•political, social and economic instability abroad;
•terrorist attacks and security concerns in general;
•reduced or varied protection for intellectual property rights in some countries; and
•the risk of U.S. regulation of foreign operations.
The occurrence of any one of these risks or other risks that we may not be able to anticipate could negatively affect our international business and, consequently, our operating results. We cannot be certain that the investment and additional resources required to establish, acquire or integrate operations in other countries will produce desired levels of revenue or profitability. If we are unable to effectively manage our expansion into additional geographic markets, our financial condition and results of operations could be harmed.
In particular, we operate a portion of our research and development activities internationally and outsource a portion of the coding and testing of our products and product enhancements to contract development vendors. These activities take place in a variety of locations, including China, the United Kingdom, Germany and Denmark. We believe that performing research and development in our international facilities and supplementing these activities with our contract development vendors enhances the efficiency and cost-effectiveness of our product development. If we experience problems with our workforce or facilities internationally, we may not be able to develop new products or enhance existing products in a cost-efficient and effective alternate manner.
We are monitoring developments related to the U.K.’s 2016 referendum in which U.K. voters approved Brexit. The United Kingdom officially exited the European Union on January 31, 2020 and the transition period during which most E.U. rules continued to apply expired on December 31, 2020. Although the U.K. and the European Union have reached an agreement on certain terms concerning the U.K.'s withdrawal, there remains substantial uncertainty regarding the details of the U.K.'s ongoing relationship with the European Union. The potential effects of Brexit on our business remain uncertain and will depend upon any agreements the United Kingdom makes to retain access to E.U. markets. Since we have operations in the United Kingdom and Europe, Brexit could potentially have corporate structural consequences, adversely change tax benefits or liabilities and disrupt some of the markets and jurisdictions in which we operate. In addition, Brexit could lead to legal uncertainty and potentially divergent national laws and regulations as the United Kingdom determines which E.U. laws to replace or replicate.
27
Volatility in the global economy could adversely impact our continued growth, results of operations and our ability to forecast future business.
As our business has expanded globally, we have become increasingly subject to the risks arising from adverse changes in domestic and global economic and political conditions. Uncertainty in the macroeconomic environment and associated global economic conditions have resulted in volatility in credit, equity, debt and foreign currency markets as well as government budgets worldwide.
These global economic conditions can result in slower economic activity, decreased consumer confidence, reduced corporate profits and capital spending, adverse business conditions and liquidity concerns. There has also been increased volatility in foreign exchange markets. These factors make it difficult for our MSP partners, our vendors and us to accurately forecast and plan future business activities. In addition, these factors could cause our MSP partners to slow or defer spending on our solutions, which would delay and lengthen sales cycles and negatively affect our results of operations. If such conditions deteriorate or if the pace of economic recovery is slower or more uneven, our results of operations could be adversely affected, we may not be able to sustain the growth rates we have experienced recently, and we could fail to meet the expectations of stock analysts and investors, which could cause the price of our common stock to decline.
We continue to invest in our business in the European and Asia-Pacific regions. There are significant risks with overseas investments and growth prospects in these regions. Increased volatility or declines in the credit, equity, debt and foreign currency markets in these regions could cause delays in or cancellations of orders. Deterioration of economic conditions in the countries in which we do business could also cause slower or impaired collections on accounts receivable. In addition, we could experience delays in the payment obligations of our MSP partners if they experience weakness in the SMB market, which would increase our credit risk exposure and harm our financial condition.
Most of our revenue is generated by sales through our MSP partners, and if these MSP partners fail to perform, our ability to sell and distribute our products and subscriptions will be very limited, and our operating results will be harmed.
Most of our revenue is generated by sales through our MSP partners. We provide our MSP partners with training materials and programs to assist them in selling our products and subscriptions, but there can be no assurance that these steps will be utilized or effective. Even following an effective onboarding of an MSP partner that understands our products and how to manage them on behalf of their SMB customers, it may take several months or more for a new MSP partner to achieve productivity. In addition, our MSP partners may be unsuccessful in marketing, selling and supporting our products and subscriptions and can cease marketing or reselling our solutions at any time with limited or no notice. We may not be able to incentivize these MSP partners to sell our products and subscriptions to SMBs. A substantial number of our agreements with our MSP partners are non-exclusive such that those MSP partners may offer customers the solutions of several different companies, including solutions that compete with ours. These MSP partners may also have incentives to promote our competitors’ products and may devote more resources to the marketing, sales and support of competitive products. Our agreements with our MSP partners may generally be terminated for any reason by either party upon the expiration of the applicable annual or monthly subscription period, subject to compliance with the notice requirements set forth in the applicable agreement.
We cannot be certain that we will retain these MSP partners or that we will be able to secure additional or replacement MSP partners. We also cannot be certain that our MSP partners will retain their SMB customers to which they resell our products. Our MSP partner sales structure could subject us to lawsuits, potential liability and reputational harm if, for example, any of our MSP partners misrepresent the functionality of our products, improperly market our products or subscriptions to SMB customers or violate laws or our corporate policies. Because our MSP partners market our products without our direct oversight, any misrepresentation or inappropriate marketing of our products or solutions by our MSP partners may cause SMB customers to be disappointed in our products or cause end-users to seek redress or assistance from us directly. If we fail to effectively manage our sales channels or MSP partners, our ability to sell our products and subscriptions and operating results will be harmed.
Our business could be materially and adversely affected as a result of natural disasters, terrorism or other catastrophic events.
Datto’s business relates to helping businesses recover in the wake of disaster by providing full image-based backup, virtualization and restore of a SMB’s full environment, as well as software as a service, or SaaS, application backup and restore and network monitoring and management. However, any economic failure or other material disruption caused by natural disasters, including fires, floods, hurricanes, earthquakes and tornadoes, power losses or shortages, environmental disasters, telecommunications or business information systems failures or break-ins and similar events could still adversely affect our ability to conduct business. If such disruptions result in cancellations of orders or contribute to a general decrease in economic activity or corporate spending on IT, or impair our ability to meet our MSP partner demands, our operating results and financial condition could be materially adversely affected. Additionally, if such disruptions were to occur within the Datto data centers and caused us to be unable to provide our continuity services, our business and operations would be materially adversely affected.
28
The ability to recruit, retain and develop key employees and management personnel is critical to our success and growth, and our inability to attract and retain qualified personnel could harm our business.
Our business requires certain expertise and intellectual capital, particularly within our management team. We rely on our management team in the areas of operations, research and development, information security, marketing, sales, support and general and administrative functions. We are also dependent on the continued service of our existing software engineers because of the complexity of our products. Our management team and other key personnel could terminate their employment with us at any time. The loss of one or more of our management team could have a material adverse effect on our business.
For us to compete successfully and grow, we must retain, recruit and develop key personnel who can provide the needed expertise for our industry, MSP partners and products, particularly with respect to engineering and sales. As we move into new geographic areas, we will need to attract, recruit and retain qualified personnel in those locations. In addition, acquisitions could cause us to lose key personnel of the acquired businesses. The market for qualified personnel is competitive and we may not succeed in recruiting additional key personnel or may fail to effectively replace current key personnel who depart with qualified or effective successors. We believe that replacing our key personnel with qualified successors is particularly challenging as we feel that our business model and approach to marketing and selling our products are different than those of our competitors. Any successors that we hire from outside of the Company, in particular, sales representatives, would likely be unfamiliar with our business model and may therefore require significant time to understand and appreciate the important aspects of our business or fail to do so altogether. Our effort to retain and develop personnel may also result in significant additional expenses, including stock-based compensation expenses, which could adversely affect our results of operations. New regulations and volatility or lack of performance in our stock price could also affect the value of our equity awards, which could affect our ability to attract and retain our key employees. We have made significant changes, and may make additional changes in the future, to our management team and other key personnel. We cannot provide assurances that key personnel will continue to be employed by us or that we will be able to attract and retain qualified personnel in the future. Failure to retain or attract key personnel could have a material adverse effect on our business.
If Microsoft or Google were to restrict access to the application programming interfaces, or APIs, we rely on in order to back up Microsoft 365 and Google Workspace, it could harm our operating results.
We work with Microsoft and Google to make efficient use of Microsoft 365 and Google Workspace APIs in order to efficiently consume data and restore services. If Microsoft or Google were to make these APIs (or similar APIs for successor products) unavailable to companies like Datto, we would not have an alternate solution to backup Microsoft 365 and Google Workspace. As a result, our operating results and revenue may be harmed if MSPs decline to renew their subscriptions with us due to our inability to backup Microsoft 365 and Google Workspace.
We invest in research and development activities in both the short and long term, and these investments may achieve delayed, or lower than expected, benefits which could harm our operating results.
While we continue to focus on managing our costs and expenses, we also continue to invest significantly in research and development activities, in both the short and long term, as we focus on organic growth through internal innovation across each of our product offerings. We believe that we must continue to dedicate a significant amount of resources to our research and development efforts to maintain our competitive position, and that the level of these investments will increase in future periods. We recognize the costs associated with these research and development investments earlier than the anticipated benefits, and the return on these investments may be lower, or may develop more slowly, than we expect. If we do not achieve the benefits anticipated from these investments, or if the achievement of these benefits is delayed, our operating results may be adversely affected.
Because we depend on manufacturing partners to build and ship components of our products, we are susceptible to manufacturing and logistics delays and pricing fluctuations that could prevent us from shipping orders on time, if at all, or on a cost-effective basis, which may result in the loss of sales and loss of our MSP partner relationships.
We depend on manufacturing partners as manufacturers for physical components of our product lines. Our reliance on these manufacturing partners for our hardware products and servers built for the Datto Cloud, reduces our control over the manufacturing process and exposes us to risks, including reduced control over quality assurance, product costs, product supply, timing and transportation risk. Our products are manufactured by our manufacturing partners at facilities located in, but not limited to, the United States, China, the Czech Republic, Japan, Taiwan and Thailand. Some of the components in our products are sourced either through a network of distributors or directly by us from component suppliers outside the United States. The portion of our products that are sourced outside the United States may subject us to additional logistical risks or risks associated with complying with local rules and regulations in foreign countries. Significant changes to existing international trade agreements could lead to sourcing or logistics disruption resulting from import delays or the imposition of increased tariffs on our sourcing partners. For example, the United States and Chinese governments have each enacted, and discussed potential, import tariffs. These tariffs, depending on their ultimate scope and how they are implemented, could negatively impact our business by increasing our costs. Each of these factors could severely impair our ability to fulfill orders.
29
In addition, we are subject to requirements under the Dodd-Frank Wall Street Reform and Consumer Protection Act of 2010, or the Dodd-Frank Act, to diligence, disclose and report whether or not our products contain minerals originating from the Democratic Republic of the Congo and adjoining countries, or Conflict Minerals. Although the SEC has provided guidance with respect to a portion of the Conflict Minerals filing requirements that may somewhat reduce our reporting practices, we have incurred and expect to incur additional costs to comply with these disclosure requirements, including costs related to determining the source of any of the relevant minerals and metals used in our products. These requirements could adversely affect the sourcing, availability and pricing of minerals used in the manufacture of semiconductor devices or other components used in our products. We may also encounter MSPs or SMBs who require that all of the components of our products be certified as conflict free. If we are not able to meet this requirement, such parties may choose not to purchase our products.
Our manufacturing partners typically fulfill our supply requirements on the basis of individual purchase orders. We generally do not have long-term contracts with these manufacturers that guarantee capacity, the continuation of particular pricing terms or the extension of credit limits. Accordingly, they are not obligated to continue to fulfill our supply requirements and the prices we pay for manufacturing services could be increased on short notice. If we are required to change manufacturing partners, our ability to meet our scheduled product deliveries to our end-users could be adversely affected, which could cause the loss of sales to existing or potential end-users, delayed revenue, a strain upon our relationship or termination with the MSP partners who market our products, or an increase in our costs which could adversely affect our gross margins. Any production interruptions for any reason, such as a natural disaster, epidemic, capacity shortages or quality problems, at one of our manufacturing partners would negatively affect sales of our product lines manufactured by that manufacturing partner and adversely affect our business and operating results.
Managing the supply of our products and product components is complex. Insufficient supply and inventory may result in lost sales opportunities or delayed revenue, while excess inventory may harm our gross margins.
Our manufacturing partners procure components and build our products based on our purchase orders, and we generally do not hold inventory for a prolonged period of time. These forecasts are based on estimates of future demand for our products, which are in turn based on historical trends and analyses from our sales and product management organizations, adjusted for overall market conditions. In order to reduce manufacturing lead times and plan for adequate component supply, from time to time we may issue purchase orders for components and products that are non-cancelable and non-returnable.
Our inventory management systems and related supply chain visibility tools may be inadequate to enable us to forecast accurately and effectively manage supply of our products and product components. If we ultimately determine that we have excess supply, we may have to reduce our prices and write-down inventory, which in turn could result in lower gross margins. If our actual component usage and product demand are lower than the purchase order we provide to our manufacturing partners, we accrue for losses on manufacturing commitments in excess of forecasted demand. Alternatively, insufficient supply levels may lead to shortages that result in delayed product revenue or loss of sales opportunities altogether as potential MSP partners turn to competitors’ products that are readily available. If we are unable to effectively manage our supply and inventory, our operating results could be adversely affected.
Because some of the key components in our products come from limited sources of supply, we are susceptible to supply shortages or supply changes, which could disrupt or delay our scheduled product deliveries to our end-users and may result of in the loss of sales or a loss of MSP partner relationships.
Our products rely on key components, including our networking hardware such as access points, switches and routers, which our manufacturing partners purchase on our behalf from a limited number of component suppliers. The manufacturing operations of some of our component suppliers are geographically concentrated in Asia and elsewhere, which makes our supply chain vulnerable to regional disruptions, such as natural disasters, fire, political instability, civil unrest, a power outage or a localized health risk, and as a result could impair the volume of components that we are able to obtain.
Further, we do not have volume purchase contracts with any of our component suppliers, and they could cease selling to us at any time following the completion of an accepted purchase order. If we are unable to obtain a sufficient quantity of these components in a timely manner for any reason, sales of our products could be delayed or halted or we could be forced to expedite shipment of such components or our products at dramatically increased costs. Our component suppliers also change their selling prices frequently in response to market trends, including industry-wide increases in demand, and because we do not have volume purchase contracts with these component suppliers, we are susceptible to price fluctuations related to raw materials and components and may not be able to adjust our prices accordingly. Additionally, poor quality in any of the sole-sourced components in our products could result in lost sales or sales opportunities.
If we are unable to obtain a sufficient volume of the necessary components for our products on commercially reasonable terms or the quality of the components do not meet our requirements, we could also be forced to redesign our products and procure new components from alternate component suppliers. The resulting stoppage or delay in selling our products and the expense of redesigning our products could result in lost sales opportunities and damage to partner relationships, lawsuits and subject us to unclear liabilities and limits, which would adversely affect our business and operating results.
30
Our ability to sell our products and subscriptions is dependent on the quality of our technical support services and those of our MSP partners, and the failure to offer high-quality technical support services could have a material adverse effect on our MSP partners’ or their SMB customers’ satisfaction with our products and subscriptions, thereby causing MSP partners to purchase less of our products and subscriptions, which would adversely affect our business financial condition and operating results.
After our products and subscriptions are deployed within its network, an SMB depends on our MSP partners’ technical support services to resolve any issues relating to our products and realize the full benefits that our offerings provide. Although we make available to our MSP partners training materials in relation to our products, and we provide substantial customer support to our MSP partners to troubleshoot technical issues, SMB customers may not be satisfied with the service provided by our MSP partners. Our MSP partners often provide similar technical support for third-parties’ products, and may therefore have fewer resources to dedicate to the support of our products and subscriptions. If we or our MSP partners do not effectively assist our SMB customers in deploying our products and subscriptions, succeed in helping the SMB customers quickly resolve post-deployment issues or provide effective ongoing support, our ability to renew and expand our subscriptions with existing MSP partners would be adversely affected and our reputation with potential MSP partners could be damaged. Additionally, if our MSP partners do not effectively provide support to the satisfaction of their SMB customers, we may be required to provide direct support to such customers, which would require us to hire additional personnel and to invest in additional resources. It can take several months to recruit, hire and train qualified technical support employees. We may not be able to hire such resources fast enough to keep up with unexpected demand, particularly if the sales of our products exceed our internal forecasts. As a result, our ability and the ability of our MSP partners to provide adequate and timely support to their SMB customers will be negatively impacted, and customers’ satisfaction with our products and subscriptions will be adversely affected. Additionally, to the extent that we may need to rely on our sales engineers to provide post-sales support while we are ramping our support resources, our sales productivity will be negatively impacted, which would harm our revenues. Our failure or our MSP partners’ failure to provide and maintain high-quality support services could have a material adverse effect on our business, financial condition and operating results.
Our use of open source software in our products and subscriptions could negatively affect our ability to sell our products and subscriptions and subject us to possible litigation.
Our products and subscriptions contain software modules licensed to us by third-party authors under “open source” licenses. Some open source licenses contain requirements that we make available applicable source code for modifications or derivative works we create based upon the type of open source software we use. If we combine our proprietary software with open source software in a certain manner, we could, under certain open source licenses, be required to release the source code of our proprietary software to the public. This would allow our competitors to create similar products or subscriptions with lower development effort and time and ultimately could result in a loss of product sales for us.
Although we monitor and are mindful of our use of open source software to avoid subjecting our products and subscriptions to conditions we do not intend, the terms of many open source licenses have not been interpreted by United States courts, and there is a risk that these licenses could be construed in a way that could impose unanticipated conditions or restrictions on our ability to commercialize our products and subscriptions. From time to time, there have been claims against companies that distribute or use open source software in their products and subscriptions, asserting that open source software infringes the claimants’ intellectual property rights. We could be subject to suits by parties claiming infringement of intellectual property rights in what we believe to be licensed open source software. If we are held to have breached the terms of an open source software license, we could be required to seek licenses from third parties to continue offering our products and subscriptions on terms that are not economically feasible, to reengineer our products and subscriptions, to discontinue the sale of our products and subscriptions if reengineering could not be accomplished on a timely basis or to make generally available, in source code form, our proprietary code, any of which could adversely affect our business, operating results and financial condition.
In addition to risks related to license requirements, usage of open source software can lead to greater risks than use of third-party commercial software, as open source licensors generally do not provide warranties or assurance of title or controls on origin of the software. In addition, many of the risks associated with usage of open source software, such as the lack of warranties or assurances of title, cannot be eliminated, and could, if not properly addressed, negatively affect our business. We have established processes to help alleviate these risks, including a review process for screening requests from our development organizations for the use of open source software, but we cannot be sure that our processes for controlling our use of open source software in our products and subscriptions will be effective.
If we fail to meet contractual commitments related to response time, service level commitments relating to our business management tools or quality of professional services, we could be obligated to provide credits for future service, or face contract termination, which could adversely affect our business, operating results and financial condition.
Certain of our agreements contain service level agreements for our business management tools, under which we guarantee specified availability of our products and solutions. If we are unable to meet the stated service level commitments to our partners or suffer extended periods of unavailability of our products or solutions, we may be obligated to provide affected partners with service credits or
31
partners could elect to terminate and receive refunds for prepaid amounts. Any failure to meet these contractual commitments could adversely affect our revenue, operating results and financial condition and any failure to meet service level commitments or extended service outages of our product offerings could adversely affect our business and reputation as partners may elect not to renew and we could lose future sales.
Indemnity provisions in various agreements potentially expose us to substantial liability for intellectual property infringement and other similar claims and losses.
Our agreements with MSP partners and other third parties may include indemnification or other provisions under which we agree to indemnify or otherwise be liable to them for losses suffered or incurred as a result of claims of intellectual property infringement or similar intellectual property rights claims, damages caused by us to property or persons or other liabilities relating to or arising from the use of our hardware, software or services or other acts or omissions. The term of these contractual provisions often survives termination or expiration of the applicable agreement. As we continue to grow, the possibility of infringement claims and other intellectual property rights claims against us may increase. For any intellectual property indemnification claim against us or our partners, we may incur significant legal expenses and may have to pay damages, settlement fees, license fees and/or stop using technology found to be in violation of the third party’s rights. Large indemnity payments could harm our business, results of operations and financial condition. We may also have to seek a license for the infringing (or violative) or allegedly infringing (or violative) technology. Such license may not be available on reasonable terms, if at all, and may significantly increase our operating expenses or may require us to restrict our business activities and limit our ability to deliver certain products. As a result, we may also be required to develop alternative non-infringing (or non-violative) technology, which could require significant effort and expense and/or cause us to alter our hardware or software, which could negatively affect our business.
From time to time, MSP partners may require us to indemnify or otherwise be liable to them. Although we normally contractually limit our liability with respect to such obligations, the existence of such a dispute may have adverse effects on our partner relationship and reputation and we may still incur substantial liability related to them.
Any assertions by a third party, whether or not successful, with respect to such indemnification obligations could subject us to costly and time-consuming litigation, expensive remediation and licenses, divert management attention and financial resources, harm our relationship with that partner and other current and prospective partners, reduce demand for our platform and harm our brand, business, results of operations and financial condition.
Our relatively limited operating history makes it difficult to evaluate our current business and prospects and may increase the risk that we will not be successful.
Our relatively limited operating history makes it difficult to evaluate our current business and prospects and plan for our future growth. We were founded in 2007, with much of our growth occurring in recent years. As a result, our business model has not been fully proven, which subjects us to a number of uncertainties, including our ability to plan for and model future growth. We have encountered and will continue to encounter risks and uncertainties frequently experienced by rapidly growing companies in developing markets, including our ability to achieve broad market acceptance of our products and services, attract additional MSP partners, withstand increasing competition and manage increasing expenses as we continue to grow our business. If our assumptions regarding these risks and uncertainties are incorrect or change in response to changes in the market for our products and services, our operating and financial results could differ materially from our expectations and our business could suffer.
Acquisitions present many risks that could have a material adverse effect on our business and results of operations.
In order to expand our business, we have made several acquisitions and expect to continue acquiring or investing in businesses, joint ventures, products and platform capabilities or technologies that we believe could complement or expand our offerings, enhance our technical capabilities or otherwise offer growth opportunities. The success of our future growth strategy will depend on our ability to identify, negotiate, complete and integrate acquisitions and, if necessary, to obtain satisfactory debt or equity financing to fund those acquisitions. Acquisitions are inherently risky, and any acquisitions we complete may not be successful. Our past acquisitions and any mergers and acquisitions that we may undertake in the future involve numerous risks, including, but not limited to, the following:
•diversion of our management’s attention from normal daily operations of our business;
•our inability to maintain the key business relationships and the reputations of the businesses we acquire;
•uncertainty of entry into markets in which we have limited or no prior experience and in which competitors have stronger market positions;
•our dependence on unfamiliar affiliates, resellers, distributors and partners of the companies we acquire;
32
•our inability to increase revenue from an acquisition for a number of reasons, including our failure to drive demand in our existing partner base for acquired products and our failure to obtain renewals or upgrades and new product sales from customers of the acquired businesses;
•charges to our operating results from expenses incurred to effect the acquisition;
•increased costs related to acquired operations and continuing support and development of acquired products;
•changes in the fair value of any contingent consideration;
•charges to our operating results due to duplicative pre-merger activities;
•costs incurred to combine the operations of companies we acquire, such as transitional employee expenses and employee retention or relocation expenses;
•potential loss of key employees of the companies we acquire;
•our responsibility for the liabilities of the businesses we acquire;
•identification of, or changes to, assumed contingent liabilities;
•charges to our operating results due to the expensing of certain stock awards assumed in an acquisition;
•potential goodwill and intangible asset impairment charges, including a reduction in the useful lives of intangible assets acquired, and amortization associated with acquired businesses;
•long-lived asset impairment charges;
•adverse tax consequences associated with acquisitions;
•changes in how we are required to account for our acquisitions under U.S. generally accepted accounting principles, including arrangements that we assume from an acquisition;
•potential negative perceptions of our acquisitions by partners, financial markets or investors;
•failure to obtain required approvals from governmental authorities under competition and antitrust laws on a timely basis, if at all, which could, among other things, delay or prevent us from completing a transaction, or otherwise restrict our ability to realize the expected financial or strategic goals of an acquisition;
•potential increases in our interest expense, leverage and debt service requirements if we incur additional debt to pay for an acquisition; and
•our inability to apply and maintain our internal standards, controls, procedures and policies to acquired businesses.
Acquisitions or asset purchases made entirely or partially for cash may reduce our cash reserves or require us to incur additional debt under our credit agreements or otherwise. We may seek to obtain additional cash to fund an acquisition by selling equity or debt securities. We may be unable to secure the equity or debt funding necessary to finance future acquisitions on terms that are acceptable to us. If we finance acquisitions by issuing equity or convertible debt securities, our existing stockholders will experience ownership dilution.
Additionally, when we acquire businesses, we allocate the purchase price to tangible assets and liabilities and identifiable intangible assets acquired at their acquisition date fair values. Any residual purchase price is recorded as goodwill, which is also generally measured at fair value. We also estimate the fair value of any contingent consideration. Our estimates of fair value are based upon assumptions believed to be reasonable, but which are uncertain and involve significant judgments by management.
The occurrence of any of these risks could have a material adverse effect on our business, results of operations, financial condition or cash flows, particularly in the case of a larger acquisition or substantially concurrent acquisitions. Changes to our operating results in any given period could differ substantially from other periods based on the timing and size of our acquisitions and the extent of integration activities.
Our operating margins and cash flows from operations could fluctuate as we make further expenditures to expand our operations in order to support additional growth in our business.
We have made significant investments in our operations to support additional growth, such as hiring substantial numbers of new personnel, investing in new facilities, acquiring other companies or their assets and establishing and broadening our international
33
operations in order to expand our business. We have made substantial investments in recent years to increase our sales and marketing operations in Europe, the Middle East and Africa, or EMEA, and the Asia-Pacific, or APAC, regions and expect to continue to invest to grow our international sales and global brand awareness. We have made multiple acquisitions in past years and expect these acquisitions will continue to increase our operating expenses in future periods. These investments may not yield increased revenue, and even if they do, the increased revenue may not offset the amount of the investments. We also expect to continue to pursue acquisitions in order to expand our presence in current markets or new markets, many or all of which may increase our operating costs more than our revenue. As a result of any of these factors, our operating income could fluctuate and may decline as a percentage of revenue relative to our prior annual periods.
Our software, website, hardware, hosted and internal systems may be subject to intentional or accidental disruption or penetration from external attackers or insiders that could adversely impact our reputation and future sales. If our end-users or third-party service providers experience data losses, security incidents and breaches via our products or solutions, our brand, reputation and business could be harmed.
Our MSP partners rely on our archiving and other solutions to protect, transfer or store the corporate data of their SMB customers, which may include financial records, credit card information, business information, health information, other personally identifiable information or other sensitive personal information. Due to the nature of our business and our storage of this sensitive data, we have previously and could be in the future a target of, or subject to, a wide variety of attacks or security incidents. In addition to threats from traditional computer “hackers,” malicious code (such as malware, viruses, trojans, worms and ransomware), employee theft or misuse, password spraying, phishing, credential stuffing and denial-of-service attacks, we also face threats from sophisticated organized crime, nation-state and nation-state supported actors who engage in attacks (including advanced persistent threat intrusions) that add to the risks our internal systems and our MSP partners’ systems, as well as the virtualized systems of our MSP partners and the information that those systems store and process. We could also experience security incidents due to the non-malicious but incorrect actions (or inactions) of our employees or business partners that could affect our security.
Despite significant efforts to create barriers to such security threats, it is virtually impossible for us to entirely mitigate these risks, especially where they are attributable to the behavior of independent third parties beyond our control. The security measures we have implemented or integrated into our internal systems and networks, which are designed to detect unauthorized activity and prevent or minimize security breaches, may not function as expected or may not be sufficient to protect us against certain attacks. Furthermore, the relative cost and operational requirements associated with maintaining such barriers may increase in the future. We are also subject to additional data security requirements relating to our acceptance of credit card and debit card payments. If we fail to comply with the rules or requirements of any provider of a payment method we accept, if the volume of fraud in our transactions limits or terminates our rights to use payment methods we currently accept, or if a data breach occurs relating to our payment systems, we may, among other things, be subject to fines or higher transaction fees and may lose, or face restrictions placed upon, our ability to accept credit card and debit card payments from customers or facilitate other types of online payments.
Experienced computer hackers may attempt to penetrate our infrastructure or applications due to inadequate security posture or ineffective controls (i.e. missing patches, technology failures, etc.) or to trick our employees into taking actions that compromise our security (such as via phishing or business email compromise attacks) in order to misappropriate proprietary information and/or cause interruptions of our services and/or expose perceived security vulnerabilities. It is also possible that systems may be disrupted or our sensitive information or the information of our SMBs might be exposed due to malfeasance or errors by employees or contractors.
In addition, techniques used to sabotage or to obtain unauthorized access to systems and networks in which data is stored, or through which data is transmitted, change frequently and generally are not recognized until launched against a target. As a result, it may not be possible for us to anticipate these techniques or implement adequate preventative measures to prevent an electronic intrusion into our systems and networks and we may be required to expend significant capital and financial resources to protect against such threats or to alleviate problems caused by breaches in systems, network or data security. If an actual or perceived breach of network security occurs as a result of third-party action, including cyber-attacks or other intentional misconduct by computer hackers, error or malfeasance by insiders, or otherwise, it could adversely affect the market perception of our company and our solutions, reduce demand for our solutions, cause a significant number of our MSP partners to terminate their monthly subscriptions and thereby cause significant revenue loss and may expose us to data loss, litigation and possible liability including fines, penalties and damages. In addition, such a security breach could impair our ability to operate our business, including our ability to provide support services to our MSP partners.
Third parties may attempt to fraudulently induce employees, contractors or partners into disclosing sensitive information such as usernames, passwords or other information. Third parties may also compromise the security of our internal electronic systems, networks and/or physical facilities or those of our partners, in order to gain access to our data or the data of our MSP partners or their SMB customers. Our MSP partners may also disclose or lose control of their API keys, secrets or passwords, or use the same or similar secrets or passwords on third-parties’ systems, which could lead to unauthorized access to their accounts (arising from, for example, an independent third-party data security incident that compromises those API keys, secrets or passwords). Through such means, as well as others, our MSP partners or their SMB customers may experience a data loss and/or breach in their own IT infrastructure and a number
34
of our Unified Continuity partners do not adhere to security best practices (i.e. have secondary replication enabled, etc.) such that the data they back up could be destroyed or compromised if the physical device they possess is directly impacted by the loss and/or breach event.
Security breaches impacting us could result in a risk of loss, unavailability or unauthorized disclosure of sensitive SMB customer information, which, in turn, could lead to significant legal and financial exposure, regulatory or government audits and investigations and possible liability (including regulatory fines), a loss of confidence in our security, interruptions or malfunctions in our operations. Ultimately, any of these consequences could have a negative impact on our ability to attract new MSP partners and to grow or maintain our revenue. Specifically, loss of confidence in our operations and products may cause a significant portion of our MSP partners to terminate their monthly subscriptions, thereby causing a significant decrease in revenue. Furthermore, any such breach, including a breach of the systems or networks of our third-party suppliers or integrators, could compromise our systems or networks, creating system disruptions or slowdowns and exploiting security vulnerabilities of our networks, or the networks of our MSP partners, and the information stored on our network or the networks of our partners could be accessed, publicly disclosed, altered, lost or stolen, which could subject us to liability and cause us financial harm. These breaches, or any perceived breach, of our systems or networks or the systems of our partners, whether or not any such breach is due to our vulnerability, may also undermine confidence in us or our industry and result in damage to our reputation, negative publicity, loss of partners and sales, increased costs to remedy any problem and costly litigation or regulatory fines.
Our insurance coverage, covering certain security and privacy damages, may be inadequate or may not be available in the future on acceptable terms, or at all. In addition, our policy may not cover any claim against us for loss of data or other indirect or consequential damages. Defending a suit based on any data loss or system disruption, regardless of its merit, could be costly and divert management’s attention.
Defects, failures, vulnerabilities or lack of availability in our or our third-parties’ software, solutions, infrastructure and hardware could harm our reputation, reduce the sales of our solutions and expose us to liability for losses.
Because our software, solutions, infrastructure and hardware are complex, undetected errors, failures or bugs may occur, especially when new software, solutions, infrastructure and hardware are first introduced or when new versions or updates are released, or when we introduce an acquired company’s solutions or services, despite our efforts to test those solutions and enhancements prior to release. This includes not only vulnerabilities that are specific to our software, solutions, infrastructure and hardware, but also vulnerabilities that impact the third-party or open source software that we use or the hardware that we rely on. In addition, to the extent that we do not effectively address capacity constraints, upgrade our infrastructure and systems as needed, our business, financial condition and results of operations may be adversely affected. We may not be able to correct defects, errors, vulnerabilities or failures promptly, or at all.
Any defects, errors, vulnerabilities or failures in our software, solutions, infrastructure and hardware or in third-party software, solutions, infrastructure or hardware that we rely on could result in:
•expenditure of significant financial and development resources in efforts to analyze, correct, eliminate or work around errors or defects or to address and eliminate vulnerabilities;
•loss of existing or potential partners or loss of partner confidence, including a widespread loss of partners simultaneously;
•loss or disclosure of our SMB customers’ confidential information or the inability to access such information;
•loss of our proprietary technology;
•our solutions being susceptible to hacking or electronic break-ins or otherwise failing to secure data;
•delayed or lost revenue, particularly in relation our BCDR solutions, which comprise a significant portion of our revenue;
•delay or failure to attain market acceptance;
•lost market share;
•negative publicity, which could harm our reputation; or
•litigation, regulatory inquiries or investigations that would be costly and harm our reputation.
In particular, because we utilize various types of software and other technology, as well as intellectual property rights, licensed from unaffiliated third parties in order to provide and improve certain elements of our solutions, any errors or defects in any third-party technology could result in errors in our solutions that could harm our business. In addition, licensed technology and intellectual property rights may not continue to be available on commercially reasonable terms, or at all. While we believe that there are currently adequate replacements for the third-party technology we use, any loss of the right to use any of this technology on commercially reasonable terms, or at all, could result in delays in producing or delivering our solutions until equivalent technology is identified and integrated, which
35
delays could harm our business. In this situation we would be required to either redesign our solutions to function with software available from other parties or to develop these components ourselves, which would result in increased costs. Furthermore, we might be forced to limit the features available in our current or future solutions. If we fail to maintain or renegotiate any of these technology or intellectual property licenses, we could face significant delays and diversion of resources in attempting to develop similar or replacement technology, or to license and integrate a functional equivalent of the technology. Our ability to effectively manage our business depends significantly on our information systems and platforms provided by third parties, including Oracle and Amazon. If we are unable to maintain our current relationships with these service providers, there is no assurance that we will be able to locate replacements on a timely basis or on acceptable terms. The failure of our information systems to operate effectively, problems with transitioning to upgraded or replacement systems or expanding them, or a breach in security of these systems, could materially adversely affect the efficiency of our business and operations.
Limitation of liability provisions in our standard terms and conditions and our other agreements may not adequately or effectively protect us from any claims related to defects, errors, vulnerabilities or failures in our solutions or those of the third-parties we rely on, including as a result of federal, state or local laws or ordinances or unfavorable judicial decisions in the United States or other countries.
The material stored on our servers may subject us to negative publicity, legal liability and expenditures.
We are not aware of the contents of the data that MSP partners store using our solutions, including our BCDR products. Our BCDR products operate by taking a complete snapshot of operating systems, applications, emails and other content, which is then encrypted and transmitted to our servers. Our employees generally do not have access to view or monitor what is actually stored within this hybrid cloud solution. To the extent that sensitive, personally identifiable, illegal or controversial data is stored in our servers and that becomes known publicly, it may create negative publicity and cause us to incur legal expenses. In 2015, it was publicized that we had backed up a prominent federal government employee’s personal email account, which contained classified and sensitive emails. While we had no role in monitoring the content or source of data stored by the MSP partners, our involvement in the storage of the emails caused our executive officers and employees to divert time from running the day to day operations of the business in order to cooperate with federal agencies and resulted in some negative press. Furthermore, because we do not monitor the data, we cannot ensure that the usage of our solutions complies with the license terms of the end-users’ software. If their usage of our BCDR products causes them to violate these license terms, the software vendors make seek legal redress from us.
We have no intention to begin monitoring the contents or nature of the data that is being stored through our solutions. Accordingly, due to storage of sensitive, illegal or controversial material, we may face in the future reputational harm, or harm to our results of operations and financial condition loss of partners, legal proceedings or actions against us by government entities or others.
Interruptions or delays in services provided by our data centers or other third parties could impair the delivery of our service and harm our business.
Our continued growth depends on the ability of our partners to access our solutions 24 hours a day, seven days a week, without any meaningful interruption or degradation of service. We have in the past and may in the future experience disruptions, outages and other performance problems within our infrastructure and our third-party providers’ infrastructure, including:
•cooling system failures that lead to the shutdown of our systems or the overheating of our servers, increasing the likelihood of hardware failures;
•the physical relocation of servers to new facilities, which may cause infrastructure to be damaged, lost or stolen; or
•data centers maintaining inadequate diversity among internet service providers, leading to redundant pathing and possible total facility outages.
We currently lease spaces from data center service providers in the United States, Canada, the United Kingdom, Germany, Iceland, Singapore and Australia, and our servers that are stored at these data centers form the basis of the Datto Cloud. In addition to relying on our data center service providers, we also rely on other third parties to maintain our cloud infrastructure and deploy our solutions. Any damage to, or failure or disruption of, the systems of our data centers, including from cyber-attacks, natural disasters, fires, floods, telecommunications failures, power loss or other similar events beyond our control, could result in interruptions to our service or our ability to successfully restore an end-user’s data when needed. The failure of our data centers to meet our capacity requirements could result in interruptions in the availability of our solutions, impair the functionality of our solutions or impede our ability to scale our operations. Additionally, due to the uncertainty of Brexit, there may occur mass requests for data migrations or service cancellations relating to our data centers in the United Kingdom. Any failure to meet these service requests or a public mass cancellation of our data center services in the United Kingdom could cause reputational harm and harm to our business.
As we continue to add data centers, restructure our data management plans and increase capacity in existing and future data centers, we may move or transfer our data and our partners’ data. Despite precautions taken during such processes and procedures, any unsuccessful data transfers may impair the delivery of our service, and we may experience costs or downtime in connection with the
36
transfer of data to other facilities. Similarly, some of our solutions’ features run or depend on IT services run by third parties, such as data feeds or public clouds, and an extended failure of such services might materially and adversely impact our ability to provide our services to our partners. Furthermore, some of our sales and business operations depend in part on third-party IT service providers and if those services were to be unavailable for extended periods of time it might materially and adversely affect our ability to operate.
We also rely on bandwidth providers, Internet service providers, mobile networks and other third-party IT service providers to operate our business, and to deliver our solutions. If we lose the services of one or more of our bandwidth providers, or if these providers experience outages, for any reason, we could experience disruption in delivering our solutions or we could be required to retain the services of a replacement bandwidth provider. Our business also depends on our partners having high-speed access to the Internet in order to purchase our offerings online and obtain access to the Datto portal for MSP partners. Any Internet outages or delays could adversely affect our ability to provide our solutions to our partners.
Our operations rely heavily on the availability of electricity, which also comes from third-party providers. If we were to experience a major power outage or if the cost of electricity were to increase significantly, our operations and financial results could be harmed. If we or our data centers were to experience a major power outage, we or they would have to rely on back-up generators, which might not work properly or might not provide an adequate power supply during a major power outage. Such a power outage could result in a significant disruption of our business.
The occurrence of an extended interruption of our or third-party services for any reason could result in lengthy interruptions in our services or in the delivery of partners’ email and require us to provide service credits, refunds, indemnification payments or other payments to our partners, and could also result in the loss of partners.
If we fail to integrate our products with a variety of operating systems, software applications, platforms and hardware that are developed by others or ourselves, our products may become less competitive or obsolete and our results of operations would be harmed.
Our products must integrate with a variety of network, hardware and software platforms, including, specifically, new versions of Windows and new file systems such as ReFS, introduced by Microsoft, and we need to continuously modify and enhance our products to adapt to changes in hardware, software, networking, browser and database technologies. We believe a significant component of our value proposition to partners is the ability to optimize and configure our products to integrate with our systems and those of third parties. If we are not able to integrate our products in a meaningful and efficient manner, demand for our products could decrease and our business and results of operations would be harmed.
In addition, we have a large number of products, and maintaining and integrating them effectively requires extensive resources. Our continuing efforts to make our products more interoperative may not be successful. Failure of our products to operate effectively with future infrastructure platforms and technologies could reduce the demand for our products, resulting in partner dissatisfaction and harm to our business. If we are unable to respond to changes in a cost-effective manner, our products may become less marketable, less competitive or obsolete and our business and results of operations may be harmed.
Claims by others that we infringe or violate their proprietary technology or other rights, or other lawsuits asserted against us, could result in significant costs and substantially harm our business, financial condition, results of operations and prospects.
A number of companies in our industry hold a large number of patents and also protect their copyright, trade secret and other intellectual property rights, and companies in the networking and security industry frequently enter into litigation based on allegations of patent infringement or other violations of intellectual property rights. In addition, patent holding companies seek to monetize patents they previously developed, have purchased or otherwise obtained. Many companies, including our competitors, may now, and in the future, have significantly larger and more mature patent, copyright, trademark and trade secret portfolios than we have, which they may use to assert claims of infringement, misappropriation and other violations of intellectual property rights against us. In addition, future litigation may involve non-practicing entities (also known as patent trolls) or other patent owners who have no relevant product offerings or revenue and against whom our own patents may therefore provide little or no deterrence or protection. As we face increasing competition and gain an increasingly higher profile, including as a result of becoming a public company, the possibility of intellectual property rights claims against us grows. Third parties, including but not limited to patent trolls, have asserted in the past and may in the future assert claims of infringement of intellectual property rights against us and these claims, even without merit, could harm our business, including by increasing our costs, reducing our revenue, creating partner concerns that result in delayed or reduced sales, distracting our management and technical experts from the running of our business and requiring us to cease use of important intellectual property. While we have managed to enter into release and settlement agreements with respect to intellectual property infringement or similar lawsuits brought by and against us, we cannot be certain that the counterparties to these release and settlement agreements will abide by their obligations as set forth in these agreements. In addition, because patents can take years to issue and are often afforded confidentiality for some period of time, there may currently be pending applications, unknown to us, that later result in issued patents that could cover one or more of our services. Moreover, in a patent infringement claim against us, we may assert, as a defense, that we do not infringe the relevant patent claims, that the patent is invalid or both. The strength of our defenses will depend on the patents asserted, the
37
interpretation of these patents and our ability to invalidate the asserted patents. However, we could be unsuccessful in advancing non-infringement and/or invalidity arguments in our defense. In the United States, issued patents enjoy a presumption of validity, and the party challenging the validity of a patent claim must present clear and convincing evidence of invalidity, which is a high burden of proof. Conversely, the patent owner need only prove infringement by a preponderance of the evidence, which is a lower burden of proof. Furthermore, because of the substantial amount of discovery required in connection with patent and other intellectual property rights litigation, there is a risk that some of our confidential information could be compromised by the discovery process.
If we are not successful in defending against third-party claims that arise, we could be required to pay substantial damages for past and future sales and/or licensing of our services, enjoined from making, using, selling or otherwise offering our services if a license or other right to continue selling our services is not made available to us, and required to pay substantial ongoing royalties and comply with unfavorable terms even if such a license is made available to us. Any of these outcomes could result in a material adverse effect on our business. Even if we were to prevail, these lawsuits, and any other third-party infringement claims, could be costly and time-consuming, divert the attention of our management and key personnel from our business operations, deter MSP partners from selling or licensing our services and dissuade potential partners from purchasing our services, which would also materially harm our business. In addition, any public announcements of the results of any proceedings in these or other third-party infringement claims could be negatively perceived by industry or financial analysts and investors and could cause our stock price to experience volatility or decline. The expense of litigation and the timing of this expense from period to period are difficult to estimate, subject to change and could adversely affect our results of operations.
As the number of products and competitors in our market increases and overlaps occur, claims of infringement, misappropriation and other violations of intellectual property rights may increase. Our insurance may not cover intellectual property rights infringement claims or other claims related to violations of intellectual property rights. Third parties have in the past and may in the future also assert infringement or similar claims against our MSP partners, with whom our agreements may obligate us to indemnify against these claims. In addition, to the extent we hire personnel from competitors, we may be subject to allegations that such employees have divulged proprietary or other confidential information to us.
In the event that we fail to successfully defend ourselves against an infringement claim or similar intellectual property rights claim, a successful claimant could secure a judgment or otherwise require payment of legal fees, settlement payments, ongoing royalties or other costs or damages; or we may agree to a settlement that prevents us from offering certain services or features; or we may be required to obtain a license, which may not be available on reasonable terms, or at all, to use the relevant technology. If we are prevented from using certain technology or intellectual property, we may be required to develop alternative, non-infringing (or non-violative) technology, which could require significant time, during which we could be unable to continue to offer our affected services or features, effort and expense and may ultimately not be successful.
From time to time, the U.S. Supreme Court, other U.S. federal courts and the U.S. Patent and Trademark Appeals Board, and their foreign counterparts, have made and may continue to make changes to the interpretation of patent laws in their respective jurisdictions. We cannot predict future changes to the interpretation of existing patent laws or whether U.S. or foreign legislative bodies will amend such laws in the future. Any changes may lead to uncertainties or increased costs and risks surrounding the outcome of third-party intellectual property rights claims brought against us and the actual or enhanced damages, including treble damages, that may be awarded in connection with any such current or future claims and could have a material adverse effect on our business and financial condition.
Any of these events could materially and adversely harm our business, financial condition and results of operations.
We may become involved in other litigation that may materially adversely affect us.
From time to time, we may become involved in various legal proceedings relating to matters incidental to the ordinary course of our business, including patent and other intellectual property claims, commercial, product liability, employment, class action, whistleblower and other litigation and claims and governmental and other regulatory investigations and proceedings. Such matters can be time-consuming, divert management’s attention and resources, cause us to incur significant expenses or liability and/or require us to change our business practices. In addition, the expense of litigation and the timing of this expense from period to period are difficult to estimate, subject to change and could adversely affect our results of operations. Because of the potential risks, expenses and uncertainties of litigation, we may, from time to time, settle disputes, even where we have meritorious claims or defenses, by agreeing to settlement agreements. Because litigation is inherently unpredictable, we cannot assure you that the results of any of these actions will not have a material adverse effect on our business, financial condition, results of operations and prospects.
The success of our business depends in part on our ability to protect and enforce our intellectual property rights.
We believe our intellectual property is an essential asset of our business and our success and ability to compete depend in part upon protection of our intellectual property rights. We rely on a combination of patent, copyright, trademark and trade secret laws, as well as confidentiality procedures and contractual provisions, to establish and protect our intellectual property rights, all of which provide only limited protection. The efforts we have taken to protect our intellectual property rights may not be sufficient or effective, and our patents,
38
trademarks and copyrights may be held invalid or unenforceable. Moreover, we cannot assure you that any patents will be issued with respect to our currently pending patent applications in a manner that gives us adequate defensive protection or competitive advantages, or that any patents issued to us will not be challenged, invalidated or circumvented. We have filed for patents in the United States and in certain non-U.S. jurisdictions, but such protections may not be available in all countries in which we operate or in which we seek to enforce our intellectual property rights, or may be difficult to enforce in practice. For example, many foreign countries have compulsory licensing laws under which a patent owner must grant licenses to third parties. In addition, many countries limit the enforceability of patents against certain third parties, including government agencies or government contractors. In these countries, patents may provide limited or no benefit. Moreover, we may need to expend additional resources to defend our intellectual property rights in these countries, and our inability to do so could impair our business or adversely affect our international expansion. Our currently issued patents and any patents that may be issued in the future with respect to pending or future patent applications may not provide sufficiently broad protection or they may not prove to be enforceable in actions against alleged infringers. Additionally, the U.S. Patent and Trademark Office and various foreign governmental patent agencies require compliance with a number of procedural, documentary, fee payment and other similar provisions during the patent application process and to maintain issued patents. There are situations in which noncompliance can result in abandonment or lapse of the patent or patent application, resulting in partial or complete loss of patent rights in the relevant jurisdiction. If this occurs, it could materially harm our business, operating results, financial condition and prospects.
We believe that our trademarks are integral to our business and our success in building our brand image and customer loyalty. We rely on trademark registrations and common law trademark rights to protect the distinctiveness of our brand and have registered, or have applied to register, those trademarks that we believe are important to our business with the United States Patent and Trademark Office. We cannot assure you that our applications will be approved or that these registrations will prevent imitation of our name or the infringement or other violation of our other intellectual property rights by others. Third parties may also oppose our trademark applications or otherwise challenge our use of the trademarks. Imitation of our name or website design in a manner that projects lesser quality or carries a negative connotation of our brand image could have a material adverse effect on our business, financial condition and results of operations.
We may not be effective in policing unauthorized use of our intellectual property rights, and even if we do detect infringements or other violations, litigation may be necessary to enforce our intellectual property rights. In addition, our intellectual property may be stolen, including by cybercriminals, and we may not be able to identify the perpetrators or prevent the exploitation of our intellectual property by our competitors or others. Protecting against the unauthorized use of our intellectual property rights, technology and other proprietary rights is expensive and difficult, particularly outside of the United States. Any enforcement efforts we undertake, including litigation, could be time-consuming and expensive and could divert management’s attention, either of which could harm our business, operating results and financial condition. Further, attempts to enforce our rights against third parties could also provoke these third parties to assert their own intellectual property or other rights against us, or result in a holding that invalidates or narrows the scope of our rights, in whole or in part. The inability to adequately protect and enforce our intellectual property and other proprietary rights could seriously harm our business, operating results, financial condition and prospects. Even if we are able to secure our intellectual property rights, we cannot assure you that such rights will provide us with competitive advantages or distinguish our services from those of our competitors or that our competitors will not independently develop similar technology, duplicate any of our technology or design around our patents.
Our ability to provide services to our partners depends on our partners’ continued high-speed access to the internet and the continued reliability of the internet infrastructure.
Our business depends on our MSP partners’ continued high-speed access to the internet, as well as the continued maintenance and development of the internet infrastructure. The future delivery of our solutions will depend on third-party internet service providers to expand high-speed internet access, to maintain a reliable network with the necessary speed, data capacity and security and to develop complementary solutions and services, including high-speed modems, for providing reliable and timely internet access and services. All of these factors are out of our control. To the extent that the internet continues to experience an increased number of users, frequency of use or bandwidth requirements, the internet may become congested and be unable to support the demands placed on it, and its performance or reliability may decline. Any internet outages or delays could adversely affect our ability to provide services to our partners.
Currently, internet access is provided by telecommunications companies and internet access service providers that have significant and increasing market power in the broadband and internet access marketplace. In the absence of government regulation, these providers could take measures that affect their customers’ ability to use our products and services, such as attempting to charge their customers more for using our products and services. To the extent that internet service providers implement usage-based pricing, including meaningful bandwidth caps, or otherwise try to monetize access to their networks, we could incur greater operating expenses and partner acquisition and retention could be negatively impacted. Furthermore, to the extent network operators were to create tiers of internet access service and either charge us for or prohibit our services from being available to our partners through these tiers, our business could be negatively impacted. Some of these providers also offer products and services that directly compete with our own offerings, which could potentially give them a competitive advantage.
39
If we are unable to sustain market recognition of and loyalty to our brand, or if our reputation were to be harmed, we could lose partners or fail to increase the number of our partners, which could harm our business, financial condition and operating results.
Given our market focus, maintaining and enhancing the “Datto” brand among MSPs is critical to our success. We believe that the importance of brand recognition and loyalty among MSPs will increase in light of increasing competition in our markets. We plan to continue investing substantial resources to promote our brand to MSPs, both domestically and internationally, but there is no guarantee that our brand development strategies will enhance the recognition of our brand. Some of our existing and potential competitors have well-established brands with greater general recognition than we have. If our efforts to promote and maintain our brand are not successful, our operating results and our ability to attract and retain partners may be adversely affected. In addition, even if our brand recognition and loyalty increases, this may not result in increased use of our solutions or higher revenue. Additionally, if our MSP partners do not use or ineffectively use our solutions to serve their SMB customers, our reputation and ability to grow our business may be harmed.
Our solutions, as well as those of our competitors, are regularly reviewed in computer and business publications. Negative reviews, or reviews in which our competitors’ solutions and services are rated more highly than our solutions, could negatively affect our brand and reputation in the view of MSPs. From time-to-time, our partners express dissatisfaction with our solutions, including, among other things, dissatisfaction with our customer support, our billing policies and the way our solutions operate. If we do not handle partner complaints effectively, our brand and reputation may suffer, we may lose our partners’ confidence and they may choose not to renew their subscriptions. In addition, many of our MSP partners participate in online blogs about computers and internet services, and software and technology, including our solutions, and our success depends in part on our ability to generate positive feedback through such online channels where MSP partners seek and share information. If actions that we take or changes that we make to our solutions upset these MSP partners, their blogging could negatively affect our brand and reputation. Complaints or negative publicity about our solutions or billing practices could adversely impact our ability to attract and retain partners and our business, financial condition and operating results.
If we cannot maintain our corporate culture as we grow, our business may be harmed.
We believe that our corporate culture has been a critical component to our success and that our culture creates an environment that drives our employees and perpetuates our overall business strategy. We have invested substantial time and resources in building our team and we expect to continue to hire aggressively as we expand, including with respect to our international operations. As we grow and mature as a public company and grow internationally, we may find it difficult to maintain our corporate culture. We face additional challenges in maintaining our culture as most of our employees have worked remotely for an extended period of time during the COVID-19 pandemic, with a growing number of new employees only experiencing Datto culture while working from home. Any failure to preserve our culture could negatively affect our future success, including our ability to recruit and retain personnel and effectively focus on and pursue our business strategy.
Foreign currency exchange rate fluctuations could harm our financial results.
We conduct significant transactions, including revenue transactions and intercompany transactions, in currencies other than the U.S. Dollar or the functional operating currency of the transactional entities. In addition, our international subsidiaries maintain significant net assets that are denominated in currencies other than the functional operating currencies of these entities. Accordingly, changes in the value of currencies relative to the U.S. Dollar may impact our consolidated revenues and operating results due to transactional and translational remeasurement that is reflected in our earnings. It is particularly difficult to forecast any impact from exchange rate movements, so there is risk that unanticipated currency fluctuations could adversely affect our financial results or cause our results to differ from investor expectations or our own guidance in any future periods. In addition, the announcement of Brexit adversely impacted global markets, including currencies, and resulted in a decline in the value of the British pound, as compared to the U.S. Dollar and other currencies. Volatility in exchange rates and global financial markets is expected to continue due to a number of factors, including uncertainty surrounding Brexit and the recent political and economic uncertainty globally.
We are subject to fluctuations in interest rates.
Borrowings under our credit agreement are subject to variable rates of interest and expose us to interest rate risk. At present, we do not have any outstanding borrowings nor do we have any interest rate swap agreements, which involve the exchange of floating for fixed rate interest payments to reduce interest rate volatility. However, to the extent we incur borrowings, we may decide to enter into such swaps in the future. If we do, we may not maintain interest rate swaps with respect to all of our variable rate indebtedness and any swaps we enter into may not fully mitigate our interest rate risk, may prove disadvantageous or may create additional risks.
40
Our indemnification obligations and limitations of our director and officer liability insurance may have a material adverse effect on our financial condition, results of operations and cash flows.
Under Delaware law, our certificate of incorporation, our bylaws and certain indemnification agreements to which we are a party, we have an obligation to indemnify, or we have otherwise agreed to indemnify, certain of our current and former directors and officers with respect to past, current and future investigations and litigation.
The scope of our indemnification obligations may be broader than the coverage available under our directors’ and officers’ liability insurance, or there may be insufficient coverage available. Further, in the event the directors and officers are ultimately determined not to be entitled to indemnification, we may not be able to recover any amounts we previously advanced to them.
We cannot provide any assurances that future indemnification claims, including the cost of fees, penalties or other expenses, will not exceed the limits of our insurance policies, that such claims are covered by the terms of our insurance policies or that our insurance carrier will be able to cover such claims. Further, should a coverage dispute arise, we may also incur significant expenses in relation to litigating or attempting to resolve any such dispute. Accordingly, we may incur significant unreimbursed costs to satisfy our indemnification obligations, which may have a material adverse effect on our financial condition, results of operations or cash flows.
We have identified a material weakness in our internal control over financial reporting, resulting from control deficiencies identified in our IT general controls and process level controls. If we are unable to remediate this material weakness, we may not be able to accurately or timely report our financial condition or results of operations, which may adversely affect investor confidence in us and, as a result, the value of our common stock.
A material weakness is a deficiency, or a combination of deficiencies, in internal control over financial reporting, such that there is a reasonable possibility that a material misstatement of a company’s annual or interim financial statements will not be prevented or detected on a timely basis. We have identified a material weakness in our internal control over the financial statement close process. Specifically:
•IT general controls
◦End-users are routinely making direct changes to data tables with limited logging/traceability;
◦Business process segregation of duties rule set has not been defined;
◦Segregation of duties conflicts are present in the IT processes (e.g. developer vs. production);
◦Documentation to evidence the performance of controls is not consistently retained;
◦Access to administrative roles and data is not restricted; and
◦System limitations may impair management’s ability to implement review/detective controls.
•Process level controls
◦Controls identified do not thoroughly document the nature and extent of procedures performed;
◦We have not identified appropriate controls to ensure system-generated reports are complete and accurate;
◦We have not identified appropriate controls for relevant applications and tools used to initiate, process, record, or report financial information; and
◦We do not have sufficient review controls in place to ensure that material transactions are properly recorded.
These control deficiencies could result in a misstatement of our accounts or disclosures that could result in a material misstatement of our financial results that would not be prevented or detected, and accordingly, we determined that these control deficiencies constitute a material weakness.
We are working to remediate this material weakness through the development and implementation of processes and controls over the financial reporting process. Specifically:
•Implementing IT general controls to manage access and program changes within our IT environment;
•Replacing certain legacy IT systems that have inherent control limitations with SaaS tools that will support enhanced access and application controls;
41
•Engaging external resources to assist with remediation efforts and internal control execution, as well as to provide additional training to existing personnel;
•Hiring additional internal resources with appropriate knowledge and expertise to effectively operate financial reporting processes and internal controls; and
•Implementing enhanced review procedures and analysis over the segregation of duties in IT systems.
While new controls are being designed and implemented, they have not operated for a sufficient period of time to demonstrate the material weakness has been remediated. We cannot assure you that the measures we have taken to date will be sufficient to remediate the material weakness we identified or avoid the identification of additional material weaknesses in the future. Although we plan to complete this remediation, if the steps we take do not remediate the material weakness in a timely manner, there could continue to be a reasonable possibility that this control deficiency or others could result in a material misstatement of our annual or interim financial statements that would not be prevented or detected on a timely basis.
As a result of becoming a public company, we are obligated to develop and maintain proper and effective internal control over financial reporting in order to comply with Section 404 of the Sarbanes-Oxley Act. We may not complete our analysis of our internal control over financial reporting in a timely manner, or these internal controls may not be determined to be effective, which may adversely affect investor confidence in us and, as a result, the value of our common stock.
Our management is responsible for establishing and maintaining adequate internal control over financial reporting. Internal control over financial reporting is a process designed to provide reasonable assurance regarding the reliability of financial reporting and the preparation of financial statements in accordance with accounting standards generally accepted in the United States ("GAAP"). We are in the early stages of the costly and challenging process of compiling the system and processing documentation necessary to perform the evaluation needed to comply with Section 404 of the Sarbanes-Oxley Act. We may not be able to complete our evaluation, testing and any required remediation in a timely manner. See “—We have identified a material weakness in our internal control over financial reporting, resulting from control deficiencies identified in our IT general controls and process level controls. If we are unable to remediate this material weakness, we may not be able to accurately or timely report our financial condition or results of operations, which may adversely affect investor confidence in us and, as a result, the value of our common stock.” If we are unable to assert that our internal control over financial reporting is effective, we could lose investor confidence in the accuracy and completeness of our financial reports, which would cause the price of our common stock to decline, and we may be subject to investigation or sanctions by the SEC.
We will be required, pursuant to Section 404 of the Sarbanes-Oxley Act, to furnish a report by management on, among other things, the effectiveness of our internal control over financial reporting as of the year-ended December 31, 2021. This assessment will need to include disclosure of any material weaknesses identified by our management in our internal control over financial reporting. We are also required to disclose changes made in our internal control and procedures on a quarterly basis. However, our independent registered public accounting firm will not be required to report on the effectiveness of our internal control over financial reporting pursuant to Section 404 of the Sarbanes-Oxley Act until the later of the year following our first Annual Report required to be filed with the SEC, or the date we are no longer an “emerging growth company” as defined in the JOBS Act if we take advantage of the exemptions contained in the JOBS Act. At such time, which could be as early as the year-ended December 31, 2021, our independent registered public accounting firm may issue a report that is adverse in the event it is not satisfied with the level at which our controls are documented, designed or operating.
Additionally, the existence of any material weakness or significant deficiency in internal controls over financial reporting, including our existing material weakness, would require management to devote significant time and incur significant expense to remediate any such material weaknesses or significant deficiencies and management may not be able to remediate any such material weaknesses or significant deficiencies in a timely manner. The existence of any material weakness in our internal control over financial reporting could also result in errors in our financial statements that could require us to restate our financial statements, cause us to fail to meet our reporting obligations and cause shareholders to lose confidence in our reported financial information, all of which could materially and adversely affect our business and stock price. To comply with the requirements of being a public company, we may need to undertake various costly and time-consuming actions, such as implementing new internal controls and procedures and hiring additional accounting or internal audit staff, which may adversely affect our business, financial condition and results of operations.
We may experience difficulties in continuing to implement our enterprise resource planning system over the next few years.
We are engaged in a multi-year implementation of an enterprise resource planning, or ERP, system. Such an implementation is a major undertaking from a financial, management and personnel perspective. The implementation of the ERP system may prove to be more difficult, costly or time consuming than expected, and there can be no assurance that this system will continue to be beneficial to the extent anticipated. Any disruptions, delays or deficiencies in the design and implementation of our ERP system could adversely affect our ability to process orders, ship products, send invoices and track payments, fulfill contractual obligations, produce financial reports or otherwise operate our business. As we continue to implement our ERP system, our exposure to system attacks may be elevated because
42
we will be running old and new processes in parallel and must simultaneously protect both the new system and legacy systems. If we are unable to implement the ERP system smoothly or successfully, or we otherwise do not capture anticipated benefits, our business, results of operations and financial condition for future periods could be negatively impacted. Additionally, our implementation of the ERP system involves greater utilization of third-party “cloud” computing services in connection with our business operations. Problems faced by us or our third-party “cloud” computing providers, including technological or business-related disruptions, as well as cybersecurity threats, could adversely impact our business, results of operations and financial condition for future periods.
Changes in financial accounting standards or practices may cause adverse, unexpected financial reporting fluctuations and affect our reported results of operations.
A change in accounting standards or practices can have a significant effect on our reported results and may even affect our reporting of transactions completed before the change is effective. New accounting pronouncements and varying interpretations of accounting pronouncements have occurred and may occur in the future. Changes to existing rules or the questioning of current practices may adversely affect our reported financial results or the way in which we conduct our business.
If our estimates or judgments relating to our critical accounting policies are based on assumptions that change or prove to be incorrect, our operating results could fall below expectations of securities analysts and investors.
The preparation of financial statements in conformity with GAAP requires management to make estimates and assumptions that affect the amounts reported in the consolidated financial statements and accompanying notes.
Additionally, we base our estimates on historical experience and on various other assumptions that we believe to be reasonable under the circumstances, as provided in the section entitled “Management’s Discussion and Analysis of Financial Condition and Results of Operations,” the results of which form the basis for making judgments about the carrying values of assets, liabilities, equity, revenue and expenses that are not readily apparent from other sources. Our operating results may be adversely affected if our assumptions change or if actual circumstances differ from those in our assumptions, which could cause our operating results to fall below the expectations of securities analysts and investors. Significant assumptions and estimates used in preparing our consolidated financial statements include those related to revenue recognition, stock-based compensation, allowance for doubtful accounts, allowance for excess or obsolete inventory, useful lives and recoverability of our long-lived assets, recoverability of our goodwill, and income taxes, including the realizability of deferred tax assets and uncertain tax positions.
Our international operations may give rise to potentially adverse tax consequences.
Our corporate structure and associated transfer pricing policies anticipate future growth into international markets. The amount of taxes we pay related to different jurisdictions may depend on the application of the tax laws of the various jurisdictions, including the United States, to our international business activities, changes in tax rates, new or revised tax laws or interpretations of existing tax laws and policies and our ability to operate our business in a manner consistent with our corporate structure and intercompany arrangements. The taxing authorities of the jurisdictions in which we operate may challenge our methodologies for pricing intercompany transactions, which are generally required to be computed on an arm’s-length basis pursuant to intercompany arrangements, or disagree with our determinations as to the income and expenses attributable to specific jurisdictions. If such a challenge or disagreement were to occur, and our position was not sustained, we could be required to pay additional taxes, interest and penalties, which could result in one-time tax charges, higher effective tax rates, reduced cash flows and harm to our results of operations and financial condition. Our financial statements could fail to reflect adequate reserves to cover such a contingency.
Changes in tax laws or regulations in the various tax jurisdictions we are subject to that are applied adversely to us or our partners could increase the costs of our solutions and harm our business.
New income, sales, use or other tax laws, statutes, rules, regulations or ordinances could be enacted at any time. Those enactments could harm our domestic and international business operations, and our business and financial performance. Further, existing tax laws, statutes, rules, regulations or ordinances could be interpreted, changed, modified or applied adversely to us. These events could require us or our partners to pay additional tax amounts on a prospective or retroactive basis, as well as require us or our partners to pay fines and/or penalties and interest for past amounts deemed to be due. If we raise our prices to offset the costs of these changes, existing and potential future partners may elect not to purchase our solutions in the future. Additionally, new, changed, modified or newly interpreted or applied tax laws could increase our partners’ and our compliance, operating and other costs, as well as the costs of our solutions. Further, these events could decrease the capital we have available to operate our business. Any or all of these events could harm our business and financial performance.
Comprehensive tax reform legislation could adversely affect our business and financial condition.
On December 22, 2017, President Trump signed into law the Tax Cuts and Jobs Act of 2017, or the Tax Act, that significantly reformed the Internal Revenue Code of 1986, as amended, or the Code. The Tax Act, among other things, includes changes to U.S.
43
federal tax rates, imposes significant additional limitations on the deductibility of interest and net operating loss carryforwards, allows for the expensing of capital expenditures on an accelerated basis, and puts into effect the migration from a “worldwide” system of taxation to a territorial system. While we have reflected the impact of the Tax Act in our financial statements in accordance with our understanding of the Tax Act and available guidance, the ultimate effects of the Tax Act remain uncertain. The U.S. Department of Treasury may issue regulations and guidance that may significantly impact how the Tax Act applies to us and components of the Tax Act could be repealed or modified in future legislation. In addition, it is uncertain if and to what extent various states will conform to the Tax Act. The foregoing items may result in changes that may have an adverse impact on our results of operations, cash flows and financial condition.
As part of Congress’ response to the COVID-19 pandemic, the Families First Coronavirus Response Act, or FFCR act, was enacted on March 18, 2020, and the Coronavirus Aid, Relief, and Economic Security Act, or CARES Act, was enacted on March 27, 2020. Both the FFCR Act and the CARES Act contain numerous tax provisions. Regulatory guidance under the FFCR Act and the CARES Act is and continues to be forthcoming, and such guidance could ultimately increase or lessen the impact of these laws on our business and financial condition. Congress may also enact additional legislation in connection with the COVID-19 pandemic, some of which could have an impact on our company. In addition, it is uncertain if and to what extent various states will conform to the FFCR Act or the CARES Act.
Our ability to utilize our net operating loss carryforwards may be limited.
As of December 31, 2020, we had U.S. federal and state net operating loss carryforwards of approximately $160.9 million and $76.7 million, respectively. Our ability to utilize our federal net operating loss carryforwards may be limited under Section 382 of the Code. The limitations apply if we experience an “ownership change,” which is generally defined as a greater than 50 percentage point change (by value) in the ownership of our equity by certain stockholders over a rolling three-year period. Similar provisions of state tax law may also apply to limit the use of our state net operating loss carryforwards. Future changes in our stock ownership, which may be outside of our control, may trigger an ownership change and, consequently, the limitations under Section 382 of the Code. As a result, our ability to use our pre-change net operating loss carryforwards to offset future taxable income may be subject to limitations, which could adversely affect our future cash flows.
In addition, our ability to use our federal and state net operating losses to offset potential future taxable income and related income taxes that would otherwise be due is dependent upon our generation of future taxable income before the expiration dates of the net operating losses, and we cannot predict with certainty when, or whether, we will generate sufficient taxable income to use all of our net operating losses. Federal net operating losses generated prior to 2018 will continue to be governed by the net operating loss carryforward rules as they existed prior to the adoption of the Tax Act, which means that generally they will expire 20 years after they were generated if not used prior thereto. Many states have similar laws. Accordingly, our federal and state net operating losses could expire unused and be unavailable to offset future income tax liabilities. Under the Tax Act as modified by the CARES Act, the federal net operating losses incurred in tax years beginning after December 31, 2017 and before January 1, 2021 may be carried back to each of the five tax years preceding such loss, and net operating losses arising in tax years beginning after December 31, 2020 may not be carried back. Moreover, federal net operating losses generated in tax years ending after December 31, 2017 may be carried forward indefinitely, but the deductibility of such federal net operating losses may be limited to 80% of current year taxable income for tax years beginning after December 31, 2020. Refer to Note 15. Income Taxes to the consolidated financial statements for further discussion of net operating loss carryforwards as of December 31, 2020.
Risks Related to Regulatory Compliance
We are subject to governmental export controls and economic sanctions laws that could impair our ability to compete in international markets and subject us to liability if we are not in full compliance with applicable laws.
Certain of our products are subject to U.S. export controls, including the U.S. Department of Commerce’s Export Administration Regulations and economic and trade sanctions regulations administered by the U.S. Treasury Department’s Office of Foreign Assets Control. These regulations may limit the export of our products and provision of our services outside of the United States, or may require export authorizations, including by a license exception or other appropriate government authorizations, including annual or semi-annual reporting and the filing of an encryption registration. Export control and economic sanctions laws may also include prohibitions on the sale or supply of certain of our products to embargoed or sanctioned countries, regions, governments, persons and entities. In addition, various countries regulate the importation of certain products, through import permitting and licensing requirements, and have enacted laws that could limit our ability to distribute our products. The exportation, re-exportation and importation of our products and the provision of services, including by our partners, must comply with these laws or else we may be adversely affected, through reputational harm, government investigations, penalties and a denial or curtailment of our ability to export our products or provide services. Complying with export control and sanctions laws may be time consuming and may result in the delay or loss of sales opportunities. If we are found to be in violation of U.S. sanctions or export control laws, it could result in substantial fines and penalties for us and for the individuals working for us. Changes in export or import laws or corresponding sanctions may delay the introduction and sale of our
44
products in international markets, or, in some cases, prevent the export or import of our products to certain countries, regions, governments, persons or entities altogether, which could adversely affect our business, financial condition and results of operations.
We are subject to a number of legal requirements, contractual obligations and industry standards regarding security, data protection and privacy and any failure to comply with these requirements, obligations or standards could have an adverse effect on our reputation, business, financial condition and operating results.
Data privacy and information security have become significant issues in the United States and in many other countries where we have employees and operations and where we offer licenses or cloud subscriptions to our offerings. The regulatory framework for privacy and information security issues worldwide is rapidly evolving and is likely to remain uncertain for the foreseeable future. The U.S. federal and various state and foreign government bodies and agencies have adopted or are considering adopting laws and regulations limiting, or laws and regulations regarding the collection, distribution, use, disclosure, storage and security of personal information. Laws in all 50 states require businesses to provide notice to customers whose personally identifiable information has been disclosed as a result of a data breach. The laws are not consistent, and compliance in the event of a widespread data breach is costly. States are also constantly amending existing laws, requiring attention to frequently changing regulatory environments. For example, in June 2018, California enacted the California Consumer Privacy Act, or CCPA, that, among other things, requires covered companies to provide new disclosures to California consumers, and afford such consumers new abilities to opt-out of certain sales of personal information. The CCPA provides for civil penalties for violations, as well as a private right of action for certain data breaches that may increase data breach litigation. The CCPA was amended in September 2018 and September 2019 and went into effect on January 1, 2020. While these amendments have helped with understanding certain aspects of the law, we cannot yet predict the impact of the CCPA on our business or operations, but it may require us to modify our data processing practices and policies and to incur substantial costs and expenses in an effort to comply.
Internationally, virtually every jurisdiction in which we operate has established its own data security and privacy or data protection legal framework with which we or our MSP partners must comply. Laws and regulations in these jurisdictions apply broadly to the collection, use, storage, disclosure and security of data that is associated with an identifiable or which identifies or may be used to identify or locate an individual. Examples include identifiers such as names, email addresses and, in some jurisdictions, Internet Protocol, or IP, addresses and data that may be associated with identifiers, including items such as marketing records, sales records, financial records, content and correspondence. These laws and regulations often are more restrictive than those in the United States and are rapidly evolving. For example, the E.U. General Data Protection Regulation, or GDPR, became effective on May 25, 2018, and, in addition to imposing stringent obligations relating to data protection and information security, authorizes fines up to 4% of global annual revenue or €20 million, whichever is greater, for some types of violations. The GDPR restricts the transfer of personal data outside of the European Economic Area (“EEA”). We transfer personal data outside of the EEA for our own internal business purposes and in order to provide our products and services to our MSP partners. The requirements on such transfers are constantly evolving. In Schrems II (C-311/18), the Court of Justice of the European Union (CJEU) invalidated the EU-U.S. Privacy Shield data transfer mechanism, which many companies had relied as an acceptable mechanism for transferring such data from the EU to the U.S. Other data transfer mechanisms such as the standard contractual clauses approved by the European Commission, which we use in our business to address certain cross-border data transfers, have faced challenges in European courts (including being called into question in Schrems II), and may be challenged, suspended or invalidated. Such developments may cause us to have to make further expenditures on local infrastructure, change internal business processes, change customer facing products, or otherwise affect or restrict sales and operations. It is further unclear how future decisions related to cross-border transfer restrictions may affect related data transfer mechanisms in other jurisdictions such as the Swiss-US Privacy Shield Framework. Further, Brexit has created some uncertainty with regard to the regulation of data protection in the United Kingdom.
Some countries also are considering or have passed legislation requiring local storage and processing of data, or similar requirements, which could increase the cost and complexity of delivering our services. We may be or become subject to data localization laws mandating that data collected in a foreign country be processed and stored only within that country. If any country in which we have partners were to adopt a data localization law, we could be required to expand our data storage facilities there or build new ones in order to comply. The expenditure this would require, as well as costs of compliance generally, could harm our financial condition. Currently, our EMEA headquarters is in the United Kingdom and much of our European data is stored within the United Kingdom. Therefore, any disruption in data transfers or uncertainty in regards to data migration resulting from Brexit would be particularly significant to our operations. While we currently have data storage locations built in Germany and Iceland, our ability to migrate data to these alternate locations in the event of complications due to Brexit may be significantly affected by the resulting transfer restrictions or uncertainty surrounding transfer mechanics. Despite having these alternate data storage centers available, we may not be able to migrate data sets at all or may only be able to migrate certain types or amounts of data, thereby causing us not to meet the needs of our partners and resulting in harm to our reputation and business.
Because many of the features of our solutions use, store and report on SMB customer data which may contain personal information from SMB customers, any inability to adequately address privacy concerns, to delete stored data at the correct times, or comply with applicable privacy laws, regulations and policies could, even if unfounded, result in liability to us and, damage to our reputation, loss of
45
sales and harm to our business. Furthermore, the costs of compliance with, and other burdens imposed by, such laws, regulations and policies that are applicable to the businesses of our partners may limit the use and adoption of our solutions and reduce overall demand for them. Complying with the GDPR, CCPA or other laws, regulations or other obligations relating to privacy, data protection, data localization or information security may cause us to incur substantial operational costs or require us to modify our data handling practices. Non-compliance could result in proceedings against us by governmental entities or others, could result in substantial fines or other liability, and may otherwise adversely impact our business, financial condition and operating results. Privacy concerns, whether or not valid, may inhibit market adoption of our solutions.
Some statutory requirements, both in the United States and abroad, include obligations of companies to notify individuals of security breaches involving particular personal information, which could result from breaches experienced by us or our service providers. Even though we may have contractual protections with our service providers, any actual or perceived security breach could impact our reputation, harm our MSP partners’ confidence, hurt our sales and expansion into new markets or cause us to lose existing MSP partners, and could expose us to potential liability or require us to expend significant resources on data security and in responding to any such actual or perceived breach.
In addition to government regulation, privacy advocates and industry groups may propose self-regulatory standards from time to time. These and other industry standards may legally or contractually apply to us, or we may elect to comply with such standards or to facilitate our MSP partners’ compliance with such standards. Because privacy, data protection and data security are critical competitive factors in our industry, we may make statements on our website, in marketing materials, or in other settings about our data security measures and our compliance with, or our ability to facilitate our MSP partners’ compliance with, these standards. We also expect that there will continue to be new proposed laws and regulations concerning privacy, data protection and information security, and we cannot yet determine the impact such future laws, regulations and standards may have on our business. New laws, amendments to or re-interpretations of existing laws and regulations, industry standards, contractual obligations and other obligations may require us to incur additional costs and restrict our business operations. Because the interpretation and application of laws, standards, contractual obligations and other obligations relating to privacy and data protection are still uncertain, it is possible that these laws, standards, contractual obligations and other obligations may be interpreted and applied in a manner that is inconsistent with our data management practices, our privacy, data protection or data security policies or procedures or the features of our offerings. If so, in addition to the possibility of fines, lawsuits and other claims, we could be required to fundamentally change our business activities and practices or modify our offerings, which could have an adverse effect on our business. We may be unable to make such changes and modifications in a commercially reasonable manner or at all, and our ability to develop new offerings and features could be limited. Furthermore, the costs of compliance with, and other burdens imposed by, the laws, regulations and policies that are applicable to the businesses of our partners may limit the use and adoption of, and reduce the overall demand for, our offerings. Any inability to adequately address privacy, data protection or information security-related concerns, even if unfounded, or to successfully negotiate privacy, data protection or information security-related contractual terms with partners, or to comply with applicable laws, regulations and policies relating to privacy, data protection and information security, could result in additional cost and liability to us, damage our reputation, inhibit sales, slow our sales cycles and adversely affect our business. Privacy and personal information security concerns, whether valid or not valid, may inhibit market adoption of our offerings particularly in certain industries and foreign countries.
We function as a HIPAA “business associate” for certain of our MSP partners and, as such, are subject to strict privacy and data security requirements. If we fail to comply with any of these requirements, we could be subject to significant liability, all of which can adversely affect our business as well as our ability to attract and retain new MSP partners.
HIPAA, as amended by the Health Information Technology for Economic and Clinical Health Act, or HITECH, and their respective implementing regulations impose specific requirements relating to the privacy, security and transmission of individually identifiable health information. Among other things, HITECH makes HIPAA’s security standards directly applicable to “business associates.” We function as a business associate for certain of our partners that are HIPAA business associates and service providers, and in that context we are regulated as a business associate for the purposes of HIPAA. If we are unable to comply with our obligations as a HIPAA business associate, we could face substantial civil and even criminal liability. HITECH imposes four tiers of civil monetary penalties and gives state attorneys general authority to file civil actions for damages or injunctions in federal courts to enforce the federal HIPAA laws and seek attorneys’ fees and costs associated with pursuing federal civil actions. In addition, many state laws govern the privacy and security of health information in certain circumstances, many of which differ from HIPAA and each other in significant ways and may not have the same effect.
As a business associate, we are required by HIPAA to maintain HIPAA-compliant business associate agreements with our MSP partners for which we, as a service provider, access, maintain, create or transmit individually identifiable health information to render services to our MSP partners. These agreements impose stringent data security and other obligations on us. If we or our subcontractors are unable to meet the requirements of any of these business associate agreements, we could face contractual liability under the applicable business associate agreement as well as possible civil and criminal liability under HIPAA, all of which can have an adverse impact on our business and generate negative publicity, which, in turn, can have an adverse impact on our ability to attract and retain MSP partners.
46
If we fail to comply with anti-corruption laws, including the FCPA and similar laws associated with our activities outside of the United States, we could be subject to penalties and we could be subject to civil and/or criminal sanctions, and our business could be materially adversely affected.
We are subject to the U.S. Foreign Corrupt Practices Act of 1977, as amended (the "FCPA"), the U.S. domestic bribery statute contained in 18 U.S.C. §201, the U.K. Bribery Act, and possibly other anti-bribery laws in countries in which we conduct activities. We face significant risks if we fail to comply with the FCPA and other anti-corruption laws that prohibit companies and their employees and third-party intermediaries from promising, authorizing, offering or providing, directly or indirectly, improper payments or benefits to foreign government officials, political parties and private-sector recipients for the purpose of obtaining or retaining business, directing business to any person, or securing any advantage. This risk is particularly significant for us given that we rely so heavily on MSP partners, distributors and other third parties to sell our solutions and conduct our business abroad. We or our third-party intermediaries may have direct or indirect interactions with officials and employees of government agencies or state-owned or affiliated entities and we can be held liable for the corrupt or other illegal activities of these third-party intermediaries, our employees, representatives, contractors, partners and agents, even if we do not explicitly authorize such activities. We have implemented and continue to update an anti-corruption compliance program but cannot assure you that all of our employees, agents and MSP partners, as well as those companies to which we outsource certain of our business operations, will not take actions in violation of our policies and applicable law, for which we may be ultimately held responsible.
As we continue to expand our business internationally, we will inevitably do more business in countries that are perceived to have heightened levels of public sector corruption. Increased business in countries perceived to have heightened levels of corruption could subject us and our officers and directors to increased scrutiny and increased liability from our business operations. Any violation of the FCPA or other applicable anti-corruption laws by our own employees or our third-party intermediaries, could result in regulatory investigations, whistleblower complaints, adverse media coverage and/or severe criminal or civil sanctions, which could have a materially adverse effect on our reputation, business, operating results and prospects. In addition, responding to any enforcement action may result in a significant diversion of management’s attention and resources and significant defense costs.
Failure to comply with governmental laws and regulations could harm our business.
Our business is subject to regulation by various federal, state, local and foreign governmental agencies, including agencies responsible for monitoring and enforcing employment and labor laws, workplace safety, product safety, environmental laws, consumer protection laws, anti-bribery laws (including the FCPA and the U.K. Anti-Bribery Act), import/export controls, federal securities laws and tax laws and regulations. In certain jurisdictions, these regulatory requirements may be more stringent than those in the United States. Noncompliance with applicable regulations or requirements could subject us to investigations, sanctions, mandatory product recalls, enforcement actions, disgorgement of profits, fines, damages, civil and criminal penalties or injunctions. If any governmental sanctions are imposed, or if we do not prevail in any possible civil or criminal litigation resulting from any alleged noncompliance, our business, operating results and financial condition could be materially adversely affected. In addition, responding to any action will likely result in a significant diversion of management’s attention and resources and an increase in professional fees. Enforcement actions, litigation and sanctions could harm our business, operating results and financial condition.
Risks Related to Our Indebtedness
Our existing indebtedness could adversely affect our business and growth prospects.
On October 23, 2020, Datto, Inc., as borrower (the “Borrower”), and certain direct and indirect wholly-owned subsidiaries of Datto Holding Corp., entered into the 2020 Credit Agreement with the lenders party thereto and Morgan Stanley Senior Funding, Inc., as administrative agent. The 2020 Credit Agreement provides for an initial $200.0 million in commitments for revolving credit loans, which amount may be increased or decreased under specific circumstances, with a $40.0 million letter of credit sublimit and a $100.0 million alternative currency sublimit. As of December 31, 2020, the 2020 Credit Agreement has no outstanding borrowings and $1.9 million of outstanding letters of credit under the revolving credit facility.
Our 2020 Credit Agreement, or any additional indebtedness we may incur, could require us to divert funds identified for other purposes for debt service and impair our liquidity position. If we cannot generate sufficient cash flow from operations to service our debt, we may need to refinance our debt, dispose of assets or issue equity to obtain necessary funds. We do not know whether we will be able to take any of these actions on a timely basis, on terms satisfactory to us or at all.
The covenants contained in our 2020 Credit Agreement have important consequences, including:
•limiting funds otherwise available for financing our capital expenditures by requiring us to dedicate a portion of our cash flows from operations to the repayment of debt and the interest on this debt;
•limiting our ability to incur additional indebtedness;
47
•limiting our ability to capitalize on significant business opportunities;
•making us more vulnerable to rising interest rates; and
•making us more vulnerable in the event of a downturn in our business.
We may incur additional debt under our 2020 Credit Agreement or pursuant to new arrangements, and our future levels of indebtedness may place us at a competitive disadvantage to our competitors that may not be as highly leveraged. Fluctuations in interest rates can increase borrowing costs and may directly impact the amount of interest we are required to pay and reduce earnings accordingly. In addition, developments in tax policy, such as the disallowance of tax deductions for interest paid on outstanding indebtedness, could have an adverse effect on our liquidity and our business, financial condition and results of operations. Further, our 2020 Credit Agreement contains customary affirmative and negative covenants and certain restrictions on operations that could impose operating and financial limitations and restrictions on us, including restrictions on our ability to enter into particular transactions and to engage in other actions that we may believe are advisable or necessary for our business. Amounts outstanding under our 2020 Credit Agreement may also subject us to mandatory prepayments in certain circumstances and this mandatory prepayment, and future required prepayments, would reduce our cash available for investment in our business.
We expect to use cash flow from operations to meet current and future financial obligations, including funding our operations, debt service requirements and capital expenditures. The ability to make these payments depends on our financial and operating performance, which is subject to prevailing economic, industry and competitive conditions and to certain financial, business, economic and other factors beyond our control.
Despite restrictive covenants, we may still be able to incur substantially more indebtedness or make certain restricted payments, which could further exacerbate the risks associated with our indebtedness.
We may be able to incur significant additional indebtedness in the future. The 2020 Credit Agreement provides for the ability of the Borrower to request incremental term loan facilities, in a minimum amount of $5.0 million for each facility. In addition, although the financing documents governing our 2020 Credit Agreement contain restrictions on the incurrence of additional indebtedness and liens, these restrictions are subject to a number of important qualifications and exceptions, and the additional indebtedness and liens incurred in compliance with these restrictions could be substantial.
The financing documents governing our 2020 Credit Agreement permit us to incur certain additional types of indebtedness, including liabilities that do not constitute indebtedness as defined in the financing documents. We may also consider investments in joint ventures or acquisitions, which may increase our indebtedness. In addition, financing documents governing our 2020 Credit Agreement do not restrict Vista from creating new holding companies that may be able to incur indebtedness without regard to the restrictions set forth in the financing documents governing our 2020 Credit Agreement. If new debt is added to our currently anticipated indebtedness levels, the related risks that we face could intensify.
We may not be able to generate sufficient cash flow to service all of our indebtedness, and may be forced to take other actions to satisfy our obligations under such indebtedness, which may not be successful.
To the extent we incur indebtedness, our ability to make scheduled payments or to refinance outstanding debt obligations depends on our financial and operating performance, which will be affected by prevailing economic, industry and competitive conditions and by financial, business and other factors beyond our control. We may not be able to maintain a sufficient level of cash flow from operating activities to permit us to pay the principal, premium, if any, and interest on our indebtedness. Any failure to make payments of interest and principal on our outstanding indebtedness on a timely basis would likely result in a reduction of our credit rating, which would also harm our ability to incur additional indebtedness.
If our cash flows and capital resources are insufficient to fund our debt service obligations, we may be forced to reduce or delay capital expenditures, sell assets, seek additional capital or seek to restructure or refinance our indebtedness. Any refinancing of our indebtedness could be at higher interest rates and may require us to comply with more onerous covenants. These alternative measures may not be successful and may not permit us to meet our scheduled debt service obligations. In the absence of such cash flows and resources, we could face substantial liquidity problems and might be required to sell material assets or operations to attempt to meet our debt service obligations. The financing documents governing our 2020 Credit Agreement restricts our ability to conduct asset sales and/or use the proceeds from asset sales. We may not be able to consummate these asset sales to raise capital or sell assets at prices and on terms that we believe are fair and any proceeds that we do receive may not be adequate to meet any debt service obligations then due. If we cannot meet our debt service obligations, the holders of our indebtedness may accelerate such indebtedness and, to the extent such indebtedness is secured, foreclose on our assets. In such an event, we may not have sufficient assets to repay all of our indebtedness.
48
The terms of the financing documents governing our 2020 Credit Agreement restricts our current and future operations, particularly our ability to respond to changes or to take certain actions.
The financing documents governing our 2020 Credit Agreement contain a number of restrictive covenants that impose significant operating and financial restrictions on us and may limit our ability to engage in acts that may be in our long-term best interests, including restrictions on our ability to:
•incur additional indebtedness;
•pay dividends on or make distributions in respect of capital stock or repurchase or redeem capital stock;
•repay, redeem or repurchase certain indebtedness;
•make loans and investments;
•sell or otherwise dispose of assets, including capital stock of restricted subsidiaries;
•incur liens;
•enter into transactions with affiliates;
•enter into agreements restricting the ability of our subsidiaries to pay dividends; and
•consolidate, merge or sell all or substantially all of our assets.
The restrictive covenants in the financing documents governing our 2020 Credit Agreement requires us to maintain specified financial ratios and satisfy other financial condition tests to the extent applicable. Our ability to meet those financial ratios and tests can be affected by events beyond our control.
A breach of the covenants or restrictions under the financing documents governing our 2020 Credit Agreement could result in an event of default under such document. Such a default may allow the creditors to accelerate the related debt, to the extent amounts are outstanding, which may result in the acceleration of any other debt to which a cross-acceleration or cross-default provision applies. In the event the holders of our indebtedness accelerate the repayment, we may not have sufficient assets to repay that indebtedness or be able to borrow sufficient funds to refinance it. Even if we are able to obtain new financing, it may not be on commercially reasonable terms or on terms acceptable to us. As a result of these restrictions, we may be:
•limited in how we conduct our business;
•unable to raise additional debt or equity financing to operate during general economic or business downturns; or
•unable to compete effectively or to take advantage of new business opportunities.
These restrictions, along with restrictions that may be contained in agreements evidencing or governing other future indebtedness, may affect our ability to grow in accordance with our growth strategy.
We may be unable to refinance our indebtedness.
We may need to refinance all or a portion of our indebtedness before maturity. We cannot assure you that we will be able to refinance any of our indebtedness on commercially reasonable terms or at all. There can be no assurance that we will be able to obtain sufficient funds to enable us to repay or refinance our debt obligations on commercially reasonable terms, or at all.
A lowering or withdrawal of the ratings assigned to our debt securities by rating agencies may increase our future borrowing costs and reduce our access to capital.
Our debt currently has a non-investment grade rating. Any rating assigned could be lowered or withdrawn entirely by a rating agency if, in that rating agency’s judgment, future circumstances relating to the basis of the rating, such as adverse changes, so warrant. Any future lowering of our ratings likely would make it more difficult or more expensive for us to obtain additional debt financing.
Our failure to raise additional capital or generate cash flows necessary to expand our operations and invest in new technologies in the future could reduce our ability to compete successfully and harm our results of operations.
We may need to raise additional funds, and we may not be able to obtain additional debt or equity financing on favorable terms or at all. If we raise additional equity financing, our security holders may experience significant dilution of their ownership interests. If we engage in additional debt financing, we may be required to accept terms that restrict our ability to incur additional indebtedness, force us
49
to maintain specified liquidity or other ratios or restrict our ability to pay dividends or make acquisitions. If we need additional capital and cannot raise it on acceptable terms, or at all, we may not be able to, among other things:
•develop and enhance our solutions;
•continue to expand our research and development and sales and marketing organizations;
•hire, train and retain employees;
•respond to competitive pressures or unanticipated working capital requirements; or
•pursue acquisition opportunities.
In addition, our 2020 Credit Agreement also limits our ability to incur additional debt and therefore we may have to amend our 2020 Credit Agreement or issue additional equity to raise capital. If we issue additional equity, your interest in us will be diluted.
Risks Related to Ownership of Our Common Stock
Vista controls us, and its interests may conflict with ours or yours in the future.
At December 31, 2020, Vista beneficially owned approximately 70.6% of our common stock, which means that, based on its percentage voting power, Vista controlled the vote of all matters submitted to a vote of our board of directors, or our Board, or shareholders, which enables it to control the election of the members of the Board and all other corporate decisions. In addition, our bylaws provide that Vista has the right to designate the Chairman of the Board for so long as Vista beneficially owns at least 30% or more of the voting power of the then outstanding shares of our capital stock then entitled to vote generally in the election of directors. Even when Vista ceases to own shares of our stock representing a majority of the total voting power, for so long as Vista continues to own a significant percentage of our stock, Vista will still be able to significantly influence the composition of our Board, including the right to designate the Chairman of our Board, and the approval of actions requiring shareholder approval. Accordingly, for such period of time, Vista will have significant influence with respect to our management, business plans and policies, including the appointment and removal of our officers, decisions on whether to raise future capital and amending our charter and bylaws, which govern the rights attached to our common stock. In particular, for so long as Vista continues to own a significant percentage of our stock, Vista will be able to cause or prevent a change of control of us or a change in the composition of our Board, including the selection of the Chairman of our Board, and could preclude any unsolicited acquisition of us. The concentration of ownership could deprive you of an opportunity to receive a premium for your shares of common stock as part of a sale of us and ultimately might affect the market price of our common stock.
In addition, in connection with our IPO, we entered into a Director Nomination Agreement with Vista that provides Vista the right to designate: (i) all of the nominees for election to our Board for so long as Vista beneficially owns 40% or more of the total number of shares of our common stock it owned on the date of the IPO; (ii) a number of directors (rounded up to the nearest whole number) equal to 40% of the total directors for so long as Vista beneficially owns at least 30% and less than 40% of the total number of shares of our common stock it owned on the date of the IPO; (iii) a number of directors (rounded up to the nearest whole number) equal to 30% of the total directors for so long as Vista beneficially owns at least 20% and less than 30% of the total number of shares of our common stock it owned on the date of our IPO; (iv) a number of directors (rounded up to the nearest whole number) equal to 20% of the total directors for so long as Vista beneficially owns at least 10% and less than 20% of the total number of shares of our common stock it owned on the date of the IPO; and (v) one director for so long as Vista beneficially owns at least 5% and less than 10% of the total number of shares of our common stock it owned on the date of the IPO, in each case minus the number of designees, if any, Mr. McChord and certain entities affiliated with him are entitled to nominate. The Director Nomination Agreement also provides that Vista may assign such right to a Vista affiliate. The Director Nomination Agreement prohibits us from increasing or decreasing the size of our Board without the prior written consent of Vista.
Vista and its affiliates engage in a broad spectrum of activities, including investments in the information and business services industry generally. In the ordinary course of their business activities, Vista and its affiliates may engage in activities where their interests conflict with our interests or those of our other shareholders, such as investing in or advising businesses that directly or indirectly compete with certain portions of our business or are suppliers or partners of ours. Our certificate of incorporation provides that none of Vista, any of its affiliates or any director who is not employed by us (including any non-employee director who serves as one of our officers in both his director and officer capacities) or its affiliates has any duty to refrain from engaging, directly or indirectly, in the same business activities or similar business activities or lines of business in which we operate. Vista also may pursue acquisition opportunities that may be complementary to our business, and, as a result, those acquisition opportunities may not be available to us. In addition, Vista may have an interest in pursuing acquisitions, divestitures and other transactions that, in its judgment, could enhance its investment, even though such transactions might involve risks to you.
50
We are a “controlled company” within the meaning of the rules of the New York Stock Exchange, and, as a result, we will qualify for, and intend to rely on, exemptions from certain corporate governance requirements. You will not have the same protections as those afforded to stockholders of companies that are subject to such governance requirements.
Vista Funds control a majority of the voting power of our outstanding common stock. As a result, we are a “controlled company” within the meaning of the corporate governance standards of the New York Stock Exchange. Under these rules, a company of which more than 50% of the voting power for the election of directors is held by an individual, group or another company is a “controlled company” and may elect not to comply with certain corporate governance requirements, including:
•the requirement that a majority of our Board consist of independent directors;
•the requirement that we have a nominating and corporate governance committee that is composed entirely of independent directors with a written charter addressing the committee’s purpose and responsibilities;
•the requirement that we have a compensation committee that is composed entirely of independent directors with a written charter addressing the committee’s purpose and responsibilities; and
•the requirement for an annual performance evaluation of the nominating and corporate governance and compensation committees.
We intend to continue to utilize these exemptions. As a result, currently we do not have a majority of independent directors on our Board, our Compensation and Nominating Committee does not consist entirely of independent directors and our Compensation and Nominating Committee is not subject to annual performance evaluations. Accordingly, you will not have the same protections afforded to stockholders of companies that are subject to all of the corporate governance requirements of the New York Stock Exchange.
For so long as we are an “emerging growth company,” we will not be required to elect to comply with certain public company reporting requirements, which could make our common stock less attractive to investors.
We are an “emerging growth company,” as defined in the JOBS Act. For as long as we continue to be an emerging growth company, we are eligible for certain exemptions from various public company reporting requirements. These exemptions include, but are not limited to, (i) not being required to comply with the auditor attestation requirements of Section 404 of Sarbanes-Oxley, (ii) reduced disclosure obligations regarding executive compensation in our periodic reports, proxy statements and registration statements, (iii) exemptions from the requirements of holding a nonbinding advisory vote on executive compensation and shareholder approval of any golden parachute payments not previously approved and (iv) not being required to provide five years of Selected Financial Data in this Annual Report on Form 10-K. We could be an emerging growth company for up to five years after the first sale of our common stock in our IPO, which fifth anniversary will occur in 2025. However, if certain events occur prior to the end of such five-year period, including if we become a “large accelerated filer”, our annual gross revenue exceeds $1.07 billion or we issue more than $1.0 billion of non-convertible debt in any three-year period, we would cease to be an emerging growth company prior to the end of such five-year period. We made certain elections with regard to the reduced disclosure obligations regarding executive compensation in this Annual Report on Form 10-K and may elect to take advantage of other reduced disclosure obligations in future filings. As a result, the information that we provide to holders of our common stock may be different than you might receive from other public reporting companies in which you hold equity interests. We cannot predict if investors will find our common stock less attractive as a result of our reliance on these exemptions. If some investors find our common stock less attractive as a result of any choice we make to reduce disclosure, there may be a less active trading market for our common stock and the market price for our common stock may be more volatile.
Under the JOBS Act, emerging growth companies may also elect to delay adoption of new or revised accounting standards until such time as those standards apply to private companies. We have elected to “opt-in” to this extended transition period for complying with new or revised accounting standards and, therefore, we will not be subject to the same new or revised accounting standards as other public companies that comply with such new or revised accounting standards on a non-delayed basis. As a result, our financial statements may not be comparable to companies that comply with public company effective dates, and thus investors may have difficulty evaluating or comparing our business, performance or prospects in comparison to other public companies, which may have a negative impact on the value and liquidity of our common stock.
The requirements of being a public company may strain our resources and distract our management, which could make it difficult to manage our business, particularly after we are no longer an “emerging growth company.”
As a public company, we incur legal, accounting and other expenses that we did not previously incur. We are subject to the reporting requirements of the Securities Exchange Act of 1934, as amended, or the Exchange Act, and the Sarbanes-Oxley Act, the listing requirements of the and other applicable securities rules and regulations. Compliance with these rules and regulations will continue to increase our legal and financial compliance costs, make some activities more difficult, time-consuming or costly and increase demand on our systems and resources, particularly after we are no longer an “emerging growth company.” The Exchange Act requires
51
that we file annual, quarterly and current reports with respect to our business, financial condition and results of operations. The Sarbanes-Oxley Act requires, among other things, that we establish and maintain effective internal controls and procedures for financial reporting. Furthermore, the need to establish the corporate infrastructure demanded of a public company may divert our management’s attention from implementing our growth strategy, which could prevent us from improving our business, financial condition and results of operations. We have made, and will continue to make, changes to our internal controls and procedures for financial reporting and accounting systems to meet our reporting obligations as a public company. However, the measures we take may not be sufficient to satisfy our obligations as a public company. In addition, these rules and regulations will increase our legal and financial compliance costs and will make some activities more time-consuming and costly. For example, we expect these rules and regulations to make it more difficult and more expensive for us to obtain director and officer liability insurance, and we may be required to incur substantial costs to maintain the same or similar coverage. These additional obligations could have a material adverse effect on our business, financial condition and results of operations.
In addition, changing laws, regulations and standards relating to corporate governance and public disclosure are creating uncertainty for public companies, increasing legal and financial compliance costs and making some activities more time consuming. These laws, regulations and standards are subject to varying interpretations, in many cases due to their lack of specificity, and, as a result, their application in practice may evolve over time as new guidance is provided by regulatory and governing bodies. This could result in continuing uncertainty regarding compliance matters and higher costs necessitated by ongoing revisions to disclosure and governance practices. We intend to invest resources to comply with evolving laws, regulations and standards, and this investment may result in increased general and administrative expenses and a diversion of our management’s time and attention from sales-generating activities to compliance activities. If our efforts to comply with new laws, regulations and standards differ from the activities intended by regulatory or governing bodies due to ambiguities related to their application and practice, regulatory authorities may initiate legal proceedings against us and could have a material adversely effect on our business, financial condition and results of operations.
Provisions of our corporate governance documents could make an acquisition of us more difficult and may prevent attempts by our shareholders to replace or remove our current management, even if beneficial to our shareholders.
In addition to Vista’s beneficial ownership of 70.6% of our common stock as of December 31, 2020, our certificate of incorporation and bylaws, and the Delaware General Corporation Law, or the DGCL, contain provisions that could make it more difficult for a third-party to acquire us, even if doing so might be beneficial to our shareholders. In certain instances outlined below, these provisions do not take effect until Vista’s beneficial ownership of our common stock drops below a certain percentage. As a result, the anti-takeover effect of these provisions is expected to increase over time as Vista’s beneficial ownership decreases. In each instance, these changes will occur automatically pursuant to the terms of our certificate of incorporation and bylaws and without further action by our board or stockholders upon Vista’s ownership crossing the applicable thresholds. Among other things:
•these provisions allow us to authorize the issuance of undesignated preferred stock, the terms of which may be established and the shares of which may be issued without shareholder approval, and which may include supermajority voting, special approval, dividend, or other rights or preferences superior to the rights of shareholders;
•these provisions provide for a classified board of directors with staggered three-year terms;
•these provisions provide that, at any time when Vista beneficially owns, in the aggregate, less than 40% in voting power of the our stock entitled to vote generally in the election of directors, directors may only be removed for cause, and only by the affirmative vote of holders of at least 66 2/3% in voting power of all the then-outstanding shares of our stock entitled to vote thereon, voting together as a single class;
•these provisions prohibit shareholder action by written consent from and after the date on which Vista beneficially owns, in the aggregate, less than 35% in voting power of our stock entitled to vote generally in the election of directors;
•these provisions provide that for as long as Vista beneficially owns, in the aggregate, at least 50% in voting power of our stock entitled to vote generally in the election of directors, any amendment, alteration, rescission or repeal of our bylaws by our shareholders will require the affirmative vote of a majority in voting power of the outstanding shares of our stock and at any time when Vista beneficially owns, in the aggregate, less than 50% in voting power of all outstanding shares of our stock entitled to vote generally in the election of directors, any amendment, alteration, rescission or repeal of our bylaws by our shareholders will require the affirmative vote of the holders of at least 66 2/3% in voting power of all the then-outstanding shares of our stock entitled to vote thereon, voting together as a single class; and
•these provisions establish advance notice requirements for nominations for elections to our Board or for proposing matters that can be acted upon by shareholders at shareholder meetings; provided, however, at any time when Vista beneficially owns, in the aggregate, at least 10% in voting power of our stock entitled to vote generally in the election of directors, such advance notice procedure will not apply to it.
Our certificate of incorporation contains a provision that provides us with protections similar to Section 203 of the DGCL, and prevents us from engaging in a business combination with a person (excluding Vista and any of its direct or indirect transferees and any
52
group as to which such persons are a party) who acquires at least 15% of our common stock for a period of three years from the date such person acquired such common stock, unless Board or shareholder approval is obtained prior to the acquisition. These provisions could discourage, delay or prevent a transaction involving a change in control of our company. These provisions could also discourage proxy contests and make it more difficult for you and other shareholders to elect directors of your choosing and cause us to take other corporate actions you desire, including actions that you may deem advantageous, or negatively affect the trading price of our common stock. In addition, because our Board is responsible for appointing the members of our management team, these provisions could in turn affect any attempt by our shareholders to replace current members of our management team.
These and other provisions in our certificate of incorporation, bylaws and Delaware law could make it more difficult for shareholders or potential acquirers to obtain control of our Board or initiate actions that are opposed by our then-current Board, including delay or impede a merger, tender offer or proxy contest involving our company. The existence of these provisions could negatively affect the price of our common stock and limit opportunities for you to realize value in a corporate transaction.
Our certificate of incorporation designates the Court of Chancery of the State of Delaware as the exclusive forum for certain litigation that may be initiated by our shareholders, which could limit our shareholders’ ability to obtain a favorable judicial forum for disputes with us.
Pursuant to our certificate of incorporation, unless we consent in writing to the selection of an alternative forum, the Court of Chancery of the State of Delaware is the sole and exclusive forum for (1) any derivative action or proceeding brought on our behalf, (2) any action asserting a claim of breach of a fiduciary duty owed by any of our directors, officers or other employees to us or our shareholders, (3) any action asserting a claim against us arising pursuant to any provision of the DGCL, our certificate of incorporation or our bylaws or (4) any other action asserting a claim against us that is governed by the internal affairs doctrine; provided that for the avoidance of doubt, the forum selection provision that identifies the Court of Chancery of the State of Delaware as the exclusive forum for certain litigation, including any “derivative action”, will not apply to suits to enforce a duty or liability created by Securities Act, the Exchange Act or any other claim for which the federal courts have exclusive jurisdiction. Our certificate of incorporation will further provide that any person or entity purchasing or otherwise acquiring any interest in shares of our capital stock is deemed to have notice of and consented to the provisions of our certificate of incorporation described above. The forum selection clause in our certificate of incorporation may have the effect of discouraging lawsuits against us or our directors and officers and may limit our shareholders’ ability to obtain a favorable judicial forum for disputes with us.
Our operating results and stock price may be volatile, and the market price of our common stock may drop below the price you pay.
Our quarterly operating results are likely to fluctuate in the future. In addition, securities markets worldwide have experienced, and are likely to continue to experience, significant price and volume fluctuations. This market volatility, as well as general economic, market or political conditions, could subject the market price of our shares to wide price fluctuations regardless of our operating performance. Our operating results and the trading price of our shares may fluctuate in response to various factors, including:
•market conditions in our industry or the broader stock market;
•actual or anticipated fluctuations in our quarterly financial and operating results;
•introduction of new solutions or services by us or our competitors;
•issuance of new or changed securities analysts’ reports or recommendations;
•sales, or anticipated sales, of large blocks of our stock;
•additions or departures of key personnel;
•regulatory or political developments;
•litigation and governmental investigations;
•changing economic conditions;
•investors’ perception of us;
•events beyond our control such as weather and war; and
•any default on our indebtedness.
These and other factors, many of which are beyond our control, may cause our operating results and the market price and demand for our shares to fluctuate substantially. Fluctuations in our quarterly operating results could limit or prevent investors from readily
53
selling their shares and may otherwise negatively affect the market price and liquidity of our shares. In addition, in the past, when the market price of a stock has been volatile, holders of that stock have sometimes instituted securities class action litigation against the company that issued the stock. If any of our shareholders brought a lawsuit against us, we could incur substantial costs defending the lawsuit. Such a lawsuit could also divert the time and attention of our management from our business, which could significantly harm our results of operations and reputation.
A significant portion of our total outstanding shares are restricted from immediate resale but may be sold into the market in the near future. This could cause the market price of our common stock to drop significantly, even if our business is doing well.
Sales of a substantial number of shares of our common stock in the public market could occur at any time. These sales, or the perception in the market that the holders of a large number of shares intend to sell shares, could reduce the market price of our common stock. Following our IPO, shares that were not sold in our IPO are subject to a 180-day lock-up period provided under lock-up agreements executed in connection with the IPO and restricted from immediate resale under the federal securities laws. All of these shares will, however, be able to be resold after the expiration of the lock-up period, as well as pursuant to customary exceptions thereto or upon the waiver of the lock-up agreement by Morgan Stanley & Co. LLC on behalf of the underwriters of our IPO. We have registered 34,934,110 shares of our common stock that we can issue pursuant to our various equity plans. As restrictions on resale end, the market price of our stock could decline if the holders of currently restricted shares sell them or are perceived by the market as intending to sell them. A decline in the market price of our stock may also impair our ability to raise capital to continue to fund operations by issuing shares and may impair our ability to acquire other companies or technologies by using our shares as consideration.
As described in our IPO Prospectus, we entered into a registration rights agreement with Vista, which requires us to affect the registration of Vista's shares in certain circumstances following the expiration of the 180-day lock-up period. If Vista exercises its rights under this agreement to resell a significant amount of its shares of our common stock, we will not receive any proceeds from those offerings.
Because we have no current plans to pay regular cash dividends on our common stock for the foreseeable future, you may not receive any return on investment unless you sell your common stock for a price greater than that which you paid for it.
We do not anticipate paying any regular cash dividends on our common stock for the foreseeable future. Any decision to declare and pay dividends in the future will be made at the discretion of our Board and will depend on, among other things, our results of operations, financial condition, cash requirements, contractual restrictions and other factors that our Board may deem relevant. In addition, our ability to pay dividends is, and may be, limited by covenants of existing and any future outstanding indebtedness we or our subsidiaries incur, including under our 2020 Credit Agreement. Therefore, any return on investment in our common stock is solely dependent upon the appreciation of the price of our common stock on the open market, which may not occur.
If securities or industry analysts do not publish research or reports about our business, if they adversely change their recommendations regarding our shares or if our results of operations do not meet their expectations, our stock price and trading volume could decline.
The trading market for our shares is influenced by the research and reports that industry or securities analysts publish about us or our business. We do not have any control over these analysts. If one or more of these analysts cease coverage of us or fail to publish reports on us regularly, we could lose visibility in the financial markets, which in turn could cause our stock price or trading volume to decline. Moreover, if one or more of the analysts who cover us downgrade our stock, or if our results of operations do not meet their expectations, our stock price could decline.
We may issue shares of preferred stock in the future, which could make it difficult for another company to acquire us or could otherwise adversely affect holders of our common stock, which could depress the price of our common stock.
Our certificate of incorporation authorizes us to issue one or more series of preferred stock. Our Board has the authority to determine the preferences, limitations and relative rights of the shares of preferred stock and to fix the number of shares constituting any series and the designation of such series, without any further vote or action by our shareholders. Our preferred stock could be issued with voting, liquidation, dividend and other rights superior to the rights of our common stock. The potential issuance of preferred stock may delay or prevent a change in control of us, discouraging bids for our common stock at a premium to the market price, and materially adversely affect the market price and the voting and other rights of the holders of our common stock.
54
ITEM 1B. UNRESOLVED STAFF COMMENTS
The Company has received no written SEC staff comments regarding any of its Exchange Act reports which remain unresolved.
ITEM 2. PROPERTIES
Our corporate headquarters are in Norwalk, Connecticut, where we lease 133,864 square feet of office space as of December 31, 2020. We also have domestic offices in several other locations, including: East Greenbush, New York; Rochester, New York; Portland, Oregon; and international offices in Australia, Canada, China, Denmark, Germany, the Netherlands, Singapore and the United Kingdom.
We lease all of our facilities. We believe that our facilities are adequate for our current needs and anticipate that suitable additional space will be readily available to accommodate any foreseeable expansion of our operations.
ITEM 3. LEGAL PROCEEDINGS
From time to time, we may become involved in various legal proceedings and claims arising in the ordinary course of business. We do not believe that we are a party to any legal proceeding that, if determined adversely to us, would individually or taken together have a material adverse effect on our business, operating results, financial condition, or cash flows.
Future litigation may be necessary to defend ourselves and our partners by determining the scope, enforceability and validity of third-party proprietary rights or to establish our proprietary rights. The results of any current or future litigation cannot be predicted with certainty, and regardless of the outcome, litigation can have an adverse impact on us because of defense and settlement costs, diversion of management resources and other factors.
ITEM 4. MINE SAFETY DISCLOSURES
Not Applicable
55
PART II
ITEM 5. MARKET FOR REGISTRANT’S COMMON EQUITY, RELATED STOCKHOLDER MATTERS AND ISSUER PURCHASES OF EQUITY SECURITIES
Market Information for Our Common Stock
Our shares of common stock, $0.001 par value per share, trade on the New York Stock Exchange (“NYSE”) under the ticker symbol “MSP”.
Holders of Record
As of December 31, 2020 there were approximately 15 shareholders of record of our common stock. This figure does not include a greater number of beneficial holders of our common stock whose shares are held by banks, brokers and other financial institutions.
Dividend Policy
We currently intend to retain all available funds and any future earnings to fund the development and growth of our business and to repay indebtedness and, therefore, we do not anticipate paying any cash dividends in the foreseeable future. Additionally, our ability to pay dividends on our common stock is limited by restrictions on the ability of our subsidiaries to pay dividends or make distributions to us. Any future determination to pay dividends will be at the discretion of our Board, subject to compliance with covenants in current and future agreements governing our and our subsidiaries’ indebtedness, including under our 2020 Credit Agreement, and will depend on our results of operations, financial condition, capital requirements and other factors that our Board may deem relevant.
Securities Authorized for Issuance under Equity Compensation Plans
See Item 12, "Security Ownership of Certain Beneficial Owners and Management and Related Stockholder Matters."
Stock Performance Graph
The following performance graph and related information shall not be deemed to be "soliciting material" or “filed” for purposes of Section 18 of the Securities Exchange Act of 1934, as amended, or otherwise subject to the liabilities of that section or Sections 11 and 12(a)(2) of the Securities Act of 1933, as amended, and shall not be incorporated by reference into any registration statement or other document filed by us with the SEC, whether made before or after the date of this Annual Report on Form 10-K, regardless of any general incorporation language in such filing, except as shall be expressly set forth by specific reference in such filing.
The following graph and related information shows a comparison of the cumulative total return for our common stock, Standard & Poor’s 500 Index (“S&P 500 Index”) and Standard & Poor’s 500 Information Technology Index (“S&P 500 IT Index”) between October 21, 2020 (the date our common stock commenced trading on the NYSE) through December 31, 2020. All values assume an initial investment of $100 and reinvestment of any dividends. The comparisons are based on historical data and are not indicative of, nor intended to forecast, the future performance of our common stock.
56
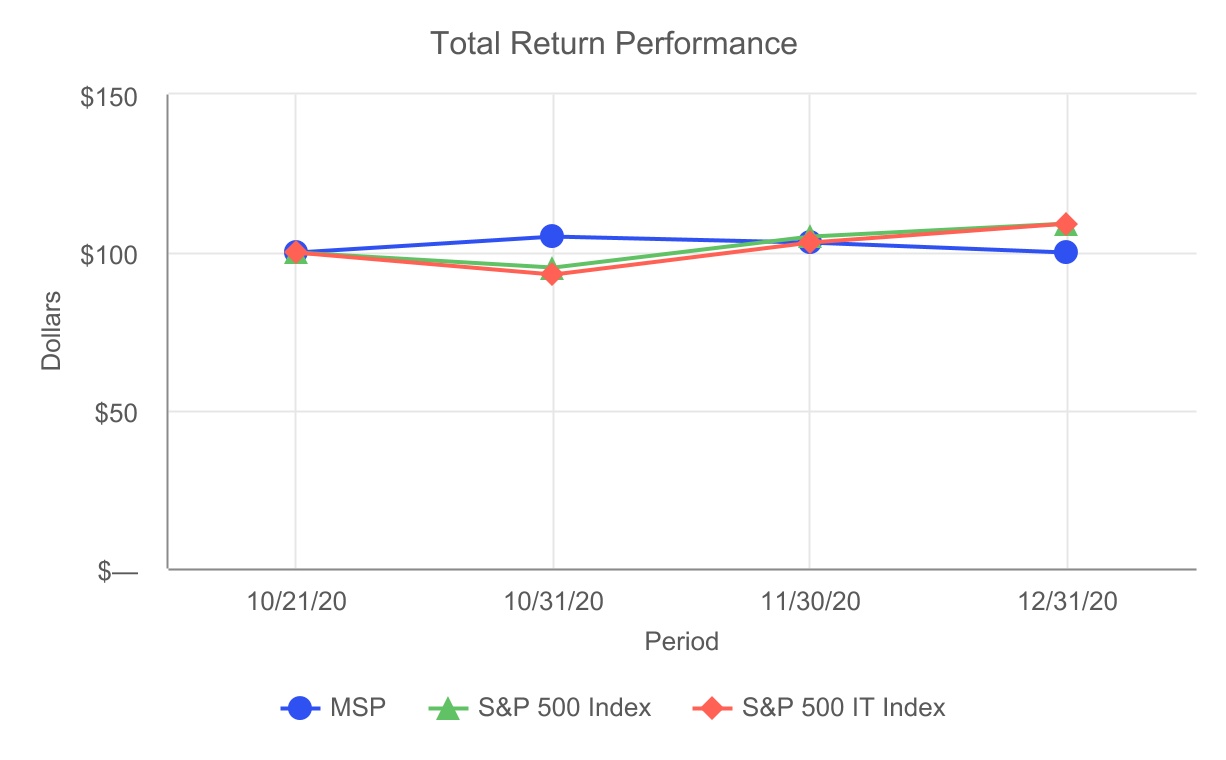
Unregistered Sales of Equity Securities
There were no unregistered sales of equity securities during the year ended December 31, 2020, except as previously reported.
Use of Proceeds from Initial Public Offering of Common Stock
On October 23, 2020, we closed our IPO, in which we issued and sold 22,000,000 shares of our common stock at a price to the public of $27.00 per share resulting in net proceeds to us of approximately $558.0 million, after deducting the underwriting discount of $36.0 million. On November 3, 2020, the underwriters exercised their option in full to purchase 3,300,000 additional shares of common stock at a price of $27.00 per share, resulting in additional net proceeds to us of approximately $83.6 million, after deducting the underwriting discount of $5.4 million. All shares issued and sold were registered pursuant to a registration statement on Form S-1 (File No. 333-249122), as amended.
Total net proceeds of approximately $636.3 million, after balances paid in connection with the IPO of $5.3 million, from our initial public offering and the exercise of the underwriters over-allotment option were used to repay all outstanding balances under our 2019 Credit Agreement of $590.2 million, with the remaining excess proceeds added to our cash balances.
At December 31, 2020, $0.7 million of expenses incurred in connection with our IPO had not yet been paid.
57
ITEM 6. SELECTED FINANCIAL DATA
The following tables present our selected consolidated financial data. The selected consolidated statements of operations, balance sheets and cash flow data for the years ended December 31, 2020, 2019 and 2018 are derived from our audited consolidated financial statements in this Form 10-K. Our historical results are not necessarily indicative of the results that may be expected in the future. You should read the selected consolidated financial data below in conjunction with the section titled “Management’s Discussion and Analysis of Financial Condition and Results of Operations” and the consolidated financial statements and related notes included in this Form 10-K.
| Year Ended December 31, | ||||||||||||||||||||
| 2020 | 2019 | 2018 | ||||||||||||||||||
(in thousands, except share and per share amounts) | ||||||||||||||||||||
| Consolidated Statements of Operations Data: | ||||||||||||||||||||
| Revenue: | ||||||||||||||||||||
| Subscription | $ | 485,326 | $ | 412,167 | $ | 333,397 | ||||||||||||||
| Device | 30,202 | 44,052 | 50,514 | |||||||||||||||||
| Professional services and other | 3,257 | 2,533 | 3,444 | |||||||||||||||||
| Total revenue | 518,785 | 458,752 | 387,355 | |||||||||||||||||
| Cost of revenue: | ||||||||||||||||||||
Subscription(1) | 84,463 | 82,066 | 72,498 | |||||||||||||||||
Device(1) | 37,607 | 53,933 | 50,813 | |||||||||||||||||
Professional services and other(1) | 6,244 | 5,563 | 3,637 | |||||||||||||||||
| Depreciation and amortization | 21,890 | 15,745 | 12,923 | |||||||||||||||||
| Total cost of revenue | 150,204 | 157,307 | 139,871 | |||||||||||||||||
| Gross profit | 368,581 | 301,445 | 247,484 | |||||||||||||||||
| Operating expenses: | ||||||||||||||||||||
Sales and marketing(1) | 115,790 | 110,441 | 98,183 | |||||||||||||||||
Research and development(1) | 78,932 | 60,459 | 54,017 | |||||||||||||||||
General and administrative(1) | 85,668 | 73,903 | 57,913 | |||||||||||||||||
| Depreciation and amortization | 27,223 | 27,417 | 28,953 | |||||||||||||||||
| Total operating expenses | 307,613 | 272,220 | 239,066 | |||||||||||||||||
| Income from operations | 60,968 | 29,225 | 8,418 | |||||||||||||||||
| Other expense: | ||||||||||||||||||||
| Interest expense | 25,348 | 43,437 | 55,380 | |||||||||||||||||
| Loss on extinguishment of debt | 8,488 | 19,231 | — | |||||||||||||||||
| Other (income) expense, net | (3,428) | 256 | 802 | |||||||||||||||||
| Total other expense | 30,408 | 62,924 | 56,182 | |||||||||||||||||
| Income (loss) before income taxes | 30,560 | (33,699) | (47,764) | |||||||||||||||||
| (Provision for) benefit from income tax | (8,062) | 2,511 | 10,041 | |||||||||||||||||
| Net income (loss) | $ | 22,498 | $ | (31,188) | $ | (37,723) | ||||||||||||||
| Net income (loss) per share attributable to common stockholders: | ||||||||||||||||||||
| Basic | $ | 0.16 | $ | (0.23) | $ | (0.28) | ||||||||||||||
| Diluted | $ | 0.16 | $ | (0.23) | $ | (0.28) | ||||||||||||||
Weighted average shares used in computing net income (loss) per share(2): | ||||||||||||||||||||
| Basic | 140,404,763 | 135,212,597 | 135,503,359 | |||||||||||||||||
| Diluted | 142,514,848 | 135,212,597 | 135,503,359 | |||||||||||||||||
58
| Year Ended December 31, | ||||||||||||||||||||
| 2020 | 2019 | 2018 | ||||||||||||||||||
| (in thousands) | ||||||||||||||||||||
| Consolidated Statement of Cash Flows Data: | ||||||||||||||||||||
| Net cash provided by (used in) operating activities | $ | 108,698 | $ | 11,235 | $ | (10,559) | ||||||||||||||
| Net cash used in investing activities | $ | (44,837) | $ | (38,226) | $ | (28,199) | ||||||||||||||
| Net cash provided by (used in) financing activities | $ | 75,679 | $ | 18,505 | $ | (5,182) | ||||||||||||||
| Consolidated Balance Sheets Data (at end of period): | ||||||||||||||||||||
| Cash and restricted cash | $ | 170,413 | $ | 29,066 | $ | 37,258 | ||||||||||||||
| Total assets | $ | 1,793,271 | $ | 1,642,292 | $ | 1,615,063 | ||||||||||||||
| Deferred revenue, current | $ | 23,763 | $ | 24,254 | $ | 30,150 | ||||||||||||||
| Deferred revenue, noncurrent | $ | 3,322 | $ | 3,798 | $ | 5,779 | ||||||||||||||
| Long-term debt, current portion | $ | — | $ | 5,500 | $ | — | ||||||||||||||
| Long-term debt | $ | — | $ | 546,499 | $ | 510,563 | ||||||||||||||
| Total liabilities | $ | 104,803 | $ | 649,989 | $ | 603,253 | ||||||||||||||
| Total stockholders’ equity | $ | 1,688,468 | $ | 992,303 | $ | 1,011,810 | ||||||||||||||
| Non-GAAP Financial Data (unaudited): | ||||||||||||||||||||
Adjusted EBITDA(3) | $ | 150,488 | $ | 84,602 | $ | 54,429 | ||||||||||||||
(1)Includes stock-based compensation expense as follows:
| Year Ended December 31, | ||||||||||||||||||||
| 2020 | 2019 | 2018 | ||||||||||||||||||
| (in thousands) | ||||||||||||||||||||
| Cost of revenue—subscription | $ | 4,092 | $ | 98 | $ | 140 | ||||||||||||||
| Cost of revenue—device | 203 | — | — | |||||||||||||||||
| Cost of revenue—professional services and other | 418 | — | — | |||||||||||||||||
| Selling and marketing | 6,614 | 2,946 | 764 | |||||||||||||||||
| Research and development | 13,590 | 3,510 | 1,020 | |||||||||||||||||
| General and administrative | 8,543 | 5,661 | 2,211 | |||||||||||||||||
| Total stock-based compensation expense | $ | 33,460 | $ | 12,215 | $ | 4,135 | ||||||||||||||
This table reflects stock-based compensation expense based upon the function of the option holder. Stock-based compensation expense for awards which contained only a time-based vesting condition was recorded in all periods presented. However, stock-based compensation expense for awards which contained both a time-based and a performance-based vesting condition, which was the closing of an IPO, commenced during the fourth quarter of 2020 as a result of our IPO.
(2)See Note 17. Net Income (Loss) per Share, to our consolidated financial statements of this Annual Report on Form 10-K for an explanation of the method used to calculate our basic and diluted net income (loss) per share and the weighted average number of shares used in the computation of the per share amounts.
(3)We define Adjusted EBITDA as net income (loss) adjusted for interest and other expense, net, loss on extinguishment of debt, depreciation and amortization, provision for (benefit from) income tax, stock-based compensation expense, restructuring expense and transaction related and other expense. For a reconciliation of Adjusted EBITDA to net income (loss), the most directly comparable measure calculated and presented in accordance with U.S. GAAP, see “Non GAAP measures—Adjusted EBITDA.”
59
ITEM 7. MANAGEMENT’S DISCUSSION AND ANALYSIS OF FINANCIAL CONDITION AND RESULTS OF OPERATIONS
The following discussion and analysis of our financial condition and results of operations should be read in conjunction with our consolidated financial statements and related notes appearing elsewhere in this Annual Report on Form 10-K. As discussed in the section titled "Forward Looking Statements," the following discussion and analysis contains forward looking statements that involve risks and uncertainties, as well as assumptions that, if they never materialize or prove incorrect, could cause our results to differ materially from those expressed or implied by such forward looking statements. Factors that could cause or contribute to these differences include, but are not limited to, those identified below and those discussed in the section titled "Risk Factors" in Part I, Item 1A of this Annual Report on Form 10-K.
A discussion regarding our financial condition and results of operations for 2020 compared to 2019 and for 2019 compared to 2018 is presented below.
Overview
Datto is the leading provider of cloud-based software and technology solutions purpose-built for delivery through the managed service provider, or MSP, channel to small and medium businesses, or SMBs. We enable our more than 17,000 MSP partners to manage and grow their businesses serving the SMB information technology, or SMB IT, market. Our platform combines mission-critical cloud-based software, technologies and security solutions that MSPs sell to SMBs, business management software to help MSPs scale their own businesses, and marketing tools, content, training and industry-leading events that cultivate an empowered and highly engaged MSP partner community.
MSPs represent the future of IT management for SMBs. Digital transformation is driving SMB adoption of modern software and technology, while regulatory and data protection requirements and proliferating security threats are increasing the complexity and risk of IT for SMBs. These trends have created an inflection point in SMB outsourcing to MSPs for IT management. MSPs are equipped with the IT resources and expertise SMBs lack, providing a single source to meet all of an SMB’s IT needs. MSPs are trusted to select, procure, implement and manage software and technology stacks that support their SMB customers’ business needs. The number of MSPs continues to grow, with approximately 125,000 MSPs providing this critical function to millions of SMBs worldwide today.
We are committed to the success of MSPs. It is the foundation of our strategy and culture. We empower our MSP partner channel, creating enormous sales and support leverage for us to efficiently address the large, but fragmented, SMB IT market. Our MSP-centric platform enables our partners to generate recurring revenue through the sale of our solutions to SMBs and to scale and effectively manage their own businesses. Our relationships are directly with our MSP partners. We are the leading pure-play vendor serving the MSP market, and believe our MSP-centric approach is highly differentiating as it aligns our mutual incentives, creates a motivated and engaged sales channel and reinforces our position as an integral component of our MSP partners’ businesses.
Our cloud-based platform provides Unified Continuity, Networking and Business Management software solutions. Our Unified Continuity offerings ensure the ongoing availability and security of mission-critical IT systems for SMBs on-premise, in private clouds and in the public cloud. Datto’s business continuity and disaster recovery, or BCDR, software, enables rapid restoration of an SMB’s full IT environment. Datto’s SaaS Protection is a reliable, automated and secure backup and restoration product for data stored on cloud applications such as Microsoft 365 and Google Workspace. Datto Networking constitutes a suite of MSP-centric networking solutions sold through our MSP partners to easily deliver networking as a managed service. These solutions are simple for MSPs to deploy, configure and manage across their SMB customers through a single portal. Our Business Management software provides critical operational tools to MSPs for efficient workflow management and delivery of end-to-end managed services. Our platform also includes a host of business development tools, training and content to help MSPs address the challenges of marketing and selling to SMB customers.
Datto was founded in 2007. From the very start, we have been creators of technology solutions for SMBs, typically only available to enterprises at the time, and recognized the power of the MSP channel. We have designed our strategy, culture and technology solutions to drive the success of our MSP partners. We have developed our platform and expanded our solutions to meet the evolving needs of MSPs, and we continually invest in cultivating the MSP community.
Our Business Model
We are committed to the success of MSPs. It is the foundation of our strategy and culture. Our cloud-based solutions are purpose-built to address the needs of MSPs and to enable the end-to-end delivery of managed services to their SMB customers. We believe our MSP-centric approach is highly differentiating because it aligns our mutual incentives, creates a motivated and engaged sales channel and ensures we become an integral component of our MSP partners’ businesses. We empower our MSP partner channel, creating
60
enormous sales and support leverage for us to efficiently address the large, but fragmented, SMB IT market. We do not market or sell to SMBs directly to avoid competing with our MSP partners, and instead, invest in helping MSPs thrive.
We generate substantially all our revenue from the sale of subscriptions to our cloud-based solutions and recognize revenue ratably over the subscription term. These contracts typically begin with a 1-year or 3-year term and auto-renew on a monthly or annual basis thereafter. For certain offerings, we enable our ongoing subscription services with an up-front sale of equipment or professional services that we recognize at the time of delivery and performance. The majority of our partners pay on a monthly basis, regardless of term length, with some opting to make quarterly, annual or multi-year prepayments.
Unified Continuity subscriptions are priced based on service tier, which is determined by data storage capacity and data retention period for our BCDR products, or by number of Microsoft 365 or Google Workspace employee accounts at the SMB domains that our MSP partners protect and data retention period for SaaS Protection offerings. Networking subscriptions are priced based on the volume and type of networking devices ordered. Business Management subscriptions are priced based on the number of employees at an MSP that are able to utilize our PSA product, or per endpoint device at the SMB for our RMM software. All of our contracts give us the right to increase prices at our discretion, although we have exercised this right infrequently.
We employ a highly efficient land-and-expand sales strategy facilitated by offering products that are reliable, easy to adopt and that drive recurring revenue growth and margin efficiency for our MSP partners. We sell our solutions to MSPs primarily through our sales team, leveraging the reach of our MSP partners and providing them with self-service options to upgrade service tiers, add volume and purchase additional solutions. Our MSP partners often significantly increase usage from their initial purchase and expand their usage to other products on our platform. We also provide access to business development tools and content to help MSPs address the challenges of marketing and selling to SMB customers. We grow alongside our MSP partners as they deploy our solutions across their existing SMB customers, add new customers and upgrade service tiers.
As of December 31, 2020, our ARR was $542.8 million and our revenue for the year ended December 31, 2020 was $518.8 million, of which approximately 94% was recurring subscription revenue. For the year ended December 31, 2020, our net income was $22.5 million and our Adjusted EBITDA was $150.5 million. As of December 31, 2019, our ARR was $474.8 million and our revenue for the year ended December 31, 2019, was $458.8 million, of which approximately 90% was recurring subscription revenue. For the year ended December 31, 2019, our net loss was $31.2 million and our Adjusted EBITDA was $84.6 million. Refer to our discussion of ARR in Key Performance Metrics and Adjusted EBITDA in Non-GAAP Financial Measures.
Impact of COVID-19
While we have not incurred significant disruptions thus far from the COVID-19 pandemic, we are unable to accurately predict the extent of the impact on our business because of numerous uncertainties, including but not limited to, the severity of the disease, the duration of the outbreak, the reoccurrence or emergence of variants of the virus, the effectiveness and speed of vaccinations, actions taken by government authorities, the impact on our customers and suppliers, and other factors. Specifically, we may experience impacts from customers deferring purchasing and activation decisions, reducing expenses and requesting extended payment terms or relief from payments.
The effect of the COVID-19 pandemic will not be fully reflected in our results of operations and overall financial performance until future periods. In addition, our consolidated financial statements reflect estimates and assumptions made by management that affect the reported amounts of assets and liabilities, disclosures of contingent assets and liabilities at the date of the consolidated financial statements and the reported amounts of revenues and expenses during the reporting periods. Significant estimates and assumptions reflected in our consolidated financial statements include, but are not limited to, establishing allowances for doubtful accounts, assessing the recoverability of prepaid assets, including trade shows and other marketing events impacted by the pandemic, determining useful lives for finite-lived assets, assessing the recoverability of long-lived assets, determining the fair value of assets acquired and liabilities assumed in business combinations, accounting for income taxes and related valuation allowances against deferred tax assets, valuing stock-based awards, recognizing revenue and the estimate for sales returns and upgrades, determining the amortization period for capitalized commissions and assessing the accounting treatment for commitments and contingencies. Management evaluates these estimates and assumptions on an ongoing basis and makes estimates based on historical experience and various other considerations that are believed to be reasonable. Actual results may differ from those estimates, including as a result of the COVID-19 pandemic. We will continue to evaluate the nature and extent of the impact of the pandemic on our business and our consolidated results of operations and financial condition.
Key Factors Affecting Our Performance
Addition of New MSPs
Our ability to attract new partners will depend on a number of factors, including the effectiveness of our pricing and products, offerings of our competitors, the effectiveness of our marketing efforts, and the growth of the MSP market. We believe there is
61
substantial opportunity to increase our penetration among MSPs. We intend to drive new partner acquisition by continuing to invest significantly in sales and marketing to identify and engage prospective partners and to extend the awareness of our brand as a trusted partner to the MSP community. We believe our singular dedication to the MSP channel and our solutions that are purpose-built to meet the needs of MSPs differentiates us in the marketplace. We intend to continue to grow the number of sales representatives to qualify and close new partner opportunities. In addition, we intend to continue investing in marketing programs, events and content to drive brand awareness, generate leads and cultivate the broader MSP ecosystem. As of December 31, 2020, we had approximately 17,000 MSP partners, a net increase of approximately 400 since December 31, 2019 and 2,600 since December 31, 2018. During the fourth quarter of 2020, the number of MSP partners declined, reflecting the churn of certain smaller MSPs resulting in part from the ongoing impacts of the COVID-19 pandemic and related payment issues.
Sales Expansion Within Our Existing Partner Base
Our ability to expand sales within our existing partner base will depend on a number of factors, including their satisfaction with our solutions and support, competition, the effectiveness of the business development tools we provide to our partners and the ability of our partners to grow their sales. Our large base of partners represents a significant opportunity for further sales expansion. Once an MSP has become our partner, we aim to grow alongside them as they increase penetration of our solutions across their existing SMB partner base, attract additional SMB customers, upgrade service tiers and adopt additional Datto solutions. We have a strong track record of growth from our existing base as evidenced by our history of partner cohort expansion and our dollar-based net retention rate, which was 111% and 119% as of December 31, 2020 and 2019, respectively. We intend to continue to invest in MSP self-service procurement tools to further enable a frictionless purchasing process, grow the number of sales representatives to facilitate increased partner adoption of our solutions and invest in enabling our partners’ sales teams through our marketing automation platform, programs, content, training and certifications for MSPs. As of December 31, 2020, over 1,100 of our MSP partners contributed ARR of $100,000 or more, up from 950 as of December 31, 2019 and 700 as of December 31, 2018.
Innovation and Introduction of New Platform Solutions
Our continued growth is dependent upon our ability to sustain innovation in order to maintain a competitive advantage. We recognize that the pace of technological innovation is accelerating and that we need to continue to innovate to maintain our product differentiation. We continually invest in improving our existing solutions and creating new mission-critical solutions to anticipate the evolving IT demands of MSPs and their SMB customers. In addition, we intend to evaluate strategic investments in businesses and technologies to drive product and market expansion. For example, in July 2020 we acquired Gluh Pty. Ltd., an Australia-based company which offers a real-time quoting platform that enables MSPs to simplify the procurement of IT products and services for their end customers.
Expansion of Our International Footprint
Our international growth in any region will depend on our ability to effectively implement our business processes and go-to-market strategy, our ability to adapt to market or cultural differences, the competitive landscape, the maturity and growth trajectory of the MSP market and our brand awareness and perception. We believe there is significant opportunity to expand internationally. For both 2020 and 2019, our international revenue was approximately 27% of our total revenue. We intend to continue to make significant investments in international markets, particularly in EMEA and APAC. This may include investing in additional sales and marketing personnel, localizing product offerings and marketing content, and adding new data-center or office locations. Although these investments may adversely affect our operating results in the near term, we believe they will contribute to our long-term growth.
Key Performance Metrics
In addition to our GAAP financial information, we review a number of operating and financial metrics, including the following key metrics, to evaluate our business, measure our performance, identify trends affecting our business, formulate business plans and make strategic decisions.
MSP Partners
The number of MSP partners represents the number of MSPs with active subscriptions as of the end of the period. We use this number to assess our ability to attract and retain MSP partners and thereby grow our business. As of December 31, 2020, we had over 17,000 MSP partners, a net increase of approximately 400 since December 31, 2019 and 2,600 since December 31, 2018. Net changes in the number of our MSP partners are a result of the total new partners added during a period, largely based on our sales and marketing efforts, and the churn or reduction of existing partners during the period, which can be affected by the broader economic environment and factors such as the effects of COVID-19 on our partners' SMB end customers. As a result of our land-and-expand model, our revenue growth is driven principally by additional revenue from existing MSP partners. We view new MSP partner additions as a leading indicator of the health of the business, but the additions do not immediately drive material revenue growth in our reported results of
62
operations. During the fourth quarter of 2020, the number of MSP partners declined, reflecting the churn of certain smaller MSPs resulting in part from the ongoing impacts of the COVID-19 pandemic and related payment issues.
Annual Run-Rate Revenue
We define annual run-rate revenue, or ARR, as the annualized value of all subscription agreements as of the end of a period. We calculate ARR by multiplying the monthly run-rate revenue for the last month of a period by 12. Monthly run-rate revenue is calculated by aggregating monthly subscription values during the final month of the reporting period from both long-term and month-to-month subscriptions. ARR only includes the annualized value of subscription contracts and excludes any one-time revenue for devices or professional services. ARR mitigates fluctuations resulting from seasonality and contract term. ARR does not have any standardized meaning and is therefore unlikely to be comparable to similarly titled measures presented by other companies. ARR should be viewed independently of revenue and deferred revenue and is not intended to be combined with or to replace either of those items. ARR is not a forecast and the active contracts at the date used in calculating ARR may or may not be extended or renewed by our MSP partners.
The table below sets forth our ARR as of December 31, 2020, 2019 and 2018:
| As of December 31, | ||||||||||||||||||||
| (in millions) | 2020 | 2019 | 2018 | |||||||||||||||||
| ARR | $ | 542.8 | $ | 474.8 | $ | 379.2 | ||||||||||||||
ARR includes run-rate revenue values from month-to-month subscription contracts. For the year ended December 31, 2020, approximately 39% of our total revenue and 42% of our subscription revenue was derived from month-to-month contracts. For the year ended December 31, 2019, approximately 31% of our total revenue and 35% of our subscription revenue was derived from month-to-month contracts. The increase in percent of total revenue and subscription revenue from month-to-month contracts primarily resulted from adding fewer long-term contracts during the COVID-19 pandemic compared to the prior year period, while other existing contracts completed their initial term and rolled to month-to-month contracts thereafter.
Our dollar-based gross retention rate as of both December 31, 2020 and 2019, was approximately 88%. Our dollar-based gross retention rate reflects ARR losses from subscription cancellations, reductions in service levels or seat counts and non-renewals, and does not reflect any ARR expansion. We calculate our dollar-based gross retention rate as of the period end by starting with the ARR from the last day of the period one year prior, or Prior Period ARR. We then deduct from the Prior Period ARR any (i) ARR attrition from MSP partners who are no longer partners as of the last day of the period, and (ii) ARR compression from MSP partners whose subscriptions are at a lower value as of the last day of the period, or Remaining ARR. We then divide the Remaining ARR by the Prior Period ARR to arrive at our dollar-based gross retention rate, which is the percentage of ARR from all MSP partners as of the year prior that is not lost to partner churn or subscription compression. Given the meaningful percentage of our subscription revenue derived from month-to-month contracts, the approximately 88% dollar-based gross retention rate demonstrates that a large majority of our MSP partners continue to renew their subscription contracts, whether on a month-to-month or longer term basis. Based on our experience, we do not believe month-to-month contracts experience significantly higher attrition than longer-term subscription contracts.
Dollar-Based Net Retention Rate
To evaluate the efficacy of our land-and-expand business model, we examine the rate at which our partners increase their subscriptions for our solutions which result in changes to ARR. Our dollar-based net retention rate measures our ability to increase ARR across our existing partner base through expanded use of our platform, offset by MSP partners whose subscription contracts with us are not renewed or are renewed at a lower amount.
We calculate our dollar-based net retention rate as of the end of a reporting period as a quotient of the following:
•Denominator: ARR as of the last day of the prior year comparative reporting period.
•Numerator: ARR as of the last day of the current reporting period from partners with associated ARR as of the last day of the prior year comparative reporting period.
The quotient obtained from this calculation is our dollar-based net retention rate. We believe our ability to grow alongside our MSP partners as they deploy our solutions to more SMBs, and to cross-sell additional solutions, will continue to support our high dollar-based net retention rate.
As of December 31, 2020 and 2019, our dollar-based net retention rate was 111% and 119%, respectively.
Because existing MSP partners drive the vast majority of our revenue growth in any given year, we believe our revenue growth is strongly correlated to our dollar-based net retention rate.
63
Components of Results of Operations
Revenue
We generate revenue primarily from fees received for subscriptions to our products and services, and also from the sale of BCDR and Networking devices and professional services associated with our Business Management offerings.
Subscription. We derive revenue primarily from cloud-based software and technology solutions sold on a recurring subscription basis. Subscription revenue is recognized ratably over the subscription term after all revenue recognition criteria have been met. We generally invoice subscription agreements monthly in advance over the subscription period or monthly in arrears based on usage. Subscription revenue for our Unified Continuity and Networking solutions grows as the end-customers, managed by our MSP partners, add new subscription products, upgrade the service tier of their existing subscription products or increase the usage of their subscription products. Revenue from our Business Management solutions increases with the addition of employees of our MSP partners who require seat licenses, the proliferation of end-user devices managed by those MSPs and the expansion of products used by those MSPs to manage their SMB customers’ IT infrastructures.
Device. Our device revenue is derived from the sale of devices in conjunction with subscription solutions. Device revenue includes the sale of BCDR and Networking devices which enable us to deliver our BCDR and Networking services to our MSP partners under a recurring subscription model. Revenue from devices in our Unified Continuity solution primarily consists of the sale of our proprietary data storage devices. Revenue from devices in our Networking solution primarily consists of the sale of wireless access points, switches, edge routers and managed power. We recognize revenue at a point in time when control of the device has transferred to the MSP. Revenue from devices does not contribute significantly to overall revenue related to our Unified Continuity solutions.
Professional services and other. We derive revenue from professional services associated with our Business Management offerings. These implementation and consulting services include configuration, database merging and data migration. Our professional services are generally priced on a time and materials basis and invoiced monthly with revenue recognized as the services are performed and we frequently discount our services to drive adoption of our business management offerings.
Cost of revenue
Subscription. Subscription cost of revenue consists of costs directly related to our subscription services, including personnel costs related to operating our data centers and customer support operations, hosting and data center related costs, third-party software licenses and allocated facilities and overhead costs associated with delivering these services.
Device. Device cost of revenue consists of hardware, manufacturing, shipping and logistics, personnel costs and allocated facilities and overhead costs associated with delivering our devices. Our Unified Continuity products rely on a mix of off-the-shelf hardware and custom designed hardware. Our Networking devices generally consist of off-the-shelf hardware, although some of our devices feature a unique industrial design.
Professional services and other. Professional services and other cost of revenue consists primarily of personnel costs and allocated facilities and overhead associated with delivering implementation and consulting services. Our professional services implementations aim to ensure higher software utilization, greater upsell opportunity and lower churn over time.
Depreciation and amortization. Depreciation and amortization cost of revenue consists of depreciation of our Datto Cloud infrastructure and amortization of our acquired technology intangible assets.
Gross profit and gross margin
Gross profit, or revenue less cost of revenue, has been, and will continue to be, affected by various factors, including revenue fluctuations, the mix of revenue and the timing and amount of investments to expand our Datto Cloud infrastructure.
Operating expenses
Our operating expenses consist of sales and marketing, research and development and general and administrative expenses as well as depreciation and amortization of internally developed software, and amortization of acquired intangible assets. Personnel costs are the most significant component of operating expenses and consist of salaries, benefits, bonuses, sales commissions, payroll taxes and stock-based compensation expense. Other significant components of operating expenses include events and travel, professional fees, allocated facilities and overhead costs, general marketing and promotion costs, payment processing fees and bad debt expense.
64
Sales and marketing
Sales and marketing expenses consist primarily of personnel costs, costs for events and travel, costs of marketing and promotional activities, payment processing fees and allocated facilities and overhead costs. Sales and marketing expenses may fluctuate as a percentage of our revenue from period to period because of the timing and extent of marketing activities, trade shows, and events including DattoCon and DattoCon EMEA, as well as the timing of amortization of sales commissions and stock-based compensation expense.
Research and development
Research and development expenses consist primarily of personnel costs, third-party professional fees and allocated facilities and overhead costs. Research and development expense may fluctuate as a percentage of our revenue from period to period because of the timing and extent of our investments in research and development activities, as well as the timing of stock-based compensation expense.
General and administrative
General and administrative expenses consist primarily of personnel costs across the corporate functions of executive, finance, human resources, information technology, internal operations and legal, as well as third-party professional fees, bad debt expense, travel and allocated costs for facilities. Following the completion of our IPO we began incurring additional general and administrative expenses as a result of operating as a public company, including increased expenses for insurance, costs to comply with the rules and regulations applicable to companies listed on a national securities exchange, costs related to compliance and reporting obligations pursuant to the rules and regulations of the SEC, investor relations and professional services expenses, and increased stock-based compensation expense.
Depreciation and amortization
Depreciation and amortization expenses in operating expenses consist of amortization of tradenames and partner relationship intangibles as well as depreciation of other property and equipment such as leasehold improvements, furniture and fixtures, and computer equipment as well as amortization of internally developed software.
Other expense
Interest expense
Interest expense consists primarily of interest payments on outstanding borrowings under our credit facilities. In conjunction with our IPO, we repaid all amounts outstanding under our 2019 Credit Agreement. We also entered into the 2020 Credit Agreement, which provides a $200.0 million revolving credit facility. No amounts were drawn under the 2020 Credit Agreement. See “Liquidity and Capital Resources—Credit Facilities” for additional details.
Other (income) expense
Other (income) expense primarily consists of the net exchange (gains) or losses on foreign currency transactions and (gains) or losses on the disposal of assets.
Loss on extinguishment of debt
Loss on extinguishment of debt reflects the loss incurred in conjunction with the termination of our credit facilities in both 2020 and 2019. See “Liquidity and Capital Resources—Credit Facilities” for additional details.
(Benefit from) provision for income tax
(Benefit from) provision for income tax consists primarily of income taxes related to U.S. federal and state income taxes and income taxes in foreign jurisdictions in which we conduct business.
Stock-Based Compensation
Stock-based compensation expense is recorded based upon the functional role of the holder. Stock-based compensation expense for awards which contained only a time-based vesting condition was recorded in all periods presented. However, stock-based compensation expense for awards which contained both a time-based and a performance-based vesting condition, which was the closing of an IPO, commenced during the fourth quarter of 2020 as a result of our IPO.
65
Results of Operations
The following table sets forth our consolidated statements of operations data for the period indicated:
| Year Ended December 31, | ||||||||||||||||||||
| 2020 | 2019 | 2018 | ||||||||||||||||||
| (in thousands) | ||||||||||||||||||||
| Revenue: | ||||||||||||||||||||
| Subscription | $ | 485,326 | $ | 412,167 | $ | 333,397 | ||||||||||||||
| Device | 30,202 | 44,052 | 50,514 | |||||||||||||||||
| Professional services and other | 3,257 | 2,533 | 3,444 | |||||||||||||||||
| Total revenue | 518,785 | 458,752 | 387,355 | |||||||||||||||||
| Cost of revenue: | ||||||||||||||||||||
Subscription(1) | 84,463 | 82,066 | 72,498 | |||||||||||||||||
Device(1) | 37,607 | 53,933 | 50,813 | |||||||||||||||||
Professional services and other(1) | 6,244 | 5,563 | 3,637 | |||||||||||||||||
| Depreciation and amortization | 21,890 | 15,745 | 12,923 | |||||||||||||||||
| Total cost of revenue | 150,204 | 157,307 | 139,871 | |||||||||||||||||
| Gross profit | 368,581 | 301,445 | 247,484 | |||||||||||||||||
| Operating expenses: | ||||||||||||||||||||
Sales and marketing(1) | 115,790 | 110,441 | 98,183 | |||||||||||||||||
Research and development(1) | 78,932 | 60,459 | 54,017 | |||||||||||||||||
General and administrative(1) | 85,668 | 73,903 | 57,913 | |||||||||||||||||
| Depreciation and amortization | 27,223 | 27,417 | 28,953 | |||||||||||||||||
| Total operating expenses | 307,613 | 272,220 | 239,066 | |||||||||||||||||
| Income from operations | 60,968 | 29,225 | 8,418 | |||||||||||||||||
| Other expense: | ||||||||||||||||||||
| Interest expense | 25,348 | 43,437 | 55,380 | |||||||||||||||||
| Loss on extinguishment of debt | 8,488 | 19,231 | — | |||||||||||||||||
| Other (income) expense, net | (3,428) | 256 | 802 | |||||||||||||||||
| Total other expense | 30,408 | 62,924 | 56,182 | |||||||||||||||||
| Income (loss) before income taxes | 30,560 | (33,699) | (47,764) | |||||||||||||||||
| (Provision for) benefit from income tax | (8,062) | 2,511 | 10,041 | |||||||||||||||||
| Net income (loss) | $ | 22,498 | $ | (31,188) | $ | (37,723) | ||||||||||||||
(1)Includes stock-based compensation expense as follows:
| Year Ended December 31, | ||||||||||||||||||||
| 2020 | 2019 | 2018 | ||||||||||||||||||
| (in thousands) | ||||||||||||||||||||
| Cost of revenue—subscription | $ | 4,092 | $ | 98 | $ | 140 | ||||||||||||||
| Cost of revenue—device | 203 | — | — | |||||||||||||||||
| Cost of revenue—professional services and other | 418 | — | — | |||||||||||||||||
| Selling and marketing | 6,614 | 2,946 | 764 | |||||||||||||||||
| Research and development | 13,590 | 3,510 | 1,020 | |||||||||||||||||
| General and administrative | 8,543 | 5,661 | 2,211 | |||||||||||||||||
| Total stock-based compensation expense | $ | 33,460 | $ | 12,215 | $ | 4,135 | ||||||||||||||
66
The following table sets forth our consolidated statements of operations data expressed as a percentage of total revenue for the period indicated:
| Year Ended December 31, | ||||||||||||||||||||
| 2020 | 2019 | 2018 | ||||||||||||||||||
| Revenue: | ||||||||||||||||||||
| Subscription | 93.6 | % | 89.8 | % | 86.1 | % | ||||||||||||||
| Device | 5.8 | % | 9.6 | % | 13.0 | % | ||||||||||||||
| Professional services and other | 0.6 | % | 0.6 | % | 0.9 | % | ||||||||||||||
| Total revenue | 100.0 | % | 100.0 | % | 100.0 | % | ||||||||||||||
| Cost of revenue: | ||||||||||||||||||||
| Subscription | 16.3 | % | 17.9 | % | 18.7 | % | ||||||||||||||
| Device | 7.2 | % | 11.8 | % | 13.1 | % | ||||||||||||||
| Professional services and other | 1.2 | % | 1.2 | % | 0.9 | % | ||||||||||||||
| Depreciation and amortization | 4.2 | % | 3.4 | % | 3.3 | % | ||||||||||||||
| Total cost of revenue | 29.0 | % | 34.3 | % | 36.1 | % | ||||||||||||||
| Gross profit | 71.0 | % | 65.7 | % | 63.9 | % | ||||||||||||||
| Operating expenses: | ||||||||||||||||||||
| Sales and marketing | 22.3 | % | 24.1 | % | 25.3 | % | ||||||||||||||
| Research and development | 15.2 | % | 13.2 | % | 13.9 | % | ||||||||||||||
| General and administrative | 16.5 | % | 16.1 | % | 15.0 | % | ||||||||||||||
| Depreciation and amortization | 5.2 | % | 5.9 | % | 7.5 | % | ||||||||||||||
| Total operating expenses | 59.3 | % | 59.3 | % | 61.7 | % | ||||||||||||||
| Income from operations | 11.8 | % | 6.4 | % | 2.2 | % | ||||||||||||||
| Other expense: | ||||||||||||||||||||
| Interest expense | 4.9 | % | 9.4 | % | 14.3 | % | ||||||||||||||
| Loss on extinguishment of debt | 1.6 | % | 4.2 | % | — | % | ||||||||||||||
| Other (income) expense, net | (0.7) | % | 0.1 | % | 0.2 | % | ||||||||||||||
| Total other expense | 5.9 | % | 13.7 | % | 14.5 | % | ||||||||||||||
| Income (loss) before income taxes | 5.9 | % | (7.3) | % | (12.3) | % | ||||||||||||||
| (Provision for) benefit from income tax | (1.6) | % | 0.5 | % | 2.6 | % | ||||||||||||||
| Net income (loss) | 4.3 | % | (6.8) | % | (9.7) | % | ||||||||||||||
Comparison of the Years Ended December 31, 2020 and 2019
Revenue
| Year Ended December 31, | ||||||||||||||||||||||||||
| 2020 | 2019 | $ Change | % Change | |||||||||||||||||||||||
| (in thousands) | ||||||||||||||||||||||||||
| Revenue: | ||||||||||||||||||||||||||
| Subscription | $ | 485,326 | $ | 412,167 | $ | 73,159 | 17.7 | % | ||||||||||||||||||
| Device | 30,202 | 44,052 | (13,850) | (31.4) | % | |||||||||||||||||||||
| Professional services and other | 3,257 | 2,533 | 724 | 28.6 | % | |||||||||||||||||||||
| Total revenue | $ | 518,785 | $ | 458,752 | $ | 60,033 | 13.1 | % | ||||||||||||||||||
Subscription
Subscription revenue increased $73.2 million, or 17.7%, for 2020 compared to 2019. The increase in subscription revenue was driven by increased sales across all of our Unified Continuity, Business Management and Networking cloud-based offerings. Recurring subscription revenue accounted for 94% of total revenue for 2020 compared to 90% for 2019.
Device
Device revenue decreased $13.9 million, or 31.4%, for 2020 compared to 2019. This decrease was primarily attributable to a lower volume of devices sold, partly as a result of the impact of the COVID-19 pandemic, which resulted in a lower volume of new subscriptions and thus a lower volume of BCDR and networking devices, as well as an impact of approximately $1.8 million from our shift in early 2019 from selling a broader range of networking devices on a one-time basis to packaging networking devices with cloud-based management software and services with lower upfront costs and a recurring subscription.
67
Professional services and other
Professional services and other revenue increased $0.7 million, or 28.6%, for 2020 compared to 2019, primarily as a result of additional implementations of our cloud-based Business Management offerings.
Cost of Revenue
| Year Ended December 31, | ||||||||||||||||||||||||||
| 2020 | 2019 | $ Change | % Change | |||||||||||||||||||||||
| (in thousands) | ||||||||||||||||||||||||||
| Cost of revenue: | ||||||||||||||||||||||||||
| Subscription | $ | 84,463 | $ | 82,066 | $ | 2,397 | 2.9 | % | ||||||||||||||||||
| Device | 37,607 | 53,933 | (16,326) | (30.3) | % | |||||||||||||||||||||
| Professional services and other | 6,244 | 5,563 | 681 | 12.2 | % | |||||||||||||||||||||
| Depreciation and amortization | 21,890 | 15,745 | 6,145 | 39.0 | % | |||||||||||||||||||||
| Total cost of revenue | $ | 150,204 | $ | 157,307 | $ | (7,103) | (4.5) | % | ||||||||||||||||||
Subscription
Subscription cost of revenue increased $2.4 million, or 2.9%, for 2020 compared to 2019. The increase was primarily driven by additional costs to support the growth of our subscription offerings, including increased personnel costs, including significantly higher stock-based compensation expense as a result of our IPO, partially offset by increased efficiencies in the costs to provide our Unified Continuity solutions. Restructuring costs of $0.5 million related to our reduction in workforce were recorded in 2020. Subscription cost of revenue reflects stock-based compensation expense of $4.1 million and $0.1 million for 2020 and 2019, respectively.
Device
Device cost of revenue decreased $16.3 million, or 30.3% for 2020 compared to 2019, primarily driven by the lower volume of devices sold in 2020, partly as a result of the impact of the COVID-19 pandemic, which resulted in a lower volume of new subscriptions and thus a lower volume of BCDR and networking devices. In addition, the decrease was driven by greater inventory write offs in 2019 and the impact of approximately $1.1 million from our shift in early 2019 from selling a broader range of networking devices on a one-time basis to packaging networking devices with cloud-based management software and services with lower upfront costs and a recurring subscription. Device cost of revenue reflects stock-based compensation expense of $0.2 million during 2020. There was no stock-based compensation expense recorded in 2019.
Professional services and other
Professional services and other cost of revenue increased $0.7 million, or 12.2% for 2020 compared to 2019, driven by growth in employee and related costs in our professional services organization, including stock-based compensation expense as a result of our IPO. Restructuring costs of $0.1 million related to our reduction in workforce were recorded in 2020. Professional services and other cost of revenue reflects stock-based compensation expense of $0.4 million during 2020. There was no stock-based compensation expense recorded in 2019.
Depreciation and amortization
Depreciation and amortization related to cost of revenue increased $6.1 million for 2020 compared to 2019. The increase was attributable primarily to higher depreciation expense in 2020 associated with the continued capital expenditures for our Datto Cloud infrastructure to support the growth in subscriptions. Depreciation expense was $16.9 million and $11.0 million in 2020 and 2019, respectively, and amortization of intangible assets was $5.0 million and $4.7 million in 2020 and 2019, respectively.
68
Gross Profit and Gross Margin
| Year Ended December 31, | ||||||||||||||||||||||||||
| 2020 | 2019 | $ Change | % Change | |||||||||||||||||||||||
| (in thousands) | ||||||||||||||||||||||||||
| Gross profit: | ||||||||||||||||||||||||||
| Subscription | $ | 400,863 | $ | 330,101 | $ | 70,762 | 21.4 | % | ||||||||||||||||||
| Device | (7,405) | (9,881) | 2,476 | (25.1) | % | |||||||||||||||||||||
| Professional services and other | (2,987) | (3,030) | 43 | (1.4) | % | |||||||||||||||||||||
| Depreciation and amortization | (21,890) | (15,745) | (6,145) | 39.0 | % | |||||||||||||||||||||
| Total gross profit | $ | 368,581 | $ | 301,445 | $ | 67,136 | 22.3 | % | ||||||||||||||||||
| Gross margin: | ||||||||||||||||||||||||||
| Subscription | 82.6 | % | 80.1 | % | ||||||||||||||||||||||
| Device | (24.5) | % | (22.4) | % | ||||||||||||||||||||||
| Professional services and other | (91.7) | % | (119.6) | % | ||||||||||||||||||||||
| Total gross margin | 71.0 | % | 65.7 | % | ||||||||||||||||||||||
Our gross profit increased $67.1 million, or 22.3%, and our gross margin increased by 534 basis points for 2020 as compared to 2019, driven by growth in subscription revenue and to a lesser extent by the reduction in device cost of revenue, partially offset by higher depreciation and amortization expense associated with our ongoing data center expansions, higher stock-based compensation expense of $4.6 million and $0.6 million of restructuring costs related to our reduction in workforce.
Operating Expenses
| Year Ended December 31, | ||||||||||||||||||||||||||
| 2020 | 2019 | $ Change | % Change | |||||||||||||||||||||||
| (in thousands) | ||||||||||||||||||||||||||
| Operating expenses: | ||||||||||||||||||||||||||
| Sales and marketing | $ | 115,790 | $ | 110,441 | $ | 5,349 | 4.8 | % | ||||||||||||||||||
| Research and development | 78,932 | 60,459 | 18,473 | 30.6 | % | |||||||||||||||||||||
| General and administrative | 85,668 | 73,903 | 11,765 | 15.9 | % | |||||||||||||||||||||
| Depreciation and amortization | 27,223 | 27,417 | (194) | (0.7) | % | |||||||||||||||||||||
| Total operating expenses | $ | 307,613 | $ | 272,220 | $ | 35,393 | 13.0 | % | ||||||||||||||||||
| As a percentage of total revenue | ||||||||||||||||||||||||||
| Sales and marketing | 22.3 | % | 24.1 | % | ||||||||||||||||||||||
| Research and development | 15.2 | % | 13.2 | % | ||||||||||||||||||||||
| General and administrative | 16.5 | % | 16.1 | % | ||||||||||||||||||||||
Sales and marketing
Sales and marketing expense increased $5.3 million, or 4.8%, for 2020 compared to 2019, driven by increased personnel costs, including increased stock-based compensation expense of $3.7 million as a result of our IPO and costs related to our workforce reduction of $1.9 million, and higher payment processing fees resulting from higher revenues. The increases were partially offset by lower marketing, travel and events costs resulting from the COVID-19 pandemic, including the cancellation of DattoCon and DattoCon EMEA in 2020. Sales and marketing expense included $6.6 million and $2.9 million of stock-based compensation expense for 2020 and 2019, respectively.
Research and development
Research and development expense increased $18.5 million, or 30.6%, for 2020 compared to 2019, primarily driven by increases in personnel costs, including increased stock-based compensation expense of $10.1 million as a result of our IPO and costs related to our workforce reduction of $0.9 million, partially offset by lower travel costs resulting from the COVID-19 pandemic. Research and development expense included $13.6 million and $3.5 million of stock-based compensation expense for 2020 and 2019, respectively.
General and administrative
General and administrative expense increased $11.8 million, or 15.9%, for 2020 compared to 2019, driven primarily by increased personnel costs, including increased stock-based compensation expense of $2.9 million as a result of our IPO and costs related to our
69
workforce reduction of $0.4 million, increased public company insurance costs, transaction related and other costs, comprised of $2.2 million related to public company readiness and acquisition costs, and $1.0 million of expense resulting from the decision to discontinue development of a back-office system. The increased costs were partially offset by lower travel and other costs resulting from the COVID-19 pandemic. General and administrative expense included $8.5 million and $5.7 million of stock-based compensation expense for 2020 and 2019, respectively.
Depreciation and amortization
Depreciation and amortization expense related to operating expenses for 2020 was consistent with 2019. Amortization of intangible assets was $17.7 million and $17.9 million in 2020 and 2019, respectively, and depreciation expense was $9.5 million for both 2020 and 2019.
Other Expenses
Interest expense
Interest expense of $25.3 million reflects a decrease of $18.1 million, or 41.6%, for 2020 compared to 2019, primarily as a result of lower interest rates in 2020 and the repayment of all outstanding debt with the proceeds from our IPO in October, partially offset by increased borrowings under our revolving credit facility during the first quarter of 2020 in order to strengthen our cash position and maintain flexibility given the unprecedented circumstances of the COVID-19 pandemic. In conjunction with the IPO, we terminated our 2019 Credit Agreement and entered into the 2020 Credit Agreement. No amounts were drawn under the 2020 Credit Agreement and we have no outstanding debt as of December 31, 2020.
Loss on extinguishment of debt
A loss on extinguishment of debt of $8.5 million was recorded in 2020 as a result of our debt refinancing which took place in conjunction with our IPO. A loss on extinguishment of debt of $19.2 million was recorded in 2019 as a result of our debt refinancing in April 2019.
Other (income) expense, net
Other (income) expense, net primarily relates to the impact of net exchange gains or losses on foreign currency balances, principally related to intercompany balances denominated in foreign currencies.
(Provision for) benefit from income tax
We recorded a provision for income tax of $8.1 million for 2020, as we generated taxable income, as compared to a benefit from income tax of $2.5 million in 2019, as we generated a taxable loss. The effective tax rate for 2020 compared to 2019 was 26.4% and 7.5%, respectively. The effective tax rate increased primarily as a result of generating taxable income in 2020, as the realizability of certain taxable losses was limited in 2019.
70
Comparison of the Years Ended December 31, 2019 and 2018
Revenue
| Year Ended December 31, | ||||||||||||||||||||||||||
| 2019 | 2018 | $ Change | % Change | |||||||||||||||||||||||
| (in thousands) | ||||||||||||||||||||||||||
| Revenue: | ||||||||||||||||||||||||||
| Subscription | $ | 412,167 | $ | 333,397 | $ | 78,770 | 23.6 | % | ||||||||||||||||||
| Device | 44,052 | 50,514 | (6,462) | (12.8) | % | |||||||||||||||||||||
| Professional services and other | 2,533 | 3,444 | (911) | (26.5) | % | |||||||||||||||||||||
| Total revenue | $ | 458,752 | $ | 387,355 | $ | 71,397 | 18.4 | % | ||||||||||||||||||
Subscription
Subscription revenue increased $78.8 million, or 23.6% for 2019 compared to 2018. The increase in subscription revenue was primarily driven by increased sales of our Unified Continuity and Business Management cloud-based offerings, as well as increased sales of SaaS offerings related to our Networking devices.
Device
Device revenue decreased $6.5 million, or 12.8% for 2019 compared to 2018. This decrease was primarily attributable to our shift from selling networking devices on a one-time basis at a substantial upfront cost to packaging networking devices with cloud-based management software and services with lower upfront costs and a recurring subscription.
Professional services and other
Professional services and other revenue decreased $0.9 million, or 26.5% for 2019 compared to 2018, primarily as a result of offering increased discounts on our professional services to encourage the adoption (and subsequent renewal) of our cloud-based Business Management offerings.
Cost of Revenue
| Year Ended December 31, | ||||||||||||||||||||||||||
| 2019 | 2018 | $ Change | % Change | |||||||||||||||||||||||
| (in thousands) | ||||||||||||||||||||||||||
| Cost of revenue: | ||||||||||||||||||||||||||
| Subscription | $ | 82,066 | $ | 72,498 | $ | 9,568 | 13.2 | % | ||||||||||||||||||
| Device | 53,933 | 50,813 | 3,120 | 6.1 | % | |||||||||||||||||||||
| Professional services and other | 5,563 | 3,637 | 1,926 | 53.0 | % | |||||||||||||||||||||
| Depreciation and amortization | 15,745 | 12,923 | 2,822 | 21.8 | % | |||||||||||||||||||||
| Total cost of revenue | $ | 157,307 | $ | 139,871 | $ | 17,436 | 12.5 | % | ||||||||||||||||||
Subscription
Subscription cost of revenue increased $9.6 million, or 13.2%, for 2019 compared to 2018. The increase was primarily driven by additional costs to support the growth of our SaaS subscription offerings, including increased staffing levels and increased hosting and data center costs for our Datto Cloud infrastructure.
Device
Device cost of revenue increased $3.1 million, or 6.1% for 2019 compared to 2018, primarily as a result of inventory write offs for defective and unsalable inventory, as we determined certain inventory components were not functional.
Professional services and other
Professional services and other cost of revenue increased $1.9 million, or 53.0% for 2019 compared to 2018, driven by growth in employee and related costs in our professional services organization to help ensure that MSP partners successfully deploy and adopt our Business Management cloud-based offerings.
71
Depreciation and amortization
Depreciation and amortization related to cost of revenue increased $2.8 million for 2019 compared to 2018. The increase was attributable primarily to additional capital expenditures for our Datto Cloud infrastructure to support the growth in subscriptions.
Gross Profit and Gross Margin
| Year Ended December 31, | ||||||||||||||||||||||||||
| 2019 | 2018 | $ Change | % Change | |||||||||||||||||||||||
| (in thousands) | ||||||||||||||||||||||||||
| Gross profit: | ||||||||||||||||||||||||||
| Subscription | $ | 330,101 | $ | 260,899 | $ | 69,202 | 26.5 | % | ||||||||||||||||||
| Device | (9,881) | (299) | (9,582) | NM | ||||||||||||||||||||||
| Professional services and other | (3,030) | (193) | (2,837) | NM | ||||||||||||||||||||||
| Depreciation and amortization | (15,745) | (12,923) | (2,822) | 21.8 | % | |||||||||||||||||||||
| Total gross profit | $ | 301,445 | $ | 247,484 | $ | 53,961 | 21.8 | % | ||||||||||||||||||
| Gross margin: | ||||||||||||||||||||||||||
| Subscription | 80.1 | % | 78.3 | % | ||||||||||||||||||||||
| Device | (22.4) | % | (0.6) | % | ||||||||||||||||||||||
| Professional services and other | (119.6) | % | (5.6) | % | ||||||||||||||||||||||
| Total gross margin | 65.7 | % | 63.9 | % | ||||||||||||||||||||||
NM – percentage change is not meaningful
Our gross profit increased $54.0 million, or 21.8%, and our gross margin increased by 180 basis points for 2019 compared to 2018, driven by growth in subscription revenue. Gross profit for device and professional services and other decreased from 2018 primarily as a result of discounts offered in conjunction with our strategy to decrease the upfront price paid for our devices in order to secure recurring subscriptions and the investment in our professional services organization.
Operating Expenses
| Year Ended December 31, | ||||||||||||||||||||||||||
| 2019 | 2018 | $ Change | % Change | |||||||||||||||||||||||
| (in thousands) | ||||||||||||||||||||||||||
| Operating expenses: | ||||||||||||||||||||||||||
| Sales and marketing | $ | 110,441 | $ | 98,183 | $ | 12,258 | 12.5 | % | ||||||||||||||||||
| Research and development | 60,459 | 54,017 | 6,442 | 11.9 | % | |||||||||||||||||||||
| General and administrative | 73,903 | 57,913 | 15,990 | 27.6 | % | |||||||||||||||||||||
| Depreciation and amortization | 27,417 | 28,953 | (1,536) | (5.3) | % | |||||||||||||||||||||
| Total operating expenses | $ | 272,220 | $ | 239,066 | $ | 33,154 | 13.9 | % | ||||||||||||||||||
| As a percentage of total revenue | ||||||||||||||||||||||||||
| Sales and marketing | 24.1 | % | 25.3 | % | ||||||||||||||||||||||
| Research and development | 13.2 | % | 13.9 | % | ||||||||||||||||||||||
| General and administrative | 16.1 | % | 15.0 | % | ||||||||||||||||||||||
Sales and marketing
Sales and marketing expense increased $12.3 million, or 12.5%, for 2019 compared to 2018, driven by an increase in employee and related costs resulting from additional staffing and increased commissions as a result of the increase in revenue, as well as an increase in payment processing fees related to higher sales volume. These increases were partially offset by modestly lower advertising and promotion expenses. Sales and marketing expense included $2.9 million and $0.8 million of stock-based compensation expense for 2019 compared to 2018, respectively.
72
Research and development
Research and development expense increased $6.4 million, or 11.9%, for 2019 compared to 2018, primarily as a result of an increase in employee and related costs because of increased staffing levels. Research and development expense included $3.5 million and $1.0 million of stock-based compensation expense for 2019 compared to 2018, respectively.
General and administrative
General and administrative expense increased $16.0 million, or 27.6%, for 2019 compared to 2018, driven primarily by an increase in professional fees and expenses for billing and financial systems to improve our internal processes, as well as an increase in employee and related costs resulting from increased staffing levels. These expenses were primarily related to our preparations to become a public company. In addition, we incurred an additional $4.0 million of bad debt expense as a result of billing system conversion issues experienced in 2019 which contributed to collection challenges. General and administrative expense included $5.7 million and $2.2 million of stock-based compensation expense for 2019 compared to 2018, respectively.
Depreciation and amortization
Depreciation and amortization expense related to operating expenses decreased $1.5 million for 2019 compared to 2018. This decrease was primarily driven by the end of the useful life of an acquired intangible asset, partially offset by an increase in depreciation for leasehold improvements and additions of computer equipment to support increased staffing levels.
Other Expenses
Interest expense
Interest expense decreased $11.9 million, or 21.6%, for 2019 compared to 2018, primarily as a result of the lower interest rate from our debt refinancing in April 2019.
Loss on extinguishment of debt
A loss on extinguishment of debt of $19.2 million was recorded in conjunction with our debt refinancing in April 2019, which included a prepayment penalty of $10.4 million and the write-off of deferred financing costs of $8.8 million.
Other expense (income), net
Other expense, net decreased $0.5 million primarily because of net exchange (gains) or losses on foreign currency transactions and decreased losses on the disposal of assets.
Non-GAAP Financial Measures
In addition to our results determined in accordance with GAAP, we believe the non-GAAP measures of Non-GAAP Gross Profit, Non-GAAP Income from Operations, Non-GAAP Net Income and Adjusted EBITDA are useful in evaluating our operating performance. We believe that non-GAAP financial information may be helpful to investors because it provides consistency and comparability with past financial performance and assists in comparisons with other companies, some of which use similar non-GAAP information to supplement their GAAP results. The non-GAAP financial information is presented for supplemental informational purposes only and should not be considered a substitute for financial information presented in accordance with GAAP, and may be different from similarly titled non-GAAP measures used by other companies. A reconciliation is provided below for each non-GAAP financial measure to the most directly comparable financial measure stated in accordance with GAAP. Investors are encouraged to review the related GAAP financial measures and the reconciliation of these non-GAAP financial measures to their most directly comparable GAAP financial measures.
Non-GAAP Gross Profit
Non-GAAP Gross Profit is a supplemental measure of operating performance that is not prepared in accordance with GAAP and that does not represent, and should not be considered as, an alternative to gross profit, as determined in accordance with GAAP. We define Non-GAAP Gross Profit as gross profit, adjusted for amortization of acquired intangible assets, stock-based compensation expense, and restructuring expense. We use Non-GAAP Gross Profit to understand and evaluate our core operating performance and trends and to develop short-term and long-term operating plans. We believe Non-GAAP Gross Profit is a useful measure to us and to our investors to assist in evaluating our core operating performance because it provides consistency and direct comparability with our past financial performance and between fiscal periods, as the metric eliminates the effects of variability of stock-based compensation expense and amortization of acquired technology intangible assets, which are non-cash expenses that may fluctuate for reasons unrelated to overall operating performance, as well as restructuring expense, which is infrequent in nature. While the amortization expense of
73
acquired technology intangible assets is excluded from Non-GAAP Gross Profit, the revenue related to acquired technology intangible assets is reflected in Non-GAAP Gross Profit as these assets contribute to our revenue generation. Non-GAAP Gross Profit has limitations as an analytical tool, and you should not consider it in isolation, or as a substitute for analysis of our results as reported under GAAP. Because of these limitations, Non-GAAP Gross Profit should not be considered as a replacement for gross profit, as determined by GAAP, or as a measure of our profitability. We compensate for these limitations by relying primarily on our GAAP results and using non-GAAP measures only for supplemental purposes. Our presentation of Non-GAAP Gross Profit should not be construed to imply that our future results will be unaffected by the types of items excluded from the calculation of Non-GAAP Gross Profit. Non-GAAP Gross Profit is not a presentation made in accordance with GAAP and the use of the term may vary from other companies.
A reconciliation of Non-GAAP Gross Profit to gross profit, the most directly comparable GAAP measure, is as follows:
| Year Ended December 31, | ||||||||||||||||||||
| 2020 | 2019 | 2018 | ||||||||||||||||||
| (in thousands) | ||||||||||||||||||||
| Gross profit | $ | 368,581 | $ | 301,445 | $ | 247,484 | ||||||||||||||
| Amortization of acquired intangible assets | 5,023 | 4,700 | 4,994 | |||||||||||||||||
| Stock-based compensation expense | 4,713 | 98 | 140 | |||||||||||||||||
Restructuring expense(1) | 601 | — | — | |||||||||||||||||
| Non-GAAP Gross Profit | $ | 378,918 | $ | 306,243 | $ | 252,618 | ||||||||||||||
(1) Restructuring expense primarily relates to severance costs incurred in connection with a reduction in workforce undertaken in Q2 2020 to align our cost structure to expectations of potentially reduced revenue resulting from the COVID-19 pandemic. Approximately $0.6 million of restructuring expense was recorded within cost of revenue for 2020.
Non-GAAP Income from Operations
Non-GAAP Income from Operations is a supplemental measure of operating performance that is not prepared in accordance with GAAP and that does not represent, and should not be considered as, an alternative to income from operations as determined in accordance with GAAP. We define Non-GAAP Income from Operations as income from operations, adjusted for amortization of acquired intangible assets, stock-based compensation, restructuring expense and transaction related and other expense. We use Non-GAAP Income from Operations to understand and evaluate our core operating performance and trends and to develop short-term and long-term operating plans. We believe that Non-GAAP Income from Operations facilitates comparison of our operating performance on a consistent basis between periods, and when viewed in combination with our results prepared in accordance with GAAP, helps provide a broader picture of factors and trends affecting our results of operations. While the amortization expense of acquired technology,partner relationships and tradenames is excluded from Non-GAAP Income from Operations, the revenue related to acquired technology, partner relationships and tradenames is reflected in Non-GAAP Income from Operations as these assets contribute to our revenue generation. Non-GAAP Income from Operations has limitations as an analytical tool, and you should not consider it in isolation, or as a substitute for analysis of our results as reported under GAAP. Because of these limitations, Non-GAAP Income from Operations should not be considered as a replacement for operating income, as determined by GAAP, or as a measure of our profitability. We compensate for these limitations by relying primarily on our GAAP results and using non-GAAP measures only for supplemental purposes. Our presentation of Non-GAAP Income from Operations should not be construed to imply that our future results will be unaffected by the types of items excluded from the calculation of Non-GAAP Income from Operations. Non-GAAP Income from Operations is not a presentation made in accordance with GAAP and the use of the term may vary from other companies.
74
A reconciliation of Non-GAAP Income from Operations to income from operations, the most directly comparable GAAP measure, is as follows:
| Year Ended December 31, | ||||||||||||||||||||
| 2020 | 2019 | 2018 | ||||||||||||||||||
| (in thousands) | ||||||||||||||||||||
| Income from operations | $ | 60,968 | $ | 29,225 | $ | 8,418 | ||||||||||||||
| Amortization of acquired intangible assets | 22,679 | 22,600 | 25,481 | |||||||||||||||||
| Stock-based compensation expense | 33,460 | 12,215 | 4,135 | |||||||||||||||||
Restructuring expense(1) | 3,835 | — | — | |||||||||||||||||
Transaction related and other expense(2) | 3,112 | — | — | |||||||||||||||||
| Non-GAAP Income from Operations | $ | 124,054 | $ | 64,040 | $ | 38,034 | ||||||||||||||
(1)Restructuring expense primarily relates to severance costs incurred in connection with a reduction in workforce undertaken in Q2 2020 to align our cost structure to expectations of potentially reduced revenue resulting from the COVID-19 pandemic. Approximately $3.2 million and $0.6 million of restructuring expense was recorded within operating expenses and cost of revenue, respectively, for 2020.
(2)Transaction related and other expense primarily relates to costs incurred to support our public company readiness, acquisition costs, as well as costs related to a decision to discontinue development of a back-office system.
Non-GAAP Net Income (Loss)
Non-GAAP Net Income (Loss) is a supplemental measure of operating performance that is not prepared in accordance with GAAP and that does not represent, and should not be considered as, an alternative to net income (loss) as determined in accordance with GAAP. We define Non-GAAP Net Income (Loss) as net income (loss) before income taxes, adjusted for loss on extinguishment of debt, amortization of acquired intangible assets, stock-based compensation expense, restructuring expense, and transaction related and other expense. The Company utilizes a normalized non-GAAP tax rate to provide better consistency across the reporting periods by eliminating the effects of non-recurring and period-specific items, which can vary in size and frequency, and which are not necessarily indicative of the Company’s long-term operations. The normalized non-GAAP tax rate applied to each period presented was 25%. We use Non-GAAP Net Income (Loss) to understand and evaluate our core operating performance and trends and to develop short-term and long-term operating plans. We believe that Non-GAAP Net Income facilitates comparison of our operating performance on a consistent basis between periods, and when viewed in combination with our results prepared in accordance with GAAP, helps provide a broader picture of factors and trends affecting our results of operations. While the amortization expense of acquired technology, partner relationships and tradenames is excluded from Non-GAAP Net Income (Loss), the revenue related to acquired technology, partner relationships and tradenames is reflected in Non-GAAP Net Income (Loss) as these assets contribute to our revenue generation. Non-GAAP Net Income (Loss) has limitations as an analytical tool, and you should not consider it in isolation, or as a substitute for analysis of our results as reported under GAAP. Because of these limitations, Non-GAAP Net Income (Loss) should not be considered as a replacement for net income (loss), as determined by GAAP, or as a measure of our profitability. We compensate for these limitations by relying primarily on our GAAP results and using non-GAAP measures only for supplemental purposes. Our presentation of Non-GAAP Net Income (Loss) should not be construed to imply that our future results will be unaffected by the types of items excluded from the calculation of Non-GAAP Net Income (Loss). Non-GAAP Net Income (Loss) is not a presentation made in accordance with GAAP and the use of the term may vary from other companies.
75
A reconciliation of Non-GAAP Net Income (Loss) to net income (loss), the most directly comparable GAAP measure, is as follows:
| Year Ended December 31, | ||||||||||||||||||||
| 2020 | 2019 | 2018 | ||||||||||||||||||
| (in thousands) | ||||||||||||||||||||
| GAAP net income (loss) | $ | 22,498 | $ | (31,188) | $ | (37,723) | ||||||||||||||
| GAAP (provision for) benefit from income taxes | (8,062) | 2,511 | 10,041 | |||||||||||||||||
| GAAP income (loss) before income taxes | 30,560 | (33,699) | (47,764) | |||||||||||||||||
| Loss on extinguishment of debt | 8,488 | 19,231 | — | |||||||||||||||||
| Amortization of acquired intangible assets | 22,679 | 22,600 | 25,481 | |||||||||||||||||
| Stock-based compensation expense | 33,460 | 12,215 | 4,135 | |||||||||||||||||
Restructuring expense(1) | 3,835 | — | — | |||||||||||||||||
Transaction related and other expense(2) | 3,112 | — | — | |||||||||||||||||
Non-GAAP (provision for) benefit income taxes(3) | (25,534) | (5,088) | 4,537 | |||||||||||||||||
| Non-GAAP Net Income (Loss) | $ | 76,600 | $ | 15,259 | $ | (13,611) | ||||||||||||||
(1)Restructuring expense primarily relates to severance costs incurred in connection with a reduction in workforce undertaken in Q2 2020 to align our cost structure to expectations of potentially reduced revenue resulting from the COVID-19 pandemic. Approximately $3.2 million and $0.6 million of restructuring expense was recorded within operating expenses and cost of revenue, respectively, for 2020.
(2)Transaction related and other expense primarily relates to costs incurred to support our public company readiness, acquisition costs, as well as costs related to a decision to discontinue development of a back-office system.
(3)The normalized non-GAAP tax rate applied to each period presented was 25%. The Company may adjust its non-GAAP tax rate as additional information becomes available or events occur which may materially affect this rate, including impacts from the rapidly evolving global tax environment, significant changes in our geographic mix, merger and acquisition activity, or changes in our business outlook.
Adjusted EBITDA
Adjusted EBITDA is a supplemental measure of operating performance monitored by management that is not defined under GAAP and that does not represent, and should not be considered as, an alternative to net income (loss), as determined by GAAP. We define Adjusted EBITDA as net income (loss) adjusted for interest and other expense, net, loss on extinguishment of debt, depreciation and amortization, (provision for) benefit from income taxes, stock-based compensation expense, restructuring expense and transaction related and other expense. We use Adjusted EBITDA to understand and evaluate our core operating performance and trends and to develop short-term and long-term operating plans.
Adjusted EBITDA has limitations as an analytical tool, and you should not consider it in isolation or as a substitute for analysis of our results as reported under GAAP. Because of these limitations, you should consider Adjusted EBITDA alongside other financial performance measures, including net income (loss) and our other GAAP results. Our presentation of Adjusted EBITDA should not be construed to imply that our future results will be unaffected by the types of items excluded from the calculation of Adjusted EBITDA. Adjusted EBITDA is not a presentation made in accordance with GAAP and the use of the term may vary from other companies.
A reconciliation of Adjusted EBITDA to net income (loss), the most directly comparable GAAP measure, is as follows:
| Year Ended December 31, | ||||||||||||||||||||
| 2020 | 2019 | 2018 | ||||||||||||||||||
| (in thousands) | ||||||||||||||||||||
| Net income (loss) | $ | 22,498 | $ | (31,188) | $ | (37,723) | ||||||||||||||
Interest and other expense, net(1) | 21,920 | 43,693 | 56,182 | |||||||||||||||||
| Loss on extinguishment of debt | 8,488 | 19,231 | — | |||||||||||||||||
| Depreciation and amortization | 49,113 | 43,162 | 41,876 | |||||||||||||||||
| Provision for (benefit from) income taxes | 8,062 | (2,511) | (10,041) | |||||||||||||||||
| Stock-based compensation expense | 33,460 | 12,215 | 4,135 | |||||||||||||||||
Restructuring expense(2) | 3,835 | — | — | |||||||||||||||||
Transaction related and other expense(3) | 3,112 | — | — | |||||||||||||||||
| Adjusted EBITDA | $ | 150,488 | $ | 84,602 | $ | 54,429 | ||||||||||||||
(1) Interest and other expense, net includes interest expense, net, foreign currency gains and losses and other expenses.
76
(2)Restructuring expense primarily relates to severance costs incurred in connection with a reduction in workforce undertaken in Q2 2020 to align our cost structure to expectations of potentially reduced revenue resulting from the COVID-19 pandemic. Approximately $3.2 million and $0.6 million of restructuring expense was recorded within operating expenses and cost of revenue, respectively, for 2020.
(3)Transaction related and other expense primarily relates to costs incurred to support our public company readiness, acquisition costs, as well as costs related to a decision to discontinue development of a back-office system.
Liquidity and Capital Resources
General
As of December 31, 2020, our balance of cash and restricted cash totaled $170.4 million, as compared to $29.1 million as of December 31, 2019. In addition, as of December 31, 2020, we had no debt outstanding and $198.1 million of capacity under our 2020 Revolving Credit Agreement (defined below), as compared to principal balances outstanding under our 2019 Credit Agreement of $562.3 million as of December 31, 2019. We believe our existing cash and cash provided by our ongoing operations will be sufficient to meet our working capital and capital expenditure needs for at least the next 12 months.
Historically, as we invested in our organization and infrastructure to meet increasing demand for our products and services and to drive our rapid growth we have financed our operations primarily through cash received from operations and debt financing. During 2020, in response to the spread of COVID-19 and its impacts on the world economy, we undertook various measures to improve our liquidity position and match our cost structure to our revenue and cash generation activities. In the first quarter of 2020, we drew down the remaining available balance of $32.1 million under our 2019 Revolving Credit Facility for working capital purposes, as well as to strengthen our cash position and maintain flexibility. We also took measures to reduce expenses, including a reduction in workforce in May 2020, and deferred certain capital projects. In addition, the COVID-19 pandemic resulted in a reduction of marketing, event and travel costs, including the cancellation of DattoCon and DattoCon EMEA in 2020. We also elected to defer payment of our obligation for social security tax for the remainder of 2020 as provided in the CARES Act, resulting in a reduction in cash outflows of $5.8 million during 2020. These actions combined to increase cash provided by operating activities for 2020 to $108.7 million, as compared to $11.2 million for 2019. In the future we will continue to invest in our organization and infrastructure and expect to resume hosting our world-class partner events in-person as we continue to grow and innovate along with our MSP partners.
On October 23, 2020, we closed our IPO through which we issued and sold 22,000,000 shares of common stock at a price per share of $27.00. We received aggregate net proceeds of approximately $558.0 million from the IPO, after deducting the underwriting discount of $36.0 million. Shortly after closing the IPO, the Company utilized the IPO proceeds and $38.4 million of available cash to repay the outstanding balances under the 2019 Credit Agreement of $590.2 million, pay $1.6 million of related accrued interest, and pay $1.2 million in debt issuance costs for the 2020 Credit Agreement. In addition, on November 3, 2020, the underwriters exercised their option in full to purchase 3,300,000 additional shares of common stock at a price of $27.00 per share, resulting in net proceeds of approximately $83.6 million, after deducting the underwriting discount of $5.4 million. The total net proceeds from the IPO, after deducting the underwriters discount, were $641.6 million. In addition, we paid $5.3 million in IPO costs through December 31, 2020.
Our future capital requirements will depend on several factors, including but not limited to, our subscription revenue growth rate and the need to invest in our Datto Cloud infrastructure to support such growth, the timing of cash receipts and payments, the timing and extent of spending to support research and development, the pace of expansion of sales and marketing activities, including in international markets, the level of investment in back-office infrastructure, and the cost to operate as a public company. In the future, we may also enter into arrangements to acquire or invest in complementary businesses, services and technologies, including intellectual property rights.
We may be required to seek additional equity or debt financing to meet our future capital requirements. In the event additional financing is required from outside sources, we may not be able to raise it on terms acceptable to us or at all. If we are unable to raise additional capital or generate cash flows necessary to fund the expansion of our operations and invest in new technologies, this could reduce our ability to compete successfully and harm our results of operations.
Credit Facilities
On October 23, 2020, Datto, Inc., as borrower (the “Borrower”), Merritt Holdco, Inc., Autotask Superior Holding, Inc., Backupify, Inc., Autotask Corporation, Open Mesh, Inc. and SoonR, Inc., each a direct or indirect wholly-owned subsidiary of Datto Holding Corp., entered into a credit agreement (the “2020 Credit Agreement”) with the lenders party thereto and Morgan Stanley Senior Funding, Inc., as administrative agent. The 2020 Credit Agreement is guaranteed by Merritt Holdco, Inc., Autotask Superior Holding, Inc., Backupify, Inc., Open Mesh, Inc., Autotask Corporation, and SoonR, Inc. (the “Guarantors,” and, together with the Borrower, the “Loan Parties”) and is supported by a security interest in substantially all of the Loan Parties’ personal property and assets, subject to customary exceptions.
77
The 2020 Credit Agreement provides for an initial $200.0 million in commitments for revolving credit loans, which may be increased or decreased under specific circumstances, with a $40.0 million letter of credit sublimit and a $100 million alternative currency sublimit (the “2020 Revolving Credit Facility”). In addition, the 2020 Credit Agreement provides for the ability of the Borrower to request incremental term loan facilities. Borrowings pursuant to the 2020 Credit Agreement may be used for working capital and other general corporate purposes, including for acquisitions permitted under the 2020 Credit Agreement.
Borrowings under the 2020 Credit Agreement are scheduled to mature on October 23, 2025. The 2020 Credit Agreement contains certain customary events of default, which include failure to make payments when due thereunder, the material inaccuracy of representations or warranties, failure to observe or perform certain covenants, cross-defaults, bankruptcy and insolvency-related events, certain judgments, certain ERISA-related events, or a Change in Control (as defined in the 2020 Credit Agreement).
The 2020 Credit Agreement contains certain customary representations and warranties and affirmative and negative covenants, including certain restrictions on the ability of the Loan Parties and their Restricted Subsidiaries (as defined in the 2020 Credit Agreement) to incur any additional indebtedness or guarantee indebtedness of others, to create liens on properties or assets, and to enter into certain asset and stock-based transactions. In addition, under the terms of the 2020 Credit Agreement, the Borrower's First Lien Net Leverage Ratio shall not be more than 4.00 to 1.00.
The interest rates applicable to the revolving borrowings under the 2020 Credit Agreement, are, at the Borrower’s option, either (i) a base rate, equal to the greater of (a) the Prime Rate, (b) the Federal Funds Effective Rate plus 0.5% or (c) the Adjusted LIBO Rate for a one month Interest Period (each term as defined in the 2020 Credit Agreement) plus 1%, or (ii) the Adjusted LIBO Rate equal to the LIBO Rate for the applicable Interest Period, plus in the case of each of clauses (i) and (ii), the Applicable Rate (as defined in the 2020 Credit Agreement). The Applicable Rate (i) for base rate loans range from 0.25% to 1.0% per annum and (ii) for LIBO Rate loans range from 1.25% to 2.0% per annum, in each case, based on the Senior Secured Net Leverage Ratio (as defined in the 2020 Credit Agreement). The Borrower will pay a commitment fee during the term of the 2020 Credit Agreement ranging from 0.20% to 0.35% per annum of the average daily undrawn portion of the revolving commitments based on the Senior Secured Net Leverage Ratio (as defined in the 2020 Credit Agreement).
Any borrowings under the 2020 Credit Agreement may be repaid, in whole or in part, at any time and from time to time without premium or penalty other than customary breakage costs, and any amounts repaid may be reborrowed. No mandatory prepayments will be required other than when borrowings and letter of credit usage exceed the aggregate commitment of all lenders.
The 2020 Revolving Credit Facility was undrawn as of December 31, 2020, with the exception of $1.9 million of outstanding letters of credit.
Cash Flows
The following table presents a summary of our consolidated cash flows from operating, investing and financing activities for the periods indicated.
| Year Ended December 31, | ||||||||||||||||||||
| 2020 | 2019 | 2018 | ||||||||||||||||||
| (in thousands) | ||||||||||||||||||||
| Net cash (used in) provided by operating activities | $ | 108,698 | $ | 11,235 | $ | (10,559) | ||||||||||||||
| Net cash used in investing activities | $ | (44,837) | $ | (38,226) | $ | (28,199) | ||||||||||||||
| Net cash (used in) provided by financing activities | $ | 75,679 | $ | 18,505 | $ | (5,182) | ||||||||||||||
Operating Activities
For 2020, net cash provided by operating activities was $108.7 million, which resulted from net income of $22.5 million, adjusted for non-cash charges of $106.8 million and net cash outflow of $20.6 million from changes in operating assets and liabilities. Non-cash charges primarily consisted of depreciation and amortization expenses of $49.1 million, stock-based compensation expense of $33.5 million, loss on extinguishment of debt of $8.5 million and an increase in deferred income taxes of $7.8 million. The net cash outflow from changes in operating assets and liabilities was primarily driven by an increase in other assets of $13.0 million primarily driven by an increase in deferred contract acquisition costs, as well as an increase in prepaid expenses and other current assets of $7.5 million, primarily driven by the payment of insurance as a result of becoming a public company.
78
For 2019, net cash provided by operating activities was $11.2 million, which resulted from a net loss of $31.2 million, adjusted for non-cash charges of $80.2 million and net cash outflow of $37.8 million from changes in operating assets and liabilities. Non-cash charges primarily consisted of depreciation and amortization expenses of $43.2 million, loss on extinguishment of debt of $19.2 million and stock-based compensation expense of $12.2 million, partially offset by a decrease in deferred income taxes of $6.1 million. The net cash outflow from changes in operating assets and liabilities was primarily driven by an increase in other assets of $24.2 million, including a $14.9 million increase in deferred contract acquisition costs, an increase of $6.0 million in contract assets, and an increase in capitalized costs for cloud computing arrangements. In addition, accounts receivables increased $10.8 million as a result of the growth in revenue and the timing of cash receipts, which was impacted by a system conversion implemented in 2019 which contributed to collection challenges, and deferred revenue decreased $7.9 million as a result of the timing of invoicing. The increase in operating assets was partially offset by an increase in accounts payable and accrued expenses of $14.8 million as a result of the timing of payments.
For 2018, net cash used in operating activities was $10.6 million, which resulted from a net loss of $37.7 million, adjusted for non-cash charges of $40.2 million and net cash outflow of $13.0 million from changes in operating assets and liabilities. Non-cash charges primarily consisted of depreciation and amortization expenses of $41.9 million and stock-based compensation expense of $4.1 million, partially offset by a decrease in deferred income taxes of $11.9 million. The net cash outflow from changes in operating assets and liabilities was primarily driven by an increase in other assets of $15.9 million related to increased deferred commission costs and capitalized costs for cloud computing arrangements, partially offset by an increase in deferred revenue of $13.8 million as a result of the impact of purchase accounting adjustments, related primarily to the fair value assigned to deferred revenue in the formation of Datto Holding Corp. in October 2017 for the purpose of acquiring all of the capital stock of Datto, Inc. (the “Vista Acquisition”), as well as the overall increase in revenue.
Investing Activities
Cash used in investing activities was $44.8 million during 2020, primarily resulting from investment in servers for our Datto Cloud infrastructure to support our overall subscription growth. In addition, we incurred expenses for leasehold improvements and furniture and fixtures to expand and update certain offices and purchased computer equipment to support our workforce and global expansion. In July 2020, we acquired two affiliated Australian entities, Gluh Pty Ltd and Keystone Software Holdings Pty Ltd, which offer a quoting tool for MSPs to quote, sell and procure IT goods and services. The amount paid was approximately $4.4 million, reflecting the purchase price of $4.0 million and certain closing adjustments.
Cash used in investing activities was $38.2 million during 2019, primarily resulting from investment in servers for our Datto Cloud infrastructure to support our overall subscription growth. In addition, we incurred expenses for leasehold improvements to expand and update certain offices and purchased computer equipment in order to support the growth in our workforce.
Cash used in investing activities was $28.2 million during 2018, primarily resulting from investment in servers for our Datto Cloud infrastructure to support our overall subscription growth. In addition, we incurred expenses for leasehold improvements to expand and update certain offices and purchased computer equipment in order to support our growth in workforce.
Financing Activities
Cash provided by financing activities was $75.7 million during 2020, primarily reflecting proceeds from our IPO, net of the underwriting discount, of $641.6 million, offset by debt repayments of $594.7 million, including $590.2 million to repay all outstanding balances under our 2019 Credit Agreement, payment of IPO costs of $5.3 million, and payment of debt issuance costs of $1.2 million for our 2020 Credit Agreement. In addition, proceeds from the exercise of stock options was $3.2 million.
Cash provided by financing activities was $18.5 million during 2019, primarily reflecting proceeds from borrowings under our 2019 Credit Agreement of $562.3 million, partially offset by repayment of our previous term loan of $520.3 million, a pre-payment penalty of $10.4 million incurred on our previous term loan, and deferred financing costs of $8.8 million incurred in securing our 2019 Credit Agreement. In addition, we paid $1.4 million in settlement of certain stock-based awards held by terminated employees.
Cash used in financing activities was $5.2 million during 2018, including $4.2 million for the repurchase of common stock and the settlement of stock-based payment awards and $1.0 million for the repayment of outstanding debt related to capital leases.
79
Contractual Obligations and Commitments
The following table sets forth the amounts of our significant contractual obligations and commitments with definitive payment terms as of December 31, 2020:
| Payments due by Period | ||||||||||||||||||||||||||||||||
| Total | Less than 1 Year | 1-3 years | 3-5 Years | More than 5 years | ||||||||||||||||||||||||||||
| (in thousands) | ||||||||||||||||||||||||||||||||
Revolving credit facility—commitment fees(1) | $ | 1,933 | $ | 400 | $ | 800 | $ | 733 | $ | — | ||||||||||||||||||||||
Unconditional purchase obligations(2) | 68,568 | 35,434 | 22,450 | 10,684 | — | |||||||||||||||||||||||||||
Operating lease obligations(3) | 45,586 | 9,308 | 17,283 | 12,269 | 6,726 | |||||||||||||||||||||||||||
| Total | $ | 116,087 | $ | 45,142 | $ | 40,533 | $ | 23,686 | $ | 6,726 | ||||||||||||||||||||||
________________
(1)We are required to pay a commitment fee of 0.20-0.35%, based on the Company's leverage ratio, on the undrawn portion of the revolving credit facility under the 2020 Credit Agreement. We have estimated the obligations based on the facts and circumstances in place at December 31, 2020.
(2)We have unconditional purchase obligations that primarily consist of commitments related to our co-located data centers, telecommunication, networking, subscription and consulting services.
(3)Our operating lease obligations consist primarily of office space and warehousing.
Impact of Inflation
While inflation may impact our net revenues and costs of revenues, we believe the effects of inflation, if any, on our results of operations and financial condition have not been significant. However, there can be no assurance that our results of operations and financial condition will not be materially impacted by inflation in the future.
Indemnification Agreements
In the ordinary course of business, we enter into agreements of varying scope and terms pursuant to which we agree to indemnify MSP partners, vendors, lessors, business partners and other parties with respect to certain matters, including, but not limited to, losses arising out of the breach of such agreements, services to be provided by us or from intellectual property infringement claims made by third parties. No demands have been made upon us to provide indemnification under such agreements and there are no claims that we are aware of that could have a material effect on our consolidated balance sheet, consolidated statement of operations and comprehensive loss or consolidated statement of cash flows. In addition, in connection with the completion of our IPO, we entered into indemnification agreements with our directors and certain officers and employees that require us, among other things, to indemnify them against certain liabilities that may arise by reason of their status or service as directors, officers or employees.
Off-Balance Sheet Arrangements
We did not have any material off-balance sheet arrangements as of December 31, 2020.
JOBS Act
We qualify as an “emerging growth company” pursuant to the provisions of the JOBS Act. For as long as we are an “emerging growth company,” we may take advantage of certain exemptions from various reporting requirements that are applicable to other public companies that are not “emerging growth companies,” including, but not limited to, not being required to comply with the auditor attestation requirements of Section 404(b) of the Sarbanes-Oxley Act, reduced disclosure obligations regarding executive compensation in our periodic reports and proxy statements, exemptions from the requirements of holding shareholder advisory “say-on-pay” votes on executive compensation and shareholder advisory votes on golden parachute compensation.
The JOBS Act also permits an emerging growth company like us to take advantage of an extended transition period to comply with new or revised accounting standards applicable to public companies. We have elected to “opt-in” to this extended transition period for complying with new or revised accounting standards and, therefore, we will not be subject to the same new or revised accounting standards as other public companies that comply with such new or revised accounting standards on a non-delayed basis.
U.K.’s Referendum Decision to Exit the European Union
The United Kingdom left the European Union on January 31, 2020 and the transition period during which most E.U. rules continued to apply expired on December 31, 2020. Although the U.K. and European Union have reached an agreement on certain terms concerning the U.K.'s withdrawal, there remains substantial uncertainty regarding the details of the U.K.'s ongoing relationship with the European Union. We continue to monitor the status of the negotiations and to plan for potential political, economic and social instability.
80
Since we have historically provided our Business Management (PSA) and SaaS Protection products to European customers from a U.K. data center and have supported certain older BCDR devices through our U.K. data center, we have taken the following steps to mitigate the potential impact of Brexit on our operations:
•developed infrastructure that will allow us to provide both our PSA and SaaS Protection products out of our data center in Germany;
•permitted European customers to move their PSA, SaaS Protection and BCDR service instances from the U.K. to Germany;
•published a notice on our website regarding our Brexit preparations and the process to migrate accounts out of the U.K.;
•sent emails regarding Brexit to our potentially impacted customers; and
•began implementing a system where new customers will be able to track the region in which data is stored and opt for the desired location.
The ultimate impact of Brexit on our business operations and financial results is uncertain. For additional information on risks related to Brexit, see “Risk Factors—Risks Related to Our Business and Industry.”
Critical Accounting Policies
Our discussion and analysis of financial condition and results of operations are based upon our consolidated financial statements included in this Annual Report on Form 10-K. The preparation of our consolidated financial statements in accordance with U.S. GAAP requires us to make estimates and assumptions that affect the reported amounts of assets, liabilities, revenue and expenses. We base our estimates on past experience and other assumptions that we believe are reasonable under the circumstances, and we evaluate these estimates on an ongoing basis. Actual results may differ from those estimates.
Our critical accounting policies are those that materially affect our consolidated financial statements and involve difficult, subjective or complex judgments by management. A thorough understanding of these critical accounting policies is essential when reviewing our consolidated financial statements.
Stock-Based Compensation
Accounting for stock-based compensation requires us to make a number of judgments, estimates and assumptions. If any of our estimates prove to be inaccurate, our net income (loss) and operating results could be adversely affected.
We estimate the fair value of stock options granted to employees and directors using the Black-Scholes option-pricing model, which requires the input of subjective assumptions, including (1) the fair value of common stock, (2) the expected stock price volatility, (3) the expected term of the award, (4) the risk-free interest rate and (5) expected dividends. Also, we made an accounting policy election to account for forfeitures as they occur. The assumptions for the Black-Scholes option-pricing model were estimated as follows:
•Fair value of common stock. Prior to our IPO our common stock was not yet publicly traded. As such we were required to estimate the fair value of our common stock, as discussed in “Common Stock Valuation” below. For grants after the IPO, the fair value is based on the closing price of our common stock on the NYSE as reported on the last trading day prior to the grant date.
•Expected volatility. As a result of the lack of historical and implied volatility data of our common stock, the expected stock price volatility has been estimated based on the historical volatilities of a specified group of companies in our industry for a period equal to the expected life of the option. We selected companies with comparable characteristics to us, including enterprise value, risk profiles and position within the industry and with historical share price information sufficient to meet the expected term of the stock options. The historical volatility data has been computed using the daily closing prices for the selected companies.
•Expected term. We determine the expected term based on the average period the stock options are expected to remain outstanding using the simplified method, generally calculated as the midpoint of the stock options’ vesting term and contractual expiration period, as we do not have sufficient historical information to develop reasonable expectations about future exercise patterns and post-vesting employment termination behavior.
•Risk-free rate. Our risk-free interest rate is based on the U.S. Treasury yield curve in effect at the time of grant for zero-coupon U.S. Treasury notes with maturities approximately equal to the stock option’s expected term.
•Expected dividend yield. We utilize a dividend yield of zero, as we do not currently issue dividends, nor do we expect to do so in the future.
81
Common Stock Valuation
Since our IPO, the fair value of the shares of common stock underlying our equity awards has been based on the closing price of the Company's common stock on the last trading day prior to the grant date, as reported on the NYSE. Prior to our IPO, the fair value of the shares of common stock underlying our equity awards was based on a determination by our Board, with input from management and contemporaneous third-party valuations, as there was no public market for our common stock.
In valuing our pre-IPO common stock, our Board determined the value using both the income and the market approach valuation methods. The income approach estimates value based on the expected future cash flows that our company will generate. These future cash flows are discounted to their present values using a discount rate based on our weighted average cost of capital, or WACC. To derive our WACC, a cost of equity was developed using the Capital Asset Pricing Model and comparable company betas, and a cost of debt was determined based on our estimated cost of borrowing. The costs of debt and equity were then weighted based on our actual capital structure. The market approach estimates value based on a comparison of our company to comparable publicly traded companies in a similar line of business and to acquisitions in the market. From the comparable companies, a representative market multiple is determined and subsequently applied to our historical and forecasted financial results to estimate our enterprise value. From the acquisitions analysis, a representative market multiple is determined and subsequently applied to our historical financial results to estimate our enterprise value.
Application of these approaches involves the use of estimates, judgment and assumptions that are highly complex and subjective, such as those regarding our expected future revenue, expenses, and cash flows, discount rates, market multiples, the selection of comparable companies and the probability of possible future events. Changes in any or all of these estimates and assumptions or the relationships among those assumptions could have a material impact on the valuation of our common stock as of each valuation date.
Revenue Recognition and Contract Balances
We recognize revenue in accordance with the Financial Accounting Standards Board's Accounting Standards Codification Topic 606, which we adopted as of January 1, 2018 on a modified retrospective basis. We generate revenue from fees received for subscriptions, support and related services, and from the sale of devices. We recognize revenue related to contracts with partners when we transfer promised goods or services to partners in an amount that reflects the consideration to which the entity expects to be entitled in exchange for those goods or services. This is determined by following a five-step process which includes (1) identifying the contract with a partner, (2) identifying the performance obligations in the contract, (3) determining the transaction price, (4) allocating the transaction price and (5) recognizing revenue when or as we satisfy a performance obligation.
We identify performance obligations in a contract based on the goods and services that will be transferred to the partner that are identifiable or distinct from other promises in the contract. If not considered distinct, the promised goods or services are combined with other goods or services and accounted for as a combined performance obligation. Determining the distinct performance obligations in a contract requires judgment. Our performance obligations primarily include subscription services, including warranties, unspecified upgrades or enhancements to our hosted SaaS offerings, delivery of devices and training. We believe that our technical support, warranties and unspecified upgrades or enhancements performance obligations each have the same pattern of transfer to the partner and are therefore accounted for as a single distinct performance obligation.
We allocate the transaction price of the contract to each distinct performance obligation on a relative standalone selling price basis. Estimating standalone selling prices for our performance obligations requires judgment and is based on multiple factors including, but not limited to, observable cost data, industry margin studies, historical selling prices, internal pricing policies and pricing practices in different regions and through different sales channels and internal cost structure. We review the standalone selling price for our performance obligations periodically and update them, if needed, to ensure that the methodology utilized reflects our current pricing practices.
Contract Balances
The timing of revenue recognition may differ from the timing of invoicing to customers. We record an accounts receivable when revenue is recognized prior to invoicing and payment will become due solely based on the passage of time, a contract asset when revenue is recognized prior to invoicing and payment is contingent upon transfer of control of another separate performance obligation, or deferred revenue when payment is received prior to the recognition of revenue. We use judgement in determining the standalone selling price for our performance obligations which would affect the amount of contract balances recognized. Deferred revenue that will be realized during the succeeding 12-month period is recorded as current, and the remaining deferred revenue is recorded as non-current.
Contract Acquisition Costs
We capitalize commission expenses that are incremental to obtaining customer contracts, using a portfolio approach. These contract acquisition costs are deferred and recorded in other assets on our consolidated balance sheets. We make judgments in determining the
82
amount of costs to be expensed in the period, including amounts which are expensed as incurred, which is the approach if the expected period of benefit is less than one year, and amounts which are capitalized and expensed over future periods, which is the approach if the expected period of benefit is beyond one year. The period of benefit often extends beyond the contract term, as we only pay a commission on the initial contract term and not upon renewal of the contract. We have determined that the expected period of benefit is five years based on evaluation of a number of factors, including customer attrition rates, weighted average useful lives of our partner relationship and developed technology intangible assets, and market factors, including the overall competitive environment and the technology life utilized by competitors. Contract acquisition costs which are capitalized are amortized as a component of sales and marketing expense in our consolidated statements of operations.
Recent Accounting Pronouncements
For a description of our recently adopted accounting pronouncements and accounting pronouncements issued but not yet adopted, see Note 2. Significant Accounting Policies to our consolidated financial statements in this Annual Report on Form 10-K.
ITEM 7A. Quantitative and Qualitative Disclosures About Market Risk
Market risk represents the risk of loss that may impact our financial position because of adverse changes in financial market prices and rates. Our market risk exposure is primarily a result of exposure resulting from potential changes in inflation or interest rates. We do not hold financial instruments for trading purposes.
Foreign Currency Exchange Risk
The functional currencies of our foreign subsidiaries are the respective local currencies. Most of our sales and operating expenses are denominated in the currencies of the countries in which our operations are located, which are primarily in the United States, United Kingdom and Europe, although we do have certain arrangements in which we invoice in a non-functional currency, based upon the location of the Partner. Our consolidated results of operations and cash flows are, therefore, subject to fluctuations resulting from changes in foreign currency exchange rates and may be adversely affected in the future because of changes in foreign exchange rates. To date, we have not entered into any hedging arrangements with respect to foreign currency risk or other derivative financial instruments. During the year ended December 31, 2020, a hypothetical 10% change in foreign currency exchange rates applicable to our business would not have had a material impact on our consolidated financial statements.
Interest Rate Risk
At December 31, 2020, we had no outstanding borrowings under the 2020 Credit Agreement. To the extent we incur borrowings, our primary market risk exposure is changes to the Prime Rate, the Federal Funds Effective Rate or LIBO Rate (and the LIBOR Successor Rate)-based interest rates. Interest rate risk is sensitive to many factors, including U.S. monetary and tax policies, U.S. and international economic factors and other factors beyond our control. The interest rate on our revolving borrowings under the 2020 Credit Agreement, are, at our option, either (i) a base rate, equal to the greater of (a) the Prime Rate, (b) the Federal Funds Effective Rate plus 0.5% or (c) the Adjusted LIBO Rate for a one month Interest Period (each term as defined in the 2020 Credit Agreement) plus 1%, or (ii) the Adjusted LIBO Rate equal to the LIBO Rate for the applicable Interest Period, plus in the case of each of clauses (i) and (ii), the Applicable Rate (as defined in the 2020 Credit Agreement). The Applicable Rate (i) for base rate loans range from 0.25% to 1.0% per annum and (ii) for LIBO Rate loans range from 1.25% to 2.0% per annum, in each case, based on the Senior Secured Net Leverage Ratio (as defined in the 2020 Credit Agreement).
83
ITEM 8. FINANCIAL STATEMENTS AND SUPPLEMENTARY DATA INDEX TO CONSOLIDATED FINANCIAL STATEMENTS
DATTO HOLDING CORP.
INDEX TO CONSOLIDATED FINANCIAL STATEMENTS
| Page | ||||||||
| Index to Audited Consolidated Financial Statements | ||||||||
| Financial Statements: | ||||||||
84
Report of Independent Registered Public Accounting Firm
To the Stockholders and the Board of Directors of Datto Holding Corp.
Opinion on the Financial Statements
We have audited the accompanying consolidated balance sheets of Datto Holding Corp. (the “Company”) as of December 31, 2020 and 2019, the related consolidated statements of operations, comprehensive income (loss), changes in stockholders’ equity, and cash flows for each of the three years in the period ended December 31, 2020, and the related notes (collectively referred to as the “consolidated financial statements”). In our opinion, the consolidated financial statements present fairly, in all material respects, the financial position of the Company at December 31, 2020 and 2019, and the results of its operations and its cash flows for each of the three years in the period ended December 31, 2020, in conformity with U.S. generally accepted accounting principles.
Basis for Opinion
These financial statements are the responsibility of the Company's management. Our responsibility is to express an opinion on the Company’s financial statements based on our audits. We are a public accounting firm registered with the Public Company Accounting Oversight Board (United States) (PCAOB) and are required to be independent with respect to the Company in accordance with the U.S. federal securities laws and the applicable rules and regulations of the Securities and Exchange Commission and the PCAOB.
We conducted our audits in accordance with the standards of the PCAOB. Those standards require that we plan and perform the audit to obtain reasonable assurance about whether the financial statements are free of material misstatement, whether due to error or fraud. The Company is not required to have, nor were we engaged to perform, an audit of its internal control over financial reporting. As part of our audits we are required to obtain an understanding of internal control over financial reporting but not for the purpose of expressing an opinion on the effectiveness of the Company's internal control over financial reporting. Accordingly, we express no such opinion.
Our audits included performing procedures to assess the risks of material misstatement of the financial statements, whether due to error or fraud, and performing procedures that respond to those risks. Such procedures included examining, on a test basis, evidence regarding the amounts and disclosures in the financial statements. Our audits also included evaluating the accounting principles used and significant estimates made by management, as well as evaluating the overall presentation of the financial statements. We believe that our audits provide a reasonable basis for our opinion.
/s/ Ernst & Young LLP
We have served as the Company’s auditor since 2018.
Stamford, Connecticut
March 11, 2021
85
DATTO HOLDING CORP.
Consolidated Balance Sheets
(in thousands, except share amounts)
| December 31, | ||||||||||||||
| 2020 | 2019 | |||||||||||||
| ASSETS | ||||||||||||||
| Current assets | ||||||||||||||
| Cash | $ | $ | ||||||||||||
| Restricted cash | ||||||||||||||
| Accounts receivable, net | ||||||||||||||
| Inventory | ||||||||||||||
| Prepaid expenses and other current assets | ||||||||||||||
| Total current assets | ||||||||||||||
| Property and equipment, net | ||||||||||||||
| Goodwill | ||||||||||||||
| Intangible assets, net | ||||||||||||||
| Other assets | ||||||||||||||
| Total assets | $ | $ | ||||||||||||
| LIABILITIES AND STOCKHOLDERS’ EQUITY | ||||||||||||||
| Current liabilities | ||||||||||||||
| Accounts payable | $ | $ | ||||||||||||
| Accrued expenses and other current liabilities | ||||||||||||||
| Long-term debt, current portion | ||||||||||||||
| Deferred revenue | ||||||||||||||
| Total current liabilities | ||||||||||||||
| Long-term debt, net of current portion | ||||||||||||||
| Deferred revenue, noncurrent | ||||||||||||||
| Deferred income taxes | ||||||||||||||
| Other long-term liabilities | ||||||||||||||
| Total liabilities | ||||||||||||||
| Commitments and contingencies (Note 9) | ||||||||||||||
| STOCKHOLDERS’ EQUITY | ||||||||||||||
Preferred stock, $ | ||||||||||||||
Common stock, $ | ||||||||||||||
| Additional paid-in capital | ||||||||||||||
Treasury stock, at cost; | ( | ( | ||||||||||||
| Accumulated deficit | ( | ( | ||||||||||||
| Accumulated other comprehensive income | ||||||||||||||
| Total stockholders’ equity | ||||||||||||||
| Total liabilities and stockholders’ equity | $ | $ | ||||||||||||
The accompanying notes are an integral part of these consolidated financial statements.
86
DATTO HOLDING CORP.
Consolidated Statements of Operations
(in thousands, except share and per share amounts)
| Year Ended December 31, | ||||||||||||||||||||
| 2020 | 2019 | 2018 | ||||||||||||||||||
| Revenue: | ||||||||||||||||||||
| Subscription | $ | $ | $ | |||||||||||||||||
| Device | ||||||||||||||||||||
| Professional services and other | ||||||||||||||||||||
| Total revenue | ||||||||||||||||||||
| Cost of revenue: | ||||||||||||||||||||
| Subscription | ||||||||||||||||||||
| Device | ||||||||||||||||||||
| Professional services and other | ||||||||||||||||||||
| Depreciation and amortization | ||||||||||||||||||||
| Total cost of revenue | ||||||||||||||||||||
| Gross profit | ||||||||||||||||||||
| Operating expense: | ||||||||||||||||||||
| Sales and marketing | ||||||||||||||||||||
| Research and development | ||||||||||||||||||||
| General and administrative | ||||||||||||||||||||
| Depreciation and amortization | ||||||||||||||||||||
| Total operating expense | ||||||||||||||||||||
| Income from operations | ||||||||||||||||||||
| Other expense: | ||||||||||||||||||||
| Interest expense | ||||||||||||||||||||
| Loss on extinguishment of debt | ||||||||||||||||||||
| Other (income) expense, net | ( | |||||||||||||||||||
| Total other expense | ||||||||||||||||||||
| Income (loss) before income taxes | ( | ( | ||||||||||||||||||
| (Provision for) benefit from income taxes | ( | |||||||||||||||||||
| Net income (loss) | $ | $ | ( | $ | ( | |||||||||||||||
| Net income (loss) per share attributable to common stockholders: | ||||||||||||||||||||
| Basic | $ | $ | ( | $ | ( | |||||||||||||||
| Diluted | $ | $ | ( | $ | ( | |||||||||||||||
| Weighted average shares used in computing net income (loss) per share: | ||||||||||||||||||||
| Basic | ||||||||||||||||||||
| Diluted | ||||||||||||||||||||
The accompanying notes are an integral part of these consolidated financial statements.
87
DATTO HOLDING CORP.
Consolidated Statements of Comprehensive Income (Loss)
(in thousands)
| Year Ended December 31, | ||||||||||||||||||||
| 2020 | 2019 | 2018 | ||||||||||||||||||
| Net income (loss) | $ | $ | ( | $ | ( | |||||||||||||||
| Other comprehensive income: | ||||||||||||||||||||
| Cumulative translation adjustment | ||||||||||||||||||||
| Total comprehensive income (loss) | $ | $ | ( | $ | ( | |||||||||||||||
The accompanying notes are an integral part of these consolidated financial statements.
88
DATTO HOLDING CORP.
Consolidated Statements of Changes in Stockholders’ Equity
(in thousands, except share amounts)
| Common Stock | Treasury Stock | Additional Paid in Capital | Accumulated Deficit | Accumulated Other Comprehensive Income (Loss) | Total Stockholders' Equity | |||||||||||||||||||||||||||||||||||||||
| Shares | Amount | |||||||||||||||||||||||||||||||||||||||||||
| Balance at December 31, 2017 | $ | $ | $ | $ | ( | $ | ( | $ | ||||||||||||||||||||||||||||||||||||
| Settlement of stock-based payment awards | — | — | — | ( | — | — | ( | |||||||||||||||||||||||||||||||||||||
| Repurchase of common stock | — | — | ( | — | — | — | ( | |||||||||||||||||||||||||||||||||||||
| Stock-based compensation | — | — | — | — | — | |||||||||||||||||||||||||||||||||||||||
Adoption of | — | — | — | — | ( | |||||||||||||||||||||||||||||||||||||||
| Other comprehensive income | — | — | — | — | — | |||||||||||||||||||||||||||||||||||||||
| Net loss | — | — | — | — | ( | — | ( | |||||||||||||||||||||||||||||||||||||
| Balance at December 31, 2018 | $ | $ | ( | $ | $ | ( | $ | ( | $ | |||||||||||||||||||||||||||||||||||
| Settlement of stock-based payment awards | — | — | — | ( | — | — | ( | |||||||||||||||||||||||||||||||||||||
| Stock-based compensation | — | — | — | — | — | |||||||||||||||||||||||||||||||||||||||
| Exercise of common stock options | — | — | — | — | ||||||||||||||||||||||||||||||||||||||||
| Other comprehensive income | — | — | — | — | — | |||||||||||||||||||||||||||||||||||||||
| Net loss | — | — | — | — | ( | — | ( | |||||||||||||||||||||||||||||||||||||
| Balance at December 31, 2019 | $ | $ | ( | $ | $ | ( | $ | $ | ||||||||||||||||||||||||||||||||||||
| Issuance of common stock upon initial public offering, net of underwriting costs | — | — | — | — | ||||||||||||||||||||||||||||||||||||||||
| Stock-based compensation | — | — | — | — | — | |||||||||||||||||||||||||||||||||||||||
| Exercise and net share settlement of stock-based payment awards | — | — | — | — | ||||||||||||||||||||||||||||||||||||||||
| Other comprehensive income | — | — | — | — | — | |||||||||||||||||||||||||||||||||||||||
| Net income | — | — | — | — | — | |||||||||||||||||||||||||||||||||||||||
| Balance at December 31, 2020 | $ | $ | ( | $ | $ | ( | $ | $ | ||||||||||||||||||||||||||||||||||||
The accompanying notes are an integral part of these consolidated financial statements.
89
DATTO HOLDING CORP.
Consolidated Statements of Cash Flows
(in thousands)
| Year Ended December 31, | ||||||||||||||||||||
| 2020 | 2019 | 2018 | ||||||||||||||||||
| OPERATING ACTIVITIES | ||||||||||||||||||||
| Net income (loss) | $ | $ | ( | $ | ( | |||||||||||||||
| Adjustments to reconcile net income (loss) to net cash provided by (used in) operating activities: | ||||||||||||||||||||
| Depreciation | ||||||||||||||||||||
| Amortization of acquired intangible assets | ||||||||||||||||||||
| Loss on extinguishment of debt | ||||||||||||||||||||
| Amortization of debt issuance costs | ||||||||||||||||||||
| Reserve for inventory obsolescence | ||||||||||||||||||||
| Stock-based compensation | ||||||||||||||||||||
| Provision for bad debt | ||||||||||||||||||||
| Deferred income taxes | ( | ( | ||||||||||||||||||
| Unrealized foreign exchange | ( | ( | ||||||||||||||||||
| Changes in operating assets and liabilities: | ||||||||||||||||||||
| Accounts receivable | ( | ( | ||||||||||||||||||
| Inventory | ( | ( | ( | |||||||||||||||||
| Prepaid expenses and other current assets | ( | ( | ||||||||||||||||||
| Other assets | ( | ( | ( | |||||||||||||||||
| Accounts payable, accrued expenses and other | ( | |||||||||||||||||||
| Deferred revenue | ( | ( | ||||||||||||||||||
| Net cash provided by (used in) operating activities | ( | |||||||||||||||||||
| INVESTING ACTIVITIES | ||||||||||||||||||||
| Purchase of property and equipment | ( | ( | ( | |||||||||||||||||
| Acquisition of business, net of cash acquired | ( | |||||||||||||||||||
| Net cash used in investing activities | ( | ( | ( | |||||||||||||||||
| FINANCING ACTIVITIES | ||||||||||||||||||||
| Proceeds from debt | ||||||||||||||||||||
| Repayments of debt | ( | ( | ( | |||||||||||||||||
| Debt issuance costs | ( | ( | ||||||||||||||||||
| Prepayment penalty on debt | ( | |||||||||||||||||||
| Proceeds from initial public offering, net of underwriting costs | ||||||||||||||||||||
| Capitalized transaction costs | ( | |||||||||||||||||||
| Proceeds from stock option exercises | ||||||||||||||||||||
| Repurchase of common stock and settlement of stock-based payment awards | ( | ( | ( | |||||||||||||||||
| Net cash provided by (used in) financing activities | ( | |||||||||||||||||||
| Effect of exchange rate changes on cash | ( | |||||||||||||||||||
| Net increase (decrease) in cash | ( | ( | ||||||||||||||||||
| Cash and restricted cash, beginning of year | ||||||||||||||||||||
| Cash and restricted cash, end of year | $ | $ | $ | |||||||||||||||||
| Reconciliation of cash and restricted cash: | ||||||||||||||||||||
| Cash | $ | $ | $ | |||||||||||||||||
| Restricted cash | $ | $ | $ | |||||||||||||||||
| SUPPLEMENTAL DISCLOSURE OF CASH FLOW INFORMATION | ||||||||||||||||||||
| Cash paid for income taxes | $ | $ | $ | |||||||||||||||||
| Cash paid for interest | $ | $ | $ | |||||||||||||||||
| NON-CASH INVESTING AND FINANCING ACTIVITIES | ||||||||||||||||||||
| Purchase of property and equipment included in accounts payable | $ | $ | $ | |||||||||||||||||
| Deferred initial public offering costs in accounts payable and accrued liabilities | $ | $ | $ | |||||||||||||||||
The accompanying notes are an integral part of these consolidated financial statements
90
DATTO HOLDING CORP.
INDEX TO NOTES TO CONSOLIDATED FINANCIAL STATEMENTS
| Page | ||||||||
| Index to Notes to Consolidated Financial Statements | ||||||||
91
DATTO HOLDING CORP.
Notes to Consolidated Financial Statements
1. Business
Description of Business
Datto Holding Corp. ("Datto Holding") through its operating subsidiaries, provides cloud-based software and technology solutions purpose-built for delivery through the managed service provider ("MSP") channel to small and medium-sized businesses (“SMB”). Unless the context otherwise indicates or requires, references to "Datto", “we,” “us,” “our” and “the Company” shall refer to Datto Holding and its wholly-owned subsidiaries as a combined entity. The Company’s platform enables its MSP partners to serve the SMB information technology market and includes mission critical cloud-based software and technologies that MSPs sell to SMBs, business management software to help MSPs scale their own businesses, and marketing tools, content, training and industry-leading events that cultivate an empowered and highly engaged MSP partner community. The Company typically has no contractual relationship with the SMBs and considers its MSP partners to be the customers. By selling through this MSP channel, the Company is able to cost-effectively scale the reach of the Company’s solutions and support the global requirements of SMBs without a direct-to-SMB sales and support model.
Datto Holding owns 100 % of Merritt Holdco, Inc. (“Merritt Holdco”), which owns 100 % of Datto, Inc., the Company’s primary operating company. Datto Holding has no operations or significant assets or liabilities other than its investment in Merritt Holdco. Accordingly, Datto Holding is dependent upon distributions from Merritt Holdco to fund any activity, including the payment of dividends. All obligations under Datto’s 2020 Credit Agreement are guaranteed by Merritt Holdco.
Initial Public Offering
On October 23, 2020, the Company completed an initial public offering (“IPO”) of its common stock. As part of the IPO, the Company issued and sold 22,000,000 shares of its common stock at a public offering price of $27.00 per share. The Company received proceeds of approximately $558.0 million from the IPO, after deducting the underwriting discount. In addition, on November 3, 2020, the underwriters exercised their option in full to purchase 3,300,000 additional shares of common stock at a price of $27.00 per share, resulting in proceeds of approximately $83.6 million, after deducting the underwriting discount.
The Company utilized the IPO proceeds to repay the outstanding principal balances under the 2019 Credit Agreement of $590.2 million, $5.3 million of IPO offering costs, and $1.2 million in debt issuance costs for the 2020 Credit Agreement, as defined in Note 11. Debt. Upon entering the 2020 Credit Agreement, the 2019 Credit Agreement was terminated, and the Company wrote-off approximately $8.5 million of unamortized debt issuance costs and original issue discount related to the 2019 Credit Agreement.
As of December 31, 2020 Funds controlled by Vista Equity Partners ("Vista") owned approximately 70.6 % of the Company’s outstanding common stock, excluding treasury shares. As a result, the Company is a “controlled company” under New York Stock Exchange ("NYSE") corporate governance rules.
Emerging Growth Company Status
The Company is an emerging growth company ("EGC"), as defined in the Jumpstart Our Business Startups Act of 2012 (the “JOBS Act”). Under the JOBS Act, EGCs can delay adopting new or revised accounting standards issued subsequent to the enactment of the JOBS Act, until such time as those standards apply to private companies.
The Company has elected to use this extended transition period for complying with new or revised accounting standards that have different effective dates for public and private companies until the earlier of the date that the Company (i) is no longer an EGC or (ii) affirmatively and irrevocably opts out of the extended transition period provided in the JOBS Act. As a result, the Company’s consolidated financial statements may not be comparable to the financial statements of issuers who are required to comply with the effective dates for new or revised accounting standards based on public company effective dates.
The Company will remain an EGC until the earliest of (i) the last day of the first fiscal year (a) following the fifth anniversary of the completion of the IPO, (b) in which the Company’s total annual gross revenue is at least $1.07 billion or (c) when the Company is deemed to be a large accelerated filer, which means the market value of the Company’s common stock that is held by non-affiliates exceeds $700.0 million as of June 30th of that fiscal year and (ii) the date on which the Company has issued more than $1.0 billion in non-convertible debt securities during the prior three-year period.
92
2. Significant Accounting Policies
Basis of Presentation
The consolidated financial statements and accompanying notes were prepared in accordance with accounting principles generally accepted in the United States (“U.S. GAAP”) and include the accounts of Datto and its wholly-owned subsidiaries. All intercompany balances and transactions have been eliminated in consolidation.
Segment Information
Operating segments are defined as components of an entity for which discrete financial information is available that is regularly reviewed by the Chief Operating Decision Maker (“CODM”) in deciding how to allocate resources to an individual segment and in assessing performance. The Company’s Chief Executive Officer is the CODM. The CODM reviews financial information presented on a consolidated basis for purposes of making operating decisions, allocating resources, and evaluating financial performance. As such, the Company has determined that it operates in one reporting unit within a single operating segment. During 2020, 2019, and 2018, the Company did not have a material balance of long-lived assets located outside of the United States.
Use of Estimates
The preparation of financial statements in conformity with U.S. GAAP requires management to make estimates and assumptions that affect the reported amounts of assets and liabilities and the disclosure of contingent assets and liabilities at the date of the financial statements and the reported amounts of revenues and expenses during the reporting period.
On an ongoing basis, the Company evaluates its estimates and assumptions, including those related to revenue recognition, contract balances, contract acquisition costs, allowance for doubtful accounts, reserves for inventory obsolescence, useful lives and recoverability of long-lived assets, income taxes, stock-based compensation and contingencies. The Company bases its estimates on historical experience and on various other assumptions that are believed to be reasonable under the circumstances, including the uncertainty surrounding rapidly changing market and economic conditions from the coronavirus disease 2019, or COVID-19, pandemic. Actual results could materially differ from these estimates.
Foreign Currency Translation
The Company’s reporting currency is the U.S. Dollar. The functional currency of the Company's foreign subsidiaries is generally the local currency. Assets and liabilities are translated into U.S. Dollars at the exchange rates at the balance sheet date, equity accounts are translated at historical exchange rates and revenue, expenses, gains and losses are translated using average exchange rates for the period. Resulting foreign currency translation adjustments are recorded directly within accumulated other comprehensive income (loss), a separate component of stockholders’ equity.
Cash, Cash Equivalents and Restricted Cash
Cash is stated at fair value. As of December 31, 2020 and 2019 the U.S. dollar value of cash and restricted cash denominated in foreign currencies was $28.1 million and $12.6 million, respectively, and these balances were comprised principally of Euro, Canadian Dollars, Australian Dollars, and British Pounds.
Cash equivalents consist of short-term, highly liquid investments with an original maturity of three months or earlier. The Company did not hold any cash equivalents as of December 31, 2020 or 2019.
Restricted cash primarily includes amounts held by banks as security related to lease arrangements for office space.
93
Accounts Receivable, Net
Trade accounts receivable are recorded at the invoiced amount and do not bear interest. Accounts receivable are presented net of an estimated allowance for doubtful accounts. The Company maintains an allowance for doubtful accounts based upon an analysis of past credit history and the current financial condition of the Company's customers, as well as the consideration of expected trends based upon characteristics of the accounts and general economic conditions. The Company also considers other specific operational factors which may impact the Company's ability to collect past due amounts. During fiscal year 2020, the Company also considered the impact of COVID-19. Account balances are written off against the allowance after all means of collection have been exhausted and the potential for recovery is considered remote.
The following table summarizes the activity of the allowance for doubtful accounts (in thousands):
| Amount | ||||||||
| Balance as of December 31, 2017 | $ | |||||||
| Provision for bad debt | ||||||||
| Net deductions and other | ( | |||||||
| Balance as of December 31, 2018 | $ | |||||||
| Provision for bad debt | ||||||||
| Net deductions and other | ( | |||||||
| Balance as of December 31, 2019 | $ | |||||||
| Provision for bad debt | ||||||||
| Net deductions and other | ( | |||||||
| Balance as of December 31, 2020 | $ | |||||||
Unbilled accounts receivable are included in the accounts receivable balances and represent revenue earned, but the amount is not contractually billable as of the balance sheet date. The unbilled accounts receivable balance is principally invoiced within the following month. As of December 31, 2020 and 2019, unbilled accounts receivable was $3.0 million, and $3.6 million, respectively.
Concentrations of Business and Credit Risk
As of and for the years ended December 31, 2020, 2019 and 2018, no single customer represents over 10% of the Company's revenues or accounts receivable.
Inventory
Inventory consists of components, work in progress and finished goods, and are stated at the lower of cost (first-in, first-out method) or net realizable value. Components consist of hard drives, solid state memory and chassis, which are used in assembling the Company's devices. The Company also utilizes components in the assembly of servers which are deployed in its data centers, which are capitalized when deployed in the data center as property and equipment on the Company's consolidated balance sheets. The Company assesses the valuation of inventory and adjusts the value for estimated excess and obsolete inventory based upon estimates of future demand and market conditions, as well as damaged or otherwise impaired goods.
Debt Issuance Costs
The Company capitalizes costs incurred to obtain debt financing if certain criteria are met. Unamortized debt issuance costs are presented as a direct reduction of the carrying value of the debt or as other assets when no debt balances are outstanding. The capitalized costs are amortized over the term of the loan agreement using the effective interest method, as a component of interest expense in the consolidated statements of operations.
Contract Acquisition Costs
The Company capitalizes commission expenses paid to internal sales personnel, which are incremental to obtaining customer contracts, using a portfolio approach. These contract acquisition costs are deferred and recorded in other assets on the Company's consolidated balance sheets. The Company makes judgments in determining the amount of costs to be expensed in the period, including amounts which are expensed as incurred if the period of benefit is less than one year, and amounts which are capitalized and expensed over future periods if the expected period of benefit is beyond one year. The period of benefit often extends beyond
94
the contract term, as the Company only pays a commission on the initial contract term and not upon renewal of the contract. Contract acquisition costs are allocated to each performance obligation within the contract and amortized on a straight-line basis over the expected period of benefit of the related performance obligation. Contract acquisition cost amortization is recorded as a component of sales and marketing expense in the Company's consolidated statements of operations.
The Company has determined that the expected period of benefit is five years based on an evaluation of a number of factors, including customer attrition rates, weighted average useful lives of the Company's partner relationships and developed technology intangible assets, and market factors, including the overall competitive environment and the technology life utilized by competitors. The Company periodically reviews the capitalized contract acquisition costs for impairment. As of December 31, 2020 and 2019, the Company has not identified any potential indicators of impairment.
Software Development Costs
Internally developed software includes software developed to meet our internal needs to provide cloud-based subscription offerings to our partners and other software we develop to meet our specific operational needs. These capitalized costs for internal-use software consist of internal compensation related costs and third-party direct costs incurred during the application development stage and are amortized using the straight-line method over the useful life, which is generally to five years , commencing when the asset is substantially ready for use. Amortization of capitalized internal-use software development costs are expensed as a component of depreciation and amortization within operating expenses in our consolidated statements of operations.
The costs to develop software that is embedded on our devices and thus marketed externally have not been capitalized as we believe our current software development process is essentially completed concurrent with the establishment of technological feasibility. As such, all related software development costs are expensed as incurred and included in research and development expense in our consolidated statements of operations.
Capitalized Implementation Costs
Costs to implement cloud computing arrangements that are service contracts are capitalized consistent with the accounting guidance for internal-use software. Capitalized costs include third-party and internal compensation related direct costs. During 2020, 2019 and 2018, the Company capitalized $3.1 million, $4.4 million, and $2.6 million, respectively, of costs associated with cloud computing arrangements related to the implementation and configuration of systems to manage certain financial operations, business processes and customer interactions. Capitalized costs are amortized using the straight-line method over the expected period of benefit, including periods which are reasonably expected to be renewed, as a component of cost of revenue or operating expenses, depending on the Company's utilization of the cloud computing arrangement. Capitalized costs, net of accumulated amortization, are included in prepaid expenses and other current assets and other assets based on the expected period of benefit. Costs capitalized are included as a component of net cash provided by (used in) operating activities in the consolidated statements of cash flows.
Business Combinations
The Company includes the results of operations of the businesses it acquires as of the respective dates of acquisition. The Company allocates the fair value of the purchase price of acquisitions to the tangible assets acquired, liabilities assumed, and intangible assets acquired, based on their estimated fair values. The excess of the purchase price over the fair values of these identifiable assets and liabilities is recorded as goodwill. Additional information existing as of the acquisition date but unknown to the Company may become known during the remainder of the measurement period, not to exceed months from the acquisition date, which may result in changes to the amounts and allocations recorded.
Impairment of Goodwill, Intangible Assets and Other Long-Lived Assets
Goodwill is evaluated for impairment on an annual basis in the fourth quarter of our fiscal year, and whenever events or changes in circumstances indicate the carrying amount of goodwill may not be recoverable. The Company has elected to first assess qualitative factors to determine whether it is more likely than not the fair value of its single reporting unit is less than the carrying amount, including goodwill. If the Company determines it is more likely than not the fair value of its single reporting unit is less than the carrying amount, then the quantitative impairment test is performed. Under the quantitative impairment test, if the carrying amount of
95
the Company's single reporting unit exceeds its fair value, the Company recognizes an impairment loss in an amount equal to the excess, although the impairment loss is limited to the total amount of goodwill.
The Company evaluates events and changes in circumstances that could indicate carrying amounts of intangible assets and other long-lived assets may not be recoverable. When such events or changes in circumstances occur, the Company assesses the recoverability of these assets by determining whether or not the carrying amount will be recovered through expected future undiscounted cash flows. If the total of the expected future undiscounted cash flows is less than the carrying amount of an asset, the Company records an impairment loss for the amount by which the carrying amount of the asset exceeds the fair value of the asset.
The Company did not recognize any impairment losses on its goodwill, intangible assets or other long-lived assets during 2020, 2019 and 2018.
Stock-Based Compensation
The fair value of stock-based awards is measured at the grant date and is recognized as expense, net of actual forfeitures. The Company has issued stock-based awards with a time-based vesting condition, for which stock-based compensation expense is typically recognized on a straight-line basis over the requisite service period, which is generally the vesting period of the respective award. Prior to its IPO, the Company had issued certain awards which contained both a time-based and a performance-based vesting condition, which was the closing of an IPO ("IPO Contingent Options"). Since the closing on an IPO is not deemed probable until consummated, stock-based compensation expense for the IPO Contingent Options commenced during the fourth quarter of 2020 as a result of the Company's IPO, and is recognized using the accelerated attribution method.
The fair value of stock options is determined using the Black-Scholes option pricing model. The fair value of restricted stock units ("RSUs") is determined based on the closing price of the Company's common stock on the NYSE as reported on the last trading day prior to the grant date. The Black-Scholes option pricing model requires the input of several variables and subjective assumptions, including the fair value of the Company's underlying common stock prior to the Company's IPO, the risk-free interest rate, the expected term of the award, the expected stock price volatility, and expected dividends.
Fair Value of the Company's Underlying Common Stock: Prior to the Company's IPO, the fair value of the Company’s shares of common stock underlying equity awards was determined by the Board of Directors ( the "Board") with input from management and contemporaneous third-party valuations, as there was no public market for the Company's common stock. The Board determined the fair value of the common stock by considering a number of objective and subjective factors including: the valuation of comparable companies, the Company’s operating and financial performance, the likelihood of achieving a liquidity event, such as an IPO or sale of the Company given prevailing market conditions, and the general and industry specific economic outlook. After the IPO, the fair value of the Company’s shares of common stock underlying equity awards is based on the closing price of the Company's common stock on the NYSE as reported on the last trading day prior to the grant date.
Risk-Free Interest Rate: The risk-free interest rate is based on the U.S. Treasury yield curve in effect at the time of grant for zero-coupon U.S. Treasury notes with maturities approximately equal to the stock option’s expected term.
Expected Term of the Award: The expected term represents the period the stock-based awards are expected to be outstanding. The Company does not have sufficient historical exercise data to provide a reasonable basis upon which to estimate the expected term because of the limited period of time that a public market for its common stock has been available. As a result, for stock options with only a time-based vesting condition, the Company used the simplified method to calculate the estimate of the expected term of the award. Under the simplified method, the expected term is equal to the average of the stock-based award’s weighted average vesting period and its contractual term. For the IPO Contingent Options, the Company estimated the expected term based on the date the performance condition was satisfied, which was the Company's IPO.
Expected Stock Price Volatility: Since the Company does not have a significant trading history of its common stock, the expected volatility is derived from the average historical stock volatilities of several unrelated public companies within its industry that management considers to be comparable to the Company's business, over a period equivalent to the expected term of the awards. The Company intends to continue to consistently apply this process to estimate the expected volatility until sufficient historical information regarding the volatility of the share price of it's common stock becomes available.
Dividend Yield: The expected dividend yield is zero as the Company has never declared or paid cash dividends and has no current plans to do so in the foreseeable future.
96
Revenue Recognition
On January 1, 2018, the Company elected to early adopt the Financial Accounting Standard Board's (“FASB”) Accounting Standard Codification ("ASC") Topic 606, Revenue from Contracts with Customers (“ASC 606”) using the modified retrospective method. The results for the years ended December 31, 2020, 2019 and 2018 reflect the application of ASC 606.
The Company recognizes revenue according to the following principles as defined in ASC 606:
•Identify the contract with a customer
•Identify the performance obligations in the contract
•Determine the transaction price
•Allocate the transaction price to the performance obligations in the contract
•Recognize revenue when or as the Company satisfies a performance obligation
Sales tax, value-added tax and goods and services tax collected from customers and remitted to governmental authorities is not included in revenue.
Subscription revenue
These services represent an MSP’s right to access software hosted by the Company in the cloud, as well as supporting services such as when-and-if-available updates and technical support, and are categorized as follows:
•Unified continuity and networking solutions include an array of business continuity and disaster recovery (“BCDR”) capabilities including full image-based backup, virtualization, cloud replication and restoration of a customer’s full environment, as well as SaaS application backup and restore, and networking monitoring and management. These services typically include private cloud storage, technical support and online training and are sold under a recurring revenue model.
•Business management solutions integrate a broad range of mission critical business systems, including professional services automation (“PSA”), customer relationship management, service desk, contract management, scheduling, project management, billing and reporting, and remote monitoring and management (“RMM”).
The Company's subscription arrangements do not provide customers with the right to take possession of the software supporting the platform and, as a result, are accounted for as service arrangements. Revenue is generally recognized ratably over the contract term, although revenue for certain subscription services are based upon monthly usage.
Device revenue
Device revenue represents the delivery of physical hardware and embedded software the Company offers to facilitate recurring subscription services. This includes (i) BCDR devices, which enable business continuity and disaster recovery services to be provided to the MSP, and the proprietary software that is embedded on those devices enabling intelligent backup and (ii) networking devices, which refers to the Company's collection of integrated WiFi access points, switches, routers and managed power offerings that enable MSPs to efficiently offer highly performant and reliable cloud-managed networking to their SMB customers.
The Company recognizes device revenue upon delivery to the customer. The Company's contracts allow for customers to return devices within 60 days of purchase for a full-refund. Returns have historically been immaterial.
Professional services and other revenue
Professional services and other revenue primarily consists of implementation and consulting services, including configuration, database merging and data migration related to the Company's PSA and RMM software. The majority of the Company's professional services are billed on a time and materials basis and revenue is recognized over time as the services are performed. For contracts billed on a fixed price basis, revenue is recognized over time based on the proportion of the professional services performed in relation to the total professional services expected to be performed.
Contracts with multiple performance obligations
Contracts that contain multiple performance obligations require an allocation of the transaction price to each performance obligation based on a relative standalone selling price basis unless the transaction price is variable and meets the criteria to be allocated entirely to a performance obligation or to a distinct service that forms part of a single performance obligation. Contracts
97
which contain multiple performance obligations include sales of devices and subscription services, and sales of business management solutions and implementation and consulting services. The Company determines standalone selling price based on the price at which the performance obligation is sold separately. If the standalone selling price is not observable through past transactions, the Company estimates the standalone selling price taking into account available information such as market conditions and internally approved pricing guidelines related to the performance obligation.
Upgrade rights
Certain device sales provide the MSP with a one-time right to upgrade the equipment within three years of the initial purchase by returning their equipment in exchange for new equipment that has a higher associated monthly service price. Upon the exercise of the right, the MSP receives a full credit of the price paid for the original device towards the purchase of the new device. At December 31, 2020, 2019 and 2018, the Company has deferred revenue of $8.2 million, $11.3 million and $10.9 million, respectively, related to these upgrade rights, which is recorded within deferred revenue, current.
Service warranty
The Company's warranty policy requires the Company to repair or replace defective devices at no cost to the customer for a typical period of three to five years after purchase, as long as the customer maintains an active subscription for the device. The Company accounts for this policy as a service-type warranty performance obligation that is fulfilled over the same period of performance as the other subscription performance obligations and therefore recognizes the associated revenue over the same period as subscription revenue.
Contract Balances
The timing of revenue recognition may differ from the timing of invoicing to customers. The Company records a receivable when revenue is recognized prior to invoicing and payment will become due solely based on the passage of time, a contract asset when revenue is recognized prior to invoicing and payment is contingent upon transfer of control of another separate performance obligation, or deferred revenue when payment is received prior to the recognition of revenue. Deferred revenue that will be realized during the succeeding 12-month period is recorded as current, and the remaining balance of deferred revenue is recorded as non-current.
Cost of Revenue
The Company includes costs directly related to revenue as a component of cost of revenue. Personnel costs associated with cost of revenue consist of salaries, benefits, bonuses, payroll taxes and stock-based compensation expense.
Subscription
Subscription cost of revenue consists of costs directly related to the Company's subscription services, including personnel costs related to operating its data centers and customer support operations, hosting and data center related costs, third-party software licenses and allocated facilities and overhead costs.
Device
Device cost of revenue consists of hardware, manufacturing, shipping and logistics and personnel costs associated with delivering the Company's devices, as well as allocated facilities and overhead costs.
Professional services and other
Professional services and other cost of revenue consists primarily of personnel costs associated with delivering these services, as well as allocated facilities and overhead costs.
Depreciation and amortization
Cost of revenue includes depreciation of its data center infrastructure and amortization of the Company's technology acquired intangible assets.
98
Operating expenses
The Company's operating expenses consist of sales and marketing, research and development and general and administrative expenses, as well as depreciation and amortization. Personnel costs are the most significant component of operating expenses and consist of salaries, benefits, bonuses, sales commissions, payroll taxes and stock-based compensation expense, as well as the related overhead costs to support the Company's staff. Other significant components of operating expenses include events and travel, professional fees, allocated facilities and overhead costs, general marketing and promotional activities, payment processing fees and bad debt expense.
Research and development
Research and development expenses consist primarily of personnel costs and the related overhead costs to support the Company's staff, third-party professional fees and allocated facilities and overhead costs.
General and administrative
General and administrative expenses consist primarily of personnel costs and the related overhead costs to support the Company's staff across the corporate functions of executive, finance, human resources, information technology, internal operations and legal, as well as third-party professional fees, bad debt expense, travel and facilities costs.
Depreciation and amortization
Depreciation and amortization expenses not included in cost of revenue consist of amortization of tradenames and partner relationship acquired intangible assets as well as depreciation of other property and equipment such as leasehold improvements, furniture and fixtures, and computer equipment.
Leases
The Company categorizes leases at their inception as either operating or capital leases. In the ordinary course of business, the Company enters into non-cancelable operating leases, principally for office space. The Company recognizes lease costs on a straight-line basis and treats lease incentives as a reduction of rent expense over the term of the agreement. The difference between cash payments and rent expense is recorded as a deferred rent liability in accrued expenses and other current liabilities and other long-term liabilities on the consolidated balance sheets.
The Company has recorded assets under capital lease agreements for certain equipment. Amounts are included in property and equipment, net on the consolidated balance sheets, and are amortized over the period of the underlying lease. The present value of the minimum lease payments are included in accrued expenses and other current liabilities and other long-term liabilities on the consolidated balance sheets. See Note 9, Commitments and Contingencies, for further information.
Fair Value of Financial Instruments and Fair Value Measurements
The Company determines the fair value of financial instruments based on assumptions that market participants would use in pricing an asset or liability in the principal or most advantageous market. When considering market participant assumptions in fair value measurements, the following fair value hierarchy distinguishes between observable and unobservable inputs, which are categorized in one of the following levels:
Level 1 Inputs: Unadjusted quoted prices for identical assets or liabilities in active markets.
Level 2 Inputs: Quoted prices for similar assets or liabilities in active markets, quoted prices for identical or similar instruments in markets that are not active, and model derived valuations whose inputs are observable or whose significant value drivers are observable.
Level 3 Inputs: Significant inputs into the valuation model are unobservable.
99
Income Taxes
Income tax expense includes U.S. (federal and state) and foreign income taxes. Deferred income tax balances reflect the effects of temporary differences between the carrying amounts of assets and liabilities and their tax bases, as well as net operating loss and tax credit carryforwards. Deferred tax assets represent amounts available to reduce income taxes payable in future periods. Deferred tax assets are evaluated for future realization and reduced by a valuation allowance to the extent the Company believes they will not be realized. The Company considers many factors when assessing the likelihood of future realization of deferred tax assets, including it's recent cumulative loss experience and expectations of future earnings, the carry-forward periods available for tax reporting purposes, and other relevant factors. The effects of the COVID-19 pandemic on the business make estimates of future earnings in relevant jurisdictions more challenging. Deferred income tax assets and liabilities are adjusted for the effects of changes in tax laws and tax rates on the date of enactment.
The Company recognizes the tax benefit from an uncertain tax position only if it is more likely than not the tax position will be sustained on examination by the taxing authorities based on the technical merits of the position. The tax benefits are recognized from such positions based on the largest benefit that has a greater than 50% likelihood of being realized upon settlement. Interest and penalties related to unrecognized tax benefits are recognized within income tax expense.
Recently Adopted Accounting Pronouncements
In October 2016, the FASB issued Accounting Standards Update ("ASU") 2016-16, Income Taxes (Topic 740): Intra-entity Transfers of Assets other than Inventory, which requires recognition of current and deferred income taxes resulting from an intra-entity transfer of any asset other than inventory when the transfer occurs. The Company adopted this guidance on January 1, 2020 and it did not have a material impact on the Company's consolidated financial statements.
In June 2018, the FASB issued ASU 2018-07, Compensation-Stock Compensation, Improvements to Non employee Share-Based Payment Accounting, which expands the scope of ASC 718, Compensation—Stock Compensation to include share-based payment transactions for acquiring goods and services from non employees. This guidance provides for the following changes: (1) awards to non employees will be measured at the grant date fair value of equity instruments that the entity is obligated to issue, (2) performance-based awards to non employees will be measured based on the probability of the performance condition being met and (3) the need to reassess the classification (equity or liability) of awards to non employees upon vesting is eliminated. The Company adopted this guidance on January 1, 2020 and it did not have a material impact on the Company's consolidated financial statements.
Accounting Pronouncements Issued but Not Yet Adopted
In February 2016, the FASB issued ASU 2016-02, Leases (Topic 842), ("ASC 842") which requires lessees to recognize the following for all leases (with the exception of short-term leases) at the commencement date; (i) a lease liability, which is a lessee’s obligation to make lease payments arising from a lease, measured on a discounted basis; and (ii) a right-of-use asset, which is an asset that represents the lessee’s right to use, or control the use of, a specified asset for the lease term. Additional disclosures will be required to allow the user to assess the amount, timing and uncertainty of cash flows arising from leasing activities. A modified retrospective transition approach is required for leases existing at the time of adoption. On November 15, 2019, the FASB issued ASU 2019-10 which addresses challenges associated with the transition. Those challenges have been significantly amplified by the current business and capital market disruptions caused by the COVID-19 pandemic, and as such the effective date of the standard has been deferred to fiscal years beginning after December 15, 2021. The Company plans to adopt this standard as of January 1, 2021 using the modified retrospective approach of all leases entered into before the effective date. The impact of the Company's adoption of ASC 842 to its consolidated financial statements will be to recognize the majority of the operating lease commitments as operating lease liabilities and right-of-use assets upon adoption, which will result in an increase in the assets and liabilities recorded on the consolidated balance sheet. The Company is still finalizing the impact of adopting this new accounting standard on its consolidated financial statements.
100
In June 2016, the FASB issued ASU 2016-13, Financial Instruments - Credit Losses (Topic 326): Measurement of Credit Losses on Financial Instruments. This standard changes the impairment model for most financial assets, including trade receivables and financial instruments. The Company will be required to use a forward-looking expected loss method, which may result in earlier recognition of allowances for losses and require expected credit losses to be reflected as allowances rather than reductions in the amortized cost basis of financial assets. For public entities, the standard is currently effective. However, as an EGC, the Company has elected to defer the adoption, so the standard is effective for fiscal years beginning after December 15, 2022, or earlier if the Company (i) is no longer an EGC or (ii) affirmatively and irrevocably opts out of the extended transition period provided in the JOBS Act. The Company is evaluating the impact this guidance will have on its consolidated financial statements.
In December 2019, the FASB issued ASU 2019-12, Income Taxes (Topic 740): Simplifying the Accounting for Income Taxes, which simplifies the accounting for income taxes by eliminating certain exceptions to the guidance in Topic 740 related to the approach for intraperiod tax allocation, the methodology for calculating income taxes in an interim period and the recognition of deferred tax liabilities for outside basis differences. The new guidance also simplifies aspects of the accounting for franchise taxes and enacted changes in tax laws or rates and clarifies the accounting for transactions that result in a step-up in the tax basis of goodwill and allocating consolidated income taxes to separate financial statements of entities not subject to income tax. The standard is effective for the Company for fiscal years beginning after December 15, 2021, with early adoption permitted. Upon adoption, the Company must apply certain aspects of this standard retrospectively for all periods presented while other aspects are applied on a modified retrospective basis through a cumulative-effect adjustment to retained earnings as of the beginning of the fiscal year of adoption. The Company is currently evaluating the impact this guidance will have on the Company's consolidated financial statements.
3. Revenue Recognition
The Company adopted ASC 606 using the modified retrospective method for all contracts with customers that were not completed as of January 1, 2018. The primary impacts of adopting ASC 606 were caused by the change in allocation of the transaction price between subscription services and devices sold in a bundled transaction and the capitalization of the incremental costs to obtain contracts which were generally expensed at contract inception prior to the adoption of ASC 606.
Disaggregation of Revenue
The following table disaggregates revenue by service (in thousands):
| Year Ended December 31, 2020 | ||||||||||||||||||||||||||
| Device | Professional Services and other | Subscription | Total | |||||||||||||||||||||||
| Recognized at a point in time | $ | $ | $ | $ | ||||||||||||||||||||||
| Recognized over time | ||||||||||||||||||||||||||
| Total | $ | $ | $ | $ | ||||||||||||||||||||||
| Year Ended December 31, 2019 | ||||||||||||||||||||||||||
| Device | Professional Services and other | Subscription | Total | |||||||||||||||||||||||
| Recognized at a point in time | $ | $ | $ | $ | ||||||||||||||||||||||
| Recognized over time | ||||||||||||||||||||||||||
| Total | $ | $ | $ | $ | ||||||||||||||||||||||
| Year Ended December 31, 2018 | ||||||||||||||||||||||||||
| Device | Professional Services and other | Subscription | Total | |||||||||||||||||||||||
| Recognized at a point in time | $ | $ | $ | $ | ||||||||||||||||||||||
| Recognized over time | ||||||||||||||||||||||||||
| Total | $ | $ | $ | $ | ||||||||||||||||||||||
101
The following table summarizes sales to customers by geography (in thousands):
| Year Ended December 31, | ||||||||||||||||||||
| 2020 | 2019 | 2018 | ||||||||||||||||||
| Revenue | ||||||||||||||||||||
| United States | $ | $ | $ | |||||||||||||||||
| International | ||||||||||||||||||||
| Total | $ | $ | $ | |||||||||||||||||
Revenue by location is determined by the billing address for the customer. Other than the United States, no other individual country accounted for greater than 10% of total revenue for 2020, 2019 and 2018.
Contract Balances
Contract assets represent amounts for which the Company has recognized revenue, pursuant to its revenue recognition policy, for contracts that have not yet been invoiced to customers where there is a remaining performance obligation. Contract assets relate to contractual arrangements with both a subscription and a device or professional service performance obligation. Amounts are recorded as a current asset or a non-current asset based on the amounts anticipated to be billed within one year of the balance sheet date.
The following table summarizes the activity of the Company's contract asset balances (in thousands):
| Amount | ||||||||
| Balance as of December 31, 2018 | $ | |||||||
| Contract assets earned | ||||||||
| Contract assets invoiced | ( | |||||||
| Foreign currency translation | ||||||||
| Balance as of December 31, 2019 | $ | |||||||
| Contract assets earned | ||||||||
| Contract assets invoiced | ( | |||||||
| Foreign currency translation | ||||||||
| Balance as of December 31, 2020 | $ | |||||||
Current contract assets of $7.7 million, $6.5 million and $3.6 million are included in prepaid expenses and other current assets as of December 31, 2020, 2019 and 2018, respectively. Non-current contract assets of $7.9 million, $7.7 million and $1.7 million are included in other assets as of December 31, 2020, 2019 and 2018, respectively.
Contract liabilities consist of customer billings in advance of revenue being recognized. Amounts anticipated to be recognized within one year of the balance sheet date are recorded as deferred revenue, current; the remaining portion is recorded as deferred revenue, noncurrent on the consolidated balance sheets.
The following table summarizes the activity of the Company's current and noncurrent deferred revenue balances (in thousands):
| Amount | ||||||||
| Balance at December 31, 2018 | $ | |||||||
| Deferred revenue recognized | ( | |||||||
| Amounts deferred | ||||||||
| Foreign currency translation | ( | |||||||
| Balance at December 31, 2019 | $ | |||||||
| Deferred revenue recognized | ( | |||||||
| Amounts deferred | ||||||||
| Foreign currency translation | ||||||||
| Balance at December 31, 2020 | $ | |||||||
Contract Acquisition Costs
The Company capitalizes commission expenses paid to internal sales personnel, which are incremental to obtaining customer contracts, using a portfolio approach. Contract acquisition costs are included in other assets on the consolidated balance sheets.
102
The following table summarizes the activity of contract acquisition costs (in thousands):
| Amount | ||||||||
| Balance as of December 31, 2018 | $ | |||||||
| Capitalization of contract acquisition costs | ||||||||
| Amortization of contract acquisition costs | ( | |||||||
| Foreign currency translation | ||||||||
| Balance as of December 31, 2019 | $ | |||||||
| Capitalization of contract acquisition costs | ||||||||
| Amortization of contract acquisition costs | ( | |||||||
| Foreign currency translation | ||||||||
| Balance as of December 31, 2020 | $ | |||||||
Remaining Performance Obligations
Revenues expected to be recognized in the future related to performance obligations that are unsatisfied at December 31, 2020 were approximately $305.4 million, of which approximately 50 % are anticipated to be satisfied in the next twelve months , with substantially all performance obligations satisfied within thirty-six months. The amount excludes month-to-month contracts.
4. Inventory
At December 31, 2020 and 2019, inventory, net of the reserves for obsolescence, consisted of the following (in thousands):
| December 31, | |||||||||||||||||
| 2020 | 2019 | ||||||||||||||||
| Components | $ | $ | |||||||||||||||
| Work in progress | |||||||||||||||||
| Finished goods | |||||||||||||||||
| Total inventory | $ | $ | |||||||||||||||
5. Prepaid Expenses and Other Current Assets
At December 31, 2020 and 2019, prepaid expenses and other current assets consisted of the following (in thousands):
| December 31, | ||||||||||||||
| 2020 | 2019 | |||||||||||||
| Contract assets | $ | $ | ||||||||||||
| Prepaid software and cloud computing arrangements | ||||||||||||||
| Prepaid insurance | ||||||||||||||
| Inventory deposits | ||||||||||||||
| Other | ||||||||||||||
| Total | $ | $ | ||||||||||||
103
6. Property and Equipment, Net
At December 31, 2020 and 2019, property and equipment, net consisted of the following (in thousands):
| Estimated Useful Life (in Years) | December 31, | |||||||||||||||||||
| 2020 | 2019 | |||||||||||||||||||
| Servers | $ | $ | ||||||||||||||||||
| Leasehold improvements | (a) | |||||||||||||||||||
| Computer equipment | ||||||||||||||||||||
| Internally developed software | ||||||||||||||||||||
| Furniture and fixtures | ||||||||||||||||||||
| Purchased software | ||||||||||||||||||||
| Vehicles | ||||||||||||||||||||
| Total property and equipment | ||||||||||||||||||||
| Less: accumulated depreciation and amortization | ( | ( | ||||||||||||||||||
| Total property and equipment, net | $ | $ | ||||||||||||||||||
(a) The shorter of the remaining lease term or useful life.
The Company capitalized $2.3 million and $1.6 million of internally developed software costs during 2020 and 2019 respectively.
Depreciation expense included in cost of revenue and operating expenses was: $16.9 million and $9.5 million, respectively, for 2020, $11.0 million and $9.5 million, respectively, for 2019 and $7.9 million and $8.5 million, respectively, for 2018.
7. Acquisitions
8. Goodwill and Intangible Assets, Net
Goodwill
On December 7, 2017, Datto, Inc. was acquired by Datto Holding, which was owned by funds controlled by the Company's equity sponsor, Vista Equity Partners (the “Vista Transaction”). Concurrent with the Vista Transaction, Datto, Inc. acquired Autotask Superior Holding, Inc. ("Autotask" and the “Autotask Transaction”) which was controlled by Vista Equity Partners immediately prior to the acquisition by Datto, Inc. The Vista Transaction and the Autotask Transaction generated the majority of the goodwill and intangible assets on the Company's consolidated balance sheets as of December 31, 2020 and 2019.
104
Definite-Lived Intangible Assets
The following table sets forth the gross carrying value and net carrying value of definite-lived intangible assets (in thousands):
| December 31, 2020 | ||||||||||||||||||||||||||
| Gross Carrying Value | Accumulated Amortization | Net Carrying Value | Weighted Average Remaining Life | |||||||||||||||||||||||
| Technology | $ | $ | ( | $ | ||||||||||||||||||||||
| Tradenames | ( | |||||||||||||||||||||||||
| Partner relationships | ( | |||||||||||||||||||||||||
| Total | $ | $ | ( | $ | ||||||||||||||||||||||
| December 31, 2019 | ||||||||||||||||||||||||||
| Gross Carrying Value | Accumulated Amortization | Net Carrying Value | Weighted Average Remaining Life | |||||||||||||||||||||||
| Technology | $ | $ | ( | $ | ||||||||||||||||||||||
| Tradenames | ( | |||||||||||||||||||||||||
| Partner relationships | ( | |||||||||||||||||||||||||
| Total | $ | $ | ( | $ | ||||||||||||||||||||||
Amortization expense related to intangible assets included in cost of revenue and operating expenses was $5.0 million and $17.7 million, respectively, for 2020, $4.7 million and $17.9 million, respectively, for 2019, and $5.0 million and $20.5 million, respectively, for 2018.
The Company's acquired intangible assets are amortized over periods ranging from 5 to 20 years, depending on their estimated useful lives. As of December 31, 2020, estimated amortization expense for intangible assets is as follows (in thousands):
| Years Ending December 31, | ||||||||
| 2021 | $ | |||||||
| 2022 | ||||||||
| 2023 | ||||||||
| 2024 | ||||||||
| 2025 | ||||||||
| Thereafter | ||||||||
| $ | ||||||||
9. Commitments and Contingencies
Commitments
The Company leases operating facilities and equipment under arrangements expiring on various dates through 2029. Some of these lease agreements have renewal options. Certain operating leases also provide for periodic rent increases and payments for maintenance, real estate taxes and insurance.
Some of the Company’s leases include provisions under which the landlord will reimburse the Company for certain costs related to the preparation and fit-out of the property. In addition, certain leases may contain free rent periods. The Company records these reimbursements and free rent amounts as a reduction to lease expense and amortizes the incentive over the lease term. Because the Company records lease expense on a straight-line basis, the difference between rent expense recorded on a straight-line basis and cash payments is recorded to deferred rent liability as a component of accrued expenses and other current liabilities and other long-term liabilities on the Company's consolidated balance sheets.
Rent expense under operating leases was $9.4 million, $10.0 million and $9.4 million for 2020, 2019 and 2018, respectively.
105
The following represents the Company's future minimum payments under non-cancelable operating leases as of December 31, 2020 for each of the next five years and thereafter (in thousands):
| Years Ending December 31, | ||||||||
| in thousands | ||||||||
| 2021 | $ | |||||||
| 2022 | ||||||||
| 2023 | ||||||||
| 2024 | ||||||||
| 2025 | ||||||||
| Thereafter | ||||||||
| $ | ||||||||
The Company's unconditional purchase obligations are generally established in the ordinary course of business and are entered into to secure services vital to the Company's operations and ability to serve its partners. As of December 31, 2020, the estimated minimum obligations associated with unconditional purchase obligations, which are not recognized on the consolidated balance sheets, were $35.4 million in 2021, $13.2 million in 2022, $9.3 million in 2023, $7.3 million in 2024 and $3.4 million in 2025.
Liabilities for loss contingencies arising from claims, assessments, litigation, fines, and penalties are recorded when it is probable that a liability has been incurred and the amount can be reasonably estimated. Legal costs incurred in connection with loss contingencies are expensed as incurred. The Company believes there is no litigation pending that could have, individually or in the aggregate, a material adverse effect on the Company's financial position, results of operations, or cash flows.
10. Accrued Expenses and Other Current Liabilities
At December 31, 2020 and 2019, accrued expenses and other current liabilities consisted of the following (in thousands):
| December 31, | ||||||||||||||
| 2020 | 2019 | |||||||||||||
| Payroll and related expenses | $ | $ | ||||||||||||
| Operating costs | ||||||||||||||
| Taxes payable | ||||||||||||||
| Offering costs | ||||||||||||||
| Capital lease obligations | ||||||||||||||
| Other | ||||||||||||||
| Total accrued expenses and other current liabilities | $ | $ | ||||||||||||
11. Debt
2020 Credit Agreement
On October 23, 2020, Datto, Inc., as borrower (the “Borrower”), and certain direct and indirect wholly-owned subsidiaries of Datto, entered into a new credit agreement with the lenders party thereto and Morgan Stanley Senior Funding, Inc., as administrative agent (the "2020 Credit Agreement"). The 2020 Credit Agreement is guaranteed by certain direct and indirect subsidiaries of Datto (the “Guarantors,” and, together with the Borrower, the “Loan Parties”) and is supported by a security interest in substantially all of the Loan Parties’ personal property and assets, subject to customary exceptions, as defined in the 2020 Credit Agreement.
The 2020 Credit Agreement provides for an initial $200 million in commitments for revolving credit loans, which may be increased or decreased under specific circumstances, with a $40.0 million letter of credit sublimit and a $100.0 million alternative currency sublimit. In addition, the 2020 Credit Agreement provides for the ability of the Borrower to request term loan facilities. Borrowings pursuant to the 2020 Credit Agreement may be used for working capital and other general corporate purposes, including for acquisitions permitted under the 2020 Credit Agreement, and are scheduled to mature on October 23, 2025. The 2020 Credit Agreement contains certain customary representations and warranties and affirmative and negative covenants.
The interest rates applicable to the revolving borrowings under the 2020 Credit Agreement, are, at the Borrower’s option, either (i) a base rate, equal to the greater of (a) the Prime Rate, (b) the Federal Funds Effective Rate plus 0.5 % or (c) the Adjusted LIBO Rate for a one month Interest Period (each term as defined in the 2020 Credit Agreement) plus 1 %, or (ii) the Adjusted LIBO Rate equal to the LIBO Rate for the applicable Interest Period, plus in the case of each of clauses (i) and (ii), the Applicable Rate (as defined in the 2020 Credit Agreement). The Applicable Rate (i) for base rate loans ranges from 0.25 % to 1.0 % per annum and (ii) for LIBO Rate loans
106
ranges from 1.25 % to 2.0 % per annum, in each case, based on the Senior Secured Net Leverage Ratio (as defined in the 2020 Credit Agreement). The 2020 Credit Agreement provides for a commitment fee ranging from 0.20 % to 0.35 % per annum of the average daily undrawn portion of the revolving commitments based on the Senior Secured Net Leverage Ratio (as defined in the 2020 Credit Agreement).
As of December 31, 2020 the 2020 Credit Agreement is undrawn, with the exception of $1.9 million of outstanding letters of credit. The Company incurred debt issuance costs for the 2020 Credit Agreement of $1.2 million, which are being amortized over the term of the 2020 Credit Agreement as a component of interest expense.
2019 Credit Agreement
The following describes the key terms of the 2019 Credit Agreement, which was entered in April 2019. All amounts outstanding under the 2019 Credit Agreement of $590.2 million were repaid in October 2020 in conjunction with the IPO, and the 2019 Credit Agreement was terminated at that time.
Term Loan Facility
Under the terms of the 2019 Credit Agreement, the Company obtained a $550.0 million term loan facility (“2019 Term Loan Facility”), which accrued interest at either an alternate base rate, plus a margin, or a Eurodollar rate, plus a margin, each as defined in the 2019 Credit Agreement. Loan proceeds were net of an original issue discount (“OID”) of $2.75 million. Principal payments were due quarterly at an amount equal to 0.25 % of the original principal, or $5.5 million annually, starting in September 2019. As of December 31, 2019, $547.25 million was outstanding under the 2019 Term Loan Facility, and the interest rate on the Term Loan Facility was 6.05 % at December 31, 2019.
Revolving Credit Facility
Under the terms of the 2019 Credit Agreement, the Company obtained a $50.0 million revolving credit facility (“2019 Revolving Credit Facility”), which accrued interest at either an alternate base rate, plus a margin, or a Euro dollar base rate, plus a margin, each as defined in the 2019 Credit Agreement. The 2019 Revolving Credit Facility provided for a commitment fee of 0.50 % per annum, due quarterly on the actual daily unused amount of the revolving commitments. The commitment fee paid is included as a component of interest expense in the consolidated statements of operations. As of December 31, 2019, $15.0 million was drawn on the 2019 Revolving Credit Facility and $2.8 million of letters of credit were outstanding were backed by the Revolving Credit Facility. The interest rate on the Revolving Credit Facility was 5.52 % at December 31, 2019. During February and March 2020, the Company drew down the remaining available balance of $32.1
The Company incurred debt issuance costs related to the 2019 Credit Agreement of $8.8 million, as well as the OID on the 2019 Term Loan Facility as described above. The OID and debt issuance costs were being amortized over the term of the loan based on the effective interest method, as a component of interest expense. The Company recorded amortization of the debt issuance costs and original issue discount of the 2019 Credit Agreement of $1.4 million, $1.9 million, and $2.4 million as interest expense for 2020 and 2019 and 2018, respectively. In conjunction with the 2020 Credit Agreement, the Company terminated its 2019 Credit Agreement, which is described below. During 2020, the Company recognized a loss on the extinguishment of the 2019 Credit Agreement of $8.5 million in the consolidated statements of operations, as a result of the write-off of deferred financing costs and original issue discount.
107
12. Other Long-term Liabilities
At December 31, 2020 and 2019, other long-term liabilities consisted of the following (in thousands):
| December 31, | ||||||||||||||
| 2020 | 2019 | |||||||||||||
| Deferred rent and related accruals | $ | $ | ||||||||||||
| Deferred payroll tax - CARES Act | ||||||||||||||
| Other | ||||||||||||||
| Total other long-term liabilities | $ | $ | ||||||||||||
13. Stockholders' Equity
Authorized capital stock consists of 500,000,000 shares of common stock, par value $0.001 per share, and 50,000,000 0.001 per share. As of December 31, 2020 and 2019 there were 161,420,016 and 135,655,428 shares, respectively, of common stock issued.
Common Stock
Dividend Rights—The holders of common stock are entitled to receive dividends out of funds legally available if the Board, in its discretion, determines to issue dividends and then only at the times and in the amounts the Board may determine. Any future determination to pay dividends is subject to compliance with covenants in current and future agreements governing the Company's and its subsidiaries’ indebtedness, and will depend on the Company's results of operations, financial condition, capital requirements and other factors the Board may deem relevant.
Voting Rights—Holders of common stock are entitled to one vote for each share held on all matters submitted to a vote of stockholders.
Preemptive or Similar Rights—The common stock is not entitled to preemptive rights, and is not subject to conversion, redemption or sinking fund provisions.
Preferred Stock
The Board may, without stockholder approval but subject to any limitations prescribed by law, direct the issuance of shares of preferred stock (in one or more series or classes), create additional series or classes of preferred stock and establish the number of shares to be included in such series or classes. The Board is also authorized, at the time of issuance, to determine the designations, powers, preferences, privileges and relative participating, optional or special rights as well as the qualifications, limitations or restrictions thereof, including dividend rights, conversion rights, voting rights, terms of redemption and liquidation preferences of such preferred stock, any or all of which may be greater than the rights of the common stock. Satisfaction of any dividend preferences of outstanding shares of preferred stock would reduce the amount of funds available for the payment of dividends on shares of the Company's common stock. As of December 31, 2020 and 2019, the Company did not have any shares of preferred stock outstanding and currently has no plans to issue shares of preferred stock.
Treasury Stock
During 2018, the Company purchased 362,126 shares of common stock from stockholders at fair value, which shares are held as treasury stock and carried at their cost basis of $3.6 million on the Company's consolidated balance sheets.
14. Stock-Based Compensation
The Company has outstanding equity awards under various plans, as described below.
Datto 2020 Omnibus Incentive Plan
In conjunction with the IPO, on October 20, 2020, the Board adopted the Datto 2020 Omnibus Incentive Plan (the “2020 Plan”) in order to align the interests of the participants with the interests of the Company's stockholders. The 2020 Plan provides for the grant of stock options, stock appreciation rights, restricted stock, restricted stock units ("RSUs"), bonus stock, dividend equivalents, other stock-based awards, substitute awards, annual incentive awards and performance awards to employees, consultants, and
108
members of the Board. In connection with the 2020 Plan, 20,868,874 shares of the Company’s common stock were reserved for issuance. Under the 2020 Plan, 672,900 of restricted stock units were outstanding as of December 31, 2020.
2017 Stock Option Plan
In December 2017, the Company adopted the 2017 Stock Option Plan (the “2017 Datto Plan”), as amended, which provides for grants of stock options to attract and retain talented employees, directors, officers, and consultants. As of December 31, 2020, 9,173,109 of stock options were outstanding under the 2017 Datto Plan. No additional awards are allowed to be issued under the 2017 Datto Plan as a result of the adoption of the 2020 Plan.
Other Equity Plans
The Company also has outstanding options which were issued under the Autotask Superior Holdings 2013 Stock Option Plan (the “Autotask Plan”), which was frozen at the time of the Autotask Transaction. All outstanding awards were fully vested as of the date of the Autotask Transaction, and the options settle in the Company's common stock. As of December 31, 2020, 381,973 of stock options were outstanding under the Autotask Plan. No additional awards are allowed to be issued under the Autotask Plan. In addition, the Company has two other plans, which were adopted in relation to grants to independent board members, prior to the adoption of the 2020 Plan. As of December 31, 2020, 23,438 of RSUs were outstanding and no additional awards may be issued under these plans.
IPO Contingent Options issued under the 2017 Datto Plan ("IPO Contingent Options")
Under the 2017 Datto Plan, the Company had issued certain awards which contained both a time-based and a performance-based vesting condition, which was the closing of an IPO. Since the closing of an IPO is not deemed probable until consummated, stock-based compensation expense for the IPO Contingent Options commenced during the fourth quarter of 2020 as a result of the Company's IPO.
During 2020 the Board approved a modification of the vesting terms of the IPO Contingent Options. The original terms provided for 25% to vest upon an IPO and 6.25% to vest quarterly thereafter. The modified vesting terms provided for 25% to vest upon an IPO, but to the extent the IPO occurs after the second anniversary of the grant date, in addition to the 25%, an additional 6.25% would vest for each quarter of service provided, commencing on the second anniversary of the grant date.
The modification of the vesting terms of these awards resulted in accounting for the awards as a new grant, and as such the Company updated the fair value of each stock option award using the Black-Scholes option pricing model on the modification date. The resulting compensation is recorded under the accelerated attribution method, resulting in a total of $23.1 million of expense for the IPO Contingent Options recorded during the fourth quarter of 2020, including a significant amount of expense recorded upon completion of the IPO.
Stock Options
The following table summarizes stock option activity for all plans during 2020:
| Number of Shares | Weighted Average Exercise Price | Weighted Average Remaining Contractual Life (Years) | Aggregate Intrinsic Value (in thousands) | |||||||||||||||||||||||
| Options outstanding at December 31, 2019 | $ | $ | ||||||||||||||||||||||||
| Options granted | $ | |||||||||||||||||||||||||
| Options exercised | ( | $ | ||||||||||||||||||||||||
| Options forfeited & expired | ( | $ | ||||||||||||||||||||||||
| Options outstanding at December 31, 2020 | $ | $ | ||||||||||||||||||||||||
| Options vested and exercisable at December 31, 2020 | $ | $ | ||||||||||||||||||||||||
The aggregate grant-date fair value of stock options that vested during 2020, 2019 and 2018 was $23.8 million, $6.9 million and $6.2 million, respectively. The year ended December 31, 2020 includes the value of IPO Contingent Options which vested upon completion of the IPO and thereafter.
The aggregate intrinsic value of stock options exercised during 2020 and 2019 was $6.6 million and $0.8 million, respectively. There were no stock options exercised during 2018.
109
The weighted average grant-date fair value of stock options granted during 2020, 2019 and 2018, was $15.42 , $5.62 and $5.09 , respectively.
The estimated grant-date fair value of stock options was calculated using the Black-Scholes option-pricing model, based on the following range of assumptions:
| Year Ended December 31, | ||||||||||||||||||||
| 2020 | 2019 | 2018 | ||||||||||||||||||
| Expected dividend yield | % | % | % | |||||||||||||||||
| Expected volatility | % | |||||||||||||||||||
| Expected term (years) | ||||||||||||||||||||
| Risk-free interest rate | % | |||||||||||||||||||
| Fair value of underlying common stock | $ | $ | $ | |||||||||||||||||
The valuation of stock options granted during 2020, including the final valuation of the IPO Contingent Options which were modified during 2020, was based upon an interpolation of the Company’s stock price from the beginning of the year of $14.50 to the IPO price of $27.00 .
As of December 31, 2020, unrecognized compensation expense related to outstanding stock options was $52.6 million, which is expected to be recognized over the remaining weighted average term of 2.6 years.
Restricted Stock Units
The following table summarizes RSU activity under all plans during 2020:
| Number of Shares | Weighted Average Grant Date Fair Value | |||||||||||||
| RSUs outstanding at December 31, 2019 | $ | |||||||||||||
| RSUs granted | $ | |||||||||||||
| RSUs forfeited | ( | $ | ||||||||||||
| RSUs outstanding at December 31, 2020 | $ | |||||||||||||
As of December 31, 2020, unrecognized compensation expense related to outstanding RSUs was $17.7 million, which is expected to be recognized over the remaining weighted average term of 3.8 years.
Shares Available for Future Grants
As noted above, future grants may only be made under the 2020 Plan. The following table summarizes the shares available for future grants under the 2020 Plan as of December 31, 2020:
| Shares Available for Future Grants | ||||||||
| Shares reserved for issuance | ||||||||
| Options and RSUs granted | ( | |||||||
| Options and RSUs forfeited, expired and repurchased | ||||||||
| Balance at December 31, 2020 | ||||||||
110
Stock-Based Compensation Expense
Stock-based compensation expense for all equity awards for 2020, 2019 and 2018 was as follows (in thousands):
| For the Year Ended December 31, | ||||||||||||||||||||
| 2020 | 2019 | 2018 | ||||||||||||||||||
| Cost of revenue—subscription | $ | $ | $ | |||||||||||||||||
| Cost of revenue—device | ||||||||||||||||||||
| Cost of revenue—professional services and other | ||||||||||||||||||||
| Selling and marketing | ||||||||||||||||||||
| Research and development | ||||||||||||||||||||
| General and administrative | ||||||||||||||||||||
| Total stock-based compensation expense | $ | $ | $ | |||||||||||||||||
15. Income Taxes
U.S. and foreign components of consolidated income (loss) before income taxes was as follows (in thousands):
| Year Ended December 31, | ||||||||||||||||||||
| 2020 | 2019 | 2018 | ||||||||||||||||||
| United States | $ | $ | ( | $ | ( | |||||||||||||||
| Foreign | ||||||||||||||||||||
| Income (loss) before income taxes | $ | $ | ( | $ | ( | |||||||||||||||
The components of (provision for) benefit from income taxes for 2020, 2019 and 2018 were as follows (in thousands):
| For the Year Ended December 31, | ||||||||||||||||||||
| 2020 | 2019 | 2018 | ||||||||||||||||||
| Current (provision for) benefit from income taxes: | ||||||||||||||||||||
| Federal | $ | $ | $ | |||||||||||||||||
| State | ( | ( | ( | |||||||||||||||||
| Foreign | ( | ( | ||||||||||||||||||
| Total current (provision for) benefit from income taxes | ( | ( | ( | |||||||||||||||||
| Deferred (provision for) benefit from income taxes: | ||||||||||||||||||||
| Federal | ( | |||||||||||||||||||
| State | ( | ( | ||||||||||||||||||
| Foreign | ( | ( | ||||||||||||||||||
| Total deferred (provision for) benefit from income taxes | ( | |||||||||||||||||||
| Total (provision for) benefit from income taxes | $ | ( | $ | $ | ||||||||||||||||
111
The reconciliation of the U.S. federal statutory income tax rate to the Company's effective tax rate for the periods indicated is as follows:
| For the Year Ended December 31, | ||||||||||||||||||||
| 2020 | 2019 | 2018 | ||||||||||||||||||
| U.S. federal statutory income tax rate | % | % | % | |||||||||||||||||
| State income tax, net of federal tax | ||||||||||||||||||||
| State income tax rate change | ( | |||||||||||||||||||
| Foreign operations, including foreign income tax rate differential | ( | |||||||||||||||||||
| Income tax credits | ( | |||||||||||||||||||
| Non-deductible expenses | ( | ( | ||||||||||||||||||
| GILTI inclusion | ( | ( | ||||||||||||||||||
| Stock-based compensation | ( | |||||||||||||||||||
| Change in valuation allowance | ( | |||||||||||||||||||
| Other | ( | ( | ||||||||||||||||||
| Effective tax rate | % | % | % | |||||||||||||||||
The primary differences between the U.S. federal statutory income tax rate and the Company’s effective tax rate for 2020 are permanent differences related to stock-based compensation, the change in valuation allowance, and the impact of state income taxes, partially offset by income tax credits primarily related to research and development activities. The difference in treatment of stock-based compensation for 2020 is primarily related to the impact of applying the limitation on compensation under Section 162(m) of the Internal Revenue Coded as a result of becoming a publicly traded corporation in 2020. The primary differences between the U.S. federal statutory income tax rate and the Company’s effective tax rate for 2019 are the impact of global intangible low-taxed income ("GILTI") and the change in valuation allowance, partially offset by income tax credits primarily related to research and development activities. The Company had a GILTI inclusion in the amount of $0.8 million, $14.7 million and $3.4 million for 2020, 2019 and 2018, respectively.
On March 27, 2020, the Coronavirus Aid, Relief, and Economic Security Act (the "CARES Act") was signed into law. The CARES Act did not have a material impact on the Company's (provision for) benefit from income taxes for 2020.
Deferred income taxes reflect the net tax effect of temporary differences between the carrying amounts of assets and liabilities for financial reporting purposes and the amounts used for income tax purposes. As of December 31, 2020 and 2019, the Company’s deferred tax assets were primarily the result of U.S. federal and state net operating losses (“NOLs”), research and development tax credits, limitations on the timing of deductions of interest expense resulting from the Tax Cuts and Jobs Act of 2017, and the timing of the realization for tax purposes of stock-based compensation expense and deferred revenue. As of December 31, 2020 and 2019, the Company’s deferred tax liabilities were primarily the result of acquired intangible assets, which are amortized for financial reporting purposes but not for tax purposes, and the timing of recognition of expense of contract acquisition costs for commissions and depreciation expense for certain property and equipment. Based on cumulative taxable income, projections for future taxable income, and the timing of reversal of deferred tax liabilities, the Company has recorded a valuation allowance against certain deferred tax assets.
112
| December 31, | ||||||||||||||
| 2020 | 2019 | |||||||||||||
| Deferred income tax assets: | ||||||||||||||
| Net operating loss carryforwards | $ | $ | ||||||||||||
| Tax credits (net of uncertain tax positions) | ||||||||||||||
| Deferred rent | ||||||||||||||
| Deferred revenue | ||||||||||||||
| Accrued expenses | ||||||||||||||
| Allowance for doubtful accounts | ||||||||||||||
| Interest expense limitation | ||||||||||||||
| Stock-based compensation | ||||||||||||||
| Other | ||||||||||||||
| Total gross deferred income tax assets | ||||||||||||||
Less valuation allowance (1) | ( | ( | ||||||||||||
| Total deferred income tax assets | $ | $ | ||||||||||||
| Deferred income tax liabilities: | ||||||||||||||
| Depreciation of property and equipment | $ | ( | $ | ( | ||||||||||
| Contract acquisition costs | ( | ( | ||||||||||||
| Amortization of acquired intangible assets | ( | ( | ||||||||||||
| Total deferred tax liabilities | ( | ( | ||||||||||||
| Net deferred tax liabilities | $ | ( | $ | ( | ||||||||||
(1) Changes of valuation allowances relating to deferred tax assets were as follows (in thousands):
| 2020 | 2019 | 2018 | ||||||||||||||||||
| Balance at January 1, | $ | $ | $ | |||||||||||||||||
| Increase recorded to income tax provision | ||||||||||||||||||||
| Decrease recorded to income tax provision | ( | ( | ||||||||||||||||||
| Balance at December 31, | $ | $ | $ | |||||||||||||||||
As of December 31, 2020 and 2019, the Company had net operating loss carryforwards for federal income tax purposes of $160.9 million and $175.2 million, respectively, which are available to offset future taxable income, if any. The net operating loss carryforwards as of December 31, 2020 were comprised of $152.5 million which will begin to expire in 2037 and $8.4 million relating to the 2018 and 2019 tax years, which will not expire but are subject to a limitation of usage of 80 % of taxable income per year.
As of December 31, 2020 and 2019, the Company had net operating loss carryforwards for state income tax purposes of $76.7 million and $91.1 million, respectively. The net operating loss carryforwards for state income tax purposes as of December 31, 2020 are available to offset future taxable income, if any, through 2040. In addition, as of December 31, 2020 and 2019, the Company had net operating loss carryforwards in various foreign jurisdictions of $4.0 million and $3.1 million, respectively. The foreign net operating loss carryforwards as of December 31, 2020 were comprised of $3.2 million which will begin to expire in 2039 and $0.8 million which do not expire.
As of December 31, 2020 and 2019, the Company had federal research and development credits of $14.2 million and $10.5 million, respectively. The federal research and development credits as of December 31, 2020 are available to offset future taxable income, if any, through 2040.
As of December 31, 2020 and 2019, the Company had state credits of $8.9 million and $9.9 million, respectively, which are available to offset future state tax liabilities. The state credits as of December 31, 2020 were comprised of $7.4 million which will expire beginning in 2030 through 2040 and $1.5 million which do not expire, primarily related to Connecticut research and development credits.
Undistributed earnings of certain foreign subsidiaries were $15.6 million as of December 31, 2020. The Company considers the current earnings and any future earnings of the foreign subsidiaries to be indefinitely reinvested, and therefore does not record deferred taxes related to these earnings. Upon repatriation of earnings, in the form of dividends or otherwise, the Company would be subject to both U.S. income taxes (subject to a dividends received deduction) and withholding taxes payable to certain foreign jurisdictions. The amount of deferred tax liability resulting from the repatriation of earnings is immaterial at December 31, 2020.
113
Tax positions for the Company and its subsidiaries are subject to income tax audits in multiple tax jurisdictions throughout the world. The Company has evaluated its tax positions and has determined it has unrecognized tax benefits as a result of certain uncertain tax positions. The following table summarizes the balance of unrecognized tax benefits, which is recorded as a component of deferred income taxes on the consolidated balance sheets as of December 31, 2020 and 2019 (in thousands):
| Amount | ||||||||
| Balance at December 31, 2018 | $ | |||||||
| Additions (reductions) related to current year | ||||||||
| Additions (reductions) related to prior years positions | ( | |||||||
| Balance at December 31, 2019 | $ | |||||||
| Additions (reductions) related to current year | ||||||||
| Additions (reductions) related to prior years positions | ( | |||||||
| Balance at December 31, 2020 | $ | |||||||
16. Employee Benefit Plans
17. Net Income (Loss) per Share
Basic net income (loss) per share attributable to common stockholders is calculated by dividing the net income (loss) attributable to common stockholders by the weighted average number of shares of common stock outstanding during the period. Diluted net income (loss) per share attributable to common stockholders is calculated by giving effect to all potential shares of common stock, including the Company's outstanding stock options and common stock related to unvested RSUs, to the extent such potential shares are dilutive. For the purpose of computing dilutive earnings per share, options with a performance-vesting condition are considered contingently issuable, and such contingent shares are included in the denominator for computing dilutive net income (loss) per share only once the performance condition is met, and only to the extent such options are dilutive. As described in Note 14. Stock-Based Compensation, the IPO Contingent Options contained a performance-vesting condition, and were only considered in computing diluted net income per share after the IPO. The calculation of basic and diluted income (loss) per share is as follows (in thousands, except share and per share amounts):
| Year Ended December 31, | ||||||||||||||||||||
| 2020 | 2019 | 2018 | ||||||||||||||||||
| Numerator: | ||||||||||||||||||||
| Net income (loss) attributable to common stockholders | $ | $ | ( | $ | ( | |||||||||||||||
| Denominator: | ||||||||||||||||||||
| Weighted average shares used in computing net income (loss) per share attributable to common stockholders | ||||||||||||||||||||
| Basic | ||||||||||||||||||||
| Total dilutive effect of outstanding equity awards | ||||||||||||||||||||
| Diluted | ||||||||||||||||||||
| Net income (loss) per share attributable to common stockholders | ||||||||||||||||||||
| Basic | $ | $ | ( | $ | ( | |||||||||||||||
| Diluted | $ | $ | ( | $ | ( | |||||||||||||||
As of December 31, 2020, 2019 and 2018, there were 2,456,147 , 6,377,560 and 6,733,505 , respectively, weighted average outstanding options that were excluded from the computation of diluted net income (loss) per share attributable to common stockholders for the period presented because including them would have been antidilutive.
18. Related Party Transactions
114
recruitment, and other services provided by Vista and Vista affiliates. At December 31, 2020 and 2019, the Company had immaterial accounts payable due to Vista on the consolidated balance sheets.
In the normal course of business, the Company sells technology solutions under recurring subscriptions to portfolio companies of Vista. Sales to Vista portfolio companies amounted to $0.2 million, $0.1 million, and $0.1 million for 2020, 2019 and 2018, respectively, with such amounts included in subscription revenue in the Company's consolidated statements of operations. At December 31, 2020 and 2019, the Company had immaterial accounts receivable from Vista portfolio companies on the consolidated balance sheets.
19. Condensed Financial Information of Registrant (Parent Company Only)
DATTO HOLDING CORP.
Parent Company Only
Condensed Balance Sheets
(in thousands, except share amounts)
| December 31, | ||||||||||||||
| 2020 | 2019 | |||||||||||||
| ASSETS | ||||||||||||||
| Other assets | ||||||||||||||
| Total assets | $ | $ | ||||||||||||
| LIABILITIES AND STOCKHOLDERS’ EQUITY | ||||||||||||||
| Total liabilities | $ | $ | ||||||||||||
| STOCKHOLDERS’ EQUITY | ||||||||||||||
Preferred stock, $ | ||||||||||||||
Common stock, $ | ||||||||||||||
| Additional paid-in capital | ||||||||||||||
Treasury stock, at cost; | ( | ( | ||||||||||||
| Accumulated deficit | ( | ( | ||||||||||||
| Accumulated other comprehensive income | ||||||||||||||
| Total stockholders’ equity | ||||||||||||||
| Total liabilities and stockholders’ equity | $ | $ | ||||||||||||
DATTO HOLDING CORP.
Parent Company Only
Condensed Statements of Operations
(in thousands, except share and per share amounts)
| Year Ended December 31, | ||||||||||||||||||||
| 2020 | 2019 | 2018 | ||||||||||||||||||
| Equity in net income (loss) of subsidiaries | $ | $ | ( | $ | ( | |||||||||||||||
| Net income (loss) | $ | $ | ( | $ | ( | |||||||||||||||
115
DATTO HOLDING CORP.
Parent Company Only
Condensed Statements of Comprehensive (Loss) Income
(in thousands)
| Year Ended December 31, | ||||||||||||||||||||
| 2020 | 2019 | 2018 | ||||||||||||||||||
| Net income (loss) | $ | $ | ( | $ | ( | |||||||||||||||
| Other comprehensive income: | ||||||||||||||||||||
| Subsidiaries' other comprehensive income (loss) | ||||||||||||||||||||
| Total comprehensive income (loss) | $ | $ | ( | $ | ( | |||||||||||||||
Business and Basis of Presentation
Description of Business
Datto Holding owns 100 % of Merritt Holdco, Inc. (“Merritt Holdco”), which owns 100 % of Datto, Inc., the primary operating company.
Datto Holding is a holding company with no material operations of its own, conducting substantially all of its activities through its subsidiaries. Datto Holding has no direct outstanding debt obligations. Datto, Inc. is the borrower and Merritt Holdco is a guarantor under the 2020 Credit Agreement. Merritt Holdco and Datto, Inc. are limited in their ability to declare dividends or make any payment on account of their capital stock to, directly or indirectly, fund a dividend or other distribution to Datto Holding under the 2020 Credit Agreement. For a discussion of the 2020 Credit Agreement, see Note 11. Debt.
Basis of Presentation
These condensed financial statements have been presented on a “parent-only” basis. Under a parent-only presentation, Datto Holding’s investments in subsidiaries are presented under the equity method of accounting. Certain information and footnote disclosures normally included in financial statements prepared in accordance with GAAP have been condensed or omitted. As such, these parent-only statements should be read in conjunction with the accompanying notes to consolidated financial statements.
20. Restructuring
116
21. Quarterly Financial Data (Unaudited)
The following tables contain selected unaudited consolidated statement of operations information for each quarter of 2020 and 2019. The following information reflects all normal recurring adjustments necessary for a fair presentation of the information for the periods presented. The operating results for any quarter are not necessarily indicative of results for any future period. Unaudited quarterly results are as follows (in thousands, except share and per share data):
| 2020 | |||||||||||||||||||||||||||||
| (in thousands, except share and per share amounts) | First Quarter | Second Quarter | Third Quarter | Fourth Quarter | Year | ||||||||||||||||||||||||
| Revenue: | |||||||||||||||||||||||||||||
| Subscription | $ | $ | $ | $ | $ | ||||||||||||||||||||||||
| Device | |||||||||||||||||||||||||||||
| Professional services and other | |||||||||||||||||||||||||||||
| Total revenue | |||||||||||||||||||||||||||||
| Cost of revenue: | |||||||||||||||||||||||||||||
Subscription | |||||||||||||||||||||||||||||
| Device | |||||||||||||||||||||||||||||
| Professional services and other | |||||||||||||||||||||||||||||
| Depreciation and amortization | |||||||||||||||||||||||||||||
| Total cost of revenue | |||||||||||||||||||||||||||||
| Gross profit | |||||||||||||||||||||||||||||
| Total operating expenses | |||||||||||||||||||||||||||||
| Total other expense | |||||||||||||||||||||||||||||
| Net income (loss) | $ | $ | $ | $ | ( | $ | |||||||||||||||||||||||
| Net income (loss) per share attributable to common stockholders: | |||||||||||||||||||||||||||||
| Basic | $ | $ | $ | $ | ( | $ | |||||||||||||||||||||||
| Diluted | $ | $ | $ | $ | ( | $ | |||||||||||||||||||||||
Weighted average shares used in computing net income (loss) per share: (1) | |||||||||||||||||||||||||||||
| Basic | |||||||||||||||||||||||||||||
| Diluted | |||||||||||||||||||||||||||||
| Stock-based compensation expense | |||||||||||||||||||||||||||||
| Cost of revenue—subscription | $ | $ | $ | $ | $ | ||||||||||||||||||||||||
| Cost of revenue—device | |||||||||||||||||||||||||||||
| Cost of revenue—professional services and other | |||||||||||||||||||||||||||||
| Selling and marketing | |||||||||||||||||||||||||||||
| Research and development | |||||||||||||||||||||||||||||
| General and administrative | |||||||||||||||||||||||||||||
| Total stock-based compensation expense | $ | $ | $ | $ | $ | ||||||||||||||||||||||||
117
| 2019 | |||||||||||||||||||||||||||||
| (in thousands, except share and per share amounts) | First Quarter | Second Quarter | Third Quarter | Fourth Quarter | Year | ||||||||||||||||||||||||
| Revenue: | |||||||||||||||||||||||||||||
| Subscription | $ | $ | $ | $ | $ | ||||||||||||||||||||||||
| Device | |||||||||||||||||||||||||||||
| Professional services and other | |||||||||||||||||||||||||||||
| Total revenue | |||||||||||||||||||||||||||||
| Cost of revenue: | |||||||||||||||||||||||||||||
Subscription | |||||||||||||||||||||||||||||
| Device | |||||||||||||||||||||||||||||
| Professional services and other | |||||||||||||||||||||||||||||
| Depreciation and amortization | |||||||||||||||||||||||||||||
| Total cost of revenue | |||||||||||||||||||||||||||||
| Gross profit | |||||||||||||||||||||||||||||
| Total operating expenses | |||||||||||||||||||||||||||||
| Total other expense | |||||||||||||||||||||||||||||
| Net income (loss) | $ | ( | $ | ( | $ | $ | ( | $ | ( | ||||||||||||||||||||
| Net income (loss) per share attributable to common stockholders: | |||||||||||||||||||||||||||||
| Basic | $ | ( | $ | ( | $ | $ | ( | $ | ( | ||||||||||||||||||||
| Diluted | $ | ( | $ | ( | $ | $ | ( | $ | ( | ||||||||||||||||||||
Weighted average shares used in computing net income (loss) per share: (1) | |||||||||||||||||||||||||||||
| Basic | |||||||||||||||||||||||||||||
| Diluted | |||||||||||||||||||||||||||||
| Stock-based compensation expense | |||||||||||||||||||||||||||||
| Cost of revenue—subscription | $ | $ | $ | $ | $ | ||||||||||||||||||||||||
| Cost of revenue—device | |||||||||||||||||||||||||||||
| Cost of revenue—professional services and other | |||||||||||||||||||||||||||||
| Selling and marketing | |||||||||||||||||||||||||||||
| Research and development | |||||||||||||||||||||||||||||
| General and administrative | |||||||||||||||||||||||||||||
| Total stock-based compensation expense | $ | $ | $ | $ | $ | ||||||||||||||||||||||||
(1) The sum of the income (loss) per share for the four quarters may differ from annual income (loss) per share as a result of the required method of computing the weighted average shares in interim periods.
22. Subsequent Events (Unaudited)
118
ITEM 9. CHANGES IN AND DISAGREEMENTS WITH ACCOUNTANTS ON ACCOUNTING AND FINANCIAL DISCLOSURE
None.
ITEM 9A. CONTROLS AND PROCEDURES
Management’s Report on Internal Control Over Financial Reporting
This Annual Report on Form 10-K does not include a report of management’s assessment regarding internal control over financial reporting or an attestation report of our independent registered public accounting firm (as defined in Rule 13a-15(f) and 15d-15(f) under the Securities Exchange Act of 1934, as amended, or the Exchange Act) because the Company is in a transition period permitted by rules of the SEC for newly public companies.
Evaluation of Disclosure Controls and Procedures
We maintain “disclosure controls and procedures” (as defined in Rules 13a-15(e) and 15d-15(e) under the Exchange Act), that are designed to provide reasonable assurance that information required to be disclosed by us in the reports that we file or submit under the Exchange Act is recorded, processed, summarized and reported within the time periods specified in the SEC’s rules and forms.
Disclosure controls and procedures include, without limitation, controls and procedures designed to provide reasonable assurance that information required to be disclosed by us in the reports that we file or submit under the Exchange Act is accumulated and communicated to our management, including our Chief Executive Officer and Chief Financial Officer, as appropriate, to allow for timely decisions regarding required disclosure.
Our management, with the participation of our Chief Executive Officer and our Chief Financial Officer, evaluated the effectiveness of our disclosure controls and procedures as of December 31, 2020, the end of the period covered by this Annual Report on Form 10-K. Based on that evaluation, our Chief Executive Officer and Chief Financial Officer concluded that our disclosure controls and procedures were not effective as of December 31, 2020 because of the material weakness in internal control over financial reporting discussed below.
Notwithstanding the material weakness in internal control over financial reporting described below, our management has concluded that our consolidated financial statements included in this Annual Report on Form 10-K are fairly stated in all material respects in accordance with accounting principles generally accepted in the United States of America.
Material Weakness
A material weakness is a deficiency, or a combination of deficiencies, in internal control over financial reporting, such that there is a reasonable possibility that a material misstatement of a company’s annual or interim financial statements will not be prevented or detected on a timely basis.
As disclosed in our final IPO prospectus dated October 20, 2020, we have identified a material weakness in our internal control over the financial statement close process related to deficiencies in information technology general controls and process level controls. These control deficiencies could result in a misstatement of our accounts or disclosures that could result in a material misstatement of our financial results that would not be prevented or detected, and accordingly, we determined that these control deficiencies constitute a material weakness.
Remediation Plan
We have developed a detailed plan for remediation of the material weakness, as well as compliance with Section 404 of the Sarbanes-Oxley Act, including developing and maintaining appropriate IT general controls and process level controls. While we have performed certain remediation activities to strengthen our controls to address the identified material weakness, control weaknesses are not considered remediated until new internal controls have been operational for a period of time, are tested, and management concludes that these controls are operating effectively. We will continue to monitor the effectiveness of our remediation measures in connection with our future assessments of the effectiveness of internal control over financial reporting and disclosure controls and procedures, and we will make any changes to the design of our plan and take such other actions that we deem appropriate given the circumstances. We expect to complete the remediation process by the end of the fourth quarter of 2021.
119
Changes in Internal Control Over Financial Reporting
There was no change in our internal control over financial reporting (as defined in Rules 13a-15(f) and 15d-15(f) under the Exchange Act) that occurred during the fiscal year ended December 31, 2020 that has materially affected, or is reasonably likely to materially affect, our internal control over financial reporting. We are continuing to take steps to remediate the material weakness in our internal control over financial reporting, as discussed above.
Inherent Limitation on the Effectiveness of Internal Controls
Our management, including our Chief Executive Officer and Chief Financial Officer, does not expect that our disclosure controls and procedures or our internal controls will prevent all error and all fraud. A control system, no matter how well conceived and operated, can provide only reasonable, and not absolute, assurance that the objectives of the control system are met. Further, the design of a control system must reflect the fact that there are resource constraints, and the benefits of controls must be considered relative to their costs. Because of the inherent limitations in all control systems, no evaluation of controls can provide absolute assurance that all control issues and instances of fraud, if any, within our Company have been detected.
ITEM 9B. OTHER INFORMATION
None.
PART III
ITEM 10. DIRECTORS, EXECUTIVE OFFICERS AND CORPORATE GOVERNANCE
The information required by this item will be contained in our definitive proxy statement to be filed with the SEC in connection with our 2020 annual meeting of stockholders (the “Proxy Statement”), which is expected to be filed no later than 120 days after the end of our fiscal year ended December 31, 2020, and is incorporated in this report by reference.
ITEM 11. EXECUTIVE COMPENSATION
The information required by this item will be set forth in the Proxy Statement, which is expected to be filed no later than 120 days after the end of our fiscal year ended December 31, 2020, and is incorporated in this report by reference.
ITEM 12. SECURITY OWNERSHIP OF CERTAIN BENEFICIAL OWNERS AND MANAGEMENT AND RELATED STOCKHOLDER MATTERS
The information required by this item will be set forth in the Proxy Statement, which is expected to be filed no later than 120 days after the end of our fiscal year ended December 31, 2020, and is incorporated in this report by reference.
ITEM 13. CERTAIN RELATIONSHIPS AND RELATED TRANSACTIONS AND DIRECTOR INDEPENDENCE
The information required by this item will be set forth in the Proxy Statement, which is expected to be filed no later than 120 days after the end of our fiscal year ended December 31, 2020, and is incorporated in this report by reference.
ITEM 14. PRINCIPAL ACCOUNTING FEES AND SERVICES
The information required by this item will be set forth in the Proxy Statement, which is expected to be filed no later than 120 days after the end of our fiscal year ended December 31, 2020, and is incorporated in this report by reference.
PART IV
ITEM 15. EXHIBITS, FINANCIAL STATEMENT SCHEDULES
Documents filed as part of this Annual Report on Form 10-K are as follows:
1. | Consolidated Financial Statements | |||||||
Our Consolidated Financial Statements are listed in the “Index to Consolidated Financial Statements” under Part II, Item 8 of this Annual Report on Form 10-K.
2. | Financial Statement Schedules | |||||||
All required financial statement schedules are included in the Notes to the Consolidated Financial Statements under Part II, Item 8 of this Annual Report on Form 10-K.
120
3. | Exhibits | |||||||
The following documents are incorporated by reference or are filed with this Annual Report on Form 10-K, in each case as indicated therein.
Exhibit Index
| Exhibit No. | Description of Exhibit | ||||
| 3.1 | |||||
| 3.2 | |||||
| 4.1 | |||||
| 4.2 | |||||
| 10.1 | |||||
| 10.2 | |||||
| 10.3 | |||||
| 10.4* | |||||
| 10.5* | |||||
| 10.6* | |||||
| 10.7* | |||||
| 10.8* | |||||
| 10.9 | |||||
| 10.10* | |||||
| 10.11* | |||||
| 21.1 | |||||
| 23.1 | |||||
| 31.1 | |||||
| 31.2 | |||||
| 32.1+ | |||||
| 32.2+ | |||||
| 101.INS | Inline XBRL Instance Document: The XBRL Instance Document does not appear in the Interactive Data File because its XBRL tags are embedded within the Inline XBRL document. | ||||
| 101.SCH | Inline XBRL Taxonomy Extension Schema. | ||||
121
| Exhibit No. | Description of Exhibit | ||||
| 101.CAL | Inline XBRL Taxonomy Extension Calculation Linkbase. | ||||
| 101.DEF | Inline XBRL Taxonomy Extension Definition Linkbase. | ||||
| 101.LAB | Inline XBRL Taxonomy Extension Label Linkbase. | ||||
| 101.PRE | Inline XBRL Taxonomy Extension Presentation Linkbase. | ||||
| 104 | Cover Page Interactive Data File: the cover page XBRL tags are embedded within the Inline XBRL document and are contained within Exhibit 101. | ||||
*Indicates a management contract or compensatory plan or arrangement.
+ The certifications furnished in Exhibit 32.1 and Exhibit 32.2 hereto are deemed to accompany this Annual Report on Form 10-K and will not be deemed "filed" for purposes of Section 18 of the Securities Exchange Act of 1934, as amended, except to the extent that the registrant specifically incorporates it by reference.
ITEM 16. FORM 10-K SUMMARY
None.
122
SIGNATURES
Pursuant to the requirements of the Securities Act of 1933, the registrant has duly caused this Registration Statement to be signed on its behalf by the undersigned, thereunto duly authorized in the City of Norwalk, State of Connecticut, on March 11, 2021.
| Datto Holding Corp. | |||||||||||
| By: | /s/ Tim Weller | ||||||||||
| Name: Tim Weller | |||||||||||
| Title: Chief Executive Officer | |||||||||||
Pursuant to the requirements of the Securities Act of 1933, this Registration Statement has been signed by the following persons in the capacities and on the dates indicated.
| Signature | Title | Date | ||||||||||||
| /s/ Tim Weller | Chief Executive Officer and Director | March 11, 2021 | ||||||||||||
| Tim Weller | (Principal Executive Officer) | |||||||||||||
| /s/ John Abbot | Chief Financial Officer | March 11, 2021 | ||||||||||||
| John Abbot | (Principal Financial Officer) | |||||||||||||
| /s/ Bill Severance | Chief Accounting Officer | March 11, 2021 | ||||||||||||
| Bill Severance | (Principal Accounting Officer) | |||||||||||||
| /s/ David Breach | Director | March 11, 2021 | ||||||||||||
| David Breach | ||||||||||||||
| /s/ Marc Brown | Director | March 11, 2021 | ||||||||||||
| Marc Brown | ||||||||||||||
| /s/ Adrian Dillon | Director | March 11, 2021 | ||||||||||||
| Adrian Dillon | ||||||||||||||
| /s/ Christina Lema | Director | March 11, 2021 | ||||||||||||
| Christina Lema | ||||||||||||||
| /s/ Austin McChord | Director | March 11, 2021 | ||||||||||||
| Austin McChord | ||||||||||||||
| /s/ Maneet S. Saroya | Director | March 11, 2021 | ||||||||||||
| Maneet S. Saroya | ||||||||||||||
| /s/ John Stadler | Director | March 11, 2021 | ||||||||||||
| John Stalder | ||||||||||||||
| /s/ Nadeem Syed | Director | March 11, 2021 | ||||||||||||
| Nadeem Syed | ||||||||||||||
123
Serious News for Serious Traders! Try StreetInsider.com Premium Free!
You May Also Be Interested In
- Pre-Investor Call Presentation available to shareholders
- MYTILINEOS ENERGY & METALS: FIRST QUARTER 2024 TRADING UPDATE
- GWM Unites Worldwide Partners and Media for Exclusive Test Drive Event, Showcasing Cutting-Edge Products
Create E-mail Alert Related Categories
SEC FilingsSign up for StreetInsider Free!
Receive full access to all new and archived articles, unlimited portfolio tracking, e-mail alerts, custom newswires and RSS feeds - and more!
