

Form 10-K Community Bankers Trust For: Dec 31
 Tweet
Tweet Share
ShareUNITED STATES
SECURITIES AND EXCHANGE COMMISSION
Washington, D.C. 20549
FORM
ANNUAL REPORT PURSUANT TO SECTION 13 OR 15(d) OF THE SECURITIES EXCHANGE ACT OF 1934 |
For the fiscal year ended
or
TRANSITION REPORT PURSUANT TO SECTION 13 OR 15(d) OF THE SECURITIES EXCHANGE ACT OF 1934 |
For the transition period from to
Commission file number
(Exact name of registrant as specified in its charter)
| ||
(State or other jurisdiction of incorporation or organization) |
| (I.R.S. Employer Identification No.) |
| ||
(Address of principal executive offices) |
| (Zip Code) |
Registrant’s telephone number, including area code (
Securities registered pursuant to Section 12(b) of the Act:
Title of each class: |
| Trading Symbol |
| Name of each exchange on which registered: |
The |
Securities registered pursuant to Section 12(g) of the Act: None
Indicate by check mark if the registrant is a well-known seasoned issuer, as defined in Rule 405 of the Securities Act. Yes ◻
Indicate by check mark if the registrant is not required to file reports pursuant to Section 13 or Section 15(d) of the Act. Yes ◻
Indicate by check mark whether the registrant (1) has filed all reports required to be filed by Section 13 or 15(d) of the Securities Exchange Act of 1934 during the preceding 12 months (or for such shorter period that the registrant was required to file such reports), and (2) has been subject to such filing requirements for the past 90 days.
Indicate by check mark whether the registrant has submitted electronically every Interactive Data File required to be submitted pursuant to Rule 405 of Regulation S-T during the preceding 12 months (or for such shorter period that the registrant was required to submit such files).
Indicate by check mark whether the registrant is a large accelerated filer, an accelerated filer, a non-accelerated filer, or a smaller reporting company, or an emerging growth company. See the definitions of “large accelerated filer,” “accelerated filer,” “smaller reporting company,” and “emerging growth company” in Rule 12b-2 of the Exchange Act.
Large accelerated filer ◻ |
| Accelerated filer ☐ |
| |||
|
| Smaller reporting company |
| |||
Emerging growth company |
If an emerging growth company, indicate by check mark if the registrant has elected not to use the extended transition period for complying with any new or revised financial accounting standards provided pursuant to Section 13(a) of the Exchange Act. ◻
Indicate by check mark whether the registrant has filed a report on and attestation to its management’s assessment of the effectiveness of its internal control over financial reporting under Section 404(b) of the Sarbanes-Oxley Act (15 U.S.C. 7262(b)) by the registered public accounting firm that prepared or issued its audit report.
Indicate by check mark whether the registrant is a shell company (as defined in Rule 12b-2 of the Act). Yes
State the aggregate market value of the voting and non-voting common equity held by non-affiliates computed by reference to the price at which the common equity was last sold, or the average bid and asked price of such common equity, as of the last business day of the registrant’s most recently completed second fiscal quarter. $
On February 28, 2021, there were
DOCUMENTS INCORPORATED BY REFERENCE
Portions of the registrant’s definitive Proxy Statement to be used in conjunction with the registrant’s
2021 Annual Meeting of Shareholders are incorporated into Part III of this Form 10-K.
TABLE OF CONTENTS
FORM 10-K
December 31, 2020
2
PART I
ITEM 1.BUSINESS
GENERAL
The Company is the holding company for Essex Bank (the “Bank”), a Virginia state bank with 24 full-service offices in Virginia and Maryland. The Bank also operates two loan production offices in Virginia.
The Bank was established in 1926. The Bank engages in a general commercial banking business and provides a wide range of financial services primarily to individuals, small businesses and larger commercial companies, including individual and commercial demand and time deposit accounts, commercial and industrial loans, consumer and small business loans, real estate and mortgage loans, investment services, on-line and mobile banking products, and cash management services.
Essex Services, Inc. is a wholly-owned subsidiary of the Bank. Essex Services and its financial consultants offer a broad range of investment products and alternatives through an affiliation with Infinex Investments, Inc., an independent broker-dealer. It also offers insurance products through the Bank’s ownership interest in Bankers Insurance, LLC, an independent insurance agency.
The Company’s common stock trades on the NASDAQ Capital Market under the symbol “ESXB”.
STRATEGY
The Company operates in many of the strongest growth markets in Virginia and Maryland. Its operating strategy has been to provide the products and services of the larger financial institutions, but delivered with the individual service focus of a community oriented bank. This strategy has allowed the Company to have organic growth in its core markets.
The Company’s markets are geographically diverse enough to spread economic risk throughout a number of different customer bases. Operating under the individual community delivery philosophy, the Company seeks to enhance customer relationships through superior products delivered with extraordinary service, while maintaining a prudent approach to credit quality and risk controls. The Company’s associates are the most important element in its strategy for success, and therefore there is significant focus on training and building a team-oriented environment. While the COVID-19 pandemic has created numerous changes in banking, the Company believes that an important aspect that sets the Company apart from other organizations is the ability and desire to give superior personal service to customers no matter what the delivery platform.
The Company believes that, as change in delivery methods and customer contact points has accelerated, the core values that the Company wants to deliver to associates, customers and shareholders is still extremely important to its ongoing success. The Company’s mission statement is “To provide financial inspiration through intriguingly unique experiences that educate and empower action”. What makes the Company intriguingly unique is the consistent delivery of core values to the customers and the communities of which it is a part. The Company believes that this strategy not only gives a competitive advantage over larger banks, but also over web-based financial technology companies.
Building a strong and cohesive culture for the Company is a primary objective of management. The Company’s strategic focus has transformed as it has expanded the various delivery channels through enhanced technology. The Company still offers individual service through its branch offices and customer service center, as well as digital banking through our web based and mobile applications. The Company is constantly upgrading its digital platform to augment the personal service delivery channels. This strategy has resulted in expanded market presence, earnings growth and increased value for shareholders. Additionally, the Company has been focused on controlling risks and allowing growth in a safe and sound manner. The Company continues to balance capital strength and growth capacities with strategies to utilize excess capital that will create more value for shareholders. Among these strategies are common share dividends and stock repurchase programs.
3
OPERATIONS
The Company’s operating strategy is delineated by business lines and by the functional support areas that help accomplish the stated goals and financial budget of the organization. A major component of future income is growth in three core business lines – retail and business banking, commercial and industrial banking and real estate lending. These core businesses, combined with the Company’s digital banking delivery, dictate the market position that the Company needs to take to be successful. Consistent and responsible growth in all these lines and delivery channels is the key to success.
Retail and Business Banking
The Company markets to consumers in geographic areas around its branch network not only through existing bricks and mortar, but also with alternative delivery mechanisms and new product development such as online banking, remote deposit capture, mobile banking and telephonic banking. In addition, the Company attracts new customers by making its service through these distribution points convenient. All of the Company’s existing markets are prime targets for expanding the consumer side of its business with full loan, deposit, investment and insurance relationships. The Company constantly looks for ways to efficiently gain profitable market share.
Commercial and Industrial Banking
In the commercial and industrial banking group, the Company focuses on small to mid-sized business customers (sales of $5 million to $15 million each year) who are not targeted by larger banks and for whom smaller community banks have limited expertise. The Company has an experienced team with a strong loan pipeline. The typical relationship consists of working capital lines and equipment loans with the primary deposit accounts of the customer. Many of these relationships will be new to the Company and create strong and positive growth potential.
Commercial Real Estate Lending
The Company has historically held a significant concentration in real estate loans. The current strategy is to manage the existing real estate portfolio and add income producing property loans and builders and other development loans to the portfolio. The Company originates both owner occupied and non-owner occupied borrowings where the cash flows provide significant debt coverage for the relationship.
Paycheck Protection Program (PPP) and Other Pandemic Relief
During the COVID-19 pandemic and in response to such government legislation and regulations as Coronavirus Aid, Relief, and Economic Security Act (the “CARES Act”), the Company has participated in the Paycheck Protection Program and in certain forms of approved payment relief to its borrowers. Any actions taken were well vetted within applicable regulations and responsibly managed to ensure the safety of the Bank while helping the businesses and communities that the Company serves.
The Company continues to adapt to the changing business environment and is committed to providing necessary support to its customers and employees to meet the challenges of these uncertain times.
COMPETITION
Within its market areas in Virginia and Maryland, the Company operates in a highly competitive environment, competing for deposits and loans with commercial corporations, savings banks and other financial institutions, including non-bank competitors such as financial technology companies, many of which possess substantially greater financial resources than those available to the Company. Many of these institutions have significantly higher lending limits than the Company. In addition, there can be no assurance that other financial institutions, with substantially greater resources than the Company, will not establish operations in its service area. The financial services industry remains highly competitive and is constantly evolving.
4
The activities in which the Company engages are highly competitive. Financial institutions such as credit unions, consumer finance companies, financial technology companies, insurance companies, brokerage companies and other financial institutions with varying degrees of regulatory restrictions compete vigorously for a share of the financial services market. Brokerage and insurance companies continue to become more competitive in the financial services arena and pose an ever increasing challenge to banks. Legislative changes also greatly affect the level of competition that the Company faces. Federal legislation allows credit unions to use their expanded membership capabilities, combined with tax-free status, to compete more fiercely for traditional bank business. The tax-free status granted to credit unions provides them a significant competitive advantage. Many of the largest banks operating in Virginia and Maryland, including some of the largest banks in the country, have offices in the Company’s market areas. Many of these institutions have capital resources, broader geographic markets, and legal lending limits substantially in excess of those available to the Company. The Company faces competition from institutions that offer products and services that it does not or cannot currently offer. Some institutions with which the Company competes offer interest rate levels on loan and deposit products that the Company is unwilling to offer due to interest rate risk and overall profitability concerns. The Company expects the level of competition to increase.
Factors such as rates offered on loan and deposit products, types of products offered, and the number and location of branch offices, as well as the reputation of institutions in the market, affect competition for loans and deposits. The Company emphasizes customer service, establishing long-term relationships with its customers, thereby creating customer loyalty, and providing adequate product lines for individuals and small to medium-sized business customers.
No material part of the Company’s business is dependent upon a single or a few customers, and the loss of any single customer would not have a materially adverse effect upon the Company’s business.
EMPLOYEES
As of December 31, 2020, the Company had 246 full-time equivalent employees, including executive officers, loan and other banking officers, branch personnel, operations personnel and other support personnel. None of the Company’s employees is represented by a union or covered under a collective bargaining agreement. Management of the Company considers its employee relations to be excellent.
AVAILABLE INFORMATION
The Company’s corporate headquarters are located at 9954 Mayland Drive, Suite 2100, Richmond, Virginia 23233. The telephone number of the corporate headquarters is (804) 934-9999. The Company’s website is www.cbtrustcorp.com, and the Bank’s website is www.essexbank.com.
The Company files with or furnishes to the Securities and Exchange Commission annual, quarterly and current reports, proxy statements, and various other documents under the Securities Exchange Act of 1934, as amended (the “Exchange Act”). The Company makes available free of charge on or through our internet website (www.cbtrustcorp.com) its annual report on Form 10-K, quarterly reports on Form 10-Q, current reports on Form 8-K and, if applicable, amendments to those reports as filed or furnished pursuant to Section 13(a) of the Exchange Act as soon as reasonably practicable after the Company electronically files such materials with, or furnishes them to, the SEC.
SUPERVISION AND REGULATION
General
Bank holding companies, banks and their affiliates are extensively regulated under both federal and state law. The following summary discusses certain provisions of federal and state laws and certain regulations and the potential impact of such provisions on the Company and the Bank. These federal and state laws and regulations have been enacted generally for the protection of depositors in banks and not for the protection of shareholders of bank holding companies or banks. This summary is not complete, and we refer you to the particular statutory or regulatory provisions or proposals for more information
5
The Company
As a bank holding company, we are subject to the Bank Holding Company Act of 1956, as amended (the “BHCA”), and regulation and supervision by the Board of Governors of the Federal Reserve System (the “Federal Reserve”). Under the BHCA, the Federal Reserve has the power to order any bank holding company or its subsidiaries to terminate any activity or to terminate its ownership or control of any subsidiary when the Federal Reserve has reasonable grounds to believe that continuation of such activity or ownership constitutes a serious risk to the financial soundness, safety or stability of any bank subsidiary of the bank holding company. The Federal Reserve and the Federal Deposit Insurance Corporation (the “FDIC”) have adopted guidelines and released interpretative materials that establish operational and managerial standards to promote the safe and sound operation of banks and bank holding companies. These standards relate to the institution’s key operating functions, including but not limited to capital management, internal controls, internal audit systems, information systems, data and cybersecurity, loan documentation, credit underwriting, interest rate exposure and risk management, vendor management, executive management and its compensation, corporate governance, asset growth, asset quality, earnings, liquidity and risk management.
The BHCA generally limits the activities of a bank holding company and its subsidiaries to that of banking, managing or controlling banks, or any other activity that is so closely related to banking or to managing or controlling banks as to be a proper incident to it. While federal law permits bank holding companies from any state to acquire banks and bank holding companies located in any other state, or to establish interstate de novo branches, the Federal Reserve has jurisdiction under the BHCA to approve any bank or non-bank acquisition, merger or consolidation, or the establishment of any interstate de novo branches, proposed by a bank holding company.
There are a number of obligations and restrictions imposed on bank holding companies and their depository institution subsidiaries by federal law and regulatory policy that are designed to reduce potential loss exposure to the depositor of such depository institutions and to the FDIC’s Deposit Insurance Fund (the “DIF”) in the event the depository institution becomes in danger of default or in default. For example, under a policy of the Federal Reserve with respect to bank holding company operations, a bank holding company is required to serve as a source of financial strength to its subsidiary depository institutions and to commit resources to support such institutions in circumstances where it might not do so otherwise.
The Federal Deposit Insurance Act (the “FDIA”) also provides that amounts received from the liquidation or other resolution of any insured depository institution by any receiver must be distributed (after payment of secured claims) to pay the deposit liabilities of the institution prior to payment of any other general or unsecured senior liability, subordinated liability, general creditor or shareholders in the event that a receiver is appointed to distribute the assets of the Bank.
The Company is also subject to regulation and supervision by the Bureau of Financial Institutions of the Virginia State Corporation Commission (the “Bureau”) under the financial institution holding company laws of Virginia.
The Bank
The Bank is subject to supervision, regulation and examination by the Bureau and its primary federal regulator, the Federal Reserve. The various laws and regulations issued and administered by the regulatory agencies affect corporate practices, such as the payment of dividends, the incurrence of debt and the acquisition of financial institutions and other companies, and affect business practices and operations, such as the payment of interest on deposits, the charging of interest on loans, the types of business conducted, the products and terms offered to customers and the location of offices. Prior approval of the applicable primary federal regulator and the Bureau is required for a Virginia chartered bank or bank holding company to merge with another bank or bank holding company, to purchase the assets or assume the deposits of another bank or bank holding company, or to acquire control of another bank or bank holding company.
6
The Dodd-Frank Act and the EGRRCPA
The Dodd-Frank Wall Street Reform and Consumer Protection Act of 2010 (the “Dodd-Frank Act”) has significantly restructured the financial regulatory regime in the United States and has had a broad impact on the financial services industry.
The Dodd-Frank Act implemented far-reaching changes across the financial regulatory landscape, including changes that have significantly affected the business of all bank holding companies and banks, including the Company and the Bank. Some of the rules that have been proposed and, in some cases, adopted to comply with the Dodd-Frank Act's mandates are discussed further below. In 2018, the Economic Growth, Regulatory Relief and Consumer Protection Act (the “EGRRCPA”) was enacted to reduce the regulatory burden on certain banking organizations, including community banks, by modifying or eliminating certain federal regulatory requirements. While the EGRRCPA maintains most of the regulatory structure established by the Dodd-Frank Act, it amends certain aspects of the regulatory framework for small depository institutions with assets of less than $10 billion as well as for larger banks with assets above $50 billion. In addition, the EGRRCPA included regulatory relief for community banks regarding regulatory examination cycles, call reports, application of the Volcker Rule (proprietary trading prohibitions), mortgage disclosures, qualified mortgages, and risk weights for certain high-risk commercial real estate loans. However, federal banking agencies retain broad discretion to impose additional regulatory requirements on banking organizations based on safety and soundness and U.S. financial system stability considerations.
The Company continues to experience ongoing regulatory reform. These regulatory changes could have a significant effect on how the Company conducts its business. The specific implications of the Dodd-Frank Act, the EGRRCPA, and other potential regulatory reforms cannot yet be fully predicted and will depend to a large extent on the specific regulations that are to be adopted in the future. Certain aspects of the Dodd-Frank Act and the EGRRCPA are discussed in more detail below.
Capital Requirements
Regulatory Capital Requirements. All financial institutions are required to maintain minimum levels of regulatory capital. The Federal Reserve establishes risk-based and leveraged capital standards for the financial institutions they regulate. The Federal Reserve also may impose capital requirements in excess of these standards on a case-by-case basis for various reasons, including financial condition or actual or anticipated growth.
Basel III Capital Framework. The Federal Reserve and the FDIC have adopted rules to implement the Basel III capital framework as outlined by the Basel Committee on Banking Supervision and standards for calculating risk-weighted assets and risk-based capital measurements (collectively, the “Basel III Final Rules”) that apply to banking institutions they supervise. For the purposes of these capital rules, (i) common equity tier 1 capital (“CET1”) consists principally of common stock (including surplus) and retained earnings; (ii) Tier 1 capital consists principally of CET1 plus non-cumulative preferred stock and related surplus, and certain grandfathered cumulative preferred stocks and trust preferred securities; and (iii) Tier 2 capital consists of other capital instruments, principally qualifying subordinated debt and preferred stock, and limited amounts of an institution’s allowance for loan losses. Each regulatory capital classification is subject to certain adjustments and limitations, as implemented by the Basel III Final Rules. The Basel III Final Rules also establish risk weightings that are applied to many classes of assets held by community banks, importantly including applying higher risk weightings to certain commercial real estate loans.
The Basel III Final Rules and minimum capital ratios required to be maintained by banks were effective January 1, 2015. The Basel III Final Rules also include a requirement that banks maintain additional capital (the “capital conservation buffer”), which was phased in beginning January 1, 2016 and was fully phased in effective January 1, 2019. The Basel III Final Rules and fully phased in capital conservation buffer require banks to maintain (i) a minimum ratio of CET1 to risk-weighted assets of at least 4.5 percent, plus a 2.5 percent capital conservation buffer (which is added to the minimum CET1 ratio, effectively resulting in a required ratio of CET1 to risk-weighted assets of at least 7 percent), (ii) a minimum ratio of Tier 1 capital to risk-weighted assets of at least 6.0 percent, plus the capital conservation buffer (effectively resulting in a required Tier 1 capital ratio of 8.5 percent), (iii) a minimum ratio of total
7
(that is, Tier 1 plus Tier 2) capital to risk-weighted assets of at least 8.0 percent, plus the capital conservation buffer (effectively resulting in a required total capital ratio of 10.5 percent) and (iv) a minimum leverage ratio of 4 percent, calculated as the ratio of Tier 1 capital to average total assets, subject to certain adjustments and limitations.
The Basel III Final Rules provide deductions from and adjustments to regulatory capital measures, primarily to CET1, including deductions and adjustments that were not applied to reduce CET1 under historical regulatory capital rules. For example, mortgage servicing rights, deferred tax assets dependent upon future taxable income, and significant investments in non-consolidated financial entities must be deducted from CET1 to the extent that any one such category exceeds 10 percent of CET1 or all such categories in the aggregate exceed 15 percent of CET1.
The Basel III Final Rules permanently include in Tier 1 capital trust preferred securities issued prior to May 19, 2010 by bank holding companies with less than $15 billion in total assets, subject to a limit of 25 percent of Tier 1 capital. The Corporation expects that its trust preferred securities will be included in the Corporation’s regulatory capital as Tier 1 capital instruments until their maturity.
As of December 31, 2020, the Bank met all capital adequacy requirements under the Basel III Final Rules, including the capital conservation buffer on a fully phased-in basis.
Community Bank Leverage Ratio. As a result of the EGRRCPA, the federal banking agencies were required to develop a Community Bank Leverage Ratio (the ratio of a bank’s tangible equity capital to average total consolidated assets) for banking organizations with assets of less than $10 billion, such as the Bank. In 2019, the federal banking agencies issued a final rule that implements the Community Bank Leverage Ratio Framework (the “CBLRF”). To qualify for the CBLRF, a bank must have less than $10 billion in total consolidated assets, limited amounts of off-balance sheet exposures and trading assets and liabilities, and a leverage ratio greater than 9 percent. A bank that elects the CBLRF and has a leverage ratio greater than 9 percent will be considered to be in compliance with Basel III capital requirements and exempt from the complex Basel III calculations and will also be deemed “well capitalized” under Prompt Corrective Action regulations, discussed below. A bank that falls out of compliance with the CBLRF will have a two-quarter grace period to come back into full compliance, provided its leverage ratio remains above 8 percent (a bank will be deemed “well capitalized” during the grace period). The CBLRF was available for banking organizations to use as of March 31, 2020 (with the flexibility for banking organizations to subsequently opt into or out of the CBLRF, as applicable).
The CARES Act directed federal banking agencies to adopt interim final rules to lower the threshold under the CBLRF from 9% to 8% and to provide a reasonable grace period for a community bank that falls below the threshold to regain compliance, in each case until the earlier of the termination date of the national emergency or December 31, 2020. In April 2020, the federal bank regulatory agencies issued two interim final rules implementing this directive. See “—Legislation and Regulation Related to the Coronavirus Pandemic” below.
Small Bank Holding Company. The EGRRCPA also expanded the category of bank holding companies that may rely on the Federal Reserve’s Small Bank Holding Company Policy Statement by raising the maximum amount of assets a qualifying bank holding company may have from $1 billion to $3 billion. In addition to meeting the asset threshold, a bank holding company must not engage in significant nonbanking activities, not conduct significant off-balance sheet activities, and not have a material amount of debt or equity securities outstanding and registered with the SEC (subject to certain exceptions). The Federal Reserve may, in its discretion, exclude any bank holding company from the application of the Small Bank Holding Company Policy Statement if such action is warranted for supervisory purposes.
In 2018, the Federal Reserve issued an interim final rule to apply the Small Bank Holding Company Policy Statement to bank holding companies with consolidated total assets of less than $3 billion. The policy statement, which, among other things, exempts certain bank holding companies from minimum consolidated regulatory capital ratios that apply to other bank holding companies. As a result of the interim final rule, the Company expects that it will be treated as a small bank holding company and will not be subject to regulatory capital requirements. The comment period on the interim final rule closed in 2018 and, to date, the Federal Reserve has not issued a final rule to replace the interim final rule. The Bank remains subject to the regulatory capital requirements described above.
8
Dividends
The Company is a legal entity that is separate and distinct from the Bank. The Company’s ability to distribute cash dividends will depend primarily on the ability of its banking subsidiary to pay dividends to it. The Bank is subject to legal limitations on the amount of dividends that it is permitted to pay under Section 5199(b) of the Revised Statues (12 U.S.C. 60), and the approval of the Federal Reserve would be required if the total of all dividends declared by a state member bank in any calendar year shall exceed the total of its net profits of that year combined with its retained net profits of the preceding two years. Additionally, the Bank is further restricted by Regulation H, Section 208.5, Dividends and Other Distributions, which requires pre-approval of dividends that exceed undivided profits. Furthermore, neither the Company nor the Bank may declare or pay a cash dividend on any of its capital stock if it is insolvent or if the payment of the dividend would render the entity insolvent or unable to pay its obligations as they become due in the ordinary course of business.
Bank regulatory agencies have the authority to prohibit the Bank or the Company from engaging in an unsafe or unsound practice in conducting its respective business. The payment of dividends, depending on the financial condition of the Bank, or the Company, could be deemed to constitute such an unsafe or unsound practice.
Under the FDIA, insured depository institutions such as the Bank, are prohibited from making capital distributions, including the payment of dividends, if, after making such distributions, the institution would become “undercapitalized” (as such term is used in the statute). Based on the Bank’s current financial condition, the Company does not expect that this provision will have any impact on its ability to receive dividends from the Bank.
Deposit Insurance
The Bank’s deposits are insured by the DIF of the FDIC up to the standard maximum insurance amount for each deposit insurance ownership category. The basic limit on FDIC deposit insurance coverage is $250,000 per depositor. Under the FDIA, the FDIC may terminate deposit insurance upon a finding that the institution has engaged in unsafe and unsound practices, is in an unsafe or unsound condition to continue operations as an insured institution, or has violated any applicable law, regulation, rule, order or condition imposed by the FDIC, subject to administrative and potential judicial hearing and review processes. The FDIC may also suspend deposit insurance temporarily during the hearing process for the permanent termination of insurance if the institution has no tangible capital. If deposit insurance is terminated, the deposits at the institution at the time of termination, less subsequent withdrawals, shall continue to be insured for a period from six months to two years, as determined by the FDIC. Management is aware of no existing circumstances that could result in termination of the Bank’s deposit insurance.
The DIF is funded by assessments on banks and other depository institutions calculated based on average consolidated total assets minus average tangible equity (defined as Tier 1 capital). As required by the Dodd-Frank Act, the FDIC has adopted a large-bank pricing assessment scheme, set a target “designated reserve ratio” (described in more detail below) of 2 percent for the DIF and, in lieu of dividends, provides for a lower assessment rate schedule when the reserve ratio reaches 2 percent and 2.5 percent. An institution's assessment rate is based on a statistical analysis of financial ratios that estimates the likelihood of failure over a three-year period, which considers the institution’s weighted average CAMELS component rating, and is subject to further adjustments including those related to levels of unsecured debt and brokered deposits (not applicable to banks with less than $10 billion in assets). At December 31, 2020, total base assessment rates for institutions that have been insured for at least five years range from 1.5 to 30 basis points applying to banks with less than $10 billion in assets.
The Dodd-Frank Act transferred to the FDIC increased discretion with regard to managing the required amount of reserves for the DIF, or the “designated reserve ratio.” The FDIA requires that the FDIC consider the appropriate level for the designated reserve ratio on at least an annual basis. As of December 31, 2020, the designated reserve ratio was 2.00 percent and the minimum designated reserve ratio was 1.35 percent.
Banks with less than $10 billion in total consolidated assets are eligible for credits to offset the portion of their assessments that helped to raise the reserve ratio to 1.35 percent. The FDIC automatically applies these credits to reduce
9
an eligible bank’s regular DIF assessment up to the entire amount of the assessment. The Bank was awarded credits of $365,000, of which $207,000 was used to offset its DIF assessment in the third and fourth quarters of 2019. The Company used the remainder of the credits to offset the Bank’s DIF assessment during 2020.
In June 2020, the FDIC adopted a final rule that generally removes the effect of PPP lending when calculating a bank’s deposit insurance assessment by providing an offset to the bank’s total assessment amount for the increase in the assessment base attributable to the bank’s participation in the PPP. This final rule began applying to FDIC deposit insurance assessments during the second quarter of 2020.
Consumer Laws and Regulations
The Bank is subject to certain consumer laws and regulations that are designed to protect consumers in transactions with banks. While the list set forth herein is not exhaustive, these laws and regulations include the Truth-in-Lending Act, the Truth-in-Savings Act, the Electronic Funds Transfer Act, the Expedited Funds Availability Act, the Equal Credit Opportunity Act, the Fair Credit Reporting Act, the Fair Housing Act, and regulations issued under such acts, among others. These laws and regulations mandate certain disclosure requirements and regulate the manner in which financial institutions must deal with customers when taking deposits, making loans to or engaging in other types of transactions with such customers.
The Dodd-Frank Act centralized responsibility for consumer financial protection by creating the Consumer Financial Protection Bureau (the “CFPB”), and giving it responsibility for implementing, examining, and enforcing compliance with federal consumer protection laws. The CFPB focuses on (i) risks to consumers and compliance with the federal consumer financial laws, (ii) the markets in which firms operate and risks to consumers posed by activities in those markets, (iii) depository institutions that offer a wide variety of consumer financial products and services, and (iv) non-depository companies that offer one or more consumer financial products or services.
The CFPB has broad rulemaking authority for a wide range of consumer financial laws that apply to all banks, including, among other things, the authority to prohibit “unfair, deceptive or abusive” acts and practices. The CFPB can issue cease-and-desist orders against banks and other entities that violate consumer financial laws. The CFPB may also institute a civil action against an entity in violation of federal consumer financial law in order to impose a civil penalty or injunction.
Community Reinvestment Act
The Bank is subject to the provisions of the Community Reinvestment Act (the “CRA”), which imposes a continuing and affirmative obligation, consistent with their safe and sound operation, to help meet the credit needs of entire communities where the bank accepts deposits, including low- and moderate-income neighborhoods. The Federal Reserve’s assessment of the Bank’s CRA record is made available to the public. Further, a less than satisfactory CRA rating will slow, if not preclude, expansion of banking activities and prevent a company from becoming or remaining a financial holding company. Federal CRA regulations require, among other things, that evidence of discrimination against applicants on a prohibited basis, and illegal or abusive lending practices be considered in the CRA evaluation. The Bank has a rating of “Satisfactory” in its most recent CRA evaluation.
Cybersecurity
The federal banking agencies have adopted guidelines for establishing information security standards and cybersecurity programs for implementing safeguards under the supervision of a financial institution’s board of directors. These guidelines, along with related regulatory materials, increasingly focus on risk management and processes related to information technology and the use of third parties in the provision of financial products and services. The federal banking agencies expect financial institutions to establish lines of defense and ensure that their risk management processes also address the risk posed by compromised customer credentials, and also expect financial institutions to maintain sufficient business continuity planning processes to ensure rapid recovery, resumption and maintenance of the institution’s operations after a cyber-attack. If the Company or the Bank fails to meet the expectations set forth in this regulatory guidance, the Company or the Bank could be subject to various regulatory actions and any remediation efforts
10
may require significant resources of the Company or the Bank. In addition, all federal and state bank regulatory agencies continue to increase focus on cybersecurity programs and risks as part of regular supervisory exams.
In 2016, the federal banking agencies issued proposed rules on enhanced cybersecurity risk-management and resilience standards that would apply to very large financial institutions and to services provided by third parties to these institutions. The comment period for these proposed rules has closed and a final rule has not been published. Although the proposed rules would apply only to bank holding companies and banks with $50 billion or more in total consolidated assets, these rules could influence the federal banking agencies’ expectations and supervisory requirements for information security standards and cybersecurity programs of smaller financial institutions, such as the Company and the Bank.
Anti-Money Laundering Legislation
The Company is subject to the Bank Secrecy Act and other anti-money laundering laws and regulations, including the USA Patriot Act of 2001. Among other things, these laws and regulations require the Company to take steps to prevent the use of the Company for facilitating the flow of illegal or illicit money, to report large currency transactions, and to file suspicious activity reports. The Company is also required to carry out a comprehensive anti-money laundering compliance program. Violations can result in substantial civil and criminal sanctions. In addition, provisions of the USA Patriot Act require the federal bank regulatory agencies to consider the effectiveness of a financial institution’s anti-money laundering activities when reviewing bank mergers and bank holding company acquisitions.
Incentive Compensation
The federal banking agencies have issued regulatory guidance intended to ensure that the incentive compensation policies of banking organizations do not undermine the safety and soundness of such organizations by encouraging excessive risk-taking. The Federal Reserve will review, as part of the regular, risk-focused examination process, the incentive compensation arrangements of banking organizations, such as the Company, that are not “large, complex banking organizations.” The findings will be included in reports of examination, and deficiencies will be incorporated into the organization’s supervisory ratings. Enforcement actions may be taken against a banking organization if its incentive compensation arrangements, or related risk-management control or governance processes, pose a risk to the organization’s safety and soundness and the organization is not taking prompt and effective measures to correct the deficiencies.
In 2016, the SEC and the federal banking agencies proposed rules that prohibit covered financial institutions (including bank holding companies and banks) from establishing or maintaining incentive-based compensation arrangements that encourage inappropriate risk taking by providing covered persons (consisting of senior executive officers and significant risk takers, as defined in the rules) with excessive compensation, fees or benefits that could lead to material financial loss to the financial institution. The proposed rules outline factors to be considered when analyzing whether compensation is excessive and whether an incentive-based compensation arrangement encourages inappropriate risks that could lead to material loss to the covered financial institution, and establishes minimum requirements that incentive-based compensation arrangements must meet to be considered to not encourage inappropriate risks and to appropriately balance risk and reward. The proposed rules also impose additional corporate governance requirements on the boards of directors of covered financial institutions and impose additional record-keeping requirements. The comment period for these proposed rules has closed and a final rule has not yet been published.
Legislation and Regulation Related to the Coronavirus Pandemic
In response to the COVID-19 pandemic, federal government enacted the CARES Act on March 27, 2020. Among other things, the CARES Act included the following provisions impacting financial institutions:
Community Bank Leverage Ratio. The CARES Act directs federal banking agencies to adopt interim final rules to lower the threshold under the CBLR from 9% to 8% and to provide a reasonable grace period for a community bank that falls below the threshold to regain compliance, in each case until the earlier of the termination date of the national
11
emergency or December 31, 2020. In April 2020, the federal bank regulatory agencies issued two interim final rules implementing this directive. One interim final rule provides that, as of the second quarter 2020, banking organizations with leverage ratios of 8% or greater (and that meet the other existing qualifying criteria) may elect to use the CBLR framework. It also establishes a two-quarter grace period for qualifying community banking organizations whose leverage ratios fall below the 8% CBLR requirement, so long as the banking organization maintains a leverage ratio of 7% or greater. The second interim final rule provides a transition from the temporary 8% CBLR requirement to a 9% CBLR requirement. It establishes a minimum CBLR of 8% for the second through fourth quarters of 2020, 8.5% for 2021, and 9% thereafter, and maintains a two-quarter grace period for qualifying community banking organizations whose leverage ratios fall no more than 100 basis points below the applicable CBLR requirement.
Temporary Troubled Debt Restructurings (“TDRs”) Relief. The CARES Act allows banks to elect to suspend requirements under GAAP for loan modifications related to the COVID-19 pandemic (for loans that were not more than 30 days past due as of December 31, 2019) that would otherwise be categorized as a TDR, including impairment for accounting purposes, until the earlier of 60 days after the termination date of the national emergency or December 31, 2020. Federal banking agencies are required to defer to the determination of the banks making such suspension.
Small Business Administration Paycheck Protection Program. The CARES Act created the PPP as administered by the Small Business Administration (the “SBA”).. Under the PPP, $349 billion was authorized for small business loans to pay payroll and group health costs, salaries and commissions, mortgage and rent payments, utilities, and interest on other debt. The loans are provided through participating financial institutions, such as the Bank, that process loan applications and service the loans.
The federal government also enacted the Consolidated Appropriations Act, 2021, on December 27, 2020, which included (i) the Economic Aid to Hard-Hit Small Businesses, Non-profits, and Venues Act, (ii) the COVID-Related Tax Relief Act of 2020, and (iii) the Taxpayer Certainty and Disability Relief Act of 2020. These laws include significant clarifications and modifications to PPP, which had terminated on August 8, 2020. In particular, the federal government revived the PPP and allocated an additional $284.45 billion in PPP funds for 2021. As a result, the SBA has modified prior guidance and promulgated new regulations and guidance to conform with and implement the new provisions during the first quarter of 2021. As a participating PPP lender, the Bank continues to monitor legislative, regulatory, and supervisory developments related thereto.
Prompt Corrective Action
The federal banking agencies have broad powers under current federal law to take prompt corrective action to resolve problems of insured depository institutions. The extent of these powers depends upon whether the institution in question is “well capitalized,” “adequately capitalized,” “undercapitalized,” “significantly undercapitalized” or “critically undercapitalized.” These terms are defined under uniform regulations issued by each of the federal banking agencies regulating these institutions. An insured depository institution which is less than adequately capitalized must adopt an acceptable capital restoration plan, is subject to increased regulatory oversight and is increasingly restricted in the scope of its permissible activities. As of December 31, 2020, the Bank was considered “well capitalized.”
Governmental Policies
The Federal Reserve regulates money, credit and interest rates in order to influence general economic conditions. These policies influence overall growth and distribution of bank loans, investments and deposits. These policies also affect interest rates charged on loans or paid for time and savings deposits. Federal Reserve monetary policies have had a significant effect on the operating results of commercial banks in the past and are expected to continue to do so in the future.
12
Future Regulations
From time to time, various legislative and regulatory initiatives are introduced in Congress and state legislatures, as well as by regulatory agencies. Such initiatives may include proposals to expand or contract the powers of bank holding companies and depository institutions or proposals to substantially change the financial institution regulatory system. Such legislation could change banking statutes and the operating environment of the Company and the Bank in substantial and unpredictable ways. If enacted, such legislation could increase or decrease the cost of doing business, limit or expand permissible activities, or affect the competitive balance among banks, savings associations, credit unions, and other financial institutions. The Company cannot predict whether any such legislation will be enacted, and, if enacted, the effect that it, or any implementing regulations, would have on the financial condition or results of operations of the Company or the Bank.
ITEM 1A.RISK FACTORS
Our operations are subject to many risks that could adversely affect our future financial condition and performance and, therefore, the market value of our common stock. The risk factors applicable to us are the following:
Risks Related to the COVID-19 Pandemic
Our business, financial condition, liquidity, capital and results of operations have been, and will likely continue to be, adversely affected by the COVID-19 pandemic.
The coronavirus (COVID-19) pandemic, including measures that governmental authorities have taken to manage the public health effects of the pandemic, has created economic and financial disruptions that have adversely affected, and are likely to continue to adversely affect, our business, financial condition, liquidity, capital and results of operations. These measures, together with voluntary changes in consumer behavior, have led to a substantial decrease in economic activity and a dramatic increase in unemployment. We cannot predict at this time the extent to which COVID-19 will continue to negatively affect us. The extent of any continued or future adverse effects of COVID-19 will depend on future developments, which are highly uncertain and outside our control, including the scope and duration of the pandemic, the direct and indirect impact of the pandemic on our employees, customers and service providers, as well as other market participants, and additional actions taken by governmental authorities and other third parties in response to the pandemic.
We are prioritizing the safety of our customers and employees and have limited our branch activity to drive-through services or in-branch appointments. In addition, most of our employees are working remotely. If these measures are not effective in serving our customers or affect the productivity of our employees, they may lead to significant disruptions in our business operations.
Many of our third-party service providers have also been, and may further be, affected by the same factors that affect us and that, in turn, increase their own risks of business disruption or may otherwise affect their ability to perform under the terms of any agreements with us or provide essential services. As a result, our operational and other risks are generally expected to increase until the pandemic subsides.
We are offering varying levels of credit relief to borrowers who are experiencing financial hardships related to COVID-19, including interest only payment concessions and payment deferrals. In addition, we are a certified and qualified SBA lender and assisted our customers with their applications under the PPP. These assistance efforts may adversely affect our revenue and results of operations. These government programs are complex, and our participation may lead to governmental and regulatory scrutiny, negative publicity and damage to our reputation. In addition, if these assistance efforts are not effective in mitigating the effects of COVID-19 on borrowers, we may experience higher rates of default and increased credit losses in future periods.
Certain concentrations where we have credit exposure, including commercial and residential lessors, hotels, medical service providers and restaurants, have experienced significant operational challenges as a result of COVID-19.
13
These negative effects may cause our commercial customers to be unable to pay their loans as they come due or decrease the value of collateral, which we expect would cause significant increases in our credit losses.
Our earnings and cash flows are dependent to a large degree on net interest income. Net interest income is significantly affected by market rates of interest. Significant reductions to the federal funds rate have led to a decrease in the rates and yields on U.S. Treasury securities. If interest rates are reduced further in response to COVID-19, we expect that our net interest income will decline, perhaps significantly. The overall effect of lower interest rates cannot be predicted at this time and depends on future actions that the Federal Reserve may take to increase or reduce the targeted federal funds rate in response to COVID-19, and resulting economic conditions.
The effects of COVID-19 on economic and market conditions have increased demands on our liquidity as we meet our customers’ and clients’ needs. We suspended repurchases for a period of time under our stock repurchase program to preserve capital and liquidity in order to support our customers and employees and, although we have no current plans to reduce or suspend our common stock dividend, we will continue to exercise prudent capital management and monitor the business environment.
Governmental authorities have taken unprecedented measures to stabilize the markets and support economic growth. The success of these measures is unknown and they may not be sufficient to address the negative effects of COVID-19 or avert severe and prolonged reductions in economic activity.
Other negative effects of the COVID-19 pandemic that may impact our business, financial condition, liquidity, capital and results of operations cannot be predicted at this time, but it is likely that we will continue to be adversely affected until the pandemic subsides and the economy begins to recover. Further, COVID-19 may also have the effect of heightening many of the other risks described in this report. Even after the pandemic subsides, it is possible that our markets continue to experience a prolonged recession, which we expect would materially and adversely affect our business, financial condition, liquidity, capital and results of operations.
Risks Related to Our Business, Industry and Markets
Our future success is dependent on our ability to compete effectively in the highly competitive banking and financial services industry.
We face vigorous competition from other commercial banks, savings banks, credit unions, mortgage banking firms, consumer finance companies, financial technology companies, securities brokerage firms, insurance companies, money market funds and other types of financial institutions for deposits, loans and other financial services in our market area. A number of these banks and other financial institutions are significantly larger than we are and have substantially greater access to capital and other resources, as well as larger lending limits and branch systems, and offer a wider array of banking services. Many of our non-bank competitors are not subject to the same extensive regulations that govern us. As a result, these non-bank competitors have advantages over us in providing certain services.
While we believe we compete effectively with these other financial institutions in our primary markets, we may face a competitive disadvantage as a result of our smaller size, smaller asset base, lack of geographic diversification and inability to spread our marketing costs across a broader market. If we have to raise interest rates paid on deposits or lower interest rates charged on loans to compete effectively, our net interest margin and income could be negatively affected. Failure to compete effectively to attract new, or to retain existing, clients may reduce or limit our margins and our market share and may adversely affect our results of operations, financial condition, and growth.
We may be adversely affected by economic conditions in our market area.
We operate in a mixed market environment with influences from both rural and urban areas. Because our lending operation is concentrated in localized areas in Virginia and Maryland, we will be affected by the general economic conditions in these markets. Changes in the local economy may influence the growth rate of our loans and deposits, the quality of the loan portfolio, and loan and deposit pricing. A significant decline in general economic conditions caused by inflation, recession, unemployment, pandemic conditions, public health emergencies, or other
14
factors beyond our control would impact these local economic conditions and the demand for banking products and services generally, which could negatively affect our financial condition and performance. Although we might not have significant credit exposure to all the businesses in our areas, the downturn in any of these businesses could have a negative impact on local economic conditions and real estate collateral values generally, which could negatively affect our profitability.
Deterioration in the soundness of other financial institutions could adversely affect us.
Our ability to engage in routine funding transactions could be adversely affected by the actions and commercial soundness of other financial institutions. Financial services institutions are interrelated as a result of trading, clearing, counterparty or other relationships. We have exposure to many different industries and counterparties, and we routinely execute transactions with counterparties in the financial industry, including brokers and dealers, commercial banks and other institutional clients. As a result, defaults by, or even rumors or questions about, one or more financial services institutions, or the financial services industry generally, could create market-wide liquidity problems and could lead to losses or defaults by us or by other institutions. Our credit risk may also be exacerbated when the collateral held by us cannot be realized upon or is liquidated at prices not sufficient to recover the full amount of the financial instrument exposure due us. There is no assurance that any such losses would not materially and adversely affect our results of operations.
We may be adversely impacted by changes in the condition of financial markets.
We are directly and indirectly affected by changes in market conditions. Market risk generally represents the risk that values of assets and liabilities or revenues will be adversely affected by changes in market conditions. Market risk is inherent in the financial instruments associated with our operations and activities including loans, deposits, securities, short-term borrowings, long-term debt, trading account assets and liabilities, and derivatives. Just a few of the market conditions that may shift from time to time, thereby exposing us to market risk, include fluctuations in interest and currency exchange rates, equity and futures prices, and price deterioration or changes in value due to changes in market perception or actual credit quality of issuers. Accordingly, depending on the instruments or activities impacted, market risks can have adverse effects on our results of operations and our overall financial condition.
Risks Related to Our Lending Activities and Our Management of Other Assets
If our allowance for loan losses becomes inadequate, our results of operations may be adversely affected.
An essential element of our business is to make loans. We maintain an allowance for loan losses that we believe is a reasonable estimate of known and inherent losses in our loan portfolio. Through a periodic review and analysis of the loan portfolio, management determines the adequacy of the allowance for loan losses by considering such factors as general and industry-specific market conditions, credit quality of the loan portfolio, the collateral supporting the loans and financial performance of our loan customers relative to their financial obligations to us. The amount of future losses is impacted by changes in economic, operating and other conditions, including changes in interest rates, which may be beyond our control. Actual losses may exceed our current estimates. Rapidly growing loan portfolios are, by their nature, unseasoned. Estimating loan loss allowances for an unseasoned portfolio is more difficult than with seasoned portfolios, and may be more susceptible to changes in estimates and to losses exceeding estimates. Although we believe the allowance for loan losses is a reasonable estimate of known and inherent losses in our loan portfolio, we cannot fully predict such losses or assert that our loan loss allowance will be adequate in the future. Future loan losses that are greater than current estimates could have a material impact on our future financial performance.
Banking regulators periodically review our allowance for loan losses and may require us to increase our allowance for loan losses or recognize additional loan charge-offs, based on credit judgments different than those of our management. Any increase in the amount of our allowance or loans charged-off as required by these regulatory agencies could have a negative effect on our operating results.
In addition, the measure of our allowance for loan losses is dependent on the adoption and interpretation of accounting standards. In 2016, the Financial Accounting Standards Board (FASB) issued ASU No. 2016-13, “Financial
15
Instruments - Credit Losses (Topic 326): Measurement of Credit Losses on Financial Instruments,” Under this ASU, the current incurred loss credit impairment methodology will be replaced with the CECL model, a methodology that reflects expected credit losses and requires consideration of a broader range of reasonable and supportable information to inform credit loss estimates. While this ASU is not effective for us until the fiscal year beginning after December 15, 2022, we expect that the implementation of the CECL model will change our current method of setting an allowance and may result in material changes in our accounting for credit losses on financial instruments. The CECL model may create more volatility in our level of allowance for loan losses. If we are required to materially increase this level for any reason, such increase could adversely affect our business, financial condition, and results of operations.
Our concentration in loans secured by real estate may increase our future credit losses, which would negatively affect our financial results.
We offer a variety of secured loans, including commercial lines of credit, commercial term loans, real estate, construction, home equity, consumer and other loans. Credit risk and credit losses can increase if our loans are concentrated to borrowers who, as a group, may be uniquely or disproportionately affected by economic or market conditions. Approximately 80.37% of our loans are secured by real estate, both residential and commercial, substantially all of which are located in our market area. A major change in the region’s real estate market, resulting in a deterioration in real estate values, or in the local or national economy, including changes caused by raising interest rates, could adversely affect our customers’ ability to pay these loans, which in turn could adversely impact us. Risk of loan defaults and foreclosures are inherent in the banking industry, and we try to limit our exposure to this risk by carefully underwriting and monitoring our extensions of credit. We cannot fully eliminate credit risk, and as a result credit losses may occur in the future.
If our concentration in commercial real estate increases significantly, we may have to take certain actions that could impact our balance sheet.
Regulators have been paying close attention to banks with higher commercial real estate concentrations, due to concerns about credit risk building in the industry. Concentration levels of concern include commercial real estate loans making up at least 300% of a bank’s total risk-based capital, construction, land development and other land loans comprising 100% or more of total risk-based capital and construction and total commercial real estate growth of 50% or more over the prior 36 months. While we currently are below all of these levels, if we exceed one or more of them, we may have to take certain actions to minimize the risk associated with higher concentration levels and otherwise bolster our balance sheet. These actions include ensuring robust risk management practices, including conducting regular appraisals, analyzing borrowers’ ability to repay credits, evaluating local economic conditions and operating with enhanced reporting and systems. At an extreme, these actions can also include curtailing our lending in these areas and raising capital.
A substantial decline in the value of our securities portfolio may result in an “other-than-temporary” impairment charge.
The total amount of our available-for-sale securities portfolio was $271.3 million at December 31, 2020. The measurement of the fair value of these securities involves significant judgment due to the complexity of the factors contributing to the measurement. Market volatility makes measurement of the fair value of our securities portfolio even more difficult and subjective. More generally, as market conditions continue to be volatile, we cannot provide assurance with respect to the amount of future unrealized losses in the portfolio. To the extent that any portion of the unrealized losses in these portfolios is determined to be other than temporary, and the loss is related to credit factors, we would recognize a charge to our earnings in the quarter during which such determination is made, and our capital ratios could be adversely affected.
Nonperforming assets adversely affect our results of operations and financial condition.
Our nonperforming assets adversely affect our net income in various ways. We do not record interest income on non-accrual loans, thereby adversely affecting our income and increasing loan administration costs. When we receive collateral through foreclosures and similar proceedings, we are required to mark the related loan to the then fair market
16
value of the collateral less estimated selling costs, which may result in a loss. An increase in the level of nonperforming assets also increases our risk profile and may impact the capital levels our regulators believe is appropriate in light of such risks. We utilize various techniques such as loan sales, workouts and restructurings to manage our problem assets. Decreases in the value of these problem assets, the underlying collateral, or in the borrowers’ performance or financial condition, could adversely affect our business, results of operations and financial condition.
In addition, the resolution of nonperforming assets requires significant commitments of time from management and staff, which can be detrimental to performance of their other responsibilities. Such resolution may also require the assistance of third parties, and thus the expense associated with it. There can be no assurance that we will avoid further increases in nonperforming loans in the future.
We rely upon independent appraisals to determine the value of the real estate, which secures a significant portion of our loans, and the values indicated by such appraisals may not be realizable if we are forced to foreclose upon such loans.
A significant portion of our loan portfolio consists of loans secured by real estate (80.37% at December 31, 2020). We rely upon independent appraisers to estimate the value of such real estate. Appraisals are only estimates of value and the independent appraisers may make mistakes of fact or judgment which adversely affect the reliability of their appraisals. In addition, events occurring after the initial appraisal may cause the value of the real estate to increase or decrease. As a result of any of these factors, the real estate securing some of our loans may be more or less valuable than anticipated at the time the loans were made. If a default occurs on a loan secured by real estate that is less valuable than originally estimated, we may not be able to recover the outstanding balance of the loan and will suffer a loss.
Risks Related to Interest Rates and Liquidity
We may incur losses if we are unable to successfully manage interest rate risk.
Our profitability depends in substantial part upon the spread between the interest rates earned on investments and loans and interest rates paid on deposits and other interest-bearing liabilities. These rates are normally in line with general market rates and rise and fall based on our view of our financing and liquidity needs. We may selectively pay above-market rates to attract deposits as we have done in some of our marketing promotions in the past. Changes in interest rates will affect our operating performance and financial condition in diverse ways including the pricing of securities, loans and deposits, which, in turn, may affect the growth in loan and retail deposit volume. We attempt to minimize our exposure to interest rate risk, but cannot eliminate it. Our net interest income will be adversely affected if market interest rates change so that the interest we pay on deposits and borrowings increases faster than the interest earned on loans and investments. Our net interest spread will depend on many factors that are partly or entirely outside our control, including competition, federal economic, monetary and fiscal policies and economic conditions generally. Fluctuations in market rates are neither predictable nor controllable and may have a material and negative effect on our business, financial condition and results of operations.
Changes in interest rates also affect the value of our loans. An increase in interest rates could adversely affect our borrowers’ ability to pay the principal or interest on existing loans or reduce their desire to borrow more money. This situation may lead to an increase in non-performing assets or a decrease in loan originations, either of which could have a material and negative effect on our results of operations.
Our liquidity needs could adversely affect results of operations and financial condition.
Our primary sources of funds are deposits and loan repayments. While scheduled loan repayments are a relatively stable source of funds, they are subject to the ability of borrowers to repay the loans. The ability of borrowers to repay loans can be adversely affected by a number of factors, including, but not limited to, changes in economic conditions, adverse trends or events affecting business industry groups, reductions in real estate values or markets, availability of, and/or access to, sources of refinancing, business closings or lay-offs, inclement weather, natural disasters and international instability. Additionally, deposit levels may be affected by a number of factors, including, but not limited to, rates paid by competitors, general interest rate levels, regulatory capital requirements, returns available to
17
customers on alternative investments and general economic conditions. Accordingly, we may be required from time to time to rely on secondary sources of liquidity to meet withdrawal demands or otherwise fund operations. Such sources include FHLB advances, sales of securities and loans, federal funds lines of credit from correspondent banks and borrowings from the Federal Reserve Discount Window, as well as additional out-of-market time deposits and brokered deposits. While we believe that these sources are currently adequate, there can be no assurance they will be sufficient to meet future liquidity demands, particularly if we continue to grow and experience increasing loan demand. We may be required to slow or discontinue loan growth, capital expenditures or other investments or liquidate assets should such sources not be adequate.
We will be required to transition from the use of the LIBOR index in the future.
We have certain variable-rate loans indexed to LIBOR to calculate the loan interest rate. The United Kingdom Financial Conduct Authority, which regulates LIBOR, has announced that the continued availability of LIBOR on the current basis is not guaranteed after 2021. It is impossible to predict whether and to what extent banks will continue to provide LIBOR submissions to the administrator of LIBOR or whether any additional reforms to LIBOR may be enacted in the United Kingdom or elsewhere. At this time, no consensus exists as to what rate or rates may become acceptable alternatives to LIBOR, and it is impossible to predict the effect of any such alternatives on the value of LIBOR-based variable-rate loans, as well as LIBOR-based securities, subordinated notes, trust preferred securities, or other securities or financial arrangements. The implementation of a substitute index or indices for the calculation of interest rates under our loan agreements with borrowers or other financial arrangements may cause us to incur significant expenses in effecting the transition, may result in reduced loan balances if borrowers do not accept the substitute index or indices, and may result in disputes or litigation with customers or other counter-parties over the appropriateness or comparability to LIBOR of the substitute index or indices, any of which could have a material adverse effect on our results of operations.
Risks Related to Our Operations
We may not be able to successfully manage our long-term growth, which may adversely affect our results of operations and financial condition.
A key aspect of our long-term business strategy is our continued growth and expansion. Our ability to continue to grow depends, in part, upon our ability to:
| ● | open new branch offices or acquire existing branches or other financial institutions; |
| ● | attract deposits to those locations; and |
| identify attractive loan and investment opportunities. |
We may not be able to successfully implement our growth strategy if we are unable to identify attractive markets, locations or opportunities to expand in the future, or if we are subject to regulatory restrictions on growth or expansion of our operations. In addition, we compete with our companies for acquisition and expansion opportunities, and many of those competitors have greater financial resources than us and thus may be able to pay more for such an opportunity than we can.
Our ability to manage our growth successfully also will depend on whether we can maintain capital levels adequate to support our growth, maintain cost controls and asset quality and successfully integrate any businesses we acquire into our organization. As we identify opportunities to implement our growth strategy by opening new branches or acquiring branches or other banks, we may incur increased personnel, occupancy and other operating expenses. In the case of new branches, we must absorb those higher expenses while we begin to generate new deposits, and there is a further time lag involved in redeploying new deposits into attractively priced loans and other higher yielding earning assets. Thus, any plans for branch expansion could decrease our earnings in the short run, even if we efficiently execute our branching strategy.
18
Our operations may be adversely affected by cyber security risks.
In the ordinary course of business, we collect and store sensitive data, including proprietary business information and personally identifiable information of our customers and employees in systems and on networks. The secure processing, maintenance, and use of this information is critical to our operations and business strategy. In addition, we rely heavily on communications and information systems to conduct our business. Any failure, interruption, or breach in security or operational integrity of these systems could result in failures or disruptions in our customer relationship management, general ledger, deposit, loan and other systems. We have invested in accepted technologies, and we continually review processes and practices that are designed to protect our networks, computers and data from damage or unauthorized access. Despite these security measures, our computer systems and infrastructure may be vulnerable to attacks by hackers or breached due to employee error, malfeasance or other disruptions. A breach of any kind could compromise systems, and the information stored there could be accessed, damaged or disclosed. A breach in security or other failure could result in legal claims, regulatory penalties, disruption in operations, increased expenses, loss of customers and business partners and damage to our reputation, which could adversely affect our business and financial condition. Furthermore, as cyber threats continue to evolve and increase, we may be required to expend significant additional financial and operational resources to modify or enhance our protective measures, or to investigate and remediate any identified information security vulnerabilities.
We rely heavily on our management team and the unexpected loss of any of those personnel could adversely affect our operations; we depend on our ability to attract and retain key personnel.
We are a customer-focused and relationship-driven organization. We expect our future growth to be driven in a large part by the relationships maintained with our customers by our president and chief executive officer and other senior officers. The unexpected loss of any of our key employees could have an adverse effect on our business and possibly result in reduced revenues and earnings. We do maintain bank-owned life insurance on key officers that would help cover some of the economic impact of a loss caused by death.
The implementation of our business strategy will also require us to continue to attract, hire, motivate and retain skilled personnel to develop new customer relationships as well as new financial products and services. Many experienced banking professionals employed by our competitors are covered by agreements not to compete or to solicit their existing customers if they were to leave their current employment. These agreements make the recruitment of these professionals more difficult. The market for these people is competitive, and we cannot assure you that we will be successful in attracting, hiring, motivating or retaining them.
We rely on other companies to provide key components of our business infrastructure.
Third parties provide key components of our business operations such as data processing, recording and monitoring transactions, online banking interfaces and services, internet connections and network access. While we have selected these third party vendors carefully, we do not control their actions. Any problem caused by these third parties, including poor performance of services, failure to provide services, disruptions in services provided by a vendor and failure to handle current or higher volumes, could adversely affect our ability to deliver products and services to our customers and otherwise conduct our business, and may harm our reputation. Financial or operational difficulties of a third party vendor could also hurt our operations if those difficulties affect the vendor’s ability to serve us. Replacing these third party vendors could also create significant delay and expense. Accordingly, use of such third parties creates an unavoidable inherent risk to our business operations.
The operational functions of business counterparties over which we may have limited or no control may experience disruptions that could adversely impact the Company.
Major U.S. retailers continue to experience data system incursions resulting in the thefts of credit and debit card information, online account information, and other financial data impacting millions of the retailers’ customers. Retailer incursions affect cards issued and deposit accounts maintained by many banks, including us. Although our systems are not breached in retailer incursions, these events can cause us to reissue a significant number of cards and take other costly steps to avoid significant losses to us and our customers. In some cases, we may be required to
19
reimburse customers for the losses they incur. Other possible points of intrusion or disruption not within our control include internet service providers, electronic mail portal providers, social media portals, distant-server (cloud) service providers, electronic data security providers, telecommunications companies, and smart phone manufacturers.
We continually encounter technological change.
The financial services industry is continually undergoing rapid technological change with frequent introductions of new technology-driven products and services. The effective use of technology increases efficiency and enables financial institutions to better serve customers and to reduce costs. Our future success depends, in part, upon our ability to address the needs of our customers by using technology to provide products and services that will satisfy customer demands, as well as to create additional efficiencies in our operations. Many of our competitors have substantially greater resources to invest in technological improvements. We may not be able to effectively implement new technology-driven products and services or be successful in marketing these products and services to our customers. Failure to successfully keep pace with technological change affecting the financial services industry could have a material adverse impact on our business and, in turn, our financial condition and results of operations.
Consumers may increasingly decide not to use us to complete their financial transactions, which would have a material adverse impact on our financial condition and operations.
Technology and other changes are allowing parties to complete financial transactions through alternative methods that historically have involved banks. For example, consumers can now maintain funds that would have historically been held as bank deposits in brokerage accounts, mutual funds or general-purpose reloadable prepaid cards. Consumers can also complete transactions such as paying bills and/or transferring funds directly without the assistance of banks. The process of eliminating banks as intermediaries, known as “disintermediation,” could result in the loss of fee income, as well as the loss of customer deposits and the related income generated from those deposits. The loss of these revenue streams and the lower cost of deposits as a source of funds could have a material adverse effect on our financial condition and results of operations.
Our risk-management framework may not be effective in mitigating risk and loss.
We maintain an enterprise risk management program that is designed to identify, quantify, monitor, report, and control the risks that we face. These risks include interest-rate, credit, liquidity, operations, reputation, compliance and litigation. While we assess and improve this program on an ongoing basis, there can be no assurance that its approach and framework for risk management and related controls will effectively mitigate all risk and limit losses in our business. If conditions or circumstances arise that expose flaws or gaps in our risk-management program, or if its controls break down, our results of operations and financial condition may be adversely affected.
Negative perception of us through social media may adversely affect our reputation and business.
Our reputation is critical to the success of our business. We believe that our brand image has been well received by customers, reflecting the fact that the brand image, like our business, is based in part on trust and confidence. Our reputation and brand image could be negatively affected by rapid and widespread distribution of publicity through social media channels. Our reputation could also be affected by our association with customers affected negatively through social media distribution, or other third parties, or by circumstances outside of our control. Negative publicity, whether true or untrue, could affect our ability to attract or retain customers, or cause us to incur additional liabilities or costs, or result in additional regulatory scrutiny.
Changes in accounting standards could impact reported earnings.
The authorities that promulgate accounting standards, including the Financial Accounting Standards Board and Securities and Exchange Commission, periodically change the financial accounting and reporting standards that govern the preparation of the Company’s consolidated financial statements. These changes are difficult to predict and can materially impact how the Company records and reports its financial condition and results of operations. In some cases, the Company could be required to apply a new or revised standard retroactively, resulting in the restatement of financial
20
statements for prior periods. Such changes could also require the Company to incur additional personnel or technology costs.
Our disclosure controls and procedures and internal controls may not prevent or detect all errors or acts of fraud.
Our disclosure controls and procedures are designed to reasonably assure that information required to be disclosed by us in reports that we file or submit under the Exchange Act is accumulated and communicated to management, and recorded, processed, summarized and reported within the time periods specified in the SEC’s rules and forms. We believe that any disclosure controls and procedures or internal controls and procedures, no matter how well conceived and operated, can provide only reasonable, not absolute, assurance that the objectives of the control system are met. These inherent limitations include the realities that judgments in decision-making can be faulty, and that breakdowns can occur because of a simple error or omission. Additionally, controls can be circumvented by individual acts, by collusion by two or more people and/or by override of the established controls. Accordingly, because of the inherent limitations in our control systems and in human nature, misstatements due to error or fraud may occur and not be detected.
We can give no assurances that our deferred tax asset will not become impaired in the future because it is based on projections of future earnings, which are subject to uncertainty and estimates that may change based on economic conditions.
We can give no assurances that our deferred tax asset will not become impaired in the future. At December 31, 2020, we recorded net deferred income tax assets of $4.0 million. We assess the realization of deferred income tax assets and record a valuation allowance if it is “more likely than not” that we will not realize all or a portion of the deferred tax asset. We consider all available evidence, both positive and negative, to determine whether, based on the weight of that evidence, we need a valuation allowance. Management’s assessment is primarily dependent on historical taxable income and projections of future taxable income, which are directly related to our core earnings capacity and our prospects to generate core earnings in the future. Projections of core earnings and taxable income are inherently subject to uncertainty and estimates that may change given an uncertain economic outlook and current banking industry conditions. The Company does not currently have a valuation allowance; however, due to the uncertainty of estimates and projections, it is possible that we will be required to establish a valuation allowance in future reporting periods.
Risks Related to Our Regulatory Environment
The financial services industry, as well as the broader economy, may be subject to new legislation, regulation, and government policy.
At this time, it is difficult to predict the legislative and regulatory changes that will result from the current presidential and congressional administrations. The President and/or Congress may change existing financial services regulations or enact new policies affecting financial institutions, specifically community banks. Such changes may include amendments to the Dodd-Frank Act and structural changes to the CFPB. The current administration and Congress also may cause broader economic changes due to changes in governing ideology and governing style. New appointments to the Board of Governors of the Federal Reserve could affect monetary policy and interest rates, and changes in fiscal policy could affect broader patterns of trade and economic growth. Future legislation, regulation, and government policy, particularly following changes in political leadership and policymakers in the federal government, could affect the banking industry as a whole, including our business and results of operations, in ways that are difficult to predict. In addition, our results of operations also could be adversely affected by changes in the way in which existing statutes and regulations are interpreted or applied by courts and government agencies.
21
We are subject to more stringent capital and liquidity requirements as a result of the Basel III regulatory capital reforms and the Dodd-Frank Act, which could adversely affect our return on equity and otherwise affect our business.
We are subject to capital adequacy guidelines and other regulatory requirements specifying minimum amounts and types of capital that we must maintain. From time to time, regulators implement changes to these regulatory capital adequacy guidelines. Under the Dodd-Frank Act, the federal banking agencies have established stricter capital requirements and leverage limits for banks and bank holding companies that are based on the Basel III regulatory capital reforms. These stricter capital requirements were phased-in over a four-year period until they were fully-implemented on January 1, 2019. See “Business − Supervision and Regulation – Capital Requirements” for further information about the requirements.
The application of more stringent capital requirements could, among other things, result in lower returns on equity, require the raising of additional capital and result in regulatory actions if we were to be unable to comply with such requirements. Furthermore, the imposition of liquidity requirements in connection with the implementation of Basel III could result in our having to lengthen the term of our funding, restructure our business models and/or increase our holdings of liquid assets. Implementation of changes to asset risk weightings for risk-based capital calculations, items included or deducted in calculating regulatory capital and/or additional capital conservation buffers could result in management modifying its business strategy and could limit our ability to use its capital for strategic opportunities. If we fail to meet these minimum capital guidelines and/or other regulatory requirements, our financial condition would be materially and adversely affected.
New regulations issued by the Consumer Financial Protection Bureau could adversely affect our earnings.
The CFPB has broad rulemaking authority to administer and carry out the provisions of the Dodd-Frank Act with respect to financial institutions that offer covered financial products and services to consumers. The CFPB has also been directed to write rules identifying practices or acts that are unfair, deceptive or abusive in connection with any transaction with a consumer for a consumer financial product or service, or the offering of a consumer financial product or service. For example, the CFPB issued a final rule in 2014 requiring mortgage lenders to make a reasonable and good faith determination based on verified and documented information that a consumer applying for a mortgage loan has a reasonable ability to repay the loan according to its terms, or to originate “qualified mortgages” that meet specific requirements with respect to terms, pricing and fees. The new rule also contains new disclosure requirements at mortgage loan origination and in monthly statements.
The requirements under the CFPB’s regulations and policies could limit our ability to make certain types of loans or loans to certain borrowers, or could make it more expensive and/or time consuming to make these loans, which could adversely impact our profitability.
We are subject to extensive government regulation and supervision.
We are subject to extensive federal and state regulation and supervision. Banking regulations are primarily intended to protect depositors’ funds, federal deposit insurance funds and the banking system as a whole, and not security holders. These regulations affect our lending practices, capital structure, investment practices, dividend policy and growth, among other things. Congress and federal regulatory agencies continually review banking laws, regulations and policies for possible changes.
The banking industry continues to be faced with new and complex regulatory requirements and enhanced supervisory oversight. Banking regulators are increasingly concerned about, among other things, growth, commercial real estate concentrations, underwriting of commercial real estate and commercial and industrial loans, capital levels and cyber security. These factors are exerting downward pressure on revenues and upward pressure on required capital levels and the cost of doing business.
These provisions, or any other aspects of current proposed regulatory or legislative changes to laws applicable to the financial industry, if enacted or adopted, may impact the profitability of our business activities or change certain of
22
our business practices, including our ability to offer new products, obtain financing, attract deposits, make loans, and achieve satisfactory interest spreads, and could expose us to additional costs, including increased compliance costs. These changes also may require us to invest significant management attention and resources to make any necessary changes to our operations in order to comply, and could therefore also materially adversely affect our business, financial condition, and results of operations. Furthermore, failure to comply with laws, regulations or policies could result in sanctions by regulatory agencies, civil money penalties and/or reputation damage, which could have a material adverse effect on our business, financial condition and results of operations.
Banking regulators have broad enforcement power, but regulations are meant to protect depositors, and not investors.
We are subject to supervision by several governmental regulatory agencies, including the Federal Reserve Bank of Richmond and Virginia’s Bureau of Financial Institutions. Bank regulations, and the interpretation and application of them by regulators, are beyond our control, may change rapidly and unpredictably and can be expected to influence earnings and growth. In addition, these regulations may limit our growth and the return to investors by restricting activities such as the payment of dividends, mergers with, or acquisitions by, other institutions, investments, loans and interest rates, interest rates paid on deposits and the opening of new branch offices. Although these regulations impose costs on us, they are intended to protect depositors, and should not be assumed to protect the interest of shareholders. The regulations to which we are subject may not always be in the best interest of investors.
Our businesses and earnings are impacted by governmental, fiscal and monetary policy.
We are affected by domestic monetary policy. For example, the Federal Reserve Board regulates the supply of money and credit in the United States and its policies determine in large part our cost of funds for lending, investing and capital raising activities and the return we earn on those loans and investments, both of which affect our net interest margin. The actions of the Federal Reserve Board also can materially affect the value of financial instruments we hold, such as loans and debt securities, and its policies also can affect our borrowers, potentially increasing the risk that they may fail to repay their loans. Our businesses and earnings also are affected by the fiscal or other policies that are adopted by various regulatory authorities of the United States. Changes in fiscal or monetary policy are beyond our control and hard to predict.
Risks Related to an Investment in Our Stock
Our profitability and the value of any equity investment in us may suffer because of rapid and unpredictable changes in the highly regulated environment in which we operate.
We are subject to extensive supervision by several governmental regulatory agencies at the federal and state levels. Recently enacted, proposed and future banking and other legislation and regulations have had, and will continue to have, or may have a significant impact on the financial services industry. These regulations, which are generally intended to protect depositors and not our shareholders, and the interpretation and application of them by federal and state regulators, are beyond our control, may change rapidly and unpredictably, and can be expected to influence our earnings and growth. Our success depends on our continued ability to maintain compliance with these regulations. Many of these regulations increase our costs and thus place other financial institutions that may not be subject to similar regulation in stronger, more favorable competitive positions.
The trading volume in our common stock is less than that of other larger financial services companies.
The trading volume in our common stock is less than that of other larger financial services companies. A public trading market having the desired characteristics of depth, liquidity and orderliness depends on the presence in the marketplace of willing buyers and sellers of our common stock at any given time. This presence depends on the individual decisions of investors and general economic and market conditions over which we have no control. Given the lower trading volume of our common stock, significant sales of our common stock, or the expectation of these sales, could cause our stock price to fall.
23
Our dividends may not be sustained
Although we recommenced paying cash dividends in 2019 to holders of our common stock, holders of common stock are not entitled to receive dividends. Financial, regulatory or economic factors may cause our Board of Directors to consider, among other actions, the suspension or reduction of dividends paid on our common stock. Furthermore, we are a bank holding company that conducts substantially all of its operations through its subsidiaries, including the Bank. As a result, we rely on dividends from the Bank for substantially all of our revenues. There are various regulatory restrictions on the ability of the Bank to pay dividends or make other payments to us, and our right to participate in a distribution of assets upon the Bank’s liquidation or reorganization is subject to the prior claims of the Bank’s creditors. If the Bank is unable to pay dividends to us, we may not be able to service our outstanding borrowings and other debt, pay our other obligations or pay a cash dividend to the holders of our common stock, and our business, financial condition and results of operations may be materially adversely affected.
Virginia law and the provisions of our articles of incorporation and bylaws could deter or prevent takeover attempts by a potential purchaser of our common stock that would be willing to pay you a premium for your shares of our common stock.
Our Articles of Incorporation and Bylaws contain provisions that may be deemed to have the effect of discouraging or delaying uninvited attempts by third parties to gain control of us. These provisions include the ability of our board to set the price, term, and rights of, and to issue, one or more series of our preferred stock. Our Articles of Incorporation and Bylaws do not provide for the ability of shareholders to call special meetings.
Similarly, the Virginia Stock Corporation Act contains provisions designed to protect Virginia corporations and employees from the adverse effects of hostile corporate takeovers. These provisions reduce the possibility that a third party could affect a change in control without the support of our incumbent directors. These provisions may also strengthen the position of current management by restricting the ability of shareholders to change the composition of the board, to affect its policies generally, and to benefit from actions that are opposed by the current board.
ITEM 1B. UNRESOLVED STAFF COMMENTS
None.
ITEM 2.PROPERTIES
The Company operates the following offices:
Corporate Headquarters:
Deep Run at Mayland — 9954 Mayland Drive, Suite 2100, Richmond, VA 23233
Virginia Branch Offices:
Bon Air — 2730 Buford Road, Richmond, VA 23235
Burgess — 14598 Northumberland Highway, Burgess, VA 22432
Callao — 654 Northumberland Highway, Callao, VA 22435
Centerville — 100 Broad Street Road, Manakin-Sabot, VA 23103
Deep Run at Mayland — 9954 Mayland Drive, Richmond, VA 23233
Flat Rock — 2320 Anderson Highway, Powhatan, VA 23139
Goochland Courthouse — 1949 Sandy Hook Road, Goochland, VA 23063
King William — 4935 Richmond-Tappahannock Highway, Aylett, VA 23009
Louisa — 217 East Main Street, Louisa, VA 23093
Lynchburg–Old Forest Road — 3638 Old Forest Road, Lynchburg, VA 24501
Lynchburg–Timberlake — 21437 Timberlake Road, Lynchburg, VA 24502
Mechanicsville — 6315 Mechanicsville Turnpike, Mechanicsville, VA 23111
Midlothian–Stonehenge — 12640 Stone Village Way, Midlothian, VA 23113
24
Tappahannock–Dillard — 1325 Tappahannock Boulevard, Tappahannock, VA 22560
Virginia Center — 9951 Brook Road, Glen Allen, VA 23060
West Broad Marketplace — 12254 West Broad Marketplace, Henrico, VA 23233
West Point — 16th and Main Street, West Point, VA 23181
Winterfield — 3740 Winterfield Road, Midlothian, VA 23113
Maryland Branch Offices:
Annapolis — 1835 West Street, Annapolis, MD 21401
Bowie — 6143 High Bridge Road, Bowie, MD 20720
Crofton — 2120 Baldwin Avenue, Crofton, MD 21114
Edgewater — 3062 Solomons Island Road, MD 21037
Rockville — 1101 Nelson Street, Rockville, MD 20850
Rosedale — 1230 Race Road, Rosedale, MD 21237
The Company owns all of the offices listed above, except that it leases its corporate headquarters and the Midlothian–Stonehenge and West Broad Marketplace offices in the Virginia market and the Crofton, Edgewater and Rockville offices in the Maryland market. The Company also has a loan production office in each of Lynchburg, Virginia, and Timonium, Maryland, each of which it leases.
All of the Company’s properties are in good operating condition and are adequate for the Company’s present and anticipated needs.
ITEM 3. LEGAL PROCEEDINGS
There are no material pending legal proceedings to which the Company, including its subsidiaries, is a party or of which its property is the subject.
ITEM 4. MINE SAFETY DISCLOSURES
Not applicable.
PART II
ITEM 5. | MARKET FOR REGISTRANT’S COMMON EQUITY, RELATED STOCKHOLDER MATTERS AND ISSUER PURCHASES OF EQUITY SECURITIES |
MARKET INFORMATION
The Company’s common stock trades on the NASDAQ Capital Market under the symbol “ESXB”.
HOLDERS OF RECORD
As of December 31, 2020, there were 1,723 holders of record of the Company’s common stock, not including beneficial holders of securities held in street name.
DIVIDENDS
The Company recommenced the payment of quarterly cash dividends in 2019. The payment of dividends is subject to the discretion of the board of directors, and future cash dividend payments to shareholders will depend upon a number of factors, including future earnings, alternative investment opportunities, financial condition, cash requirements and general business conditions.
25
EQUITY COMPENSATION PLAN INFORMATION
The following table provides information about common stock that may be issued upon the exercise of options, warrants and rights under the Company’s two stock incentive plans as of December 31, 2020. There are no outstanding warrants or rights under that plan, and the Company does not have any other plans that provide for the issuance of any options, warrants or rights.
Plan Category | Number of Securities to be Issued Upon Exercise of Outstanding Options, Warrants and Rights | Weighted-Average Exercise Price of Outstanding Options, Warrants and Rights | Number of Securities Remaining Available for Future Issuance Under Equity Compensation Plans (Excluding Securities Reflected in First Column) |
Equity Compensation Plans Approved by Security Holders 2009 Stock Incentive Plan 2019 Stock Incentive Plan | 1,539,750 314,000 | $6.08 9.45 | -- 2,138,323 |
Equity Compensation Plans Not Approved by Security Holders | -- | -- | -- |
Total | 1,853,750 | $6.65 | 2,138,323 |
26
STOCK PERFORMANCE GRAPH
The stock performance graph set forth below shows the cumulative stockholder return on the Company’s common stock during the period from December 31, 2015, to December 31, 2020, as compared with (i) an overall stock market index, the NASDAQ Composite Index, and (ii) a published industry index, the SNL Bank and Thrift Index. The graph assumes that $100 was invested on December 31, 2015 in the Company’s common stock and in each of the comparable indices and that dividends were reinvested.
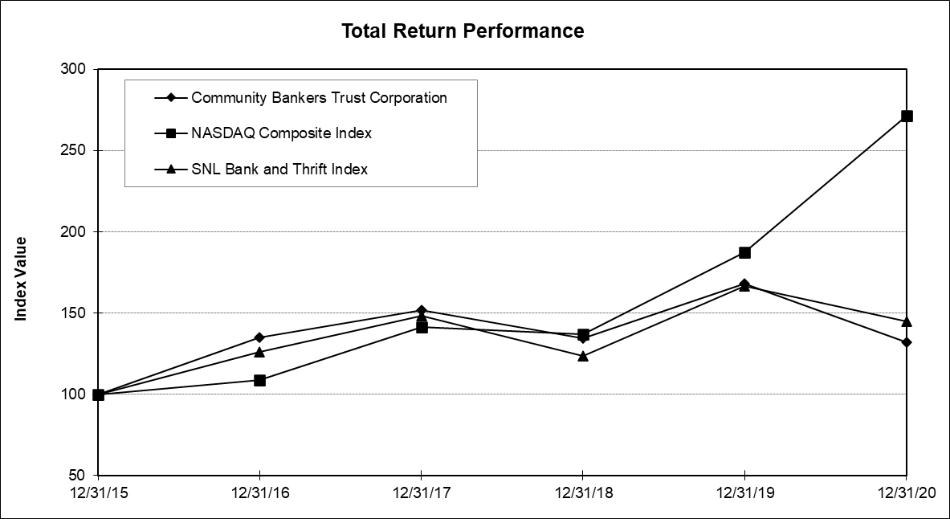
| Period Ending | |||||
Index | 12/31/15 | 12/31/16 | 12/31/17 | 12/31/18 | 12/31/19 | 12/31/20 |
Community Bankers Trust Corporation | 100.00 | 135.01 | 151.77 | 134.45 | 167.95 | 132.00 |
NASDAQ Composite Index | 100.00 | 108.87 | 141.13 | 137.12 | 187.44 | 271.64 |
SNL Bank and Thrift Index | 100.00 | 126.25 | 148.45 | 123.32 | 166.67 | 144.61 |
27
PURCHASES OF EQUITY SECURITES BY THE ISSUER
Effective January 22, 2020, the Company’s Board of Directors authorized a share repurchase program to purchase up to 1,000,000 shares of the Company’s common stock in open market transactions or privately negotiated transactions, including pursuant to a trading plan in accordance with Rule 10b5-1 and/or Rule 10b-18 under the Exchange Act. The Company purchased 130,800 shares under the program during the first two quarters of 2020 before suspending activity under it effective April 2, 2020. On October 26, 2020, the Company authorized the recommencement of the program for the repurchase of up to 200,000 shares of its common stock through January 2021.
The following table provides information with respect to purchases under the share repurchase program during the fourth quarter of 2020.
Period | Total Number of Shares Purchased (1) |
| Average Price Paid Per Share | Total Number of Shares Purchased as Part of Publicly Announced Plans or Programs | Maximum Number of Shares That May Yet Be Purchased Under the Program | |||||
November 1 - November 30, 2020 | — | — | — | — | ||||||
Total | 178,900 | $ | 6.91 | 178,900 | 690,300 | |||||
ITEM 6. SELECTED FINANCIAL DATA
Not applicable
ITEM 7. MANAGEMENT’S DISCUSSION AND ANALYSIS OF FINANCIAL CONDITION AND RESULTS OF OPERATIONS
The following discussion and analysis of the financial condition at December 31, 2020 and results of operations for the year ended December 31, 2020 of Community Bankers Trust Corporation (the “Company”) should be read in conjunction with the Company’s consolidated financial statements and the accompanying notes to consolidated financial statements included in this report.
GENERAL
Community Bankers Trust Corporation (the “Company”) is headquartered in Richmond, Virginia and is the holding company for Essex Bank (the “Bank”), a Virginia state bank with 24 full-service offices, 18 of which are in Virginia and six of which are in Maryland. The Bank also operates two loan production offices.
The Bank engages in a general commercial banking business and provides a wide range of financial services primarily to individuals, small businesses and larger commercial companies, including individual and commercial demand and time deposit accounts, commercial and industrial loans, consumer and small business loans, real estate and mortgage loans, investment services, on-line and mobile banking products, and cash management services.
The Company generates a significant amount of its income from the net interest income earned by the Bank. Net interest income is the difference between interest income and interest expense. Interest income depends on the amount of interest earning assets outstanding during the period and the interest rates earned thereon. The Company’s cost of funds is a function of the average amount of interest bearing deposits and borrowed money outstanding during the period and the interest rates paid thereon. The mix and product type for both loans and deposits can have a significant effect on the net interest income of the Bank. For the past several years, the Bank’s focus has been on maximizing that mix through customer growth and targeted product types, with lenders and other employees directly involved with customer relationships. Additionally, the quality of the interest earning assets further influences the amount of interest income lost on nonaccrual loans and the amount of additions to the allowance for loan losses.
28
The Bank also earns noninterest income from service charges on deposit accounts and other fee or commission-based services and products, such as insurance, mortgage loans, annuities, and other wealth management products. Other sources of noninterest income can include gains or losses on securities transactions and income from bank owned life insurance (BOLI) policies. The Company’s income is offset by noninterest expense, which consists of salaries and employee benefits, occupancy and equipment costs, data processing expenses, professional fees, transactions involving bank-owned property, and other operational expenses. The provision for loan losses and income taxes may also materially affect net income.
CAUTION ABOUT FORWARD-LOOKING STATEMENTS
The Company makes certain forward-looking statements in this report that are subject to risks and uncertainties. These forward-looking statements include statements regarding our profitability, liquidity, allowance for loan losses, interest rate sensitivity, market risk, future strategy, and financial and other goals. These forward-looking statements are generally identified by phrases such as “the Company expects,” “the Company believes” or words of similar import.
These forward-looking statements are subject to significant uncertainties because they are based upon or are affected by factors, including, without limitation, the effects of and changes in the following:
| ● | the quality or composition of the Company’s loan or investment portfolios, including collateral values and the repayment abilities of borrowers and issuers; |
| ● | assumptions that underlie the Company’s allowance for loan losses; |
| ● | general economic and market conditions, either nationally or in the Company’s market areas; |
| ● | unusual and infrequently occurring events, such as weather-related disasters, terrorist acts or public health events (such as the current COVID-19 pandemic), and of governmental and societal responses to them |
| ● | the interest rate environment; |
| ● | competitive pressures among banks and financial institutions or from companies outside the banking industry; |
| ● | real estate values; |
| ● | the demand for deposit, loan, and investment products and other financial services; |
| ● | the demand, development and acceptance of new products and services; |
| ● | the performance of vendors or other parties with which the Company does business; |
| ● | time and costs associated with de novo branching, acquisitions, dispositions and similar transactions; |
| ● | the realization of gains and expense savings from acquisitions, dispositions and similar transactions; |
| ● | assumptions and estimates that underlie the accounting for purchased credit impaired loans; |
| ● | consumer profiles and spending and savings habits; |
| ● | levels of fraud in the banking industry; |
| ● | the level of attempted cyber attacks in the banking industry; |
| ● | the securities and credit markets; |
| ● | costs associated with the integration of banking and other internal operations; |
| ● | the soundness of other financial institutions with which the Company does business; |
| ● | inflation; |
| ● | technology; and |
| ● | legislative and regulatory requirements. |
These factors and additional risks and uncertainties are described in the “Risk Factors” discussion in Part I, Item 1A, of this report.
Although the Company believes that its expectations with respect to the forward-looking statements are based upon reliable assumptions within the bounds of its knowledge of its business and operations, there can be no assurance that actual results, performance or achievements of the Company will not differ materially from any future results, performance or achievements expressed or implied by such forward-looking statements.
29
CRITICAL ACCOUNTING POLICIES
The Company’s financial statements are prepared in accordance with accounting principles generally accepted in the United States (GAAP). The financial information contained within the statements is, to a significant extent, financial information that is based on measures of the financial effects of transactions and events that have already occurred. A variety of factors could affect the ultimate value that is obtained when either earning income, recognizing an expense, recovering an asset or relieving a liability. For example, the Company uses historical loss factors as one factor in determining the inherent loss that may be present in its loan portfolio. Actual losses could differ significantly from the historical factors that the Company uses. In addition, GAAP itself may change from one previously acceptable method to another method. Although the economics of the Company’s transactions would be the same, the timing of events that would impact its transactions could change.
The Company’s critical accounting policies are discussed in detail in Note 1 - “Nature of Banking Activities and Significant Accounting Policies” in Item 8 of this Form 10-K. The following is a summary of the Company’s critical accounting policies that are highly dependent on estimates, assumptions and judgments.
Allowance for Loan Losses on Loans
The allowance for loan losses is established as losses are estimated to have occurred through a provision for loan losses charged to earnings. Loan losses are charged against the allowance when management believes the uncollectability of a loan balance is confirmed. Subsequent recoveries, if any, are credited to the allowance.
The allowance is an amount that management believes is appropriate to absorb estimated losses relating to specifically identified loans, as well as probable credit losses inherent in the balance of the loan portfolio, based on an evaluation of the collectability of existing loans and prior loss experience. This evaluation also takes into consideration such factors as changes in the nature and volume of the loan portfolio, overall portfolio quality, review of specific problem loans, and current economic conditions that may affect the borrower’s ability to pay. This evaluation does not include the effects of expected losses on specific loans or groups of loans that are related to future events or expected changes in economic conditions. The evaluation also considers the following risk characteristics of each loan portfolio:
| ● | Residential 1-4 family mortgage loans include HELOCs and single family investment properties secured by first liens. The carry risks associated with owner-occupied and investment properties are the continued credit-worthiness of the borrower, changes in the value of the collateral, successful property maintenance and collection of rents due from tenants. The Company manages these risks by using specific underwriting policies and procedures and by avoiding concentrations in geographic regions. |
| ● | Commercial real estate loans, including owner occupied and non-owner occupied mortgages, carry risks associated with the successful operations of the principal business operated on the property securing the loan or the successful operation of the real estate project securing the loan. General market conditions and economic activity may impact the performance of these loans. In addition to using specific underwriting policies and procedures for these types of loans, the Company manages risk by avoiding concentrations to any one business or industry, and by diversifying the lending to various lines of businesses, such as retail, office, office warehouse, industrial and hotel. |
| ● | Construction and land development loans are generally made to commercial and residential builders/developers for specific construction projects, as well as to consumer borrowers. These carry more risk than real estate term loans due to the dynamics of construction projects, changes in interest rates, the long-term financing market and state and local government regulations. The Company manages risk by using specific underwriting policies and procedures for these types of loans and by avoiding concentrations to any one business or industry and by diversifying lending to various lines of businesses, in various geographic regions and in various sales or rental price points. |
| ● | Second mortgages on residential 1-4 family loans carry risk associated with the continued credit-worthiness of the borrower, changes in value of the collateral and a higher risk of loss in the event the collateral is liquidated due to the inferior lien position. The Company manages risk by using specific underwriting policies and procedures. |
30
| ● | Multifamily loans carry risks associated with the successful operation of the property, general real estate market conditions and economic activity. In addition to using specific underwriting policies and procedures, the Company manages risk by avoiding concentrations in geographic regions and by diversifying the lending to various unit mixes, tenant profiles and rental rates. |
| ● | Agriculture loans carry risks associated with the successful operation of the business, changes in value of non-real estate collateral that may depreciate over time and inventory that may be affected by weather, biological, price, labor, regulatory and economic factors. The Company manages risks by using specific underwriting policies and procedures, as well as avoiding concentrations to individual borrowers and by diversifying lending to various agricultural lines of business (i.e., crops, cattle, dairy, etc.). |
| ● | Commercial loans carry risks associated with the successful operation of the business, changes in value of non-real estate collateral that may depreciate over time, accounts receivable whose collectability may change and inventory values that may be subject to various risks including obsolescence. General market conditions and economic activity may also impact the performance of these loans. In addition to using specific underwriting policies and procedures for these types of loans, the Company manages risk by diversifying the lending to various industries and avoids geographic concentrations. |
| ● | Consumer installment loans carry risks associated with the continued credit-worthiness of the borrower and the value of rapidly depreciating assets or lack thereof. These types of loans are more likely than real estate loans to be quickly and adversely affected by job loss, divorce, illness or personal bankruptcy. The Company manages risk by using specific underwriting policies and procedures for these types of loans. |
| ● | All other loans generally support the obligations of state and political subdivisions in the U.S. and are not a material source of business for the Company. The loans carry risks associated with the continued credit-worthiness of the obligations and economic activity. The Company manages risk by using specific underwriting policies and procedures for these types of loans. |
While management uses the best information available to make its evaluation, future adjustments to the allowance may be necessary if there are significant changes in economic conditions. In addition, regulatory agencies, as an integral part of their examination process, periodically review the Company’s allowance for loan losses, and may require the Company to make additions to the allowance based on their judgment about information available to them at the time of their examinations.
The allowance consists of specific, general and unallocated components. For loans that are also classified as impaired, an allowance is established when the collateral value (or discounted cash flows or observable market price) of the impaired loan is lower than the carrying value of that loan. The general component covers non-classified loans and is based on historical loss experience adjusted for qualitative factors. Qualitative factors relate to loan growth and concentrations, internal environment, loan quality deterioration and delinquencies. The unallocated component covers uncertainties that could affect management’s estimate of probable losses.
A loan is considered impaired when, based on current information and events, it is probable that the Company will be unable to collect the scheduled payments of principal or interest when due according to the contractual terms of the loan agreement. Factors considered by management in determining impairment include payment status, collateral value, and the probability of collecting scheduled principal and interest payments when due. Loans that experience insignificant payment delays and payment shortfalls generally are not classified as impaired. Management determines the significance of payment delays and payment shortfalls on a case-by-case basis, taking into consideration all of the circumstances surrounding the loan and the borrower, including the length of the delay, the reasons for the delay, the borrower’s prior payment record, and the amount of the shortfall in relation to the principal and interest owed. Impairment is measured on a loan by loan basis for commercial and construction loans by either the present value of the expected future cash flows discounted at the loan’s effective interest rate, the loan’s obtainable market price, or the fair value of the collateral if the loan is collateral dependent. Large groups of smaller balance homogeneous loans are evaluated for impairment as a pool. Accordingly, the Company does not separately analyze these individual loans for impairment disclosures.
31
Accounting for Certain Loans Acquired in a Transfer
FASB Accounting Standards Codification (ASC) 310, Receivables requires acquired loans to be recorded at fair value and prohibits carrying over valuation allowances in the initial accounting for acquired impaired loans. Loans carried at fair value, mortgage loans held for sale, and loans to borrowers in good standing under revolving credit arrangements are excluded from the scope of FASB ASC 310 which limits the yield that may be accreted to the excess of the undiscounted expected cash flows over the investor’s initial investment in the loan. The excess of the contractual cash flows over expected cash flows may not be recognized as an adjustment of yield. Subsequent increases in cash flows to be collected are recognized prospectively through an adjustment of the loan’s yield over its remaining life. Decreases in expected cash flows are recognized as impairments through the allowance for loan losses.
The Company’s acquired loans from the Suburban Federal Savings Bank (SFSB) transaction (the “PCI loans”), subject to FASB ASC Topic 805, Business Combinations, were recorded at fair value and no separate valuation allowance was recorded at the date of acquisition. FASB ASC 310-30, Loans and Debt Securities Acquired with Deteriorated Credit Quality, applies to loans acquired in a transfer with evidence of deterioration of credit quality for which it is probable, at acquisition, that the investor will be unable to collect all contractually required payments receivable. The Company is applying the provisions of FASB ASC 310-30 to all loans acquired in the SFSB transaction. The Company has grouped loans together based on common risk characteristics including product type, delinquency status and loan documentation requirements among others.
The PCI loans are subject to the credit review standards described above for loans. If and when credit deterioration occurs subsequent to the date that the loans were acquired, a provision for loan loss for PCI loans will be charged to earnings for the full amount.
The Company has made an estimate of the total cash flows it expects to collect from each pool of loans, which includes undiscounted expected principal and interest. The excess of that amount over the fair value of the pool is referred to as accretable yield. Accretable yield is recognized as interest income on a constant yield basis over the life of the pool. The Company also determines each pool’s contractual principal and contractual interest payments. The excess of that amount over the total cash flows that it expects to collect from the pool is referred to as nonaccretable difference, which is not recorded. Judgmental prepayment assumptions are applied to both contractually required payments and cash flows expected to be collected at acquisition. Over the life of the loan or pool, the Company continues to estimate cash flows expected to be collected. Subsequent decreases in cash flows expected to be collected over the life of the pool are recognized as an impairment in the current period through the allowance for loan losses. Subsequent increases in expected or actual cash flows are first used to reverse any existing valuation allowance for that loan or pool. Any remaining increase in cash flows expected to be collected is recognized as an adjustment to the accretable yield with the amount of periodic accretion adjusted over the remaining life of the pool.
OVERVIEW
Coming off a strong end to the 2019 year, the Company began the year with good momentum but was disrupted by the coronavirus (COVID-19) pandemic that set off an economic crisis. Specific events that impacted the Company’s financial results during 2020, and will impact future financial results, include government mandated business closures and stay-at-home orders, which have transformed into some of the highest unemployment rates seen in the Company’s markets. In addition, unprecedented government stimulus programs and the uncertainties regarding how long the mandates will last have contributed to the unpredictability of the financial impacts that the Company may experience. The Company is focused on assessing the risks in its loan portfolio and working with its customers to minimize future losses. See below for additional discussion regarding trends and the potential effects of COVID-19.
Total assets increased $213.9 million, or 15.0%, to $1.645 billion at December 31, 2020 when compared with December 31, 2019. Total loans, excluding PCI loans, were $1.182 billion at December 31, 2020, increasing $124.0 million, or 11.7%, from year end 2019. Total PCI loans were $24.0 million at December 31, 2020 versus $32.5 million at December 31, 2019.
32
The Company’s securities portfolio, excluding restricted equity securities, was $292.5 million at December 31, 2020 and increased $69.8 million since December 31, 2019. U.S. Treasury issues increased $23.5 million during 2020 as excess liquidity was invested short term in very liquid and low risk instruments. Corporate securities with balances, at fair value, of $26.6 million at December 31, 2020, increased by $20.5 million during 2020. State, county and municipal securities, the largest investment category totaling $146.9 million at December 31, 2020, increased by $22.6 million during 2020. Asset backed securities, consisting of student loan pools 97% guaranteed by the U.S. Government, increased by $25.9 million during 2020 and totaled $37.5 million at December 31, 2020. Offsetting these increases were a decrease of $16.6 million in mortgage backed securities and a decline of $6.1 million in balances held in U.S. Government agency bonds. The Company actively manages the portfolio to improve its liquidity and maximize the return within the desired risk profile.
The Company had cash and cash equivalents of $63.2 million at December 31, 2020 compared with $28.7 million at year end 2019, an increase of $34.5 million. The majority of this category growth, $33.4 million, occurred in interest bearing bank balances, which were $45.1 million at December 31, 2020, as large amounts of liquidity have been funneled into the banking system through the facilitation of PPP loans by the banking industry and stimulus checks issued by the U.S. Treasury during 2020 under the Coronavirus Aid, Relief, and Economic Security Act (the “CARES Act”).
Interest bearing deposits at December 31, 2020 were $1.100 billion, an increase of $114.9 million, or 11.7%, from December 31, 2019. Interest bearing checking accounts (formerly NOW accounts) of $239.6 million grew by $69.1 million, or 40.5%, during 2020. Money market deposit accounts were $154.5 million at December 31, 2020 and grew $33.7 million, or 27.9%, during 2020. Savings accounts totaled $124.4 million at December 31, 2020 and grew $27.8 million, or 28.8%, during 2020. Strong growth in these non-maturity categories for the year has allowed the Bank to react to lower interest rates through proactive repricing in certificates of deposit, the highest costing deposit category. As a result, there has been less growth in time deposits over $250,000, which grew by $8.9 million, or 7.5%, in 2020 and were $128.4 million at December 31, 2020. Time deposits less than or equal to $250,000 declined $24.6 million in 2020 and were $452.9 million at December 31, 2020. Time deposit balances combined were 52.9% of interest bearing deposits at December 31, 2020 and 41.6% of all deposit balances. This is a decline from 60.6% of interest bearing balances and 51.3% of all deposit balances at December 31, 2019. The growth in interest bearing checking accounts, money market accounts and savings accounts, as well as in noninterest bearing deposits, was $250.9 million, or 44.3%, during 2020. A portion of this growth was associated with the $85.1 million in PPP loans originated during the second and third quarters of 2020 and stimulus checks issued under the CARES Act, as well as previously postponed business activity that resulted from the COVID-19 stay-at-home orders.
In other funding activity, noninterest bearing deposits were $298.9 million at December 31, 2020 and increased by $120.3 million, or 67.4%, during 2020. FHLB borrowings were $57.8 million at December 31, 2020, compared with $68.5 million at December 31, 2019. The stable level of FHLB borrowings during 2020 has been due to the FHLB swiftly responding to the March 16, 2020 rate cut of 1.50% to the discount rate by repricing advances downward to ensure low cost liquidity for the banking system. As a result, the Bank has found this level of borrowing to be a stable source of low cost funding. The average rate paid on FHLB borrowings, net of cash flow hedge, was 1.15% during 2020. There were no Federal funds purchased at December 31, 2020 compared with $24.4 million at December 31, 2019.
Shareholders’ equity was $169.7 million at December 31, 2020, or 10.3% of total assets, compared with $155.5 million, or 10.9% of total assets, at December 31, 2019. During 2020, the Company repurchased 309,700 shares of common stock at a total cost of $2.1 million.
.
RESULTS OF OPERATIONS
Net Income
Net income was $15.5 million for the year ended December 31, 2020 compared with $15.7 million for the same period in 2019. This is a decrease of $157,000, or 1.0% driven by the provision for loan losses recorded to reflect the business and market disruptions arising from the COVID-19 pandemic. The provision was $4.2 million for 2020 compared with $325,000 for 2019. The decrease in net income on a year-over-year basis was the result of an increase of $1.4 million,
33
or 2.7%, in net interest income, an increase of $594,000, or 11.1%, in noninterest income and a decrease of $2.0 million in noninterest expenses. There was an increase of $226,000 in income tax expense in 2020 compared with 2019. Details on the drivers of these year-over-year changes are presented below. Earnings per share were $0.70 basic and $0.69 fully diluted for 2020 compared with $0.71 basic and $0.70 fully diluted for 2019.
Net Interest Income
The Company’s operating results depend primarily on its net interest income, which is the difference between interest income on interest earning assets, including securities and loans, and interest expense incurred on interest bearing liabilities, including deposits and other borrowed funds. Net interest income is affected by changes in the amount and mix of interest earning assets and interest bearing liabilities, referred to as a “volume change.” It is also affected by changes in yields earned on interest earning assets and rates paid on interest bearing deposits and other borrowed funds, referred to as a “rate change.”
Net interest income was $51.3 million for the year ended December 31, 2020. This is an increase of $1.4 million, or 2.7%, from net interest income of $50.0 million for the year ended December 31, 2019. Interest and dividend income declined by $1.8 million over this time frame. Interest and dividend income was impacted by volume increases offset by a decline in yield. First, there was an increase of $929,000, or 1.8%, in interest and fees on loans, which increased as a result of growth of $119.0 million, or 11.6%, in the average balance of loans in 2020 over 2019. The yield on loans declined from 5.03% for 2019 to 4.61% for 2020. A portion of this decrease is attributable to the addition of $85.1 million in PPP loans net of unamortized fees/costs during the second and third quarters of 2020 at a rate of 1.00%. Interest and fees on PCI loans declined by $2.0 million, or 32.9%. Part of this decline is related to payoffs within charged-off loan pools in the PCI portfolio during 2019. The yield on the PCI portfolio was 14.00% for 2020 compared with 16.99% for 2019. Interest on deposits in other banks declined by $53,000. Interest and dividends on securities declined by $705,000 in 2020 compared with 2019. The yield on earning assets was 4.35% for 2020, a decline of 64 basis points from 4.99% in 2019. The yield on total loans, which includes PCI loans and PPP loans, declined from 5.44% for 2019 to 4.84% for 2020. The return on interest bearing bank balances declined from 2.45% to 0.59%, while the tax-equivalent yield on the securities portfolio declined from 3.23% for 2019 to 2.90% for 2020.
Interest expense of $12.3 million for 2020 was a decrease of $3.2 million, or 20.6%, from interest expense of $15.5 million for 2019. The cost of interest bearing liabilities decreased from 1.44% for 2019 to 1.08% for 2020. Interest on deposits decreased $2.7 million due to a decline in the rate paid from 1.39% for 2019 to 1.06% for 2020. Short term borrowing expense decreased by $89,000, and the cost of FHLB and other borrowings decreased by $426,000, or 31.7%, as the rate paid decreased from 2.04% for 2019 to 1.32% for 2020.
Interest spread is the product of yield on earning assets less cost of total interest bearing liabilities. The Company’s net interest spread declined from 3.55% for the year ended December 31, 2019 to 3.27% for the same period in 2020. The tax equivalent yield (non-GAAP) on earning assets decreased from 4.99% for the year ended December 31, 2019 to 4.35% for the year ended December 31, 2020.
The Company’s total loan to deposit ratio was 86.3% at December 31, 2020 versus 93.8% at December 31, 2019.
34
The following table presents the total amount of average balances, interest income from average interest earning assets and the resulting yields, as well as the interest expense on average interest bearing liabilities, expressed both in dollars and rates. Except as indicated in the footnote, no tax equivalent adjustments were made. Any non-accruing loans have been included in the table as loans carrying a zero yield.
NET INTEREST MARGIN ANALYSIS
AVERAGE BALANCE SHEETS
(Dollars in thousands)
| Year ended December 31, 2020 |
| Year ended December 31, 2019 |
| Year ended December 31, 2018 |
| |||||||||||||||||||
Average | Average | Average |
| ||||||||||||||||||||||
Average | Interest | Rates | Average | Interest | Rates | Average | Interest | Rates |
| ||||||||||||||||
Balance | Income/ | Earned/ | Balance | Income/ | Earned/ | Balance | Income/ | Earned/ |
| ||||||||||||||||
(Dollars in thousands) |
| Sheet |
| Expense |
| Paid |
| Sheet |
| Expense |
| Paid |
| Sheet |
| Expense |
| Paid |
| ||||||
ASSETS: |
|
|
|
|
|
|
|
|
|
|
|
|
|
|
|
|
|
| |||||||
Loans | $ | 1,138,603 | $ | 52,480 |
| 4.61 | % | $ | 1,023,861 | $ | 51,551 | 5.03 | % | $ | 960,978 | $ | 46,291 | 4.82 | % | ||||||
PCI loans |
| 28,948 | 4,053 |
| 14.00 |
| 35,568 | 6,042 | 16.99 |
| 40,641 | 5,222 | 12.85 | ||||||||||||
Total loans |
| 1,167,551 | 56,533 |
| 4.84 |
| 1,059,429 | 57,593 | 5.44 |
| 1,001,619 | 51,513 | 5.14 | ||||||||||||
Interest bearing bank balances |
| 57,022 | 338 |
| 0.59 |
| 15,977 | 391 | 2.45 |
| 13,995 | 303 | 2.16 | ||||||||||||
Federal funds sold |
| 172 | 0 |
| 0.27 |
| 688 | 14 | 2.16 |
| 242 | 5 | 2.03 | ||||||||||||
Securities (taxable) |
| 195,155 | 5,373 |
| 2.75 |
| 188,531 | 5,870 | 3.11 |
| 178,086 | 5,258 | 2.95 | ||||||||||||
Securities (tax exempt) (1) |
| 50,080 | 1,737 |
| 3.47 |
| 55,448 | 2,001 | 3.61 |
| 75,741 | 2,737 | 3.61 | ||||||||||||
Total earning assets |
| 1,469,980 | 63,981 |
| 4.35 |
| 1,320,073 | 65,869 | 4.99 |
| 1,269,683 | 59,816 | 4.71 | ||||||||||||
Allowance for loan losses |
| (11,391) |
|
| (8,821) |
| (9,198) |
|
| ||||||||||||||||
Non-earning assets |
| 109,379 |
|
| 101,590 |
| 92,621 |
|
| ||||||||||||||||
Total assets | $ | 1,567,968 |
| $ | 1,412,842 | $ | 1,353,106 |
|
| ||||||||||||||||
LIABILITIES AND SHAREHOLDERS’ EQUITY |
|
|
|
|
|
|
| ||||||||||||||||||
Demand - interest bearing | $ | 193,919 | $ | 426 |
| 0.22 | $ | 157,876 | $ | 346 | 0.22 | $ | 156,541 | 325 | 0.21 | % | |||||||||
Savings and money market |
| 253,118 | 943 |
| 0.37 |
| 221,817 | 1,268 | 0.57 |
| 230,637 | 1,187 | 0.51 | ||||||||||||
Time deposits |
| 623,403 | 9,997 |
| 1.60 |
| 627,913 | 12,422 | 1.98 |
| 581,619 | 8,745 | 1.5 | ||||||||||||
Total interest bearing deposits |
| 1,070,440 | 11,366 |
| 1.06 |
| 1,007,606 | 14,036 | 1.39 |
| 968,797 | 10,257 | 1.06 | ||||||||||||
Short-term borrowings |
| 1,554 | 24 |
| 1.55 |
| 4,422 | 113 | 2.56 |
| 2,856 | 65 | 2.28 | ||||||||||||
FHLB and other borrowings |
| 69,200 | 917 |
| 1.32 |
| 65,673 | 1,343 | 2.04 |
| 90,966 | 1,732 | 1.9 | ||||||||||||
Long-term debt |
|
|
|
| |||||||||||||||||||||
Total interest bearing liabilities |
| 1,141,194 | 12,307 |
| 1.08 |
| 1,077,701 | 15,492 | 1.44 |
| 1,062,619 | 12,054 | 1.13 | ||||||||||||
Noninterest bearing deposits |
| 250,875 |
|
| 174,163 |
| 155,003 |
|
| ||||||||||||||||
Other liabilities |
| 13,581 |
|
|
| 13,235 |
| 6,219 |
|
| |||||||||||||||
Total liabilities |
| 1,405,650 |
|
|
| 1,265,099 |
| 1,223,841 |
|
| |||||||||||||||
Shareholders’ equity |
| 162,318 |
|
|
| 147,743 |
| 129,265 |
|
| |||||||||||||||
Total liabilities and shareholders’ equity | $ | 1,567,968 |
|
| $ | 1,412,842 | $ | 1,353,106 |
|
| |||||||||||||||
Net interest earnings |
| $ | 51,674 |
|
|
| $ | 50,377 |
|
| $ | 47,762 |
| ||||||||||||
Interest spread |
|
|
|
|
| 3.27 | % |
| 3.55 | % |
|
|
| 3.58 | % | ||||||||||
Net interest margin |
|
|
|
|
| 3.52 | % |
| 3.82 | % |
|
|
| 3.76 | % | ||||||||||
Tax equivalent adjustment: |
|
|
|
|
|
|
|
|
|
|
| ||||||||||||||
Securities |
|
| $ | 364 |
|
|
| $ | 420 |
|
| $ | 576 |
| |||||||||||
| (1) | Income and yields are reported on a tax equivalent basis assuming a federal tax rate of 21% for each of 2020, 2019 and 2018. |
35
The following table presents changes in interest income and interest expense and distinguishes between the changes related to increases or decreases in average outstanding balances of interest earning assets and interest bearing liabilities (volume), and the changes related to increases or decreases in average interest rates on such assets and liabilities (rate). No tax equivalent adjustments were made.
EFFECT OF RATE-VOLUME CHANGE ON NET INTEREST INCOME
FOR THE YEAR ENDED DECEMBER 31, 2020 AND 2019
(Dollars in thousands)
2020 compared to 2019 | 2019 compared to 2018 | |||||||||||||||||
Increase (Decrease) | Increase (Decrease) | |||||||||||||||||
| Volume |
| Rate |
| Total |
| Volume |
| Rate |
| Total | |||||||
Interest Income: |
|
|
|
|
|
|
|
|
|
|
|
| ||||||
Loans, including fees | $ | 5,772 | $ | (4,843) | $ | 929 | $ | 3,031 | $ | 2,229 | $ | 5,260 | ||||||
PCI loans, including fees |
| (1,125) |
| (864) |
| (1,989) |
| (652) |
| 1,472 |
| 820 | ||||||
Interest bearing bank balances and federal funds sold |
| 995 |
| (1,062) | (67) |
| 52 |
| 45 |
| 97 | |||||||
Securities |
| 38 |
| (743) | (705) |
| (288) |
| 319 |
| 31 | |||||||
Total earning assets |
| 5,680 |
| (7,512) |
| (1,832) |
| 2,143 |
| 4,065 |
| 6,208 | ||||||
Interest Expense: |
|
|
|
|
|
|
|
|
| |||||||||
Demand - interest bearing |
| 79 |
| 1 |
| 80 |
| 3 |
| 18 |
| 21 | ||||||
Savings and money market |
| 178 |
| (503) |
| (325) |
| (45) |
| 126 |
| 81 | ||||||
Time deposits |
| (89) |
| (2,336) |
| (2,425) |
| 694 |
| 2,983 |
| 3,677 | ||||||
Total interest-bearing deposits |
| 168 |
| (2,838) |
| (2,670) |
| 652 |
| 3,127 |
| 3,779 | ||||||
Other borrowed funds |
| 14 |
| (529) |
| (515) |
| (455) |
| 113 |
| (342) | ||||||
Total interest-bearing liabilities |
| 182 |
| (3,367) |
| (3,185) |
| 197 |
| 3,240 |
| 3,437 | ||||||
Net increase in net interest income | $ | 5,498 | $ | (4,145) | $ | 1,353 | $ | 1,946 | $ | 825 | $ | 2,771 | ||||||
Provision for Loan Losses
Management actively monitors the Company’s asset quality and provides specific loss provisions when necessary. Provisions for loan losses are charged to income to bring the total allowance for loan losses to a level deemed appropriate by management of the Company based on such factors as historical credit loss experience, industry diversification of the commercial loan portfolio, the amount of nonperforming loans and related collateral, the volume growth and composition of the loan portfolio, current economic conditions that may affect the borrower’s ability to pay and the value of collateral, the evaluation of the loan portfolio through the internal loan review function and other relevant factors. See Allowance for Loan Losses on Loans in the Critical Accounting Policies section above for further discussion.
Loans are charged-off against the allowance for loan losses when appropriate. Although management believes it uses the best information available to make determinations with respect to the provision for loan losses, future adjustments may be necessary if economic conditions differ from the assumptions used in making the initial determinations.
Provision for loan losses for the year ended December 31, 2020 was $4.2 million, compared with $325,000 for the year ended December 31, 2019. The provision recorded during 2020 was due to the heightened risks associated with the loan portfolio that resulted from the economic impact of the rapidly evolving effects of the COVID-19 stay-at-home orders, business shut-downs and increased unemployment. Beginning in the first quarter of 2020, management reviews each loan within the portfolio at least quarterly to identify, and monitor on a going forward basis, those borrowers that management believed to be possibly impacted by the economy. Loans identified with increased risk are aggregated by loan type. During the first half of 2020, this analysis indicated a risk grade migration in a number of loan categories that led to a heightened risk level in the loan portfolio. The impact of the loans’ risk grade migration was applied to the allowance for loan loss calculation, which led to the provision for loan losses for each of the first two quarters of 2020.
36
The Company determined that no provision was necessary for the third or fourth quarters of 2020 after a similar analysis and review process for each quarter.
Due to the COVID-19 pandemic, the Company is closely monitoring loan concentrations in various “at risk areas” that it has deemed most likely to be affected by the stay-at-home orders and lack of general business activity, including a lack of travel in the Company’s geographic territory. As of December 31, 2020, the Company identified the following categories of borrowers as being potentially at risk:
Category | % of Total Loans | ||
Lessors of commercial properties | 18.5 | % | |
Consumer | 13.9 | ||
Lessors of residential properties | 12.3 | ||
Hotels and other lodging | 5.6 | ||
Medical and care services | 4.2 | ||
Food service & drinking | 2.2 | ||
Retail stores | 1.5 | ||
Personal services | 1.1 |
The Company is working with borrowers who have currently expressed a need for relief due to the effects of COVID-19. The Company provided COVID-19 related payment relief on loans totaling $182.4 million as of December 31, 2020. PCI loans comprised $12.2 million of this total. As of December 31, 2020, regular payments have resumed on $143.4 million of these loans, of which PCI comprised $8.4 million. The Company re-extended this payment relief on $52.7 million of these loans, $13.7 of which have resumed regular payments and $2.0 million of which were within the PCI portfolio. In accordance with current regulatory guidance and/or the CARES Act, none of these loans were deemed to be TDRs, as they were all current under their terms as of December 31, 2019.
The Company is also helping its customers and communities by participating in the PPP. The Company originated 793 loans totaling $85.1 million net of fees, with the median size for all loans made being approximately $31,500. These loans had an outstanding balance of $49.3 million net of fees at December 31, 2020. As these loans are 100% guaranteed by the SBA, no allowance for loan losses is required.
In January 2021, the Company began participating in the third round of PPP under the CARES Act, as amended by the Consolidated Appropriations Act (CAA). As of March 9, 2021, the Company originated 361 loans totaling $35.5 million net of fees under the CAA.
The allowance for loan losses, excluding PCI loans, equaled 276.7% of nonaccrual loans at December 31, 2020 compared with 159.3% at December 31, 2019. The ratio of the allowance for loan losses to total loans, excluding PCI loans, was 1.04% at December 31, 2020 compared with 0.80% at December 31, 2019. Net charge-offs were $289,000 in 2020 compared with net charge-offs of $879,000 in 2019.
The Company records a separate provision for loan losses for its loan portfolio, excluding PCI loans, and the PCI loan portfolio. Management actively monitors its PCI loan portfolio for impairment and necessary loan loss provisions. Provisions for PCI loans may be necessary due to a change in expected cash flows or an increase in expected losses within a pool of loans. Due to the stable nature of its performance and its declining balances over time as the portfolio amortizes, no provision was taken during either of the years December 31, 2020 and 2019. While the PCI loan portfolio contains significant risk, it was considered in determining the initial fair value, which was reflected in adjustments recorded at the time of the acquisition. See the Asset Quality discussion below for further analysis.
Noninterest Income
Noninterest income was $5.9 million for 2020, an increase of $594,000, or 11.1%, over noninterest income of $5.4 million for 2019. Mortgage loan income was $1.1 million, an increase of $630,000 for 2020 over 2019. This increase
37
was created by continuity within the mortgage team, coupled with attractive rates and increased referrals within the Bank. Other noninterest income was $1.3 million for 2020, an increase of $190,000 over the same period in 2019. The increase was primarily the result from 2020 activity that included a $64,000 gain on the extinguishment of a FHLB borrowing combined with a $272,000 increase in swap fee income. These items were partially offset by a decrease of $120,000 from non-recurring insurance proceeds received in 2019. Gains on securities transactions were $284,000 in 2020, an increase of $49,000 over 2019. Offsetting these increases to noninterest income were a decline of $237,000 in service charges and fees, resulting from reduced transaction volumes created by the COVID-19 pandemic stay-at-home orders, offset by a $102,000 one-time account interchange fee received during the fourth quarter of 2020, and a decrease of $35,000 in income on bank owned life insurance. Gain on sale of loans was $11,000 for 2020 compared with $14,000 in 2019.
Noninterest Expenses
Noninterest expenses were $33.7 million for the year ended December 31, 2020, a decrease of $2.0 million, or 5.6%, year over year. Salaries and employee benefits declined $1.3 million, or 6.0%. The decrease reflects increased capitalized internal loan costs relating to the origination of PPP loans and the closure of two branch offices in 2019. The branch closures positively affected salaries as well as other expense categories in 2020, namely occupancy and equipment expenses. Occupancy expenses were $275,000 lower, equipment expenses were $117,000 lower, and other operating expenses decreased $221,000. Other real estate expenses, net were $152,000 for 2020 and decreased by $566,000 versus the same period in 2019. In the third quarter of 2019, a nonperforming loan was migrated to OREO and as part of the process the Bank paid $624,000 in real estate taxes on the property. FDIC assessment was $639,000 for 2020 and increased $343,000 over 2019 mainly due to a $324,000 assessment credit received by the FDIC in 2019. Data processing fees were $2.5 million for 2020, an increase of $124,000 when compared with 2019.
Income Taxes
For the year ended December 31, 2020, income tax expense was $3.8 million compared with $3.6 million for 2019. The effective tax rate was 19.5% for the year ended December 31, 2020 compared with 18.4% for the year ended December 31, 2019. The increase reflects significantly higher tax deductions related to stock option exercises in 2019.
Loans
Total loans were $1.206 billion at December 31, 2020, increasing $115.6 million from $1.091 billion at December 31, 2019. Total loans, excluding PCI loans, were $1.182 billion at December 31, 2020 versus $1.058 million at December 31, 2019, an increase of $124.0 million, or 11.7%. Loans, net of unamortized fees/costs that the Bank originated under the PPP were $49.3 million at December 31, 2020. All of these balances are included in commercial loans. As a result of the economic conditions that existed during 2020, commercial loans, excluding PPP loans, declined by $15.1 million from December 31, 2019. Construction and land development loans increased by the largest dollar amount during 2020, $35.7 million, or 24.4%, and were $182.3 million at December 31, 2020, or 15.4% of total loans. Commercial mortgage loans, the largest category of loans at $474.9 million, or 40.2% of total loans, at December 31, 2020 grew by $78.0 million. Multifamily loans grew by $5.2 million during 2020 and were $78.2 million, or 6.6% of total loans. Residential 1 – 4 family loans declined by $26.3 million during 2020 and were $197.2 million, or 16.7% of total loans, as more of the home loans originated by the Bank are sold on the secondary market through its mortgage division, as evidenced by the increase in mortgage loan income in noninterest income. PCI loans were $24.0 million at December 31, 2020, $8.5 million lower than at year end 2019.
38
The following tables indicate the total dollar amount of loans outstanding and the percentage of gross loans as of December 31 of the years presented (dollars in thousands):
2020 |
| |||||||||||||||
Loans | PCI Loans | Total Loans |
| |||||||||||||
Mortgage loans on real estate: |
|
|
|
|
|
| ||||||||||
Residential 1‑4 family | $ | 197,228 |
| 16.68 | % | $ | 21,720 |
| 90.35 | % | $ | 218,948 |
| 18.15 | % | |
Commercial |
| 474,856 |
| 40.16 |
| 429 |
| 1.78 |
| 475,285 |
| 39.40 | ||||
Construction and land development |
| 182,277 |
| 15.42 |
| 780 |
| 3.25 |
| 183,057 |
| 15.17 | ||||
Second mortgages |
| 6,360 |
| 0.54 |
| 904 |
| 3.76 |
| 7,264 |
| 0.60 | ||||
Multifamily |
| 78,158 |
| 6.61 |
| 207 |
| 0.86 |
| 78,365 |
| 6.50 | ||||
Agriculture |
| 6,662 |
| 0.56 |
| — |
| — |
| 6,662 |
| 0.55 | ||||
Total real estate loans |
| 945,541 |
| 79.97 |
| 24,040 |
| 100.00 |
| 969,581 |
| 80.37 | ||||
Commercial loans |
| 225,386 |
| 19.06 |
| — |
| — |
| 225,386 |
| 18.68 | ||||
Consumer installment loans |
| 9,996 |
| 0.85 |
| — |
| — |
| 9,996 |
| 0.83 | ||||
All other loans |
| 1,439 |
| 0.12 |
| — |
| — |
| 1,439 |
| 0.12 | ||||
Total loans | $ | 1,182,362 |
| 100.00 | % | $ | 24,040 |
| 100.00 | % | $ | 1,206,402 |
| 100.00 | % | |
2019 |
| |||||||||||||||
Loans | PCI Loans | Total Loans |
| |||||||||||||
Mortgage loans on real estate: |
|
|
|
|
|
|
|
|
|
|
|
| ||||
Residential 1‑4 family | $ | 223,538 |
| 21.12 | % | $ | 29,465 |
| 90.58 | % | $ | 253,003 |
| 23.19 | % | |
Commercial |
| 396,858 |
| 37.50 |
| 490 |
| 1.51 |
| 397,348 |
| 36.42 | ||||
Construction and land development |
| 146,566 |
| 13.85 |
| 1,172 |
| 3.60 |
| 147,738 |
| 13.54 | ||||
Second mortgages |
| 6,639 |
| 0.63 |
| 1,169 |
| 3.59 |
| 7,808 |
| 0.72 | ||||
Multifamily |
| 72,978 |
| 6.90 |
| 232 |
| 0.72 |
| 73,210 |
| 6.71 | ||||
Agriculture |
| 8,346 |
| 0.79 |
| — |
| — |
| 8,346 |
| 0.77 | ||||
Total real estate loans |
| 854,925 |
| 80.79 |
| 32,528 |
| 100.00 |
| 887,453 |
| 81.35 | ||||
Commercial loans |
| 191,183 |
| 18.06 |
| — |
| — |
| 191,183 |
| 17.53 | ||||
Consumer installment loans |
| 11,163 |
| 1.05 |
| — |
| — |
| 11,163 |
| 1.02 | ||||
All other loans |
| 1,052 |
| 0.10 |
| — |
| — |
| 1,052 |
| 0.10 | ||||
Total loans | $ | 1,058,323 |
| 100.00 | % | $ | 32,528 |
| 100.00 | % | $ | 1,090,851 |
| 100.00 | % | |
2018 |
| |||||||||||||||
Loans | PCI Loans | Total Loans |
| |||||||||||||
Mortgage loans on real estate: |
|
|
|
|
|
|
|
|
|
|
|
| ||||
Residential 1-4 family | $ | 216,268 |
| 21.77 | % | $ | 34,240 |
| 89.43 | % | $ | 250,508 |
| 24.27 | % | |
Commercial |
| 379,904 |
| 38.23 |
| 746 |
| 1.95 |
| 380,650 |
| 36.89 | ||||
Construction and land development |
| 120,413 |
| 12.12 |
| 1,326 |
| 3.46 |
| 121,739 |
| 11.80 | ||||
Second mortgages |
| 6,778 |
| 0.68 |
| 1,729 |
| 4.52 |
| 8,507 |
| 0.82 | ||||
Multifamily |
| 59,557 |
| 5.99 |
| 244 |
| 0.64 |
| 59,801 |
| 5.79 | ||||
Agriculture |
| 8,370 |
| 0.84 |
| — |
| — |
| 8,370 |
| 0.81 | ||||
Total real estate loans |
| 791,290 |
| 79.63 |
| 38,285 |
| 100.00 |
| 829,575 |
| 80.38 | ||||
Commercial loans |
| 188,722 |
| 18.99 |
| — |
| — |
| 188,722 |
| 18.29 | ||||
Consumer installment loans |
| 12,048 |
| 1.21 |
| — |
| — |
| 12,048 |
| 1.17 | ||||
All other loans |
| 1,645 |
| 0.17 |
| — |
| — |
| 1,645 |
| 0.16 | ||||
Total loans | $ | 993,705 |
| 100.00 | % | $ | 38,285 |
| 100.00 | % | $ | 1,031,990 |
| 100.00 | % | |
39
2017 |
| |||||||||||||||
Loans | PCI Loans | Total Loans |
| |||||||||||||
Mortgage loans on real estate: |
|
|
|
|
|
| ||||||||||
Residential 1‑4 family | $ | 227,542 |
| 24.16 | % | $ | 39,805 |
| 89.79 | % | $ | 267,347 |
| 27.10 | % | |
Commercial |
| 366,331 |
| 38.89 |
| 547 |
| 1.23 |
| 366,878 |
| 37.20 | ||||
Construction and land development |
| 107,814 |
| 11.44 |
| 1,588 |
| 3.58 |
| 109,402 |
| 11.09 | ||||
Second mortgages |
| 8,410 |
| 0.89 |
| 2,136 |
| 4.82 |
| 10,546 |
| 1.07 | ||||
Multifamily |
| 59,024 |
| 6.27 |
| 257 |
| 0.58 |
| 59,281 |
| 6.01 | ||||
Agriculture |
| 7,483 |
| 0.79 |
| — |
| — |
| 7,483 |
| 0.76 | ||||
Total real estate loans |
| 776,604 |
| 82.44 |
| 44,333 |
| 100.00 |
| 820,937 |
| 83.23 | ||||
Commercial loans |
| 159,024 |
| 16.88 |
| — |
| — |
| 159,024 |
| 16.13 | ||||
Consumer installment loans |
| 5,169 |
| 0.55 |
| — |
| — |
| 5,169 |
| 0.52 | ||||
All other loans |
| 1,221 |
| 0.13 |
| — |
| — |
| 1,221 |
| 0.12 | ||||
Total loans | $ | 942,018 |
| 100.00 | % | $ | 44,333 |
| 100.00 | % | $ | 986,351 |
| 100.00 | % | |
2016 |
| |||||||||||||||
Loans | PCI Loans | Total Loans |
| |||||||||||||
Mortgage loans on real estate: |
|
|
|
|
|
| ||||||||||
Residential 1‑4 family | $ | 207,863 |
| 24.86 | % | $ | 46,623 |
| 89.72 | % | $ | 254,486 |
| 28.64 | % | |
Commercial |
| 339,804 |
| 40.63 |
| 649 |
| 1.25 |
| 340,453 |
| 38.33 | ||||
Construction and land development |
| 98,282 |
| 11.75 |
| 1,969 |
| 3.79 |
| 100,251 |
| 11.29 | ||||
Second mortgages |
| 7,911 |
| 0.95 |
| 2,453 |
| 4.72 |
| 10,364 |
| 1.17 | ||||
Multifamily |
| 39,084 |
| 4.67 |
| 270 |
| 0.52 |
| 39,354 |
| 4.43 | ||||
Agriculture |
| 7,185 |
| 0.86 |
| — |
| — |
| 7,185 |
| 0.81 | ||||
Total real estate loans |
| 700,129 |
| 83.72 |
| 51,964 |
| 100.00 |
| 752,093 |
| 84.67 | ||||
Commercial loans |
| 129,300 |
| 15.46 |
| — |
| — |
| 129,300 |
| 14.56 | ||||
Consumer installment loans |
| 5,627 |
| 0.67 |
| — |
| — |
| 5,627 |
| 0.63 | ||||
All other loans |
| 1,243 |
| 0.15 |
| — |
| — |
| 1,243 |
| 0.14 | ||||
Total loans | $ | 836,299 |
| 100.00 | % | $ | 51,964 |
| 100.00 | % | $ | 888,263 |
| 100.00 | % | |
The following table indicates the contractual maturity of commercial and construction and land development loans as of December 31, 2020 (dollars in thousands):
Construction and | ||||||
| Commercial |
| land development | |||
Within 1 year | $ | 59,816 | $ | 115,761 | ||
Variable Rate |
|
|
|
| ||
One to Five Years |
| 29,743 | $ | 33,265 | ||
After Five Years |
| 27,516 |
| 11,320 | ||
Total |
| 57,259 | $ | 44,585 | ||
Fixed Rate |
|
|
|
| ||
One to Five Years |
| 98,332 | $ | 22,574 | ||
After Five Years |
| 9,979 |
| 137 | ||
Total |
| 108,311 | $ | 22,711 | ||
Total Maturities | $ | 225,386 | $ | 183,057 | ||
Asset Quality – Assets, Excluding PCI Loans
The Company maintains a list of loans that have potential weaknesses and thus may need special attention. This nonperforming loan list is used to monitor such loans and is used in the determination of the appropriateness of the allowance for loan losses. At December 31, 2020, nonperforming assets totaled $8.9 million and net charge-offs were $289,000. Nonperforming assets totaled $10.8 million and net charge-offs were $879,000 at December 31, 2019.
40
Nonperforming loans were $4.5 million at December 31, 2020 compared to $6.2 million at December 31, 2019. The $1.7 million decrease in nonperforming loans since December 31, 2019 was the net result of $5.3 million in additions to nonperforming loans and $7.0 million in reductions. The increase related mainly to one construction and land development relationship totaling $1.4 million and four commercial loan relationships totaling $3.3 million. With respect to the reductions in nonaccrual loans, $352,000 were payments to existing nonaccrual loans, $619,000 were charge-offs, $5.6 million were paid off, including $2.0 million of the additions noted above, and $415,000 returned to accruing status.
The following table sets forth selected asset quality data and ratios with respect to assets, excluding PCI loans, at December 31 of the years presented (dollars in thousands):
2020 |
| 2019 |
| 2018 |
| 2017 |
| 2016 | |||||||
Nonaccrual loans | $ | 4,460 | $ | 5,292 | $ | 9,500 | $ | 9,026 | $ | 10,243 | |||||
Loans past due 90 days and accruing interest |
| 45 |
| 946 |
| — |
| — |
| — | |||||
Total nonperforming loans |
| 4,505 |
| 6,238 |
| 9,500 |
| 9,026 |
| 10,243 | |||||
OREO |
| 4,361 |
| 4,527 |
| 1,099 |
| 2,791 |
| 4,427 | |||||
Total nonperforming assets | $ | 8,866 | $ | 10,765 | $ | 10,599 | $ | 11,817 | $ | 14,670 | |||||
Accruing troubled debt restructure loans | $ | 4,679 | $ | 4,593 | $ | 8,359 | $ | 5,271 | $ | 4,653 | |||||
Balances |
|
|
|
|
|
|
|
|
|
| |||||
Specific reserve on impaired loans |
| 1,165 |
| 584 |
| 2,246 |
| 959 |
| 1,130 | |||||
General reserve related to unimpaired loans |
| 11,175 |
| 7,845 |
| 6,737 |
| 8,010 |
| 8,363 | |||||
Total allowance for loan losses |
| 12,340 |
| 8,429 |
| 8,983 |
| 8,969 |
| 9,493 | |||||
Average loans during the year, net of unearned income |
| 1,138,603 |
| 1,023,861 |
| 960,978 |
| 870,258 |
| 787,245 | |||||
Impaired loans |
| 9,139 |
| 9,885 |
| 17,859 |
| 14,297 |
| 18,541 | |||||
Non-impaired loans |
| 1,173,223 |
| 1,048,438 |
| 975,846 |
| 927,721 |
| 817,758 | |||||
Total loans, net of unearned income |
| 1,182,362 |
| 1,058,323 |
| 993,705 |
| 942,018 |
| 836,299 | |||||
Ratios |
|
|
|
|
|
|
|
|
|
| |||||
Allowance for loan losses to loans |
| 1.04 | % |
| 0.80 | % |
| 0.90 | % |
| 0.95 | % |
| 1.14 | |
Allowance for loan losses to nonaccrual loans |
| 276.68 |
| 159.28 |
| 94.56 |
| 99.37 |
| 92.68 | |||||
General reserve to non-impaired loans |
| 0.95 |
| 0.75 |
| 0.69 |
| 0.86 |
| 1.02 | |||||
Nonaccrual loans to loans |
| 0.38 |
| 0.50 |
| 0.96 |
| 0.96 |
| 1.22 | |||||
Nonperforming assets to loans and OREO |
| 0.75 |
| 1.01 |
| 1.07 |
| 1.25 |
| 1.74 | |||||
Net charge-offs to average loans |
| 0.03 |
| 0.09 |
| (0.00) |
| 0.12 |
| 0.07 | |||||
The following table presents the composition of the Company’s nonaccrual loans, excluding PCI loans, as of December 31 of the years presented (dollars in thousands):
2020 |
| 2019 |
| 2018 |
| 2017 |
| 2016 | |||||||
Mortgage loans on real estate: | |||||||||||||||
Residential 1‑4 family | $ | 1,357 | $ | 1,378 | $ | 1,257 | $ | 1,962 | $ | 2,893 | |||||
Commercial |
| 730 |
| 1,006 |
| 2,123 |
| 1,498 |
| 1,758 | |||||
Construction and land development |
| 44 |
| 376 |
| 4,571 |
| 4,277 |
| 5,495 | |||||
Multifamily | — | 2,463 | — | — | — | ||||||||||
Agriculture |
| 45 |
| — |
| — |
| 68 |
| — | |||||
Total real estate loans |
| 2,176 |
| 5,223 |
| 7,951 |
| 7,805 |
| 10,146 | |||||
Commercial loans |
| 2,264 |
| 62 |
| 1,549 |
| 1,214 |
| 53 | |||||
Consumer installment loans |
| 20 |
| 7 |
| — |
| 7 |
| 44 | |||||
Total loans | $ | 4,460 | $ | 5,292 | $ | 9,500 | $ | 9,026 | $ | 10,243 | |||||
41
Allowance for Loan Losses
The allowance for loan losses represents management’s estimate of the amount appropriate to provide for probable losses inherent in the loan portfolio.
Loan quality is continually monitored, and the Company’s management has established an allowance for loan losses that it believes is appropriate for the risks inherent in the loan portfolio. Among other factors, management considers the Company’s historical loss experience, the size and composition of the loan portfolio, the value and appropriateness of collateral and guarantors, nonperforming loans and current and anticipated economic conditions. There are additional risks of future loan losses, which cannot be precisely quantified nor attributed to particular loans or classes of loans. Because those risks include general economic trends, as well as conditions affecting individual borrowers, the allowance for loan losses is an estimate. The allowance is also subject to regulatory examinations and determination as to appropriateness, which may take into account such factors as the methodology used to calculate the allowance and size of the allowance in comparison to peer companies identified by regulatory agencies. See Allowance for Loan Losses on Loans in the Critical Accounting Policies section above for further discussion.
In conjunction with the impairment analysis the Company performs as part of its allowance methodology, the Company frequently orders appraisals for all loans with balances in excess of $250,000 when the most recent appraisal is deemed to be stale or invalid. The Company may also utilize internally prepared estimates that generally result from current market data and actual sales data related to the Company’s collateral. A ratio analysis is used for all loans with balances less than $250,000. The Company maintains detailed analysis and other information for its allowance methodology, both for internal purposes and for review by its regulators.
The following table indicates the dollar amount of the allowance for loan losses, excluding PCI loans, including charge-offs and recoveries by loan type and related ratios as of December 31 of the years presented (dollars in thousands):
| 2020 |
| 2019 |
| 2018 |
| 2017 |
| 2016 |
| ||||||
Balance, beginning of year | $ | 8,429 | $ | 8,983 | $ | 8,969 | $ | 9,493 | $ | 9,559 | ||||||
Loans charged-off: |
|
|
|
|
|
|
|
|
|
| ||||||
Commercial |
| 608 |
| 724 |
| 45 |
| 431 |
| — | ||||||
Real estate |
| — |
| 667 |
| 216 |
| 797 |
| 687 | ||||||
Consumer and other loans |
| 176 |
| 253 |
| 220 |
| 285 |
| 191 | ||||||
Total loans charged-off |
| 784 |
| 1,644 |
| 481 |
| 1,513 |
| 878 | ||||||
Recoveries: |
|
|
|
|
|
|
|
|
|
| ||||||
Commercial |
| 87 |
| 184 |
| 49 |
| 5 |
| 11 | ||||||
Real estate |
| 319 |
| 465 |
| 234 |
| 282 |
| 245 | ||||||
Consumer and other loans |
| 89 |
| 116 |
| 212 |
| 152 |
| 106 | ||||||
Total recoveries |
| 495 |
| 765 |
| 495 |
| 439 |
| 362 | ||||||
Net charge-offs (recoveries) |
| 289 |
| 879 |
| (14) |
| 1,074 |
| 516 | ||||||
Provision for loan losses |
| 4,200 |
| 325 |
| — |
| 550 |
| 450 | ||||||
Balance, end of year | $ | 12,340 | $ | 8,429 | $ | 8,983 | $ | 8,969 | $ | 9,493 | ||||||
Allowance for loan losses to loans |
| 1.04 | % |
| 0.80 | % |
| 0.90 | % |
| 0.95 | % |
| 1.14 | % | |
Net charge-offs (recoveries) to average loans |
| 0.03 | % |
| 0.09 | % |
| (0.00) | % |
| 0.12 | % |
| 0.07 | % | |
Allowance to nonperforming loans |
| 276.68 | % |
| 159.28 | % |
| 94.57 | % |
| 99.37 | % |
| 92.68 | % | |
During 2020, the Company’s net charge-offs of $289,000 was a decrease of $590,000 from net charge-offs of $879,000 in the prior year. Net charge-offs (recoveries) by loan category to total net charge-offs (recoveries) were the following for 2020: 180.28% for commercial loans, (110.38)% for real estate loans, and 30.1% for consumer loans.
During 2019, the Company’s net charge-offs of $879,000 was an increase of $893,000 from net recoveries of $14,000 in the prior year and were primarily centered in commercial loans. Net charge-offs by loan category to total net charge-offs were the following for 2019: 61.4% for commercial loans, 23.0% for real estate loans, and 15.6% for consumer loans.
42
While the entire allowance is available to cover charge-offs from all loan types, the following table indicates the dollar amount allocation of the allowance for loan losses by loan type, as well as the ratio of the related outstanding loan balances to loans, excluding PCI loans, as of December 31 of the years presented (dollars in thousands):
2020 | 2019 | 2018 | 2017 | 2016 |
| |||||||||||||||||||||
| Amount |
| % |
| Amount |
| % |
| Amount |
| % |
| Amount |
| % |
| Amount |
| % |
| ||||||
Commercial | $ | 1,897 |
| 19.1 | % | $ | 1,980 |
| 18.1 | % | $ | 1,894 |
| 19.0 | % | $ | 1,139 |
| 16.9 | % | $ | 602 |
| 15.5 | % | |
Construction and land development |
| 2,545 |
| 15.4 |
| 1,044 |
| 13.9 |
| 1,161 |
| 12.1 |
| 1,247 |
| 11.4 |
| 2,195 |
| 11.7 | ||||||
Real estate mortgage |
| 7,772 |
| 64.5 |
| 5,246 |
| 66.9 |
| 4,499 |
| 67.5 |
| 6,423 |
| 71.0 |
| 5,068 |
| 72.0 | ||||||
Consumer and other |
| 126 |
| 1.0 |
| 121 |
| 1.1 |
| 164 |
| 1.4 |
| 113 |
| 0.7 |
| 142 |
| 0.8 | ||||||
Unallocated |
| — |
| — |
| 38 |
| — |
| 1,265 |
| — |
| 47 |
| — |
| 1,486 |
| — | ||||||
Total allowance | $ | 12,340 |
| 100 | % | $ | 8,429 |
| 100 | % | $ | 8,983 |
| 100 | % | $ | 8,969 |
| 100 | % | $ | 9,493 |
| 100 | % | |
Asset Quality and Allowance for Credit Losses – PCI assets
Loans accounted for under FASB ASC 310-30 are generally considered accruing and performing loans as the loans accrete interest income over the estimated life of the loan. Accordingly, acquired impaired loans that are contractually past due are still considered to be accruing and performing loans.
The PCI loans are subject to credit review standards for loans. If and when credit deterioration occurs subsequent to the date that they were acquired, a provision for credit loss for PCI loans will be charged to earnings for the full amount. The Company makes an estimate of the total cash flows it expects to collect from a pool of PCI loans, which includes undiscounted expected principal and interest. Over the life of the loan or pool, the Company continues to estimate cash flows expected to be collected. Subsequent decreases in cash flows expected to be collected over the life of the pool are recognized as impairments in the current period through the allowance for loan losses. Subsequent increases in expected cash flows are first used to reverse any existing valuation allowance for that loan or pool. Any remaining increase in cash flows expected to be collected is recognized as an adjustment to the yield over the remaining life of the pool.
Securities
The Company’s securities portfolio, excluding restricted equity securities, increased $69.8 million, or 31.4%, since year end 2019, to $292.5 million at December 31, 2020. State, county and municipal bonds, 50.2% of total securities, increased $22.6 million during the year and totaled $146.9 million at December 31, 2020. Gains on securities transactions, net totaled $284,000 during 2020 compared with $235,000 in 2019. The Company actively manages the portfolio to improve its liquidity and maximize the return within the desired risk profile.
43
The following table summarizes the securities portfolio by contractual maturity and issuer, including weighted average yields, excluding restricted stock, as of December 31, 2020 (dollars in thousands):
| 1 Year or Less |
| 1‑5 Years |
| 5‑10 Years |
| Over 10 Years |
| Total |
| ||||||
U.S. Treasury Issue and other |
|
|
|
|
|
|
|
|
|
| ||||||
U.S. Government agencies |
|
|
|
|
|
|
|
|
|
| ||||||
Amortized Cost | $ | 23,545 | $ | 12,791 | $ | 4,046 | $ | 8,998 | $ | 49,380 | ||||||
Fair Value |
| 23,544 |
| 12,839 |
| 4,029 |
| 8,940 |
| 49,352 | ||||||
Weighted Avg Yield |
| 0.06 | % |
| 1.10 | % |
| 1.38 | % |
| 0.89 | % |
| 0.56 | % | |
State, county and municipal(1) |
|
|
|
|
|
|
|
|
|
| ||||||
Amortized Cost |
| 8,226 |
| 50,008 |
| 61,749 |
| 19,805 |
| 139,788 | ||||||
Fair Value |
| 8,300 |
| 52,936 |
| 65,721 |
| 21,020 |
| 147,977 | ||||||
Weighted Avg Yield |
| 3.72 | % |
| 3.49 | % |
| 3.07 | % |
| 3.00 | % |
| 3.25 | % | |
Corporate and other bonds |
|
|
|
|
|
|
|
|
|
| ||||||
Amortized Cost |
| 9,596 |
| 33,725 |
| 19,656 |
| — |
| 62,977 | ||||||
Fair Value |
| 9,634 |
| 34,375 |
| 20,077 |
| — |
| 64,086 | ||||||
Weighted Avg Yield |
| 3.95 | % |
| 2.49 | % |
| 2.20 | % |
| — | % |
| 2.62 | % | |
Mortgage Backed securities |
|
|
|
|
|
|
|
|
|
| ||||||
Amortized Cost |
| 1,941 |
| 10,320 |
| 16,374 |
| 1,799 |
| 30,434 | ||||||
Fair Value |
| 1,952 |
| 10,979 |
| 17,456 |
| 1,802 |
| 32,189 | ||||||
Weighted Avg Yield |
| 1.46 | % |
| 2.58 | % |
| 2.39 | % |
| 2.60 | % |
| 2.41 | % | |
Total |
|
|
|
|
|
|
|
|
|
| ||||||
Amortized Cost |
| 43,308 |
| 106,844 |
| 101,825 |
| 30,602 |
| 282,579 | ||||||
Fair Value |
| 43,430 |
| 111,129 |
| 107,283 |
| 31,762 |
| 293,604 | ||||||
Weighted Avg Yield |
| 1.68 | % |
| 2.80 | % |
| 2.72 | % |
| 2.36 | % |
| 2.55 | % | |
| (1) | Computed on a tax equivalent basis |
The amortized cost and fair value of securities available for sale and held to maturity as of December 31 of the years presented are as follows (dollars in thousands):
December 31, 2020 | ||||||||||||
Gross Unrealized | ||||||||||||
| Amortized Cost |
| Gains |
| Losses |
| Fair Value | |||||
Securities Available for Sale |
|
|
|
|
|
|
|
| ||||
U.S. Treasury securities | $ | 23,500 | $ | — | $ | (1) | $ | 23,499 | ||||
U.S. Government agencies | 25,880 |
| 114 |
| (141) |
| 25,853 | |||||
State, county and municipal |
| 118,612 |
| 7,172 |
| (64) |
| 125,720 | ||||
Mortgage backed securities |
| 30,434 |
| 1,756 |
| (1) |
| 32,189 | ||||
Asset backed securities |
| 36,841 |
| 704 |
| (57) |
| 37,488 | ||||
Corporate bonds |
| 26,136 |
| 480 |
| (18) |
| 26,598 | ||||
Total securities available for sale | $ | 261,403 | $ | 10,226 | $ | (282) | $ | 271,347 | ||||
Securities Held to Maturity |
|
|
|
|
|
|
|
| ||||
U.S. Government agencies | $ | — | $ | — | $ | — | $ | — | ||||
State, county and municipal |
| 21,176 |
| 1,081 |
| — |
| 22,257 | ||||
Total securities held to maturity | $ | 21,176 | $ | 1,081 | $ | — | $ | 22,257 | ||||
44
December 31, 2019 | ||||||||||||
Gross Unrealized | ||||||||||||
| Amortized Cost |
| Gains |
| Losses |
| Fair Value | |||||
Securities Available for Sale |
|
|
|
|
|
|
|
| ||||
U.S. Government agencies | $ | 22,104 | $ | 51 | $ | (219) | $ | 21,936 | ||||
State, county and municipal |
| 95,467 | 3,167 | (42) | 98,592 | |||||||
Mortgage backed securities |
| 48,045 | 808 | (113) | 48,740 | |||||||
Asset backed securities |
| 11,637 | 49 | (82) | 11,604 | |||||||
Corporate bonds |
| 6,016 | 84 | (3) | 6,097 | |||||||
Total securities available for sale | $ | 183,269 | $ | 4,159 | $ | (459) | $ | 186,969 | ||||
Securities Held to Maturity |
|
|
|
|
| |||||||
U.S. Government agencies | $ | 10,000 | $ | — | $ | (12) | $ | 9,988 | ||||
State, county and municipal |
| 25,733 | 913 | (1) | 26,645 | |||||||
Total securities held to maturity | $ | 35,733 | $ | 913 | $ | (13) | $ | 36,633 | ||||
December 31, 2018 | ||||||||||||
Gross Unrealized | ||||||||||||
| Amortized Cost |
| Gains |
| Losses |
| Fair Value | |||||
Securities Available for Sale |
|
|
|
|
|
|
|
| ||||
U.S. Treasury securities | $ | 13,460 | $ | — | $ | (336) | $ | 13,124 | ||||
U.S. Government agencies |
| 24,689 |
| 71 |
| (151) |
| 24,609 | ||||
State, county and municipal |
| 112,465 |
| 1,018 |
| (941) |
| 112,542 | ||||
Mortgage backed securities |
| 46,877 |
| 196 |
| (656) |
| 46,417 | ||||
Asset backed securities |
| 5,342 |
| 73 |
| (4) |
| 5,411 | ||||
Corporate bonds |
| 4,685 |
| — |
| (62) |
| 4,623 | ||||
Total securities available for sale | $ | 207,518 | $ | 1,358 | $ | (2,150) | $ | 206,726 | ||||
Securities Held to Maturity |
|
|
|
|
|
|
|
| ||||
U.S. Government agencies | $ | 10,000 | $ | — | $ | (210) | $ | 9,790 | ||||
State, county and municipal |
| 32,108 |
| 419 |
| (64) |
| 32,463 | ||||
Total securities held to maturity | $ | 42,108 | $ | 419 | $ | (274) | $ | 42,253 | ||||
Deposits
The Company’s lending and investing activities are funded primarily through its deposits. Interest bearing deposits at December 31, 2020 were $1.100 billion, an increase of $114.9 million, or 11.7%, from December 31, 2019. Interest bearing checking accounts (formerly NOW accounts) of $239.6 million grew by $69.1 million, or 40.5%, during 2020, including growth of $38.5 million during the fourth quarter of 2020. Money market deposit accounts were $154.5 million at December 31, 2020 and grew $33.7 million, or 27.9%, during 2020. Savings accounts totaled $124.4 million at December 31, 2020 and grew $27.8 million, or 28.8%, during 2020. Strong growth in these non-maturity categories for the year has allowed the Bank to react to lower interest rates through proactive repricing in certificates of deposit, the highest costing deposit category. As a result, there has been less growth in time deposits over $250,000, which grew by $8.9 million, or 7.5%, in 2020 and were $128.4 million at December 31, 2020. Time deposits less than or equal to $250,000 declined $24.6 million in 2020 and were $452.9 million at December 31, 2020. Time deposit balances combined were 52.9% of interest bearing deposits at December 31, 2020 and 41.6% of all deposit balances. This is a decline from 60.6% of interest bearing balances and 51.3% of all deposit balances at December 31, 2019. The growth in interest bearing checking accounts, money market accounts and savings accounts, as well as in noninterest bearing deposits, was $250.9 million, or 44.3%, during 2020. A portion of this growth was associated with the $85.1 million in PPP loans originated during 2020 and stimulus checks issued under the CARES Act, as well as previously postponed business activity that resulted from the COVID-19 stay-at-home orders.
.
45
The following table summarizes deposits by product and percent of total deposits for the periods ended December 31 of the years presented (dollars in thousands):
2020 | 2019 | 2018 |
| |||||||||||||
% of | % of | % of |
| |||||||||||||
| Amount |
| Deposits |
| Amount |
| Deposits |
| Amount |
| Deposits |
| ||||
Noninterest bearing | $ | 298,901 | 21.4 | % | $ | 178,584 | 15.3 | % | $ | 165,086 | 14.2 | % | ||||
Interest bearing: | ||||||||||||||||
Interest checking | 239,628 | 17.1 | — | — | — | — | ||||||||||
NOW | — |
| — | 170,532 |
| 14.7 | 165,946 |
| 14.2 | |||||||
MMDA |
| 154,503 |
| 11.0 |
| 120,841 |
| 10.4 |
| 126,933 |
| 10.9 | ||||
Savings |
| 124,384 |
| 8.9 |
| 96,570 |
| 8.3 |
| 92,910 |
| 8.0 | ||||
Time deposits less than $100,000 |
| 452,885 |
| 32.4 |
| 263,619 |
| 22.7 |
| 264,678 |
| 22.7 | ||||
Time deposits $100,000 and over |
| 128,400 |
| 9.2 |
| 333,302 |
| 28.6 |
| 349,422 |
| 30.0 | ||||
Total interest bearing deposits | 1,099,800 | 78.6 | 984,864 | 84.7 | 999,889 | 85.8 | ||||||||||
$ | 1,398,701 |
| 100.0 | % | $ | 1,163,448 |
| 100.0 | % | $ | 1,164,975 |
| 100.0 | % | ||
The Company derives a significant amount of its deposits through time deposits, and certificates of deposit specifically. The following table summarizes the contractual maturity of time deposits $100,000 or more, as of December 31, 2020 (dollars in thousands):
Within 3 months |
| $ | 98,259 |
3‑6 months |
| 50,958 | |
6‑12 months |
| 127,592 | |
over 12 months |
| 63,709 | |
Total | $ | 340,518 |
Borrowings
The Company uses borrowings in conjunction with deposits to fund lending and investing activities. Borrowings include overnight borrowings from correspondent banks (federal funds purchased) and funding from the Federal Home Loan Bank (FHLB). The Company classifies all borrowings that will mature within a year from the date on which the Company enters into them as short-term advances. The following information is provided for borrowings balances, rates, and maturities as of December 31 of the years presented (dollars in thousands):
FHLB Borrowings | ||||||||||||
Federal Funds | Short-term | Long-term notes | ||||||||||
| Purchased |
| Advances |
| payable |
| Total | |||||
As of December 31, 2020 | ||||||||||||
Amount outstanding at year end | $ | — | $ | 10,000 | $ | 47,833 | $ | 57,833 | ||||
Maximum month-end outstanding balance |
| 7,254 | 20,000 |
| 48,500 | |||||||
Average outstanding balance during the year |
| 1,260 | 17,554 |
| 47,995 | |||||||
Average interest rate during the year |
| 1.55 | % | 0.70 | % |
| 1.11 | % | ||||
Average interest rate at year end |
| — | % | 0.24 | % |
| 1.04 | % | ||||
46
| FHLB Borrowings | |||||||||||
| Federal Funds | Short-term |
| Long-term notes | ||||||||
| Purchased |
| Advances |
| payable |
| Total | |||||
As of December 31, 2019 | ||||||||||||
Amount outstanding at year end | $ | 24,437 | $ | 20,000 | $ | 48,500 | $ | 68,500 | ||||
Maximum month-end outstanding balance |
| 24,437 | 50,000 |
| 48,667 | |||||||
Average outstanding balance during the year |
| 4,422 | 35,123 |
| 26,426 | |||||||
Average interest rate during the year |
| 2.56 | % | 2.45 | % |
| 1.76 | % | ||||
Average interest rate at year end |
| 2.26 | % | 1.74 | % |
| 1.45 | % | ||||
| FHLB Borrowings | |||||||||||
| Federal Funds | Short-term |
| Long-term notes | ||||||||
| Purchased |
| Advances |
| payable |
| Total | |||||
As of December 31, 2018 | ||||||||||||
Amount outstanding at year end | $ | 19,440 | $ | 40,000 | $ | 19,447 | $ | 59,447 | ||||
Maximum month-end outstanding balance |
| 20,000 | 75,500 |
| 30,929 | |||||||
Average outstanding balance during the year |
| 2,856 | 62,138 |
| 24,704 | |||||||
Average interest rate during the year |
| 2.28 | % | 1.97 | % |
| 1.76 | % | ||||
Average interest rate at year end |
| 2.94 | % | 2.53 | % |
| 1.87 | % | ||||
Liquidity
Liquidity represents the Company’s ability to meet present and future financial obligations through either the sale or maturity of existing assets or the acquisition of additional funds through liability management. Liquid assets include cash, interest bearing deposits with banks, federal funds sold and certain investment securities. As a result of the Company’s management of liquid assets and the ability to generate liquidity through liability funding, management believes that the Company maintains overall liquidity sufficient to satisfy its depositors’ requirements and meet its customers’ credit needs.
The Company’s results of operations are significantly affected by its ability to manage effectively the interest rate sensitivity and maturity of its interest earning assets and interest bearing liabilities. A summary of the Company’s liquid assets at December 31, 2020 and 2019 was as follows (dollars in thousands):
| December 31, 2020 |
| December 31, 2019 |
| |||
Cash and due from banks | $ | 17,845 | $ | 16,976 | |||
Interest bearing bank deposits |
| 45,118 |
| 11,708 | |||
Federal funds sold | 222 | — | |||||
Available for sale securities, at fair value, unpledged |
| 235,784 |
| 157,225 | |||
Total liquid assets | $ | 298,969 | $ | 185,909 | |||
Deposits and other liabilities | $ | 1,475,155 | $ | 1,275,361 | |||
Ratio of liquid assets to deposits and other liabilities |
| 20.27 | % |
| 14.58 | % | |
Capital Resources
The determination of capital adequacy depends upon a number of factors, such as asset quality, liquidity, earnings, growth trends and economic conditions. The Company seeks to maintain a strong capital base to support its growth and expansion plans, provide stability to current operations and promote public confidence in the Company. The adequacy of the Company’s capital is reviewed by management on an ongoing basis with reference to size, composition, and quality of the Company’s balance sheet. Moreover, capital levels are regulated and compared with industry standards.
Effective January 22, 2020, the Company’s Board of Directors authorized a share repurchase program to purchase up to 1,000,000 shares of the Company’s common stock. The Company purchased 130,800 shares under the program during the first two quarters of 2020 before suspending activity under it effective April 2, 2020 due to the uncertainties surrounding COVID-19. On October 26, 2020, the Company authorized the recommencement of the program for the
47
repurchase of up to 200,000 shares of its common stock through January 2021. The Company purchased an additional 178,900 shares as of December 31, 2020. Shares of common stock may be purchased under the program periodically in privately negotiated transactions or in open market transactions at prevailing market prices, and pursuant to a trading plan in accordance with applicable securities laws. The Company continues to place a heightened emphasis on capital and liquidity to safeguard shareholders, its balance sheet and the needs of its customers.
Management believes that the Company possesses strong capital and liquidity. The actions taken with regard to capital and liquidity as a result of the pandemic were put into effect to safeguard these areas of strength.
In August 2018, the Federal Reserve Board (Board) issued an interim final rule that raises the asset size threshold for determining applicability of the Board’s Small Bank Holding Company and Savings and Loan Holding Company Policy Statement (Policy Statement) from $1 billion to $3 billion of total consolidated assets and makes related and conforming revisions to the Board’s regulatory capital rule and requirements for bank holding companies. As such, the Company is no longer required to report nor manage regulatory capital ratios on a consolidated basis. The Company is only required to report these ratios for the Bank. Management seeks to maintain a capital level exceeding regulatory statutes of “well capitalized” that is consistent to its overall growth plans, yet allows the Company to provide the optimal return to its shareholders.
Under the final rule on Enhanced Regulatory Capital Standards, commonly referred to as Basel III and which became effective January 1, 2015, the federal banking regulators have defined four tests for assessing the capital strength and adequacy of banks, based on four definitions of capital. “Common equity tier 1 capital” is defined as common equity, retained earnings, and accumulated other comprehensive income (AOCI), less certain intangibles. “Tier 1 capital” is defined as common equity tier 1 capital plus qualifying perpetual preferred stock, tier 1 minority interests, and grandfathered trust preferred securities. “Tier 2 capital” is defined as specific subordinated debt, some hybrid capital instruments and other qualifying preferred stock, non-tier 1 minority interests and a limited amount of the allowance for loan losses. “Total capital” is defined as tier 1 capital plus tier 2 capital. Four risk-based capital ratios are computed using the above capital definitions, total assets and risk-weighted assets, and the ratios are measured against regulatory minimums to ascertain adequacy. All assets and off-balance sheet risk items are grouped into categories according to degree of risk and assigned a risk-weighting and the resulting total is risk-weighted assets. “Common equity tier 1 capital ratio” is common equity tier 1 capital divided by risk-weighted assets. “Tier 1 risk-based capital ratio” is tier 1 capital divided by risk-weighted assets. “Total risk-based capital ratio” is total capital divided by risk-weighted assets. “Leverage ratio” is tier 1 capital divided by total average assets.
Under the Basel III regulatory capital framework, a capital conservation buffer of 2.5% above the minimum risk-based capital thresholds was established. Dividend and executive compensation restrictions begin if the Bank does not maintain the full amount of the buffer. The Bank had a capital conservation buffer of 5.61% and 5.86% at December 31, 2020 and 2019, respectively, above the required buffer of 2.5% for each of 2020 and 2019.
The following table shows the Bank’s capital ratios at the dates indicated (dollars in thousands):
December 31, 2020 | December 31, 2019 |
| |||||||||
| Amount |
| Ratio |
| Amount |
| Ratio |
| |||
Total Capital to risk weighted assets | $ | 178,363 |
| 13.61 | % | $ | 164,783 |
| 13.86 | % | |
Tier 1 Capital to risk weighted assets |
| 166,210 |
| 12.68 | % |
| 156,541 |
| 13.16 | % | |
Common Equity Tier 1 Capital to risk weighted assets |
| 166,210 |
| 12.68 | % |
| 156,541 |
| 13.16 | % | |
Tier 1 Capital to adjusted average total assets |
| 166,210 |
| 10.14 | % |
| 156,541 |
| 11.03 | % | |
All capital ratios exceed regulatory minimums for well capitalized institutions as referenced in Note 19 to the Consolidated Financial Statements.
On December 12, 2003, BOE Statutory Trust I, a wholly-owned subsidiary of the Company, was formed for the purpose of issuing redeemable capital securities. On December 12, 2003, $4.124 million of trust preferred securities were issued through a direct placement. The securities have a LIBOR-indexed floating rate of interest. The average interest rate
48
at December 31, 2020 and 2019, was 3.98% and 5.45%, respectively. The securities have a mandatory redemption date of December 12, 2033 and are subject to varying call provisions that began December 12, 2008. The principal asset of the Trust is $4.124 million of the Company’s junior subordinated debt securities with like maturities and like interest rates to the capital securities.
Off-Balance Sheet Arrangements
A summary of the contract amount of the Company’s exposure to off-balance sheet risk as of December 31, 2020 and 2019, is as follows (dollars in thousands):
| December 31, 2020 |
| December 31, 2019 | |||
Commitments with off-balance sheet risk: |
|
|
|
| ||
Commitments to extend credit | $ | 245,858 | $ | 210,086 | ||
Standby letters of credit |
| 15,193 |
| 15,155 | ||
Total commitments with off-balance sheet risks | $ | 261,051 | $ | 225,241 | ||
Commitments to extend credit are agreements to lend to a customer as long as there is no violation of any condition established in the contract. Commitments generally have fixed expiration dates or other termination clauses and may require payment of a fee. Since many of the commitments are expected to expire without being drawn upon, the total commitment amounts do not necessarily represent future cash requirements. The Company evaluates each customer’s credit worthiness on a case-by-case basis. The amount of collateral obtained, if deemed necessary by the Company upon extension of credit, is based on management’s credit evaluation of the counterparty. Collateral held varies but may include accounts receivable, inventory, property and equipment, and income-producing commercial properties.
Unfunded commitments under lines of credit are commitments for possible future extensions of credit to existing customers. Those lines of credit may be drawn upon only to the total extent to which the Company is committed.
Standby letters of credit are conditional commitments issued by the Company to guarantee the performance of a customer to a third party. Those guarantees are primarily issued to support public and private borrowing arrangements, including commercial paper, bond financing, and similar transactions. The credit risk involved in issuing letters of credit is essentially the same as that involved in extending loan facilities to clients. The Company holds certificates of deposit, deposit accounts, and real estate as collateral supporting those commitments for which collateral is deemed necessary.
The Company designates derivatives as cash flow hedges when they are used to manage exposure to variability in cash flows related to forecasted transactions on variable rate borrowings, such as FHLB borrowings, repurchase agreements, and brokered CDs. The Company had cash flow hedges with total notional amounts of $20 million and $10 million at December 31, 2020 and 2019, respectively. The Company recorded a fair value liability of $631,000 and $44,000 in other liabilities at December 31, 2020 and 2019, respectively. The Company’s cash flow hedges are deemed to be highly effective. Therefore, the net gain was recorded as a component of other comprehensive income recorded in the Company’s consolidated statements of comprehensive income.
Financial Ratios
Financial ratios give investors a way to compare companies within industries to analyze financial performance. Return on average assets is net income as a percentage of average total assets. It is a key profitability ratio that indicates how effectively a bank has used its total resources. Return on average equity is net income as a percentage of average stockholders’ equity. It provides a measure of how productively a Company’s equity has been employed. Dividend payout ratio is the percentage of net income paid to common shareholders as cash dividends during a given period. It is computed by dividing dividends per share by net income per common share. The Company paid dividends to shareholders of $4.7 million and $2.9 million during the years ended December 31, 2020 and 2019, respectively. The Company did not pay dividends to shareholders during the years ended December 31, 2018. The Company utilizes leverage within guidelines prescribed by federal banking regulators as described in the “Capital Requirements” section. Leverage is average shareholders’ equity divided by average total assets.
49
The following table shows the Company’s financial ratios at the dates indicated:
Year Ended December 31 |
| ||||||
| 2020 |
| 2019 |
| 2018 |
| |
Return on average assets |
| 0.99 | % | 1.11 | % | 1.01 | % |
Return on average equity |
| 9.58 | % | 10.63 | % | 10.59 | % |
Dividend payout | 28.57 | % | 18.31 | — | |||
Leverage |
| 10.35 | % | 10.46 | % | 9.55 | % |
ITEM 7A. QUANTITATIVE AND QUALITATIVE DISCLOSURES ABOUT MARKET RISK
Market risk is the risk of loss in a financial instrument arising from adverse changes in market rates or prices such as interest rates, foreign currency exchange rates, commodity prices and equity prices. The Company’s primary market risk exposure is interest rate risk. The ongoing monitoring and management of interest rate risk is an important component of the Company’s asset/liability management process, which is governed by policies established by its Board of Directors that are reviewed and approved annually. The Board of Directors delegates responsibility for carrying out asset/liability management policies to the Asset/Liability Committee (ALCO) of the Bank. In this capacity, ALCO develops guidelines and strategies that govern the Company’s asset/liability management related activities, based upon estimated market risk sensitivity, policy limits and overall market interest rate levels and trends.
Interest rate risk represents the sensitivity of earnings to changes in market interest rates. As interest rates change, the interest income and expense streams associated with the Company’s financial instruments also change, affecting net interest income, the primary component of the Company’s earnings. ALCO uses the results of a detailed and dynamic simulation model to quantify the estimated exposure of net interest income to sustained interest rate changes. While ALCO routinely monitors simulated net interest income sensitivity over various periods, it also employs additional tools to monitor potential longer-term interest rate risk.
The simulation model captures the impact of changing interest rates on the interest income received and interest expense paid on all assets and liabilities reflected on the Company’s balance sheet. The simulation model is prepared and results are analyzed at least quarterly. This sensitivity analysis is compared to ALCO policy limits, which specify a maximum tolerance level for net interest income exposure over a one-year horizon, assuming no balance sheet growth, given a 400 basis point upward shift and a 400 basis point downward shift in interest rates. The downward shift of 300 or 400 basis points is included in the analysis, although less meaningful in the current rate environment, because all results are monitored regardless of likelihood. A parallel shift in rates over a 12-month period is assumed.
The following table represents the change to net interest income given interest rate shocks up and down 100, 200, 300 and 400 basis points at December 31, 2020, 2019 and 2018 (dollars in thousands):
2020 | 2019 | 2018 | ||||||||||
| % |
| $ |
| % |
| $ |
| % |
| $ | |
Change in Yield curve | ||||||||||||
+400 bp |
| 11.7 | 6,175 | 4.4 | 2,211 | 3.8 | 1,807 | |||||
+300 bp |
| 8.5 | 4,459 | 3.5 | 1,775 | 3.1 | 1,441 | |||||
+200 bp |
| 5.0 | 2,657 | 2.6 | 1,286 | 2.3 | 1,087 | |||||
+100 bp |
| 2.0 | 1,070 | 1.2 | 605 | 1.3 | 623 | |||||
most likely |
| — | — | — | — | — | — | |||||
‑100 bp |
| (0.3) | (147) | (0.8) | (410) | (1.6) | (758) | |||||
‑200 bp |
| (0.3) | (158) | (1.9) | (975) | (3.2) | (1,515) | |||||
‑300 bp |
| (0.3) | (161) | (2.0) | (995) | (5.1) | (2,403) | |||||
‑400 bp |
| (0.3) | (161) | (2.0) | (995) | (5.2) | (2,430) | |||||
At December 31, 2020, the Company’s interest rate risk model indicated that, in a rising rate environment of 400 basis points over a 12 month period, net interest income could increase by 11.7%. For the same time period, the interest rate risk model indicated that in a declining rate environment of 400 basis points, net interest income could decrease by
50
0.3%. While these percentages are subjective based upon assumptions used within the model, management believes the balance sheet is appropriately balanced with acceptable risk to changes in interest rates.
The preceding sensitivity analysis does not represent a forecast and should not be relied upon as being indicative of expected operating results. These hypothetical estimates are based upon numerous assumptions, including the nature and timing of interest rate levels such as yield curve shape, prepayments on loans and securities, deposit decay rates, pricing decisions on loans and deposits, reinvestment or replacement of asset and liability cash flows. While assumptions are developed based upon current economic and local market conditions, the Company cannot make any assurances about the predictive nature of these assumptions, including how customer preferences or competitor influences might change.
Also, as market conditions vary from those assumed in the sensitivity analysis, actual results will also differ due to factors such as prepayment and refinancing levels likely deviating from those assumed, the varying impact of interest rate change, caps or floors on adjustable rate assets, the potential effect of changing debt service levels on customers with adjustable rate loans, depositor early withdrawals and product preference changes, and other internal and external variables. Furthermore, the sensitivity analysis does not reflect actions that ALCO might take in response to, or in anticipation of, changes in interest rates
51
ITEM 8. FINANCIAL STATEMENTS AND SUPPLEMENTARY DATA
Index to Financial Statements
52
REPORT OF INDEPENDENT REGISTERED PUBLIC ACCOUNTING FIRM
To the Shareholders and Board of Directors
Community Bankers Trust Corporation
Richmond, Virginia
Opinion on the Financial Statements
We have audited the accompanying consolidated balance sheets of Community Bankers Trust Corporation and its Subsidiary (the Company) as of December 31, 2020 and 2019, the related consolidated statements of income, comprehensive income, changes in shareholders' equity and cash flows for the years then ended, and the related notes to the consolidated financial statements (collectively, the financial statements). In our opinion, the financial statements present fairly, in all material respects, the financial position of the Company as of December 31, 2020 and 2019, and the results of its operations and its cash flows for the years then ended, in conformity with accounting principles generally accepted in the United States of America.
Basis for Opinion
These financial statements are the responsibility of the Company’s management. Our responsibility is to express an opinion on the Company’s financial statements based on our audits. We are a public accounting firm registered with the Public Accounting Oversight Board (United States) (PCAOB) and are required to be independent with respect to the Company in accordance with U.S. federal securities laws and the applicable rules and regulations of the Securities and Exchange Commission and the PCAOB.
We conducted our audits in accordance with the standards of the PCAOB. Those standards require that we plan and perform the audits to obtain reasonable assurance about whether the financial statements are free of material misstatement, whether due to error or fraud. The Company is not required to have, nor were we engaged to perform, an audit of its internal control over financial reporting. As part of our audits we are required to obtain an understanding of internal control over financial reporting but not for the purpose of expressing an opinion on the effectiveness of the Company’s internal control over financial reporting. Accordingly, we express no such opinion.
Our audits included performing procedures to assess the risks of material misstatement of the financial statements, whether due to error or fraud, and performing procedures that respond to those risks. Such procedures included examining, on a test basis, evidence regarding the amounts and disclosures in the financial statements. Our audits also included evaluating the accounting principles used and significant estimates made by management, as well as evaluating the overall presentation of the financial statements. We believe that our audits provide a reasonable basis for our opinion.
Critical Audit Matters
The critical audit matter communicated below is a matter arising from the current period audit of the financial statements that was communicated or required to be communicated to the audit committee and that: (1) relates to accounts or disclosures that are material to the financial statements and (2) involved our especially challenging, subjective, or complex judgments. The communication of critical audit matters does not alter in any way our opinion on the financial statements, taken as a whole, and we are not, by communicating the critical audit matter below, providing separate opinions on the critical audit matter or on the accounts or disclosures to which it relates.
Allowance for Loan Losses – Loans Collectively Evaluated for Impairment – Quantitative & Qualitative Allocations
Description of the Matter
As described in Note 1 (Summary of Significant Accounting Policies) and Note 3 (Loans and Related Allowance for Loan Losses) to the consolidated financial statements, the Company maintains an allowance for loan losses that it believes is appropriate to absorb estimated losses relating to specifically identified loans, as well as probable credit losses inherent in the balance of the loan portfolio, based on an evaluation of the collectability of existing loans and prior loss experience. The Company’s allowance for loan losses has three basic components: specific, general and unallocated. At December 31, 2020, the general allowance represented $11,175,000 of the total allowance for loan losses of $12,340,000 and the unallocated represented $0. For loans that are not specifically identified for impairment, the general allowance uses historical loss experience along with various quantitative and qualitative allocations to develop a general reserve for each
53
loan segment. The adjustments to the historical loss experience are established by applying quantitative allocations based on risk grade migration trends, severe delinquency trends, concentration trends and qualitative allocations for internal and external environmental factors. Quantitative and qualitative factors are determined based on management’s continuing evaluation of inputs and assumptions underlying the quality of the loan portfolio. Management evaluates qualitative factors, primarily considering loan review results; policy exceptions; collateral values; management changes; and economic factors.
Management exercised significant judgment when assessing the quantitative and qualitative allocations in estimating the allowance for loan losses. We identified the assessment of the quantitative and qualitative allocations as a critical audit matter as auditing these allocations involved especially complex and subjective auditor judgment in evaluating management’s assessment of the inherently subjective estimates.
How We Addressed the Matter in Our Audit
The primary audit procedures we performed to address this critical audit matter included:
● Substantively testing management’s process, including evaluating their judgments and assumptions for developing the quantitative and qualitative allocations, which included: |
| ● | Evaluating the completeness and accuracy of data inputs used as a basis for the quantitative and qualitative allocations. |
| ● | Evaluating the reasonableness of management’s judgments related to the determination of quantitative and qualitative allocations. |
| ● | Evaluating the quantitative and qualitative allocations for directional consistency and for reasonableness. |
| ● | Testing the mathematical accuracy of the allowance calculation, including the application of the quantitative and qualitative allocations. |
/s/ Yount, Hyde & Barbour, P.C.
We have served as the Company's auditor since 2018.
Richmond, Virginia
March 15, 2021
54
COMMUNITY BANKERS TRUST CORPORATION
CONSOLIDATED BALANCE SHEETS
AS OF DECEMBER 31, 2020 AND DECEMBER 31, 2019
(dollars in thousands, except share data)
| December 31, 2020 |
| December 31, 2019 | |||
ASSETS | ||||||
Cash and due from banks | $ | | $ | | ||
Interest bearing bank deposits |
| |
| | ||
Federal funds sold | | — | ||||
Total cash and cash equivalents |
| |
| | ||
Securities available for sale, at fair value |
| |
| | ||
Securities held to maturity, at cost (fair value of $ |
| |
| | ||
Equity securities, restricted, at cost |
| |
| | ||
Total securities |
| |
| | ||
Loans held for sale |
| — |
| | ||
Loans |
| |
| | ||
Purchased credit impaired (PCI) loans |
| |
| | ||
Total loans |
| |
| | ||
Allowance for loan losses (loans of $ |
| ( |
| ( | ||
Net loans |
| |
| | ||
Bank premises and equipment, net |
| |
| | ||
Bank premises and equipment held for sale |
| |
| | ||
Right-of-use lease assets | | | ||||
Other real estate owned |
| |
| | ||
Bank owned life insurance |
| |
| | ||
Other assets |
| |
| | ||
Total assets | $ | | $ | | ||
LIABILITIES |
|
|
|
| ||
Deposits: |
|
|
|
| ||
Noninterest bearing | $ | | $ | | ||
Interest bearing |
| |
| | ||
Total deposits |
| |
| | ||
Federal funds purchased |
| - |
| | ||
Federal Home Loan Bank borrowings |
| |
| | ||
Trust preferred capital notes |
| |
| | ||
Lease liabilities | | | ||||
Other liabilities |
| |
| | ||
Total liabilities |
| |
| | ||
SHAREHOLDERS’ EQUITY |
|
|
|
| ||
Common stock ( |
| |
| | ||
Additional paid in capital |
| |
| | ||
Retained earnings |
| |
| | ||
Accumulated other comprehensive income |
| |
| | ||
Total shareholders’ equity |
| |
| | ||
Total liabilities and shareholders’ equity | $ | | $ | | ||
See accompanying notes to consolidated financial statements
55
COMMUNITY BANKERS TRUST CORPORATION
CONSOLIDATED STATEMENTS OF INCOME
FOR THE YEARS ENDED DECEMBER 31, 2020 AND 2019
(dollars and shares in thousands, except per share data)
2020 |
| 2019 | ||||
Interest and dividend income |
|
|
| |||
Interest and fees on loans | $ | | $ | | ||
Interest and fees on PCI loans |
| |
| | ||
Interest on federal funds sold |
| - |
| | ||
Interest on deposits in other banks |
| |
| | ||
Interest and dividends on securities |
|
|
|
| ||
Taxable |
| |
| | ||
Nontaxable |
| |
| | ||
Total interest and dividend income |
| |
| | ||
Interest expense |
|
|
|
| ||
Interest on deposits |
| |
| | ||
Interest on borrowed funds |
| |
| | ||
Total interest expense |
| |
| | ||
Net interest income |
| |
| | ||
Provision for loan losses |
| |
| | ||
Net interest income after provision for loan losses |
| |
| | ||
Noninterest income |
|
|
|
| ||
Service charges and fees |
| |
| | ||
Gain on securities transactions, net |
| |
| | ||
Gain on sale of other loans |
| |
| | ||
Income on bank owned life insurance |
| |
| | ||
Mortgage loan income |
| |
| | ||
Other |
| |
| | ||
Total noninterest income |
| |
| | ||
Noninterest expense |
|
|
|
| ||
Salaries and employee benefits |
| |
| | ||
Occupancy expenses |
| |
| | ||
Equipment expenses |
| |
| | ||
FDIC assessment |
| |
| | ||
Data processing fees |
| |
| | ||
Other real estate expense, net |
| |
| | ||
Other operating expenses |
| |
| | ||
Total noninterest expense |
| |
| | ||
Income before income taxes |
| |
| | ||
Income tax expense |
| |
| | ||
Net income | $ | | $ | | ||
Net income per share — basic | $ | | $ | | ||
Net income per share — diluted | $ | | $ | | ||
Weighted average number of shares outstanding |
|
|
|
| ||
Basic |
| |
| | ||
Diluted |
| |
| | ||
See accompanying notes to consolidated financial statements
56
COMMUNITY BANKERS TRUST CORPORATION
CONSOLIDATED STATEMENTS OF COMPREHENSIVE INCOME
FOR THE YEARS ENDED DECEMBER 31, 2020 AND 2019
(dollars in thousands)
2020 |
| 2019 | ||||
Net income | $ | | $ | | ||
Other comprehensive income: | ||||||
Unrealized gain on investment securities: | ||||||
Change in unrealized gain on investment securities |
| |
| | ||
Tax related to unrealized gain on investment securities |
| ( |
| ( | ||
Reclassification adjustment for gain on securities sold |
| ( |
| ( | ||
Tax related to realized gain on securities sold |
| |
| | ||
Defined benefit pension plan: | ||||||
Change in prior service cost |
| |
| | ||
Change in unrealized loss on plan assets |
| ( |
| ( | ||
Tax related to defined benefit pension plan |
| |
| | ||
Cash flow hedge: | ||||||
Change in unrealized loss on cash flow hedge |
| ( |
| ( | ||
Tax related to cash flow hedge |
| |
| | ||
Total other comprehensive income |
| |
| | ||
Total comprehensive income | $ | | $ | | ||
See accompanying notes to consolidated financial statements
57
COMMUNITY BANKERS TRUST CORPORATION
CONSOLIDATED STATEMENTS OF CHANGES IN SHAREHOLDERS’ EQUITY
FOR THE YEARS ENDED DECEMBER 31, 2020 AND 2019
(dollars and shares in thousands)
Accumulated | |||||||||||||||||
Additional | Retained | Other | |||||||||||||||
Common Stock | Paid in | Earnings | Comprehensive | ||||||||||||||
| Shares |
| Amount |
| Capital |
| (Deficit) |
| Income (Loss) |
| Total | ||||||
Balance December 31, 2018 | | $ | | $ | | $ | ( | $ | ( | $ | | ||||||
Issuance of common stock | |
| — |
| |
| — |
| — |
| | ||||||
Exercise and issuance of employee stock options | |
| |
| |
| — |
| — |
| | ||||||
Net income | — |
| — |
| — |
| |
| — |
| | ||||||
Dividends paid on common stock ($ | — |
| — |
| — |
| ( |
| — |
| ( | ||||||
Other comprehensive income | — |
| — |
| — |
| — |
| |
| | ||||||
Balance December 31, 2019 | | $ | | $ | | $ | | $ | | $ | | ||||||
Issuance of common stock | |
| — |
| |
| — |
| — |
| | ||||||
Exercise and issuance of employee stock options | |
| |
| |
| — |
| — |
| | ||||||
Stock purchased under stock repurchase program | ( | ( | ( | — | ( | ||||||||||||
Net income | — |
| — |
| — |
| |
| — |
| | ||||||
Dividends paid on common stock ($ | — |
| — |
| — |
| ( |
| — |
| ( | ||||||
Other comprehensive income | — |
| — |
| — |
| — |
| |
| | ||||||
Balance December 31, 2020 | | $ | | $ | | $ | | $ | | $ | | ||||||
See accompanying notes to consolidated financial statements
58
COMMUNITY BANKERS TRUST CORPORATION
CONSOLIDATED STATEMENTS OF CASH FLOWS
FOR THE YEARS ENDED DECEMBER 31, 2020 AND 2019
(dollars in thousands)
2020 |
| 2019 | ||||
Operating activities: | ||||||
Net income | $ | | $ | | ||
Adjustments to reconcile net income to net cash provided by operating activities: | ||||||
Depreciation |
| |
| | ||
Right-of-use lease asset amortization | | | ||||
Stock-based compensation expense |
| |
| | ||
Tax benefit of exercised stock options |
| ( |
| ( | ||
Amortization of purchased loan premium |
| |
| | ||
Deferred tax (benefit) expense |
| ( |
| | ||
Provision for loan losses |
| |
| | ||
Amortization of security premiums and accretion of discounts, net |
| |
| | ||
Net gain on sale of securities |
| ( |
| ( | ||
Net loss (gain) on sale and valuation of other real estate owned |
| |
| ( | ||
Net loss on disposal of premises and equipment | | | ||||
Net gain on sale of loans |
| ( |
| ( | ||
Net gain on sale of mortgages held for sale | ( | ( | ||||
Originations of mortgages held for sale |
| ( |
| ( | ||
Proceeds from sales of mortgages held for sale |
| |
| | ||
Increase in bank owned life insurance investment | ( | ( | ||||
Changes in assets and liabilities: |
| |||||
(Increase) decrease in other assets |
| ( |
| | ||
Decrease in accrued expenses and other liabilities |
| ( | ( | |||
Net cash provided by operating activities |
| |
| | ||
Investing activities: |
|
|
|
| ||
Proceeds from sales/calls/maturities/paydowns of available for sale securities |
| |
| | ||
Proceeds from calls/maturities/paydowns of held to maturity securities |
| |
| | ||
Proceeds from sales of restricted equity securities |
| |
| | ||
Purchase of available for sale securities |
| ( |
| ( | ||
Purchase of restricted equity securities |
| ( |
| ( | ||
Proceeds from sale of other real estate owned |
| |
| | ||
Net increase in loans |
| ( |
| ( | ||
Principal recoveries of loans previously charged off |
| |
| | ||
Purchase of premises and equipment, net |
| ( |
| ( | ||
Purchase small business investment company fund investment |
| ( |
| ( | ||
Proceeds from bank owned life insurance investment |
| — |
| | ||
Proceeds from sale of loans |
| |
| | ||
Net cash used in investing activities |
| ( |
| ( | ||
Financing activities: |
|
|
|
| ||
Net increase (decrease) in deposits |
| |
| ( | ||
Net (decrease) increase in federal funds purchased |
| ( |
| | ||
Net decrease in short-term Federal Home Loan Bank borrowings |
| ( |
| ( | ||
Proceeds from long-term Federal Home Loan Bank borrowings |
| |
| | ||
Payments on long-term Federal Home Loan Bank borrowings |
| ( |
| ( | ||
Proceeds from issuance of common stock |
| |
| | ||
Cash dividends paid | ( | ( | ||||
Repurchase of common stock |
| ( |
| — | ||
Net cash provided by financing activities |
| |
| | ||
Net increase (decrease) in cash and cash equivalents |
| |
| ( | ||
Cash and cash equivalents: |
|
|
|
| ||
Beginning of the period |
| |
| | ||
End of the period | $ | | $ | | ||
Supplemental disclosures of cash flow information: |
|
|
|
| ||
Interest paid | $ | | $ | | ||
Income taxes paid |
| |
| | ||
Transfers of loans to other real estate owned |
| — |
| | ||
Right-of-use lease assets in exchange for lease liability | — | | ||||
Transfers of building premises and equipment to held for sale |
| — |
| | ||
See accompanying notes to consolidated financial statements
59
COMMUNITY BANKERS TRUST CORPORATION
NOTES TO CONSOLIDATED FINANCIAL STATEMENTS
Note 1. Nature of Banking Activities and Significant Accounting Policies
Organization
Community Bankers Trust Corporation (the “Company”) is headquartered in Richmond, Virginia and is the holding company for Essex Bank (the “Bank”), a Virginia state bank with
The Bank engages in a general commercial banking business and provides a wide range of financial services primarily to individuals, small businesses and larger commercial companies, including individual and commercial demand and time deposit accounts, commercial and industrial loans, consumer and small business loans, real estate and mortgage loans, investment services, on-line and mobile banking products, and cash management services.
Principles of Consolidation
The accompanying consolidated financial statements include the accounts of the Company and the Bank, its wholly-owned subsidiary. All intercompany balances and transactions have been eliminated in consolidation. Financial Accounting Standards Board (FASB) Accounting Standards Codification (ASC) 810, Consolidation, requires that the Company no longer eliminate through consolidation the equity investment in BOE Statutory Trust I, which was $
Cash and Cash Equivalents
For purposes of the consolidated statements of cash flows, the Company has defined cash and cash equivalents as cash and due from banks and interest-bearing bank balances.
Securities
Debt securities that management has the positive intent and ability to hold to maturity are classified as “held to maturity” and recorded at amortized cost. Securities not classified as held to maturity, including equity securities with readily determinable fair values, are classified as “available for sale” and recorded at fair value, with unrealized gains and losses excluded from earnings and reported in other comprehensive income.
Purchase premiums and discounts are recognized in interest income using the interest method over the terms of the securities. Declines in the fair value of held-to-maturity and available-for-sale securities below their cost that are deemed to be other than temporary are reflected in earnings as realized losses. In estimating other than temporary impairment losses, management considers (1) the length of time and the extent to which the fair value has been less than cost, (2) the financial condition and near-term prospects of the issuer, and (3) the intent and ability of the Company to retain its investment in the issuer for a period of time sufficient to allow for any anticipated recovery in fair value. Gains and losses on the sale of securities are determined using the specific identification method.
Restricted Securities
The Company is required to maintain an investment in the capital stock of certain correspondent banks. The Company’s investment in these securities is recorded at cost.
60
Loans Held for Sale
Mortgage loans originated and intended for sale in the secondary market are carried at the lower of cost or estimated fair value in the aggregate. Net unrealized losses are recognized through a valuation allowance by charges to income. Mortgage loans held for sale are sold with the mortgage servicing rights released by the Company.
The Company enters into commitments to originate certain mortgage loans whereby the interest rate on the loans is determined prior to funding (rate lock commitments). Rate lock commitments on mortgage loans that are intended to be sold are considered to be derivatives. The period of time between issuance of a loan commitment and closing and the sale of the loan generally ranges from thirty to forty-five days. The Company protects itself from changes in interest rates through the use of best efforts forward delivery commitments, whereby the Company commits to sell a loan at the time the borrower commits to an interest rate with the intent that the buyer has assumed interest rate risk on the loan. As a result, the Company is not exposed to losses nor will it realize significant gains related to its rate lock commitments due to changes in interest rates. The correlation between the rate lock commitments and the best efforts contracts is very high due to their similarity. Because of this high correlation, the gain or loss that occurs on the rate lock commitments is immaterial.
Loans
The Bank grants mortgage, commercial and consumer loans to customers. A significant portion of the loan portfolio is represented by 1-4 family residential and commercial mortgage loans. The ability of the Bank’s debtors to honor their contracts is dependent upon the real estate and general economic conditions in the Bank’s market area.
Loans that management has the intent and ability to hold for the foreseeable future or until maturity or pay-off generally are reported at their outstanding unpaid principal balances adjusted for charge-offs, the allowance for loan losses, and any deferred fees or costs on originated loans. Interest income is accrued on the unpaid principal balance. Loan origination fees, net of certain direct origination costs, are deferred and recognized as an adjustment of the related loan yield using the effective interest method.
The accrual of interest on mortgage and commercial loans is discontinued at the time the loan is 90 days delinquent unless the credit is well-secured and in process of collection. Consumer loans are typically charged off no later than 180 days past due. In all cases, loans are placed on nonaccrual or charged-off at an earlier date if collection of principal or interest is considered doubtful.
All interest accrued but not collected for loans that are placed on nonaccrual or charged-off is reversed against interest income. The interest on these loans is accounted for on the cash-basis or cost-recovery method until qualifying for return to accrual status. Loans are returned to accrual status when all of the principal and interest amounts contractually due are brought current and future payments are reasonably assured.
Allowance for Loan Losses on Loans
The allowance for loan losses is established as losses are estimated to have occurred through a provision for loan losses charged to earnings. Loan losses are charged against the allowance when management believes the uncollectability of a loan balance is confirmed. Subsequent recoveries, if any, are credited to the allowance.
The allowance is an amount that management believes is appropriate to absorb estimated losses relating to specifically identified loans, as well as probable credit losses inherent in the balance of the loan portfolio, based on an evaluation of the collectability of existing loans and prior loss experience. This evaluation also takes into consideration such factors as changes in the nature and volume of the loan portfolio, overall portfolio quality, review of specific problem loans, and current economic conditions that may affect the borrower’s ability to pay. This evaluation does not
61
include the effects of expected losses on specific loans or groups of loans that are related to future events or expected changes in economic conditions. The evaluation also considers the following risk characteristics of each loan portfolio:
| ● | Residential 1-4 family mortgage loans include HELOCs and single family investment properties secured by first liens. The carry risks associated with owner-occupied and investment properties are the continued credit-worthiness of the borrower, changes in the value of the collateral, successful property maintenance and collection of rents due from tenants. The Company manages these risks by using specific underwriting policies and procedures and by avoiding concentrations in geographic regions. |
| ● | Commercial real estate loans, including owner occupied and non-owner occupied mortgages, carry risks associated with the successful operations of the principal business operated on the property securing the loan or the successful operation of the real estate project securing the loan. General market conditions and economic activity may impact the performance of these loans. In addition to using specific underwriting policies and procedures for these types of loans, the Company manages risk by avoiding concentrations to any one business or industry, and by diversifying the lending to various lines of businesses, such as retail, office, office warehouse, industrial and hotel. |
| ● | Construction and land development loans are generally made to commercial and residential builders/developers for specific construction projects, as well as to consumer borrowers. These carry more risk than real estate term loans due to the dynamics of construction projects, changes in interest rates, the long-term financing market and state and local government regulations. The Company manages risk by using specific underwriting policies and procedures for these types of loans and by avoiding concentrations to any one business or industry and by diversifying lending to various lines of businesses, in various geographic regions and in various sales or rental price points. |
| ● | Second mortgages on residential 1-4 family loans carry risk associated with the continued credit-worthiness of the borrower, changes in value of the collateral and a higher risk of loss in the event the collateral is liquidated due to the inferior lien position. The Company manages risk by using specific underwriting policies and procedures. |
| ● | Multifamily loans carry risks associated with the successful operation of the property, general real estate market conditions and economic activity. In addition to using specific underwriting policies and procedures, the Company manages risk by avoiding concentrations in geographic regions and by diversifying the lending to various unit mixes, tenant profiles and rental rates. |
| ● | Agriculture loans carry risks associated with the successful operation of the business, changes in value of non-real estate collateral that may depreciate over time and inventory that may be affected by weather, biological, price, labor, regulatory and economic factors. The Company manages risks by using specific underwriting policies and procedures, as well as avoiding concentrations to individual borrowers and by diversifying lending to various agricultural lines of business (i.e., crops, cattle, dairy, etc.). |
| ● | Commercial loans carry risks associated with the successful operation of the business, changes in value of non-real estate collateral that may depreciate over time, accounts receivable whose collectability may change and inventory values that may be subject to various risks including obsolescence. General market conditions and economic activity may also impact the performance of these loans. In addition to using specific underwriting policies and procedures for these types of loans, the Company manages risk by diversifying the lending to various industries and avoids geographic concentrations. |
| ● | Consumer installment loans carry risks associated with the continued credit-worthiness of the borrower and the value of rapidly depreciating assets or lack thereof. These types of loans are more likely than real estate loans to be quickly and adversely affected by job loss, divorce, illness or personal bankruptcy. The Company manages risk by using specific underwriting policies and procedures for these types of loans. |
| ● | All other loans generally support the obligations of state and political subdivisions in the U.S. and are not a material source of business for the Company. The loans carry risks associated with the continued credit-worthiness of the obligations and economic activity. The Company manages risk by using specific underwriting policies and procedures for these types of loans. |
While management uses the best information available to make its evaluation, future adjustments to the allowance may be necessary if there are significant changes in economic conditions. In addition, regulatory agencies, as an integral part of their examination process, periodically review the Company’s allowance for loan losses, and may require the
62
Company to make additions to the allowance based on their judgment about information available to them at the time of their examinations.
The allowance consists of specific, general and unallocated components. For loans that are also classified as impaired, an allowance is established when the collateral value (or discounted cash flows or observable market price) of the impaired loan is lower than the carrying value of that loan. The general component covers non-classified loans and is based on historical loss experience adjusted for qualitative factors. The unallocated component covers uncertainties that could affect management’s estimate of probable losses.
A loan is considered impaired when, based on current information and events, it is probable that the Company will be unable to collect the scheduled payments of principal or interest when due according to the contractual terms of the loan agreement. Factors considered by management in determining impairment include payment status, collateral value, and the probability of collecting scheduled principal and interest payments when due. Loans that experience insignificant payment delays and payment shortfalls generally are not classified as impaired. Management determines the significance of payment delays and payment shortfalls on a case-by-case basis, taking into consideration all of the circumstances surrounding the loan and the borrower, including the length of the delay, the reasons for the delay, the borrower’s prior payment record, and the amount of the shortfall in relation to the principal and interest owed. Impairment is measured on a loan by loan basis for commercial and construction loans by either the present value of the expected future cash flows discounted at the loan’s effective interest rate, the loan’s obtainable market price, or the fair value of the collateral if the loan is collateral dependent.
Large groups of smaller balance homogeneous loans are evaluated for impairment as a pool. Accordingly, the Company does not separately analyze these individual loans for impairment disclosures.
Accounting for Certain Loans Acquired in a Transfer
FASB ASC 310, Receivables requires acquired loans to be recorded at fair value and prohibits carrying over valuation allowances in the initial accounting for acquired impaired loans. Loans carried at fair value, mortgage loans held for sale, and loans to borrowers in good standing under revolving credit arrangements are excluded from the scope of FASB ASC 310 which limits the yield that may be accreted to the excess of the undiscounted expected cash flows over the investor’s initial investment in the loan. The excess of the contractual cash flows over expected cash flows may not be recognized as an adjustment of yield. Subsequent increases in cash flows to be collected are recognized prospectively through an adjustment of the loan’s yield over its remaining life. Decreases in expected cash flows are recognized as impairments through the allowance for loan losses.
The Company’s acquired loans from the Suburban Federal Savings Bank (SFSB) transaction (the “PCI loans”), subject to FASB ASC Topic 805, Business Combinations, were recorded at fair value and no separate valuation allowance was recorded at the date of acquisition. FASB ASC 310-30, Loans and Debt Securities Acquired with Deteriorated Credit Quality, applies to loans acquired in a transfer with evidence of deterioration of credit quality for which it is probable, at acquisition, that the investor will be unable to collect all contractually required payments receivable. The Company is applying the provisions of FASB ASC 310-30 to all loans acquired in the SFSB transaction. The Company has grouped loans together based on common risk characteristics including product type, delinquency status and loan documentation requirements among others.
The PCI loans are subject to the credit review standards described above for loans. If and when credit deterioration occurs subsequent to the date that the loans were acquired, a provision for loan loss for PCI loans will be charged to earnings for the full amount.
The Company has made an estimate of the total cash flows it expects to collect from each pool of loans, which includes undiscounted expected principal and interest. The excess of that amount over the fair value of the pool is referred to as accretable yield. Accretable yield is recognized as interest income on a constant yield basis over the life of the pool. The Company also determines each pool’s contractual principal and contractual interest payments. The excess of that amount over the total cash flows that it expects to collect from the pool is referred to as nonaccretable difference, which is not recorded. Judgmental prepayment assumptions are applied to both contractually required payments and cash
63
flows expected to be collected at acquisition. Over the life of the loan or pool, the Company continues to estimate cash flows expected to be collected. Subsequent decreases in cash flows expected to be collected over the life of the pool are recognized as an impairment in the current period through the allowance for loan loss. Subsequent increases in expected or actual cash flows are first used to reverse any existing valuation allowance for that loan or pool. Any remaining increase in cash flows expected to be collected is recognized as an adjustment to the accretable yield with the amount of periodic accretion adjusted over the remaining life of the pool.
Bank Premises and Equipment
Bank premises and equipment are stated at cost less accumulated depreciation. Land is carried at cost. Depreciation of bank premises and equipment is computed on the straight-line method over estimated useful lives of to
Costs of maintenance and repairs are charged to expense as incurred and major improvements are capitalized. Upon sale or retirement of depreciable properties, the cost and related accumulated depreciation are eliminated from the accounts and the resulting gain or loss is included in the determination of income.
Other Real Estate Owned
Real estate acquired through, or in lieu of, loan foreclosure is held for sale and is initially recorded at the fair value at the date of foreclosure net of estimated disposal costs, establishing a new cost basis. Subsequent to foreclosure, valuations are periodically performed by management and the assets are carried at the lower of the carrying amount or the fair value less costs to sell. Revenues and expenses from operations and changes in the valuation allowance are included in other operating expenses. Costs to bring a property to salable condition are capitalized up to the fair value of the property while costs to maintain a property in salable condition are expensed as incurred. The Company had $
Bank Owned Life Insurance
The Company is the owner and beneficiary of bank owned life insurance (BOLI) policies on certain current and former Bank employees. These policies are recorded at their cash surrender value and can be liquidated, if necessary, with associated tax costs. Income generated from these policies is recorded as noninterest income. The Bank is exposed to credit risk to the extent an insurance company is unable to fulfill its financial obligations under a policy.
Advertising Costs
The Company follows the policy of expensing advertising costs as incurred, which totaled $
Income Taxes
Deferred income tax assets and liabilities are determined using the liability (or balance sheet) method. Under this method, the net deferred tax asset or liability is determined based on the tax effects of the temporary differences between the book and tax bases of the various balance sheet assets and liabilities and gives current recognition to changes in tax rates and laws.
Positions taken in the Company’s tax returns may be subject to challenge by the taxing authorities upon examination. Uncertain tax positions are initially recognized in the consolidated financial statements when it is more likely than not that the position will be sustained upon examination by the tax authorities. Such tax positions are both initially and subsequently measured as the largest amount of tax benefit that is greater than 50 percent likely of being realized upon settlement with the tax authority, assuming full knowledge of the position and all relevant facts. The Company had no uncertain tax positions at each of December 31, 2020 and 2019. The Company provides for interest and, in some cases, penalties on tax positions that may be challenged by the taxing authorities. Interest expense is recognized beginning in the first period that such interest would begin accruing. Penalties are recognized in the period
64
that the Company claims the position in the tax return. Interest and penalties on income tax uncertainties are classified within income tax expense in the consolidated statement of income. The Company had no interest or penalties during the years ended December 31, 2020 or 2019. Under FASB ASC 740, Income Taxes, a valuation allowance is provided when it is more likely than not that some portion of the deferred tax asset will not be realized. In management’s opinion, based on a three year taxable income projection, tax strategies that would result in potential securities gains and the effects of off-setting deferred tax liabilities, it is more likely than not that the deferred tax assets are realizable; therefore no allowance is required.
The Company and its subsidiaries are subject to U. S. federal income tax as well as income tax for various states. All years from 2017 through 2020 are open to examination by the respective tax authorities.
Earnings Per Share
Basic earnings per share (EPS) is computed based on the weighted average number of shares outstanding and excludes any dilutive effects of options, warrants and convertible securities. Diluted EPS is computed in a manner similar to basic EPS, except for certain adjustments to the denominator. Diluted EPS gives effect to all dilutive potential common shares that were outstanding at the end of the period. Potential common shares that may be issued by the Company relate solely to outstanding stock options and are determined using the treasury stock method. Dividends of $
Stock-Based Compensation
In April 2009, the Company adopted the Community Bankers Trust Corporation 2009 Stock Incentive Plan, which was authorized to issue up to
Derivatives - Cash Flow Hedge
The Company uses interest rate derivatives to manage certain amounts of its exposure to interest rate movements. To accomplish this objective, the Company is a party to interest rate swaps whereby the Company pays fixed amounts to a counterparty in exchange for receiving variable payments over the life of an underlying agreement without the exchange of underlying notional amounts.
Derivatives designated as cash flow hedges are used primarily to minimize the variability in cash flows of assets or liabilities caused by interest rates. Cash flow hedges are periodically tested for effectiveness, which measures the correlation of the cash flows of the hedged item with the cash flows from the derivative. The changes in the fair value of derivatives designated as cash flow hedges is recorded in accumulated other comprehensive income and is subsequently reclassified into net income in the period that the hedged forecasted transaction affects earnings. The Company’s cash flow hedge was deemed effective for each of the years ended 2020 and 2019.
Recent Accounting Pronouncements
Adopted in 2020
In August 2018, the FASB issued Accounting Standards Update (ASU) 2018-13, Fair Value Measurement (Topic 820): Disclosure Framework—Changes to the Disclosure Requirements for Fair Value Measurement. The ASU removes, modifies, and adds to existing fair value measurement disclosure requirements.
The following public company disclosure requirements are removed:
| ● | Transfers between Level 1 and Level 2 of the fair value hierarchy |
| ● | The policy for determining when transfers between any of the three levels have occurred |
| ● | The valuation processes used for Level 3 measurements |
65
The following public company disclosure requirements are modified:
| ● | For certain investments that calculate the net asset value, timing of liquidation and redemption restrictions lapsing if the latter has been communicated to the reporting entity |
| ● | A clarification that the Level 3 measurement uncertainty disclosure should communicate information about the uncertainty at the balance sheet date |
The following public company disclosure requirements are new:
| ● | The changes in unrealized gains and losses for the period included in other comprehensive income for recurring Level 3 instruments held at the balance sheet date |
| ● | The range and weighted average of significant unobservable inputs used for Level 3 measurements. For certain unobservable inputs, an option to disclose other quantitative information in place of the weighted average is available to the extent that it would be a more reasonable and rational method to reflect the distribution of unobservable inputs. |
The ASU was effective for all entities in fiscal years beginning after December 15, 2019 and interim periods within those fiscal years. Early adoption is permitted. In addition, an entity may early adopt any of the removed or modified disclosures immediately and delay adoption of the new disclosures until the effective date. The Company chose this early adoption option for the year ended December 31, 2018. The Company adopted the remaining guidance with no material impact on its consolidated financial statements.
In August 2018, the FASB issued ASU 2018-14, Compensation—Retirement Benefits—Defined Benefit Plans—General (Topic 715-20): Disclosure Framework—Changes to the Disclosure Requirements for Defined Benefit Plan. This ASU modifies the disclosure requirements for employers that sponsor defined benefit pension or other postretirement plans by eliminating the requirement to disclose the amounts in accumulated other comprehensive income expected to be recognized as components of net periodic benefit cost over the next fiscal year and adding a requirement to disclose an explanation of the reasons for significant gains and losses related to changes in the benefit obligation for the period. The ASU is effective for fiscal years ending after December 15, 2020. Early adoption is permitted. The Company adopted the guidance with no material impact on its consolidated financial statements.
In March 2020, President Trump signed into law the Coronavirus Aid, Relief, and Economic Security Act (the “CARES Act”), which provides relief from certain requirements under GAAP. Section 4013 of the CARES Act gives entities temporary relief from the accounting and disclosure requirements for troubled debt restructurings (TDRs) under FASB ASC 310-40, Receivables – Troubled Debt Restructurings by Creditors, in certain situations. Under FASB ASC 310-40, a restructuring of debt constitutes a TDR if the creditor, for economic or legal reasons related to the debtor’s financial difficulties, grants a concession to the debtor that it would not otherwise consider. Section 4013 of the CARES Act permits the suspension of FASB ASC 310-40 for loan modifications that are made by financial institutions in response to the coronavirus (COVID-19) pandemic if (1) the borrower was not more than 30 days past due as of December 31, 2019, and (2) the modifications are related to arrangements that defer or delay the payment of principal or interest, or change the interest rate on the loan. These modifications must be made between March 1, 2020 and the earlier of December 31, 2020 or the date that is 60 days after the date on which the national emergency concerning COVID–19 declared by the President on March 13, 2020 under the National Emergencies Act (50 U.S.C. 1601 et seq.) terminates (the “applicable period”).
In April 2020, various regulatory agencies, including the Board of Governors of the Federal Reserve System and the Federal Deposit Insurance Corporation (the “agencies”), issued an interagency statement on loan modifications and reporting for financial institutions working with customers affected by COVID-19. The agencies noted that there are circumstances in which a loan modification may not be eligible for non-TDR treatment under Section 4013 of the CARES Act or in which an institution elects not to apply Section 4013. For example, a loan that is modified after the end of the applicable period would not be eligible under Section 4013. For such loans, the agencies confirmed with the staff of the FASB that short-term modifications made on a good faith basis in response to the impact of COVID-19 to borrowers who were current prior to any relief are not to be considered TDRs. This includes short-term (e.g., six months) modifications such as payment deferrals, fee waivers, extensions of repayment terms, or other delays in payment that are
66
insignificant. Borrowers considered current are those that are less than 30 days past due on their contractual payments at the time a modification program is implemented. The interagency statement was effective immediately.
In December 2020, President Trump signed into law the Consolidated Appropriations Act, 2021 extending the period established by Section 4013 of the CARES Act under which consideration of troubled debt restructuring identification and accounting triggered by effects of the COVID-19 epidemic are suspended. That period is extended to the earlier of a) January 1, 2022, or b) the date that is 60 days after the date on which the national COVID-19 emergency terminates. In addition, Section 541 of this Act amended the relief to expand beyond financial institutions to include insurance companies. The requirement that the subject specific loans not be more that 30 days past due as of December 31, 2019 was not changed.
The Company provided COVID-19 related payment relief on loans totaling $
The CARES Act and interagency statement are expected to have a material impact on the Company’s financial statements; however, due to the uncertainties regarding the economic effects of COVID-19, this impact cannot be quantified at this time.
In March 2020, the FASB issued ASU No. 2020-04, Reference Rate Reform (Topic 848): Facilitation of the Effects of Reference Rate Reform on Financial Reporting. These amendments provide temporary optional guidance to ease the potential burden in accounting for reference rate reform. The ASU provides optional expedients and exceptions for applying generally accepted accounting principles to contract modifications and hedging relationships, subject to meeting certain criteria, that reference LIBOR or another reference rate expected to be discontinued. It is intended to help stakeholders during the global market-wide reference rate transition period. The guidance is effective for all entities as of March 12, 2020 through December 31, 2022. Subsequently, in January 2021, the FASB issued ASU No. 2021-01 Reference Rate Reform (Topic 848): Scope. This ASU clarifies that certain optional expedients and exceptions in Topic 848 for contract modifications and hedge accounting apply to derivatives that are affected by the discounting transition. The ASU also amends the expedients and exceptions in Topic 848 to capture the incremental consequences of the scope clarification and to tailor the existing guidance to derivative instruments affected by the discounting transition. An entity may elect to apply ASU No. 2021-01 on contract modifications that change the interest rate used for margining, discounting, or contract price alignment retrospectively as of any date from the beginning of the interim period that includes March 12, 2020, or prospectively to new modifications from any date within the interim period that includes or is subsequent to January 7, 2021, up to the date that financial statements are available to be issued. An entity may elect to apply ASU No. 2021-01 to eligible hedging relationships existing as of the beginning of the interim period that includes March 12, 2020, and to new eligible hedging relationships entered into after the beginning of the interim period that includes March 12, 2020.
The Company’s cash flow hedges contracts allow it to covert the swaps to another index any time after March 12, 2020, in accordance with the optional expedient provided in Topic 848. Otherwise, the hedges will be converted to a Secured Financing Overnight Rate (SOFR) index at the end of June 2023. The Company is anticipating converting to the SOFR rate in effect as of June 2023.
Issued But Not Yet Adopted
In November 2019, the FASB issued ASU 2019-11, Codification Improvements to Topic 326, Financial Instruments – Credit Losses. This ASU addresses issues raised by stakeholders during the implementation of ASU No. 2016-13, Financial Instruments—Credit Losses (Topic 326): Measurement of Credit Losses on Financial Instruments. Among other narrow-scope improvements, the new ASU clarifies guidance around how to report expected recoveries. “Expected recoveries” describes a situation in which an organization recognizes a full or partial write-off of the amortized cost basis of a financial asset, but then later determines that the amount written off, or a portion of that amount, will in fact be recovered. While applying the credit losses standard, stakeholders questioned whether expected
67
recoveries were permitted on assets that had already shown credit deterioration at the time of purchase (PCD assets, currently known as PCI loans). In response to this question, the ASU permits organizations to record expected recoveries on PCD assets. In addition to other narrow technical improvements, the ASU also reinforces existing guidance that prohibits organizations from recording negative allowances for available-for-sale debt securities. The ASU includes effective dates and transition requirements that vary depending on whether or not an entity has already adopted ASU 2016-13.
Also in November 2019, the SEC adopted Staff Accounting Bulletin (SAB) 119. SAB 119 updated portions of SEC interpretative guidance to align with FASB ASC 326. It covers topics including (1) measuring current expected credit losses; (2) development, governance, and documentation of a systematic methodology; (3) documenting the results of a systematic methodology; and (4) validating a systematic methodology.
In June 2016, the FASB issued ASU 2016-13, Financial Instruments – Credit Losses (Topic 326): Measurement of Credit Losses on Financial Instruments. The ASU is intended to improve financial reporting by requiring timelier recording of credit losses on loans and other financial instruments held by financial institutions and other organizations. The ASU requires the measurement of all expected credit losses for financial assets held at the reporting date based on historical experience, current conditions, and reasonable and supportable forecasts. Financial institutions and other organizations will now use forward-looking information in developing their credit loss estimates. Many of the loss estimation techniques applied today will still be permitted, although the inputs to those techniques will change to reflect the full amount of expected credit losses. Organizations will continue to use judgment to determine which loss estimation method is appropriate for their circumstances. The ASU requires enhanced disclosures to help investors and other financial statement users better understand significant estimates and judgments used in estimating credit losses, as well as the credit quality and underwriting standards of an organization’s portfolio. These disclosures include qualitative and quantitative requirements that provide additional information about the amounts recorded in the financial statements. In addition, the ASU amends the accounting for credit losses on available-for-sale debt securities and purchased financial assets with credit deterioration.
As a smaller reporting company, the Company will be required to apply the guidance for fiscal years, and interim periods within those years, beginning after December 15, 2022. The Company is currently evaluating the impact this guidance will have on its accounting, but it expects to recognize a one-time cumulative-effect adjustment to its allowance for loan losses as of the beginning of the first reporting period in which the new standard is effective, consistent with regulatory expectations set forth in interagency guidance issued at the end of 2016. The Company has formed an implementation committee and is working with a third-party vendor to build a model which it plans to run parallel with its current model in the months prior to implementation. The Company cannot yet determine the magnitude of the one-time cumulative adjustment or of the overall impact of the new standard on our financial condition or results of operations, as the final impact will be dependent, among other things, upon the loan portfolio composition and credit quality at the adoption date, as well as economic conditions, financial models used and forecasts at the time.
In October 2020, the FASB issued ASC 2020-08, Codification Improvements to Subtopic 310-20, Receivables – Nonrefundable fees and Other Costs. This ASU clarifies that an entity should reevaluate whether a callable debt security is within the scope of ASC paragraph 310-20-35-33 for each reporting period. For public business entities, the ASU is effective for fiscal years beginning after December 15, 2021, and interim periods within those fiscal years. Early adoption is not permitted. All entities should apply ASU 2020-08 on a prospective basis as of the beginning of the period of adoption for existing or newly purchased callable debt securities. The Company does not expect the adoption of ASU 2020-08 to have a material impact on its consolidated financial statements.
Use of Estimates
The preparation of financial statements in conformity with GAAP requires management to make estimates and assumptions that affect the reported amounts of assets and liabilities at the date of the financial statements and the reported amounts of revenues and expenses during the reporting period. Actual results could differ from those estimates. Management estimates that are particularly susceptible to significant change in the near term relate to the determination
68
of the allowance for loan losses, the valuation of other real estate owned, projected cash flows relating to certain acquired loans, and the valuation of deferred tax assets.
Note 2. Securities
Amortized costs and fair values of securities available for sale and held to maturity as of December 31, 2020 and 2019 were as follows (dollars in thousands):
December 31, 2020 | ||||||||||||
Gross Unrealized |
| |||||||||||
| Amortized Cost |
| Gains |
| Losses |
| Fair Value | |||||
Securities Available for Sale |
|
|
|
|
|
|
|
| ||||
U.S. Treasury securities | $ | | $ | — | $ | ( | $ | | ||||
U.S. Government agencies | |
| |
| ( |
| | |||||
State, county and municipal |
| |
| |
| ( |
| | ||||
Mortgage backed securities |
| |
| |
| ( |
| | ||||
Asset backed securities |
| |
| |
| ( |
| | ||||
Corporate bonds |
| |
| |
| ( |
| | ||||
Total securities available for sale | $ | | $ | | $ | ( | $ | | ||||
Securities Held to Maturity |
|
|
|
|
|
|
|
| ||||
State, county and municipal | $ | |
| |
| — |
| | ||||
Total securities held to maturity | $ | | $ | | $ | — | $ | | ||||
December 31, 2019 | ||||||||||||
Gross Unrealized | ||||||||||||
| Amortized Cost |
| Gains |
| Losses |
| Fair Value | |||||
Securities Available for Sale | ||||||||||||
U.S. Government agencies | $ | | $ | | $ | ( | $ | | ||||
State, county and municipal |
| |
| |
| ( |
| | ||||
Mortgage backed securities |
| |
| |
| ( |
| | ||||
Asset backed securities |
| |
| |
| ( |
| | ||||
Corporate bonds |
| |
| |
| ( |
| | ||||
Total securities available for sale | $ | | $ | | $ | ( | $ | | ||||
Securities Held to Maturity |
|
|
|
|
|
|
|
| ||||
U.S. Government agencies | $ | | $ | — | $ | ( | $ | | ||||
State, county and municipal |
| |
| |
| ( |
| | ||||
Total securities held to maturity | $ | | $ | | $ | ( | $ | | ||||
The amortized cost and fair value of securities as of December 31, 2020 by final contractual maturity are shown below. Expected maturities may differ from final contractual maturities because issuers may have the right to call or prepay obligations without any penalties.
(dollars in thousands) |
| Amortized Cost |
| Fair Value |
| Amortized Cost |
| Fair Value | ||||
Due in one year or less | $ | | $ | | $ | | $ | | ||||
Due after one year through five years |
| |
| |
| |
| | ||||
Due after five years through ten years |
| |
| |
| |
| | ||||
Due after ten years |
| |
| |
| |
| | ||||
Total securities | $ | | $ | | $ | | $ | | ||||
69
Proceeds from sales and calls of securities available for sale were $
2020 |
| 2019 | ||||
Gross realized gains | $ | | $ | | ||
Gross realized losses |
| ( |
| ( | ||
Net securities gain | $ | | $ | | ||
In estimating other than temporary impairment (OTTI) losses, management considers the length of time and the extent to which the fair value has been less than cost, the financial condition and short-term prospects for the issuer, and the intent and ability of management to hold its investment for a period of time to allow a recovery in fair value. There were
The fair value and gross unrealized losses for securities, segregated by the length of time that individual securities have been in a continuous gross unrealized loss position, at December 31, 2020 and 2019 were as follows (dollars in thousands):
December 31, 2020 | ||||||||||||||||||
Less than 12 Months | 12 Months or More | Total | ||||||||||||||||
| Fair Value |
| Unrealized Loss |
| Fair Value |
| Unrealized Loss |
| Fair Value |
| Unrealized Loss | |||||||
Securities Available for Sale | ||||||||||||||||||
U.S. Treasury securities | $ | | $ | ( | $ | — | $ | — | $ | | $ | ( | ||||||
U.S. Government agencies | |
| ( |
| |
| ( |
| | ( | ||||||||
State, county and municipal |
| |
| ( |
| |
| ( |
| | ( | |||||||
Mortgage backed securities |
| |
| ( |
| — |
| — |
| | ( | |||||||
Asset backed securities |
| |
| ( |
| |
| ( |
| | ( | |||||||
Corporate bonds |
| |
| ( |
| — |
| — |
| | ( | |||||||
Total | $ | | $ | ( | $ | | $ | ( | $ | | $ | ( | ||||||
December 31, 2019 | ||||||||||||||||||
Less than 12 Months | 12 Months or More | Total | ||||||||||||||||
| Fair Value |
| Unrealized Loss |
| Fair Value |
| Unrealized Loss |
| Fair Value |
| Unrealized Loss | |||||||
Securities Available for Sale | ||||||||||||||||||
U.S. Government agencies |
| | $ | ( | $ | | $ | ( | $ | | $ | ( | ||||||
State, county and municipal |
| |
| ( |
| |
| ( |
| |
| ( | ||||||
Mortgage backed securities |
| |
| ( |
| |
| ( |
| |
| ( | ||||||
Asset backed securities |
| |
| ( |
| |
| ( |
| |
| ( | ||||||
Corporate bonds |
| |
| ( |
| — |
| — |
| |
| ( | ||||||
Total | $ | | $ | ( | $ | | $ | ( | $ | | $ | ( | ||||||
Securities Held to Maturity |
|
|
|
|
|
|
|
|
|
|
|
| ||||||
U.S. Government agencies | $ | — | $ | — | $ | | $ | ( | $ | | $ | ( | ||||||
State, county and municipal |
| |
| — |
| |
| ( |
| | ( | |||||||
Total | $ | | $ | — | $ | | $ | ( | $ | | $ | ( | ||||||
The unrealized losses (impairments) in the investment portfolio at December 31, 2020 and 2019 are generally a result of market fluctuations that occur daily. The unrealized losses are from
70
impairment is temporary in nature. Based on this analysis, the Company has determined these impairments to be temporary in nature. The Company does not intend to sell and it is more likely than not that the Company will not be required to sell these securities until they recover in value or reach maturity.
Market prices are affected by conditions beyond the control of the Company. Investment decisions are made by the management group of the Company and reflect the overall liquidity and strategic asset/liability objectives of the Company. Management analyzes the securities portfolio frequently and manages the portfolio to provide an overall positive impact to the Company’s income statement and balance sheet.
Securities with amortized costs of $
Note 3. Loans and Related Allowance for Loan Losses
The Company’s loans, net of deferred fees and costs, as of December 31, 2020 and 2019 were comprised of the following (dollars in thousands):
December 31, 2020 | December 31, 2019 |
| |||||||||
| Amount |
| % of Loans |
| Amount |
| % of Loans |
| |||
Mortgage loans on real estate: | |||||||||||
Residential 1‑4 family | $ | |
| | % | $ | |
| | % | |
Commercial |
| |
| |
| |
| | |||
Construction and land development |
| |
| |
| |
| | |||
Second mortgages |
| |
| |
| |
| | |||
Multifamily |
| |
| |
| |
| | |||
Agriculture |
| |
| |
| |
| | |||
Total real estate loans |
| |
| |
| |
| | |||
Commercial loans |
| |
| |
| |
| | |||
Consumer installment loans |
| |
| |
| |
| | |||
All other loans |
| |
| |
| |
| | |||
Total loans | $ | |
| | % | $ | |
| | % | |
The Company held $
During 2020, the Company originated loans under the Paycheck Protection Program (PPP) of the Small Business Administration (SBA). These PPP loans totaled $
71
At December 31, 2020 and 2019, the Company’s allowance for loan losses was comprised of the following: (i) a specific valuation component calculated in accordance with FASB ASC 310, Receivables, (ii) a general valuation component calculated in accordance with FASB ASC 450, Contingencies, based on historical loan loss experience, current economic conditions and other qualitative risk factors, and (iii) an unallocated component to cover uncertainties that could affect management’s estimate of probable losses. Management identified loans subject to impairment in accordance with ASC 310.
The following table summarizes information related to impaired loans as of December 31, 2020 and 2019 (dollars in thousands):
December 31, 2020 | December 31, 2019 | ||||||||||||||||||
|
| Unpaid |
|
|
| Unpaid |
| ||||||||||||
Recorded | Principal | Related | Recorded | Principal | Related | ||||||||||||||
Investment (1) | Balance (2) | Allowance | Investment (1) | Balance (2) | Allowance | ||||||||||||||
With no related allowance recorded: | |||||||||||||||||||
Mortgage loans on real estate: | |||||||||||||||||||
Residential 1‑4 family | $ | | $ | | $ | — | $ | | $ | | $ | — | |||||||
Commercial |
| |
| |
| — |
| |
| |
| — | |||||||
Construction and land development | — | | | — | |||||||||||||||
Multifamily |
|
|
| — |
| |
| |
| — | |||||||||
Total real estate loans |
| |
| |
| — |
| |
| |
| — | |||||||
Subtotal impaired loans with no valuation allowance |
| |
| |
| — |
| |
| |
| — | |||||||
With an allowance recorded: |
|
|
|
|
|
|
|
|
|
|
|
| |||||||
Mortgage loans on real estate: |
|
|
|
|
|
|
|
|
|
|
|
| |||||||
Residential 1‑4 family |
| |
| |
| |
| |
| |
| | |||||||
Commercial |
| |
| |
| |
| |
| |
| | |||||||
Construction and land development |
| |
| |
| |
| |
| |
| | |||||||
Agriculture |
| |
| |
| |
| — |
| — |
| — | |||||||
Total real estate loans |
| |
| |
| |
| |
| |
| | |||||||
Commercial loans |
| |
| |
| |
| |
| |
| | |||||||
Consumer installment loans |
| |
| |
| |
| |
| |
| | |||||||
Subtotal impaired loans with a valuation allowance |
| |
| |
| |
| |
| |
| | |||||||
Total: |
|
|
|
|
|
|
|
|
|
|
|
| |||||||
Mortgage loans on real estate: |
|
|
|
|
|
|
|
|
|
|
|
| |||||||
Residential 1‑4 family |
| |
| |
| |
| |
| |
| | |||||||
Commercial |
| |
| |
| |
| |
| |
| | |||||||
Construction and land development |
| |
| |
| |
| |
| |
| | |||||||
Multifamily |
|
|
| — |
| |
| |
| — | |||||||||
Agriculture |
| |
| |
| |
| — |
| — |
| — | |||||||
Total real estate loans |
| |
| |
| |
| |
| |
| | |||||||
Commercial loans |
| |
| |
| |
| |
| |
| | |||||||
Consumer installment loans |
| |
| |
| |
| |
| |
| | |||||||
Total impaired loans | $ | | $ | | $ | | $ | | $ | | $ | | |||||||
| (1) | The amount of the investment in a loan is not net of a valuation allowance, but does reflect any direct write-down of the investment |
| (2) | The contractual amount due reflects paydowns applied in accordance with loan documents, but does not reflect any direct write-downs or valuation allowance |
72
The following table summarizes the average recorded investment of impaired loans for the years ended December 31, 2020 and 2019 (dollars in thousands):
2020 | 2019 | |||||||||||
| Average Investment |
| Interest Recognized |
| Average Investment |
| Interest Recognized | |||||
Mortgage loans on real estate: |
|
|
|
|
|
|
|
| ||||
Residential 1‑4 family | $ | | $ | | $ | | $ | | ||||
Commercial |
| |
| |
| |
| | ||||
Construction and land development |
| |
| — |
| |
| — | ||||
Multifamily |
| |
| — |
| |
| — | ||||
Agriculture |
| |
| — |
| — |
| — | ||||
Total real estate loans |
| |
| |
| |
| | ||||
Commercial loans |
| |
| |
| |
| | ||||
Consumer installment loans |
| |
| — |
| |
| — | ||||
Total impaired loans | $ | | $ | | $ | | $ | | ||||
Troubled debt restructures still accruing interest are loans that management expects to ultimately collect all principal and interest due, but not under the terms of the original contract. A reconciliation of impaired loans to nonaccrual loans as of December 31, 2020 and December 31, 2019 is set forth in the table below (dollars in thousands):
| December 31, 2020 |
| December 31, 2019 | |||
Nonaccruals | $ | | $ | | ||
Trouble debt restructure and still accruing |
| |
| | ||
Total impaired | $ | | $ | | ||
Interest income on nonaccrual loans, if recognized, is recorded using the cash basis method of accounting. The Company recognized $
The following tables present an age analysis of past due status of loans by category as of December 31, 2020 and 2019 (dollars in thousands):
December 31, 2020 | ||||||||||||||||||
| 30‑89 Days |
| 90+ Days Past |
| Total Past |
|
| Total Loans | ||||||||||
Past Due | Due and Accruing | Nonaccrual | Due | Current | Receivable | |||||||||||||
Mortgage loans on real estate: |
|
|
|
|
|
|
|
|
|
|
| |||||||
Residential 1‑4 family | $ | | $ | | $ | | $ | | $ | | $ | | ||||||
Commercial |
| |
| — |
| |
| |
| |
| | ||||||
Construction and land development |
| |
| — |
| |
| |
| |
| | ||||||
Second mortgages |
| |
| — |
|
| |
| |
| | |||||||
Multifamily |
|
| — |
|
|
| |
| | |||||||||
Agriculture |
|
| — |
| |
| |
| |
| | |||||||
Total real estate loans |
| |
| |
| |
| |
| |
| | ||||||
Commercial loans |
| |
| — |
| |
| |
| |
| | ||||||
Consumer installment loans |
|
| |
| |
| |
| |
| | |||||||
All other loans |
|
| — |
|
|
| |
| | |||||||||
Total loans | $ | | $ | | $ | | $ | | $ | | $ | | ||||||
73
December 31, 2019 | ||||||||||||||||||
| 30‑89 Days |
| 90+ Days Past |
| Total Past |
|
| Total Loans | ||||||||||
Past Due | Due and Accruing | Nonaccrual | Due | Current | Receivable | |||||||||||||
Mortgage loans on real estate: |
|
|
|
|
|
|
|
|
|
|
| |||||||
Residential 1‑4 family | $ | | $ | — | $ | | $ | | $ | | $ | | ||||||
Commercial |
| |
| — |
| |
| |
| |
| | ||||||
Construction and land development |
| |
| — |
| |
| |
| |
| | ||||||
Second mortgages |
| |
| — |
|
| |
| |
| | |||||||
Multifamily |
|
| — |
| |
| |
| |
| | |||||||
Agriculture |
|
| — |
|
| — |
| |
| | ||||||||
Total real estate loans |
| |
| — |
| |
| |
| |
| | ||||||
Commercial loans |
| |
| |
| |
| |
| |
| | ||||||
Consumer installment loans |
| |
| — |
| |
| |
| |
| | ||||||
All other loans |
|
| — |
|
| — |
| |
| | ||||||||
Total loans | $ | | $ | | $ | | $ | | $ | | $ | | ||||||
Activity in the allowance for loan losses on loans by segment for the years ended December 31, 2020 and 2019 is presented in the following tables (dollars in thousands):
| Year Ended December 31, 2020 | ||||||||||||||
Provision | |||||||||||||||
December 31, 2019 | Allocation | Charge-offs | Recoveries | December 31, 2020 | |||||||||||
Mortgage loans on real estate: |
|
|
|
|
|
|
|
|
|
| |||||
Residential 1‑4 family | $ | | $ | ( | $ | $ | | $ | | ||||||
Commercial |
| |
| |
|
| |
| | ||||||
Construction and land development |
| |
| |
|
| |
| | ||||||
Second mortgages |
| |
| ( |
|
| |
| | ||||||
Multifamily |
| |
| |
|
|
| | |||||||
Agriculture |
| |
| |
|
|
| | |||||||
Total real estate loans |
| |
| |
|
| |
| | ||||||
Commercial loans |
| |
| |
| ( |
| |
| | |||||
Consumer installment loans |
| |
| |
| ( |
| |
| | |||||
All other loans |
| |
|
|
|
| | ||||||||
Unallocated |
| |
| ( |
|
|
| — | |||||||
Total loans | $ | | $ | | $ | ( | $ | | $ | | |||||
Year Ended December 31, 2019 | |||||||||||||||
Provision | |||||||||||||||
| December 31, 2018 |
| Allocation |
| Charge-offs |
| Recoveries |
| December 31, 2019 | ||||||
Mortgage loans on real estate: |
|
|
|
|
| ||||||||||
Residential 1‑4 family | $ | | $ | | $ | ( | $ | | $ | | |||||
Commercial |
| |
| |
| ( |
| |
| | |||||
Construction and land development |
| |
| |
| ( |
| |
| | |||||
Second mortgages |
| |
| |
|
| |
| | ||||||
Multifamily |
| |
| ( |
|
| |
| | ||||||
Agriculture |
| |
| |
|
|
| | |||||||
Total real estate loans |
| |
| |
| ( |
| |
| | |||||
Commercial loans |
| |
| |
| ( |
| |
| | |||||
Consumer installment loans |
| |
| |
| ( |
| |
| | |||||
All other loans |
| |
| ( |
|
|
| | |||||||
Unallocated |
| |
| ( |
|
|
| | |||||||
Total loans | $ | | $ | | $ | ( | $ | | $ | | |||||
74
The increase in provision expense reflects the significant increase in commercial real estate and construction and land development loans classified as special mention due to the inherent economic impact COVID-19 may have on these borrowers due to potential lost rental income, declining hospitality revenues, and construction material shortages. The allowance for loan losses could be further impacted by COVID-19; however, the amount of that impact is not currently estimable.
The following tables present information on the loans evaluated for impairment in the allowance for loan losses as of December 31, 2020 and 2019 (dollars in thousands):
December 31, 2020 | ||||||||||||||||||
Allowance for Loan Losses | Recorded Investment in Loans | |||||||||||||||||
| Individually |
| Collectively |
|
| Individually |
| Collectively |
| |||||||||
Evaluated for | Evaluated for | Evaluated for | Evaluated for | |||||||||||||||
Impairment | Impairment | Total | Impairment | Impairment | Total | |||||||||||||
Mortgage loans on real estate: |
|
|
|
|
|
|
|
|
|
|
|
| ||||||
Residential 1‑4 family | $ | | $ | | $ | | $ | | $ | | $ | | ||||||
Commercial |
| |
| |
| |
| |
| |
| | ||||||
Construction and land development |
| |
| |
| |
| |
| |
| | ||||||
Second mortgages |
|
| |
| |
| — |
| |
| | |||||||
Multifamily |
|
| |
| |
| — |
| |
| | |||||||
Agriculture |
| |
| |
| |
| |
| |
| | ||||||
Total real estate loans |
| |
| |
| |
| |
| |
| | ||||||
Commercial loans |
| |
| |
| |
| |
| |
| | ||||||
Consumer installment loans |
| |
| |
| |
| |
| |
| | ||||||
All other loans |
|
| |
| |
| — |
| |
| | |||||||
Unallocated |
|
|
|
| — |
| — |
| — | |||||||||
Total loans | $ | | $ | | $ | | $ | | $ | | $ | | ||||||
December 31, 2019 | ||||||||||||||||||
Allowance for Loan Losses | Recorded Investment in Loans | |||||||||||||||||
| Individually |
| Collectively |
|
| Individually |
| Collectively |
| |||||||||
Evaluated for | Evaluated for | Evaluated for | Evaluated for | |||||||||||||||
Impairment | Impairment | Total | Impairment | Impairment | Total | |||||||||||||
Mortgage loans on real estate: |
|
|
|
|
|
|
|
|
|
|
|
| ||||||
Residential 1‑4 family | $ | | $ | | $ | | $ | | $ | | $ | | ||||||
Commercial |
| |
| |
| |
| |
| |
| | ||||||
Construction and land development |
| |
| |
| |
| |
| |
| | ||||||
Second mortgages |
|
| |
| |
|
| |
| | ||||||||
Multifamily |
|
| |
| |
| |
| |
| | |||||||
Agriculture |
|
| |
| |
|
| |
| | ||||||||
Total real estate loans |
| |
| |
| |
| |
| |
| | ||||||
Commercial loans |
| |
| |
| |
| |
| |
| | ||||||
Consumer installment loans |
| |
| |
| |
| |
| |
| | ||||||
All other loans |
|
| |
| |
|
| |
| | ||||||||
Unallocated |
|
| |
| |
|
|
| ||||||||||
Total loans | $ | | $ | | $ | | $ | | $ | | $ | | ||||||
Loans are monitored for credit quality on a recurring basis. These credit quality indicators are defined as follows:
Pass - A pass loan is not adversely classified, as it does not display any of the characteristics for adverse classification. This category includes purchased loans that are
75
Special Mention - A special mention loan has potential weaknesses that deserve management’s close attention. If left uncorrected, such potential weaknesses may result in deterioration of the repayment prospects or collateral position at some future date. Special mention loans are not adversely classified and do not warrant adverse classification.
Substandard - A substandard loan is inadequately protected by the current net worth and paying capacity of the obligor or of the collateral pledged, if any. Loans classified as substandard generally have a well-defined weakness, or weaknesses, that jeopardize the liquidation of the debt. These loans are characterized by the distinct possibility of loss if the deficiencies are not corrected.
Doubtful - A doubtful loan has all the weaknesses inherent in a loan classified as substandard with the added characteristics that the weaknesses make collection or liquidation in full highly questionable and improbable, on the basis of currently existing facts, conditions, and values. The possibility of loss is extremely high.
The following tables present the composition of loans by credit quality indicator as of December 31, 2020 and 2019 (dollars in thousands):
December 31, 2020 | |||||||||||||||
Special | |||||||||||||||
| Pass |
| Mention |
| Substandard |
| Doubtful |
| Total | ||||||
Mortgage loans on real estate: | |||||||||||||||
Residential 1‑4 family | $ | | $ | | $ | | $ | $ | | ||||||
Commercial |
| | | | | ||||||||||
Construction and land development |
| | | | | ||||||||||
Second mortgages |
| | | — | | ||||||||||
Multifamily |
| | | — | | ||||||||||
Agriculture |
| | | | | ||||||||||
Total real estate loans |
| | | | | ||||||||||
Commercial loans |
| | | | | ||||||||||
Consumer installment loans |
| | | | | ||||||||||
All other loans |
| | | — | | ||||||||||
Total loans | $ | | $ | | $ | | $ | $ | | ||||||
December 31, 2019 | |||||||||||||||
Special | |||||||||||||||
| Pass |
| Mention |
| Substandard |
| Doubtful |
| Total | ||||||
Mortgage loans on real estate: |
|
|
|
|
|
|
|
|
|
| |||||
Residential 1‑4 family | $ | | $ | | $ | | $ | $ | | ||||||
Commercial |
| |
| |
| |
|
| | ||||||
Construction and land development |
| |
| |
| |
|
| | ||||||
Second mortgages |
| |
| |
| — |
|
| | ||||||
Multifamily |
| |
| — |
| |
|
| | ||||||
Agriculture |
| |
| |
| — |
|
| | ||||||
Total real estate loans |
| |
| |
| |
|
| | ||||||
Commercial loans |
| |
| |
| |
|
| | ||||||
Consumer installment loans |
| |
| |
| |
|
| | ||||||
All other loans |
| |
| — |
| — |
|
| | ||||||
Total loans | $ | | $ | | $ | | $ | $ | | ||||||
In accordance with FASB ASU 2011-02, Receivables (Topic 310): A Creditor’s Determination of Whether a Restructuring is a Troubled Debt Restructuring, the Company assesses all loan modifications to determine whether they are considered troubled debt restructurings (TDRs) under the guidance. The Company had
76
During the year ended December 31, 2020, the Company modified
During the year ended December 31, 2020, there were
In the determination of the allowance for loan losses, management considers TDRs and subsequent defaults in these restructures by reviewing for impairment in accordance with FASB ASC 310-10-35, Receivables, Subsequent Measurement.
At December 31, 2020 the Company had 1-4 family mortgages in the amount of $
Note 4. PCI Loans and Related Allowance for Loan Losses
On January 30, 2009, the Company entered into a Purchase and Assumption Agreement with the FDIC to assume all of the deposits and certain other liabilities and acquire substantially all assets of SFSB. The Company is applying the provisions of FASB ASC 310-30, Loans and Debt Securities Acquired with Deteriorated Credit Quality, to all loans acquired in the SFSB transaction (the “PCI” loans). Of the total $
As of December 31, 2020 and 2019, the outstanding contractual balance of the PCI loans was $
December 31, 2020 | December 31, 2019 |
| |||||||||
|
| % of PCI |
|
| % of PCI |
| |||||
Amount | Loans | Amount | Loans |
| |||||||
Mortgage loans on real estate: | |||||||||||
Residential 1‑4 family | $ | |
| | % | $ | |
| | % | |
Commercial |
| |
| |
| |
| | |||
Construction and land development |
| |
| |
| |
| | |||
Second mortgages |
| |
| |
| |
| | |||
Multifamily |
| |
| |
| |
| | |||
Total real estate loans |
| |
| |
| |
| | |||
Total PCI loans | $ | |
| | % | $ | |
| | % | |
There was
77
The following table presents information on the PCI loans collectively evaluated for impairment in the allowance for loan losses as of December 31, 2020 and 2019 (dollars in thousands):
December 31, 2020 | December 31, 2019 | |||||||||||
| Allowance |
| Recorded |
|
| Recorded | ||||||
for loan | investment in | Allowance for | investment in | |||||||||
losses | loans | loan losses | loans | |||||||||
Mortgage loans on real estate: |
|
|
|
|
|
|
|
| ||||
Residential 1‑4 family | $ | | $ | | $ | | $ | | ||||
Commercial |
|
| |
|
| | ||||||
Construction and land development |
|
| |
|
| | ||||||
Second mortgages |
|
| |
|
| | ||||||
Multifamily |
|
| |
|
| | ||||||
Total real estate loans |
| |
| |
| |
| | ||||
Total PCI loans | $ | | $ | | $ | | $ | | ||||
The change in the accretable yield balance for the years ended December 31, 2020 and 2019 is as follows (dollars in thousands):
|
| ||
Balance, January 1, 2019 | $ | | |
Accretion |
| ( | |
Reclassification from nonaccretable difference |
| | |
Balance, December 31, 2019 | $ | | |
Accretion |
| ( | |
Reclassification to nonaccretable difference |
| ( | |
Balance, December 31, 2020 | $ | |
The PCI loans were not classified as nonperforming assets as of December 31, 2020 or 2019, as the loans are accounted for on a pooled basis, and interest income, through accretion of the difference between the carrying amount of the loans and the expected cash flows, is being recognized on all PCI loans.
Note 5. Bank Premises and Equipment Held for Sale
Bank premises and equipment held for sale includes
Also included in bank premises and equipment held for sale is a piece of land the Company had been holding as a possible future branch site. The Company has decided not to pursue that location and is marketing the property. The book value of $
78
Note 6. Premises and Equipment
A summary of the bank premises and equipment is as follows (dollars in thousands):
December 31 | ||||||
| 2020 |
| 2019 | |||
Land | $ | | $ | | ||
Land improvements and buildings |
| |
| | ||
Leasehold improvements |
| |
| | ||
Furniture and equipment |
| |
| | ||
Construction in progress |
| |
| | ||
Total |
| |
| | ||
Less accumulated depreciation and amortization |
| ( |
| ( | ||
Bank premises and equipment, net | $ | | $ | | ||
Depreciation expense was $
Note 7. Other Real Estate Owned
The following table presents the balances of other real estate owned as of December 31, 2020 and 2019 (dollars in thousands):
| December 31, 2020 |
| December 31, 2019 | |||
Residential 1‑4 family | $ | | $ | | ||
Commercial |
| — |
| — | ||
Construction and land development |
| |
| | ||
Total other real estate owned | $ | | $ | | ||
At December 31, 2020, the Company had $
Note 8. Deposits
The following table provides interest bearing deposit information, by type, as of December 31, 2020 and 2019 (dollars in thousands):
| December 31, 2020 |
| December 31, 2019 | |||
Interest bearing checking | $ | | $ | — | ||
NOW | — | | ||||
MMDA |
| |
| | ||
Savings |
| |
| | ||
Time deposits less than or equal to $250,000 |
| |
| | ||
Time deposits over $250,000 |
| |
| | ||
Total interest bearing deposits | $ | | $ | | ||
Effective January 1, 2020, the Company re-classified all NOW accounts to interest bearing checking accounts, thereby eliminating the seven days withdrawal notification requirement imposed on NOW accounts.
79
The scheduled maturities of time deposits at December 31, 2020 are as follows (dollars in thousands):
|
| ||
2021 | $ | | |
2022 |
| | |
2023 |
| | |
2024 |
| | |
2025 |
| | |
Total | $ | |
Brokered deposits totaled $
Note 9. Borrowings
The Company uses borrowings in conjunction with deposits to fund lending and investing activities. Borrowings include overnight borrowings from correspondent banks (federal funds purchased) and funding from the Federal Home Loan Bank (FHLB). The Company classifies all borrowings that will mature within a year from the date on which the company enters into them as short-term advances.
The following table presents the Company’s borrowings as of December 31, 2020 and 2019 (dollars in thousands):
| 2020 |
| 2019 | |||
Federal funds purchased | $ | — | $ | | ||
FHLB: |
|
|
|
| ||
Short-term advances | $ | | $ | | ||
Long-term notes payable |
| |
| | ||
Total | $ | | $ | | ||
The average interest rate of federal funds purchased during the years ended December 31, 2020 and 2019 was
The Company has an available line of credit with the FHLB of Atlanta which allows the Company to borrow on a collateralized basis. As of December 31, 2020, the Company had residential 1-4 family mortgages in the amount of $
Maturities of long-term debt at December 31, 2020 are as follows (dollars in thousands):
|
| ||
2022 | $ | | |
2023 | | ||
2025 | | ||
2030 |
| | |
Total | $ | |
80
The Company had unsecured lines of credit with correspondent banks available for overnight borrowing totaling $
Note 10. Accumulated Other Comprehensive Income
The following tables present activity net of tax in accumulated other comprehensive income (AOCI) for the years ended December 31, 2020 and 2019 (dollars in thousands):
Year ended December 31, 2020 | ||||||||||||
| Unrealized |
| Defined |
| Gain (Loss) on |
| Total Other | |||||
Gain (Loss) on | Benefit | Cash Flow | Comprehensive | |||||||||
Securities | Pension Plan | Hedge | Income (Loss) | |||||||||
Beginning balance | $ | | $ | ( | $ | ( | $ | | ||||
Other comprehensive income (loss) before reclassifications |
| |
| ( |
| ( |
| | ||||
Amounts reclassified from AOCI |
| ( |
| |
| — |
| ( | ||||
Net current period other comprehensive income (loss) |
| |
| ( |
| ( |
| | ||||
Ending balance | $ | | $ | ( | $ | ( | $ | | ||||
Year ended December 31, 2019 | ||||||||||||
| Unrealized |
| Defined |
| Gain (Loss) on |
| Total Other | |||||
Gain (Loss) on | Benefit | Cash Flow | Comprehensive | |||||||||
Securities | Pension Plan | Hedge | Income (Loss) | |||||||||
Beginning balance | $ | ( | $ | ( | $ | | $ | ( | ||||
Other comprehensive income (loss) before reclassifications |
| |
| ( |
| ( |
| | ||||
Amounts reclassified from AOCI |
| ( |
| |
| — |
| ( | ||||
Net current period other comprehensive income (loss) |
| |
| ( |
| ( |
| | ||||
Ending balance | $ | | $ | ( | $ | ( | $ | | ||||
The Company releases the income tax effects included in AOCI when income or loss from the related items has been recognized in earnings. The following tables present the effects of reclassifications out of AOCI on line items of consolidated income for the years ended December 31, 2020 and 2019 (dollars in thousands):
Affected Line Item in the Unaudited Consolidated | ||||||||
Details about AOCI Components | Amount Reclassified from AOCI | Statement of Income | ||||||
Year ended | ||||||||
| December 31, 2020 |
| December 31, 2019 |
|
| |||
Securities available for sale: |
|
|
|
|
|
| ||
Unrealized gains on securities available for sale | $ | ( | $ | ( |
| Gain on securities transactions, net | ||
Related tax expense |
| |
| |
| Income tax expense | ||
$ | ( | $ | ( |
| Net of tax | |||
Defined benefit plan |
|
|
|
|
|
| ||
Amortization of prior service cost | $ | | $ | |
| Salaries and employee benefits | ||
Related tax (benefit) expense |
| ( |
| ( |
| Income tax expense | ||
$ | | $ | |
| Net of tax | |||
Total reclassifications for the period | $ | ( | $ | ( |
|
| ||
81
Note 11. Income Taxes
The tax effects of temporary differences that give rise to significant portions of the deferred tax assets and deferred tax liabilities as of December 31, 2020 and 2019 are as follows (dollars in thousands):
| 2020 |
| 2019 | |||
Deferred tax assets: |
|
|
|
| ||
Allowance for loan losses | $ | | $ | | ||
Deferred compensation |
| |
| | ||
Pension adjustment |
| |
| | ||
Purchase accounting adjustment(1) |
| |
| | ||
OREO |
| |
| | ||
Right-of-use lease asset | | | ||||
Other |
| |
| | ||
| |
| | |||
Deferred tax liabilities: |
|
|
|
| ||
Accrued pension |
| |
| | ||
Unrealized gain on available for sale securities |
| |
| | ||
Depreciation premises and equipment |
| |
| | ||
Lease liability | | | ||||
Other |
| |
| | ||
| |
| | |||
Net deferred tax asset | $ | | $ | | ||
| (1) | Purchase accounting adjustment includes timing differences related to PCI loans, purchased fixed assets, and differences in income recognition on the purchase transactions. |
The Company has analyzed the tax positions taken or expected to be taken in its tax returns and concluded that it has
Allocation of the income tax expense between current and deferred portions is as follows (dollars in thousands):
| 2020 |
| 2019 | |||
Current tax provision | $ | | $ | | ||
Deferred tax (benefit) expense |
| ( |
| | ||
Income tax expense | $ | | $ | | ||
The following is a reconciliation of the expected income tax expense with the reported expense for each year:
| 2020 |
| 2019 |
| |
Statutory federal income tax rate |
| | % | | % |
(Reduction) Increase in taxes resulting from: |
|
|
|
| |
Municipal interest |
| ( |
| ( | |
Bank owned life insurance income |
| ( |
| ( | |
Stock compensation |
| |
| ( | |
Other, net |
| ( |
| | |
Effective tax rate |
| | % | | % |
Note 12. Employee Benefit Plans
The Company adopted the Bank of Essex noncontributory, defined benefit pension plan for all full-time pre-merger Bank of Essex employees over
82
the consolidated statement of income, in accordance with the funding provisions of the Employee Retirement Income Security Act.
The Company froze the plan benefits for all defined benefit plan participants effective December 31, 2010. Information pertaining to the activity in the plan for the years ended December 31, 2020 and 2019 is as follows (dollars in thousands):
Years ended December 31 | ||||||
| 2020 |
| 2019 | |||
Change in Benefit Obligation | ||||||
Benefit obligation, beginning of year | $ | | $ | | ||
Interest cost |
| |
| | ||
Actuarial loss/(gain) |
| |
| | ||
Benefits paid |
| ( |
| ( | ||
Settlement loss | — | | ||||
Benefit obligation, ending | $ | | $ | | ||
Change in Plan Assets |
|
|
|
| ||
Fair value of plan assets, beginning of year | $ | | $ | | ||
Actual return on plan assets |
| |
| | ||
Employer contribution | | — | ||||
Benefits paid |
| ( |
| ( | ||
Fair value of plan assets, ending |
| |
| | ||
Funded status | $ | | $ | ( | ||
Amounts Recognized in the Balance Sheet |
|
|
|
| ||
Other assets | $ | $ | — | |||
Other liabilities | — | ( | ||||
Amounts Recognized in Accumulated Other Comprehensive Income (Loss) |
|
|
|
| ||
Net loss | $ | | $ | | ||
Prior service cost |
| |
| | ||
Deferred tax |
| ( |
| ( | ||
Total amount recognized | $ | | $ | | ||
Accumulated benefit obligation | $ | | $ | | ||
| ||||||
Components of net periodic (income) cost |
|
| ||||
Interest cost | $ | | $ | | ||
Expected return on plan assets |
| ( |
| ( | ||
Amortization of prior service cost |
| |
| | ||
Recognized net loss due to settlement |
| — |
| | ||
Recognized net actuarial loss |
| |
| | ||
Net periodic (income) cost | $ | ( | $ | | ||
Other changes in plan assets and benefit obligations recognized in other comprehensive income | ||||||
Net (gain) loss |
| $ | |
| $ | |
Amortization of prior service cost | ( | ( | ||||
Total amount recognized | $ | | $ | | ||
Total recognized in net periodic benefit (income) cost and accumulated other comprehensive (loss) income |
| $ | |
| $ | |
83
The weighted-average assumptions used in the measurement of the Company’s benefit obligation and net periodic benefit cost are shown in the following table:
December 31 |
| ||||
| 2020 |
| 2019 |
| |
Discount rate used for net periodic pension cost |
| | % | | % |
Discount rate used to determine obligation |
| | % | | % |
Expected return on plan assets |
| | % | | % |
Long-Term Rate of Return
The plan sponsor selects the expected long-term rate of return on assets assumption in consultation with its investment advisors and actuary. This rate is intended to reflect the average rate of earnings expected to be earned on the funds invested or to be invested to provide plan benefits. Historical performance is reviewed, especially with respect to real rates of return (net of inflation), for the major asset classes held or anticipated to be held by the trust, and for the trust itself. Undue weight is not given to recent experience that may not continue over the measurement period, with higher significance placed on current forecasts of future long-term economic conditions.
Because assets are held in a qualified trust, anticipated returns are not reduced for taxes. Further, solely for this purpose, the plan is assumed to continue in force and not terminate during the period during which assets are invested. However, consideration is given to the potential impact of current and future investment policy, cash flow into and out of the trust, and expenses (both investment and non-investment) typically paid from plan assets (to the extent such expenses are not explicitly estimated within periodic cost).
Asset Allocation
The pension plan’s weighted-average asset allocations as of December 31, 2020 and 2019 by asset category were as follows:
December 31 |
| ||||
| 2020 |
| 2019 |
| |
Asset Category |
|
|
|
| |
Mutual funds — fixed income |
| | % | | % |
Mutual funds — equity |
| |
| | |
Cash and equivalents |
| |
| | |
Total |
| | % | | % |
The fair value of plan assets is measured based on the fair value hierarchy as discussed in Note 20, “Fair Values of Assets and Liabilities”, to the Consolidated Financial Statements. The valuations are based on third party data received as of the balance sheet date. All plan assets are considered Level 1 assets, as quoted prices exist in active markets for identical assets.
84
The following table presents the fair value of plan assets as of December 31, 2020 and 2019 (dollars in thousands):
Assets measured at Fair Value (Level 1) | ||||||
| December 31, 2020 |
| December 31, 2019 | |||
Cash | $ | | $ | | ||
Mutual funds: |
|
|
|
| ||
Fixed income funds |
| |
| | ||
International funds |
| |
| | ||
Large cap funds |
| |
| | ||
Mid cap funds |
| |
| | ||
Small cap funds |
| |
| | ||
Real Estate Fund | | — | ||||
Stock fund |
| — |
| | ||
$ | | $ | | |||
The trust fund is sufficiently diversified to maintain a reasonable level of risk without imprudently sacrificing return, with a targeted asset allocation of
It is the responsibility of the trustee to administer the investments of the trust within reasonable costs, being careful to avoid sacrificing quality. These costs include, but are not limited to, management and custodial fees, consulting fees, transaction costs and other administrative costs chargeable to the trust.
Estimated future contributions and benefit payments, which reflect expected future service, as appropriate, are as follows (dollars in thousands):
Expected Employer Contributions |
| ||
2021 | $ | ||
Expected Benefit Payments |
|
| |
2021 |
| | |
2022 |
| | |
2023 |
| | |
2024 |
| | |
2025 |
| | |
2026-2030 |
| |
401(k) Plan
The Company maintains the Essex Bank 401(k) plan. The employee may contribute up to
The amounts charged to expense under these plans for the years ended December 31, 2020 and 2019 were $
Deferred Compensation Agreements
The Company has deferred compensation agreements with certain key employees and the Board of Directors. The retirement benefits to be provided are fixed based upon the amount of compensation earned and deferred. Deferred
85
compensation expense amounted to $
The Company also has a non-qualified defined contribution retirement plan for certain key executive officers. The purpose of the plan is to enhance the retirement benefits that the Company provides to each officer and to recognize each officer for overall performance through additional incentive-based compensation. The planned contributions were based on the same metrics that the Company used for its annual incentive plan for executive officers. All contributions were
Note 13. Stock Option Plans
Stock Option Plan
In 2019, the Company adopted the Community Bankers Trust Corporation 2019 Stock Incentive Plan (the “Plan”). The purpose of the Plan is to further the long-term stability and financial success of the Company by attracting and retaining employees and directors through the use of stock incentives and other rights that promote and recognize the financial success and growth of the Company. The Company believes that ownership of company stock will stimulate the efforts of such employees and directors by further aligning their interests with the interest of the Company’s shareholders. The Plan is to be used to grant restricted stock awards, stock options in the form of incentive stock options and nonstatutory stock options, stock appreciation rights and other stock-based awards to employees and directors of the Company for up to
The exercise price of a stock option cannot be less than
The Company’s previously adopted 2009 Stock Incentive Plan terminated June 17, 2019. The 2009 Plan had the same general terms as the newly adopted 2019 Plan. Outstanding awards under the 2009 Plan will be administered in accordance with their terms under such plan.
The fair value of each option granted is estimated on the date of grant using the “Black Scholes Option Pricing” method with the following assumptions for the years ended December 31, 2020 and 2019:
| 2020 |
| 2019 |
| |
Expected volatility |
| | % | | % |
Expected term (years) |
|
| |||
Risk free rate |
| | % | | % |
The expected volatility is an estimate of the volatility of the Company’s share price based on historical performance. The risk free interest rates for periods within the contractual life of the awards are based on the U. S. Treasury Bill implied yield at the time of the grant correlating to the expected term. The expected term is based on the simplified method as provided by the Securities and Exchange Commission Staff Accounting Bulletin No 110 (SAB 110). In accordance with SAB 110, the Company has chosen to use the simplified method, as minimal historical exercise data exists.
86
The Company plans to issue new shares of common stock when options are exercised. The Company recognizes forfeitures as they occur.
The Company issues equity grants to non-employee directors as payment for annual retainer fees. The fair value of these grants was the closing price of the Company’s stock at the grant date. A summary of these grants for the years ended December 31, 2020 and 2019 is shown in the following table:
2020 | 2019 | |||||||
Month |
| Shares Issued |
| Fair Value |
| Shares Issued |
| Fair Value |
March |
| | $ | | $ | |||
June |
| | | | | |||
September |
| | | | | |||
December |
| | | | | |||
The Company granted
|
| Weighted |
| |||||
Average | Aggregate | |||||||
Number of Shares | Exercise Price | Intrinsic Value | ||||||
Outstanding at beginning of year |
| | $ | | ||||
Granted |
| |
| | ||||
Forfeited |
| ( |
| |
|
| ||
Exercised |
| ( |
| |
|
| ||
Outstanding at end of year |
| |
| | $ | | ||
Options outstanding and exercisable at end of year |
| |
| | $ | | ||
Weighted average remaining contractual life for outstanding and exercisable shares at year end |
|
|
|
|
| |||
The weighted average fair value per option of options granted during the year was $
The Company recorded total stock-based compensation expense of $
87
The following table summarizes non-vested options outstanding as of December 31, 2020:
Weighted Average | |||||
Grant-Date | |||||
| Number of Shares |
| Fair Value | ||
Non-vested at beginning of the year |
| | $ | | |
Granted |
| |
| | |
Vested |
| ( |
| | |
Forfeited |
| ( |
| | |
Non-vested at end of year |
| |
| | |
The unrecognized compensation expense related to non-vested options was $
Note 14. Earnings Per Share
Basic earnings per share (EPS) is computed by dividing net income or loss by the weighted average number of shares outstanding during the period. Diluted EPS is computed using the weighted average number of shares outstanding during the period, including the effect of all potentially dilutive shares outstanding attributable to stock instruments. The following table presents basic and diluted EPS for the years ended December 31, 2020 and 2019 (dollars and shares in thousands, except per share data):
|
| Weighted Average |
| |||||
Net Income | Shares | Per | ||||||
(Numerator) | (Denominator) | Share Amount | ||||||
For the year ended December 31, 2020 | ||||||||
Basic EPS | $ | |
| | $ | | ||
Effect of dilutive stock awards |
|
| |
| ( | |||
Diluted EPS | $ | |
| | $ | | ||
For the year ended December 31, 2019 |
|
|
|
|
|
| ||
Basic EPS | $ | |
| | $ | | ||
Effect of dilutive stock awards |
|
| |
| ( | |||
Diluted EPS | $ | |
| | $ | | ||
Antidilutive common shares issuable under awards or options of
Note 15. Related Party Transactions
In the ordinary course of business, the Bank has and expects to continue to have transactions, including borrowings, with its executive officers, directors, and their affiliates. The Bank had an insignificant amount of such loans outstanding at December 31, 2020 and 2019, respectively.
The Bank held deposits of related parties in the amount of $
88
Note 16. Cash Flow Hedge
The Company designates derivatives as cash flow hedges when they are used to manage exposure to variability in cash flows related to forecasted transactions on variable rate borrowings, such as FHLB borrowings, repurchase agreements, and brokered CDs. The Company had interest rate swaps designated as cash flow hedges with total notional amounts of $
Amounts receivable or payable are recognized as accrued under the terms of the agreements. In accordance with FASB ASC 815, Derivatives and Hedging, the Company has designated the swap as a cash flow hedge, with the derivatives’ unrealized gains or losses recorded as a component of other comprehensive income. The Company has assessed the effectiveness of each hedging relationship by comparing the changes in cash flows on the designated hedged item. The Company’s cash flow hedge was deemed to be highly effective for the years ended 2020 and 2019. The Company recorded a fair value liability of $
Note 17. Concentration of Credit Risk
At December 31, 2020 and 2019, the Company’s loan portfolio consisted of commercial, real estate and consumer (installment) loans. Real estate secured loans represented the largest concentration at
The Company maintains a portion of its cash balances with several financial institutions located in its market area. Accounts at each institution are secured by the FDIC up to $
Note 18. Financial Instruments With Off-Balance Sheet Risk
The Company is party to financial instruments with off-balance sheet risk in the normal course of business to meet the financing needs of its customers. These financial instruments include commitments to extend credit and standby letters of credit. Those instruments involve, to varying degrees, elements of credit and interest rate risk in excess of the amount recognized in the balance sheet. The contract amounts of those instruments reflect the extent of involvement the Company has in particular classes of financial instruments.
The Company’s exposure to credit loss in the event of nonperformance by the other party to the financial instrument for commitments to extend credit and standby letters of credit is represented by the contractual amount of those instruments. The Company uses the same credit policies in making commitments and conditional obligations as it does for on-balance sheet instruments. A summary of the contract amounts of the Company’s exposure to off-balance sheet risk as of December 31, 2020 and 2019, is as follows (dollars in thousands):
| December 31, 2020 |
| December 31, 2019 | |||
Commitments with off-balance sheet risk: |
|
|
|
| ||
Commitments to extend credit | $ | | $ | | ||
Standby letters of credit |
| |
| | ||
Total commitments with off-balance sheet risks | $ | | $ | | ||
Commitments to extend credit are agreements to lend to a customer as long as there is no violation of any condition established in the contract. Commitments generally have fixed expiration dates or other termination clauses and may require payment of a fee. Since many of the commitments are expected to expire without being drawn upon, the total commitment amounts do not necessarily represent future cash requirements. The Company evaluates each customer’s credit worthiness on a case-by-case basis. The amount of collateral obtained, if deemed necessary by the Company upon extension of credit, is based on management’s credit evaluation of the counterparty. Collateral held
89
varies but may include accounts receivable, inventory, property and equipment, and income-producing commercial properties.
Unfunded commitments under commercial lines of credit, revolving credit lines and overdraft protection agreements are commitments for possible future extensions of credit to existing customers. These lines of credit are generally uncollateralized and usually do not contain a specified maturity date and may be drawn upon only to the total extent to which the Company is committed.
Standby letters of credit are conditional commitments issued by the Company to guarantee the performance of a customer to a third party. Those guarantees are primarily issued to support public and private borrowing arrangements, including commercial paper, bond financing, and similar transactions. The credit risk involved in issuing letters of credit is essentially the same as that involved in extending loan facilities to customers. The amount of collateral obtained, if deemed necessary by the Company upon extension of credit, is based on management’s evaluation of the counterparty. Since most of the letters of credit are expected to expire without being drawn upon, they do not necessarily represent future cash requirements.
Note 19. Minimum Regulatory Capital Requirements
The Bank is subject to various regulatory capital requirements administered by the federal banking agencies. Failure to meet minimum capital requirements can initiate certain mandatory and possibly additional discretionary actions by regulators that, if undertaken, could have a direct material effect on the Bank’s financial statements. Under capital adequacy guidelines and the regulatory framework for prompt corrective action, the Bank must meet specific capital guidelines that involve quantitative measures of their assets, liabilities and certain off-balance sheet items as calculated under regulatory accounting practices. The capital amounts and classification are also subject to qualitative judgments by the regulators about components, risk weightings, and other factors.
Quantitative measures established by regulation to ensure capital adequacy require the Bank to maintain minimum amounts and ratios (set forth in the table below) of total, tier 1 and common equity tier 1 capital (as defined in the regulations) to risk weighted assets (as defined), and of tier 1 capital (as defined) to adjusted average total assets (as defined). Management believes, as of December 31, 2020 and 2019, that the Bank met all capital adequacy requirements to which it is subject.
As of December 31, 2020, based on regulatory guidelines, the Bank is well capitalized under the regulatory framework for prompt corrective action. To be categorized as well capitalized, the Bank must maintain minimum total risk-based, tier 1 risk-based, common equity tier 1, and tier 1 leverage ratios as set forth in the table below. There are no conditions or events since that date that management believes have changed the Bank’s category.
90
The Bank’s actual capital amounts and ratios are presented in the following table (dollars in thousands).
Required in Order to be |
| |||||||||||||||
Required for Capital | Well Capitalized Under Prompt |
| ||||||||||||||
Actual | Adequacy Purposes | Corrective Action |
| |||||||||||||
| Amount |
| Ratio |
| Amount |
| Ratio |
| Amount |
| Ratio |
| ||||
As of December 31, 2020: |
|
|
|
|
|
|
|
|
|
|
|
| ||||
Total Capital to risk weighted assets | $ | |
| | % | $ | |
| | % | $ | |
| | ||
Tier 1 Capital to risk weighted assets |
| |
| | % |
| |
| | % |
| |
| | % | |
Common Equity Tier 1 Capital to risk weighted assets |
| |
| | % |
| |
| | % |
| |
| | % | |
Tier 1 Capital to adjusted average total assets |
| |
| | % |
| |
| | % |
| |
| | % | |
As of December 31, 2019: |
|
|
|
|
|
|
|
|
|
|
|
| ||||
Total Capital to risk weighted assets | $ | |
| | % | $ | |
| | % | $ | |
| | % | |
Tier 1 Capital to risk weighted assets |
| |
| | % |
| |
| | % |
| |
| | % | |
Common Equity Tier 1 Capital to risk weighted assets |
| |
| | % |
| |
| | % |
| |
| | % | |
Tier 1 Capital to adjusted average total assets |
| |
| | % |
| |
| | % |
| |
| | % | |
Under the Basel III regulatory capital framework, a capital conservation buffer of
In 2018, the Economic Growth, Regulatory Relief and Consumer Protection Act developed a Community Bank Leverage Ratio (the ratio of a bank’s tangible equity capital to average total consolidated assets) for banking organizations with assets of less than $10 billion, such as the Bank. In 2019, the federal banking agencies issued a final rule that implements the Community Bank Leverage Ratio Framework (the “CBLRF”). To qualify for the CBLRF, a bank must have less than $10 billion in total consolidated assets, limited amounts of off-balance sheet exposures and trading assets and liabilities, and a leverage ratio greater than 9 percent. A bank that elects the CBLRF and has a leverage ratio greater than 9 percent will be considered to be in compliance with Basel III capital requirements and exempt from the complex Basel III calculations and will also be deemed “well capitalized” under Prompt Corrective Action regulations. A bank that falls out of compliance with the CBLRF will have a two-quarter grace period to come back into full compliance, provided its leverage ratio remains above 8 percent (a bank will be deemed “well capitalized” during the grace period). The CBLRF was available for banking organizations to use as of March 31, 2020 (with the flexibility for banking organizations to subsequently opt into or out of the CBLRF, as applicable). The Bank has chosen to opt out of the CBLRF as of December 31, 2020.
Note 20. Fair Values of Assets and Liabilities
FASB ASC 820, Fair Value Measurements and Disclosures, defines fair value as the exchange price that would be received for an asset or paid to transfer a liability (an exit price) in the principal or most advantageous market for the asset or liability in an orderly transaction between market participants on the measurement date. FASB ASC 820 requires that valuation techniques maximize the use of observable inputs and minimize the use of unobservable inputs and also establishes a fair value hierarchy that prioritizes the valuation inputs into three broad levels. The Company groups assets and liabilities at fair value in three levels, based on the markets in which the assets and liabilities are traded and the reliability of the assumptions used to determine fair value. These levels are:
| ● | Level 1—Valuation is based upon quoted prices for identical instruments traded in active markets. |
91
| ● | Level 2—Valuation is based upon quoted prices for similar instruments in active markets, quoted prices for identical or similar instruments in markets that are not active, and model-based valuation techniques for which all significant assumptions are observable in the market or can be corroborated by observable market data for substantially the full term of the assets or liabilities. |
| ● | Level 3—Valuation is determined using model-based techniques with significant assumptions not observable in the market. These unobservable assumptions reflect the Company’s own estimates of assumptions that market participants would use in pricing the asset or liability. Valuation techniques include the use of third party pricing services, option pricing models, discounted cash flow models and similar techniques. |
FASB ASC 825, Financial Instruments, allows an entity the irrevocable option to elect fair value for the initial and subsequent measurement for certain financial assets and liabilities on a contract-by-contract basis. The Company has not made any material FASB ASC 825 elections as of December 31, 2020.
Assets and Liabilities Recorded at Fair Value on a Recurring Basis
The Company utilizes fair value measurements to record adjustments to certain assets to determine fair value disclosures. Securities available for sale and the cash flow hedge are recorded at fair value on a recurring basis. The tables below present the recorded amount of assets and liabilities measured at fair value on a recurring basis (dollars in thousands):
December 31, 2020 | ||||||||||||
| Total |
| Level 1 |
| Level 2 |
| Level 3 | |||||
Investment securities available for sale |
|
|
|
|
|
|
|
| ||||
U.S. Treasury securities | $ | | $ | | $ | $ | ||||||
U.S. Government agencies |
| |
| |
| |
| |||||
State, county and municipal |
| |
| |
| |
| |||||
Mortgage backed securities |
| |
| |
| |
| |||||
Asset backed securities |
| |
| |
| |
| |||||
Corporate bonds |
| |
| |
| |
| |||||
Total investment securities available for sale |
| |
| |
| |
| |||||
Total assets at fair value | $ | | $ | | $ | | $ | |||||
Cash flow hedge liability | $ | |
| $ | |
| ||||||
Total liabilities at fair value | $ | | $ | $ | | $ | ||||||
December 31, 2019 | ||||||||||||
| Total |
| Level 1 |
| Level 2 |
| Level 3 | |||||
Investment securities available for sale | ||||||||||||
U.S. Government agencies | $ | | $ | $ | | $ | ||||||
State, county and municipal |
| |
| |
| |
| |||||
Mortgage backed securities |
| |
| |
| |
| |||||
Asset backed securities |
| |
|
| |
| ||||||
Corporate bonds |
| |
|
| |
| ||||||
Total investment securities available for sale |
| |
| |
| |
| |||||
Total assets at fair value | $ | | $ | | $ | | $ | |||||
Cash flow hedge liability | |
| $ | |
| |||||||
Total liabilities at fair value | $ | | $ | $ | | $ | ||||||
Investment securities available for sale
Investment securities available for sale are recorded at fair value each reporting period. Fair value measurement is based upon quoted prices, if available (Level 1). If quoted prices are not available, fair values are measured using independent pricing models or other model-based valuation techniques such as the present value of future cash flows,
92
adjusted for the security’s credit rating, prepayment assumptions and other factors such as credit loss assumptions (Level 2).
The Company utilizes a third party vendor to provide fair value data for purposes of determining the fair value of its available for sale securities portfolio. The third party vendor uses reputable pricing companies for security market data. The third party vendor has controls in place for month-to-month market checks and zero pricing, and a Statement on Standards for Attestation Engagements No. 18 report is obtained from the third party vendor on an annual basis. The Company makes no adjustments to the pricing service data received for its securities available for sale.
Cash flow hedge
The fair values of interest rate swaps are determined using the market standard methodology of netting the discounted future fixed cash receipts (or payments) and the discounted expected variable cash payments (or receipts). The variable cash payments (or receipts) are based on an expectation of future interest rates (forward curves) derived from observable market interest rate curves.
Assets and Liabilities Measured at Fair Value on a Nonrecurring Basis
The Company is also required to measure and recognize certain other financial assets at fair value on a nonrecurring basis on the consolidated balance sheet. The following tables present assets measured at fair value on a nonrecurring basis for the years ended December 31, 2020 and 2019 (dollars in thousands):
December 31, 2020 | ||||||||||||
| Total |
| Level 1 |
| Level 2 |
| Level 3 | |||||
Impaired loans | $ | | $ | $ | $ | | ||||||
Loans held for sale |
|
|
| |||||||||
Bank premises and equipment held for sale |
| |
|
|
| | ||||||
Other real estate owned |
| |
|
|
| | ||||||
Total assets at fair value | $ | | $ | $ | $ | | ||||||
Total liabilities at fair value | $ | $ | $ | $ | ||||||||
December 31, 2019 | ||||||||||||
| Total |
| Level 1 |
| Level 2 |
| Level 3 | |||||
Impaired loans | $ | | $ | $ | $ | | ||||||
Loans held for sale | | | ||||||||||
Bank premises and equipment held for sale | | | ||||||||||
Other real estate owned |
| |
|
|
| | ||||||
Total assets at fair value | $ | | $ | $ | | $ | | |||||
Total liabilities at fair value | $ | $ | $ | $ | ||||||||
Impaired loans
Loans for which it is probable that payment of interest and principal will not be made in accordance with the contractual terms of the loan agreement are considered impaired. Once a loan is identified as individually impaired, management measures the impairment in accordance with FASB ASC 310, Receivables. The fair value of impaired loans is estimated using one of several methods, including collateral value and discounted cash flows. Those impaired loans not requiring an allowance represent loans for which the fair value of the expected repayments or collateral exceeds the recorded investments in such loans. At December 31, 2020 and December 31, 2019, a majority of total impaired loans were evaluated based on the fair value of the collateral. The Company frequently obtains appraisals prepared by external professional appraisers for classified loans greater than $
93
records impaired loans as nonrecurring Level 3. For the years ended December 31, 2020 and December 31, 2019, weighted average adjustments, calculated based on relative fair value, related to impaired loans were
The Company may also identify collateral deterioration based on current market sales data, including price and absorption, as well as input from real estate sales professionals and developers, county or city tax assessments, market data and on-site inspections by Company personnel. When management determines that the fair value of the collateral is further impaired below the appraised value, due to such things as absorption rates and market conditions, and there is no observable market price, the Company records the impaired loan as nonrecurring Level 3. In instances where an appraisal received subsequent to an internally prepared estimate reflects a higher collateral value, management does not revise the carrying amount. Impaired loans can also be evaluated for impairment using the present value of expected future cash flows discounted at the loan’s effective interest rate. The measurement of impaired loans using future cash flows discounted at the loan’s effective interest rate rather than the market rate of interest is not a fair value measurement and is therefore excluded from fair value disclosure requirements. Reviews of classified loans are performed by management on a quarterly basis.
Loans held for sale
The carrying amounts of loans held for sale approximate fair value (Level 2).
Bank premises and equipment held for sale
The fair value of bank premises and equipment held for sale was determined using the adjusted appraisal methodology described in the other real estate owned (OREO) asset section below.
Other real estate owned
OREO assets are adjusted to fair value less estimated disposal costs upon transfer of the related loans to OREO, establishing a new cost basis. Initial fair value is based on appraised values of the collateral less estimated disposal costs. Subsequent to the transfer, valuations are periodically performed by management based on updated appraisals, general market conditions, recent sales of similar properties, length of time the properties have been held, and the Company’s ability and intent with regard to continued ownership of the properties. The assets are carried at the lower of carrying value or fair value less estimated disposal costs. The Company may incur additional write-downs of OREO assets to fair value less estimated costs to sell if valuations indicate a further deterioration in market conditions. As such, the Company records OREO as a nonrecurring fair value measurement classified as Level 3.
Fair Value of Financial Instruments
FASB ASC 825, Financial Instruments, requires disclosure of the fair value of financial assets and financial liabilities, including those financial assets and financial liabilities that are not measured and reported at fair value on a recurring or nonrecurring basis. FASB ASC 825 excludes certain financial instruments and all nonfinancial instruments from its disclosure requirements. Accordingly, the aggregate fair value amounts presented may not necessarily represent the underlying fair value of the Company. Additionally, in accordance with FASB ASU 2016-01, which the Company adopted on January 1, 2018 on a prospective basis, the Company uses the exit price notion, rather than the entry price notion, in calculating fair values of financial instruments not measured at fair value on a recurring basis.
94
The following reflects the fair value of financial instruments, whether or not recognized on the consolidated balance sheet, at fair value measures by level of valuation assumptions used for those assets. These tables exclude financial instruments for which the carrying value approximates fair value (dollars in thousands):
December 31, 2020 | |||||||||||||||
|
| Estimated Fair |
|
|
| ||||||||||
Carrying Value | Value | Level 1 | Level 2 | Level 3 | |||||||||||
Financial assets: | |||||||||||||||
Securities held to maturity | $ | | $ | | $ | $ | | $ | |||||||
Loans, net of allowance |
| |
| |
|
|
| | |||||||
PCI loans, net of allowance |
| |
| |
|
|
| | |||||||
Financial liabilities: |
|
|
|
|
|
|
|
|
|
| |||||
Interest bearing deposits |
| |
| |
|
| |
| |||||||
Borrowings |
| |
| |
|
| |
| |||||||
December 31, 2019 | |||||||||||||||
|
| Estimated Fair |
|
|
| ||||||||||
Carrying Value | Value | Level 1 | Level 2 | Level 3 | |||||||||||
Financial assets: | |||||||||||||||
Securities held to maturity | $ | | $ | | $ | $ | | $ | |||||||
Loans, net of allowance |
| |
| |
|
|
| | |||||||
PCI loans, net of allowance |
| |
| |
|
|
| | |||||||
Financial liabilities: |
|
|
|
|
|
|
|
|
|
| |||||
Interest bearing deposits |
| |
| |
|
| |
| |||||||
Borrowings |
| |
| |
|
| |
| |||||||
Note 21. Trust Preferred Capital Notes
On December 12, 2003, BOE Statutory Trust I, a wholly-owned unconsolidated subsidiary of the Company, was formed for the purpose of issuing redeemable capital securities. On December 12, 2003, $
The obligations of the Company with respect to the issuance of the capital securities constitute a full and unconditional guarantee by the Company of the Trust’s obligations with respect to the capital securities.
Subject to certain exceptions and limitations, the Company may elect from time to time to defer interest payments on the junior subordinated debt securities, which would result in a deferral of distribution payments on the related capital securities. The Company is current in its obligations under the trust preferred notes.
Note 22. Revenue Recognition
The Company recognizes income in accordance with FASB ASU 2014-09, Revenue from Contracts with Customers (Topic 606), and all subsequent ASUs that modified Topic 606. Topic 606 does not apply to revenue associated with financial instruments, including revenue from loans and securities. In addition, certain noninterest income streams such as fees associated with mortgage servicing rights, financial guarantees, derivatives, and certain credit card fees are also not in scope of this guidance. Topic 606 is applicable to noninterest revenue streams such as deposit related fees, interchange fees, merchant income, and brokerage fees and commissions. Substantially all of the Company’s revenue is generated from contracts with customers. Noninterest revenue streams in-scope of Topic 606 are discussed below.
95
Service charges and fees on deposit accounts
The Company earns fees from its deposit customers for transaction-based, account maintenance, and overdraft services. Transaction-based fees, which include services such as stop payment charges, statement rendering, and ACH fees, are recognized at the time the transaction is executed as that is the point in time the Company fulfills the customer’s request. Account maintenance fees, which relate primarily to monthly maintenance, are earned over the course of a month, representing the period over which the Company satisfies the performance obligation. Overdraft fees are recognized at the point in time that the overdraft occurs. Service charges on deposits are withdrawn from the customer’s account balance.
Interchange and ATM fees
The Company earns interchange and ATM fees from debit/credit cardholder transactions conducted through the Visa and ATM payment networks. Interchange fees from cardholder transactions represent a percentage of the underlying transaction value and are recognized daily, concurrently with the transaction processing services provided to the cardholder. Because the Company acts as an agent and does not control the services rendered to the customers, related costs are netted against the fee income. These costs were included in other operating expenses prior to the adoption of Topic 606.
Brokerage fees and commissions
Brokerage fees and commissions consist of other recurring revenue streams such as commissions from sales of mutual funds and other investments to customers by a third-party service provider and investment advisor fees. The Company receives commissions from the third-party service provider on a monthly basis based upon customer activity for the month. The investment advisor fees are charged to the customer’s account in advance on the first month of the quarter, and the revenue is recognized over the following three-month period.
The following table presents noninterest income, segregated by revenue streams in-scope and out-of-scope of Topic 606, for the years ended December 31, 2020 and 2019 (dollars in thousands):
Year ended | ||||||
December 31, 2020 | December 31, 2019 | |||||
Noninterest income | ||||||
In-scope of Topic 606: | ||||||
Service charges on deposit accounts | $ | | $ | | ||
Interchange and ATM fees |
| |
| | ||
Brokerage fees and commissions |
| |
| | ||
Noninterest income (in-scope of Topic 606) |
| |
| | ||
Noninterest income (out-of-scope of Topic 606) |
| |
| | ||
Total noninterest income | $ | | $ | | ||
Note 23. Leases
On January 1, 2019, the Company adopted FASB ASU 2016-02, Leases (Topic 842), as it relates to its non-cancellable operating leases and subleases of bank premises. The guidance was implemented using the modified retrospective transition approach at the date of adoption with no cumulative effect adjustment to opening retained earnings and no material impact on the measurement of operating lease costs. Prior period amounts were not adjusted and continue to be reported in accordance with the Company’s historical accounting policies, resulting in a balance sheet presentation that is not comparable to the prior period in the first year of adoption. The Company elected the
96
The Company's leases have lease terms between
The following table presents operating lease liabilities at December 31, 2020 and December 31, 2019 (dollars in thousands):
December 31, 2020 | December 31, 2019 | |||||
|
|
| ||||
Gross lease liability | $ | | $ | | ||
Less: imputed interest |
| ( |
| ( | ||
Present value of lease liability | $ | | $ | | ||
The weighted average remaining lease term and weighted average discount rate for operating leases for the years ended December 31, 2020 and 2019 were
2021 |
| $ | |
2022 |
| | |
2023 |
| | |
2024 |
| | |
2025 |
| | |
Thereafter |
| | |
Total of future payments | $ | |
Operating lease costs and sublease rental income for the years ended December 31, 2020 and 2019 were $
Note 24. Other Operating Expenses
Other operating expenses totals are presented in the following tables. Components of these expenses exceeding
Year Ended December 31 | ||||||
| 2020 |
| 2019 | |||
Bank franchise tax | $ | | $ | | ||
Stationery, printing and supplies |
| |
| | ||
Credit expense |
| |
| | ||
Outside vendor fees |
| |
| | ||
Other expenses |
| |
| | ||
Total other operating expenses | $ | | $ | | ||
97
Note 25. Parent Corporation Only Financial Statements
PARENT COMPANY
CONDENSED BALANCE SHEETS
AS OF DECEMBER 31, 2020 and 2019
(dollars in thousands)
| 2020 |
| 2019 | |||
Assets | ||||||
Cash | $ | | $ | | ||
Other assets |
| |
| | ||
Investments in subsidiaries |
| |
| | ||
Total assets | $ | | $ | | ||
Liabilities |
|
|
|
| ||
Other liabilities | $ | | $ | — | ||
Balances due to non-bank subsidiary |
| |
| | ||
Total liabilities |
| |
| | ||
Shareholders’ Equity |
|
|
|
| ||
Common stock ( |
| |
| | ||
Additional paid in capital |
| |
| | ||
Retained earnings |
| |
| | ||
Accumulated other comprehensive income |
| |
| | ||
Total shareholders’ equity | $ | | $ | | ||
Total liabilities and shareholders’ equity | $ | | $ | | ||
PARENT COMPANY
CONDENSED STATEMENTS OF INCOME AND COMPREHENSIVE INCOME
FOR THE YEARS ENDED DECEMBER 31, 2020 AND 2019
(dollars in thousands)
| 2020 |
| 2019 | |||
Income: | ||||||
Dividends received from subsidiaries | $ | | $ | — | ||
Other operating income |
| |
| | ||
Total income |
| |
| | ||
Expenses: |
|
|
|
| ||
Interest expense |
| |
| | ||
Management fee paid to subsidiaries |
| |
| | ||
Stock compensation expense |
| |
| | ||
Professional and legal expenses |
| |
| | ||
Other operating expenses |
| |
| | ||
Total expenses |
| |
| | ||
Equity in undistributed income of subsidiaries |
| |
| | ||
Net income before income taxes |
| |
| | ||
Income tax benefit |
| |
| | ||
Net income | $ | | $ | | ||
Comprehensive income | $ | | $ | | ||
98
PARENT COMPANY
STATEMENTS OF CASH FLOWS
FOR THE YEARS ENDED DECEMBER 31, 2020 AND 2019
(dollars in thousands)
| 2020 |
| 2019 | |||
Operating activities: | ||||||
Net income | $ | | $ | | ||
Adjustments to reconcile net income to net cash provided by operating activities: |
|
|
|
| ||
Stock compensation expense |
| |
| | ||
Undistributed equity in income of subsidiary |
| ( |
| ( | ||
Decrease (increase) in other assets |
| |
| ( | ||
Increase (decrease) in other liabilities |
| |
| ( | ||
Net cash and cash equivalents provided by operating activities |
| |
| | ||
Financing activities: |
|
|
|
| ||
Proceeds from issuance of common stock |
| |
| | ||
Advances from subsidiary | | — | ||||
Repurchase of common stock | ( | — | ||||
Cash dividends paid |
| ( |
| ( | ||
Net cash and cash equivalents used in financing activities |
| ( |
| ( | ||
Increase (decrease) in cash and cash equivalents |
| |
| ( | ||
Cash and cash equivalents at beginning of the period |
| |
| | ||
Cash and cash equivalents at end of the period | $ | | $ | | ||
99
ITEM 9. CHANGES IN AND DISAGREEMENTS WITH ACCOUNTANTS ON ACCOUNTING AND FINANCIAL DISCLOSURE
Not applicable.
ITEM 9A. CONTROLS AND PROCEDURES
Evaluation of Disclosure Controls and Procedures
As of the end of the period covered by this Form 10-K, the Company’s management, with the participation of the Company’s chief executive officer and chief financial officer (the “Certifying Officers”), conducted evaluations of the Company’s disclosure controls and procedures. As defined under Section 13a-15(e) of the Securities Exchange Act of 1934, as amended (the “Exchange Act”), the term “disclosure controls and procedures” means controls and other procedures of an issuer that are designed to ensure that information required to be disclosed by the issuer in the reports that it files or submits under the Exchange Act is recorded, processed, summarized and reported, within the time periods specified in the Commission’s rules and forms. Disclosure controls and procedures include, without limitation, controls and procedures designed to ensure that information required to be disclosed by an issuer in the reports that it files or submits under the Exchange Act is accumulated and communicated to the issuer’s management, including the Certifying Officers, to allow timely decisions regarding required disclosures.
Based on this evaluation, the Certifying Officers have concluded that the Company’s disclosure controls and procedures were effective to ensure that material information is recorded, processed, summarized and reported by management of the Company on a timely basis in order to comply with the Company’s disclosure obligations under the Exchange Act and the rules and regulations promulgated thereunder.
Management’s Report on Internal Control over Financial Reporting
The management of the Company is responsible for establishing and maintaining adequate internal control over financial reporting. The Company’s internal control over financial reporting is a process designed under the supervision of the Certifying Officers to provide reasonable assurance regarding the reliability of financial reporting and the preparation of the Company’s financial statements for external purposes in accordance with generally accepted accounting principles.
As of December 31, 2020, management assessed the effectiveness of the Company’s internal control over financial reporting based on the criteria for effective internal control over financial reporting established in “Internal Control — Integrated Framework (2013),” issued by the Committee of Sponsoring Organizations (COSO) of the Treadway Commission. This assessment included controls over the preparation of the schedules equivalent to the basic financial statements in accordance with the instructions for the Consolidated Financial Statements for Bank Holding Companies (Form FR Y-9C) to meet the reporting requirements of Section 112 of the Federal Deposit Insurance Corporation Improvement Act.
Based on its assessment, management concluded that, as of December 31, 2020, the Company’s internal control over financial reporting was effective based on the criteria set forth by COSO in its “Internal Control — Integrated Framework.”
The Company’s annual report does not include an attestation report of the Company’s independent registered public accounting firm, Yount, Hyde, & Barbour. P.C. (YHB), regarding internal control over financial reporting. Management’s report was not subject to attestation by YHB pursuant to rules of the Securities and Exchange Commission that permit the Company to provide only management’s report in its annual report.
Changes in Internal Control over Financial Reporting
There was no change in the Company's internal control over financial reporting identified in connection with the evaluation of internal controls that occurred during the fourth quarter of 2020 that has materially affected, or is reasonably likely to materially affect, the Company's internal control over financial reporting.
100
ITEM 9B. OTHER INFORMATION
Not applicable.
PART III
ITEM 10. DIRECTORS, EXECUTIVE OFFICERS AND CORPORATE GOVERNANCE
The information required by this item is incorporated by reference to the Company’s definitive Proxy Statement for the 2021 Annual Meeting of Shareholders, to be filed within 120 days after the end of the fiscal year that this Form 10-K covers.
ITEM 11. EXECUTIVE COMPENSATION
The information required by this item is incorporated by reference to the Company’s definitive Proxy Statement for the 2021 Annual Meeting of Shareholders, to be filed within 120 days after the end of the fiscal year that this Form 10-K covers.
ITEM 12. SECURITY OWNERSHIP OF CERTAIN BENEFICIAL OWNERS AND MANAGEMENT AND RELATED STOCKHOLDER MATTERS
The information required by this item is incorporated by reference to the Company’s definitive Proxy Statement for the 2021 Annual Meeting of Shareholders, to be filed within 120 days after the end of the fiscal year that this Form 10-K covers.
ITEM 13. CERTAIN RELATIONSHIPS AND RELATED TRANSACTIONS, AND DIRECTOR INDEPENDENCE
The information required by this item is incorporated by reference to the Company’s definitive Proxy Statement for the 2021 Annual Meeting of Shareholders, to be filed within 120 days after the end of the fiscal year that this Form 10-K covers.
ITEM 14. PRINCIPAL ACCOUNTING FEES AND SERVICES
The information required by this item is incorporated by reference to the Company’s definitive Proxy Statement for the 2021 Annual Meeting of Shareholders, to be filed within 120 days after the end of the fiscal year that this Form 10-K covers.
101
PART IV
ITEM 15. EXHIBITS, FINANCIAL STATEMENT SCHEDULES
(a)The following documents are filed as part of this Form 10-K:
1. Consolidated Financial Statements. Reference is made to the Consolidated Financial Statements, the report thereon and the notes thereto, with respect to the Company, commencing at page 53 of this Form 10-K.
2. Financial Statement Schedules. All supplemental schedules are omitted as inapplicable or because the required information is included in the Consolidated Financial Statements or notes thereto.
3. Exhibits
No. |
| Description |
3.1 | ||
3.2 | ||
3.3 | Amended and Restated Bylaws of Community Bankers Trust Corporation, a Virginia corporation, incorporated by reference to the Company’s Current Report on Form 8-K filed on May 1, 2020 (File No. 001- | |
4.1 | ||
10.1 | ||
10.2 | ||
10.3 | ||
10.4 | ||
10.5 | ||
10.6 |
102
14.1 | ||
21.1 | ||
23.1 | Consent of Independent Registered Public Accounting Firm (Yount, Hyde & Barbour, P.C.)* | |
31.1 | Rule 13a-14(a)/15d-14(a) Certification for Chief Executive Officer* | |
31.2 | Rule 13a-14(a)/15d-14(a) Certification for Chief Financial Officer* | |
32.1 | ||
101 | Inline Data File with respect to the following materials from the Company’s Annual Report on Form 10-K for the period ended December 31, 2020, formatted in Extensible Business Reporting Language (XBRL): (i) the Consolidated Balance Sheets, (ii) the Consolidated Statements of Income, (iii) the Consolidated Statement of Comprehensive Income, (iv) the Consolidated Statements of Changes in Shareholders’ Equity, (v) the Consolidated Statements of Cash Flows, and (vi) Notes to Consolidated Financial Statements* | |
104 | Cover Page Interactive Data File (formatted as Inline XBRL and contained in Exhibit 101) |
*Filed herewith.
| (b) | Exhibits. See Item 15(a)3. above |
| (c) | Financial Statement Schedules. See Item 15(a)2. above |
ITEM 16. FORM 10-K SUMMARY
Not applicable.
103
SIGNATURES
Pursuant to the requirements of Section 13 or 15(d) of the Securities Exchange Act of 1934, the registrant has duly caused this report to be signed on its behalf by the undersigned, thereunto duly authorized.
COMMUNITY BANKERS TRUST CORPORATION | ||
By: | /s/ Rex L. Smith, III | |
Rex L. Smith, III | ||
President and Chief Executive Officer | ||
Date: March 15, 2021
Pursuant to the requirements of the Securities Exchange Act of 1934, this report has been signed below by the following persons on behalf of the registrant and in the capacities and on the dates indicated.
Signature | Title | Date |
|---|---|---|
/s/ Rex L. Smith, III Rex L. Smith, III | President and Chief Executive Officer and Director (principal executive officer) | March 15, 2021 |
/s/ Bruce E. Thomas Bruce E. Thomas | Executive Vice President and Chief Financial Officer (principal financial officer) | March 15, 2021 |
/s/ Laureen D. Trice Laureen D. Trice | Senior Vice President and Controller (principal accounting officer) | March 15, 2021 |
/s/ John C. Watkins John C. Watkins | Chairman of the Board | March 15, 2021 |
/s/ Gerald F. Barber Gerald F. Barber | Director | March 15, 2021 |
/s/ Hugh M. Fain, III Hugh M. Fain, III | Director | March 15, 2021 |
/s/ William E. Hardy William E. Hardy | Director | March 15, 2021 |
/s/ Ira C. Harris | Director | March 15, 2021 |
Ira C. Harris | ||
/s/ Gail L. Letts Gail L. Letts | Director | March 15, 2021 |
/s/ Eugene S. Putnam, Jr. Eugene S. Putnam, Jr. | Director | March 15, 2021 |
/s/ S. Waite Rawls III S. Waite Rawls III | Director | March 15, 2021 |
/s/ Oliver L. Way Oliver L. Way | Director | March 15, 2021 |
/s/ Robin Traywick Williams Robin Traywick Williams | Director | March 15, 2021 |
104
Serious News for Serious Traders! Try StreetInsider.com Premium Free!
You May Also Be Interested In
- Share buybacks in Spar Nord Bank – transactions in week 16
- FPT to Shape the Future of AI and Cloud on a Global Scale in Collaboration with NVIDIA
- Regula Pinpoints Top Three Business Challenges with Verification of International Customers
Create E-mail Alert Related Categories
SEC FilingsSign up for StreetInsider Free!
Receive full access to all new and archived articles, unlimited portfolio tracking, e-mail alerts, custom newswires and RSS feeds - and more!
