

Form 10-K CSW INDUSTRIALS, INC. For: Mar 31
 Tweet
Tweet Share
ShareUNITED STATES
SECURITIES AND EXCHANGE COMMISSION
Washington, D.C. 20549
FORM | ||
| ANNUAL REPORT PURSUANT TO SECTION 13 OR 15(d) OF THE SECURITIES EXCHANGE ACT OF 1934 | |||||
For the fiscal year ended March 31 , 2022
OR
| TRANSITION REPORT PURSUANT TO SECTION 13 OR 15(d) OF THE SECURITIES EXCHANGE ACT OF 1934 | |||||
For the transition period from to .
Commission file number 001-37454
(Exact name of registrant as specified in its charter) | ||
| (state or other jurisdiction of incorporation or organization) | (I.R.S. Employer Identification No.) | |||||||
| (Address of principal executive offices) | (zip code) | |||||||
(214 ) 884-3777
Registrant’s telephone number, including area code:
Securities registered pursuant to Section 12(b) of the Act:
| Title of each class | Trading symbol (s) | Name of each exchange on which registered | ||||||||||||
| Securities registered pursuant to section 12(g) of the Act: None | ||
Indicate by check mark if the registrant is a well-known seasoned issuer, as defined in Rule 405 of the Securities Act. Yes ☐ No ☒
Indicate by check mark if the registrant is not required to file reports pursuant to Section 13 or Section 15(d) of the Act. Yes ☐ No ☒
Indicate by check mark whether the registrant (1) has filed all reports required to be filed by Section 13 or 15(d) of the Securities Exchange Act of 1934 during the preceding 12 months (or for such shorter period that the registrant was required to file such reports) and (2) has been subject to such filing requirements for the past 90 days. Yes ☒ No ☐
Indicate by check mark whether the registrant has submitted electronically every Interactive Data File required to be submitted pursuant to Rule 405 of Regulation S-T (§232.405 of this chapter) during the preceding 12 months (or for such shorter period that the registrant was required to submit such files). Yes ☒ No ☐
Indicate by check mark whether the registrant is a large accelerated filer, an accelerated filer, a non-accelerated filer, smaller reporting company, or an emerging growth company. See the definitions of “large accelerated filer,” “accelerated filer,” “smaller reporting company,” and “emerging growth company” in Rule 12b-2 of the Exchange Act.
Accelerated filer ☐ | Non-accelerated filer ☐ (Do not check if smaller reporting company) | Smaller reporting company | Emerging growth company | |||||||||||
If an emerging growth company, indicate by check mark if the registrant has elected not to use the extended transition period for complying with any new or revised financial accounting standards provided pursuant to Section 13(a) of the Exchange Act. ☐
Indicate by check mark whether the registrant has filed a report on and attestation to its management's assessment of the effectiveness of its internal control over financial reporting under Section 404(b) of the Sarbanes-Oxley Act (15 U.S.C. 7262(b)) by the registered public accounting firm that prepared or issued its audit report. ☒
Indicate by check mark whether the registrant is a shell company (as defined in Rule 12b-2 of the Exchange Act). Yes ☐ No ☒
The aggregate market value of the registrant’s common stock held by non-affiliates, based on the last sale price for the common stock as reported by the Nasdaq Global Select Market on September 30, 2021, the last business day of our most recently completed second fiscal quarter was approximately $1,984.0 million.
As of May 12, 2022, the latest practicable date, 15,676,790 shares of the registrant’s common stock, par value $0.01 per share, were issued and outstanding.
DOCUMENTS INCORPORATED BY REFERENCE
TABLE OF CONTENTS
| PART I | ||||||||
| ITEM 1: | ||||||||
| ITEM 1A: | ||||||||
| ITEM 1B: | ||||||||
| ITEM 2: | ||||||||
| ITEM 3: | ||||||||
| ITEM 4: | ||||||||
| PART II | ||||||||
| ITEM 5: | ||||||||
| ITEM 6: | ||||||||
| ITEM 7: | ||||||||
| ITEM 7A: | ||||||||
| ITEM 8: | ||||||||
| ITEM 9: | ||||||||
| ITEM 9A: | ||||||||
| ITEM 9B: | ||||||||
| PART III | ||||||||
| ITEM 10: | ||||||||
| ITEM 11: | ||||||||
| ITEM 12: | ||||||||
| ITEM 13: | ||||||||
| ITEM 14: | ||||||||
| PART IV | ||||||||
| ITEM 15: | ||||||||
| EX-10.3 | ||||||||
| EX-21.1 | ||||||||
| EX-23.1 | ||||||||
| EX-31.1 | ||||||||
| EX-31.2 | ||||||||
| EX-32.1 | ||||||||
| EX-32.2 | ||||||||
| EX-101 XBRL Instance Document | ||||||||
| EX-101 XBRL Taxonomy Extension Schema | ||||||||
| EX-101 XBRL Taxonomy Extension Calculation Linkbase Document | ||||||||
| EX-101 XBRL Taxonomy Extension Definition Linkbase Document | ||||||||
| EX-101 XBRL Taxonomy Extension Label Linkbase Document | ||||||||
| EX-101 XBRL Taxonomy Extension Presentation Linkbase Document | ||||||||
PART I
Unless otherwise specified, or the context otherwise requires, the references in this Annual Report on Form 10-K for the fiscal year ended March 31, 2022 (“Annual Report”) to “our company,” “we,” “us,” “our” or “CSWI” refer to CSW Industrials, Inc. together with our wholly-owned subsidiaries.
ITEM 1: BUSINESS
General
CSWI is a diversified industrial growth company with a strategic focus on providing niche, value-added products in the end markets we serve. We operate in three business segments: Contractor Solutions, Engineered Building Solutions and Specialized Reliability Solutions. Our products include mechanical products for heating, ventilation, air conditioning and refrigeration ("HVAC/R"), plumbing products, grilles, registers and diffusers ("GRD"), building safety solutions and high-performance specialty lubricants and sealants. End markets that we serve include HVAC/R, architecturally-specified building products, plumbing, energy, rail, mining and general industrial. Our manufacturing operations are concentrated in the United States (“U.S.”), Canada and Vietnam, and we have distribution operations in the U.S., Australia, Canada and the United Kingdom (“U.K.”). Our products are sold directly to end users or through designated channels in over 100 countries around the world, primarily including Australia, Canada, the U.K. and the U.S.
Drawing on our innovative and proven technologies, we seek to deliver solutions primarily to our professional end-use customers that place a premium on superior performance and reliability. We believe our brands are well-known in the specific end markets we serve and have a reputation for high quality. We rely on both organic growth and inorganic growth through acquisitions to provide an increasingly broad portfolio of performance optimizing solutions that meet our customers’ ever-changing needs. We have a successful record of making attractive, synergistic acquisitions that support expansion of our broad portfolio of solutions, and we remain focused on identifying additional acquisition opportunities in our core end markets.
Through our operating companies, we have a well-established legacy of providing high quality products accompanied by dependable service and attention to customer satisfaction. We also have a long history of innovation, through which we have developed a robust line of products to solve our customers' specific challenges. These products are distributed through an extensive wholesale distribution network serving the HVAC/R, architecturally-specified buildings products, plumbing, general industrial, energy, rail and mining end markets. Our desire to develop solutions for our professional end-use customers, combined with the differentiated nature of our niche product offerings, drives loyalty to our brands.
CSWI is a Delaware corporation and was incorporated in 2014 in anticipation of CSWI's separation from Capital Southwest Corporation ("Capital Southwest"). Our well-established operating companies provide a collective history that spans more than a century. The separation was executed on September 30, 2015 through a pro-rata share distribution of all the then outstanding shares of common stock of CSWI to the holders of common stock of Capital Southwest (the "Share Distribution"). Since the separation, CSWI has been an independent, publicly-traded company, listed on the Nasdaq Global Select Market.
Business Segments
Beginning with the quarter ended June 30, 2021, we revised our segment structure to align with how our chief operating decision maker (who was determined to be our Chief Executive Officer) views our business, assesses performance and allocates resources to our business components. Effective April 1, 2021, following the completion of various strategic transactions including the acquisition of T.A. Industries, Inc. ("TRUaire") and the formation of a joint venture owned by Whitmore Manufacturing, LLC ("Whitmore"), a wholly-owned subsidiary of CSWI, and Pennzoil-Quaker State Company dba SOPUS Products ("Shell"), a wholly-owned subsidiary of Shell Oil Company that comprises of Shell's U.S. lubricants business ("Whitmore JV"), our business is organized into three reportable segments: Contractor Solutions, Engineered Building Solutions and Specialized Reliability Solutions.
The table below provides an overview of these business segments. For financial information regarding our segments, see Note 21 to our consolidated financial statements included in Item 8 Financial Statements and Supplementary Data ("Item 8") of this Annual Report.
1
| Business Segment | Principal Product Categories | Key End Use Markets | Representative Industrial Brands | ||||||||
| Contractor Solutions | • Cements •Diffusers •Grilles • Registers •Solvents •Thread sealants •Traps •Vents | •HVAC/R •Plumbing •General Industrial •Architecturally-Specified Building Products |  | ||||||||
| Engineered Building Solutions | • Architectural railings and associated services •Fire and smoke protection solutions •Pre-engineered and custom architectural building components | • Architecturally-Specified Building Products |  | ||||||||
| Specialized Reliability Solutions | •Compounds •Contamination control •Industrial maintenance and repairs •Lubricants •Lubricant management products •Operations solutions •Sealants | •Energy •General Industrial •Mining •Railing |  | ||||||||
Contractor Solutions
Our Contractor Solutions segment manufactures efficiency and performance enhancing products predominantly for residential and commercial HVAC/R and plumbing applications, which are designed primarily for professional end -use customers. The segment is compromised primarily of our RectorSeal, TRUaire and Shoemaker operating companies and provides a wide range of products designed to create efficiency and expediency for professional end-user customers, while delivering home and building owners with trusted solutions. Our Contractor Solutions segment is strategically positioned to grow in each market served by leveraging our sales channels and distribution networks. HVAC/R professional end-user customers ask for our products by name, and for generations, professional plumbers have been using our industry-leading solutions. We manufacture the majority of our mechanical and chemical products internally and we strategically engage third-party manufacturers for certain products. We ensure the quality of internally- and externally-manufactured products through our stringent quality control review procedures.
2
Our key product types and brand names are shown below:
| PRODUCT TYPES | BRAND NAMES | ||||
• condensate removal pumps and equipment mounting brackets | • AC Leak Freeze® | ||||
• condensate switches, traps and pans | • AquaGuard® | ||||
• decorative roof drain downspout nozzles | • Aspen® Pumps | ||||
• drain waste and vent systems mechanical products | • Calci-Free® | ||||
• ductless mini-split systems installation support tools and accessories | • Clean Check® | ||||
• equipment pads | • DesolvTM | ||||
• grilles, registers and diffusers | • EZ Trap® | ||||
• line set covers | • Fortress® | ||||
| • solvents, cements, traps, vents, and thread sealants | • Goliath® | ||||
• tamper resistant locking refrigerant caps | • G-O-N® | ||||
• wire pulling head tools | • Nokorde® | ||||
| • Novent® | |||||
• RectorSeal® No. 5 | |||||
| • Safe-T-Switch® | |||||
• Shoemaker ManufacturingTM | |||||
| • Slimduct® | |||||
• SureSeal® | |||||
• T Plus 2® | |||||
| • TRUaire® | |||||
New Product Development – Customer experience is a core competency in our Contractor Solutions segment. We gather "voice of the customer" market research through organized focus groups and online surveys, as well as through less formal channels. Ideas for new products or enhancements to existing products are also generated by our relationships with end users, independent sales representatives, distributors and our internal sales and marketing team. We also actively monitor the competitive landscape. We develop new products and modify existing products in our research and development (“R&D”) lab in Houston, Texas.
Competition – Our competition in the Contractor Solutions segment is varied. Competitors range from small entrepreneurial companies with a single product, to large multinational original equipment manufacturers (“OEMs”). In the products serving the HVAC/R end market category, we compete with Diversitech, Dura-Vent/Hart & Cooley, Intermatic, Nu-Calgon, Little Giant, Supco and others. In the products serving the plumbing end market category, we compete with IPS, J.R. Smith, Mainline, Oatey and others. Most of our products are sold through distribution channels, and we compete in this channel based on breadth of product line, customer service and pricing.
Customers – Our primary customers are wholesalers and distributors in the HVAC/R and plumbing end markets. Some of these are single location distributors, the majority are regional or national with hundreds of locations. These products are generally sold domestically; however, a small portion is sold internationally through similar channels, and a small number of OEMs purchase these products directly.
Seasonality – A significant portion of our products are sold into the HVAC/R market, which is seasonal by nature. While products are sold throughout the year, revenues tend to peak during the spring and summer months.
3
Engineered Building Solutions
Our Engineered Building Solutions segment provides primarily code-driven, life-safety products that are engineered to provide aesthetically-pleasing solutions for the construction, refurbishment and modernization of commercial, institutional and multi-family residential buildings. This segment is comprised primarily of our Balco, Greco, and Smoke Guard operating companies. Our Engineered Building Solutions segment is a market leader in providing unique solutions to architects and contractors that meet code requirements, while adding functionality, performance, and aesthetically-pleasing designs. The safety and sustainability of our engineered building products enables them to be easily incorporated into the Leadership in Energy and Environmental Design (“LEED”) building market.
Our key product types and brand names are shown below:
| PRODUCT TYPES | BRAND NAMES | ||||
| • fire and smoke protection solutions | • Balco® Expansion Joint Systems | ||||
| • fire stopping solutions | • Balco® IllumiTreadTM | ||||
| • pre-engineered and custom architectural building components | • Balco® MetaflexProTM | ||||
| • architectural railings and metals | • BlazeSealTM | ||||
• Greco Architectural Railings & Metals | |||||
• Metacaulk® | |||||
• Smoke Guard Elevator Protection | |||||
• Smoke Guard Large Curtain Solutions | |||||
• Smoke Guard Perimeter Protection | |||||
New Product Development – Strategic investment in new product innovation, technical advancement, and customer driven product development enhances demand for our products and enriches relationships with end-users. Development teams are located in Boise, Idaho; Hudson, Florida; Wichita, Kansas and Windsor Ontario, Canada.
Competition – Our products generally demand premium valuation. We compete primarily on the basis of competitive lead times, superior customer specification levels and customer-centric service, which are the key drivers of our customers' buying decisions. In the fire and smoke protection product category, we compete with McKeon, US Smoke & Fire, Won Door and others, typically based on product innovation, knowledge of building codes and customer service. In the architecturally building component, we compete primarily with Construction Specialties, EMSEAL and Inpro on the basis of product innovation, price and driving architectural specifications.
Customers – Fire and smoke protection products are sold through internal sales and installation teams, as well as local building products distributors that also perform installations and service. Architecturally building components are primarily sold through independent sales representatives and building product distributors to general contractors or sub-contractors. Engineered Building Solutions' end use customers include multi-family residential buildings, educational facilities or institutions, warehouses, construction companies, plant maintenance customers, building contractors and repair service companies.
Specialized Reliability Solutions
Our Specialized Reliability Solutions segment provides products for increasing reliability, efficiency, performance and lifespan of industrial assets and solving equipment maintenance challenges. The segment is comprised primarily of our Whitmore operating company and the Whitmore JV. Through our commercial team and supply chain partners, our Specialized Reliability Solutions segment delivers products that protect assets in the most demanding environments and extreme conditions. Our customers depend on their mission-critical equipment, and thus they depend on our trusted specialty lubricants, compounds, sealants, desiccant breather filtration, and lubrication management systems. Our Specialized Reliability Solutions segment manufactures and supplies highly specialized consumables that impart or enhance properties such as lubricity, anti-seize qualities, friction, sealing and heat control. These highly-specialized products are typically used in harsh operating conditions, including extreme heat and pressure and chemical exposure, where commodity products would fail. These products protect and extend the working life of large capital equipment such as cranes, rail systems, mining equipment, oil rigs and rotating and grinding equipment found in various industrial segments such as steel mills, canning and bottling, mining and cement. These products enhance, repair or condition the internal working systems of industrial systems and are critical to ensuring safe, efficient and effective long-term operational integrity. The Specialized Reliability Solutions segment also
4
supplies products and services into the water well treatment space, which includes testing services and diagnosis of current conditions, coupled with consumable solutions to resolve any identified problems.
Our key product types and brand names by the end markets we serve are shown below:
| PRODUCT TYPES | BRAND NAMES | ||||
| • anti-seize products | • Air Sentry® | ||||
| • contamination control | • Jet-Lube® Deacon® | ||||
| • lubricants and lubricant management products | • Jet-Lube® Extreme® | ||||
| • rail friction modifiers | • Jet-Lube® Kopr-Kote® | ||||
| • sealants | • Jet-Lube® NCS-30® ECFTM | ||||
• Jet-Lube® Run-N-Seal® ECFTM | |||||
• OilSafe® | |||||
• Whitmore® Envirolube® XE Extreme | |||||
• Whitmore® Gearmate® 1000 ICT | |||||
• Whitmore® Matrix® | |||||
• Whitmore® AccuTrack® | |||||
• Whitmore® BioRail® | |||||
• Whitmore® RailArmor® | |||||
• Whitmore® TOR Armor® | |||||
New Product Development – We develop relationships with end-users and channel partners to understand a multitude of operating conditions where technical innovation or enhancement is needed. For example, these relationships have generated innovation in the areas of modifying existing lubrication products to operate in arctic conditions or modifying an existing product for use in an application where saltwater may be present. The development team is located in Rockwall, Texas and is actively targeting additional end markets for product use and penetration.
Competition – In general, our products demand premium valuation, rather than commodity products, and competitors tend to be varied and include global, regional and local companies that may be large or small. We compete primarily on the basis of product differentiation, superior performance and quality and customer-centric service. When compared to many commodity consumables, the product sales cycle is often long, typically resulting in quantified, verified and repeat product performance being the key driver of buying decisions, rather than price. As these products protect and enhance the operation of large capital equipment, qualification is based on the proof of value in application, resulting in a high changeover risk barrier. Typical competitors include Exxon-Mobil, Fuchs, Kleuber, Shell and South Coast Products.
Customers – Specialized Reliability Solutions products are primarily sold through value-added distribution partners, as well as maintenance and repair operations or catalog channels. Our Specialized Reliability Solutions' organization provides both market-specific and product line specific training to both the distribution partners and potential end users. Our specialists often visit end users with distribution partners to advise on critical application issues, which enhances our ability to both “pull” demand from the end-user and “push” demand to distributor partners. Specialized Reliability Solutions' customers include petrochemical facilities, industrial manufacturers, construction companies, utilities, plant maintenance customers, building contractors and rail and mining operators.
Discontinued Operations
During the third quarter of the fiscal year ended March 31, 2018, we committed to a plan to divest our Strathmore Products business (the "Coatings business"). As a result, we reclassified the assets comprising that business to assets held-for-sale, and made a corresponding adjustment to our consolidated statements of operations to reflect discontinued operations for all periods presented. During the quarter ended September 30, 2018, we received an aggregate of $6.9 million for the sale of assets that related to our Coatings business in multiple transactions. During the quarter ended March 31, 2020, we received $1.5 million for the sale of the last remaining real property owned by our former Coatings business. The discontinued operations have had no activities since the year ended March 31, 2020.
5
Our Competitive Strengths
As discussed in this section, we believe we have a variety of competitive strengths.
Broad Portfolio of Industry Leading Products and Solutions
In our targeted end markets, we have leading industry positions among our broad portfolio of products. We believe our products and solutions are differentiated from those of our competitors by superior performance, quality and total value delivered to customers. For example, RectorSeal No. 5® pipe thread sealant is widely regarded as an industry standard for thread sealants for HVAC/R, plumbing and electrical configurations. Additionally, we believe Kopr-Kote® anti-seize lubricant is recognized as the anti-seize compound of choice for use in oil and gas drilling operations, where it is requested by name.
Organic Revenue Growth Platform and Optimizing Performance
We focus on developing our presence in end markets with strong growth trends, continuously evaluating the potential uses of existing products to broaden end market penetration. We historically have a loyal customer base that recognizes the performance results and quality of our products and solutions. Further, our customer base is diverse. For the year ended March 31, 2022, no single customer represented 10% or more of our net revenues.
These factors have enabled us to generate strong organic revenue growth performance, while remaining focused on strong profitability through optimizing our manufacturing processes. This effort is supported by a culture of continuous improvement, looking to refine processes in all of our manufacturing facilities to reduce manufacturing costs, increase production capacity and improve product quality. Additionally, we often evaluate strategic investments to drive transformational changes in our manufacturing processes. For example, in all of our reportable segments, we have taken actions to consolidate our manufacturing footprint in order to optimize capacity, improve efficiency and leverage technologies while enhancing product quality.
Diverse Sales and Distribution Channels
Many of our products are sold through full-service distribution networks where product knowledge and customer satisfaction are key success factors. We primarily market through an international network of both internal and third-party sales representatives that call on our wholesale distributors, contractors and direct customers. The strong, long-term relationships we have developed with our wholesale distribution partners and exclusive dealers allow us to successfully introduce organically developed products and acquired products. In addition, our extensive distribution network allows us to reach and serve niche end markets that provide organic growth opportunities and a source of opportunities for our acquisition strategy.
Inorganic Growth Investment with Proven Track Record
We believe our experience in identifying, completing and integrating acquisitions is one of our core competitive strengths, as evidenced by our portfolio of 7 acquisitions completed since the inception of the Company. Historically, we have pursued product-line acquisitions with relatively low integration risk that have the potential to benefit from our extensive distribution network and manufacturing efficiencies. More recently, we began targeting commercially-proven products and solutions that are attractive in our existing end markets where we can drive revenue growth, improved profitability and increased cash flow.
In the third quarter of the fiscal year ended March 31, 2022, we acquired Shoemaker Manufacturing ("Shoemaker"), based in Cle Elum, Washington, which offers high-quality customizable GRD for commercial and residential markets, and expands CSWI’s HVAC/R product offering and regional exposure in the northwest U.S. In the third quarter of the fiscal year ended March 31, 2021, we acquired T.A. Industries, Inc. (“TRUaire”), a leading manufacturer of GRD for the residential and commercial HVAC/R end market, based in Santa Fe Springs, California. In early fiscal year 2020, we acquired Petersen Metals, Inc. ("Petersen"), a designer, manufacturer and installer of engineered railings and safety systems for institutional and commercial structures in the Southeast U.S. We invested over $440 million for all three acquisitions.
Culture of Product Enhancement and Customer-Centric Solutions
Our highly-trained and specialized personnel work closely with our customers, industry experts and research partners to continuously improve our existing products to meet evolving customer and end market requirements. We focus on product enhancements and product line extensions that are designed to meet the specific application needs of our professional end use customers. Customer-centric solutions underpin our strong industrial brands and reputation for high quality products, in turn leading us to realize improved customer retention and loyalty. Further, our ability to meet the needs of high-value, niche end
6
markets with customized solutions that leverage our existing products has enabled us to differentiate ourselves from larger competitors that may not be as willing or able to respond quickly to evolving customer demands.
Amid the novel coronavirus ("COVID-19") pandemic, we worked closely with our customers to provide them with the products and services that they need to continue conducting their operations. This includes ensuring that our supply chains are secure, that we maintain an adequate level of inventory to meet our customers' needs and that we remain able to operate our facilities at the levels required to meet customer demand.
Our Growth Strategy
We are focused on creating long-term stockholder value by increasing our revenue, profitability and cash flow. Identifying strategic end markets yielding sustainable growth, expanding market share through our new product development and targeted acquisitions are all components of our strategy.
We Leverage Existing Customer Relationships and Products and Solutions
We expect to drive revenue growth by leveraging our reputation for providing high quality products to our broad customer base. Our team of sales representatives, engineers and other technical personnel continues to proactively collaborate with our distributors and professional end user customers to enhance and adapt existing products and solutions to meet evolving customer needs. In addition, we seek to leverage our existing customer base to cross-sell our products and solutions across our three business segments, thereby driving organic growth.
We Innovate New Products to Accelerate Organic Growth
The collaborative relationships and open feedback channels we have with our distributors and end users allow us to add value not only through enhancing and adapting existing products and solutions, but also through efficiently developing new products and solutions to meet existing and future customer needs. Our team of research, development, sales and marketing personnel work together to identify product opportunities and methodically pursue development of innovative new products. Through developing new products and solutions to both address new markets and complement our product portfolio in markets we currently serve, we create increased opportunities to drive organic growth.
We Invest in Focused Acquisitions that Leverage our Distribution Channels
While we are focused on new product development, improving our existing products and penetrating new markets with these products, we expect to continue to identify and execute acquisitions that will broaden our portfolio of products and offer attractive risk-adjusted returns. We primarily focus on commercially proven products and solutions that would benefit from a broader distribution network and are attractive to customers in our targeted end markets. Once acquired, we strive to utilize our extensive distribution networks to increase revenue by selling those products and solutions to our diversified customer base.
Raw Materials and Suppliers
Our products are manufactured using various raw materials, including base oils, copper flake, steel, aluminum, polyvinyl chloride and tetra-hydrofuran. These raw materials are available from numerous sources, and we do not depend on a single source of supply for any significant amount of raw materials. Since the onset of the COVID-19 pandemic, many of our suppliers have experienced varying production and shipping delays related to the pandemic. Additionally, global supply chain and logistics constraints continue to affect global markets and caused additional supply chain headwinds in the year ended March 31, 2022. These conditions have made it more difficult to manufacture and ship our products to customers and have also led to an increase in freight costs. We continuously monitor the business conditions of our suppliers to manage competitive market conditions and to avoid potential supply disruptions wherever possible.
Intellectual Property
We own and maintain a substantial portfolio of trademarks and patents relating to the names and designs of our products. We consider our trademarks and patents to be valuable assets. In addition, our pool of proprietary information, consisting of know-how and trade secrets related to the design, manufacture and operation of our products, is considered particularly valuable. Accordingly, we take proactive measures to protect proprietary information. In aggregate, we own the rights to the products that we manufacture and sell and are not materially encumbered by licensing or franchise agreements. Our trademarks can typically be renewed indefinitely as long as they remain in use, whereas our patents generally expire 10 to 20 years from the
7
dates they were filed. Our patents expire from time to time, but we do not believe that the expiration of any individual patent will have a material adverse impact on our business, financial condition or results of operations.
Export Regulations
We are subject to export control regulations in countries from which we export products and services. These controls may apply by virtue of the country in which the products are located or by virtue of the origin of the content contained in the products. The level of control generally depends on the nature of the goods and services in question. Where controls apply, we typically need an export license or authorization (either on a per-product or per transaction basis) or the transaction must qualify for a license exception or the equivalent. In certain cases corresponding reporting requirements may apply. See Note 21 to our consolidated financial statements included in Item 8 of this Annual Report for financial and other information regarding our operations on a geographical basis.
Human Capital Management
We believe that our employees are our most valuable assets and that our skilled, engaged workforce provides us with a competitive advantage. As part of our commitment to our employees, we provide a safe work environment, ongoing training and professional development, competitive compensation and a generous health and retirement benefits package that includes an employee stock ownership plan ("ESOP"), a defined contribution plan ("401(k)"), paid time off, health and wellness care and college tuition reimbursement.
As of March 31, 2022, we employed approximately 2,400 individuals within our continuing operations globally. Regionally, approximately 1,100 of our employees are in North America, approximately 1,300 are in Asia Pacific, and approximately 10 are in Europe, the Middle East and Africa. Our workforce is made up of approximately 400 salaried employees and 2,000 hourly employees. Of these employees, approximately 1.6% of our U.S. workforce is represented by unions. We also have an employee organization in Vietnam. We believe that relations with our employees throughout our operations are generally positive, including those employees represented by unions or employee organizations. No unionized facility accounted for more than 10% of our consolidated revenues for the fiscal year ended March 31, 2022.
As a result of maintaining a consistent focus on our employee-centric culture, the retention rate (excluding retirements) for our high performance talent in the fiscal year ended March 31, 2022 was 93%. Our company-wide (all employees) voluntary retention rate (excluding retirements) was 79%.
Workplace Health and Safety
We are committed to creating and maintaining a safe, healthy working environment, and we have developed a health and safety program that focuses on implementing policies and training programs to ensure that all employees understand this commitment. Our health and safety strategies are consistently reviewed and updated as changes occur in our business, and employees are empowered to identify and report safety concerns and take corrective actions. Safety awareness and employee engagement programs have been implemented at the Company’s facilities and have generated meaningful reductions in workplace safety incidents. For the fiscal year ended March 31, 2022, our total recordable incident rate ("TRIR") for employees was 1.2, a reduction of 0.5 from the prior year.
The COVID-19 pandemic has underscored the importance of keeping our employees safe and healthy. Our health and safety focus is evident in our response to the COVID-19 pandemic and includes adding work from home flexibility, encouraging those who are sick or have symptoms to stay home, increasing cleaning protocols across all locations, regular communications regarding health and safety protocols and procedures, establishing physical distancing and personal protective equipment procedures for employees, providing masks and cleaning supplies, implementing protocols to address actual and suspected COVID-19 cases and potential exposure and limiting non-essential domestic and international travel for all employees.
Training, Development and Ethics
Consistent with our belief that our employees are our most valuable assets, developing our people is a critical aspect of our culture. Successful execution of the Company's strategy depends on attracting and retaining highly qualified individuals. We provide developmental opportunities to help our employees build the skills necessary to reach their career goals, including on-the-job training, online learning, professional memberships, and leadership and management training. To help our employees see how their efforts contribute to our Company’s overall success, we utilize a robust performance management process and
8
provide regular feedback to increase engagement and maximize talent development efforts. We have also established various talent development programs for current and future leaders during the critical stages of their careers.
Our core values of integrity, respect, excellence, stewardship, citizenship, accountability and teamwork form the foundation for our decentralized, entrepreneurial culture, and our Code of Business Conduct represents our shared commitment to living out these core values with the highest level of ethical conduct. All our employees across the globe, including our executive officers, are required to abide by our Code of Business Conduct to ensure that our business is conducted in a consistently legal and ethical manner. Our Code of Business Conduct covers many topics, including conflicts of interest, anticorruption, financial reporting, confidentiality, insider trading, antitrust and competition law, cybersecurity and information security, appropriate use of social media, and respect in the workplace. Every year, through online and in personal training, our employees receive training on all topics addressed in our Code of Business Conduct, and are required to certify that they will comply with our Code.
Compensation and Benefits
We strive to support both the short-term and long-term well-being of our employees. This commitment extends to the communities in which our employees live, where we are positive, active corporate citizens. A key element of employee well-being is providing pay and benefits for our employees that are competitive and equitable based on local markets. We analyze our compensation and benefits program annually, and make changes as necessary, to ensure that we remain competitive and make changes as necessary. We believe it is important to reward employees with competitive pay and benefits to recognize professional excellence and career progression.
As part of our comprehensive total rewards program, our employees are eligible to participate in Company-subsidized medical, dental, vision, life, short-term and long-term disability insurance plans. We provide employees with a paid supplemental life and accident insurance plan. We offer employees the opportunity to contribute to a Flexible Spending Account and a Health Savings Account. Our wellness plan offers a range of programs focused on improving health awareness and well-being. In recognition of our commitment to wellness, Cigna awarded us their Well-Being Award for Outstanding Culture of Well-Being in both 2020 and 2021. The award honors the difference the Company is making in the health and well-being of our employees in areas such as leadership, organizational foundations, policy and environment, program implementation and participation. As part of our employee wellness program, and in an effort to encourage employees to participate, we provide financial incentives to our employees who choose to participate. Our retirement savings program includes a 401(k) plan plus an ESOP plan. Our 401(k) plan has a 96% participation rate, which we believe is significantly higher than recognized industry benchmarks. Current and former domestic employees who have participated in our ESOP collectively own approximately 4% of our company. We believe this ESOP strongly aligns the interests of our employees with those of our stockholders. In addition, we provide employees with opportunities to earn bonuses through incentives designed to reward perfect attendance, employee referrals and suggestions that increase employee safety or result in efficiencies and savings.
We believe that the compensation and benefits, and other components of our total rewards program we provided to our employees, give us a competitive edge and differentiate us in a challenging labor market. We seek to recruit and retain high performing talent and provide safe, secure and dignified retirements for our employees.
Diversity and Inclusion
We are committed to promoting equal employment opportunities in all our operations, which begins with employee recruiting process and continues through our employees' relationship with the Company. We also believe that a truly innovative workforce needs to be diverse and must leverage the skills and perspectives of a broad range of backgrounds and experiences. It is our policy, specifically noted in the Company’s Code of Business Conduct, that we do not tolerate discrimination for any reason, including without limitation race, color, religion, marital status, gender, gender identity, veteran status, sexual orientation, disability or perceived disability, whether or not such discrimination violates law. It is also our policy to comply fully with all laws prohibiting discrimination and promoting opportunity and advancement in employment. This policy extends to all aspects of employment opportunity including recruitment, hiring, compensation, benefits, promotion, transfer, layoff, recall, reduction in force, termination, retirement, placement, training and all other privileges, terms and conditions of employment. These initiatives align with our goal of creating a positive and dynamic workplace where all employees can flourish. Our Board of Directors, senior leadership and human resources team are fully aligned in their commitment to promoting the above policies to ensure we remain an employer of choice.
9
We assess employee engagement through targeted surveys, which provide feedback on a variety of subjects including safety, communications, diversity and inclusion, performance management, development opportunities, respect and recognition and management support. About 93% of our employees participated in our fiscal 2022 survey. The survey results are reviewed by our senior leadership and shared with our managers and employees who collaborate to act on identified areas of improvement to implement measures of success.
Government Regulations
Our operations are subject to certain foreign, federal, state and local regulatory requirements relating to environmental, waste management, labor and health and safety matters. Management believes that our business is operated in material compliance with all such regulations. To date, the cost of such compliance has not had a material impact on our capital expenditures, earnings or competitive position or that of our operating subsidiaries. While we have implemented policies, practices and procedures to prevent and mitigate risks, violations may occur in the future as a result of human error, equipment failure or other causes. Further, we cannot predict the nature, scope or effect of future environmental legislation or regulatory requirements that could be imposed, or how existing or future laws or regulations will be administered or interpreted.
Available Information
We file annual, quarterly and current reports, proxy statements and other information with the U.S. Securities and Exchange Commission (“SEC”). Our SEC filings are available to the public at the SEC’s website (www.sec.gov). We also make these filings available free of charge on our website (www.cswindustrials.com) as soon as reasonably practicable after we electronically file those documents with the SEC.
Also available on our website are our Corporate Governance Guidelines and Code of Business Conduct, as well as the charters for the Audit, Compensation & Talent Development, and Nominating & Corporate Governance Committees of our Board of Directors and other important governance documents. All of the foregoing may be obtained through our website noted above and are available in print without charge to stockholders who request them. The information on or accessible through our website is not incorporated by reference into, or otherwise made part of, this Annual Report or any other document we file with or furnish to the SEC.
ITEM 1A: RISK FACTORS
Consider carefully the following risk factors, which we believe are the principal risks that we face and of which we are currently aware, and the other information in this Annual Report, including our consolidated financial statements and related notes to those financial statements. It is possible that additional risks and uncertainties not presently known to us, or that we currently deem immaterial, may also impair our business operations. Furthermore, the impact of the COVID-19 pandemic may exacerbate the risks discussed in this Annual Report, which could have a material effect on the Company.
Market, Economic and Geopolitical Risks
Adverse changes in global economic conditions, particularly in the U.S. and including changes resulting from the effects of the COVID-19 pandemic, could materially adversely affect our financial position, results of operations and cash flows.
Our served industries and key end markets are affected by changes in economic conditions outside our control, which can affect our business in many ways. Any adverse occurrence, including among others, industry slowdown, recession, public health crisis, political instability, costly or constraining regulations, armed hostilities, including any impacts from Russia’s invasion of the Ukraine and economic or trade sanctions enacted to condemn or counteract Russian aggression, terrorism, excessive inflation, including the current high inflationary environment, prolonged disruptions in one or more of our customers' production schedules or labor disturbances, could materially adversely affect our business, financial condition, and operating results.
We are closely monitoring the potential impact on our business resulting from the COVID-19 pandemic and the corresponding decline in economic activity, in particular the effect it may have on demand for our products in the short and long term. Reduced demand may cause us and our competitors to compete on the basis of price, which would have a negative impact on our revenues and profitability. In turn, this could cause us to not be able to satisfy the financial and other covenants to which we are subject under our existing indebtedness. In particular, the COVID-19 pandemic and subsequent supply chain disruptions and uncertainties have had a significant negative impact on the global economy in 2020 and 2021, including negatively impacting the global supply chain and increasing the cost of materials and operations.
10
Reduced demand may also hinder our growth plans and otherwise delay or impede execution of our long-term strategic plan and capital allocation strategy. If there is deterioration in the general economy or in the industries we serve, our business, results of operations and financial condition could be materially adversely affected.
The industries in which we operate are highly competitive, and many of our products are in highly competitive markets. We may lose market share to producers of other products that directly compete with or that can be substituted for our products.
The industries in which we operate are highly competitive, and we face significant competition from both large domestic and international competitors and from smaller regional competitors. Our competitors may improve their competitive position in our served markets by successfully introducing new or substitute products, improving their manufacturing processes or expanding their capacity or manufacturing facilities. Further, some of our competitors benefit from advantageous cost positions that could make it increasingly difficult for us to compete in markets for less-differentiated applications. If we are unable to keep pace with our competitors’ products and manufacturing process innovations or cost position, our financial condition and results of operations could be materially adversely affected.
Certain end markets that we serve are cyclical, which can cause significant fluctuations in our results of operations and cash flows.
The cyclical nature of the supply and demand balance of certain end markets that we serve, including manufacturing, construction, energy and mining, poses risks to us that are beyond our control and can affect our operating results. These markets are highly competitive; are driven to a large extent by end-use markets; and may experience overcapacity, all of which may affect demand for and pricing of our products and result in volatile operating results and cash flows over our business cycle. Our operations and earnings may also be significantly affected by changes in oil, gas and petrochemical prices and drilling activities, which depend on local, regional and global events or conditions that affect supply and demand for the relevant commodity. Additionally, the cyclical nature of these end markets could be further exaggerated or interrupted by the effects of the COVID-19 pandemic, which in turn could significantly affect demand for our products. Product demand may not be sufficient to utilize current or future capacity. Excess industry capacity may continue to depress our volumes and margins on some products. Our operating results, accordingly, may be volatile as a result of excess industry capacity, as well as from rising energy and raw materials costs.
Growth of our business will depend in part on market awareness of our industrial brands, and any failure to develop, maintain, protect or enhance our industrial brands would hurt our ability to retain or attract customers.
We believe that building and maintaining market awareness, brand recognition and goodwill is critical to our success. This will depend largely on our ability to continue to provide high-quality products, and we may not be able to do so effectively. Our efforts in developing our industrial brands may be affected by the marketing efforts of our competitors and our reliance on our independent dealers, distributors and strategic partners to promote our industrial brands effectively. If we are unable to cost-effectively maintain and increase positive awareness of our industrial brands, our businesses, results of operations and financial condition could be harmed.
Climate change could have an adverse effect on our business.
While we seek to mitigate our business risks associated with climate change, we recognize that there are inherent climate related risks wherever business is conducted, and climate change could create physical and financial risk to our business. Physical risks from climate change could, among other things, include an increase in extreme weather events (such as floods, tornados or hurricanes), limitations on availability in water and reliable energy, and the health and well-being of individuals in communities where we conduct business. Such events have the potential to disrupt our business, our third-party suppliers or the businesses of our customers, which in turn could have an adverse effect on our financial condition and results of operations.
Climate change regulations may impact our ability to operate at a profit and harm our operating margins.
Existing climate change-driven environmental and social regulations may negatively impact our business, our customers, or our suppliers, in terms of availability and cost of natural resources and raw materials, product demand, or manufacturing. Furthermore, future regulations may impose new operational burdens, require investment in additional emission control technology, or result in unfavorable market changes. The cost of compliance with stringent climate change regulations could adversely affect our ability to compete with companies in locations that are not subject to stringent climate change regulations.
11
Business, Operations and Human Capital Risks
Our attempts to address evolving customer needs require that we continually enhance our products. Our efforts to enhance our products may not be commercially viable and failure to develop commercially successful products or keep pace with our competitors could harm our business and results of operations.
A failure to develop commercially successful products or product enhancements or to identify product extensions could materially adversely affect our financial results. If our attempts to develop or enhance products are unsuccessful, we may be unable to recover our development costs, which could have an adverse effect on our business and results of operations. In addition, our inability to enhance or develop products that can meet the evolving needs of our customers, including a failure to do so that results in our products lagging those of new or existing competitors, could reduce demand for our products and may have a material adverse effect on our business and results of operations.
Our international sales and manufacturing operations, including our use of third party manufacturers for certain products that we sell, involve inherent risks that could result in harm to our business.
We have worldwide sales and manufacturing operations, including in North America, Europe, the Middle East, Australia and Asia, including Vietnam. We also use third parties to manufacture certain of our products, most of which are located in jurisdictions outside the United States, including China. Foreign sales and manufacturing are subject to a number of risks, including political and economic uncertainty, social unrest, sudden changes in laws and regulations (including those enacted in response to pandemics), ability to enforce existing or future contracts, labor shortages and work stoppages, natural disasters, currency exchange rate fluctuations, transportation delays or loss or damage to products in transit, expropriation, nationalization, compliance with foreign laws and changes in domestic and foreign governmental policies, including the imposition of new or increased tariffs and duties on exported and imported products.
To the extent that we rely on independent third parties to perform sales and manufacturing functions, we do not directly control their activity, including product delivery schedules and quality assurance, which may result in product shortages or quality assurance problems that could delay shipments of products, increase manufacturing, assembly, testing or other costs, or diminish our brand recognition or relationships with our customers. If a third party sales representative or manufacturer experiences capacity constraints or financial difficulties, suffers damage to its facilities, experiences power outages, natural disasters, labor shortages or labor strikes, or any other disruption, we may not be able to obtain alternative resources in a timely manner or on commercially acceptable terms. Any of these factors could negatively affect our business, results of operations and financial condition.
Loss of key suppliers, the inability to secure raw materials on a timely basis, the potential impacts of global inflation, or our inability to pass commodity price increases on to customers could have an adverse effect on our business.
Materials used in our manufacturing operations are generally available on the open market from multiple sources. However, some of the raw materials we use are only available from a limited number of sources. Accordingly, any disruptions to a critical suppliers' operations could have a material adverse effect on our business and results of operations. We are closely monitoring the impact of the COVID-19 pandemic and other macroeconomic conditions on our supply chain, which is causing supply chains for many companies to be interrupted, slowed or temporarily rendered inoperable. In addition, supply chain shortages have negatively impacted, and could continue to negatively impact, our manufacturing costs and logistics costs and, in turn, our gross margins. We may also be required to pay higher prices for raw materials due to inflationary trends regardless of supply. In addition, inflation can also result in higher interest rates. With inflation, the costs of capital increases, and the purchasing power of our and our end users’ cash resources can decline. Current or future efforts by the government to stimulate the economy may increase the risk of significant inflation, which could have a direct and indirect adverse impact on our business and results of operations.
While we believe many challenges are temporary and can be managed in the near-term, our business and results of operations could be materially adversely affected by prolonged or increasing supply chain disruptions. Availability and cost of raw materials could be affected by a number of factors, including the condition of the energy industry and other commodity prices; inflation; tariffs and duties on imported materials; foreign currency exchange rates; and phases of the general business cycle and global demand. We may be unable to pass along price increases to our customers, which could have a material adverse effect on our business and results of operations.
12
We rely on independent distributors as a channel to market for many of our products. Termination of a substantial number of our distributor relationships or an increase in a distributor's sales of our competitors’ products could have a material adverse effect on our business, financial condition, results of operations or cash flows.
We depend on the services of domestic and international independent distributors to sell our products and, in many cases, provide service and aftermarket support to end users of our products. Rather than serving as passive conduits for delivery of products, our distributors play a significant role in determining which of our products are available for purchase by contractors to service end users. While the use of distributors expands the reach and customer base for our products, the maintenance and administration of distributor relationships is costly and time consuming. The loss of a substantial number of our distributors, for any reason, including among others changing market conditions resulting from the COVID-19 pandemic, could have a material adverse effect on our business, financial condition, results of operations or cash flows. In certain international jurisdictions, distributors are conferred certain legal rights that could limit our ability to modify or terminate distribution relationships.
Many of the distributors with whom we transact business also offer competitors’ products and services to our customers. An increase in the distributors’ sales of our competitors’ products to our customers, or a decrease in the number of our products the distributor makes available for purchase, could have a material adverse effect on our business, financial condition, results of operations or cash flows.
Our insurance policies may not cover, or fully cover, us against natural disasters, global conflicts or environmental risk.
We currently have insurance policies for certain business risks, which include property damage, business interruption, operational and product liability, transit, directors’ and officers’ liability, cybersecurity, industrial accident and other risks customary in the industries in which we operate. However, we may become subject to liability (including in relation to pollution, occupational illnesses, injury resulting from tampering, product contamination or degeneration or other hazards) against which we have not insured or cannot fully insure.
For example, hurricanes may affect our facilities or the failure of our information systems as a result of breakdown, malicious attacks, unauthorized access, viruses or other factors could severely impair several aspects of operations, including, but not limited to, logistics, revenues, customer service and administration. In addition, in the event that a product liability or third-party liability claim is brought against us, we may be required to recall our products in certain jurisdictions if they fail to meet relevant quality or safety standards, and we cannot guarantee that we will be successful in making an insurance claim under our policies or that the claimed proceeds will be sufficient to compensate the actual damages suffered.
Should we suffer a major uninsured loss, a product liability judgment against us or a product recall, future earnings could be materially adversely affected. We could be required to increase our debt or divert resources from other investments in our business to discharge product related claims. In addition, adverse publicity in relation to our products could have a significant effect on future revenues, and insurance may not continue to be available at economically acceptable premiums. As a result, our insurance coverage may not cover the full scope and extent of claims against us or losses that we incur.
Cybersecurity breaches and other disruptions to our information technology systems could compromise our information, disrupt our operations, and expose us to liability, which may adversely impact our operations.
In the ordinary course of our business, we store sensitive data, including our proprietary business information and that of our customers, suppliers and business partners, and personally identifiable information of our employees in our information technology systems, including in our data centers and on our networks. The secure processing, maintenance and transmission of this data is critical to our operations. Despite our efforts to secure our information systems from cyber-security attacks or breaches, our information technology systems may be vulnerable to attacks by hackers or breached or disrupted due to employee error, malfeasance or other disruptions. If these technologies, systems, products or services are damaged, cease to function properly, are compromised due to employee or third-party contractor error, user error, malfeasance, system errors, or other vulnerabilities, or are subject to cybersecurity attacks, such as those involving denial of service attacks, unauthorized access, malicious software, or other intrusions, including by criminals, nation states or insiders, our business may be adversely impacted. The impacts of any such circumstances could include production downtimes, operational delays, and other impacts on our operations and ability to provide products and services to our customers; compromise of confidential, proprietary or otherwise protected information, including personal information and customer confidential data; destruction, corruption, or theft of data or intellectual property; manipulation, disruption, or improper use of these technologies, systems, products or services; financial losses from fraudulent transactions, remedial actions, loss of business or potential liability; adverse media coverage; and legal claims or legal proceedings, including regulatory investigations, actions and fines; and damage to our reputation. There has been a rise in the number of cyberattacks targeting confidential business information generally and in the manufacturing industry specifically. Moreover, there has been a rise in the number of cyberattacks that depend on human error
13
or manipulation, including phishing attacks or schemes that use social engineering to gain access to systems or perpetuate wire transfer or other frauds.
These trends increase the likelihood of such events occurring as well as the costs associated with protecting against such attacks. Although such attempts have been made to attack our information technology systems, no material harm has resulted. Any such attack, breach or disruption could compromise our information technology systems and the information stored in them could be accessed, publicly disclosed, lost or stolen and our business operations could be disrupted. Additionally, any significant disruption or slowdown of our systems could cause customers to cancel orders or cause standard business processes to become inefficient or ineffective, which could adversely affect our financial position, results of operations or cash flows. Any such access, disclosure or other loss of information or business disruption could result in legal claims or proceedings, liability under laws that protect the privacy of personal information, and damage to our reputation, which could adversely impact our operations.
Our relationships with our employees could deteriorate, which could adversely affect our operations.
As a manufacturing company, we rely on a positive relationship with our employees to produce our products and maintain our production processes and productivity. As of March 31, 2022, we had approximately 2,400 full-time employees, of which approximately 20 were subject to collective bargaining agreements, and approximately 1,300 of which are located in Vietnam. If our workers were to engage in a strike, work stoppage or other slowdown, our operations could be disrupted, or we could experience higher labor costs. In addition, if significant portions of our employees were to become unionized, we could experience significant operating disruptions and higher ongoing labor costs, which could adversely affect our business, financial condition and results of operations.
Loss of key personnel or our inability to attract and retain new qualified personnel could hurt our business and inhibit our ability to operate and grow successfully.
Our success in the highly competitive end markets in which we operate will continue to depend to a significant extent on the experience and expertise of our senior leaders. Loss of the services of any of these individuals could have an adverse effect on our business. Further, we may not be able to retain or recruit qualified individuals to join our company. The loss of executive officers or other key employees could result in high transition costs and could disrupt our operations.
Strategic Transactions and Investments Risks
Our acquisition and integration of businesses could negatively impact our financial results.
Inorganic growth is an important part of our strategic growth plans, and we seek to acquire businesses, some of which may be material, in pursuit of our plans. Acquiring businesses involves a number of financial, accounting, managerial, operational, legal, compliance and other risks and challenges, including the following, any of which could adversely affect our financial statements:
•we may experience difficulty in identifying appropriate acquisition candidates;
•any acquired business, technology, service or product could under-perform relative to our expectations and the price that we paid for it, not achieve cost savings or other synergies in accordance with our anticipated timetable or require us to take an impairment related to the acquired business;
•we may decide to divest businesses, technologies, services or products for financial, strategic or other reasons, which may require significant financial and managerial resources and may result in unfavorable accounting treatment;
•we may incur or assume significant debt in connection with our acquisitions, which would increase our leverage and interest expense, thereby reducing funds available to us for purposes such as working capital, capital expenditures, research and development and other general corporate purposes;
•pre-closing and post-closing earnings and charges could adversely impact operating results in any given period, and the impact may be substantially different from period to period;
•the process of integrating acquired operations may create operating difficulties and may require significant financial and managerial resources that would otherwise be available for existing operations;
•we could experience difficulty in integrating financial and other controls and systems;
•we may lose key employees or customers of the acquired company;
•we may assume liabilities that are unknown or for which our indemnification rights are insufficient, or known or contingent liabilities may be greater than anticipated;
14
•conforming the acquired company's standards, process, procedures and controls, including accounting systems and controls, with our operations could cause deficiencies related to our internal control over financial reporting or exposure to regulatory sanctions resulting from the acquired company's activities; and
•the COVID-19 pandemic may impact our ability to conduct due diligence on acquisitions in the normal manner, including forecasting future financial performance, which could cause a delay in executing transactions until alternate methods of due diligence are determined or the impacted due diligence is able to be conducted by customary means.
We may be unable to successfully execute and realize the expected financial benefits from strategic initiatives.
From time to time, our business has engaged in strategic initiatives, and such activities may occur in the future. These efforts have included consolidating manufacturing facilities, rationalizing our manufacturing processes, and, establishing a joint venture within our Specialized Reliability Solutions segment.
While we expect meaningful financial benefits from our strategic initiatives, we may not realize the full benefits expected within the anticipated time frame. Adverse effects from strategy-driven organizational change could interfere with our realization of anticipated synergies, customer service improvements and cost savings from these strategic initiatives. Additionally, our ability to fully realize the benefits and implement strategic initiatives may be limited by certain contractual commitments. Moreover, we may incur substantial expenses in connection with the execution of strategic plans in excess of what is forecasted. Further, strategic initiatives can be a complex and time-consuming process that can place substantial demands on management, which could divert attention from other business priorities or disrupt our daily operations. Any of these failures could materially adversely affect our business, financial condition, results of operations and cash flows, which could constrain our liquidity.
Changes in future business or other market conditions could cause business investments and/or recorded goodwill or other long-term assets to become impaired, resulting in substantial losses and write-downs that would materially adversely affect our results of operations and financial condition.
From time to time, we acquire businesses, following careful analysis and due diligence procedures designed to achieve a desired return or strategic objective. These procedures often involve certain assumptions and judgments in determining acquisition price. After acquisition, such assumptions and judgments may prove to be inaccurate due to a variety of circumstances, which could adversely affect the anticipated returns or which are otherwise not recoverable as an adjustment to the purchase price. Additionally, actual operating results for an acquisition may vary significantly from initial estimates. As of March 31, 2022, we had goodwill of $224.7 million recorded in our consolidated balance sheet, the majority of which was recorded in connection with the TRUaire acquisition. We evaluate the recoverability of recorded goodwill annually, as well as when we changed reporting units and when events or circumstances indicate the possibility of impairment. Because of the significance of our goodwill and other intangible assets, a future impairment of these assets could have a material adverse effect on our results of operations and financial condition. For additional information on our accounting policies related to goodwill, see our discussion under Note 1 to our consolidated financial statements in Item 8 of this Annual Report.
Financial Risks
Our outstanding indebtedness and the restrictive covenants in the agreements governing our indebtedness limit our operating and financial flexibility.
We are required to make scheduled repayments and, under certain events of default, accelerated repayments on our outstanding indebtedness, which may require us to dedicate a substantial portion of our cash flows from operations to payments on our indebtedness. Such repayment requirements could reduce the availability of our cash flows to fund working capital acquisitions, capital expenditures, R&D efforts and other general corporate purposes, and could generally limit our flexibility in planning for, or reacting to, changes in our business and industry.
In addition, the agreements governing our indebtedness impose certain operating and financial restrictions on us and somewhat limit management’s discretion in operating our businesses. These agreements limit or restrict our ability, among other things, to: incur additional debt; pay dividends and make other distributions; make investments and other restricted payments; create liens; sell assets; and enter into transactions with affiliates.
In the event we incur additional indebtedness, or if interest rates on our indebtedness increase, the risks described above could increase. In addition, certain or our variable rate indebtedness use the London Inter-bank Offered Rate ("LIBOR") as a benchmark for establishing the rate of interest. LIBOR has been the subject of national, international, and other regulatory guidance and proposals for reform. On March 5, 2021, the United Kingdom’s Financial Conduct Authority published the dates
15
that the use of LIBOR as an index for commercial loans will be phased out. Foreign currency indices, including the British pound, the Euro, and Swiss franc, along with the U.S. dollar 1-week and 2-month settings ceased after December 31, 2021. Also, after June 30, 2023, the remaining U.S. dollar settings will cease. While our material financing agreements indexed to LIBOR provide for an alternative base rate that could be applied in the event that LIBOR is discontinued, there can be no assurances as to whether such alternative base rate will be more or less favorable than LIBOR. We intend to monitor developments with respect to the phasing out of LIBOR and will work to minimize the impact of any LIBOR transitions. The consequences of these developments cannot be entirely predicted but could include an increase in the cost of variable rate indebtedness. In addition, the overall financial markets may be disrupted as a result of the replacement of LIBOR, which could have an adverse effect on our cost of capital and our financial position.
We are also required to comply with leverage and interest coverage financial covenants and deliver to our lenders audited annual and unaudited quarterly financial statements. Our ability to comply with these covenants may be affected by events beyond our control. Failure to comply with these covenants could result in an event of default that, if not cured or waived, may have a material adverse effect on our business, financial condition, results of operations and cash flows.
Fluctuations in currency exchange rates may significantly impact our results of operations and may significantly affect the comparability of our results between financial periods.
Our operations are conducted in many countries. The results of the operations and the financial position of these subsidiaries are reported in the relevant foreign currencies and then translated into U.S. dollars at the applicable exchange rates for inclusion in our consolidated financial statements. The main currencies to which we are exposed, besides the U.S. dollar, are primarily the Australian dollar, the British pound, the Canadian dollar and the Vietnamese Dong. The exchange rates between these currencies and the U.S. dollar in recent years have fluctuated significantly and may continue to do so in the future for a variety of reasons, including general economic conditions and event-driven circumstances. A depreciation of these currencies against the U.S. dollar will decrease the U.S. dollar equivalent of the amounts derived from these operations reported in our consolidated financial statements, and an appreciation of these currencies will result in a corresponding increase in such amounts.
Because many of our raw material costs are determined with respect to the U.S. dollar rather than these currencies, depreciation of these currencies may have an adverse effect on our profit margins or our reported results of operations. Conversely, to the extent that we are required to pay for goods or services in foreign currencies, the appreciation of such currencies against the U.S. dollar will tend to negatively impact our results of operations. In addition, currency fluctuations may affect the comparability of our results of operations between financial periods.
We incur currency transaction risk whenever we enter into either a purchase or sale transaction using a currency other than the local currency of the transacting entity. Given the volatility of exchange rates, there can be no assurance that we will be able to effectively manage our currency transaction risks, that our hedging activities will be effective or that any volatility in currency exchange rates will not have a material adverse effect on our financial condition or results of operations.
Changes in effective tax rates or adverse outcomes resulting from examination of our income tax returns could adversely affect our results.
Our future effective tax rates could be adversely affected by changes in tax laws, regulations, accounting principles or interpretations thereof, which can impact our current and future years' tax provision. The effect of such tax law changes or regulations and interpretations, as well as any additional tax reform legislation in the U.S., U.K, Canada, Australia, Vietnam or elsewhere, could have a material adverse effect on our business, financial condition and results of operations. In addition, we are also subject to periodic examination of our income tax returns by the Internal Revenue Service and other tax authorities. We regularly assess the likelihood of adverse outcomes resulting from these examinations to determine the adequacy of our provision for income taxes. As of March 31, 2022, we had a reserve of $14.0 million relating to uncertain tax positions, and taxing authorities may disagree with the positions we have taken regarding the tax treatment or characterization of our transactions. There can be no assurance that the outcomes from these examinations will not have a material adverse effect on our business, financial condition and results of operations.
16
We may acquire various structured financial instruments for purposes of hedging or reducing our risks, which may be costly and ineffective.
We may seek to hedge against commodity price fluctuations and credit risk by using structured financial instruments such as futures, options, swaps and forward contracts. Use of structured financial instruments for hedging purposes may present significant risks, including the risk of loss of the amounts invested. Defaults by the other party to a hedging transaction can result in losses in the hedging transaction. Hedging activities also involve the risk of an imperfect correlation between the hedging instrument and the asset being hedged, which could result in losses both on the hedging transaction and on the instrument being hedged. Use of hedging activities may not prevent significant losses and could increase our losses.
We may inadvertently fail to maintain effective disclosure controls and procedures and internal controls over financial reporting.
Effective internal controls are necessary for us to provide reliable financial reports, effectively prevent fraud and operate successfully as a public company. If we cannot provide reliable financial reports or effectively prevent fraud, our reputation and operating results could be harmed. If we are unable to maintain effective disclosure controls and procedures and internal controls over financial reporting, we may not be able to provide reliable financial reports, which in turn could affect our operating results or cause us to fail to meet our reporting obligations. Ineffective internal controls could also cause investors to lose confidence in reported financial information, which could negatively affect our stock price, limit our ability to access capital markets in the future, and require additional costs to improve internal control systems and procedures.
Legal and Regulatory Risks
Regulatory and statutory changes applicable to us or our customers could adversely affect our financial condition and results of operations.
We and many of our customers are subject to various national, state and local laws, rules and regulations. Changes in any of these areas could result in additional compliance costs, seizures, confiscations, recall or monetary fines, any of which could prevent or inhibit the development, distribution and sale of our products.
In addition, we benefit from certain regulations, including building code regulations, which require the use of products that we and other manufacturers sell. For example, certain environmental regulations may encourage the use of more environmentally friendly products, such as some of the lubricants and greases that we manufacture. If these regulations were to change, demand for our products could be reduced and our results of operations could be adversely affected.
Compliance with extensive environmental, health and safety laws could require material expenditures, changes in our operations or site remediation.
Our operations and properties are subject to regulation under environmental laws, which can impose substantial sanctions for violations. We must conform our operations to applicable regulatory requirements and adapt to changes in such requirements in all jurisdictions in which we operate. Certain materials we use in the manufacture of our products can represent potentially significant health and safety concerns. We use hazardous substances and generate hazardous wastes in certain of our manufacturing operations. Consequently, our operations are subject to extensive environmental, health and safety laws and regulations at the international, national, state and local level in multiple jurisdictions. These laws and regulations govern, among other things, air emissions, wastewater discharges, solid and hazardous waste management, site remediation programs and chemical use and management. Many of these laws and regulations have become more stringent over time, and the costs of compliance with these requirements may increase, including costs associated with any necessary capital investments. In addition, our production facilities require operating permits that are subject to renewal and, in some circumstances, revocation. The necessary permits may not be issued or continue in effect, and renewals of any issued permits may contain significant new requirements or restrictions.
Compliance with environmental laws and regulations generally increases the costs of transportation and storage of raw materials and finished products, as well as the costs of storage and disposal of wastes. We may incur substantial costs, including fines, damages, criminal or civil sanctions and remediation costs, or experience interruptions in our operations for violations arising under environmental laws, regulations or permit requirements.
17
We are subject to the U.S. Foreign Corrupt Practices Act and other anti-corruption laws, as well as other laws governing our operations. If we fail to comply with these laws, we could be subject to civil or criminal penalties, other remedial measures, and legal expenses, which could adversely affect our business, financial condition and results of operations.
Our operations are subject to anti-corruption laws, including the U.S. Foreign Corrupt Practices Act (“FCPA”), and other anti-corruption laws that apply in countries where we do business. The FCPA and these other laws generally prohibit us and our employees and intermediaries from bribing, being bribed or making other prohibited payments to government officials or other persons to obtain or retain business or gain some other business advantage. We conduct business in a number of jurisdictions that pose a high risk of potential FCPA violations, and we participate in relationships with third parties whose actions could potentially subject us to liability under the FCPA or other anti-corruption laws. In addition, we cannot predict the nature, scope or effect of future regulatory requirements to which our international operations might be subject or the manner in which existing laws might be administered or interpreted.
We are also subject to other laws and regulations governing our international operations, including regulations administered by the U.S. Department of Commerce’s Bureau of Industry and Security, the U.S. Department of Treasury’s Office of Foreign Asset Control and various non-U.S. government entities, including applicable export control regulations, economic sanctions on countries and persons, customs requirements, currency exchange regulations and transfer pricing regulations (collectively, “Trade Control Laws”).
We have and maintain a compliance program with policies, procedures and employee training to help ensure compliance with applicable anti-corruption laws and the Trade Control Laws. However, despite our compliance programs, there is no assurance that we will be completely effective in ensuring our compliance with all applicable anti-corruption laws, including the FCPA or other legal requirements, or Trade Control Laws. If we are not in compliance with the FCPA and other anti-corruption laws or Trade Control Laws, we may be subject to criminal and civil penalties, disgorgement and other sanctions and remedial measures, and legal expenses, which could have an adverse impact on our business, financial condition, results of operations and liquidity.
Likewise, any investigation of any potential violations of the FCPA, other anti-corruption laws or Trade Control Laws by the U.S. or foreign authorities could also have an adverse impact on our reputation, business, financial condition and results of operations.
Our permits, licenses, registrations or authorizations and those of our customers or distributors may be modified, suspended, terminated or revoked before their expiration or we and/or they may be unable to renew them upon their expiration. We may bear liability for failure to obtain, maintain or comply with required authorizations.
We are required to obtain and maintain, and may be required to obtain and maintain in the future, various permits, licenses, registrations and authorizations for the ownership or operation of our business, including the manufacturing, distribution, sale and marketing of our products and importing of raw materials. These permits, licenses, registrations and authorizations could be modified, suspended, terminated or revoked or we may be unable to renew them upon their expiration for various reasons, including for non-compliance. These permits, licenses, registrations and authorizations can be difficult, costly and time consuming to obtain and could contain conditions that limit our operations. Our failure to obtain, maintain and comply with necessary permits, licenses, registrations or authorizations for the conduct of our business could result in fines or penalties, which may be significant. Additionally, any such failure could restrict or otherwise prohibit certain aspects of our operations, which could have a material adverse effect on our business, financial condition and results of operations.
Many of our customers and distributors require similar permits, licenses, registrations and authorizations to operate. If a significant customer, distributor or group thereof were to lose an important permit, license, registration or authorization, forcing them to cease or reduce their business, our revenues could decrease, which would have a material adverse effect on our business, financial condition and results of operations.
Industrial manufacturing is inherently hazardous, which could result in accidents that disrupt our operations or expose us to significant losses or liabilities.
Hazards associated with our manufacturing processes and the related storage and transportation of raw materials, products and wastes exist in our operations and the operations of other occupants with whom we share manufacturing sites. These hazards could lead to an interruption or suspension of operations and have an adverse effect on the productivity and profitability of a particular manufacturing facility or on us as a whole. These potential risks include, but are not necessarily limited to, spills and other discharges or releases of toxic or hazardous substances or gases, pipeline and storage tank leaks and ruptures, explosions and fires and mechanical failure. These hazards may result in personal injury and loss of life, damage to property
18
and contamination of the environment, which may result in a suspension of operations and the imposition of civil or criminal penalties, including governmental fines, expenses for remediation and claims brought by governmental entities or third parties. The loss or shutdown of operations over an extended period at any of our major operating facilities could have a material adverse effect on our financial condition and results of operations. Our property, business interruption and casualty insurance may not fully insure us against all potential hazards incidental to our business.
Regulation of our employees’ exposure to certain chemicals or other hazardous products could require material expenditures or changes in our operations.
Certain chemicals and other raw materials that we use in the manufacture of our products may have adverse health effects. The Occupational Safety and Health Administration limits the permissible employee exposure to some of those materials. Future studies on the health effects of certain chemicals and materials may result in additional or new regulations that further restrict or prohibit the use of, and exposure to, certain chemicals and materials. Additional regulation of certain chemicals and materials could require us to change our operations, and these changes could affect the quality of our products and materially increase our costs.
We may be unable to protect our trademarks, trade secrets, other intellectual property and proprietary information, which could harm our competitive position.
Our ability to protect and preserve our trademarks, trade secrets and other intellectual property and proprietary information relating to our business is an important factor to our success. However, we may be unable to prevent third parties from using our intellectual property and other proprietary information without our authorization or from independently developing intellectual property and other proprietary information that is similar to ours, particularly in those countries where the laws do not protect our proprietary rights to the same degree as in the U.S. In addition, because certain of our products are manufactured by third parties, we have necessarily shared some of our intellectual property with those third parties. There can be no guarantee that those third parties, some of whom are located in jurisdictions where intellectual property risks may be more pronounced, will comply with contractual and other legal commitments to preserve and protect our intellectual property.
The use of our intellectual property and other proprietary information by others could reduce or eliminate any competitive advantage we have developed, potentially causing us to lose sales or otherwise harm our business. If it becomes necessary for us to litigate to protect these rights, any proceedings could be burdensome and costly, and we may not prevail.
Our intellectual property may not provide us with any competitive advantage and may be challenged by third parties. Moreover, our competitors may already hold or in the future may hold intellectual property rights in the U.S. or abroad that, if enforced or issued, could possibly prevail over our rights or otherwise limit our ability to manufacture or sell one or more of our products in the U.S. or internationally. Despite our efforts, we may be sued for infringing on the intellectual property rights of others. This litigation is costly and, even if we prevail, the costs of such litigation could adversely affect our financial condition.
Adequate remedies may not be available in the event of an unauthorized use or disclosure of our trade secrets and manufacturing expertise. The loss of employees who have specialized knowledge and expertise could harm our competitive position and cause our revenues and operating results to decline as a result of increased competition. In addition, others may obtain knowledge of our trade secrets through independent development or other access by legal means.
Forward-Looking Statements
This Annual Report contains forward-looking statements within the meaning of the Private Securities Litigation Reform Act of 1995. These statements reflect the current views of our senior management with respect to future events and our financial performance. These statements include forward-looking statements with respect to our business and industry in general. Statements that include the words “may,” “expects,” “plans,” “anticipates,” “estimates,” “believes,” “potential,” “projects,” “forecasts,” “intends,” or the negative thereof or other comparable terminology and similar statements of a future or forward-looking nature identify forward-looking statements for purposes of the federal securities laws or otherwise.
Forward-looking statements include, but are not limited to, statements that relate to, or statements that are subject to risks, contingencies or uncertainties that relate to:
•our business strategy;
•changes in local political, economic, social and labor conditions;
•potential disruptions from wars and military conflicts, including Russia's invasion of Ukraine;
19
•future levels of revenues, operating margins, income from operations, net income or earnings per share;
•the ability to respond to anticipated inflationary pressure, including reductions on consumer discretionary income and our ability to pass along rising costs through increased selling prices;
•anticipated levels of demand for our products and services;
•the actual impact to supply, production levels and costs from global supply chain logistics and transportation challenges
•short and long-term effects of the COVID-19 pandemic;
•future levels of research and development, capital, environmental or maintenance expenditures;
•our beliefs regarding the timing and effects on our business of health and safety, tax, environmental or other legislation, rules and regulations;
•the success or timing of completion of ongoing or anticipated capital, restructuring or maintenance projects;
•expectations regarding the acquisition or divestiture of assets and businesses;
•our ability to obtain appropriate insurance and indemnities;
•the potential effects of judicial or other proceedings, including tax audits, on our business, financial condition, results of operations and cash flows;
•the anticipated effects of actions of third parties such as competitors, or federal, foreign, state or local regulatory authorities, or plaintiffs in litigation;
•the expected impact of accounting pronouncements; and
•the other factors listed above under “Risk Factors.”
Although we believe that the expectations reflected in the forward-looking statements are reasonable based on our current knowledge of our business and operations, we cannot guarantee future results, levels of activity, performance or achievements. The foregoing factors should not be construed as exhaustive. If one or more of these or other risks or uncertainties materialize, or if our underlying assumptions prove to be incorrect, actual results may differ materially from what we anticipate. The impact of the COVID-19 pandemic may also exacerbate the risks discussed in this Annual Report, which could have a material impact on our company. Any forward-looking statements you read in this Annual Report reflect our views as of the date of this Annual Report with respect to future events and are subject to these and other risks, uncertainties and assumptions relating to our operations, results of operations, growth strategy and liquidity. You should not place undue reliance on these forward-looking statements and you should carefully consider all of the factors identified in this Annual Report that could cause actual results to differ. We assume no obligation to update or revise these forward-looking statements, except as required by law.
20
ITEM 1B: UNRESOLVED STAFF COMMENTS
Not applicable.
ITEM 2: PROPERTIES
Properties
Our principal executive offices are located at 5420 Lyndon B. Johnson Freeway, Suite 500, Dallas, Texas 75240. Our headquarters is a leased facility. The current lease term expires August 31, 2026, but may be renewed.
We consider the many manufacturing and R&D facilities, distribution centers, warehouses, offices and other properties that we own or lease to be in good condition and generally suitable for the purposes for which they are used. The following table presents our principal physical locations by segment and excludes facilities classified as discontinued operations.
| Location | Use | Segment | Square Footage | Owned/Leased | ||||||||||||||||||||||
| Boise, Idaho | Manufacturing, Office and R&D | Engineered Building Solutions | 42,000 | Leased | ||||||||||||||||||||||
| Cle Elum, Washington | Distribution Center, Manufacturing, Office, R&D and Warehouse | Contractor Solutions | 180,000 | Leased | ||||||||||||||||||||||
| Dong Nai, Vietnam | Manufacturing and Office | Contractor Solutions | 634,000 | Owned | ||||||||||||||||||||||
| Fall River, Massachusetts | Manufacturing and Office | Contractor Solutions | 140,200 | Leased | ||||||||||||||||||||||
| Greenwood, Indiana | Distribution Center & Office | Contractor Solutions | 54,000 | Leased | ||||||||||||||||||||||
| Houston, Texas | Manufacturing, Office, R&D and Warehouse | Contractor Solutions | 253,900 | Owned | ||||||||||||||||||||||
| Houston, Texas | Distribution Center & Office | Contractor Solutions | 150,000 | Leased | ||||||||||||||||||||||
| Hudson, Florida | Manufacturing, Office and R&D | Engineered Building Solutions | 40,000 | Leased | ||||||||||||||||||||||
| Jacksonville, Florida | Distribution Center & Office | Contractor Solutions | 217,000 | Leased | ||||||||||||||||||||||
| North East, Maryland | Distribution Center & Office | Contractor Solutions | 150,000 | Leased | ||||||||||||||||||||||
| Rockwall, Texas | Manufacturing, Office, R&D and Warehouse | Specialized Reliability Solutions | 227,600 | Owned | ||||||||||||||||||||||
| Terrell, Texas | Manufacturing, Office and Warehouse | Specialized Reliability Solutions & Engineered Building Solutions | 101,000 | Leased | ||||||||||||||||||||||
| Santa Fe Springs, California | Distribution Center & Office | Contractor Solutions | 240,000 | Leased | ||||||||||||||||||||||
| Wichita, Kansas | Manufacturing and Office | Engineered Building Solutions | 42,800 | Owned | ||||||||||||||||||||||
| Windsor, Ontario, Canada | Manufacturing, Office and R&D | Engineered Building Solutions | 42,000 | Leased | ||||||||||||||||||||||
We believe that our facilities are adequate for our current operations. We may endeavor to selectively reduce or expand our existing lease commitments as circumstances warrant. See Note 10 to our consolidated financial statements included in Item 8 of this Annual Report for additional information regarding our lease obligations.
ITEM 3: LEGAL PROCEEDINGS
We may, from time to time, be involved in litigation arising out of our operations in the normal course of business or otherwise. Furthermore, third parties may try to seek to impose liability on us in connection with the activities of our operating companies. We are not currently a party to any legal proceedings that, individually or in the aggregate, are expected to have a material effect on our business, financial condition, results of operations or financial statements, taken as a whole.
21
ITEM 4: MINE SAFETY DISCLOSURES
Not applicable.
22
PART II
ITEM 5: MARKET FOR REGISTRANT’S COMMON EQUITY, RELATED STOCKHOLDER MATTERS AND ISSUER PURCHASES OF EQUITY SECURITIES
Market Information
Our common shares are listed on the Nasdaq Global Select Market under the symbol "CSWI."
Holders
As of May 12, 2022, there were 377 holders of record of our common stock. The number of holders of record is based upon the actual numbers of holders registered at such date and does not include holders of shares in “street name” or persons, partnerships, associates, corporations or other entities in security position listings maintained by depositories.
Issuer Purchases of Equity Securities
Note 13 to our consolidated financial statements included in Item 8 of this Annual Report includes a discussion of our share repurchase program. The following table represents the number of shares repurchased during the quarter ended March 31, 2022.
| Period | Total Number of Shares Purchased | Average Price Paid per Share | Total Number of Shares Purchased as Part of Publicly Announced Program | Maximum Number of Shares (or Approximate Dollar Value) That May Yet Be Purchased Under the Program | ||||||||||||||||||||||
| (in millions) | ||||||||||||||||||||||||||
| January 1 - 31 | 5,497 | (a) (b) | $ | 112.00 | 5,458 | $ | 98.9 | |||||||||||||||||||
| February 1 - 28 | 115,291 | (a) | 114.52 | 115,291 | 85.7 | |||||||||||||||||||||
| March 1 - 31 | 1,191 | (a) | 114.84 | 1,191 | 85.6 | |||||||||||||||||||||
| 121,979 | 121,940 | |||||||||||||||||||||||||
(a) On October 30, 2020, we announced that our Board of Directors authorized a new program to repurchase up to $100.0 million of our common stock, which replaced a previously announced $75.0 million program. Under the current program, shares may be repurchased from time to time in the open market or in privately negotiated transactions. Our Board of Directors has established an expiration date of December 31, 2022, for completion of the new repurchase program; however, the program may be limited or terminated at any time at our discretion without notice. As of March 31, 2022, 126,115 shares of our common stock had been repurchased under the current program for an aggregate amount of $14.4 million.
(b) Includes 39 shares tendered by employees to satisfy minimum tax withholding amounts for restricted share vesting at an average price per share of $125.56.
23
Stock Performance Chart
The following graph compares the cumulative total shareholder return on our common stock from April 1, 2017 through March 31, 2022 compared with the Russell 2000 Index, of which CSWI is a component, and a composite custom peer group, which was selected on an industry basis and is periodically reviewed and updated (if necessary) to ensure it provides reasonable comparability based on products offered and end markets served by CSWI. The graph assumes that $100 was invested at the market close on April 1, 2017 and that all dividends were reinvested. The stock price performance of the following graph is not necessarily indicative of future stock price performance. The custom peer group consists of the following:
| Aaon, Inc | CTS Corporation | Landec Corporation | PGT Innovations | ||||||||
| Armstrong Industries, Inc | Futurefuel Corp. | Littelfuse, Inc. | Quaker Chemical Corp. | ||||||||
| Astec Industries, Inc. | Gorman-Rupp Co. | LSB Industries, Inc. | Tredegar Corp. | ||||||||
| Chase Corporation | Innospec Inc. | Methode Electronics, Inc. | |||||||||
| Columbus McKinnon Corp | Kraton Corp. | NN, Inc. | |||||||||
This graph is furnished and not filed with the SEC. Notwithstanding anything to the contrary set forth in any of our previous filings made under the Securities Act of 1933 or the Exchange Act that incorporate future filings made by us under those statutes, the stock performance graph below is not to be incorporated by reference in any prior filings, nor shall it be incorporated by reference into any future filings made by us under those statutes.
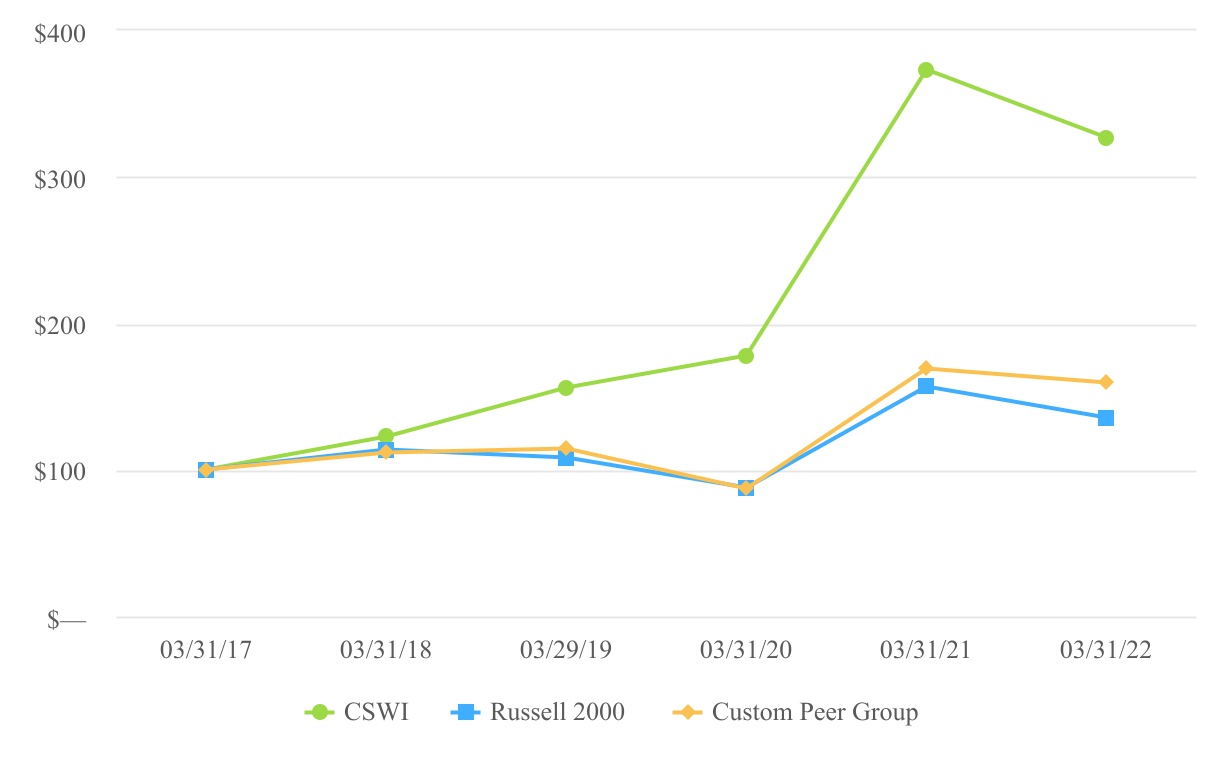
ITEM 6: [Reserved]
24
ITEM 7: MANAGEMENT’S DISCUSSION AND ANALYSIS OF FINANCIAL CONDITION AND RESULTS OF OPERATIONS
The following discussion and analysis is provided to increase the understanding of, and should be read in conjunction with, the accompanying consolidated financial statements and notes. See “Item 1A. Risk Factors” and the “Forward-Looking Statements” included in this Annual Report for a discussion of the risks, uncertainties and assumptions associated with these statements. Unless otherwise noted, all amounts discussed herein are consolidated.
EXECUTIVE OVERVIEW
Our Company
We are a diversified industrial growth company with a strategic focus on providing niche, value-added products in the end markets we serve. We operate in three business segments: Contractor Solutions, Engineered Building Solutions and Specialized Reliability Solutions. Our products include mechanical products for heating, ventilation, air conditioning and refrigeration ("HVAC/R"), grilles, registers and diffusers ("GRD"), building safety solutions and high-performance specialty lubricants and sealants. End markets that we serve include HVAC/R, architecturally-specified building products, plumbing, energy, rail, mining and general industrial. Our manufacturing operations are concentrated in the United States (“U.S.”), Canada and Vietnam, and we have distribution operations in the U.S., Australia, Canada and the United Kingdom (“U.K.”). Our products are sold directly to end users or through designated channels in over 100 countries around the world, primarily including Australia, Canada, the U.K. and the U.S.
Many of our products are used to protect the capital assets of our customers that are expensive to repair or replace and are critical to their operations. We have a source of recurring revenue from the maintenance, repair and overhaul and consumable nature of many of our products. We also provide some custom engineered products that strengthen and enhance our customer relationships. The reputation of our product portfolio is built on more than 100 well-respected brand names, such as RectorSeal No. 5®, Kopr-Kote®, KATS Coatings®, Safe-T-Switch®, Air Sentry®, Deacon®, Leak Freeze®, Greco® and TRUaire® and Shoemaker ManufacturingTM.
Drawing on our innovative and proven technologies, we seek to deliver solutions primarily to our professional end-use customers that place a premium on superior performance and reliability. We believe our brands are well-known in the specific end markets we serve and have a reputation for high quality. We rely on both organic growth and inorganic growth through acquisitions to provide an increasingly broad portfolio of performance optimizing solutions that meet our customers’ ever-changing needs. We have a successful record of making attractive, synergistic acquisitions in support of this objective, and we remain focused on identifying additional acquisition opportunities in our core end markets.
The COVID-19 pandemic and its resulting impacts had an overall negative impact on our financial results in our prior fiscal year ended March 31, 2021. During our current fiscal year ended March 31, 2022, the direct impact of the COVID-19 pandemic on our consolidated operating results was limited, in all material respects, to our operations in Vietnam. In early August 2021, the Vietnamese government mandated numerous restrictions in an effort to mitigate the spread of COVID-19, including closures of non-essential businesses, limitations on movements of individuals, and the imposition of other highly-restrictive measures for businesses, like ours, that continued operations in compliance with the restrictions. Our Vietnam operations began resuming normal production activities in late November 2021, when the Vietnamese government-mandated restrictions began to ease. Regarding our operations generally, the indirect impacts of the COVID-19 pandemic have resulted in material and freight cost inflation, supply chain disruptions and freight delays, driven by numerous factors including countermeasures taken by U.S. federal, state and/or local governments and the Federal Reserve, labor supply shortages, and recovering demand. We expect material and freight cost volatility, supply chain challenges and freight delays to continue in the near-term, and we are addressing these impacts through focused inventory management and by continuing and increasing the pricing initiatives that began in the three months ended March 31, 2021.
While the COVID-19 pandemic and its indirect effects have contributed to increased demand in certain parts of our business, including the HVAC/R end market, we expect customer demand levels and our overall results of operations and financial condition to have some level of volatility through the duration of the pandemic when compared to pre-pandemic periods. Despite strong demand in certain of our end markets and clear signs of recovery in others, we cannot reasonably estimate the magnitude or length of the pandemic’s direct and indirect adverse impact, including its ultimate impact on our business or financial condition, due to continued uncertainty regarding (1) the duration and severity of the COVID-19 pandemic, including any surges due to variants and (2) the continued potential for short and long-term impacts on our facilities and employees, customer demand and supply chain.
25
We are closely monitoring the Russian invasion of Ukraine and its global impacts. We have no operations, employees or assets in Russia, Belarus or Ukraine, nor do we source goods or services of any material amount from those countries, whether directly or indirectly. During the fiscal year ended March 31, 2022, we had no sales into Belarus or Ukraine and our sales into Russia were immaterial to both our consolidated sales and the sales for our Specialized Reliability Solutions segment. Additionally, shortly after the Russian invasion of Ukraine began in February 2022, we indefinitely suspended all business activity in Russia. While the conflict continues to evolve and the outcome remains highly uncertain, we do not currently believe the Russia-Ukraine conflict will have a material impact on our business and results of operations. However, if the Russia-Ukraine conflict continues or worsens, leading to greater global economic or political disruptions and uncertainty, our business and results of operations could be materially impacted as a result.
Business Developments
On December 15, 2021, we acquired 100% of the outstanding equity of Shoemaker Manufacturing, LLC (“Shoemaker”), based in Cle Elum, Washington, for an aggregate purchase price of $43.5 million, including preliminary working capital and closing cash adjustments and expected contingent consideration. Shoemaker offers high-quality customizable GRD for commercial and residential markets, and expands CSWI’s HVAC/R product offering and regional exposure in the northwest U.S. The aggregate purchase price was comprised of cash consideration of $38.5 million, 25,483 shares of the Company's common stock valued at $3.0 million at transaction close and additional contingent consideration of up to $2.0 million based on Shoemaker meeting a defined financial target during the quarter ended March 31, 2022, which was achieved. Shoemaker activity has been included in our Contractor Solutions segment since the acquisition date.
On April 1, 2021, Whitmore Manufacturing, LLC (“Whitmore”), a wholly-owned subsidiary of CSWI, completed the formation of a joint venture with Pennzoil-Quaker State Company dba SOPUS products (“Shell”), a wholly-owned subsidiary of Shell Oil Company that comprises Shell’s U.S. lubricants business. The formation was consummated through a transaction in which Whitmore sold to Shell a 50% interest in a wholly-owned subsidiary (containing certain existing operating assets) in exchange for consideration of $13.4 million from Shell in the form of cash ($5.3 million) and intangible assets ($8.1 million). The Whitmore JV has been consolidated into the operations of the Company and its activity has been included in our Specialized Reliability Solutions segment since the formation date.
On December 15, 2020, we acquired 100% of the outstanding equity of T.A. Industries, Inc. (“TRUaire”), a leading manufacturer of grilles, registers, and diffusers for the residential and commercial HVAC/R end market, based in Santa Fe Springs, California. The acquisition also included TRUaire’s wholly-owned manufacturing facility based in Vietnam. The acquisition extended the Company’s product offerings to the HVAC market and provided strategic distribution facilities. The consideration paid for TRUaire included cash of $288.0 million and 849,852 shares of the Company’s common stock. The cash consideration was funded through a combination of cash on hand and borrowings under our Revolving Credit Facility, and 849,852 shares of common stock were reissued from treasury shares. TRUaire activity has been included in our Contractor Solutions segment since the acquisition date.
During the third quarter of the fiscal year ended March 31, 2018, we committed to a plan to divest our Strathmore Products business (the "Coatings business"). As a result, we reclassified the assets comprising that business to assets held-for-sale, and made a corresponding adjustment to our consolidated statements of operations to reflect discontinued operations for all periods presented. During the quarter ended September 30, 2018, we received an aggregate of $6.9 million for the sale of assets that related to our Coatings business in multiple transactions. During the quarter ended March 31, 2020, we received $1.5 million for the sale of the last remaining real property owned by our former Coatings business. The discontinued operation have had no activities since the year ended March 31, 2020.
Segment Realignment
Beginning with the quarter ended June 30, 2021, we revised our segment structure to align with how our chief operating decision maker (who was determined to be our Chief Executive Officer) views our business, assesses performance and allocates resources to our business components. This segment structure revision became effective on April 1, 2021, and followed the completion of various strategic transactions including the acquisition of TRUaire and the formation of the Whitmore JV. Refer to Accounting Policies in Note 1 to our consolidated financial statements included in Item 8 of this Annual Report.
As a result of the business segment revision, reclassification of certain prior year financial information has been made to conform with the current period's presentation. None of the changes impact the Company's previously reported consolidated net revenue, operating income, net income or net income per share. Refer to Note 21 to our consolidated financial statements included in Item 8 of this Annual Report for additional information on the Company's segment realignment.
26
Change in Accounting Principle
In connection with the integration of TRUaire and the Whitmore JV, the Company voluntarily changed its method of accounting for certain domestic inventory previously valued by the last-in, first-out ("LIFO") method to the first-in, first-out ("FIFO") method during the fourth quarter of fiscal 2022. The FIFO method of accounting for inventory is preferable because it improves the Company's comparability with the industry peers, the majority of which use the FIFO method as the primary inventory valuation method, conforms the Company's entire inventory to a single method of accounting and aligns the inventory cost flow assumption with the physical flow of goods. All prior periods presented have been retrospectively adjusted to apply the new method of accounting. Refer to Note 1 and Note 7 to our consolidated financial statements included in Item 8 of this Annual Report for more information related to the change in inventory accounting method.
Our Markets
HVAC/R
The HVAC/R market is our largest market served and it represented approximately 53% and 42% of our net revenues in the years ended March 31, 2022 and 2021, respectively. We provide an extensive array of products for installation, repair and maintenance of HVAC/R systems that includes condensate switches, pans and pumps, grilles, registers and diffusers ("GRD"), refrigerant caps, line set covers and other chemical and mechanical products. The industry is driven by replacement and repair of existing HVAC/R systems, as well as new construction projects. New HVAC/R systems are heavily influenced by macro trends, while replacement and repair of existing HVAC/R systems are dependent on weather and age of unit. The HVAC/R market tends to be seasonal with the peak sales season beginning in March and continuing through August. Construction and repair is typically performed by contractors, and we utilize our global distribution network to drive sales of our brands to such contractors.
Architecturally-Specified Building Products
Architecturally-specified building products represented approximately 19% and 27% of our net revenues in the years ended March 31, 2022 and 2021, respectively. We manufacture and sell products such as engineered railings, smoke and fire protection systems, expansion joints and stair edge nosings for end use customers including multi-family residential buildings, educational facilities or institutions, warehouses, construction companies, plant maintenance customers, building contractors and repair service companies. Sales of these products are driven by architectural specifications and safety codes. The sales process is typically long as these can be multi-year construction projects. The construction market, both commercial and multi-family, is a key driver for sales of architecturally-specified building products.
Plumbing
The plumbing market represented approximately 9% and 10% of our net revenues in the years ended March 31, 2022 and 2021, respectively. We provide many products to the plumbing industry including thread sealants, solvent cements, fire-stopping products, condensate switches and trap guards, as well as other mechanical products, such as drain traps. Installation is typically performed by contractors, and we utilize our global distribution network to drive sales of our products to contractors.
General Industrial
The general industrial end market represented approximately 7% and 10% of our net revenues in the years ended March 31, 2022 and 2021, respectively. We provide products focused on asset protection and reliability, including lubricants, desiccant breathers and fluid management products. The general industrial market includes the manufacture of chemicals, steel, cement, food and beverage, pulp and paper and a wide variety of other processed materials. We serve this market primarily through a network of distributors. The growth trajectory of the general industrial end market is expected to reflect a blended average of the aforementioned end use markets.
Energy
The energy market represented approximately 6% and 4% of our net revenues in the years ended March 31, 2022 and 2021, respectively. We provide market-leading lubricants and anti-seize compounds, as well as greases, for use in oilfield drilling activity and maintenance of oilfield drilling and valve related equipment. We sell our products primarily through
27
distributors that are strategically situated near the major oil and gas producing areas across the globe. The outlook for the energy industry is heavily dependent on the global demand expectations from developed and emerging economies, as well as oil price and local government policies relative to oil exploration, drilling, storage and transportation.
Rail
The rail market represented approximately 3% and 4% of our net revenues in the years ended March 31, 2022 and 2021, respectively. We provide an array of products into the rail industry, including lubricants and lubricating devices for rail lines, which increase efficiency, reduce noise and extend the life of rail equipment such as rails and wheels. We leverage our technical expertise to build relationships with key decision-makers to ensure our products meet required specifications. We sell our products primarily through a direct sales force, as well as through distribution partners. End markets for Rail include Class 1 Rail as the primary end market in North America and Transit Rail as the primary end market in all other geographies. Cyclical product classes such as farm products and petrochemical products can impact volumes in Class 1 Rail. While coal transport is diminishing demand for Class 1 Rail in North America, global investment in Transit Rail systems is expected to more than offset this decline.
Mining
The mining market represented approximately 3% and 3% of our net revenues in the years ended March 31, 2022 and 2021, respectively. Across the globe, we provide market-leading lubricants to open gears used in large mining excavation equipment, primarily through direct sales agents, as well as a network of strategic distributors. The North American mining industry is heavily weighted toward coal production and has experienced headwinds due to continued decline in domestic coal demand, partially mitigated by the seaborne coal export market. Globally, coal demand has been robust, and focused efforts in coal markets outside of the U.S., coupled with enhanced focus on markets such as iron, gold, diamonds and uranium in Southeast Asia, South America, and Africa have delivered growth that has generally offset the weakness in North American coal demand. Outside of coal, the mining market tends to move with global industrial output as basic industrial metals such as copper, tin, aluminum, and zinc, which are critical inputs to many industrial products.
Our Outlook
We expect to maintain a strong balance sheet in fiscal year 2023, which provides us with access to capital through our cash on hand, internally-generated cash flow and availability under our Revolving Credit Facility. Our capital allocation strategy continues to guide our investing decisions, with a priority to direct capital to the highest risk adjusted return opportunities, within the categories of organic growth, strategic acquisitions and the return of cash to shareholders through our share repurchase and dividend programs. With the strength of our financial position, we will continue to invest in financially and strategically attractive expanded product offerings, key elements of our long-term strategy of targeting long-term profitable growth. We will continue to invest our capital in maintaining our facilities and in continuous improvement initiatives. We recognize the importance of, and remain committed to, continuing to drive organic growth, as well as investing additional capital in opportunities with attractive risk-adjusted returns, driving increased penetration in the end markets we serve.
We remain disciplined in our approach to acquisitions, particularly as it relates to our assessment of valuation, prospective synergies, diligence, cultural fit and ease of integration, especially in light of the economic conditions due to the pandemic.
28
RESULTS OF OPERATIONS
The following discussion provides an analysis of our consolidated results of operations and results for each of our segments.
The operations of Shoemaker have been included in our consolidated results of operations and in the operating results of our Contractor Solutions segment since December 15, 2021, the effective date of the acquisition. The operations of TRUaire have been included in our consolidated results of operations and in the operating results of our Contractor Solutions segment since December 15, 2020, the effective date of the acquisition. The operations of Petersen Metals, Inc. ("Petersen") have been included in our consolidated results of operations and in the operating results of our Engineered Building Solutions segment since April 2, 2019, the effective date of the acquisition. All acquisitions are described in Note 2 to our consolidated financial statements included in Item 8 of this Annual Report.
Net Revenues
| Year Ended March 31, | ||||||||||||||||||||
| (amounts in thousands) | 2022 | 2021 | 2020 | |||||||||||||||||
| Revenues, net | $ | 626,435 | $ | 419,205 | $ | 385,871 | ||||||||||||||
Net revenues for the year ended March 31, 2022 increased $207.2 million, or 49.4%, as compared with the year ended March 31, 2021. The increase was primarily due to the acquisitions of TRUaire and Shoemaker ($103.2 million or 24.6%). Excluding the impact of acquisitions, organic sales increased $104.0 million or 24.8% from the prior year due to implemented pricing initiatives and increased sales volumes. Pricing initiatives, which began in the three months ended March 31, 2021 to mitigate rising costs, continued and increased during the current year. Sales volumes increased in all end markets including HVAC/R, energy, plumbing, mining, rail, architecturally-specified building products and general industrial.
Net revenues for the year ended March 31, 2021 increased $33.3 million, or 8.6%, as compared with the year ended March 31, 2020. The increase was primarily due to the December 15, 2020 acquisition of TRUaire ($33.8 million or 8.8%). Excluding the acquisition impact, the organic sales remained relatively flat from the prior year with a slight sales decrease ($0.5 million or 0.1%) primarily due to decreased sales into general industrial, energy, rail and mining end markets, mostly offset by increased sales volumes into the HVAC/R and architecturally-specified building products end markets. Although the energy and mining end markets decreased over the prior fiscal year, those decreases occurred during the first nine months of the fiscal year, while the fourth fiscal quarter showed improvements as compared with the same period in the prior year. The plumbing end market experienced growth in the fourth fiscal quarter as compared with the same period in the prior year, offsetting the slight decreases in the first nine months of the fiscal year.
Net revenues into the Americas, Europe, Middle East and Africa ("EMEA") and the Asia Pacific regions for the year ended March 31, 2022, 2021 and 2020 are presented below. The presentation of net revenues by geographic region is based on the location of the customer. For additional information regarding net revenues by geographic region, see Note 20 to our consolidated financial statements included in Item 8 of this Annual Report.
| Year Ended March 31, | ||||||||||||||||||||
| 2022 | 2021 | 2020 | ||||||||||||||||||
| Americas | 94% | 93% | 90% | |||||||||||||||||
| EMEA | 3% | 4% | 6% | |||||||||||||||||
| Asia Pacific Regions | 3% | 3% | 4% | |||||||||||||||||
Gross Profit and Gross Profit Margin
| Year Ended March 31, | ||||||||||||||||||||
| (amounts in thousands, except percentages) | 2022 | 2021* | 2020* | |||||||||||||||||
| Gross profit | $ | 255,962 | $ | 184,550 | $ | 176,837 | ||||||||||||||
| Gross profit margin | 40.9 | % | 44.0 | % | 45.8 | % | ||||||||||||||
*Years ended March 31, 2021 and 2020 amounts have been adjusted to reflect the change in inventory accounting method, as described in Notes 1 and 7 to the Consolidated Financial Statements.
Gross profit for the year ended March 31, 2022 increased $71.4 million, or 38.7%, as compared with the year ended March 31, 2021. The increase was primarily due to the acquisitions of TRUaire and Shoemaker, pricing initiatives and increased
29
organic sales. Gross profit margin for the year ended March 31, 2022 of 40.9% decreased from 44.0% for the year ended March 31, 2021, primarily due to the inclusions of the TRUaire and Shoemaker acquisitions, material and freight costs increases outpacing implemented pricing initiatives and $1.7 million of under-absorption costs resulting from reduced production levels and incremental compensation expenses incurred at the TRUaire Vietnam facility during the year to maintain TRUaire Vietnam's operations in accordance with COVID-19 restrictions ("TRUaire Vietnam COVID COGS Impact").
Gross profit for the year ended March 31, 2021 increased $7.7 million, or 4.4%, as compared with the year ended March 31, 2020. The increase was primarily due to the TRUaire acquisition, partially offset by decreased gross margin and an $0.8 million gain on sales of property, plant and equipment in the prior year that did not recur. Gross profit margin for the year ended March 31, 2021 of 44.0% decreased from 45.8% for the year ended March 31, 2020, primarily due to the TRUaire acquisition, including a $3.5 million purchase accounting impact and increased freight and transportation costs in the fourth fiscal quarter.
Selling, General and Administrative Expense
| Year Ended March 31, | ||||||||||||||||||||
| (amounts in thousands, except percentages) | 2022 | 2021 | 2020 | |||||||||||||||||
| Operating expenses | $ | 158,582 | $ | 125,330 | $ | 110,983 | ||||||||||||||
| Operating expenses as a % of revenues | 25.3 | % | 29.9 | % | 28.8 | % | ||||||||||||||
Selling, general and administrative expense for the year ended March 31, 2022 increased $33.3 million, or 26.5%, as compared with the year ended March 31, 2021. The increase was primarily due to the added expenses related to the inclusion of TRUaire, Shoemaker and the Whitmore JV in the current period, increased equity compensation expenses and increased spending on sales commissions driven by increased revenues, increased depreciation expenses related to enterprise resource planning systems, increased headcount, increased travel and $0.7 million of transaction expenses related to the Shoemaker acquisition. The increases were partially offset by transactions expenses related to the TRUaire acquisition ($7.8 million) and JV formation ($2.6 million) incurred in the prior year period that did not recur. The decrease in operating expense as a percentage of sales was primarily attributable to sales increasing by a greater percentage than the increase in operating expenses.
Selling, general and administrative expense for the year ended March 31, 2021 increased $14.3 million, or 12.9%, as compared with the year ended March 31, 2020. The increase was primarily due to transaction expenses related to the TRUaire acquisition ($7.8 million) and the formation of Whitmore JV ($2.6 million), the inclusion of TRUaire's operations and employee severance costs ($0.7 million), partially offset by reduced spend on travel and entertainment expenses and a trademark impairment ($1.0 million) in the prior year that did not recur. The increase in operating expense as a percentage of sales was primarily attributable to transaction expenses discussed above.
Operating Income
| Year Ended March 31, | ||||||||||||||||||||
| (amounts in thousands, except percentages) | 2022 | 2021* | 2020* | |||||||||||||||||
| Operating income | $ | 97,380 | $ | 59,220 | $ | 65,854 | ||||||||||||||
| Operating margin | 15.5 | % | 14.1 | % | 17.1 | % | ||||||||||||||
*Years ended March 31, 2021 and 2020 amounts have been adjusted to reflect the change in inventory accounting method, as described in Notes 1 and 7 to the Consolidated Financial Statements.
Operating income for the year ended March 31, 2022 increased by $38.2 million, or 64.4%, as compared with the year ended March 31, 2021. The increase was a result of the $71.4 million increase in gross profit, partially offset by the $33.3 million increase in selling, general and administrative expense as discussed above.
Operating income for the year ended March 31, 2021 decreased by $6.6 million, or 10.1%, as compared with the year ended March 31, 2020. The decrease was a result of $14.3 million increase in selling, general and administrative expense as discussed above, partially offset by the $7.7 million increase in gross profit.
30
Other income and expense
Interest expense, net for the year ended March 31, 2022 increased $3.1 million to $5.4 million as compared with the year ended March 31, 2021, due to increased borrowing under our Revolving Credit Facility (described in Note 9 to our consolidated financial statements included in Item 8 of this Annual Report) in connection with the TRUaire and Shoemaker acquisitions.
Interest expense, net for the year ended March 31, 2021 increased $1.1 million to $2.4 million as compared with the year ended March 31, 2020, primarily due to increased borrowing under our Revolving Credit Facility (described in Note 9 to our consolidated financial statements included in Item 8 of this Annual Report) in connection with the TRUaire acquisition.
Other expense, net decreased by $5.5 million for the year ended March 31, 2022 to expense of $0.5 million as compared with the year ended March 31, 2021. The decrease was primarily due to a prior year indemnification expense of $5.0 million arising from the partial release of a tax indemnification asset related to the TRUaire acquisition that did not recur.
Other expense, net decreased by $1.2 million for the year ended March 31, 2021 to expense of $6.0 million as compared with the year ended March 31, 2020. The decrease was primarily due to an indemnification expense of $5.0 million due to the partial release of a tax indemnification asset related to the TRUaire acquisition and loss arising from transactions in currencies other than our sites' functional currencies, entirely offset by a charge of $6.5 million resulting from the termination of our U.S. defined benefit pension plan and a lease termination cost of $0.5 million in the prior year that did not recur.
Provision for Income Taxes and Effective Tax Rate
The provision for income taxes for the year ended March 31, 2022 was $24.1 million, representing an effective tax rate of 26.4%, as compared with the provision of $10.8 million, representing an effective tax rate of 21.2%, for the year ended March 31, 2021 and the provision of $12.7 million, representing an effective tax rate of 22.2%, for the year ended March 31, 2020. As compared with the statutory rate for the year ended March 31, 2022, the provision for income taxes was primarily impacted by the state tax expense (net of federal benefits), which increased the provision by $4.8 million and the effective rate by 5.2%; executive compensation limitation, which increased the provision by $1.0 million and effective tax rate by 1.1% and a net increase in the reserve for uncertain tax positions, which increased the provision by $0.8 million and the effective tax rate by 0.8%. This was offset by tax benefits related to the restricted stock vesting which decreased the provision by $1.9 million and the effective tax rate by 2.1%.
As compared with the statutory rate for the year ended March 31, 2021, the provision for income taxes was primarily impacted by the state tax expense, which increased the provision by $2.4 million and the effective rate by 4.8%, the additional non-deductible expenses, which increased the provision by $1.9 million and the effective rate by 2.1%, and the release of uncertain tax positions, which decreased the provision by $4.7 million and the effective rate by 9.3%.
During the year ended March 31, 2022, we released a $0.3 million reserve related to positions taken on tax returns for which the statute has expired, and accrued interest and penalties of $0.6 million and $0.5 million, respectively.
During the year ended March 31, 2021, we recorded total tax contingency reserves of $17.3 million, including unrecognized tax benefit of $13.6 million, accrued interest and penalty of $1.4 million and $2.3 million, respectively, through purchase accounting as a result of the TRUaire acquisition discussed in Note 2 to our consolidated financial statements included in Item 8 of this Annual Report. During the three months ended March 31, 2021, a tax benefit of $5.3 million, including release of accrued interest ($0.6 million) and penalty ($0.6 million), was recognized through the income statement as a result of receiving the audit closing letter from Internal Revenue Service related to calendar 2017. For the year ended March 31, 2021, we recorded an additional net tax contingency reserve of $0.2 million, accrued interest of $0.1 million and accrued penalty of $0.2 million.
Our federal income tax returns for the years ended March 31, 2021, 2020 and 2019 remain subject to examination. Our income tax returns for TRUaire's pre-acquisition periods including calendar years 2018, 2019 and 2020 remain subject to examinations. Our income tax returns in certain state income tax jurisdictions remain subject to examination for various periods for the period ended September 30, 2015 and subsequent years.
As of both March 31, 2022 and 2021, we had no tax effected net operating loss carryforwards, net of valuation allowances. Net operating loss carryforwards will expire in periods beyond the next 5 years.
31
Business Segments
We conduct our operations through three business segments based on type of product and how we manage the business. We evaluate segment performance and allocate resources based on each segment’s operating income. The key operating results for our three business segments are discussed below.
Contractor Solutions Segment Results
The Contractor Solutions segment manufactures efficiency and performance enhancing products predominantly for residential and commercial HVAC/R, plumbing, architecturally-specified building and general industrial applications, which are designed primarily for professional end-use customers.
| Year Ended March 31, | ||||||||||||||||||||
| (amounts in thousands, except percentages) | 2022 | 2021* | 2020* | |||||||||||||||||
| Revenues, net | $ | 416,487 | $ | 245,528 | $ | 190,696 | ||||||||||||||
| Operating income | 96,115 | 59,007 | 58,236 | |||||||||||||||||
| Operating margin | 23.1 | % | 24.0 | % | 30.5 | % | ||||||||||||||
*Years ended March 31, 2021 and 2020 amounts have been adjusted to reflect the change in inventory accounting method, as described in Notes 1 and 7 to the Consolidated Financial Statements.
Net revenues for the year ended March 31, 2022 increased $171.0 million, or 69.6%, as compared with the year ended March 31, 2021. The increase was primarily due to the TRUaire and Shoemaker acquisitions ($103.2 million or 42.0%). Excluding the impact of acquisitions, organic sales increased by $67.8 million, or 27.6%, due to implemented pricing initiatives and increased sales volumes. Pricing initiatives to mitigate rising costs, which began in the three months ended March 31, 2021, continued and increased during the year ended March 31, 2022. Sales volumes increased in HVAC/R, plumbing and architecturally-specified building products end markets and decreased in general industrial end market.
Net revenues for the year ended March 31, 2021 increased $54.8 million, or 28.8%, as compared with the year ended March 31, 2020. The increase was primarily due to the TRUaire acquisition ($33.8 million or 17.7%) and organic sales increases ($21.0 million or 11.1%) driven by increased sales volumes into the HVAC/R, general industrial, architecturally-specified building products and plumbing end markets.
Operating income for the year ended March 31, 2022 increased $37.1 million, or 62.9%, as compared with the year ended March 31, 2021. The increase was primarily due to the inclusion of TRUaire and the transactions expenses ($7.8 million) related to the TRUaire acquisition incurred in prior year that did not recur, partially offset by the transaction expenses ($0.7 million) in the current year related to the Shoemaker acquisition. The organic sales growth contributed to the increased operating income, which was partially offset by increased material and freight costs, the $1.7 million TRUaire Vietnam COVID COGS Impact discussed above and increased spending on sales commissions, depreciation and optimization expenses related to enterprise resource planning systems, headcount and travel.
Operating income for the year ended March 31, 2021 increased $0.8 million, or 1.3%, as compared with the year ended March 31, 2020. The increase was primarily attributable to transaction expenses related to the TRUaire acquisition ($7.8 million), partially offset by increased revenues.
Engineered Building Solutions Segment Results
The Engineered Building Solutions segment provides primarily code-driven products focused on life safety that are engineered to provide aesthetically-pleasing solutions for the construction, refurbishment and modernization of commercial, institutional, and multi-family residential buildings.
32
| Year Ended March 31, | ||||||||||||||||||||
| (amounts in thousands, except percentages) | 2022 | 2021* | 2020* | |||||||||||||||||
| Revenues, net | $ | 97,296 | $ | 95,672 | $ | 90,881 | ||||||||||||||
| Operating income | 11,101 | 14,066 | 14,278 | |||||||||||||||||
| Operating margin | 11.4 | % | 14.7 | % | 15.7 | % | ||||||||||||||
*Years ended March 31, 2021 and 2020 amounts have been adjusted to reflect the change in inventory accounting method, as described in Notes 1 and 7 to the Consolidated Financial Statements.
Net revenues for the year ended March 31, 2022 increased $1.6 million, or 1.7%, as compared with the year ended March 31, 2021. The increase was primarily due to enhanced marketing efforts and market share gains.
Net revenues for the year ended March 31, 2021 increased $4.8 million, or 5.3%, as compared with the year ended March 31, 2020. The increase was primarily due to the successful execution of a large-scale project and project wins due to competitive lead times.
Operating income for the year ended March 31, 2022 decreased $3.0 million, or 21.1%, as compared with the year ended March 31, 2021. The decrease was due to a shift in sales to lower margin projects and added salespeople to achieve long-term revenue growth objectives.
Operating income for the year ended March 31, 2021 decreased $0.2 million, or 1.5%, as compared with the year ended March 31, 2020. The decrease was due to a shift in sales to lower margin projects.
Specialized Reliability Solutions Segment Results
Specialized Reliability Solutions segment provides long-established products for increasing the reliability, performance and lifespan of industrial assets and solving equipment maintenance challenges.
| Year Ended March 31, | ||||||||||||||||||||
| (amounts in thousands, except percentages) | 2022 | 2021* | 2020* | |||||||||||||||||
| Revenues, net | $ | 116,042 | $ | 78,365 | $ | 104,641 | ||||||||||||||
| Operating income | 9,007 | 581 | 7,690 | |||||||||||||||||
| Operating margin | 7.8 | % | 0.7 | % | 7.3 | % | ||||||||||||||
*Years ended March 31, 2021 and 2020 amounts have been adjusted to reflect the change in inventory accounting method, as described in Notes 1 and 7 to the Consolidated Financial Statements.
Net revenues for the year ended March 31, 2022 increased $37.7 million, or 48.1%, as compared with the year ended March 31, 2021. The increase was primarily due to demand recovery in the energy, mining and rail and general industrial end markets, pricing initiatives to mitigate rising costs that began in the three months ended June 30, 2021 and continued throughout the current year, as well as the inclusion of the newly formed Whitmore JV.
Net revenues for the year ended March 31, 2021 decreased $26.3 million, or 25.1%, as compared with the year ended March 31, 2020. The decrease was primarily attributable to decreased sales volumes into the general industrial, energy, rail and mining end markets.
Operating income for the year ended March 31, 2022 increased $8.4 million, or 1,451.5%, as compared with the year ended March 31, 2021. The increase was primarily due to increased organic sales and the Whitmore JV, partially offset by increased material expenses outpacing implemented price increases, increased spending on sales commissions driven by increased sales and increased travel expense.
Operating income for the year ended March 31, 2021 decreased $7.1 million, or 92.5%, as compared with the year ended March 31, 2020. The decrease was primarily attributable to decreased sales and $2.6 million of transaction expenses related to the formation of Whitmore JV, partially offset by decreases in travel and personnel-related expenses and sales commissions.
For additional information on segments, see Note 21 to our consolidated financial statements included in Item 8 of this Annual Report.
33
LIQUIDITY AND CAPITAL RESOURCES
General
Existing cash on hand, cash generated by operations and borrowings available under our Revolving Credit Facility ("Revolver Borrowings") are our primary sources of short-term liquidity. Our ability to consistently generate strong cash flow from our operations is one of our most significant financial strengths; it enables us to invest in our people and our brands, make capital investments and strategic acquisitions, provide a cash dividend program, and from time-to-time, repurchase shares of our common stock. Our largest use of cash in our operations is for purchasing and carrying inventories and carrying seasonal accounts receivable. Additionally, we use our Revolver Borrowings to support our working capital requirements, capital expenditures and strategic acquisitions. We seek to maintain adequate liquidity to meet working capital requirements, fund capital expenditures, and repay scheduled principal and interest payments on debt. Absent deterioration of market conditions, we believe that cash flows from operating and financing activities, primarily Revolver Borrowings, will provide adequate resources to satisfy our working capital, scheduled principal and interest payments on debt, anticipated dividend payments, periodic share repurchases, and anticipated capital expenditure requirements for both our short-term and long-term capital needs.
Cash Flow Analysis
| Year Ended March 31, | ||||||||||||||||||||
| (amounts in thousands) | 2022 | 2021* | 2020* | |||||||||||||||||
| Net cash provided by operating activities, continuing operations | $ | 69,089 | $ | 66,254 | $ | 71,397 | ||||||||||||||
| Net cash used in investing activities, continuing operations | (51,456) | (289,889) | (21,982) | |||||||||||||||||
| Net cash (used in) provided by financing activities | (13,039) | 214,049 | (57,151) | |||||||||||||||||
*Years ended March 31, 2021 and 2020 amounts have been adjusted to reflect the change in inventory accounting method, as described in Notes 1 and 7 to the Consolidated Financial Statements.
Our cash balance at March 31, 2022 was $16.6 million, as compared with $10.1 million at March 31, 2021.
For the year ended March 31, 2022, our cash provided by operating activities from continuing operations was $69.1 million, as compared with $66.3 million and $71.4 million for the years ended March 31, 2021 and 2020, respectively.
•Working capital used cash for the year ended March 31, 2022 due to higher inventories ($49.4 million) and higher accounts receivable ($26.7 million), partially offset by higher accounts payable and other current liabilities ($28.0 million) and lower prepaid expenses and other current assets ($3.5 million).
•Working capital used cash for the year ended March 31, 2021 due to higher accounts receivable ($7.2 million), higher prepaid expenses and other current assets ($4.2 million), and higher inventories ($3.4 million), partially offset by higher accounts payable and other current liabilities ($13.9 million).
•Working capital provided cash for the year ended March 31, 2020 due to higher accounts payable and other current liabilities ($5.9 million) and lower prepaid expenses and other assets ($4.0 million), mostly offset by higher accounts receivable ($8.0 million) and higher inventory ($1.7 million).
Cash flows used in investing activities from continuing operations during the year ended March 31, 2022 were $51.5 million as compared with $289.9 million and $22.0 million for the years ended March 31, 2021 and 2020, respectively.
•Capital expenditures during the years ended March 31, 2022, 2021 and 2020 were $15.7 million, $8.8 million and $11.4 million, respectively. Our capital expenditures have been focused on enterprise resource planning systems, capacity expansion, continuous improvement and automation and new product introductions
•During the year ended March 31, 2022 we acquired Shoemaker for an aggregate purchase price of $43.5 million, including $38.5 million in cash consideration. Additionally, we received proceeds of $1.4 million as a result of the final working capital true-up adjustment related to the TRUaire acquisition. During the year ended March 31, 2021 we acquired TRUaire for $286.9 million (after working capital adjustment) in cash consideration and stock consideration valued at $97.7 million. During the year ended March 31, 2020 we acquired Petersen for $11.8 million as discussed in Note 2 to our consolidated financial statements included in Item 8 of this Annual Report.
34
Cash flows provided by (used in) financing activities during the years ended March 31, 2022, 2021 and 2020 were $(13.0) million, $214.0 million and $(57.2) million, respectively. Cash outflows resulted from:
•Net borrowing (repayments) on our lines of credit (as discussed in Note 9 to our consolidated financial statements included in Item 8 of this Annual Report) of $10.4 million, $231.4 million and $(20.6) million during the years ended March 31, 2022, 2021 and 2020, respectively.
•Payments of $2.3 million of underwriting discounts and fees in connection with amending and extending our Revolving Credit Facility during the year ended March 31, 2022, as discussed in Note 9 to our consolidated financial statements included in Item 8 of this Annual Report.
•Proceeds from the redeemable noncontrolling interest shareholder for its investment in the consolidated Whitmore JV of $6.3 million during the year ended March 31, 2022, as discussed in Note 3 to our consolidated financial statements included in Item 8 of this Annual Report.
•Repurchases of shares under our share repurchase programs (as discussed in Note 13 to our consolidated financial statements included in Item 8 of this Annual Report) of $14.4 million, $7.3 million and $26.9 million during the years ended March 31, 2022, 2021 and 2020, respectively.
•Dividend payments of $9.5 million, $8.1 million and $8.1 million were paid during the years ended March 31, 2022, 2021 and 2020, respectively.
We believe that available cash and cash equivalents, cash flows generated through operations and cash available under our Revolving Credit Facility will be sufficient to meet our liquidity needs, including capital expenditures, for at least the next 12 months.
Acquisitions
We regularly evaluate acquisition opportunities of various sizes. The cost and terms of any financing to be raised in conjunction with any acquisition, including our ability to raise capital, is a critical consideration in any such evaluation. During the year ended March 31, 2022, we acquired 100% of the outstanding equity of Shoemaker Manufacturing, LLC (“Shoemaker”). The aggregate cash paid for the Shoemaker acquisition, net of cash acquired, totaled $37.3 million and was funded through a combination of cash on hand and borrowings under our Revolving Credit Facility. See Note 2 to our consolidated financial statements included in Item 8 of this Annual Report for a discussion of our acquisitions.
Debt
Out short-term debt obligation consists of the current maturity of our Whitmore Term Loan in the amount of $0.6 million. Our long-term debt obligations consist of the final maturity of our Whitmore Term Loan with maturity dates between fiscal 2024 and 2030 and Revolver Borrowings with maturity date in fiscal 2027. As of March 31, 2022, we had $243.0 million in outstanding Revolver Borrowings, which resulted in a borrowing capacity of $157.0 million. See Note 9 to our consolidated financial statements included in Item 8 of this Annual Report for a discussion of our indebtedness.
Dividends
Total dividends of $9.5 million were paid during the year ended March 31, 2022. On April 14, 2022, we announced a 13% quarterly dividend increase to $0.170 per share which was paid on May 13, 2022 to shareholders of record as of April 29, 2022. We currently expect to continue to pay a regular quarterly dividend to shareholders in the future, but such payments are subject to approval of our Board of Directors and are dependent upon our financial conditions, results of operations, capital requirements, and other factors, including those set forth under Item 1A. "Risk Factors" of this Annual Report. See Note 13 to our consolidated financial statements included in Item 8 of this Annual Report for a discussion of dividends.
35
Share Repurchase Program
On October 30, 2020, our Board of Directors authorized the repurchase up to $100.0 million of our common stock, which replaced the previously announced $75.0 million program. During the year ended March 31, 2022, we repurchased 126,115 shares for an aggregate amount of $14.4 million. We primarily used cash on hand to pay for the repurchased shares. Our Board of Directors has established an expiration of December 31, 2022 for the $100.0 million repurchase program and we currently expect to continue to repurchase shares in the near future, but such repurchases are dependent upon our financial condition, results of operations, capital requirements, and other factors, including those set forth under Item 1A. "Risk Factors" of this Annual Report. See Note 13 to our consolidated financial statements included in Item 8 of this Annual Report for a discussion of our share repurchase program.
Capital Expenditures
During the year ended March 31, 2022, we invested $15.7 million in capital expenditures related to enterprise resource planning systems, capacity expansion, continuous improvement and automation and new product introductions. We plan to continue investing in capital expenditures in the future to improve manufacturing productivity, upgrade information technology infrastructure and security and implement advanced technologies for our existing facilities.
Contractual Obligations
Our contractual obligations as of March 31, 2022 primarily included purchase obligations and operating lease commitments. Purchase obligations include agreements to purchase goods or services that are enforceable, legally binding and specify all significant terms, including: fixed or minimum quantities to be purchased; fixed, minimum or variable price provisions; and the approximate timing of the transaction. Purchase obligations exclude agreements that are cancellable without penalty. We expect to incur $67.4 million in purchase obligations over the next 12 months. For operating lease commitments, see Note 10 to our consolidated financial statements included in Item 8 of this Annual Report.
CRITICAL ACCOUNTING ESTIMATES
The process of preparing financial statements in conformity with U.S. GAAP requires the use of estimates and assumptions to determine reported amounts of certain assets, liabilities, revenues and expenses and the disclosure of related contingent assets and liabilities. These estimates and assumptions are based upon information available at the time of the estimates or assumptions, including our historical experience, where relevant. The most significant estimates made by management include: timing and amount of revenue recognition; deferred taxes and tax reserves; and valuation of goodwill and indefinite-lived intangible assets, both at the time of initial acquisition, as well as part of recurring impairment analyses, as applicable. The significant estimates are reviewed at least annually, if not quarterly, by management. Because of the uncertainty of factors surrounding the estimates, assumptions and judgments used in the preparation of our financial statements, actual results may differ from the estimates, and the difference may be material.
Our critical accounting policies are those policies that are both most important to our financial condition and results of operations and require the most difficult, subjective or complex judgments on the part of management in their application, often as a result of the need to make estimates about the effect of matters that are inherently uncertain. We believe that the following represent our critical accounting policies. For a summary of all of our significant accounting policies, see Note 1 to our consolidated financial statements included in Item 8 of this Annual Report. Management and our external auditors have discussed our critical accounting estimates and policies with the Audit Committee of our Board of Directors.
Revenue Recognition
We recognize revenues to depict the transfer of control of promised goods or services to our customers in an amount that reflects the consideration to which we expect to be entitled in exchange for those goods or services. Refer to Note 20 for further discussion. We recognize revenue when all of the following criteria have been met: (i) a contract with a customer exists, (ii) performance obligations have been identified, (iii) the price to the customer has been determined, (iv) the price to the customer has been allocated to the performance obligations, and (v) performance obligations are satisfied, which are more fully described below.
(i) We identify a contract with a customer when a sales agreement indicates approval and commitment of the parties; identifies the rights of the parties; identifies the payment terms; has commercial substance; and it is probable that we
36
will collect the consideration to which we will be entitled in exchange for the goods or services that will be transferred to the customer. In most instances, our contract with a customer is the customer's purchase order. For certain customers, we may also enter into a sales agreement that outlines a framework of terms and conditions that apply to all future purchase orders for that customer. In these situations, our contract with the customer is both the sales agreement and the specific customer purchase order. Because our contract with a customer is typically for a single transaction or customer purchase order, the duration of the contract is one year or less. As a result, we have elected to apply certain practical expedients and, as permitted by the Financial Accounting Standards Board, omit certain disclosures of remaining performance obligations for contracts that have an initial term of one year or less.
(ii) We identify performance obligations in a contract for each promised good or service that is separately identifiable from other promises in the contract and for which the customer can benefit from the good or service either on its own or together with other resources that are readily available to the customer. Goods and services provided to our customers that are deemed immaterial are included with other performance obligations.
(iii) We determine the transaction price as the amount of consideration we expect to be entitled to in exchange for fulfilling the performance obligations, including the effects of any variable consideration.
(iv) For any contracts that have more than one performance obligation, we allocate the transaction price to each performance obligation in an amount that depicts the amount of consideration to which we expect to be entitled in exchange for satisfying each performance obligation. We have excluded disclosure of the transaction price allocated to remaining performance obligations if the performance obligation is part of a contract that has an original expected duration of one year or less as the majority of our contracts are short-term in nature with a term of one year or less.
(v) We recognize revenue when, or as, we satisfy the performance obligation in a contract by transferring control of a promised good or service to the customer.
We exclude from the measurement of the transaction price all taxes assessed by a governmental authority that are both imposed on and concurrent with a specific revenue-producing transaction and collected from a customer. As such, we present revenue net of sales and other similar taxes. Shipping and handling costs associated with outbound freight after control over a product has transferred to a customer are accounted for as a fulfillment cost and are included in cost of revenues. Costs to obtain a contract, which include sales commissions recorded in selling, general and administrative expense, are expensed when incurred as the amortization period is one year or less. We do not have customer contracts that include significant financing components.
Deferred Taxes and Tax Reserves
Deferred tax assets and liabilities are determined based on temporary differences between the financial statement carrying amounts and the tax basis of assets and liabilities, applying enacted tax rates expected to be in effect for the year in which the differences are expected to reverse. The effect on deferred tax assets and liabilities of a change in tax rates is recognized in income in the period that includes the enactment date. Based on the evaluation of available evidence, both positive and negative, we recognize future tax benefits, such as net operating loss carryforwards and tax credit carryforwards, to the extent that these benefits are more likely than not to be realized. We base our judgment of the recoverability of our deferred tax assets primarily on historical earnings, our estimate of current and expected future earnings using historical and projected future operating results, and prudent and feasible tax planning strategies.
The amount of income taxes we pay is subject to ongoing audits by federal, state and foreign tax authorities, which may result in proposed assessments. Significant judgment is required in determining income tax provisions and evaluating tax positions. We establish reserves for open tax years for uncertain tax positions that may be subject to challenge by various taxing authorities. The consolidated tax provision and related accruals include the impact of such reasonably estimable losses and related interest and penalties as deemed appropriate. Tax benefits recognized in the financial statements from uncertain tax positions are measured based on the largest benefit that has a greater than 50% likelihood of being realized upon ultimate settlement. During the year ended March 31, 2022, we released a $0.3 million reserve related to positions taken on tax returns for which the statute has expired, and accrued interest and penalties of $0.6 million and $0.5 million, respectively.
37
During the year ended March 31, 2021, we recorded total tax contingency reserves of $17.3 million, including unrecognized tax benefit of $13.6 million, accrued interest and penalty of $1.4 million and $2.3 million, respectively, through purchase accounting as a result of the TRUaire acquisition discussed in Note 2. During the three months ended March 31, 2021, a tax benefit of $5.3 million, including release of accrued interest ($0.6 million) and penalty ($0.6 million), was recognized through the income statement as a result of receiving the audit closing letter from Internal Revenue Service related to calendar 2017. For the year ended March 31, 2021, we recorded an additional net tax contingency reserve of $0.2 million, accrued interest of $0.1 million and accrued penalty of $0.2 million. For the year ended March 31, 2020, we released a net $1.4 million reserve, which included settlements of $0.2 million, increases of $0.1 million and a release of $1.3 million in federal uncertain tax positions. The interest and penalties related to the uncertain tax position resulted in a reduction of $0.4 million in income tax expense for the year ended March 31, 2020. Our liability for uncertain tax positions contains uncertainties as management is required to make assumptions and apply judgments to estimate exposures associated with our tax positions.
Our federal income tax returns for the years ended March 31, 2021, 2020 and 2019 remain subject to examination. Our income tax returns for TRUaire's pre-acquisition periods including calendar years 2018, 2019 and 2020 remain subject to examinations. Our income tax returns in certain state income tax jurisdictions remain subject to examination for various periods for the period ended September 30, 2015 and subsequent years.
While we believe we have adequately provided for any reasonably foreseeable outcome related to these matters, our future results may include favorable or unfavorable adjustments to our estimated tax liabilities. To the extent that the expected tax outcome of these matters changes, such changes in estimate will impact the income tax provision in the period in which such determination is made.
Goodwill and Indefinite-Lived Intangible Assets
The initial recording of goodwill and intangible assets requires subjective judgements concerning estimates of the fair value of the acquired assets. We test the value of goodwill for impairment as of January 31 each year or whenever events or circumstances indicate such asset may be impaired.
The test for goodwill impairment involves significant judgement in estimating projections of fair value generated through future performance of each of the reporting units. The identification of our reporting units began at the operating segment level and considered whether components one level below the operating segment levels should be identified as reporting units for purpose of testing goodwill for impairment based on certain conditions. These conditions included, among other factors, (i) the extent to which a component represents a business and (ii) the aggregation of economically similar components within the operating segments. Other factors that were considered in determining whether the aggregation of components was appropriate included the similarity of the nature of the products and services, the nature of the production processes, the methods of distribution and the types of industries served.
Accounting Standards Codification ("ASC") 350 allows an optional qualitative assessment, prior to a quantitative assessment test, to determine whether it is more likely than not that the fair value of a reporting unit exceeds its carrying amount. We bypassed the qualitative assessment and proceeded directly to the quantitative test. If the carrying value of a reporting unit exceeds its fair value, the goodwill of that reporting unit is impaired and an impairment loss is recorded equal to the excess of the carrying value over its fair value. We estimate the fair value of our reporting units based on an income approach, whereby we calculate the fair value of a reporting unit based on the present value of estimated future cash flows. A discounted cash flow analysis requires us to make various judgmental assumptions about future sales, operating margins, growth rates and discount rates, which are based on our budgets, business plans, economic projections, anticipated future cash flows and market participants. Our quantitative test performed as of January 31, 2022 indicated that no goodwill impairment loss should be recognized for the year ended March 31, 2022. There were no impairment loss recognized for the years ended March 31, 2021 and 2020, respectively.
We have indefinite-lived intangible assets in the form of trademarks and license agreements. We test these intangible assets for impairment at least annually as of January 31 or whenever events or circumstances indicate that the carrying amount may not be recoverable. Significant assumptions used in the impairment test include the discount rate, royalty rate, future sales projections and terminal value growth rate. These inputs are considered non-recurring level three inputs within the fair value hierarchy. An impairment loss would be recognized when estimated future cash flows are less than their carrying amount. We recorded impairment losses on intangible assets (excluding those related to discontinued operations) of $0, $0 and $1.0 million for the years ended March 31, 2022, 2021 and 2020, respectively.
38
ACCOUNTING DEVELOPMENTS
We have presented the information about accounting pronouncements not yet implemented in Note 1 to our consolidated financial statements included in Item 8 of this Annual Report.
39
ITEM 7A: QUANTITATIVE AND QUALITATIVE DISCLOSURES ABOUT MARKET RISK
We are exposed to market risk from changes in interest rates and foreign currency exchange rates, which may adversely affect our consolidated financial position and results of operations. We seek to minimize these risks through regular operating and financing activities, and when deemed appropriate, through the use of interest rate swaps. It is our policy to enter into interest rate swaps only to the extent considered necessary to meet our risk management objectives. We do not purchase, hold or sell derivative financial instruments for trading or speculative purposes.
Variable Rate Indebtedness
We are subject to interest rate risk on our variable rate indebtedness. Fluctuations in interest rates have a direct effect on interest expense associated with our outstanding indebtedness. We manage, or hedge, interest rate risks related to our borrowings by means of interest rate swap agreements. As of March 31, 2022, we had $243.0 million in outstanding variable rate indebtedness, after consideration of the interest rate swap, which covered 3.9% of our $252.8 million of our total outstanding indebtedness. At March 31, 2022, we had $243.0 million in unhedged variable rate indebtedness with a weighted average interest rate of 1.95%. Each quarter point change in interest rates would result in a change of approximately $0.6 million in our interest expense on an annual basis.
We may also be exposed to credit risk in derivative contracts we may use. Credit risk is the failure of the counterparty to perform under the terms of the derivative contract. If the fair value of a derivative contract is positive, the counterparty will owe us, which creates credit risk for us. If the fair value of a derivative contract is negative, we will owe the counterparty and, therefore, do not have credit risk. We have sought to minimize the credit risk in derivative instruments by entering into transactions with high-quality counterparties.
Foreign Currency Exchange Rate Risk
We conduct a portion of our operations outside of the U.S. in currencies other than the U.S. dollar. Our non-U.S. operations are conducted primarily in their local currencies, which are also their functional currencies, and include the Australian dollar, British pound, Canadian dollar and Vietnamese dong. Foreign currency exposures arise from translation of foreign-denominated assets and liabilities into U.S. dollars and from transactions denominated in a currency other than a non-U.S. operation’s functional currency. We realized net (losses) gains associated with foreign currency translation of less than $(0.1) million, $4.8 million and $(2.3) million for the years ended March 31, 2022, 2021 or 2020, respectively, which are included in accumulated other comprehensive income (loss). We recognized foreign currency transaction net gains (losses) of less than $0.1 million, $(0.9) million and $0.3 million for the years ended March 31, 2022, 2021 or 2020, respectively, which are included in other income (expense), net on our consolidated statements of operations.
Based on a sensitivity analysis at March 31, 2022, a 10% change in the foreign currency exchange rates for the year ended March 31, 2022 would have impacted our income from continuing operations by less than 1%. This calculation assumes that all currencies change in the same direction and proportion relative to the U.S. dollar and that there are no indirect effects, such as changes in non-U.S. dollar sales volumes or prices.
40
ITEM 8: FINANCIAL STATEMENTS AND SUPPLEMENTARY DATA
REPORT OF INDEPENDENT REGISTERED PUBLIC ACCOUNTING FIRM
Board of Directors and Shareholders
CSW Industrials, Inc.
Opinion on the Financial Statements
We have audited the accompanying consolidated balance sheets of CSW Industrials, Inc. (a Delaware corporation) and subsidiaries (the “Company”) as of March 31, 2022 and 2021, the related consolidated statements of operations, comprehensive income, equity, and cash flows for each of the three years in the period ended March 31, 2022, and the related notes (collectively referred to as the “financial statements”). In our opinion, the financial statements present fairly, in all material respects, the financial position of the Company as of March 31, 2022 and 2021, and the results of its operations and its cash flows for each of the three years in the period ended March 31,2022, in conformity with accounting principles generally accepted in the United States of America.
We also have audited, in accordance with the standards of the Public Company Accounting Oversight Board (United States) (“PCAOB”), the Company’s internal control over financial reporting as of March 31, 2022, based on criteria established in the 2013 Internal Control—Integrated Framework issued by the Committee of Sponsoring Organizations of the Treadway Commission (“COSO”), and our report dated May 18, 2022 expressed an unqualified opinion.
Basis for Opinion
These financial statements are the responsibility of the Company’s management. Our responsibility is to express an opinion on the Company’s financial statements based on our audits. We are a public accounting firm registered with the PCAOB and are required to be independent with respect to the Company in accordance with the U.S. federal securities laws and the applicable rules and regulations of the Securities and Exchange Commission and the PCAOB.
We conducted our audits in accordance with the standards of the PCAOB. Those standards require that we plan and perform the audit to obtain reasonable assurance about whether the financial statements are free of material misstatement, whether due to error or fraud. Our audits included performing procedures to assess the risks of material misstatement of the financial statements, whether due to error or fraud, and performing procedures that respond to those risks. Such procedures included examining, on a test basis, evidence regarding the amounts and disclosures in the financial statements. Our audits also included evaluating the accounting principles used and significant estimates made by management, as well as evaluating the overall presentation of the financial statements. We believe that our audits provide a reasonable basis for our opinion.
Critical Audit Matter
The critical audit matter communicated below is a matter arising from the current period audit of the financial statements that was communicated or required to be communicated to the audit committee and that: (1) relates to accounts or disclosures that are material to the financial statements and (2) involved our especially challenging, subjective, or complex judgments. The communication of a critical audit matter does not alter in any way our opinion on the financial statements, taken as a whole, and we are not, by communicating the critical audit matter below, providing a separate opinion on the critical audit matter or on the accounts or disclosures to which it relates.
Valuation of Customer Lists Intangible Asset
As described further in Note 2 to the financial statements, on December 15, 2021, the Company completed the acquisition of Shoemaker Manufacturing, LLC for an aggregate purchase price of $43.5 million. The Company’s accounting for the acquisition required the estimation of the fair value of assets acquired and liabilities assumed, which included a customer lists intangible asset of $23.0 million. The estimated fair value of the customer lists intangible asset was determined using the excess earnings method. We identified the estimation of the fair value of the customer lists intangible asset in management’s purchase price allocation as a critical audit matter.
The principal consideration for our determination that the valuation of the customer lists intangible asset is a critical audit matter is the significant estimation uncertainty involved in determining fair value. The significant assumptions included the expected revenue growth rates, gross profit margin, and discount rates. These assumptions required a high degree of auditor judgment, subjectivity, and effort in performing procedures and evaluating management’s significant assumptions and involved the use of valuation specialists.
41
Our audit procedures related to the valuation of the customer lists intangible asset included the following, among others.
a.We tested the effectiveness of internal controls over management’s valuation of the customer list intangible asset.
b.We evaluated the methodologies and tested the significant assumptions used by the Company by involving valuation specialists to evaluate the appropriateness of the methodology and the significant assumptions in the fair value estimate by comparing the discount rate to relevant observable market data.
c.We tested the underlying data by comparing the estimated future revenues and gross profit margin to historical operating results, as well as tested the completeness and accuracy of the underlying data used in the excess earnings method valuation.
d.We also evaluated corroborative and contrary evidence when evaluating the expected future revenue growth rates, gross profit margin, and discount rate assumptions.
/s/ GRANT THORNTON LLP
We have served as the Company’s auditor since 2015.
May 18, 2021
42
CSW INDUSTRIALS, INC.
CONSOLIDATED BALANCE SHEETS
| March 31, | ||||||||||||||
| (Amounts in thousands, except per share amounts) | 2022 | 2021* | ||||||||||||
| ASSETS | ||||||||||||||
| Current assets: | ||||||||||||||
| Cash and cash equivalents | $ | $ | ||||||||||||
| Accounts receivable, net | ||||||||||||||
| Inventories, net | ||||||||||||||
| Prepaid expenses and other current assets | ||||||||||||||
| Total current assets | ||||||||||||||
| Property, plant and equipment, net | ||||||||||||||
| Goodwill | ||||||||||||||
| Intangible assets, net | ||||||||||||||
| Other assets | ||||||||||||||
| Total assets | $ | $ | ||||||||||||
| LIABILITIES AND EQUITY | ||||||||||||||
| Current liabilities: | ||||||||||||||
| Accounts payable | $ | $ | ||||||||||||
| Accrued and other current liabilities | ||||||||||||||
| Current portion of long-term debt | ||||||||||||||
| Total current liabilities | ||||||||||||||
| Long-term debt | ||||||||||||||
| Retirement benefits payable | ||||||||||||||
| Other long-term liabilities | ||||||||||||||
| Total liabilities | ||||||||||||||
| Commitments and contingencies (Note 18) | ||||||||||||||
| Redeemable noncontrolling interest | ||||||||||||||
| Equity: | ||||||||||||||
Common shares, $ | ||||||||||||||
Shares authorized – | ||||||||||||||
Shares issued – | ||||||||||||||
Preferred shares, $ | ||||||||||||||
Shares authorized ( | ||||||||||||||
| Additional paid-in capital | ||||||||||||||
Treasury shares, at cost ( | ( | ( | ||||||||||||
| Retained earnings | ||||||||||||||
| Accumulated other comprehensive loss | ( | ( | ||||||||||||
| Total equity | ||||||||||||||
| Total liabilities and equity | $ | $ | ||||||||||||
See accompanying notes to consolidated financial statements.
43
CSW INDUSTRIALS, INC.
CONSOLIDATED STATEMENTS OF OPERATIONS
| Year Ended March 31, | ||||||||||||||||||||
| (Amounts in thousands, except per share amounts) | 2022 | 2021* | 2020* | |||||||||||||||||
| Revenues, net | $ | $ | $ | |||||||||||||||||
| Cost of revenues | ( | ( | ( | |||||||||||||||||
| Gross profit | ||||||||||||||||||||
| Selling, general and administrative expenses | ( | ( | ( | |||||||||||||||||
| Impairment expenses | ( | |||||||||||||||||||
| Operating income | ||||||||||||||||||||
| Interest expense, net | ( | ( | ( | |||||||||||||||||
| Other expense, net | ( | ( | ( | |||||||||||||||||
| Income before income taxes | ||||||||||||||||||||
| Provision for income taxes | ( | ( | ( | |||||||||||||||||
| Income from continuing operations | ||||||||||||||||||||
| Income from discontinued operations, net of tax | ||||||||||||||||||||
| Net income | ||||||||||||||||||||
| Income attributable to redeemable noncontrolling interest | ( | |||||||||||||||||||
| Net income attributable to CSW Industrials, Inc. | $ | $ | $ | |||||||||||||||||
| Basic earnings per common share: | ||||||||||||||||||||
| Continuing operations | $ | $ | $ | |||||||||||||||||
| Discontinued operations | ||||||||||||||||||||
| Net income attributable to CSW Industrials, Inc. | $ | $ | $ | |||||||||||||||||
| Diluted earnings per common share: | ||||||||||||||||||||
| Continuing operations | $ | $ | $ | |||||||||||||||||
| Discontinued operations | ||||||||||||||||||||
| Net income attributable to CSW Industrials, Inc. | $ | $ | $ | |||||||||||||||||
| Weighted average number of shares outstanding: | ||||||||||||||||||||
| Basic | ||||||||||||||||||||
| Diluted | ||||||||||||||||||||
44
CONSOLIDATED STATEMENTS OF COMPREHENSIVE INCOME
| Year Ended March 31, | ||||||||||||||||||||
| (Amounts in thousands) | 2022 | 2021* | 2020* | |||||||||||||||||
| Net income | $ | $ | $ | |||||||||||||||||
| Other comprehensive (loss) income: | ||||||||||||||||||||
| Foreign currency translation adjustments | ( | ( | ||||||||||||||||||
Cash flow hedging activity, net of taxes of $( | ( | |||||||||||||||||||
Pension and other postretirement effects, net of taxes of $( | ||||||||||||||||||||
| Other comprehensive income (loss) | ( | |||||||||||||||||||
| Comprehensive income | $ | $ | $ | |||||||||||||||||
| Less: Comprehensive income attributable to redeemable noncontrolling interest | ( | |||||||||||||||||||
| Comprehensive income attributable to CSW Industrials, Inc. | $ | $ | $ | |||||||||||||||||
*Years ended March 31, 2021 and 2020 amounts have been adjusted to reflect the change in inventory accounting method, as described in Notes 1 and 7 to the Consolidated Financial Statements.
See accompanying notes to consolidated financial statements.
45
CSW INDUSTRIALS, INC.
CONSOLIDATED STATEMENTS OF EQUITY
| (Amounts in thousands) | Common Stock | Treasury Shares | Additional Paid-In Capital | Retained Earnings | Accumulated Other Comprehensive Loss | Total Equity | ||||||||||||||||||||||||||||||||
| Balance at March 31, 2019 (As reported) | $ | $ | ( | $ | $ | $ | ( | $ | ||||||||||||||||||||||||||||||
| Cumulative effect of inventory accounting method change (Note 1 and Note 7) | — | — | — | — | ||||||||||||||||||||||||||||||||||
| Balance at March 31, 2019* | $ | $ | ( | $ | $ | $ | ( | $ | ||||||||||||||||||||||||||||||
| — | — | — | ( | — | ( | |||||||||||||||||||||||||||||||||
| Share-based compensation | — | — | — | — | ||||||||||||||||||||||||||||||||||
| Stock activity under stock plans | ( | — | — | ( | ||||||||||||||||||||||||||||||||||
| Repurchase of common shares | — | ( | — | — | — | ( | ||||||||||||||||||||||||||||||||
| Net income | — | — | — | — | ||||||||||||||||||||||||||||||||||
| Dividends | — | — | $ | ( | — | ( | ||||||||||||||||||||||||||||||||
| Other comprehensive loss, net of tax | — | — | — | — | ( | ( | ||||||||||||||||||||||||||||||||
| Balance at March 31, 2020* | $ | $ | ( | $ | $ | $ | ( | $ | ||||||||||||||||||||||||||||||
| Share-based compensation | — | — | — | — | ||||||||||||||||||||||||||||||||||
| Stock activity under stock plans | ( | ( | — | — | ( | |||||||||||||||||||||||||||||||||
| Reissuance of treasury shares | — | — | — | |||||||||||||||||||||||||||||||||||
| Repurchase of common shares | — | ( | — | — | — | ( | ||||||||||||||||||||||||||||||||
| Net income | — | — | — | — | ||||||||||||||||||||||||||||||||||
| Dividends | — | — | ( | — | ( | |||||||||||||||||||||||||||||||||
| Other comprehensive income, net of tax | — | — | — | — | ||||||||||||||||||||||||||||||||||
| Balance at March 31, 2021* | $ | $ | ( | $ | $ | $ | ( | $ | ||||||||||||||||||||||||||||||
| Share-based compensation | — | — | — | — | ||||||||||||||||||||||||||||||||||
| Stock activity under stock plans | ( | — | — | ( | ||||||||||||||||||||||||||||||||||
| Reissuance of treasury shares | — | ( | — | — | ||||||||||||||||||||||||||||||||||
| Repurchase of common shares | — | ( | — | — | — | ( | ||||||||||||||||||||||||||||||||
| Net income | — | — | — | — | ||||||||||||||||||||||||||||||||||
| Dividends | — | — | ( | — | ( | |||||||||||||||||||||||||||||||||
| Other comprehensive income, net of tax | — | — | — | — | ||||||||||||||||||||||||||||||||||
| Balance at March 31, 2022 | $ | $ | ( | $ | $ | $ | ( | $ | ||||||||||||||||||||||||||||||
*The balances at March 31, 2019, 2020 and 2021 amounts have been adjusted to reflect the change in inventory accounting method, as described in Notes 1 and 7 to the Consolidated Financial Statements.
See accompanying notes to consolidated financial statements.
46
CSW INDUSTRIALS, INC.
CONSOLIDATED STATEMENTS OF CASH FLOWS
| Year Ended March 31, | ||||||||||||||||||||
| (Amounts in thousands) | 2022 | 2021* | 2020* | |||||||||||||||||
| Cash flows from operating activities: | ||||||||||||||||||||
| Net income | $ | $ | $ | |||||||||||||||||
| Less: Income from discontinued operations, net of tax | ||||||||||||||||||||
| Income from continuing operations | ||||||||||||||||||||
| Adjustments to reconcile net income to net cash provided by operating activities: | ||||||||||||||||||||
| Depreciation | ||||||||||||||||||||
| Amortization of intangible and other assets | ||||||||||||||||||||
| Provision for inventory reserves | ||||||||||||||||||||
| Provision for doubtful accounts | ||||||||||||||||||||
| Share-based and other executive compensation | ||||||||||||||||||||
| Net gain on disposals of property, plant and equipment | ( | ( | ( | |||||||||||||||||
| Pension plan termination expense | ||||||||||||||||||||
| Net pension benefit | ( | |||||||||||||||||||
| Impairment of intangible assets | ||||||||||||||||||||
| Net deferred taxes | ( | ( | ||||||||||||||||||
| Changes in operating assets and liabilities: | ||||||||||||||||||||
| Accounts receivable | ( | ( | ( | |||||||||||||||||
| Inventories | ( | ( | ( | |||||||||||||||||
| Prepaid expenses and other current assets | ( | |||||||||||||||||||
| Other assets | ( | |||||||||||||||||||
| Accounts payable and other current liabilities | ||||||||||||||||||||
| Retirement benefits payable and other liabilities | ( | ( | ||||||||||||||||||
| Net cash provided by operating activities, continuing operations | ||||||||||||||||||||
| Net cash used in operating activities, discontinued operations | ( | |||||||||||||||||||
| Net cash provided by operating activities | ||||||||||||||||||||
| Cash flows from investing activities: | ||||||||||||||||||||
| Capital expenditures | ( | ( | ( | |||||||||||||||||
| Proceeds from sale of assets held for investment | ||||||||||||||||||||
| Proceeds from sale of assets | ||||||||||||||||||||
| Cash paid for acquisitions | ( | ( | ( | |||||||||||||||||
| Net cash used in investing activities, continuing operations | ( | ( | ( | |||||||||||||||||
| Net cash provided by investing activities, discontinued operations | ||||||||||||||||||||
| Net cash used in investing activities | ( | ( | ( | |||||||||||||||||
| Cash flows from financing activities: | ||||||||||||||||||||
| Borrowings on lines of credit | ||||||||||||||||||||
| Repayments of lines of credit | ( | ( | ( | |||||||||||||||||
| Payments of deferred loan costs | ( | ( | ||||||||||||||||||
| Purchase of treasury shares | ( | ( | ( | |||||||||||||||||
| Proceeds from stock option activity | ||||||||||||||||||||
| Proceeds from acquisition of redeemable noncontrolling interest shareholder | ||||||||||||||||||||
| Dividends paid to shareholders | ( | ( | ( | |||||||||||||||||
| Net cash (used in) provided by financing activities | ( | ( | ||||||||||||||||||
| Effect of exchange rate changes on cash and equivalents | ( | |||||||||||||||||||
| Net change in cash and cash equivalents | ( | ( | ||||||||||||||||||
| Cash and cash equivalents, beginning of period | ||||||||||||||||||||
| Cash and cash equivalents, end of period | $ | $ | $ | |||||||||||||||||
| Supplemental non-cash disclosure: | ||||||||||||||||||||
| Cash paid during the year for interest | $ | $ | $ | |||||||||||||||||
| Cash paid during the year for income taxes | ||||||||||||||||||||
*Years ended March 31, 2021 and 2020 amounts have been adjusted to reflect the change in inventory accounting method, as described in Notes 1 and 7 to the Consolidated Financial Statements.
See accompanying notes to consolidated financial statements.
47
1. ORGANIZATION AND OPERATIONS AND SUMMARY OF SIGNIFICANT ACCOUNTING POLICIES
CSWI is a diversified industrial growth company with a strategic focus on providing niche, value-added products in the end markets we serve. We operate in three business segments: Contractor Solutions, Engineered Building Solutions and Specialized Reliability Solutions. Our products include mechanical products for heating, ventilation, air conditioning and refrigeration ("HVAC/R"), plumbing products, grilles, registers and diffusers ("GRD"), building safety solutions and high-performance specialty lubricants and sealants. End markets that we serve include HVAC/R, architecturally-specified building products, plumbing, energy, rail, mining and general industrial. Drawing on our innovative and proven technologies, we seek to deliver solutions to our professional customers that require superior performance and reliability. Our diverse product portfolio includes more than 100 highly respected industrial brands including RectorSeal No. 5®, KOPR-KOTE®, KATS Coatings®, Safe-T-Switch®, Air Sentry®, Deacon®, Leak Freeze®, Greco® and TRUaire® and Shoemaker ManufacturingTM.
The COVID-19 pandemic and its resulting impacts had an overall negative impact on our financial results in our prior fiscal year ended March 31, 2021. During our current fiscal year ended March 31, 2022, the direct impact of the COVID-19 pandemic on our consolidated operating results was limited, in all material respects, to our operations in Vietnam. In early August 2021, the Vietnamese government mandated numerous restrictions in an effort to mitigate the spread of COVID-19, including closures of non-essential businesses, limitations on movements of individuals, and the imposition of other highly-restrictive measures for businesses, like ours, that continued operations in compliance with the restrictions. Our Vietnam operations began resuming normal production activities in late November 2021, when the Vietnamese government-mandated restrictions began to ease. Regarding our operations generally, the indirect impacts of the COVID-19 pandemic have resulted in material and freight cost inflation, supply chain disruptions and freight delays, driven by numerous factors including countermeasures taken by U.S. federal, state and/or local governments and the Federal Reserve, labor supply shortages, and recovering demand. We expect material and freight cost volatility, supply chain challenges and freight delays to continue in the near-term, and we are addressing these impacts through focused inventory management and by continuing and increasing the pricing initiatives that began in the three months ended March 31, 2021.
While the COVID-19 pandemic and its indirect effects have contributed to increased demand in certain parts of our business, including the HVAC/R end market, we expect customer demand levels and our overall results of operations and financial condition to have some level of volatility through the duration of the pandemic when compared to pre-pandemic periods. Despite strong demand in certain of our end markets and clear signs of recovery in others, we cannot reasonably estimate the magnitude or length of the pandemic’s direct and indirect adverse impact, including its ultimate impact on our business or financial condition, due to continued uncertainty regarding (1) the duration and severity of the COVID-19 pandemic, including any surges due to the variants and (2) the continued potential for short and long-term impacts on our facilities and employees, customer demand and supply chain.
We are closely monitoring the Russian invasion of Ukraine and its global impacts. We have no operations, employees or assets in Russia, Belarus or Ukraine, nor do we source goods or services of any material amount from those countries, whether directly or indirectly. During the fiscal year ended March 31, 2022, we had no sales into Belarus or Ukraine and our sales into Russia were immaterial to both our consolidated sales and the sales for our Specialized Reliability Solutions segment. Additionally, shortly after the Russian invasion of Ukraine began in February 2022, we indefinitely suspended all business activity in Russia. While the conflict continues to evolve and the outcome remains highly uncertain, we do not currently believe the Russia-Ukraine conflict will have a material impact on our business and results of operations. However, if the Russia-Ukraine conflict continues or worsens, leading to greater global economic or political disruptions and uncertainty, our business and results of operations could be materially impacted as a result.
48
Use of Estimates – The process of preparing financial statements in conformity with U.S. GAAP requires us to make estimates and assumptions that affect reported amounts of certain assets, liabilities, revenues and expenses. We believe our estimates and assumptions are reasonable; however, actual results may differ materially from such estimates. The most significant estimates and assumptions are used in determining:
•Timing and amount of revenue recognition;
•Deferred taxes and tax reserves; and
•Valuation of goodwill and indefinite-lived intangible assets.
Inventories and Related Reserves – Inventories are stated at the lower of cost or net realizable value and include raw materials, supplies, direct labor and manufacturing overhead. Cost is determined using the first-in, first-out (“FIFO”) method for valuing inventories at majority of our domestic operations. Our foreign subsidiaries and some domestic operations use either the FIFO or the weighted average cost method to value inventory. Foreign inventories represent approximately 10 % and 12 % of total inventories as of March 31, 2022 and 2021, respectively.
Reserves are provided for slow-moving or excess and obsolete inventory based on the difference between the cost of the inventory and its net realizable value and by reviewing quantities on hand in comparison with historical and expected future usage. In estimating the reserve for excess or slow-moving inventory, management considers factors such as product aging, current and future customer demand and market conditions.
49
Property, Plant and Equipment – Property, plant and equipment are stated at cost and depreciated using the straight-line method over the estimated useful lives of the individual assets. When property, plant and equipment are retired or otherwise disposed of, the related cost and accumulated depreciation are removed from the accounts, and the resulting gain or loss is included in income from operations for the period. Generally, the estimated useful lives of assets are:
| Land improvements | to | ||||||||||
| Buildings and improvements | to | ||||||||||
| Plant, office and lab equipment | to | ||||||||||
We review property, plant and equipment for impairment whenever events or changes in circumstances indicate the carrying amount of an asset may not be recoverable.
50
date. Where available, fair value is based on observable market prices or parameters or derived from such prices or parameters. Where observable prices or inputs are not available, valuation models may be applied.
Assets and liabilities recorded at fair value in our consolidated balance sheets are categorized based upon the level of judgment associated with the inputs used to measure their fair values. Hierarchical levels, as defined by Accounting Standards Codification (“ASC”) 820, “Fair Value Measurements and Disclosures,” are directly related to the amount of subjectivity associated with the inputs to fair valuation of these assets and liabilities. An asset or a liability’s categorization within the fair value hierarchy is based on the lowest level of significant input to its valuation. Hierarchical levels are as follows:
Level I – Inputs are unadjusted, quoted prices in active markets for identical assets or liabilities at the measurement date.
Level II – Inputs (other than quoted prices included in Level I) are either directly or indirectly observable for the asset or liability through correlation with market data at the measurement date and for the duration of the instrument’s anticipated life.
Level III – Inputs reflect management’s best estimate of what market participants would use in pricing the asset or liability at the measurement date. Consideration is given to the risk inherent in the valuation technique and the risk inherent in the inputs to the model.
Derivative Instruments and Hedge Accounting – We do not use derivative instruments for trading or speculative purposes. We enter into interest rate swap agreements for the purpose of hedging our cash flow exposure to floating interest rates on certain portions of our debt. All derivative instruments are recognized on the balance sheet at their fair values. Changes in the fair value of a designated interest rate swap are recorded in other comprehensive loss until earnings are affected by the underlying hedged item. Any ineffective portion of the gain or loss is immediately recognized in earnings. Upon settlement, realized gains and losses are recognized in interest expense in the consolidated statements of operations.
We discontinue hedge accounting when (1) we deem the hedge to be ineffective and determine that the designation of the derivative as a hedging instrument is no longer appropriate; (2) the derivative matures, terminates or is sold; or (3) occurrence of the contracted or committed transaction is no longer probable or will not occur in the originally expected period. When hedge accounting is discontinued and the derivative remains outstanding, we carry the derivative at its estimated fair value on the balance sheet, recognizing changes in the fair value in current period earnings. If a cash flow hedge becomes ineffective, any deferred gains or losses remain in accumulated other comprehensive loss until the underlying hedged item is recognized. If
51
it becomes probable that a hedged forecasted transaction will not occur, deferred gains or losses on the hedging instrument are recognized in earnings immediately.
We are exposed to risk from credit-related losses resulting from nonperformance by counterparties to our financial instruments. We perform credit evaluations of our counterparties under forward exchange contracts and interest rate swap agreements and expect all counterparties to meet their obligations. If necessary, we adjust the values of our derivative contracts for our or our counterparties’ credit risk.
Pension Obligations – Determination of pension benefit obligations is based on estimates made by management in consultation with independent actuaries. Inherent in these valuations are assumptions including discount rates, expected rates of return on plan assets, retirement rates, mortality rates and rates of compensation increase and other factors, all of which are reviewed annually and updated if necessary. Current market conditions, including changes in rates of return, interest rates and medical inflation rates, are considered in selecting these assumptions.
Actuarial gains and losses and prior service costs are recognized in accumulated other comprehensive loss as they arise, and we amortize these costs into net pension expense over the remaining expected service period.
We used a measurement date of March 31 for all periods presented.
Revenue Recognition – We recognize revenues to depict the transfer of control of promised goods or services to our customers in an amount that reflects the consideration to which we expect to be entitled in exchange for those goods or services. Refer to Note 20 for further discussion. We recognize revenue when all of the following criteria have been met: (i) a contract with a customer exists, (ii) performance obligations have been identified, (iii) the price to the customer has been determined, (iv) the price to the customer has been allocated to the performance obligations, and (v) performance obligations are satisfied, which are more fully described below.
(i) We identify a contract with a customer when a sales agreement indicates approval and commitment of the parties; identifies the rights of the parties; identifies the payment terms; has commercial substance; and it is probable that we will collect the consideration to which we will be entitled in exchange for the goods or services that will be transferred to the customer. In most instances, our contract with a customer is the customer's purchase order. For certain customers, we may also enter into a sales agreement that outlines a framework of terms and conditions that apply to all future purchase orders for that customer. In these situations, our contract with the customer is both the sales agreement and the specific customer purchase order. Because our contract with a customer is typically for a single transaction or customer purchase order, the duration of the contract is one year or less. As a result, we have elected to apply certain practical expedients and, as permitted by the Financial Accounting Standards Board ("FASB"), omit certain disclosures of remaining performance obligations for contracts that have an initial term of one year or less.
52
(ii) We identify performance obligations in a contract for each promised good or service that is separately identifiable from other promises in the contract and for which the customer can benefit from the good or service either on its own or together with other resources that are readily available to the customer. Goods and services provided to our customers that are deemed immaterial are included with other performance obligations.
(iii) We determine the transaction price as the amount of consideration we expect to be entitled to in exchange for fulfilling the performance obligations, including the effects of any variable consideration.
(iv) For any contracts that have more than one performance obligation, we allocate the transaction price to each performance obligation in an amount that depicts the amount of consideration to which we expect to be entitled in exchange for satisfying each performance obligation. We have excluded disclosure of the transaction price allocated to remaining performance obligations if the performance obligation is part of a contract that has an original expected duration of one year or less as the majority of our contracts are short-term in nature with a term of one year or less.
(v) We recognize revenue when, or as, we satisfy the performance obligation in a contract by transferring control of a promised good or service to the customer.
Income Taxes, Deferred Taxes, Tax Valuation Allowances and Tax Reserves – We apply the liability method in accounting and reporting for income taxes. Under the liability approach, deferred tax assets and liabilities are determined based upon the difference between the financial statement carrying amounts and the tax basis of assets and liabilities that will result in taxable or deductible amounts in the future based on enacted tax rates expected to be in effect when these differences are expected to reverse. The effect on deferred tax assets and liabilities resulting from a change in tax rates is recognized in the period that includes the enactment date. The deferred income tax assets are adjusted by a valuation allowance, if necessary, to recognize future tax benefits only to the extent, based on available evidence, that it is more likely than not to be realized. This analysis is performed on a jurisdictional basis and reflects our ability to utilize these deferred tax assets through a review of past, current and estimated future taxable income in addition to the establishment of viable tax strategies that will result in the utilization of the deferred assets.
We recognize income tax related interest and penalties, if any, as a component of income tax expense.
53
Foreign Currency Translation – Assets and liabilities of our foreign subsidiaries are translated to U.S. dollars at exchange rates prevailing at the balance sheet date, while income and expenses are translated at average rates for each month. Translation gains and losses are reported as a component of accumulated other comprehensive loss. Transactional currency gains and losses arising from transactions in currencies other than our sites’ functional currencies are included in our consolidated statements of operations.
Transaction and translation gains and losses arising from intercompany balances are reported as a component of accumulated other comprehensive loss when the underlying transaction stems from a long-term equity investment or from debt designated as not due in the foreseeable future. Otherwise, we recognize transaction gains and losses arising from intercompany transactions as a component of income.
Segments - We conduct our operations through three business segments based on how we manage the business. Our Chief Executive Officer views our business, assesses performance and allocates resources using financial information generated and reported at the reportable segment level. We evaluate segment performance and allocate resources based on each reportable segment's operating income. Our reportable segments are as follows:
1.Contractor Solutions, which manufactures efficiency and performance enhancing products predominantly for residential and commercial HVAC/R and plumbing applications, which are designed primarily for professional end-use customers. This segment is comprised primarily of our RectorSeal, TRUaire and Shoemaker operating companies.
2.Engineered Building Solutions, which provides primarily code-driven products focused on life safety that are engineered to provide aesthetically-pleasing solutions for the construction, refurbishment and modernization of commercial, institutional, and multi-family residential buildings. This segment is comprised primarily of our Balco, Greco and Smoke Guard operating companies.
3.Specialized Reliability Solutions, which provides products for increasing the reliability, performance and lifespan of industrial assets and solving equipment maintenance challenges. This segment is comprised primarily of our Whitmore operating company and the Whitmore JV.
Intersegment sales and transfers are recorded at cost plus a profit margin, with the revenues and related margin on such sales eliminated in consolidation. We do not allocate share-based compensation expense, interest expense, interest income or other income, net to our segments. Our corporate headquarters does not constitute a separate segment. The Eliminations and
54
Accounting Developments
Pronouncements Implemented
In December 2019, the FASB issued ASU No. 2019-12, "Income Taxes: Simplifying the Accounting for Income Taxes." This update simplifies the accounting for income taxes by removing certain exceptions and adding some requirements regarding franchise (or similar) tax, step-ups in a business combination, treatment of entities not subject to tax and when to apply enacted changes in tax laws. This ASU is effective for fiscal years beginning after December 15, 2020 and interim periods within those fiscal years. The amendments related to changes in ownership of foreign equity method investments or foreign subsidiaries should be applied on a modified retrospective basis through a cumulative-effect adjustment to retained earnings as of the beginning of the fiscal year of adoption. The amendments related to franchise taxes that are partially based on income should be applied on either a retrospective basis for all periods presented or a modified retrospective basis through a cumulative-effect adjustment to retained earnings as of the beginning of the fiscal year of adoption. All other amendments should be applied on a prospective basis. Early adoption is permitted. Our adoption of ASU No. 2019-12 effective April 1, 2021 did not have a material impact on our condensed consolidated financial conditions and results of operations.
Pronouncements not yet implemented
In October 2021, the FASB issued ASU No. 2021-08, "Accounting for Contract Assets and Contract Liabilities from Contracts with Customers." This update improves comparability for both the recognition and measurement of acquired customer revenue contracts at the date of and after a business combination. The amendments are effective for fiscal years beginning after December 15, 2022, including interim periods within those fiscal years and should be applied prospectively to business combinations occurring on or after the effective date of the amendments. The adoption is not expected to have a significant impact on our consolidated financial condition and results of operations.
In March 2020, the FASB issued ASU 2020-04, "Reference Rate Reform (Topic 848) Facilitation of the Effects of Reference Rate Reform on Financial Reporting." This update provides temporary optional expedients and exceptions to existing guidance on applying contract modifications and hedge accounting to facilitate the market transition from existing reference rates, such as the London Interbank Offered Rate ("LIBOR"), which is scheduled to be phased out in June 2023, to alternate rates such as the Secured Overnight Financing Rate ("SOFR"). This ASU was effective upon issuance and can be applied prospectively through December 31, 2022. The adoption is not expected to have a significant impact on our consolidated financial condition and results of operations.
55
2. ACQUISITIONS
Shoemaker Manufacturing, LLC
On December 15, 2021, we acquired 100 % of outstanding equity of Shoemaker Manufacturing, LLC (“Shoemaker”), based in Cle Elum, Washington, for an aggregate purchase price of $43.5 million, including working capital and closing cash adjustments and expected contingent consideration. Shoemaker offers high-quality customizable GRD for commercial and residential markets, and expands CSWI’s HVAC/R product offering and regional exposure in the northwest U.S. The aggregate purchase price was comprised of cash consideration of $38.5 million (including $1.2 million cash acquired), 25,483 shares of the Company's common stock valued at $3.0 million at transaction close and additional contingent consideration of up to $2.0 million based on Shoemaker meeting a defined financial target during the quarter ended March 31, 2022, which was achieved. The cash consideration was funded with cash on hand and borrowings under our existing Revolving Credit Facility. The 25,483 shares of common stock delivered to the sellers as consideration were issued from treasury shares. As of the acquisition date, the estimated fair value of the contingent consideration obligation was classified as a current liability of $2.0 million and was determined using a scenario-based analysis on forecasted future results. In May 2022, the full earn-out amount of $2.0 million was remitted to the sellers due to the performance obligation had been met. During the year ended March 31, 2022, we incurred $0.7 million in transaction expenses in connection with the Shoemaker acquisition, which were included in selling, general and administrative expenses in the Consolidated Statement of Operations under the Contractor Solution segment.
The Shoemaker acquisition was accounted for as a business combination under FASB Accounting Standards Codification Topic 805, Business Combinations ("Topic 805"). The excess of the purchase price over the preliminary fair value of the identifiable assets acquired was $8.1 million allocated to goodwill, which represents the value expected to be obtained from owning a more extensive GRD product portfolio for the HVAC/R market and increased regional exposure to the northwest U.S. The preliminary allocation of the fair value of the net assets acquired included customer lists ($23.0 million), trademarks ($6.5 million), noncompete agreements ($0.7 million), backlog ($0.3 million), inventory ($3.6 million), accounts receivable ($1.7 million), cash ($1.2 million), equipment ($1.4 million) and prepaid expenses ($0.2 million), net of current liabilities ($3.2 million). Customer lists, noncompete agreements and backlog are being amortized over 15 years, 5 years and 1 month, respectively, while trademarks and goodwill are not being amortized. The Company's evaluation of the facts and circumstances available of December 15, 2021, to assign fair values to assets acquired and liabilities assumed is ongoing. We expect to finalize the purchase price allocation as soon as practicable, but no later than one year from the acquisition date. Goodwill and all intangible assets, including customer lists, trademarks, noncompete agreements and backlog are deductible and amortized over 15 years for income tax purposes. Shoemaker activity has been included in our Contractor Solutions segment since the acquisition date. No proforma information has been provided due to immateriality.
T.A. Industries
On December 15, 2020, we acquired 100 % of the outstanding equity of T.A. Industries, Inc. (“TRUaire”), a leading manufacturer of grilles, registers, and diffusers for the residential and commercial HVAC/R end market, based in Santa Fe Springs, California. The acquisition also included TRUaire’s wholly-owned manufacturing facility based in Vietnam. The acquisition extended the Company’s product offerings to the HVAC market and provided strategic distribution facilities.
The contractual consideration paid for TRUaire included cash of $288.0 million (after working capital and closing cash adjustments) and 849,852 shares of the Company’s common stock valued at $97.7 million at transaction close based on the closing market price of the Company's common shares on the acquisition date. The cash consideration was funded through a combination of cash on hand and borrowings under our Revolving Credit Facility. The 849,852 shares of common stock delivered to the sellers as consideration were reissued from treasury shares.
Acquisition Consideration (Amounts in thousands, except for shares) | |||||
| Cash (a) | $ | ||||
Common stock ( | |||||
| Total consideration transferred | $ | ||||
(a) Amount includes working capital and closing cash adjustments, and includes a $1.0 million to be paid to the sellers as a result of an expected tax refund pursuant to the purchase agreement.
56
The TRUaire acquisition was accounted for as a business combination under FASB Accounting Standards Codification Topic 805, Business Combinations ("Topic 805"). Pursuant to Topic 805, the Company allocated the TRUaire purchase price to tangible and identifiable intangible assets acquired and liabilities assumed based on their estimated fair values as of the acquisition date, December 15, 2020. The excess of the purchase price over those fair values was recorded to goodwill. The Company completed the analysis of tangible assets, intangible assets, liabilities assumed and the related allocation during the three months ended December 31, 2021. The following table summarizes the Company's best initial estimate of the aggregate fair value of the assets acquired and liabilities assumed at the date of acquisition (in thousands).
| Initial Estimated Fair Value | Measurement Period Adjustments | Updated Estimated Fair Value | ||||||||||||||||||
| Cash | $ | $ | — | $ | ||||||||||||||||
| Accounts Receivable, net | ( | |||||||||||||||||||
| Inventory | ( | |||||||||||||||||||
| Short-Term Tax Indemnity Assets | — | |||||||||||||||||||
| Other Current Assets | ||||||||||||||||||||
| Property, Plant and Equipment | ( | |||||||||||||||||||
| Trade Name (indefinite life) | — | |||||||||||||||||||
Customer Lists (useful life of | ||||||||||||||||||||
| Right-Of-Use Assets | — | |||||||||||||||||||
| Long-Term Tax Indemnity Assets | — | |||||||||||||||||||
| Other Long-term Assets | ( | |||||||||||||||||||
| Accounts Payable | ( | — | ( | |||||||||||||||||
| Accrued and Other Current Liabilities | ( | ( | ( | |||||||||||||||||
| Lease Liabilities - Short-Term | ( | — | ( | |||||||||||||||||
| Deferred Tax Liabilities (a) | ( | ( | ( | |||||||||||||||||
| Tax Contingency Reserve | ( | ( | ||||||||||||||||||
| Lease Liabilities - Long-Term | ( | — | ( | |||||||||||||||||
| Estimated fair value of net assets acquired | ||||||||||||||||||||
Goodwill (a) | ( | |||||||||||||||||||
| Total Purchase Price | $ | $ | ( | $ | ||||||||||||||||
(a) Reflects an immaterial adjustment of $1.8
Deferred tax liabilities were established to record the deferred tax impact of purchase price accounting adjustments, primarily related to intangibles assets. Tax contingency reserves relate to uncertain tax positions TRUaire took in the periods prior to the acquisition date.
In accordance with the tax indemnification included in the purchase agreement of TRUaire, the seller provided contractual indemnification to the Company for up to $12.5 million related to uncertain tax positions taken in prior years. The outcome of this arrangement will either be settled or expire by 2023. During the three months ended March 31, 2021, TRUaire received an audit closing letter from Internal Revenue Service related to calendar 2017, a pre-acquisition tax year. As a result of this, $5.0 million of the relevant tax indemnification was released in accordance with the purchase agreement. The release of the relevant uncertain tax position accrual of $5.3 million was recorded as an income tax benefit for the three months ended March 31, 2021, and the offsetting indemnification expense of $5.0 million was recorded in other expense on the consolidated statement of operations. As of March 31, 2022, approximately $7.5 million of the indemnification assets remained outstanding.
57
Goodwill of $123.5 million represents the excess of the purchase price over the fair value of the underlying tangible and intangible assets acquired and liabilities assumed. The acquisition goodwill represents the value expected to be obtained from expanding the Company’s product offerings more broadly across the HVAC end market. The goodwill recorded as part of this acquisition is included in the Contractor Solutions segment. The goodwill associated with the acquisition will not be amortized for financial reporting purposes and will not be deductible for income tax purposes.
TRUaire activity has been included in our Contractor Solutions segment since the acquisition date. During the years ended March 31, 2022 and March 31, 2021, the Company incurred and paid $0 and $7.8 million transaction expenses in connection with the TRUaire acquisition. Effective April 1, 2022, TRUaire was fully integrated with RectorSeal, the primary operating company of the Contractor Solutions segment.
Pursuant to Topic 805, unaudited supplemental proforma results of operations for the year ended March 31, 2021 and 2020, as if the acquisition of TRUaire had occurred on April 1, 2019 are presented below (in thousands, except per share amounts):
| Year Ended March 31, | ||||||||
| 2021 | 2020 | |||||||
| Revenue, net | $ | $ | ||||||
| Net income | ||||||||
| Net earnings per common share: | ||||||||
| Diluted | $ | $ | ||||||
| Basic | ||||||||
These proforma results do not present financial results that would have been realized had the acquisition occurred on April 1, 2019, nor are they intended to be a projection of future results. The unaudited proforma results include certain proforma adjustments to net income that were directly attributable to the acquisition, as if the acquisition had occurred on April 1, 2019, including the following:
•Transactions expenses of $0 and $7.8 million for the years ended March 31, 2021 and 2020, respectively, that would have been recognized by the Company related to the TRUaire acquisition;
•Additional depreciation expense of $0.4 million and $0.5 million for the years ended March 31, 2021 and 2020, respectively, that would have been recognized as a result of the fair value step-up of the property, plant and equipment;
•Additional amortization expense of $0 and $7.9 million for the years ended March 31, 2021 and 2020, respectively, that would have been recognized as a result of the fair value step-up of the inventory;
•Additional amortization expense of $9.6 million and $13.5 million for the years ended March 31, 2021 and 2020, respectively, that would have been recognized as a result of the allocation of purchase consideration to customer lists subject to amortization;
•Estimated additional interest expense of $3.3 million and $4.6 million for the years ended March 31, 2021 and 2020, respectively, as a result of incurring additional borrowing;
•Income tax effect of the proforma adjustments calculated using a blended statutory income tax rate of 24.5 3.2 million and $8.4 million for the years ended March 31, 2021 and 2020, respectively.
58
Petersen Metals
On April 2, 2019, we acquired the assets of Petersen Metals, Inc. (“Petersen”), based near Tampa, Florida, for $11.8 million, of which $11.5 million was paid at closing and funded through our Revolving Credit Facility, and the remaining $0.3 million represented a working capital adjustment paid in July 2019. Petersen is a leading designer, manufacturer and installer of architecturally-specified, engineered metal products and railings, including aluminum and stainless steel railings products for interior and exterior applications. The excess of the purchase price over the fair value of the identifiable assets acquired was $6.1 million allocated to goodwill, which will be deductible for income tax purposes. Goodwill represents the value expected to be obtained from enabling geographic, end market and product diversification and expansion as Petersen is a strategic complement to our existing line of architecturally-specified building products. The allocation of the fair value of the net assets acquired included customer lists of $3.2 million and backlog of $0.4 million, as well as accounts receivable, inventory and equipment of $2.2 million, $0.8 million and $0.7 million, respectively, net of current liabilities of $1.5 million. Customer lists are being amortized over 15 years, backlog is amortized over 1.5 years and goodwill is not being amortized. Petersen activity has been included in our Engineered Building Solutions segment since the acquisition date. No proforma information has been provided due to immateriality.
3. CONSOLIDATION OF VARIABLE INTEREST ENTITY AND REDEEMABLE NONCONTROLLING INTEREST
Whitmore Joint Venture
On April 1, 2021, Whitmore Manufacturing, LLC (“Whitmore”), a wholly-owned subsidiary of CSWI, completed the formation of a joint venture (the "Whitmore JV") with Pennzoil-Quaker State Company dba SOPUS Products (“Shell”), a wholly-owned subsidiary of Shell Oil Company that comprises Shell’s U.S. lubricants business. The formation was consummated through a transaction in which Whitmore sold to Shell a 50 % interest in a wholly-owned subsidiary (containing certain existing operating assets) in exchange for consideration of $13.4 million from Shell in the form of cash ($5.3 million) and intangible assets ($8.1 million). The Whitmore JV has been consolidated into the operations of the Company and its activity has been included in our Specialized Reliability Solutions segment since the formation date.
The Whitmore JV is deemed to be a VIE as the equity investors at risk, as a group, lack the characteristics of a controlling financial interest. The major factor that led to the conclusion that the Company is the primary beneficiary of this VIE is that Whitmore has the power to direct the manufacturing activities, which are considered the most significant activities for the Whitmore JV. Whitmore JV's total net assets are presented below (in thousands):
| March 31, 2022 | |||||
| Cash | $ | ||||
| Accounts receivable, net | |||||
| Inventories, net | |||||
| Prepaid expenses and other current assets | |||||
| Property, plant and equipment, net | |||||
| Intangible assets, net | |||||
| Other assets | |||||
| Total assets | $ | ||||
| Accounts payable | $ | ||||
| Accrued and other current liabilities | |||||
| Other long-term liabilities | |||||
| Total liabilities | $ | ||||
For the year ended March 31, 2022, the Whitmore JV generated net income of $1.9 million.
59
The Whitmore JV's LLC Agreement contains a put option that gives either member the right to sell its 50 % equity interest in the Whitmore JV to the other member at a dollar amount equivalent to 90 % of the initiating member's equity interest determined based on the fair market value of the Whitmore JV's net assets. This put option can be exercised, at either member's discretion, by providing written notice to the other member after three years from the Whitmore JV's formation, subject to certain timing restrictions. This redeemable noncontrolling interest is recorded at the higher of the redemption value or carrying value each reporting period. Changes in redeemable noncontrolling interest for the year ended March 31, 2022 were as follows (in thousands):
| Balance at March 31, 2021 | $ | ||||
| Fair value of redeemable noncontrolling interest at formation-date | |||||
| Net income attributable to redeemable noncontrolling interest | |||||
| Contributions from noncontrolling interest | |||||
| Adjustments to redemption value | |||||
| Balance at March 31, 2022 | $ | ||||
4. DISCONTINUED OPERATIONS
During the third quarter of the fiscal year ended March 31, 2018, we committed to a plan to divest our Strathmore Products business (the "Coatings business") to allow us to focus resources on our core growth platforms. Our former Coatings business manufactured specialized industrial coatings products including urethanes, epoxies, acrylics and alkyds. As a result, we reclassified the assets comprising that business to assets held-for-sale, and made a corresponding adjustment to our consolidated statements of operations to reflect discontinued operations for all periods presented. During the quarter ended September 30, 2018, we received an aggregate of $6.9 million for the sale of assets that related to our Coatings business in multiple transactions. This resulted in gains on disposal of $6.9 million due to write-downs of long-lived assets in prior periods. During the quarter ended March 31, 2020, we received $1.5 million for the sale of the last remaining real property owned by our former Coatings business. The sale resulted in proceeds and a gain on disposal of $1.5 million due to write-downs of long-lived assets in prior periods. The last remaining asset of the Coatings business is a long-term lease that expires in March 2027. We have not terminated the lease, but we have sub-let the property for the remainder of the lease term. As such, this lease has been moved back into continuing operations, effective March 31, 2020, and the related ROU assets and lease liabilities have been reported as continuing operations since March 31, 2020. The discontinued operations have had no activities since the year ended March 31, 2020.
The assets and liabilities of the Coatings business reside in a disregarded entity for tax purposes. Accordingly, the tax attributes associated with the operations of our Coatings business will ultimately flow through to the corporate parent, which files a consolidated federal return. Therefore, any corresponding tax assets or liabilities have been reflected as a component of our continuing operations. Discontinued operations reported no
| Year Ended March 31, | ||||||||||||||||||||
| 2022 | 2021 | 2020 | ||||||||||||||||||
| Revenues, net | $ | $ | $ | |||||||||||||||||
| Gain from discontinued operations before income taxes | ||||||||||||||||||||
| Income tax expense | ( | |||||||||||||||||||
| Gain from discontinued operations | $ | $ | $ | |||||||||||||||||
60
5. GOODWILL AND INTANGIBLE ASSETS
During the three months ended June 30, 2021, we revised our segment structure creating three reportable segments: Contractor Solutions, Engineered Building Solutions and Specialized Reliability Solutions. Refer to Note 1 and Note 21 for additional information on the Company's segment realignment. As part of our segment realignment, we changed our reporting units and reallocated existing goodwill to each of the new reportable segments and associated reporting units, based on management's estimate of the relative fair value of each reporting unit. The result of this reallocation of goodwill has been recast, by reportable segment, as of March 31, 2021.
In conjunction with the goodwill reallocation described above, during the three months ended June 30, 2021, we performed an impairment test of goodwill held by all reporting units as of March 31, 2021. Based on the results of the goodwill assessment, we determined that the fair values of each reporting unit exceeded its carrying value. As such, we concluded that there was no indication of goodwill impairment for all reporting units in connection with the segment changes.
The changes in the carrying amount of goodwill for the years ended March 31, 2022 and 2021 were as follows (in thousands):
| Contractor Solutions | Engineered Building Solutions | Specialized Reliability Solutions | Total | |||||||||||||||||||||||
| Balance at April 1, 2020 | $ | $ | $ | $ | ||||||||||||||||||||||
| TRUaire acquisition | ||||||||||||||||||||||||||
| Currency translation | ||||||||||||||||||||||||||
| Balance at March 31, 2021 | $ | $ | $ | $ | ||||||||||||||||||||||
| Goodwill re-allocation | ( | |||||||||||||||||||||||||
| TRUaire acquisition | ( | ( | ||||||||||||||||||||||||
| Shoemaker acquisition | ||||||||||||||||||||||||||
| Currency translation | ( | ( | ( | |||||||||||||||||||||||
| Balance at March 31, 2022 | $ | $ | $ | $ | ||||||||||||||||||||||
The following table provides information about our intangible assets for the years ended March 31, 2022 and 2021 (in thousands, except years):
| March 31, 2022 | March 31, 2021 | |||||||||||||||||||||||||||||||
| Wtd Avg Life (Years) | Ending Gross Amount | Accumulated Amortization | Ending Gross Amount | Accumulated Amortization | ||||||||||||||||||||||||||||
| Finite-lived intangible assets: | ||||||||||||||||||||||||||||||||
| Patents | $ | $ | ( | $ | $ | ( | ||||||||||||||||||||||||||
| Customer lists and amortized trademarks | ( | ( | ||||||||||||||||||||||||||||||
| Non-compete agreements | ( | ( | ||||||||||||||||||||||||||||||
| Other | ( | ( | ||||||||||||||||||||||||||||||
| $ | $ | ( | $ | $ | ( | |||||||||||||||||||||||||||
| Trade names and trademarks not being amortized: | $ | $ | — | $ | $ | — | ||||||||||||||||||||||||||
61
Amortization expense for the years ended March 31, 2022, 2021 and 2020 was $24.8 million (including the amortization of inventory purchase accounting adjustment of $3.9 million), $10.5 million and $6.7 million, respectively. The following table presents the estimated future amortization of finite-lived intangible assets for the next five fiscal years ending March 31 (in thousands):
| 2023 | $ | |||||||
| 2024 | ||||||||
| 2025 | ||||||||
| 2026 | ||||||||
| 2027 | ||||||||
| Thereafter | ||||||||
| Total | $ | |||||||
6. SHARE-BASED COMPENSATION
We maintain the shareholder-approved 2015 Equity and Incentive Compensation Plan (the “2015 Plan”), which provides for the issuance of up to 1,230,000 shares of CSWI common stock through the grant of stock options, stock appreciation rights, restricted shares, restricted stock units, performance shares, performance units or other share-based awards, to employees, officers and non-employee directors. As of March 31, 2022, 512,782 shares were available for issuance under the 2015 Plan.
We recorded share-based compensation expense for restricted stock as follows for the years ended March 31, 2022, 2021 and 2020 (in thousands):
| Year Ended March 31, | ||||||||||||||||||||
| 2022 | 2021 | 2020 | ||||||||||||||||||
| Share-based compensation expense | $ | $ | $ | |||||||||||||||||
| Related income tax benefit | ( | ( | ( | |||||||||||||||||
| Net share-based compensation expense | $ | $ | $ | |||||||||||||||||
Stock option activity, which represents outstanding CSWI awards resulting from the conversion of Capital Southwest stock options held by former Capital Southwest employees, was as follows:
| Year Ended March 31, 2022 | ||||||||||||||||||||||||||
| Number of Shares | Weighted Average Exercise Price | Remaining Contractual Life (Years) | Aggregate Intrinsic Value (in Millions) | |||||||||||||||||||||||
| Outstanding at April 1, 2021 | $ | |||||||||||||||||||||||||
| Exercised | ( | |||||||||||||||||||||||||
| Outstanding at March 31, 2022 (a) | $ | $ | ||||||||||||||||||||||||
| Exercisable at March 31, 2022 (a) | $ | $ | ||||||||||||||||||||||||
(a) All remaining awards outstanding and exercisable at March 31, 2022 are held by employees of CSWI.
62
| Year Ended March 31, 2021 | ||||||||||||||||||||||||||
| Number of Shares | Weighted Average Exercise Price | Remaining Contractual Life (Years) | Aggregate Intrinsic Value (in Millions) | |||||||||||||||||||||||
| Outstanding at April 1, 2020 | $ | |||||||||||||||||||||||||
| Exercised | ( | |||||||||||||||||||||||||
| Outstanding at March 31, 2021 | $ | $ | ||||||||||||||||||||||||
| Exercisable at March 31, 2021 | $ | $ | ||||||||||||||||||||||||
Restricted stock activity was as follows:
| Year Ended March 31, 2022 | ||||||||||||||
| Number of Shares | Weighted Average Grant Date Fair Value | |||||||||||||
| Outstanding at April 1, 2021 | $ | |||||||||||||
| Granted | ||||||||||||||
| Vested | ( | |||||||||||||
| Canceled | ( | |||||||||||||
| Outstanding at March 31, 2022 | $ | |||||||||||||
During the three months ended June 30, 2021, Joe Armes, the Company's Chairman, Chief Executive Officer and President, was awarded special long-term incentive awards with the purpose of retaining him through retirement and promoting successful succession planning and transition practices. Mr. Armes' awards include 31,496 shares of restricted stock, 27,559 performance shares and 19,685 performance restricted stock units. All awards granted to Mr. Armes are included in the above restricted share activity.
During the restriction period, the holders of restricted shares are entitled to vote and receive dividends. Unvested restricted shares outstanding as of March 31, 2022 and 2021 included 102,360 and 82,728 shares (at target), respectively, with performance-based vesting provisions, having vesting ranges from 0 -200 % based on pre-defined performance targets with market conditions. Performance-based awards accrue dividend equivalents, which are settled upon (and to the extent of) vesting of the underlying award, and do not have the right to vote until vested. Performance-based awards are earned upon the achievement of objective performance targets and are payable in common shares. Compensation expense is calculated based on the fair market value as determined by a Monte Carlo simulation and is recognized over a 36 -month cliff vesting period. We granted 47,845 and 34,245 awards with performance-based vesting provisions during the years ended March 31, 2022 and 2021, respectively, with a vesting range of 0 -200 %.
At March 31, 2022, we had unrecognized compensation cost related to unvested restricted shares of $20.1 million, which will be amortized into net income over the remaining weighted average vesting period of 3.4 years. The total fair value of restricted shares vested during the years ended March 31, 2022 and 2021 was $14.2 million and $8.5 million, respectively.
63
7. INVENTORY
Inventories are stated at the lower of cost or net realizable value. In connection with the integration of TRUaire and the Whitmore JV, the Company voluntarily changed its method of accounting for certain domestic inventory previously valued by the LIFO method to the FIFO method during the fourth quarter of fiscal 2022. The cumulative effect of this change on periods presented prior to fiscal 2020 resulted in an increase in Retained earnings of $3.8 million at March 31, 2019. The FIFO method of accounting for inventory is preferable because it improves the Company's comparability with the industry peers, the majority of which use the FIFO method as the primary inventory valuation method, conforms the Company's entire inventory to a single method of accounting and aligns the inventory cost flow assumption with the physical flow of goods.
The Inventories, net caption in the Consolidated Balance Sheet is comprised of the following components:
| March 31, | ||||||||||||||
| 2022 | 2021* | |||||||||||||
| Raw materials and supplies | $ | $ | ||||||||||||
| Work in process | ||||||||||||||
| Finished goods | ||||||||||||||
| Total inventories | ||||||||||||||
| Less: Obsolescence reserve | ( | ( | ||||||||||||
| Inventories, net | $ | $ | ||||||||||||
*Year ended March 31, 2021 amounts have been revised to reflect the change in inventory accounting method, as described above and in Note 1 to the consolidated financial statements.
As a result of the retrospective application of this change in accounting method, the following financial statement line items within the accompanying financial statements were adjusted, as follows:
| Fiscal Year Ended March 31, 2022 | ||||||||||||||||||||
| (in thousands, except for per share amounts) | As Computed Under LIFO | As Reported Under FIFO | Effect of Change | |||||||||||||||||
| Consolidated Statement of Operations | ||||||||||||||||||||
| Cost of sales | $ | $ | $ | ( | ||||||||||||||||
| Income before income taxes | ||||||||||||||||||||
| Income tax expense | ||||||||||||||||||||
| Net income | ||||||||||||||||||||
| Income attributable to redeemable noncontrolling interest | ( | ( | ||||||||||||||||||
| Net income attributable to CSW Industrials, Inc. | ||||||||||||||||||||
| Earnings per share attributable to CSW Industrials, Inc. | ||||||||||||||||||||
| Basic | $ | $ | $ | |||||||||||||||||
| Diluted | ||||||||||||||||||||
| Consolidated Statements of Comprehensive Income | ||||||||||||||||||||
| Net income | $ | $ | $ | |||||||||||||||||
| Comprehensive income attributable to redeemable noncontrolling interest | ( | ( | ||||||||||||||||||
| Total comprehensive income attributable to CSW Industrials, Inc. | ||||||||||||||||||||
64
| Fiscal Year Ended March 31, 2021 | ||||||||||||||||||||
| (in thousands, except for per share amounts) | As Previously Reported Under LIFO | As Reported Under FIFO | Effect of Change | |||||||||||||||||
| Consolidated Statement of Operations | ||||||||||||||||||||
| Cost of sales | $ | $ | $ | |||||||||||||||||
| Income before income taxes | ( | |||||||||||||||||||
| Income tax expense | ( | |||||||||||||||||||
| Net income | ( | |||||||||||||||||||
| Net income attributable to CSW Industrials, Inc. | ( | |||||||||||||||||||
| Earnings per share attributable to CSW Industrials, Inc. | ||||||||||||||||||||
| Basic | $ | $ | $ | ( | ||||||||||||||||
| Diluted | ( | |||||||||||||||||||
| Consolidated Statements of Comprehensive Income | ||||||||||||||||||||
| Net income | $ | $ | $ | ( | ||||||||||||||||
| Total comprehensive income attributable to CSW Industrials, Inc. | ( | |||||||||||||||||||
| Fiscal Year Ended March 31, 2020 | ||||||||||||||||||||
| (in thousands, except for per share amounts) | As Previously Reported Under LIFO | As Reported Under FIFO | Effect of Change | |||||||||||||||||
| Consolidated Statement of Operations | ||||||||||||||||||||
| Cost of sales | $ | $ | $ | |||||||||||||||||
| Income before income taxes | ( | |||||||||||||||||||
| Income tax expense | ( | |||||||||||||||||||
| Net income | ( | |||||||||||||||||||
| Net income attributable to CSW Industrials, Inc. | ( | |||||||||||||||||||
| Earnings per share attributable to CSW Industrials, Inc. | ||||||||||||||||||||
| Basic | $ | $ | $ | ( | ||||||||||||||||
| Diluted | ( | |||||||||||||||||||
| Consolidated Statements of Comprehensive Income | ||||||||||||||||||||
| Net income | $ | $ | $ | ( | ||||||||||||||||
| Total comprehensive income attributable to CSW Industrials, Inc. | ( | |||||||||||||||||||
65
| Fiscal Year Ended March 31, 2022 | ||||||||||||||||||||
| (in thousands, except for per share amounts) | As Computed Under LIFO | As Reported Under FIFO | Effect of Change | |||||||||||||||||
| Consolidated Balance Sheets | ||||||||||||||||||||
| Inventories, net | $ | $ | $ | |||||||||||||||||
| Deferred tax liabilities | ||||||||||||||||||||
| Redeemable noncontrolling interest | ( | |||||||||||||||||||
| Retained earnings | ||||||||||||||||||||
| Consolidated Statement of Cash Flows | ||||||||||||||||||||
| Net income | $ | $ | $ | |||||||||||||||||
| Deferred income taxes | ( | ( | ||||||||||||||||||
| Provision for inventory reserves | ( | |||||||||||||||||||
| Fiscal Year Ended March 31, 2021 | ||||||||||||||||||||
| (in thousands, except for per share amounts) | As Previously Reported Under LIFO | As Reported Under FIFO | Effect of Change | |||||||||||||||||
| Consolidated Balance Sheets | ||||||||||||||||||||
| Inventories, net | $ | $ | $ | |||||||||||||||||
| Deferred tax liabilities | ||||||||||||||||||||
| Retained earnings | ||||||||||||||||||||
| Consolidated Statement of Cash Flows | ||||||||||||||||||||
| Net income | $ | $ | $ | ( | ||||||||||||||||
| Deferred income taxes | ( | ( | ( | |||||||||||||||||
| Provision for inventory reserves | ||||||||||||||||||||
| Fiscal Year Ended March 31, 2020 | ||||||||||||||||||||
| (in thousands, except for per share amounts) | As Previously Reported Under LIFO | As Reported Under FIFO | Effect of Change | |||||||||||||||||
| Consolidated Balance Sheets | ||||||||||||||||||||
| Inventories, net | $ | $ | $ | |||||||||||||||||
| Deferred tax liabilities | ||||||||||||||||||||
| Retained earnings | ||||||||||||||||||||
| Consolidated Statement of Cash Flows | ||||||||||||||||||||
| Net income | $ | $ | $ | ( | ||||||||||||||||
| Deferred income taxes | ( | |||||||||||||||||||
| Provision for inventory reserves | ( | |||||||||||||||||||
As a result of the retrospective application of this change in accounting principle, the following financial statement line items within the unaudited quarterly condensed consolidated financial statements for fiscal 2022 and 2021 were adjusted, as follows:
66
| Three Months Ended | ||||||||||||||||||||||||||||||||||||||
| June 30, 2021 | June 30, 2020 | |||||||||||||||||||||||||||||||||||||
| (in thousands, except for per share amounts) | As Previously Reported Under LIFO | As Reported Under FIFO | Effect of Change | As Previously Reported Under LIFO | As Reported Under FIFO | Effect of Change | ||||||||||||||||||||||||||||||||
| Consolidated Statement of Operations | ||||||||||||||||||||||||||||||||||||||
| Cost of sales | $ | $ | $ | ( | $ | $ | $ | |||||||||||||||||||||||||||||||
| Income before income taxes | ( | |||||||||||||||||||||||||||||||||||||
| Income tax expense | ( | |||||||||||||||||||||||||||||||||||||
| Net income | ( | |||||||||||||||||||||||||||||||||||||
| Income attributable to redeemable noncontrolling interest | ( | ( | ||||||||||||||||||||||||||||||||||||
| Net income attributable to CSW Industrials, Inc. | ( | |||||||||||||||||||||||||||||||||||||
| Earnings per share attributable to CSW Industrials, Inc. | ||||||||||||||||||||||||||||||||||||||
| Basic | $ | $ | $ | $ | $ | $ | ||||||||||||||||||||||||||||||||
| Diluted | ( | |||||||||||||||||||||||||||||||||||||
| Three Months Ended | ||||||||||||||||||||||||||||||||||||||
| September 30, 2021 | September 30, 2020 | |||||||||||||||||||||||||||||||||||||
| (in thousands, except for per share amounts) | As Previously Reported Under LIFO | As Reported Under FIFO | Effect of Change | As Previously Reported Under LIFO | As Reported Under FIFO | Effect of Change | ||||||||||||||||||||||||||||||||
| Consolidated Statement of Operations | ||||||||||||||||||||||||||||||||||||||
| Cost of sales | $ | $ | $ | ( | $ | $ | $ | |||||||||||||||||||||||||||||||
| Income before income taxes | ( | |||||||||||||||||||||||||||||||||||||
| Income tax expense | ( | |||||||||||||||||||||||||||||||||||||
| Net income | ( | |||||||||||||||||||||||||||||||||||||
| Income attributable to redeemable noncontrolling interest | ( | ( | ||||||||||||||||||||||||||||||||||||
| Net income attributable to CSW Industrials, Inc. | ( | |||||||||||||||||||||||||||||||||||||
| Earnings per share attributable to CSW Industrials, Inc. | ||||||||||||||||||||||||||||||||||||||
| Basic | $ | $ | $ | $ | $ | $ | ( | |||||||||||||||||||||||||||||||
| Diluted | ( | |||||||||||||||||||||||||||||||||||||
67
| Three Months Ended | ||||||||||||||||||||||||||||||||||||||
| December 31, 2021 | December 31, 2020 | |||||||||||||||||||||||||||||||||||||
| (in thousands, except for per share amounts) | As Previously Reported Under LIFO | As Reported Under FIFO | Effect of Change | As Previously Reported Under LIFO | As Reported Under FIFO | Effect of Change | ||||||||||||||||||||||||||||||||
| Consolidated Statement of Income | ||||||||||||||||||||||||||||||||||||||
| Cost of sales | $ | $ | $ | ( | $ | $ | $ | |||||||||||||||||||||||||||||||
| Income before income taxes | ( | |||||||||||||||||||||||||||||||||||||
| Income tax expense | ( | |||||||||||||||||||||||||||||||||||||
| Net income | ( | |||||||||||||||||||||||||||||||||||||
| Income attributable to redeemable noncontrolling interest | ( | ( | ||||||||||||||||||||||||||||||||||||
| Net income attributable to CSW Industrials, Inc. | ( | |||||||||||||||||||||||||||||||||||||
| Earnings per share attributable to CSW Industrials, Inc. | ||||||||||||||||||||||||||||||||||||||
| Basic | $ | $ | $ | $ | $ | $ | ( | |||||||||||||||||||||||||||||||
| Diluted | ( | |||||||||||||||||||||||||||||||||||||
| Three Months Ended | ||||||||||||||||||||||||||||||||||||||
| March 31, 2022 | March 31, 2021 | |||||||||||||||||||||||||||||||||||||
| (in thousands, except for per share amounts) | As Computed Under LIFO | As Reported Under FIFO | Effect of Change | As Previously Reported Under LIFO | As Reported Under FIFO | Effect of Change | ||||||||||||||||||||||||||||||||
| Consolidated Statement of Income | ||||||||||||||||||||||||||||||||||||||
| Cost of sales | $ | $ | $ | ( | $ | $ | $ | ( | ||||||||||||||||||||||||||||||
| Income before income taxes | ||||||||||||||||||||||||||||||||||||||
| Income tax expense | ||||||||||||||||||||||||||||||||||||||
| Net income | ||||||||||||||||||||||||||||||||||||||
| Income attributable to redeemable noncontrolling interest | ( | ( | ||||||||||||||||||||||||||||||||||||
| Net income attributable to CSW Industrials, Inc. | ||||||||||||||||||||||||||||||||||||||
| Earnings per share attributable to CSW Industrials, Inc. | ||||||||||||||||||||||||||||||||||||||
| Basic | $ | $ | $ | $ | $ | $ | ||||||||||||||||||||||||||||||||
| Diluted | ||||||||||||||||||||||||||||||||||||||
68
8. DETAILS OF CERTAIN CONSOLIDATED BALANCE SHEET CAPTIONS
Accounts receivable, net consists of the following (in thousands):
| March 31, | ||||||||||||||
| 2022 | 2021 | |||||||||||||
| Accounts receivable trade | $ | $ | ||||||||||||
| Other receivables | ||||||||||||||
| Less: Allowance for doubtful accounts | ( | ( | ||||||||||||
| Accounts receivable, net | $ | $ | ||||||||||||
Property, plant and equipment, net, consist of the following (in thousands):
| March 31, | ||||||||||||||
| 2022 | 2021 | |||||||||||||
| Land and improvements | $ | $ | ||||||||||||
| Buildings and improvements | ||||||||||||||
| Plant, office and laboratory equipment | ||||||||||||||
| Construction in progress | ||||||||||||||
| Less: Accumulated depreciation | ( | ( | ||||||||||||
| Property, plant and equipment, net | $ | $ | ||||||||||||
Depreciation of property, plant and equipment was $11.6 million, $9.2 million and $7.9 million for the years ended March 31, 2022, 2021 and 2020, respectively. Of these amounts, cost of revenues includes $8.3 million, $7.1 million and $6.6 million, respectively.
Other assets consist of the following (in thousands):
| March 31, | ||||||||||||||
| 2022 | 2021 | |||||||||||||
| Right-of-use lease assets | $ | $ | ||||||||||||
| Property held for investment (a) | ||||||||||||||
| Deferred income taxes | ||||||||||||||
| Long-term tax indemnification assets | ||||||||||||||
| Other | ||||||||||||||
| Other assets | $ | $ | ||||||||||||
69
Accrued and other current liabilities consist of the following (in thousands):
| March 31, | ||||||||||||||
| 2022 | 2021 | |||||||||||||
| Compensation and related benefits | $ | $ | ||||||||||||
| Rebates and marketing agreements | ||||||||||||||
| Operating lease liabilities | ||||||||||||||
| Billings in excess of costs | ||||||||||||||
| Non-income taxes | ||||||||||||||
| Income taxes payable | ||||||||||||||
| Other accrued expenses | ||||||||||||||
| Accrued and other current liabilities | $ | $ | ||||||||||||
Other long-term liabilities consists of the following (in thousands):
| March 31, | ||||||||||||||
| 2022 | 2021* | |||||||||||||
| Operating lease liabilities | $ | $ | ||||||||||||
| Deferred income taxes | ||||||||||||||
| Tax Reserve | ||||||||||||||
| Other | ||||||||||||||
| Other long-term liabilities | $ | $ | ||||||||||||
*Years ended March 31, 2021 amounts have been adjusted to reflect the change in inventory accounting method, as described in Notes 1 and 7 to the Consolidated Financial Statements.
9. LONG-TERM DEBT AND COMMITMENTS
Debt consists of the following (in thousands):
| March 31, | ||||||||||||||
| 2022 | 2021 | |||||||||||||
Revolving Credit Facility, interest rate of | $ | $ | ||||||||||||
Whitmore term loan, interest rate of | ||||||||||||||
| Total debt | ||||||||||||||
| Less: Current portion | ( | ( | ||||||||||||
| Long-term debt | $ | $ | ||||||||||||
Revolving Credit Facility Agreement
On December 11, 2015, we entered into a five-year $250.0 million Revolving Credit Facility agreement (“Revolving Credit Facility”), with an additional $50.0 million accordion feature, with JPMorgan Chase Bank, N.A., as administrative agent, and the other lenders party thereto. The agreement was amended on September 15, 2017 to allow for multi-currency borrowing with a $125.0 million sublimit and to extend the maturity date to September 15, 2022. On December 1, 2020, the Company entered into an amendment to the Revolving Credit Facility to utilize the accordion feature, thus increasing the commitment from $250.0 million to $300.0 million, and hence eliminating the available incremental commitment by a corresponding amount. On March 10, 2021, the Revolving Credit Facility was amended to facilitate the formation and future operation of the joint venture discussed in Note 3.
On May 18, 2021, we entered into a Second Amended and Restated Credit Agreement (the “Second Credit Agreement”) with JPMorgan Chase Bank, N.A., as administrative agent and collateral agent, and the lenders, issuing banks and swingline lender party thereto. CSW Industrials Holdings, LLC, a wholly-owned subsidiary of the Company (the “Borrower”) is the borrower under the Second Credit Agreement. The Second Credit Agreement provides for a $400.0 million Revolving Credit Facility that contains a $25.0 million sublimit for the issuance of letters of credit and a $10.0 million sublimit for swingline loans. The Second Credit Agreement is scheduled to mature on May 18, 2026. Borrowings under the Second Credit
70
Agreement may be used for working capital and general corporate purposes, including, without limitation, for financing permitted acquisitions and fees and expenses incurred in connection therewith. The obligations of the Borrower under the Second Credit Agreement are guaranteed by the Company and all of its direct and indirect domestic subsidiaries. The Second Credit Agreement is secured by a first priority lien on all tangible and intangible assets and stock issued by the Borrower and its domestic subsidiaries, subject to specified exceptions, and 65 % of the voting equity interests in its first-tier foreign subsidiaries.
The financial covenants contained in the Second Credit Agreement require the maintenance of a maximum Leverage Ratio of 3.00 to 1.00, subject to a temporary increase to 3.75 to 1.00 for 18 months following the consummation of permitted acquisitions with consideration in excess of certain threshold amounts set forth in the Second Credit Agreement, and the maintenance of a minimum Fixed Charge Coverage Ratio of 1.25 to 1.00, the calculations and terms of which are defined in the Second Credit Agreement. The Second Credit Agreement also contains (i) affirmative and negative covenants which are customary for similar credit agreements, including, without limitation, limitations on the Company, the Borrower and its subsidiaries with respect to indebtedness, liens, investments, distributions, mergers and acquisitions, disposition of assets and transactions with affiliates, and (ii) customary events of default.
Borrowings under the Second Credit Agreement bear interest, at the Borrower’s option, at either base rate or LIBOR, plus, in either case, an applicable margin based on the Company’s leverage ratio calculated on a quarterly basis. The base rate is described in the Second Credit Agreement as the highest of (i) the Federal funds effective rate plus 0.50 %, (ii) the prime rate quoted by The Wall Street Journal, and (iii) the one-month LIBOR rate plus 1.00 %. We also pay a commitment fee of an applicable margin based on the Company's leverage ratio for the unutilized portion of the Revolving Credit Facility. Interest and commitment fees are payable at least quarterly and the outstanding principal balance is due at the maturity date.
As of March 31, 2022 and 2021, we had $243.0 million and $232.0 million, respectively, in outstanding borrowings under the Facility, which resulted in a borrowing capacity of $157.0 million and $68.0 million, respectively, inclusive of the accordion feature. Covenant compliance is tested quarterly and we were in compliance with all covenants as of March 31, 2022.
Whitmore Term Loan
As of March 31, 2022, Whitmore Manufacturing, LLC (one of our wholly-owned operating subsidiaries) maintained a secured term loan related to the warehouse, corporate office building and remodel of the existing manufacturing and R&D facility. The term loan matures on July 31, 2029, with payments of $140,000 due each quarter. Borrowings under the term loan bear interest at a variable annual rate equal to one-month LIBOR plus 2.0 %. As of March 31, 2022 and 2021, Whitmore had $9.8 million and $10.3 million, respectively, in outstanding borrowings under the term loan. Interest payments under the Whitmore term loan are hedged under an interest rate swap agreement as described in Note 11.
Future Minimum Debt Payments
Future minimum debt payments are as follows for years ending March 31 (in thousands):
| 2023 | $ | |||||||
| 2024 | ||||||||
| 2025 | ||||||||
| 2026 | ||||||||
| 2027 | ||||||||
| Thereafter | ||||||||
| Total | $ | |||||||
71
10. LEASES
We have operating leases for manufacturing facilities, offices, warehouses, vehicles and certain equipment. Our leases have remaining lease terms of 1 year to 26 years, some of which include escalation clauses and/or options to extend or terminate the leases.
In October 2019, we terminated two operating leases and paid an early lease termination fee of $0.5 million. The loss on early termination is recorded in other income (expense), net as the leased properties were not used in our operations.
We do not currently have any financing lease arrangements.
| (in thousands) | March 31, 2022 | March 31, 2021 | ||||||||||||
| Components of Operating Lease Expenses | ||||||||||||||
| Operating lease expense | $ | $ | ||||||||||||
| Short-term lease expense | ||||||||||||||
| Total operating lease expense (a) | $ | $ | ||||||||||||
| (a) Included in cost of revenues and selling, general and administrative expense | ||||||||||||||
| (in thousands) | March 31, 2022 | March 31, 2021 | ||||||||||||
| Operating Lease Assets and Liabilities | ||||||||||||||
| $ | $ | |||||||||||||
| $ | $ | |||||||||||||
| Total operating lease liabilities (b) | $ | $ | ||||||||||||
| (a) Included in other assets | ||||||||||||||
| (b) Included in accrued and other current liabilities and other long-term liabilities, as applicable | ||||||||||||||
| (in thousands) | March 31, 2022 | March 31, 2021 | ||||||||||||
| Supplemental Cash Flow | ||||||||||||||
| Cash paid for amounts included in the measurement of operating lease liabilities (a) | $ | $ | ||||||||||||
| ROU assets obtained in exchange for new operating lease obligations | ||||||||||||||
| (a) Included in our condensed consolidated statement of cash flows, operating activities in accounts payable and other current liabilities | ||||||||||||||
| Other Information for Operating Leases | ||||||||||||||
| Weighted average remaining lease term (in years) | ||||||||||||||
| Weighted average discount rate (percent) | % | % | ||||||||||||
72
| Maturities of operating lease liabilities were as follows (in thousands): | (in thousands) | ||||
| 2023 | $ | ||||
| 2024 | |||||
| 2025 | |||||
| 2026 | |||||
| 2027 | |||||
| Thereafter | |||||
| Total lease liabilities | $ | ||||
| Less: Imputed interest | ( | ||||
| Present value of lease liabilities | $ | ||||
11. DERIVATIVE INSTRUMENTS AND HEDGE ACCOUNTING
We enter into interest rate swap agreements to hedge exposure to floating interest rates on certain portions of our debt. As of March 31, 2022 and 2021, we had $9.8 million and $10.3 million, respectively, of notional amount in outstanding designated interest rate swaps with third parties. All interest rate swaps are highly effective. At March 31, 2022, the maximum remaining length of any interest rate swap contract in place was approximately 7.3 years.
The fair value of interest rate swaps designated as hedging instruments are summarized below (in thousands):
| March 31, | ||||||||||||||
| 2022 | 2021 | |||||||||||||
| Current derivative liabilities | $ | $ | ||||||||||||
| Non-current derivative liabilities | ||||||||||||||
The impact of changes in the fair value of interest rate swaps is included in Note 19.
73
12. EARNINGS PER SHARE
The following table sets forth the reconciliation of the numerator and the denominator of basic and diluted earnings per share for the years ended March 31, 2022, 2021 and 2020:
| March 31, | ||||||||||||||||||||
| (amounts in thousands, except per share data) | 2022 | 2021* | 2020* | |||||||||||||||||
| Income from continuing operations | $ | $ | $ | |||||||||||||||||
| Income from discontinued operations, net of tax | ||||||||||||||||||||
| Income attributable to redeemable noncontrolling interest | ( | |||||||||||||||||||
| Net income attributable to CSW Industrials, Inc. | $ | $ | $ | |||||||||||||||||
| Weighted average shares: | ||||||||||||||||||||
| Common stock | ||||||||||||||||||||
| Participating securities | ||||||||||||||||||||
| Denominator for basic earnings per common share | ||||||||||||||||||||
| Potentially dilutive securities | ||||||||||||||||||||
| Denominator for diluted earnings per common share | ||||||||||||||||||||
| Basic earnings per common share: | ||||||||||||||||||||
| Continuing operations | $ | $ | $ | |||||||||||||||||
| Discontinued operations | ||||||||||||||||||||
| Net income attributable to CSW Industrials, Inc. | $ | $ | $ | |||||||||||||||||
| Diluted earnings per common share: | ||||||||||||||||||||
| Continuing operations | $ | $ | $ | |||||||||||||||||
| Discontinued operations | ||||||||||||||||||||
| Net income attributable to CSW Industrials, Inc. | $ | $ | $ | |||||||||||||||||
*Years ended March 31, 2021 and 2020 amounts have been adjusted to reflect the change in inventory accounting method, as described in Notes 1 and 7 to the Consolidated Financial Statements.
13. SHAREHOLDERS' EQUITY
Share Repurchase Programs
On November 7, 2018, we announced that our Board of Directors authorized a program to repurchase up to $75.0 million of our common stock over a two-year time period. On October 30, 2020, we announced that our Board of Directors authorized a new program to repurchase up to $100.0 million of our common stock, which replaced the previously announced $75.0 million program. Under the current repurchase program, shares may be repurchased from time to time in the open market or in privately negotiated transactions. Repurchases will be made at our discretion, based on ongoing assessments of the capital needs of the business, the market price of our common stock and general market conditions. Our Board of Directors has established an expiration of December 31, 2022 for completion of the new repurchase program; however, the program may be limited or terminated at any time at our discretion without notice. During the year ended March 31, 2022, we repurchased 126,115 shares for an aggregate amount of $14.4 million under the current repurchase program. During the year ended March 31, 2021, we repurchased 115,151 shares for an aggregate amount of $7.3 million under the prior $75.0 million program.
74
14. FAIR VALUE MEASUREMENTS
The fair value of interest rate swaps discussed in Note 11 are determined using Level II inputs. The carrying value of our debt, included in Note 9, approximates fair value as it bears interest at floating rates. The carrying amounts of other financial instruments (i.e., cash and cash equivalents, accounts receivable, net, accounts payable) approximated their fair values at March 31, 2022 and 2021 due to their short-term nature.
The redeemable noncontrolling interest is recorded at the higher of the redemption value or carrying value each reporting period. The redemption value of the redeemable noncontrolling interest is estimated using a discounted cash flow analysis, which requires management judgment with respect to future revenue, operating margins, growth rates and discount rates and is classified as Level III under the fair value hierarchy. The redemption value of the redeemable noncontrolling interest is discussed in Note 3.
15. RETIREMENT PLANS
We had a frozen qualified defined benefit pension plan (the “Qualified Plan”) that covered certain of our U.S. employees. The Qualified Plan was previously closed to employees hired or re-hired on or after January 1, 2015, and it was amended to freeze benefit accruals and to modify certain ancillary benefits effective as of September 30, 2015. Benefits were based on years of service and an average of the highest consecutive years of compensation during the last ten years of employment. The funding policy of the Qualified Plan was to contribute annual amounts that are currently deductible for federal income tax purposes. No 16 % of our liability. Approximately 67 % of those participants accepted the lump sum offer for an aggregate payment of $7.3 million. During the six months ended September 30, 2019, we offered lump sum payments to eligible active and terminated vested participants, representing approximately 42 % of our remaining liability. Approximately 74 % of those participants accepted the lump sum offer for an aggregate payment of $17.0 million in August 2019. We entered into an annuity purchase contract for the remaining liability in September 2019, and terminated the Qualified Plan effective September 30, 2019. The termination initially required an additional contribution of $0.5 million, which was paid in September 2019, and resulted in an overall termination charge of $7.0 million ($5.4 million, net of tax) recorded in other (expense) income, net, due primarily to the recognition of expenses that were previously included in accumulated other comprehensive loss and the recognition of additional costs associated with the annuity purchase contract. After the participant data for the annuity purchase contract was finalized in the fiscal fourth quarter ended March 31, 2020, the Qualified Plan had excess funds of $0.5 million, which were distributed into the Defined Contribution Plan discussed below.
We maintain a frozen unfunded retirement restoration plan (the “Restoration Plan”) that is a non-qualified plan providing for the payment to participating employees, upon retirement, of the difference between the maximum annual payment permissible under the Qualified Plan pursuant to federal limitations and the amount that would otherwise have been payable under the Qualified Plan. The Restoration Plan was closed to new participants on January 1, 2015 and was amended to freeze benefit accruals and to modify certain ancillary benefits effective as of September 30, 2015.
We maintain a registered defined benefit pension plan (the "Canadian Plan") that covers all of our employees based at our facility in Alberta, Canada. The plan was amended to freeze benefit accruals effective as of January 31, 2022. Employees were eligible for membership in the plan following the completion of one year of employment. Benefits accrued to eligible employees based on years of service and an average of the highest 60 consecutive months of compensation during the last 10 consecutive years of employment. Benefit eligibility typically occurs upon the first day of the month following an eligible employee’s reaching age 65, and plan benefits are typically paid monthly in advance for the lifetime of the participant.
75
The plans described above (collectively, the "Plans") are presented in aggregate as the impact of the Restoration Plan and Canadian Plan to our consolidated financial position and results of operations is not material.
The following are assumptions related to the Plans:
| March 31, | ||||||||||||||||||||
| 2022 | 2021 | 2020 | ||||||||||||||||||
| Assumptions used to determine benefit obligations: | ||||||||||||||||||||
| Discount rate | % | % | % | |||||||||||||||||
| Rate of compensation increases (a) | % | % | % | |||||||||||||||||
| Assumptions used to determine net pension expense: | ||||||||||||||||||||
| Discount rate | % | % | % | |||||||||||||||||
| Expected return on plan assets | % | % | % | |||||||||||||||||
| Rate of compensation increases (b) | % | % | % | |||||||||||||||||
(a) Rate of compensation increase is not relevant to the Restoration Plan and the Canadian Plan due to freezing benefit accruals.
(b) Rate of compensation increase is no longer relevant to the Restoration Plan due to freezing benefit accruals. Rate of compensation increase of $3.0 % was used to determine the fiscal 2022 expenses for the Canadian Plan.
The factors used in determination of these assumptions are described in Note 1.
Net pension (benefit) expense for the Plans was:
| Year Ended March 31, | ||||||||||||||||||||
| (in thousands) | 2022 | 2021 | 2020 | |||||||||||||||||
| Service cost – benefits earned during the year | $ | $ | $ | |||||||||||||||||
| Interest cost on projected benefit obligation | ||||||||||||||||||||
| Expected return on assets | ( | ( | ( | |||||||||||||||||
| Net amortization and deferral | ||||||||||||||||||||
| Pension plan termination (a) | ||||||||||||||||||||
| Curtailment impact | ( | |||||||||||||||||||
| Net pension expense | $ | $ | $ | |||||||||||||||||
(a) Reflects impact of the termination of the Qualified Plan.
No estimated prior service costs or net loss for the Plans will be amortized from accumulated other comprehensive loss into pension expense in the year ended March 31, 2023.
The following is a summary of the changes in the Plans' pension obligations:
| March 31, | ||||||||||||||
| (in thousands) | 2022 | 2021 | ||||||||||||
| Benefit obligation at beginning of year | $ | $ | ||||||||||||
| Service cost | ||||||||||||||
| Interest cost | ||||||||||||||
| Actuarial gain | ( | |||||||||||||
| Benefits paid | ( | ( | ||||||||||||
| Curtailment impact | ( | |||||||||||||
| Currency translation impact | ||||||||||||||
| Benefit obligation at end of year | $ | $ | ||||||||||||
| Accumulated benefit obligation | $ | $ | ||||||||||||
76
The following is a reconciliation of the Plans' assets:
| March 31, | ||||||||||||||
| (in thousands) | 2022 | 2021 | ||||||||||||
| Fair value of plan assets at beginning of year | $ | $ | ||||||||||||
| Actual return on plan assets | ( | |||||||||||||
| Benefits paid | ( | ( | ||||||||||||
| Company contributions | ||||||||||||||
| Currency translation impact | ||||||||||||||
| Fair value of plan assets at end of year | $ | $ | ||||||||||||
We contributed $0.1 million to the Canadian Plan in the year ended March 31, 2022. No contribution will be made in the year ending March 31, 2023 due to the freezing of benefits and the funded position as at March 31, 2022.
The following summarizes the net pension asset for the Plans
| March 31, | ||||||||||||||
| (in thousands) | 2022 | 2021 | ||||||||||||
| Plan assets at fair value | $ | $ | ||||||||||||
| Benefit obligation | ( | ( | ||||||||||||
| Unfunded status | $ | ( | $ | ( | ||||||||||
The following summarizes amounts recognized in the balance sheets for the Plans:
| March 31, | ||||||||||||||
| (in thousands) | 2022 | 2021 | ||||||||||||
| Current liabilities | $ | ( | $ | ( | ||||||||||
| Noncurrent liabilities | ( | ( | ||||||||||||
| Unfunded status | $ | ( | $ | ( | ||||||||||
The following table presents the change in accumulated other comprehensive loss attributable to the components of the net cost and the change in the benefit obligation:
| March 31, | ||||||||||||||
| (in thousands) | 2022 | 2021 | ||||||||||||
| Accumulated other comprehensive loss at beginning of year | $ | ( | $ | ( | ||||||||||
| Amortization of net loss | ||||||||||||||
| Amortization of prior service cost | ( | ( | ||||||||||||
| Curtailment impact | ||||||||||||||
| Net gain arising during the year | ||||||||||||||
| Currency translation impact | ( | ( | ||||||||||||
| Accumulated other comprehensive loss at end of year | $ | ( | $ | ( | ||||||||||
77
Amounts recorded in accumulated other comprehensive loss consist of:
| March 31, | ||||||||||||||
| (in thousands) | 2022 | 2021 | ||||||||||||
| Net prior service cost | $ | $ | ||||||||||||
| Net loss | ( | ( | ||||||||||||
| Accumulated other comprehensive loss | $ | ( | $ | ( | ||||||||||
The Canadian Plan accounts for 100 % of total assets, and has investments of $2.5 million primarily in high-quality fixed income securities (Level II inputs in the fair value hierarchy) that are issued by governments and corporations. The actual asset allocations for the Plans were as follows:
| March 31, | ||||||||||||||
| Asset category | 2022 | 2021 | ||||||||||||
| Fixed income securities | % | % | ||||||||||||
| Other | % | % | ||||||||||||
| Cash and cash equivalents | % | % | ||||||||||||
| Total | % | % | ||||||||||||
The following table summarizes the expected cash benefit payments for the Plans for fiscal years ending March 31 (in millions):
| 2023 | $ | |||||||
| 2024 | ||||||||
| 2025 | ||||||||
| 2026 | ||||||||
| 2027 | ||||||||
| Thereafter | ||||||||
Defined Contribution Plan
Effective October 1, 2015, we began to sponsor a defined contribution plan covering substantially all of our U.S. employees. Employees may contribute to this plan, and these contributions are matched 100 % by us up to 6.0 % of eligible earnings. We also contribute an additional percentage of eligible earnings to employees regardless of their level of participation in the plan, which is discretionary and varies based on profitability. We made total contributions to the plan of $4.8 million and $3.9 million during the years ended March 31, 2022 and 2021, respectively.
Employee Stock Ownership Plan
We sponsor a qualified, non-leveraged employee stock ownership plan (“ESOP”) in which domestic employees are eligible to participate following the completion of one year of service. The ESOP provides annual discretionary contributions of up to the maximum amount that is deductible under the Internal Revenue Code. Contributions to the ESOP are invested in our common stock. A participant’s interest in contributions to the ESOP fully vests after three years of credited service or upon retirement, permanent disability (each, as defined in the plan document) or death.
We recorded total contributions to the ESOP of $2.3 million, $3.6 million and $3.2 million during the years ended March 31, 2022, 2021 and 2020, respectively, based on performance in the prior year. During the year ended March 31, 2022, $3.0 million was recorded to expense based on performance in the year ended March 31, 2022 and is expected to be contributed to the ESOP during the year ending March 31, 2023.
The ESOP held 549,863 and 628,289 shares of CSWI common stock as of March 31, 2022 and 2021, respectively.
78
16. INCOME TAXES
Income from continuing operations before income taxes was comprised of the following (in thousands):
| Year Ended March 31, | ||||||||||||||||||||
| 2022 | 2021* | 2020* | ||||||||||||||||||
| U.S. Federal | $ | $ | $ | |||||||||||||||||
| Foreign | ||||||||||||||||||||
| Income before income taxes | $ | $ | $ | |||||||||||||||||
*Years ended March 31, 2021 and 2020 amounts have been adjusted to reflect the change in inventory accounting method, as described in Notes 1 and 7 to the Consolidated Financial Statements.
Income tax expense consists of the following (in thousands):
| For the year ended: | Current | Deferred | Total | |||||||||||||||||
| March 31, 2022 | ||||||||||||||||||||
| U.S. Federal | $ | $ | ( | $ | ||||||||||||||||
| State and local | ||||||||||||||||||||
| Foreign | ( | ( | ||||||||||||||||||
| Provision for income taxes | $ | $ | ( | $ | ||||||||||||||||
| March 31, 2021* | ||||||||||||||||||||
| U.S. Federal | $ | $ | ( | $ | ||||||||||||||||
| State and local | ( | |||||||||||||||||||
| Foreign | ||||||||||||||||||||
| Provision for income taxes | $ | $ | ( | $ | ||||||||||||||||
| March 31, 2020* | ||||||||||||||||||||
| U.S. Federal | $ | $ | $ | |||||||||||||||||
| State and local | ( | |||||||||||||||||||
| Foreign | ( | |||||||||||||||||||
| Provision for income taxes | $ | $ | $ | |||||||||||||||||
*Years ended March 31, 2021 and 2020 amounts have been adjusted to reflect the change in inventory accounting method, as described in Notes 1 and 7 to the Consolidated Financial Statements.
79
Income tax expense differed from the amounts computed by applying the U.S. federal statutory income tax rate of 21.0% to income from continuing operations before income taxes as a result of the following (in thousands):
| Year Ended March 31, | ||||||||||||||||||||
| 2022 | 2021* | 2020* | ||||||||||||||||||
| Computed tax expense at statutory rate | $ | $ | $ | |||||||||||||||||
| Increase (reduction) in income taxes resulting from: | ||||||||||||||||||||
| State and local income taxes, net of federal benefits | ||||||||||||||||||||
| Nondeductible executive compensation | ||||||||||||||||||||
| Vesting of stock-based compensation | ( | ( | ( | |||||||||||||||||
| Amended return items (pension and foreign withholding) | ||||||||||||||||||||
| IRS audit adjustments | ||||||||||||||||||||
| Global intangible low-taxed income ("GILTI") inclusion and foreign-derived intangible income ("FDII") deduction | ( | |||||||||||||||||||
| Foreign rate differential | ||||||||||||||||||||
| Uncertain tax positions | ( | ( | ||||||||||||||||||
| Other permanent differences | ( | ( | ||||||||||||||||||
| Foreign tax credits | ( | ( | ( | |||||||||||||||||
| Valuation allowance | ||||||||||||||||||||
| Repatriation tax, net of tax credit | ||||||||||||||||||||
| Other, net | ( | |||||||||||||||||||
| Provision for income taxes continuing operations | $ | $ | $ | |||||||||||||||||
*Years ended March 31, 2021 and 2020 amounts have been adjusted to reflect the change in inventory accounting method, as described in Notes 1 and 7 to the Consolidated Financial Statements.
The effective tax rates for the years ended March 31, 2022, 2021 and 2020 were 26.4 %, 21.2 % and 22.2 %, respectively. As compared with the statutory rate for the year ended March 31, 2022, the provision for income taxes was primarily impacted by state tax expense (net of federal benefits), which increased the provision by $4.8 million and effective rate by 5.2 %, executive compensation limitation, which increased the provision by $1.0 million and the effective tax rate by 1.1 % and a net increase in uncertain tax positions, which increased the provision by $0.8 million and the effective rate by 0.8 %. This was offset by tax benefits related to the restricted stock vesting, which decreased the provision by $1.9 million and the effective tax rate by 2.1 %.
As compared with the statutory rate for the year ended March 31, 2021, the provision for income taxes was primarily impacted by the state tax expense, which increased the provision by $2.4 million and the effective rate by 4.8 %, the additional non-deductible expenses, which increased the provision by $1.9 million and the effective rate by 2.1 %, and the release of uncertain tax positions, which decreased the provision by $4.7 million and the effective rate by 9.3 %.
80
The tax effects of temporary differences that give rise to significant portions of the deferred tax assets and deferred tax liabilities at March 31, 2022 and 2021 are presented below (in thousands):
| March 31, | ||||||||||||||
| 2022 | 2021* | |||||||||||||
| Deferred tax assets: | ||||||||||||||
| Operating lease liabilities | $ | $ | ||||||||||||
| Accrued compensation | ||||||||||||||
| Impairment | ||||||||||||||
| Pension and other employee benefits | ||||||||||||||
| Inventory reserves | ||||||||||||||
| Net operating loss carryforwards | ||||||||||||||
| Accrued expenses | ||||||||||||||
| Foreign tax credit carry-forward | ||||||||||||||
| State R&D credit carry-forward | ||||||||||||||
| Transaction Costs | ||||||||||||||
| Other, net | ||||||||||||||
| Deferred tax assets | ||||||||||||||
| Valuation allowance | ( | ( | ||||||||||||
| Deferred tax assets, net of valuation allowance | ||||||||||||||
| Deferred tax liabilities: | ||||||||||||||
| Goodwill and intangible assets | ( | ( | ||||||||||||
| Property, plant and equipment | ( | ( | ||||||||||||
| Operating lease - ROU assets | ( | ( | ||||||||||||
| Repatriation reserve | ( | ( | ||||||||||||
| Other, net | ( | ( | ||||||||||||
| Deferred tax liabilities | ( | ( | ||||||||||||
| Net deferred tax liabilities | $ | ( | $ | ( | ||||||||||
*Year ended March 31, 2021 amounts have been adjusted to reflect the change in inventory accounting method, as described in Notes 1 and 7 to the Consolidated Financial Statements.
As the assets and liabilities of our discontinued Coatings business discussed in Note 4 reside in a disregarded entity for tax purposes, the tax attributes associated with the operations of our Coatings business ultimately flow through to our corporate parent, which files a consolidated federal return. Therefore, corresponding deferred tax assets or liabilities expected to be substantially realized by our corporate parent have been reflected above as assets of our continuing operations and have not been allocated to the balances of assets or liabilities of our discontinued operations disclosed in Note 4.
As of both March 31, 2022 and 2021, we had no
Certain earnings of foreign subsidiaries continue to be permanently invested outside of the United States. The earnings related to these foreign subsidiaries for which taxes are not being provided are $16.6 million. The calculation of the taxes on these undistributed earnings are impracticable because it is unknown how these earnings would be distributed.
81
A reconciliation of the beginning and ending amount of unrecognized tax benefits is as follows (in thousands):
| March 31, | ||||||||||||||
| 2022 | 2021 | |||||||||||||
| Balance at beginning of year | $ | $ | ||||||||||||
| Increases related to prior year tax positions | ||||||||||||||
| Decreases related to prior year tax positions | ( | ( | ||||||||||||
| Increases related to current year tax positions | ||||||||||||||
| Balance at end of year | $ | $ | ||||||||||||
During the year ended March 31, 2022, we released a $0.3 million reserve related to positions taken on tax returns for which the statute has expired, and accrued interest and penalties of $0.6 million and $0.5 million, respectively.
During the year ended March 31, 2021, we recorded total tax contingency reserves of $17.3 million, including unrecognized tax benefit of $13.6 million, accrued interest and penalty of $1.4 million and $2.3 million, respectively, through purchase accounting as a result of the TRUaire acquisition discussed in Note 2. During the three months ended March 31, 2021, a tax benefit of $5.3 million, including release of accrued interest ($0.6 million) and penalty ($0.6 million), was recognized through the income statement as a result of receiving the audit closing letter from Internal Revenue Service related to calendar 2017. For the year ended March 31, 2021, we recorded an additional net tax contingency reserve of $0.2 million, accrued interest of $0.1 million and accrued penalty of $0.2 million.
17. RELATED PARTY TRANSACTIONS
18. CONTINGENCIES
82
19. OTHER COMPREHENSIVE INCOME (LOSS)
The following table provides an analysis of the changes in accumulated other comprehensive loss (in thousands).
| March 31, | ||||||||||||||
| 2022 | 2021 | |||||||||||||
| Currency translation adjustments: | ||||||||||||||
| Balance at beginning of period | $ | ( | $ | ( | ||||||||||
| Foreign currency translation adjustments | ( | |||||||||||||
| Balance at end of period | $ | ( | $ | ( | ||||||||||
| Interest rate swaps: | ||||||||||||||
| Balance at beginning of period | $ | ( | $ | ( | ||||||||||
Unrealized gain, net of taxes of $( | ||||||||||||||
Reclassification of losses included in interest expense, net of taxes of $( | ||||||||||||||
| Other comprehensive income | ||||||||||||||
| Balance at end of period | $ | ( | $ | ( | ||||||||||
| Defined benefit plans: | ||||||||||||||
| Balance at beginning of period | $ | ( | $ | ( | ||||||||||
Amortization of net prior service benefit, net of taxes of $ | ( | ( | ||||||||||||
Amortization of net loss, net of taxes of $( | ||||||||||||||
Net gain arising during the year, net of taxes of $( | ||||||||||||||
Curtailment impact, net of taxes of $( | ||||||||||||||
| Currency translation impact | ( | ( | ||||||||||||
| Other comprehensive income | ||||||||||||||
| Balance at end of period | $ | ( | $ | ( | ||||||||||
(a) Unrealized gains are reclassified to earnings as underlying cash interest payments are made. We expect to recognize a loss of less than $0.1 million, net of deferred taxes, over the next twelve months related to a designated cash flow hedge based on its fair value as of March 31, 2022.
(b) Amortization of prior service costs and actuarial losses out of accumulated other comprehensive loss are included in the computation of net periodic pension expense. See Note 15 for additional information.
20. REVENUE RECOGNITION
We conduct our operations in three reportable segments: Contractor Solutions, Engineered Building Solutions and Specialized Reliability Solutions. With the adoption of ASC Topic 606, we have concluded that the disaggregation of revenues that would be most useful in understanding the nature, timing and extent of revenue recognition is the breakout of build-to-order and book-and-ship, as defined below:
Build-to-order products are architecturally-specified building products generally sold into the construction industry. Revenue generated from sales of products under build-to-order transactions are currently reflected in the results of our Engineered Building Solutions segment. Occasionally, our built-to-order business lines enter into arrangements for the delivery of a customer-specified product and the provision of installation services. These orders are generally negotiated as a package and are commonly subject to retainage by the customer, which means the final 10 % of the transaction price, when applicable, is not collectible until the overall construction project into which our products are incorporated is complete. The lead times for transfer to the customer can be up to 12 weeks. Revenue for goods is recognized at a point in time, but installation services are recognized over time as those services are performed. Installation services represented approximately 3 % of total consolidated revenue for the year ended March 31, 2022.
Book-and-ship products are sold across all of our end markets. Revenue generated from sales of products under book-and-ship transactions have historically been presented in the Contractor Solutions, Engineered Building Solutions and
83
Specialized Reliability Solutions. These sales are typically priced on a product-by-product basis using price lists provided to our customers. The lead times for transfer to the customer is usually one week or less as these items are generally built to stock. Revenue for products sold under these arrangements is recognized at a point in time.
Disaggregation of revenues reconciled to our reportable segments is as follows (in thousands):
| Year Ended March 31, 2022 | ||||||||||||||||||||||||||
| Contractor Solutions | Engineered Building Solutions | Specialized Reliability Solutions | Total | |||||||||||||||||||||||
| Build-to-order | $ | $ | $ | $ | ||||||||||||||||||||||
| Book-and-ship | ||||||||||||||||||||||||||
| Net revenues | $ | $ | $ | $ | ||||||||||||||||||||||
| Year Ended March 31, 2021 | ||||||||||||||||||||||||||
| Contractor Solutions | Engineered Building Solutions | Specialized Reliability Solutions | Total | |||||||||||||||||||||||
| Build-to-order | $ | $ | $ | $ | ||||||||||||||||||||||
| Book-and-ship | ||||||||||||||||||||||||||
| Net revenues | $ | $ | $ | $ | ||||||||||||||||||||||
| Year Ended March 31, 2020 | ||||||||||||||||||||||||||
| Contractor Solutions | Engineered Building Solutions | Specialized Reliability Solutions | Total | |||||||||||||||||||||||
| Build-to-order | $ | $ | $ | $ | ||||||||||||||||||||||
| Book-and-ship | ||||||||||||||||||||||||||
| Net revenues | $ | $ | $ | $ | ||||||||||||||||||||||
Contract liabilities, which are included in accrued and other current liabilities in our consolidated balance sheets were as follows (in thousands):
| Balance at April 1, 2021 | $ | |||||||
| Revenue recognized | ( | |||||||
| New contracts and revenue added to existing contracts | ||||||||
| Balance at March 31, 2022 | $ | |||||||
84
21. SEGMENTS
During the quarter ended June 30, 2021, we revised our segment structure to align with how our chief operating decision maker (who was determined to be our Chief Executive Officer) views our business, assesses performance and allocates resources to our business components. Effective April 1, 2021, following the completion of various strategic transactions including the acquisition of TRUaire and the formation of the Whitmore JV, our business is organized into three reportable segments:
•Contractor Solutions
•Engineered Building Solutions; and
•Specialized Reliability Solutions.
The following is a summary of the financial information of our reporting segments reconciled to the amounts reported in the consolidated financial statements (in thousands).
| Year Ended March 31, 2022 | ||||||||||||||||||||||||||||||||||||||
| (in thousands) | Contractor Solutions | Engineered Building Solutions | Specialized Reliability Solutions | Subtotal - Reportable Segments | Eliminations and Other | Total | ||||||||||||||||||||||||||||||||
| Revenues, net to external customers | $ | $ | $ | $ | $ | $ | ||||||||||||||||||||||||||||||||
| Intersegment revenue | ( | — | ||||||||||||||||||||||||||||||||||||
| Operating income | ( | |||||||||||||||||||||||||||||||||||||
| Depreciation and amortization | ||||||||||||||||||||||||||||||||||||||
| Year Ended March 31, 2021* | ||||||||||||||||||||||||||||||||||||||
| (in thousands) | Contractor Solutions | Engineered Building Solutions | Specialized Reliability Solutions | Subtotal - Reportable Segments | Eliminations and Other | Total | ||||||||||||||||||||||||||||||||
| Revenues, net to external customers | $ | $ | $ | $ | $ | $ | ||||||||||||||||||||||||||||||||
| Intersegment revenue | ( | — | ||||||||||||||||||||||||||||||||||||
| Operating income | ( | |||||||||||||||||||||||||||||||||||||
| Depreciation and amortization | ||||||||||||||||||||||||||||||||||||||
| Year Ended March 31, 2020* | ||||||||||||||||||||||||||||||||||||||
| (in thousands) | Contractor Solutions | Engineered Building Solutions | Specialized Reliability Solutions | Subtotal - Reportable Segments | Eliminations and Other | Total | ||||||||||||||||||||||||||||||||
| Revenues, net to external customers | $ | $ | $ | $ | $ | $ | ||||||||||||||||||||||||||||||||
| Intersegment revenue | ( | — | ||||||||||||||||||||||||||||||||||||
| Operating income | ( | |||||||||||||||||||||||||||||||||||||
| Depreciation and amortization | ||||||||||||||||||||||||||||||||||||||
*Years ended March 31, 2021 and 2020 amounts have been adjusted to reflect the change in inventory accounting method, as described in Notes 1 and 7 to the Consolidated Financial Statements.
In the fiscal quarter ended March 31, 2020, we recorded an impairment of $1.0 million on one of our unamortized trademarks in our Contractor Solutions segment.
85
| TOTAL ASSETS | ||||||||||||||||||||||||||||||||||||||
| (Amounts in thousands) | Contractor Solutions | Engineered Building Solutions | Specialized Reliability Solutions | Subtotal - Reportable Segments | Eliminations and Other | Total | ||||||||||||||||||||||||||||||||
| March 31, 2022 | $ | $ | $ | $ | $ | $ | ||||||||||||||||||||||||||||||||
| March 31, 2021* | ||||||||||||||||||||||||||||||||||||||
| March 31, 2020* | ||||||||||||||||||||||||||||||||||||||
*Years ended March 31, 2021 and 2020 amounts have been adjusted to reflect the change in inventory accounting method, as described in Notes 1 and 7 to the Consolidated Financial Statements.
Geographic information – We attribute revenues to different geographic areas based on the destination of the product or service delivery. Long-lived assets are classified based on the geographic area in which the assets are located and exclude deferred taxes. No individual country, except for the U.S., accounted for more than 10% of consolidated net revenues or total long-lived assets.
Revenues and long-lived assets by geographic area are as follows (in thousands, except percent data):
| Year Ended March 31, | ||||||||||||||||||||||||||||||||||||||
| 2022 | 2021 | 2020 | ||||||||||||||||||||||||||||||||||||
| U.S. | $ | % | $ | % | $ | % | ||||||||||||||||||||||||||||||||
| Non-U.S. (a) | % | % | % | |||||||||||||||||||||||||||||||||||
| Revenues, net | $ | % | $ | % | $ | % | ||||||||||||||||||||||||||||||||
(a) No individual country within this group represents 10% or more of consolidated totals for any period presented.
| Year Ended March 31, | ||||||||||||||||||||||||||||||||||||||
| 2022 | 2021 | 2020 | ||||||||||||||||||||||||||||||||||||
| U.S. | $ | % | $ | % | $ | % | ||||||||||||||||||||||||||||||||
| Non-U.S. | % | % | % | |||||||||||||||||||||||||||||||||||
| Long-lived assets (a) | $ | % | $ | % | $ | % | ||||||||||||||||||||||||||||||||
(a) Long-lived assets consist primarily of property, plant and equipment, intangible assets, goodwill and other assets, net of deferred taxes.
Major customer information – We have a large number of customers across our locations and do not believe that we have sales to any individual customer that represented 10% or more of consolidated net revenues for any of the fiscal years presented.
86
22. QUARTERLY FINANCIAL DATA (UNAUDITED)
The following presents a summary of the unaudited quarterly data for the years ended March 31, 2022 and 2021 (amounts in millions, except per share data):
| Year Ended March 31, 2022 | ||||||||||||||||||||||||||
| Quarter | 4th | 3rd | 2nd | 1st | ||||||||||||||||||||||
| Revenues, net | $ | $ | $ | $ | ||||||||||||||||||||||
| Gross profit | ||||||||||||||||||||||||||
| Income before income taxes | ||||||||||||||||||||||||||
| Net income | ||||||||||||||||||||||||||
| Net income attributable to CSW Industrials, Inc. | ||||||||||||||||||||||||||
| Earnings per share attributable to CSW Industrials, Inc. (a) | ||||||||||||||||||||||||||
| Basic | $ | $ | $ | $ | ||||||||||||||||||||||
| Diluted | ||||||||||||||||||||||||||
| Year Ended March 31, 2021* | ||||||||||||||||||||||||||
| Quarter | 4th | 3rd | 2nd | 1st | ||||||||||||||||||||||
| Revenues, net | $ | $ | $ | $ | ||||||||||||||||||||||
| Gross profit | ||||||||||||||||||||||||||
| Income before income taxes | ||||||||||||||||||||||||||
| Net income | ||||||||||||||||||||||||||
| Net income attributable to CSW Industrials, Inc. | ||||||||||||||||||||||||||
| Earnings per share attributable to CSW Industrials, Inc. (a) | ||||||||||||||||||||||||||
| Basic | $ | $ | $ | $ | ||||||||||||||||||||||
| Diluted | ||||||||||||||||||||||||||
(a) Net earnings per common share is computed independently for each of the quarters presented. The sum of the quarters may not equal the total year amount due to the impact of changes in weighted average quarterly shares outstanding.
87
ITEM 9: CHANGES IN AND DISAGREEMENTS WITH ACCOUNTANTS ON ACCOUNTING AND FINANCIAL DISCLOSURE
None
ITEM 9A. CONTROLS AND PROCEDURES
Evaluation of Disclosure Controls and Procedures
Our disclosure controls and procedures (as defined in Rule 13a-15(e) under the Securities Exchange Act of 1934 (the "Exchange Act")) are designed to ensure that the information, which we are required to disclose in the reports that we file or submit under the Exchange Act, is recorded, processed, summarized and reported within the time periods specified in the United States Securities and Exchange Commission's rules and forms, and that such information is accumulated and communicated to our management, including our Principal Executive Officer and Principal Financial Officer, as appropriate to allow timely decisions regarding required disclosure.
In connection with the preparation of this Annual Report on Form 10-K for the year ended March 31, 2022, our management, under the supervision and with the participation of our Principal Executive Officer and our Principal Financial Officer, carried out an evaluation of the effectiveness of the design and operation of our disclosure controls and procedures as of March 31, 2022 as required by Rule 13a-15(b) under the Exchange Act. Based on this evaluation, our Principal Executive Officer and Principal Financial Officer concluded that our disclosure controls and procedures were effective at the reasonable assurance level as of March 31, 2022.
Management’s Report on Internal Control Over Financial Reporting
Our management, under the supervision and with the participation of our Principal Executive Officer and Principal Financial Officer, is responsible for establishing and maintaining adequate internal control over financial reporting, as such term is defined in Rules 13a-15(f) and 15d-15(f) under the Exchange Act. Internal control over financial reporting is a process designed to provide reasonable assurance regarding the reliability of financial reporting and the preparation of financial statements for external purposes in accordance with accounting principles generally accepted in the United States ("U.S. GAAP"). Internal control over financial reporting includes policies and procedures that: (1) pertain to the maintenance of records that, in reasonable detail, accurately and fairly reflect the transactions and dispositions of our assets; (2) provide reasonable assurance that transactions are recorded as necessary to permit preparation of financial statements in accordance with U.S. GAAP, and that our receipts and expenditures are being made only in accordance with authorizations of our management and directors; and (3) provide reasonable assurance regarding prevention or timely detection of unauthorized acquisition, use or disposition of our assets that could have a material effect on the financial statements.
The design of any system of control is based upon certain assumptions about the likelihood of future events, and there can be no assurance that any design will succeed in achieving its stated objectives under all future events, no matter how remote, or that the degree of compliance with the policies or procedures may not deteriorate.
Under the supervision and with the participation of our Principal Executive Officer and Principal Financial Officer, our management conducted an assessment of our internal control over financial reporting as of March 31, 2022, based on the criteria established in Internal Control - Integrated Framework (2013), issued by the Committee of Sponsoring Organizations of the Treadway Commission. In accordance with guidance issued by the SEC, recently acquired businesses may be excluded from management's assessment of the effectiveness of the Company's internal control over financial reporting in the year of acquisition. Accordingly, management excluded the Shoemaker acquisition from management's assessment of the effectiveness of the Company's internal control over financial reporting from the December 15, 2021 acquisition date, which excluded total assets and total net revenues representing approximately 5% and 1%, respectively, of the Company's related consolidated financial statement amounts as of and for the year ended March 31, 2022. Based on this assessment, our management has concluded that as of March 31, 2022, our internal control over financial reporting was effective based on those criteria.
The effectiveness of our internal control over financial reporting as of March 31, 2022, has been audited by Grant Thornton LLP, our independent registered public accounting firm, as stated in their report, which is included herein.
Changes in Internal Control Over Financial Reporting
There were no changes in our internal control over financial reporting during the quarter ended March 31, 2022 that have materially affected, or are reasonably likely to materially affect, our internal control over financial reporting.
88
REPORT OF INDEPENDENT REGISTERED PUBLIC ACCOUNTING FIRM
Board of Directors and Shareholders
CSW Industrials, Inc.
Opinion on Internal Control over Financial Reporting
We have audited the internal control over financial reporting of CSW Industrials, Inc. (a Delaware corporation) and subsidiaries (the “Company”) as of March 31, 2022, based on criteria established in the 2013 Internal Control—Integrated Framework issued by the Committee of Sponsoring Organizations of the Treadway Commission (“COSO”). In our opinion, the Company maintained, in all material respects, effective internal control over financial reporting as of March 31, 2022, based on criteria established in the 2013 Internal Control—Integrated Framework issued by COSO.
We also have audited, in accordance with the standards of the Public Company Accounting Oversight Board (United States) (“PCAOB”), the consolidated financial statements of the Company as of and for the year ended March 31, 2022, and our report dated May 18, 2022 expressed an unqualified opinion on those financial statements.
Basis for Opinion
The Company’s management is responsible for maintaining effective internal control over financial reporting and for its assessment of the effectiveness of internal control over financial reporting, included in the accompanying Management’s Report on Internal Control over Financial Reporting. Our responsibility is to express an opinion on the Company’s internal control over financial reporting based on our audit. We are a public accounting firm registered with the PCAOB and are required to be independent with respect to the Company in accordance with the U.S. federal securities laws and the applicable rules and regulations of the Securities and Exchange Commission and the PCAOB.
We conducted our audit in accordance with the standards of the PCAOB. Those standards require that we plan and perform the audit to obtain reasonable assurance about whether effective internal control over financial reporting was maintained in all material respects. Our audit included obtaining an understanding of internal control over financial reporting, assessing the risk that a material weakness exists, testing and evaluating the design and operating effectiveness of internal control based on the assessed risk, and performing such other procedures as we considered necessary in the circumstances. We believe that our audit provides a reasonable basis for our opinion.
Our audit of and opinion on, the Company’s internal control over financial reporting does not include the internal control over financial reporting of Shoemaker Manufacturing LLC (“Acquired Entity”) whose financial statements reflect total assets and revenues constituting 5% and 1%, respectively of the related consolidated financial statement amounts as of and for the year ended March 31, 2022. As indicated in Management’s Report on Internal Control over Financial Reporting, the Acquired Entity was acquired on December 15, 2021. Management’s assertion of the effectiveness of the Company’s internal control over financial reporting excluded internal control over financial reporting of the Acquired Entity.
Definition and Limitations of Internal Control over Financial Reporting
A company’s internal control over financial reporting is a process designed to provide reasonable assurance regarding the reliability of financial reporting and the preparation of financial statements for external purposes in accordance with generally accepted accounting principles. A company’s internal control over financial reporting includes those policies and procedures that (1) pertain to the maintenance of records that, in reasonable detail, accurately and fairly reflect the transactions and dispositions of the assets of the company; (2) provide reasonable assurance that transactions are recorded as necessary to permit preparation of financial statements in accordance with generally accepted accounting principles, and that receipts and expenditures of the company are being made only in accordance with authorizations of management and directors of the company; and (3) provide reasonable assurance regarding prevention or timely detection of unauthorized acquisition, use, or disposition of the company’s assets that could have a material effect on the financial statements.
Because of its inherent limitations, internal control over financial reporting may not prevent or detect misstatements. Also, projections of any evaluation of effectiveness to future periods are subject to the risk that controls may become inadequate because of changes in conditions, or that the degree of compliance with the policies or procedures may deteriorate.
/s/ GRANT THORNTON LLP
Dallas, Texas
May 18, 2021
ITEM 9B: OTHER INFORMATION
89
PART III
ITEM 10: DIRECTORS, EXECUTIVE OFFICERS AND CORPORATE GOVERNANCE
The information required by this item is incorporated by reference to our Proxy Statement for the 2022 Annual Meeting of Stockholders to be filed with the SEC within 120 days after the fiscal year ended March 31, 2022.
ITEM 11: EXECUTIVE COMPENSATION
The information required by this item is incorporated by reference to our Proxy Statement for the 2022 Annual Meeting of Stockholders to be filed with the SEC within 120 days after the fiscal year ended March 31, 2022.
ITEM 12: SECURITY OWNERSHIP OF CERTAIN BENEFICIAL OWNERS AND MANAGEMENT AND RELATED STOCKHOLDER MATTERS
The information required by this item is incorporated by reference to our Proxy Statement for the 2022 Annual Meeting of Stockholders to be filed with the SEC within 120 days after the fiscal year ended March 31, 2022.
ITEM 13: CERTAIN RELATIONSHIPS AND RELATED TRANSACTIONS, AND DIRECTOR INDEPENDENCE
The information required by this item is incorporated by reference to our Proxy Statement for the 2022 Annual Meeting of Stockholders to be filed with the SEC within 120 days after the fiscal year ended March 31, 2022.
ITEM 14: PRINCIPAL ACCOUNTING FEES AND SERVICES
The information required by this item is incorporated by reference to our Proxy Statement for the 2022 Annual Meeting of Stockholders to be filed with the SEC within 120 days after the fiscal year ended March 31, 2022.
PART IV
ITEM 15: EXHIBITS, FINANCIAL STATEMENT SCHEDULES
The following documents are filed as a part of this Annual Report on Form 10-K:
(1) Consolidated Financial Statements | |||||
| CSW Industrials, Inc. Consolidated Financial Statements: | |||||
| For each of the three years in the period ended March 31, 2022: | |||||
(2) Financial Statement Schedules | |||||
None. | |||||
(3) Exhibits | |||||
90
Exhibit Index
| EXHIBIT NUMBER | DESCRIPTION | ||||
| 3.1 | |||||
| 3.2 | |||||
| 4.1 | |||||
| 10.1 | |||||
| 10.2 | |||||
| 10.3 | |||||
| 10.4 | |||||
| 10.5 | |||||
| 10.6 | |||||
| 10.7 | |||||
| 10.8 | |||||
| 10.9 | |||||
| 10.10 | |||||
| 10.11 | |||||
| 18.1* | |||||
| 21.1* | |||||
| 23.1* | |||||
| 31.1* | |||||
| 31.2* | |||||
| 32.1** | |||||
| 32.2** | |||||
| 101.INS | XBRL Instance Document | ||||
| 101.SCH | XBRL Taxonomy Extension Schema | ||||
| 101.CAL | XBRL Taxonomy Extension Calculation Linkbase Document | ||||
| 101.DEF | XBRL Taxonomy Extension Definition Linkbase Document | ||||
| 101.LAB | XBRL Taxonomy Extension Label Linkbase Document | ||||
| 101.PRE | XBRL Taxonomy Extension Presentation Linkbase Document | ||||
| 104 | Cover Page Interactive Data File (formatted as Inline XBRL and contained in Exhibit 101) | ||||
| * | Filed herewith | ||||
| ** | Furnished herewith | ||||
| + | Management contracts and compensatory plans required to be filed as exhibits to this Annual Report on Form 10-K. | ||||
91
SIGNATURES
Pursuant to the requirements of Section 13 or 15(d) of the Securities Exchange Act of 1934, the registrant has duly caused this report to be signed on its behalf by the undersigned, thereunto duly authorized:
| Date: May 18, 2022 | CSW INDUSTRIALS, INC. | |||||||||||||||||||
| By: | /s/ Joseph B. Armes | |||||||||||||||||||
| Joseph B. Armes | ||||||||||||||||||||
| Chairman and Chief Executive Officer | ||||||||||||||||||||
Pursuant to the requirements of the Securities Exchange Act of 1934, this report has been signed below by the following persons on behalf of the registrant and in the capacities and on the dates indicated:
| Name | Title | Date | |||||||||
| /s/ Joseph B. Armes | Chief Executive Officer | May 18, 2022 | |||||||||
| Joseph B. Armes | (Principal Executive Officer) | ||||||||||
| /s/ James E. Perry | Chief Financial Officer | May 18, 2022 | |||||||||
| James E. Perry | (Principal Financial and Accounting Officer) | ||||||||||
| /s/ Michael R. Gambrell | Director | May 18, 2022 | |||||||||
| Michael R. Gambrell | |||||||||||
| /s/ Bobby Griffin | Director | May 18, 2022 | |||||||||
| Bobby Griffin | |||||||||||
| /s/ Terry L. Johnston | Director | May 18, 2022 | |||||||||
| Terry L. Johnston | |||||||||||
| /s/ Linda A. Livingstone | Director | May 18, 2022 | |||||||||
| Linda A. Livingstone, Ph.D. | |||||||||||
| /s/ Robert M. Swartz | Director | May 18, 2022 | |||||||||
| Robert M. Swartz | |||||||||||
| /s/ J. Kent Sweezey | Director | May 18, 2022 | |||||||||
| J. Kent Sweezey | |||||||||||
| /s/ Debra L. von Storch | Director | May 18, 2022 | |||||||||
| Debra L. von Storch | |||||||||||
92
Serious News for Serious Traders! Try StreetInsider.com Premium Free!
You May Also Be Interested In
- Empire State Realty Trust Publishes 2023 Sustainability Report with Major Achievements, Key Goals, and Transparent Metrics
- Weatherford Announces $130 Million Credit Facility Increase to $680 Million and Notice to Redeem All of Its 6.50% Senior Notes Due 2028
- IDEX Reports First Quarter Results and Confirms Full Year Guidance
Create E-mail Alert Related Categories
SEC FilingsSign up for StreetInsider Free!
Receive full access to all new and archived articles, unlimited portfolio tracking, e-mail alerts, custom newswires and RSS feeds - and more!
