

Form 10-K COMSTOCK RESOURCES INC For: Dec 31
 Tweet
Tweet Share
ShareUNITED STATES SECURITIES AND EXCHANGE COMMISSION
Washington, D.C. 20549
FORM 10-K
(Mark One)
| ANNUAL REPORT PURSUANT TO SECTION 13 OR 15(d) | |||||
| OF THE SECURITIES EXCHANGE ACT OF 1934 | |||||
For the fiscal year ended | |||||
| OR | |||||
| TRANSITION REPORT PURSUANT TO SECTION 13 OR 15(d) OF | |||||
| THE SECURITIES EXCHANGE ACT OF 1934 | |||||
For the transition period from to | |||||
Commission File No. 001-03262
(Exact name of registrant as specified in its charter)
| (State or other jurisdiction of incorporation or organization) | (I.R.S. Employer Identification Number) | |||||||
(Address of principal executive offices including zip code)
(Registrant's telephone number and area code)
Securities registered pursuant to Section 12(b) of the Act:
| Title of each class | Trading Symbol(s) | Name of each exchange on which registered | ||||||
Indicate by check mark if the registrant is a well-known seasoned issuer, as defined in Rule 405 of the Securities Act.
| Yes | ¨ | þ | |||||||||
Indicate by check mark if the registrant is not required to file reports pursuant to Section 13 or Section 15(d) of the Act.
| Yes | ¨ | þ | |||||||||
Indicate by check mark whether the registrant (1) has filed all reports required to be filed by Section 13 or 15(d) of the Securities Exchange Act of 1934 during the preceding 12 months (or for such shorter period that the registrant was required to file such reports), and (2) has been subject to such filing requirements for the past 90 days.
| þ | No | ¨ | |||||||||
Indicate by check mark whether the registrant has submitted electronically every Interactive Data File required to be submitted pursuant to Rule 405 of Regulation S-T (§ 232.405 of this chapter) during the preceding 12 months (or for such shorter period that the registrant was required to submit such files).
| þ | No | ¨ | |||||||||
Indicate by check mark whether the registrant is a large accelerated filer, an accelerated filer, a non-accelerated filer a smaller reporting company or an emerging growth company. See the definitions of "large accelerated filer", "accelerated filer", "smaller reporting company" and "emerging growth company" in Rule 12b-2 of the Exchange Act.
| Large accelerated filer | ¨ | þ | Non-accelerated filer | ¨ | Smaller reporting company | ||||||||||||||||||
| Emerging growth company | |||||||||||||||||||||||
If an emerging growth company, indicate by check mark if registrant has elected to not use the extended transition period for complying with any new or revised final accounting standards provided pursuant to Section 13(a) of the Exchange Act. Emerging growth company ¨
Indicate by check mark whether the registrant has filed a report on and attestation to its management’s assessment of the effectiveness of its internal control over financial reporting under Section 404(b) of the Sarbanes-Oxley Act (15 U.S.C. 7262(b)) by the registered public accounting firm that prepared or issued its audit report. ☑
Indicate by check mark whether the registrant is a shell company (as defined in Exchange Act Rule 12b-2).
| Yes | ¨ | No | |||||||||
The aggregate market value of the common stock held by non-affiliates of the registrant, based on the closing price of common stock on the New York Stock Exchange on June 30, 2020 (the last business day of the registrant's most recently completed second fiscal quarter), was $276.0 million. As of February 16, 2021 there were 232,411,218 shares of common stock of the registrant outstanding.
DOCUMENTS INCORPORATED BY REFERENCE
Portions of the Definitive Proxy Statement for the 2021 Annual Meeting of Stockholders
are incorporated by reference into Part III of this report.
COMSTOCK RESOURCES, INC.
ANNUAL REPORT ON FORM 10-K
For the Fiscal Year Ended December 31, 2020
CONTENTS
1
CAUTIONARY NOTE REGARDING FORWARD-LOOKING STATEMENTS
The information contained in this report includes "forward-looking statements" within the meaning of Section 27A of the Securities Act of 1933 and Section 21E of the Securities Exchange Act of 1934. These forward-looking statements are identified by their use of terms such as "expect," "estimate," "anticipate," "project," "plan," "intend," "believe" and similar terms. All statements, other than statements of historical facts, included in this report, are forward-looking statements, including statements mentioned under "Risk Factors" and "Management's Discussion and Analysis of Financial Condition and Results of Operations," regarding:
•amount and timing of future production of oil and natural gas;
•amount, nature and timing of capital expenditures;
•the number of anticipated wells to be drilled after the date hereof;
•the availability of exploration and development opportunities;
•our financial or operating results;
•our cash flow and anticipated liquidity;
•operating costs including lease operating expenses, administrative costs and other expenses;
•finding and development costs;
•our business strategy; and
•other plans and objectives for future operations.
Any or all of our forward-looking statements in this report may turn out to be incorrect. They can be affected by a number of factors, including, among others:
•the risks described in "Risk Factors" and elsewhere in this report;
•the volatility of prices and supply of, and demand for, oil and natural gas;
•the timing and success of our drilling activities;
•the numerous uncertainties inherent in estimating quantities of oil and natural gas reserves and actual future production rates and associated costs;
•our ability to successfully identify, execute or effectively integrate future acquisitions;
•the usual hazards associated with the oil and natural gas industry, including fires, well blowouts, pipe failure, spills, explosions and other unforeseen hazards;
•our ability to effectively market our oil and natural gas;
•the availability of rigs, equipment, supplies and personnel;
•our ability to discover or acquire additional reserves;
•our ability to satisfy future capital requirements;
•changes in regulatory requirements;
•general economic conditions, status of the financial markets and competitive conditions; and
•our ability to retain key members of our senior management and key employees.
2
DEFINITIONS
The following are abbreviations and definitions of terms commonly used in the oil and gas industry and this report. Natural gas equivalents and crude oil equivalents are determined using the ratio of six Mcf to one barrel. All references to "us", "our", "we" or "Comstock" mean the registrant, Comstock Resources, Inc. and where applicable, its consolidated subsidiaries.
"Bbl" means a barrel of U.S. 42 gallons of oil.
"Bcf" means one billion cubic feet of natural gas.
"Bcfe" means one billion cubic feet of natural gas equivalent.
"BOE" means one barrel of oil equivalent.
"Btu" means British thermal unit, which is the quantity of heat required to raise the temperature of one pound of water from 58.5 to 59.5 degrees Fahrenheit.
"Completion" means the installation of permanent equipment for the production of oil or gas.
"Condensate" means a hydrocarbon mixture that becomes liquid and separates from natural gas when the gas is produced and is similar to crude oil.
"Development well" means a well drilled within the proved area of an oil or gas reservoir to the depth of a stratigraphic horizon known to be productive.
"Dry hole" means a well found to be incapable of producing hydrocarbons in sufficient quantities such that proceeds from the sale of such production exceed production expenses and taxes.
"Exploratory well" means a well drilled to find a new field or to find a new productive reservoir in a field previously found to be productive of oil or natural gas in another reservoir or to extend a known reservoir.
"Gross" when used with respect to acres or wells, production or reserves refers to the total acres or wells in which we or another specified person has a working interest.
"LNG" refers to liquefied natural gas, which is a composition of methane and some mixture of ethane that has been cooled to liquid form for ease and safety of non-pressurized storage or transport.
"MBbls" means one thousand barrels of oil.
"MBbls/d" means one thousand barrels of oil per day.
"Mcf" means one thousand cubic feet of natural gas.
"Mcfe" means one thousand cubic feet of natural gas equivalent.
"MMBbls" means one million barrels of oil.
"MMBOE" means one million barrels of oil equivalent.
"MMBtu" means one million British thermal units.
"MMcf" means one million cubic feet of natural gas.
"MMcf/d" means one million cubic feet of natural gas per day.
"MMcfe/d" means one million cubic feet of natural gas equivalent per day.
"MMcfe" means one million cubic feet of natural gas equivalent.
3
"Net" when used with respect to acres or wells, refers to gross acres of wells multiplied, in each case, by the percentage working interest owned by us.
"Net production" means production we own less royalties and production due others.
"NGL" refers to natural gas liquids, which is composed exclusively of carbon and hydrogen.
"Oil" means crude oil or condensate.
"Operator" means the individual or company responsible for the exploration, development, and production of an oil or gas well or lease.
"Proved developed reserves" means reserves that can be expected to be recovered through existing wells with existing equipment and operating methods.
"Proved developed non-producing" means reserves (i) expected to be recovered from zones capable of producing but which are shut-in because no market outlet exists at the present time or whose date of connection to a pipeline is uncertain or (ii) currently behind the pipe in existing wells, which are considered proved by virtue of successful testing or production of offsetting wells.
"Proved developed producing" means reserves expected to be recovered from currently producing zones under continuation of present operating methods. This category includes recently completed shut-in gas wells scheduled for connection to a pipeline in the near future.
"Proved reserves" means the estimated quantities of crude oil, natural gas, and natural gas liquids which geological and engineering data demonstrate with reasonable certainty to be recoverable in future years from known reservoirs under existing economic and operating conditions, i.e., prices and costs as of the date the estimate is made. Prices include consideration of changes in existing prices provided by contractual arrangements.
"Proved undeveloped reserves" means reserves that are expected to be recovered from new wells on undrilled acreage, or from existing wells where a relatively major expenditure is required for recompletion. Reserves on undrilled acreage are limited to those drilling locations offsetting productive wells that are reasonably certain of production when drilled or where it can be demonstrated with certainty that there is continuity of production from the existing productive formation.
"PV 10 Value" means the present value of estimated future revenues to be generated from the production of proved reserves calculated, net of estimated production and future development costs, using prices and costs as of the date of estimation without future escalation, without giving effect to non-property related expenses such as general and administrative expenses, debt service, future income tax expense and depreciation, depletion and amortization, and discounted using an annual discount rate of 10%. This amount is the same as the standardized measure of discounted future net cash flows related to proved oil and natural gas reserves except that it is determined without deducting future income taxes. Although PV 10 Value is not a financial measure calculated in accordance with GAAP, management believes that the presentation of PV 10 Value is relevant and useful to our investors because it presents the discounted future net cash flows attributable to our proved reserves prior to taking into account corporate future income taxes and our current tax structure. We use this measure when assessing the potential return on investment related to our oil and gas properties. Because many factors that are unique to any given company affect the amount of estimated future income taxes, we believe the use of a pre-tax measure is helpful to investors when comparing companies in our industry.
"Recompletion" means the completion for production of an existing well bore in another formation from which the well has been previously completed.
"Reserve life" means the calculation derived by dividing year-end reserves by total production in that year.
"Royalty" means an interest in an oil and gas lease that gives the owner of the interest the right to receive a portion of the production from the leased acreage (or of the proceeds of the sale thereof), but generally does not
4
require the owner to pay any portion of the costs of drilling or operating the wells on the leased acreage. Royalties may be either landowner's royalties, which are reserved by the owner of the leased acreage at the time the lease is granted, or overriding royalties, which are usually reserved by an owner of the leasehold in connection with a transfer to a subsequent owner.
"3-D seismic" means an advanced technology method of detecting accumulations of hydrocarbons identified by the collection and measurement of the intensity and timing of sound waves transmitted into the earth as they reflect back to the surface.
"SEC" means the United States Securities and Exchange Commission.
"Tcf" means one trillion cubic feet of natural gas.
"Tcfe" means one trillion cubic feet of natural gas equivalent.
"Working interest" means an interest in an oil and gas lease that gives the owner of the interest the right to drill for and produce oil and gas on the leased acreage and requires the owner to pay a share of the costs of drilling and production operations. The share of production to which a working interest owner is entitled will always be smaller than the share of costs that the working interest owner is required to bear, with the balance of the production accruing to the owners of royalties. For example, the owner of a 100% working interest in a lease burdened only by a landowner's royalty of 12.5% would be required to pay 100% of the costs of a well but would be entitled to retain 87.5% of the production.
"Workover" means operations on a producing well to restore or increase production.
5
PART I
ITEMS 1 and 2. BUSINESS AND PROPERTIES
We are an independent energy company operating primarily in the Haynesville shale, a premier natural gas basin located in North Louisiana and East Texas with superior economics given its geographical proximity to the Gulf Coast markets. As of December 31, 2020, 95% of our proved reserves were in the Haynesville and Bossier shale play and we are the largest producer of natural gas in that basin. We are focused on creating value through the development of our substantial inventory of highly economic and low-risk drilling opportunities in the Haynesville and Bossier shales. Our common stock is listed and traded on the New York Stock Exchange under the symbol "CRK".
On August 14, 2018, Arkoma Drilling, L.P. and Williston Drilling, L.P. (collectively, the "Jones Partnerships") contributed certain oil and gas properties in North Dakota and Montana in exchange for 88,571,429 newly issued shares of our common stock representing 84% of our then outstanding common stock (the "Jones Contribution"). The Jones Partnerships are wholly owned and controlled by Dallas businessman Jerry Jones and his children (collectively, the "Jones Group"). References to "Successor" or "Successor Company" relate to the operations of us and our subsidiaries (the "Company") subsequent to the Jones Contribution on August 13, 2018. Reference to "Predecessor" or "Predecessor Company" relate to the operations of the Company on or prior to August 13, 2018.
On July 16, 2019, we acquired Covey Park Energy LLC ("Covey Park") in a cash and stock transaction valued at approximately $2.2 billion (the "Covey Park Acquisition"). Covey Park was a privately held Haynesville shale focused company producing approximately 710 MMcfe per day. The Covey Park Acquisition meaningfully increased our scale, more than doubling our asset base and created significant financial and operational efficiencies.
Our oil and gas operations are primarily concentrated in Louisiana, Texas and North Dakota. Our oil and natural gas properties are estimated to have proved reserves of 5.6 Tcfe with an SEC PV 10 Value of $2.0 billion as of December 31, 2020. Our proved oil and natural gas reserve base is 99% natural gas and 1% oil and was 36% developed as of December 31, 2020, and our properties have an average reserve life of approximately 12 years.
Strengths
High Quality Properties. As of December 31, 2020, we have accumulated 410,644 acres (323,044 net) in the Haynesville and Bossier shale plays, located in North Louisiana and Texas. Approximately 93% of our Haynesville/Bossier shale net acreage is held-by-production and our Haynesville/Bossier shale properties have extensive development and exploration potential. Advances in drilling and completion technology over the last six years have allowed us to increase the reserves recovered through longer horizontal lateral length and substantially larger well stimulation. As a result of the improved economic returns, we have focused our development activities primarily on drilling Haynesville and Bossier horizontal wells since 2015.
Our Haynesville and Bossier shale positions in North Louisiana and East Texas are located in one of the premier North American natural gas shale plays and have access to the Gulf Coast market demand related to LNG exports and the petrochemical industry due to its geographic proximity. We believe we are well positioned for future growth due to the following:
•De-risked, contiguous and prolific oil and natural gas resources. The Haynesville and Bossier shale plays have been substantially delineated since 2008 through the drilling of over 5,700 horizontal wells. We believe that these shale plays represent some of the most consistent and economic natural gas development drilling opportunities in North America.
•Management and operating team with extensive experience in developing the Haynesville and Bossier shale plays. We were among the first exploration and production companies to effectively apply horizontal drilling techniques in the Haynesville and Bossier shales beginning in 2007. Since then, our management and operating team have executed drilling programs in the Haynesville and Bossier shales based on enhanced completion well designs that have significantly improved the economics of these wells. When combining our historical activity with Covey Park, we have drilled and completed 268 (212.4 net) operated wells from 2015 through 2020, more wells than any other operator targeting the Haynesville or Bossier shale.
6
•Attractive economic returns. The Haynesville and Bossier shales offer highly economic and low-risk drilling opportunities through application of advanced drilling and completion technologies, including the use of longer laterals, and high intensity fracture stimulation using tighter frac stages and higher proppant loading. Our management and operating team has been instrumental in developing and optimizing some of the most effective completion techniques in the Haynesville and Bossier shales and such completion techniques have resulted in a substantial improvement in initial production rates and recoverable reserves, which has resulted in some of the highest single well rates of return when compared to results from other natural gas basins in North America.
•Proximity to premium natural gas markets. Our natural gas production benefits from the strong regional Gulf Coast demand growth driven by a substantial increase in LNG exports, exports to Mexico and new or expanded petrochemical facilities. Producers, such as us, with access to the Gulf Coast natural gas markets are receiving higher net realized prices than most producers in other regions. We are also able to realize higher margins due to our ability to access the extensive midstream infrastructure at attractive rates and lack of above-market midstream commitments.
Value-Added Acquisitions. We closed the Covey Park Acquisition in July 2019 for $2.2 billion. The acquisition included approximately 249,000 net acres and 2.9 Tcfe of proved reserves, and added over 710 MMcfe per day of production and approximately 1,200 future drilling locations. In November 2019, we acquired a private company for $42.3 million in an all-stock transaction, which included approximately 3,155 net acres, 75 (20.1 net) producing wells and 44 (12.7 net) Haynesville/Bossier shale future drilling locations.
Successful Drilling Program. We spent $483.6 million on development activities in 2020, exclusively in the Haynesville and Bossier shale. We spent $436.1 million on drilling and completing horizontal Haynesville and Bossier shale wells and an additional $34.5 million million on other development activity. We drilled 71 (47.4 net) horizontal Haynesville and Bossier wells in 2020, which had an average lateral length of approximately 9,000 feet. Our drilling program in 2020 allowed us to replace 159% of our 2020 production, excluding price-related revisions to our proved reserves.
Efficient Operator. We operated 97% of our proved reserve base as of December 31, 2020. As the operator, we are better able to control operating costs, the timing and plans for future development, the level of drilling and lifting costs, and the marketing of production. As an operator, we receive reimbursements for overhead from other working interest owners, which reduces our general and administrative expenses. In 2020 we were able to reduce the drilling costs of our horizontal wells with lateral lengths over 8,000 feet to $1,026 per completed lateral foot as compared to $1,215 in 2019.
Business Strategy
Our strategy consists of the following principal elements:
•Prudently grow free cash flow, production and reserves through development of our high-quality inventory of drilling locations. We have an extensive inventory of de-risked, high-return drilling locations prospective for the Haynesville and Bossier shales. As of December 31, 2020 we have identified 3,799 drilling locations (1,953 net to us) which gives us years of drilling activity. 73% of the locations are extended laterals in excess of 5,000 feet. Since substantially all of these locations are on acreage that is held by production, we have the ability to allocate capital among projects in a manner that optimizes both costs and returns, resulting in a highly efficient drilling program. We intend to manage the selection of drilling locations and the timing of development and associated capital expenditures to support our conservative operating plan to generate modest growth and free cash flow to support deleveraging our balance sheet.
•Enhance returns on capital through a focus on optimizing full-cycle economics. We focus on enhancing our return on capital deployed by focusing on optimizing our already industry leading low operating cost structure and by continuing to reduce our drilling and completion costs. We continually monitor and adjust our drilling and completion and operating procedures on a regular basis with the objective of achieving the most economical returns on our portfolio of drilling opportunities. We believe that we will achieve this objective by (i) minimizing our costs to drill and complete wells, (ii) maximizing well production and recoveries by optimizing lateral length, the number of frac stages, perforation intervals and the type of fracture stimulation employed, (iii) producing near
7
pipeline-quality natural gas, which leads to lower processing costs, and (iv) minimizing operating costs through efficient well management.
We maintain an active oil and natural gas price hedging program designed to mitigate volatility in oil and natural gas prices and to protect a portion of our expected future cash flows to insure that we have adequate cash flow to meet our financial obligations.
•Evaluate and pursue strategic acquisition opportunities to grow our reserves, production, and acreage position. We intend to leverage our management and operating team's significant technical expertise and experience in the Haynesville shale to continue to pursue acquisition opportunities in our region and to successfully execute and integrate acquisitions that will add to our drilling inventory. We plan to continue to pursue strategic acquisitions that complement our high quality asset base like the Covey Park Acquisition and acquire complimentary acreage with an active leasing program.
•Maintain disciplined financial strategy. We intend to maintain a conservative operating plan in 2021 with the primary goal of improving our balance sheet. We will measure progress of achieving this objective by the improvement to our leverage ratio and the level of free cash flow we generate in 2021. Our low operating cost structure combined with maximizing the capital efficiency of our drilling program and maintaining financial discipline should allow us to achieve this goal.
Primary Operating Areas
The following tables summarize the estimated proved oil and natural gas reserves as of December 31, 2020 for our primary operating areas:
| Oil (MBbls) | Natural Gas (MMcf)(1) | Total (MMcfe)(1) | PV 10 Value (000's)(2) | |||||||||||||||||||||||
| Haynesville/Bossier Shale | 86 | 5,366,033 | 5,366,547 | $ | 1,867,505 | |||||||||||||||||||||
| Bakken Shale | 10,429 | 38,385 | 100,961 | $ | 80,132 | |||||||||||||||||||||
| Other | 485 | 158,458 | 161,367 | $ | 43,608 | |||||||||||||||||||||
| Total | 11,000 | 5,562,876 | 5,628,875 | $ | 1,991,245 | |||||||||||||||||||||
_______________
(1)Natural gas volumes include NGLs. Oil and NGLs are converted to natural gas equivalents by using a conversion factor of one barrel of oil or NGLs for six Mcf of natural gas based upon the approximate relative energy content of oil to natural gas, which is not indicative of oil and natural gas prices.
(2)The PV 10 Value represents the discounted future net cash flows attributable to our proved oil and gas reserves before income tax, discounted at 10%. Although it is a non-GAAP measure, we believe that the presentation of PV 10 Value is relevant and useful to our investors because it presents the discounted future net cash flows attributable to our proved reserves prior to taking into account corporate future income taxes and our current tax structure. We use this measure when assessing the potential return on investment related to our oil and gas properties. The standardized measure of discounted future net cash flows represents the present value of future cash flows attributable to our proved oil and gas reserves after income tax, discounted at 10%.
Production for each of our primary operating areas for the last three years was as follows:
| Predecessor | Successor | ||||||||||||||||||||||||||||
| Period from January 1, 2018 through August 13, 2018 | Period from August 14, 2018 through December 31, 2018 | Year Ended December 31, 2019 | Year Ended December 31, 2020 | ||||||||||||||||||||||||||
| Natural Gas (MMcf): | |||||||||||||||||||||||||||||
| Haynesville/Bossier Shale | 52,021 | 39,413 | 275,832 | 425,493 | |||||||||||||||||||||||||
| Bakken Shale | — | 3,855 | 6,106 | 7,066 | |||||||||||||||||||||||||
| Other | 3,219 | 1,763 | 10,896 | 18,277 | |||||||||||||||||||||||||
| Total | 55,240 | 45,031 | 292,834 | 450,836 | |||||||||||||||||||||||||
| Oil (MBbls): | |||||||||||||||||||||||||||||
| Haynesville/Bossier Shale | — | — | 6 | 8 | |||||||||||||||||||||||||
| Bakken Shale | — | 1,364 | 2,465 | 1,418 | |||||||||||||||||||||||||
| Other | 287 | 21 | 214 | 82 | |||||||||||||||||||||||||
| Total | 287 | 1,385 | 2,685 | 1,508 | |||||||||||||||||||||||||
| Total (MMcfe): | |||||||||||||||||||||||||||||
| Haynesville/Bossier Shale | 52,021 | 39,413 | 275,869 | 425,544 | |||||||||||||||||||||||||
| Bakken Shale | — | 12,037 | 20,896 | 15,572 | |||||||||||||||||||||||||
| Other | 4,942 | 1,888 | 12,179 | 18,767 | |||||||||||||||||||||||||
| Total | 56,963 | 53,338 | 308,944 | 459,883 | |||||||||||||||||||||||||
8
Haynesville/Bossier Shale
Approximately 95%, or 5.4 Tcfe of our proved reserves, are in the Haynesville and Bossier shales in North Louisiana and East Texas, where we own interests in 1,176 producing wells (660.0 net). We operate 734 of these wells. The wells produce from the Bossier shale at depths of 10,500 to 12,100 feet and from the Haynesville shale at depths from 10,500 to 12,950 feet. Our production from the Haynesville and Bossier shale averaged 1,163 MMcfe of natural gas per day in 2020. We spent $436.1 million in 2020 drilling 71 wells (47.4 net) and completing 18 wells (12.2 net) that were drilled in 2019. We also spent $28.3 million on other development activity on these properties in 2020. We currently plan to focus substantially all of our drilling activities in 2021 on the Haynesville and Bossier shales. Under our current operating plan, we expect to drill 62 operated wells (51.0 net) and to complete an additional 19 wells (17.4 net) we drilled in 2020.
Bakken Shale
Approximately 2% (17 MMBOE) of our proved reserves are located in North Dakota and Montana, where we own interests in 429 producing wells (66.7 net) which produce from the Bakken shale. The Bakken shale proved reserves are 62% oil and represent 4% of our PV 10 Value. We acquired 403 non-operated wells (60.3 net) in the Bakken shale with the Jones Contribution. Net daily production rates from our Bakken shale properties averaged 3,873 Bbls of oil and 19.3 MMcf of natural gas per day in 2020.
Other Regions
Approximately 19.8 Bcfe of our proved reserves are located primarily in the Cotton Valley formations in East Texas and North Louisiana, where we own interests in 903 producing wells (591.1 net). These wells produce from multiple sands at a depth of 8,000 to 10,000 feet. We operate 637 of these wells. Our Cotton Valley wells averaged 13.8 MMcf of natural gas per day and 131 Bbls of oil per day in 2020.
Our remaining proved reserves in other regions are located primarily in Texas, the Mid-Continent region and New Mexico. We own interests in 356 producing wells (135.9 net) within these regions. Net daily production from our other regions during 2020 totaled 36.2 MMcf of natural gas and 92 Bbls of oil per day.
Oil and Natural Gas Reserves
The following table sets forth our estimated proved oil and natural gas reserves as of December 31, 2020:
| Oil (MBbls) | Natural Gas (MMcf)(1) | Total (MMcfe)(1) | PV 10 Value (000's)(2) | ||||||||||||||||||||
| Proved Developed: | |||||||||||||||||||||||
| Producing | 10,783 | 1,943,601 | 2,008,300 | $ | 1,324,908 | ||||||||||||||||||
| Non-producing | 217 | 23,687 | 24,987 | 6,720 | |||||||||||||||||||
| Total Proved Developed | 11,000 | 1,967,288 | 2,033,287 | 1,331,628 | |||||||||||||||||||
| Proved Undeveloped | — | 3,595,588 | 3,595,588 | 659,617 | |||||||||||||||||||
| Total Proved | 11,000 | 5,562,876 | 5,628,875 | 1,991,245 | |||||||||||||||||||
| Discounted Future Income Taxes | (55,520) | ||||||||||||||||||||||
| Standardized Measure of Discounted Cash Flows | $ | 1,935,725 | |||||||||||||||||||||
______________
(1)Natural gas volumes include NGLs. Oil and NGLs are converted to natural gas equivalents by using a conversion factor of one barrel of oil or NGLs for six Mcf of natural gas based upon the approximate relative energy content of oil to natural gas, which is not indicative of oil and natural gas prices.
(2)The PV 10 Value represents the discounted future net cash flows attributable to our proved oil and gas reserves before income tax, discounted at 10%. Although it is a non-GAAP measure, we believe that the presentation of PV 10 Value is relevant and useful to our investors because it presents the discounted future net cash flows attributable to our proved reserves prior to taking into account corporate future income taxes and our current tax structure. We use this measure when assessing the potential return on investment related to our oil and gas properties. The standardized measure of discounted future net cash flows represents the present value of future cash flows attributable to our proved oil and gas reserves after income tax, discounted at 10%.
9
The following table sets forth our year end reserves as of December 31 for each of the last three fiscal years:
2018 | 2019 | 2020 | |||||||||||||||||||||||||||||||||
| Oil (MBbls) | Natural Gas (MMcf) (1) | Oil (MBbls) | Natural Gas (MMcf) (1) | Oil (MBbls) | Natural Gas (MMcf) (1) | ||||||||||||||||||||||||||||||
| Proved Developed | 21,466 | 583,107 | 15,104 | 1,890,357 | 11,000 | 1,967,288 | |||||||||||||||||||||||||||||
| Proved Undeveloped | 2,146 | 1,699,651 | 1,643 | 3,451,140 | — | 3,595,588 | |||||||||||||||||||||||||||||
| Total Proved Reserves | 23,612 | 2,282,758 | 16,747 | 5,341,497 | 11,000 | 5,562,876 | |||||||||||||||||||||||||||||
______________
(1)Natural gas volumes include NGLs. NGLs are converted to natural gas equivalents by using a conversion factor of one barrel of NGLs for six Mcf of natural gas based upon the approximate relative energy content.
Proved reserves that are attributable to existing producing wells are primarily determined using decline curve analysis and rate transient analysis, which incorporates the principles of hydrocarbon flow. Proved reserves attributable to producing wells with limited production history and for undeveloped locations are estimated using performance from analogous wells in the surrounding area and geologic data to assess the reservoir continuity. Technologies relied on to establish reasonable certainty of economic producibility include electrical logs, radioactivity logs, core analyses, geologic maps and available production data, seismic data and well test data.
There are numerous uncertainties inherent in estimating quantities of proved oil and natural gas reserves. Oil and natural gas reserve engineering is a subjective process of estimating underground accumulations of oil and natural gas that cannot be precisely measured. The accuracy of any reserve estimate is a function of the quality of available data and of engineering and geological interpretation and judgment. Results of drilling, testing and production subsequent to the date of the estimate may justify revision of such estimate. Accordingly, reserve estimates are often different from the quantities of oil and natural gas that are ultimately recovered.
Prices used in determining quantities of oil and natural gas reserves and future cash inflows from oil and natural gas reserves represent the average first of the month prices received at the point of sale for the last twelve months. These prices have been adjusted from posted prices for both location and quality differences. The oil and natural gas prices used for reserves estimation were as follows:
| Year | Oil Price (per Bbl) | Natural Gas Price (per Mcf) | ||||||||||||
| 2018 | $61.21 | $2.90 | ||||||||||||
| 2019 | $55.69 | $2.58 | ||||||||||||
| 2020 | $39.57 | $1.99 | ||||||||||||
The average prices that we realized from sales of oil and natural gas and the associated lifting costs for each of the last three fiscal years were as follows:
| Predecessor | Successor | |||||||||||||||||||||||||
| Period from January 1, 2018 through August 13, 2018 | Period from August 14, 2018 through December 31, 2018 | Year Ended December 31, 2019 | Year Ended December 31, 2020 | |||||||||||||||||||||||
| Oil Price - $/Bbl | $65.23 | $57.34 | $49.49 | $32.36 | ||||||||||||||||||||||
| Natural Gas Price - $/Mcf | $2.68 | $3.20 | $2.17 | $1.80 | ||||||||||||||||||||||
| Lifting Costs - $/Mcfe | ||||||||||||||||||||||||||
| Lease operating | $0.34 | $0.37 | $0.27 | $0.22 | ||||||||||||||||||||||
| Gathering and transportation | $0.21 | $0.20 | $0.23 | $0.23 | ||||||||||||||||||||||
| Production taxes | $0.06 | $0.21 | $0.09 | $0.05 | ||||||||||||||||||||||
| Ad valorem taxes | $0.03 | $0.02 | $0.02 | $0.03 | ||||||||||||||||||||||
Reserves may be classified as proved undeveloped if there is a high degree of confidence that the quantities will be recovered, and they are scheduled to be drilled within five years of their initial inclusion as proved reserves, unless specific circumstances justify a longer time. In connection with estimating proved undeveloped reserves for our reserve report, reserves on undrilled acreage were limited to those that are reasonably certain of production when drilled where we can verify the continuity of the reservoir. We only include wells in our proved undeveloped reserves
10
that we currently plan to drill and in which we have adequate capital resources to enable us to drill them. Using empirical evidence, we utilize control points and sample sizes to show continuity in the reservoir. We reflect changes to undeveloped reserves that occur in the same field as revisions to the extent that proved undeveloped locations are revised due to changes in future development plans, including changes to proposed lateral lengths, development spacing and timing of development. As of December 31, 2020, our proved undeveloped reserves did not include any undrilled wells with a rate of return less than 10%.
As of December 31, 2020, our proved undeveloped reserves were comprised of 3.6 Tcf of natural gas consisting of 371 undeveloped locations. All of our natural gas undeveloped reserves are associated with our Haynesville and Bossier shale properties where our 2020 drilling program was focused. Our natural gas proved undeveloped reserves increased by 144.4 Bcf during 2020. 50 proved undeveloped locations included in our 2019 reserves were converted to proved developed reserves in 2020. Our 2019 proved undeveloped oil reserves were removed from proved reserves in 2020 due to the low oil price that was used to determine proved reserves at December 31, 2020.
As of December 31, 2019, our proved undeveloped reserves were comprised of 1.6 million Bbls of oil and 3.5 Tcf of natural gas. We had proved undeveloped oil reserves of 1.2 million Bbls associated with our Eagle Ford shale properties and 0.4 million Bbls associated with our Bakken shale properties. Most of our natural gas undeveloped reserves were associated with our Haynesville and Bossier shale properties where our 2019 drilling program was focused. Our natural gas proved undeveloped reserves increased by 1.7 Tcf during 2019. This increase was primarily related to acquisitions including reserve additions associated with the Covey Park Acquisition of 1.9 Bcfe that were partially offset by 0.2 Bcfe of proved undeveloped conversions. During 2019, 38 proved undeveloped locations were converted to proved developed reserves.
As of December 31, 2019, our estimates of proved undeveloped reserves included 246.1 Bcfe related to undrilled wells that had positive undiscounted future cash flows but which, based upon natural gas prices that we used to prepare reserve estimates in accordance with SEC guidelines, had a rate of return that is less than the 10% discount rate used in the Standardized Measure. We anticipated drilling such wells on December 31, 2019 based on our expectation of future oil and natural gas prices. To the extent that oil or natural gas prices are substantially weaker than our expectations, we likely would not recover our investment in drilling these wells from future cash flows.
The following table presents the changes in our estimated proved undeveloped oil and natural gas reserves for the years ended December 31, 2018, 2019 and 2020:
| Proved Undeveloped Reserves | |||||||||||||||||||||||||||||||||||
2018 | 2019 | 2020 | |||||||||||||||||||||||||||||||||
| Oil (MBbls) | Natural Gas (MMcf) | Oil (MBbls) | Natural Gas (MMcf) | Oil (MBbls) | Natural Gas (MMcf) | ||||||||||||||||||||||||||||||
| Beginning Balance | — | 680,842 | 2,146 | 1,699,651 | 1,643 | 3,451,140 | |||||||||||||||||||||||||||||
| Jones Contribution | 502 | 1,061 | — | — | — | — | |||||||||||||||||||||||||||||
| Divestitures | (4,002) | (74,297) | — | (25,179) | — | — | |||||||||||||||||||||||||||||
| Acquisitions | — | 204,414 | — | 1,853,820 | — | — | |||||||||||||||||||||||||||||
| Extension and Discoveries | 5,646 | 952,152 | — | — | — | 213,658 | |||||||||||||||||||||||||||||
| Conversion from Undeveloped to Developed | — | (128,692) | (247) | (188,894) | (50) | (343,735) | |||||||||||||||||||||||||||||
| Revisions | — | 64,171 | (256) | 111,742 | (1,593) | 274,525 | |||||||||||||||||||||||||||||
| Total Change | 2,146 | 1,018,809 | (503) | 1,751,489 | (1,643) | 144,448 | |||||||||||||||||||||||||||||
| Ending Balance | 2,146 | 1,699,651 | 1,643 | 3,451,140 | — | 3,595,588 | |||||||||||||||||||||||||||||
11
The timing, by year, when our proved undeveloped reserve quantities are estimated to be converted to proved developed reserves is as follows:
| Proved Undeveloped Reserves | ||||||||||||||||||||||||||||||||||||||
2018 | 2019 | 2020 | ||||||||||||||||||||||||||||||||||||
| Year ended December 31, | Oil (MBbls) | Natural Gas (MMcf) | Oil (MBbls) | Natural Gas MMcf) | Oil (MBbls) | Natural Gas (MMcf) | ||||||||||||||||||||||||||||||||
| 2019 | 966 | 214,481 | — | — | — | — | ||||||||||||||||||||||||||||||||
| 2020 | 147 | 385,209 | 58 | 363,900 | — | — | ||||||||||||||||||||||||||||||||
| 2021 | 378 | 487,265 | 1,327 | 578,067 | — | 724,329 | ||||||||||||||||||||||||||||||||
| 2022 | 190 | 368,696 | 122 | 795,598 | — | 639,934 | ||||||||||||||||||||||||||||||||
| 2023 | 465 | 244,000 | 136 | 956,162 | — | 705,390 | ||||||||||||||||||||||||||||||||
| 2024 | — | — | — | 757,413 | — | 721,268 | ||||||||||||||||||||||||||||||||
| 2025 | — | — | — | — | — | 804,667 | ||||||||||||||||||||||||||||||||
| Total | 2,146 | 1,699,651 | 1,643 | 3,451,140 | — | 3,595,588 | ||||||||||||||||||||||||||||||||
The following table presents the timing of our estimated future development capital costs to be incurred for the years ended December 31, 2018, 2019 and 2020:
| Future Development Costs Total Proved Undeveloped Reserves | ||||||||||||||||||||
2018 | 2019 | 2020 | ||||||||||||||||||
| Year ended December 31, | (in millions) | |||||||||||||||||||
| 2019 | $ | 193.4 | $ | — | $ | — | ||||||||||||||
| 2020 | 364.3 | 286.9 | — | |||||||||||||||||
| 2021 | 516.9 | 566.6 | 445.6 | |||||||||||||||||
| 2022 | 431.6 | 758.6 | 438.0 | |||||||||||||||||
| 2023 | 276.4 | 918.7 | 519.2 | |||||||||||||||||
| 2024 | — | 640.6 | 499.6 | |||||||||||||||||
| 2025 | — | — | 549.9 | |||||||||||||||||
| Total | $ | 1,782.6 | $ | 3,171.4 | $ | 2,452.3 | ||||||||||||||
The following table presents the changes in our estimated future development costs for the years ended December 31, 2019 and December 31, 2020:
| (in millions) | |||||
| Total as of December 31, 2018 | $1,782.6 | ||||
| Development Costs Incurred | (311.3) | ||||
| Asset Disposals | (16.0) | ||||
| Jones Contribution | 1,573.7 | ||||
| Asset Acquisitions | 142.4 | ||||
| Total Changes | 1,388.8 | ||||
| Total as of December 31, 2019 | 3,171.4 | ||||
| Development Costs Incurred | (302.1) | ||||
| Additions and Revisions | (417.0) | ||||
| Total Changes | (719.1) | ||||
| Total as of December 31, 2020 | $2,452.3 | ||||
Our estimated future capital costs to develop proved undeveloped reserves as of December 31, 2020 of $2.5 billion decreased by $0.7 billion from our estimated future capital costs of $3.2 billion as of December 31, 2019. This decrease is primarily attributable to lower expected development costs related to the proved undeveloped Haynesville and Bossier shale locations.
Our estimated future capital costs to develop proved undeveloped reserves as of December 31, 2019 of $3.2 billion increased by $1.4 billion from our estimated future capital costs of $1.8 billion as of December 31, 2018. This increase was primarily attributable to future development costs related to the proved undeveloped Haynesville and Bossier shale locations from the Covey Park Acquisition.
12
We performed an analysis to compare our proved reserve estimates as of December 31, 2020 to oil and natural gas reserves using a $43.33 per Bbl oil price and $2.46 per Mcf natural gas price, which represents our expected realized prices based on $50.00 per Bbl NYMEX index oil price and a $2.75 per Mcf NYMEX index natural gas price ("Alternative Price Case") to show the sensitivity of our oil and natural gas reserves to price fluctuations. All factors other than the oil and natural gas price assumptions have been held constant with the average first of the month pricing for the last twelve months ("SEC Prices"), including the number of proved undeveloped locations, drill schedules and operating cost assumptions. This sensitivity analysis is only meant to demonstrate the impact that changing oil and natural gas prices may have on our proved oil and natural gas reserves and the related PV 10 Value and there is no assurance this outcome will be realized. Our proved oil and natural gas reserves utilizing SEC Prices and utilizing Alternative Prices are as follows:
| SEC Case | Alternative Price Case | |||||||||||||
| Oil (MBbls) | ||||||||||||||
| Proved Developed | 11,000 | 12,303 | ||||||||||||
| Proved Undeveloped | — | 15 | ||||||||||||
| Total | 11,000 | 12,318 | ||||||||||||
Natural Gas (MMcf) (1) | ||||||||||||||
| Proved Developed | 1,967,288 | 2,058,257 | ||||||||||||
| Proved Undeveloped | 3,595,588 | 3,640,143 | ||||||||||||
| Total | 5,562,876 | 5,698,400 | ||||||||||||
Total Proved Reserves (MMcfe) (1) | 5,628,875 | 5,772,306 | ||||||||||||
PV 10 Value (000's) (2) | $ | 1,991,245 | $ | 4,356,857 | ||||||||||
______________
(1)Natural gas volumes include NGLs. Oil and NGLs are converted to natural gas equivalents by using a conversion factor of one barrel of oil or NGLs for six Mcf of natural gas based upon the approximate relative energy content of oil to natural gas, which is not indicative of oil and natural gas prices.
(2)The PV 10 Value represents the discounted future net cash flows attributable to our proved oil and gas reserves before income tax, discounted at 10%. Although it is a non-GAAP measure, we believe that the presentation of PV 10 Value is relevant and useful to our investors because it presents the discounted future net cash flows attributable to our proved reserves prior to taking into account corporate future income taxes and our current tax structure. We use this measure when assessing the potential return on investment related to our oil and gas properties.
Proved reserve information in this report is based on estimates prepared by our petroleum engineering staff and is the responsibility of management. We retained two independent petroleum consultants to conduct audits of our December 31, 2020 reserve estimates for both the SEC case and Alternative Price Case. Netherland, Sewell & Associates, Inc. ("NSAI") audited our Haynesville and Bossier shale properties and Lee Keeling and Associates, Inc. ("LKA") audited our other properties. The audited SEC case PV 10 Values were $1.9 billion by NSAI and $123.7 million by LKA, representing, in the aggregate, 100% of our total SEC case PV 10 Value as of December 31, 2020. The audited alternative price case PV 10 Values were $4.1 billion by NSAI and $251.5 million by LKA, representing, in the aggregate, 100% of our total alternative price case PV 10 Value as of December 31, 2020. The purpose of these audits was to provide additional assurance on the reasonableness of internally prepared reserve estimates. These engineering firms were selected for their geographic expertise and their historical experience.
The summary reserve reports prepared by our independent petroleum consultants are included as an exhibit to this report. The technical person at each independent petroleum consulting firm responsible for reviewing the reserve estimates presented herein meets the requirements regarding qualifications, independence, objectivity and confidentiality as set forth in the Standards Pertaining to the Estimating and Auditing of Oil and Gas Reserves Information promulgated by the Society of Petroleum Engineers.
The independent consultants' estimates of proved reserves and the pretax present value of such reserves discounted at 10% did not differ from our estimates by more than 5% in the aggregate. However, when compared on a lease-by-lease, field-by-field or area-by-area basis, some of our estimates may be greater than those of our independent consultants and some may be less than the estimates of the independent consultants. When such differences do not exceed 5% in the aggregate, our reserve auditors are satisfied that the proved reserves and pretax present value of such reserves discounted at 10% are reasonable and will issue an unqualified opinion. Remaining differences are not resolved due to the limited cost benefit of continuing such analysis. During the year, our reserves group also performs separate, detailed technical reviews of reserve estimates for significant acquisitions or for
13
properties with problematic indicators such as excessively long lives, sudden changes in performance or changes in economic or operating conditions.
We have established, and maintain, internal controls designed to provide reasonable assurance that the estimates of proved reserves are computed and reported in accordance with rules and regulations promulgated by the SEC. These internal controls include documented process workflows, employing qualified engineering and geological personnel, and on-going education for personnel involved in our reserves estimation process. Our internal audit function routinely tests our processes and controls. Throughout the year, our technical team meets periodically with representatives of our independent petroleum consultants to review properties and discuss methods and assumptions. We provide historical information to our consultants for our largest producing properties such as ownership interest, natural gas, NGLs and oil production, well test data, commodity prices and operating and development costs. In some cases, additional meetings are held to review identified reserve differences.
All of our reserve estimates are reviewed with our executive management, our independent consultants perform an independent analysis, and ultimately our reserve estimates are approved by our Senior Vice President of Corporate Development, David J. Terry. Mr. Terry holds a Bachelor of Science degree in Petroleum Engineering from Louisiana State University and has more than fifteen years of engineering experience in the oil and gas industry.
We did not provide estimates of total proved oil and natural gas reserves during the three year period ended December 31, 2020 to any federal authority or agency, other than the SEC.
Drilling Activity Summary
During the three-year period ended December 31, 2020, we drilled development and exploratory wells as set forth in the table below:
| 2018 | 2019 | 2020 | |||||||||||||||||||||||||||||||||
| Gross | Net | Gross | Net | Gross | Net | ||||||||||||||||||||||||||||||
| Development: | |||||||||||||||||||||||||||||||||||
| Oil | — | — | 4 | 2.2 | — | — | |||||||||||||||||||||||||||||
| Gas | 49 | 17.0 | 82 | 51.1 | 71 | 47.4 | |||||||||||||||||||||||||||||
| Dry | — | — | — | — | — | — | |||||||||||||||||||||||||||||
| 49 | 17.0 | 86 | 53.3 | 71 | 47.4 | ||||||||||||||||||||||||||||||
| Exploratory: | |||||||||||||||||||||||||||||||||||
| Oil | — | — | — | — | — | — | |||||||||||||||||||||||||||||
| Gas | — | — | — | — | — | — | |||||||||||||||||||||||||||||
| Dry | — | — | — | — | — | — | |||||||||||||||||||||||||||||
| — | — | — | — | — | — | ||||||||||||||||||||||||||||||
| Total | 49 | 17.0 | 86 | 53.3 | 71 | 47.4 | |||||||||||||||||||||||||||||
As of December 31, 2018, 2019 and 2020, we had 9 (6.1 net), 26 (18.1 net), and 26 (23.5 net), respectively, operated wells in the process of being drilled and completed.
14
Producing Well Summary
The following table sets forth the gross and net producing oil and natural gas wells in which we owned an interest at December 31, 2020:
| Oil | Natural Gas | ||||||||||||||||||||||
| Gross | Net | Gross | Net | ||||||||||||||||||||
| Louisiana | 14 | 3.7 | 1,241 | 634.1 | |||||||||||||||||||
| Montana | 1 | 0.2 | — | — | |||||||||||||||||||
| New Mexico | 1 | — | 88 | 13.6 | |||||||||||||||||||
| North Dakota | 428 | 66.5 | — | — | |||||||||||||||||||
| Oklahoma | 6 | 0.6 | 99 | 8.9 | |||||||||||||||||||
| Texas | 16 | 7.5 | 944 | 716.7 | |||||||||||||||||||
| Wyoming | — | — | 26 | 1.9 | |||||||||||||||||||
| Total | 466 | 78.5 | 2,398 | 1,375.2 | |||||||||||||||||||
We operate 1,480 of the 2,864 producing wells presented in the above table. As of December 31, 2020, we did not own an interest in any wells containing multiple completions, which means that a well is producing from more than one completed zone.
Acreage
The following table summarizes our developed and undeveloped leasehold acreage at December 31, 2020, all of which is onshore in the continental United States. We have excluded acreage in which our interest is limited to a royalty or overriding royalty interest.
| Developed | Undeveloped | ||||||||||||||||||||||
| Gross | Net | Gross | Net | ||||||||||||||||||||
| Louisiana | 210,979 | 158,363 | 33,699 | 23,295 | |||||||||||||||||||
| New Mexico | 12,757 | 2,739 | — | — | |||||||||||||||||||
| Oklahoma | 26,080 | 3,382 | — | — | |||||||||||||||||||
| Texas | 189,703 | 141,725 | 99,812 | 65,816 | |||||||||||||||||||
| Wyoming | 13,440 | 927 | — | — | |||||||||||||||||||
| Total | 452,959 | 307,136 | 133,511 | 89,111 | |||||||||||||||||||
As of December 31, 2020, our undeveloped acreage expires as follows:
| Gross | Net | ||||||||||||||||||||||
| 2021 | 2,275 | 2 | % | 1,747 | 2 | % | |||||||||||||||||
| 2022 | 1,885 | 1 | % | 1,524 | 2 | % | |||||||||||||||||
| 2023 | 4,910 | 4 | % | 3,983 | 5 | % | |||||||||||||||||
| 2024 | 119 | — | % | 82 | — | % | |||||||||||||||||
| 2025 | 13,286 | 10 | % | 7,424 | 8 | % | |||||||||||||||||
| Thereafter | 111,036 | 83 | % | 74,351 | 83 | % | |||||||||||||||||
| 133,511 | 100 | % | 89,111 | 100 | % | ||||||||||||||||||
Title to our oil and natural gas properties is subject to royalty, overriding royalty, carried and other similar interests and contractual arrangements customary in the oil and gas industry, liens incident to operating agreements and for current taxes not yet due and other minor encumbrances. All of our oil and natural gas properties are pledged as collateral under our bank credit facility. As is customary in the oil and natural gas industry, we are generally able to retain our ownership interest in undeveloped acreage by production from wells producing from a different reservoir, by drilling activity which establishes commercial reserves sufficient to maintain the lease, by payment of delay rentals or by the exercise of contractual extension rights.
15
Markets and Customers
The market for our production of oil and natural gas depends on factors beyond our control, including the extent of domestic production and imports of oil and natural gas, the proximity and capacity of natural gas pipelines and other transportation facilities, demand for oil and natural gas, the marketing of competitive fuels and the effects of state and federal regulation. The oil and gas industry also competes with other industries in supplying the energy and fuel requirements of industrial, commercial and individual consumers.
Our oil production is currently sold under short-term contracts with a duration of six months or less. The contracts require the purchasers to purchase the amount of oil production that is available at prices tied to the spot oil markets. Our natural gas production is primarily sold under contracts with various terms and priced on first of the month index prices or on daily spot market prices. We target selling approximately 70% of our natural gas on first of month index price, with the remaining 30% on daily spot market pricing. The percentage of natural gas sold on spot market pricing can be impacted when new wells commence production as such production is typically sold on spot market pricing during the month the well is first brought on line. Enterprise Products Operating and its subsidiaries, Southwest Energy L.P., Shell Oil Company and its subsidiaries and BP Energy and its subsidiaries, accounted for 19%, 15%, 15% and 10%, respectively, of our total 2020 sales. The loss of any of these customers would not have a material adverse effect on us as there is an available market for our crude oil and natural gas production from other purchasers.
We have entered into longer term marketing arrangements to ensure that we have adequate transportation to get our natural gas production in North Louisiana to the markets. As an alternative to constructing our own gathering and treating facilities, we have entered into a variety of gathering and treating agreements with midstream companies to transport our natural gas to the long-haul natural gas pipelines. We currently have agreements with two major natural gas marketing companies to provide us with firm transportation for an average of approximately 84,000 MMBtu per day for our natural gas production on the long-haul pipelines, which expire in October 2021. In 2019, we entered into a firm transportation contract with a major natural gas marketing company as an anchor shipper for 400,000 MMBtu per day for ten years for our North Louisiana natural gas production. We expect deliveries under this commitment to commence in the fourth quarter of 2021. To the extent we are not able to deliver the contracted natural gas volumes, we may be responsible for the transportation costs. Our production available to deliver under these agreements in North Louisiana is expected to exceed the firm transportation arrangements we have in place. In addition, the marketing company managing the firm transportation is required to use reasonable efforts to supplement our deliveries should we have a shortfall during the term of the agreements.
Competition
The oil and gas industry is highly competitive. Competitors include major oil companies, other independent energy companies and individual producers and operators, many of which have financial resources, personnel and facilities substantially greater than we do. We face intense competition for the acquisition of oil and natural gas properties and leases for oil and gas exploration.
Regulation
General. Various aspects of our oil and natural gas operations are subject to extensive and continually changing regulation, as legislation affecting the oil and natural gas industry is under constant review for amendment or expansion. Numerous departments and agencies, both federal and state, are authorized by statute to issue, and have issued, rules and regulations binding upon the oil and natural gas industry and its individual members. The Federal Energy Regulatory Commission, or "FERC", regulates the transportation and sale for resale of natural gas in interstate commerce pursuant to the Natural Gas Act of 1938, or "NGA", and the Natural Gas Policy Act of 1978, or "NGPA". In 1989, however, Congress enacted the Natural Gas Wellhead Decontrol Act, which removed all remaining price and nonprice controls affecting all "first sales" of natural gas, effective January 1, 1993, subject to the terms of any private contracts that may be in effect. While sales by producers of natural gas and all sales of crude oil, condensate and natural gas liquids can currently be made at uncontrolled market prices, in the future Congress could reenact price controls or enact other legislation with detrimental impact on many aspects of our business. Under the provisions of the Energy Policy Act of 2005 (the "2005 Act"), the NGA has been amended to prohibit any form of market manipulation with the purchase or sale of natural gas, and the FERC has issued new regulations that are intended to
16
increase natural gas pricing transparency. The 2005 Act has also significantly increased the penalties for violations of the NGA. The FERC has issued Order No. 704 et al. which requires a market participant to make an annual filing if it has sales or purchases equal to or greater than 2.2 million MMBtu in the reporting year to facilitate price transparency.
Regulation and transportation of natural gas. Our sales of natural gas are affected by the availability, terms and cost of transportation. The price and terms for access to pipeline transportation are subject to extensive regulation. The FERC requires interstate pipelines to provide open-access transportation on a not unduly discriminatory basis for similarly situated shippers. The FERC frequently reviews and modifies its regulations regarding the transportation of natural gas, with the stated goal of fostering competition within the natural gas industry.
Intrastate natural gas transportation is subject to regulation by state regulatory agencies. The Texas Railroad Commission has been changing its regulations governing transportation and gathering services provided by intrastate pipelines and gatherers. While the changes by these state regulators affect us only indirectly, they are intended to further enhance competition in natural gas markets. We cannot predict what further action the FERC or state regulators will take on these matters; however, we do not believe that we will be affected differently in any material respect than other natural gas producers with which we compete by any action taken.
Additional proposals and proceedings that might affect the natural gas industry are pending before Congress, the FERC, state commissions and the courts. The natural gas industry historically has been very heavily regulated; therefore, there is no assurance that the less stringent regulatory approach pursued by the FERC, Congress and state regulatory authorities will continue.
Federal leases. Some of our operations are located on federal oil and natural gas leases that are administered by the Bureau of Land Management ("BLM") of the United States Department of the Interior. These leases are issued through competitive bidding and contain relatively standardized terms. These leases require compliance with detailed Department of Interior and BLM regulations and orders that are subject to interpretation and change. These leases are also subject to certain regulations and orders promulgated by the Department of Interior's Bureau of Ocean Energy Management, Regulation & Enforcement ("BOEMRE"), through its Minerals Revenue Management Program, which is responsible for the management of revenues from both onshore and offshore leases. The Company's operations located on federal oil and natural gas leases are insignificant to its total operations and any Executive Orders related to federal oil and gas leases issued by the Biden administration are not expected to adversely affect our business, financial position and results of operations.
Oil and natural gas liquids transportation rates. Our sales of crude oil, condensate and natural gas liquids are not currently regulated and are made at market prices. In a number of instances, however, the ability to transport and sell such products is dependent on pipelines whose rates, terms and conditions of service are subject to FERC jurisdiction under the Interstate Commerce Act. In other instances, the ability to transport and sell such products is dependent on pipelines whose rates, terms and conditions of service are subject to regulation by state regulatory bodies under state statutes. The price received from the sale of these products may be affected by the cost of transporting the products to market.
The FERC's regulation of pipelines that transport crude oil, condensate and natural gas liquids under the Interstate Commerce Act is generally more light-handed than the FERC's regulation of natural gas pipelines under the NGA. FERC-regulated pipelines that transport crude oil, condensate and natural gas liquids are subject to common carrier obligations that generally ensure non-discriminatory access. With respect to interstate pipeline transportation subject to regulation of the FERC under the Interstate Commerce Act, rates generally must be cost-based, although settlement rates agreed to by all shippers are permitted and market-based rates are permitted in certain circumstances. Effective January 1, 1995, the FERC implemented regulations establishing an indexing system (based on inflation) for transportation rates governed by the Interstate Commerce Act that allowed for an increase or decrease in the transportation rates. The FERC's regulations include a methodology for such pipelines to change their rates through the use of an index system that establishes ceiling levels for such rates. The mandatory five year review in 2005 revised the methodology for this index to be based on Producer Price Index for Finished Goods (PPI-FG) plus 1.3 percent for the period July 1, 2006 through June 30, 2011. The mandatory five year review in 2012 revised the methodology for this index to be based on PPI-FG plus 2.65 percent for the period July 1, 2011 through June 30,
17
2016. The regulations provide that each year the Commission will publish the oil pipeline index after the PPI-FG becomes available.
With respect to intrastate crude oil, condensate and natural gas liquids pipelines subject to the jurisdiction of state agencies, such state regulation is generally less rigorous than the regulation of interstate pipelines. State agencies have generally not investigated or challenged existing or proposed rates in the absence of shipper complaints or protests. Complaints or protests have been infrequent and are usually resolved informally.
We do not believe that the regulatory decisions or activities relating to interstate or intrastate crude oil, condensate or natural gas liquids pipelines will affect us in a way that materially differs from the way it affects other crude oil, condensate and natural gas liquids producers or marketers.
Environmental regulations. We are subject to stringent federal, state and local laws. These laws, among other things, govern the issuance of permits to conduct exploration, drilling and production operations, the amounts and types of materials that may be released into the environment, the discharge and disposition of waste materials, the remediation of contaminated sites and the reclamation and abandonment of wells, sites and facilities. Numerous governmental departments issue rules and regulations to implement and enforce such laws, which are often difficult and costly to comply with and which carry substantial civil and even criminal penalties for failure to comply. Some laws, rules and regulations relating to protection of the environment may, in certain circumstances, impose strict liability for environmental contamination, rendering a person liable for environmental damages and cleanup cost without regard to negligence or fault on the part of such person. Other laws, rules and regulations may restrict the rate of oil and natural gas production below the rate that would otherwise exist or even prohibit exploration and production activities in sensitive areas. In addition, state laws often require various forms of remedial action to prevent pollution, such as closure of inactive pits and plugging of abandoned wells. The regulatory burden on the oil and natural gas industry increases our cost of doing business and consequently affects our profitability. These costs are considered a normal, recurring cost of our on-going operations. Our domestic competitors are generally subject to the same laws and regulations.
We believe that we are in substantial compliance with current applicable environmental laws and regulations and that continued compliance with existing requirements will not have a material adverse impact on our operations. Environmental laws and regulations have been subject to frequent changes over the years, and the imposition of more stringent requirements or new regulatory schemes such as carbon "cap and trade" or pricing programs could have a material adverse effect upon our capital expenditures, earnings or competitive position, including the suspension or cessation of operations in affected areas. The Biden administration has made, and is expected to make additional changes to applicable regulations, and in each case we expect changes to be more stringent than those of the prior administration. There are also costs associated with responding to changing regulations and policies, whether such regulations are more or less stringent. As such, there can be no assurance that material cost and liabilities will not be incurred in the future.
The Comprehensive Environmental Response, Compensation and Liability Act; or "CERCLA", imposes liability, without regard to fault, on certain classes of persons that are considered to be responsible for the release of a "hazardous substance" into the environment. These persons include the current or former owner or operator of the disposal site or sites where the release occurred and companies that disposed or arranged for the disposal of hazardous substances. Under CERCLA, such persons may be subject to joint and several liability for the cost of investigating and cleaning up hazardous substances that have been released into the environment, for damages to natural resources and for the cost of certain health studies. In addition, companies that incur liability frequently also confront third party claims because it is not uncommon for neighboring landowners and other third parties to file claims for personal injury and property damage allegedly caused by hazardous substances or other pollutants released into the environment from a polluted site. Many states have adopted similar statutes that impose liability for the release of hazardous substances and petroleum. In addition, from time to time the EPA, states, and other agencies make new findings that certain chemicals are potential environmental concerns, sometimes referred to as emerging contaminants. These agencies may also adjust risk based assessment or cleanup levels, in some instances, to be more stringent. The EPA and other agencies may impose new restrictions or cleanup requirements on such chemicals. We may incur costs to comply with such requirements.
18
The Federal Solid Waste Disposal Act, as amended by the Resource Conservation and Recovery Act of 1976, or "RCRA", regulates the generation, transportation, storage, treatment and disposal of hazardous wastes and can require cleanup of hazardous waste disposal sites. RCRA currently excludes drilling fluids, produced waters and other wastes associated with the exploration, development or production of oil and natural gas from regulation as "hazardous waste". Disposal of such non-hazardous oil and natural gas exploration, development and production wastes usually are regulated by state law. Other wastes handled at exploration and production sites or used in the course of providing well services may not fall within this exclusion. Moreover, stricter standards for waste handling and disposal may be imposed on the oil and natural gas industry in the future. From time to time, legislation is proposed in Congress that would revoke or alter the current exclusion of exploration, development and production wastes from RCRA's definition of "hazardous wastes", thereby potentially subjecting such wastes to more stringent handling, disposal and cleanup requirements. If such legislation were enacted, it could have a significant impact on our operating costs, as well as the oil and natural gas industry in general. The impact of future revisions to environmental laws and regulations cannot be predicted.
Certain oil and gas wastes may also contain naturally occurring radioactive materials ("NORM"), which is regulated by the federal Occupational Safety and Health Administration and state agencies. These regulations require certain worker protections and waste handling and disposal procedures. We believe our operations comply in all material respects with these worker protection and waste handling and disposal requirements.
Our operations are also subject to the Clean Air Act, or "CAA", and comparable state and local requirements. Amendments to the CAA were adopted in 1990 and contain provisions that may result in the gradual imposition of certain pollution control requirements with respect to air emissions from our operations. On April 17, 2012, the U.S. Environmental Protection Agency or "EPA" promulgated new emission standards for the oil and gas industry. These rules require a nearly 95 percent reduction in volatile organic compounds ("VOCs") emitted from hydraulically fractured gas wells by January 1, 2015, primarily through the use of "green completions" (i.e., capturing natural gas that currently escapes to the air). These rules also have notification and reporting requirements. In 2014, EPA revised the emission requirements for storage tanks emitting certain levels of VOCs requiring a 95% reduction of VOC emissions by April 15, 2014 and April 15, 2015 (depending upon the date of construction of the storage tank). In 2016, EPA finalized regulations that required further reductions specifically regarding methane emissions, but in September 2020, EPA published a rule that revised the VOC requirements and rescinded the methane requirements. EPA also revised its interpretation of the CAA, such that, in order to impose the methane emission requirements, it would need to first make a Significant Contribution Finding for each particular pollutant for the specific source. While the 2020 rules may pose hurdles for EPA to reinstate these requirements, the Biden administration issued an Executive Order calling for such regulations to be proposed by September 2021. There are costs associated with following the status and impacts of these regulatory changes, and implementing any changes as they become effective. However, we believe our operations will not be materially adversely affected by new or reinstated requirements, and the requirements are not expected to be any more burdensome to us than to other similarly situated companies involved in oil and natural gas exploration and production activities.
The Federal Water Pollution Control Act of 1972, as amended, or the "Clean Water Act", imposes restrictions and controls on the discharge of produced waters and other wastes into navigable waters. Permits must be obtained to discharge pollutants into state and federal waters and to conduct construction activities in waters and wetlands. Although recent regulatory changes have caused certain water features to be considered not jurisdictional, the Biden administration has targeted these changes for review, and may reverse or make other changes to these regulations. Certain state regulations and the general permits issued under the Federal National Pollutant Discharge Elimination System program prohibit the discharge of produced waters and sand, drilling fluids, drill cuttings and certain other substances related to the oil and natural gas industry into certain coastal and offshore waters, unless otherwise authorized. Further, the EPA has adopted regulations requiring certain oil and natural gas exploration and production facilities to obtain permits for storm water discharges. Costs may be associated with the treatment of wastewater or developing and implementing storm water pollution prevention plans. The Clean Water Act and comparable state statutes provide for civil, criminal and administrative penalties for unauthorized discharges for oil and other pollutants and impose liability on parties responsible for those discharges for the cost of cleaning up any environmental damage caused by the release and for natural resource damages resulting from the release. We believe that our operations comply in all material respects with the requirements of the Clean Water Act and state statutes enacted to control water pollution.
19
The Federal Safe Drinking Water Act of 1974, as amended, requires EPA to develop minimum federal requirements for Underground Injection Control ("UIC") programs and other safeguards to protect public health by preventing injection wells from contaminating underground sources of drinking water. The UIC program does not regulate wells that are solely used for production. However, EPA has authority to regulate hydraulic fracturing when diesel fuels are used in fluids or propping agents. In February 2014, EPA issued guidance on when UIC permitting requirements apply to fracking fluids containing diesel. We believe that our operations comply in all material respects with the requirements of the Federal Safe Drinking Water Act and similar state statutes. We believe the requirements are not any more burdensome to us than to other similarly situated companies involved in oil and natural gas exploration and production activities.
State and federal regulatory agencies have studied possible connections between hydraulic fracturing related activities and the increased occurrence of seismic activity. When caused by human activity, such events are called induced seismicity. In a few instances, operators of injection wells in the vicinity of seismic events have been ordered to reduce injection volumes or suspend operations. Some state regulatory agencies, including those in Arkansas, California, Colorado, Illinois, Kansas, Ohio, Oklahoma, and Texas, have modified their regulations to account for induced seismicity. There continues to be research into the possible linkage between oil and gas activity and induced seismicity. A 2012 report published by the National Academy of Sciences, as well as a more recent paper published in the journal Reviews of Geophysics and cited on the US Geological Survey website, concluded that only a very small fraction of the tens of thousands of injection wells have been suspected to be, or have been, the likely cause of induced seismicity. In 2015, the United States Geological Survey identified eight states, including Texas, with areas of increased rates of induced seismicity that could be attributed to fluid injection or oil and gas extraction. In March 2016, the United States Geological Survey identified six states with the most significant hazards from induced seismicity, including Texas, Colorado, Oklahoma, Kansas, New Mexico, and Arkansas. In addition, a number of lawsuits have been filed, most recently in Oklahoma, alleging that disposal well operations have caused damage to or injury at nearby properties or otherwise violated state and federal rules regulating waste disposal. It is possible that the EPA or other agencies may develop rules to specifically address the disposal of wastewater from oil and gas development and the potential for induced seismicity from wastewater injection. Future regulatory developments could adversely affect our operations by placing restrictions on the use of injection wells and hydraulic fracturing and/or causing us to incur increased operating expenses.
In December 2016, the EPA finalized its report on the potential impacts of hydraulic fracturing on drinking water resources, which concluded that hydraulic fracturing activities could impact drinking water resources under some circumstances. Other governmental agencies, including the U.S. Department of Energy, have evaluated or are evaluating various other aspects of hydraulic fracturing. These ongoing or proposed studies have the potential to impact the likelihood or scope of future legislation or regulation.
Federal regulators require certain owners or operators of facilities that store or otherwise handle oil to prepare and implement spill prevention, control, countermeasure and response plans relating to the possible discharge of oil into surface waters. The Oil Pollution Act of 1990 ("OPA") contains numerous requirements relating to the prevention and response to oil spills in the waters of the United States. The OPA subjects owners of facilities to strict joint and several liability for all containment and cleanup costs and certain other damages relating to a spill. Noncompliance with OPA may result in varying civil and criminal penalties and liabilities.
Executive Order 13158, issued on May 26, 2000, directs federal agencies to safeguard existing Marine Protected Areas, or MPAs, in the United States and establish new MPAs. The order requires federal agencies to avoid harm to MPAs to the extent permitted by law and to the maximum extent practicable. It also directs the EPA to propose new regulations under the Clean Water Act to ensure appropriate levels of protection for the marine environment. This order has the potential to adversely affect our operations by restricting areas in which we may carry out future exploration and development projects and/or causing us to incur increased operating expenses.
Certain flora and fauna that have officially been classified as "threatened" or "endangered" are protected by the Endangered Species Act. This law prohibits any activities that could "take" a protected plant or animal or reduce or degrade its habitat area. If endangered species are located in an area we wish to develop, the work could be prohibited or delayed and/or expensive mitigation might be required.
20
Other statutes that provide protection to animal and plant species and which may apply to our operations include, but are not necessarily limited to, the Oil Pollution Act, the Emergency Planning and Community Right to Know Act, the Marine Mammal Protection Act, the Marine Protection, Research and Sanctuaries Act, the Fish and Wildlife Coordination Act, the Fishery Conservation and Management Act, the Migratory Bird Treaty Act and the National Historic Preservation Act. These laws and regulations may require the acquisition of a permit or other authorization before construction or drilling commences and may limit or prohibit construction, drilling and other activities on certain lands lying within wilderness or wetlands and other protected areas and impose substantial liabilities for pollution resulting from our operations. The permits required for our various operations are subject to revocation, modification and renewal by issuing authorities. In addition, laws such as the National Environmental Policy Act and the Coastal Zone Management Act may make the process of obtaining certain permits more difficult or time consuming, resulting in increased costs and potential delays that could affect the viability or profitability of certain activities. Administrative policies with respect to such laws are also changing, and we incur costs to follow such changes and comply as changes become effective.
Certain statutes such as the Emergency Planning and Community Right to Know Act require the reporting of hazardous chemicals manufactured, processed, or otherwise used, which may lead to heightened scrutiny of the company's operations by regulatory agencies or the public. In 2012, the EPA adopted a new reporting requirement, the Petroleum and Natural Gas Systems Greenhouse Gas Reporting Rule (40 C.F.R. Part 98, Subpart W), which requires certain onshore petroleum and natural gas facilities to begin collecting data on their emissions of greenhouse gases, or GHGs, in January 2012, with the first annual reports of those emissions due on September 28, 2012. GHGs include gases such as methane, a primary component of natural gas, and carbon dioxide, a byproduct of burning natural gas. Different GHGs have different global warming potentials with CO2 having the lowest global warming potential, so emissions of GHGs are typically expressed in terms of CO2 equivalents, or CO2e. The rule applies to facilities that emit 25,000 metric tons of CO2e or more per year, and requires onshore petroleum and natural gas operators to group all equipment under common ownership or control within a single hydrocarbon basin together when determining if the threshold is met. These greenhouse gas reporting rules were amended on October 22, 2015 to expand the number of sources and operations that are subject to these rules, and again on November 18, 2016 to provide less burdensome reporting requirements. We have determined that these reporting requirements apply to us and we believe we have met all of the EPA required reporting deadlines and strive to ensure accurate and consistent emissions data reporting. It is possible that these requirements may be more restrictive under the Biden administration. Other EPA actions with respect to the reduction of greenhouse gases (such as EPA's Greenhouse Gas Endangerment Finding, and EPA's Prevention of Significant Deterioration and Title V Greenhouse Gas Tailoring Rule) and various state actions have or could impose mandatory reductions in greenhouse gas emissions. We are unable to predict at this time how much the cost of compliance with any legislation or regulation of greenhouse gas emissions will be in future periods.
The U.S. has not passed legislation to expressly address GHGs; however, in recent years the EPA moved ahead with its efforts to regulate GHG emissions from certain sources by rule. Beyond requiring measurement and reporting of GHGs as discussed above, the EPA issued an "Endangerment Finding" under section 202(a) of the Clean Air Act, concluding greenhouse gas pollution threatens the public health and welfare of current and future generations. The EPA has adopted regulations that would require permits for and reductions in greenhouse gas emissions for certain facilities. States in which we operate may also require permits and reductions in GHG emissions. Additionally, the EPA published a set of final rules in 2016 that require reductions in VOC and methane generation from new sources. Although 2020 rule changes reduced these requirements, changes are anticipated in response to Executive Orders issued by the Biden administration. Additional regulations may still be forthcoming. Similarly, the Bureau of Land Management ("BLM") has proposed to suspend and revise a 2016 rule relating to methane venting, flaring, and leaks from oil and gas production on public lands that was being challenged by multiple western states and energy companies. In September 2018, the BLM published a final rule revising or rescinding certain provisions of the 2016 rule. The 2018 rule was challenged in federal court, and was vacated in 2020, but the court stayed its vacatur of the 2018 rule to allow for challenges to the 2016 rule to proceed. BLM did not defend the 2016 rule, and it was vacated. This decision may be further appealed, leaving the final outcome uncertain. Since all of our oil and natural gas production is in the United States, laws or regulations that have been or may be adopted to restrict or reduce emissions of greenhouse gases could require us to incur substantial increased operating costs, and could have an adverse effect on demand for the oil and natural gas we produce. In addition, efforts have been made and continue to be made in the international community toward the adoption of international treaties or protocols that would address global climate
21
change issues. Most recently in 2015, the United States participated in the United Nations Conference on Climate Change, which led to the creation of the Paris Agreement. The Paris Agreement requires ratifying countries to review and "represent a progression" in the ambitions of their nationally determined contributions, which set GHG emission reduction goals, every five years. The United States signed the Paris Agreement on April 22, 2016; although the Trump administration provided notice of its intent to withdraw from the Paris Agreement, the Biden administration is reinstating the United States' participation. It is difficult to predict the timing and certainty of any future government action and the effect on our operations. Future legislation or regulations adopted to address climate change could also make our products more or less desirable than competing sources of energy. However, we expect that the impacts to our operations will not be materially different from other similarly situated companies involved in oil and natural gas exploration and production activities.
In 2010, the BLM began implementation of a proposed oil and gas leasing reform that would increase environmental review requirements and was expected to have the effect of reducing the amount of new federal lands made available for lease, increasing the competition for and cost of available parcels. This leasing reform initiative was replaced by a new BLM policy, dated January 31, 2018, which is expected to remove the additional environmental review created under the 2010 initiative and streamline the leasing process. Additionally, on December 28, 2017, the BLM rescinded a rule the BLM adopted in 2015 concerning hydraulic fracturing on federal land. The 2015 rule would have required increased well integrity testing, increased requirements for the managing of fluids, and the disclosure of chemicals used in fracturing. The Biden administration issued an Executive Order pausing new oil and gas leasing and drilling permits for U.S. public lands and offshore waters until the Secretary of the Interior conducts a comprehensive review and reconsideration of Federal oil and gas permitting and leasing practices. Further actions may occur. Due to the ongoing regulatory and legal uncertainty, we cannot predict what effect these changes will have on our operations, though the changes are expected to be more restrictive with regard to oil and gas leasing on Federal lads in the future. We expect that the impacts to our operations will be similar to other similarly situated companies involved in oil and natural gas exploration and production activities.
Such changes in environmental laws and regulations which result in more stringent and costly reporting, or waste handling, storage, transportation, disposal or cleanup activities, could materially affect companies operating in the energy industry. Adoption of new regulations further regulating emissions from oil and gas production could adversely affect our business, financial position, results of operations and prospects, as could the adoption of new laws or regulations which levy taxes or other costs on greenhouse gas emissions from other industries, which could result in changes to the consumption and demand for natural gas. We may also be assessed administrative, civil and/or criminal penalties if we fail to comply with any such new laws and regulations applicable to oil and natural gas production.
Regulation of oil and natural gas exploration and production. Our exploration and production operations are subject to various types of regulation at the federal, state and local levels. Such regulations include requiring permits and drilling bonds for the drilling of wells, regulating the location of wells, the method of drilling and casing wells and the surface use and restoration of properties upon which wells are drilled. Many states also have statutes or regulations addressing conservation matters, including provisions for the unitization or pooling of oil and natural gas properties, the establishment of maximum rates of production from oil and natural gas wells and the regulation of spacing, plugging and abandonment of such wells. Some state statutes limit the rate at which oil and natural gas can be produced from our properties. It is also possible that certain states may increase regulatory activity in response to changing federal regulations or policies.
State regulation. Most states regulate the production and sale of oil and natural gas, including requirements for obtaining drilling permits, the method of developing new fields, the spacing and operation of wells and the prevention of waste of oil and gas resources. The rate of production may be regulated and the maximum daily production allowable from both oil and gas wells may be established on a market demand or conservation basis or both.
Office and Operations Facilities
Our executive offices are located at 5300 Town and Country Blvd., Suite 500 in Frisco, Texas 75034 and our telephone number is (972) 668-8800. We lease office space in Frisco, Texas covering 66,382 square feet at a monthly rate of $129,998. This lease expires on December 31, 2021. In January 2021, we extended this lease to December 31,
22
2024. We also own production offices and pipe yard facilities near Carthage, Franklin, Nacogdoches and Marshall, Texas and Bossier City, Grand Cane, Greenwood, Homer and Logansport, Louisiana.
Human Capital
As of December 31, 2020, we had 204 employees and utilized contract employees for certain of our drilling, completion and production operations. We seek to attract a qualified and diverse workforce and maintain strong non-discrimination and anti-harassment policies.
The safety of our employees, contractors and the community is a core business value and in order to obtain our goals of operational excellence and an injury free workplace, we have implemented an environmental, health and safety management system as a framework on which to build our success. The framework includes policies and procedures outlining how we do our work, programs to engage employees and drive a proactive safety culture, employee training to help ensure our employees have the knowledge to perform their work safely, setting targets and objectives for clearly defined deliverables and accountabilities and periodic audit and inspection of results using data collection of key performance indicators and scorecards to measure our success and develop improvement strategies. In response to the COVID-19 pandemic, we have implemented a COVID-19 exposure prevention, preparedness and response plan that incorporates the latest information available from public officials.
We utilize a third party contractor management service to ensure a consistent approach in aligning our expectations with all third parties involved in our operations. We hold our contractors accountable to the highest performance standards through our contractor onboarding and continuous auditing process.
Directors and Executive Officers
The following table sets forth certain information concerning our executive officers and directors.
| Name | Position with Company | Age | ||||||||||||
| M. Jay Allison | Chief Executive Officer and Chairman of the Board of Directors | 65 | ||||||||||||
| Roland O. Burns | President, Chief Financial Officer, Secretary and Director | 60 | ||||||||||||
| Daniel S. Harrison | Chief Operating Officer | 57 | ||||||||||||
| David J. Terry | Senior Vice President of Corporate Development | 40 | ||||||||||||
| Patrick H. McGough | Vice President of Operations | 40 | ||||||||||||
| Ronald E. Mills | Vice President of Finance and Investor Relations | 49 | ||||||||||||
| Daniel K. Presley | Vice President of Accounting, Controller and Treasurer | 60 | ||||||||||||
| LaRae L. Sanders | Vice President of Land | 58 | ||||||||||||
| Whitney H. Ward | Vice President of Marketing | 36 | ||||||||||||
| Elizabeth B. Davis | Director | 58 | ||||||||||||
| Morris E. Foster | Director | 78 | ||||||||||||
| Jim L. Turner | Director | 75 | ||||||||||||
A brief biography of each person who serves as an executive officer or director follows below.
Executive Officers
M. Jay Allison has been our Chief Executive Officer since 1988. Mr. Allison was elected Chairman of the Board in 1997 and has been a director since 1987. From 1988 to 2013, Mr. Allison served as our President. From 1981 to 1987, he was a practicing oil and gas attorney with the firm of Lynch, Chappell & Alsup in Midland, Texas. He received B.B.A., M.S. and J.D. degrees from Baylor University in 1978, 1980 and 1981, respectively.
Roland O. Burns has been our President since 2013, Chief Financial Officer since 1990, Secretary since 1991 and a director since 1999. Mr. Burns served as our Senior Vice President from 1994 to 2013 and Treasurer from 1990 to 2013. From 1982 to 1990, Mr. Burns was employed by the public accounting firm, Arthur Andersen. During his tenure with Arthur Andersen, Mr. Burns worked primarily in the firm's oil and gas audit practice. Mr. Burns received B.A. and M.A. degrees from the University of Mississippi in 1982 and is a Certified Public Accountant. Mr. Burns also serves on the Board of Directors and the audit committee of the University of Mississippi Foundation.
23
Daniel S. Harrison became our Chief Operating Officer in July 2019 and served as Vice President of Operations since 2017. Mr. Harrison has been with us since 2008 and served in various engineering and operations management positions of increasing responsibility during that time. Prior to joining us, Mr. Harrison was an operations engineer at Cimarex Energy Company from 2005 to 2008. Prior to 2005 he worked in various petroleum engineering operations management positions for several independent oil and gas exploration and development companies. Mr. Harrison received a B.S. Degree in Petroleum Engineering from the Louisiana State University in 1985.
David J. Terry became our Senior Vice President of Corporate Development in July 2019 concurrently with the closing of the Covey Park Acquisition. In this role, Mr. Terry is responsible for driving our long-term strategy for acquisitions and development, reserves and midstream. Prior to co-founding Covey Park, Mr. Terry held significant roles in operations and business development at EXCO Resources, Inc. and Winchester Production. Mr. Terry received a Bachelor of Science in Petroleum Engineering from Louisiana State University in 2005.
Patrick H. McGough became our Vice President of Operations in July 2019 following the Covey Park Acquisition. He joined Covey Park in August 2018 as the Vice President of Operations, where he was responsible for drilling, completion, and production operations and engineering. Prior to his time at Covey Park, Mr. McGough held significant roles as a drilling, completion, and production engineer at Brammer Engineering. Mr. McGough received a Bachelor of Science in Chemical Engineering from Louisiana Tech University in 2003 and an MBA from Centenary College of Louisiana in 2010.
Ronald E. Mills became our Vice President of Finance and Investor Relations in August 2019. Prior to joining us, Mr. Mills was an Equity Member and Senior Analyst responsible for covering exploration and production companies at Johnson Rice & Company LLC. Mr. Mills joined Johnson Rice in August 1995. Mr. Mills received a Bachelor of Arts in Economics and Master of Business Administration from Tulane University in 1994 and 1995, respectively.
Daniel K. Presley has been our Treasurer since 2013. Mr. Presley, who has been with us since 1989, also continues to serve as our Vice President of Accounting and Controller, positions he has had held since 1997 and 1991, respectively. Prior to joining us, Mr. Presley had six years of experience with several independent oil and gas companies including AmBrit Energy, Inc. Prior thereto, Mr. Presley spent two and one-half years with B.D.O. Seidman, a public accounting firm. Mr. Presley received a B.B.A. degree from Texas A & M University in 1983.
LaRae L. Sanders has been our Vice President of Land since 2014. Ms. Sanders has been with us since 1995. She has served as Land Manager since 2007, and has been instrumental in all of our active development programs and major acquisitions. Prior to joining us, Ms. Sanders held positions with Bridge Oil Company and Kaiser-Francis Oil Company, as well as other independent exploration and production companies. Ms. Sanders is a Certified Professional Landman with 38 years of experience. She became the nation's first Certified Professional Lease and Title Analyst in 1990.
Whitney H. Ward became our Vice President of Marketing in July 2019 concurrently with the closing of the Covey Park Acquisition, where she also served as Vice President of Marketing. She joined Covey Park in 2014, and started the marketing department. Prior to joining Covey Park, Ms. Ward held various positions in the marketing department at EXCO Resources, Inc. from 2007 through 2014. She received a Bachelor's degree in Communication Studies from The University of Texas at Austin in 2007.
Outside Directors
Elizabeth B. Davis has served as a director since 2014. Dr. Davis is currently the President of Furman University. Dr. Davis was the Executive Vice President and Provost for Baylor University until July 2014, and served as Interim Provost from 2008 until 2010. Prior to her appointment as Provost, she was a professor of accounting in the Hankamer School of Business at Baylor University where she also served as associate dean for undergraduate programs and as acting chair for the Department of Accounting and Business Law. Prior to joining Baylor University, she worked for the public accounting firm Arthur Andersen from 1984 to 1987.
24
Morris E. Foster has served as a director since 2017. Mr. Morris retired in 2008 as Vice President of ExxonMobil Corporation and President of ExxonMobil Production Company following more than 40 years of service with the ExxonMobil group. Mr. Foster served in a number of production engineering and management roles domestically as well as in the United Kingdom and Malaysia prior to his appointment in 1995 as a Senior Vice President in charge of the upstream business of Exxon Company, USA. In 1998, Mr. Foster was appointed President of Exxon Upstream Development Company, and following the merger of Exxon and Mobil in 1999, he was named to the position of President of ExxonMobil Development Company. In 2004, Mr. Foster was named President of Exxon Mobil Production Company, the division responsible for ExxonMobil's upstream oil and gas exploration and production business, and a Vice President of ExxonMobil Corporation. Mr. Foster currently serves as Chairman of Stagecoach Properties Inc., a real estate holding corporation with properties in Salado, Houston and College Station, Texas and Carmel, California and as a member of the Board of Regents of Texas A&M University. In addition, Mr. Foster currently serves on the board of directors of Scott & White Medical Institute.
Jim L. Turner has served as a director since 2014. Mr. Turner currently serves as Chairman of Turner Holdings, LLC and CEO of JLT Automotive, Inc. Mr. Turner served as President and Chief Executive Officer of Dr Pepper/Seven Up Bottling Group, Inc. from its formation in 1999 through 2005, when he sold this interest in that company. Prior to that, Mr. Turner served as Owner/Chairman of the Board and Chief Executive Officer of the Turner Beverage Group, the largest privately owned independent bottler in the United States. Mr. Turner is past-Chairman and currently serves on the Board of Trustees of Baylor Scott and White Health, the largest not-for-profit healthcare system in the State of Texas, where he also serves as Chairman of the Finance Committee and as a member of the Executive Committee. He is a Director of Crown Holdings where he also serves as Chairman of the Compensation Committee and as a member of the Nominating and Governance Committee. He is on the Board of Directors of INSURICA, a full service insurance agency. Mr. Turner is former Chairman of Dean Foods Company where he also served as Chairman of the Compensation Committee.
Available Information
We file annual, quarterly and current reports, proxy statements and other documents with the SEC under the Securities Exchange Act of 1934. The SEC maintains a website that contains reports, proxy and information statements, and other information that is electronically filed with the SEC. The public can obtain any documents that we file with the SEC at www.sec.gov. We also make available free of charge on our website (www.comstockresources.com) our Annual Report on Form 10-K, quarterly reports on Form 10-Q, current reports on Form 8-K and, if applicable, amendments to those reports filed or furnished pursuant to Section 13(a) of the Exchange Act as soon as reasonably practicable after we file such material with, or furnish it to, the SEC.
ITEM 1A. Risk Factors
You should carefully consider the following material risk factors as well as the other information contained or incorporated by reference in this report, as these important factors, among others, could cause our actual results to differ from our expected or historical results. It is not possible to predict or identify all such factors. Consequently, you should not consider any such list to be a complete statement of all of our potential risks or uncertainties. Based on the information currently known to us, we believe the following information identifies the most material risk factors affecting us, but the below risks and uncertainties are not the only ones related to our businesses and are not necessarily listed in the order of their significance. Additional risks and uncertainties not presently known to us or that we currently believe to be immaterial may also adversely affect our business.
An extended period of depressed oil and natural gas prices will adversely affect our business, financial condition, cash flow, liquidity, results of operations and our ability to meet our capital expenditure obligations and financial commitments.
Our business is heavily dependent upon the prices of, and demand for, oil and natural gas. Historically, the prices for oil and natural gas have been volatile and are likely to remain volatile in the future. During 2020, commodity prices fluctuated significantly, with the settlement price for West Texas Intermediate ("WTI") crude oil ranging from a high of approximately $63.27 per barrel to a low of approximately negative $36.98 per barrel and settlement prices for Henry Hub natural gas ranging from a high of approximately $3.14 per Mcf to a low of approximately $1.33 per Mcf.
25
The prices we receive for our oil and natural gas production are subject to wide fluctuations and depend on numerous factors beyond our control, including the following:
•the domestic and foreign supply of oil, natural gas liquids and natural gas;
•weather conditions;
•the price and quantity of imports of oil and natural gas;
•political conditions and events in other oil-producing and natural gas-producing countries, including embargoes, hostilities in the Middle East and other sustained military campaigns, and acts of terrorism or sabotage;
•the actions of the Organization of Petroleum Exporting Countries, or OPEC;
•domestic government regulation, legislation and policies;
•the level of global oil and natural gas inventories;
•technological advances affecting energy consumption;
•the price and availability of alternative fuels; and
•overall economic conditions.
Lower oil and natural gas prices will adversely affect:
•our revenues, profitability and cash flow from operations;
•the value of our proved oil and natural gas reserves;
•the economic viability of certain of our drilling prospects;
•our borrowing capacity; and
•our ability to obtain additional capital.
Our future production and revenues depend on our ability to replace our reserves.
Our future production and revenues depend upon our ability to find, develop or acquire additional oil and natural gas reserves that are economically recoverable. Our proved reserves will generally decline as reserves are depleted, except to the extent that we conduct successful exploration or development activities or acquire properties containing proved reserves, or both. To increase reserves and production, we must continue our acquisition and drilling activities. We cannot assure you that we will have adequate capital resources to conduct acquisition and drilling activities or that our acquisition and drilling activities will result in significant additional reserves or that we will have continuing success drilling productive wells at low finding and development costs. Furthermore, while our revenues may increase if prevailing oil and natural gas prices increase significantly, our finding costs for additional reserves could also increase.
Our access to capital markets may be limited in the future.
Adverse changes in the financial and credit markets could negatively impact our ability to grow production and reserves and meet our future obligations. In addition, the continuation of the current low oil and natural gas price environment, or further declines of oil and natural gas prices, will affect our ability to obtain financing for acquisitions and drilling activities and could result in a reduction in drilling activity, which could lead to a loss of acreage due to lease expirations, both of which could negatively affect our ability to replace reserves.
Drilling and completion activities are typically regulated by state oil and natural gas commissions. Our drilling and completion activities are conducted primarily in Louisiana and Texas. Texas adopted a law in June 2012 requiring disclosure to the Railroad Commission of Texas and the public of certain information regarding the components used in the hydraulic-fracturing process. In addition, Congress has considered legislation that, if implemented, would subject the process of hydraulic fracturing to regulation under the Safe Drinking Water Act. In June 2015, the EPA released a draft report on the potential impacts of hydraulic fracturing on drinking water resources, which concluded that hydraulic fracturing activities have not led to widespread, systemic impacts on drinking water resources in the United States, although there may be above and below ground mechanisms by which hydraulic fracturing activities have the potential to impact drinking water resources. The draft report was finalized in December 2016. Other governmental agencies, including the U.S. Department of Energy, have evaluated or are evaluating various other aspects of hydraulic fracturing. These ongoing or proposed studies have the potential to impact the likelihood or scope of future legislation or regulation.
26
State and federal regulatory agencies have recently focused on a possible connection between the hydraulic fracturing related activities and the increased occurrence of seismic activity. When caused by human activity, such events are called induced seismicity. In a few instances, operators of injection wells in the vicinity of seismic events have been ordered to reduce injection volumes or suspend operations. Some state regulatory agencies, including those in Arkansas, California, Colorado, Illinois, Kansas, Ohio, Oklahoma, and Texas, have modified their regulations to account for induced seismicity. Regulatory agencies at all levels are continuing to study the possible linkage between oil and gas activity and induced seismicity. A 2012 report published by the National Academy of Sciences concluded that only a very small fraction of the tens of thousands of injection wells have been suspected to be, or have been, the likely cause of induced seismicity; and a 2015 report by researchers at the University of Texas has suggested that the link between seismic activity and wastewater disposal may vary by region. In 2015, the United States Geological Survey identified eight states, including Texas, with areas of increased rates of induced seismicity that could be attributed to fluid injection or oil and gas extraction. In March 2016, the United States Geological Survey identified six states with the most significant hazards from induced seismicity, including Texas, Colorado, Oklahoma, Kansas, New Mexico, and Arkansas. In addition, a number of lawsuits have been filed, most recently in Oklahoma, alleging that disposal well operations have caused damage to neighboring properties or otherwise violated state and federal rules regulating waste disposal. Future regulatory developments could adversely affect our operations by placing restrictions on the use of injection wells and hydraulic fracturing.
Substantial exploration and development activities could require significant outside capital, which could dilute the value of our common shares and restrict our activities. Also, we may not be able to obtain needed capital or financing on satisfactory terms, which could lead to a limitation of our future business opportunities and a decline in our oil and natural gas reserves.
We expect to expend substantial capital in the acquisition of, exploration for and development of oil and natural gas reserves. In order to finance these activities, we may need to alter or increase our capitalization substantially through the issuance of debt or equity securities, the sale of non-strategic assets or other means. The issuance of additional equity securities could have a dilutive effect on the value of our common shares, and may not be possible on terms acceptable to us given the current volatility in the financial markets. The issuance of additional debt would likely require that a portion of our cash flow from operations be used for the payment of interest on our debt, thereby reducing our ability to use our cash flow to fund working capital, capital expenditures, acquisitions, dividends and general corporate requirements, which could place us at a competitive disadvantage relative to other competitors. Our cash flow from operations and access to capital is subject to a number of variables, including:
•our estimated proved reserves;
•the level of oil and natural gas we are able to produce from existing wells;
•our ability to extract natural gas liquids from the natural gas we produce;
•the prices at which oil, natural gas liquids and natural gas are sold; and
•our ability to acquire, locate and produce new reserves.
If our revenues decrease as a result of lower oil or natural gas prices, operating difficulties or declines in reserves, our ability to obtain the capital necessary to undertake or complete future exploration and development programs and to pursue other opportunities may be limited, which could result in a curtailment of our operations relating to exploration and development of our prospects, which in turn could result in a decline in our oil and natural gas reserves.
We pursue acquisitions as part of our growth strategy and there are risks associated with such acquisitions.
Our growth has been attributable in part to acquisitions of producing properties and companies. More recently we have been focused on acquiring acreage for our drilling program. We expect to continue to evaluate and, where appropriate, pursue acquisition opportunities on terms we consider favorable. However, we cannot assure you that suitable acquisition candidates will be identified in the future, or that we will be able to finance such acquisitions on favorable terms. In addition, we compete against other companies for acquisitions, and we cannot assure you that we will successfully acquire any material property interests. Further, we cannot assure you that future acquisitions by us will be integrated successfully into our operations or will increase our profits.
27
The successful acquisition of producing properties requires an assessment of numerous factors beyond our control, including, without limitation:
•recoverable reserves;
•exploration potential;
•future oil and natural gas prices;
•operating costs; and
•potential environmental and other liabilities.
In connection with such assessments, we perform a review of the subject properties that we believe to be generally consistent with industry practices. The resulting assessments are inexact and their accuracy uncertain, and such a review may not reveal all existing or potential problems, nor will it necessarily permit us to become sufficiently familiar with the properties to fully assess their merits and deficiencies. Inspections may not always be performed on every well, and structural and environmental problems are not necessarily observable even when an inspection is made.
Additionally, significant acquisitions can change the nature of our operations and business depending upon the character of the acquired properties, which may be substantially different in operating and geologic characteristics or geographic location than our existing properties. While our current operations are focused in Texas and Louisiana, we may pursue acquisitions or properties located in other geographic areas.
Our hedging transactions could result in financial losses or could reduce our income. To the extent we have hedged a significant portion of our expected production and our actual production is lower than we expected or the costs of goods and services increase, our profitability would be adversely affected.
To achieve more predictable cash flows and to reduce our exposure to adverse fluctuations in the prices of oil and gas, we have entered into and may continue to enter into hedging transactions for certain of our expected oil and natural gas production. These transactions could result in both realized and unrealized hedging losses. Further, these hedges may be inadequate to protect us from continuing and prolonged declines in the price of oil and natural gas. To the extent that the prices of oil and natural gas remain at current levels or declines further, we will not be able to hedge future production at the same level as our current hedges, and our results of operations and financial condition would be negatively impacted.
The extent of our commodity price exposure is related largely to the effectiveness and scope of our derivative activities. For example, the derivative instruments we utilize are primarily based on NYMEX futures prices, which may differ significantly from the actual crude oil and gas prices we realize in our operations. Furthermore, we have adopted a policy that requires, and our revolving credit facility also requires, that we enter into derivative transactions related to only a portion of our expected production volumes and, as a result, we will continue to have direct commodity price exposure on the portion of our production volumes not covered by these derivative financial instruments.
Our actual future production may be significantly higher or lower than we estimate at the time we enter into derivative transactions. If our actual future production is higher than we estimated, we will have greater commodity price exposure than we intended. If our actual future production is lower than the nominal amount that is subject to our derivative financial instruments, we might be forced to satisfy all or a portion of our derivative transactions without the benefit of the cash flow from our sale or purchase of the underlying physical commodity, resulting in a substantial diminution in our profitability and liquidity. As a result of these factors, our derivative activities may not be as effective as we intend in reducing the volatility of our cash flows, and in certain circumstances may actually increase the volatility of our cash flows.
In addition, our hedging transactions are subject to the following risks:
•we may be limited in receiving the full benefit of increases in oil and gas prices as a result of these transactions;
•a counterparty may not perform its obligation under the applicable derivative financial instrument or may seek bankruptcy protection;
28
•there may be a change in the expected differential between the underlying commodity price in the derivative instrument and the actual price received; and
•the steps we take to monitor our derivative financial instruments may not detect and prevent violations of our risk management policies and procedures, particularly if deception or other intentional misconduct is involved.
Market conditions or operational impediments may hinder our access to oil and natural gas markets or delay our production.
Market conditions or the unavailability of satisfactory oil and natural gas transportation arrangements may hinder our access to oil and natural gas markets or delay our production. The availability of a ready market for our oil and natural gas production depends on a number of factors, including the demand for and supply of oil and natural gas and the proximity of reserves to pipelines and processing facilities. Our ability to market our production depends in a substantial part on the availability and capacity of gathering systems, pipelines and processing facilities, which, in some cases, may be owned and operated by third parties. Our failure to obtain such services on acceptable terms could materially harm our business. We may be required to shut in wells due to a lack of market demand or because of the inadequacy or unavailability of pipelines or gathering system capacity. If that were to occur, then we would be unable to realize revenue from those wells until arrangements were made to deliver our production to market.
Our debt service requirements could adversely affect our operations and limit our growth.
We had $2.8 billion principal amount of debt as of December 31, 2020.
Our outstanding debt has important consequences, including, without limitation:
•a portion of our cash flow from operations is required to make debt service payments;
•our ability to borrow additional amounts for capital expenditures (including acquisitions) or other purposes is limited; and
•our debt limits (i) our ability to capitalize on significant business opportunities, (ii) our flexibility in planning for or reacting to changes in market conditions, and (iii) our ability to withstand competitive pressures and economic downturns.
Future acquisitions or development activities may require us to alter our capitalization significantly. These changes in capitalization may significantly increase our debt. Moreover, our ability to meet our debt service obligations and to reduce our total debt will be dependent upon our future performance, which will be subject to general economic conditions and financial, business and other factors affecting our operations, many of which are beyond our control. If we are unable to service our indebtedness and to meet other commitments, we will be required to adopt one or more alternatives, such as refinancing or restructuring our indebtedness, selling material assets or seeking to raise additional debt or equity capital. We cannot assure you that any of these actions could be effected on a timely basis or on satisfactory terms or that these actions would enable us to continue to satisfy our capital requirements.
Our debt agreements contain a number of significant covenants. These covenants limit our ability to, among other things:
•borrow additional money;
•merge, consolidate or dispose of assets;
•make certain types of investments;
•enter into transactions with our affiliates; and
•pay dividends.
Our failure to comply with any of these covenants could cause a default under our bank credit facility and the indentures governing our outstanding notes. A default, if not waived, could result in acceleration of our indebtedness, in which case the debt would become immediately due and payable. If this occurs, we may not be able to repay our debt or borrow sufficient funds to refinance it given the current status of the credit markets. Even if new financing is available, it may not be on terms that are acceptable to us.
29
Complying with these covenants may cause us to take actions that we otherwise would not take or not take actions that we otherwise would take.
Prospects that we decide to drill may not yield oil or natural gas in commercially viable quantities or quantities sufficient to meet our targeted rate of return and firm transportation commitments.
A prospect is a property in which we own an interest, or have operating rights to, and that has what our geoscientists believe, based on available seismic and geological information, to be an indication of potential oil or natural gas. Our prospects are in various stages of evaluation, ranging from a prospect that is ready to be drilled to a prospect that will require substantial additional evaluation and interpretation. There is no way to predict in advance of drilling and testing whether any particular prospect will yield oil or natural gas in sufficient quantities to recover drilling or completion costs or to be economically viable. The use of seismic data and other technologies and the study of producing fields in the same area will not enable us to know conclusively prior to drilling whether oil or natural gas will be present or, if present, whether oil or natural gas will be present in commercial quantities. The analysis that we perform using data from other wells, more fully explored prospects and/or producing fields may not be useful in predicting the characteristics and potential reserves associated with our drilling prospects. If we drill additional unsuccessful wells, our drilling success rate may decline and we may not achieve our targeted rate of return.
Further, unsuccessful drilling may impact our ability to fulfill our firm transportation commitments. We recently entered into an agreement with Enterprise Products Partners to be an anchor shipper on its new one Bcf per day Haynesville Acadian Extension to transport natural gas to the Gillis Hub. As part of this agreement, we entered into firm transportation commitments that may be incurred in the event of unsuccessful drilling operations.
Our business involves many uncertainties and operating risks that can prevent us from realizing profits and can cause substantial losses.
Our success depends on the success of our exploration and development activities. Exploration activities involve numerous risks, including the risk that no commercially productive natural gas or oil reserves will be discovered. In addition, these activities may be unsuccessful for many reasons, including weather, cost overruns, equipment shortages and mechanical difficulties. Moreover, the successful drilling of a natural gas or oil well does not ensure we will realize a profit on our investment. A variety of factors, both geological and market-related, can cause a well to become uneconomical or only marginally economical. In addition to their costs, unsuccessful wells can hurt our efforts to replace production and reserves.
Our business involves a variety of operating risks, including:
•unusual or unexpected geological formations;
•fires;
•explosions;
•blow-outs and surface cratering;
•uncontrollable flows of natural gas, oil and formation water;
•natural disasters, such as hurricanes, tropical storms and other adverse weather conditions;
•pipe, cement, or pipeline failures;
•casing collapses;
•mechanical difficulties, such as lost or stuck oil field drilling and service tools;
•abnormally pressured formations; and
•environmental hazards, such as natural gas leaks, oil spills, pipeline ruptures and discharges of toxic gases.
If we experience any of the above operating risks, our well bores, gathering systems and processing facilities could be affected, which could adversely affect our ability to conduct operations.
We could also incur substantial losses as a result of:
•injury or loss of life;
•severe damage to and destruction of property, natural resources and equipment;
•pollution and other environmental damage;
30
•clean-up responsibilities;
•regulatory investigation and penalties;
•suspension of our operations; and
•repairs to resume operations.
We maintain insurance against "sudden and accidental" occurrences, which may cover some, but not all, of the risks described above. Most significantly, the insurance we maintain will not cover the risks described above which occur over a sustained period of time. Further, there can be no assurance that such insurance will continue to be available to cover all such cost or that such insurance will be available at a cost that would justify its purchase. The occurrence of a significant event not fully insured or indemnified against could have a material adverse effect on our financial condition and results of operations.
Loss of our information and computer systems could adversely affect our business.
We are heavily dependent on our information systems and computer-based programs, including our well operations information, seismic data, electronic data processing and accounting data. If any of these programs or systems were to fail or create erroneous information in our hardware or software network infrastructure, possible consequences include loss of our communication links, our inability to find, produce, process and sell oil and natural gas and the inability to automatically process commercial transactions or engage in similar automated or computerized business activities. Any of these consequences could have a material effect on our business.
Our business could be negatively impacted by security threats, including cyber-security threats and other disruptions.
As an oil and natural gas producer, we face various security threats, including cyber-security threats to gain unauthorized access to sensitive information or to render data or systems unusable, threats to the safety of our employees, threats to the security or operation of our facilities and infrastructure or third party facilities and infrastructure, such as processing plants and pipelines, and threats from terrorist acts. Cyber-security attacks in particular are evolving and include, but are not limited to, malicious software, attempts to gain unauthorized access to data, and other electronic security breaches that could lead to disruptions in critical systems, unauthorized release of confidential or otherwise protected information and corruption of data. Although we utilize various procedures and controls to monitor and protect against these threats and to mitigate our exposure to such threats, there can be no assurance that these procedures and controls will be sufficient in preventing security threats from materializing. If any of these events were to materialize, either to the Company or a third party upon which we rely, they could lead to losses of sensitive information, critical infrastructure, personnel or capabilities, essential to our operations and could have a material adverse effect on our reputation, financial position, results of operations, or cash flows.
We are subject to extensive governmental laws and regulations that may adversely affect the cost, manner or feasibility of doing business.
Our operations and facilities are subject to extensive federal, state and local laws and regulations relating to the exploration for, and the development, production and transportation of, oil and natural gas, as well as the safe operations thereof. Future laws or regulations, adverse changes in the interpretation of existing laws and regulations or our failure to comply with existing legal requirements may harm our business, results of operations and financial condition. We may be required to make large and unanticipated capital expenditures to comply with present and future governmental laws and regulations, such as:
•lease permit restrictions;
•drilling bonds and other financial responsibility requirements, such as plug and abandonment bonds;
•spacing of wells;
•unitization and pooling of properties;
•safety precautions;
•regulatory requirements; and
•taxation.
Under these laws and regulations, we could be liable for:
•personal injuries;
31
•property and natural resource damages;
•well reclamation costs; and
•governmental sanctions, such as fines and penalties.
Our operations could be significantly delayed or curtailed and our cost of operations could significantly increase as a result of regulatory requirements or restrictions. In addition, the Biden administration has made, and is expected to make additional changes to applicable regulations, and in each case we expect changes to be more stringent than those of the prior administration. There are also costs associated with responding to changing regulations and policies, whether such regulations are more or less stringent. As such, there can be no assurance that material cost and liabilities will not be incurred in the future.
The widespread outbreak of an illness, pandemic or any other public health crisis may have material adverse effects on our business, financial position, results of operations and/or cash flows.
In December 2019, a novel strain of coronavirus (SARS-CoV-2), which causes COVID-19, was reported to have surfaced in China. The spread of this virus has caused business disruption beginning in January 2020, including disruption to the oil and natural gas industry. In March 2020, the World Health Organization declared the outbreak of COVID-19 to be a pandemic, and the U.S. economy began to experience pronounced effects. The COVID-19 pandemic has negatively impacted the global economy, disrupted global supply chains, reduced global demand for oil and gas, and created significant volatility and disruption of financial and commodity markets. The extent of the impact of the COVID-19 pandemic on our operational and financial performance, including our ability to execute our business strategies and initiatives in the expected time frame, is uncertain and depends on various factors, including the demand for oil and natural gas, the availability of personnel, equipment and services critical to our ability to operate our properties and the impact of potential governmental restrictions on travel, transports and operations. There is uncertainty around the extent and duration of the disruption. The degree to which the COVID-19 pandemic or any other public health crisis adversely impacts our results will depend on future developments, which are highly uncertain and cannot be predicted, including, but not limited to, the duration and spread of the outbreak, its severity, the actions to contain the virus or treat its impact, its impact on the economy and market conditions, and how quickly and to what extent normal economic and operating conditions can resume. In 2020, the pandemic did not significantly disrupt our operations except for the impact it had on oil and natural gas prices.
ITEM 1B. UNRESOLVED STAFF COMMENTS
None.
ITEM 3. LEGAL PROCEEDINGS
We are not a party to any legal proceedings which management believes will have a material adverse effect on our consolidated results of operations or financial condition.
ITEM 4. MINE SAFETY DISCLOSURES
Not applicable.
32
PART II
ITEM 5. MARKET FOR REGISTRANT'S COMMON EQUITY, RELATED STOCKHOLDER MATTERS AND ISSUER PURCHASES OF EQUITY SECURITIES
Our common stock is listed for trading on the New York Stock Exchange under the symbol "CRK". As of February 16, 2021, we had 232,411,218 shares of common stock outstanding, which were held by 108 holders of record. We have not paid a dividend on our common stock since 2014. Any future determination as to the payment of dividends will depend upon the results of our operations, capital requirements, our financial condition and such other factors as our board of directors may deem relevant.
Stockholder Return Performance
A peer group of companies is used by our compensation committee to determine total stockholder return performance which is used as a metric in our Annual Incentive Plan and to determine whether performance share units are earned as awarded under our 2019 Long-term Incentive Plan. In 2020, the compensation committee utilized a peer group that consisted of Antero Resources Corporation, Cabot Oil & Gas Corporation, Chesapeake Energy Corporation, CNX Resources Corporation, EQT Corporation, Gulfport Energy Corporation, Montage Resources Corporation, Range Resources Corporation, SilverBow Resources, Inc. and Southwestern Energy Company. The following graph compares the yearly percentage change in the cumulative total stockholder return on our common stock during the five years ended December 31, 2020 with the cumulative return on the New York Stock Exchange Index and the cumulative return for our peer group. The graph assumes that $100.00 was invested on the last trading day of 2015, and that dividends, if any, were reinvested.
COMPARISON OF 5 YEAR CUMULATIVE TOTAL RETURN (1)
Among Comstock, the NYSE Composite Index, and Our Peer Group
| As of December 31, | ||||||||||||||||||||||||||||||||||||||
| Total Return Analysis | 2015 | 2016 | 2017 | 2018 | 2019 | 2020 | ||||||||||||||||||||||||||||||||
| Comstock | $100.00 | $105.35 | $90.48 | $48.45 | $88.02 | $46.74 | ||||||||||||||||||||||||||||||||
| NYSE Composite | $100.00 | $111.94 | $132.90 | $121.01 | $151.87 | $162.49 | ||||||||||||||||||||||||||||||||
| Peer Group | $100.00 | $132.89 | $106.30 | $68.22 | $44.07 | $42.26 | ||||||||||||||||||||||||||||||||
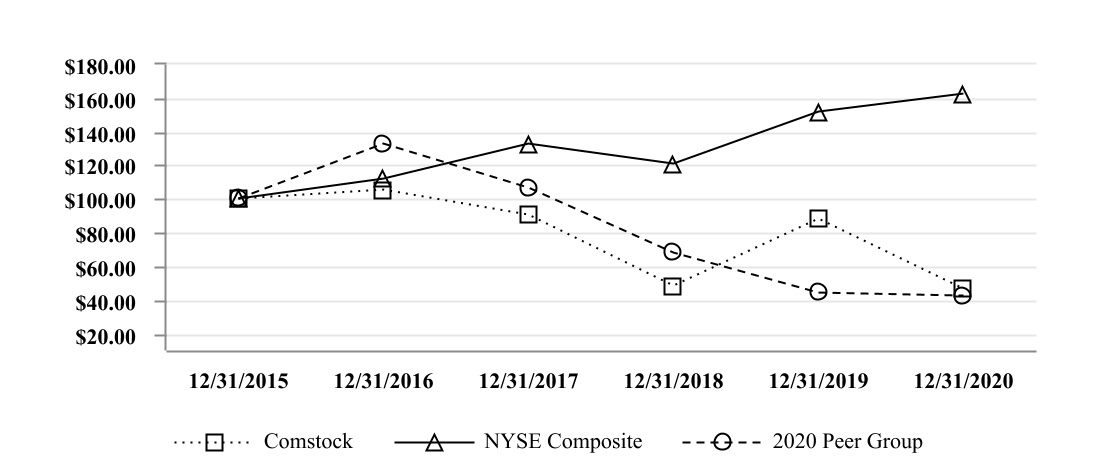
_______________
(1)The data contained in the above graph is deemed to be furnished and not filed pursuant to Section 18 of the Securities Exchange Act of 1934, as amended, or otherwise subject to the liabilities of that section.
33
ITEM 7. MANAGEMENT'S DISCUSSION AND ANALYSIS OF FINANCIAL CONDITION AND RESULTS OF OPERATIONS
The following discussion and analysis should be read in conjunction with our selected historical consolidated financial data and our accompanying consolidated financial statements and the notes to those financial statements included elsewhere in this report. The following discussion includes forward-looking statements that reflect our plans, estimates and beliefs. Our actual results could differ materially from those discussed in these forward-looking statements. Factors that could cause or contribute to such differences include, but are not limited to, those discussed below and elsewhere in this report, particularly in "Risk Factors" and "Cautionary Note Regarding Forward-Looking Statements."
Overview
We are an independent energy company engaged in the acquisition, exploration, development and production of oil and natural gas in the United States. Our assets are concentrated in the Haynesville and Bossier shale located in North Louisiana and East Texas, a premier natural gas basin with superior economics due to geographic proximity to Gulf Coast natural gas markets. Approximately 95% of our December 31, 2020 proved reserves are located in the Haynesville and Bossier shale region. We own interests in 2,864 producing oil and natural gas wells (1,453.7 net) and we operate 1,480 of these wells. We intend to maintain an operating plan in 2021 targeting debt reduction and generation of free cash flow.
We use the successful efforts method of accounting, which allows only for the capitalization of costs associated with developing proven oil and natural gas properties as well as exploration costs associated with successful exploration activities. Accordingly, our exploration costs consist of costs we incur to acquire seismic data, impairments of our unevaluated leasehold where we were not successful in discovering reserves and the costs of unsuccessful exploratory wells that we drill.
We generally sell our oil and natural gas at current market prices at the point our wells connect to third party purchaser pipelines or terminals. We have entered into certain transportation and treating agreements with midstream and pipeline companies to transport a substantial portion of our natural gas production to long-haul gas pipelines. We market our products several different ways depending upon a number of factors, including the availability of purchasers for the product, the availability and cost of pipelines near our wells, market prices, pipeline constraints and operational flexibility. Accordingly, our revenues are heavily dependent upon the prices of, and demand for, oil and natural gas. Oil and natural gas prices have historically been volatile and are likely to remain volatile in the future.
Our operating costs are generally comprised of several components, including costs of field personnel, insurance, repair and maintenance costs, production supplies, fuel used in operations, transportation costs, workover expenses and state production and ad valorem taxes.
Like all oil and natural gas exploration and production companies, we face the challenge of replacing our reserves. Although in the past we have offset the effect of declining production rates from existing properties through successful acquisition and drilling efforts, there can be no assurance that we will be able to continue to offset production declines or maintain production at current rates through future acquisitions or drilling activity.
Our operations and facilities are subject to extensive federal, state and local laws and regulations relating to the exploration for, and the development, production and transportation of, oil and natural gas, and operating safety. Future laws or regulations, any adverse changes in the interpretation of existing laws and regulations or our failure to comply with existing legal requirements may have an adverse effect on our business, results of operations and financial condition. Applicable environmental regulations require us to remove our equipment after production has ceased, to plug and abandon our wells and to remediate any environmental damage our operations may have caused. The present value of the estimated future costs to plug and abandon our oil and gas wells and to dismantle and remove our production facilities is included in our reserve for future abandonment costs, which was $19.3 million of December 31, 2020.
Prices for oil and natural gas have been highly volatile in recent years, and we experienced a period of low prices in 2020 primarily due to an oversupply of oil and natural gas. We expect our oil production to continue to
34
decline as we have limited future plans to participate in the drilling of new oil wells. We expect our natural gas production to increase, assuming we maintain a sufficient development program to offset expected production declines from our producing wells. The level of our drilling activity is dependent on natural gas prices. If we are unable to offset production declines resulting from the new wells we plan to drill in 2021 and future periods, our production volumes and cash flows from our operating activities may not be sufficient to fund our capital expenditures, and thus, we may need to either curtail drilling activity or seek additional borrowings, which would result in an increase in our interest expense in 2021 and future periods. We may need to recognize impairments if oil and natural gas prices decline, and as a result, the expected future cash flows from these properties becomes insufficient to recover their carrying value.
Jones Contribution
On August 14, 2018, the Jones Partnerships contributed certain oil and gas properties in North Dakota and Montana in exchange for 88,571,429 newly issued shares of common stock representing 84% of our then outstanding common stock (the "Jones Contribution"). The Jones Partnerships are wholly owned and controlled by Dallas businessman Jerry Jones and his children (collectively, the "Jones Group"). References to "Successor" or "Successor Company" relate to the operations of the Company subsequent to August 13, 2018. References to "Predecessor" or "Predecessor Company" relate to the operations of the Company on or prior to August 13, 2018.
Covey Park Acquisition
On July 16, 2019, we acquired Covey Park Energy LLC ("Covey Park") for total consideration of $700.0 million of cash, the issuance of Series A Convertible Preferred Stock with a redemption value of $210.0 million, and the issuance of 28,833,000 shares of common stock (the "Covey Park Acquisition"). Covey Park's operations were focused primarily in the Haynesville/Bossier shale in North Louisiana and East Texas. In addition to the consideration paid, we assumed $625.0 million of Covey Park's 7.5% senior notes, repaid $380.0 million of Covey Park's then outstanding borrowings under its bank credit facility and redeemed all of Covey Park's preferred equity for $153.4 million. Based on the fair value of the preferred stock issued and the closing price of our common stock of $5.82 per share on July 16, 2019, the transaction was valued at approximately $2.2 billion. On May 20, 2020, we redeemed all of the outstanding shares of the Series A Convertible Preferred Stock for an aggregate redemption price of $210.0 million plus accrued and unpaid dividends of approximately $2.9 million.
Funding for the $700.0 million of cash consideration was provided by the sale of 50 million newly issued shares of our common stock for $300.0 million and 175,000 shares of newly issued Series B Convertible Preferred Stock for $175.0 million to our majority stockholder and by borrowings under our bank credit facility and cash on hand. We incurred $41.0 million of advisory and legal fees and other acquisition-related costs in connection with the Covey Park Acquisition. These costs are included in transaction costs in our consolidated statements of operations.
The acquisition included approximately 249,000 net acres and 2.9 Tcfe of proved reserves. The acquisition added approximately 710 MMcfe of daily average production, at the date of the acquisition, and over 1,200 net future drilling locations. The transaction was accounted for as a business combination, using the acquisition method.
As of December 31, 2020, our majority stockholder owned approximately 60% of our outstanding common stock and the former owners of Covey Park owned approximately 8% of our common stock. The Jones Group also holds our Series B Convertible Preferred Stock that is convertible into 43,750,000 shares of our common stock.
35
Results of Operations
Year Ended December 31, 2020 Compared to Year Ended December 31, 2019
Our operating data for the year ended December 31, 2019 and 2020 are summarized below:
| Year Ended December 31, | |||||||||||
| 2019 | 2020 | ||||||||||
| Oil and Gas Sales (in thousands): | |||||||||||
| Natural gas sales | $635,795 | $809,399 | |||||||||
| Oil sales | 132,894 | 48,796 | |||||||||
| Total oil and gas sales | $768,689 | $858,195 | |||||||||
| Net Production Data: | |||||||||||
| Natural gas sales (MMcf) | 292,834 | 450,836 | |||||||||
| Oil sales (MBbls) | 2,685 | 1,508 | |||||||||
| Total oil and gas (MMcfe) | 308,944 | 459,883 | |||||||||
| Average Sales Price: | |||||||||||
| Natural gas sales | $2.17 | $1.80 | |||||||||
| Oil sales | $49.49 | $32.36 | |||||||||
| Total oil and gas sales | $2.49 | $1.87 | |||||||||
| Expenses ($ per Mcfe): | |||||||||||
| Production and ad valorem taxes | $0.11 | $0.08 | |||||||||
| Gathering and transportation | $0.23 | $0.23 | |||||||||
| Lease operating | $0.27 | $0.22 | |||||||||
| Depreciation, depletion and amortization | $0.90 | $0.91 | |||||||||
Oil and gas sales. Oil and gas sales of $858.2 million in 2020 increased $89.5 million or 12% over oil and gas sales in 2019 of $768.7 million. The increase is due to a 49% increase in production volumes that was partially offset by lower realized oil and natural gas prices in 2020. Our 2020 natural gas production was 450.8 billion cubic feet ("Bcf") (1.2 Bcf per day), which was sold at an average price of $1.80 per Mcf as compared to 292.8 Bcf (0.8 Bcf per day) sold at an average price of $2.17 in 2019. Our 2020 oil production was 1.5 MMBbls (4,120 Bbls per day), which was sold at an average price of $32.36 per Bbl as compared to 2.7 MMBbls (7,356 Bbls per day) sold at an average price of $49.49 per Bbl in 2019.
We utilize natural gas and oil price derivative financial instruments to manage our exposure to natural gas and oil prices and protect returns on investment from our drilling activities. The following table presents our natural gas and oil prices before and after the effect of cash settlements of our derivative financial instruments:
| Year Ended December 31, | |||||||||||
| 2019 | 2020 | ||||||||||
| Average Realized Natural Gas Price: | |||||||||||
| Natural gas, per Mcf | $ | 2.17 | $ | 1.80 | |||||||
| Cash settlements on derivative financial instruments, per Mcf | 0.18 | 0.27 | |||||||||
| Price per Mcf, including cash settlements on derivative financial instruments | $ | 2.35 | $ | 2.07 | |||||||
| Average Realized Oil Price: | |||||||||||
| Crude oil per Barrel | $ | 49.49 | $ | 32.36 | |||||||
| Cash settlements on derivative financial instruments, per Barrel | 0.15 | 8.52 | |||||||||
| Price per Barrel, including cash settlements on derivative financial instruments | $ | 49.64 | $ | 40.88 | |||||||
Cash settlements for oil and natural gas derivative financial instruments totaled $52.7 million and $134.9 million for 2019 and 2020, respectively.
36
Production and ad valorem taxes. Our production and ad valorem taxes increased $1.3 million (4%) to $37.0 million in 2020 from $35.7 million in 2019. This increase is primarily related to the $89.5 million increase in oil and gas sales.
Gathering and transportation. Gathering and transportation costs increased $35.3 million or 49% to $106.6 million in 2020 as compared to $71.3 million in 2019. This increase was due primarily to the increase in our natural gas production resulting from our drilling activities and the Covey Park Acquisition completed in 2019.
Lease operating expenses. Our lease operating expenses of $102.5 million in 2020 was $21.7 million or 27% higher than the lease operating expenses in 2019 of $80.8 million. Our lease operating expense of $0.22 per Mcfe produced for 2020 was 0.05 per Mcfe lower than the lease operating expense of $0.27 per Mcfe in 2019. The lower average per unit cost is related to the growth in our lower cost natural gas production where much of the operating costs are fixed in nature.
Depreciation, depletion and amortization expense ("DD&A"). DD&A increased $140.6 million (51%) to $417.1 million in 2020 from $276.5 million in 2019 due to the 49% increase in production. Our DD&A per equivalent Mcf produced was $0.91 per Mcfe in 2020, which was comparable to the $0.90 per Mcfe rate for 2019.
General and administrative expenses. General and administrative expense, which is reported net of overhead reimbursements, increased to $32.0 million in 2020 from $29.2 million in 2019 due primarily to higher stock-based compensation and higher personnel costs. Stock-based compensation was $4.0 million and $6.5 million in 2019 and 2020, respectively.
Derivative financial instruments. We use derivative financial instruments as part of our price risk management program to protect our capital investments. We had net gains on derivative financial instruments of $51.7 million for 2019 and $10.0 million for 2020. Realized net gains from our oil and natural gas price risk management program were $52.7 million and $134.9 million in 2019 and 2020, respectively. Realized losses from our interest rate risk management program were none and $0.4 million in 2019 and 2020, respectively. Unrealized loss on derivative financial instruments were $1.0 million in 2019 and $124.5 million in 2020.
Interest expense. Interest expense was $234.8 million for 2020 as compared to $161.5 million for 2019. Interest expense for 2020 includes interest payments on the 7½% senior notes (the "2025 Notes") that were assumed in the Covey Park Acquisition, our 9¾% senior notes (the "2026 Notes") and our bank credit facility. Included in interest expense was amortization of the discount on the 2025 Notes, the 2026 Notes and the debt cost amortization associated with our outstanding debt. The non-cash interest expense for 2020 totaled $34.0 million compared with non-cash interest expense of $16.3 million for 2019. The increase in interest expense was due to the issuance of an additional $800.0 million principal amount of the 2026 Notes during 2020.
Income taxes. Income taxes were a benefit of $9.2 million in 2020 and a provision of $27.8 million in 2019. The effective tax rate of 22% in 2019 and 15% in 2020 differed from the federal income tax rate of 21% primarily due to the impact of deferred state income taxes.
Net income. We reported a net loss available to common stockholders of $83.4 million or $0.39 per share in 2020 and net income available to common stockholders of $74.5 million or $0.52 per diluted share in 2019. The net loss in 2020 is primarily due to the unrealized loss on derivative financial instruments of $124.5 million. Income from operations in 2020 was $163.0 million.
Year Ended December 31, 2019 Compared to 2018 Periods
Discussions of 2018 items and year-to-year comparisons between 2019 and 2018 that are not included in this Annual Report on Form 10-K can be found in "Management's Discussion and Analysis of Financial Condition and Results of Operations" in the Company's Annual Report on Form 10-K for the fiscal year ended December 31, 2019 filed with the SEC on March 2, 2020.
37
Liquidity and Capital Resources
Funding for our activities has historically been provided by our operating cash flow, debt or equity financings or proceeds from asset sales. In 2020, we generated $575.7 million in cash flow from operating activities as compared to $451.2 million in 2019. We also completed a public offering of our common stock in which we received $196.5 million in net proceeds. The proceeds from the offering were used together with cash on hand to redeem our Series A Convertible Preferred Stock for $210.0 million. We also issued $800.0 million principal amount of our 9¾% senior notes for net proceeds of $737.1 million. The proceeds from the senior note issuances were used to repay outstanding borrowings under our bank credit facility. In addition in 2020, we exchanged 767,096 shares of our common stock, valued at approximately $5.0 million, to retire $5.6 million aggregate principal amount of our 7½% senior notes.
For 2019 our primary source of funds was operating cash flow and the issuance of common stock, preferred stock and borrowings to finance two acquisitions.
Our capital expenditure activity is summarized in the following table:
| Predecessor | Successor | |||||||||||||||||||||||||
| Period from January 1, 2018 through August 13, 2018 | Period from August 14, 2018 through December 31, 2018 | Year Ended December 31, 2019 | Year Ended December 31, 2020 | |||||||||||||||||||||||
| (in thousands) | ||||||||||||||||||||||||||
| Acquisitions | $ | 39,323 | $ | 21,013 | $ | 2,097,451 | $ | — | ||||||||||||||||||
| Exploration and development: | ||||||||||||||||||||||||||
| Exploratory leasehold costs | — | — | — | 7,949 | ||||||||||||||||||||||
| Development leasehold costs | 2,848 | 1,715 | 7,603 | 13,022 | ||||||||||||||||||||||
| Development drilling and completion costs | 90,840 | 148,745 | 493,625 | 436,074 | ||||||||||||||||||||||
| Other development costs | 13,871 | 13,612 | 9,339 | 34,525 | ||||||||||||||||||||||
| Total exploration and development | 146,882 | 185,085 | 2,608,018 | 491,570 | ||||||||||||||||||||||
| Other | 31 | 2 | 198 | 366 | ||||||||||||||||||||||
| Total capital expenditures | $ | 146,913 | $ | 185,087 | $ | 2,608,216 | $ | 491,936 | ||||||||||||||||||
The timing of most of our capital expenditures is discretionary because we have no material long-term capital expenditure commitments. Consequently, we have a significant degree of flexibility to adjust the level of our capital expenditures as circumstances warrant. Under our current operating plan, we expect to drill 62 operated horizontal wells (51.0 net), and complete an additional 19 wells (17.4 net) drilled in 2020. We currently expect to spend approximately $517.0 million to $560.0 million in 2021 on our development and exploration projects. We expect to fund our future development and exploration activities with future operating cash flow. If our plans or assumptions change or our assumptions prove to be inaccurate, we may be required to seek additional capital, including additional equity or debt financings. We cannot provide any assurance that we will be able to obtain such capital, or if such capital is available, that we will be able to obtain it on acceptable terms.
We do not have a specific acquisition budget for 2021 because the timing and size of acquisitions are unpredictable. We intend to use our cash flows from operations, borrowings under our bank credit facility, or other debt or equity financings to the extent available, to finance such acquisitions. The availability and attractiveness of these sources of financing will depend upon a number of factors, some of which will relate to our financial condition and performance and some of which will be beyond our control, such as prevailing interest rates, oil and natural gas prices and other market conditions. Lack of access to the debt or equity markets due to general economic conditions could impede our ability to complete acquisitions.
As of December 31, 2020, we had $500.0 million outstanding under our bank credit facility that matures on July 16, 2024. The borrowing base, which is currently set at $1.4 billion, is re-determined on a semi-annual basis and upon the occurrence of certain other events. Borrowings under the bank credit facility are secured by substantially all of our assets and those of our subsidiaries and bear interest at our option, at either LIBOR plus 2.25% to 3.25% or a base rate plus 1.25% to 2.25%, in each case depending on the utilization of the borrowing base. We also pay a
38
commitment fee of 0.375% to 0.5% on the unused portion of the borrowing base. The bank credit facility places certain restrictions upon our and our subsidiaries' ability to, among other things, incur additional indebtedness, pay cash dividends, repurchase common stock, make certain loans, investments and divestitures and redeem the senior notes. The only financial covenants are the maintenance of a leverage ratio of less than 4.0 to 1.0 and an adjusted current ratio of at least 1.0 to 1.0. We were in compliance with the covenants as of December 31, 2020.
The following table summarizes our aggregate liabilities and commitments by year of maturity:
| 2021 | 2022 | 2023 | 2024 | 2025 | Thereafter | Total | |||||||||||||||||||||||||||||||||||
| (In thousands) | |||||||||||||||||||||||||||||||||||||||||
| Bank credit facility | $ | — | $ | — | $ | — | $ | 500,000 | $ | — | $ | — | $ | 500,000 | |||||||||||||||||||||||||||
| 7½% Senior Notes due 2025 | — | — | — | — | 619,400 | — | 619,400 | ||||||||||||||||||||||||||||||||||
| 9¾% Senior Notes due 2026 | — | — | — | — | — | 1,650,000 | 1,650,000 | ||||||||||||||||||||||||||||||||||
| Interest | 220,630 | 220,630 | 220,630 | 214,534 | 178,296 | 100,547 | 1,155,267 | ||||||||||||||||||||||||||||||||||
| Operating leases | 2,682 | 795 | 196 | — | — | — | 3,673 | ||||||||||||||||||||||||||||||||||
| Transportation | 21,517 | 31,208 | 24,820 | 24,888 | 24,820 | 144,783 | 272,036 | ||||||||||||||||||||||||||||||||||
| Drilling rigs and completion | 6,031 | — | — | — | — | — | 6,031 | ||||||||||||||||||||||||||||||||||
| $ | 250,860 | $ | 252,633 | $ | 245,646 | $ | 739,422 | $ | 822,516 | $ | 1,895,330 | $ | 4,206,407 | ||||||||||||||||||||||||||||
Future interest costs are based upon the effective interest rates of our outstanding senior notes and borrowings under our bank credit facility.
We also have obligations to incur future payments for dismantlement, abandonment and restoration costs of oil and gas properties which are currently estimated to be incurred primarily after 2023.
Federal and State Taxation
The Tax Cuts and Jobs Act, which was enacted on December 22, 2017, reduced the corporate income tax rate effective January l, 2018 from 35% to 21%. Among the other significant tax law changes that potentially affect us are the elimination of the corporate alternative minimum tax ("AMT"), changes that require operating losses incurred in 2018 and beyond be carried forward indefinitely with no carryback up to 80% of taxable income in a given year, and limitations on the deduction for interest expense incurred in 2018 or later of up to 30% of its adjusted taxable income (defined as taxable income before interest and net operating losses) for the taxable year. For the tax years beginning before January 1, 2022, the adjusted taxable income for these purposes is also adjusted to exclude the impact of depreciation, depletion and amortization. The Tax Cuts and Jobs Act preserved deductibility of intangible drilling costs for federal income tax purposes, which allows us to deduct a portion of drilling costs in the year incurred and minimizes current taxes payable in periods of taxable income. At December 31, 2018, we completed the accounting for the tax effects of enactment of the Tax Cuts and Jobs Act.
The Tax Cuts and Jobs Act repealed the AMT for tax years beginning on or after January 1, 2018 and provides that existing AMT credit carryforwards can be utilized to offset federal taxes for any taxable year. Due to tax law enacted in 2020 with the Coronavirus Aid, Relief and Economic Security ("CARES") Act, we received $10.2 million in refunds for our outstanding AMT carryforwards in 2020.
At December 31, 2020, we had $0.9 billion in U.S. federal net operating loss carryforwards and $1.6 billion in certain state net operating loss carryforwards. The shares of common stock issued as a result of the Jones Contribution triggered an ownership change under Section 382 of the Internal Revenue Code. As a result, our ability to use net operating losses ("NOLs") to reduce taxable income is generally limited to an annual amount based on the fair market value of our stock immediately prior to the ownership change multiplied by the long-term tax-exempt interest rate. Our NOLs are estimated to be limited to $3.3 million a year as a result of this limitation. In addition to this limitation, IRC Section 382 provides that a corporation with a net unrealized built-in gain immediately before an ownership change may increase its limitation by the amount of built-in gain recognized during a recognition period, which is generally the five-year period immediately following an ownership change. Based on the fair market value of our common stock immediately prior to the ownership change, we believe that we have a net unrealized built-in gain which will increase the Section 382 limitation during the five-year recognition period from 2018 to 2023.
39
NOLs that exceed the Section 382 limitation in any year continue to be allowed as carryforwards until they expire and can be used to offset taxable income for years within the carryover period subject to the limitation in each year. NOLs incurred prior to 2018 generally have a 20-year life until they expire. NOLs generated in 2018 and after would be carried forward indefinitely. Our use of new NOLs arising after the date of an ownership change would not be affected by the 382 limitation. If we do not generate a sufficient level of taxable income prior to the expiration of the pre-2018 NOL carry-forward periods, then we will lose the ability to apply those NOLs as offsets to future taxable income. We estimate that $844.6 million of the U.S. federal NOL carryforwards and $1.4 billion of the estimated state NOL carryforwards will expire unused.
Our federal income tax returns for the years subsequent to December 31, 2016 remain subject to examination. Our income tax returns in major state income tax jurisdictions remain subject to examination for various periods subsequent to December 31, 2017. We currently believe that our significant filing positions are highly certain and that all of our other significant income tax filing positions and deductions would be sustained upon audit or the final resolution would not have a material effect on our consolidated financial statements. Therefore, we have not established any significant reserves for uncertain tax positions.
Critical Accounting Policies
The preparation of financial statements in conformity with accounting principles generally accepted in the United States requires us to make estimates and use assumptions that can affect the reported amounts of assets, liabilities, revenues or expenses.
Successful efforts accounting. We are required to select among alternative acceptable accounting policies. There are two generally acceptable methods for accounting for oil and gas producing activities. The full cost method allows the capitalization of all costs associated with finding oil and natural gas reserves, including certain general and administrative expenses. The successful efforts method allows only for the capitalization of costs associated with developing proven oil and natural gas properties as well as exploration costs associated with successful exploration projects. Costs related to exploration that are not successful are expensed when it is determined that commercially productive oil and gas reserves were not found. We have elected to use the successful efforts method to account for our oil and gas activities and we do not capitalize any of our general and administrative expenses.
Oil and natural gas reserve quantities. The determination of depreciation, depletion and amortization expense is highly dependent on the estimates of the proved oil and natural gas reserves attributable to our properties. The determination of whether impairments should be recognized on our oil and gas properties is also dependent on these estimates, as well as estimates of probable reserves. Reserve engineering is a subjective process of estimating underground accumulations of oil and natural gas that cannot be precisely measured. The accuracy of any reserve estimate depends on the quality of available data, production history and engineering and geological interpretation and judgment. Because all reserve estimates are to some degree imprecise, the quantities and timing of oil and natural gas that are ultimately recovered, production and operating costs, the amount and timing of future development expenditures and future oil and natural gas prices may all differ materially from those assumed in these estimates. The information regarding present value of the future net cash flows attributable to our proved oil and natural gas reserves are estimates only and should not be construed as the current market value of the estimated oil and natural gas reserves attributable to our properties. Thus, such information includes revisions of certain reserve estimates attributable to proved properties included in the preceding year's estimates. Such revisions reflect additional information from subsequent activities, production history of the properties involved and any adjustments in the projected economic life of such properties resulting from changes in product prices. Any future downward revisions could adversely affect our financial condition, our future prospects and the value of our common stock.
Impairment of oil and gas properties. We evaluate our proved properties for potential impairment when circumstances indicate that the carrying value of an asset may not be recoverable. If impairment is indicated based on a comparison of the asset's carrying value to its undiscounted expected future net cash flows, then it is recognized to the extent that the carrying value exceeds fair value. A significant amount of judgment is involved in performing these evaluations since the results are based on estimated future events. Expected future cash flows are determined using estimated future prices based on market based forward prices applied to projected future production volumes. The projected production volumes are based on the property's proved and risk adjusted probable oil and natural gas
40
reserves estimates at the end of the period. The estimated future cash flows that we use in our assessment of the need for an impairment are based on a corporate forecast which considers forecasts from multiple independent price forecasts. Prices are not escalated to levels that exceed observed historical market prices. Costs are also assumed to escalate at a rate that is based on our historical experience, currently estimated at 2% per annum. The oil and natural gas prices used for determining asset impairments will generally differ from those used in the standardized measure of discounted future net cash flows because the standardized measure requires the use of the average first day of the month historical price for the year. Unproved properties are evaluated for impairment based upon the results of drilling, planned future drilling and the terms of our oil and gas leases. It is reasonably possible that our estimates of undiscounted future net cash flows attributable to its oil and gas properties may change in the future. The primary factors that may affect estimates of future cash flows include future adjustments, both positive and negative, to proved and appropriate risk-adjusted probable oil and gas reserves, results of future drilling activities, future prices for oil and natural gas, and increases or decreases in production and capital costs. As a result of these changes, there may be impairments in the carrying values of our proved and unproved oil and gas properties in the future.
Goodwill. We have goodwill of $335.9 million as of December 31, 2020 that was recorded in connection with the Jones Contribution. Goodwill represents the excess of purchase price over fair value of net tangible and identifiable intangible assets. We are not required to amortize goodwill as a charge to earnings; however, we are required to conduct an annual review of goodwill for impairment.
We determine the potential for impairment of our goodwill by initially preparing a qualitative fair value assessment of our business value. In performing this qualitative assessment, we examine relevant events and circumstances that could have a negative effect on our business, including macroeconomic conditions, industry and market conditions (including current commodity price), earnings and cash flows, overall financial performance and other relevant entity specific events.
If the qualitative assessment indicates that it is more likely than not that our business is impaired, a quantitative analysis would be performed to assess our fair value and to determine the amount of impairment, if any, that requires recognition. When performing a quantitative impairment assessment of goodwill, fair value is determined based on a market approach or an income approach. If the carrying value of goodwill exceeds the fair value calculated using the quantitative approach, an impairment charge would be recorded for the difference between fair value and carrying value. If oil or natural gas prices decrease, drilling efforts are unsuccessful or our market capitalization declines, it is reasonably possible that impairments would need to be recognized. We performed a quantitative assessment of goodwill as of October 1, 2020 and determined there was no goodwill impairment.
Income Taxes. We account for income taxes using the asset and liability method, whereby deferred tax assets and liabilities are recognized for the future tax consequences attributable to differences between the financial statement carrying amounts of assets and liabilities and their respective tax basis, as well as the future tax consequences attributable to the future utilization of existing tax net operating loss and other types of carryforwards. Deferred tax assets and liabilities are measured using enacted tax rates expected to apply to taxable income in the years in which those temporary differences and carryforwards are expected to be recovered or settled. The effect on deferred tax assets and liabilities of a change in tax rates is recognized in income in the period that the change in rate is enacted.
In recording deferred income tax assets, we consider whether it is more likely than not that some portion or all of our deferred income tax assets will be realized in the future. The ultimate realization of deferred income tax assets is dependent upon the generation of future taxable income during the periods in which those deferred income tax assets would be deductible. We believe that after considering all the available objective evidence, historical and prospective, with greater weight given to historical evidence, we are not able to determine that it is more likely than not that all of our deferred tax assets will be realized. As a result, we established valuation allowances for our deferred tax assets and U.S. federal and state net operating loss carryforwards that are not expected to be utilized due to the uncertainty of generating taxable income prior to the expiration of the carryforward periods. We will continue to assess the valuation allowances against deferred tax assets considering all available information obtained in future reporting periods.
41
Stock-based compensation. We follow the fair value based method in accounting for equity-based compensation. Under the fair value based method, compensation cost is measured at the grant date based on the fair value of the award and is recognized on a straight-line basis over the award vesting period.
Recent accounting pronouncements. In January 2017, the FASB issued Accounting Standards Update No. 2017-04 (ASU 2017-04) "Intangibles-Goodwill and Other (Topic 350): Simplifying the Test for Goodwill Impairment." ASU 2017-04 eliminates step two of the goodwill impairment test and specifies that goodwill impairment should be measured by comparing the fair value of a reporting unit with its carrying amount. ASU 2017-04 is effective for annual or interim goodwill impairment tests performed in fiscal years beginning after December 15, 2019 and early adoption is permitted. We implemented ASU 2017-04 during the fourth quarter of 2020 when we performed the annual goodwill impairment assessment and it did not have a significant effect on our results of operations, liquidity or financial position.
In June 2016, The FASB issued Accounting Standards Update ASU No. 2016-13 ("ASU 2016-13") that amends guidance on reporting credit losses for trade receivables, net investments in leases, debt securities, loans and certain other instruments. ASU 2016-13 requires the use of a forward-looking expected loss model as opposed to existing incurred loss recognition. The guidance requires a cumulative-effect adjustment to the statement of financial position as of the beginning of the first reporting period in which the standard is effective. We implemented ASU 2016-13 during the first quarter of 2020. We concluded there was no cumulative-effect adjustment required and the other provisions of the standard did not have a significant effect on our results of operations, liquidity or financial position.
ITEM 7A. QUANTITATIVE AND QUALITATIVE DISCLOSURES ABOUT MARKET RISK
Our financial condition, results of operations and capital resources are highly dependent upon the prevailing market prices of oil and natural gas. These commodity prices are subject to wide fluctuations and market uncertainties due to a variety of factors that are beyond our control. Factors influencing oil and natural gas prices include the level of global demand for oil, the foreign supply of oil and natural gas, the establishment of and compliance with production quotas by oil exporting countries, weather conditions which determine the demand for natural gas, the price and availability of alternative fuels and overall economic conditions. It is impossible to predict future oil and natural gas prices with any degree of certainty. Sustained weakness in oil and natural gas prices may adversely affect our financial condition and results of operations, and may also reduce the amount of oil and natural gas reserves that we can produce economically. Any reduction in our oil and natural gas reserves, including reductions due to price fluctuations, can have an adverse effect on our ability to obtain capital for our exploration and development activities. Similarly, any improvements in oil and natural gas prices can have a favorable impact on our financial condition, results of operations and capital resources. Based on our oil and natural gas production in 2020 and taking into account any oil or natural gas price swap agreements we had in place, a $1.00 change in the price per barrel of oil would have resulted in a change in our cash flow for such period by approximately $1.4 million and a $0.10 change in the price per Mcf of natural gas would have changed our cash flow by approximately $24.4 million.
As of December 31, 2020, we have entered into natural gas price swap agreements to hedge approximately 208.3 Bcf of our 2021 through 2022 production at an average price of $2.54 per MMBtu and natural gas swaption contracts where the counterparty has the right to exercise a call option to enter into a price swap with us on 65.7 Bcf of our 2021 through 2022 natural gas production at an average price of $2.51 per MMBtu. We have also entered into natural gas collars to hedge approximately 120.5 Bcf of natural gas with an average floor price of $2.46 per MMBtu and an average ceiling price of $2.99 per MMBtu. We also have oil collars to hedge 182,500 Bbls with an average floor price of $40.00 per barrel and an average ceiling price of $45.00 per barrel. None of our derivative contracts have margin requirements or collateral provisions that could require funding prior to the scheduled cash settlement date. The change in the fair value of our natural gas swaps that would result from a 10% change in commodities prices at December 31, 2020 would be $43.4 million. Such a change in fair value could be a gain or a loss depending on whether prices increase or decrease. Since December 31, 2020, the Company added natural gas collar contracts to hedge 32.9 Bcf of natural gas production from July 2021 to December 2022 at an average ceiling price of $3.20 per MMBtu and an average floor price of $2.50 per MMBtu and added natural gas swap contracts to hedge 7.3 Bcf of natural gas production from January 2022 to December 2022 at an average price of $2.70 per MMBtu. The Company
42
also added oil collar contracts to hedge 349,500 Bbls of oil production from January 2021 to December 2021 at an average ceiling price of $54.96 per Bbl and an average floor price of $42.39 per Bbl.
Interest Rates
At December 31, 2020, we had approximately $2.8 billion principal amount of long-term debt outstanding. The 2026 Notes, of which $1.65 billion was outstanding at December 31, 2020, bear interest at a fixed rate of 9¾%. The 2025 Notes, of which $619.4 million was outstanding at December 31, 2020 bear interest at a fixed rate of 7½%. The fair market value of the 2026 Notes and 2025 Notes as of December 31, 2020 was $1,769.6 million and $628.7 million, respectively, based on the market price of approximately 107.3% and 101.5% of the face amount of such debt. At December 31, 2020, we had $500.0 million outstanding under our bank credit facility, which is subject to variable rates of interest that are tied to LIBOR or the corporate base rate, at our option. Any increase in these interest rates would have an adverse impact on our results of operations and cash flow.
ITEM 8. FINANCIAL STATEMENTS AND SUPPLEMENTARY DATA
Our consolidated financial statements are included on pages F-1 to F-33 of this report.
We have prepared these financial statements in conformity with generally accepted accounting principles. We are responsible for the fairness and reliability of the financial statements and other financial data included in this report. In the preparation of the financial statements, it is necessary for us to make informed estimates and judgments based on currently available information on the effects of certain events and transactions.
Our registered independent public accountants, Ernst & Young LLP, are engaged to audit our financial statements and to express an opinion thereon. Their audit is conducted in accordance with auditing standards generally accepted in the United States to enable them to report whether the financial statements present fairly, in all material respects, our financial position and results of operations in accordance with accounting principles generally accepted in the United States.
The audit committee of our board of directors is comprised of three directors who are not our employees. This committee meets periodically with our independent public accountants and management. Our independent public accountants have full and free access to the audit committee to meet, with and without management being present, to discuss the results of their audits and the quality of our financial reporting.
ITEM 9. CHANGES IN AND DISAGREEMENTS WITH ACCOUNTANTS ON ACCOUNTING AND FINANCIAL DISCLOSURE
None.
ITEM 9A. CONTROLS AND PROCEDURES
Evaluation of Controls and Procedures. Disclosure controls and procedures (as defined in Rules 13a-15(e) and 15d-15(e) under the Securities Exchange Act of 1934, as amended, or the Exchange Act) are designed to provide reasonable assurance that information required to be disclosed in reports we file or submit under the Exchange Act is recorded, processed, summarized and reported within the time periods specified in the rules and forms of the SEC and that such information is accumulated and communicated to our management, including our Chief Executive Officer and Chief Financial Officer, as appropriate to allow timely decisions regarding required disclosures.
We performed an evaluation of the effectiveness of our disclosure controls and procedures as of December 31, 2020. The evaluation was performed with the participation of senior management of each business segment and key corporate functions, and under the supervision of the Chief Executive Officer and Chief Financial Officer.
Based on our evaluation of our disclosure controls and procedures, our chief executive officer and chief financial officer concluded that our disclosure controls and procedures were effective as of December 31, 2020 to provide reasonable assurance that information required to be disclosed by us in the reports filed or submitted by us under the Securities Exchange Act of 1934 is recorded, processed, summarized and reported within the time periods
43
specified in the SEC's rules and forms, and to provide reasonable assurance that information required to be disclosed by us is accumulated and communicated to our management, including our chief executive officer and chief financial officer, as appropriate, to allow timely decisions regarding required disclosure.
Changes in Internal Control over Financial Reporting. There were no changes in our internal control over financial reporting during the quarter ended December 31, 2020 that materially affected or are reasonably likely to materially affect our internal control over financial reporting.
Management's Report on Internal Control over Financial Reporting. We are responsible for establishing and maintaining adequate internal control over financial reporting for the Company. In order to evaluate the effectiveness of internal control over financial reporting, as required by Section 404 of the Sarbanes-Oxley Act, we conducted an assessment, including testing, using the criteria in Internal Control — Integrated Framework, issued by the Committee of Sponsoring Organizations of the Treadway Commission (2013 framework) (the COSO criteria). Our system of internal control over financial reporting is designed to provide reasonable assurance regarding the reliability of financial reporting and the preparation of financial statements for external purposes in accordance with generally accepted accounting principles. Because of its inherent limitations, internal control over financial reporting may not prevent or detect misstatements. Also, projections of any evaluation of effectiveness to future periods are subject to the risk that controls may become inadequate because of changes in conditions, or that the degree of compliance with the policies or procedures may deteriorate. As of December 31, 2020, we assessed the effectiveness of the Company's internal control over financial reporting based on the COSO criteria, and based on that assessment we determined that the Company maintained effective internal control over financial reporting as of December 31, 2020.
Ernst & Young LLP, the independent registered public accounting firm that audited the consolidated financial statements of the Company included in this Annual Report on Form 10-K, has issued an attestation report on the effectiveness of the Company's internal control over financial reporting as of December 31, 2020. The report, which expresses an unqualified opinion on the effectiveness of the Company's internal control over financial reporting as of December 31, 2020, follows below.
44
Report of Independent Registered Public Accounting Firm
To the Board of Directors and Stockholders
Comstock Resources, Inc.
Opinion on Internal Control over Financial Reporting
We have audited Comstock Resources, Inc. and subsidiaries’ internal control over financial reporting as of December 31, 2020, based on criteria established in Internal Control — Integrated Framework issued by the Committee of Sponsoring Organizations of the Treadway Commission (2013 framework) (the COSO criteria). In our opinion, Comstock Resources, Inc. and subsidiaries (the Company) maintained, in all material respects, effective internal control over financial reporting as of December 31, 2020, based on the COSO criteria.
We also have audited, in accordance with the standards of the Public Company Accounting Oversight Board (United States) (PCAOB), the consolidated balance sheets of the Company as of December 31, 2019 and 2020, the related consolidated statements of operations, stockholders’ equity and cash flows for the period from January 1, 2018 through August 13, 2018 (Predecessor), the period from August 14, 2018 through December 31, 2018 (Successor), and each of the two years ended December 31, 2020 (Successor), and the related notes and our report dated February 17, 2021 expressed an unqualified opinion thereon.
Basis for Opinion
The Company’s management is responsible for maintaining effective internal control over financial reporting and for its assessment of the effectiveness of internal control over financial reporting included in the accompanying Management’s Report on Internal Control over Financial Reporting. Our responsibility is to express an opinion on the Company’s internal control over financial reporting based on our audit. We are a public accounting firm registered with the PCAOB and are required to be independent with respect to the Company in accordance with the U.S. federal securities laws and the applicable rules and regulations of the Securities and Exchange Commission and the PCAOB.
We conducted our audit in accordance with the standards of the PCAOB. Those standards require that we plan and perform the audit to obtain reasonable assurance about whether effective internal control over financial reporting was maintained in all material respects.
Our audit included obtaining an understanding of internal control over financial reporting, assessing the risk that a material weakness exists, testing and evaluating the design and operating effectiveness of internal control based on the assessed risk, and performing such other procedures as we considered necessary in the circumstances. We believe that our audit provides a reasonable basis for our opinion.
Definition and Limitations of Internal Control Over Financial Reporting
A company’s internal control over financial reporting is a process designed to provide reasonable assurance regarding the reliability of financial reporting and the preparation of financial statements for external purposes in accordance with generally accepted accounting principles. A company’s internal control over financial reporting includes those policies and procedures that (1) pertain to the maintenance of records that, in reasonable detail, accurately and fairly reflect the transactions and dispositions of the assets of the company; (2) provide reasonable assurance that transactions are recorded as necessary to permit preparation of financial statements in accordance with generally accepted accounting principles, and that receipts and expenditures of the company are being made only in accordance with authorizations of management and directors of the company; and (3) provide reasonable assurance regarding prevention or timely detection of unauthorized acquisition, use, or disposition of the company’s assets that could have a material effect on the financial statements.
Because of its inherent limitations, internal control over financial reporting may not prevent or detect misstatements. Also, projections of any evaluation of effectiveness to future periods are subject to the risk that controls may become inadequate because of changes in conditions, or that the degree of compliance with the policies or procedures may deteriorate.
/s/ ERNST & YOUNG LLP
Dallas, Texas
February 17, 2021
ITEM 9B. OTHER INFORMATION
None.
45
PART III
ITEM 10. DIRECTORS, EXECUTIVE OFFICERS AND CORPORATE GOVERNANCE
The information required by this item is incorporated herein by reference to "Business – Directors and Executive Officers" in this Form 10-K and to our definitive proxy statement which will be filed with the SEC within 120 days after December 31, 2020.
Section 16(a) Beneficial Ownership Reporting Compliance. Our directors, executive officers and stockholders with ownership of 10% or greater are required, under Section 16(a) of the Securities Exchange Act of 1934, to file reports of their ownership and changes to their ownership of our securities with the SEC. Based solely on our review of the reports and any written representations we received that no other reports were required, we believe that, during the year ended December 31, 2020, all of our officers, directors and stockholders with ownership of 10% or greater complied with all Section 16(a) filing requirements applicable to them.
Code of Ethics. We have adopted a Code of Business Conduct and Ethics that is applicable to all of our directors, officers and employees as required by New York Stock Exchange rules. We have also adopted a Code of Ethics for Senior Financial Officers that is applicable to our Chief Executive Officer and Senior Financial Officers. Both the Code of Business Conduct and Ethics and Code of Ethics for Senior Financial Officers may be found on our website at www.comstockresources.com. Both of these documents are also available, without charge, to any stockholder upon request to: Comstock Resources, Inc., Attn: Investor Relations, 5300 Town and Country Blvd., Suite 500, Frisco, Texas 75034, (972) 668-8800. We intend to disclose any amendments or waivers to these codes that apply to our Chief Executive Officer and senior financial officers on our website in accordance with applicable SEC rules. Please see the definitive proxy statement for our 2021 annual meeting, which will be filed with the SEC within 120 days of December 31, 2020, for additional information regarding our corporate governance policies.
ITEM 11. EXECUTIVE COMPENSATION
The information required by this item is incorporated herein by reference to our definitive proxy statement which will be filed with the SEC within 120 days after December 31, 2020.
ITEM 12. SECURITY OWNERSHIP OF CERTAIN BENEFICIAL OWNERS AND MANAGEMENT AND RELATED STOCKHOLDER MATTERS
The following table summarizes certain information regarding our equity compensation plans as of December 31, 2020:
| Number of securities to be issued upon exercise of outstanding options, warrants and rights | Number of securities authorized for future issuance under equity compensation plans (excluding outstanding options, warrants and rights) | ||||||||||
| Equity compensation plans approved by stockholders | 2,272,976(1) | 4,776,556 | |||||||||
_______________
(1)Represents performance share unit awards that would be issuable based upon achievement of the maximum awards under the terms of the performance share unit awards.
We do not have any equity compensation plans that were not approved by stockholders.
Further information required by this item is incorporated herein by reference to our definitive proxy statement which will be filed with the SEC within 120 days after December 31, 2020.
46
ITEM 13. CERTAIN RELATIONSHIPS AND RELATED TRANSACTIONS, AND DIRECTOR INDEPENDENCE
The information required by this item is incorporated herein by reference to our definitive proxy statement which will be filed with the SEC within 120 days after December 31, 2020.
ITEM 14. PRINCIPAL ACCOUNTANT FEES AND SERVICES
The information required by this item is incorporated herein by reference to our definitive proxy statement which will be filed with the SEC within 120 days after December 31, 2020.
PART IV
ITEM 15. EXHIBITS AND FINANCIAL STATEMENT SCHEDULES
(a)Financial Statements:
| 1. | The following consolidated financial statements and notes of Comstock Resources, Inc. are included on Pages F-2 to F-33 of this report: | |||||||
F-1 | ||||||||
F-3 | ||||||||
F-4 | ||||||||
F-5 | ||||||||
F-6 | ||||||||
F-7 | ||||||||
| 2. | All financial statement schedules are omitted because they are not applicable, or are immaterial or the required information is presented in the consolidated financial statements or the related notes. | |||||||
(b)Exhibits:
The exhibits to this report required to be filed pursuant to Item 15(c) are listed below.
| Exhibit No. | Description | |||||||
| 2.1 | Contribution Agreement dated May 9, 2018, by and among Arkoma Drilling, L.P., Williston Drilling, L.P. and the Company (incorporated by reference to Exhibit 2.1 to our Current Report on Form 8-K/A dated May 9, 2018). | |||||||
| 2.2 | Amendment No. 1 to the Contribution Agreement, dated as of August 14, 2018, by and among Arkoma Drilling, L.P., Williston Drilling, L.P. and the Company (incorporated by reference to Exhibit 2.1 to our Current Report on Form 8-K dated August 13, 2018). | |||||||
| 2.3 | Agreement and Plan of Merger, dated June 7, 2019, by and among the Company, Covey Park Energy LLC, New Covey Park Energy LLC and Covey Park Energy Holdings LLC (incorporated by reference to Exhibit 2.1 to our Current Report on Form 8-K dated June 7, 2019). | |||||||
| 2.4 | First Amendment to Agreement and Plan of Merger dated as of July 15, 2019 by and among the Company, New Covey Park Energy LLC, Covey Park Energy LLC and Covey Park Energy Holdings LLC (incorporated by reference to Exhibit 10.1 to our Current Report on Form 8-K dated July 15, 2019). | |||||||
| 3.1 | Second Amended and Restated Articles of Incorporation of the Company (incorporated by reference to Exhibit 3.1 to our Current Report on Form 8-K dated August 13, 2018). | |||||||
| 3.2 | Amendment to Second Amended and Restated Articles of Incorporation of the Company, dated July 16, 2019 (incorporated by reference to Exhibit 3.1 to our Current Report on Form 8-K dated July 15, 2019). | |||||||
| 3.3 | Amended and Restated Bylaws (incorporated by reference to Exhibit 3.1 to our Current Report on Form 8-K dated August 21, 2014). | |||||||
| 3.4 | First Amendment to Amended and Restated Bylaws of the Company (incorporated by reference to Exhibit 3.1 to our Current Report on Form 8-K dated August 17, 2018). | |||||||
| 3.5 | Amendment No. 2 to the Amended and Restated Bylaws (incorporated by reference to Exhibit 3.2 to our Current Report on Form 8-K dated July 15, 2019). | |||||||
47
| Exhibit No. | Description | |||||||
| 4.1 | Indenture, dated as of August 3, 2018, by and between Comstock Escrow Corporation, as issuer, and American Stock Transfer & Trust Company LLC, as trustee for the 9¾% Senior Notes due 2026 (incorporated by reference to Exhibit 4.1 to our Current Report on Form 8-K dated August 3, 2018). | |||||||
| 4.2 | First Supplemental Indenture dated August 14, 2018 among the Company, the Guarantors and American Stock Transfer & Trust Company, LLC, as trustee for the 9¾% Senior Notes due 2026 (incorporated by reference to Exhibit 4.3 to our Current Report on Form 8-K dated August 13, 2018). | |||||||
| 4.3 | Supplemental Indenture dated July 16, 2019 among the Company, the Guarantors and American Stock Transfer & Trust Company, LLC for the 9¾% Senior Notes due 2026 (incorporated by reference to Exhibit 4.3 to our Current Report on Form 8-K dated July 15, 2019). | |||||||
| 4.4 | Indenture dated May 3, 2017 between Covey Park Energy LLC, Covey Park Finance Corp. and Wells Fargo Bank National Association, as Trustee, for the 7½% Senior Notes due 2025 (incorporated by reference to Exhibit 4.7 to our Quarterly Report on Form 10-Q for the quarter ended June 30, 2019). | |||||||
| 4.5 | Supplemental Indenture dated July 16, 2019 among the Company and Wells Fargo Bank, National Association for the 7½% Senior Notes due 2025 (incorporated by reference to Exhibit 4.1 to our Current Report on Form 8-K dated July 15, 2019). | |||||||
| 4.6 | Supplemental Indenture dated July 16, 2019 among the Company, the Guaranteeing Subsidiaries and Wells Fargo Bank, National Association for the 7½% Senior Notes due 2025 (incorporated by reference to Exhibit 4.2 to our Current Report on Form 8-K dated July 15, 2019). | |||||||
| 4.7 | Instrument of Resignation, Appointment and Acceptance dated as of July 16, 2019 among the Company, the Subsidiary Guarantors named therein, Wells Fargo Bank, N.A. and American Stock Transfer & Trust Company LLC (incorporated by reference to Exhibit 10.3 to our Current Report on Form 8-K dated July 15, 2019). | |||||||
| 4.8 | Indenture dated June 23, 2020 by and among the Company, the Guaranteeing Subsidiaries and American Stock Transfer & Trust Company, LLC for the 9¾% Senior Notes due 2026 (incorporated by reference to Exhibit 4.1 to our Current Report on Form 8-K dated June 23, 2020). | |||||||
| 4.9 | Supplemental Indenture dated June 23, 2020 by and among the Company, the Guaranteeing Subsidiaries and American Stock Transfer & Trust Company, LLC for the 9¾% Senior Notes due 2026 (incorporated by reference to Exhibit 4.2 to our Current Report on Form 8-K dated June 23, 2020). | |||||||
| 4.10 | Certificate of Designations of the Series B Redeemable Convertible Preferred Stock (incorporated by reference to Exhibit 4.4 to our Current Report on Form 8-K dated July 15, 2019). | |||||||
| 4.11 | Shareholders Agreement, dated June 7, 2019, by and among the Company, Arkoma Drilling CP, LLC, Williston Drilling CP, LLC, Arkoma Drilling, L.P., Williston Drilling, L.P., New Covey Park Energy LLC and Jerral W. Jones (incorporated by reference to Exhibit 10.2 to our Current Report on Form 8-K dated June 10, 2019). | |||||||
| 10.1 | Amended and Restated Credit Agreement dated as of July 16, 2019, among the Company, Bank of Montreal as Administrative Agent and the lenders party thereto from time to time (incorporated by reference to Exhibit 10.2 to our Current Report on Form 8-K dated July 15, 2019). | |||||||
| 10.2 | First Amendment to Amended and Restated Credit Agreement dated November 27, 2019, by and among the Company, Bank of Montreal as the Administrative Agent and the lenders party thereto from time to time (incorporated by reference to Exhibit 10.2 to our Annual Report on Form 10-K for Fiscal Year Ended December 31, 2019). | |||||||
| 10.3 | Borrowing Base Redetermination Agreement and Second Amendment to Amended and Restated Credit Agreement dated May 6, 2020 by and among the Company, Bank of Montreal as Administrative Agent and the lenders party thereto from time to time (incorporated by reference to Exhibit 10.1 to our Quarterly Report on Form 10-Q for the Quarter ended March 31, 2020). | |||||||
| 10.4 | Third Amendment to Amended and Restated Credit Agreement dated June 12, 2020 by and among the Company, Bank of Montreal as Administrative Agent and the lenders party thereto from time to time (incorporated by reference to Exhibit 10.1 to our Current Report on Form 8-K dated June 12, 2020). | |||||||
| 10.5 | Fourth Amendment to Amended and Restated Credit Agreement dated August 13, 2020 by and among the Company, Bank of Montreal as Administrative Agent and the lenders party thereto from time to time (incorporated by reference to Exhibit 10.1 to our Current Report on Form 8-K dated August 13, 2020). | |||||||
| 10.6 | Fifth Amendment to Amended and Restated Credit Agreement, dated as of December 4, 2020, by and among the Company, Bank of Montreal as Administrative Agent and the lenders party thereto from time to time (incorporated by reference to Exhibit 10.1 to our Current Report on Form 8-K dated December 8, 2020). | |||||||
| 10.8 | Amended and Restated Registration Rights Agreement, dated June 7, 2019, by and among the Company, Arkoma Drilling, L.P., Williston Drilling, L.P., Arkoma Drilling CP, LLC, Williston Drilling CP, LLC, New Covey Park Energy LLC and Jerral W. Jones (incorporated by reference to Exhibit 10.3 to our Current Report on Form 8-K dated June 7, 2019). | |||||||
| 10.9 | Amendment No. 1 to the Amended and Restated Registration Rights Agreement, dated December 17, 2019, by and among the Company, Arkoma Drilling, L.P., Williston Drilling, L.P. and New Covey Park Energy LLC incorporated by reference to Exhibit 10.3 to our Annual Report on Form 10-K for the year ended December 31, 2019. | |||||||
| 10.10# | Comstock Resources, Inc. 2019 Long-term Incentive Plan Effective as of May 31, 2019 (incorporated by reference to Exhibit 99 to our Registration Statement on Form S-8 dated June 4, 2019). | |||||||
48
| Exhibit No. | Description | |||||||
| 10.11# | Employment Agreement dated September 7, 2018 by and between the Company and M. Jay Allison (Incorporated by reference to Exhibit 10.1 to our Current Report on Form 8-K dated September 7, 2018). | |||||||
| 10.12# | Employment Agreement dated September 7, 2018 by and between the Company and Roland O. Burns (incorporated by reference to Exhibit 10.2 to our Current Report on Form 8-K dated September 7, 2018). | |||||||
| 10.13# | Employment Agreement dated June 22, 2013 by and between the Company (as successor in interest to Covey Park) and David Terry (incorporated by reference to Exhibit 10.8 to our Annual Report on Form 10-K for the year ended December 31, 2019). | |||||||
| 10.14 | Lease between Stonebriar I Office Partners, Ltd., and Comstock Resources, Inc. dated May 6, 2004 (incorporated by reference to Exhibit 10.24 to our Annual Report on Form 10-K for the year ended December 31, 2004). | |||||||
| 10.15 | First Amendment to the Lease Agreement dated August 25, 2005, between Stonebriar I Office Partners, Ltd. and Comstock Resources, Inc. (incorporated by reference to Exhibit 10.19 to our Annual Report on Form 10-K for the year ended December 31, 2005). | |||||||
| 10.16 | Second Amendment to the Lease Agreement dated October 15, 2007 between Stonebriar I Office Partners, Ltd. and Comstock Resources, Inc. (incorporated by reference to Exhibit 10.10 to our Annual Report on Form 10-K for the year ended December 31, 2008). | |||||||
| 10.17 | Third Amendment to the Lease Agreement dated September 30, 2008 between Stonebriar I Office Partners, Ltd. and Comstock Resources, Inc. (incorporated by reference to Exhibit 10.11 to our Annual Report on Form 10-K for the year ended December 31, 2008). | |||||||
| 10.18 | Fourth Amendment to the Lease Agreement dated May 8, 2009 between Stonebriar I Office Partners, Ltd. and Comstock Resources, Inc. (incorporated by reference to Exhibit 10.2 to our Quarterly Report on Form 10-Q for the quarter ended June 30, 2009). | |||||||
| 10.19 | Fifth Amendment to the Lease Agreement dated June 15, 2011 between Stonebriar I Office Partners, Ltd. and Comstock Resources, Inc. (incorporated by reference to Exhibit 10.1 to our Quarterly Report on Form 10-Q for the quarter ended June 30, 2011). | |||||||
| 101.INS* | XBRL Instance Document | |||||||
| 101.SCH* | XBRL Schema Document | |||||||
| 101.CAL* | XBRL Calculation Linkbase Document | |||||||
| 101.LAB* | XBRL Labels Linkbase Document | |||||||
| 101.PRE* | XBRL Presentation Linkbase Document | |||||||
| 101.DEF* | XBRL Definition Linkbase Document | |||||||
| 104* | Cover Page Interactive Data File (embedded within the Inline XBRL document) | |||||||
_______________
* Filed herewith.
+ Furnished herewith.
# Management contract or compensatory plan document.
49
SIGNATURES
Pursuant to the requirements of Section 13 or 15(d) of the Securities Exchange Act of 1934, the registrant has duly caused this report to be signed on its behalf by the undersigned, thereunto duly authorized.
| COMSTOCK RESOURCES, INC. | ||||||||
| By: | /s/ M. JAY ALLISON | |||||||
| M. Jay Allison Chief Executive Officer | ||||||||
| Date: February 17, 2021 | (Principal Executive Officer) | |||||||
Pursuant to the requirements of the Securities Exchange Act of 1934, this report has been signed below by the following persons on behalf of the registrant and in the capacities and on the dates indicated.
| /s/ M. JAY ALLISON | Chief Executive Officer and | February 17, 2021 | |||||||||
| M. Jay Allison | Chairman of the Board of Directors (Principal Executive Officer) | ||||||||||
| /s/ ROLAND O. BURNS | President, Chief Financial Officer, | February 17, 2021 | |||||||||
| Roland O. Burns | Secretary and Director (Principal Financial and Accounting Officer) | ||||||||||
| /s/ ELIZABETH B. DAVIS | Director | February 17, 2021 | |||||||||
| Elizabeth B. Davis | |||||||||||
| /s/ MORRIS E. FOSTER | Director | February 17, 2021 | |||||||||
| Morris E. Foster | |||||||||||
| /s/ JIM L. TURNER | Director | February 17, 2021 | |||||||||
| Jim L. Turner | |||||||||||
50
COMSTOCK RESOURCES, INC. AND SUBSIDIARIES
FINANCIAL STATEMENTS
INDEX
51
REPORT OF INDEPENDENT REGISTERED PUBLIC ACCOUNTING FIRM
To the Board of Directors and Stockholders
Comstock Resources, Inc.
Opinion on the Financial Statements
We have audited the accompanying consolidated balance sheets of Comstock Resources, Inc. and subsidiaries (the Company) as of December 31, 2019 and 2020, the related consolidated statements of operations, stockholders’ equity, and cash flows for the period from January 1, 2018 through August 13, 2018 (Predecessor), the period from August 14, 2018 through December 31, 2018 (Successor), and each the two years in the period ended December 31, 2020 (Successor), and the related notes (collectively referred to as the “consolidated financial statements“). In our opinion, the consolidated financial statements present fairly, in all material respects, the financial position of the Company at December 31, 2019 and 2020, and the results of its operations and its cash flows for the period from January 1, 2018 through August 13, 2018 (Predecessor), the period from August 14, 2018 through December 31, 2018 (Successor), and each of the two years in the period ended December 31, 2020 (Successor), in conformity with U.S. generally accepted accounting principles.
We also have audited, in accordance with the standards of the Public Company Accounting Oversight Board (United States) (PCAOB), the Company‘s internal control over financial reporting as of December 31, 2020, based on criteria established in Internal Control-Integrated Framework issued by the Committee of Sponsoring Organizations of the Treadway Commission (2013 framework) and our report dated February 17, 2021 expressed an unqualified opinion thereon.
Basis for Opinion
These financial statements are the responsibility of the Company‘s management. Our responsibility is to express an opinion on the Company‘s financial statements based on our audits. We are a public accounting firm registered with the PCAOB and are required to be independent with respect to the Company in accordance with the U.S. federal securities laws and the applicable rules and regulations of the Securities and Exchange Commission and the PCAOB.
We conducted our audits in accordance with the standards of the PCAOB. Those standards require that we plan and perform the audit to obtain reasonable assurance about whether the financial statements are free of material misstatement, whether due to error or fraud. Our audits included performing procedures to assess the risks of material misstatement of the financial statements, whether due to error or fraud, and performing procedures that respond to those risks. Such procedures included examining, on a test basis, evidence regarding the amounts and disclosures in the financial statements. Our audits also included evaluating the accounting principles used and significant estimates made by management, as well as evaluating the overall presentation of the financial statements. We believe that our audits provide a reasonable basis for our opinion.
Critical Audit Matters
The critical audit matter communicated below is a matter arising from the current period audit of the consolidated financial statements that was communicated or required to be communicated to the audit committee and that: (1) relates to accounts or disclosures that are material to the consolidated financial statements and (2) involved our especially challenging, subjective, or complex judgments. The communication of the critical audit matter does not alter in any way our opinion on the consolidated financial statements, taken as a whole, and we are not, by communicating the critical audit matter below, providing a separate opinion on the critical audit matter or on the accounts or disclosures to which it relates.
F-1
| Depreciation, Depletion and Amortization of Proved Oil and Gas Properties | |||||
| Description of the Matter | At December 31, 2020, the net book value of the Company’s proved oil and gas properties was $3,746 million, and depreciation, depletion and amortization (DD&A) expense was $417 million for the year then ended. As described in Note 1, under the successful efforts method of accounting, capitalized costs of proved properties are depleted using the units-of-production method based on proved reserves, as estimated by the Company’s engineers. Proved oil and gas reserve estimates are based on geological and engineering interpretation and judgment. Significant judgment is required by the Company’s engineers in evaluating geological and engineering data when estimating proved oil and gas reserves. Estimating reserves also requires the selection of inputs, including oil and gas price assumptions, future operating and capital cost assumptions and tax rates by jurisdiction, among others. Because of the complexity involved in estimating oil and gas reserves, management used independent petroleum engineers to audit the estimates prepared by the Company’s engineers as of December 31, 2020. | ||||
Auditing the Company’s DD&A calculation is especially complex because of the use of the work of the Company’s engineers and the independent petroleum engineers and the evaluation of management’s determination of the inputs described above used by the engineers in estimating proved oil and gas reserves. | |||||
| How We Addressed the Matter in Our Audit | We obtained an understanding, evaluated the design and tested the operating effectiveness of the Company’s controls over its process to calculate DD&A, including management’s controls over the completeness and accuracy of the financial data provided to the engineers for use in estimating proved oil and gas reserves. | ||||
Our audit procedures included, among others, evaluating the professional qualifications and objectivity of the Company’s engineers responsible for the preparation of the reserve estimates and the independent petroleum engineers used to audit the estimates. In addition, in assessing whether we can use of the work of the engineers, we evaluated the completeness and accuracy of the financial data and inputs described above used by the engineers in estimating proved oil and gas reserves by agreeing them to source documentation, and we identified and evaluated corroborative and contrary evidence. For proved undeveloped reserves, we evaluated management’s development plan for compliance with SEC requirements. We also tested the mathematical accuracy of the DD&A calculations, including comparing the proved oil and gas reserves amounts used to the Company’s reserve report. | |||||
/s/ ERNST & YOUNG LLP
We have served as the Company's auditor since 2003.
Dallas, Texas
February 17, 2021
F-2
COMSTOCK RESOURCES, INC. AND SUBSIDIARIES
CONSOLIDATED BALANCE SHEETS
As of December 31, 2019 and 2020
| Successor | |||||||||||
| December 31, 2019 | December 31, 2020 | ||||||||||
| ASSETS | (In thousands) | ||||||||||
| Cash and Cash Equivalents | $ | $ | |||||||||
| Accounts Receivable: | |||||||||||
| Oil and gas sales | |||||||||||
| Joint interest operations | |||||||||||
| From affiliates | |||||||||||
| Derivative Financial Instruments | |||||||||||
| Income Taxes Receivable | |||||||||||
| Other Current Assets | |||||||||||
| Total current assets | |||||||||||
| Property and Equipment: | |||||||||||
| Oil and natural gas properties, successful efforts method: | |||||||||||
| Proved properties | |||||||||||
| Unproved properties | |||||||||||
| Other property and equipment | |||||||||||
| Accumulated depreciation, depletion and amortization | ( | ( | |||||||||
| Net property and equipment | |||||||||||
| Goodwill | |||||||||||
| Income Taxes Receivable | |||||||||||
| Derivative Financial Instruments | |||||||||||
| Operating Lease Right-of-Use Assets | |||||||||||
| Other Assets | |||||||||||
| $ | $ | ||||||||||
| LIABILITIES AND STOCKHOLDERS' EQUITY | |||||||||||
| Accounts Payable | $ | $ | |||||||||
| Accrued Expenses | |||||||||||
| Operating Leases | |||||||||||
| Derivative Financial Instruments | |||||||||||
| Total current liabilities | |||||||||||
| Long-term Debt | |||||||||||
| Deferred Income Taxes | |||||||||||
| Derivative Financial Instruments | |||||||||||
| Long-term Operating Leases | |||||||||||
| Reserve for Future Abandonment Costs | |||||||||||
| Other Non-current Liabilities | |||||||||||
| Total liabilities | |||||||||||
| Commitments and Contingencies | |||||||||||
| Mezzanine Equity: | |||||||||||
Preferred Stock — | |||||||||||
Series A | |||||||||||
Series B | |||||||||||
| Stockholders' Equity: | |||||||||||
Common stock—$ | |||||||||||
| Additional paid-in capital | |||||||||||
| Accumulated earnings | |||||||||||
| Total stockholders' equity | |||||||||||
| $ | $ | ||||||||||
The accompanying notes are an integral part of these statements.
F-3
COMSTOCK RESOURCES, INC. AND SUBSIDIARIES
CONSOLIDATED STATEMENTS OF OPERATIONS
| Predecessor | Successor | ||||||||||||||||||||||||||||
| Period from January 1, 2018 through August 13, 2018 | Period from August 14, 2018 through December 31, 2018 | Year Ended December 31, 2019 | Year Ended December 31, 2020 | ||||||||||||||||||||||||||
| (In thousands, except per share amounts) | |||||||||||||||||||||||||||||
| Natural gas sales | $ | $ | $ | $ | |||||||||||||||||||||||||
| Oil sales | |||||||||||||||||||||||||||||
| Total oil and gas sales | |||||||||||||||||||||||||||||
| Operating expenses: | |||||||||||||||||||||||||||||
| Production and ad valorem taxes | |||||||||||||||||||||||||||||
| Gathering and transportation | |||||||||||||||||||||||||||||
| Lease operating | |||||||||||||||||||||||||||||
| Depreciation, depletion and amortization | |||||||||||||||||||||||||||||
| General and administrative, net | |||||||||||||||||||||||||||||
| Exploration | |||||||||||||||||||||||||||||
| Loss (gain) on sale of assets | ( | ( | |||||||||||||||||||||||||||
| Total operating expenses | |||||||||||||||||||||||||||||
| Operating income (loss) | |||||||||||||||||||||||||||||
| Other income (expenses): | |||||||||||||||||||||||||||||
| Gain from derivative financial instruments | |||||||||||||||||||||||||||||
| Other income | |||||||||||||||||||||||||||||
| Interest expense | ( | ( | ( | ( | |||||||||||||||||||||||||
| Loss on early extinguishment of debt | ( | ||||||||||||||||||||||||||||
| Transaction costs | ( | ( | |||||||||||||||||||||||||||
| Total other income (expenses) | ( | ( | ( | ( | |||||||||||||||||||||||||
| Income (loss) before income taxes | ( | ( | |||||||||||||||||||||||||||
| (Provision for) benefit from income taxes | ( | ( | ( | ||||||||||||||||||||||||||
| Net income (loss) | ( | ( | |||||||||||||||||||||||||||
| Preferred stock dividends and accretion | ( | ( | |||||||||||||||||||||||||||
| Net income (loss) available to common stockholders | $ | ( | $ | $ | $ | ( | |||||||||||||||||||||||
| Net income (loss) per share – basic and diluted | $ | ( | $ | $ | $ | ( | |||||||||||||||||||||||
| Weighted average shares outstanding: | |||||||||||||||||||||||||||||
| Basic | |||||||||||||||||||||||||||||
| Diluted | |||||||||||||||||||||||||||||
The accompanying notes are an integral part of these statements.
F-4
COMSTOCK RESOURCES, INC. AND SUBSIDIARIES
CONSOLIDATED STATEMENTS OF STOCKHOLDERS' EQUITY
| Common Shares | Common Stock- Par Value | Common Stock Warrants | Additional Paid-in Capital | Accumulated Earnings (Deficit) | Total | ||||||||||||||||||||||||||||||
| (In thousands) | |||||||||||||||||||||||||||||||||||
| Predecessor Company: | |||||||||||||||||||||||||||||||||||
| Balance at December 31, 2017 | $ | $ | $ | $ | ( | $ | ( | ||||||||||||||||||||||||||||
| Stock-based compensation | |||||||||||||||||||||||||||||||||||
| Income tax withholdings on equity awards | ( | ( | — | ( | — | ( | |||||||||||||||||||||||||||||
| Common stock issued for debt conversion | — | — | |||||||||||||||||||||||||||||||||
| Common stock warrants exercised | ( | — | — | ||||||||||||||||||||||||||||||||
| Net loss | — | — | — | — | ( | ( | |||||||||||||||||||||||||||||
| Balance at August 13, 2018 | $ | $ | $ | $ | ( | $ | ( | ||||||||||||||||||||||||||||
| Successor Company: | |||||||||||||||||||||||||||||||||||
| Balance at August 13, 2018 | $ | $ | $ | $ | — | $ | |||||||||||||||||||||||||||||
| Jones Contribution | — | — | |||||||||||||||||||||||||||||||||
| Vesting of equity awards | — | — | |||||||||||||||||||||||||||||||||
| Income tax withholdings on equity awards | ( | ( | — | ( | — | ( | |||||||||||||||||||||||||||||
| Stock-based compensation | — | — | |||||||||||||||||||||||||||||||||
| Stock issuance costs | — | — | — | ( | — | ( | |||||||||||||||||||||||||||||
| Common stock warrants exercised and expired | ( | — | — | ||||||||||||||||||||||||||||||||
| Net income | — | — | — | — | |||||||||||||||||||||||||||||||
| Balance at December 31, 2018 | $ | $ | $ | $ | $ | ||||||||||||||||||||||||||||||
| Jones Contribution adjustment | — | — | — | ( | — | ( | |||||||||||||||||||||||||||||
| Stock-based compensation | — | ||||||||||||||||||||||||||||||||||
| Issuance of common stock | — | — | |||||||||||||||||||||||||||||||||
| Income tax withholdings on equity awards | ( | ( | — | ( | — | ( | |||||||||||||||||||||||||||||
| Equity issuance costs | — | — | — | ( | — | ( | |||||||||||||||||||||||||||||
| Net income | — | — | — | — | |||||||||||||||||||||||||||||||
| Preferred stock accretion | — | — | — | — | ( | ( | |||||||||||||||||||||||||||||
| Payment of preferred dividends | — | — | — | — | ( | ( | |||||||||||||||||||||||||||||
| Balance at December 31, 2019 | $ | $ | — | $ | $ | $ | |||||||||||||||||||||||||||||
| Stock-based compensation | — | — | |||||||||||||||||||||||||||||||||
| Issuance of common stock | — | — | |||||||||||||||||||||||||||||||||
| Income tax withholdings on equity awards | ( | ( | — | ( | — | ( | |||||||||||||||||||||||||||||
| Stock issuance costs | — | — | — | ( | — | ( | |||||||||||||||||||||||||||||
| Net loss | — | — | — | — | ( | ( | |||||||||||||||||||||||||||||
| Preferred stock accretion | — | — | — | — | ( | ( | |||||||||||||||||||||||||||||
| Payment of preferred dividends | — | — | — | — | ( | ( | |||||||||||||||||||||||||||||
| Balance at December 31, 2020 | $ | $ | — | $ | $ | $ | |||||||||||||||||||||||||||||
The accompanying notes are an integral part of these statements.
F-5
COMSTOCK RESOURCES, INC. AND SUBSIDIARIES
CONSOLIDATED STATEMENTS OF CASH FLOWS
| Predecessor | Successor | |||||||||||||||||||||||||
| For the Period from January 1, 2018 through August 13, 2018 | Period from August 14, 2018 through December 31, 2018 | Year Ended December 31, 2019 | Year Ended December 31, 2020 | |||||||||||||||||||||||
| (In thousands) | ||||||||||||||||||||||||||
| CASH FLOWS FROM OPERATING ACTIVITIES: | ||||||||||||||||||||||||||
| Net income (loss) | $ | ( | $ | $ | $ | ( | ||||||||||||||||||||
| Adjustments to reconcile net income (loss) to net cash provided by operating activities: | ||||||||||||||||||||||||||
| Deferred and non-current income taxes | ( | |||||||||||||||||||||||||
| Exploration | ||||||||||||||||||||||||||
| Loss (gain) on sale of oil and gas properties | ( | ( | ||||||||||||||||||||||||
| Depreciation, depletion and amortization | ||||||||||||||||||||||||||
| Gain from derivative financial instruments | ( | ( | ( | ( | ||||||||||||||||||||||
| Cash settlements of derivative financial instruments | ( | |||||||||||||||||||||||||
| Amortization of debt discount, premium and issuance costs | ||||||||||||||||||||||||||
| Interest paid in-kind | ||||||||||||||||||||||||||
| Stock-based compensation | ||||||||||||||||||||||||||
| Loss on extinguishment of debt | ||||||||||||||||||||||||||
| Decrease (increase) in accounts receivable | ( | |||||||||||||||||||||||||
| Decrease (increase) in other current assets | ( | |||||||||||||||||||||||||
| Increase in accounts payable and accrued expenses | ||||||||||||||||||||||||||
| Net cash provided by operating activities | ||||||||||||||||||||||||||
| CASH FLOWS FROM INVESTING ACTIVITIES: | ||||||||||||||||||||||||||
| Acquisition of Covey Park Energy LLC, net of cash acquired | ( | |||||||||||||||||||||||||
| Capital expenditures | ( | ( | ( | ( | ||||||||||||||||||||||
| Advance payments for drilling costs | ( | ( | ( | |||||||||||||||||||||||
| Proceeds from sales of oil and gas properties | ||||||||||||||||||||||||||
| Net cash used for investing activities | ( | ( | ( | ( | ||||||||||||||||||||||
| CASH FLOWS FROM FINANCING ACTIVITIES: | ||||||||||||||||||||||||||
| Borrowings | ||||||||||||||||||||||||||
Issuances of senior notes | ||||||||||||||||||||||||||
| Payments to retire debt | ( | ( | ( | ( | ||||||||||||||||||||||
| Repayment of Covey Park Energy LLC preferred equity | ( | |||||||||||||||||||||||||
| Issuance of common stock | ||||||||||||||||||||||||||
| Issuance of Series B Convertible Preferred Stock | ||||||||||||||||||||||||||
| Redemption of Series A Preferred Convertible Stock | ( | |||||||||||||||||||||||||
| Preferred stock dividends paid | ( | ( | ||||||||||||||||||||||||
| Jones Contribution | ||||||||||||||||||||||||||
| Debt and stock issuance costs | ( | ( | ( | ( | ||||||||||||||||||||||
| Income tax withholdings related to equity awards | ( | ( | ( | ( | ||||||||||||||||||||||
| Net cash provided by (used for) financing activities | ( | ( | ||||||||||||||||||||||||
| Net increase (decrease) in cash and cash equivalents | ( | ( | ||||||||||||||||||||||||
| Cash and cash equivalents, beginning of the year | ||||||||||||||||||||||||||
| Cash and cash equivalents, end of the year | $ | $ | $ | $ | ||||||||||||||||||||||
The accompanying notes are an integral part of these statements.
F-6
COMSTOCK RESOURCES, INC. AND SUBSIDIARIES
NOTES TO CONSOLIDATED FINANCIAL STATEMENTS
(1)Summary of Significant Accounting Policies
Accounting policies used by Comstock Resources, Inc. and subsidiaries reflect oil and natural gas industry practices and conform to accounting principles generally accepted in the United States of America.
Basis of Presentation and Principles of Consolidation
Comstock Resources, Inc. and its subsidiaries are engaged in the acquisition, exploration, development and production of oil and natural gas. The Company's operations are primarily focused in Texas, Louisiana and North Dakota. The consolidated financial statements include the accounts of Comstock Resources, Inc. and its wholly owned or controlled subsidiaries (collectively, "Comstock" or the "Company"). All significant intercompany accounts and transactions have been eliminated in consolidation. The Company accounts for its undivided interest in oil and gas properties using the proportionate consolidation method, whereby its share of assets, liabilities, revenues and expenses are included in its financial statements. Net income (loss) and comprehensive income (loss) are the same in all periods presented. All adjustments are of a normal recurring nature unless otherwise disclosed. Certain amounts in prior periods have been reclassified to conform with current period presentation.
Jones Contribution
On August 14, 2018, Arkoma Drilling, L.P. and Williston Drilling, L.P. (collectively, the "Jones Partnerships") contributed certain oil and gas properties in North Dakota and Montana (the "Bakken Shale Properties") in exchange for 88,571,429 newly issued shares of common stock representing 84 % of the Company's then outstanding common stock (the "Jones Contribution"). The Jones Partnerships are wholly-owned and controlled by Dallas businessman Jerry Jones and his children (collectively, the "Jones Group").
The Company assessed the Bakken Shale Properties to determine whether they met the definition of a business under US generally accepted accounting principles, determining that they did not meet the definition of a business. As a result, the Jones Contribution was not accounted for as a business combination. Upon the issuance of the shares of Comstock common stock, the Jones Group obtained control over Comstock through their ownership of the Jones Partnerships. Through the Jones Partnerships, the Jones Group owns a majority of the voting common stock as well as the ability to control the composition of the majority of the board of directors of Comstock. As a result of the change of control that occurred upon the issuance of the common stock, the Jones Group controls Comstock and, thereby, continues to control the Bakken Shale Properties.
Accordingly, the basis of the Bakken Shale Properties recognized by Comstock is the historical basis of the Jones Group. The historical cost basis of the Bakken Shale properties contributed was $397.6 million, which was comprised of $554.3 million of capitalized costs less $156.7 million of accumulated depletion, depreciation and amortization. The change in control of Comstock resulted in a new basis for Comstock and the Company elected to apply pushdown accounting pursuant to ASC 805, Business Combinations. The new basis was pushed down to Comstock for financial reporting purposes, resulting in Comstock's assets, liabilities and equity accounts being recognized at fair value upon the closing of the Jones Contribution.
References to "Successor" or "Successor Company" relate to the financial position and results of operations of the Company subsequent to August 13, 2018. Reference to "Predecessor" or "Predecessor Company" relate to the financial position and results of operations of the Company on or prior to August 13, 2018. The Company's consolidated financial statements and related footnotes are presented with a black line division which delineates the lack of comparability between amounts presented after August 13, 2018 and dates prior thereto.
Covey Park Acquisition
On July 16, 2019, Comstock acquired Covey Park Energy LLC ("Covey Park") for total consideration of $700.0 million of cash, the issuance of Series A Convertible Preferred Stock with a redemption value of $210.0 million, and the issuance of 28,833,000 shares of common stock (the "Covey Park Acquisition"). In addition to the consideration paid, Comstock assumed $625.0 million of Covey Park's 7.5 % senior notes, repaid $380.0 million of
F-7
Covey Park's then outstanding borrowings under its bank credit facility and redeemed all of Covey Park's preferred equity for $153.4 million. Based on the fair value of the preferred stock issued and the closing price of the Company's common stock of $5.82 per share on July 16, 2019, the transaction was valued at approximately $2.2 billion. Covey Park's operations were focused primarily in the Haynesville/Bossier shale in East Texas and North Louisiana.
Funding for the cash consideration was provided by the sale of 50 million newly issued shares of common stock for $300.0 million and 175,000 shares of newly issued Series B Convertible Preferred Stock for $175.0 million to the Jones Group and by borrowings under Comstock's bank credit facility and cash on hand. Comstock incurred $41.0 million of advisory and legal fees and other acquisition-related costs in connection with the acquisition. These acquisition costs are included in transaction costs in the Company's consolidated statements of operations.
The transaction was accounted for as a business combination, using the acquisition method. The purchase price allocation of the assets acquired and liabilities assumed was finalized in the third quarter of 2020. The following table summarizes the original and final purchase price allocations of the assets acquired and liabilities assumed based on their fair values as of the acquisition date:
| Original Allocation | Measurement Period Adjustments | Final Allocation | ||||||||||||||||||
| (In thousands) | ||||||||||||||||||||
| Consideration: | ||||||||||||||||||||
| Cash Paid | $ | $ | — | $ | ||||||||||||||||
| Fair Value of Common Stock Issued | — | |||||||||||||||||||
| Fair Value of Series A Preferred Stock Issued | — | |||||||||||||||||||
| Total Consideration | — | |||||||||||||||||||
| Liabilities Assumed: | ||||||||||||||||||||
| Accounts Payable and Accrued Liabilities | — | |||||||||||||||||||
| Derivative Financial Instruments | — | |||||||||||||||||||
| Other Current Liabilities | ||||||||||||||||||||
| Long Term Debt | — | |||||||||||||||||||
| Covey Park Preferred Equity | — | |||||||||||||||||||
| Non-current Derivative Financial Instruments | — | |||||||||||||||||||
| Asset Retirement Obligations | — | |||||||||||||||||||
| Deferred Income Taxes | ( | |||||||||||||||||||
| Other Non-current Liabilities | — | |||||||||||||||||||
| Liabilities Assumed | ( | |||||||||||||||||||
| Total Consideration and Liabilities Assumed | $ | $ | ( | $ | ||||||||||||||||
| Assets Acquired: | ||||||||||||||||||||
| Cash and Cash Equivalents | $ | $ | — | $ | ||||||||||||||||
| Accounts Receivable | — | |||||||||||||||||||
| Current Derivative Financial Instruments | — | |||||||||||||||||||
| Other Current Assets | ( | |||||||||||||||||||
| Proved Oil and Natural Gas Properties | ( | |||||||||||||||||||
| Unproved Oil and Natural Gas Properties | — | |||||||||||||||||||
| Other Property, Plant and Equipment | — | |||||||||||||||||||
| Non-current Derivative Financial Instruments | — | |||||||||||||||||||
| Total Assets Acquired | $ | $ | ( | $ | ||||||||||||||||
The Series A Convertible Preferred Stock was issued with a face value of $210.0 million. Management retained a third-party valuation firm to assess the fair value of the preferred stock. A yield methodology using Level 2 inputs of the Company's publicly traded debt, including the assumption of Covey Park's 7.5 % senior notes, resulted in a fair value of $200.0 million. On May 19, 2020, the Company redeemed the 210,000 outstanding shares of the Series A Convertible Preferred Stock for an aggregate redemption price of $210.0 million plus accrued and unpaid dividends of approximately $2.9 million.
F-8
The fair values determined for accounts receivable, accounts payable, accrued drilling costs and other current liabilities were equivalent to the carrying value due to their short-term nature.
The fair value of the proved and unproved oil and natural gas properties was derived from estimated future discounted net cash flows, a Level 3 measurement, based on existing production curves and timing of development of those properties. The key factors used in deriving the estimated future cash flows include estimated recoverable reserves, production rates, future operating and development costs, and future commodity prices. Key inputs to the valuation included average oil prices of $74.80 per barrel and average natural gas prices of $3.32 per Mcf utilizing a combination of third-party price estimates and management price forecasts as of the acquisition date. The resulting estimated future cash flows from the acquired assets were discounted at rates ranging from 10 % - 25 % depending on risk characteristics of reserve categories acquired. Management utilized the assistance of an independent reserve firm and internal resources to estimate the fair value of the oil and natural gas properties.
The fair value measurements of long-term debt were estimated based on market prices and represent Level 2 inputs. The fair value measurements of derivative instruments assumed were determined based on fair value measurements consistent with managements valuation methodologies including implied market volatility, contract terms and prices and discount factors as of the close date. These inputs represent Level 2 inputs. The fair values of commodity derivative instruments in an asset position include a measure of counterparty nonperformance risk and the derivative instruments in a liability position include a measure of the Company's own nonperformance risk, each based on the current published credit default swap rates.
The fair value of the asset retirement obligations of $5.4 million is included in the oil and natural gas properties with the corresponding liability in the table above. The fair value was based on a discounted cash flow model that included assumptions of current abandonment costs, inflation rates, discount rates and timing of actual abandonment and restoration activities. Due to the inputs and significant assumptions associated with the estimation of asset retirement obligations, the estimates made by management represent Level 3 inputs.
The Covey Park Acquisition qualified as a tax free merger whereby the Company acquired carryover tax basis in Covey Park's assets and liabilities, adjusted for differences between the purchase price allocated to the assets acquired and liabilities assumed based on the fair value and the carryover tax basis.
The Company's results of operations from the closing date on July 16, 2019 through December 31, 2019 included approximately $264.4 million of operating revenues and approximately $93.0 million of operating income, excluding general and administrative and interest expenses, attributable to the Covey Park assets.
Pro forma Results
The pro forma condensed combined financial information for the year ended December 31, 2019 gives effect to the Covey Park Acquisition as if the acquisition had occurred on January 1, 2019. The pro forma condensed combined financial information for year ended December 31, 2018 gives effect to the Covey Park Acquisition and the Jones Contribution as if the transactions had occurred on January 1, 2018. The unaudited pro forma information reflects adjustments for the issuance of the Company's common stock and preferred stock, debt incurred in connection with the transaction, impact of the fair value of properties acquired and related depletion other adjustments the Company believes are reasonable for the pro forma presentation. In addition, the pro forma earnings include acquisition-related costs of $41.0 The unaudited pro forma results do not reflect any cost savings or other synergies that may arise in the future.
| Pro Forma Year Ended December 31, | |||||||||||
| 2018 | 2019 | ||||||||||
| (In thousands, except per share amounts) | |||||||||||
| Revenues: | $ | $ | |||||||||
| Net Income | $ | $ | |||||||||
| Net income per share: | |||||||||||
| Basic | $ | $ | |||||||||
| Diluted | $ | $ | |||||||||
F-9
On November 1, 2019, Comstock acquired a privately held company with producing properties and acreage in the Haynesville shale basin in exchange for 4,500,000 newly issued shares of the Company's common stock. The acquisition qualified as a tax-free reorganization whereby the Company acquired carryover of the sellers inside tax basis and was accounted for as an asset acquisition. Based on the closing price of the Company's common stock of $6.85 per share on November 1, 2019, and the recognition of deferred income taxes associated with the acquisition, the transaction was valued at approximately $42.3 million.
Use of Estimates in the Preparation of Financial Statements
The preparation of financial statements in conformity with generally accepted accounting principles requires management to make estimates and assumptions that affect the reported amounts of assets and liabilities and disclosure of contingent assets and liabilities at the date of the financial statements, and the reported amounts of revenues and expenses during the reporting period. Actual amounts could differ from those estimates. Changes in the future estimated oil and natural gas reserves or the estimated future cash flows attributable to the reserves that are utilized for impairment analyses could have a significant impact on the future results of operations.
Other Current Assets
Other current assets at December 31, 2019 and 2020 consist of the following:
| As of December 31, | |||||||||||
| 2019 | 2020 | ||||||||||
| (In thousands) | |||||||||||
| Prepaid expenses | $ | $ | |||||||||
| Advance payments for drilling costs | |||||||||||
| Production tax refunds receivable | |||||||||||
| Pipe and oil field equipment inventory | |||||||||||
| Other | |||||||||||
| $ | $ | ||||||||||
Level 1 — Inputs used to measure fair value are unadjusted quoted prices that are available in active markets for the identical assets or liabilities as of the reporting date.
F-10
Level 2 — Inputs used to measure fair value, other than quoted prices included in Level 1, are either directly or indirectly observable as of the reporting date through correlation with market data, including quoted prices for similar assets and liabilities in active markets and quoted prices in markets that are not active. Level 2 also includes assets and liabilities that are valued using models or other pricing methodologies that do not require significant judgment since the input assumptions used in the models, such as interest rates and volatility factors, are corroborated by readily observable data from actively quoted markets for substantially the full term of the financial instrument.
Level 3 — Inputs used to measure fair value are unobservable inputs that are supported by little or no market activity and reflect the use of significant management judgment. These values are generally determined using pricing models for which the assumptions utilize management's estimates of market participant assumptions.
The following is a reconciliation of the beginning and ending balances for derivative instruments classified as Level 3 in the fair value hierarchy:
| For the Years Ended December 31, | |||||||||||
| 2019 | 2020 | ||||||||||
| (In thousands) | |||||||||||
| Balance at beginning of year | $ | $ | |||||||||
| Total gains (losses) included in earnings | |||||||||||
| Settlements, net | ( | ||||||||||
| Transfers out of Level 3 | ( | ||||||||||
| Balance at end of year | $ | $ | ( | ||||||||
The following presents the carrying amounts and the fair values of the Company's financial instruments as of December 31, 2019 and December 31, 2020:
| For the Years Ended December 31, | |||||||||||||||||||||||
| 2019 | 2020 | ||||||||||||||||||||||
| Carrying Value | Fair Value | Carrying Value | Fair Value | ||||||||||||||||||||
| Assets: | (In thousands) | ||||||||||||||||||||||
Commodity-based derivatives (1) | $ | $ | $ | $ | |||||||||||||||||||
| Liabilities: | |||||||||||||||||||||||
Commodity-based derivatives (1) | |||||||||||||||||||||||
Bank credit facility (2) | |||||||||||||||||||||||
_______________
(1)The Company's natural gas price swaps and basis swap agreements, its interest rate swap agreements and its crude oil and natural gas price collars are classified as Level 2 and measured at fair value using a market approach using third party pricing services and other active markets or broker quotes that are readily available in the public markets. The Company's natural gas swaption contracts provide the counterparty the right, but not the obligation, to extend terms of an existing swap on a predetermined dates. Due to the subjectivity of the inputs used to value the counterparty rights in the contracts, these contracts are classified as Level 3 in the fair value hierarchy.
(2)The carrying value of our floating rate debt outstanding approximates fair value.
(3)The fair value of the Company's fixed rate debt was based on quoted prices as of December 31, 2019 and 2020, respectively, a Level 1 measurement.
Property and Equipment
The Company follows the successful efforts method of accounting for its oil and gas properties. Costs incurred to acquire oil and gas leasehold are capitalized. Acquisition costs for proved oil and gas properties, costs of drilling and equipping productive wells, and costs of unsuccessful development wells are capitalized and amortized on an equivalent unit-of-production basis over the life of the remaining related oil and gas reserves. Equivalent units are determined by converting oil to natural gas at the ratio of one barrel of oil for six thousand cubic feet of natural gas. This conversion ratio is not based on the price of oil or natural gas, and there may be a significant difference in price between an equivalent volume of oil versus natural gas. The estimated future costs of dismantlement, restoration, plugging and abandonment of oil and gas properties and related facilities disposal are capitalized when
F-11
asset retirement obligations are incurred and amortized as part of depreciation, depletion and amortization expense. Exploration expense includes geological and geophysical expenses and delay rentals related to exploratory oil and gas properties, costs of unsuccessful exploratory drilling and impairments of unproved properties. As of December 31, 2019 and 2020, the unproved properties primarily relate to future drilling locations that were not included in proved undeveloped reserves. Most of these future drilling locations are located on acreage where the reservoir is known to be productive but have been excluded from proved reserves due to uncertainty on whether the wells would be drilled within the next five years as required by SEC rules in order to be included in proved reserves. The costs of unproved properties are transferred to proved oil and gas properties when they are either drilled or they are reflected in proved undeveloped reserves and amortized on an equivalent unit-of-production basis. Costs associated with unevaluated exploratory acreage are periodically assessed for impairment on a property by property basis, and any impairment in value is included in exploration expense. Exploratory drilling costs are initially capitalized as unproved property but charged to expense if and when the well is determined not to have found commercial proved oil and gas reserves. Exploratory drilling costs are evaluated within a one-year period after the completion of drilling.
The Company assesses the need for an impairment of the costs capitalized for its proved oil and gas properties when events or changes in circumstances, such as a significant drop in commodity prices, indicate that the Company may not be able to recover its capitalized costs. If impairment is indicated based on undiscounted expected future cash flows attributable to the property, then a provision for impairment is recognized to the extent that net capitalized costs exceed the estimated fair value of the property. The Company determines the fair values of its oil and gas properties using a discounted cash flow model and proved and risk-adjusted probable reserves. Significant Level 3 assumptions associated with the calculation of discounted future cash flows included in the cash flow model include management's outlook for oil and natural gas prices, future oil and natural gas production, production costs, capital expenditures, and the total proved and risk-adjusted probable oil and natural gas reserves expected to be recovered. Management's oil and natural gas price outlook is developed based on third-party longer-term price forecasts as of each measurement date. The expected future net cash flows are discounted using an appropriate discount rate in determining a property's fair value. The oil and natural gas prices used for determining asset impairments will generally differ from those used in the standardized measure of discounted future net cash flows because the standardized measure requires the use of an average price based on the first day of each month of the preceding year. Unproved properties are evaluated for impairment based upon the results of drilling, planned future drilling and the terms of the oil and gas leases.
The Company's estimates of undiscounted future net cash flows attributable to its oil and gas properties may change in the future. The primary factors that may affect estimates of future cash flows include future adjustments, both positive and negative, to proved and appropriate risk-adjusted probable oil and natural gas reserves, results of future drilling activities, future prices for oil and natural gas, and increases or decreases in production and capital costs. As a result of these changes, there may be impairments in the carrying values of our oil and gas properties.
Other property and equipment consists primarily of computer equipment, furniture and fixtures and an airplane which are depreciated over estimated useful lives ranging from to 31.5 years on a straight-line basis.
Goodwill
The Company had goodwill of $335.9 Goodwill represents the excess of purchase price over fair value of net tangible and identifiable intangible assets.
F-12
Leases
The Company had right-of-use lease assets of $3.5 million and $3.0 million as of December 31, 2019 and 2020, respectively, related to its corporate office lease, certain office equipment and leased vehicles used in oil and gas operations with corresponding short-term and long-term liabilities. The value of the lease assets and liabilities are determined based upon discounted future minimum cash flows contained within each of the respective contracts. The Company determines if contracts contain a lease at inception of the contract. To the extent that contract terms representing a lease are identified, leases are identified as being either an operating lease or a finance-type lease. Comstock currently has no finance-type leases. Right-of-use lease assets representing the Company's right to use an underlying asset for the lease term and the related lease liabilities represent our obligation to make lease payments under the terms of the contracts. Short-term leases that have an initial term of one year or less are not capitalized; however, amounts paid for those leases are included as part of its lease cost disclosures. Short-term lease costs exclude expenses related to leases with a lease term of one month or less.
Lease costs recognized during the twelve months ended December 31, 2020 were as follows:
| Year Ended December 31, | |||||||||||
| 2019 | 2020 | ||||||||||
| (In thousands) | |||||||||||
| Operating lease cost included in general and administrative expense | $ | $ | |||||||||
| Operating lease cost included in lease operating expense | |||||||||||
| Short-term lease cost (drilling rig costs included in proved oil and gas properties) | |||||||||||
| $ | $ | ||||||||||
Cash payments for operating leases associated with right-of-use assets included in cash provided by operating activities were $2.0 million and $2.5 million for the twelve months ended December 31, 2019 and 2020, respectively.
As of December 31, 2019 and 2020, the operating leases had a weighted average remaining term of 1.96 years and 1.54 years, respectively, and the weighted-average discount rate used to determine the present value of future operating lease payments was 5.0 % and 4.3 %, respectively. The maturities of Comstock's operating lease obligations are as follows:
| (In thousands) | |||||
| 2021 | $ | ||||
| 2022 | |||||
| 2023 | |||||
| Total lease payments | |||||
| Imputed interest | ( | ||||
| Total lease liability | $ | ||||
F-13
Accrued Expenses
Accrued expenses at December 31, 2019 and 2020 consist of the following:
| As of December 31, | |||||||||||
| 2019 | 2020 | ||||||||||
| (In thousands) | |||||||||||
| Accrued interest payable | $ | $ | |||||||||
| Accrued drilling costs | |||||||||||
| Accrued transportation costs | |||||||||||
| Accrued transaction costs | |||||||||||
| Accrued employee compensation | |||||||||||
| Accrued lease operating expenses | |||||||||||
| Other | |||||||||||
| $ | $ | ||||||||||
Reserve for Future Abandonment Costs
The Company's asset retirement obligations relate to future plugging and abandonment costs of its oil and gas properties and related facilities disposal. The Company records a liability in the period in which an asset retirement obligation is incurred, in an amount equal to the estimated fair value of the obligation that is capitalized. Thereafter, this liability is accreted up to the final retirement cost. Accretion of the discount is included as part of depreciation, depletion and amortization in the accompanying consolidated statements of operations.
The following table summarizes the changes in the Company's total estimated liability:
| Year Ended December 31, | ||||||||||||||
| 2019 | 2020 | |||||||||||||
| (In thousands) | ||||||||||||||
| Reserve for future abandonment costs at beginning of the year | $ | $ | ||||||||||||
| Wells acquired | ||||||||||||||
| New wells placed on production | ||||||||||||||
| Changes in estimates and timing | ( | |||||||||||||
| Liabilities settled | ( | ( | ||||||||||||
| Asset divestitures | ( | |||||||||||||
| Accretion expense | ||||||||||||||
| Reserve for future abandonment costs at end of the year | $ | $ | ||||||||||||
Stock-based Compensation
The Company has stock-based employee compensation plans under which stock awards, comprised primarily of restricted stock and performance share units, are issued to employees and non-employee directors. The Company follows the fair value-based method in accounting for equity-based compensation. Under the fair value based method, compensation cost is measured at the grant date based on the fair value of the award and is recognized on a straight-line basis over the award vesting period.
Segment Reporting
The Company presently operates in one business segment, the exploration and production of North American oil and natural gas.
Derivative Financial Instruments and Hedging Activities
The Company accounts for derivative financial instruments (including derivative instruments embedded in other contracts) as either an asset or liability measured at its fair value. Changes in the fair value of derivatives are recognized currently in earnings and in net cash flows from operating activities. The fair value of derivative
F-14
Revenue Recognition and Gas Balancing
Comstock produces oil and natural gas and reports revenues separately for each of these two primary products in its statements of operations. Revenues are recognized upon the transfer of produced volumes to the Company's customers, who take control of the volumes and receive all the benefits of ownership upon delivery at designated sales points. Payment is reasonably assured upon delivery of production. All sales are subject to contracts that have commercial substance, contain specific pricing terms, and define the enforceable rights and obligations of both parties. These contracts typically provide for cash settlement within 25 days following each production month and are cancellable upon 30 days' notice by either party for oil and vary for natural gas based upon the terms set out in the confirmations between both parties. Prices for sales of oil and natural gas are generally based upon terms that are common in the oil and gas industry, including index or spot prices, location and quality differentials, as well as market supply and demand conditions. As a result, prices for oil and natural gas routinely fluctuate based on changes in these factors. Each unit of production (barrel of crude oil and thousand cubic feet of natural gas) represents a separate performance obligation under the Company's contracts since each unit has economic benefit on its own and each is priced separately according to the terms of the contracts.
General and Administrative Expenses
General and administrative expenses are reported net of reimbursements of overhead costs that are received from working interest owners of the oil and gas properties operated by the Company of $8.5 million, $4.5 million, $16.8 million and $24.7 million for the Predecessor Period from January 1, 2018 through August 13, 2018, for the Successor Period from August 14, 2018 through December 31, 2018 and for the years ended December 31, 2019 and 2020, respectively.
F-15
Income Taxes
The Company accounts for income taxes using the asset and liability method, whereby deferred tax assets and liabilities are recognized for the future tax consequences attributable to differences between the financial statement carrying amounts of assets and liabilities and their respective tax basis, as well as the tax consequences attributable to the future utilization of existing net operating loss and other carryforwards. Deferred tax assets and liabilities are measured using enacted tax rates expected to apply to taxable income in the years in which those temporary differences and carryforwards are expected to be recovered or settled. The effect on deferred tax assets and liabilities of a change in tax rates is recognized in income in the period that the change in rate is enacted.
Earnings Per Share
Unvested restricted stock containing nonforfeitable rights to dividends are included in common stock outstanding and are considered to be participating securities and included in the computation of basic and diluted earnings per share pursuant to the two-class method. Weighted average shares of unvested restricted stock included in common stock outstanding were as follows:
| Predecessor | Successor | |||||||||||||||||||||||||
| For the Period from January 1, 2018 through August 13, 2018 | For the Period from August 14, 2018 through December 31, 2018 | Year Ended December 31, 2019 | Year Ended December 31, 2020 | |||||||||||||||||||||||
Unvested restricted stock (in thousands) | ||||||||||||||||||||||||||
Performance share units ("PSUs") represent the right to receive a number of shares of the Company's common stock that may range from zero to up to two times the number of PSUs granted on the award date based on the achievement of certain performance measures during a performance period. The number of potentially dilutive shares related to PSUs is based on the number of shares, if any, which would be issuable at the end of the respective period, assuming that date was the end of the performance period. The treasury stock method is used to measure the dilutive effect of PSUs.
Unexercised common stock warrants represent the right to convert the warrants into common stock at an exercise price of $0.01 per share. The treasury stock method is used to measure the dilutive effect of unexercised common stock warrants.
The shares that would be issuable upon exercise of the conversion right contained in the Company's convertible notes for the Predecessor Period were based on the if-converted method for computing potentially dilutive shares of common stock that could be issued upon conversion.
For the year ended December 31, 2019, the Series A and Series B Convertible Preferred Stock issued in connection with the Covey Park Acquisition were convertible into in the aggregate 96,250,000 shares of common stock. For the year ended December 31, 2020, the Series A Convertible Preferred Stock was convertible into 52,500,000 shares of common stock prior to their redemption on May 19, 2020 and the Series B Convertible Preferred Stock is convertible into an aggregate of 43,750,000 shares of common stock at a conversion price of $4.00 per share. The dilutive effect of preferred stock is computed using the if-converted method as if conversion of the preferred shares had occurred at the earlier of the date of issuance or the beginning of the period.
F-16
All stock options, unvested PSUs, warrants exercisable into common stock and contingently issuable shares related to the convertible debt that were anti-dilutive to earnings and excluded from weighted average shares used in the computation of earnings per share were as follows:
| Predecessor | Successor | |||||||||||||||||||||||||
| For the Period from January 1, 2018 through August 13, 2018 | For the Period from August 14, 2018 through December 31, 2018 | Year Ended December 31, 2019 | Year Ended December 31, 2020 | |||||||||||||||||||||||
| (In thousands) | ||||||||||||||||||||||||||
| Weighted average PSUs | ||||||||||||||||||||||||||
| Weighted average grant date fair value per unit | $ | $ | $ | $ | ||||||||||||||||||||||
| Weighted average convertible preferred stock | ||||||||||||||||||||||||||
| Weighted average warrants for common stock | ||||||||||||||||||||||||||
| Weighted average exercise price per share | $ | $ | $ | $ | ||||||||||||||||||||||
| Weighted average contingently convertible shares | ||||||||||||||||||||||||||
| Weighted average conversion price per share | $ | $ | $ | $ | ||||||||||||||||||||||
Basic and diluted earnings per share were determined as follows:
| Predecessor | Successor | |||||||||||||||||||||||||
| For the Period January 1, 2018 through August 13, 2018 | For the Period from August 14, 2018 through December 31, 2018 | Year Ended December 31, 2019 | Year Ended December 31, 2020 | |||||||||||||||||||||||
| (In thousands, except per share amounts) | ||||||||||||||||||||||||||
| Net income (loss) attributable to common stockholders | $ | ( | $ | $ | $ | ( | ||||||||||||||||||||
| Income allocable to unvested restricted shares | ( | ( | ||||||||||||||||||||||||
| Basic net income (loss) attributable to common stockholders | $ | ( | $ | $ | $ | ( | ||||||||||||||||||||
| Income allocable to convertible preferred stock | ||||||||||||||||||||||||||
| Diluted net income (loss) attributable to common stockholders | $ | ( | $ | $ | $ | ( | ||||||||||||||||||||
| Basic weighted average shares outstanding | ||||||||||||||||||||||||||
| Effect of dilutive securities: | ||||||||||||||||||||||||||
| Performance stock units | ||||||||||||||||||||||||||
| Convertible preferred stock | ||||||||||||||||||||||||||
| Stock warrants | ||||||||||||||||||||||||||
| Diluted weighted average shares outstanding | ||||||||||||||||||||||||||
| Basic income (loss) per share | $ | ( | $ | $ | $ | ( | ||||||||||||||||||||
| Diluted income (loss) per share | $ | ( | $ | $ | $ | ( | ||||||||||||||||||||
Basic and diluted per share amounts are the same for the Predecessor Period and the year ended December 31, 2020 due to the net loss in those periods.
Supplementary Information With Respect to the Consolidated Statements of Cash Flows
For the purpose of the consolidated statements of cash flows, the Company considers all highly liquid investments purchased with an original maturity of three months or less to be cash equivalents.
F-17
Cash payments made for interest and income taxes and other non-cash investing and financing activities were as follows:
| Predecessor | Successor | |||||||||||||||||||||||||
| For the Period from January 1, 2018 through August 13, 2018 | For the Period from August 14, 2018 through December 31, 2018 | Year Ended December 31, 2019 | Year Ended December 31, 2020 | |||||||||||||||||||||||
| (In thousands) | ||||||||||||||||||||||||||
| Cash payments for: | ||||||||||||||||||||||||||
| Interest payments | $ | $ | $ | $ | ||||||||||||||||||||||
| Income tax (payments) refunds | $ | ( | $ | $ | ( | $ | ||||||||||||||||||||
| Non-cash investing activities include: | ||||||||||||||||||||||||||
| Increase (decrease) in accrued capital expenditures | $ | ( | $ | $ | $ | ( | ||||||||||||||||||||
| Liabilities assumed in exchange for right-of-use lease assets | $ | $ | $ | $ | ||||||||||||||||||||||
| Non-cash investing and financing activities related to acquisitions | ||||||||||||||||||||||||||
| Issuance of common stock | $ | $ | $ | $ | ||||||||||||||||||||||
| Issuance of Series A Convertible Preferred Stock | $ | $ | $ | $ | ||||||||||||||||||||||
Assumed | $ | $ | $ | $ | ||||||||||||||||||||||
| Acquired working capital | $ | $ | $ | $ | ||||||||||||||||||||||
| Non-cash financing activities include: | ||||||||||||||||||||||||||
| Retirement of debt in exchange for common stock | $ | $ | $ | $ | ( | |||||||||||||||||||||
| Issuance of common stock in exchange for debt | $ | $ | $ | $ | ||||||||||||||||||||||
The Company paid $25.0 million of interest in-kind on its convertible notes in the Predecessor Period from January 1, 2018 through August 13, 2018.
Recent accounting pronouncements
In January 2017, the FASB issued Accounting Standards Update No. 2017-4 (ASU 2017-4) "Intangibles-Goodwill and Other (Topic 350): Simplifying the Test for Goodwill Impairment." ASU 2017-4 eliminates step two of the goodwill impairment test and specifies that goodwill impairment should be measured by comparing the fair value of a reporting unit with its carrying amount. ASU 2017-4 was effective for annual or interim goodwill impairment tests performed in fiscal years beginning after December 15, 2019 and early adoption was permitted. We implemented ASU 2017-4 when we performed our annual impairment assessment during the fourth quarter of 2020 and it did not have a significant effect on our results of operations, liquidity or financial position.
In June 2016, The FASB issued Accounting Standards Update ASU No. 2016-13 ("ASU 2016-13") that amends guidance on reporting credit losses for trade receivables, net investments in leases, debt securities, loans and certain other instruments. ASU 2016-13 requires the use of a forward-looking expected loss model as opposed to existing incurred loss recognition. The update was effective for us beginning in 2020. The guidance required a cumulative-effect adjustment to the statement of financial position as of the beginning of the first reporting period in which the standard is effective. We implemented ASU 2016-13 and concluded there was no cumulative-effect adjustment required as of January 1, 2020. The implementation of ASU 2016-13 did not have a material impact on our results of operations, financial position and financial disclosures.
(2)Acquisitions and Dispositions of Oil and Gas Properties
F-18
Results of operations for the properties that were sold during the Predecessor Period from January 1 through August 13, 2018 were as follows:
| Predecessor | |||||
| For the Period from January 1, 2018 through August 13, 2018 | |||||
| (In thousands) | |||||
| Total oil and gas sales | $ | ||||
Total operating expenses (1) | ( | ||||
| Operating income | $ | ||||
_______________
(1)Includes direct operating expenses, depreciation, depletion and amortization and exploration expense. Excludes interest expense, general and administrative expenses and depreciation, depletion and amortization expense subsequent to the date the assets were designated as held for sale.
On July 31, 2018, the Company acquired oil and gas properties in North Louisiana and Texas for $41.5 million. These properties included 22,559 acres (12,085 net) and 114 producing natural gas wells (27.8 net), 47 (14.6 net) of which produce from the Haynesville shale.
On August 14, 2018, as part of the Jones Contribution, the strategic drilling venture previously entered into by the Company and Arkoma Drilling, LP was terminated and Comstock re-acquired working interests in wells drilled under the joint venture for $17.9 million, representing the costs paid by Arkoma Drilling, LP.
On September 21, 2018, the Company entered into a joint development venture with an affiliate of USG Properties Haynesville, LLC by contributing its undeveloped Eagle Ford shale acreage. Under the joint development venture, Comstock can participate in drilling wells on the undeveloped acreage and can participate in any in-fill wells or refracs of existing wells on acreage owned by the joint venture partner. Comstock subsequently sold a portion of the undeveloped acreage in the joint venture for proceeds of $13.7 million in September 2018.
On December 19, 2018, the Company entered into an agreement to acquire 5,301 net acres in Harrison and Panola counties, Texas. The Company will pay $20.5 million over a four years period by providing a 12 % carried interest in each well drilled by Comstock on the acreage.
On July 16, 2019, the Company acquired Covey Park Energy LLC, for consideration valued at approximately $2.2 billion. The acquisition included 317,142 acres (248,196 net) with 1,230 producing natural gas wells (712.0 net), 844 (383.0 net) of which produce from the Haynesville/Bossier shales.
On November 1, 2019, the Company acquired a privately held company in exchange for 4.5 million newly- issued shares of the Company's common stock. The properties acquired included 7,702 acres (3,155 net) and 75 producing natural gas wells (20.1 net), 36 (11.7 net) of which produce from the Haynesville shale.
During 2020, the Company leased 13,519 net acres for a total lease cost of $7.9 million.
F-19
(3)Oil and Gas Producing Activities
Set forth below is certain information regarding the aggregate capitalized costs of oil and gas properties and costs incurred by the Company for its oil and natural gas property acquisition, development and exploration activities:
Capitalized Costs
| As of December 31, | |||||||||||
| 2019 | 2020 | ||||||||||
| (In thousands) | |||||||||||
| Proved properties: | |||||||||||
| Leasehold costs | $ | $ | |||||||||
| Wells and related equipment and facilities | |||||||||||
| Accumulated depreciation depletion and amortization | ( | ( | |||||||||
| Unproved properties | |||||||||||
| $ | $ | ||||||||||
Costs Incurred
| Predecessor | Successor | |||||||||||||||||||||||||
| For the Period from January 1, 2018 through August 13, 2018 | For the Period from August 14, 2018 through December 31, 2018 | Year Ended December 31, 2019 | Year Ended December 31, 2020 | |||||||||||||||||||||||
| (In thousands) | ||||||||||||||||||||||||||
| Property acquisitions | $ | $ | $ | $ | ||||||||||||||||||||||
| Exploration and development: | ||||||||||||||||||||||||||
| Exploratory leasehold costs | ||||||||||||||||||||||||||
| Development leasehold costs | ||||||||||||||||||||||||||
| Development drilling and completion costs | ||||||||||||||||||||||||||
| Other development costs | ||||||||||||||||||||||||||
| Total capital expenditures | $ | $ | $ | $ | ||||||||||||||||||||||
(4)Long-term Debt
Long-term debt is comprised of the following:
| As of December 31, | |||||||||||
| 2019 | 2020 | ||||||||||
| (In thousands) | |||||||||||
| Principal | $ | $ | |||||||||
| Discount, net of amortization | ( | ( | |||||||||
| Principal | |||||||||||
| Discount, net of amortization | ( | ( | |||||||||
| Bank Credit Facility: | |||||||||||
| Principal | |||||||||||
| Debt issuance costs, net of amortization | ( | ( | |||||||||
| $ | $ | ||||||||||
F-20
The discounts on the senior notes are being amortized over the lives of the senior notes using the effective interest rate method. Issuance costs are amortized over the lives of the senior notes on a straight-line basis which approximates the amortization that would be calculated using an effective interest rate method.
The following table summarizes Comstock's principal amount of debt as of December 31, 2020 by year of maturity:
| 2021 | 2022 | 2023 | 2024 | 2025 | Thereafter | Total | |||||||||||||||||||||||||||||||||||
| (In thousands) | |||||||||||||||||||||||||||||||||||||||||
| Bank credit facility | $ | $ | $ | $ | $ | $ | $ | ||||||||||||||||||||||||||||||||||
| $ | $ | $ | $ | $ | $ | $ | |||||||||||||||||||||||||||||||||||
On August 14, 2018, the Company entered into a bank credit facility with Bank of Montreal, as administrative agent, and certain participating banks. The bank credit facility was subject to a borrowing base of $700.0 million. Concurrent with the closing of the Covey Park Acquisition, the bank credit facility was amended and restated to provide for a $1.6 billion borrowing base which is re-determined on a semi-annual basis and upon the occurrence of certain other events. The maturity date was extended to July 16, 2024. The borrowing base was re-determined at $1.4 billion during 2020. Borrowings under the bank credit facility are secured by substantially all of the assets of the Company and its subsidiaries and bear interest at the Company's option, at either LIBOR plus 2.25 % to 3.25 % or a base rate plus 1.25 % to 2.25 %, in each case depending on the utilization of the borrowing base. The Company also pays a commitment fee of 0.375 % to 0.5 % on the unused borrowing base. The weighted average interest rate on borrowings under the bank credit facility were 3.48 % and 4.69 % as of December 31, 2020 and 2019, respectively. The bank credit facility places certain restrictions upon the Company's and its subsidiaries' ability to, among other things, incur additional indebtedness, pay cash dividends, repurchase common stock, make certain loans, investments and divestitures and redeem the senior notes. The only financial covenants are the maintenance of a last twelve month leverage ratio of less than 4.0 to 1.0 and an adjusted current ratio of at least 1.0 to 1.0 . The Company was in compliance with the covenants as of December 31, 2020. On February 12, 2021, Wells Fargo Bank was appointed administrative agent.
In connection with the Jones Contribution, the Company completed a series of refinancing transactions to retire all of its then-outstanding senior secured and unsecured convertible notes. On August 3, 2018, the Company issued $850.0 million principal amount of its 9 ¾% Senior Notes due 2026 in an underwritten offering and received proceeds of $815.9 million. Interest on the senior notes is payable on February 15 and August 15 at an annual rate of 9.75 % and the senior notes mature on August 15, 2026.
As a part of the Covey Park Acquisition, the Company assumed $625.0 million of senior notes. The fair market value of the notes at the closing was $446.6 million. Interest on the assumed notes is payable on May 15 and November 15 at an annual rate of 7.5 %. These senior notes mature on May 15, 2025.
In May 2020, the Company exchanged 767,096 shares of its common stock, valued at approximately $5.0 million, to retire $5.6 million aggregate principal amount of the Company's 7 ½% Senior Notes due 2025, which had a carrying value of $4.2 million. As a result, the Company recognized a $0.9 million loss on early retirement of debt in 2020.
On June 23, 2020, the Company issued $500.0 million principal amount of its 9 ¾% Senior Notes due 2026 in an underwritten offering and received net proceeds of $441.1 million, which were used to repay borrowings under the Company's bank credit facility.
On August 19, 2020, the Company issued an additional $300.0 million principal amount of its 9 ¾% Senior Notes due 2026 in an underwritten offering and received net proceeds of $296.4 million, which were used to further repay borrowings under the Company's bank credit facility.
F-21
(5)Commitments and Contingencies
The Company has entered into natural gas transportation contracts which extend to 2031. Commitments under these contracts are $21.5 million for 2021, $31.2 million for 2022 and $24.8 million for 2023 through 2030.
The Company has drilling rig contracts and completion service contracts. Terms of drilling contracts vary from well to well, or are for periods of less than one year . The service contracts are generally cancellable with 45 days notice. Existing commitments under these contracts is $6.0 million as of December 31, 2020.
From time to time, the Company is involved in certain litigation that arise in the normal course of its operations. The Company records a loss contingency for these matters when it is probable that a liability has been incurred and the amount of the loss can be reasonably estimated. The Company does not believe the resolution of these matters will have a material adverse effect on the Company's financial position, results of operations or cash flows and no material amounts are accrued relative to these matters at December 31, 2019 or 2020.
(6)Convertible Preferred Stock
(7)Stockholders' Equity
During 2018, warrants were exercised for 402,708 shares of common stock and 11,955 warrants expired without being exercised on September 7, 2018.
On July 16, 2019, the Company amended its Second Amended and Restated Articles of Incorporation to increase its authorized capital to 405,000,000 shares, of which 400,000,000 shares are common stock, $0.50 par value per share, and 5,000,000 are preferred stock, $10.00 par value per share.
In May 2020, the Company completed an underwritten public offering of its common stock pursuant to which it issued and sold 41,325,000 shares for net proceeds after offering costs of $196.5 million. The proceeds of the offering were used toward the redemption of the Series A Convertible Preferred Stock.
(8)Stock-based Compensation
The Company grants restricted shares of common stock and PSUs to key employees and directors as part of their compensation. Grants are made pursuant to the Company's 2019 Long-term Incentive Plan (the "2019 Plan"), which was approved by the Company's shareholders on May 31, 2019. Future awards of performance share units, restricted stock grants or other equity awards available under the 2019 Plan as of December 31, 2020 were 4,776,556 shares of common stock.
Stock-based compensation expense is included in general and administrative expenses. During the Predecessor Period from January 1, 2018 through August 13, 2018 the Company had $3.9 million in stock-based compensation expense. For the Successor Period from August 14, 2018 through December 31, 2018, and during the years ended December 31, 2019 and 2020 the Company had $1.0 million, $4.0 million and $6.5 million, respectively, in stock-based compensation expense.
F-22
Restricted Stock
The fair value of restricted stock grants is amortized over the vesting period, generally one year to three years , using the straight-line method. The fair value of each restricted share on the date of grant is equal to the market price of a share of the Company's stock.
A summary of restricted stock activity is presented below:
| Number of Restricted Shares | Weighted Average Grant Price | ||||||||||
| Outstanding at January 1, 2020 | $ | ||||||||||
| Granted | $ | ||||||||||
| Vested | ( | $ | |||||||||
| Forfeitures | ( | $ | |||||||||
| Outstanding at December 31, 2020 | $ | ||||||||||
| Predecessor | Successor | |||||||||||||||||||||||||
| For the Period from January 1, 2018 through August 13, 2018 | For the Period from August 14, 2018 through December 31, 2018 | Year Ended December 31, 2019 | Year Ended December 31, 2020 | |||||||||||||||||||||||
| (In thousands, except per share data) | ||||||||||||||||||||||||||
| Fair value of vested restricted stock | $ | $ | $ | $ | ||||||||||||||||||||||
| Per share weighted average fair value | $ | $ | $ | $ | ||||||||||||||||||||||
| Compensation expense recognized for restricted stock grants | $ | $ | $ | $ | ||||||||||||||||||||||
| Unrecognized compensation expense related to unvested shares | $ | |||||||||||||||||||||||||
| Expected recognition period | ||||||||||||||||||||||||||
Performance Share Units
The Company issues PSUs as part of its long-term equity incentive compensation. PSU awards can result in the issuance of common stock to the holder if certain performance criteria are met during a performance period. The performance periods consist of three years. The performance criteria for the PSUs are based on the Company's annualized total stockholder return ("TSR") for the performance period as compared with the TSR of certain peer companies for the performance period. The costs associated with PSUs are recognized as general and administrative expense over the performance periods of the awards.
The fair value of PSUs was measured at the grant date using the Geometric Brownian Motion Model ("GBM Model"). Significant assumptions used in this simulation include the Company's expected volatility and a risk-free interest rate based on U.S. Treasury yield curve rates with maturities consistent with the vesting periods, as well as the volatilities for each of the Company's peers. Assumptions regarding volatility included the historical volatility of each company's stock and the implied volatilities of publicly traded stock options.
Significant assumptions used to value PSUs included:
| Predecessor | Successor | |||||||||||||||||||||||||
| For the Period from January 1, 2018 through August 13, 2018 | For the Period from August 14, 2018 through December 31, 2018 | Year Ended December 31, 2019 | Year Ended December 31, 2020 | |||||||||||||||||||||||
| Risk free interest rate | % | % | % | % | ||||||||||||||||||||||
| Range of implied volatility: | ||||||||||||||||||||||||||
| Minimum | % | % | % | % | ||||||||||||||||||||||
| Maximum | % | % | % | % | ||||||||||||||||||||||
F-23
A summary of PSU activity is presented below:
| Number of PSUs | Weighted Average Grant Price | ||||||||||
| Outstanding at January 1, 2020 | $ | ||||||||||
| Granted | $ | ||||||||||
| Forfeitures | ( | $ | |||||||||
| Outstanding at December 31, 2020 | $ | ||||||||||
| Predecessor | Successor | |||||||||||||||||||||||||
| For the Period from January 1, 2018 through August 13, 2018 | For the Period from August 14, 2018 through December 31, 2018 | Year Ended December 31, 2019 | Year Ended December 31, 2020 | |||||||||||||||||||||||
| (In thousands, except per unit data) | ||||||||||||||||||||||||||
| Number of PSUs granted | ||||||||||||||||||||||||||
| Grant date fair value | $ | $ | $ | $ | ||||||||||||||||||||||
| Grant date fair value per unit | $ | $ | $ | $ | ||||||||||||||||||||||
| Compensation expense recognized for PSUs | $ | $ | $ | $ | ||||||||||||||||||||||
| Unrecognized compensation expense related to unvested shares | $ | |||||||||||||||||||||||||
| Expected recognition period | ||||||||||||||||||||||||||
The fair value of PSUs is amortized over the vesting period of three years , using the straight-line method. The final number of shares of common stock issued may vary depending upon the performance multiplier, and can result in the issuance of zero to 2,272,976 shares of common stock based on the achieved performance ranges from zero to two .
During the Predecessor Period from January 1, 2018 through August 13, 2018, 85,987 PSUs were earned and converted into restricted stock. The change of control that occurred due to the Jones Contribution resulted in the vesting of all then outstanding performance share units on August 14, 2018 at the maximum amount that could be earned, and a total of 1,028,672 shares of common stock were issued related to the earned PSUs with a fair value of $8.8 million.
(9)Retirement Plan
(10)Income Taxes
F-24
The following is an analysis of the consolidated income tax provision (benefit):
| Predecessor | Successor | |||||||||||||||||||||||||
| For the Period from January 1, 2018 through August 13, 2018 | For the Period from August 14, 2018 through December 31, 2018 | Year Ended December 31, 2019 | Year Ended December 31, 2020 | |||||||||||||||||||||||
| (In thousands) | ||||||||||||||||||||||||||
| Current - Federal | $ | $ | ( | $ | $ | |||||||||||||||||||||
| Current - State | ( | ( | ||||||||||||||||||||||||
| Deferred - Federal | ( | |||||||||||||||||||||||||
| Deferred - State | ( | |||||||||||||||||||||||||
| $ | $ | $ | $ | ( | ||||||||||||||||||||||
In recording deferred income tax assets, the Company considers whether it is more likely than not that its deferred income tax assets will be realized in the future. The ultimate realization of deferred income tax assets is dependent upon the generation of future taxable income during the periods in which those deferred income tax assets would be deductible. The Company believes that after considering all the available objective evidence, historical and prospective, with greater weight given to historical evidence, management is not able to determine that it is more likely than not that all of its deferred tax assets will be realized. As a result, the Company established valuation allowances for its deferred tax assets and U.S. federal and state net operating loss carryforwards that are not expected to be utilized due to the uncertainty of generating taxable income prior to the expiration of the carryforward periods. The Company will continue to assess the valuation allowances against deferred tax assets considering all available information obtained in future periods.
The Tax Cuts and Jobs Act, which was enacted on December 22, 2017, reduced the corporate income tax rate effective January 1, 2018 from 35% to 21%. Among the other significant tax law changes that potentially affect the Company are the elimination of the corporate alternative minimum tax ("AMT"), changes that require operating losses incurred in 2018 and beyond be carried forward indefinitely with no carryback up to 80 % of taxable income in a given year, and limitations on the deduction for interest expense incurred in 2018 or later of up to 30 % of its adjusted taxable income (defined as taxable income before interest and net operating losses) for the taxable year. For the tax years beginning before January 1, 2022, the adjusted taxable income for these purposes is also adjusted to exclude the impact of depreciation, depletion and amortization. The Tax Cuts and Jobs Act preserved deductibility of intangible drilling costs for federal income tax purposes, which allows the Company to deduct a portion of drilling costs in the year incurred and minimizes current taxes payable in periods of taxable income. In December 31, 2018, the Company completed its accounting for the tax effects of enactment of the Tax Cuts and Jobs Act. The Tax Cuts and Jobs Act repealed the AMT for tax years beginning on or after January 1, 2018 and provides that existing AMT credit carryforwards can be utilized to offset federal taxes for any taxable year. Due to tax law enacted in 2020 with the Coronavirus Aid, Relief and Economic Security ("CARES") Act, the Company received $10.2 million in refunds for outstanding AMT carryforwards in 2020.
F-25
The tax effects of significant temporary differences representing the net deferred tax liability at December 31, 2019 and 2020 were as follows:
| 2019 | 2020 | ||||||||||
| (In thousands) | |||||||||||
| Deferred tax assets: | |||||||||||
| Asset retirement obligation | $ | $ | |||||||||
| Net operating loss carryforwards | |||||||||||
| Interest expense limitation | |||||||||||
| Unrealized hedging losses | |||||||||||
| Other | |||||||||||
| Valuation allowance on deferred tax assets | ( | ( | |||||||||
| Deferred tax assets | |||||||||||
| Deferred tax liabilities: | |||||||||||
| Property and equipment | ( | ( | |||||||||
| Unrealized hedging income | ( | ||||||||||
| Bond discount | ( | ( | |||||||||
| Other | ( | ( | |||||||||
| Deferred tax liabilities | ( | ( | |||||||||
| Net deferred tax liability | $ | ( | $ | ( | |||||||
The difference between the customary rate of 21% and the effective tax rate on income (losses) is due to the following:
| Predecessor | Successor | |||||||||||||||||||||||||
| For the Period from January 1, 2018 through August 13, 2018 | For the Period from August 14, 2018 through December 31, 2018 | Year Ended December 31, 2019 | Year Ended December 31, 2020 | |||||||||||||||||||||||
| (In thousands) | ||||||||||||||||||||||||||
| Tax at statutory rate | $ | ( | $ | $ | $ | ( | ||||||||||||||||||||
| Tax effect of: | ||||||||||||||||||||||||||
| Alternative minimum tax | ( | |||||||||||||||||||||||||
Valuation allowance on deferred tax assets | ( | ( | ( | |||||||||||||||||||||||
State income taxes, net of federal benefit | ( | ( | ||||||||||||||||||||||||
| Nondeductible transaction costs | ||||||||||||||||||||||||||
Nondeductible stock-based compensation | ( | |||||||||||||||||||||||||
| Other | ( | |||||||||||||||||||||||||
| Total | $ | $ | $ | $ | ( | |||||||||||||||||||||
F-26
| Predecessor | Successor | |||||||||||||||||||||||||
| For the Period from January 1, 2018 through August 13, 2018 | For the Period from August 14, 2018 through December 31, 2018 | Year Ended December 31, 2019 | Year Ended December 31, 2020 | |||||||||||||||||||||||
| Tax at statutory rate | % | % | % | % | ||||||||||||||||||||||
| Tax effect of: | ||||||||||||||||||||||||||
| Alternative minimum tax | ( | |||||||||||||||||||||||||
Valuation allowance on deferred tax assets | ( | ( | ( | |||||||||||||||||||||||
State income taxes, net of federal benefit | ( | ( | ||||||||||||||||||||||||
| Nondeductible transaction costs | ||||||||||||||||||||||||||
Nondeductible stock-based compensation | ( | ( | ( | |||||||||||||||||||||||
| Other | ( | |||||||||||||||||||||||||
| Effective tax rate | ( | % | % | % | % | |||||||||||||||||||||
At December 31, 2020, Comstock had the following carryforwards available to reduce future income taxes:
| Types of Carryforward | Years of Expiration Carryforward | Amount | ||||||||||||
| (In thousands) | ||||||||||||||
| Net operating loss – U.S. federal | 2021-2037 | $ | ||||||||||||
| Net operating loss – U.S. federal | Unlimited | $ | ||||||||||||
| Net operating loss – state taxes | 2021-2037 | $ | ||||||||||||
| Interest expense – U.S. federal | Unlimited | $ | ||||||||||||
| Interest expense – state taxes | Unlimited | $ | ||||||||||||
The shares of common stock issued as a result of the Jones Contribution triggered an ownership change under Section 382 of the Internal Revenue Code. As a result, the Company's ability to use net operating losses ("NOLs") generated before the change in control to reduce taxable income is generally limited to an annual amount based on the fair market value of its stock immediately prior to the ownership change multiplied by the long-term tax-exempt interest rate. The Company's NOLs are estimated to be limited to $3.3 million a year as a result of this limitation. In addition to this limitation, IRC Section 382 provides that a corporation with a net unrealized built-in gain immediately before an ownership change may increase its limitation by the amount of built-in gain recognized during a recognition period, which is generally the five-year period immediately following an ownership change. Based on the fair market value of the Company's common stock immediately prior to the ownership change, Comstock believes that it has a net unrealized built-in gain which will increase the Section 382 limitation during the five-year recognition period.
NOLs that exceed the Section 382 limitation in any year continue to be allowed as carry forwards until they expire and can be used to offset taxable income for years within the carryover period subject to the limitation in each year. NOLs incurred prior to 2018 generally have a 20-year life until they expire. NOLs generated in 2018 and after would be carried forward indefinitely. Comstock's use of new NOLs arising after the date of an ownership change would not be affected by the 382 limitation. If the Company does not generate a sufficient level of taxable income prior to the expiration of the pre-2018 NOL carry-forward periods, then it will lose the ability to apply those NOLs as offsets to future taxable income. The Company estimates that $844.6 million of the U.S. federal NOL carryforwards and $1.4 billion of the estimated state NOL carryforwards will expire unused.
F-27
(11)Derivative Financial Instruments and Hedging Activities
Comstock uses commodity swaps, basis swaps, collars and swaptions to hedge oil and natural gas prices to manage price risk. Swaps are settled monthly based on differences between the prices specified in the instruments and the settlement prices of futures contracts. Generally, when the applicable settlement price is less than the price specified in the contract, Comstock receives a settlement from the counterparty based on the difference multiplied by the volume or amounts hedged. Similarly, when the applicable settlement price exceeds the price specified in the contract, Comstock pays the counterparty based on the difference. Comstock generally receives a settlement from the counterparty for floors when the applicable settlement price is less than the price specified in the contract, which is based on the difference multiplied by the volumes hedged. For collars, generally Comstock receives a settlement from the counterparty when the settlement price is below the floor and pays a settlement to the counterparty when the settlement price exceeds the cap. No settlement occurs when the settlement price falls between the floor and cap. Swaptions are a combined derivative which includes a fixed price swap and a sold option to extend the volume hedged.
All of the Company's derivative financial instruments are used for risk management purposes and, by policy, none are held for trading or speculative purposes. Comstock minimizes credit risk to counterparties of its derivative financial instruments through formal credit policies, monitoring procedures, and diversification. The Company is not required to provide any credit support to its counterparties other than cross collateralization with the assets securing its bank credit facility. None of the Company's derivative financial instruments involve payment or receipt of premiums. The Company classifies the fair value amounts of derivative financial instruments as net current or noncurrent assets or liabilities, whichever the case may be, by commodity contract. None of the Company's derivative contracts are designated as cash flow hedges. The Company recognizes cash settlements and changes in the fair value of its derivative financial instruments as a single component of other income (expenses).
All of Comstock's natural gas derivative financial instruments are tied to the Henry Hub-NYMEX price index and all of its oil derivative financial instruments are tied to the WTI-NYMEX index price. Basis swaps are tied to Henry Hub.
F-28
The Company had the following outstanding commodity-based derivative financial instruments, excluding basis swaps which are discussed separately below, at December 31, 2020:
| 2021 | 2022 | Total | |||||||||||||||||||||
| Natural Gas Swap Contracts: | |||||||||||||||||||||||
| Volume (MMBtu) | (1) | ||||||||||||||||||||||
| Average Price per MMBtu | $ | (1) | $ | $ | |||||||||||||||||||
| Natural Gas Collar Contracts: | |||||||||||||||||||||||
| Volume (MMBtu) | |||||||||||||||||||||||
| Price per MMBtu: | |||||||||||||||||||||||
| Average Ceiling | $ | $ | $ | ||||||||||||||||||||
| Average Floor | $ | $ | $ | ||||||||||||||||||||
| Natural Gas Swaptions Contracts: | |||||||||||||||||||||||
| Volume (MMBtu) | (2) | (3) | |||||||||||||||||||||
| Average Price per MMBtu | $ | (2) | $ | (3) | $ | ||||||||||||||||||
| Crude Oil Collar Contracts: | |||||||||||||||||||||||
| Volume (Bbls) | |||||||||||||||||||||||
| Price per Barrel: | |||||||||||||||||||||||
| Average Ceiling | $ | $ | $ | ||||||||||||||||||||
| Average Floor | $ | $ | $ | ||||||||||||||||||||
_______________
(1)2021 natural gas price swap contracts include 49,200,000 MMBtu at an average price of $2.51 that are part of certain natural gas price swaption contracts which include a call to extend the price swap by the counterparty as described in (3) below.
(2)The counterparties have the right to exercise a call option, which expires in March 2021, to enter into a price swap with the Company on 16,500,000 MMBtu in 2021 at an average price of $2.50 .
(3)The counterparties have the right to exercise a call option to enter into a price swap with the Company on 49,200,000 MMBtu in 2022 at an average price of $2.51 . The call option expires for 5,400,000 MMBtu at an average price of $2.50 in March 2021; for 36,500,000 MMBtu at an average price of $2.52 in October 2021 and 7,300,000 MMBtu at an average price of $2.50 in November 2021.
In addition to the swaps, collars and swaptions above, at December 31, 2020, the Company has basis swap contracts that fix the differentials between NYMEX Henry Hub and Houston Ship Channel indices. These contracts settle monthly through December 2022 on a total volume of 25,550,000 MMBtu. The fair value of these contracts was a net asset of $1.0 million at December 31, 2020.
The Company has interest rate swap agreements that fix LIBOR at 0.33 % for $500.0 million of its floating rate long-term debt. These contracts settle monthly through April 2023. The fair value of these contracts was a net liability of $2.1 million at December 31, 2020.
Subsequent to December 31, 2020, the Company added natural gas collar contracts to hedge 32,880,000 MMBtu of natural gas production from July 2021 to December 2022 at an average ceiling price of $3.20 per MMBtu and an average floor price of $2.50 per MMBtu and added natural gas swap contracts to hedge 7,300,000 MMBtu of natural gas production from January 2022 to December 2022 at an average price of $2.70 per MMBtu. The Company also added oil collar contracts to hedge 349,500 Bbls of oil production from January 2021 to December 2021 at an average ceiling price of $54.96 per Bbl and an average floor price of $42.39 per Bbl.
F-29
The aggregate fair value of the Company's derivative financial instruments are presented on a gross basis in the accompanying consolidated balance sheets. The classification of derivative financial instruments between assets and liabilities, consists of the following:
| As of December 31, | ||||||||||||||||||||
| Type | Consolidated Balance Sheet Location | 2019 | 2020 | |||||||||||||||||
| (in thousands) | ||||||||||||||||||||
| Asset Derivative Financial Instruments: | ||||||||||||||||||||
| Natural gas price derivatives | Derivative Financial Instruments – current | $ | $ | |||||||||||||||||
| Oil price derivatives | Derivative Financial Instruments – current | |||||||||||||||||||
| $ | $ | |||||||||||||||||||
| Natural gas price derivatives | Derivative Financial Instruments – long-term | $ | $ | |||||||||||||||||
| Liability Derivative Financial Instruments: | ||||||||||||||||||||
| Natural gas price derivatives | Derivative Financial Instruments – current | $ | $ | |||||||||||||||||
| Oil price derivatives | Derivative Financial Instruments – current | |||||||||||||||||||
| Interest rate derivatives | Derivative Financial Instruments – current | |||||||||||||||||||
| $ | $ | |||||||||||||||||||
| Natural gas price derivatives | Derivative Financial Instruments – long-term | $ | $ | |||||||||||||||||
| Oil price derivatives | Derivative Financial Instruments – long-term | |||||||||||||||||||
| Interest rate derivatives | Derivative Financial Instruments – long-term | |||||||||||||||||||
| $ | $ | |||||||||||||||||||
Gains and losses related to the change in the fair value of the Company's derivative contracts recognized in the consolidated statement of operations were as follows:
| Predecessor | Successor | ||||||||||||||||||||||||||||
| Gain/(Loss) Recognized in Earnings on Derivatives | For the Period from January 1, 2018 through August 13, 2018 | For the Period from August 14, 2018 through December 31, 2018 | Year Ended December 31, 2019 | Year Ended December 31, 2020 | |||||||||||||||||||||||||
| (In thousands) | |||||||||||||||||||||||||||||
| Natural gas price derivatives | $ | $ | $ | $ | |||||||||||||||||||||||||
| Oil price derivatives | ( | ||||||||||||||||||||||||||||
| Interest rate derivatives | ( | ||||||||||||||||||||||||||||
| $ | $ | $ | $ | ||||||||||||||||||||||||||
(12)Related Party Transactions
In February 2019, Comstock sold certain leases covering 1,464 undeveloped net acres in Caddo Parish, Louisiana for $5.9 million to a partnership owned by the Company's majority stockholder. The proceeds from the sale were used to fund the purchase of a like number of net acres from a third party for $5.9 million. The acreage acquired was in part the acreage sold to the partnership or acreage in the same area. The purchase price paid per net acre was determined by the price paid by the Company to the third party.
The Company operates and owns working interests in these properties along with the partnership owned by the majority stockholder. Comstock also drills and operates certain other properties for the partnership that the Company does not own working interest in. Comstock charges the partnership for the costs incurred to drill and operate the wells as well as drilling and operating overhead fees that it charges other working interest owners. Comstock also provides natural gas marketing services to the partnership, including evaluating potential markets and providing hedging services, and receives a fee equal to $0.02 per Mcf for natural gas marketed. Comstock
F-30
received $134,000 and $718,000 in 2019 and 2020, respectively, for operating and marketing services provided to the partnership.
Comstock had a $6.2 million receivable from the partnership at December 31, 2020, which was collected in full in February 2021. In addition, derivative financial instruments at December 31, 2020 included a $2.0 million payable for oil and natural gas price hedging contracts that the Company has entered into with the partnership.
(13)Oil and Gas Reserves Information (Unaudited)
Set forth below is a summary of the Company's proved oil and natural gas reserves:
| Predecessor | Successor | |||||||||||||||||||||||||||||||||||||||||||||||||
| Period from January 1, 2018 through August 13, 2018 | Period from August 14, 2018 through December 31, 2018 | Year Ended December 31, 2019 | Year Ended December 31, 2020 | |||||||||||||||||||||||||||||||||||||||||||||||
| Oil (MBbls) | Natural Gas (MMcf) | Oil (MBbls) | Natural Gas (MMcf) | Oil (MBbls) | Natural Gas (MMcf) | Oil (MBbls) | Natural Gas (MMcf) | |||||||||||||||||||||||||||||||||||||||||||
| Proved Reserves: | ||||||||||||||||||||||||||||||||||||||||||||||||||
Beginning of period (1) | ||||||||||||||||||||||||||||||||||||||||||||||||||
| Revisions of previous estimates | ( | ( | ||||||||||||||||||||||||||||||||||||||||||||||||
| Extensions and discoveries | ||||||||||||||||||||||||||||||||||||||||||||||||||
| Acquisitions of minerals in place | ||||||||||||||||||||||||||||||||||||||||||||||||||
| Sales of minerals in place | ( | ( | ( | ( | ( | ( | ||||||||||||||||||||||||||||||||||||||||||||
| Production | ( | ( | ( | ( | ( | ( | ( | ( | ||||||||||||||||||||||||||||||||||||||||||
| End of period | ||||||||||||||||||||||||||||||||||||||||||||||||||
Proved Developed Reserves: | ||||||||||||||||||||||||||||||||||||||||||||||||||
Beginning of period (1) | ||||||||||||||||||||||||||||||||||||||||||||||||||
| End of period | ||||||||||||||||||||||||||||||||||||||||||||||||||
Proved Undeveloped Reserves: | ||||||||||||||||||||||||||||||||||||||||||||||||||
Beginning of period (1) | ||||||||||||||||||||||||||||||||||||||||||||||||||
| End of period | ||||||||||||||||||||||||||||||||||||||||||||||||||
___________
(1)The beginning proved reserves balance at August 14, 2018 represents the contributed Bakken shale properties and the reserves of the Predecessor on a combined basis.
Revisions of previous estimates. Revisions of previous estimates in 2018, 2019 and 2020 were primarily attributable to higher production performance from the Company's wells as compared to expected performance from proved undeveloped locations included in proved reserves in the previous year which exceeded downward revisions that primarily related to changes related to oil and natural gas prices that were used to determine proved reserves in that year. Revisions of previous estimates associated with changes in oil prices were none in 2018, 0.5 MMBbls of negative revisions in 2019 and 2.9 MMBbls of negative revisions in 2020. Revisions of previous estimates associated with changes in natural gas prices were none in 2018, 228.5 Bcfe of negative revisions in 2019 and 68.2 Bcf of negative revisions in 2020.
Extensions and discoveries. Extensions and discoveries for 2018, 2019 and 2020 were primarily comprised of proved reserve additions attributable to the wells drilled in the current year that were not classified as proved undeveloped in prior years and additional proved undeveloped reserves added from the Company's drilling program.
Acquisitions of minerals in place. The significant acquisitions of minerals in place in 2019 is primarily related to the Covey Park Acquisition.
F-31
The following table sets forth the standardized measure of discounted future net cash flows relating to proved reserves:
| Predecessor | Successor | |||||||||||||||||||||||||
| As of August 13, 2018 | As of December 31, 2018 | As of December 31, 2019 | As of December 31, 2020 | |||||||||||||||||||||||
| (In thousands) | ||||||||||||||||||||||||||
| Cash Flows Relating to Proved Reserves: | ||||||||||||||||||||||||||
| Future Cash Flows | $ | $ | $ | $ | ||||||||||||||||||||||
| Future Costs: | ||||||||||||||||||||||||||
| Production | ( | ( | ( | ( | ||||||||||||||||||||||
| Development and Abandonment | ( | ( | ( | ( | ||||||||||||||||||||||
| Future Income Taxes | ( | ( | ( | ( | ||||||||||||||||||||||
| Future Net Cash Flows | ||||||||||||||||||||||||||
| ( | ( | ( | ( | |||||||||||||||||||||||
Standardized Measure of Discounted Future Net Cash Flows | $ | $ | $ | $ | ||||||||||||||||||||||
The following table sets forth the changes in the standardized measure of discounted future net cash flows relating to proved reserves:
| Predecessor | Successor | |||||||||||||||||||||||||
| For the Period from January 1, 2018 through August 13, 2018 | For the Period from August 14, 2018 through December 31, 2018 | Year Ended December 31, 2019 | Year Ended December 31, 2020 | |||||||||||||||||||||||
| (In thousands) | ||||||||||||||||||||||||||
| Standardized Measure, Beginning of Year | $ | $ | $ | $ | ||||||||||||||||||||||
| Net change in sales price, net of production costs | ( | ( | ( | |||||||||||||||||||||||
| Development costs incurred during the year which were previously estimated | ||||||||||||||||||||||||||
| Revisions of quantity estimates | ||||||||||||||||||||||||||
| Accretion of discount | ||||||||||||||||||||||||||
| Changes in future development and abandonment costs | ( | ( | ||||||||||||||||||||||||
| Changes in timing and other | ( | ( | ||||||||||||||||||||||||
| Extensions and discoveries | ||||||||||||||||||||||||||
| Acquisitions of minerals in place | ||||||||||||||||||||||||||
| Sales of minerals in place | ( | ( | ( | |||||||||||||||||||||||
| Sales, net of production costs | ( | ( | ( | ( | ||||||||||||||||||||||
| Net changes in income taxes | ( | ( | ( | |||||||||||||||||||||||
| Standardized Measure, End of Year | $ | $ | $ | $ | ||||||||||||||||||||||
The standardized measure of discounted future net cash flows was determined based on the simple average of the first of month market prices for oil and natural gas for each year. Prices used in determining quantities of oil and natural gas reserves and future cash inflows from oil and natural gas reserves represent prices received at the Company's sales point. These prices have been adjusted from posted or index prices for both location and quality differences.
F-32
Prices used in determining oil and natural gas reserves quantities and cash flows are as follows:
| Predecessor | Successor | |||||||||||||||||||||||||
| For the Period from January 1, 2018 through August 13, 2018 | For the Period from August 14, 2018 through December 31, 2018 | Year Ended December 31, 2019 | Year Ended December 31, 2020 | |||||||||||||||||||||||
| Crude Oil: $/barrel | $ | $ | $ | $ | ||||||||||||||||||||||
| Natural Gas: $/Mcf | $ | $ | $ | $ | ||||||||||||||||||||||
Proved reserve information utilized in the preparation of the financial statements were based on estimates prepared by the Company's petroleum engineering staff in accordance with guidelines established by the Securities and Exchange Commission and the Financial Accounting Standards Board, which require that reserve reports be prepared under existing economic and operating conditions with no provision for price and cost escalation except by contractual agreement. All of the Company's reserves are located onshore in the continental United States of America. The Company retained two independent petroleum consultants to conduct audits of the Company's 2020 reserve estimates. The purpose of these audits was to provide additional assurance on the reasonableness of internally prepared reserve estimates. The engineering firms were selected for their geographic expertise and their historical experience.
Future development and production costs are computed by estimating the expenditures to be incurred in developing and producing proved oil and gas reserves at the end of the year, based on year end costs and assuming continuation of existing economic conditions. Future income tax expenses are computed by applying the appropriate statutory tax rates to the future pre-tax net cash flows relating to proved reserves, net of the tax basis of the properties involved. The future income tax expenses give effect to permanent differences and tax credits, but do not reflect the impact of future operations.
F-33
Serious News for Serious Traders! Try StreetInsider.com Premium Free!
You May Also Be Interested In
- Comstock Resources (CRK) PT Raised to $10 at Mizuho
- Form 8.3 - Mondi plc
- AI HRMS Revolutionizes HR Management with a New Plan for Small Businesses
Create E-mail Alert Related Categories
SEC FilingsSign up for StreetInsider Free!
Receive full access to all new and archived articles, unlimited portfolio tracking, e-mail alerts, custom newswires and RSS feeds - and more!
