

Form 10-K C. H. ROBINSON WORLDWIDE For: Dec 31
 Tweet
Tweet Share
ShareUNITED STATES SECURITIES AND EXCHANGE COMMISSION
Washington, D.C. 20549
FORM 10-K
For the fiscal year ended December 31 , 2022
or
For the transition period from ____ to _____
Commission File Number: 000-23189

(Exact name of registrant as specified in its charter)
| (State or other jurisdiction of incorporation or organization) | (I.R.S. Employer Identification No.) | |||||||
(Address of principal executive offices, including zip code)
Registrant’s telephone number, including area code: 952 -937-8500
Securities registered pursuant to Section 12(b) of the Act:
| Title of each class | Trading Symbol(s) | Name of each exchange on which registered | ||||||
Securities registered pursuant to Section 12(g) of the Act: None
Indicate by check mark if the registrant is a well-known seasoned issuer, as defined in Rule 405 of the Securities Act. Yes ☒ No ☐
Indicate by check mark if the registrant is not required to file reports pursuant to Section 13 or Section 15(d) of the Act. Yes ☐ No ☒
Indicate by check mark whether the registrant (1) has filed all reports required to be filed by Section 13 or 15(d) of the Securities Exchange Act of 1934 during the preceding 12 months (or for such shorter period that the registrant was required to file such reports) and (2) has been subject to such filing requirements for the past 90 days. Yes ☒ No ☐
Indicate by check mark whether the registrant has submitted electronically every Interactive Date File required to be submitted pursuant to Rule 405 of Regulation S-T (§232.405 of this chapter) during the preceding 12 months (or for such shorter period that the registrant was required to submit such files). Yes ☒ No ☐
Indicate by check mark whether the registrant is a large accelerated filer, an accelerated filer, a non-accelerated filer, a smaller reporting company, or emerging growth company. See definitions of “large accelerated filer,” “accelerated filer,” “smaller reporting company,” “emerging growth company” in Rule 12b-2 of the Exchange Act.
| ☒ | Accelerated filer | ☐ | Non-accelerated filer | ☐ | Smaller reporting company | Emerging growth company | |||||||||||||||||||||||
If an emerging growth company, indicate by check mark if the registrant has elected not to use the extended transition period for complying with any new or revised financial accounting standards provided pursuant to Section 13(a) of the Exchange Act. ☐
Indicate by check mark whether the registrant has filed a report on and attestation to its management’s assessment of the effectiveness of its internal control over financial reporting under Section 404(b) of the Sarbanes-Oxley Act (15 U.S.C. 7262(b)) by the registered public accounting firm that prepared or issued its audit report. ☒
If securities are registered pursuant to Section 12(b) of the Act, indicate by check mark whether the financial statements of the registrant included in the filing reflect the correction of an error to previously issued financial statements. ☐
Indicate by check mark whether any of those error corrections are restatements that required a recovery analysis of incentive-based compensation received by any of the registrant’s executive officers during the relevant recovery period pursuant to § 240.10D-1(b). ☐
Indicate by check mark whether the registrant is a shell company (as defined in Rule 12b-2 of the Exchange Act). Yes ☐ No ☒
The aggregate market value of voting stock held by non-affiliates of the registrant as of June 30, 2022, was $12,646,143,071 (based upon the closing price of $101.37 per common share on that date as quoted on The Nasdaq Global Select Market).
As of February 15, 2023, the number of shares outstanding of the registrant’s common stock, par value $0.10 per share, was 116,510,428 .
DOCUMENTS INCORPORATED BY REFERENCE
C.H. ROBINSON WORLDWIDE, INC.
ANNUAL REPORT ON FORM 10-K
For the Year Ended December 31, 2022
TABLE OF CONTENTS
| PART I | Page | |||||||
| Item 1. | ||||||||
| Item 1A. | ||||||||
| Item 1B. | ||||||||
| Item 2. | ||||||||
| Item 3. | ||||||||
| Item 4. | ||||||||
| PART II | ||||||||
| Item 5. | ||||||||
| Item 6. | ||||||||
| Item 7. | ||||||||
| Item 7A. | ||||||||
| Item 8. | ||||||||
| Item 9. | ||||||||
| Item 9A. | ||||||||
| Item 9B. | ||||||||
| Item 9C. | ||||||||
| PART III | ||||||||
| Item 10. | ||||||||
| Item 11. | ||||||||
| Item 12. | ||||||||
| Item 13. | ||||||||
| Item 14. | ||||||||
| PART IV | ||||||||
| Item 15. | ||||||||
| Item 16. | ||||||||
2
PART I
ITEM 1. BUSINESS
Overview
C.H. Robinson Worldwide, Inc. (“C.H. Robinson,” “the company,” “we,” “us,” or “our”) is one of the largest global logistics companies in the world, with consolidated total revenues of $24.7 billion in 2022. We bring together customers, carriers, and suppliers to connect and grow supply chains. We are grounded in our customer promise to use our technology, which is built by and for supply chain experts and powered by our information advantage, to deliver smarter solutions. These global solutions, combined with the expertise of our people, deliver value–from improved cost reductions and reliability to sustainability and visibility–that our customers and carriers can rely on.
In 2022, we handled approximately 20 million shipments and worked with approximately 100,000 customers. Operating throughout North America, Europe, Asia, Oceania, and South America, we offer a global suite of services using tailored, market-leading differentiated technology to drive better outcomes by leveraging our experience, data, technology, and scale. Our EDGE values are the core of our strategy and drive us to Evolve Constantly, Deliver Excellence, Grow Together, and Embrace Integrity.
As a global logistics platform, we connect across continents by working closely with a wide variety of transportation companies and utilize those relationships to efficiently and cost-effectively arrange the transport of our customers’ freight. In 2022, we continued to provide our customers with solutions to their complex challenges. We utilized approximately 96,000 contracted transportation companies around the world, including contracted motor carriers, railroads (primarily intermodal service providers), and ocean and air carriers in 2022. Our employees, technology, and product portfolio enable us to provide a differentiated experience, remain flexible, and provide solutions that optimize service for our customers. As an integral part of our transportation services, we also provide a wide range of value-added logistics services, such as freight consolidation, customs brokerage, supply chain consulting and analysis, emission analytics, optimization, and reporting.
In addition to transportation and logistics services, we also provide sourcing services under the trade name Robinson Fresh® (“Robinson Fresh”). Our sourcing services consist primarily of the buying, selling, and/or marketing of fresh fruits, vegetables, and other value-added perishable items. The foundation for much of our logistics expertise can be traced to this original business, founded in 1905, which gives us significant experience in handling produce and temperature controlled commodities. We supply fresh produce through a network of independent produce growers and suppliers. Our customers include grocery retailers, restaurants, foodservice distributors, and produce wholesalers. In many cases, we also arrange the logistics and transportation of the products we sell and provide related supply chain services, such as replenishment, category management, and managed procurement services. We have developed proprietary brands of produce and have exclusive licensing agreements to distribute fresh and value-added produce under recognized consumer brand names. The produce for these brands is sourced through a preferred grower network and packed to order through contract packing agreements. We have instituted quality assurance and monitoring procedures with each of these preferred growers.
Segment information. We have two reportable segments, North American Surface Transportation (“NAST”) and Global Forwarding, with our remaining operating segments reported as All Other and Corporate. The All Other and Corporate segment includes Robinson Fresh, Managed Services, Other Surface Transportation outside of North America, and other miscellaneous revenues and unallocated corporate expenses. See additional disclosure in Note 9, Segment Reporting, to our consolidated financial statements.
NAST provides transportation and logistics services across North America through a network of offices in the U.S., Canada, and Mexico. The primary services provided by NAST include truckload and less than truckload (“LTL”) transportation brokerage services.
Global Forwarding provides transportation and logistics services through an international network of offices in North America, Europe, Asia, Oceania, and South America and also contracts with independent agents worldwide. The primary services provided by Global Forwarding include ocean freight services, air freight services, and customs brokerage.
Robinson Fresh provides sourcing services that primarily include the buying, selling, and/or marketing of fresh fruits, vegetables, and other value-added perishable items. Robinson Fresh sources products from around the world.
Managed Services is primarily comprised of our TMC division, which offers Managed TMS® (“Managed TMS”). Managed TMS combines the use of our global technology platform Navisphere® (“Navisphere”), logistics process expertise, and consulting services in relation to the use of motor carriers and other transportation providers chosen by our customers. Customers can access Navisphere, logistics experts, and supply chain engineers to manage their day-to-day operations and optimize supply chain performance.
3
Other Surface Transportation revenues are primarily earned by our Europe Surface Transportation operating segment. Europe Surface Transportation provides transportation and logistics services, including truckload and groupage services, across Europe.
Sales
Transportation and Logistics Services
C.H. Robinson provides freight transportation and related logistics and supply chain services. Our services range from commitments on a specific shipment to much more comprehensive and integrated relationships. We execute these services by investing in and retaining talented employees, developing innovative proprietary systems and processes, and utilizing a network of contracted transportation providers, including, but not limited to, contracted motor carriers, railroads, and ocean and air carriers. We make a profit that is driven by the value we provide our customers and the resulting difference between what we charge to our customers for the totality of services provided to them and what we pay to the transportation providers to transport the freight.
We provide the following transportation and logistics services:
•Truckload: Through our contracts with motor carriers, we have access to dry vans, temperature controlled vans, flatbeds, and bulk capacity. Through the use of Navisphere, we connect our customers with contracted motor carriers that specialize in their transportation lanes and product types, and we help contracted motor carriers optimize the usage of their equipment.
•LTL: LTL transportation involves the shipment of single or multiple pallets of freight. We primarily focus on shipments of a single pallet or larger, although we handle any size shipment. Through our contracts with motor carriers and the use of Navisphere, we consolidate freight and freight information to provide our customers with a single source of information on their freight. In many instances, we consolidate partial shipments for several customers into full truckloads.
•Ocean: As a licensed Non-Vessel Operating Common Carrier (“NVOCC”) and freight forwarder, we consolidate shipments, determine routing, select ocean carriers, contract for ocean shipments, and/or provide for local pickup and delivery of shipments.
•Air: As a certified Indirect Air Carrier (“IAC”) and freight forwarder, we organize air shipments and provide door-to-door service.
•Customs: Our customs brokers are licensed and regulated by U.S. Customs and Border Protection and other authoritative governmental agencies to assist importers and exporters in meeting regulatory and operational requirements governing imports and exports.
•Other Logistics Services: We provide intermodal transportation service, which is the shipment of freight in containers or trailers by a combination of truck and rail. In addition, we provide fee-based Managed Services, warehousing services, small parcel, and other services.
Customers communicate their freight needs, typically on an order-by-order basis, to the C.H. Robinson team responsible for their account, either directly or through highly automated connections established between Navisphere and the customers' transportation management system. The C.H. Robinson team then ensures that all necessary information regarding each shipment is available in Navisphere. We utilize the information from Navisphere and other available sources to select the best contracted carrier based upon factors such as their service score, equipment availability, freight rates, and other relevant factors.
Once the contracted carrier is selected, we receive the contracted carrier’s commitment to provide the transportation. During the time when a shipment is executed, we connect frequently, either electronically or manually, with the contracted carrier to track the status of the shipment to meet the unique needs of our customers.
For most of our transportation and logistics services, we are a service provider. By accepting the customer’s order, we accept certain responsibilities for transportation of the shipment from origin to destination. The carrier’s contract is with us, not the customer, and we are responsible for prompt payment of freight charges. In cases where we have agreed to pay for claims for damage to freight while in transit, we pursue reimbursement from the contracted carrier for the claims. In our Managed Services business, we are acting as the shipper’s agent. In those cases, the carrier’s contract is typically with the customer, and we collect a fee for our services.
As a result of our logistics capabilities, our technology, our global suite of services, and available modes of transportation, some of our customers have us handle all, or a substantial portion, of their freight transportation requirements. Our employees price
4
our services to provide a profit to us for the totality of services performed for the customer. Our services to the customer may be priced on a spot market, or transactional basis, or prearranged contractual rates. Most of our contractual rate commitments are for one year or less and allow for renegotiation. As is typical in the transportation industry, most of these contracts do not include specific volume commitments. When we enter into prearranged rate agreements for truckload services with our customers, we usually have fuel surcharge agreements that allow for fuel to primarily act as a pass-through cost, in addition to the underlying line-haul portion of the rate.
We purchase most of our truckload services from our contracted truckload carriers on a spot market, or transactional basis, even when we are working with the customer on a contractual basis. In some cases, we may get advance commitments from one or more contracted motor carriers to transport contracted shipments for the length of our customer contract or to provide transportation services within dense transportation lanes. In those cases, where we have prearranged rates with contracted motor carriers, there is typically a calculated fuel surcharge based on a mutually agreed-upon formula.
While providing day-to-day transportation services, our employees often identify opportunities for additional logistics services as they become more familiar with our customers’ daily operations and the nuances of our customers’ supply chains. We offer a wide range of logistics services on a global basis that reduce or eliminate supply chain inefficiencies. We analyze customers’ current transportation rate structures, modes of shipping, and carrier selection. We identify opportunities to consolidate shipments for cost savings. We suggest ways to improve operating and shipping procedures and manage claims. We help customers minimize storage through crossdocking and other flow-through operations. Many of these services are provided in connection with providing the transportation services based on the nature of the customer relationship. In addition to these transportation services, we may also provide a wide range of value-added logistics services, such as freight consolidation, customs brokerage, supply chain consulting and analysis, emission analytics, optimization, and reporting, for which we are usually paid separately.
We have broadened our relationship with many of our customers through an emphasis on integrated logistics solutions, resulting in our management of a greater portion of their supply chains. We often serve our customers through specially created teams and through multiple locations. Our transportation and logistics services are provided to numerous international customers through our worldwide network.
Transportation services accounted for approximately 97 percent of adjusted gross profits in 2022 and 2021 and 96 percent of adjusted gross profits in 2020. Adjusted gross profits is a non-GAAP financial measure calculated as total revenues less the total of purchased transportation and related services and the cost of purchased products sourced for resale. For additional information, see Item 7 of Part II, Management’s Discussion and Analysis of Financial Condition and Results of Operations.
The table below shows our adjusted gross profits by transportation mode, for the years ended December 31 (in thousands):
| 2022 | 2021 | 2020 | 2019 | 2018 | |||||||||||||||||||||||||
| Truckload | $ | 1,561,310 | $ | 1,280,629 | $ | 1,071,873 | $ | 1,348,878 | $ | 1,445,916 | |||||||||||||||||||
| LTL | 632,116 | 523,365 | 457,290 | 477,348 | 471,275 | ||||||||||||||||||||||||
| Ocean | 729,839 | 711,223 | 350,094 | 308,367 | 312,952 | ||||||||||||||||||||||||
| Air | 198,166 | 225,286 | 151,443 | 106,777 | 120,540 | ||||||||||||||||||||||||
| Customs | 107,691 | 100,539 | 87,095 | 91,828 | 88,515 | ||||||||||||||||||||||||
| Other Logistics Services | 251,547 | 210,958 | 195,159 | 149,664 | 154,546 | ||||||||||||||||||||||||
| Total | $ | 3,480,669 | $ | 3,052,000 | $ | 2,312,954 | $ | 2,482,862 | $ | 2,593,744 | |||||||||||||||||||
Sourcing
Since we were founded in 1905, we have been in the business of sourcing fresh produce. Much of our logistics expertise can be traced to our significant experience in handling produce and other perishable commodities. Because of its perishable nature, produce must be rapidly packaged, carefully transported within tight timetables, usually in temperature-controlled equipment, and quickly distributed to replenish high-turnover inventories maintained by our customers. In many instances, we consolidate an individual customer’s produce orders into truckload quantities at the point of origin and arrange for transportation of the truckloads, often to multiple destinations. Our sourcing customer base includes grocery retailers, restaurants, foodservice distributors, and produce wholesalers.
Our sourcing services include inventory forecasting and replenishment, brand management, and category development services. We have various national and regional branded produce programs, including both proprietary brands and nationally licensed brands. These programs contain a wide variety of high quality, fresh bulk, and value-added fruits and vegetables. These brands have expanded our market presence and relationships with many of our retail customers. We have also instituted quality assurance and monitoring programs as part of our branded and preferred grower programs. Sourcing accounted for
5
approximately three percent of our adjusted gross profits in 2022 and 2021 and four percent of our adjusted gross profits in 2020.
Customer Relationships
We work to establish long-term relationships with our customers and to increase the amount of business done with each customer by providing them with a full range of logistics services and people on whom they can rely. During 2022, we served approximately 100,000 customers worldwide, ranging from Fortune 100 companies to small businesses in a wide variety of industries. During 2022, our largest customer accounted for approximately two percent of total revenues. In recent years, we have grown by adding new customers and by increasing our volumes with, and providing more services to, our existing customers.
We seek additional business from existing customers and pursue new customers based on our knowledge of the marketplace, our unique information advantage, and the range of logistics services we can provide. We believe that our account management disciplines, expertise, and technology built by and for supply chain experts enable our employees to better serve our customers by combining a broad knowledge of logistics and market conditions with a deep, data-driven, understanding of the specific supply chain issues facing individual customers and certain industries.
Markets and Resources
Competition
The transportation services industry is highly competitive and fragmented. We compete against many logistics companies, including technology-based service companies, trucking companies, property freight brokers, carriers offering logistics services, NVOCCs, IACs, and freight forwarders. We also buy from and sell transportation services to companies that compete with us.
In our sourcing business, we compete with produce brokers, produce growers, produce marketing companies, produce wholesalers, and foodservice buying groups. We also buy from and sell produce to companies that compete with us.
We often compete with respect to price, scope of services, or a combination thereof, but believe that our most significant competitive advantages are:
•People and relationships: Our knowledgeable, dedicated, and empowered people act as an extension of our customers’ teams—logistics experts they can rely on—to innovate and execute their supply chain strategies. Our large number of unique, strong relationships provide global connections and valuable market knowledge;
•Global suite of services: A wide selection of services and products help provide our customers with consistent capacity and service levels;
•Scale: Our customers leverage our industry-leading capacity, broad procurement options, global data insights, and substantial shipment volumes for better efficiency, service, and marketplace advantages;
•Information, products, and technology: Our global suite of services, unparalleled quantity of relationships, and scale combine to provide us with an information advantage. We have one of the largest datasets of shipments, routings, and carriers in the world. We use our data and data analysts to drive smarter solutions and products for our customers. Navisphere, our proprietary technology, provides flexibility, global visibility, customized solutions, easy integration, broad connectivity, and advanced security;
•Network: Our combination of global capability, regional and local expertise, and scale gives our customers a strategic advantage in supply chain execution;
•Process: Proven processes and solutions combine strategy with practical experience for customized action plans that succeed in the real world; and
•Stability: Our customers and our contract carriers rely on us to support critical elements of their business. Our financial strength, discipline, and consistent track record of success are a key foundation of our ability to sustainably meet their needs.
Proprietary Information Technology and Intellectual Property
Most of our global network operates on a single global technology platform called Navisphere, which is used to match customer needs with supplier capabilities, to collaborate with other offices, and to utilize centralized support resources to complete all
6
facets of the transaction. Our technology and software platform is essential to serve our customers and contracted carriers and to manage our business. In 2022, we executed approximately 20 million shipments for approximately 100,000 customers with approximately 96,000 contracted carriers.
Navisphere and our other operational systems help our employees service customer orders, select the optimal mode of transportation, build and consolidate shipments, identify appropriate carriers, and manage exceptions, all based on customer-specific service parameters. Our data estate and scale provide our organization with the business intelligence to support decision-making in all areas of our business.
We have committed to investing in our technology to bring the value of technology, data, and analytics to our customers, help solve their most complex logistics challenges, and drive the industry forward. With approximately 1,300 data scientists, engineers, and developers, we are continuing to make smart, talent-focused investments globally in this critical area and building the next generation of tools and processes that will change how supply chains function.
C.H. Robinson® Labs™ (“Robinson Labs”) is part of this commitment. It is an innovation incubator where the next big ideas in logistics and supply chain are created, tested, and scaled to drive smarter solutions for our customers and contracted carriers. The Robinson Labs team collaborates with customers to solve their logistics challenges with technology built by and for supply chain experts. Industry-first tools launched by Robinson Labs include:
•Procure IQ®, which uses algorithms built by our data scientists and the largest freight shipment dataset in the industry to show shippers the optimal way to purchase transportation in each of their shipping lanes;
•Emissions IQ®, which gives shippers instant visibility into their carbon emissions and surfaces opportunities for reduction; and
•Market Rate IQ™, which reveals the patterns in a shipper’s spot freight that they could change to increase savings.
Our operations primarily use Navisphere, our global, multimodal transportation management system that allows customers to communicate worldwide with parties in their supply chain across languages, currencies, and continents. Navisphere offers sophisticated business analytics, artificial intelligence, and data-driven tools to improve supply chain performance and meet increasing customer demands, including the following tools:
•Navisphere Vision™ allows our customers to see their freight across all modes and services globally in a single view. Details of shipment contents, shipment status, disruptions to shipments, and resulting adjustments to estimated time of arrival using artificial intelligence are provided for the customer to manage their supply chain exceptions. Collaboration, intelligent notifications, and performance scorecards allow customers to manage their supply chain and identify inefficiencies.
•Navisphere Insight™ takes a customer’s raw data about their freight and uses data science to turn it into valuable insights, surfacing trends in transportation performance and spend that can be used for decision-making in real time or over time. Analysis is provided down to the shipment and order level.
•Navisphere Optimizer™ helps customers minimize the travel time, distance, and total miles of their freight, while maximizing their trailer utilization and savings. It is used during the transportation planning process and dynamically selects the right route with the right mode and right carrier on the right day.
Navisphere is also integrated into 35 third-party transportation management systems and/or enterprise resource planning systems, allowing our dynamic pricing engine to directly deliver real-time quotes to customers when they have freight to be picked up or delivered. This eliminates the need for our customers to shop around and provides an automated solution.
The Navisphere Carrier™ (“Navisphere Carrier”) platform provides contracted motor carriers access to the functionality necessary to efficiently manage their relationships with C.H. Robinson. Contracted motor carriers can search and book available freight, provide online status updates, keep track of receivables, and upload scanned documentation. Many of our contracted motor carriers’ favorite features of Navisphere Carrier are also available through our Navisphere Carrier mobile application for Android® and iOS® mobile operating systems.
The Navisphere Driver™ mobile application provides contracted motor carriers’ drivers with load status automation capabilities. Drivers can elect to allow the application to automate location services and updates while in transit. Drivers can also capture and upload bill of lading documentation to initiate payment processes. The track and trace capabilities give our systems and customers frequent load status information.
7
Freightquote® by C.H. Robinson (“Freightquote”) is a web-based, mobile-responsive offering designed to streamline the shipping process for small business customers, allowing the booking of freight without any shipping knowledge or expertise. Freightquote's small business customers can go online with their smart phone, tablet, or computer to book their LTL or truckload freight, track shipments, get proactive notifications, and pay for transportation services with a credit card.
We rely on a combination of cybersecurity, trademarks, copyrights, trade secrets, and nondisclosure and non-competition agreements to establish and protect our intellectual property and proprietary technology. Additionally, we have numerous registered trademarks, trade names, and logos in the U.S. and internationally. Our reliance on our intellectual property and proprietary technology subjects us to certain risks that, if realized, would negatively impact our operating results. For a description of such risks and their potential effect on our business, see Item 1A. of Part I, Risk Factors.
Relationships with Transportation Providers
We continually work on establishing contractual relationships with qualified transportation providers that meet both ours and our customers’ service requirements to provide dependable services, favorable pricing, and available capacity during periods when demand for transportation equipment is greater than the supply. We own very little transportation equipment and do not employ the people directly involved with the delivery of our customers’ freight, so these relationships are critical to our success.
In 2022, we worked with approximately 96,000 transportation providers worldwide, the vast majority of which are contracted motor carriers. To strengthen and maintain our relationships with contracted motor carriers, our employees regularly communicate with them and try to assist them by increasing their equipment utilization, reducing their empty miles, and repositioning their equipment. To make it easier for contracted motor carriers to work with us, we have a policy of making contracted motor carrier invoice payments upon receipt of proof of delivery in accordance with our standard payment terms. For those contracted motor carriers that would like a faster payment, we also offer expedited payment upon receipt of proof of delivery in exchange for a discount, along with offering in-trip cash advances.
Contracted motor carriers provide access to dry vans, temperature controlled vans, flatbeds, and bulk capacity. These contracted motor carriers are of all sizes, including owner-operators of a single truck, small and mid-size fleets, private fleets, and the largest national trucking companies. Consequently, we are not dependent on any one contracted motor carrier. Our largest truck transportation provider was less than two percent of our total cost of transportation in 2022. Contracted motor carriers that had fewer than 100 trucks transported approximately 80 percent of our truckload shipments in 2022. Every U.S. and Canadian motor carrier we do business with is required to execute a contract that establishes the motor carrier is acting as an independent contractor. At the time the contract is executed, and thereafter, through subscriptions with a third-party service, we confirm that each U.S. contracted motor carrier is properly licensed and insured, has the necessary federally-issued authority to provide transportation services, and can provide the necessary level of service on a dependable basis. Our motor carrier contracts require that the contracted motor carrier issue invoices only to, and accept payment solely from, us for the shipments that they transport under their contract with us and allow us to withhold payment to satisfy previous claims or shortages. Our standard contracts do not include volume commitments, and typically the initial contract rate is modified each time we confirm an individual shipment with a contracted motor carrier.
In our NVOCC ocean transportation business, we have contracts with most of the major ocean carriers, which support a variety of service and rate needs for our customers. We negotiate annual contracts that establish the predetermined rates we agree to pay the ocean carriers. The rates are negotiated based on expected volumes from our customers in specific trade lanes. These contracts are often amended throughout the year to reflect changes in market conditions for our business, such as additional trade lanes.
We operate both as a consolidator and as a transactional IAC in the U.S. and internationally. We select air carriers and provide for local pickup and delivery of shipments. We execute our air freight services through our relationships with air carriers, charter services, block space agreements, capacity space agreements, and transactional spot market negotiations. Through charter services, we contract part or all of an airplane to meet customer requirements. Our block space agreements and capacity space agreements are contracts for a defined time period. The contracts include fixed allocations for predetermined flights at agreed upon rates that are reviewed periodically throughout the year. The transactional negotiations afford us the ability to capture excess capacity at prevailing market rates for a specific shipment.
Seasonality
Our operating results have been subject to seasonal trends as a result of, or as influenced by, numerous factors, including national holidays, weather patterns, consumer demand, economic conditions, and other similar and subtle forces. Although seasonal changes in the transportation industry have not had a significant impact on our cash flow or results of operations, we expect this trend to continue, and we cannot guarantee that it will not adversely impact us in the future.
8
Government Regulation
Our operations may be regulated and licensed by various federal, state, and local transportation agencies in the U.S. and similar governmental agencies in foreign countries in which we operate.
We are subject to licensing and regulation as a property freight broker and are licensed by the U.S. Department of Transportation (“DOT”) to arrange for the transportation of property by motor vehicle. The DOT prescribes qualifications for acting in this capacity, including certain surety bonding requirements. C.H. Robinson is also licensed under, and subject to regulation by, the Federal Maritime Commission (“FMC”) as an ocean transportation intermediary in the capacity as both a freight forwarder and NVOCC; we maintain separate bonds and licenses for each. We operate as a Department of Homeland Security certified IAC, providing air freight services, subject to commercial standards set forth by the International Air Transport Association (“IATA”) and federal regulations issued by the Transportation Security Administration (“TSA”). C.H. Robinson performs customs brokerage services pursuant to its customs brokerage license issued by U.S. Customs and Border Protection (“CBP”). As a licensed customs broker, C.H. Robinson has experience working with other government agencies that maintain jurisdiction over certain customs entries. We also hold customs trade partnership against terrorism (“C-TPAT”) certification with CBP as both a customs broker and NVOCC.
Although Congress enacted legislation in 1994 that substantially preempts the authority of states to exercise economic regulation of motor carriers and brokers of freight, some intrastate shipments for which we arrange transportation may be subject to additional licensing, registration, or permit requirements. We contractually require and rely on the motor carrier transporting the shipment to ensure compliance with these types of requirements. We, along with the contracted motor carriers on which we rely to arrange transportation services for our customers, are also subject to a variety of federal and state safety and environmental regulations. Although compliance with the regulations governing licensees in these areas has not had a materially adverse effect on our operations or financial condition in the past, there can be no assurance that such regulations or changes thereto will not adversely impact our operations in the future. Violation of these regulations could also subject us to fines, as well as increased claims liability.
We buy and sell fresh produce under licenses issued by the U.S. Department of Agriculture (“USDA”) as required by the Perishable Agricultural Commodities Act (“PACA”). Other sourcing and distribution activities may be subject to various federal and state food and drug statutes and regulations.
As a publicly traded company and issuer of stock, we are subject to and maintain compliance with various anti-corruption and anti-bribery statutes such as the Foreign Corrupt Practices Act, the UK Bribery Act 2010, and certain other foreign countries' equivalent statutes or programs in the countries in which we operate.
We are subject to laws and regulations in the U.S. and other countries concerning the handling of personal information, including laws that require us to notify governmental authorities and/or affected individuals of data breaches involving certain personal information. These laws and regulations include, for example, the European General Data Protection Regulation and the California Consumer Privacy Act. Regulatory actions or litigation seeking to impose significant penalties could be brought against us in the event of a data breach or alleged non-compliance with such laws and regulations.
Human Capital
At C.H. Robinson, our employees connect the world and are at the core of our success. They are logistics experts and problem solvers, and they act as an extension of our customers' teams. In fact, our customers and contract carriers consistently cite our people as one of the top reasons they work with C.H. Robinson. Our talent strategy is built on our EDGE values: Evolve Constantly, Deliver Excellence, Grow Together, and Embrace Integrity. Our EDGE values are brought to life through our Leadership Principles: Adapt and Change, Constantly Innovate and Improve, Deliver Exceptional Results, Compete to Win, Value Differences, Inspire, Coach and Develop our People, and Think Like the Customer. Our Leadership Principles are unique to us and provide a shared understanding of what it means to lead at C.H. Robinson; they reinforce our culture and help drive exceptional results.
We attract, retain, and reward exceptional talent by creating an inclusive, high-performing culture and engaging employees with meaningful work at a place where they belong, can grow, and are proud to work. We leverage the diverse perspectives and experiences of our global network of supply chain experts to create innovative solutions and better meet the needs of our customers, contract carriers, and growers.
Oversight and Governance
Our Board of Directors & Talent and Compensation Committee have oversight of our human capital management and diversity, equity and inclusion (“DEI”) efforts. They receive regular updates from our Chief Human Resources and Environmental,
9
Social, and Governance (“ESG”) Officer on our key strategic initiatives, success measurements, and other relevant matters pertaining to human resources and DEI. This includes, but is not limited to, hiring and retention, culture, employee engagement, succession planning, compensation and benefits, and human resources or DEI-related risks.
Our People
As of December 31, 2022, we had a total of 17,399 employees in more than 38 countries, 14,678 of whom are network employees, as presented below. Our remaining employees support our network teams in Advanced Analytics and Data Science, Communications, Customer Strategy, Finance, Human Resources, Legal, Marketing, Product, and Technology and Engineering. The following table illustrates our employee count by global region:
| North America | Europe | Asia | Oceania | South America | Total | |||||||||||||||||||||||||||||||||
| Network employees | 10,357 | 1,664 | 1,835 | 472 | 350 | 14,678 | ||||||||||||||||||||||||||||||||
| Shared services employees | 1,919 | 457 | 278 | 32 | 35 | 2,721 | ||||||||||||||||||||||||||||||||
Total Employees | 12,276 | 2,121 | 2,113 | 504 | 385 | 17,399 | ||||||||||||||||||||||||||||||||
| Contingent workers | 1,404 | 19 | 333 | 54 | 216 | 2,026 | ||||||||||||||||||||||||||||||||
Diversity, Equity, and Inclusion (DEI)
Fostering a diverse and inclusive workforce is core to our company values. It is imperative to our business and the right thing to do. The unique experiences and backgrounds of our employees create a stronger, more innovative and successful team. We bring our commitment to diversity, equity, and inclusion to life by integrating our DEI strategic pillars (workplace diversity, workforce inclusivity, partnerships, and accountability) across our talent strategies and into our business.
We believe the way to make progress on our DEI initiatives is by taking a shared approach to accountability. DEI metrics are tracked and reviewed quarterly with senior leadership. This allows leaders to spot trends and act as needed. Additionally, we have identified aspirational goals to be met by 2025 that focus on hiring, retention, engagement, and leadership representation for women (globally) and people of color (U.S. only). We regularly assess our progress on these goals and will set new goals in the future as we achieve our objectives. Some of our DEI metrics are summarized below as of December 31, 2022. Additional information can be found in our annual ESG report.
| Women in Workforce | 48 | % | |||
| Management Positions Held by Women | 46 | % | |||
| Leadership Positions Held by Women | 27 | % | |||
| U.S. Racial and Ethnic Minorities in Workforce | 29 | % | |||
| Management Positions Held by U.S. Racial and Ethnic Minorities | 23 | % | |||
| Leadership Positions Held by U.S. Racial and Ethnic Minorities | 11 | % | |||
| External Hires - Women | 49 | % | |||
| External Hires - U.S. Racial and Ethnic Minorities | 42 | % | |||
We have shown our commitment to shared accountability by tying progress on our DEI strategy and goals to the annual incentives for our senior leaders. We provide robust and targeted resources for managers to support inclusive leadership behaviors. Our talent acquisition team is focused on recruiting and hiring more women and people of color through partnerships with external organizations and universities, as well as implementing trainings and policies to ensure we have a bias-free hiring process. We offer several developmental opportunities with a DEI focus to our employees including sponsorship, mentorship, and leadership programs, as well as employee resource groups.
Talent Acquisition, Engagement, and Retention
C.H. Robinson attracts, engages, and retains exceptional talent that represents the communities we serve. Proven recruitment marketing practices are leveraged to increase talent brand awareness and drive high quality applicant flow. Our Leadership Principles are embedded in the recruitment process to help ensure new hires meet our expectations along with having the skills and abilities to perform the job.
Our employee turnover ratio, which is calculated as the number of employees who departed in the 12 months ended December 31, 2022, divided by the average number of employees in the 12 months ended December 31, 2022, was 19 percent.
10
Despite tight labor market conditions in 2022, our turnover rate held steady. We achieved this by focusing on the top drivers of retention, including work-life balance, compensation, career growth opportunities and benefits.
We regularly survey our employees and engage in focus groups to better understand what our employees value and how we can continuously enhance their experience. Our 2022 engagement survey generated a positive engagement score of 80 percent, which is consistent with past years and is in the top third of all companies surveyed. Leadership continues to be a signature strength for C.H. Robinson. In this survey, manager effectiveness and manager relationship favorability scores surpassed the 75th percentile benchmark. The survey results indicated that employees feel supported by their managers in growing their careers, and they believe they can confide in their managers and that managers are doing a good job helping them prioritize their work. In addition, our focus on providing employees visibility to career opportunities at C.H. Robinson has increased those scores in 2021 and 2022, which is a driver of engagement for our employees and supports retention.
Onboarding and Development
We believe a focus on the development of our leaders and employees results in high performing employees who are empowered to accelerate their careers and deliver exceptional results. Our talent model is to prioritize growing our own talent and leaders, because we believe with time their experience, knowledge, relationships, and expertise become increasingly valuable.
The foundation of our talent strategy starts with building and developing great leaders. We prioritize our leaders’ capabilities to coach and provide feedback to empower employees to grow their careers. We provide new leaders with onboarding to ensure incoming and transitioning leaders get up to speed quickly, so they are ready to lead and support their employees. Throughout their careers, leaders are provided development opportunities via our leadership development programs, which are in place for our high potential employees and next generation, and high-performing leaders. In addition, we have a sponsorship program to champion the growth of our employees of color and women employees. We also have targeted leadership development programs for women and Black leaders at various stages of their leadership careers. We evaluate leadership talent across the organization through our talent review process, which allows us to calibrate and differentiate talent based on performance and potential across the organization. This process drives succession planning for critical roles in the organization.
As new employees join C.H. Robinson, they are provided onboarding that emphasizes the skills necessary to become productive employees, including training on our proprietary technology systems, our customer service philosophy, and our company culture, values, DEI which includes unconscious bias training, and Leadership Principles. Onboarding is followed by on-the-job training and regular performance and development conversations between employees and their managers.
Throughout an employee’s career at C.H. Robinson, we develop and recognize employees by setting clear performance expectations and providing development opportunities. All employees have access to a digital learning platform that supports their ongoing development. Employees can also explore potential roles and career paths through an online resource center, where they are provided resources about performance and development, along with information about how they are supported and rewarded for the work they do.
Wellness, Benefits, and Compensation
At C.H. Robinson, we take a comprehensive view on the importance of supporting our employees’ health and well-being. Our total rewards strategies support employees’ health, wealth, and self and incorporate market-competitive pay and comprehensive benefit programs for all global employees.
We deliver highly competitive and meaningful benefit programs designed to meet the needs of our diverse workforce. Our commitment to our employees embodies benefit plans and programs that support physical, emotional, and financial wellness. Our benefit programs include a broad array of plans, such as healthcare and retirement benefits, and an employee assistance program in Europe and North America, which provides additional no-cost access to behavioral health benefits and counseling. Benefits are reviewed on an annual basis to ensure they stay competitive in the marketplace and to incorporate the voice of our employees to ensure we meet their diverse needs.
The goals of our compensation programs are to: align pay for performance; reward profitable long-term growth; support company goals, business transformation, and company culture; pay market competitive compensation that attracts, retains, and motivates top talent and allows for upside opportunity to reward that talent if the company achieves superior performance; and align the interests of management to our owners, the shareholders. Our rewards are constructed to support business strategy and the achievement of business performance goals. We have designed short- and long-term incentives to drive the behaviors necessary to achieve our strategic priorities. This ensures groups and individuals are rewarded for working together toward our most impactful priorities, products, and services. We are increasing compensation transparency, which helps drive the connection between pay and performance and supports our goal of providing visibility to our employees about career path opportunities in the organization.
11
Lastly, our equity compensation program is an important part of how we stay competitive from a total compensation perspective, as it incentivizes and rewards leadership for sustained enterprise performance. We believe the program further contributes to our success as it helps to create long-term ownership and alignment between employees and our shareholders. Select employees who have significant responsibilities in helping drive results are eligible to receive equity awards through our equity compensation program. Refer to Note 6, Capital Stock and Stock Award Plans, to our consolidated financial statements for further discussion related to our equity award plan design.
Community Engagement
Giving back to our communities and supporting non-profit organizations inspires and engages our employees and is core to our culture. We proudly support our industry and our communities around the world by providing philanthropic donations to causes that matter most to our employees. Through our company and the C.H. Robinson Foundation, we contributed more than $4 million to 1,100 charities in 2022.
In addition to our employee-driven philanthropy, we support disaster relief efforts, strategic grantmaking, employee relief funds, and scholarship programs for our employees and our contract carriers. We focus on supporting basic needs for families including preventing hunger and providing housing, education, and workforce development as well as support for organizations working to remove barriers and diversify the talent pipeline within our industry.
Environmental Sustainability
C.H. Robinson is committed to reducing our environmental footprint, while helping to support sustainability efforts in our industry and for our customers. On a regular basis, we engage with our internal and external stakeholders to identify our priority ESG topics, including environmental sustainability. Our Chief Human Resources and ESG Officer and Vice President of ESG provide annual updates to the Board of Directors and Governance Committee on our most critical ESG topics. The full results of these engagements and more information is available in our annual ESG report each year, which includes indices for the Sustainability Accounting Standards Board and Task Force on Climate-Related Financial Disclosures.
We focus our sustainability efforts in three areas: working to reduce our own greenhouse gas emissions, helping customers meet their sustainability goals, and contributing to advancements in sustainability within the transportation industry. We are committed to reducing our greenhouse gas emissions and we measure and report on our Scope 1, 2, and 3 emissions in our annual ESG report. We have set a science-aligned below 2°C goal to reduce our Scope 1 and 2 carbon intensity by 2025. In 2022, we announced we were 90 percent of the way to our goal. To achieve this goal, we have focused on energy efficiencies within our operations and purchasing renewable energy credits. In addition, Robinson Fresh focuses on reducing food waste through innovative technologies and reducing waste by including sustainable packaging options across our product portfolio.
In addition to tracking and managing our own environmental footprint, we leverage our scope, size, and scale to help customers meet their sustainability goals through tools like Emissions IQ™, which measures Scope 3 emissions from transportation, and by consulting on ways to optimize their supply chain and eliminate empty miles on the road in order to reduce emissions.
As a leader in our industry, we work to advance sustainability efforts through collaborations with non-profit and academic institutions, including sponsorship of research and participation in working groups focused on innovation within the transportation industry.
Additional information about our human capital management and environmental sustainability initiatives, goals, and achievements is available in the ESG report available on our website; however, the ESG report is not incorporated by reference in, and is not a part of, this Annual Report on Form 10-K.
12
Information about our Executive Officers
The Board of Directors designates the executive officers annually. Below are the names, ages, and positions of the executive officers as of February 17, 2023:
| Name | Age | Position | ||||||||||||
| Scott P. Anderson | 56 | Interim Chief Executive Officer | ||||||||||||
| Ben G. Campbell | 57 | Chief Legal Officer and Secretary | ||||||||||||
| Angela K. Freeman | 55 | Chief Human Resources and ESG Officer | ||||||||||||
| Mac Pinkerton | 49 | President of NAST | ||||||||||||
| Arun Rajan | 54 | Chief Operating Officer | ||||||||||||
| Michael J. Short | 52 | President of Global Freight Forwarding | ||||||||||||
| Michael P. Zechmeister | 56 | Chief Financial Officer | ||||||||||||
Scott P. Anderson has been a Director of the company since 2012, including as Chairman of our Board of Directors from 2020 to 2022, and was appointed Interim Chief Executive Officer effective January 1, 2023. Scott was a Senior Advisor to Patterson Companies, Inc. (Nasdaq: PDCO), a medical supply company, from June 2017 to June 2019. He served as President and Chief Executive Officer of Patterson Companies from 2010 to 2017. In April 2013, he was elected to the additional responsibility of Chairman of the Board. Prior to 2006, when he became President of Patterson Dental Supply, Inc., Scott held senior management positions in the dental unit, including Vice President, Sales, and Vice President, Marketing. Scott became a director of Patterson in 2010. He is a past chairman of the Dental Trade Alliance and has served on the board of directors of the Ordway Theater. Scott is a trustee of Gustavus Adolphus College, where he serves as Chairman of the Board. Scott earned a Master of Business Administration from Northwestern University, Kellogg School of Management and his bachelor’s degree from Gustavus Adolphus College.
Ben G. Campbell was named Chief Legal Officer and Secretary in January 2015. Previous positions with the company include Vice President, General Counsel and Secretary from January 2009 to December 2014 and Assistant General Counsel from February 2004 to December 2008. Ben joined C.H. Robinson in 2004. Before coming to C.H. Robinson, Ben was a partner at Rider Bennett, LLP, in Minneapolis, Minnesota. He currently serves as a director on the board of Second Harvest Heartland. Ben holds a Bachelor of Science degree from St. John’s University and a Juris Doctor from William Mitchell College of Law.
Angela K. Freeman was named Chief Human Resources Officer in January 2015, and in October 2019, also became ESG Officer. Prior to her current role, she served as Vice President of Human Resources from August 2012 to December 2014. Previous positions with C.H. Robinson include Vice President of Investor Relations and Public Affairs from January 2009 to August 2012, Director of Investor Relations, Director of Marketing Communications, and President of the C.H. Robinson Worldwide Foundation. In addition to her responsibilities at C.H. Robinson, Angie currently serves on the Board of Directors of The Shyft Group, Inc. (Nasdaq: SHYF) and on the Board of the University of North Dakota Alumni Association & Foundation. Prior to joining C.H. Robinson in 1998, Angie was with McDermott/O’Neill & Associates, a Boston-based public affairs firm. Angie holds a Bachelor of Arts degree and a Bachelor of Science degree from the University of North Dakota and a Master of Science degree from the London School of Economics.
Mac Pinkerton was named President of NAST in January 2019. Prior executive positions with the company include Vice President, Service Lines from July 2017 to December 2018 and Vice President, Transportation from October 2010 to June 2017. Prior to his executive roles, Mac was General Manager in the company's Mobile, Alabama and Dallas, Texas offices. Mac began his career with C.H. Robinson in 1997 as a transportation representative. He holds a Bachelor of Science degree from Mississippi State University.
Arun Rajan was named Chief Operating Officer in October 2022 and leads the Product, Technology, Data Science, Analytics and Marketing organizations at C.H. Robinson. Arun joined the company as Chief Product Officer in September 2021. Prior to joining the company, Arun was the Chief Technology Officer of Whole Foods Market, part of Amazon, from September 2019 to July 2021. Arun also held leadership positions at Zappos, an online retail company, through its acquisition by Amazon, serving as Chief Operating Officer from April 2015 to August 2019, Acting Chief Operating Officer from September 2014 to March 2015, and Chief Technology Officer from 2009 to 2013. Prior to Zappos, Arun's leadership roles included serving as the Chief Technology Officer of One Kings Lane in San Francisco, Co-founder and Chief Technology Officer of New York City’s Intent Media, Chief Technology Officer of Travelocity Europe and LastMinute.com in London, and Co-Founder and Chief Technology Officer of ITRadar.com in Minneapolis, Minnesota. Arun holds a Bachelor of Science degree in Computer Science from Pittsburgh State University and a Master of Science degree in Information Systems Management from the University of Arizona.
13
Michael J. Short was named President of Global Freight Forwarding in May 2015. Prior to this role, Mike served as Vice President, Global Forwarding - North America. He joined C.H. Robinson through the acquisition of Phoenix International (“Phoenix”) in November 2012, prior to which, he held a number of roles at Phoenix, including Regional Manager, Sales Manager, and General Manager of the St. Louis, Missouri office. Mike holds a Bachelor of Science degree in Business from the University of Missouri.
Michael P. Zechmeister was named Chief Financial Officer in August 2019. Before coming to C.H. Robinson, Mike served as Chief Financial Officer of United Natural Foods, Inc., a food wholesaler, from September 2015 to August 2019. Prior to joining United Natural Foods, Inc., Mike spent 25 years at General Mills, Inc., holding a variety of leadership roles, including Vice President of Finance for the Pillsbury Division, Vice President of Finance for U.S. Retail Sales, and Treasurer. Since 2009, he has served as a director on the board of advisors for the Carlson School of Management at the University of Minnesota, from which he holds a Bachelor of Science in Business degree. Mike also holds a Master of Business Administration from the Kellogg School of Management at Northwestern University.
Investor Information
We were reincorporated in Delaware in 1997 as the successor to a business existing, in various legal forms, since 1905. Our corporate office is located at 14701 Charlson Road, Eden Prairie, Minnesota, 55347-5088, and our telephone number is (952) 937-8500. Copies of our Annual Report on Form 10-K, Quarterly Reports on Form 10-Q, Proxy Statement, Current Reports on Form 8-K, and amendments to those reports filed or furnished pursuant to Section 13(a) or 15(d) of the Securities Exchange Act of 1934 are available free of charge through our website (www.chrobinson.com) as soon as reasonably practicable after we electronically file the material with the Securities and Exchange Commission. Information contained on our website is not part of this report.
Cautionary Statement Relevant to Forward-Looking Information
This Annual Report on Form 10-K, including our financial statements, Management’s Discussion and Analysis of Financial Condition and Results of Operations in Item 7 of Part II of this report, and other documents incorporated by reference, contain certain “forward-looking statements” within the meaning of Section 27A of the Securities Act of 1933, as amended, and Section 21E of the Securities Exchange Act of 1934, as amended. When used in this Form 10-K and in our other filings with the Securities and Exchange Commission, in our press releases, presentations to securities analysts or investors, in oral statements made by or with the approval of any of our executive officers, the words or phrases “believes,” “may,” “could,” “will,” “expects,” “should,” “continue,” “anticipates,” “intends,” “will likely result,” “estimates,” “projects,” or similar expressions and variations thereof are intended to identify such forward-looking statements.
Except for the historical information contained in this Form 10-K, the matters set forth in this document may be deemed to be forward-looking statements that represent our expectations, beliefs, intentions, or strategies concerning future events. These forward-looking statements are subject to certain risks and uncertainties that could cause actual results to differ materially from our historical experience or our present expectations, including, but not limited to, factors such as changes in economic conditions, including uncertain consumer demand; changes in market demand and pressures on the pricing for our services; fuel price increases or decreases, or fuel shortages; competition and growth rates within the global logistics industry; freight levels and increasing costs and availability of truck capacity or alternative means of transporting freight; risks associated with significant disruptions in the transportation industry; changes in relationships with existing contracted truck, rail, ocean, and air carriers; changes in our customer base due to possible consolidation among our customers; risks associated with reliance on technology to operate our business; cyber-security related risks; risks associated with operations outside of the U.S.; our ability to successfully integrate the operations of acquired companies with our historic operations; risks related to our search for a permanent CEO and retention of key management personnel; climate change related risks; risks associated with our indebtedness; risk associated with interest rates; risks associated with litigation, including contingent auto liability and insurance coverage; risks associated with the potential impact of changes in government regulations; risks associated with the changes to income tax regulations; risks associated with the produce industry, including food safety and contamination issues; the impact of war on the economy; changes to our capital structure; changes due to catastrophic events including pandemics such as COVID-19; and other risks and uncertainties, including those described in Item 1A, Risk Factors. Forward-looking statements speak only as of the date they are made. We undertake no obligation to update these statements in light of subsequent events or developments.
14
ITEM 1A. RISK FACTORS
The following are material factors that could affect our financial performance and could cause actual results for future periods to differ materially from our anticipated results or other expectations, including those expressed in any forward-looking statements made in this Annual Report on Form 10-K. We may also refer to this disclosure to identify factors that may cause actual results to differ from those expressed in other forward-looking statements, including those made in oral presentations such as telephone conferences and webcasts open to the public.
Business environment and competition risk factors
Economic recessions could have a significant, adverse impact on our business. The transportation industry historically has experienced cyclical fluctuations in financial results due to economic recessions, downturns in business cycles of our customers, interest rate fluctuations, currency fluctuations, and other economic factors beyond our control. Deterioration in the economic environment subjects our business to various risks, which may have a material and adverse impact on our operating results and cause us to not reach our long-term growth goals:
•Decrease in volumes: A reduction in overall freight volumes in the marketplace may reduce our opportunities for growth. A significant portion of our freight is comprised of transactional or spot market opportunities. The market may be impacted by supply chain disruptions or overall economic conditions. In addition, if a downturn in our customers’ business cycles causes a reduction in the volumes of freight shipped by those customers, particularly among certain national retailers or in the food, beverage, retail, manufacturing, housing, paper, ecommerce, or printing industries, our operating results could be adversely affected. During 2022 and continuing in 2023, we have experienced a decline in volumes as shippers struggle with elevated inventory levels and consumer demand has been negatively impacted by inflation and macroeconomic uncertainty. These volume declines have also driven declining freight rates in certain transportation modes and trade lanes.
•Credit risk and working capital: Some of our customers may face economic difficulties and may not be able to pay us, and some may go out of business. In addition, some customers may not pay us as quickly as they have in the past, which may cause our working capital needs to increase.
•Transportation provider failures: A significant number of our contracted transportation providers may go out of business and we may be unable to secure sufficient equipment or other transportation services to meet our commitments to our customers.
•Expense management: We may not be able to appropriately adjust our expenses to changing market demands. In order to maintain high variability in our business model, it is necessary to adjust staffing levels to changing market demands. In periods of rapid change, it may be more difficult to match our staffing levels to our business needs. In addition, we have other expenses that are fixed for a period of time, and we may not be able to adequately adjust them in a period of rapid change in market demand.
Higher carrier prices may result in decreased adjusted gross profit margin and increases in working capital. Carriers can be expected to charge higher prices if market conditions warrant or to cover higher operating expenses. Our adjusted gross profits and income from operations may decrease if we are unable to increase our pricing to our customers. Increased demand for over the road transportation services and changes in regulations may reduce available capacity and increase motor carrier pricing. In some instances where we have entered into contract freight rates with customers, in the event market conditions change and those contracted rates are below market rates, we may be required to provide transportation services at a loss. As our volumes increase or we increase freight rates charged to our customers, the resulting increase in revenues may increase our working capital needs due to our business model, which generally has a higher length of days sales outstanding than days payables outstanding.
Changing fuel costs and interruptions of fuel supplies may have an impact on our adjusted gross profit margin. In our truckload transportation business, fluctuating fuel prices may result in a decreased adjusted gross profit margin. While our different pricing arrangements with customers and contracted motor carriers make it very difficult to measure the precise impact, we believe that fuel costs essentially act as a pass-through cost to our truckload business. In times of fluctuating fuel prices, our adjusted gross profit margin may also fluctuate. Adjusted gross profit margin is a non-GAAP financial measure calculated as adjusted gross profits divided by total revenues. For additional information, see Item 7 of Part II, Management’s Discussion and Analysis of Financial Condition and Results of Operations.
15
Our dependence on third parties to provide equipment and services may impact the delivery and quality of our transportation and logistics services. We do not employ the people directly involved in delivering our customers’ freight. We depend on independent third parties to provide truck, rail, ocean, and air services and to report certain events to us, including but not limited to, shipment status information and freight claims. These independent third parties may not fulfill their obligations to us, or our relationship with these parties may change, which may prevent us from meeting our commitments to our customers. This reliance also could cause delays in reporting certain events, including recognizing claims. In addition, if we are unable to secure sufficient equipment or other transportation services from third parties to meet our commitments to our customers, our operating results could be materially and adversely affected, and our customers could switch to our competitors temporarily or permanently. Many of these risks are beyond our control, including:
•equipment and driver shortages in the transportation industry, particularly among contracted motor carriers;
•changes in regulations impacting transportation;
•disruption in the supply or cost of fuel;
•reduction or deterioration in rail service;
•the introduction of alternative means of transporting freight; and
•unanticipated changes in freight markets.
We face substantial industry competition. Competition in the transportation services industry is intense and broad-based. We compete against traditional and non-traditional logistics companies, including transportation providers that own equipment, third-party freight brokers, technology matching services, internet freight brokers, carriers offering logistics services, and on-demand transportation service providers. We also compete against carriers’ internal sales forces. In addition, customers can bring in-house some of the services we provide to them. We often buy and sell transportation services from and to many of our competitors. Increased competition could reduce our market opportunity and create downward pressure on freight rates, and continued rate pressure may adversely affect our adjusted gross profits and income from operations. In some instances where we have entered into contract freight rates with customers, in the event market conditions change and those contracted rates are below market rates, we may be required to provide transportation services at a loss.
Our sourcing business is dependent upon the supply and price of fresh produce. The supply and price of fresh produce is affected by weather and growing conditions, including but not limited to, flood, drought, freeze, insects, disease, and other conditions over which we have no control. Commodity prices can be affected by shortages or overproduction and are often highly volatile. If we are unable to secure fresh produce to meet our commitments to our customers, our operating results could be materially and adversely affected, and our customers could switch to our competitors temporarily or permanently. To assure access to certain commodities, we occasionally make monetary advances to growers to finance their operations. Repayment of these advances is dependent upon the growers’ ability to grow and harvest marketable crops.
Our earnings may be affected by seasonal changes or significant disruptions in the transportation industry. Results of operations for our industry generally show a seasonal pattern as customers reduce shipments during and after the winter holiday season. We believe this historical pattern has been the result of, or influenced by, numerous factors, including national holidays, weather patterns, consumer demand, economic conditions, and other similar and subtle forces. Although seasonal changes in the transportation industry have not had a significant impact on our cash flow or results of operations, we expect this trend to continue and we cannot guarantee that it will not adversely impact us in the future. The transportation industry may also be significantly impacted by disruptions such as port congestion and the availability of transportation equipment, as well as factors such as labor shortages, fuel prices, shifts in consumer demand toward more locally sourced products, and regulatory changes. These disruptions may impact the growth rates within the global logistics industry and our ability to provide transportation services for our customers, each of which may adversely impact our results of operations and operating cash flows.
We may be unable to identify or complete suitable acquisitions and investments. We may acquire or make investments in complementary businesses, products, services, or technologies. We cannot guarantee that we will be able to identify suitable acquisitions or investment candidates. Even if we identify suitable candidates, we cannot guarantee that we will make acquisitions or investments on commercially acceptable terms, if at all. The timing and number of acquisitions we pursue may also cause volatility in our financial results. In addition, we may incur debt or be required to issue equity securities to pay for future acquisitions or investments. The issuance of any equity securities could be dilutive to our stockholders.
16
Company risk factors
We rely on technology to operate our business. We have internally developed the majority of our operating systems and also rely on technology provided by third parties. Our continued success is dependent on our systems continuing to operate and to meet the changing needs of our customers and users. The continued automation of existing processes and usage of third-party technology and cloud network capacity will require adaptation and adjustments that may increase our exposure to cybersecurity risks and system availability reliance. We rely on our technology staff and third-party vendors to successfully implement changes to, and to maintain, our operating systems in an efficient manner. If we fail to maintain, protect, and enhance our operating systems, we may be at a competitive disadvantage and lose customers.
As demonstrated by recent material and high-profile data security breaches, computer malware, viruses, computer hacking, and phishing attacks have become more prevalent, have occurred on our operating systems in the past, and may occur on our operating systems in the future. Previous attacks on our operating systems have not had a material financial impact on our operations, but we cannot guarantee that future attacks will have little to no impact on our business. Furthermore, given the interconnected nature of the supply chain and our significant presence in the industry, we believe that we may be an attractive target for such attacks. The insurance coverage we currently have in place may not apply to a particular loss or it may not be sufficient to cover all liabilities to which we may be subject. A loss for which we are not adequately insured could materially affect our financial results.
Though it is difficult to determine what, if any, harm may directly result from any specific interruption or attack, a significant impact on the performance, reliability, security, and availability of our operating systems and technical infrastructure to the satisfaction of our users may harm our reputation, impair our ability to retain existing customers or attract new customers, and expose us to legal claims and government action, each of which could have a material adverse impact on our financial condition, results of operations, and growth prospects.
Our international operations subject us to operational and financial risks. We provide services within and between foreign countries on an increasing basis. Our business outside of the U.S. is subject to various risks, including:
•changes in tariffs, trade restrictions, trade agreements, and taxations;
•difficulties in managing or overseeing foreign operations and agents;
•limitations on the repatriation of funds because of foreign exchange controls;
•different liability standards;
•intellectual property laws of countries that do not protect our rights in our intellectual property, including but not limited to, our proprietary information systems, to the same extent as the laws of the U.S.; and
•issues related to non-compliance with laws, rules, and regulations in the countries in which we operate including the U.S. Foreign Corrupt Practices Act and similar regulations. Failure to comply could result in reputational harm, substantial penalties, and operational restrictions.
The occurrence or consequences of any of these factors may restrict our ability to operate in the affected region and/or decrease the profitability of our operations in that region.
As we continue to expand our business internationally, we expose the company to increased risk of loss from foreign currency fluctuations, as well as longer accounts receivable payment cycles. Foreign currency fluctuations could result in currency exchange gains or losses or could affect the book value of our assets and liabilities. Furthermore, we may experience unanticipated changes to our income tax liabilities resulting from changes in geographical income mix and changing international tax legislation. We have limited control over these risks, and if we do not correctly anticipate changes in international economic and political conditions, we may not alter our business practices in time to avoid adverse effects.
Our ability to appropriately staff and retain employees is important to our business model. Our continued success depends upon our ability to attract and retain motivated logistics professionals. In order to maintain high variability in our business model, it is necessary to adjust staffing levels to changing market demands. In periods of rapid change, it may be more difficult to match our staffing level to our business needs. We cannot guarantee that we will be able to continue to hire and retain a sufficient number of qualified personnel. In addition, macroeconomic factors impacting the labor market may result in higher costs to hire and retain qualified personnel. Because of our comprehensive employee training program, our employees are attractive targets for new and existing competitors. Continued success depends in large part on our ability to develop successful employees into managers.
17
We derive a significant portion of our total revenues and adjusted gross profits from our largest customers. During 2022, our top 100 customers based on total revenue comprised approximately 35 percent of our consolidated total revenues and our top 100 customers based on adjusted gross profits comprised approximately 29 percent of consolidated adjusted gross profit. Our largest customer comprised approximately two percent of our consolidated total revenues. The sudden loss of major customers could materially and adversely affect our operating results.
We may be subject to the negative impacts of climate change, which could adversely impact our business and financial results. The potential impacts of climate change may subject us to various risks, including:
•physical risks such as extreme weather conditions or other types of weather events, which could disrupt our operations;
•compliance costs and transition risks such as increased regulation on us and on our contracted transportation providers; and
•reputational and strategic risks due to shifts in customer demands such as customers requiring more fuel efficient transportation, autonomous transportation modes, or increased transparency to carbon emissions in their supply chains.
Such impacts may disrupt our operations by adversely affecting our ability to procure services that meet regulatory or customer requirements and may negatively affect our results of operations, cash flows and financial condition.
We may have difficulties integrating acquired companies. For acquisitions, success depends upon efficiently integrating the acquired business into our existing operations. If we complete a large acquisition or multiple acquisitions within a short period of time, we may experience heightened difficulties in integrating the acquired companies. We are required to integrate these businesses into our internal control environment, which may present challenges that are different than those presented by organic growth and that may be difficult to manage. If we are unable to successfully integrate and grow these acquisitions and to realize contemplated revenue synergies and cost savings, our business, prospects, results of operations, financial position, and cash flows could be materially and adversely affected.
Our growth and profitability may not continue, which may result in a decrease in our stock price. There can be no assurance that our long-term growth targets will be achieved or that we will be able to effectively adapt our management, administrative, and operational systems to respond to any future growth. Future changes in and expansion of our business, or changes in economic or political conditions, could adversely affect our operating margins. Slower or less profitable growth or losses could adversely affect our stock price.
We are in the process of searching for a new Chief Executive Officer and need to retain key management personnel.
Our Board of Directors is conducting a search for a new Chief Executive Officer. In January 2023, we announced that the Board of Directors was conducting a search for a successor for our Chief Executive Officer whose employment terminated January 1, 2023, and the Board appointed a member of the Board to serve as Interim Chief Executive Officer. We must successfully identify and integrate a new Chief Executive Officer to achieve our strategic and operating objectives, and the timeline for completing this process is currently unknown. Transitions in senior executive leadership can adversely affect relationships with our clients, suppliers, and employees; make it difficult to attract and retain talent; and pose challenges in planning for the future. We must also retain other key management personnel to facilitate a smooth transition. Failure to attract, retain and incentivize key management personnel could materially and adversely affect our operating results.
Our indebtedness could adversely impact our financial condition and results of operations. Significant adverse economic and industry conditions could negatively affect our ability to pay principal and interest on our debt and limit our ability to fund working capital, capital expenditures, possible acquisitions, dividends, share repurchases, or other investments. If we are unable to generate sufficient cash flows to satisfy our debt obligations or refinance these debt obligations with commercially acceptable terms, it may adversely impact our financial position and results of operations. We may be unable to comply with the various restrictions and covenants under our indebtedness, which may result in default and our outstanding indebtedness may become immediately due and payable and adversely impact our financial position.
We may be adversely impacted by changing interest rates. We are exposed to changes in interest rates, primarily on our short-term debt that carries floating interest rates. Interest rates are highly sensitive to many factors, including governmental monetary policies, economic conditions, and other factors beyond our control. A significant increase in interest rates could adversely impact our financial position and results of operations.
18
Governmental, regulatory, and legal risk factors
Changes to income tax regulations in the U.S. and other jurisdictions where we operate may increase our tax liability. We are subject to income taxes in the U.S. and other jurisdictions where we operate. Changes to income tax laws and regulations in any of the jurisdictions where we operate could significantly increase our effective tax rate and reduce our operating cash flows.
We are subject to claims arising from our transportation operations. We use the services of thousands of third party transportation companies in connection with our transportation operations. From time to time, the drivers employed and engaged by the motor carriers with which we contract are involved in accidents, which may result in serious personal injuries. The resulting types and/or amounts of damages may be excluded by or exceed the amount of insurance coverage maintained by the contracted motor carrier. We contractually require all motor carriers we work with to carry at least $750,000 in automobile liability insurance. We also require all contracted motor carriers to maintain workers compensation and other insurance coverage as required by law. Most contracted motor carriers have insurance exceeding these minimum requirements, as well as cargo insurance in varying policy amounts. Railroads, which are generally self-insured, provide limited common carrier cargo loss or damage liability protection, generally up to $250,000 per shipment. Although these drivers are not our employees and all of these drivers are employees, owner-operators, or independent contractors working for the contracted motor carriers, from time to time, claims may be asserted against us for their actions or for our actions in retaining them. Claims against us may exceed the amount of our insurance coverage or may not be covered by insurance at all. In addition, we are insured up to $2.5 million per incident within our automobile liability policy. A material increase in the frequency or severity of accidents, liability claims, workers’ compensation claims, or unfavorable resolutions of claims could materially and adversely affect our operating results. In addition, significant increases in insurance costs or the inability to purchase insurance as a result of these claims could reduce our profitability. Our involvement in the transportation of certain goods, including but not limited to, hazardous materials, could also increase our exposure in the event one of our contracted motor carriers is involved in an accident resulting in injuries or contamination.
In North America, as a property freight broker, we are not legally liable for loss or damage to our customers' cargo. In our customer contracts, we may agree to assume cargo liability up to a stated maximum. We typically do not assume cargo liability to our customers above minimum industry standards in our international freight forwarding, ocean transportation, or air freight businesses on international or domestic air shipments. Although we are not legally liable for loss or damage to our customers' cargo, from time to time, claims may be asserted against us for cargo losses. We maintain a broad cargo liability insurance policy to help protect us against catastrophic losses that may not be recovered from the responsible contracted carrier. We also carry various liability insurance policies, including automobile and general liability, with a $155 million umbrella where we carry retentions between $0.5 million and $7.5 million.
Buying and reselling fresh produce exposes us to possible product liability. Agricultural chemicals used on fresh produce are subject to various approvals, and the commodities themselves are subject to regulations on cleanliness and contamination. Product recalls in the produce industry have been caused by concern about particular chemicals and alleged contamination, often leading to lawsuits brought by consumers of allegedly affected produce. We may face claims for a variety of damages arising from the sale of produce, which may include potentially uninsured consequential damages. While we are insured for up to $155 million for product liability claims subject to a $500,000 per incident deductible, settlement of class action claims is often costly, and we cannot guarantee that our coverage will be adequate or that it will continue to be available. If we have to recall produce, we may be required to bear the cost of repurchasing, transporting, and destroying any allegedly contaminated product, as well as associated consequential damages. We carry product recall and contamination insurance coverage of $30 million. A loss for which we are not adequately insured could materially affect our financial results. The coverage we currently have in place may not apply to a particular loss, or it may not be sufficient to cover all liabilities to which we may be subject. This policy has a retention of $3.5 million per incident. Any recall or allegation of contamination could affect our reputation, particularly of our proprietary and/or licensed branded produce programs, which could materially and adversely affect our operating results. Loss due to spoilage (including the need for disposal) is also a routine part of the sourcing business.
Any material litigation related to the above types of claims or claims arising from our transportation operations may require significant management time and could cause us to incur substantial legal and related costs, which may include damages that could have a material adverse impact on our financial results.
Our business depends upon compliance with numerous government regulations. Our operations may be regulated and licensed by various federal, state, and local transportation agencies in the U.S. and similar governmental agencies in foreign countries in which we operate.
19
We are subject to licensing and regulation as a property freight broker and are licensed by the DOT to arrange for the transportation of property by motor vehicle. The DOT prescribes qualifications for acting in this capacity, including certain surety bonding requirements. For purposes of our Global Forwarding services, we are also subject to regulation by the FMC as an ocean freight forwarder and NVOCC, and we maintain separate bonds and licenses for each. We operate as a Department of Homeland Security certified IAC, providing air freight services, subject to commercial standards set forth by the IATA and federal regulations issued by the TSA. We provide customs brokerage services as a customs broker under a license issued by U.S. Customs and Border Protection and other authoritative governmental agencies. We also have and maintain other licenses as required by law.
We source fresh produce under a license issued by the USDA as required by PACA. We are also subject to various regulations and requirements promulgated by other international, domestic, state, and local agencies and port authorities. Our failure to comply with the laws and regulations applicable to entities holding these licenses could materially and adversely affect our results of operations or financial condition.
Legislative or regulatory changes can affect the economics of the transportation industry by requiring changes in operating practices or influencing the demand for, and the cost of providing, transportation services. As part of our logistics services, we operate owned or leased warehouse facilities. Our operations at these facilities include both warehousing and distribution services, and we are subject to various federal, state, and international environmental, work safety, and hazardous materials regulations. We may experience an increase in operating costs, such as security costs, as a result of governmental regulations that have been or will be adopted in response to terrorist activities and potential terrorist activities. No assurances can be given that we will be able to pass these increased costs on to our customers in the form of rate increases or surcharges, and our operations and profitability may be materially and adversely affected as a result.
Department of Homeland Security regulations applicable to our customers that import goods into the U.S. and our contracted ocean carriers can impact our ability to provide and/or receive services with and from these parties. Enforcement measures related to violations of these regulations can slow and/or prevent the delivery of shipments, which may negatively impact our operations.
We cannot predict the impact that future regulations may have on our business. Our failure to maintain required permits or licenses, or to comply with applicable regulations, could result in substantial fines or revocation of our operating permits and licenses.
Our contracted transportation providers are subject to increasingly stringent laws protecting the environment, including transitional risks relating to climate change, which could directly or indirectly have a material adverse effect on our business. Future and existing environmental regulatory requirements, including evolving transportation technology, in the U.S. and abroad could adversely affect operations and increase operating expenses, which in turn could increase our purchased transportation costs. We may also incur expenses as a result of regulators requiring additional climate-related disclosures regarding our contracted transportation providers that may be labor-intensive to report on. Until the timing, scope, and extent of such possible regulation becomes known, we cannot predict its effect on our company, but if we are unable to pass such costs along to our customers, our business could be materially and adversely affected. Even without any new legislation or regulation, increased public concern regarding greenhouse gas emissions by transportation carriers could harm the reputations of companies operating in the transportation logistics industries and shift consumer demand toward more locally sourced products and away from our services.
General risk factors
We are subject to negative impacts of changes in political and governmental conditions. Our operations are subject to the influences of significant political, governmental, and similar changes and our ability to respond to them, including:
•changes in political conditions and in governmental policies;
•changes in and compliance with international and domestic laws and regulations; and
•wars, civil unrest, acts of terrorism, and other conflicts.
20
We may be subject to negative impacts of catastrophic events. A disruption or failure of our systems or operations in the event of a major earthquake, weather event, cyber-attack, heightened security measures, actual or threatened terrorist attack, strike, civil unrest, pandemic, or other catastrophic event could cause delays in providing services or performing other critical functions. We are particularly vulnerable to these risks given the broad and global scope of our operations. A catastrophic event that results in the destruction or disruption of any of our critical business or information systems could harm our ability to conduct normal business operations and adversely impact our operating results.
In addition, the company is continuously monitoring the ongoing impact of the COVID-19 pandemic, which has already caused a significant disruption to global financial markets and supply chains and has resulted in numerous travel restrictions and the shutdown of certain businesses across the globe since its inception. Since the beginning of the pandemic we have experienced periods of significant changes including volatility in demand, declines in certain industries and regions, volatile pricing, and negative impacts to carrier capacity. The extent to which the ongoing COVID-19 pandemic impacts our operating results will depend on future developments, which remain highly uncertain and cannot be predicted, including new information that may emerge concerning the severity of outbreaks, the emergence of new COVID-19 variants, and the effectiveness of local, state, federal, and international actions that are being taken to contain and treat COVID-19. There continues to be uncertainty around the duration of the COVID-19 pandemic and its broader impact on the economy, and therefore, the effects it will have on our operations and financial results remain uncertain for 2023. If economic or market conditions in key global markets deteriorate, it may have a material adverse impact on our business and results of operations, and we may experience material adverse effects on our financial positions.
ITEM 1B. UNRESOLVED STAFF COMMENTS
None.
ITEM 2. PROPERTIES
Our corporate headquarters is in Eden Prairie, Minnesota. The total square footage of our four buildings, three of which we own, in Eden Prairie is 377,000. This total includes a data center of approximately 18,000 square feet.
We lease approximately 250 office locations in 38 countries across North America, Europe, Asia, South America, and Oceania. In 2022, we completed a ten-year sale-leaseback of a 201,000 square foot facility in Kansas City, Missouri. In 2018, we completed a fifteen-year lease of a 207,000 square foot facility in Chicago, Illinois. In addition, we lease warehouse space totaling approximately 4.7 million square feet in 26 locations primarily within the U.S. and a data center in Oronoco, Minnesota, of approximately 32,000 square feet.
Most of our offices and warehouses are leased from third parties under leases with initial terms ranging from one to fifteen years. Our office locations range in space from 1,000 to 207,000 square feet. Because we are a global enterprise characterized by substantial intersegment cooperation, properties are often used by multiple business segments.
We continue to optimize our real estate footprint across the network in consideration of expected staffing levels and flexible work arrangements. We consider our current office spaces and warehouse facilities adequate for our current level of operations. We have not had difficulty in obtaining sufficient office space and believe we can renew existing leases or relocate to new offices as leases expire if necessary.
ITEM 3. LEGAL PROCEEDINGS
We are not subject to any pending or threatened litigation other than routine litigation arising in the ordinary course of our business operations. For some legal proceedings, we have accrued an amount that reflects the aggregate liability deemed probable and estimable, but this amount is not material to our consolidated financial position, results of operations, or cash flows. Because of the preliminary nature of many of these proceedings, the difficulty in ascertaining the applicable facts relating to many of these proceedings, the inconsistent treatment of claims made in many of these proceedings, and the difficulty of predicting the settlement value of many of these proceedings, we are not able to estimate an amount or range of any reasonably possible losses. However, based upon our historical experience, the resolution of these proceedings is not expected to have a material adverse effect on our consolidated financial position, results of operations, or cash flows.
ITEM 4. MINE SAFETY DISCLOSURES
Not applicable.
21
PART II
ITEM 5. MARKET FOR REGISTRANT’S COMMON EQUITY, RELATED STOCKHOLDER MATTERS, AND ISSUER PURCHASES OF EQUITY SECURITIES
Our common stock began trading on The Nasdaq National Market on October 15, 1997, and currently trades on the Nasdaq Global Select Market under the symbol “CHRW”.
On February 15, 2023, the closing sales price per share of our common stock as quoted on the Nasdaq Global Select Market was $105.18 per share. On February 10, 2023, there were 129 holders of record. On February 9, 2023, there were 183,730 beneficial owners of our common stock.
Our declaration of dividends is subject to the discretion of the Board of Directors. Any determination as to the payment of dividends will depend upon our results of operations, capital requirements and financial condition, and such other factors as the Board of Directors may deem relevant. Accordingly, there can be no assurance that the Board of Directors will declare or continue to pay dividends on the shares of common stock in the future.
The following table provides information about company purchases of common stock during the quarter ended December 31, 2022:
Total Number of Shares Purchased (1) | Average Price Paid Per Share | Total Number of Shares Purchased as Part of Publicly Announced Plans or Programs | Maximum Number of Shares That May Yet Be Purchased Under the Plans or Programs (2) | ||||||||||||||||||||
| October 2022 | 2,673,287 | $ | 95.94 | 2,665,000 | 9,089,110 | ||||||||||||||||||
| November 2022 | 1,572,887 | 93.55 | 1,564,812 | 7,524,298 | |||||||||||||||||||
| December 2022 | 117,903 | 94.48 | 115,100 | 7,409,198 | |||||||||||||||||||
| Fourth quarter 2022 | 4,364,077 | $ | 95.04 | 4,344,912 | 7,409,198 | ||||||||||||||||||
________________________________
(1)The total number of shares purchased includes: (i) 4,344,912 shares of common stock purchased under the authorization described below; and (ii) 19,165 shares of common stock surrendered to satisfy statutory tax withholding obligations under our stock incentive plans.
(2)On December 9, 2021, the Board of Directors increased the company’s share repurchase authorization by an additional 20,000,000 shares of common stock. As of December 31, 2022, there were 7,409,198 shares remaining for future repurchases. Repurchases may be made from time to time at prevailing prices in the open market or in privately negotiated transactions, subject to market conditions and other factors including Rule 10b5-1 plans and accelerated repurchase programs.
22
The graph below compares the cumulative 5-year total return of holders of C.H. Robinson Worldwide, Inc.’s common stock with the cumulative total returns of the S&P 500 index and the Nasdaq Transportation index. The graph tracks the performance of a $100 investment in our common stock and in each index (with the reinvestment of all dividends) from December 31, 2017 to December 31, 2022.
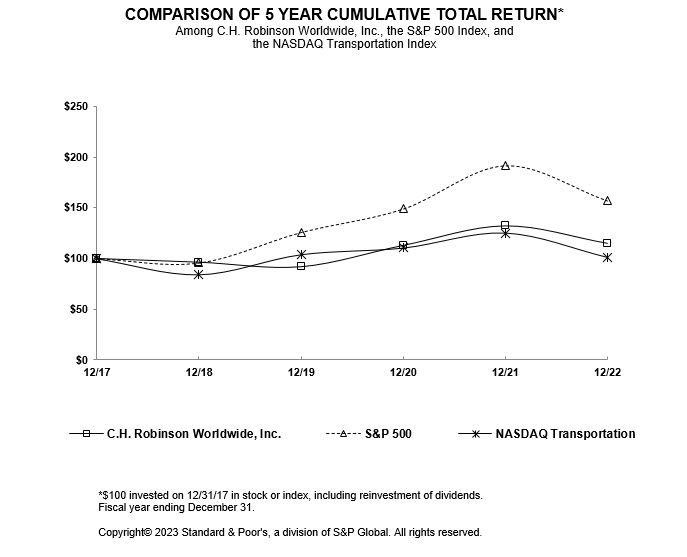
| December 31, | |||||||||||||||||||||||||||||||||||
| 2017 | 2018 | 2019 | 2020 | 2021 | 2022 | ||||||||||||||||||||||||||||||
C.H. Robinson Worldwide, Inc. | $ | 100.00 | $ | 96.39 | $ | 91.85 | $ | 112.99 | $ | 132.40 | $ | 115.06 | |||||||||||||||||||||||
S&P 500 | 100.00 | 95.62 | 125.72 | 148.85 | 191.58 | 156.89 | |||||||||||||||||||||||||||||
Nasdaq Transportation | 100.00 | 84.30 | 103.87 | 110.40 | 125.06 | 101.32 | |||||||||||||||||||||||||||||
The stock price performance included in this graph is not necessarily indicative of future stock price performance.
ITEM 6. RESERVED
23
ITEM 7. MANAGEMENT’S DISCUSSION AND ANALYSIS OF FINANCIAL CONDITION AND RESULTS OF OPERATIONS
OVERVIEW
C.H. Robinson Worldwide, Inc. (“C.H. Robinson,” “the company,” “we,” “us,” or “our”) is one of the largest global logistics companies in the world, with consolidated total revenues of $24.7 billion in 2022. We bring together customers, carriers, and suppliers to connect and grow supply chains. We are grounded in our customer promise to use our technology, which is built by and for supply chain experts and powered by our information advantage, to deliver smarter solutions. These global solutions, combined with the expertise of our people, deliver value–from improved cost reductions and reliability to sustainability and visibility–that our customers and carriers can rely on.
Our adjusted gross profits and adjusted gross profit margin are non-GAAP financial measures. Adjusted gross profits is calculated as gross profit excluding amortization of internally developed software utilized to directly serve our customers and contracted carriers. Adjusted gross profit margin is calculated as adjusted gross profits divided by total revenues. We believe adjusted gross profits and adjusted gross profit margin are useful measures of our ability to source, add value, and sell services and products that are provided by third parties, and we consider adjusted gross profits to be a primary performance measurement. Accordingly, the discussion of our results of operations often focuses on the changes in our adjusted gross profits and adjusted gross profit margin. The reconciliation of gross profit to adjusted gross profits and gross profit margin to adjusted gross profit margin is presented below (dollars in thousands):
| Twelve Months Ended December 31, | |||||||||||||||||||||||||||||||||||
| 2022 | 2021 | 2020 | |||||||||||||||||||||||||||||||||
| Revenues: | |||||||||||||||||||||||||||||||||||
| Transportation | $ | 23,516,384 | $ | 22,046,574 | $ | 15,147,562 | |||||||||||||||||||||||||||||
| Sourcing | 1,180,241 | 1,055,564 | 1,059,544 | ||||||||||||||||||||||||||||||||
| Total revenues | 24,696,625 | 23,102,138 | 16,207,106 | ||||||||||||||||||||||||||||||||
| Costs and expenses: | |||||||||||||||||||||||||||||||||||
| Purchased transportation and related services | 20,035,715 | 18,994,574 | 12,834,608 | ||||||||||||||||||||||||||||||||
| Purchased products sourced for resale | 1,067,733 | 955,475 | 960,241 | ||||||||||||||||||||||||||||||||
| Direct internally developed software amortization | 25,487 | 20,208 | 16,634 | ||||||||||||||||||||||||||||||||
| Total direct costs | 21,128,935 | 19,970,257 | 13,811,483 | ||||||||||||||||||||||||||||||||
| Gross profit / Gross profit margin | 3,567,690 | 14.4 | % | 3,131,881 | 13.6 | % | 2,395,623 | 14.8 | % | ||||||||||||||||||||||||||
| Plus: Direct internally developed software amortization | 25,487 | 20,208 | 16,634 | ||||||||||||||||||||||||||||||||
| Adjusted gross profits / Adjusted gross profit margin | $ | 3,593,177 | 14.5 | % | $ | 3,152,089 | 13.6 | % | $ | 2,412,257 | 14.9 | % | |||||||||||||||||||||||
Our adjusted operating margin is a non-GAAP financial measure calculated as operating income divided by adjusted gross profit. We believe adjusted operating margin is a useful measure of our profitability in comparison to our adjusted gross profit, which we consider a primary performance metric as discussed above. The reconciliation of operating margin to adjusted operating margin is presented below (dollars in thousands):
| Twelve Months Ended December 31, | ||||||||||||||||||||
| 2022 | 2021 | 2020 | ||||||||||||||||||
| Total revenues | $ | 24,696,625 | $ | 23,102,138 | $ | 16,207,106 | ||||||||||||||
| Operating income | 1,266,782 | 1,082,108 | 673,268 | |||||||||||||||||
| Operating margin | 5.1 | % | 4.7 | % | 4.2 | % | ||||||||||||||
| Adjusted gross profit | $ | 3,593,177 | $ | 3,152,089 | $ | 2,412,257 | ||||||||||||||
| Operating income | 1,266,782 | 1,082,108 | 673,268 | |||||||||||||||||
| Adjusted operating margin | 35.3 | % | 34.3 | % | 27.9 | % | ||||||||||||||
24
MARKET TRENDS
The cost of purchased transportation in the North American surface transportation market declined significantly over the course of 2022 as excess carrier capacity combined with slowing demand led to softening market conditions. This compared to extremely tight market conditions in 2021 as strong demand combined with challenges due to driver availability and supply chain disruptions drove purchased transportation costs to historic levels. Many of these challenges improved over the course of 2022, allowing routing guides to perform more efficiently, which resulted in a comparatively soft market versus 2021. Industry freight volumes, as measured by the Cass Freight Index, were flat in 2022, compared to a 13 percent increase in 2021. One of the metrics we use to measure market conditions is the truckload routing guide depth from our Managed Services business. Routing guide depth represents the average number of carriers contacted prior to acceptance when procuring a transportation provider. The average routing guide depth at the end of 2022 declined to 1.2, representing that on average, the first carrier in a shipper's routing guide was executing the shipment in most cases. This average routing guide penetration is reflective of a softening freight market compared to the 1.7 average at the end of 2021.
The cost of purchased transportation fell significantly in the global forwarding market in the second half of 2022 as global demand slowed in most trade lanes. The peak shipping season historically experienced in the second half of each year, which would typically drive elevated rates and volumes, remained uncharacteristically soft. Shippers in the U.S. and Europe continue to struggle with elevated inventory levels as consumer demand has been negatively impacted by inflation and macroeconomic uncertainty. In an effort to adapt to this slowing demand, steamship lines continue to rationalize services by reducing capacity where possible with blank sailings and slow steaming. All of these factors have allowed port congestion to ease in many parts of the world. As with the North American surface transportation market, this compared to extremely tight market conditions in 2021 as strong demand combined with supply chain disruptions caused by port congestion along with equipment and labor shortages drove purchased transportation to historic levels in 2021 and the first half of 2022. The slowdown of global demand has also had a significant impact on the air freight market. Air freight pricing and volumes have significantly declined driven by shippers maintaining higher inventory levels, declining consumer demand, and improving ocean schedule reliability eliminating ocean freight to air freight conversions. Air freight capacity continues to improve and drive rates lower in many trade lanes due to increased belly capacity as commercial flights become more frequent after being significantly reduced during the COVID-19 pandemic.
BUSINESS TRENDS
Our 2022 surface transportation results benefited from the declining cost of purchased transportation over the course of the year, as periods where the cost of purchased transportation declines often result in improved adjusted gross profits per shipment in our portfolio. Industry freight volumes as measured by the Cass Freight Index were flat in 2022 compared to the prior year. Our combined NAST truckload and less than truckload (“LTL”) volume decreased 1.0 percent in 2022 compared to the prior year. As a result of the softening market conditions, our contractual rates negotiated in prior quarters contributed to an increase in our adjusted gross profit per shipment and reduced the percentage of shipments with negative adjusted gross profit margins. Our average truckload linehaul cost per mile, excluding fuel surcharges, decreased approximately 7.5 percent during 2022. Our average truckload linehaul rate charged to our customers, excluding fuel surcharges, decreased approximately 4.0 percent during 2022.
Our 2022 Global Forwarding results were largely consistent with the trends discussed above in the market trends section. We experienced elevated purchased transportation costs and volume growth for ocean freight in the first half of 2022 and saw those purchased transportation costs and volumes rapidly decline in the second half of 2022. Our total ocean freight volumes decreased 0.5 percent for the full year of 2022. Air freight tonnage decreased 9.0 percent as we experienced more customers willing to accept longer transit times in the ocean freight market, which was also aided by the improved schedule reliability for ocean freight.
25
SELECTED OPERATING PERFORMANCE AND OTHER SIGNIFICANT ITEMS
The following summarizes select 2022 year-over-year operating comparisons to 2021:
•Total revenues increased 6.9 percent to $24.7 billion, driven primarily by higher pricing in truckload, LTL, and ocean services.
•Gross profits increased 13.9 percent to $3.6 billion. Adjusted gross profits increased 14.0 percent to $3.6 billion, primarily driven by higher adjusted gross profit per transaction in truckload and LTL services.
•Personnel expenses increased 11.6 percent to $1.7 billion, primarily due to 11.7 percent increase in average employee headcount.
•Selling, general, and administrative (“SG&A”) expenses increased 14.6 percent to $603.4 million, primarily due to increases in purchased and contracted services, legal settlements, travel expenses, and an impairment of internally developed software, partially offset by a $25.3 million gain on the sale-leaseback of our Kansas City regional center and a decrease in credit losses.
•Income from operations totaled $1.3 billion, up 17.1 percent from last year, primarily due to an increase in adjusted gross profits, partially offset by the increase in operating expenses. Adjusted operating margin of 35.3 percent increased 100 basis points.
•Interest and other expenses, net totaled $100.0 million, which primarily consisted of $77.1 million of interest expense, which increased $25.0 million versus last year due to a higher average debt balance. The current year also included a $23.5 million unfavorable impact from foreign currency revaluation and realized foreign currency gains and losses, which increased $8.4 million versus last year primarily due to foreign currency revaluation on intercompany assets and liabilities denominated in U.S. Dollars in countries where the U.S. Dollar is not the functional currency.
•The effective tax rate for 2022 was 19.4 percent compared to 17.4 percent in 2021. The lower rate in the year-ago period was due primarily to a favorable mix of foreign earnings and an increased benefit related to U.S. tax credits and incentives.
•Net income totaled $940.5 million, up 11.4 percent from a year ago. Diluted earnings per share increased 17.3 percent to $7.40.
•Cash flow from operations increased significantly to $1.7 billion.
26
CONSOLIDATED RESULTS OF OPERATIONS
The following table summarizes our results of operations (dollars in thousands, except per share data):
| Twelve Months Ended December 31, | ||||||||||||||||||||||||||||||||
| 2022 | 2021 | % change | 2020 | % change | ||||||||||||||||||||||||||||
| Revenues: | ||||||||||||||||||||||||||||||||
| Transportation | $ | 23,516,384 | $ | 22,046,574 | 6.7 | % | $ | 15,147,562 | 45.5 | % | ||||||||||||||||||||||
| Sourcing | 1,180,241 | 1,055,564 | 11.8 | % | 1,059,544 | (0.4) | % | |||||||||||||||||||||||||
Total revenues | 24,696,625 | 23,102,138 | 6.9 | % | 16,207,106 | 42.5 | % | |||||||||||||||||||||||||
| Costs and expenses: | ||||||||||||||||||||||||||||||||
| Purchased transportation and related services | $ | 20,035,715 | $ | 18,994,574 | 5.5 | % | $ | 12,834,608 | 48.0 | % | ||||||||||||||||||||||
| Purchased products sourced for resale | 1,067,733 | 955,475 | 11.7 | % | 960,241 | (0.5) | % | |||||||||||||||||||||||||
| Personnel expenses | 1,722,980 | 1,543,610 | 11.6 | % | 1,242,867 | 24.2 | % | |||||||||||||||||||||||||
| Other selling, general, and administrative expenses | 603,415 | 526,371 | 14.6 | % | 496,122 | 6.1 | % | |||||||||||||||||||||||||
Total costs and expenses | 23,429,843 | 22,020,030 | 6.4 | % | 15,533,838 | 41.8 | % | |||||||||||||||||||||||||
Income from operations | 1,266,782 | 1,082,108 | 17.1 | % | 673,268 | 60.7 | % | |||||||||||||||||||||||||
| Interest and other expense | (100,017) | (59,817) | 67.2 | % | (44,937) | 33.1 | % | |||||||||||||||||||||||||
Income before provision for income taxes | 1,166,765 | 1,022,291 | 14.1 | % | 628,331 | 62.7 | % | |||||||||||||||||||||||||
| Provision for income taxes | 226,241 | 178,046 | 27.1 | % | 121,910 | 46.0 | % | |||||||||||||||||||||||||
Net income | $ | 940,524 | $ | 844,245 | 11.4 | % | $ | 506,421 | 66.7 | % | ||||||||||||||||||||||
Diluted net income per share | $ | 7.40 | $ | 6.31 | 17.3 | % | $ | 3.72 | 69.6 | % | ||||||||||||||||||||||
Average employee headcount | 17,601 | 15,761 | 11.7 | % | 15,119 | 4.2 | % | |||||||||||||||||||||||||
Adjusted gross profit margin percentage(1) | ||||||||||||||||||||||||||||||||
| Transportation | 14.8% | 13.8% | 100 bps | 15.3% | (150 bps) | |||||||||||||||||||||||||||
| Sourcing | 9.5% | 9.5% | - bps | 9.4% | 10 bps | |||||||||||||||||||||||||||
| Total adjusted gross profit margin | 14.5% | 13.6% | 90 bps | 14.9% | (130 bps) | |||||||||||||||||||||||||||
________________________________
(1) Adjusted gross profit margin is a non-GAAP financial measure explained above.
The following discussion and analysis of our Results of Operations and Liquidity and Capital Resources includes a comparison of the twelve months ended December 31, 2022, to the twelve months ended December 31, 2021. A similar discussion and analysis that compares the twelve months ended December 31, 2021, to the twelve months ended December 31, 2020, can be found in Item 7, “Management's Discussion and Analysis of Financial Condition and Results of Operations,” of our 2021 Annual Report on Form 10-K filed with the SEC on February 23, 2022.
A reconciliation of our reportable segments to our consolidated results can be found in Note 9, Segment Reporting, in Part II, Financial Information of this Annual Report on Form 10-K.
Consolidated Results of Operations—Twelve Months Ended December 31, 2022 Compared to Twelve Months Ended December 31, 2021
Total revenues and direct costs. Total transportation revenues and direct costs increased driven by higher pricing and freight costs in nearly all service lines, most notably truckload, LTL, and ocean freight services. These increases were partially offset by volume declines in most of our service lines. The cost of purchased transportation remained historically elevated in the first half of 2022 as the industry continued to struggle with elevated inventory levels and supply chain disruptions due to port congestion and driver and equipment shortages. As global demand began to slow in the middle of 2022, the cost of purchased transportation began to decline, allowing port congestion and challenges due to driver and equipment shortages to ease. Our sourcing total revenue and direct costs increased, driven by higher pricing and cost per case across all customer industries.
27
Gross profits and adjusted gross profits. Our transportation adjusted gross profits increased due to increased pricing compared to the prior year across most of our services lines, most notably in our truckload and LTL services resulting in higher adjusted gross profits per transaction. Our surface transportation adjusted gross profit per transaction benefited from the declining cost of purchased transportation relative to our contractual rates negotiated in prior quarters. Sourcing adjusted gross profits increased driven by an increase in case volume across the retail and foodservice industries and higher adjusted gross profits per case across all customer industries.
Operating expenses. Personnel expenses increased primarily due to an increase in salaries and incentive compensation driven by an increase in average employee headcount. These increases were partially offset by a reduction in stock-based compensation expense as the prior year included significant stock-based compensation expense on performance-based equity awards granted prior to 2021. Other SG&A expenses increased primarily due to increases in purchased and contracted services, legal settlements, travel, and warehouse expenses. These increases were partially offset by a $23.5 million gain on the sale-leaseback of a facility in Kansas City and lower credit losses.
Operating expenses in 2022 also included the impact of organizational changes made to support our enterprise strategy of accelerating our digital transformation and productivity initiatives. In connection with these organizational changes, we recorded $21.5 million of personnel expense, primarily related to severance, and $15.2 million of other SG&A expenses, primarily due to the impairment of certain capitalized internally developed software projects as a result of these restructuring initiatives.
Interest and other income/expense, net. Interest and other expense of $100.0 million primarily consisted of $77.1 million of interest expense, which increased $25.0 million compared to the prior year due to a higher average debt balance. The current year also included a $23.5 million unfavorable impact of foreign currency revaluation and realized foreign currency gains and losses driven primarily by balances denominated in U.S. Dollars, including intercompany balances, in regions where the U.S. Dollar is not the functional currency. The prior year included a $15.1 million unfavorable impact of foreign currency revaluation and realized foreign currency gains and losses. These prior year expenses were partially offset by a $2.9 million local government subsidy in Asia for achieving specified performance criteria that was almost entirely offset by a reduction in foreign tax credits within the provision for income taxes.
Provision for income taxes. Our effective income tax rate was 19.4 percent in 2022 and 17.4 percent in 2021. The effective income tax rate for the twelve months ended December 31, 2022 was lower than the statutory federal income tax rate primarily due to the tax benefit from U.S. tax credits and incentives, foreign tax credits, and the tax impact of share-based payment awards. These impacts were partially offset by state income taxes, net of federal benefits. The effective income tax rate for the twelve months ended December 31, 2021, was lower than the statutory federal income tax rate primarily due to the tax benefit from U.S. tax credits and incentives, and a lower tax rate on foreign earnings. These impacts were partially offset by state income taxes, net of federal benefits.
28
NAST Segment Results of Operations
| Twelve Months Ended December 31, | |||||||||||||||||||||||||||||
| (dollars in thousands) | 2022 | 2021 | % change | 2020 | % change | ||||||||||||||||||||||||
| Total revenues | $ | 15,827,467 | $ | 14,507,917 | 9.1 | % | $ | 11,312,553 | 28.2 | % | |||||||||||||||||||
| Costs and expenses: | |||||||||||||||||||||||||||||
| Purchased transportation and related services | 13,630,763 | 12,714,964 | 7.2 | % | 9,795,462 | 29.8 | % | ||||||||||||||||||||||
| Personnel expenses | 844,472 | 779,435 | 8.3 | % | 624,358 | 24.8 | % | ||||||||||||||||||||||
| Other selling, general, and administrative expenses | 518,930 | 428,167 | 21.2 | % | 384,258 | 11.4 | % | ||||||||||||||||||||||
Total costs and expenses | 14,994,165 | 13,922,566 | 7.7 | % | 10,804,078 | 28.9 | % | ||||||||||||||||||||||
| Income from operations | $ | 833,302 | $ | 585,351 | 42.4 | % | $ | 508,475 | 15.1 | % | |||||||||||||||||||
| Twelve Months Ended December 31, | |||||||||||||||||||||||||||||
| 2022 | 2021 | % change | 2020 | % change | |||||||||||||||||||||||||
Average employee headcount | 7,365 | 6,764 | 8.9 | % | 6,811 | (0.7) | % | ||||||||||||||||||||||
| Service line volume statistics | |||||||||||||||||||||||||||||
| Truckload | 0.5 | % | 2.5 | % | |||||||||||||||||||||||||
| LTL | (2.0) | % | 8.0 | % | |||||||||||||||||||||||||
Adjusted gross profits(1) | |||||||||||||||||||||||||||||
| Truckload | $ | 1,463,363 | $ | 1,192,644 | 22.7 | % | $ | 981,420 | 21.5 | % | |||||||||||||||||||
| LTL | 626,744 | 517,500 | 21.1 | % | 452,033 | 14.5 | % | ||||||||||||||||||||||
| Other | 106,597 | 82,809 | 28.7 | % | 83,638 | (1.0) | % | ||||||||||||||||||||||
| Total adjusted gross profits | $ | 2,196,704 | $ | 1,792,953 | 22.5 | % | $ | 1,517,091 | 18.2 | % | |||||||||||||||||||
________________________________
(1) Adjusted gross profits is a non-GAAP financial measure explained above.
Twelve Months Ended December 31, 2022 Compared to Twelve Months Ended December 31, 2021
Total revenues and direct costs. NAST total revenues and direct costs increased driven by higher pricing and freight costs in truckload and LTL services in addition to an increase in volume in truckload services. The cost of purchased transportation started at historic levels in 2022 driven by the continuation of the strong demand that impacted much of 2021 combined with challenges related to driver availability, supply chain disruption, and weather events. Many of these challenges improved over the course of 2022 as demand slowed, which resulted in the cost of purchased transportation declining over the course of 2022.
Gross profits and adjusted gross profits. NAST adjusted gross profits increased due to higher adjusted gross profits per transaction. Our truckload services adjusted gross profit per transaction benefited from the declining cost of purchased transportation relative to our contractual rates negotiated in prior quarters. Our average truckload linehaul rate per mile charged to our customers decreased approximately 4.0 percent. Our truckload transportation costs, excluding fuel surcharges, decreased approximately 7.5 percent. NAST LTL adjusted gross profits increased due to increased adjusted gross profits per transaction. NAST other adjusted gross profits increased driven by increased warehousing services and an increase in intermodal adjusted gross profits.
Operating expenses. NAST personnel expense increased primarily due to an increase in salaries and incentive compensation driven by an increase in average employee headcount. These increases were partially offset by a reduction in stock-based compensation expense as the prior year included significant stock-based compensation expense on performance-based equity awards granted prior to 2021. NAST SG&A expenses increased driven by increased investments in technology, legal settlements, warehouse expenses, travel expenses, and increased expenditures for purchased and contracted services, including temporary labor. The operating expenses of NAST and all other segments include allocated corporate expenses. Allocated personnel expenses consist primarily of stock-based compensation allocated based upon segment participation levels in our equity plans. Remaining corporate allocations, including corporate functions and technology related expenses, are primarily included within each segment’s other SG&A expenses and allocated based upon relevant segment operating metrics.
NAST operating expenses in 2022 also included the impact of organizational changes made to support our enterprise strategy of accelerating our digital transformation and productivity initiatives. In connection with these organizational changes, we
29
recorded $6.3 million of personnel expense, primarily related to severance, and $3.2 million of other SG&A expenses, primarily due to the impairment of certain capitalized internally developed software projects as a result of these restructuring initiatives.
Global Forwarding Segment Results of Operations
| Twelve Months Ended December 31, | |||||||||||||||||||||||||||||
| (dollars in thousands) | 2022 | 2021 | % change | 2020 | % change | ||||||||||||||||||||||||
| Total revenues | $ | 6,812,008 | $ | 6,729,790 | 1.2 | % | $ | 3,100,525 | 117.1 | % | |||||||||||||||||||
| Costs and expenses: | |||||||||||||||||||||||||||||
| Purchased transportation and related services | 5,728,535 | 5,656,249 | 1.3 | % | 2,471,537 | 128.9 | % | ||||||||||||||||||||||
| Personnel expenses | 414,690 | 368,563 | 12.5 | % | 281,048 | 31.1 | % | ||||||||||||||||||||||
| Other selling, general, and administrative expenses | 219,419 | 194,222 | 13.0 | % | 172,427 | 12.6 | % | ||||||||||||||||||||||
Total costs and expenses | 6,362,644 | 6,219,034 | 2.3 | % | 2,925,012 | 112.6 | % | ||||||||||||||||||||||
| Income from operations | $ | 449,364 | $ | 510,756 | (12.0) | % | $ | 175,513 | 191.0 | % | |||||||||||||||||||
| Twelve Months Ended December 31, | |||||||||||||||||||||||||||||
| 2022 | 2021 | % change | 2020 | % change | |||||||||||||||||||||||||
Average employee headcount | 5,712 | 5,071 | 12.6 | % | 4,708 | 7.7 | % | ||||||||||||||||||||||
| Service line volume statistics | |||||||||||||||||||||||||||||
| Ocean | (0.5) | % | 17.0 | % | |||||||||||||||||||||||||
| Air | (9.0) | % | 45.5 | % | |||||||||||||||||||||||||
| Customs | 3.5 | % | 13.5 | % | |||||||||||||||||||||||||
Adjusted gross profits(1) | |||||||||||||||||||||||||||||
| Ocean | $ | 729,453 | $ | 710,845 | 2.6 | % | $ | 349,868 | 103.2 | % | |||||||||||||||||||
| Air | 195,191 | 221,906 | (12.0) | % | 146,056 | 51.9 | % | ||||||||||||||||||||||
| Customs | 107,691 | 100,540 | 7.1 | % | 87,092 | 15.4 | % | ||||||||||||||||||||||
| Other | 51,138 | 40,250 | 27.1 | % | 45,972 | (12.4) | % | ||||||||||||||||||||||
| Total adjusted gross profits | $ | 1,083,473 | $ | 1,073,541 | 0.9 | % | $ | 628,988 | 70.7 | % | |||||||||||||||||||
________________________________
(1)Adjusted gross profits is a non-GAAP financial measure explained above.
Twelve Months Ended December 31, 2022 Compared to Twelve Months Ended December 31, 2021
Total revenues and direct costs. Total revenues and direct costs increased due to higher pricing and purchased transportation costs in ocean services, partially offset by lower pricing in air freight services, in addition to volume decreases in both ocean and air freight services. Similar to surface transportation, the cost of purchased transportation started at historic levels in 2022 driven by the continuation of the strong demand that impacted much of 2021. This was combined with supply chain disruptions caused by port congestion as well as equipment and labor shortages. As global demand slowed in most trade lanes in the second half of 2022, many of these challenges improved, which resulted in a rapid decline in purchased transportation costs and pricing.
Gross profits and adjusted gross profits. Ocean freight adjusted gross profits increased, driven by higher pricing and resulting in higher adjusted gross profits per transaction in the first half of 2022. These higher adjusted gross profits were largely offset by declining shipments in the second half of 2022, as discussed in the market trends and business trends sections above. Air freight adjusted gross profits decreased, driven by pricing and volumes significantly declining over the course of 2022 as shippers struggled with elevated inventory levels, consumer demand declined, and improving ocean schedule reliability eliminated ocean freight to air freight conversions. Customs adjusted gross profits increased driven by an increase in transaction volumes.
Operating expenses. Personnel expenses increased primarily due to an increase in salaries driven by an increase in average employee headcount. These increases were partially offset by a reduction in stock-based compensation expense as the prior year included significant stock-based compensation expense on performance-based equity awards granted prior to 2021. SG&A expenses increased driven by increased investments in technology, partially offset by lower credit losses.
30
Global Forwarding operating expenses in 2022 also included the impact of organizational changes made to support our enterprise strategy of accelerating our digital transformation and productivity initiatives. In connection with these organizational changes, we recorded $3.8 million of personnel expense, primarily related to severance, and $3.2 million of other SG&A expenses, primarily due to the impairment of certain capitalized internally developed software projects as a result of these restructuring initiatives.
All Other and Corporate Segment Results of Operations
All Other and Corporate includes our Robinson Fresh and Managed Services segment, as well as Other Surface Transportation outside of North America and other miscellaneous revenues and unallocated corporate expenses.
| Twelve Months Ended December 31, | |||||||||||||||||||||||||||||
| (dollars in thousands) | 2022 | 2021 | % change | 2020 | % change | ||||||||||||||||||||||||
| Total revenues | $ | 2,057,150 | $ | 1,864,431 | 10.3 | % | $ | 1,794,028 | 3.9 | % | |||||||||||||||||||
| Loss from operations | (15,884) | (13,999) | N/M | (10,720) | N/M | ||||||||||||||||||||||||
Adjusted gross profits(1) | |||||||||||||||||||||||||||||
| Robinson Fresh | 121,639 | 107,543 | 13.1 | % | 105,700 | 1.7 | % | ||||||||||||||||||||||
| Managed Services | 115,094 | 105,064 | 9.5 | % | 94,828 | 10.8 | % | ||||||||||||||||||||||
| Other Surface Transportation | 76,267 | 72,988 | 4.5 | % | 65,650 | 11.2 | % | ||||||||||||||||||||||
| Total adjusted gross profits | $ | 313,000 | $ | 285,595 | 9.6 | % | $ | 266,178 | 7.3 | % | |||||||||||||||||||
________________________________
(1) Adjusted gross profits is a non-GAAP financial measure explained above.
Twelve Months Ended December 31, 2022 Compared to Twelve Months Ended December 31, 2021
Total revenues and direct costs. Total revenues and direct costs increased driven by higher pricing and cost per case across all customer industries in Robinson Fresh. Other Surface Transportation total revenues and direct costs also increased, driven by higher truckload pricing in Europe.
Gross profits and adjusted gross profits. Robinson Fresh adjusted gross profits increased, driven by an increase in case volume across the retail and foodservice industries and higher adjusted gross profits per case across all customer industries. Managed Services adjusted gross profits increased, due to an increase in freight under management and growth in adjusted gross profit per transaction. Other Surface Transportation adjusted gross profits increased primarily due to higher European truckload adjusted gross profits per transaction, partially offset by a decline in Europe truckload volumes.
Operating expenses. The operating expenses for All Other and Corporate included the impact of organizational changes made to support our enterprise strategy of accelerating our digital transformation and productivity initiatives. In connection with these organizational changes, we recorded $11.4 million of personnel expense, primarily related to severance, and $8.8 million of other SG&A expenses, primarily due to the impairment of certain capitalized internally developed software projects as a result of these restructuring initiatives.
31
LIQUIDITY AND CAPITAL RESOURCES
We have historically generated substantial cash from operations, which has enabled us to fund our organic growth while paying cash dividends and repurchasing stock. In addition, we maintain the following debt facilities as described in Note 4, Financing Arrangements (dollars in thousands):
| Description | Carrying Value as of December 31, 2022 | Borrowing Capacity | Maturity | |||||||||||||||||
| Revolving credit facility | $ | — | $ | 1,000,000 | November 2027 | |||||||||||||||
| 364-day revolving credit facility | 379,000 | 500,000 | May 2023 | |||||||||||||||||
| Senior Notes, Series A | 175,000 | 175,000 | August 2023 | |||||||||||||||||
| Senior Notes, Series B | 150,000 | 150,000 | August 2028 | |||||||||||||||||
| Senior Notes, Series C | 175,000 | 175,000 | August 2033 | |||||||||||||||||
Receivables Securitization Facility(1) | 499,655 | 500,000 | November 2023 | |||||||||||||||||
Senior Notes (1) | 595,049 | 600,000 | April 2028 | |||||||||||||||||
| Total debt | $ | 1,973,704 | $ | 3,100,000 | ||||||||||||||||
________________________________
(1) Net of unamortized discounts and issuance costs.
We expect to use our current debt facilities and potentially other indebtedness incurred in the future to assist us in continuing to fund working capital, capital expenditures, possible acquisitions, dividends, share repurchases, or other investments.
Cash and cash equivalents totaled $217.5 million as of December 31, 2022, and $257.4 million as of December 31, 2021. Cash and cash equivalents held outside the U.S. totaled $204.7 million as of December 31, 2022, and $217.1 million as of December 31, 2021. Working capital decreased from $1.48 billion at December 31, 2021, to $266.4 million at December 31, 2022.
We prioritize our investments to grow our market share and expand globally in key industries, trade lanes, and geographies, and to digitize our customer, carrier, and internal tools to support our organic growth. We are continually looking for acquisitions, but those acquisitions must fit our culture and enhance our growth opportunities.
The following table summarizes our major sources and uses of cash and cash equivalents (dollars in thousands):
| Twelve months ended December 31, | 2022 | 2021 | % change | 2020 | % change | ||||||||||||||||||||||||
| Sources (uses) of cash: | |||||||||||||||||||||||||||||
| Cash provided by operating activities | $ | 1,650,171 | $ | 94,955 | 1,637.8 | % | $ | 499,191 | (81.0) | % | |||||||||||||||||||
| Capital expenditures | (128,497) | (70,922) | (54,009) | ||||||||||||||||||||||||||
| Acquisitions, net of cash acquired | — | (14,750) | (223,230) | ||||||||||||||||||||||||||
| Sale of property and equipment | 63,579 | — | 5,525 | ||||||||||||||||||||||||||
| Cash used for investing activities | (64,918) | (85,672) | (24.2) | % | (271,714) | (68.5) | % | ||||||||||||||||||||||
| Repurchase of common stock | (1,459,900) | (581,756) | (177,514) | ||||||||||||||||||||||||||
| Cash dividends | (285,317) | (277,321) | (209,956) | ||||||||||||||||||||||||||
| Net borrowings (repayments) on debt | 54,000 | 822,701 | (143,000) | ||||||||||||||||||||||||||
| Other financing activities | 71,671 | 43,949 | 89,803 | ||||||||||||||||||||||||||
| Net cash (used for) provided by financing activities | (1,619,546) | 7,573 | NM | (440,667) | NM | ||||||||||||||||||||||||
| Effect of exchange rates on cash and cash equivalents | (5,638) | (3,239) | 9,128 | ||||||||||||||||||||||||||
| Net change in cash and cash equivalents | $ | (39,931) | $ | 13,617 | $ | (204,062) | |||||||||||||||||||||||
32
Cash flow from operating activities. The significant increase in cash flow from operating activities in 2022 from 2021 was due to a decrease in operating working capital. The improvement in 2022 from 2021 was primarily due to a $650 million sequential decrease in operating working capital, which represents accounts receivable and contract assets less total accounts payable and accrued transportation expense. The decrease in operating working capital was driven by the decline in the cost of purchased transportation and the related decline in freight rates near the end of 2022. Conversely, 2021 included a $200 million sequential increase in operating working capital as the cost of purchased transportation and freight rates were rising near the end of 2021. The increase in operating working capital near the end of 2021 was also impacted by a change in business mix from the significant growth of our Global Forwarding business where our days sales outstanding ratio is approximately double that of our NAST business.
Cash used for investing activities. Our investing activities consist primarily of capital expenditures and cash paid for acquisitions. Capital expenditures consisted primarily of investments in software, which are intended to deliver scalable solutions to improve our customer and carrier experience and increase our efficiency to help expand our adjusted operating margins and grow the business.
During 2022, we sold an office building in Kansas City, Missouri, for a sales price of $55.0 million and recognized a gain of $23.5 million on the sale in the twelve months ended December 31, 2022. We simultaneously entered into an agreement to lease the office building for 10 years.
In 2021, we used $14.7 million for the acquisition of Combinex. In 2020, we used $222.7 million for the acquisition of Prime.
We anticipate capital expenditures in 2023 to be approximately $90 million to $100 million.
Cash used for financing activities. We had net borrowings on debt in 2022 and 2021 and net repayments in 2020. Net borrowings in 2022 were primarily to fund share repurchases and working capital needs in the first half of 2022. The increase in cash used for share repurchases was due to an increase in the number of shares repurchased and a higher average price per share during 2022.
Net borrowings in 2021 were primarily to provide cash for operations, as our working capital needs increased throughout 2021 as mentioned above.
The net repayments in 2020 were primarily to reduce the outstanding balance on the Receivables Securitization Facility.
In December 2021, the Board of Directors increased the number of shares authorized to be repurchased by 20,000,000 shares. As of December 31, 2022, there were 7,409,198 shares remaining for future repurchases. The number of shares we repurchase, if any, during future periods will vary based on our cash position, potential alternative uses of our cash, and market conditions. Over the long term, we remain committed to our quarterly dividend and share repurchases to enhance shareholder value. Such repurchases, if any, will depend on prevailing market conditions, our liquidity requirements, contractual restrictions, and other factors. We may seek to retire or purchase our outstanding Senior Notes through open market cash purchases, privately negotiated transactions, or otherwise.
We believe that, assuming no change in our current business plan, our available cash, together with expected future cash generated from operations, the amount available under our credit facilities, and credit available in the market, will be sufficient to satisfy our anticipated needs for working capital, capital expenditures, and cash dividends for at least the next 12 months and the foreseeable future thereafter. We also believe we could obtain funds under lines of credit or other forms of indebtedness on short notice, if needed.
As of December 31, 2022, we were in compliance with all of the covenants under our debt agreements.
CRITICAL ACCOUNTING POLICIES AND ESTIMATES
Our consolidated financial statements and accompanying notes are prepared in accordance with accounting principles generally accepted in the U.S. (“U.S. GAAP”). The preparation of the consolidated financial statements requires management to make estimates and assumptions that affect the reported amounts of assets, liabilities, revenue, expenses, and the related disclosures. Because future events and their effects cannot be determined with certainty, actual results could differ from our assumptions and estimates, and such differences could be material.
Our significant accounting policies are discussed in Note 1, Summary of Significant Accounting Policies, of the Notes to the Consolidated Financial Statements, included in Item 8, Financial Statements and Supplementary Data, of this Annual Report on Form 10-K. We consider the following items in our consolidated financial statements to require significant estimation or judgment.
33
REVENUE RECOGNITION. At contract inception, we assess the goods and services promised in our contracts with customers and identify our performance obligations to provide distinct goods and services to our customers. Our transportation and logistics service arrangements often require management to use judgment and make estimates that impact the amounts and timing of revenue recognition.
Transportation and Logistics Services - As a global logistics provider, our primary performance obligation under our customer contracts is to utilize our relationships with a wide variety of transportation companies to efficiently and cost-effectively transport our customers’ freight. Revenue is recognized for these performance obligations as they are satisfied over the contract term, which generally represents the transit period. The transit period can vary based upon the method of transport; generally, a number of days for over the road, rail, and air transportation, or several weeks in the case of an ocean shipment.
Recognizing revenue for contracts where the transit period is partially complete or completed and not yet invoiced at period end requires management to make judgments that affect the amounts and timing of revenue recognized at period end. As of December 31, 2022, we recorded revenue of $257.6 million for services we have provided while a shipment was still in-transit but for which we had not yet completed our performance obligation or had not yet invoiced our customer compared to $453.7 million at December 31, 2021. The amount of revenue recognized for contracts where the transit period was partially complete declined significantly at December 31, 2022 compared to December 31, 2021 driven by the macroeconomic and industry factors impacting the cost of purchased transportation, in addition to the supply chain disruptions that caused increased transit times near the end of 2021. See Item 7 of Part II, Management’s Discussion and Analysis of Financial Condition and Results of Operations, for further information.
We utilize our historical knowledge of shipping lanes and estimated transit times to determine the transit period in cases where our customers’ freight has not reached its intended destination. In addition, we analyze contract data for the first few days following the reporting date combined with our historical experience of trends related to partially completed contracts as of the reporting date to determine our right to consideration for the services we have provided where the transit period is partially complete or completed and not yet invoiced at period end. Differences in contract data for the first few days following the reporting date compared with our historical experience or disruptions such as weather events, port congestion, or other delays could cause the actual amount of revenue earned at period end to differ from these estimates.
Total revenues represent the total dollar value of revenue recognized from contracts with customers for the goods and services we provide. Substantially all of our revenue is attributable to contracts with our customers. Most transactions in our transportation and sourcing businesses are recorded at the gross amount we charge our customers for the service we provide and goods we sell. In these transactions, we are primarily responsible for fulfilling the promise to provide the specified good or service to our customer and we have discretion in establishing the price for the specified good or service. Additionally, in our sourcing business, in some cases we take inventory risk before the specified good has been transferred to our customer. Customs brokerage, managed services, freight forwarding, and sourcing managed procurement transactions are recorded at the net amount we charge our customers for the service we provide because many of the factors stated above are not present. See also Note 1, Summary of Significant Accounting Policies, for further information regarding our revenue recognition policies.
GOODWILL. Goodwill represents the excess of the cost of acquired businesses over the net of the fair value of identifiable tangible assets and identifiable intangible assets purchased and liabilities assumed.
Goodwill is tested for impairment annually on November 30, or more frequently if events or changes in circumstances indicate that the asset might be impaired. We first perform a qualitative assessment to determine whether it is more likely than not that the fair value of our reporting units is less than their respective carrying value (“Step Zero Analysis”). If the Step Zero Analysis indicates it is more likely than not that the fair value of our reporting units is less than their respective carrying value, an additional impairment assessment is performed (“Step One Analysis”).
When we perform a Step One Analysis, the fair value of each reporting unit is compared with the carrying amount of the reporting unit, including goodwill. If the carrying amount of a reporting unit exceeds its fair value, an impairment loss is recognized in an amount equal to that excess, limited to the total amount of goodwill allocated to that reporting unit.
In the Step One Analysis, the fair value of each reporting unit is determined using a discounted cash flow analysis and market approach. Projecting discounted future cash flows requires us to make significant estimates regarding future revenues and expenses, projected capital expenditures, changes in working capital, and the appropriate discount rate. Use of the market approach consists of comparisons to comparable publicly-traded companies that are similar in size and industry. Actual results may differ from those used in our valuations when a Step One Analysis is performed.
As part of our annual Step Zero Analysis performed in 2022, we determined that due to certain qualitative factors and the recent performance of our Europe Surface Transportation reporting unit, the more likely than not criteria had been met, and therefore a Step One Analysis was completed for this reporting unit. Our Step Zero Analysis did not indicate that the more likely than not
34
criteria was met for any other reporting units and therefore a Step One Analysis was not completed for those reporting units. As a result of our Step One Analysis for Europe Surface Transportation we determined that the fair value was greater than the reporting unit's respective carrying value. As such, the goodwill balance of Europe Surface Transportation was not impaired. No impairments have been recorded in any period presented in the financial statements.
INCOME TAX RESERVES. The calculation of our tax liabilities involves dealing with uncertainties in the application of complex tax regulations in a multitude of jurisdictions across our global operations. We establish reserves when, despite our belief that our tax return positions are fully supportable, we believe that certain positions are likely to be challenged and that we may or may not prevail in full or in part. Under U.S. GAAP, if we determine that a tax position, more likely than not, will be sustained upon audit based solely on the technical merits of the position, we recognize the benefit. We measure the benefit by determining the amount that is greater than 50 percent likely of being realized upon resolution. We presume that all tax positions will be examined by a taxing authority with full knowledge of all relevant information.
We regularly monitor our tax positions and tax liabilities. We reevaluate the technical merits of our tax positions and recognize an uncertain tax benefit, or derecognize a previously recorded tax benefit, when there is (i) a completion of a tax audit, (ii) effective settlement of an issue, (iii) litigation of the issue, including appeals, (iv) a change in applicable tax law including a tax case or legislative guidance, or (v) the expiration of the applicable statute of limitations. Significant judgment is required in accounting for tax reserves. Although we believe that we have adequately provided for liabilities resulting from tax assessments by taxing authorities, positions taken by these tax authorities could have a material impact on our effective tax rate, consolidated earnings, financial position and/or cash flows. Uncertain income tax positions are included in “Accrued income taxes” or “Noncurrent income taxes payable” in the consolidated balance sheet.
DISCLOSURES ABOUT CONTRACTUAL OBLIGATIONS AND COMMERCIAL CONTINGENCIES
The following table aggregates all contractual commitments and commercial obligations, due by period, that affect our financial condition and liquidity position as of December 31, 2022 (dollars in thousands):
| 2023 | 2024 | 2025 | 2026 | 2027 | Thereafter | Total | |||||||||||||||||||||||||||||||||||
| Borrowings under credit agreements | $ | 878,655 | $ | — | $ | — | $ | — | $ | — | $ | — | $ | 878,655 | |||||||||||||||||||||||||||
Senior notes(1) | 25,200 | 25,200 | 25,200 | 25,200 | 25,200 | 607,350 | 733,350 | ||||||||||||||||||||||||||||||||||
Long-term notes payable(1) | 196,388 | 14,440 | 14,440 | 14,440 | 14,440 | 379,690 | 633,838 | ||||||||||||||||||||||||||||||||||
Maturity of lease liabilities(2) | 85,930 | 77,868 | 64,308 | 53,098 | 42,757 | 113,678 | 437,639 | ||||||||||||||||||||||||||||||||||
Purchase obligations(3) | 167,484 | 44,799 | 6,252 | 3,906 | 1,251 | — | 223,692 | ||||||||||||||||||||||||||||||||||
| Total | $ | 1,353,657 | $ | 162,307 | $ | 110,200 | $ | 96,644 | $ | 83,648 | $ | 1,100,718 | $ | 2,907,174 | |||||||||||||||||||||||||||
________________________________
(1)Amounts payable relate to the semi-annual interest due on the senior and long-term notes and the principal amount at maturity.
(2) We maintain operating leases for office space, warehouses, office equipment, and a small number of intermodal containers. See Note 11, Leases, for further information.
(3) Purchase obligations include agreements for services that are enforceable and legally binding and that specify all significant terms. As of December 31, 2022, such obligations primarily include ocean and air freight capacity, telecommunications services, third-party software contracts, maintenance contracts, and information technology related capacity. In some instances our contractual commitments may be usage based or require estimates as to the timing of cash settlement.
We have no financing lease obligations. Long-term liabilities consist primarily of noncurrent taxes payable and long-term notes payable. Due to the uncertainty with respect to the amounts or timing of future cash flows associated with our unrecognized tax benefits as of December 31, 2022, we are unable to make reasonably reliable estimates of the period of cash settlement with the respective taxing authority. Therefore, $43.0 million of unrecognized tax benefits have been excluded from the contractual obligations table above. See Note 5, Income Taxes, to the consolidated financial statements for a discussion on income taxes. As of December 31, 2022, we do not have significant off-balance sheet arrangements as defined in Item 303(a)(4)(ii) of SEC Regulation S-K.
35
ITEM 7A. QUANTITATIVE AND QUALITATIVE DISCLOSURES ABOUT MARKET RISK
We had $217.5 million of cash and cash equivalents on December 31, 2022. Substantially all of the cash equivalents are in demand accounts with financial institutions. The primary market risks associated with these investments are liquidity risks.
We are a party to a credit agreement with various lenders consisting of a $1 billion revolving credit facility. Interest accrues on the revolving loan at a variable rate determined by a pricing schedule or the base rate (which is the highest of: (a) the administrative agent's prime rate, (b) the federal funds rate plus 0.50 percent, or (c) the sum of one-month SOFR plus a specified margin). There was no outstanding balance on the revolving loan as of December 31, 2022.
We are a party to a credit agreement with U.S. Bank consisting of $500 million and a maturity date of May 5, 2023. Interest accrues at an alternate base rate plus a margin or a term SOFR-based rate plus a margin of 0.625 percent to 1.25 percent. The alternate base rate is determined by a pricing schedule (which is the highest of: (a) 0 percent, (b) U.S. Bank’s prime rate, (c) the federal funds effective rate plus 0.50 percent, or (d) a term SOFR-based rate plus 1.00 percent). At December 31, 2022, there was $379 million outstanding on the revolving loan.
We are a party to the Note Purchase Agreement, as amended, with various institutional investors with fixed rates consisting of: (i) $175 million of the company’s 3.97 percent Senior Notes, Series A, due August 27, 2023, (ii) $150 million of the company’s 4.26 percent Senior Notes, Series B, due August 27, 2028, and (iii) $175 million of the company’s 4.6 percent Senior Notes, Series C, due August 27, 2033. There was $500 million outstanding on the notes as of December 31, 2022. The fair value of the notes approximated $468.7 million as of December 31, 2022.
We issued Senior Notes through a public offering on April 9, 2018. The Senior Notes bear an annual interest rate of 4.2 percent payable semi-annually on April 15 and October 15, until maturity on April 15, 2028. Taking into effect the amortization of the original issue discount and all underwriting and issuance expenses, the Senior Notes have an effective yield to maturity of approximately 4.39 percent per annum. The fair value of the Senior Notes, excluding debt discounts and issuance costs, approximated $569.5 million as of December 31, 2022, based primarily on the market prices quoted from external sources. The carrying value of the Senior Notes was $595.0 million as of December 31, 2022.
We are a party to a Receivables Securitization Facility with various lenders, that provides a total availability of up to $500 million. Interest accrues on the facility at variable rates based on Bloomberg Short Term Bank Yield Index (“BSBY”) plus a margin. There was $499.7 million outstanding, net of unamortized issuance costs, on the Receivables Securitization Facility as of December 31, 2022.
A hypothetical 100-basis-point change in the interest rate would not have a material effect on our earnings. We do not use derivative financial instruments to manage interest rate risk or to speculate on future changes in interest rates. A rise in interest rates could negatively affect the fair value of our debt facilities.
Foreign Exchange Risk
We frequently transact using currencies other than the U.S. Dollar, primarily the Chinese Yuan, Euro, Canadian Dollar, and Mexican Peso. We operate through a network of offices in North America, Europe, Asia, Oceania, and South America. Due to the global nature of our business, we use our expertise and global logistics platform to connect shippers with transportation providers that are in different parts of the world to efficiently and cost-effectively move our customers’ freight. This often results in a shipment involving multiple parties, currencies, and participating C.H. Robinson offices. This global cooperation often results in assets and liabilities, including intercompany balances, denominated in a currency other than the functional currency. In these instances, most commonly, we have balances denominated in U.S. Dollars in regions where the U.S. Dollar is not the functional currency, and vice versa. This results in foreign exchange risk.
Foreign exchange risk can be quantified by performing a sensitivity analysis assuming a hypothetical change in the value of the U.S. Dollar compared to other currencies in which we transact. Our primary foreign exchange risks are associated with balances denominated in U.S. Dollars held in China where the functional currency is the Chinese Yuan and balances denominated in Euro and Chinese Yuan held in entities where the functional currency is U.S. Dollars. All other things being equal, a hypothetical 10 percent weakening of the U.S. Dollar against these currencies on December 31, 2022 would have decreased our net income by approximately $20.4 million and a hypothetical 10 percent strengthening of the U.S. Dollar against these on December 31, 2022 would have increased our net income by approximately $16.2 million.
36
ITEM 8. FINANCIAL STATEMENTS AND SUPPLEMENTARY DATA
REPORT OF INDEPENDENT REGISTERED PUBLIC ACCOUNTING FIRM
To the Stockholders and the Board of Directors of C.H. Robinson Worldwide, Inc.
Opinion on the Financial Statements
We have audited the accompanying consolidated balance sheets of C.H. Robinson Worldwide, Inc. and subsidiaries (the “Company”) as of December 31, 2022 and 2021, the related consolidated statements of operations and comprehensive income, stockholders’ investment, and cash flows, for each of the three years in the period ended December 31, 2022, and the related notes (collectively referred to as the “financial statements”). In our opinion, the financial statements present fairly, in all material respects, the financial position of the Company as of December 31, 2022 and 2021, and the results of its operations and its cash flows for each of the three years in the period ended December 31, 2022, in conformity with accounting principles generally accepted in the United States of America.
We have also audited, in accordance with the standards of the Public Company Accounting Oversight Board (United States) (PCAOB), the Company's internal control over financial reporting as of December 31, 2022, based on criteria established in Internal Control — Integrated Framework (2013) issued by the Committee of Sponsoring Organizations of the Treadway Commission and our report dated February 17, 2023, expressed an unqualified opinion on the Company's internal control over financial reporting.
Basis for Opinion
These financial statements are the responsibility of the Company's management. Our responsibility is to express an opinion on the Company's financial statements based on our audits. We are a public accounting firm registered with the PCAOB and are required to be independent with respect to the Company in accordance with the U.S. federal securities laws and the applicable rules and regulations of the Securities and Exchange Commission and the PCAOB.
We conducted our audits in accordance with the standards of the PCAOB. Those standards require that we plan and perform the audit to obtain reasonable assurance about whether the financial statements are free of material misstatement, whether due to error or fraud. Our audits included performing procedures to assess the risks of material misstatement of the financial statements, whether due to error or fraud, and performing procedures that respond to those risks. Such procedures included examining, on a test basis, evidence regarding the amounts and disclosures in the financial statements. Our audits also included evaluating the accounting principles used and significant estimates made by management, as well as evaluating the overall presentation of the financial statements. We believe that our audits provide a reasonable basis for our opinion.
Critical Audit Matter
The critical audit matter communicated below is a matter arising from the current-period audit of the financial statements that was communicated or required to be communicated to the audit committee and that (1) relates to accounts or disclosures that are material to the financial statements and (2) involved our especially challenging, subjective, or complex judgments. The communication of critical audit matters does not alter in any way our opinion on the financial statements, taken as a whole, and we are not, by communicating the critical audit matter below, providing a separate opinion on the critical audit matter or on the accounts or disclosures to which it relates.
Revenue Recognition — Refer to Notes 1 and 10 to the financial statements
Critical Audit Matter Description
Transportation and logistics revenue is recognized for performance obligations identified in the customer contract as they are satisfied over the contract term, which generally represents the transit period. Recognizing revenue at period end for contracts where the transit period is partially complete at period end or completed and not yet invoiced, requires management to make judgments that affect the amounts and timing of revenue recognized. At December 31, 2022, the Company recorded revenue of $257.6 million for services it provided while a shipment was still in-transit but for which it had not yet completed its performance obligation or had not yet invoiced the customer.
Auditing the estimate of the Company’s revenue recorded for contracts where the transit period is partially complete or completed and not yet invoiced as of the reporting date required a high degree of auditor judgment when performing audit procedures and evaluating the results of those procedures.
37
How the Critical Audit Matter Was Addressed in the Audit
Our audit procedures related to management’s estimate of the revenue recorded for contracts where the transit period is partially complete or completed and not yet invoiced as of the reporting date included the following, among others:
•We tested the effectiveness of controls over revenue recognized over time, including management’s controls over the identification of shipments in-transit, the portion of the transit period completed, and the estimate of contracts completed but not yet invoiced.
•We evaluated management’s ability to identify the shipments in-transit and to estimate the revenue to be recorded for contracts where the transit period is partially complete or completed and not yet invoiced at the reporting date by:
•Performing a retrospective review of management’s estimate for prior reporting periods.
•Testing the accuracy and completeness of the data in the system-generated report utilized in management’s revenue cutoff estimate with the assistance of our information technology specialists.
•Assessing the estimate methodology for reasonableness, in light of recent market events or changes within the Company’s operating environment.
•Testing the mathematical accuracy of management’s estimate.
/s/ DELOITTE & TOUCHE LLP
Minneapolis, Minnesota
February 17, 2023
We have served as the Company's auditor since 2002.
38
REPORT OF INDEPENDENT REGISTERED PUBLIC ACCOUNTING FIRM
To the Stockholders and the Board of Directors of C.H. Robinson Worldwide, Inc.
Opinion on Internal Control over Financial Reporting
We have audited the internal control over financial reporting of C.H. Robinson Worldwide, Inc. and subsidiaries (the “Company”) as of December 31, 2022, based on criteria established in Internal Control — Integrated Framework (2013) issued by the Committee of Sponsoring Organizations of the Treadway Commission (COSO). In our opinion, the Company maintained, in all material respects, effective internal control over financial reporting as of December 31, 2022, based on criteria established in Internal Control — Integrated Framework (2013) issued by COSO.
We have also audited, in accordance with the standards of the Public Company Accounting Oversight Board (United States) (PCAOB), the consolidated financial statements as of and for the year ended December 31, 2022, of the Company and our report dated February 17, 2023, expressed an unqualified opinion on those financial statements.
Basis for Opinion
The Company’s management is responsible for maintaining effective internal control over financial reporting and for its assessment of the effectiveness of internal control over financial reporting, included in the accompanying Management’s Report on Internal Control Over Financial Reporting. Our responsibility is to express an opinion on the Company’s internal control over financial reporting based on our audit. We are a public accounting firm registered with the PCAOB and are required to be independent with respect to the Company in accordance with the U.S. federal securities laws and the applicable rules and regulations of the Securities and Exchange Commission and the PCAOB.
We conducted our audit in accordance with the standards of the PCAOB. Those standards require that we plan and perform the audit to obtain reasonable assurance about whether effective internal control over financial reporting was maintained in all material respects. Our audit included obtaining an understanding of internal control over financial reporting, assessing the risk that a material weakness exists, testing and evaluating the design and operating effectiveness of internal control based on the assessed risk, and performing such other procedures as we considered necessary in the circumstances. We believe that our audit provides a reasonable basis for our opinion.
Definition and Limitations of Internal Control over Financial Reporting
A company’s internal control over financial reporting is a process designed to provide reasonable assurance regarding the reliability of financial reporting and the preparation of financial statements for external purposes in accordance with generally accepted accounting principles. A company’s internal control over financial reporting includes those policies and procedures that (1) pertain to the maintenance of records that, in reasonable detail, accurately and fairly reflect the transactions and dispositions of the assets of the company; (2) provide reasonable assurance that transactions are recorded as necessary to permit preparation of financial statements in accordance with generally accepted accounting principles, and that receipts and expenditures of the company are being made only in accordance with authorizations of management and directors of the company; and (3) provide reasonable assurance regarding prevention or timely detection of unauthorized acquisition, use, or disposition of the company’s assets that could have a material effect on the financial statements.
Because of its inherent limitations, internal control over financial reporting may not prevent or detect misstatements. Also, projections of any evaluation of effectiveness to future periods are subject to the risk that controls may become inadequate because of changes in conditions, or that the degree of compliance with the policies or procedures may deteriorate.
/s/ DELOITTE & TOUCHE LLP
Minneapolis, Minnesota
February 17, 2023
39
C.H. ROBINSON WORLDWIDE, INC.
CONSOLIDATED BALANCE SHEETS
(In thousands, except per share data)
| December 31, | |||||||||||
| 2022 | 2021 | ||||||||||
| ASSETS | |||||||||||
| Current assets: | |||||||||||
| Cash and cash equivalents | $ | $ | |||||||||
Receivables, net of allowance for credit loss of $ | |||||||||||
| Contract assets, net of allowance for credit loss | |||||||||||
| Prepaid expenses and other | |||||||||||
Total current assets | |||||||||||
| Property and equipment | |||||||||||
| Accumulated depreciation and amortization | ( | ( | |||||||||
| Net property and equipment | |||||||||||
| Goodwill | |||||||||||
Other intangible assets, net of accumulated amortization of $ | |||||||||||
| Right-of-use lease assets | |||||||||||
| Deferred tax assets | |||||||||||
| Other assets | |||||||||||
Total assets | $ | $ | |||||||||
| LIABILITIES AND STOCKHOLDERS’ INVESTMENT | |||||||||||
| Current liabilities: | |||||||||||
| Accounts payable | $ | $ | |||||||||
| Outstanding checks | |||||||||||
| Accrued expenses: | |||||||||||
| Compensation | |||||||||||
| Transportation expense | |||||||||||
| Income taxes | |||||||||||
| Other accrued liabilities | |||||||||||
| Current lease liabilities | |||||||||||
| Current portion of debt | |||||||||||
Total current liabilities | |||||||||||
| Long-term debt | |||||||||||
| Noncurrent lease liabilities | |||||||||||
| Noncurrent income taxes payable | |||||||||||
| Deferred tax liabilities | |||||||||||
| Other long-term liabilities | |||||||||||
Total liabilities | |||||||||||
| Commitments and contingencies | |||||||||||
| Stockholders’ investment: | |||||||||||
Preferred stock, $ | |||||||||||
Common stock, $ | |||||||||||
| Additional paid-in capital | |||||||||||
| Retained earnings | |||||||||||
| Accumulated other comprehensive loss | ( | ( | |||||||||
Treasury stock at cost ( | ( | ( | |||||||||
Total stockholders’ investment | |||||||||||
Total liabilities and stockholders’ investment | $ | $ | |||||||||
See accompanying notes to the consolidated financial statements.
40
C.H. ROBINSON WORLDWIDE, INC.
CONSOLIDATED STATEMENTS OF OPERATIONS AND COMPREHENSIVE INCOME
(In thousands, except per share data)
| For the years ended December 31, | |||||||||||||||||
| 2022 | 2021 | 2020 | |||||||||||||||
| Revenues: | |||||||||||||||||
| Transportation | $ | $ | $ | ||||||||||||||
| Sourcing | |||||||||||||||||
Total revenues | |||||||||||||||||
| Costs and expenses: | |||||||||||||||||
| Purchased transportation and related services | |||||||||||||||||
| Purchased products sourced for resale | |||||||||||||||||
| Personnel expenses | |||||||||||||||||
| Other selling, general, and administrative expenses | |||||||||||||||||
Total costs and expenses | |||||||||||||||||
| Income from operations | |||||||||||||||||
| Interest and other expenses | ( | ( | ( | ||||||||||||||
| Income before provision for income taxes | |||||||||||||||||
| Provision for income taxes | |||||||||||||||||
| Net income | |||||||||||||||||
| Other comprehensive (loss) income | ( | ( | |||||||||||||||
Comprehensive income | $ | $ | $ | ||||||||||||||
Basic net income per share | $ | $ | $ | ||||||||||||||
Diluted net income per share | $ | $ | $ | ||||||||||||||
Basic weighted average shares outstanding | |||||||||||||||||
Dilutive effect of outstanding stock awards | |||||||||||||||||
Diluted weighted average shares outstanding | |||||||||||||||||
See accompanying notes to the consolidated financial statements.
41
C.H. ROBINSON WORLDWIDE, INC.
CONSOLIDATED STATEMENTS OF STOCKHOLDERS’ INVESTMENT
(In thousands, except per share data)
| Common Shares Outstanding | Amount | Additional Paid-in Capital | Retained Earnings | Accumulated Other Comprehensive Loss | Treasury Stock | Total Stockholders’ Investment | |||||||||||||||||||||||||||||||||||
| Balance December 31, 2019 | $ | $ | $ | $ | ( | $ | ( | $ | |||||||||||||||||||||||||||||||||
| Net income | |||||||||||||||||||||||||||||||||||||||||
Foreign currency adjustments | |||||||||||||||||||||||||||||||||||||||||
Dividends declared, $ | ( | ( | |||||||||||||||||||||||||||||||||||||||
Stock issued for employee benefit plans | ( | ||||||||||||||||||||||||||||||||||||||||
| Issuance of restricted stock | ( | ||||||||||||||||||||||||||||||||||||||||
| Stock-based compensation expense | |||||||||||||||||||||||||||||||||||||||||
| Repurchase of common stock | ( | ( | ( | ( | |||||||||||||||||||||||||||||||||||||
| Balance December 31, 2020 | ( | ( | |||||||||||||||||||||||||||||||||||||||
| Net income | |||||||||||||||||||||||||||||||||||||||||
Foreign currency adjustments | ( | ( | |||||||||||||||||||||||||||||||||||||||
Dividends declared, $ | ( | ( | |||||||||||||||||||||||||||||||||||||||
| Stock issued for employee benefit plans | ( | ||||||||||||||||||||||||||||||||||||||||
| Issuance of restricted stock | ( | ( | |||||||||||||||||||||||||||||||||||||||
| Stock-based compensation expense | |||||||||||||||||||||||||||||||||||||||||
| Repurchase of common stock | ( | ( | ( | ( | |||||||||||||||||||||||||||||||||||||
| Balance December 31, 2021 | ( | ( | |||||||||||||||||||||||||||||||||||||||
| Net income | |||||||||||||||||||||||||||||||||||||||||
| Foreign currency adjustments | ( | ( | |||||||||||||||||||||||||||||||||||||||
Dividends declared, $ | ( | ( | |||||||||||||||||||||||||||||||||||||||
| Stock issued for employee benefit plans | ( | ||||||||||||||||||||||||||||||||||||||||
| Stock-based compensation expense | |||||||||||||||||||||||||||||||||||||||||
| Repurchase of common stock | ( | ( | ( | ( | |||||||||||||||||||||||||||||||||||||
| Balance, December 31, 2022 | $ | $ | $ | $ | ( | $ | ( | $ | |||||||||||||||||||||||||||||||||
See accompanying notes to the consolidated financial statements.
42
C.H. ROBINSON WORLDWIDE, INC.
CONSOLIDATED STATEMENTS OF CASH FLOWS
(In thousands)
| For the year ended December 31, | |||||||||||||||||
| 2022 | 2021 | 2020 | |||||||||||||||
| OPERATING ACTIVITIES | |||||||||||||||||
| Net income | $ | $ | $ | ||||||||||||||
| Adjustments to reconcile net income to net cash provided by operating activities: | |||||||||||||||||
| Depreciation and amortization | |||||||||||||||||
| Provision for credit losses | ( | ||||||||||||||||
| Stock-based compensation | |||||||||||||||||
| Deferred income taxes | ( | ( | ( | ||||||||||||||
| Excess tax benefit on stock-based compensation | ( | ( | ( | ||||||||||||||
| Other operating activities | ( | ||||||||||||||||
| Changes in operating elements, net of effects of acquisitions: | |||||||||||||||||
| Receivables | ( | ( | |||||||||||||||
| Contract assets | ( | ( | |||||||||||||||
| Prepaid expenses and other | ( | ( | |||||||||||||||
| Accounts payable and outstanding checks | ( | ||||||||||||||||
| Accrued compensation | |||||||||||||||||
| Accrued transportation expense | ( | ||||||||||||||||
| Accrued income taxes | ( | ||||||||||||||||
| Other accrued liabilities | |||||||||||||||||
| Other assets and liabilities | ( | ||||||||||||||||
| Net cash provided by operating activities | |||||||||||||||||
| INVESTING ACTIVITIES | |||||||||||||||||
| Purchases of property and equipment | ( | ( | ( | ||||||||||||||
| Purchases and development of software | ( | ( | ( | ||||||||||||||
| Acquisitions, net of cash acquired | ( | ( | |||||||||||||||
| Proceeds from sale of property and equipment | |||||||||||||||||
| Net cash used for investing activities | ( | ( | ( | ||||||||||||||
| FINANCING ACTIVITIES | |||||||||||||||||
| Proceeds from stock issued for employee benefit plans | |||||||||||||||||
| Stock tendered for payment of withholding taxes | ( | ( | ( | ||||||||||||||
| Repurchase of common stock | ( | ( | ( | ||||||||||||||
| Cash dividends | ( | ( | ( | ||||||||||||||
| Proceeds from long-term borrowings | |||||||||||||||||
| Payments on long-term borrowings | ( | ||||||||||||||||
| Proceeds from short-term borrowings | |||||||||||||||||
| Payments on short-term borrowings | ( | ( | ( | ||||||||||||||
| Net cash (used for) provided by financing activities | ( | ( | |||||||||||||||
| Effect of exchange rates on cash and cash equivalents | ( | ( | |||||||||||||||
Net change in cash and cash equivalents | ( | ( | |||||||||||||||
Cash and cash equivalents, beginning of year | |||||||||||||||||
Cash and cash equivalents, end of year | $ | $ | $ | ||||||||||||||
| Supplemental cash flow disclosures | |||||||||||||||||
| Cash paid for income taxes | $ | $ | $ | ||||||||||||||
| Cash paid for interest | |||||||||||||||||
| Accrued share repurchases held in other accrued liabilities | |||||||||||||||||
See accompanying notes to the consolidated financial statements.
43
C.H. ROBINSON WORLDWIDE, INC.
NOTES TO CONSOLIDATED FINANCIAL STATEMENTS
NOTE 1: SUMMARY OF SIGNIFICANT ACCOUNTING POLICIES
REVENUE RECOGNITION. At contract inception, we assess the goods and services promised in our contracts with customers and identify our performance obligations to provide distinct goods and services to our customers. We have determined that the following distinct goods and services represent our primary performance obligations.
Transportation and Logistics Services - As a global logistics provider, our primary performance obligation under our customer contracts is to utilize our relationships with a wide variety of transportation companies to efficiently and cost-effectively transport our customers’ freight. Revenue is recognized for these performance obligations as they are satisfied over the contract term, which generally represents the transit period. The transit period can vary based upon the method of transport, generally a number of days for over the road, rail, and air transportation, or several weeks in the case of an ocean shipment. Determining the transit period and how much of it has been completed as of the reporting date may require management to make judgments that affect the timing of revenue recognized. When the customer’s freight reaches its intended destination our performance obligation is complete. Pricing for our services is generally a fixed amount and is typically due within 30 days upon completion of our performance obligation, but can vary based on the nature of the service provided and certain other factors.
We also provide certain value-added logistics services, such as customs brokerage, fee-based managed services, warehousing services, small parcel, and supply chain consulting and optimization services. These services may include one or more performance obligations, which are generally satisfied over the service period as we perform our obligations. The service period may be a very short duration, in the case of customs brokerage and small parcel, or it may be longer in the case of warehousing, managed services, and supply chain consulting and optimization services. Pricing for our services is established in the customer contract and is dependent upon the specific needs of the customer but may be agreed upon at a fixed fee per transaction, labor hour, or service period. Payment is typically due within 30 days upon completion of our performance obligation, but can vary based on the nature of the service provided and certain other factors.
Sourcing Services - We contract with grocery retailers, restaurants, foodservice distributors, and produce wholesalers to provide sourcing services under the trade name Robinson Fresh® (“Robinson Fresh”). Our primary service obligation under these contracts is the buying, selling, and/or marketing of produce including fresh fruits, vegetables, and other value-added perishable items. Revenue is recognized when our performance obligations under these contracts are satisfied at a point in time, generally when the produce is received by our customer. Pricing under these contracts is generally a fixed amount and is typically due within 20 to 30 days upon completion of our performance obligation, but can vary based on the nature of the service provided and certain other factors.
In many cases, as additional performance obligations, we contract to arrange logistics and transportation of the products we buy, sell, and/or market. These performance obligations are satisfied over the contract term consistent with our other transportation and logistics services. The contract period is typically less than one year . Pricing for our services is generally a fixed amount and is typically due within 30 days upon completion of our performance obligation, but can vary based on the nature of the service provided and certain other factors.
Total revenues represent the total dollar value of revenue recognized from contracts with customers for the goods and services we provide. Substantially all of our revenues are attributable to contracts with our customers. Our adjusted gross profits are our total revenues less purchased transportation and related services, including contracted motor carrier, rail, ocean, air, and other costs, and the purchase price and services related to the products we source. Most transactions in our transportation and sourcing businesses are recorded at the gross amount we charge our customers for the services we provide and goods we sell. In these transactions, we are primarily responsible for fulfilling the promise to provide the specified good or service to our customers and we have discretion in establishing the price for the specified good or service. Additionally, in our sourcing business, in some cases, we take inventory risk before the specified good has been transferred to our customer. Customs
44
RIGHT-OF-USE LEASE ASSETS. Right-of-use lease assets are recognized upon lease commencement and represent our right to use an underlying asset for the lease term.
LEASE LIABILITIES. Lease liabilities are recognized at commencement date and represent our obligation to make the lease payments arising from a lease, measured on a discounted basis.
45
We recognized the following depreciation expense (in thousands):
| 2022 | $ | |||||||
| 2021 | ||||||||
| 2020 | ||||||||
A summary of our property and equipment as of December 31 is as follows (in thousands):
| 2022 | 2021 | ||||||||||
| Furniture, fixtures, and equipment | $ | $ | |||||||||
Buildings(1) | |||||||||||
Corporate aircraft(1) | |||||||||||
| Leasehold improvements | |||||||||||
| Land | |||||||||||
| Construction in progress | |||||||||||
| Less: accumulated depreciation and amortization | ( | ( | |||||||||
| Net property and equipment | $ | $ | |||||||||
________________________________
(1) Our corporate aircraft and an office building in Kansas City, Missouri, were reclassified as held-for-sale assets as of December 31, 2021. These held-for-sale assets of $35.0 million were sold in 2022 and were included within Prepaid expenses and other current assets in our Consolidated Balance Sheets as of December 31, 2021. The fair value of the assets that were held for sale was $64.0 million.
| 2022 | $ | |||||||
| 2021 | ||||||||
| 2020 | ||||||||
A summary of our purchased and internally developed software as of December 31, is as follows (in thousands):
| 2022 | 2021 | ||||||||||
| Purchased software | $ | $ | |||||||||
| Internally developed software | |||||||||||
| Less accumulated amortization | ( | ( | |||||||||
| Net software | $ | $ | |||||||||
46
INCOME TAXES. Income taxes are accounted for using the asset and liability method. Under this method, deferred tax assets and liabilities are recognized for the future tax consequences of temporary differences between the carrying amounts and tax bases of assets and liabilities using enacted rates.
Annual tax provisions include amounts considered sufficient to pay assessments that may result from examination of prior year tax returns; however, the amount ultimately paid upon resolution of issues raised may differ from the amounts accrued.
The financial statement benefits of an uncertain income tax position are recognized when more likely than not, based on the technical merits, the position will be sustained upon examination. Unrecognized tax benefits are, more likely than not, owed to a taxing authority, and the amount of the contingency can be reasonably estimated. Uncertain income tax positions are included in “Accrued income taxes” or “Noncurrent income taxes payable” in the consolidated balance sheets.
STOCK-BASED COMPENSATION. We have issued stock awards, including stock options, performance-based restricted shares, performance-based restricted stock units, and time-based restricted stock units to certain key employees. The awards vest over to five years , either based on the company’s earnings or adjusted gross profits growth or the passage of time. The related compensation expense for each award is recognized over the appropriate vesting period. The fair value of each share-based payment award is established on the date of grant. For grants of restricted shares and restricted stock units, the fair value is established based on the market price on the date of the grant, discounted for post-vesting holding restrictions. The discounts on outstanding grants vary from 12 percent to 24 percent and are calculated using the Black-Scholes option pricing model-protective put method. Changes in expected volatility and risk-free interest rates are the primary reason for changes in the discount.
For grants of stock options, we use the Black-Scholes option pricing model to estimate the fair value of these share-based payment awards. The determination of the fair value of stock options is affected by our stock price and a number of assumptions, including expected volatility, expected term, risk-free interest rate, and dividend yield.
NOTE 2: GOODWILL AND OTHER INTANGIBLE ASSETS
| NAST | Global Forwarding | All Other and Corporate | Total | ||||||||||||||||||||
| December 31, 2020 balance | $ | $ | $ | $ | |||||||||||||||||||
| Acquisitions | |||||||||||||||||||||||
| Foreign currency translation | ( | ( | ( | ( | |||||||||||||||||||
| December 31, 2021 balance | |||||||||||||||||||||||
| Foreign currency translation | ( | ( | ( | ( | |||||||||||||||||||
| December 31, 2022 balance | $ | $ | $ | $ | |||||||||||||||||||
Goodwill is tested at least annually for impairment on November 30, or more frequently if events or changes in circumstances indicate that the asset might be impaired. We first perform a qualitative assessment to determine whether it is more likely than not that the fair value of our reporting units is less than their respective carrying value (“Step Zero Analysis”). If the Step Zero Analysis indicates it is more likely than not that the fair value of our reporting units is less than their respective carrying value, an additional impairment assessment is performed (“Step One Analysis”).
As part of our annual Step Zero Analysis performed in 2022, we determined that due to certain qualitative factors and the recent performance of our Europe Surface Transportation reporting unit that the more likely than not criteria had been met, and therefore a Step One Analysis was completed for this reporting unit. Our Step Zero Analysis did not indicate that the more likely than not criteria was met for any other reporting units and therefore a Step One Analysis was not completed for those reporting units. As a result of our Step One Analysis for Europe Surface Transportation, we determined that the fair value was greater than the reporting unit's respective carrying value and as such the goodwill balance was not impaired.
47
| 2022 | 2021 | ||||||||||||||||||||||||||||||||||
| Cost | Accumulated Amortization | Net | Cost | Accumulated Amortization | Net | ||||||||||||||||||||||||||||||
| Finite-lived intangibles | |||||||||||||||||||||||||||||||||||
| Customer relationships | $ | $ | ( | $ | $ | $ | ( | $ | |||||||||||||||||||||||||||
| Total finite-lived intangibles | ( | ( | |||||||||||||||||||||||||||||||||
| Indefinite-lived intangibles | |||||||||||||||||||||||||||||||||||
| Trademarks | — | — | |||||||||||||||||||||||||||||||||
| Total intangibles | $ | $ | ( | $ | $ | $ | ( | $ | |||||||||||||||||||||||||||
Amortization expense for other intangible assets was (in thousands):
| 2022 | $ | ||||
| 2021 | |||||
| 2020 | |||||
| NAST | Global Forwarding | All Other and Corporate | Total | ||||||||||||||||||||
| 2023 | $ | $ | $ | $ | |||||||||||||||||||
| 2024 | |||||||||||||||||||||||
| 2025 | |||||||||||||||||||||||
| 2026 | |||||||||||||||||||||||
| 2027 | |||||||||||||||||||||||
| Thereafter | |||||||||||||||||||||||
| Total | $ | ||||||||||||||||||||||
NOTE 3: FAIR VALUE MEASUREMENT
Accounting guidance on fair value measurements for certain financial assets and liabilities requires that assets and liabilities carried at fair value be classified and disclosed in one of the following three categories:
•Level 1-Quoted market prices in active markets for identical assets or liabilities.
•Level 2-Observable market-based inputs or unobservable inputs that are corroborated by market data.
•Level 3-Unobservable inputs reflecting the reporting entity’s own assumptions or external inputs from inactive markets.
48
NOTE 4: FINANCING ARRANGEMENTS
The components of our short-term and long-term debt and the associated interest rates were as follows (dollars in thousands):
| Average interest rate as of | Carrying value as of | |||||||||||||||||||||||||||||||
| December 31, 2022 | December 31, 2021 | Maturity | December 31, 2022 | December 31, 2021 | ||||||||||||||||||||||||||||
| Revolving credit facility | % | % | November 2027 | $ | $ | |||||||||||||||||||||||||||
| 364-day revolving credit facility | % | % | May 2023 | |||||||||||||||||||||||||||||
| Senior Notes, Series A | % | % | August 2023 | |||||||||||||||||||||||||||||
| Senior Notes, Series B | % | % | August 2028 | |||||||||||||||||||||||||||||
| Senior Notes, Series C | % | % | August 2033 | |||||||||||||||||||||||||||||
Receivables Securitization Facility (1) | % | % | November 2023 | |||||||||||||||||||||||||||||
Senior Notes(1) | % | % | April 2028 | |||||||||||||||||||||||||||||
| Total debt | ||||||||||||||||||||||||||||||||
| Less: Current maturities and short-term borrowing | ( | ( | ||||||||||||||||||||||||||||||
| Long-term debt | $ | $ | ||||||||||||||||||||||||||||||
________________________________
(1) Net of unamortized discounts and issuance costs.
SENIOR UNSECURED REVOLVING CREDIT FACILITY
We have a senior unsecured revolving credit facility (the “Credit Agreement”) with a total availability of $1 billion and a maturity date of November 19, 2027. Borrowings under the Credit Agreement generally bear interest at a variable rate determined by a pricing schedule or the base rate (which is the highest of (a) the administrative agent's prime rate, (b) the federal funds rate plus 0.50 percent, or (c) the sum of one-month SOFR plus a specified margin). As of December 31, 2022, the variable rate equaled SOFR and a Credit Spread Adjustment of 0.10 percent plus 1.00 percent. In addition, there is a commitment fee on the average daily undrawn stated amount under the facility ranging from 0.07 percent to 0.15 percent. The recorded amount of borrowings outstanding, if any, approximates fair value because of the short maturity period of the debt; therefore, we consider these borrowings to be a Level 2 financial liability.
The Credit Agreement contains various restrictions and covenants that require us to maintain certain financial ratios, including a maximum leverage ratio of 3.75 to 1.00. The Credit Agreement also contains customary events of default.
364-DAY UNSECURED REVOLVING CREDIT FACILITY
On May 6, 2022, we entered into an unsecured revolving credit facility (the “364-day Credit Agreement”) with a total availability of $500 million and a maturity date of May 5, 2023. Borrowings under the 364-day Credit Agreement generally bear interest at an alternate base rate plus a margin or a term SOFR-based rate plus a margin of 0.625 percent to 1.25 percent. The alternate base rate is determined by a pricing schedule (which is the highest of (a) 0 percent, (b) U.S. Bank’s prime rate, (c) the federal funds effective rate plus 0.50 percent, or (d) a term SOFR-based rate plus 1.00 percent). In addition, there is a commitment fee on the aggregate unused commitments under the 364-day Credit Agreement ranging from 0.05 percent to 0.175 percent per annum. The recorded amount of borrowings outstanding approximates fair value because of the short maturity period of the debt.
The 364-day Credit Agreement contains various restrictions and covenants that require us to maintain certain financial ratios, including an initial maximum leverage ratio of 3.00 to 1.00. The 364-day Credit Agreement also contains customary events of default.
49
NOTE PURCHASE AGREEMENT
On August 23, 2013, we entered into a Note Purchase Agreement with certain institutional investors (the “Purchasers”). On August 27, 2013, the Purchasers purchased an aggregate principal amount of $500 million of our Senior Notes, Series A, Senior Notes Series B, and Senior Notes Series C (collectively, the “Notes”). Interest on the Notes is payable semi-annually in arrears. The fair value of the Notes approximated $468.7 million as of December 31, 2022. We estimate the fair value of the Notes primarily using an expected present value technique, which is based on observable market inputs using interest rates currently available to companies of similar credit standing for similar terms and remaining maturities, and considering our own risk. If the Notes were recorded at fair value, they would be classified as Level 2. Senior Notes, Series A mature in August 2023 and are classified as current portion of debt in our Consolidated Balance Sheets as of December 31, 2022.
The Note Purchase Agreement contains various restrictions and covenants that require us to maintain certain financial ratios, including a maximum leverage ratio of 3.50 to 1.00, a minimum interest coverage ratio of 2.00 to 1.00, and a maximum consolidated priority debt to consolidated total asset ratio of 15 percent.
The Note Purchase Agreement provides for customary events of default. The occurrence of an event of default would permit certain Purchasers to declare certain Notes then outstanding to be immediately due and payable. Under the terms of the Note Purchase Agreement, the Notes are redeemable, in whole or in part, at 100 percent of the principal amount being redeemed together with a “make-whole amount” (as defined in the Note Purchase Agreement), and accrued and unpaid interest with respect to each Note. The obligations of the company under the Note Purchase Agreement and the Notes are guaranteed by C.H. Robinson Company, a Delaware corporation and a wholly-owned subsidiary of the company, and by C.H. Robinson Company, Inc., a Minnesota corporation and an indirect wholly-owned subsidiary of the company. On November 21, 2022, we executed the third amendment to the Note Purchase Agreement to among other things, facilitate the terms of the Credit Agreement.
U.S. TRADE ACCOUNTS RECEIVABLE SECURITIZATION
On November 19, 2021, we entered into a receivables purchase agreement and related transaction documents with Bank of America, N.A. and Wells Fargo Bank, N.A. to provide a receivables securitization facility (the “Receivables Securitization Facility”). The Receivables Securitization Facility is based on the securitization of our U.S. trade accounts receivable with a total availability of $500 million as of December 31, 2022. The interest rate on borrowings under the Receivables Securitization Facility is based on Bloomberg Short Term Bank Yield Index (“BSBY”) plus a margin. There is also a commitment fee we are required to pay on any unused portion of the facility. The Receivables Securitization Facility expires on November 17, 2023, unless extended by the parties. The recorded amount of borrowings outstanding on the Receivables Securitization Facility approximates fair value because it can be redeemed on short notice and the interest rate floats. We consider these borrowings to be a Level 2 financial liability. Borrowings on the Receivables Securitization Facility are included within proceeds on current borrowings on the consolidated statement of cash flows.
The Receivables Securitization Facility contains various customary affirmative and negative covenants, and it also contains customary default and termination provisions, which provide for acceleration of amounts owed under the Receivables Securitization Facility upon the occurrence of certain specified events.
On February 1, 2022, we amended the Receivables Securitization Facility primarily to increase the total availability from $300 million to $500 million pursuant to the provisions of the existing agreement. On July 7, 2022, we amended the Receivables Securitization Facility to effectively increase the receivables pool available with respect to the Receivables Securitization Facility.
SENIOR NOTES
On April 9, 2018, we issued senior unsecured notes (“Senior Notes”) through a public offering. The Senior Notes bear an annual interest rate of 4.20 percent payable semi-annually on April 15 and October 15, until maturity on April 15, 2028. Taking into effect the amortization of the original issue discount and all underwriting and issuance expenses, the Senior Notes have an effective yield to maturity of approximately 4.39 percent per annum. The fair value of the Senior Notes, excluding debt discounts and issuance costs, approximated $569.5 million as of December 31, 2022, based primarily on the market prices quoted from external sources. The carrying value of the Senior Notes was $595.0 million as of December 31, 2022. If the Senior Notes were measured at fair value in the financial statements, they would be classified as Level 2 in the fair value hierarchy.
We may redeem the Senior Notes, in whole or in part, at any time and from time to time prior to their maturity at the applicable redemption prices described in the Senior Notes. Upon the occurrence of a “change of control triggering event” as defined in the Senior Notes (generally, a change of control of us accompanied by a reduction in the credit rating for the Senior Notes), we
50
will generally be required to make an offer to repurchase the Senior Notes from holders at 101 percent of their principal amount plus accrued and unpaid interest to the date of repurchase.
The Senior Notes were issued under an indenture that contains covenants imposing certain limitations on our ability to incur liens; enter into sales and leaseback transactions above certain limits; and consolidate, merge, or transfer substantially all of our assets and those of our subsidiaries on a consolidated basis. It also provides for customary events of default (subject in certain cases to customary grace and cure periods), which include among other things nonpayment, breach of covenants in the indenture, and certain events of bankruptcy and insolvency. If an event of default occurs and is continuing with respect to the Senior Notes, the trustee or holders of at least 25 percent in principal amount outstanding of the Senior Notes may declare the principal and the accrued and unpaid interest, if any, on all of the outstanding Senior Notes to be due and payable. These covenants and events of default are subject to a number of important qualifications, limitations, and exceptions that are described in the indenture. The indenture does not contain any financial ratios or specified levels of net worth or liquidity to which we must adhere.
In addition to the above financing agreements, we have a $15 million discretionary line of credit with U.S. Bank of which $7.9 million is currently utilized for standby letters of credit related to insurance collateral as of December 31, 2022. These standby letters of credit are renewed annually and were undrawn as of December 31, 2022.
NOTE 5: INCOME TAXES
C.H. Robinson Worldwide, Inc. and its 80 percent (or more) owned U.S. subsidiaries file a consolidated federal income tax return. We file unitary or separate state returns based on state filing requirements. With few exceptions, we are no longer subject to audits of U.S. federal, state and local, or non-U.S. income tax returns before 2015. We are currently under an Internal Revenue Service audit for the 2015 to 2017 tax years.
In 2019, we removed our assertion that the unremitted earnings of our foreign subsidiaries were permanently reinvested with limited exceptions. If we repatriated all foreign earnings that are still considered to be permanently reinvested, the estimated effect on income taxes payable would be an increase of approximately $2.0 million as of December 31, 2022.
On March 27, 2020, the U.S. government enacted the Coronavirus Aid, Relief, and Economic Security Act (the “CARES Act”) in response to the COVID-19 pandemic. The CARES Act allowed for a deferral of the employer share of federal payroll taxes. We recognized a payroll deferral of $14.7 million under the CARES Act as of December 31, 2021, which has been paid as of December 31, 2022.
| 2022 | 2021 | 2020 | |||||||||||||||
| Domestic | $ | $ | $ | ||||||||||||||
| Foreign | |||||||||||||||||
| Total | $ | $ | $ | ||||||||||||||
| 2022 | 2021 | 2020 | |||||||||||||||
| Unrecognized tax benefits, beginning of period | $ | $ | $ | ||||||||||||||
| Additions based on tax positions related to the current year | |||||||||||||||||
| Additions for tax positions of prior years | |||||||||||||||||
| Reductions for tax positions of prior years | ( | ( | ( | ||||||||||||||
| Lapse in statute of limitations | ( | ( | ( | ||||||||||||||
| Settlements | ( | ( | |||||||||||||||
| Unrecognized tax benefits, end of the period | $ | $ | $ | ||||||||||||||
Income tax expense considers amounts that may be needed to cover exposures for open tax years. We do not expect any material impact related to open tax years; however, actual settlements may differ from amounts accrued.
51
As of December 31, 2022, we had $43.0 million of unrecognized tax benefits and related interest and penalties, all of which would affect our effective tax rate if recognized. In the unlikely event these unrecognized tax benefits and related interest and penalties were recognized fully in 2022, the impact to the annual effective tax rate would have been 3.7 percent. We are not aware of any tax positions for which it is reasonably possible that the total amount of unrecognized tax benefit will significantly increase or decrease in the next 12 months. The total liability for unrecognized tax benefits is expected to decrease by approximately $3.0 million in the next 12 months due to lapsing of statutes.
We recognize interest and penalties related to uncertain tax positions in the provision for income taxes. During the years ended December 31, 2022, 2021, and 2020, we recognized approximately $0.6 million, $0.9 million, and $1.0 million in interest and penalties, respectively. We had approximately $3.9 million and $5.6 million for the payment of interest and penalties related to uncertain tax positions accrued within noncurrent income taxes payable as of December 31, 2022 and 2021, respectively. These amounts are not included in the reconciliation above.
The components of the provision for income taxes consist of the following for the years ended December 31 (in thousands):
| 2022 | 2021 | 2020 | |||||||||||||||
| Tax provision: | |||||||||||||||||
| Federal | $ | $ | $ | ||||||||||||||
| State | |||||||||||||||||
| Foreign | |||||||||||||||||
| Deferred provision (benefit): | |||||||||||||||||
| Federal | ( | ( | ( | ||||||||||||||
| State | ( | ( | ( | ||||||||||||||
| Foreign | ( | ( | ( | ||||||||||||||
| ( | ( | ( | |||||||||||||||
| Total provision | $ | $ | $ | ||||||||||||||
| 2022 | 2021 | 2020 | |||||||||||||||
| Federal statutory rate | % | % | % | ||||||||||||||
| State income taxes, net of federal benefit | |||||||||||||||||
| Share-based payment awards | ( | ( | ( | ||||||||||||||
| Excess foreign tax credits | ( | ( | ( | ||||||||||||||
| Other U.S. tax credits and incentives | ( | ( | ( | ||||||||||||||
| Foreign | ( | ||||||||||||||||
| Other | |||||||||||||||||
| Effective income tax rate | % | % | % | ||||||||||||||
52
| 2022 | 2021 | ||||||||||
| Deferred tax assets: | |||||||||||
| Lease liabilities | $ | $ | |||||||||
| Compensation | |||||||||||
| Accrued expenses | |||||||||||
| Foreign affiliate prepayment | |||||||||||
| Long-lived assets | |||||||||||
| Other | |||||||||||
| Deferred tax liabilities: | |||||||||||
| Right-of-use assets | ( | ( | |||||||||
| Intangible assets | ( | ( | |||||||||
| Accrued revenue | ( | ||||||||||
| Prepaid assets | ( | ( | |||||||||
| Long-lived assets | ( | ||||||||||
| Foreign withholding tax | ( | ( | |||||||||
| Other | ( | ( | |||||||||
| Net deferred tax assets | $ | $ | |||||||||
We had foreign net operating loss carryforwards with a tax effect of $9.0 million as of December 31, 2022, and $8.6 million as of December 31, 2021. The net operating loss carryforwards will expire at various dates from 2023 to 2030, with certain jurisdictions having indefinite carryforward terms. We continually monitor and review the foreign net operating loss carryforwards to determine the ability to realize the deferred tax assets associated with the foreign net operating loss carryforwards. As of December 31, 2022 and 2021, we have recorded a valuation allowance of $1.4 million and $2.5 million, respectively, against the deferred tax asset related to the foreign operating loss carryforwards.
NOTE 6: CAPITAL STOCK AND STOCK AWARD PLANS
PREFERRED STOCK. Our Certificate of Incorporation authorizes the issuance of 20,000,000 shares of preferred stock, par value $0.10 per share. There are no shares of preferred stock outstanding. The preferred stock may be issued by resolution of our Board of Directors at any time without any action of the stockholders. The Board of Directors may issue the preferred stock in one or more series and fix the designation and relative powers. These include voting powers, preferences, rights, qualifications, limitations, and restrictions of each series. The issuance of any such series may have an adverse effect on the rights of holders of common stock and may impede the completion of a merger, tender offer, or other takeover attempt.
COMMON STOCK. Our Certificate of Incorporation authorizes 480,000,000 shares of common stock, par value $0.10 per share. Subject to the rights of preferred stock, which may from time to time be outstanding, holders of common stock are entitled to receive dividends out of funds legally available, when and if declared by the Board of Directors, and to receive their share of the net assets of the company legally available for distribution upon liquidation or dissolution.
For each share of common stock held, stockholders are entitled to one vote on each matter to be voted on by the stockholders, including the election of directors. Holders of common stock are not entitled to cumulative voting. The stockholders do not have preemptive rights. All outstanding shares of common stock are fully paid and nonassessable.
53
STOCK AWARD PLANS. Stock-based compensation cost is measured at the grant date based on the value of the award and is recognized as expense as it vests. A summary expense recognized within personnel expenses in our consolidated statements of operations and comprehensive income for stock-based compensation is as follows (in thousands):
| 2022 | 2021 | 2020 | |||||||||||||||
| Stock options | $ | $ | $ | ||||||||||||||
| Stock awards | |||||||||||||||||
| Company expense on ESPP discount | |||||||||||||||||
| Total stock-based compensation expense | $ | $ | $ | ||||||||||||||
On May 5, 2022, our shareholders approved a 2022 Equity Incentive Plan (the “Plan”) and authorized an initial 4,261,884 shares for issuance of awards thereunder. Upon approval of the Plan, no new awards may be made under our 2013 Equity Incentive Plan. The Plan allows us to grant certain stock awards, including stock options at fair market value, performance-based restricted stock units and shares, and time-based restricted stock units, to our key employees and non-employee directors. Shares subject to awards granted under the plan or our prior equity incentive plans that expire or are canceled without delivery of shares or that are settled in cash, generally become available again for issuance under the Plan. There were 4,377,540 shares were available for stock awards under the Plan as of December 31, 2022.
STOCK OPTIONS. We have awarded stock options to certain key employees that vest primarily based on their continued employment. The value of these awards is established by the market price on the date of the grant calculated using the Black-Scholes option pricing model. Changes in measured stock price volatility and interest rates were the primary reasons for changes in the fair value. These grants are being expensed based on the terms of the awards. Although participants can exercise options via a stock swap exercise, we do not issue reloads (restoration options) on the grants.
| Options | Weighted Average Exercise Price | Aggregate Intrinsic Value (in thousands) | Average Remaining Life (years) | ||||||||||||||||||||
| Outstanding as of December 31, 2021 | $ | $ | |||||||||||||||||||||
| Exercised | ( | ||||||||||||||||||||||
| Forfeitures | ( | ||||||||||||||||||||||
| Outstanding as of December 31, 2022 | $ | $ | |||||||||||||||||||||
| Vested as of December 31, 2022 | $ | ||||||||||||||||||||||
| Exercisable as of December 31, 2022 | $ | ||||||||||||||||||||||
As of December 31, 2022, unrecognized compensation expense related to stock options was $13.4 million. The amount of future expense to be recognized will be based on the passage of time and the employees' continued employment.
There were no potentially dilutive stock options for 2022 excluded from our diluted net income per share calculations because these securities’ exercise prices were anti-dilutive (e.g., greater than the average market price of our common stock).
54
| 2022 | $ | ||||
| 2021 | |||||
| 2020 | |||||
The following table summarizes these unvested stock option grants as of December 31, 2022:
| First Vesting Date | Last Vesting Date | Options Granted, Net of Forfeitures | Weighted Average Grant Date Fair Value(1) | Unvested Options | ||||||||||||||||||||||
| December 31, 2019 | December 31, 2023 | $ | ||||||||||||||||||||||||
| December 31, 2020 | December 31, 2024 | |||||||||||||||||||||||||
| $ | ||||||||||||||||||||||||||
________________________________
Determining Fair Value
We estimated the fair value of stock options granted using the Black-Scholes option pricing model. We estimate the fair value of restricted shares and units using the Black-Scholes option pricing model-protective put method. A description of significant assumptions used to determine the risk-free interest rate, dividend yield, expected volatility, and expected term are as follows:
Risk-Free Interest Rate-The risk-free interest rate was based on the implied yield available on U.S. Treasury zero-coupon issues at the date of grant with a term equal to the expected term.
Dividend Yield-The dividend yield assumption is based on our history of dividend payouts.
Expected Volatility-Expected volatility was determined based on the implied volatility of traded options of our stock and the historical volatility of our stock price.
Expected Term-Expected term represents the period that our stock-based awards are expected to be outstanding and was determined based on historical experience and anticipated future exercise patterns, giving consideration to the contractual terms of unexercised stock-based awards.
The grant date fair value per option was estimated using the Black-Scholes option pricing model with the following assumptions:
| 2020 Grants | 2019 Grants | ||||||||||
| Weighted-average risk-free interest rate | |||||||||||
| Expected dividend yield | |||||||||||
| Weighted-average volatility | |||||||||||
| Expected term (in years) | |||||||||||
| Weighted average fair value per option | $ | $ | |||||||||
STOCK AWARDS. We have awarded performance-based restricted shares, performance-based restricted stock units (“PSUs”), and time-based restricted stock units. Nearly all of our awards contain restrictions on the awardees’ ability to sell or transfer vested awards for a specified period of time. The fair value of these awards is established based on the market price on the date of grant, discounted for post-vesting holding restrictions. The discounts on outstanding grants with post-vesting holding restrictions vary from 12 percent to 24 percent and are calculated using the Black-Scholes option pricing model-protective put method. The duration of the restriction period to sell or transfer vested awards, changes in the measured stock price volatility, and changes in interest rates are the primary reasons for changes in the discount. These grants are being expensed based on the terms of the awards.
Performance-Based Awards
We have awarded performance-based restricted shares through 2020 to certain key employees. These awards vest over a five-year period based on the company’s earnings growth. Beginning in 2021, we have awarded annually PSUs to certain key employees. These PSUs vest over a three-year period based on the company's cumulative three-year dilutive earnings per share growth and annual adjusted gross profits growth. These PSUs contain an upside opportunity of 200 percent of target contingent upon obtaining certain dilutive earnings per share and adjusted gross profits growth targets.
55
The following table summarizes activity related to our performance-based restricted shares and PSUs as of December 31, 2022:
| Number of Restricted Shares and Restricted Stock Units | Weighted Average Grant Date Fair Value | ||||||||||
| Unvested as of December 31, 2021 | $ | ||||||||||
Granted(1) | |||||||||||
Performance-based grant adjustment(2) | |||||||||||
| Vested | ( | ||||||||||
| Forfeitures | ( | ||||||||||
| Unvested as of December 31, 2022 | $ | ||||||||||
________________________________
(1) Amount represents PSU grants at target.
(2)Amount represents incremental shares issuable for achieving 200 percent upside upon meeting certain adjusted gross profits targets in 2022.
The following table summarizes unvested PSUs by vesting period at target:
| First Vesting Date | Last Vesting Date | Performance Shares and Stock Units Granted, Net of Forfeitures | Weighted Average Grant Date Fair Value (1) | Unvested Performance Shares and Restricted Stock Units | ||||||||||||||||||||||
| December 31, 2021 | December 31, 2023 | $ | ||||||||||||||||||||||||
| December 31, 2022 | December 31, 2024 | |||||||||||||||||||||||||
| $ | ||||||||||||||||||||||||||
________________________________
We granted an additional 272,455 performance-based restricted stock units at target in February 2023. These awards have a weighted average grant date fair value of $92.15 and will vest over a three-year period based upon achieving certain cumulative three-year dilutive earnings per share, adjusted gross profits, and adjusted operating margin percentage targets.
Time-Based Awards
We award time-based restricted stock units to certain key employees. Time-based awards granted through 2020 vest over a five-year period. Beginning in 2021, we have granted annually time-based awards that vest over a three-year period primarily based on the passage of time and the employee's continued employment. These grants are being expensed based on the terms of the awards.
| Number of Restricted Shares and Stock Units | Weighted Average Grant Date Fair Value | ||||||||||
| Unvested as of December 31, 2021 | $ | ||||||||||
| Granted | |||||||||||
| Vested | ( | ||||||||||
| Forfeitures | ( | ||||||||||
| Unvested as of December 31, 2022 | $ | ||||||||||
We granted an additional 688,341 time-based restricted stock units in February 2023. These awards have a weighted average grant date fair value of $92.74 and will vest over a three-year period.
56
A summary of the fair value of stock awards vested (in thousands):
| 2022 | $ | ||||
| 2021 | |||||
| 2020 | |||||
As of December 31, 2022, there was unrecognized compensation expense of $119.0 million related to previously granted stock awards assuming maximum achievement is obtained on our performance-based awards. The amount of future expense to be recognized will be based on the passage of time, the company’s dilutive earnings per share and adjusted gross profits growth, and certain other conditions.
EMPLOYEE STOCK PURCHASE PLAN. Our 1997 Employee Stock Purchase Plan allows our employees to contribute up to $10,000 of their annual cash compensation to purchase company stock. Purchase price is determined using the closing price on the last day of the quarter discounted by 15 percent. Shares are vested immediately. The following is a summary of the employee stock purchase plan activity (dollar amounts in thousands):
| Shares Purchased By Employees | Aggregate Cost to Employees | Expense Recognized By the Company | |||||||||||||||
| 2022 | $ | $ | |||||||||||||||
| 2021 | |||||||||||||||||
| 2020 | |||||||||||||||||
SHARE REPURCHASE PROGRAMS. On December 9, 2021, the Board of Directors increased the company’s share repurchase authorization by an additional 20,000,000 shares of common stock. As of December 31, 2022, we had 7,409,198 shares remaining under the share repurchase authorization. The activity under these authorizations is as follows (dollar amounts in thousands):
| Shares Repurchased | Total Value of Shares Repurchased | ||||||||||
| 2022 Repurchases | $ | ||||||||||
| 2021 Repurchases | |||||||||||
| 2020 Repurchases | |||||||||||
NOTE 7: COMMITMENTS AND CONTINGENCIES
EMPLOYEE BENEFIT PLANS. We offer a defined contribution plan, which qualifies under section 401(k) of the Internal Revenue Code and covers all eligible U.S. employees. We can also elect to make matching contributions to the plan. Annual discretionary contributions may also be made to the plan. Defined contribution plan expense, including matching contributions, is as follows (in thousands):
| 2022 | $ | ||||
| 2021 | |||||
| 2020 | |||||
We contributed a defined contribution match of six
LEASE COMMITMENTS. We maintain operating leases for office space, warehouses, office equipment, trailers, and a small number of intermodal containers. See Note 11, Leases, for further information.
57
NOTE 8: ACQUISITIONS
Combinex Holding B.V.
On June 3, 2021, we acquired all of the outstanding shares of Combinex Holding B.V. (“Combinex”) to strengthen our European surface transportation presence. Total purchase consideration, net of cash acquired was $14.7 million, which was paid in cash.
| Estimated Life (years) | |||||||||||
| Customer relationships | $ | ||||||||||
There was $10.8 million of goodwill recorded related to the acquisition of Combinex. The Combinex goodwill is a result of acquiring and retaining the Combinex workforce and expected synergies from integrating its business into ours. Purchase accounting is considered complete. The goodwill will not be deductible for tax purposes. The results of operations of Combinex have been included as part of the All Other and Corporate segment in our consolidated financial statements since June 3, 2021.
Prime Distribution Services
On March 2, 2020, we acquired all of the outstanding shares of Prime Distribution Services (“Prime Distribution”), a leading provider of retail consolidation services in North America, for $222.7 million in cash. This acquisition adds scale and value-added warehouse capabilities to our retail consolidation platform, adding to our global suite of services.
| Current assets | $ | ||||
| Property and equipment | |||||
| Right-of-use lease assets | |||||
| Other intangible assets | |||||
| Goodwill | |||||
| Total assets | |||||
| Current liabilities | |||||
| Lease liabilities | |||||
| Deferred tax liabilities | |||||
| Net assets acquired | $ | ||||
58
| Estimated Life (years) | |||||||||||
| Customer relationships | $ | ||||||||||
There was $176.7 million of goodwill recorded related to the acquisition of Prime Distribution. The Prime Distribution goodwill is a result of acquiring and retaining the Prime Distribution workforce and expected synergies from integrating its business into ours. Purchase accounting is considered complete. The goodwill will not be deductible for tax purposes. The acquisition was effective as of February 29, 2020, and therefore the results of operations of Prime Distribution have been included as part of the North American Surface Transportation (“NAST”) segment in our consolidated financial statements since March 1, 2020.
NOTE 9: SEGMENT REPORTING
Our segments are based on our method of internal reporting, which generally segregates the segments by service line and the primary services they provide to our customers. The internal reporting of segments is defined, based in part, on the reporting and review process used by our chief operating decision maker (“CODM”), our Interim Chief Executive Officer. The accounting policies of our reportable segments are the same as those described in the summary of significant accounting policies. We do not report our intersegment revenues by segment to our CODM and do not believe they are a meaningful metric for evaluating the performance of our reportable segments. We identify two reportable segments as follows:
•North American Surface Transportation: NAST provides freight transportation services across North America through a network of offices in the U.S., Canada, and Mexico. The primary services provided by NAST are truckload and less than truckload (“LTL”) transportation services.
•Global Forwarding: Global Forwarding provides global logistics services through an international network of offices in North America, Asia, Europe, Oceania, and South America and also contracts with independent agents worldwide. The primary services provided by Global Forwarding include ocean freight services, air freight services, and customs brokerage.
•All Other and Corporate: All Other and Corporate includes our Robinson Fresh and Managed Services segments, as well as Other Surface Transportation outside of North America and other miscellaneous revenues and unallocated corporate expenses. Robinson Fresh provides sourcing services including the buying, selling, and/or marketing of fresh fruits, vegetables, and other value-added perishable items. Managed Services provides Transportation Management Services, or Managed TMS®. Other Surface Transportation revenues are primarily earned by our Europe Surface Transportation segment. Europe Surface Transportation provides transportation and logistics services including truckload and groupage services across Europe.
59
Reportable segment information as of, and for the years ended, December 31, 2022, 2021, and 2020, is as follows (dollars in thousands):
| NAST | Global Forwarding | All Other and Corporate | Consolidated | ||||||||||||||||||||
| Twelve Months Ended December 31, 2022 | |||||||||||||||||||||||
| Total revenues | $ | $ | $ | $ | |||||||||||||||||||
| Income (loss) from operations | ( | ||||||||||||||||||||||
| Depreciation and amortization | |||||||||||||||||||||||
Total assets(1) | |||||||||||||||||||||||
| Average employee headcount | |||||||||||||||||||||||
| NAST | Global Forwarding | All Other and Corporate | Consolidated | ||||||||||||||||||||
| Twelve Months Ended December 31, 2021 | |||||||||||||||||||||||
| Total revenues | $ | $ | $ | $ | |||||||||||||||||||
| Income (loss) from operations | ( | ||||||||||||||||||||||
| Depreciation and amortization | |||||||||||||||||||||||
Total assets(1) | |||||||||||||||||||||||
| Average employee headcount | |||||||||||||||||||||||
| NAST | Global Forwarding | All Other and Corporate | Consolidated | ||||||||||||||||||||
| Twelve Months Ended December 31, 2020 | |||||||||||||||||||||||
| Total revenues | $ | $ | $ | $ | |||||||||||||||||||
| Income (loss) from operations | ( | ||||||||||||||||||||||
| Depreciation and amortization | |||||||||||||||||||||||
Total assets(1) | |||||||||||||||||||||||
| Average employee headcount | |||||||||||||||||||||||
________________________________
(1) All cash and cash equivalents and certain owned properties are included in All Other and Corporate.
The following table presents our total revenues (based on location of the customer) and long-lived assets (including intangible and other assets) by geographic regions (in thousands):
| For the year ended December 31, | |||||||||||||||||
| 2022 | 2021 | 2020 | |||||||||||||||
| Total revenues | |||||||||||||||||
| U.S. | $ | $ | $ | ||||||||||||||
| Other locations | |||||||||||||||||
| Total revenues | $ | $ | $ | ||||||||||||||
| As of December 31, | |||||||||||||||||
| 2022 | 2021 | 2020 | |||||||||||||||
| Long-lived assets | |||||||||||||||||
| U.S. | $ | $ | $ | ||||||||||||||
| Other locations | |||||||||||||||||
| Total long-lived assets | $ | $ | $ | ||||||||||||||
60
NOTE 10: REVENUE FROM CONTRACTS WITH CUSTOMERS
A summary of our total revenues disaggregated by major service line and timing of revenue recognition is presented below for each of our reportable segments for the twelve months ended December 31, 2022, 2021, and 2020, as follows (dollars in thousands):
| Twelve Months Ended December 31, 2022 | |||||||||||||||||||||||
| NAST | Global Forwarding | All Other and Corporate | Total | ||||||||||||||||||||
| Major service lines: | |||||||||||||||||||||||
Transportation and logistics services(1) | $ | $ | $ | $ | |||||||||||||||||||
Sourcing(2) | |||||||||||||||||||||||
| Total | $ | $ | $ | $ | |||||||||||||||||||
| Twelve Months Ended December 31, 2021 | |||||||||||||||||||||||
| NAST | Global Forwarding | All Other and Corporate | Total | ||||||||||||||||||||
| Major service lines: | |||||||||||||||||||||||
Transportation and logistics services(1) | $ | $ | $ | $ | |||||||||||||||||||
Sourcing(2) | |||||||||||||||||||||||
| Total | $ | $ | $ | $ | |||||||||||||||||||
| Twelve Months Ended December 31, 2020 | |||||||||||||||||||||||
| NAST | Global Forwarding | All Other and Corporate | Total | ||||||||||||||||||||
| Major service lines: | |||||||||||||||||||||||
Transportation and logistics services(1) | $ | $ | $ | $ | |||||||||||||||||||
Sourcing(2) | |||||||||||||||||||||||
| Total | $ | $ | $ | $ | |||||||||||||||||||
________________________________
(1) Transportation and logistics services performance obligations are completed over time.
(2) Sourcing performance obligations are completed at a point in time.
We typically do not receive consideration and amounts are not due from our customer prior to the completion of our performance obligations and as such contract liabilities as of December 31, 2022 and 2021, and revenue recognized in the twelve months ended December 31, 2022, 2021, and 2020, resulting from contract liabilities were not significant. Contract assets and accrued expenses—transportation expense fluctuate from period to period primarily based upon shipments in-transit at period end and the timing of customer invoicing.
Approximately 93 percent, 93 percent, and 91 percent of our total revenues for the twelve months ended December 31, 2022, 2021, and 2020, respectively, are attributable to arranging for the transportation of our customers’ freight for which we transfer control and satisfy our performance obligation over the requisite transit period. A days in transit output method is used to measure the progress of our performance as of the reporting date. We determine the transit period based upon the departure date and the delivery date, which may be estimated if delivery has not occurred as of the reporting date. Determining the transit period and how much of it has been completed as of the reporting date may require management to make judgments that affect the timing of revenue recognized. We have determined that revenue recognition over the transit period provides a faithful depiction of the transfer of goods and services to our customer as our obligation is performed over the transit period. The transaction price for our performance obligation under these arrangements is generally fixed and readily determinable upon contract inception and is not contingent upon the occurrence or non-occurrence of another event.
Approximately five percent, five percent, and seven percent of our total revenues for the twelve months ended December 31, 2022, 2021, and 2020, respectively, are attributable to buying, selling, and/or marketing of produce including fresh fruits, vegetables, and other value-added perishable items. Total revenues for these transactions are recognized at a point in time upon completion of our performance obligation, which is generally when the produce is received by our customer. The transaction price for our performance obligation under these arrangements is generally fixed and readily determinable upon contract inception and is not contingent upon the occurrence or non-occurrence of another event.
61
Approximately two
We expense incremental costs of obtaining customer contracts (i.e., sales commissions) due to the short duration of our arrangements as the amortization period of such amounts is expected to be less than one year . These amounts are included within personnel expenses in our consolidated statements of operations and comprehensive income. In addition, we do not disclose the aggregate amount of transaction price allocated to performance obligations that are unsatisfied as of the end of the period, as our contracts have an expected length of one year or less. Finally, for certain of our performance obligations such as fee-based managed services, supply chain consulting and optimization services, and warehousing services, we have recognized revenue in the amount for which we have the right to invoice our customer as we have determined this amount corresponds directly with the value provided to the customer for our performance completed to date.
NOTE 11: LEASES
We determine if our contractual agreements contain a lease at inception. A lease is identified when a contract allows us the right to control an identified asset for a period of time in exchange for consideration. Our lease agreements consist primarily of operating leases for office space, warehouses, office equipment, trailers, and a small number of intermodal containers. We do not have material financing leases. Frequently, we enter into contractual relationships with a wide variety of transportation companies for freight capacity and utilize those relationships to efficiently and cost-effectively arrange the transport of our customers’ freight. These contracts typically have a term of twelve months or less and do not allow us to direct the use or obtain substantially all of the economic benefits of a specifically identified asset. Accordingly, these agreements are not considered leases.
Our operating leases are included on the consolidated balance sheets as right-of-use lease assets and lease liabilities. A right-of-use lease asset represents our right to use an underlying asset over the term of a lease, while a lease liability represents our obligation to make lease payments arising from the lease. Current and noncurrent lease liabilities are recognized on commencement date at the present value of lease payments, including non-lease components, which consist primarily of common area maintenance and parking charges. Right-of-use lease assets are also recognized on the commencement date as the total lease liability plus prepaid rents. As our leases typically do not provide an implicit rate, we use our fully collateralized incremental borrowing rate based on the information available at commencement date in determining the present value of lease payments. The incremental borrowing rate is influenced by market interest rates, our credit rating, and lease term and as such, may differ for individual leases.
Our lease agreements typically do not contain variable lease payments, residual value guarantees, purchase options, or restrictive covenants. Many of our leases include the option to renew for a period of months to several years. The term of our leases may include the option to renew when it is reasonably certain that we will exercise that option although these occurrences are seldom. We have lease agreements with lease components (e.g., payments for rent) and non-lease components (e.g., payments for common area maintenance and parking), which are all accounted for as a single lease component.
We do not have material lease agreements that have not yet commenced that are expected to create significant rights or obligations as of December 31, 2022.
Information regarding lease expense, remaining lease term, discount rate, and other select lease information is presented below as of December 31, 2022 and 2021, and for the twelve months ended December 31, 2022 and 2021 (dollars in thousands):
| Twelve Months Ended December 31, | |||||||||||||||||
| Lease Costs | 2022 | 2021 | 2020 | ||||||||||||||
| Operating lease expense | $ | $ | $ | ||||||||||||||
| Short-term lease expense | |||||||||||||||||
| Total lease expense | $ | $ | $ | ||||||||||||||
| Twelve Months Ended December 31, | |||||||||||||||||
| Other Lease Information | 2022 | 2021 | 2020 | ||||||||||||||
| Operating cash outflows from operating leases | $ | $ | $ | ||||||||||||||
Right-of-use lease assets obtained in exchange for new lease liabilities(1) | |||||||||||||||||
62
| As of December 31, | |||||||||||
| Lease Term and Discount Rate | 2022 | 2021 | |||||||||
Weighted average remaining lease term (in years)(1) | |||||||||||
| Weighted average discount rate | % | % | |||||||||
________________________________
| Maturity of Lease Liabilities | Operating Leases | |||||||
| 2023 | $ | |||||||
| 2024 | ||||||||
| 2025 | ||||||||
| 2026 | ||||||||
| 2027 | ||||||||
| Thereafter | ||||||||
| Total lease payments | ||||||||
| Less: Interest | ( | |||||||
| Present value of lease liabilities | $ | |||||||
NOTE 12. ALLOWANCE FOR CREDIT LOSSES
Our allowance for credit losses is computed using a number of factors including our historical credit loss experience, customer aging trends, our customers' credit ratings, in addition to other customer-specific factors. We have also considered recent trends and developments related to the current macroeconomic environment in determining our ending allowance for credit losses for both accounts receivable and contract assets. The allowance for credit losses on contract assets was not significant.
A rollforward of our allowance for credit losses on our accounts receivable balance is presented below for the twelve months ended December 31, 2021 and 2022 (in thousands):
| Balance, December 31, 2020 | $ | ||||
| Provision | |||||
| Write-offs | ( | ||||
| Balance, December 31, 2021 | |||||
| Provision | ( | ||||
| Write-offs | ( | ||||
| Balance, December 31, 2022 | $ | ||||
Recoveries of amounts previously written off were not significant for the twelve months ended December 31, 2022.
NOTE 13: CHANGES IN ACCUMULATED OTHER COMPREHENSIVE LOSS
Accumulated other comprehensive loss is included in the Stockholders’ investment on our consolidated balance sheets. The recorded balance as of December 31, 2022 and 2021, was $88.9 million and $61.1 million, respectively, and is comprised solely of foreign currency adjustments, including foreign currency translation.
Other comprehensive loss was $27.7 million for the twelve months ended December 31, 2022, driven primarily by fluctuations in the Yuan, Singapore Dollar, and Australian Dollar. Other comprehensive loss was $15.1 million for the twelve months ended December 31, 2021, driven primarily by fluctuations in the Singapore Dollar and Australian Dollar.
63
NOTE 14: RECENTLY ISSUED ACCOUNTING PRONOUNCEMENTS
NOTE 15: RESTRUCTURING
In 2022, we announced organizational changes to support our enterprise strategy of accelerating our digital transformation and productivity initiatives. We recognized restructuring charges of $36.7 million related to cost saving initiatives including workforce reductions and reprioritizing our investments in technology. For severance and other operating expenses related to restructuring activities, we paid $2.7 million in cash in 2022 with nearly all the remaining $19.0 million expected to be paid in 2023.
A summary of the restructuring charges recognized is presented below (in thousands):
| Twelve Months Ended December 31, | |||||
| 2022 | |||||
Severance(1) | $ | ||||
Other selling, general, and administrative expenses(2) | |||||
Other personnel expenses(1) | |||||
| Total | $ | ||||
(1) Amounts are included within personnel expenses in our consolidated statement of operations.
(2) We recognized expense of $14.8 million related to the impairment of certain capitalized internally developed software projects and $0.4 million related other miscellaneous exit costs within other selling, general, and administrative expenses in our consolidated statement of operations.
The following table summarizes restructuring charges by reportable segment for the twelve months ended December 31, 2022 ($ in thousands):
| NAST | Global Forwarding | All Other and Corporate | Consolidated | ||||||||||||||||||||
| Personnel expenses | $ | $ | $ | $ | |||||||||||||||||||
| Other selling, general, and administrative expenses | |||||||||||||||||||||||
The following table summarizes restructuring reserves included in our consolidated balance sheet as of December 31, 2022:
| Accrued Severance and Other Personnel Expenses | Other Selling, General, and Administrative Expenses | Total | |||||||||||||||
| Balance, December 31, 2021 | $ | $ | $ | ||||||||||||||
| Restructuring charges | |||||||||||||||||
| Cash payments | ( | ( | ( | ||||||||||||||
| Settled non-cash | ( | ( | |||||||||||||||
| Balance, December 31, 2022 | $ | $ | $ | ||||||||||||||
64
ITEM 9. CHANGES IN AND DISAGREEMENTS WITH ACCOUNTANTS ON ACCOUNTING AND FINANCIAL DISCLOSURE
None.
ITEM 9A. CONTROLS AND PROCEDURES
Evaluation of Disclosure Controls and Procedures
We maintain disclosure controls and procedures as defined in Rules 13a-15(e) and 15d-15(e) under the Securities Exchange Act of 1934 (“Exchange Act”) that are designed to provide reasonable assurance that information required to be disclosed by us in reports that we file or submit under the Exchange Act is (i) recorded, processed, summarized, and reported within the time periods specified in SEC rules and forms; and (ii) accumulated and communicated to our management, including our principal executive officer and principal financial officer, as appropriate to allow timely decisions regarding disclosure.
Our management, including our Interim Chief Executive Officer and Chief Financial Officer, assessed the effectiveness of the design and operation of our disclosure controls and procedures (as defined in Rules 13a-15(e) and 15d-15(e) under the Exchange Act) as of December 31, 2022. Based upon that assessment, our Interim Chief Executive Officer and Chief Financial Officer concluded that our disclosure controls and procedures were effective at the reasonable assurance level as of December 31, 2022.
Changes in Internal Control Over Financial Reporting
There were no changes in our internal control over financial reporting (as defined in Rules 13a-15(f) and 15d-15(f) under the Exchange Act) that occurred during the three months ended December 31, 2022, that have materially affected, or are reasonably likely to materially affect, our internal control over financial reporting.
Management’s Report on Internal Control Over Financial Reporting
Our management is responsible for establishing and maintaining adequate internal control over financial reporting as defined in Rules 13a-15(f) and 15d-15(f) under the Exchange Act.
The Company’s internal control over financial reporting is a process designed under the supervision of our Interim Chief Executive Officer and Chief Financial Officer to provide reasonable assurance regarding the reliability of financial reporting and the preparation of our financial statements for external purposes in accordance with generally accepted accounting principles. The Company’s internal control over financial reporting includes those policies and procedures that (i) pertain to the maintenance of records that, in reasonable detail, accurately and fairly reflect the transactions and dispositions of the assets of the Company; (ii) provide reasonable assurance that transactions are recorded as necessary to permit preparation of consolidated financial statements in accordance with generally accepted accounting principles, and that receipts and expenditures of the Company are being made only in accordance with authorizations of management and directors of the Company; and (iii) provide reasonable assurance regarding the prevention or timely detection of unauthorized acquisition, use or disposition of the Company’s assets that could have a material effect on the consolidated financial statements.
Because of its inherent limitations, internal control over financial reporting may not prevent or detect misstatements. Also, projections of any evaluation of effectiveness to future periods are subject to the risk that controls may become inadequate because of changes in conditions, or that the degree of compliance with the policies or procedures may deteriorate.
Management assessed the effectiveness of the Company’s internal control over financial reporting as of December 31, 2022, using the criteria set forth by the Committee of Sponsoring Organizations of the Treadway Commission (COSO) in Internal Control-Integrated Framework (2013). Based on that assessment and the COSO criteria, we concluded that, as of December 31, 2022, the Company maintained effective internal control over financial reporting.
The Company’s independent registered public accounting firm, Deloitte & Touche LLP, has audited the Company’s internal control over financial reporting as of December 31, 2022, and has issued a report that is included in Item 8 of this Annual Report on Form 10-K.
ITEM 9B. OTHER INFORMATION
None
ITEM 9C. DISCLOSURE REGARDING FOREIGN JURISDICTIONS THAT PREVENT INSPECTIONS
None.
65
PART III
ITEM 10. DIRECTORS, EXECUTIVE OFFICERS, AND CORPORATE GOVERNANCE
Information with respect to our Board of Directors contained under the heading “Proposal 1: Election of Directors” in the Proxy Statement, is incorporated in this Form 10-K by reference. Information with respect to our executive officers is provided in Part I, Item 1 of this Form 10-K.
We have adopted a code of ethics that applies to our principal executive officer, principal financial officer, principal accounting officer, directors, and all other company employees performing similar functions. This code of ethics, which is part of our corporate compliance program, is posted on the Investors page of our website at www.chrobinson.com in the Governance Documents section under the caption “Code of Ethics”.
We intend to satisfy the disclosure requirement under Item 10 of Form 8-K regarding an amendment to, or waiver from, a provision of this code of ethics by posting such information on our website, at the web address specified above.
ITEM 11. EXECUTIVE COMPENSATION
The information contained under the headings or subheadings “Compensation of Directors,” and “Executive Compensation” (excluding the information presented under the subheading “Pay Versus Performance”) in the Proxy Statement is incorporated in this Form 10-K by reference.
ITEM 12. SECURITY OWNERSHIP OF CERTAIN BENEFICIAL OWNERS AND MANAGEMENT AND RELATED STOCKHOLDER MATTERS
(a) Equity Compensation Plans
The following table summarizes share and exercise price information about our equity compensation plans as of December 31, 2022:
________________________________
| Plan Category | Number of Securities to Be Issued Upon Exercise of Outstanding Options, Warrants, and Rights(1) | Weighted Average Exercise Price of Outstanding Options, Warrants, and Rights | Number of Securities Remaining Available for Future Issuance Under Equity Compensation Plans (Excluding Securities Reflected in the First Column) (2) | |||||||||||||||||
Equity compensation plans approved by security holders | 5,358,796 | $ | 77.93 | 6,492,529 | ||||||||||||||||
| Equity compensation plans not approved by security holders | — | — | — | |||||||||||||||||
| Total | 5,358,796 | $ | 77.93 | 6,492,529 | ||||||||||||||||
(1) Includes 5,358,796 stock options remaining outstanding for future exercise.
(2)Includes 2,114,989 shares available for issuance under our Employee Stock Purchase Plan and 4,377,540 shares that may become subject to future awards in the form of stock options, restricted stock units, performance shares and performance-based restricted stock units under our 2022 Equity Incentive Plan.
(b) Security Ownership
The information contained under the heading “Security Ownership of Certain Beneficial Owners and Management” in the Proxy Statement is incorporated in this Form 10-K by reference.
ITEM 13. CERTAIN RELATIONSHIPS AND RELATED TRANSACTIONS, AND DIRECTOR INDEPENDENCE
The information contained under the heading “Related Party Transactions” in the Proxy Statement is incorporated in this Form 10-K by reference.
ITEM 14. PRINCIPAL ACCOUNTING FEES AND SERVICES
The information contained under the heading “Proposal 4: Ratification of the Selection of Independent Auditors” in the Proxy Statement is incorporated in this Form 10-K by reference.
66
PART IV
ITEM 15. EXHIBITS, AND FINANCIAL STATEMENT SCHEDULES
(a)The following documents are filed as part of this report:
(1)The Company’s 2022 Consolidated Financial Statements and the Report of Independent Registered Public Accounting Firm are included in Part II, Item 8. Financial Statements and Supplementary Data.
a.Deloitte & Touche LLP (PCAOB ID No. 34 )
b.Location: Minneapolis, Minnesota
(2)All financial statement schedules are omitted as the required information is inapplicable or the information is presented in the consolidated financial statements or related notes.
(b)Index to Exhibits-Any document incorporated by reference is identified by a parenthetical referencing the SEC filing, which included the document. We will furnish a copy of any Exhibit at no cost to a security holder upon request.
67
INDEX TO EXHIBITS
| Number | Description | ||||||||||
| 3.1 | |||||||||||
| 3.2 | |||||||||||
| 4.1 | |||||||||||
| 4.2 | |||||||||||
| 4.3 | |||||||||||
| 4.4 | |||||||||||
| †10.1 | |||||||||||
| †10.2 | |||||||||||
| †10.3 | |||||||||||
| 10.4 | |||||||||||
| 10.5 | |||||||||||
| 10.6 | |||||||||||
| 10.7 | |||||||||||
| 10.8 | |||||||||||
| 10.9 | |||||||||||
| 10.10 | |||||||||||
| 10.11 | |||||||||||
| 10.12 | |||||||||||
| 10.13 | |||||||||||
| †10.14 | |||||||||||
68
| †10.15 | |||||||||||
| †10.16 | |||||||||||
| †10.17 | |||||||||||
| †10.18 | |||||||||||
| †10.19 | |||||||||||
| †10.20 | |||||||||||
| †10.21 | |||||||||||
| †10.22 | |||||||||||
| †10.23 | |||||||||||
| †10.24 | |||||||||||
| †10.25 | |||||||||||
| †10.26 | |||||||||||
| †10.27 | |||||||||||
| †10.28 | |||||||||||
| †10.29 | |||||||||||
| †10.30 | |||||||||||
| †10.31 | |||||||||||
| *21 | |||||||||||
| *23.1 | |||||||||||
| *24 | |||||||||||
| *31.1 | |||||||||||
| *31.2 | |||||||||||
| *32.1 | |||||||||||
| *32.2 | |||||||||||
| *101 | The following financial statements from our Annual Report on Form 10-K for the year ended December 31, 2022, filed on February 17, 2023, formatted in Inline XBRL: (i) Consolidated Statements of Operations and Comprehensive Income for the years ended December 31, 2022, 2021, and 2020, (ii) Consolidated Balance Sheets as of December 31, 2022 and 2021, (iii) Consolidated Statements of Cash Flows for the years ended December 31, 2022, 2021, and 2020, (iv) Consolidated Statements of Stockholders’ Investment for the years ended 2022, 2021, and 2020, and (v) the Notes to the Consolidated Financial Statements, tagged as blocks of text. | ||||||||||
69
| 104 | The cover page from the Current Report on Form 10-K formatted in Inline XBRL | ||||||||||
| * | Filed herewith | ||||
| † | Management contract or compensatory plan or arrangement required to be filed as an exhibit to Form 10-K pursuant to Item 15(c) of the Form 10-K Report | ||||
ITEM 16. FORM 10-K SUMMARY
None.
70
SIGNATURES
Pursuant to the requirements of the Section 13 or 15(d) of the Securities Exchange Act of 1934, the registrant has duly caused this Report to be signed on its behalf by the undersigned, thereunto duly authorized, in the City of Eden Prairie, State of Minnesota, on February 17, 2023.
| C.H. ROBINSON WORLDWIDE, INC. | ||||||||
| By: | /s/ BEN G. CAMPBELL | |||||||
| Ben G. Campbell | ||||||||
| Chief Legal Officer and Secretary | ||||||||
Pursuant to the requirements of the Securities Exchange Act of 1934, this Report has been signed below by the following persons on behalf of the registrant and in the capacities indicated on February 17, 2023.
| Signature | Title | |||||||
| /s/ SCOTT P. ANDERSON | Interim Chief Executive Officer (Principal Executive Officer) | |||||||
| Scott P. Anderson | ||||||||
| /s/ MICHAEL P. ZECHMEISTER | Chief Financial Officer (Principal Financial Officer and Principal Accounting Officer) | |||||||
| Michael P. Zechmeister | ||||||||
| * | Chair of the Board | |||||||
| Jodee A. Kozlak | ||||||||
| * | Director | |||||||
| James J. Barber, Jr. | ||||||||
| * | Director | |||||||
| Kermit R. Crawford | ||||||||
| * | Director | |||||||
| Timothy C. Gokey | ||||||||
| * | Director | |||||||
| Mark A. Goodburn | ||||||||
| * | Director | |||||||
| Mary J. Steele Guilfoile | ||||||||
| * | Director | |||||||
| Henry J. Maier | ||||||||
| * | Director | |||||||
| James B. Stake | ||||||||
| * | Director | |||||||
| Paula C. Tolliver | ||||||||
| * | Director | |||||||
| Henry W. Winship | ||||||||
| *By: | /s/ BEN G. CAMPBELL | |||||||
| Ben G. Campbell | ||||||||
| Attorney-in-Fact | ||||||||
71
ATTACHMENTS / EXHIBITS
XBRL TAXONOMY EXTENSION SCHEMA DOCUMENT
XBRL TAXONOMY EXTENSION CALCULATION LINKBASE DOCUMENT
XBRL TAXONOMY EXTENSION DEFINITION LINKBASE DOCUMENT
XBRL TAXONOMY EXTENSION LABEL LINKBASE DOCUMENT
Serious News for Serious Traders! Try StreetInsider.com Premium Free!
You May Also Be Interested In
- Wolfe Research Upgrades C.H. Robinson Worldwide (CHRW) to Peerperform
- Cochlear receives FDA clearance to lower the age for the Osia System to 5-years-old
- The Center for Arts & Innovation Reveals First Concept Designed by Pritzker Prize-Winning Architect Renzo Piano and Renzo Piano Building Workshop
Create E-mail Alert Related Categories
SEC FilingsSign up for StreetInsider Free!
Receive full access to all new and archived articles, unlimited portfolio tracking, e-mail alerts, custom newswires and RSS feeds - and more!
