

Form 10-K BrightSphere Investment For: Dec 31
 Tweet
Tweet Share
ShareUNITED STATES
SECURITIES AND EXCHANGE COMMISSION
Washington, D.C. 20549
FORM 10-K
(Mark One)
For the fiscal year ended December 31 , 2020
OR
For the transition period from to
Commission File Number 001-38979
 | ||||||||
(Exact name of registrant as specified in its charter)
| (State or other jurisdiction of incorporation or organization) | (I.R.S. Employer Identification No.) | |||||||
| (Address of principal executive offices) | (Zip Code) | |||||||
(617 )-369-7300
(Registrant’s telephone number, including area code)
Securities registered pursuant to Section 12(b) of the Act:
| Title of each class | Ticker Symbol | Name of each exchange on which registered | ||||||
Securities registered pursuant to Section 12(g) of the Act: None.
Indicate by check mark if the registrant is a well-known seasoned issuer, as defined in Rule 405 of the Securities Act. Yes ☒ No ☐
Indicate by check mark if the registrant is not required to file reports pursuant to Section 13 or Section 15(d) of the Act. Yes ☐ No ☒
Indicate by check mark whether the registrant (1) has filed all reports required to be filed by Section 13 or 15(d) of the Securities Exchange Act of 1934 during the preceding 12 months (or for such shorter period that the Registrant was required to file such reports), and (2) has been subject to such filing requirements for the past 90 days. Yes ☒ No ☐
Indicate by check mark whether the registrant has submitted electronically every Interactive Data File required to be submitted pursuant to Rule 405 of Regulation S-T (§232.405 of this chapter) during the preceding 12 months (or for such shorter period that the registrant was required to submit such files). Yes ☒ No ☐
Indicate by check mark if disclosure of delinquent filers pursuant to Item 405 of Regulation S-K (229.405 of this chapter) is not contained herein, and will not be contained, to the best of registrant’s knowledge, in definitive proxy or information statements incorporated by reference in Part III of this Form 10-K or any amendment to this Form 10-K. ☐
Indicate by check mark whether the registrant is a large accelerated filer, an accelerated filer, a non-accelerated filer, a smaller reporting company, or an emerging growth company. See the definitions of “large accelerated filer,” “accelerated filer,” “smaller reporting company” and “emerging growth company” in Rule 12b-2 of the Exchange Act. (Check one):
| ☒ | Accelerated filer | ☐ | Smaller reporting company | ||||||||||||||
Non-accelerated filer | ☐ | Emerging growth company | |||||||||||||||
If an emerging growth company, indicate by check mark if the Registrant has elected not to use the extended transition period for complying with any new or revised financial accounting standards provided pursuant to Section 13(a) of the Exchange Act. ☐
Indicate by check mark whether the registrant has filed a report on and attestation to its management’s assessment of the effectiveness of its internal control over financial reporting under Section 404(b) of the Sarbanes-Oxley Act (15 U.S.C. 7262(b)) by the registered public accounting firm that prepared or issued its audit report. ☒
Indicate by check mark whether the Registrant is a shell company (as defined in Rule 12b-2 of the Act). Yes ☐ No ☒
At June 30, 2020, the aggregate market value of the shares of common stock held by non-affiliates of the registrant, based upon the closing price of $12.46 on that date on the New York Stock Exchange, was $653,651,438 . Calculation of holdings by non-affiliates is based upon the assumption, for this purpose only, that executive officers, directors and any persons holding 10% or more of the registrant’s shares of common stock are affiliates. There were 79,399,859 shares of the registrant’s shares of common stock outstanding on February 25, 2021.
DOCUMENTS INCORPORATED BY REFERENCE
TABLE OF CONTENTS
| Page | ||||||||
| Part I | ||||||||
| Item 1. | ||||||||
| Item 1A. | ||||||||
| Item 1B. | ||||||||
| Item 2. | ||||||||
| Item 3. | ||||||||
| Item 4. | ||||||||
| Part II | ||||||||
| Item 5. | ||||||||
| Item 6. | ||||||||
| Item 7. | ||||||||
| Item 7A. | ||||||||
| Item 8. | ||||||||
| Item 9. | ||||||||
| Item 9A. | ||||||||
| Item 9B. | ||||||||
| Part III | ||||||||
| Item 10. | ||||||||
| Item 11. | ||||||||
| Item 12. | ||||||||
| Item 13. | ||||||||
| Item 14. | ||||||||
| Part IV | ||||||||
| Item 15. | ||||||||
| Item 16. | ||||||||
EXPLANATORY NOTE
On July 12, 2019, the BrightSphere corporate group, which consisted of BrightSphere Investment Group plc, a public company limited by shares incorporated under the laws of England and Wales and its operating subsidiaries (such operating subsidiaries and the holding company collectively, the “BrightSphere Group”), completed a redomestication, resulting in BrightSphere Investment Group Inc., a Delaware corporation, becoming the publicly traded parent company of the BrightSphere Group (the “Redomestication”). As part of the Redomestication, which was approved by the shareholders of BrightSphere Investment Group plc, existing shares of BrightSphere Investment Group plc were exchanged on a one-for-one basis for newly issued shares of common stock of BrightSphere Investment Group Inc. immediately prior to the effective time of the Redomestication. As a result, all outstanding shareholders of BrightSphere Investment Group plc became common stockholders of BrightSphere Investment Group Inc. Throughout this Annual Report on Form 10-K, references to “BrightSphere,” “the Company,” “we” and “us” (i) for periods until the completion of the Redomestication, refer to BrightSphere Investment Group plc and (ii) for periods after the completion of the Redomestication, refer to BrightSphere Investment Group Inc. Also throughout this Annual Report on Form 10-K, we refer to our equity securities (i) for periods until the completion of the Redomestication, as ordinary shares and (ii) for periods after the completion of the Redomestication, as shares of common stock.
1
Forward-Looking Statements
This Annual Report on Form 10-K includes forward-looking statements, as that term is used in the Private Securities Litigation Reform Act of 1995, including information relating to anticipated revenues, margins or earnings, anticipated performance of our business, expected future net cash flows and the sufficiency of capital resources, our anticipated expense levels, expectations regarding market conditions and the closing of our sale of Investment Counselors of Maryland. The words or phrases “will likely result,” “are expected to,” “will continue,” “is anticipated,” “can be,” “may be,” “aim to,” “may affect,” “may depend,” “intends,” “expects,” “believes,” “estimate,” “plan,” “project,” and other similar expressions are intended to identify such forward-looking statements. Such statements are subject to various known and unknown risks and uncertainties and we caution readers that any forward-looking information provided by or on behalf of us is not a guarantee of future performance.
Actual results may differ materially from those in forward-looking information as a result of various factors including but not limited to our dependence on our Affiliates, reliance on key personnel, the potential for reputational harm, actual or potential conflicts of interest, potential losses on seed and co-investment capital, foreign currency exchange risk, litigation risk, competition, risks associated with governmental regulation, and other risks discussed under the heading “Risk Factors” in Item 1A of this Annual Report on Form 10-K. Due to such risks and uncertainties and other factors, we caution each person receiving such forward-looking information not to place undue reliance on such statements. Further, such forward-looking statements speak only as of the date of this Annual Report on Form 10-K and we undertake no obligations to update any forward looking statement to reflect events or circumstances after the date of this Annual Report on Form 10-K or to reflect the occurrence of unanticipated events.
Unless we state otherwise or the context otherwise requires, references in this Annual Report on Form 10-K to “BrightSphere” or “BSIG” refer to BrightSphere Investment Group Inc., references to the “Company” and references to “we,” “our” and “us” refer to BSIG and its consolidated subsidiaries and equity-accounted Affiliate, excluding discontinued operations. References to the “Center” refer to the holding company excluding the Affiliates and/or BrightSphere Inc., or BSUS, a Delaware corporation and wholly owned subsidiary of BSIG. Unless we state otherwise or the context otherwise requires, references in this Annual Report on Form 10-K to “Affiliates” or an “Affiliate” refer to the asset management firms in which we have an ownership interest, and references to our Affiliates’ sponsored investment entities are “Funds.” References in this Annual Report on Form 10-K to “OM plc” refer to Old Mutual plc, our former parent. References to the “Offering” refer to our initial public offering which occurred on October 8, 2014. None of the information in this Annual Report on Form 10-K constitutes either an offer or a solicitation to buy or sell any of our Affiliates’ products or services, nor is any such information a recommendation for any of our Affiliates’ products or services.
Performance measures used in this report
We present economic net income, or ENI, to help us describe our operating and financial performance. ENI is the key measure our management uses to evaluate the financial performance of, and make operational decisions for, our business. ENI is not audited, and is not a substitute for net income or other performance measures that are derived in accordance with accounting principles generally accepted in the United States, or U.S. GAAP. Furthermore, our calculation of ENI may differ from similarly titled measures provided by other companies. Please refer to “Item 7. Management’s Discussion and Analysis of Financial Condition and Results of Operations—Non-GAAP Supplemental Performance Measure—Economic Net Income and Segment Analysis” for a more thorough discussion of ENI and a reconciliation of ENI to U.S. GAAP net income.
2
PART I
Item 1. Business.
Overview
We are a global, diversified asset management company with $156.7 billion of assets under management as of December 31, 2020. We operate our business through our five Affiliates.
We ensure that key management professionals at each Affiliate retain meaningful levels of equity in their own businesses to maintain strong alignment of interests between us, our Affiliates, their clients, and our shareholders. Our approach to investing in Affiliates includes a profit-sharing arrangement to provide incentives for growth and prudent business management across multiple generations of Affiliate partners.
We have broad and deep experience in working with asset managers. Our collaboration with our Affiliates extends to the commitment of seed and co-investment capital to launch new products and investment capital to financially support new growth initiatives.
Currently, our business comprises interests in the following Segments:
(1)On July 24, 2020, we sold all of our equity interests in Copper Rock, a former Affiliate in the Liquid Alpha segment, to Spouting Rock Asset Management LLC. On November 17, 2020, we completed the sale of all of our equity interests in Barrow Hanley, a former Affiliate in the Liquid Alpha segment, to Perpetual U.S. Holdings Company Inc. (“Perpetual”). On February 6, 2021, we entered into a definitive agreement to sell all our interests in ICM, an Affiliate in the Liquid Alpha segment. The transaction is expected to close during second quarter of 2021.
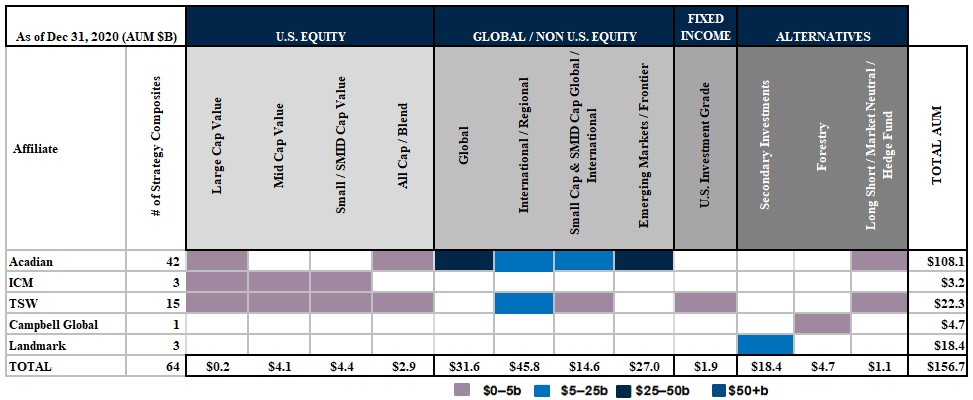
Our diversification, by Affiliate, asset class, geography and investment strategy, enhances relative earnings stability and provides multiple sources of growth for us. Collectively, our Affiliates offer 64 distinct, active investment strategies in U.S., global, international and emerging markets equities; U.S. fixed income; and alternative investments, including forestry and secondary strategies. In addition, there is significant diversification within each of our Affiliate firms through the breadth of their respective investment capabilities. We believe our Affiliates have generated competitive absolute and relative performance returns.
3
Through our Affiliates, we serve a diverse investor base in the institutional and sub-advisory channels in the U.S. and around the world. These clients are highly sophisticated, value the stability and equity ownership of our Affiliates, and typically reward our Affiliates’ strong process-driven investment performance with long-term relationships and asset flows. Our sub-advisory clients also provide access to the retail and defined-contribution marketplace where decision makers take a more institutional approach to choosing asset management providers. Our Affiliates currently manage assets for non-U.S. clients in approximately 29 countries, including Australia, Canada, Ireland,, Denmark, the Netherlands, China and the United Kingdom.
Competitive Strengths
We believe our success as an asset management company is driven by the following competitive strengths:
Well-Established, Diverse Affiliates. Through our five current Affiliates, we are well-diversified by brand, strategy and asset class, providing multiple sources of revenue and growth opportunities for our business across global market cycles, while limiting downside risk. Each Affiliate has its own brand and investment processes and generally operates in distinct asset classes. Our assets under management across Affiliates are invested in both global/non-U.S. and U.S. equities (75.9% and 7.4%, respectively) and alternative assets including forestry and secondary strategies focused in real estate, infrastructure, and private equity, as well as fixed income. We are also well-diversified by investment strategy within each asset class, with 64 distinct investment strategy composites. The breadth of our investment capabilities and distinct brand identities appeal to a wide range of clients. We have a well-diversified client base with low levels of client concentration. Our business serves over 550 institutional and sub-advisory clients, with our top 25 client relationships representing approximately 25% of run rate gross management fee revenue, including our equity-accounted Affiliate, as of December 31, 2020. Total run rate gross management fee revenue reflects the sum for each account at each of our five Affiliates, of the product of (a) assets under management in each account at December 31, 2020, multiplied by (b) the relevant management fee rate on that account. This calculation includes all accounts at our equity-accounted Affiliate.
Differentiated Model Drives Growth. We have a two-pronged approach for successfully collaborating with our Affiliate firms. First, we align our interests with those of our Affiliates by providing Affiliate partners with equity in their own firms and through a profit-sharing structure that sets bonuses as a percentage of pre-bonus profit. This structure gives our Affiliate partners meaningful wealth creation opportunities through equity ownership and encourages investments in long-term growth while maintaining an appropriate focus on profitability, efficient capital management and risk control. Second, we offer our Affiliates financial support to grow and enhance their businesses through the investment of seed and co-investment capital to help launch new investment strategies.
Track Record of Competitive Investment Performance Across Market Cycles. Our Affiliates have produced competitive long-term investment performance across their product offerings, generating outperformance relative to benchmarks across market cycles. Through December 31, 2020, 46 of our Affiliates’ 59 strategies that have performance benchmarks have outperformed their relevant benchmarks since inception. These strategies represent 94% of the total assets in the 59 strategies that have performance benchmarks. Investment performance is calculated on a gross basis, excluding the impact of management, administration, and performance fees. Based on our current average management fee rate, investment returns net of fees would be on average approximately 40 bps lower than gross returns (excluding products which are not benchmarked). For the rolling 10-year period ending December 31, 2020, approximately 88% of benchmarked assets have outperformed their relevant benchmarks. Our Affiliates’ four largest benchmarked investment strategies, Acadian Asset Management (AAM) Emerging Markets Equity, AAM Global Equity, Thompson, Siegel & Walmsley LLC (TSW) International, and AAM Global Managed Volatility, have each outperformed their relevant benchmarks since inception by 2.2%, 1.5%, 1.4%, and 0.2%, respectively, on an annualized basis.
4
Attractive Financial Model. Our model has generated strong, recurring free cash flow to our business that we can use for growth initiatives on behalf of our Affiliates, return to shareholders through dividends and stock repurchases, repay outstanding debt obligations or in certain circumstances, use to make investments in new Affiliates. Our revenue consists largely of recurring management fees on assets under management and is not heavily dependent upon more volatile performance fees. We earn an attractive margin on revenue enhanced by our profit-sharing model that enables us to participate directly in margin expansion as our Affiliates grow. Our U.S. GAAP operating margin was 23% for 2016 (23% excluding consolidated Funds) and 25% for 2020 (24% excluding consolidated Funds). Our comparable ENI operating margin (calculated before Affiliate key employee distributions) was 35% in 2016 and 35% in 2020 as we continued to invest in the business.
Growth Strategy
We strive to maintain and enhance the characteristics which have made our Affiliates market leaders in their areas of expertise. Growth initiatives are primarily driven by our Affiliates, who by virtue of their day to day management of their operations are able to identify new products and business opportunities. We seek to support their growth through capital deployment and strategic guidance. Our Affiliates are strong investment management firms with highly-defined and rigorous investment strategies for which there is real demand in the institutional marketplace. Our Affiliates have excellent long-term performance records and have generated strong growth through net client revenue flows. See “—Overview of Current Affiliates.”
Our Operating Model and Holding Company Activities
Overview
We manage our business through five Affiliates, each of which operates autonomously and employs its own distinct investment processes. Our collaboration with our Affiliates primarily extends to the commitment of seed and co-investment capital to launch new products and investment capital to financially support new growth initiatives. We also encourage our Affiliates to pursue inorganic growth opportunities such as team lift outs and bolt-on acquisitions and are willing to provide strategic advice and capital support in these endeavors. We align incentives with our Affiliates through our partnership structure, which provides employee partners of our Affiliates with equity in their respective firms through an equity recycling program, and participation in established profit-sharing arrangements.
Affiliate Partnership Model
We are a partner dedicated to providing our Affiliates with operational autonomy in a structure that aligns our common economic interests. By offering Affiliate management direct participation in the growth and profitability of their businesses through equity ownership and a profit-share-based bonus pool, we provide our Affiliates with a strong incentive to manage their businesses for the long-term, investing with us to build equity value over time.
•Affiliate Operating Autonomy. Affiliates retain day-to-day operating autonomy over their businesses, including decisions related to hiring, compensation, investment processes, product distribution and branding. We retain oversight through Affiliate board representation, remuneration committee participation, and certain approval rights, including approval of each Affiliate’s annual business plan.
•Affiliate Partners Have Retained Equity in their Own Firms. Partners in each of our Affiliates own meaningful equity positions in their respective businesses. Among our consolidated Affiliates, their equity stakes generally range from approximately 20% to 40%, in some cases following a distribution preference to BSIG. We may facilitate the recycling of Affiliate equity to the next generation of Affiliate partners. When this occurs, the impact to us is generally cash-neutral.
5
•Profit-Share Economics. Rather than invest in a fixed percentage of Affiliate revenues (a “revenue-share” model), Affiliate partners and we each invest in the underlying profits of their respective businesses, a model we refer to as a “profit-share” model (with the exception of ICM, which has a legacy revenue-share model that was not restructured). Distributions of profit to the Affiliate equity-holders are based on their proportionate ownership of their businesses, in some cases following a preferred return to us. In addition, bonus pools for Affiliates are typically contractually set at 25% to 35% of Affiliate pre-bonus profit. This enables us to participate in the margin increases of our Affiliates, while incentivizing Affiliate management and us to jointly support growth initiatives. For additional information on our profit-sharing model, see “Management’s Discussion and Analysis of Financial Condition and Results of Operations—The Economics of Our Business.”
Collaborative Growth Initiatives
Our collaboration with Affiliates generally consists of the following:
•Seed Capital. As of December 31, 2020, we have approximately $24 million committed to seed capital, which is currently invested in six products across four different asset classes. Our Affiliates’ use of seed capital generally falls into two categories: incubation capital and scale capital. Incubation capital is used to establish a track record for a new investment strategy. These new strategies generally take three to five years to season to the point where they are recommended by consultants or become attractive for clients. Alternatively, scale capital is used to extend a product with an established track record into a co-mingled fund, and is generally outstanding for a shorter period of time. Scale capital allows third-party clients to invest in the new fund without individually representing too substantial a percentage of the vehicle. Over $9 billion of our current AUM are in products which have been seeded by us since 2004, and our seeding program has generated an annualized internal rate of return of approximately 24% over this period, including investment returns on the seeded products and the incremental value generated by third party assets raised, including annual profits and a terminal value.
•Co-Investment Capital. We also provide co-investment capital to support the formation of closed-end, long-term partnerships managed by our Affiliates. These fixed-life partnerships typically require us and/or the Affiliate or its employees to invest 1% to 3% of the product’s capital to align interests with those of their clients. Of our current $46 million portfolio of co-investments at fair value, 15% is managed by Campbell Global (investing in forestry), 75% is managed by Landmark Partners (investing in secondary strategies), and 11% remains managed by Heitman LLC (“Heitman”), a former Affiliate (investing in real estate). As part of the sale of our interest in Heitman to its management, we retained our co-investment interests in Heitman-managed funds as well as any carried interest associated with these investments. In consideration for providing co-investment capital, which is typically illiquid for approximately seven to ten years, we receive returns on our underlying partnership investment, our proportionate share of profits on assets in the fund, and the potential for fund incentive fee allocations.
•Inorganic Growth Opportunities. We provide strategic advice and capital support to our Affiliates in pursuing inorganic growth opportunities such as team lift outs and bolt-on acquisitions when such opportunities emerge.
6
Capital Management
Our asset management business generates significant, recurring free cash flow that can be re-invested in the growth-oriented strategies described above to create value for our shareholders. Strategic and efficient management of our capital underpins our approach to investing in these strategies. In particular, we believe we can generate strong returns on allocated capital by (i) providing seed capital to fund new products and strategies; (ii) committing co-investment capital to launch new fund partnerships in which our Affiliates act as the general partner; (iii) providing investment capital to support organic growth; and (iv) implementing opportunistic share repurchase programs. Management undertakes detailed business case analyses with respect to all growth opportunities, and only considers those that yield an acceptable return while operating within the parameters of our risk appetite. For the period January 1, 2016 to December 31, 2020, we have repurchased approximately 36% of our shares.
7
Overview of Current Affiliates

Acadian Asset Management LLC, or Acadian ($108.1 billion in AUM as of December 31, 2020), founded in 1986, is a leading quantitative investment manager of active global, international equity, and alternative strategies. The firm pursues a fundamentally-grounded, data rich and highly structured approach to investing that seeks to identify and exploit systematic and structural inefficiencies in the markets. Acadian applies a range of investment and risk considerations to a universe of over 43,000 securities taken from 200 global markets. Managed strategies include global, international and emerging markets equities, long/short strategies, and managed volatility strategies. Its flagship Emerging Markets Equity strategy has outperformed its benchmark, MSCI Emerging Markets (Net), by 2.2% (USD, gross of fees) on an annualized basis since its inception in 1994 through December 31, 2020.
Acadian invests on behalf of a wide range of institutional clients across the globe, including public and private funds, endowments and foundations, and retail clients through sub-advisory channels. The firm’s clients are domiciled in 19 countries across Asia, Australia, Europe and North America. Acadian’s management team is led by Co-Chief Executive Officers Ross Dowd and John Chisholm, and Acadian’s Chief Investment Officer, Brendan Bradley. The firm has over 100 investment and research professionals and manages over 70 distinct investment products and strategies.

Campbell Global LLC, or Campbell Global ($4.7 billion in AUM as of December 31, 2020), is a global investment manager focused on forestland. They are widely recognized as an authority on both forest management and investing. Based in Portland, Oregon, Campbell Global has more than three decades of experience in timberland management and value creation. A pioneer in the field, over the last 35 years they have managed more than 5.3 million acres (2.1 million hectares) worldwide for pension funds, endowments, foundations and other global institutional investors. At Campbell Global, responsible investing is not a box they check. It is a fundamental belief and a core practice. They remain true to the values they live by while creating exceptional value for their clients. Campbell Global takes an innovative approach to responsible investing, including developing strategies for carbon sequestration and forest restoration. Campbell Global combines ingenuity, data-supported decision making and a passion for responsible investing to deliver the best possible performance to their clients.
As of December 31, 2020, the firm employed 159 individuals and managed nearly 1.7 million acres (0.7 million hectares) in North America, Australasia, and Latin America. Campbell Global’s management team is led by Chief Executive Officer and Chairman John Gilleland and Angie Davis, President and Managing Director. The firm has 32 investment professionals managing its investment portfolios.
8
Overview of Current Affiliates (cont.)

Investment Counselors of Maryland, LLC,(1) or ICM ($3.2 billion in AUM as of December 31, 2020), founded in 1972, focuses on value-driven equities and invests through a well-established, bottom-up investment process that it applies with an emphasis on small- and mid-cap companies. The firm employs a team orientation in making investment decisions. Each member of ICM’s investment team has a sector focus and is responsible for generating and analyzing ideas within that sector. The most promising investment ideas are reviewed by the entire team, and the ultimate buy/sell decisions are made by the respective portfolio manager teams.
For over four decades, ICM has been managing assets for institutional clients and high net worth individuals through separate accounts and an institutional mutual fund, and has generated excellent results for its clients over this time. ICM’s management team is led by Managing Partner and Chief Investment Officer, William V. Heaphy. The firm has eight investment professionals managing three distinct investment strategies.
(1)Accounted for under the equity method of accounting. On February 6, 2021, we entered into a definitive agreement to sell all our interests in ICM. The transaction is expected to close during second quarter of 2021.

Landmark Partners, LLC, or Landmark ($18.4 billion in AUM as of December 31, 2020), founded in 1989 and acquired by us in August 2016, specializes in secondary market transactions of private equity, real estate and infrastructure investments. The firm has one of the longest track records in the industry and is a leading source of liquidity to owners of interests in real estate, real asset, venture, mezzanine and buyout limited partnerships. Landmark has formed 34 funds over the last 31 years. These funds have been capitalized at more than $28.6 billion, which has been deployed across over 2,420 partnership interests that comprise over 29,100 underlying company and property investments.
Landmark’s investor base is mostly comprised of institutional investors including: sovereign wealth funds, public pensions, corporate pensions, insurance companies, asset managers and foundations located globally.
Landmark is led by President and Managing Partner, Timothy Haviland and Chairman and Managing Partner, Francisco Borges, supported by a team of eighteen Partners. As of December 31, 2020, Landmark employed 150 individuals across six offices in Simsbury, CT; Boston, MA; New York, NY; and Dallas, TX in the United States, together with London in the United Kingdom and a newly opened office in Hong Kong China.
9
Overview of Current Affiliates (cont.)

Thompson, Siegel & Walmsley LLC, or TSW ($22.3 billion in AUM as of December 31, 2020), founded in 1969, applies a value-oriented investment approach across a range of products in U.S. and international equities, fixed income and alternative investments. TSW’s singular investment objective is to outperform its benchmarks, net of fees, over rolling three- to five-year periods. TSW employs a proprietary screening process to generate focused lists of companies that are most attractive within different market capitalization ranges. The firm’s investment teams then use fundamental analysis to construct portfolios, which they believe possess catalysts that can unlock value.
TSW has a diverse client base that includes corporations, public pensions, high-net-worth families and individuals, and sub-advisory clients and has a history of providing investors with strong long-term results. The firm’s management team is led by Chief Executive Officer Frank Reichel, President John Reifsnider, and Director of Operations, Lori Anderson. The firm has 21 investment professionals managing approximately fifteen investment strategy composites.
10
Distribution Model and Client Base
Our distribution is focused on the institutional and sub-advisory channels, reached through Affiliate-led sales efforts. During the year ended December 31, 2020 we repositioned our distribution strategy and discontinued supplemental distribution efforts from the Center. As a result all distribution activities are concentrated at the Affiliate level. Our Affiliates have teams of established sales and client service professionals with broad and deep relationships across the major segments of the institutional investor community. In aggregate, our Affiliates service over 550 institutional and sub-advisory clients.
The institutional channel accounts for 79% of our AUM. Within this channel, we have strong relationships in the public/government pension market (43% of our AUM) and the corporate plan market (14% of our AUM), which comprise a substantial portion of the institutional investment market overall, particularly in the U.S. Our institutional marketplace clients are highly diverse across segments and geographies and have various growth characteristics.
While our Affiliates market primarily to institutional investors, we participate in the individual investor market through the sub-advisory channel, which represents 15% of our AUM. Within this channel, we manage assets for mutual funds, giving us exposure to a retail investor base and the defined contribution market. We have approximately 55 sub-advisory mandates on approximately 30 leading platforms, including Transamerica, SEI, and Strategic Advisors Inc (SAI). Our top ten sub-advisory relationships account for approximately 14% of AUM and 8% of run rate gross management fee revenue, including our equity-accounted Affiliate, and have an average tenure of over ten years.
Across our Affiliates, our client base is highly diverse with no significant concentration in our portfolio, though some Affiliates may have client exposures that are meaningful to their individual businesses. As of December 31, 2020, our Affiliates’ top five client relationships represented 10% of total run rate gross management fee revenue, including our equity-accounted Affiliate, and our Affiliates’ top 25 clients represented 25% of run rate gross management fee revenue, including our equity-accounted Affiliate.
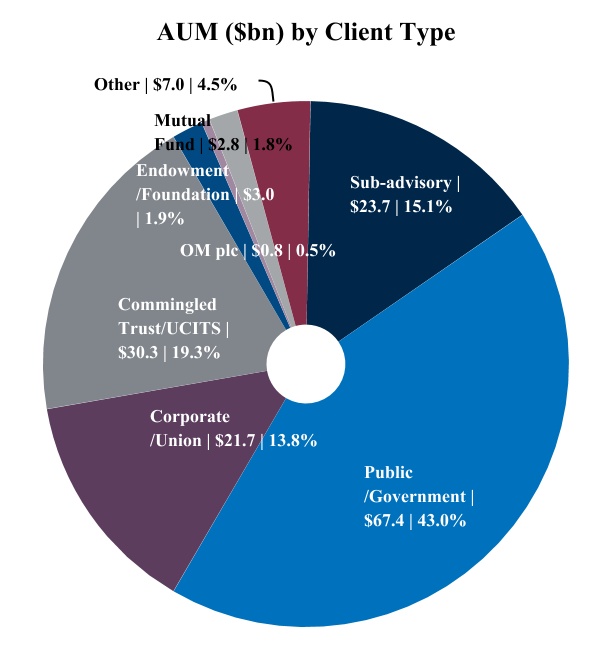
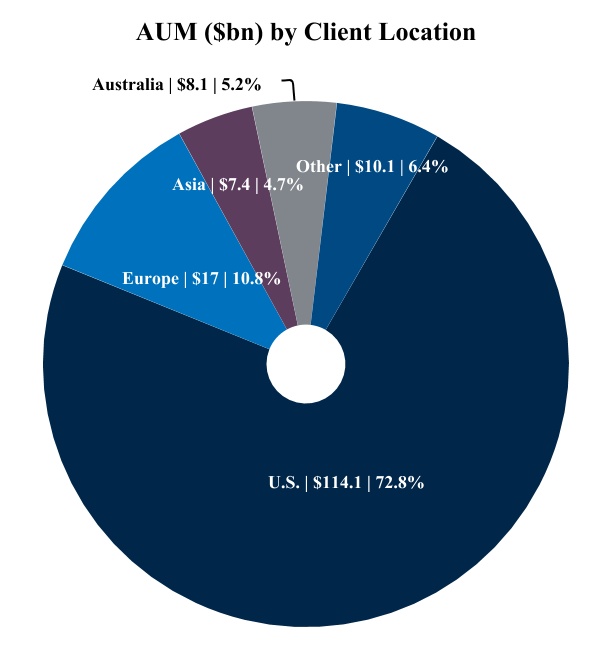
| Total AUM: | $156.7 bn | ||||
Data as of December 31, 2020
11
Segments
We continually monitor and review our segment reporting structure in accordance with authoritative guidance to determine whether any changes have occurred that would impact its reportable segments. Our segment reporting structure is based on our various investment strategies. We have the following business segments:
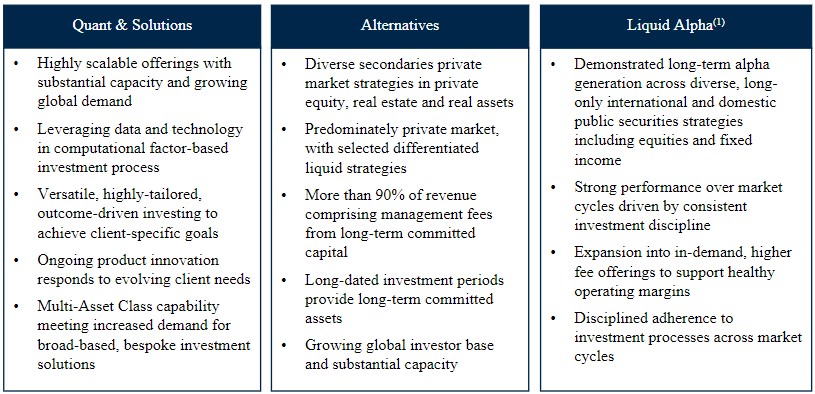
•Quant & Solutions—comprised of versatile, often highly-tailored strategies that leverage data and technology in a computational, factor-based investment process across a range of asset classes and geographies, including Global, non-U.S., and emerging markets equities, as well as multi-asset and managed volatility products.
•Alternatives—comprised of illiquid and differentiated liquid investment strategies that include private equity, real estate and real assets, including forestry, as well as a growing suite of liquid alternative capabilities in areas such as long/short, market neutral and absolute return.
•Liquid Alpha(1)—comprised of specialized investment strategies with a focus on alpha-generation across market cycles in long-only small-, mid-, and large-cap U.S. and non-U.S. equities, as well as fixed income.
(1)On July 24, 2020, we sold all of our equity interests in Copper Rock, a former Affiliate in the Liquid Alpha segment, to Spouting Rock Asset Management LLC. On November 17, 2020, we completed the sale of all of our equity interests in Barrow Hanley, a former Affiliate in the Liquid Alpha segment, to Perpetual U.S. Holdings Company Inc. (“Perpetual”). On February 6, 2021, we entered into a definitive agreement to sell all our interests in ICM, an Affiliate in the Liquid Alpha segment. The transaction is expected to close during second quarter of 2021.
Products and Investment Performance
Product Mix
Our Affiliates offer leading products in U.S., global, international and emerging markets equities; U.S. fixed income; and alternative investments, including forestry and secondary strategies.
The chart below presents our assets under management by asset class and illustrates the diversification benefits of our business model. Each of the five major asset classes provides a balanced earnings stream to our business. Moreover, within our three largest asset classes of revenue — international equity, global equity and emerging markets equity — we offer a range of strategies which provide further stability to our earnings.
12
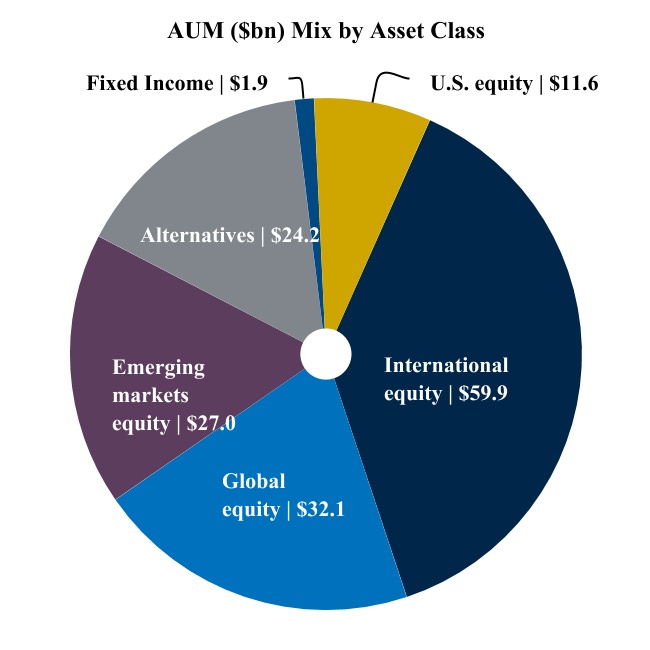
| Total AUM: $156.7 bn | ||
| Data as of December 31, 2020 | ||
* Excludes equity-accounted Affiliate
We believe our Affiliates’ product offerings are well-positioned in areas of investor demand, and the diversity of investment style and asset class enables us to participate in growing segments of the industry in multiple investing environments. The chart below illustrates the diversity of our assets under management by asset class and Affiliate. In total, our Affiliates manage 64 strategy composites.
13
Investment Performance
While each of our segments have distinct investment processes and generally operate in different asset classes, our unifying mission is to produce risk-adjusted performance, or alpha, for our clients. For our Quant & Solutions and Liquid Alpha segments, we measure alpha generation relative to the specific benchmarks our clients use to evaluate our performance in these strategies. Our Alternative segment strategies are generally not measured relative to benchmarks. Looking at this measure on a consolidated basis, our segments have competitive near- and long-term performance records and are well-positioned for continued growth. Investment performance is calculated on a gross basis, excluding the impact of management, administration, and performance fees.
In the chart below, which measures revenue-weighted performance relative to benchmarks for the Quant & Solutions and Liquid Alpha segments over the last five years, we typically derive between 45% and 90% of our revenue from benchmarked products (which represented approximately 76% of our total AUM as of December 31, 2020) performing ahead of their respective benchmarks on a three-, five- and ten-year basis.
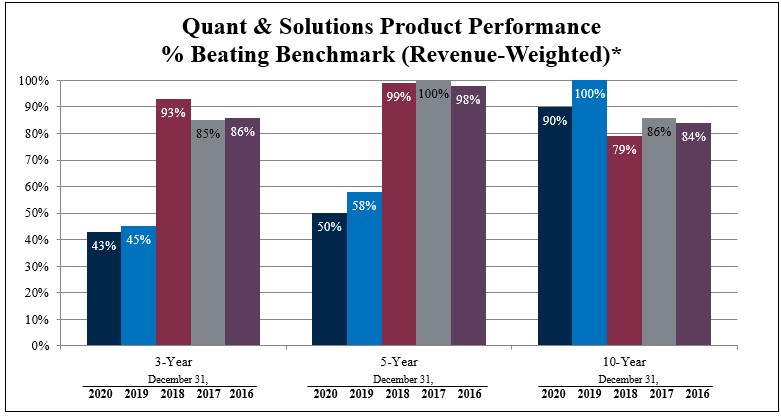
Data as of December 31 for the years 2016 to 2020
*Quant & Solutions assets representing 82%, 82%, 32%, 11%, and 47% of revenue were outperforming benchmarks on a 1- year basis as of December 31, 2016, 2017, 2018, 2019, and 2020, respectively.
14
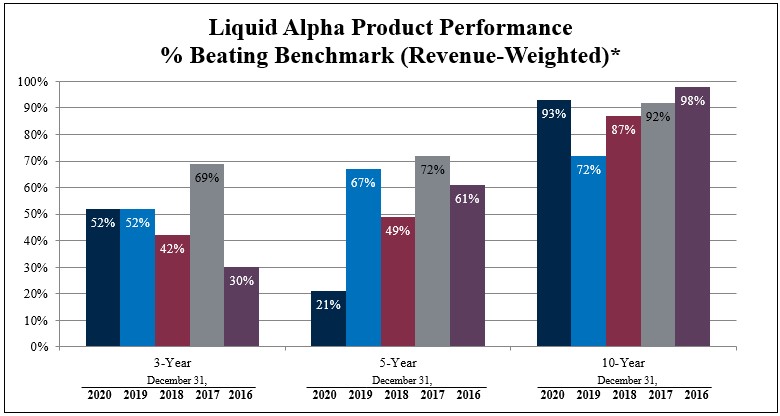
Data as of December 31 for the years 2016 to 2020
*Liquid Alpha assets representing 23%, 53%, 34%, 43%, and 2% of revenue were outperforming benchmarks on a 1- year basis as of December 31, 2016, 2017, 2018, 2019, and 2020, respectively.
In addition to analyzing our segment performance on a revenue-weighted basis, which gives us a perspective on product performance with respect to our segments’ existing client base, we also consider the number of our segments’ at-scale product strategies (defined as strategies with greater than $100 million of AUM) beating benchmarks. This latter measure, labeled as “equal-weighted,” indicates the opportunity we have to generate sales in a variety of market environments. For instance, strong performance in a newer, smaller product such as small-cap emerging markets may not affect revenue-weighted performance, but it can have a meaningful effect on revenue growth given client demand for this higher fee product. The chart below indicates performance on a revenue-weighted and equal-weighted (by product) basis relative to benchmark, as at December 31, 2020. In addition, we have indicated the percentage of our assets beating their benchmarks over the same time periods. While we believe the first two methodologies provide better insight into our performance trends, we have also included AUM-weighted performance, as this is a more standard industry performance metric.
15
Quant & Solutions Investment Performance*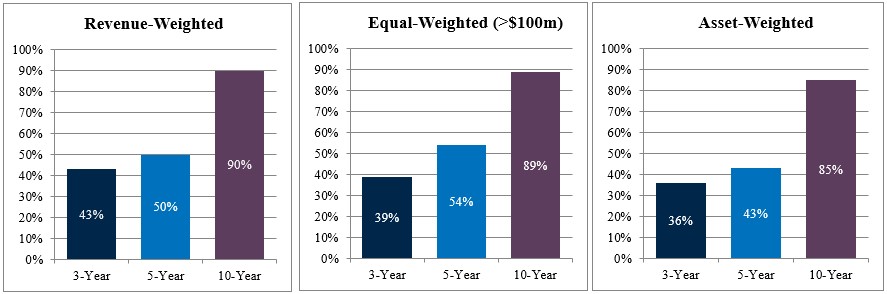
Data as of December 31, 2020*
* As of December 31, 2020, Quant & Solutions assets representing 47% of revenue were outperforming benchmarks on a 1- year basis.
Liquid Alpha Investment Performance*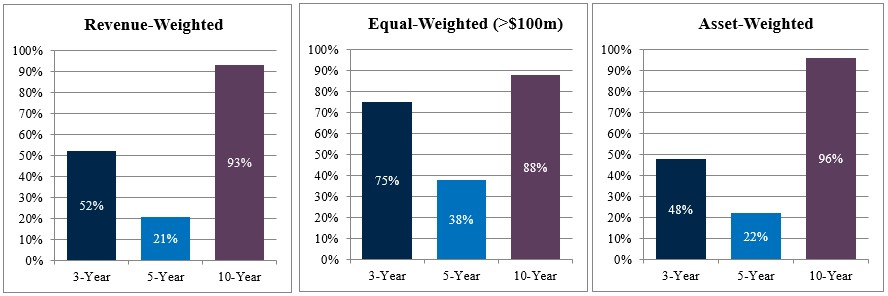
Data as of December 31, 2020*
* As of December 31, 2020, Liquid Alpha assets representing 2% of revenue were outperforming benchmarks on a 1- year basis.
16
Competition
We and our Affiliates face competition from many segments in the asset management industry. We compete with other investment management firms, including investment management holding companies, insurance companies, banks and private equity firms. Our Affiliates compete globally with international and domestic investment management firms, hedge funds and other subsidiaries of financial institutions for institutional assets.
Many of the organizations our Affiliates compete with offer investment strategies similar to those offered by our firms, and these organizations may have greater financial resources and distribution capabilities than we or our Affiliates are able to offer. Some of these firms offer other products and services in particular investment strategies such as passively-managed products, including exchange traded funds, that typically carry lower fee rates, as well as environmental, social, and governance (“ESG”) strategies and other developing strategies or trends. Additionally, there are limited barriers to entry for new investment managers. Our Affiliates compete with these organizations to attract and retain institutional clients and their assets based on the following primary factors:
•the investment performance records of our Affiliates’ investment strategies;
•the breadth of active investment strategies offered by our Affiliates in the asset classes in which they specialize;
•the alignment of our Affiliates’ investment strategies to the current market conditions and investment preferences of potential clients;
•the quality and reputation of the investment teams that execute the investment strategies at our Affiliates;
•the strength of our Affiliates’ and our distribution teams; and
•the strength of our Affiliates’ client service and long-term client relationships.
Business History
The predecessor of BSIG was formed in 1980. We were incorporated on May 29, 2014 as a private limited company under the laws of England and Wales. At the time of our initial public offering of our ordinary shares, or the Offering, we changed our name to OM Asset Management plc.
From the Offering until May 2017, we were a majority-owned subsidiary of OM Group (UK) Limited, or OMGUK, which was in turn wholly owned by OM plc. The board of directors of OM plc elected to undertake the Offering which was priced on October 8, 2014. On October 9, 2014, we began trading on the New York Stock Exchange under the ticker symbol “OMAM.” On March 2, 2018, we announced the change of our name to BrightSphere Investment Group plc and on March 26, 2018, our ticker symbol changed to “BSIG.” On July 12, 2019, we completed a redomestication process to change our publicly traded parent company from a company incorporated under the laws of England and Wales to a Delaware corporation. Effective as of the close of business on July 12, 2019, all issued ordinary shares of BrightSphere Investment Group plc were exchanged on a one-for-one basis for newly issued shares of common stock of BrightSphere Investment Group Inc. The common stock of BrightSphere Investment Group Inc. began trading on July 15, 2019, and our trading symbol on the NYSE remained unchanged as “BSIG.”
Between the time of the Offering and November 2017, OM plc implemented a plan to dispose of our shares in an orderly manner which balanced value, cost, time and risk. A series of transactions were executed to dispose of OM plc’s shareholdings, including secondary offerings on the public market, sales of shares from OM plc to HNA Capital U.S., or HNA, and our repurchase and retirement of shares held by OM plc. Following these transactions, at December 31, 2017, HNA owned 24.95% of our outstanding ordinary shares and OM plc held 1,000 of our ordinary shares. On November 18, 2018, HNA notified us that it had agreed to sell the substantial majority of its ordinary shares to Paulson & Co (“Paulson”). On February 25, 2019, this transaction was completed and Paulson held approximately 21.7% of our ordinary shares and we bought back the remaining shares held by HNA in the first quarter of 2019. See Note 1, “Organization and Description of the Business” in our Consolidated Financial Statements included in Item 8 herein for a further description of these transactions.
17
In August 2016, we completed the acquisition of Landmark Partners and in January 2018, we completed the sale of our stake in Heitman LLC (“Heitman”) to members of Heitman’s management. In July 2020, we completed the sale of Copper Rock Capital Partners LLC and in November 2020 we completed the sale of Barrow Hanley Mewhinney & Strauss, LLC. In February 2021, we entered into a definitive agreement to sell all our interests in ICM. This transaction is expected to close during second quarter of 2021. We believe these acquisitions and divestitures have resulted in a mix of Affiliates well positioned to meet the ever changing needs of asset management clients.
Employees and Human Capital
As of December 31, 2020, we had 800 full-time equivalent employees, of which 30 were employees of the Company and 770 were employees of our Affiliates. Neither the Company’s employees nor our Affiliates’ employees are represented by any collective bargaining agreements. Management considers its employee relations to be good. We believe our ability and the ability of our Affiliates to attract and retain employees is a key to our success. Accordingly, the Company and our Affiliates each strive to offer competitive compensation and employee benefits and monitor compensation and benefits to the competitive market. BrightSphere and our Affiliates are committed to pay equity for employees doing similar work, regardless of gender, race or ethnicity and comply with applicable local regulations.
Operations, Systems and Technology
We generally use both third-party commercial technology solutions and services to support investment management and operational activities, including functions such as portfolio management, trading, investment accounting, client reporting and financial reporting. Certain Affiliates have built proprietary systems to support the investment process where competitive advantages to do so exist. Systems and processes are customized as necessary to support our investment processes and operations. Information security, business continuity and data privacy programs have been implemented to help mitigate risks.
Available Information
Our web site is www.bsig.com. Our web site provides information about us, and from time to time we may use it as a distribution channel of material company information. We routinely post financial and other important information in the “Investor Relations” section of our web site and we encourage investors to consult that section regularly. That section of our web site includes “Public Filings” where one can download copies of our Annual Reports on Form 10-K, Quarterly Reports on Form 10-Q, Current Reports on Form 8-K, including exhibits, and any other report filed or furnished with the U.S. Securities and Exchange Commission, or the SEC, pursuant to Section 13(a) or 15(d) of the Securities Exchange Act of 1934, as amended. We make these reports available through our web site as soon as reasonably practicable after our electronic filing of such materials with, or the furnishing of them to, the SEC. The information contained or incorporated on our web site is not a part of this Annual Report on Form 10-K.
In addition, the SEC maintains a website that contains reports, proxy statement and other information about issuers, such as BSIG, who file electronically with the SEC. The address of the website is www.sec.gov.
18
Item 1A. Risk Factors
You should carefully consider the following risk factors in addition to the other information included or incorporated by reference in this Annual Report on Form 10-K before investing in our common stock. Any of the following risks could have a material adverse effect on our business, financial condition, results of operations or cash flow. If any of the following risks and uncertainties actually occurs, you may lose all or part of your investment. The risks and uncertainties described below are not the only ones we face. Additional risks and uncertainties not presently known to us or that we currently believe to be immaterial may also adversely affect our business.
Summary of Risk Factors
Our business is subject to numerous risks and uncertainties, discussed in more detail in the following section.
These risks include, among others, the following key risks:
•Our overall financial results are dependent on the ability of our Affiliates to generate earnings;
•The ability of our Affiliates to attract and retain assets under management and generate earnings is dependent on our Affiliates maintaining competitive investment performance, as well as market and other factors;
•We derive a substantial portion of our revenue from a limited number of Affiliates and investment strategies;
•Our growth strategy is dependent upon continued growth of our existing Affiliates;
•We and our Affiliates rely on certain key personnel, and our results are dependent upon our ability to retain and attract key personnel;
•Reputational harm could result in a loss of assets under management and revenues for our Affiliates and us;
•Impairment of our Affiliates’ relationships with clients and/or consultants may negatively impact their businesses and our results of operations;
•Pressure on fee levels of our Affiliates and changes to their mix of assets could impact our results of operations;
•If our techniques for managing risk are ineffective, we may be exposed to material unanticipated losses;
•Our expenses are subject to fluctuations that could materially impact our results of operations;
•Investments in non-U.S. markets and in securities of non-U.S. companies may involve foreign currency exchange risk, and tax, political, social and economic uncertainties, and a reduction in assets under management associated with investments in non-U.S. equities could have a disproportionately adverse impact on our results of operations;
•Our outstanding indebtedness may impact our business and may restrict our growth and results of operations;
•Any significant limitation on the use of our facilities or the failure or security breach of our software applications or operating systems and networks, including the potential risk of cyber-attacks, could result in the accidental or unlawful destruction, loss, alteration, unauthorized disclosure of, or access to, confidential client information or personal data, damage to our reputation, additional costs, regulatory penalties and financial losses;
19
•The novel coronavirus (COVID-19) pandemic has disrupted and may continue to disrupt financial markets and our business;
•We operate in a highly regulated industry, and continually changing federal, state, local and foreign laws and regulations could materially adversely affect our business, financial condition and results of operations;
Risks Related to Affiliate Operations
Our overall financial results are dependent on the ability of our Affiliates to generate earnings.
Substantially all of our revenue generation is dependent on our Affiliates, who are registered investment advisers under the Investment Advisers Act of 1940, as amended, or the Advisers Act, and who receive the majority of their fees based on the values of assets under management. Substantially all of our cash flows consist of distributions received from our Affiliates. As a result, our cash flows and ability to fund operations are largely dependent upon the profitability of our Affiliates.
Each Affiliate is required to make certain cash distributions to us under the operating agreement we entered into with such Affiliate. Distributions to us from an Affiliate may be subject to the Affiliate maintaining sufficient working capital, regulatory requirements, claims of creditors of the Affiliate and applicable bankruptcy and insolvency laws. Any material decrease in profits at, or material reduction in distributions from, our Affiliates could negatively impact our business and results of operations.
The ability of our Affiliates to attract and retain assets under management and generate earnings is dependent on our Affiliates maintaining competitive investment performance, as well as market and other factors.
Our financial performance is dependent upon the abilities of our Affiliates to minimize outflows and increase inflows through sound relative investment performance over measured periods of time compared to relevant benchmarks and peer performance results. The performance of our Affiliates’ investment strategies, which can be impacted by factors within and/or outside the control of our Affiliates, including general market and economic conditions, is critical to retaining existing client assets and investors, including in mutual funds and private funds our Affiliates advise or sub-advise, and attracting new client and investor assets. Poor performance can be caused by our Affiliates’ choices in investing in sectors, industries, companies or assets that do not perform as well as others. Additionally, companies in which our Affiliates invest may incur negative changes in their financial conditions or suffer other adverse events that could reduce the values of investments in those companies.
Net flows related to our investment strategies can be affected by investment performance relative to other competing investment strategies or to established benchmarks. Investment management strategies may be rated, ranked or assessed by independent third parties, distribution partners, and industry periodicals and services. These assessments often influence the investment decisions of our Affiliates’ clients and investors in mutual funds and private funds our Affiliates advise or sub-advise. If the performance or assessment of our Affiliates’ investment strategies is seen as underperforming relative to peers, it could, among other things, result in an increase in the withdrawal of assets by existing clients and investors in mutual funds and private funds our Affiliates advise or sub-advise, the termination of an Affiliate as a sub-adviser to a mutual fund and the inability to attract additional investments from existing and new clients or investors. If a significant portion of clients or investors decides to withdraw their investments or terminate their investment management agreements or sub-advisory agreements with our Affiliates, our Affiliates’ abilities to generate earnings would decline and our results of operations and financial condition would be affected.
20
In addition, assets could be withdrawn for any number of reasons other than poor absolute or relative investment performance, including macro-economic factors unrelated to investment performance, a reduction in market demand for the asset classes, products or strategies offered by our Affiliates, the loss of key personnel, price declines in the securities markets generally, price declines in those assets in which client assets are concentrated or changes in investment patterns of clients, or a failure by our Affiliates to comply with applicable client and regulatory investment guidelines. Any of these factors could have a negative impact on the revenues and profits of an Affiliate and an adverse impact on our results of operations and financial condition.
Our relationships with our Affiliates are critical to our success.
Maintaining strong relationships with our Affiliates is critical to our business model. Any potential disagreements over matters such as economics or management policies, growth strategies and compensation philosophy would impact our relationships with our Affiliates if not effectively managed. Any strains in the relationships that we have with our Affiliates could be detrimental to our overall business.
Each of our Affiliates operates under ownership, governance and economic arrangements that we and such Affiliate negotiated either at inception or during the course of our relationship. Periodically, these arrangements are reviewed and, in some instances, may be renegotiated and revised. Any renegotiation that results in a reduction in our ownership interest in an Affiliate and/or a revision to the economic arrangements could reduce the economic benefits derived by us from that Affiliate.
We derive a substantial portion of our revenue from a limited number of Affiliates and investment strategies.
As of December 31, 2020, Acadian and Landmark represented 81% of our assets under management, from which we derive a substantial portion of our revenue. An adverse change in the operating results of either of these Affiliates, whether as a result of poor investment performance, withdrawals of assets under management or otherwise, could have a substantial impact on our results of operations.
While our Affiliates invest in a number of asset classes on behalf of their clients, a significant portion of the assets are invested in a limited number of investment strategies. As of December 31, 2020, $68.4 billion, or 44%, of our assets under management were concentrated across five investment strategies: Acadian’s Emerging Markets Equity ($21.4 billion, or 14%), TSW’s International ($12.5 billion, or 8%), Landmark’s Private Equity ($11.9 billion, or 8%), Acadian’s Global Managed Volatility Equity ($11.6 billion, or 7%) and Acadian’s All-Country World ex-U.S. ($11 billion, or 7%). Consequently, our results of operations are dependent upon the abilities of our Affiliates that manage these investment strategies to minimize the risk of outflows through relatively strong performance over measured periods of time compared to relevant benchmarks and peer performance results. Also, certain investors may evaluate us on the basis of the asset-weighted performance of our assets under management. A relatively small change in the relative performance of one of our largest strategies, such as Acadian’s Emerging Markets Equity, could have a significant impact on the asset-weighted performance of our assets under management. Such volatility could adversely affect our results of operations and investors’ perception of us.
Our business model limits our ability to manage our Affiliates’ investment management practices and certain other aspects of their day-to-day operations.
Our structure offers a diversity of investment styles and client bases. While our agreements with all of our consolidated Affiliates give us ultimate control over the business activities of those Affiliates if necessary, we generally do not become directly involved in managing their day-to-day operations, including investment management practices, policies and procedures, fee levels, marketing and product development, client relationships and employment and compensation programs. If we fail to intervene in the operations of our Affiliates as needed, our results of operations could be adversely affected.
For ICM, we exercise significant influence rather than control. Our ability to (i) direct the activities of ICM, (ii) influence its decision-making processes and (iii) require that our risk management and governance practices are applied may be limited and not consistent with those of our controlled Affiliates.
21
Our growth strategy is dependent upon continued growth of our existing Affiliates.
Since we depend on distributions from our Affiliates to conduct our operations, the inability of our Affiliates to grow their businesses and contribute to our future growth at current or historical levels could impact our ability to grow. In addition, capacity constraints, particularly on our Affiliates’ smaller strategies, or the unavailability of appropriate investment opportunities could limit our Affiliates’ ability to accept new client assets and, therefore, limit the growth of their and our revenue.
Our growth strategy may also be enhanced from time to time by our ability to successfully make new acquisitions or investment in new products or strategies. There is no certainty that we will identify suitable investments at prices and terms we consider attractive, consummate any such acquisition or investment on acceptable terms, have sufficient resources to complete an identified acquisition or investment or that our strategy for pursuing acquisitions or investments will be effective. Any acquisition or investment can involve a number of risks, including the existence of known liabilities or contingent liabilities or those not disclosed or known by us prior to closing an acquisition or investment. An acquisition or investment may impose additional demands on our staff that could strain our operational resources and increase the possibility of operational error, and require expenditure of substantial legal, investment banking and accounting fees. We may be required to issue common stock or otherwise obtain additional capital or spend significant cash to consummate an acquisition or investment, resulting in dilution of ownership, a potential decline in our stock price or additional debt leverage, or spend additional time and money on facilitating the acquisition or investment that otherwise would be spent on the development and expansion of our existing businesses. Following a completed acquisition or investment, failure by us to achieve a strong, long-term relationship, or failure to realize incremental growth may result in our inability to achieve the anticipated benefits of the acquisition or investment, and could have an adverse impact on our business, financial condition and results of operations.
We and our Affiliates rely on certain key personnel, and our results are dependent upon our ability to retain and attract key personnel.
We and our Affiliates depend on the skills and expertise of our key investment and management personnel, and our success and growth depends on our ability to attract and retain key personnel. Our Affiliates rely heavily upon the services of certain key investment and management personnel, many of whom have managed their firms for a number of years and who primarily guide the investment decision-making processes and strategies at the firms. The loss of key investment and management personnel at any of our Affiliates for any reason could have an adverse impact upon our business, results of operations and financial condition. Any of our key investment or management personnel could resign at any time, join a competitor or form a competing company. We and our Affiliates have entered into non-competition agreements with some, but not all, of our investment and management personnel, but these agreements may not be enforceable or may not be enforceable to their full extent. In addition, we and our Affiliates may agree to waive a non-competition agreement applicable to investment or management personnel in light of the circumstances of our relationship with that person.
All of our Affiliates have established equity plans which are intended to attract, retain and motivate key personnel and pursuant to which key Affiliate personnel may be awarded or be able to purchase equity in their firm. The equity plans provide key employees with the opportunity to participate in the appreciation in the value of their businesses. Award documents under these plans typically limit a recipient’s right to provide competitive services to clients of the Affiliates or solicit employees of the Affiliates for prescribed periods. Additionally, certain of our Affiliates’ key executive management personnel may have entered into, or been offered the opportunity to enter into, agreements with us that are structured to motivate and retain such personnel. However, retention strategies we and our Affiliates have put into place may not be successful and, to the extent the plans do not produce the desired results, our Affiliates may suffer a loss of valued personnel.
22
For certain of our Affiliates, a number of key management personnel may, from time to time, arrive at the point in their careers where they may be looking to limit their day-to-day involvement in their businesses or withdraw entirely. We have instituted succession planning at our Affiliates in an attempt to mitigate any disruption caused by these changes but cannot predict whether such efforts will be successful and whether the firms will be able to retain clients, assets and personnel or attract new assets and talent.
We rely upon the contributions of our senior management team to establish and implement our strategy and to manage the future growth of our business. The amount and structure of compensation and opportunities for equity ownership we offer are key components of our ability to attract and retain qualified management personnel. There is no assurance that we will be successful in designing and implementing an attractive compensation model.
Our Affiliates’ business operations are complex, and a failure to properly perform operational tasks or maintain infrastructure could have an adverse effect on our revenues and income.
In addition to providing investment management services, our Affiliates must have the necessary operational capabilities to manage their businesses effectively in accordance with client expectations and applicable law. The required non-investment management functions include sales, marketing, portfolio recordkeeping and accounting, security pricing, trading activity, investor reporting, corporate governance, compliance, net asset value computations, account reconciliations and calculations of required distributions to accounts. Some of these functions are performed either independently or with the support of or in conjunction with us or third-party service providers that are overseen by our Affiliates. Also, certain of our Affiliates are highly dependent on specially developed proprietary systems. Any material failure to properly develop, update, or maintain sufficient technological infrastructure, or perform and monitor non-investment management functions and operations, or adequately oversee the entities that provide the services, could result in potential liability to clients, regulatory sanctions, investment losses, loss of clients and damage to the reputation of our Affiliates or to our reputation.
Reputational harm could result in a loss of assets under management and revenues for our Affiliates and us.
The integrity of our brand and reputation, as well as the integrity of the brand and reputation of each of our Affiliates, is critical to the ability of us and our Affiliates to attract and retain clients, business partners and employees and maintain relationships with consultants. We operate within the highly regulated financial services industry and various potential scenarios could result in harm to our reputation. They include internal operational failures, failure to follow investment or legal guidelines in the management of accounts, instances of financial criminal activity by our employees or employees of our Affiliates, intentional or unintentional misrepresentation of our Affiliates’ products and services in offering or advertising materials, public relations information, social media or other external communications, employee misconduct or investments in businesses or industries that are controversial to certain special interest groups. Such factors could potentially result in regulatory actions and litigation. The negative publicity associated with any of these factors could harm our reputation and those of our Affiliates and adversely impact relationships with existing and potential clients, third-party distributors, consultants and other business partners and subject us to regulatory sanctions. Damage to our brands or reputations would negatively impact our standing in the industry and result in loss of business in both the short term and the long term.
We or our Affiliates may not always successfully manage actual or potential conflicts of interests that may arise in our businesses.
As we continue to expand the scope of our business, we continue to confront actual, potential and perceived conflicts of interest relating to our activities and the investment activities of our Affiliates. Conflicts may arise with respect to decisions regarding, among other things, the allocation of specific investment opportunities among accounts in which Affiliates may receive an allocation of profits and accounts in which they do not receive such an allocation or among client accounts that have overlapping investment objectives yet different fee structures, including certain accounts which may pay Affiliates performance-based fees.
23
Certain client accounts of our Affiliates have similar investment objectives and may engage in transactions in the same types of securities and instruments. These transactions could impact the prices and availability of the securities and instruments in which a client account invests and could have an adverse impact on an account’s performance. An Affiliate may also buy or sell positions in a client account while another Affiliate, on behalf of other client accounts, is undertaking a similar, differing or opposite strategy, which could disadvantage the other accounts.
The SEC and other regulators have increased their scrutiny of conflicts of interest. Our Affiliates have implemented procedures and controls to identify, manage, mitigate (where possible) and disclose actual, potential or perceived conflicts of interest, but it is possible that the procedures adopted by our Affiliates may not be effective in identifying, managing or mitigating all conflicts which could give rise to the dissatisfaction of, or litigation by, investors or regulatory enforcement actions. Appropriately dealing with conflicts of interest is complex and difficult, and the reputations of us and our Affiliates could be damaged if we or they fail, or appear to fail, to deal appropriately with one or more potential or actual conflicts of interest. Regulatory scrutiny, litigation or reputational risk incurred in connection with conflicts of interest would adversely impact our business in a number of ways, including by making counterparties reluctant to do business with us, impeding our ability to retain or increase our assets under management, subjecting us to potential litigation and adversely impacting our results of operations.
Conflicts of interest also may arise between our Affiliates where, for example, for competitive business reasons, more than one Affiliate may seek the same business opportunity, clients or talent or make other competitive business decisions.
We may make business decisions which we believe are in our best interests but that may have indirect negative effects on one or more of our Affiliates. We also may be required to make strategic and financial or other resource allocation decisions that may directly benefit one or more Affiliates and not others. Any decision that does not directly or indirectly benefit an Affiliate could negatively impact our relationship with that Affiliate.
Equity ownership by key employees of each Affiliate is at the level of the applicable Affiliate and not at the holding company level, although employees of our Affiliates may acquire our common stock. There may be instances where the interests of an Affiliate and its key employee equity-holders may not align with ours in effecting a desired outcome.
There is no assurance that a resolution of any conflicts of interest may be possible or the interests of all parties can be taken into account.
Impairment of our Affiliates’ relationships with clients and/or consultants may negatively impact their businesses and our results of operations.
Our Affiliates have strong client and consultant relationships in their core institutional marketplaces, and they depend upon these relationships to successfully market their existing products and strategies and to introduce new products and strategies. Some Affiliates may have client exposures that are meaningful to their individual businesses. As of December 31, 2020, our Affiliates’ top five client relationships represented 10% of total run rate gross management fee revenue, including our equity-accounted Affiliate, and our Affiliates’ top 25 clients represented 25% of run rate gross management fee revenue, including our equity-accounted Affiliate. Total run rate gross management fee revenue reflects the sum for each account at each of our five current Affiliates, of the product of (a) assets under management in each account at December 31, 2020, multiplied by (b) the relevant management fee rate on that account. This calculation includes the management fees paid by accounts at our equity-accounted Affiliate. Any negative changes in these relationships that reduce the number of client or consultant contacts, restrict access to existing or potential clients, or result in negative statements by a consultant, could have an adverse impact on our Affiliates’ businesses and negatively impact our results of operations.
24
The business of our Affiliates is dependent upon investment advisory agreements that are subject to negotiation, non-renewal, or termination, including termination upon assignment.
Our Affiliates derive substantially all of their revenues from the fees charged to their clients under their investment advisory agreements with those clients. The agreements generally provide for fees to be paid on the basis of the values of assets under management, although a portion also provide for performance-based fees to be paid on the basis of investment performance against stated benchmarks.
An investment advisory agreement may be terminated by a client without penalty upon relatively short notice (typically no more than 30 days). In addition, the investment advisory agreements and sub-advisory agreements with respect to registered investment companies generally may be terminated by the mutual fund or, in those instances where an Affiliate serves as a sub-adviser, the mutual fund’s adviser, without penalty, upon 60 days’ notice and are subject to annual approval by the mutual fund’s board of directors or trustees. Clients may decide to terminate or not renew an agreement for poor investment performance or any variety of reasons which may be beyond the control of our Affiliates. A decrease in revenues resulting from termination of an investment advisory agreement or sub-advisory agreement for any reason could have a material adverse effect on the revenue and profits of our Affiliates and a negative effect on our results of operations.
Pursuant to the Advisers Act, investment advisory agreements between our Affiliates, who are (or who have subsidiaries who are) U.S. registered investment advisers, and their clients are not assignable without the consent of the client. As required by the Investment Company Act of 1940, or the Investment Company Act, investment advisory agreements and sub-advisory agreements between our Affiliates and investment company clients and/or the investment advisers to those investment companies terminate upon their assignment. Assignment, as generally defined, includes direct assignments as well as assignments that may be deemed to occur, under certain circumstances, upon the direct or indirect transfer of a “controlling block” of the voting securities of the respective Affiliate. A transaction is not deemed an assignment under the Advisers Act or the Investment Company Act, however, if it does not result in a change of actual control or management of the relevant Affiliate.
If anyone acquires, or is deemed to have acquired, a controlling block of our voting securities in the future, the contractual anti-assignment and termination provisions of the investment advisory and sub-advisory agreements between our Affiliates and their clients may be implicated. If an assignment of an investment advisory or sub-advisory agreement is deemed to occur, and clients do not consent to the assignment or, with respect to investment company clients, enter into a new agreement, which may require the approval of the investment company’s shareholders in addition to its board of directors or trustees, our results of operations could be materially and adversely affected.
Pressure on fee levels of our Affiliates and changes to their mix of assets could impact our results of operations.
Our profit margins and net income are dependent on the ability of our Affiliates to maintain current fee levels for the products and services they offer. The competitive nature of the asset management industry has led to a trend toward lower fees in certain segments of the asset management market, and there can be no assurance that our Affiliates will be able to maintain their current pricing structures. Our Affiliates also may be required to restructure their fees due to regulatory changes. These factors also could inhibit the ability of our Affiliates to increase fees for certain products. A reduction in the fees charged by our Affiliates, or limited opportunities to increase fees, will reduce or limit our revenues and could reduce or limit our net income.
The fees charged by our Affiliates on their assets under management vary by asset class and produce different revenues per dollar of assets under management based on factors such as the type of assets being managed, the applicable investment strategy, the type of client and the client fee schedule. Institutional clients may have significant negotiating leverage in establishing the terms of an advisory relationship, particularly with respect to the level of fees paid, and the competitive pressure to attract and retain institutional clients may impact the level of fee income earned by an Affiliate. In order for an Affiliate to maintain its fee structure in a competitive environment, it may elect to decline to manage additional assets from potential clients who demand lower fees even though our revenues may be adversely affected in the short term.
25
Furthermore, a shift in the mix of assets under management from asset classes or products that generate higher fees to those that generate lower fees may result in a decrease in revenues while aggregate assets under management remain unchanged or increase. Such shifts can occur as various investment strategies go in and out of favor due to competition in the industry or as a result of movements between asset classes or certain products no longer being available to investors. In addition, in the event current or future Affiliates have or develop a focus on strategies that generate lower fees, a decrease in revenues may result. A decrease in revenues without a reduction in expenses will result in reduced net income.
Changes in how clients choose to access asset management services may also exert downward pressure on fees. Some investment consultants, for example, are implementing programs in which the consultant provides a range of services, including selection, in a fiduciary capacity, of asset managers to serve as sub-adviser at lower fee rates than the manager’s otherwise applicable rates, with the expectation of a larger amount of assets under management through that consultant. The expansion of those and similar programs could, over time, make it more difficult for us to maintain our fee rates.
If our techniques for managing risk are ineffective, we may be exposed to material unanticipated losses.
In order to manage the significant risks inherent in our business, we and our Affiliates must maintain effective policies, procedures and systems that enable us to identify, monitor and control our exposure to operational, legal and reputational risks. Our or our Affiliates’ risk management methods may prove to be ineffective due to their design or implementation, or as a result of the lack of adequate, accurate or timely information or otherwise. If our or our Affiliates’ risk management efforts are ineffective, we could suffer losses that could have a material adverse effect on our financial condition or results of operations. The potential for some types of operational risks, including, for example, trading errors, may be increased or amplified in periods of increased volatility, which can magnify the cost of an error. We may experience operational errors, including trading errors, in the future. Additionally, we or our Affiliates could be subject to litigation, particularly from our clients, and investigations and enforcement proceedings by and sanctions or fines from regulators. Our Affiliates’ techniques for managing operational, legal and reputational risks in client portfolios may not fully mitigate the risk exposure in all economic or market environments, including exposure to risks that we might fail to identify or anticipate.
We or our Affiliates may be exposed to potential liability as a general partner or a controlling person.
Our Affiliates are limited liability companies of which we are, or an entity controlled by us is the majority member, except for ICM in which case we have certain consent and management rights. Certain of our Affiliates may serve as general partners, managing members or their equivalents for investment products that are organized as partnerships or other commingled vehicles. As such, we or an Affiliate may be exposed to liability in the limited liability company, partnership or investment vehicle or required to undertake certain obligations under applicable law that we or they otherwise would not be required to undertake as a holding company or investment adviser. In addition we may be deemed to be a control person of our Affiliates, as that term is defined in various U.S. federal and state statutes and, as such, potentially liable for the acts of our Affiliates or their employees. Consequently, if under such circumstances any of our Affiliates incurs liabilities or expenses that exceed its ability to pay, we may be directly or indirectly liable for its payment to the extent provided in the governing documents of the limited liability company, partnership or investment vehicle or under applicable law. While we and our Affiliates maintain errors and omissions and general liability insurance in amounts believed to be adequate to cover certain potential liabilities, we cannot be certain that claims will not be made against us that exceed the limits of available insurance coverage, that the insurers will remain solvent and will meet their obligations to provide coverage or that an adequate amount of insurance coverage will continue to be available to us and our Affiliates at a reasonable cost. A judgment against any of our Affiliates and/or us in excess of available insurance coverage could have a material adverse impact on our business and financial condition.
26
Our expenses are subject to fluctuations that could materially impact our results of operations.
Our results of operations are dependent upon the level of our expenses and those of our Affiliates, which can vary from period to period. We and our Affiliates have certain fixed expenses that we incur as going concerns, and some of those expenses are not subject to adjustment. If our revenues decrease, without a corresponding decrease in expenses, our results of operations would be negatively impacted. While we and our Affiliates attempt to project expense levels in advance, there is no guarantee that an unforeseen expense will not arise or that we will be able to adjust our variable expenses quickly enough to match a declining asset base. Consequently, either event could have either a temporary or permanent negative impact on our results of operations.
Losses on our seed and co-investment capital could adversely impact our results of operations or financial condition.
Our support of our Affiliates extends to the commitment of seed and co-investment capital to launch new products and investment capital to financially support new growth initiatives. As of December 31, 2020, we had approximately $24 million committed to seed capital, which is currently invested in 6 products across 4 different asset classes. We also provide co-investment capital (currently a $46 million portfolio) to support the formation of closed-end, long-term partnerships managed by our Affiliates. These fixed-life partnerships typically require us and/or the Affiliate or its employees to invest 1% to 3% of the product’s capital to align interests with those of their clients. The capital utilized in the seed and co-investment portfolios may be subject to liquidity constraints over certain time periods and is subject to market conditions. A decline in the value of our seed and co-investment capital would adversely impact our results of operations or financial condition.
The cost of insuring our business is meaningful and may increase.
Our insurance costs are meaningful and can fluctuate significantly from year to year. In addition, certain insurance coverage may not be available or may only be available at prohibitive costs. As we renew our insurance coverage, we may be subject to additional costs caused by premium increases, higher deductibles, co-insurance liability, changes in the size of our business or nature of our operations, litigation or acquisitions or dispositions. Higher insurance costs and incurred deductibles, as with any expense, would reduce our net income. In addition, we may obtain additional liability insurance for our directors and officers. There have been historical periods in which directors’ and officers’ liability insurance and errors and omissions insurance have been available only with limited coverage amounts, less favorable terms or at prohibitive cost, and these conditions could recur.
Investments in non-U.S. markets and in securities of non-U.S. companies may involve foreign currency exchange risk, and tax, political, social and economic uncertainties, and a reduction in assets under management associated with investments in non-U.S. equities could have a disproportionately adverse impact on our results of operations.
A significant amount of our Affiliates’ assets under management is represented by strategies that invest in securities of non-U.S. companies. Fluctuations in foreign currency exchange rates could negatively impact the account values and the investment returns of clients who are invested in these strategies, with a corresponding reduction in management fee income. In addition, an increase in the value of the U.S. dollar relative to non-U.S. currencies could result in a decrease in the U.S. dollar value of assets under management that are denominated in non-U.S. currencies, which in turn would result in lower revenues.
27
Many non-U.S. financial markets are not as developed or as efficient as the U.S. financial markets and, as a result, have limited liquidity and greater price volatility and may lack established regulations. Liquidity in such markets also may be adversely impacted by political or economic events, government policies, expropriation, volume trading limits by foreign investors, and social or civil unrest. The ability to dispose of an investment and its market value may be adversely impacted by any of these factors. In addition, non-U.S. legal and regulatory financial accounting standards and practices may be different from those of the U.S., and there may be less publicly available information about non-U.S. companies and non-U.S. markets. Governments of foreign jurisdictions may assert their abilities to tax local gains and/or income of foreign investors, including clients of our Affiliates, which could adversely impact the economics associated with investing in foreign jurisdictions or non-U.S. based companies. These risks also could impact the performance of strategies that invest in such markets and, in particular, strategies that concentrate investments in emerging market companies and countries.
In general, management fees for accounts that invest in non-U.S. equity markets, particularly emerging markets, are higher than those for accounts that invest in the domestic markets. Since 76% of our Affiliates’ total assets under management as of December 31, 2020 were invested in global, international and emerging markets equities, a significant reduction in assets under management associated with such investments could have a disproportionately adverse impact on our results of operations.
Our Affiliates’ non-U.S. distribution initiatives may be unsuccessful, may expose us to other tax and regulatory risks and may not facilitate the growth of our business.
One of the primary opportunities for growth lies in expanding the geographic regions in which our Affiliates’ investment products and services are distributed. The success of these non-U.S. initiatives is dependent upon the ability of our Affiliates’ teams to structure products that appeal to the global markets. The inability of our Affiliates to successfully execute on their non-U.S. distribution plans may adversely impact the growth prospects of our Affiliates.
The non-U.S. distribution initiatives of our Affiliates has required and will continue to require the incurence of a number of up-front expenses, including those associated with obtaining regulatory approvals, as well as additional ongoing expenses, including those associated with the employment of additional support staff and regulatory compliance. Our Affiliates’ employees travel outside the U.S. in connection with distribution efforts and may spend extended periods of time in one or more non-U.S. jurisdictions. Their activities outside the U.S. may raise both tax and regulatory issues. If our Affiliates are incorrect in their analysis of the applicability or the extent of the impact of non-U.S. tax or regulatory requirements, such Affiliates could incur costs, penalties or be the subject of an enforcement or other action. In addition, operating our business in non-U.S. markets generally will be more expensive than in the U.S. To the extent that our revenues do not increase as much as our expenses in connection with distribution initiatives outside the U.S., our profitability could be adversely affected. Expanding our distribution initiatives into non-U.S. markets may also place significant demands on our or our Affiliates’ existing infrastructure and employees.
Our outstanding indebtedness may impact our business and may restrict our growth and results of operations.
As of December 31, 2020, we have $394.3 million of long-term bonds outstanding and $0.0 million of debt outstanding under our revolving credit facility with third-party lenders. For additional information regarding our revolving credit facility and our long-term bonds, see “Management’s Discussion and Analysis of Financial Condition and Results of Operations—Capital Resources and Liquidity—Working Capital and Long-Term Debt.”
We may incur additional indebtedness in the future for a variety of business reasons, including in relation to our share repurchases, for seed or co-investment capital, or for other strategic reasons. We will be dependent on the cash flow generated from our Affiliates to service any indebtedness that is taken on by us.
28
The level of our indebtedness has important consequences to investors in our securities. For example, our level of indebtedness may require us to use a substantial portion of our cash flow from operations to pay interest and principal on our debt, which would reduce the funds available to us for working capital, capital expenditures and other general corporate purposes and may limit our ability to pay future dividends. Too much debt may limit our ability to implement our business strategy; heighten our vulnerability to downturns in our business, the financial services industry or in the general economy and limit our flexibility in planning for, or reacting to, changes in our business and the financial services industry; limit our access to additional debt; or prevent us from taking advantage of business opportunities as they arise or successfully carrying out our plans to expand our business and our Affiliates’ product offerings. Any of these consequences could have a material adverse effect on our financial condition or results of operations.
We may be unable to obtain sufficient capital and liquidity to meet the financing requirements of our business.
In July 2016 we issued an aggregate of $400 million of long-term bonds. On August 20, 2019, we entered into a $450 million senior unsecured revolving credit facility with third party lenders. In February 2021, we assigned this credit facility to Acadian and the available borrowings were decreased to $125 million in connection with the assignment. Accordingly, this credit facility is no longer available to us for future borrowings. Our ability to finance our operations, strategic initiatives and maturing obligations under our long-terms bonds is therefore dependent on future issuances of long-term bonds and the profitability of our Affiliates and our future operating performance. Any future inability to obtain financing on reasonable terms and with reasonable restrictions on the operation of our business could impair our liquidity, have a negative impact on our growth and that of our Affiliates and negatively impact our financial condition.
Our business involves risks of potential litigation that could harm our business.
We and our Affiliates may be named as defendants or co-defendants in lawsuits, or may be involved in disputes that include the threat of lawsuits seeking substantial damages. Any such legal action, whether threatened or actual, could result in reputational damage, loss of clients and assets, increased costs and expenses in resolving a claim, diversion of employee resources and resulting financial losses.
Our Affiliates make investment decisions on behalf of their clients that could result in substantial losses to those clients. If their clients suffer significant losses or otherwise are dissatisfied with the service of one of our Affiliates, that Affiliate could be subject to the risk of legal liability or actions alleging, among other theories, negligent misconduct, breach of fiduciary duty, breach of contract, unjust enrichment and/or fraud. These risks often are difficult to assess or quantify and their existence and magnitude often remain unknown for substantial periods of time, even after an action has been commenced. Our Affiliates may incur substantial legal expenses in defending against litigation commenced by a client or regulatory authority. Substantial legal liability levied on any one of our Affiliates could have a material adverse effect on our business, financial condition, or results of operations and could cause significant reputational harm.
Any significant limitation on the use of our facilities or the failure or security breach of our software applications or operating systems and networks, including the potential risk of cyber-attacks, could result in the accidental or unlawful destruction, loss, alteration, unauthorized disclosure of, or access to, confidential client information or personal data, damage to our reputation, additional costs, regulatory penalties and financial losses.
We and our Affiliates depend upon our principal business offices and our various centers of operation for the continued operations of our businesses. A disruption in the infrastructure that supports our businesses or prevents our employees from performing their job functions, including communication failures, natural disasters, terrorist attacks, third party hacks and international hostilities, may have a material impact on our ability to continue business operations without interruption. Insurance and other safeguards might not be available or might only partially reimburse us for our losses.
29
Although we and our Affiliates have back-up systems and disaster recovery programs in place and test their uses periodically, there can be no assurance that the recovery programs will be sufficient to mitigate any harm that may result from a disruption or disaster. Additionally, it is possible that any such disruption or disaster could have a significant impact on the general economy, domestic and local financial and capital markets or specific industries, including the financial services industry.
A significant portion of our operations relies heavily on the secure processing, storage and transmission of confidential and other information as well as the monitoring of a large number of complex transactions. With the evolving proliferation of new technologies and the increasing use of the Internet and mobile devices to conduct financial transactions, financial institutions such as us have been, and will continue to be, subject to an increasing risk of cyber incidents from these activities. We and our Affiliates take protective measures to secure information, including through system security technology. However, our technology systems may still be vulnerable to unauthorized access, computer malware or other events that have a security impact, such as an authorized employee or vendor inadvertently causing the release of confidential information or third-party unauthorized access or account takeovers, which could materially damage our operations or cause the disclosure or modification of sensitive or confidential information. Breach of our technology systems through cyber-attacks, or failure to manage and secure our technology environment, could result in interruptions or malfunctions in the operations of our business, loss of valuable information, liability for stolen assets or information, remediation costs to repair damage caused by a breach, additional costs to mitigate against future incidents and litigation costs resulting from an incident. Moreover, accidental or unlawful destruction, loss, alteration, unauthorized disclosure of, or access to, personal data and confidential client information could harm our reputation and subject us to liability under the laws that protect personal data and confidential information, resulting in increased costs or loss of revenues.
Our Affiliates and third parties with which we do business may also be sources of cybersecurity or other technological risks as we outsource certain functions. While we engage in certain actions to reduce the exposure resulting from outsourcing, such as performing onsite security control assessments, limiting third-party access to the least privileged level necessary to perform job functions, and restricting third-party processing to systems stored within our data centers, ongoing threats may result in accidental or unlawful destruction, loss, alteration, unauthorized disclosure of, or access to, data and information, or other cyber incidents with increased costs and consequences to us such as those discussed above.
We are subject to data protection laws under European Union (“EU”) and United Kingdom (“UK”) legislation, and any breaches of such legislation could adversely affect our business, reputation, results of operations and financial condition.
Certain of our and our Affiliates’ processing activities are subject to the General Data Protection Regulation (EU) 2016/679 (“GDPR”) and the Data Protection Act 2018 in the UK (“Act”) (together “EU Data Protection Laws”). The EU Data Protection Laws have a wide territorial reach and apply to data controllers and data processors which have an establishment in the European Union and UK respectively, or which offer goods or services to, or monitor the behavior of, data subjects in the European Union and UK respectively. The EU Data Protection Laws impose stringent operational requirements on data controllers and data processors. These include (i) accountability and transparency obligations which require organizations to demonstrate and record compliance with the EU Data Protection Laws and to provide detailed information to data subjects regarding the processing of their personal data, (ii) obligations to consider data privacy as any new products or services are developed and to limit the amount of information they collect, process and store, (iii) ensuring and maintaining an appropriate level of security for personal data, and (iv) reporting breaches to data protection authorities and, in some cases, affected individuals. The EU Data Protection Laws give strong enforcement powers to data protection authorities in the European Union and UK respectively, and introduce significant penalties for non-compliance, with fines of up to 4% of total annual worldwide turnover or €20 million (whichever is higher), depending on the type and severity of the breach. The interpretation of EU Data Protection Laws and other privacy laws to which we are subject around the world can be uncertain, and as business practices are challenged by regulators, data subjects and consumer protection agencies, it is possible that these laws may be interpreted and applied in a manner that is inconsistent with our data protection practices.
30
The carrying value of goodwill and other intangible assets on our balance sheet could become impaired, which would adversely affect our financial condition and results of operations.
We have recorded goodwill and intangible asset impairments in the past and could incur such charges in the future as acquisitions occur and we take on more goodwill. We review the carrying value of goodwill and intangible assets not subject to amortization on an annual basis, or more frequently if indications exist suggesting that the fair value of our intangible assets may be below their carrying values. We test the values of intangible assets subject to amortization whenever events or changes in circumstances indicate that the carrying amount of an asset may not be recoverable. Should such review indicate impairment, a write-down of the carrying value of goodwill or the intangible asset could occur, resulting in a non-cash charge that may, in turn, affect our reported results of operations, financial condition and shareholders’ equity.
The failure of a counterparty to meet its obligations could affect our business adversely.
Our Affiliates routinely execute transactions with counterparties in the financial industry and for the provision of services that are important to the business, and we may engage in transactions with counterparties as part of our corporate finance management function and for the provision of services, including insurance protection. As a result, we and our Affiliates and clients have exposure to the credit, operational and other risks posed by such counterparties, including the risk of default by or bankruptcy of a counterparty. The failure of a counterparty to meet its obligations or provide the services or insurance protection we depend on for these or other reasons could adversely affect our ability to conduct our businesses and result in loss of client assets and potential liability. Additionally, we hold insurance policies which cover historical and future tax benefits relating to certain of our deferred tax assets. The insurers of the policies are considered a significant counterparty to us.
We are subject to the U.S. Foreign Corrupt Practices Act, the U.K. Bribery Act and other anti-corruption laws, as well as export control laws, customs laws, sanctions laws, anti-facilitation of tax evasion laws and other laws governing our operations. If we fail to comply with these laws, we could be subject to civil or criminal penalties, other remedial measures, and legal expenses, which could adversely affect our business, results of operations and financial condition.
Our operations are subject to anti-corruption laws, including the U.S. Foreign Corrupt Practices Act, or the FCPA, the U.K. Bribery Act 2010, or the Bribery Act, and other anti-corruption laws that apply in countries where we do business. The FCPA, the Bribery Act and these other laws generally prohibit us and our employees and intermediaries from bribing, being bribed or making other prohibited payments to government officials or other persons to obtain or retain business or gain some other business advantage. We and our commercial partners operate in a number of jurisdictions that may pose a risk of potential FCPA or Bribery Act violations, and we participate in collaborations and relationships with third parties whose actions could potentially subject us to liability under FCPA, the Bribery Act or local anti-corruption laws. In addition, we cannot predict the nature, scope or effect of future regulatory requirements to which our internal operations might be subject or the manner in which existing laws might be administered or interpreted.
We are also subject to other laws and regulations governing our international operations, including regulations administered by the governments of the U.S. and the United Kingdom, or U.K., and authorities in the European Union, including applicable export control regulations, economic sanctions on countries or persons, customs requirements and currency exchange regulations, anti-facilitation of tax evasion rules (including the U.K. Criminal Finances Act 2017), or Trade Control Laws.
31
There is no assurance that we will be completely effective in ensuring our compliance with all applicable anti-corruption laws, including the FCPA, the Bribery Act or other legal requirements, including Trade Control Laws. If we are not in compliance with the FCPA, the Bribery Act and other anti-corruption laws or Trade Control Laws, we may be subject to criminal and civil penalties, disgorgement and other sanctions and remedial measures, and legal expenses, which could have an adverse impact on our business, financial condition, results of operations and liquidity. Likewise, any investigation of any potential violations of the FCPA, the Bribery Act, other anti-corruption laws or Trade Control Laws by U.K., U.S. or other authorities could also have an adverse impact on our reputation, business, results of operations and financial condition.
The United Kingdom exit from the European Union (“Brexit”) could adversely impact our business.
The United Kingdom left the European Union on January 31, 2020 (commonly referred to as “Brexit”). During an 11-month transition period, the United Kingdom and the European Union agreed to a Trade and Cooperation Agreement which sets out the agreement for certain parts of the future relationship between the European Union and the United Kingdom from January 1, 2021. The Trade and Cooperation Agreement does not provide the United Kingdom with the same level of rights or access to all goods and services in the European Union as the United Kingdom previously maintained as a member of the European Union and during the transition period. In particular the Trade and Cooperation Agreement does not include an agreement on financial services which is yet to be agreed. Accordingly, uncertainty remains in certain areas as to the future relationship between the United Kingdom and the European Union.
From January 1, 2021, European Union laws ceased to apply in the United Kingdom. However, many European Union laws have been transposed into English law and these transposed laws will continue to apply until such time that they are repealed, replaced or amended. Depending on the terms of any future agreement between the European Union and the United Kingdom on financial services, substantial amendments to English law may occur, and it is impossible to predict the consequences of this on us and our investments.
Although one cannot predict the full effect of Brexit, it could have a significant adverse impact on the United Kingdom, European and global macroeconomic conditions and could lead to prolonged political, legal, regulatory, tax and economic uncertainty. This uncertainty is likely to continue to impact the global economic climate and may impact opportunities, pricing, availability and cost of bank financing, regulation, values or exit opportunities of companies or assets based, doing business, or having service or other significant relationships in, the United Kingdom or the European Union, including companies or assets held by us or considered by us as a prospective investment.
The future application of European Union-based legislation to the investment management industry in the United Kingdom and the European Union will ultimately depend on how the United Kingdom renegotiates the regulation of the provision of financial services within and to persons in the European Union. There can be no assurance that any renegotiated terms or regulations will not have an adverse impact on us and our investments, including our ability to achieve our investment objectives. Brexit may result in significant market dislocation, heightened counterparty risk, an adverse effect on the management of market risk and, in particular, asset and liability management due in part to redenomination of financial assets and liabilities, an adverse effect on our ability to manage, operate and invest, and increased legal, regulatory or compliance burden for us and our Affiliates, each of which may have a negative impact on our operations, financial condition, returns or prospects.
Areas where the uncertainty created by the United Kingdom’s withdrawal from the European Union is relevant include, but are not limited to, trade within Europe, foreign direct investment in Europe, the scope and functioning of European regulatory frameworks, industrial policy pursued within European countries, immigration policy pursued within European Union countries, the regulation of the provision of financial services within and to persons in Europe and trade policy within European countries and internationally. The volatility and uncertainty caused by the withdrawal may adversely affect the value of our investments and the ability to achieve our investment objectives.
32
The novel coronavirus (COVID-19) pandemic has disrupted and may continue to disrupt financial markets and our business.
The outbreak of COVID-19 and the related containment and mitigation measures put in place have had, and may continue to have, a serious impact on the economy and the financial and securities markets. As a result, the investment results of our Affiliates have been, and may continue to be, negatively affected, resulting in decreases to our assets under management and related revenue and earnings in the first half of 2020. In addition, the economic conditions caused by the COVID-19 pandemic may increase our funding costs or limit our access to the capital markets, which could impact our ability to finance our operations through borrowing. As the potential impact of COVID-19 is impossible to predict, the extent to which COVID-19 could negatively affect our and our Affiliates’ operating results or the duration of any potential business disruption is uncertain.
In addition, our operations and the operations of our Affiliates, as well as third-party service providers on whom we rely, have been, and are expected to continue to be, significantly impacted by the COVID-19 pandemic. No assurance can be given that the steps we have taken with respect to business continuity plans will be effective or appropriate. While our employees have been successful in working remotely, operational challenges may arise in the future. In the event that our workforce, the workforce of one or more Affiliates, or the workforces of our or our Affiliates’ key service providers were to experience significant illness levels, our ability to operate our business normally could be materially disrupted. Any such material disruptions to our business operations could have a material adverse impact on our results of operation or financial condition.
We may not achieve the expected strategic and financial benefits of current or potential divestitures.
In 2020, we divested our affiliates Barrow Hanley and Copper Rock and, in early 2021, we have agreed to the divestiture of our affiliate ICM. We effected these divestitures because we believe that it better positioned our business and the consideration received was additive to shareholder value. We may in the future divest additional investments in the event we believe there is a similarly strong strategic and financial rationale for such divestitures. There can be no assurances, however, that we will be able to achieve the expected strategic and financial benefits from these divestitures.
We may be adversely affected by the phase-out of, or changes in the method of determining, the London Interbank Offered Rate (“LIBOR”) or the replacement of LIBOR with a different reference rate.
LIBOR is the basic rate of interest used in lending between banks on the London interbank market and is widely used as a reference for setting the interest rate on U.S. dollar-denominated loans globally. Our credit facility, originally entered into on August 20, 2019 and assigned to Acadian on February 23, 2021, uses LIBOR a a reference rate such that the interest due to our creditors under the facility is calculated using LIBOR. On July 27, 2017, the U.K.’s Financial Conduct Authority (the authority that administers LIBOR) announced that it intends to phase out LIBOR by the end of 2021. It is unclear whether new methods of calculating LIBOR will be established such that it continues to exist after 2021, or if alternative rates or benchmarks will be adopted. Changes in the method of calculating LIBOR, or the replacement of LIBOR with an alternative rate or benchmark, may adversely affect interest rates and result in higher borrowing costs. This could materially and adversely affect our results of operations, cash flows, and liquidity. We cannot predict the effect of the potential changes to LIBOR or the establishment and use of alternative rates or benchmarks.
33
Industry Risks
We operate in a competitive environment.
The investment management industry is highly competitive, with competition based on a variety of factors, including investment performance, investment management fee rates, continuity of investment professionals and client relationships, the quality of services provided to clients, reputation and the strategies offered. We and our Affiliates compete against a broad range of domestic and international asset management firms, broker-dealers, hedge funds, investment banking firms and other financial institutions. We directly compete against these organizations with respect to investment products, distribution channels, opportunities to acquire other investment management firms and retention and recruitment of talent. The capital resources, scale, name recognition and geographic footprints of many of these organizations are greater than ours. The recent trend toward consolidation in the investment management industry, and the financial services industry in general, has served to increase the size and strength of a number of our competitors. Some investors may prefer to invest with an investment manager that is not publicly traded based on the perception that a publicly traded asset manager may focus on the manager’s own growth to the detriment of investment performance for clients. Some competitors may operate in a different regulatory environment than we do, which may give them certain competitive advantages in the investment products and portfolio structures that they offer.
In addition, each of our Affiliates competes against other investment managers offering the same or different investment strategies. The competition in our industry results in pressure on fees which may hinder the ability of our Affiliates to compete. All of our Affiliates rely upon their investment performance as a competitive advantage, which may not always position them to compare favorably to their competitors. In certain instances, our Affiliates also may compete against one another for clients. It is likely that new competitors will enter the market as there are low costs and limited barriers to entry.
Our ability to attract assets also is dependent upon the ability of our Affiliates to offer a mix of products and services that meet client demand and their abilities to maintain investment management fees at competitive levels. There are a number of asset classes and product types that currently are not well covered by our Affiliates, such as index funds, passive exchange-traded funds and hedge funds. When these asset classes or products are in favor with either existing or potential clients, our Affiliates will miss the opportunity to attract and manage these assets and face the risk of assets being withdrawn in favor of competitors who manage the asset classes and/or provide these products. If our Affiliates are unable to compete effectively in their markets, our results of operations and potential business growth could be adversely affected.
Our sole business is asset management. As a result, we may be more impacted by trends and issues and more susceptible to negative events impacting the asset management industry than other more diversified financial services companies that provide asset management and other financial services.
We operate in a highly regulated industry, and continually changing federal, state, local and foreign laws and regulations could materially adversely affect our business, financial condition and results of operations.
The investment management business is highly regulated and, as a result, our Affiliates are required to comply with a wide array of domestic and international laws and regulations. The requirements imposed by our regulators are designed to ensure the integrity of the financial markets and to protect customers and other third parties who deal with us, and are not designed to protect our shareholders. Accordingly, these regulators often serve to limit our activities, including through client protection and market conduct requirements.
34
Our Affiliates are subject to extensive regulation in the U.S. through their primary regulator, the SEC, under the Advisers Act. Those of our Affiliates that act as investment advisers or sub-advisers to registered investment companies must comply with the terms of the Investment Company Act and the rules thereunder. The Advisers Act imposes numerous obligations on registered investment advisers, including fiduciary, record keeping, advertising and operational requirements, disclosure obligations, and prohibitions on fraudulent activities. The Investment Company Act regulates the structure and operations of registered investment companies and imposes additional obligations on advisers to registered investment companies, including detailed disclosure and regulatory requirements applicable to the registered investment companies and additional compliance responsibilities which must strictly be adhered to by the funds and their advisers. Certain of our advisory Affiliates also are subject to the rules and regulations adopted by the Commodity Futures Trading Commission, under the Commodity Exchange Act; by the Department of Labor, under ERISA; the Financial Industry Regulatory Authority, Inc., or FINRA; and state regulators.
The domestic regulatory environment in which we operate has seen significantly increased regulation in recent years. In particular, the Dodd-Frank Wall Street Reform and Consumer Protection Act, or the Dodd-Frank Act, represents a comprehensive overhaul of the financial services industry in the U.S. and includes, among other things: (i) the creation of a Financial Stability Oversight Council to identify emerging systemic risks posed by financial firms, activities and practices, and to improve cooperation among federal agencies, (ii) the creation of the Consumer Financial Protection Bureau authorized to promulgate and enforce consumer protection regulations relating to financial products and services, and (iii) enhanced regulation of financial markets, including the derivatives and securitization markets. Certain provisions of the Dodd-Frank Act may require our Affiliates to change, or adopt new limitations on, the manner in which they conduct their business. The Dodd-Frank Act and the rules promulgated thereunder have also increased regulatory burdens and related reporting and compliance costs. Certain provisions may have unintended adverse consequences on the liquidity or structure of the financial markets. In addition, the scope and impact of many provisions of the Dodd-Frank Act remain to be determined by implementing regulations, some of which have involved lengthy proposal and promulgation periods and could lead to additional legislation or regulation. The Dodd-Frank Act impacts a broad range of market participants with whom our Affiliates interact or may interact. These changes may also impact the way in which our Affiliates conduct business with their counterparties and many aspects of the regulatory landscape continue to evolve. As a result of these uncertainties, the full impact of the Dodd-Frank Act on the investment management industry and on our and our Affiliates’ businesses, in particular, cannot be predicted at this time.
We and our Affiliates also are subject to the regulatory environments of the non-U.S. jurisdictions in which we and they operate, some of which also recently implemented or are in the process of implementing changes in regulations. In the U.K., certain of our Affiliates are subject to regulation by the Financial Conduct Authority, or FCA, which impose a comprehensive system of regulation on investment advisers and the manner in which we and they conduct our businesses. Certain other of our Affiliates may be registered in jurisdictions outside of the United States and are subject to applicable regulation in those jurisdictions. We and our Affiliates are additionally subject to regulation relating to the offer and sale of financial products in each of the European Union countries in which we and they operate. The system of financial regulation outside the United States continues to develop and evolve and, as a result, the rules to which we and our Affiliates are subject (including rules relating to the remuneration of staff) are and will continue to be subject to change. As we execute on our growth strategy and continue to expand our distribution efforts into non-U.S. jurisdictions, including other member countries of the European Union, Latin America, the Middle East and Asian countries, we and our Affiliates may be required to register with additional foreign regulatory authorities or otherwise comply with non-U.S. rules and regulations that currently are not applicable to our businesses and with respect to which we may have limited or no compliance experience. Our lack of experience in complying with any such non-U.S. or non-English laws and regulations may increase our risk of becoming a party to litigation or subject to regulatory actions. Additionally, one or more of the jurisdictions in which we operate may require our shareholders to seek the approval of, or provide notice to, an applicable regulator before acquiring a substantial amount of our outstanding shares.
35
Developments in the regulatory environment in the U.S. may include heightened and additional examinations and inspections by regulators and the imposition of additional reporting and disclosure obligations. Regulators also may take a more aggressive posture on bringing enforcement proceedings which could result in fines, penalties and additional remedial activities.
Policy and legislative changes in the U.S. and in other countries are affecting many aspects of financial regulation. Our business, results of operations and financial condition may be adversely affected as a result of new or revised legislation or regulations or by changes in the interpretation or enforcement of existing laws and regulations in any of the jurisdictions in which we and our Affiliates conduct business. The ability of us and our Affiliates to function in this legislative and regulatory environment will depend on our and our Affiliates’ ability to monitor and promptly react and adapt to legislative and regulatory changes, including situations where such changes in regulatory requirements may be driven by internal factors. It is impossible to determine the extent of the impact of any new laws, regulations or initiatives that may be proposed, or whether any of the proposals will become law. Any new laws or regulations could make compliance more difficult and expensive and affect the manner in which we and our Affiliates conduct business.
Failure to comply with applicable laws or regulations could result in fines, suspension or revocation of an Affiliate’s registration as an investment adviser, suspensions of individual employees, revocation of licenses to operate in certain jurisdictions or other sanctions, which could materially adversely affect our business, financial condition and results of operations. Even if an investigation or proceeding did not result in a fine or sanction, or the fine or sanction imposed against an Affiliate or us or our respective employees by a regulator were small in monetary amount, the adverse publicity relating to an investigation, proceeding or imposition of a fine or sanction could cause us to suffer financial loss, harm our reputation and cause us to lose business or fail to attract new business which would have a direct adverse impact on our business, financial condition and results of operations.
If we were deemed an investment company under the Investment Company Act, we would become subject to burdensome regulatory requirements and our business activities could be restricted.
We do not believe that we are an “investment company” under the Investment Company Act. Generally, a company is an “investment company” if, absent an applicable exemption, it (i) is, or holds itself out as being, engaged primarily, or proposes to engage primarily, in the business of investing, reinvesting or trading in securities or (ii) engages, or proposes to engage, in the business of investing, reinvesting, owning, holding or trading in securities and owns or proposes to acquire “investment securities” having a value exceeding 40% of the value of its total assets (exclusive of U.S. government securities and cash items) on an unconsolidated basis. We believe we are primarily engaged in a non-investment company business and that less than 40% of our total assets (exclusive of U.S. government securities and cash items) on an unconsolidated basis are comprised of assets that could be considered investment securities.
We and our Affiliates intend to conduct our operations so that we will not be deemed an investment company under the Investment Company Act. However, if we were to be deemed an investment company, restrictions imposed by the Investment Company Act, including limitations on our capital structure and our ability to transact with our Affiliates, could make it impractical for us to continue our business as currently conducted and could have a material adverse effect on our financial performance and operations.
36
Risks Related to Our Ownership Structure
Any sale of a controlling block of our voting securities could adversely impact our relationship with our Affiliates and their clients.
Our Affiliates are (or have subsidiaries who are) U.S. registered investment advisers. Certain of our Affiliates provide investment advisory services to investment companies registered under the Investment Company Act pursuant to the terms of an investment advisory agreement between the Affiliate and the applicable U.S. registered investment company. Certain of our Affiliates have been retained by U.S. registered investment advisers to certain U.S. registered investment companies to provide investment subadvisory services to U.S. registered investment companies pursuant to the terms of an investment subadvisory agreement between the Affiliate and the relevant U.S. registered investment adviser. Each of these investment advisory and subadvisory agreements provides for its automatic termination in the event of its “assignment,” as defined in the Investment Company Act. The investment advisory agreements between our Affiliates, (or their subsidiaries) and their non-registered investment company clients provide that there can be no “assignment,” as defined under the Advisers Act, of those agreements without the consent of the client. An assignment is generally defined to include direct assignments as well as assignments that may be deemed to occur, under certain circumstances, upon the direct or indirect transfer of a “controlling block” of the voting securities of the respective Affiliate.
If any acquisition of a block of our voting securities by a third party, separately or together, were deemed an “assignment” of the underlying investment advisory and subadvisory agreements between our Affiliates (or their subsidiaries) and their clients under the Advisers Act and Investment Company Act and (ii) non-registered investment company clients do not consent to the assignment and/or registered investment company clients do not enter into new advisory agreements, our results of operations could be materially and adversely affected.
Paulson has meaningful ability to influence our business.
As of February 26, 2021, Paulson & Co., Inc. (“Paulson”) owns 25.19% of our common stock. This concentration of ownership may have the effect of delaying or preventing a change in control of us or discouraging others from making tender offers for our common stock. It also may make it difficult for other shareholders to replace management and may adversely impact the trading price of our common stock because investors often perceive disadvantages in owning common stock in companies with significant shareholders. Additional repurchases of our common stock could, without any action by Paulson, further increase Paulson’s concentration of ownership. Additionally, Paulson has the right to appoint two directors so long as Paulson holds at least 20% of our outstanding common stock and has the right to appoint one director so long as Paulson holds at least 7% of our outstanding common stock. Paulson also has the right to transfer these appointment rights to a transferee that acquires from Paulson the foregoing percentages of our common stock, at which point such unknown third party may have a meaningful ability to influence our business.
Risks Related to Our Tax Matters
Our global effective tax rate is subject to a variety of different factors, which could create volatility in that rate, expose us to greater than anticipated tax liabilities and cause us to adjust previously recognized tax assets and liabilities.
We are subject to income taxes in the U.S., U.K. and many other jurisdictions. As a result, our global effective tax rate from period to period can be affected by many factors, including our global mix of earnings, the tax characteristics of our income and changes in tax legislation. Significant judgment is required in determining our worldwide provision for income taxes, and our determination of our tax liability is always subject to review by applicable tax authorities.
We cannot provide any assurances as to what our tax rate will be in any period because of, among other things, uncertainty regarding the nature and extent of our business activities in any particular jurisdiction in the future and the tax laws of such jurisdictions, as well as changes in U.S. and other tax laws, treaties and regulations. Our actual global tax rate may vary from our expectation and that variance may be material.
37
Failure to comply with the tax laws of the U.S., the U.K. or other jurisdictions, which laws are subject to potential legislative, judicial or administrative change and differing interpretations, possibly on a retroactive basis, may result in erroneous filings, adjustments to previously recognized tax assets and liabilities, negative impact to income and reputational damage.
We and our Affiliates are subject to a range of taxes and tax audits and may be subject to future audits and examinations by both foreign and domestic taxing authorities. Tax and other regulatory authorities may disagree with tax positions taken by us and our Affiliates based on our, or their, interpretations of the relevant tax laws, including, for example, with respect to our tax positions related to the Redomestication or to prior reorganizations, which could result in erroneous filings, retroactive adverse impact on income, the loss of tax benefits and reputational damage. The resolution of such audits and examinations could impact our tax rate in future periods, as would any reclassification or other matter (such as changes in applicable accounting rules) that increases the amounts we have provided for income taxes in our Consolidated Financial Statements. We will regularly assess the likelihood of favorable or unfavorable outcomes resulting from these audits and examinations to determine the adequacy of our provision for income taxes, which will require estimates and judgments. Although we will make these tax estimates and judgments on a reasonable basis, there can be no assurance that the tax authorities will agree with such estimates and judgments. From time to time, we may have to engage in litigation to attempt to achieve the results reflected in our estimates, which may be time-consuming and expensive and may have other adverse impacts. There can be no assurance that we will be successful in any such litigation or other attempts to mitigate adverse effects resulting from such audits or examinations or that any final determination of our tax liability will not be materially different from the historical treatment reflected in our historical income tax provisions and accruals. Our inability to mitigate the negative consequences of any resolution of audits and examinations could cause our global tax rate to increase, our use of cash to increase and our financial condition and results of operations to suffer.
Changes in tax laws could have an adverse impact on our business, financial condition, and results of operations.
The tax laws of the U.S., the U.K. and other jurisdictions could change in the future, and such changes could cause a material change in our effective tax rate and otherwise adversely affect our results of operations. As a result of the recent presidential and congressional elections in the United States, there could be significant changes in tax law and regulations. While the likelihood and nature of any such legislation or regulations is uncertain, the new administration may pursue tax policies seeking to increase the corporate tax rate and further limit the deductibility of interest, among other things. Such changes could materially increase the amount of taxes we are required to pay.
Further, pursuant to ongoing efforts to encourage global tax compliance, the U.S. Congress, the Organization for Economic Co-operation and Development (the “OECD”) and other government agencies in jurisdictions in which we and our Affiliates invest or do business have maintained a focus on issues related to the taxation of multinational companies. The OECD, which represents a coalition of member countries, is contemplating changes to numerous long-standing tax principles through its base erosion and profit shifting (“BEPS”) project, which is focused on a number of issues, including profit shifting among affiliated entities in different jurisdictions, interest deductibility and eligibility for the benefits of double tax treaties. Some member countries have been moving forward on, and have implemented aspects of, the BEPS agenda but, because timing of implementation and the specific measures adopted will vary among participating states, significant uncertainty remains regarding the impact of BEPS proposals. These and other proposals could adversely affect us, our Affiliates, and the Funds. In addition, the OECD is working on a BEPS 2.0 initiative, which is aimed at (i) shifting taxing rights to the jurisdiction of the consumer and (ii) ensuring all companies pay a global minimum tax. New rules could be recommended in 2021 and if implemented could impact us and our Affiliates. The timing and scope of any provisions are subject to significant uncertainty.
Any changes in domestic or foreign tax laws, regulations, or accompanying standards or the release of additional guidance, interpretation or information relating to existing legislation (including the Tax Act) could impact our effective tax rate or result in unanticipated additional tax liabilities, which could have an adverse effect on our business, financial condition or results of operations.
38
Risks Related to Investing in our Common Stock
Future sales of our common stock by us, Paulson or other shareholders could cause our share price to decline.
If we, Paulson or other shareholders sell, or indicate an intention to sell, or there is a perception that they might sell a substantial number of shares of our common stock in the public market or in privately negotiated transactions, the trading price of our common stock could decline below the current trading level.
Sales by Paulson or other stockholders or the possibility that these sales may occur also may make it more difficult for us to raise additional capital by selling equity securities in the future, at a time and price that we deem appropriate.
We cannot predict the size of future issuances or sales of our common stock or the effect, if any, that future issuances and sales of our common stock may have on the market price of our common stock. Sales or distributions of substantial amounts of our common stock, including shares issued in connection with an acquisition, or the perception that such sales or distributions could occur, may cause the market price of our common stock to decline.
Our amended and restated certificate of incorporation designates the Court of Chancery of the State of Delaware as the sole and exclusive forum for certain types of actions and proceedings that may be initiated by our stockholders, which could limit our stockholders’ ability to obtain a favorable judicial forum for disputes with us or our directors, officers, employees or agents.
Our amended and restated certificate of incorporation provides that, unless we consent in writing to an alternative forum, the Court of Chancery of the State of Delaware will be the sole and exclusive forum for (i) any derivative action or proceeding brought on our behalf, (ii) any action asserting a claim of breach of a fiduciary duty owed by any of our directors, officers, employees or agents to us or our stockholders, (iii) any action asserting a claim arising pursuant to any provision of the Delaware General Corporation Law or (iv) any action asserting a claim that is governed by the internal affairs doctrine, in each case subject to the Court of Chancery having personal jurisdiction over the indispensable parties named as defendants therein and the claim not being one which is vested in the exclusive jurisdiction of a court or forum other than the Court of Chancery or for which the Court of Chancery does not have subject matter jurisdiction. Any person purchasing or otherwise acquiring any interest in any shares of our capital stock shall be deemed to have notice of and to have consented to this provision of our amended and restated certificate of incorporation. This choice of forum provision may limit our stockholders’ ability to bring a claim in a judicial forum that it finds favorable for disputes with us or our directors, officers, employees or agents, which may discourage such lawsuits against us and our directors, officers, employees and agents. Alternatively, if a court were to find this provision of our restated certificate of incorporation inapplicable to, or unenforceable in respect of, one or more of the specified types of actions or proceedings, we may incur additional costs associated with resolving such matters in other jurisdictions, which could adversely affect our business and financial condition. The exclusive forum provision described above does not impact the Federal courts’ exclusive jurisdiction over Exchange Act claims or the Federal and state courts’ concurrent jurisdiction over Securities Act claims.
General Risk Factors
The market price of our common stock and the broader equity markets have been, and may continue to be, volatile.
The market price of our common stock has been and may continue to be volatile, and equity markets have experienced and may continue to experience significant price and volume fluctuations. Among the factors that may affect our stock price are the following:
•Speculation in the investment community or the press about, or actual changes in, our competitive position, organizational structure, executive team, operations, financial condition, financial reporting and results, ability to maximize shareholder returns or plans to engage in strategic transactions by us or others in our industry;
39
•The announcement of mergers, acquisitions, dispositions or new products or services by us or others in our industry;
•Announcements of our financial results, including changes in net client cash flows and assets under management, changes in earnings estimates by the investment community, and variations between estimated financial results and actual financial results; and
•The pricing structure for products offered by us, our Affiliates or our competitors.
Changes in general conditions and volatility in the economy, the financial markets and our industry, and other developments affecting us, our Affiliates or our competitors, as well as geopolitical, regulatory, economic, and business factors unrelated to us, could cause the market price of our common stock to fluctuate substantially. Declines in the market price of our common stock or failure of the market price to increase could also harm our ability to retain key employees, reduce our access to capital and otherwise harm our business.
Our ability to pay regular dividends to our stockholders is subject to the discretion of our Board of Directors and may be limited by our structure and applicable provisions of Delaware law.
Any declaration of dividends will be at the discretion of our Board of Directors, and will depend on our financial condition, earnings, cash needs, regulatory constraints, capital requirements and any other factors that our Board of Directors deems relevant in making such a determination. However, our ability to make such distributions will be subject to our operating results, which are impacted by the ability of our Affiliates to make distributions to us, cash requirements and financial condition, the applicable provisions of Delaware law that may limit the amount of funds available for distribution, our compliance with covenants and financial ratios related to existing or future indebtedness, including under our notes and our credit facilities, and our other agreements with third parties. In addition, we are dependent upon the ability of our Affiliates to generate earnings and cash flows and distribute them to us so that we may pay dividends to our stockholders. As a consequence of these various limitations and restrictions, we may not be able to make, or may have to reduce or eliminate, the payment of dividends on our common stock.
Our management devotes substantial time to compliance with our public company legal and reporting obligations.
We are subject to the reporting requirements of the Securities Exchange Act of 1934, as amended, or the Exchange Act, and are required to implement specific corporate governance practices and adhere to a variety of reporting requirements under the Sarbanes-Oxley Act of 2002, or Sarbanes-Oxley, and the related rules and regulations of the SEC, as well as the rules of the NYSE. The Exchange Act requires us to file annual, quarterly and current reports with respect to our business and financial condition. Our management and other personnel devote substantial time to compliance with our public company obligations. Moreover, these rules and regulations increase our legal and financial compliance costs and make some activities more time-consuming and costly.
In addition, Sarbanes-Oxley requires, among other things, that we maintain effective internal control over financial reporting and disclosure controls and procedures. In particular, commencing with our Annual Report on Form 10-K for fiscal year 2015, we have performed system and process evaluations and we have tested our internal control over financial reporting to allow management to report on the effectiveness of our internal control over financial reporting, as required by Section 404 of Sarbanes-Oxley, and obtain an auditor attestation as to the effectiveness of our internal controls.
40
Testing may reveal deficiencies in our internal control over financial reporting that are deemed to be material weaknesses. Our compliance with Section 404 has required that we incur additional accounting expense and expend additional management time on compliance-related issues. Moreover, if at any time we are not able to comply with the requirements of Section 404 in a timely manner, or if we identify deficiencies in our internal control over financial reporting that are deemed to be material weaknesses, the market price of our common stock could decline, and we could be subject to sanctions or investigations by the NYSE, the SEC or other regulatory authorities, which would require additional financial and management resources.
41
Item 1B. Unresolved Staff Comments.
There are no unresolved written comments that were received from the Securities and Exchange Commission staff 180 days or more before the end of our fiscal year relating to our periodic or current reports under the Securities Exchange Act of 1934, as amended.
Item 2. Properties.
Our principal executive office is located at 200 Clarendon Street, 53rd Floor, Boston, Massachusetts 02116. In Boston, we lease 28,606 square feet under a lease that expires on December 31, 2022. Each Affiliate has its own primary office where core investment management activities take place. Primary Affiliate-leased locations include Boston, MA; Baltimore, MD; Portland, OR; and Richmond, VA, as well as an owned property in Simsbury, CT. In addition, both we and several of our Affiliates have leased secondary offices to support research, distribution and client servicing. Key locations for secondary offices include (but are not limited to) London, New York, Singapore and Sydney. We believe existing facilities are appropriate in size, location and functionality to meet current and future business requirements.
Item 3. Legal Proceedings.
From time to time, we and our Affiliates may be parties to various claims, suits and complaints in the ordinary course of our business. Although the amount of liability that may result from these matters cannot be ascertained, we do not currently believe that, in the aggregate, they will result in liabilities material to our consolidated financial condition, future results of operations or cash flow.
Item 4. Mine Safety Disclosures.
Not applicable.
42
PART II
Item 5. Market for Registrant’s Common Equity, Related Stockholder Matters and Issuer Purchases of Equity Securities.
Market Information for Common Stock
Our common stock trades on the New York Stock Exchange under the symbol “BSIG.” As of February 26, 2021 there were two registered stockholders of record.
Repurchases
The following table sets out information regarding repurchases of equity securities by the Company for the three months ended December 31, 2020:
| Period | Total number of shares purchased | Average price paid per share | Total number of shares purchased as part of publicly announced plans or programs | Approximate dollar value that may yet be purchased under the plans or programs(1) (in millions) | ||||||||||||||||||||||
| October 1-31, 2020 | 117,700 | $ | 13.66 | 117,700 | $ | 241.8 | ||||||||||||||||||||
| November 1-30, 2020 | 627,001 | 14.52 | 627,001 | 232.7 | ||||||||||||||||||||||
| December 1-31, 2020 | — | — | — | 232.7 | ||||||||||||||||||||||
| Total | 744,701 | $ | 14.38 | 744,701 | ||||||||||||||||||||||
(1)On February 3, 2016, our Board of Directors authorized a $150.0 million open market share repurchase program, which was approved by shareholders on March 15, 2016. On April 18, 2018, our Board of Directors approved an amendment to the existing repurchase contract, to permit us to repurchase shares from time to time, up to an aggregate limit of $600.0 million of shares.We repurchased 744,701 shares of common stock with an aggregate purchase price of $10.7 million under this program during the three months ended December 31, 2020. As of December 31, 2020, $232.7 million remained available to repurchase shares under the open market share repurchase program.
43
Financial Performance Graph
This performance graph shall not be deemed “soliciting material” or to be “filed” with the SEC for purposes of Section 18 of the Securities Exchange Act of 1934, as amended, or the Exchange Act, or otherwise subject to the liabilities under that Section, and shall not be deemed to be incorporated by reference into any filing of BSIG under the Securities Act.
The following graph compares the cumulative shareholder return on our common stock from October 8, 2014, the date of our initial public offering, through December 31, 2020, with the cumulative total return, during the same period, of the Standard & Poor’s 500 Index, the Standard & Poor’s 500 Financial Sector Index and a peer group comprised of Affiliated Managers Group, Inc., AllianceBernstein Holding L.P., Artisan Partners Asset Management, Inc.,Cohen & Steers, Inc., Eaton Vance Corp., Federated Investors, Inc., Franklin Resources, Inc., Invesco Ltd., Janus Henderson Group plc, T. Rowe Price Group, Inc., Victory Capital Management, and Virtus Investment Partners, Inc.
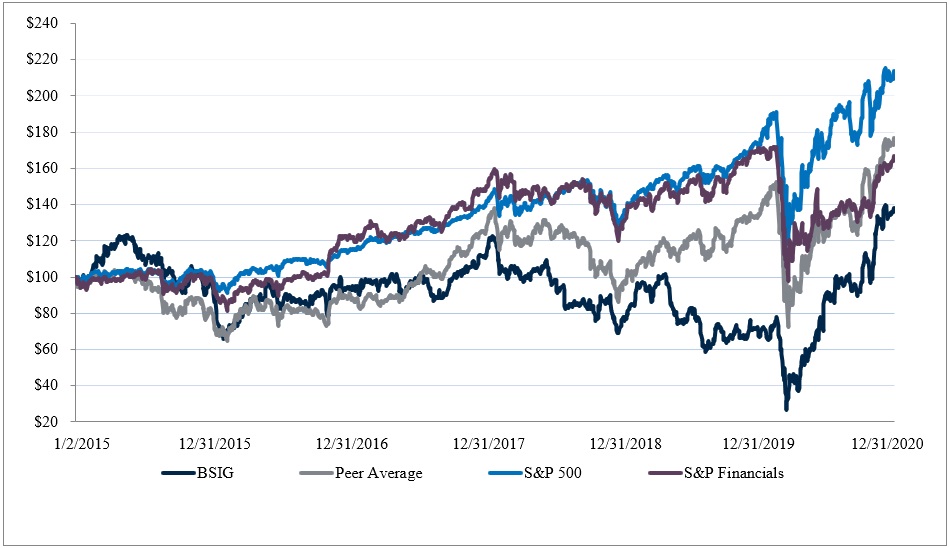
44
Item 6. Selected Financial Data.
We present economic net income, or ENI, to help us describe our operating and financial performance. ENI is the key measure our management uses to evaluate the financial performance of, and make operational decisions for, our business. ENI is not audited, and is not a substitute for net income or other performance measures that are derived in accordance with U.S. GAAP. Furthermore, our calculation of ENI may differ from similarly titled measures provided by other companies. Please refer to “Management’s Discussion and Analysis of Financial Condition and Results of Operations—Non-GAAP Supplemental Performance Measure—Economic Net Income and Segment Analysis” for a more thorough discussion of ENI and a reconciliation of ENI to U.S. GAAP net income.
The following table sets forth our selected historical consolidated financial data as of the dates and for the periods indicated. The data for each of the five years presented have been derived from our historical Consolidated Financial Statements audited under U.S. GAAP.
You should read our following selected historical consolidated financial data together with “Management’s Discussion and Analysis of Financial Condition and Results of Operations” and the historical Consolidated Financial Statements and the related notes thereto, included elsewhere in this Annual Report on Form 10-K.
| Years ended December 31, | |||||||||||||||||||||||||||||
| ($ in millions, except per share data as noted) | 2020 | 2019 | 2018 | 2017 | 2016 | ||||||||||||||||||||||||
U.S. GAAP Statement of Operations Data(1): | |||||||||||||||||||||||||||||
Management fees(2) | $ | 697.9 | $ | 807.0 | $ | 905.0 | $ | 858.0 | $ | 659.9 | |||||||||||||||||||
| Performance fees | 7.8 | (0.1) | 9.8 | 26.5 | 2.6 | ||||||||||||||||||||||||
| Other revenues | 7.3 | 6.0 | 9.6 | 1.2 | 0.9 | ||||||||||||||||||||||||
Consolidated Funds’ revenue(2) | 5.5 | 6.6 | 3.8 | 1.7 | 0.1 | ||||||||||||||||||||||||
Total Revenue(2) | $ | 718.5 | $ | 819.5 | $ | 928.2 | $ | 887.4 | $ | 663.5 | |||||||||||||||||||
Net income before tax from continuing operations attributable to controlling interests(3) | $ | 398.8 | $ | 241.9 | $ | 141.3 | $ | 137.1 | $ | 161.0 | |||||||||||||||||||
Net income from continuing operations attributable to controlling interests(2)(3) | 286.7 | 223.9 | 136.3 | 4.3 | 120.2 | ||||||||||||||||||||||||
Net income (loss) from continuing operations(2) | 315.5 | 240.0 | 130.2 | 9.2 | 120.0 | ||||||||||||||||||||||||
U.S. GAAP operating margin(2)(4) | 25 | % | 31 | % | 9 | % | 8 | % | 23 | % | |||||||||||||||||||
U.S. GAAP basic earnings per share from continuing operations attributable to controlling interests | $ | 3.53 | $ | 2.45 | $ | 1.27 | $ | 0.04 | $ | 0.98 | |||||||||||||||||||
U.S. GAAP diluted earnings per share from continuing operations attributable to controlling interests | $ | 3.49 | $ | 2.45 | $ | 1.26 | $ | 0.04 | $ | 0.98 | |||||||||||||||||||
45
| Years ended December 31, | |||||||||||||||||||||||||||||
| ($ in millions, unless otherwise noted) | 2020 | 2019 | 2018 | 2017 | 2016 | ||||||||||||||||||||||||
| Non-GAAP Data: | |||||||||||||||||||||||||||||
Economic net income(5): | |||||||||||||||||||||||||||||
| Management fees | $ | 697.9 | $ | 807.0 | $ | 905.0 | $ | 858.0 | $ | 659.9 | |||||||||||||||||||
| Performance fees | 7.8 | (0.1) | 9.8 | 26.5 | 2.6 | ||||||||||||||||||||||||
| Other revenues | 5.6 | 4.4 | 4.3 | 16.2 | 16.0 | ||||||||||||||||||||||||
| Total ENI revenue | $ | 711.3 | $ | 811.3 | $ | 919.1 | $ | 900.7 | $ | 678.5 | |||||||||||||||||||
| Pre-tax economic net income | $ | 187.1 | $ | 210.8 | $ | 262.5 | $ | 251.3 | $ | 190.7 | |||||||||||||||||||
| Economic net income | 143.6 | 160.8 | 199.8 | 180.9 | 145.1 | ||||||||||||||||||||||||
ENI operating margin(6) | 35 | % | 35 | % | 38 | % | 38 | % | 35 | % | |||||||||||||||||||
| ENI earnings per share, diluted | 1.75 | 1.76 | 1.86 | 1.62 | 1.21 | ||||||||||||||||||||||||
Other Operational Information(7): | |||||||||||||||||||||||||||||
Assets under management at period end (in billions) | $ | 156.7 | $ | 204.4 | $ | 206.3 | $ | 243.0 | $ | 240.4 | |||||||||||||||||||
Net client cash flows (in billions)(8) | (3.3) | (32.7) | (4.3) | — | 7.3 | ||||||||||||||||||||||||
Annualized revenue impact of net flows (in millions)(9) | (22.0) | (69.1) | 19.1 | 54.8 | 44.2 | ||||||||||||||||||||||||
| Years ended December 31, | |||||||||||||||||||||||||||||
| ($ in millions) | 2020 | 2019 | 2018 | 2017 | 2016 | ||||||||||||||||||||||||
| U.S. GAAP Balance Sheet Data: | |||||||||||||||||||||||||||||
Total assets(10) | $ | 1,379.2 | $ | 1,419.7 | $ | 1,553.7 | $ | 1,491.7 | $ | 1,294.3 | |||||||||||||||||||
| Total assets attributable to controlling interests | 1,298.9 | 1,280.8 | 1,467.6 | 1,386.7 | 1,283.0 | ||||||||||||||||||||||||
Total borrowings and debt(10) | 394.3 | 568.8 | 393.3 | 426.3 | 392.3 | ||||||||||||||||||||||||
| Total borrowings and debt attributable to controlling interests | 394.3 | 568.8 | 393.3 | 426.3 | 392.3 | ||||||||||||||||||||||||
Total liabilities(10) | 994.8 | 1,221.3 | 1,377.6 | 1,320.4 | 1,123.8 | ||||||||||||||||||||||||
Total liabilities attributable to controlling interests | 994.8 | 1,215.1 | 1,362.7 | 1,309.9 | 1,118.0 | ||||||||||||||||||||||||
Total Equity(10) | $ | 384.4 | $ | 198.4 | $ | 176.1 | $ | 171.3 | $ | 170.5 | |||||||||||||||||||
Redeemable non-controlling interests in consolidated Funds(2) | — | (83.9) | (41.9) | (44.0) | (5.5) | ||||||||||||||||||||||||
Non-controlling interests in consolidated Funds(2) | (80.3) | (48.8) | (29.3) | (50.6) | — | ||||||||||||||||||||||||
| Non-controlling interests | (1.7) | (1.3) | (1.6) | (1.3) | (1.0) | ||||||||||||||||||||||||
| Shareholders’ equity | $ | 302.4 | $ | 64.4 | $ | 103.3 | $ | 75.4 | $ | 164.0 | |||||||||||||||||||
(1)The U.S. GAAP Consolidated Statements of Operations Data above has been presented on a continuing operations basis. Please refer to “Management’s Discussion and Analysis of Financial Condition and Results of Operations” for further discussion of our results of operations, including discontinued operations, and a reconciliation to the results from continuing operations.
46
(2)Consolidated Statements of Operations data presented in accordance with U.S. GAAP include the results of consolidated Funds managed by our Affiliates where it has been determined these entities are controlled by us. There was no management fee elimination associated with Funds consolidation in 2016 through 2020. The net income from continuing operations presented as attributable to controlling interests exclude the income or loss directly attributable to third-party Fund investors, and represent the net amounts attributable to our shareholders. For the years ended December 31, 2016 through 2020, as a result of the purchase or deployment of seed capital investments, we consolidated certain Funds.
(3)The following table reconciles our net income attributable to controlling interests to our net income from continuing operations attributable to controlling interests and our pre-tax income from continuing operations attributable to controlling interests:
| Years ended December 31, | |||||||||||||||||||||||||||||
| ($ in millions) | 2020 | 2019 | 2018 | 2017 | 2016 | ||||||||||||||||||||||||
| Net income attributable to controlling interests | $ | 286.7 | $ | 223.9 | $ | 136.4 | $ | 4.2 | $ | 126.4 | |||||||||||||||||||
Exclude: Loss (profit) on disposal of discontinued operations attributable to controlling interests | — | — | (0.1) | 0.1 | (6.2) | ||||||||||||||||||||||||
Net income from continuing operations attributable to controlling interests | 286.7 | 223.9 | 136.3 | 4.3 | 120.2 | ||||||||||||||||||||||||
| Add: Income tax expense | 112.1 | 18.0 | 5.0 | 132.8 | 40.8 | ||||||||||||||||||||||||
Pre-tax income from continuing operations attributable to controlling interests | $ | 398.8 | $ | 241.9 | $ | 141.3 | $ | 137.1 | $ | 161.0 | |||||||||||||||||||
(4)U.S. GAAP operating margin equals operating income (loss) from continuing operations divided by total revenue. Excluding the effect of Funds consolidation, our U.S. GAAP operating margin would be 24% for the year ended December 31, 2020, 30% for the year ended December 31, 2019, 9% for the year ended December 31, 2018, 8% for the year ended December 31, 2017 and 23% for the year ended December 31, 2016.
(5)Economic net income, including a reconciliation to U.S. GAAP net income attributable to controlling interests, is discussed in “Management’s Discussion and Analysis of Financial Condition and Results of Operations—Non-GAAP Supplemental Performance Measure—Economic Net Income.” Pre-tax and post-tax ENI are presented after Affiliate key employee distributions. These measures are conceptually equivalent to net income before tax from continuing operations attributable to controlling interests and net income from continuing operations attributable to controlling interests, respectively.
(6)ENI operating margin is a non-GAAP efficiency measure, calculated based on ENI operating earnings divided by ENI revenue. For a more detailed discussion of the differences between U.S. GAAP net income and economic net income, see “Management’s Discussion and Analysis of Financial Condition and Results of Operations—Non-GAAP Supplemental Performance Measure—Economic Net Income and Segment Analysis.”
(7)On August 2, 2017, we entered into a non-binding term sheet to sell our stake in Heitman to Heitman’s management. Pursuant to this term sheet, we entered into a redemption agreement on November 17, 2017. Heitman stopped contributing to our financial results of operations as of November 30, 2017 and the transaction closed on January 5, 2018. We have broken the Heitman AUM and flows out of our AUM reporting as of July 1, 2017, in order to give the reader a better perspective of the ongoing business following the closing of this transaction. Unless specifically noted, flow information includes flows from Heitman for the first half of 2017, but excludes it thereafter, and AUM data at December 31, 2017 and thereafter excludes the Heitman AUM.
(8)Net flows and revenue impact of net flows for all periods above have been revised for the inclusion of reinvested income and distributions, and the exclusion of realizations. The impact of reinvested income and distributions was calculated using an average yield estimate for the year ended December 31, 2016.
47
(9)Annualized revenue impact of net flows excludes market appreciation or depreciation. Annualized revenue impact of net flows represents the difference between annualized management fees expected to be earned on new accounts and net assets contributed to existing accounts, less the annualized management fees lost on terminated accounts or net assets withdrawn from existing accounts, including equity-accounted Affiliate. The annualized management fees are calculated by multiplying the annual gross fee rate for the relevant account by the net assets gained in the account in the event of a positive flow, excluding any current or future market appreciation or depreciation, or the net assets lost in the account in the event of an outflow, excluding any current or future market appreciation or depreciation. For a further discussion of the uses and limitations of the annualized revenue impact of net flows, see “Management’s Discussion and Analysis of Financial Condition and Results of Operations—Overview—Assets Under Management.”
(10)Balance sheet data presented in accordance with U.S. GAAP for the years 2016, 2017, 2018, 2019 and 2020 include the results of Funds managed by our Affiliates where it has been determined these entities are controlled by our Company. Consolidated assets and liabilities of these entities that are attributable to third-party investors, or non-controlling interests, have the effect of increasing our consolidated assets and liabilities. The net assets and liabilities presented as attributable to controlling interests exclude the portions directly attributable to these third-party investors, and represent the net amounts attributable to our shareholders. Similarly, Shareholders’ equity represents our net assets after excluding net assets directly attributable to these third-party investors.
48
Item 7. Management’s Discussion and Analysis of Financial Condition and Results of Operations.
Unless we state otherwise or the context otherwise requires, references in this Annual Report on Form 10-K to “BrightSphere” or “BSIG” refer to BrightSphere Investment Group Inc., references to the “Company” refer to BSIG, and references to “we,” “our” and “us” refer to BSIG and its consolidated subsidiaries and equity-accounted Affiliate, excluding discontinued operations. References to the holding company or “Center” excluding the Affiliates refer to BrightSphere Inc., or BSUS, a Delaware corporation and indirect, wholly owned subsidiary of BSIG. Unless we state otherwise or the context otherwise requires, references in this Annual Report on Form 10-K to “Affiliates” or an “Affiliate” refer to the asset management firms in which we have an ownership interest. References in this Annual Report on Form 10-K to “OM plc” refer to Old Mutual plc, our former parent. None of the information in this Annual Report on Form 10-K constitutes either an offer or a solicitation to buy or sell any of our Affiliates’ products or services, nor is any such information a recommendation for any of our Affiliates’ products or services.
The following discussion of our financial condition and results of operations should be read in conjunction with our Consolidated Financial Statements and related notes which appear in this Annual Report on Form 10-K in Item 8, Financial Statements and Supplementary Data.
This discussion contains forward-looking statements that involve risks and uncertainties. See “Special Note Regarding Forward-Looking Statements” for more information. Our actual results could differ materially from those anticipated in these forward-looking statements as a result of various factors, including those discussed below and elsewhere in this Annual Report on Form 10-K, particularly under Item 1A, Risk Factors.
This Management’s Discussion and Analysis of Financial Condition and Results of Operations, or MD&A, is designed to provide a reader of our financial statements with a narrative from the perspective of our management on our financial condition, results of operations, liquidity and certain other factors that may affect our future results.
Our MD&A is presented in five sections:
•Overview provides a brief description of our Affiliates, a summary of The Economics of Our Business and an explanation of How We Measure Performance using a non-GAAP measure which we refer to as economic net income, or ENI. This section also provides a Summary Results of Operations and information regarding our Assets Under Management by Affiliate, strategy, client type and client location, and net flows by segment, client type and client location.
•U.S. GAAP Results of Operations for the years ended December 31, 2020, 2019 and 2018 includes an explanation of changes in our U.S. GAAP revenue, expense, and other items over the last three years as well as key U.S. GAAP operating metrics.
•Non-GAAP Supplemental Performance Measure—Economic Net Income and Segment Analysis includes an explanation of the key differences between U.S. GAAP net income and ENI, the key measure management uses to evaluate our performance. This section also provides a reconciliation between U.S. GAAP net income and ENI for the years ended December 31, 2020, 2019, and 2018, as well as a reconciliation of key ENI operating items including ENI revenue and ENI operating expenses. This section also provides key Non-GAAP operating metrics and a calculation of tax on economic net income. In addition, this section provides segment analysis for each of our business segments.
•Capital Resources and Liquidity discusses our key balance sheet data. This section discusses Cash Flows from the business; Working Capital and Long-Term Debt; Adjusted EBITDA; Future Capital Needs; and Commitments, Contingencies and Off-Balance Sheet Obligations. The discussion of Adjusted EBITDA includes an explanation of how we calculate Adjusted EBITDA and a reconciliation of U.S. GAAP net income attributable to controlling interests to Adjusted EBITDA.
49
•Critical Accounting Policies and Estimates provides a discussion of the key accounting policies and estimates that we believe are the most critical to an understanding of our results of operations and financial condition. These accounting policies and estimates require complex management judgment regarding matters that are highly uncertain at the time policies were applied and estimates were made.
Overview
We are a diversified, global asset management company headquartered in Boston, Massachusetts. We operate our business through three business segments:
•Quant & Solutions—comprised of versatile, often highly-tailored strategies that leverage data and technology in a computational, factor-based investment process across a range of asset classes and geographies, including Global, non-U.S., and emerging markets equities, as well as multi-asset and managed volatility products.
•Alternatives—comprised of illiquid and differentiated liquid investment strategies that include private equity, real estate and real assets, including forestry, as well as a growing suite of liquid alternative capabilities in areas such as long/short, market neutral and absolute return.
•Liquid Alpha—comprised of specialized investment strategies with a focus on alpha-generation across market cycles in long-only small-, mid-, and large-cap U.S. and non-U.S. equities, as well as fixed income.
Within our three segments, we have five affiliate firms to whom we refer in this Annual Report on Form 10-K as our Affiliates. Through our Affiliates, we offer a diverse range of actively-managed investment strategies and products to institutional investors around the globe. While our Affiliates maintain autonomy in the investment process and the day-to-day management of their businesses, our strategy is to work with them to accelerate the growth and profitability of their firms.
Under U.S. GAAP, our Affiliates may be consolidated into our operations or may be accounted for under the equity method of accounting. We may also be required to consolidate certain of our Affiliates’ sponsored investment entities, or Funds, due to the nature of our decision-making rights, our economic interests in these Funds or the rights of third party clients in those Funds.
Our Affiliates within each business segment and their principal strategies include:
Quant & Solutions
•Acadian Asset Management LLC (“Acadian”)(1)—a leading quantitatively-oriented manager of active global and international equity, and alternative strategies.
Alternatives
•Landmark Partners, LLC (“Landmark”)—a leading global secondary private equity, real estate and real asset investment firm.
•Campbell Global, LLC (“Campbell Global”)—a leading sustainable forestry and natural resource investment manager that seeks to deliver superior investment performance by focusing on unique acquisition opportunities, client objectives and disciplined management.
Liquid Alpha
•Thompson, Siegel & Walmsley LLC (“TSW”)(1)—a value-oriented investment manager focused on small- and mid-cap U.S. equity, international equity and fixed income strategies.
•Investment Counselors of Maryland, LLC (“ICM”)(2)—a value-driven domestic equity manager with product offerings focused on small- and mid-cap companies.
(1)Certain smaller Acadian strategies are included in Alternatives and certain TSW strategies are included in Quant & Solutions where the classification is more appropriate.
50
(2)Accounted for under the equity method of accounting.
Recent Developments
Divestiture of Barrow Hanley, Copper Rock and ICM
On July 24, 2020, we sold all of our equity interests in Copper Rock, a former Affiliate included in our Liquid Alpha segment, to Spouting Rock Asset Management LLC. The transaction resulted in a $7.2 million pre-tax gain which is reflected on our Consolidated Statement of Operations for the year ended December 31, 2020.
On November 17, 2020, we completed the sale of all of our equity interests in Barrow Hanley, a former Affiliate included in our Liquid Alpha segment, to Perpetual U.S. Holdings Company Inc. (“Perpetual”). The transaction resulted in a $231.2 million pre-tax gain which is reflected on our Consolidated Statement of Operations for the year ended December 31, 2020.
On February 6, 2021, we entered into a definitive agreement to sell all our interests in ICM, an Affiliate included in the Liquid Alpha segment. The transaction is expected to close during second quarter of 2021.
COVID-19 Impact
Beginning in the first quarter of 2020, the outbreak of COVID-19 had a significant impact on the global economy and the financial and securities markets, which will likely to continue for months to come. Because most of the revenue we earn is based on the market value of our assets under management, fluctuations in global markets impact our revenues and earnings. Our assets under management, excluding the impact of Barrow Hanley and Copper Rock divestitures, declined from $148.8 billion on December 31, 2019 to $119.8 billion on March 31, 2020, and have subsequently rebounded to $156.7 billion as of December 31, 2020.
The COVID-19 pandemic continues to impact the manner in which we operate. As of the date of this filing, the majority of our employees are working from home and our employees have significantly reduced business travel. Additionally, many third-party vendors on whom we rely for certain critical functions are also operating in remote environments. Given the continued uncertainty surrounding the COVID-19 pandemic, it is difficult to predict how long such remote working conditions and travel restrictions will last. We expect most operating costs to return to pre-COVID-19 levels when employees return to the office and resume business travel.
We believe we are operating well under these circumstances, benefiting from the flexible and highly mobile operating environment. However, market volatility, as well as changes in our operations and those of our key vendors, may result in increased client redemptions; inefficiencies, delays and decreased communication; and an increase in the number and significance of operational and trade errors. In addition, we do not know what, if any, longer-term impact the current operating circumstances (and/or the extension of them) will have on our business and results.The extent of the impact on our business operations, assets under management and financial results will depend on a number of factors and future developments, which are uncertain and cannot be predicted. See Item 1A, Risk Factors.
51
The Economics of Our Business
Our profitability is affected by a variety of factors including the level and composition of our average assets under
management, or AUM, fee rates charged on AUM and our expense structure. Our Affiliates earn management fees
based on assets under management. Approximately 70% of our management fees are calculated based on average
AUM (calculated on either a daily or monthly basis) with the remainder of our management fees calculated based on
period-end AUM or other measuring methods. Changes in the levels of our AUM are driven by our investment
performance and net client cash flows. Our Affiliates may also earn performance fees, or adjust management fees,
when certain accounts differ in relation to relevant benchmarks or exceed or fail to exceed required returns.
Approximately $17.5 billion, or 11% of our AUM in consolidated Affiliates, are in accounts with incentive fee or carried interest features in which we participate in the performance fee. The majority of these incentive fees are calculated based on value added over the relevant benchmarks on a rolling three-year basis. Carried interests are features of private equity funds, which are calculated based on long-term cumulative returns.
Our largest expense item is compensation and benefits paid to our and our Affiliates’ employees, which consists of
both fixed and variable components. Fixed compensation and benefits represents base salaries and wages, payroll
taxes and the costs of our employee benefit programs. Variable compensation, calculated as described below, may be awarded in cash, equity or profit interests.
The arrangements in place with our Affiliates result in the sharing of economics between BSUS and each Affiliate’s
key management personnel using a profit-sharing model, except for ICM, which uses a revenue share model as a
result of a legacy economic arrangement that has not been restructured. Profit sharing affects two elements within
our earnings: (i) the calculation of variable compensation and (ii) the level of each Affiliate’s equity or profit
interests distribution to its employees. Variable compensation is the portion of earnings that is contractually
allocated to Affiliate employees as a bonus pool, typically representing a fixed percentage of earnings before
variable compensation, which is measured as revenues less fixed compensation and benefits and other operating and
administrative expenses. Profits after variable compensation are shared between us and Affiliate key employee
equity holders according to our respective equity or profit interests ownership. The sharing of profits in this manner
ensures that the economic interests of Affiliate key employees and those of BSUS are aligned, both in terms of
generating strong annual earnings as well as investing those earnings back into the business in order to generate
growth over the long term. We view profit sharing as an attractive operating model, as it allows us to share in the
benefits of operating leverage as the business grows, and ensures all equity and profit interests holders are
incentivized to achieve that growth.
Equity or profit interests owned by Affiliate key employees are either awarded as part of their variable compensation
arrangements, or alternatively, may have originally resulted from BSUS acquiring less than 100% of the Affiliate.
Over time, Affiliate key employee-owned equity or profit interests are recycled from one generation of employee owners to the next, either by the next generation purchasing equity or profit interests directly from retiring
principals, or by Affiliate key employees forgoing cash bonuses in exchange for the equivalent value in Affiliate
equity or profit interests. The recycling of equity or profit interests is often facilitated by BSUS; see "—U.S. GAAP
Results of Operations—U.S. GAAP Expenses—Compensation and Benefits Expense" for a further discussion.
52
The diagram below provides an illustrative example of how the profit-sharing model would work initially and over time if the affiliate grew its revenue and profits. In this example, the employees’ variable compensation has been contractually set at 30% of earnings before variable compensation, and the earnings after variable compensation are split 60% to BSUS and 40% to the affiliate key employees. Revenue initially equals $200 and operating expenses equal $100. Therefore, earnings before variable compensation equal $100 and the contractual bonus pool (variable compensation) equals $30. The owners split the $70 profit after variable compensation, with BSUS receiving $42, or 60%, and the Affiliate key employees receiving $28, or 40%. Including both the contractual employee bonus pool and the key employees’ share of profit, the employees receive $58, or 58% of profit before variable compensation. Employee equity is valued at a fixed multiple of this $28 share of profits, so employees have transparency into both their earning potential in any year from the bonus pool and share of profits, as well as the current value of their equity and the long-term potential to realize value from its growth. In this structure, key employees who are managing their business have incentives to manage for profit, but also to manage the business prudently, in the interest of their clients, and invest for growth, since they will benefit over the long term as both employees and equity holders. In this way, each Affiliate is aligned with BSUS and the public shareholders to generate profits and growth over time.
Illustrative Structure: Profit-Sharing Economics
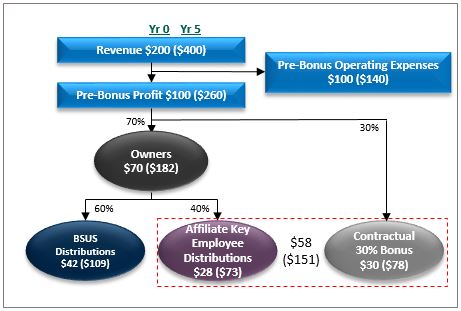
Figures in parenthesis indicate impact of model after five years if revenue and pre-bonus operating expenses grew 15% and 7% annually, respectively.
The alignment of interests is even clearer if we consider the impact of growth on the profit-sharing model. The numbers in parenthesis in the diagram represent the financial results of the illustrative business in five years, assuming revenue has grown at 15% annually and operating expenses have grown at 7% annually. With revenue of $400 and operating expenses of $140, profit before variable compensation has now increased to $260, representing an annual growth rate of 21%. The 30% contractual bonus pool of $78 has also grown 21% annually, as has BSUS’s 60% share of profits, which equals $109, and the affiliate’s 40% share of profits, which equals $73. From this example, it is clear that as profit in the affiliate’s business grows and the operating margin increases, both of the stakeholders—BSUS and the key employees—are benefiting in a proportionate way. This means that both parties are aligned to invest in the business by hiring new investment professionals, developing new products, or establishing new distribution channels. We believe this investment in turn benefits clients and should generate growth over time.
53
The alternative structure common in the industry is the revenue share model. In the revenue share model, the affiliate’s revenue is typically divided into two fixed percentages—the operating allocation and the owners’ allocation. All operating expenses of the business, including employee bonuses, must be covered by the operating allocation. The owners’ allocation can be owned entirely by the affiliate owner or ownership can be divided between the affiliate owner and the affiliate’s key employees. In either case, the affiliate owner effectively owns a fixed percentage of the affiliates’ revenue, which typically does not change as the business grows. While the initial economics of the profit share model and the revenue share model can be similar, over time the economic split and incentive structure can be quite different, leading to less alignment between the affiliate and the affiliate owner. The affiliate owner’s share of profits grows in line with revenue, while any operating leverage in the business is retained entirely by the affiliate’s employees. Likewise, new costs and investments to drive growth are borne entirely by the affiliate employees, while the revenue generated by these investments is shared with the affiliate owner. While the revenue share structure has been successfully implemented by a number of our peers who have a more autonomous strategy, for BSIG, which emphasizes collaborative engagement and joint investment with our Affiliates, the alignment of the profit-sharing model is mutually reinforcing with our overall growth strategy and operating philosophy.
How We Measure Performance
We manage our business based on three business segments, reflecting how our management assesses the performance of our business.
In measuring and monitoring the key components of our earnings, our management uses a non-GAAP financial measure, ENI, to evaluate the financial performance of, and to make operational decisions for, our business. We also use ENI to make resource allocation decisions, determine appropriate levels of investment or dividend payout, manage balance sheet leverage, determine Affiliate variable compensation and equity distributions, and incentivize management. It is an important measure in evaluating our financial performance because we believe it most accurately represents our operating performance and cash generation capability.
ENI differs from net income determined in accordance with U.S. GAAP as a result of both the reclassification of certain income statement items and the exclusion of certain non-cash or non-recurring income statement items. In particular, ENI excludes non-cash charges representing the changes in the value of Affiliate equity and profit interests held by Affiliate key employees, the impact of a one-time compensation arrangement entered into that includes advances against future compensation payments, the results of discontinued operations which are no longer part of our business, restructuring costs, capital transaction costs, seed capital and co-investment gains, losses and related financing costs, and that portion of consolidated Funds which are not attributable to our stockholders. ENI is also adjusted for amortization of acquisition-related contingent consideration and pre-acquisition retained equity with service components.
ENI revenue is primarily comprised of the fee revenues paid to us by our clients for our advisory services and earnings from our equity-accounted Affiliate. Revenue included within ENI differs from U.S. GAAP revenue in that it excludes amounts from consolidated Funds which are not attributable to our stockholders, it excludes reimbursement of certain costs we paid on behalf of our customers and it includes our share of earnings from our equity-accounted Affiliate.
ENI expenses are calculated to reflect all usual expenses from ongoing continuing operations attributable to our stockholders. Expenses included within ENI differ from U.S. GAAP expenses in that they exclude amounts from consolidated Funds which are not attributable to our stockholders, revaluations of Affiliate key employee owned equity and profit interests, amortization and impairment of acquired intangibles and other acquisition-related items, the impact of a one-time compensation arrangement entered into that includes advances against future compensation payments, costs we paid on behalf of our customers which were subsequently reimbursed and certain other non-cash expenses.
54
“Non-controlling interests” is a concept under U.S. GAAP that identifies net components of revenues and expenses that are not attributable to our stockholders. For example, the portion of the net income (loss) of any consolidated Funds that is attributable to the outside investors or clients of the consolidated Funds is included in “Non-controlling interests” in our Consolidated Financial Statements. Conversely, “controlling interests” is the portion of revenue or expense that is attributable to our stockholders.
For a more detailed discussion of the differences between U.S. GAAP net income and economic net income, see "—Non-GAAP Supplemental Performance Measure — Economic Net Income and Segment Analysis."
Summary Results of Operations
The following table summarizes our results of operations for the years ended December 31, 2020, 2019, and 2018:
| Years ended December 31, | Increase (Decrease) | ||||||||||||||||||||||||||||
| ($ in millions, unless otherwise noted) | 2020 | 2019 | 2018 | 2020 vs. 2019 | 2019 vs. 2018 | ||||||||||||||||||||||||
| U.S. GAAP Basis | |||||||||||||||||||||||||||||
| Revenue | $ | 718.5 | $ | 819.5 | $ | 928.2 | $ | (101.0) | $ | (108.7) | |||||||||||||||||||
Pre-tax income from continuing operations attributable to controlling interests | 398.8 | 241.9 | 141.3 | 156.9 | 100.6 | ||||||||||||||||||||||||
Net income from continuing operations attributable to controlling interests | 286.7 | 223.9 | 136.3 | 62.8 | 87.6 | ||||||||||||||||||||||||
| Net income attributable to controlling interests | 286.7 | 223.9 | 136.4 | 62.8 | 87.5 | ||||||||||||||||||||||||
U.S. GAAP operating margin(1) | 25 | % | 31 | % | 9 | % | (557) bps | 2152 bps | |||||||||||||||||||||
| Earnings per share, basic ($) | $ | 3.53 | $ | 2.45 | $ | 1.27 | $ | 1.08 | $ | 1.18 | |||||||||||||||||||
| Earnings per share, diluted ($) | 3.49 | 2.45 | 1.26 | $ | 1.04 | $ | 1.19 | ||||||||||||||||||||||
| Basic shares outstanding (in millions) | 81.3 | 91.2 | 107.4 | (9.9) | (16.2) | ||||||||||||||||||||||||
| Diluted shares outstanding (in millions) | 82.0 | 91.3 | 107.6 | (9.3) | (16.3) | ||||||||||||||||||||||||
Economic Net Income Basis(2)(3) | |||||||||||||||||||||||||||||
| (Non-GAAP measure used by management) | |||||||||||||||||||||||||||||
ENI revenue(4) | $ | 711.3 | $ | 811.3 | $ | 919.1 | $ | (100.0) | $ | (107.8) | |||||||||||||||||||
Pre-tax economic net income(5) | 187.1 | 210.8 | 262.5 | (23.7) | (51.7) | ||||||||||||||||||||||||
ENI operating margin(6) | 35 | % | 35 | % | 38 | % | 6 bps | (326) bps | |||||||||||||||||||||
| Adjusted EBITDA | $ | 232.4 | $ | 249.0 | $ | 290.6 | $ | (16.6) | $ | (41.6) | |||||||||||||||||||
Economic net income(7) | 143.6 | 160.8 | 199.8 | (17.2) | (39.0) | ||||||||||||||||||||||||
ENI diluted EPS ($) | $ | 1.75 | $ | 1.76 | $ | 1.86 | $ | (0.01) | $ | (0.10) | |||||||||||||||||||
| Other Operational Information | |||||||||||||||||||||||||||||
Assets under management (AUM) at year end (in billions) | $ | 156.7 | $ | 204.4 | $ | 206.3 | $ | (47.7) | $ | (1.9) | |||||||||||||||||||
| Net client cash flows (in billions) | (3.3) | (32.7) | (4.3) | 29.4 | (28.4) | ||||||||||||||||||||||||
Annualized revenue impact of net flows(8) | (22.0) | (69.1) | 19.1 | 47.1 | (88.2) | ||||||||||||||||||||||||
(1)U.S. GAAP operating margin equals operating income from continuing operations divided by total revenue.
(2)Economic net income is a non-GAAP measure we use to evaluate the performance of our business. For a reconciliation to U.S. GAAP financial information and a further discussion of economic net income refer to “—Non-GAAP Supplemental Performance Measures—Economic Net Income and Segment Analysis.”
55
(3)Excludes costs relating to the impact of a one-time compensation arrangement entered into that includes advances against future compensation payments of $17.0 million and restructuring costs which include costs associated with the transfer of an insurance policy from our former Parent of $1.6 million, restructuring at the Center and Affiliates of $9.4 million, and the gain on sale of Affiliates of $241.3 million for the year ended December 31, 2020. Excludes restructuring costs which include costs associated with the redomicile to the U.S. of $1.6 million, costs associated with the transfer of an insurance policy from our former Parent of $0.9 million and restructuring costs at the Center and Affiliates of $6.7 million for the year ended December 31, 2019. Excludes restructuring charges associated with the 2018 CEO transition of $4.8 million for the year ended December 31, 2018.
(4)ENI revenue is the ENI measure which corresponds to U.S. GAAP revenue.
(5)Pre-tax economic net income is the ENI measure which corresponds to U.S. GAAP pre-tax income from continuing operations attributable to controlling interests.
(6)ENI operating margin is a non-GAAP efficiency measure, calculated based on ENI operating earnings divided by ENI revenue. ENI operating earnings is calculated as ENI revenue, less ENI operating expense, less ENI variable compensation. The ENI operating margin is most comparable to our U.S. GAAP operating margin (excluding the effect of consolidated Funds) of 24% for the year ended December 31, 2020, 30% for the year ended December 31, 2019 and 9% for the year ended December 31, 2018.
(7)Economic net income is the ENI measure which corresponds to U.S. GAAP net income from continuing operations attributable to controlling interests.
(8)Annualized revenue impact of net flows represents the difference between annualized management fees expected to be earned on new accounts and net assets contributed to existing accounts, less the annualized management fees lost on terminated accounts or net assets withdrawn from existing accounts, plus revenue impact from reinvested income and distributions, including equity-accounted Affiliate. The annualized management fees are calculated by multiplying the annual gross fee rate for the relevant account by the net assets gained in the account in the event of a positive flow, excluding any current or future market appreciation or depreciation, or the net assets lost in the account in the event of an outflow, excluding any current or future market appreciation or depreciation. In addition, reinvested income and distributions for each segment is multiplied by average fee rate for the respective segment to compute the revenue impact. For a further discussion of the uses and limitations of the annualized revenue impact of net flows, see “Assets Under Management” herein.
Assets Under Management
Our total assets under management as of December 31, 2020 were $156.7 billion. The following table presents our assets under management by Affiliate as of each of the dates indicated:
| ($ in billions) | December 31, 2020 | December 31, 2019 | December 31, 2018 | ||||||||||||||
| Acadian Asset Management | $ | 108.1 | $ | 102.2 | $ | 86.2 | |||||||||||
| Barrow, Hanley, Mewhinney & Strauss | — | 51.7 | 72.0 | ||||||||||||||
| Campbell Global | 4.7 | 4.8 | 4.6 | ||||||||||||||
| Copper Rock Capital Partners | — | 3.9 | 4.0 | ||||||||||||||
Investment Counselors of Maryland(1) | 3.2 | 2.4 | 1.8 | ||||||||||||||
| Landmark Partners | 18.4 | 18.3 | 17.8 | ||||||||||||||
| Thompson, Siegel & Walmsley | 22.3 | 21.1 | 19.9 | ||||||||||||||
Total assets under management | $ | 156.7 | $ | 204.4 | $ | 206.3 | |||||||||||
(1)On February 6, 2021, we entered into a definitive agreement to sell all our interests in ICM. The transaction is expected to close during second quarter of 2021.
56
Our strategies include:
i.U.S. equity, which includes small cap through large cap securities and primarily value or blended investment styles;
ii.Global / non-U.S. equity, which includes global and international equities including emerging markets;
iii.Fixed income, which includes government bonds, corporate bonds and other fixed income investments in the United States; and
iv.Alternatives, which consist of illiquid and differentiated liquid investment strategies that include private equity, real estate and real assets, including forestry, as well as a growing suite of liquid alternative capabilities in areas such as long/short, market neutral and absolute return.
The following table presents our assets under management by strategy as of each of the dates indicated:
| ($ in billions) | December 31, 2020 | December 31, 2019 | December 31, 2018 | ||||||||||||||
| U.S. equity, small/smid cap value | $ | 4.4 | $ | 6.0 | $ | 5.1 | |||||||||||
| U.S. equity, mid cap value | 4.1 | 5.3 | 9.6 | ||||||||||||||
| U.S. equity, large cap value | 0.2 | 30.2 | 45.2 | ||||||||||||||
| U.S. equity, core/blend | 2.9 | 1.9 | 2.7 | ||||||||||||||
| Total U.S. equity | 11.6 | 43.4 | 62.6 | ||||||||||||||
| Global equity | 32.1 | 40.3 | 34.4 | ||||||||||||||
| International equity | 59.9 | 54.9 | 46.4 | ||||||||||||||
| Emerging markets equity | 27.0 | 28.7 | 26.0 | ||||||||||||||
| Total global/non-U.S. equity | 119.0 | 123.9 | 106.8 | ||||||||||||||
| Fixed income | 1.9 | 13.3 | 13.1 | ||||||||||||||
| Alternatives | 24.2 | 23.8 | 23.8 | ||||||||||||||
| Total assets under management | $ | 156.7 | $ | 204.4 | $ | 206.3 | |||||||||||
The following table shows assets under management by client type as of each of the dates indicated:
| ($ in billions) | December 31, 2020 | December 31, 2019 | December 31, 2018 | ||||||||||||||||||||||||||||||||
| AUM | % of total | AUM | % of total | AUM | % of total | ||||||||||||||||||||||||||||||
| Sub-advisory | $ | 23.7 | 15.1 | % | $ | 40.5 | 19.8 | % | $ | 61.3 | 29.7 | % | |||||||||||||||||||||||
| Corporate / Union | 21.7 | 13.9 | % | 38.6 | 18.9 | % | 36.4 | 17.6 | % | ||||||||||||||||||||||||||
| Public / Government | 67.4 | 43.0 | % | 75.2 | 36.8 | % | 63.9 | 31.0 | % | ||||||||||||||||||||||||||
| Endowment / Foundation | 3.0 | 1.9 | % | 5.3 | 2.6 | % | 4.5 | 2.2 | % | ||||||||||||||||||||||||||
| OM plc Group | 0.8 | 0.5 | % | 2.1 | 1.0 | % | 2.1 | 1.0 | % | ||||||||||||||||||||||||||
| Commingled Trust/UCITS | 30.3 | 19.3 | % | 30.8 | 15.1 | % | 28.2 | 13.7 | % | ||||||||||||||||||||||||||
| Mutual Fund | 2.8 | 1.8 | % | 2.2 | 1.1 | % | 2.0 | 1.0 | % | ||||||||||||||||||||||||||
| Other | 7.0 | 4.5 | % | 9.7 | 4.7 | % | 7.9 | 3.8 | % | ||||||||||||||||||||||||||
| Total assets under management | $ | 156.7 | $ | 204.4 | $ | 206.3 | |||||||||||||||||||||||||||||
57
The following table shows assets under management by client location as of each of the dates indicated:
| ($ in billions) | December 31, 2020 | December 31, 2019 | December 31, 2018 | ||||||||||||||||||||||||||||||||
| AUM | % of total | AUM | % of total | AUM | % of total | ||||||||||||||||||||||||||||||
| U.S. | $ | 114.1 | 72.8 | % | $ | 148.4 | 72.6 | % | $ | 156.8 | 76.0 | % | |||||||||||||||||||||||
| Europe | 17.0 | 10.9 | % | 20.1 | 9.8 | % | 17.3 | 8.4 | % | ||||||||||||||||||||||||||
| Asia | 7.4 | 4.7 | % | 12.4 | 6.1 | % | 10.4 | 5.0 | % | ||||||||||||||||||||||||||
| Australia | 8.1 | 5.2 | % | 9.4 | 4.6 | % | 9.2 | 4.5 | % | ||||||||||||||||||||||||||
| Other | 10.1 | 6.4 | % | 13.9 | 6.9 | % | 12.6 | 6.1 | % | ||||||||||||||||||||||||||
| Total assets under management | $ | 156.7 | $ | 204.4 | $ | 206.3 | |||||||||||||||||||||||||||||
AUM flows and the annualized revenue impact of net flows
Reinvested income and distributions represent investment yield that is reinvested back into the portfolios as opposed to distributed as cash. Realizations include distributions related to the sale of alternative assets, which represent a return on investment.
In the following table, we present our asset flows and market appreciation (depreciation) by segment. We also present a key metric used to better understand our asset flows, the annualized revenue impact of net client cash flows. Annualized revenue impact of net flows represents annualized management fees expected to be earned on new accounts and net assets contributed to existing accounts (inflows), less the annualized management fees lost on terminated accounts or net assets withdrawn from existing accounts (outflows), plus revenue impact from reinvested income and distributions. Annualized management fee for client flow is calculated by multiplying the annual gross fee rate for the relevant account with the inflow or the outflow, including equity-accounted Affiliate. In addition, reinvested income and distributions for each segment is multiplied by average fee rate for the respective segment to compute the revenue impact.
The annualized revenue impact of net flows metric is designed to provide investors with a better indication of the potential financial impact of net client cash flows, however it has certain limitations. For instance, it does not include assumptions for the next twelve months' market appreciation or depreciation and investment performance associated with the assets gained or lost. Nor does it account for factors such as future client terminations or additional contributions or withdrawals over the next twelve months. Additionally, the basis points reported are fee rates based on the asset levels at the time of the transactions and do not consider the fact that client fee rates may change over the next twelve months.
The following table summarizes our asset flows and market appreciation (depreciation) by segment for each of the periods indicated:
58
| ($ in billions, unless otherwise noted) | Years ended December 31, | ||||||||||||||||
| 2020 | 2019 | 2018 | |||||||||||||||
| Quant & Solutions | |||||||||||||||||
| Beginning balance | $ | 101.9 | $ | 85.2 | $ | 96.0 | |||||||||||
| Gross inflows | 12.9 | 12.9 | 14.8 | ||||||||||||||
| Gross outflows | (17.5) | (13.0) | (12.4) | ||||||||||||||
| Reinvested income and distributions | 2.8 | 2.9 | 2.6 | ||||||||||||||
| Net flows | (1.8) | 2.8 | 5.0 | ||||||||||||||
| Market appreciation (depreciation) | 7.3 | 13.9 | (15.8) | ||||||||||||||
| Ending balance | $ | 107.4 | $ | 101.9 | $ | 85.2 | |||||||||||
Average AUM(1) | $ | 94.9 | $ | 95.3 | $ | 95.8 | |||||||||||
| Alternatives | |||||||||||||||||
| Beginning balance | $ | 23.8 | $ | 23.8 | $ | 22.1 | |||||||||||
| Gross inflows | 2.3 | 2.0 | 6.1 | ||||||||||||||
| Gross outflows | (0.4) | (0.8) | (2.3) | ||||||||||||||
| Net flows | 1.9 | 1.2 | 3.8 | ||||||||||||||
| Market appreciation (depreciation) | (0.4) | 0.1 | — | ||||||||||||||
Realizations and Other(2) | (1.1) | (1.3) | (2.1) | ||||||||||||||
| Ending balance | $ | 24.2 | $ | 23.8 | $ | 23.8 | |||||||||||
Average AUM(1) | $ | 24.2 | $ | 23.6 | $ | 23.1 | |||||||||||
Liquid Alpha(3) | |||||||||||||||||
| Beginning balance | $ | 78.7 | $ | 97.3 | $ | 124.9 | |||||||||||
| Sale of Affiliates | (50.3) | — | — | ||||||||||||||
| Gross inflows | 9.4 | 5.8 | 6.7 | ||||||||||||||
| Gross outflows | (14.3) | (45.0) | (22.9) | ||||||||||||||
| Reinvested income and distributions | 1.5 | 2.5 | 3.1 | ||||||||||||||
| Net flows | (3.4) | (36.7) | (13.1) | ||||||||||||||
| Market appreciation (depreciation) | 0.1 | 18.1 | (14.5) | ||||||||||||||
| Ending balance | $ | 25.1 | $ | 78.7 | $ | 97.3 | |||||||||||
| Average AUM | $ | 60.6 | $ | 97.4 | $ | 116.0 | |||||||||||
| Average AUM of consolidated Affiliates | $ | 58.3 | $ | 95.2 | $ | 113.9 | |||||||||||
| Total | |||||||||||||||||
| Beginning balance | $ | 204.4 | $ | 206.3 | $ | 243.0 | |||||||||||
| Sale of Affiliates | (50.3) | — | — | ||||||||||||||
| Gross inflows | 24.6 | 20.7 | 27.6 | ||||||||||||||
| Gross outflows | (32.2) | (58.8) | (37.6) | ||||||||||||||
| Reinvested income and distributions | 4.3 | 5.4 | 5.7 | ||||||||||||||
| Net flows | (3.3) | (32.7) | (4.3) | ||||||||||||||
| Market appreciation (depreciation) | 7.0 | 32.1 | (30.3) | ||||||||||||||
Realizations and Other(2) | (1.1) | (1.3) | (2.1) | ||||||||||||||
| Ending balance | $ | 156.7 | $ | 204.4 | $ | 206.3 | |||||||||||
| Average AUM | $ | 179.7 | $ | 216.3 | $ | 234.9 | |||||||||||
| Average AUM of consolidated Affiliates | $ | 177.4 | $ | 214.1 | $ | 232.8 | |||||||||||
| Annualized basis points: inflows | 36.4 | 35.6 | 47.8 | ||||||||||||||
| Annualized basis points: outflows | 40.0 | 27.4 | 35.0 | ||||||||||||||
| Annualized revenue impact of net flows (in millions) | $ | (22.0) | $ | (69.1) | $ | 19.1 | |||||||||||
(1)Average AUM equals average AUM of consolidated Affiliates.
(2)Realizations include distributions related to the sale of alternative assets, and represent a return on investments. Other activity primarily relates to the decline in billable AUM as a legacy alternative fund transitioned from billing base on committed AUM to net asset value.
(3)The following table summarizes our asset flows and market appreciation (depreciation) for the Liquid Alpha segment excluding Barrow Hanley and Copper Rock for the periods indicated:
59
| ($ in billions) | Years ended December 31, | ||||||||||||||||
| 2020 | 2019 | 2018 | |||||||||||||||
| Liquid Alpha | |||||||||||||||||
| Beginning balance | $ | 23.1 | $ | 21.3 | $ | 26.8 | |||||||||||
| Net flows | 1.0 | (0.2) | 0.8 | ||||||||||||||
| Market appreciation depreciation | 1.0 | 2.0 | (6.3) | ||||||||||||||
| Ending balance | $ | 25.1 | $ | 23.1 | $ | 21.3 | |||||||||||
| Average AUM | $ | 20.6 | $ | 22.7 | $ | 25.3 | |||||||||||
| Average AUM of consolidated Affiliates | $ | 18.3 | $ | 20.5 | $ | 23.2 | |||||||||||
(4)The following table summarizes our total asset flows and market appreciation (depreciation) excluding Barrow Hanley and Copper Rock:
| ($ in billions) | Years ended December 31, | ||||||||||||||||
| 2020 | 2019 | 2018 | |||||||||||||||
| Total | |||||||||||||||||
| Beginning balance | $ | 148.8 | $ | 130.3 | $ | 144.9 | |||||||||||
| Net flows | 1.1 | 3.8 | 9.6 | ||||||||||||||
| Market appreciation depreciation | 6.8 | 14.7 | (24.2) | ||||||||||||||
| Realizations and other | — | — | — | ||||||||||||||
| Ending balance | $ | 156.7 | $ | 148.8 | $ | 130.3 | |||||||||||
| Average AUM of consolidated Affiliates | $ | 137.4 | $ | 139.4 | $ | 142.1 | |||||||||||
We also analyze our asset flows by client type and client location. Our client types include:
i.Sub-advisory, which includes assets managed for underlying mutual fund and variable insurance products which are sponsored by insurance companies and mutual fund platforms, where the end client is typically retail;
ii.Institutional, which includes assets managed for public / government pension funds, including U.S. state and local government funds and non-U.S. sovereign wealth, local government and national pension funds; also includes corporate and union-sponsored pension plans; and
iii.Retail / other, which includes assets managed for mutual funds sponsored by our Affiliates, defined contribution plans and accounts managed for high net worth clients.
60
The following table summarizes our asset flows by client type for each of the periods indicated:
| ($ in billions) | Years ended December 31, | ||||||||||||||||
| 2020 | 2019 | 2018 | |||||||||||||||
| Sub-advisory | |||||||||||||||||
| Beginning balance | $ | 40.5 | $ | 61.3 | $ | 80.1 | |||||||||||
| Sale of Affiliates | (16.8) | — | — | ||||||||||||||
| Gross inflows | 6.3 | 4.5 | 5.8 | ||||||||||||||
| Gross outflows | (7.1) | (38.1) | (17.1) | ||||||||||||||
Reinvested income and distributions(1) | 0.8 | 1.6 | 1.9 | ||||||||||||||
| Net flows | — | (32.0) | (9.4) | ||||||||||||||
| Market appreciation (depreciation) | — | 11.2 | (9.4) | ||||||||||||||
Realizations and other(2) | — | — | — | ||||||||||||||
| Ending balance | $ | 23.7 | $ | 40.5 | $ | 61.3 | |||||||||||
| Institutional | |||||||||||||||||
| Beginning balance | $ | 152.0 | $ | 135.1 | $ | 151.9 | |||||||||||
| Sale of Affiliates | (30.5) | — | — | ||||||||||||||
| Gross inflows | 15.9 | 14.2 | 20.1 | ||||||||||||||
| Gross outflows | (23.0) | (18.9) | (18.7) | ||||||||||||||
Reinvested income and distributions(1) | 3.2 | 3.5 | 3.5 | ||||||||||||||
| Net flows | (3.9) | (1.2) | 4.9 | ||||||||||||||
| Market appreciation (depreciation) | 6.7 | 19.4 | (19.6) | ||||||||||||||
Realizations and other(2) | (1.1) | (1.3) | (2.1) | ||||||||||||||
| Ending balance | $ | 123.2 | $ | 152.0 | $ | 135.1 | |||||||||||
| Retail / Other | |||||||||||||||||
| Beginning balance | $ | 11.9 | $ | 9.9 | $ | 11.0 | |||||||||||
| Sale of Affiliates | (3.0) | — | — | ||||||||||||||
| Gross inflows | 2.4 | 2.0 | 1.7 | ||||||||||||||
| Gross outflows | (2.1) | (1.8) | (1.8) | ||||||||||||||
Reinvested income and distributions(1) | 0.3 | 0.3 | 0.3 | ||||||||||||||
| Net flows | 0.6 | 0.5 | 0.2 | ||||||||||||||
| Market appreciation (depreciation) | 0.3 | 1.5 | (1.3) | ||||||||||||||
Realizations and other(2) | — | — | — | ||||||||||||||
| Ending balance | $ | 9.8 | $ | 11.9 | $ | 9.9 | |||||||||||
| Total | |||||||||||||||||
| Beginning balance | $ | 204.4 | $ | 206.3 | $ | 243.0 | |||||||||||
| Sale of Affiliates | (50.3) | — | — | ||||||||||||||
| Gross inflows | 24.6 | 20.7 | 27.6 | ||||||||||||||
| Gross outflows | (32.2) | (58.8) | (37.6) | ||||||||||||||
Reinvested income and distributions(1) | 4.3 | 5.4 | 5.7 | ||||||||||||||
| Net flows | (3.3) | (32.7) | (4.3) | ||||||||||||||
| Market appreciation (depreciation) | 7.0 | 32.1 | (30.3) | ||||||||||||||
Realizations and other(2) | (1.1) | (1.3) | (2.1) | ||||||||||||||
| Ending balance | $ | 156.7 | $ | 204.4 | $ | 206.3 | |||||||||||
(1)Reinvested income and distributions is allocated based on consolidated total distribution rate multiplied by the beginning of period AUM of each client type.
(2)Realizations include distributions related to the sale of alternative assets, and represent a return on investments. Other activity primarily relates to the decline in billable AUM as a legacy alternative fund transitioned from billing base on committed AUM to net asset value.
61
It is a strategic objective to increase our percentage of assets under management sourced from non-U.S. clients. Our categorization by client location includes:
i.U.S.-based clients, where the contracting client is based in the United States, and
ii.Non-U.S.-based clients, where the contracting client is based outside the United States.
The following table summarizes asset flows by client location for each of the periods indicated:
| ($ in billions) | Years ended December 31, | ||||||||||||||||
| 2020 | 2019 | 2018 | |||||||||||||||
| U.S. | |||||||||||||||||
| Beginning balance | $ | 148.4 | $ | 156.8 | $ | 190.1 | |||||||||||
| Sale of Affiliates | (39.9) | — | — | ||||||||||||||
| Gross inflows | 18.3 | 13.5 | 18.8 | ||||||||||||||
| Gross outflows | (21.2) | (49.5) | (31.0) | ||||||||||||||
Reinvested income and distributions(1) | 3.1 | 4.1 | 4.5 | ||||||||||||||
| Net flows | 0.2 | (31.9) | (7.7) | ||||||||||||||
| Market appreciation (depreciation) | 6.4 | 24.6 | (23.8) | ||||||||||||||
Realizations and other(2) | (1.0) | (1.1) | (1.8) | ||||||||||||||
| Ending balance | $ | 114.1 | $ | 148.4 | $ | 156.8 | |||||||||||
| Non-U.S. | |||||||||||||||||
| Beginning balance | $ | 56.0 | $ | 49.5 | $ | 52.9 | |||||||||||
| Sale of Affiliates | (10.4) | — | — | ||||||||||||||
| Gross inflows | 6.3 | 7.2 | 8.8 | ||||||||||||||
| Gross outflows | (11.0) | (9.3) | (6.6) | ||||||||||||||
Reinvested income and distributions(1) | 1.2 | 1.3 | 1.2 | ||||||||||||||
| Net flows | (3.5) | (0.8) | 3.4 | ||||||||||||||
| Market appreciation (depreciation) | 0.6 | 7.5 | (6.5) | ||||||||||||||
Realizations and other(2) | (0.1) | (0.2) | (0.3) | ||||||||||||||
| Ending balance | $ | 42.6 | $ | 56.0 | $ | 49.5 | |||||||||||
| Total | |||||||||||||||||
| Beginning balance | $ | 204.4 | $ | 206.3 | $ | 243.0 | |||||||||||
| Sale of Affiliates | (50.3) | — | — | ||||||||||||||
| Gross inflows | 24.6 | 20.7 | 27.6 | ||||||||||||||
| Gross outflows | (32.2) | (58.8) | (37.6) | ||||||||||||||
Reinvested income and distributions(1) | 4.3 | 5.4 | 5.7 | ||||||||||||||
| Net flows | (3.3) | (32.7) | (4.3) | ||||||||||||||
| Market appreciation (depreciation) | 7.0 | 32.1 | (30.3) | ||||||||||||||
Realizations and other(2) | (1.1) | (1.3) | (2.1) | ||||||||||||||
| Ending balance | $ | 156.7 | $ | 204.4 | $ | 206.3 | |||||||||||
(1)Reinvested income and distributions is allocated based on consolidated total distribution rate multiplied by the beginning of period AUM of each client location.
(2)Realizations include distributions related to the sale of alternative assets, and represent a return on investments. Other activity primarily relates to the decline in billable AUM as a legacy alternative fund transitioned from billing base on committed AUM to net asset value.
62
At December 31, 2020, our total assets under management were $156.7 billion, a decrease of $(47.7) billion or (23.3)%, compared to $204.4 billion at December 31, 2019. The assets under management at December 31, 2019 represented a decrease of $(1.9) billion or (0.9)% compared to $206.3 billion at December 31, 2018. The change in assets under management during the year ended December 31, 2020 reflects the sale of Barrow Hanley and Copper Rock of $(50.3) billion, net outflows of $(3.3) billion including reinvested income and distributions of $4.3 billion, and realizations and other of $(1.1) billion, partially offset by net market appreciation of $7.0 billion from continued market recovery. The change in assets under management during the year ended December 31, 2019 reflects net market appreciation of $32.1 billion, realizations and other of $(1.3) billion and net outflows of $(32.7) billion including reinvested income and distributions of $5.4 billion. The change in assets under management during the year ended December 31, 2018 reflects net market depreciation of $(30.3) billion, realizations and other of $(2.1) billion, and net flows of $(4.3) billion including reinvested income and distributions of $5.7 billion.
For the year ended December 31, 2020, our net outflows were $(3.3) billion compared to net outflows of $(32.7) billion for the year ended December 31, 2019 and net outflows of $(4.3) billion for the year ended December 31, 2018. The change in net outflows for the year ended December 31, 2020.December 31, 2019, and December 31, 2018 was primarily due to the $(22.8) billion reallocation of several Vanguard sub-advisory strategies for the year ended December 31, 2019 that did not occur in the year ended December 31, 2020 or December 31, 2018. Reinvested income and distributions of $4.3 billion, $5.4 billion, and $5.7 billion are reflected in the net flows for the years ended December 31, 2020, 2019 and 2018, respectively. For the year ended December 31, 2020, the annualized revenue impact of the net flows improved to $(22.0) million compared to $(69.1) million for the year ended December 31, 2019.
63
U.S. GAAP Results of Operations
For the Years Ended December 31, 2020, 2019 and 2018
Our U.S. GAAP results of operations were as follows for the years ended December 31, 2020, 2019 and 2018.
| Years ended December 31, | Increase (Decrease) | ||||||||||||||||||||||||||||
| ($ in millions unless otherwise noted) | 2020 | 2019 | 2018 | 2020 vs. 2019 | 2019 vs. 2018 | ||||||||||||||||||||||||
U.S. GAAP Consolidated Statements of Operations(1) | |||||||||||||||||||||||||||||
| Management fees | $ | 697.9 | $ | 807.0 | $ | 905.0 | $ | (109.1) | $ | (98.0) | |||||||||||||||||||
| Performance fees | 7.8 | (0.1) | 9.8 | 7.9 | (9.9) | ||||||||||||||||||||||||
| Other revenue | 7.3 | 6.0 | 9.6 | 1.3 | (3.6) | ||||||||||||||||||||||||
| Consolidated Funds’ revenue | 5.5 | 6.6 | 3.8 | (1.1) | 2.8 | ||||||||||||||||||||||||
| Total revenue | 718.5 | 819.5 | 928.2 | (101.0) | (108.7) | ||||||||||||||||||||||||
| Compensation and benefits | 388.7 | 416.2 | 696.4 | (27.5) | (280.2) | ||||||||||||||||||||||||
| General and administrative expense | 106.0 | 128.8 | 126.0 | (22.8) | 2.8 | ||||||||||||||||||||||||
| Impairment of goodwill | 16.4 | — | — | 16.4 | — | ||||||||||||||||||||||||
Amortization of acquired intangibles | 6.7 | 6.6 | 6.6 | 0.1 | — | ||||||||||||||||||||||||
| Depreciation and amortization | 21.0 | 17.2 | 14.5 | 3.8 | 2.7 | ||||||||||||||||||||||||
| Consolidated Funds’ expense | 0.3 | 0.4 | 0.9 | (0.1) | (0.5) | ||||||||||||||||||||||||
| Total operating expenses | 539.1 | 569.2 | 844.4 | (30.1) | (275.2) | ||||||||||||||||||||||||
| Operating income | 179.4 | 250.3 | 83.8 | (70.9) | 166.5 | ||||||||||||||||||||||||
| Investment income | 4.9 | 16.8 | 66.5 | (11.9) | (49.7) | ||||||||||||||||||||||||
| Interest income | 0.6 | 2.2 | 3.2 | (1.6) | (1.0) | ||||||||||||||||||||||||
| Interest expense | (28.5) | (32.2) | (24.9) | (3.7) | (7.3) | ||||||||||||||||||||||||
| Gain on sale of Affiliates | 241.3 | — | — | 241.3 | — | ||||||||||||||||||||||||
| Revaluation of DTA deed | — | — | 20.0 | — | (20.0) | ||||||||||||||||||||||||
| Net consolidated Funds’ investment gain (loss) | 29.9 | 20.9 | (13.4) | 9.0 | 34.3 | ||||||||||||||||||||||||
Income from continuing operations before taxes | 427.6 | 258.0 | 135.2 | 169.6 | 122.8 | ||||||||||||||||||||||||
| Income tax expense | 112.1 | 18.0 | 5.0 | 94.1 | 13.0 | ||||||||||||||||||||||||
| Income from continuing operations | 315.5 | 240.0 | 130.2 | 75.5 | 109.8 | ||||||||||||||||||||||||
Gain (loss) on disposal of discontinued operations, net of tax | — | — | 0.1 | — | (0.1) | ||||||||||||||||||||||||
| Net income | 315.5 | 240.0 | 130.3 | 75.5 | 109.7 | ||||||||||||||||||||||||
Net income (loss) attributable to non-controlling interests in consolidated Funds | 28.8 | 16.1 | (6.1) | 12.7 | 22.2 | ||||||||||||||||||||||||
Net income attributable to controlling interests | $ | 286.7 | $ | 223.9 | $ | 136.4 | $ | 62.8 | $ | 87.5 | |||||||||||||||||||
| Basic earnings per share ($) | $ | 3.53 | $ | 2.45 | $ | 1.27 | $ | 1.08 | $ | 1.18 | |||||||||||||||||||
| Diluted earnings per share ($) | 3.49 | 2.45 | 1.26 | 1.04 | 1.19 | ||||||||||||||||||||||||
Weighted average shares of common stock outstanding—basic | 81.3 | 91.2 | 107.4 | (9.9) | (16.2) | ||||||||||||||||||||||||
Weighted average shares of common stock outstanding—diluted | 82.0 | 91.3 | 107.6 | (9.3) | (16.3) | ||||||||||||||||||||||||
U.S. GAAP operating margin (2) | 25 | % | 31 | % | 9 | % | (557) bps | 2152 bps | |||||||||||||||||||||
(1)Certain Funds have been consolidated due to our seed capital or co-investments in the Funds.
(2)U.S. GAAP operating margin equals operating income from continuing operations divided by total revenue.
The following table reconciles our net income attributable to controlling interests to our pre-tax income from continuing operations attributable to controlling interests:
64
| Years ended December 31, | |||||||||||||||||
| ($ in millions) | 2020 | 2019 | 2018 | ||||||||||||||
| U.S. GAAP Consolidated Statements of Operations | |||||||||||||||||
| Net income attributable to controlling interests | $ | 286.7 | $ | 223.9 | $ | 136.4 | |||||||||||
| Exclude: (Gain) loss on discontinued operations attributable to controlling interests | — | — | (0.1) | ||||||||||||||
| Net income from continuing operations attributable to controlling interests | 286.7 | 223.9 | 136.3 | ||||||||||||||
| Add: Income tax expense | 112.1 | 18.0 | 5.0 | ||||||||||||||
| Pre-tax income from continuing operations attributable to controlling interests | $ | 398.8 | $ | 241.9 | $ | 141.3 | |||||||||||
U.S. GAAP Revenues
Our U.S. GAAP revenues principally consist of:
i.management fees earned based on our overall weighted average fee rate charged to our clients and the level of assets under management;
ii.performance fees earned or management fee adjustments when our Affiliates’ investment performance over agreed time periods for certain clients has differed from pre-determined hurdles;
iii.other revenue, consisting primarily of consulting services as well as reimbursement of certain Fund expenses our Affiliates paid on behalf of our Funds; and
iv.revenue from consolidated Funds, a portion of which is attributable to the holders of non-controlling interests in consolidated Funds.
Management Fees
Our management fees are a function of the fee rates our Affiliates charge to their clients, which are typically expressed in basis points, and the levels of our assets under management.
Excluding assets managed by our equity-accounted Affiliate, average basis points earned on average assets under management were 39.2 bps for the year ended December 31, 2020, 37.7 bps for the year ended December 31, 2019 and 38.9 bps for the year ended December 31, 2018. The greatest driver of increases or decreases in this average fee rate is changes in the mix of our assets under management caused by net inflows or outflows in certain asset classes, net catch-up fees, or disproportionate market movements.
65
Our average basis points by Segment (including only consolidated Affiliates that are included in management fee revenue, unless indicated) over each of the periods indicated were:
| ($ in millions, except AUM data in billions) | Years ended December 31, | ||||||||||||||||||||||||||||||||||
| 2020 | 2019 | 2018 | |||||||||||||||||||||||||||||||||
| Revenue | Basis Pts | Revenue | Basis Pts | Revenue | Basis Pts | ||||||||||||||||||||||||||||||
| Quant & Solutions | $ | 346.8 | 36 | $ | 370.8 | 39 | $ | 377.4 | 39 | ||||||||||||||||||||||||||
| Alternatives | 170.6 | 70 | 165.0 | 70 | 208.3 | 90 | |||||||||||||||||||||||||||||
| Liquid Alpha | 180.5 | 31 | 271.2 | 28 | 319.3 | 28 | |||||||||||||||||||||||||||||
U.S. GAAP management fee revenue & weighted average fee rate on average AUM of consolidated Affiliates(1) | $ | 697.9 | 39.2 | $ | 807.0 | 37.7 | $ | 905.0 | 38.9 | ||||||||||||||||||||||||||
| Average AUM excluding equity-accounted Affiliate | $ | 177.4 | $ | 214.1 | $ | 232.8 | |||||||||||||||||||||||||||||
| Average AUM including equity-accounted Affiliate & weighted average fee rate | $ | 179.7 | 39.5 | $ | 216.3 | 37.9 | $ | 234.9 | 39.0 | ||||||||||||||||||||||||||
(1)Amounts shown are equivalent to ENI management fee revenue. (See “ENI Revenues.”)
Year ended December 31, 2020 compared to year ended December 31, 2019: Management fees decreased $(109.1) million, or (13.5)%, from $807.0 million for the year ended December 31, 2019 to $697.9 million for the year ended December 31, 2020. The decrease was primarily due to the disposition of Barrow Hanley and Copper Rock and lower overall level of average assets under management. Average assets under management excluding equity-accounted Affiliate decreased (17.1)%, from $214.1 billion for the year ended December 31, 2019 to $177.4 billion for the year ended December 31, 2020, mainly due to the sale of Barrow Hanley and Copper Rock and the equity market decline during the first quarter of 2020 driven by the COVID-19 pandemic.
Year ended December 31, 2019 compared to year ended December 31, 2018: Management fees decreased $(98.0) million, or (10.8)%, from $905.0 million for the year ended December 31, 2018 to $807.0 million for the year ended December 31, 2019. The decrease was primarily attributable to a decrease in both average assets under management excluding our equity-accounted Affiliate and our weighted average fee rate for the year ended December 31, 2019. The decrease in management fee revenue was also caused by net catch-up fees associated with alternative assets earned in 2018 that did not repeat in 2019. Net catch-up fees represent payment of certain Fund management fees back to the initial closing date for certain products with multiple closings, less placement fees paid to third parties related to these funds. Average assets under management excluding equity-accounted Affiliate decreased (8.0)%, from $232.8 billion for the year ended December 31, 2018 to $214.1 billion for the year ended December 31, 2019, mainly due to equity market decline at the end of 2018 and the impact of the $(22.8) billion reallocation of several Vanguard sub-advisory strategies in the fourth quarter of 2019.
Performance Fees
Approximately $17.5 billion, or 11.0% of our AUM in consolidated Affiliates at December 31, 2020, are in accounts with incentive fee or carried interest features in which we participate. Performance fees are typically shared with our Affiliate key employees through various contractual compensation and profit-sharing arrangements. Performance fees are variable and are contractually triggered based on investment performance results over agreed upon time periods.
Year ended December 31, 2020 compared to year ended December 31, 2019: Performance fees improved $7.9 million, from $(0.1) million for the year ended December 31, 2019 to $7.8 million for the year ended December 31, 2020. A performance fee penalty in 2019 was attributable to sub-advisory assets no longer with the Affiliates.
66
Year ended December 31, 2019 compared to year ended December 31, 2018: Performance fees decreased $(9.9) million, or (101.0)%, from $9.8 million for the year ended December 31, 2018 to $(0.1) million for the year ended December 31, 2019. Performance fees are variable and are contractually triggered based on investment performance results over agreed upon time periods.
The liquidation of an alternative product may result in the recognition of a performance fee. With respect to liquidations likely to occur in the near term, we do not expect to receive any net performance fees that would be material to our operating results. These projections are based on market conditions and investment performance as of December 31, 2020.
Other Revenue
Year ended December 31, 2020 compared to year ended December 31, 2019: Other revenue increased $1.3 million, or 21.7%, from $6.0 million for the year ended December 31, 2019 to $7.3 million for the year ended December 31, 2020. The increase was primarily attributable to an increase in consulting performed by an Affiliate for the year ended December 31, 2020.
Year ended December 31, 2019 compared to year ended December 31, 2018: Other revenue decreased $(3.6) million, or (37.5)%, from $9.6 million for the year ended December 31, 2018 to $6.0 million for the year ended December 31, 2019. The decrease was primarily attributable to the decrease in revenue recorded for certain Fund expenses paid by our Affiliates and subsequently reimbursed by the Fund for the year ended December 31, 2019.
U.S. GAAP Expenses
Our U.S. GAAP expenses principally consist of:
i.compensation paid to our investment professionals and other employees, including base salary, benefits, sales-based compensation, variable compensation, Affiliate distributions, revaluation of key employee owned Affiliate equity and profit interests, and the amortization of acquisition-related consideration and pre-acquisition employee equity;
ii.general and administrative expenses;
iii.impairment of goodwill;
iv.amortization of acquired intangible assets;
v.depreciation and amortization charges; and
vi.expenses of consolidated Funds, a portion of which is attributable to the holders of non-controlling interests in consolidated Funds.
67
Compensation and Benefits Expense
Our most significant category of expense is compensation and benefits awarded to our and our Affiliates’ employees. The following table presents the components of U.S. GAAP compensation expense for the years ended December 31, 2020, 2019 and 2018:
| Years ended December 31, | |||||||||||||||||
| ($ in millions) | 2020 | 2019 | 2018 | ||||||||||||||
Fixed compensation and benefits(1) | $ | 177.6 | $ | 194.1 | $ | 188.7 | |||||||||||
Sales-based compensation(2) | 8.8 | 11.2 | 17.4 | ||||||||||||||
Variable compensation(3) | 180.7 | 199.4 | 235.9 | ||||||||||||||
Affiliate key employee distributions(4) | 41.5 | 45.1 | 76.6 | ||||||||||||||
Non-cash Affiliate key employee equity revaluations(5)(6) | (26.1) | (65.9) | 107.2 | ||||||||||||||
Amortization of acquisition-related consideration and pre-acquisition employee equity(7) | 6.2 | 32.3 | 70.6 | ||||||||||||||
| Total U.S. GAAP compensation and benefits expense | $ | 388.7 | $ | 416.2 | $ | 696.4 | |||||||||||
(1)Fixed compensation and benefits includes base salaries, payroll taxes and the cost of benefit programs provided. For the year ended December 31, 2020, $173.3 million of fixed compensation and benefits (of the $177.6 million above) is included within economic net income, which excludes Fund expenses initially paid by our Affiliates on the Fund’s behalf and subsequently reimbursed. For the year ended December 31, 2019, $189.7 million of fixed compensation and benefits (of the $194.1 million above) is included within economic net income, which excludes Fund expenses initially paid by our Affiliates on the Fund’s behalf and subsequently reimbursed. For the year ended December 31, 2018, $181.4 million of fixed compensation and benefits (of the $188.7 million above) is included within economic net income, which excludes Fund expenses initially paid by our Affiliates on the Fund’s behalf and subsequently reimbursed, as well as the compensation and benefits associated with the 2018 CEO transition.
(2)Sales-based compensation is paid to our and our Affiliates’ sales and distribution teams and represents compensation earned by our sales professionals, paid over a multi-year period, related to revenue earned on new sales. Its variability is based upon the structure of sales-based compensation due on inflows of assets under management and market-based movement in both current and prior periods.
(3)Variable compensation is contractually set and calculated individually at each Affiliate, plus Center bonuses and compensation paid by our Affiliates on behalf of their Funds that are subsequently reimbursed. Variable compensation is usually awarded based on a contractual percentage of each Affiliate’s ENI profits before variable compensation and may be paid in the form of cash or non-cash Affiliate equity or profit interests. In Affiliates with an agreed split of performance fees between Affiliate employees and BSUS, the Affiliates’ share of performance fees is allocated entirely to variable compensation. Center variable compensation includes cash and BSIG equity. Non-cash variable compensation awards typically vest over several years and are recognized as compensation expense over that service period. The variable compensation ratio at each Affiliate, calculated as variable compensation divided by ENI earnings before variable compensation, will typically be between 25% and 35%.
| Years ended December 31, | |||||||||||||||||
| ($ in millions) | 2020 | 2019 | 2018 | ||||||||||||||
| Cash variable compensation | $ | 165.4 | $ | 179.9 | $ | 214.9 | |||||||||||
| Non-cash equity-based award amortization | 15.3 | 19.5 | 21.0 | ||||||||||||||
Total variable compensation(a) | $ | 180.7 | $ | 199.4 | $ | 235.9 | |||||||||||
68
(a)For the year ended December 31, 2020, $159.6 million of variable compensation expense (of the $180.7 million above) is included within economic net income, which excludes the variable compensation associated with restructuring at the Center and the Affiliates, variable compensation subsequently reimbursed by Funds, and a one-time compensation arrangement entered into that includes advances against future compensation payments. For the year ended December 31, 2019, $184.7 million of variable compensation expense (of the $199.4 million above) is included within economic net income, which excludes the variable compensation associated with restructuring at the Center and the Affiliates, as well as variable compensation subsequently reimbursed by Funds. For the year ended December 31, 2018, $230.7 million of variable compensation expense (of the $235.9 million above) is included within economic net income, which excludes the variable compensation associated with the 2018 CEO transition costs and variable compensation subsequently reimbursed by Funds.
(4)Affiliate key employee distributions represent the share of Affiliate profits after variable compensation that is attributable to Affiliate key employee equity and profit interests holders, according to their ownership interests. For the year ended December 31, 2019, Affiliate key employee distributions included within economic net income was $53.1 million, which included an adjustment of $8.0 million of variable compensation related to restructuring at an Affiliate that will be reimbursed through a reduction of Affiliate key employee distributions. The Affiliate key employee distribution ratio at each Affiliate is calculated as Affiliate key employee distributions divided by ENI operating earnings at that Affiliate. At certain Affiliates with tiered equity structures, BSUS and other classes of employee equity holders are entitled to an initial proportionate preference over profits after variable compensation, structured such that before a preference threshold is reached, there would be no required key employee distributions to the tiered equity holders, whereas for profits above the threshold the key employee distribution amount to the tiered equity holders would be calculated based on the tiered key employee ownership percentages. Based on current economic arrangements, employee distributions range from approximately 20% to 40% of marginal ENI operating earnings at each of our consolidated Affiliates.
(5)Non-cash Affiliate key employee equity revaluations represent changes in the value of Affiliate equity and profit interests held by Affiliate key employees. These ownership interests may, in certain circumstances, be repurchased by BSUS at a value based on a pre-determined fixed multiple of twelve-month earnings and as such a liability is carried on our balance sheet based on the expected cash to be paid. However, any equity or profit interests repurchased by BSUS can be used to fund a portion of future variable compensation awards, resulting in savings in cash variable compensation that offset the negative cash effect of repurchasing the equity. Our Affiliate equity and profit interest plans have been designed to ensure BSUS is not required to repurchase more equity than we can reasonably recycle through variable compensation awards in any given twelve month period.
(6)Included in non-cash Affiliate key employee equity revaluations are revaluations as a result of the Landmark transaction related to contingent consideration amounting to $95.3 million for the year ended December 31, 2018, along with the revaluations of Landmark employee equity owned pre-acquisition amounting to $(6.0) million for the year ended December 31, 2020, $13.3 million for the year ended December 31, 2019 and $37.9 million for the year ended December 31, 2018.
(7)Acquisition-related consideration and pre-acquisition employee equity represents the amortization of acquisition-related contingent consideration created as a result of the Landmark transaction amounting to $37.1 million in the year ended December 31, 2018, along with the amortization of employee equity owned pre-acquisition amounting to $6.2 million for the year ended December 31, 2020, $32.3 million for the year ended December 31, 2019 and $33.5 million for the year ended December 31, 2018. These items have been included in U.S. GAAP compensation expense as a result of ongoing service requirements for employee recipients.
69
Fluctuations in compensation and benefits expense for the periods presented are discussed below.
Year ended December 31, 2020 compared to year ended December 31, 2019: Compensation and benefits expense decreased $(27.5) million, or (6.6)%, from $416.2 million for the year ended December 31, 2019 to $388.7 million for the year ended December 31, 2020. Fixed compensation and benefits decreased $(16.5) million, or (8.5)%, from $194.1 million for the year ended December 31, 2019 to $177.6 million for the year ended December 31, 2020. This decrease reflects the cost savings from the restructuring at the Center and Affiliates, as well as the disposition of Barrow Hanley and Copper Rock in 2020. Variable compensation decreased $(18.7) million, or (9.4)%, from $199.4 million for the year ended December 31, 2019 to $180.7 million for the year ended December 31, 2020. The decrease was attributable to lower pre-variable compensation earnings in 2020, offset by the impact of a one-time compensation arrangement entered into that includes advances against future compensation payments. Sales-based compensation decreased $(2.4) million, or (21.4)%, from $11.2 million for the year ended December 31, 2019 to $8.8 million for the year ended December 31, 2020, as a result of the structure of sales-based compensation programs, driven by the timing of asset inflows triggering sales-based compensation in both current and prior periods. Affiliate key employee distributions decreased $(3.6) million, or (8.0)%, from $45.1 million for the year ended December 31, 2019 to $41.5 million for the year ended December 31, 2020 as a result of lower earnings before Affiliate key employee distributions at the consolidated Affiliates. Revaluations of Affiliate key employee equity changed $39.8 million in 2020, reflecting revaluations of key employee ownership interests at our consolidated Affiliates, as the value of Affiliate equity decreased $(65.9) million for the year ended December 31, 2019 and decreased $(26.1) million for the year ended December 31, 2020. Amortization of acquisition-related consideration and pre-acquisition equity decreased $(26.1) million, or (80.8)% from $32.3 million for the year ended December 31, 2019 to $6.2 million for the year ended December 31, 2020, as a result of employee equity vesting in the prior year.
Year ended December 31, 2019 compared to year ended December 31, 2018: Compensation and benefits expense decreased $(280.2) million, or (40.2)%, from $696.4 million for the year ended December 31, 2018 to $416.2 million for the year ended December 31, 2019. Fixed compensation and benefits increased $5.4 million, or 2.9%, from $188.7 million for the year ended December 31, 2018 to $194.1 million for the year ended December 31, 2019. This increase reflects the growth of the investment teams at our Affiliates and cost of living increases. Variable compensation decreased $(36.5) million, or (15.5)%, from $235.9 million for the year ended December 31, 2018 to $199.4 million for the year ended December 31, 2019 due to lower pre-variable compensation earnings in the current period. Sales-based compensation decreased $(6.2) million, or (35.6)%, from $17.4 million for the year ended December 31, 2018 to $11.2 million for the year ended December 31, 2019, as a result of the structure of sales-based compensation and the timing of asset inflows triggering sales-based compensation in both current and prior periods. Affiliate key employee distributions decreased $(31.5) million, or (41.1)%, from $76.6 million for the year ended December 31, 2018 to $45.1 million for the year ended December 31, 2019, as a result of lower earnings before Affiliate key employee distributions at the consolidated Affiliates and the levered structure of distributions at certain Affiliates. Revaluations of Affiliate key employee equity decreased $(173.1) million in 2019. Amortization of acquisition-related consideration and pre-acquisition equity decreased $(38.3) million, or (54.2)% from $70.6 million for the year ended December 31, 2018 to $32.3 million for the year ended December 31, 2019. The decrease in the revaluations of Affiliate equity was driven by lower earnings at the Affiliates in 2019, while the reduction in the amortization of acquisition-related consideration and pre-acquisition equity was primarily due to the Landmark contingent consideration arrangement that was fully accrued as of December 31, 2018.
70
General and Administrative Expense
Year ended December 31, 2020 compared to year ended December 31, 2019: General and administrative expense decreased $(22.8) million, or (17.7)%, from $128.8 million for the year ended December 31, 2019 to $106.0 million for the year ended December 31, 2020. The decrease was primarily due to cost saving initiatives at the Center and Affiliates and the disposition of Barrow Hanley and Copper Rock in 2020.
Year ended December 31, 2019 compared to year ended December 31, 2018: General and administrative expense increased $2.8 million, or 2.2%, from $126.0 million for the year ended December 31, 2018 to $128.8 million for the year ended December 31, 2019. The increase in general and administrative expenses primarily reflects new initiatives, additional system costs and continued investment in the business.
Impairment of Goodwill
Year ended December 31, 2020 compared to year ended December 31, 2019: No goodwill impairment charge was recorded in the year ended December 31, 2019. A goodwill impairment charge of $16.4 million was recorded for the year ended December 31, 2020 with respect to the Copper Rock reporting unit which was included within the Liquid Alpha segment prior to its disposition in July 2020. See “Recent Developments” herein. In the first quarter of 2020, we performed a quantitative impairment test of Copper Rock due to the decline in assets under management and the fair value of the Copper Rock reporting unit did not exceed its carrying value. Accordingly, we recognized a goodwill impairment charge of $16.4 million for the year ended December 31, 2020.
Year ended December 31, 2019 compared to year ended December 31, 2018: No goodwill impairment charge was recorded in either the year ended December 31, 2019 or December 31, 2018.
Amortization of Acquired Intangibles Expense
Year ended December 31, 2020 compared to year ended December 31, 2019: Amortization of acquired intangibles expense increased $0.1 million, or 1.5%, from $6.6 million for the year ended December 31, 2019 to $6.7 million for the year ended December 31, 2020. This expense primarily reflects the amortization of intangible assets acquired in the Landmark transaction.
Year ended December 31, 2019 compared to year ended December 31, 2018: Amortization of acquired intangibles expense was unchanged at $6.6 million for the year ended December 31, 2019 and $6.6 million for the year ended December 31, 2018. This expense primarily reflects the amortization of intangible assets acquired in the Landmark transaction.
Depreciation and Amortization Expense
Year ended December 31, 2020 compared to year ended December 31, 2019: Depreciation and amortization expense increased $3.8 million, or 22.1%, from $17.2 million for the year ended December 31, 2019 to $21.0 million for the year ended December 31, 2020. The increase was primarily related to additional software and technology investments in the business.
Year ended December 31, 2019 compared to year ended December 31, 2018: Depreciation and amortization expense increased $2.7 million, or 18.6%, from $14.5 million for the year ended December 31, 2018 to $17.2 million for the year ended December 31, 2019. The increase was primarily related to additional software and technology investments in the business.
71
U.S. GAAP Other Non-Operating Items of Income and Expense
Other non-operating items of income and expense consist of:
i.investment income;
ii.interest income;
iii.interest expense; and
iv.gain on sale of Affiliates
Investment Income
Year ended December 31, 2020 compared to year ended December 31, 2019: Investment income decreased $(11.9) million, or (70.8)%, from $16.8 million for the year ended December 31, 2019 to $4.9 million for the year ended December 31, 2020. The decrease is primarily due to the change in unrealized gains/losses on seed investments driven by the market decline in the first quarter of 2020, which was partially offset by the change in unrealized gains in the following quarters of 2020 as the market recovered.
Year ended December 31, 2019 compared to year ended December 31, 2018: Investment income decreased $(49.7) million, or (74.7)%, from $66.5 million for the year ended December 31, 2018 to $16.8 million for the year ended December 31, 2019, primarily due to a $65.7 million gain from the sale of our stake in Heitman that was included in 2018 results and not repeated in 2019. Excluding the gain from the sale of our stake in Heitman, investment income increased $16.0 million as a result of higher returns on co-investments and seed capital investments in 2019.
Interest Income
Year ended December 31, 2020 compared to year ended December 31, 2019: Interest income decreased $(1.6) million, or (72.7)%, from $2.2 million for the year ended December 31, 2019 to $0.6 million for the year ended December 31, 2020, principally due to a decrease in short-term investment returns in 2020.
Year ended December 31, 2019 compared to year ended December 31, 2018: Interest income decreased $(1.0) million, or (31.3)%, from $3.2 million for the year ended December 31, 2018 to $2.2 million for the year ended December 31, 2019, principally due to lower average cash balances and a decrease in short-term investment returns in 2019.
Interest Expense
Year ended December 31, 2020 compared to year ended December 31, 2019: Interest expense decreased $3.7 million, or (11.5)%, from $32.2 million for the year ended December 31, 2019 to $28.5 million for the year ended December 31, 2020, primarily reflecting a lower balance drawn on the non-recourse seed capital and revolving credit facilities during 2020. We paid down the balance on our non-recourse seed capital facility, and paid down the balance on our revolving credit facility in the year ended December 31, 2020.
Year ended December 31, 2019 compared to year ended December 31, 2018: Interest expense increased $7.3 million, or 29.3%, from $24.9 million for the year ended December 31, 2018 to $32.2 million for the year ended December 31, 2019, primarily reflecting the utilization of our revolving credit facility and non-recourse seed capital facility during 2019.
72
Gain on Sale of Affiliates
Year ended December 31, 2020 compared to year ended December 31, 2019: Gain on sale of Affiliate was $241.3 million for the year ended December 31, 2020, representing a gain of $7.2 million on the sale of our equity interests in Copper Rock, a gain of $231.2 million on the sale of our equity interests in Barrow Hanley and a gain of $2.9 million on a previously disposed Affiliate. No gain on sale of Affiliate was recorded in the year ended December 31, 2019.
Year ended December 31, 2019 compared to year ended December 31, 2018: No gain on sale of an Affiliate was recorded in either the year ended December 31, 2019 or December 31, 2018.
U.S. GAAP Income Tax Expense
Our effective tax rate has been impacted by changes in liabilities for uncertain tax positions, tax effects of stock-based compensation, sale of Affiliates, limitations on executive compensation, the mix of income earned in the United States versus lower-taxed foreign jurisdictions and benefits from intercompany financing arrangements which ended in 2019. Our effective tax rate could be impacted in the future by these items as well as further changes in tax laws and regulations in jurisdictions in which we operate. As of December 31, 2020, a significant portion of the Company’s liabilities for uncertain tax positions have been reduced due to the lapse of statutes of limitation.
The Coronavirus Aid, Relief, and Economic Security Act (“CARES Act”) contains numerous income tax provisions including some that are effective retroactively. Our Consolidated Balance Sheet reflects the benefit of a provision that increased the business interest limitation under IRC Section 163(j) from 30% to 50% for tax years 2019 and 2020. This provision allowed us to utilize more of the deferred tax asset related to interest expense.
Year ended December 31, 2020 compared to year ended December 31, 2019: Income tax expense increased $94.1 million, from $18.0 million for the year ended December 31, 2019 to $112.1 million for the year ended December 31, 2020. The increase in income tax expense relates to the increase in income from continuing operations for the year ended December 31, 2020 driven by the gain on sale of Affiliates, in addition to the reductions to liabilities for uncertain tax positions due to the lapse of statues of limitation and adjustments to deferred tax assets in 2020 compared to 2019. Deferred tax assets have been adjusted primarily for changes in the Company's state tax rates and an increase in state tax obligations.
Year ended December 31, 2019 compared to year ended December 31, 2018: Income tax expense increased $13.0 million, from $5.0 million for the year ended December 31, 2018 to $18.0 million for the year ended December 31, 2019, primarily due to the increase in the income from continuing operations before taxes. This increase in income tax expense was partially reduced by the reduction to liabilities for uncertain tax positions due to the lapse of statutes of limitation and adjustments to deferred tax assets in 2019. In 2019, deferred tax assets increased in connection with the Redomestication and an increase in state tax obligations. The effective tax rate increased to7.1% for the year ended December 31, 2019 from 3.7% for the year ended December 31, 2018 primarily due to the increase in income from continuing operations before taxes and a smaller reduction in 2019 to liabilities for uncertain tax positions due to the lapse of statutes of limitations. These increases to the effective tax rate were partially reduced by the impact of the deferred tax adjustments described above.
In 2018, the Company agreed to terminate the DTA Deed with OM plc. The Company recorded a revaluation gain of $20.0 million in connection with the settlement of the DTA Deed for the year ended December 31, 2018. This is reflected in income from continuing operations before tax, and is comprised of a $12.6 million discount on the DTA Deed payable and a $7.4 million gain relating to the value of the tax insurance policies transferred to the Company by OM plc. This adjustment to the DTA Deed is not subject to U.K. tax, consequently having the effect of reducing our effective tax rate. In the first quarter of 2019, the final cash payment of $32.7 million was made to OM plc to settle the outstanding liability under the Deed.
73
U.S. GAAP Consolidated Funds
The net income or loss of all Consolidated Funds, excluding any income or loss attributable to seed capital or co-investments we make in the Funds, is included in non-controlling interests in our Consolidated Financial Statements and is not included in net income attributable to controlling interests or in management fees.
Year ended December 31, 2020 compared to year ended December 31, 2019: Consolidated Funds’ revenue decreased $(1.1) million, from $6.6 million for the year ended December 31, 2019 to $5.5 million for the year ended December 31, 2020. Consolidated Funds’ expense decreased $(0.1) million, from $0.4 million for the year ended December 31, 2019 to $0.3 million for the year ended December 31, 2020. The decrease in Consolidated Funds’ revenue and decrease in Consolidated Funds’ expense is due to changes in the population of Consolidated Funds during the year ended December 31, 2020, including the deconsolidation of Funds due to redemption of seed investments in Barrow Hanley Consolidated Funds following the sale of our equity interests in Barrow Hanley in November 2020. Consolidated Funds’ investment gain (loss) increased $9.0 million from $20.9 million for the year ended December 31, 2019 to $29.9 million for the year ended December 31, 2020.
Year ended December 31, 2019 compared to year ended December 31, 2018: Consolidated Funds’ revenue increased $2.8 million, from $3.8 million for the year ended December 31, 2018 to $6.6 million for the year ended December 31, 2019. Consolidated Funds’ expense decreased $(0.5) million, from $0.9 million for the year ended December 31, 2018 to $0.4 million for the year ended December 31, 2019. The increase in consolidated Funds’ revenue and decrease in Consolidated Funds’ expense is due to changes in the population of consolidated Funds during the year ended December 31, 2019. Consolidated Funds’ investment gain (loss) increased $34.3 million from $(13.4) million for the year ended December 31, 2018 to $20.9 million for the year ended December 31, 2019.
74
Key U.S. GAAP Operating Metrics
The following table shows our key U.S. GAAP operating metrics for the years ended December 31, 2020, 2019 and 2018. The second, third and fourth metrics below have each been adjusted to eliminate the effect of consolidated Funds to more accurately reflect the economics of our Company.
| Years ended December 31, | |||||||||||||||||
| ($ in millions) | 2020 | 2019 | 2018 | ||||||||||||||
Numerator: Operating income | $ | 179.4 | $ | 250.3 | $ | 83.8 | |||||||||||
Denominator: Total revenue | $ | 718.5 | $ | 819.5 | $ | 928.2 | |||||||||||
U.S. GAAP operating margin(1) | 25.0 | % | 30.5 | % | 9.0 | % | |||||||||||
Numerator: Total operating expenses(2) | $ | 538.8 | $ | 568.8 | $ | 843.5 | |||||||||||
Denominator: Management fee revenue | $ | 697.9 | $ | 807.0 | $ | 905.0 | |||||||||||
U.S. GAAP operating expense / management fee revenue(3) | 77.2 | % | 70.5 | % | 93.2 | % | |||||||||||
Numerator: Variable compensation | $ | 180.7 | $ | 199.4 | $ | 235.9 | |||||||||||
Denominator: Operating income before variable compensation and Affiliate key employee distributions(2)(4)(5) | $ | 396.4 | $ | 488.6 | $ | 393.4 | |||||||||||
U.S. GAAP variable compensation ratio(3) | 45.6 | % | 40.8 | % | 60.0 | % | |||||||||||
Numerator: Affiliate key employee distributions | $ | 41.5 | $ | 45.1 | $ | 76.6 | |||||||||||
Denominator: Operating income before Affiliate key employee distributions(2)(4)(5) | $ | 215.7 | $ | 289.2 | $ | 157.5 | |||||||||||
U.S. GAAP Affiliate key employee distributions ratio(3) | 19.2 | % | 15.6 | % | 48.6 | % | |||||||||||
(1)Excluding the effect of Funds consolidation in the applicable periods, the U.S. GAAP operating margin would be 24.4% for the year ended December 31, 2020, 30.0% for the year ended December 31, 2019 and 8.8% for the year ended December 31, 2018.
(2)Excludes consolidated Funds’ expense of $0.3 million for the year ended December 31, 2020, $0.4 million for the year ended December 31, 2019 and $0.9 million for the year ended December 31, 2018.
(3)Excludes the effect of Funds consolidation for the years ended December 31, 2020, 2019 and 2018.
(4)Excludes consolidated Funds’ revenue of $5.5 million for the year ended December 31, 2020, $6.6 million for the year ended December 31, 2019 and $3.8 million for the year ended December 31, 2018.
(5)The following table identifies the components of operating income before variable compensation and Affiliate key employee distributions, as well as operating income before Affiliate key employee distributions:
| Years ended December 31, | |||||||||||||||||
| ($ in millions) | 2020 | 2019 | 2018 | ||||||||||||||
Operating income | $ | 179.4 | $ | 250.3 | $ | 83.8 | |||||||||||
Affiliate key employee distributions | 41.5 | 45.1 | 76.6 | ||||||||||||||
Operating (income) loss of consolidated Funds | (5.2) | (6.2) | (2.9) | ||||||||||||||
Operating income before Affiliate key employee distributions | $ | 215.7 | $ | 289.2 | $ | 157.5 | |||||||||||
| Variable compensation | 180.7 | 199.4 | 235.9 | ||||||||||||||
Operating income before variable compensation and Affiliate key employee distributions | $ | 396.4 | $ | 488.6 | $ | 393.4 | |||||||||||
75
Effects of Inflation
For the years ended December 31, 2020, 2019 and 2018, inflation did not have a material effect on our consolidated results of operations.
Non-GAAP Supplemental Performance Measure—Economic Net Income and Segment Analysis
As supplemental information, we provide a non-GAAP performance measure that we refer to as economic net income, or ENI, which represents our management’s view of the underlying economic earnings generated by us. We define economic net income as ENI revenue less (i) ENI operating expenses, (ii) variable compensation, (iii) key employee distributions, (iv) net interest and (v) taxes, each as further discussed in this section. ENI adjustments to U.S. GAAP include both reclassifications of U.S. GAAP revenue and expense items, as well as adjustments to U.S. GAAP results, primarily to exclude non-cash, non-economic expenses, or to reflect cash benefits not recognized under U.S. GAAP.
ENI is an important measure to investors because it is used by the Company to make resource allocation decisions, determine appropriate levels of investment or dividend payout, manage balance sheet leverage, determine Affiliate variable compensation and equity distributions, and incentivize management. It is also an important measure because it assists management in evaluating our operating performance and is presented in a way that most closely reflects the key elements of our profit share operating model with our Affiliates. For a further discussion of how we use ENI and why ENI is useful to investors, see “—Overview—How We Measure Performance.”
In the first quarter of 2020, we refined our definition of economic net income in light of a one-time compensation arrangement entered into that includes advances against future contractual compensation payments.
To calculate economic net income, we re-categorize certain line items on our Consolidated Statements of Operations to reflect the following:
•We exclude the effect of Funds consolidation by removing the portion of Fund revenues, expenses and investment return which were not attributable to our stockholders.
•We include within management fee revenue any fees paid to Affiliates by consolidated Funds, which are viewed as investment income under U.S. GAAP.
•We include our share of earnings from equity-accounted Affiliates within other income in ENI revenue, rather than investment income.
•We treat sales-based compensation as a general and administrative expense, rather than part of fixed compensation and benefits.
•We identify separately from operating expenses variable compensation and Affiliate key employee distributions, which represent Affiliate earnings shared with Affiliate key employees.
•We net the separate revenue and expenses under U.S. GAAP for certain Fund expenses initially paid by our Affiliates on the Funds’ behalf and subsequently reimbursed, to better reflect the economics of our business.
76
We also make the following adjustments to U.S. GAAP results to more closely reflect our economic results:
i.We exclude non-cash expenses representing changes in the value of Affiliate equity and profit interests held by Affiliate key employees. These ownership interests may in certain circumstances be repurchased by BSUS at a value based on a pre-determined fixed multiple of trailing earnings and as such this value is carried on our balance sheet as a liability. Non-cash movements in the value of this liability are treated as compensation expense under U.S. GAAP. However, any equity or profit interests repurchased by BSUS can be used to fund a portion of future variable compensation awards, resulting in savings in cash variable compensation that offset the negative cash effect of repurchasing the equity. Our Affiliate equity and profit interest plans have been designed to ensure BSUS is never required to repurchase more equity than we can reasonably recycle through variable compensation awards in any given twelve month period.
ii.We exclude non-cash amortization or impairment expenses related to acquired goodwill and other intangibles as these are non-cash charges that do not result in an outflow of tangible economic benefits from the business. We also exclude the amortization of acquisition-related contingent consideration, as well as the value of employee equity owned pre-acquisition, as occurred as a result of the Landmark transaction, where such items have been included in compensation expense as a result of ongoing service requirements for certain employees. Please note that the revaluations related to these acquisition-related items are included in (i) above.
iii.We exclude capital transaction costs, including the costs of raising debt or equity, gains or losses realized as a result of redeeming debt or equity and direct incremental costs associated with acquisitions of businesses or assets.
iv.We exclude seed capital and co-investment gains, losses and related financing costs. The net returns on these investments are considered and presented separately from ENI because ENI is primarily a measure of our earnings from managing client assets, which therefore differs from earnings generated by our investments in Affiliate products, which can be variable from period to period.
v.We include cash tax benefits associated with deductions allowed for acquired intangibles and goodwill that may not be recognized or have timing differences compared to U.S. GAAP.
vi.We exclude the results of discontinued operations attributable to controlling interests since they are not part of our ongoing business, restructuring costs incurred in continuing operations, and the impact of a one-time compensation arrangement entered into that includes advances against future contractual compensation payments.
vii.We exclude deferred tax resulting from changes in tax law and expiration of statutes, adjustments for uncertain tax positions, deferred tax attributable to intangible assets and other unusual items not related to current operating results to reflect ENI tax normalization.
We also adjust our income tax expense to reflect any tax impact of our ENI adjustments.
77
Reconciliation of U.S. GAAP Net Income to Economic Net Income for the Years Ended December 31, 2020, 2019 and 2018
The following table reconciles U.S. GAAP net income attributable to controlling interests to economic net income for the years ended December 31, 2020, 2019 and 2018:
| Years ended December 31, | ||||||||||||||||||||
| ($ in millions) | 2020 | 2019 | 2018 | |||||||||||||||||
| U.S. GAAP net income attributable to controlling interests | $ | 286.7 | $ | 223.9 | $ | 136.4 | ||||||||||||||
| Adjustments to reflect the economic earnings of the Company: | ||||||||||||||||||||
| i. | Non-cash key employee-owned equity and profit interest revaluations | (26.1) | (65.9) | 107.2 | ||||||||||||||||
| ii. | Goodwill impairment and amortization of acquired intangible assets, acquisition-related consideration and pre-acquisition employee equity | 29.3 | 38.9 | 77.2 | ||||||||||||||||
| iii. | Capital transaction costs | 0.8 | 2.9 | 1.6 | ||||||||||||||||
| iv. | Seed/Co-investment (gains) losses and financings(1) | (2.5) | (16.2) | 14.5 | ||||||||||||||||
| v. | Tax benefit of goodwill and acquired intangibles deductions | 9.2 | 9.3 | 5.7 | ||||||||||||||||
| vi. | Discontinued operations, restructuring and the impact of one-time compensation arrangement that includes advances against future compensation payments (2) | (213.2) | 9.2 | (79.4) | ||||||||||||||||
| vii. | ENI tax normalization(3) | 1.6 | (49.8) | (30.3) | ||||||||||||||||
Tax effect of above adjustments(4) | 57.8 | 8.5 | (33.1) | |||||||||||||||||
| Economic net income | $ | 143.6 | $ | 160.8 | $ | 199.8 | ||||||||||||||
(1)The net return on seed/co-investment (gains) losses and financings for the years ended December 31, 2020, 2019 and 2018 are shown in the following table.
| Years ended December 31, | |||||||||||||||||
| ($ in millions) | 2020 | 2019 | 2018 | ||||||||||||||
| Seed/Co-investment (gains) losses | $ | (8.2) | $ | (25.0) | $ | 6.4 | |||||||||||
| Financing costs: | |||||||||||||||||
| Seed/Co-investment average balance | 97.0 | 143.4 | 129.5 | ||||||||||||||
| Blended interest rate* | 5.9 | % | 6.1 | % | 6.3 | % | |||||||||||
| Financing costs | 5.7 | 8.8 | (8.1) | ||||||||||||||
Net seed/co-investment (gains) losses and financing | $ | (2.5) | $ | (16.2) | $ | (1.7) | |||||||||||
* The blended rate is based first on the interest rate paid on our non-recourse seed capital facility up to the average amount drawn, and thereafter on the weighted average rate of the long-term debt.
(2)For the year ended December 31, 2020, includes $17.0 million costs relating to the impact of a one-time compensation arrangement entered into that includes advances against future compensation payments and restructuring costs which include $1.6 million costs associated with the transfer of an insurance policy from our former Parent, $9.4 million of restructuring costs at the Center and Affiliates, and the gain on sale of Affiliates of $241.3 million. For the year ended December 31, 2019, includes costs related to restructuring at the Center and the Affiliates of $6.7 million, as well as costs associated with the redomicile to the U.S. of $2.5 million. For the year ended December 31, 2018, includes the gain on sale of Heitman of $(65.7) million, a gain related to the Company’s agreement to terminate its deferred tax asset deed with OM plc of $(20.0) million, CEO transition costs of $4.8 million, comprised of $0.1 million of fixed compensation and benefits, $4.4 million of variable compensation and $0.4 million of other CEO transition costs and restructuring costs associated with its redomicile to the U.S. of $1.6 million.
78
(3)Includes an adjustments of $8.7 million and $40.8 million to remove the tax benefit resulting from the reduction in liabilities for uncertain tax positions recorded during the years ended December 31, 2020 and 2019, respectively. Includes an adjustment of $44.0 million in the year ended December 31, 2018 to remove the tax benefit resulting from the reduction in liabilities for uncertain tax positions recorded during the year, partially offset by non-taxable gains resulting from the agreement to terminate the Deferred Tax Asset Deed at a discount.
(4)Reflects the sum of line items (i), (ii), (iii), (iv) and the restructuring portion of line item (vi) taxed at the 27.3% U.S. statutory rate (including state tax). The restructuring portion of line item (vi) amounted to $(213.2) million for the year ended December 31, 2020, $9.2 million for the year ended December 31, 2019 and $(79.3) million for the year ended December 31, 2018.
The following table reconciles U.S. GAAP net income per share to economic net income per share for the years ended December 31, 2020, 2019 and 2018:
| Years ended December 31, | ||||||||||||||||||||
| ($) | 2020 | 2019 | 2018 | |||||||||||||||||
| U.S. GAAP net income per share | $ | 3.49 | $ | 2.45 | $ | 1.26 | ||||||||||||||
| Adjustments to reflect the economic earnings of the Company: | ||||||||||||||||||||
| i. | Non-cash key employee-owned equity and profit interest revaluations | (0.32) | (0.72) | 1.00 | ||||||||||||||||
| ii. | Goodwill impairment and amortization of acquired intangible assets, acquisition-related consideration and pre-acquisition employee equity | 0.36 | 0.43 | 0.72 | ||||||||||||||||
| iii. | Capital transaction costs | 0.02 | 0.04 | 0.02 | ||||||||||||||||
| iv. | Seed/Co-investment (gains) losses and financings | (0.03) | (0.18) | 0.14 | ||||||||||||||||
| v. | Tax benefit of goodwill and acquired intangibles deductions | 0.11 | 0.10 | 0.05 | ||||||||||||||||
| vi. | Discontinued operations, restructuring and the impact of a one-time compensation arrangement that includes advances against future compensation payments | (2.60) | 0.10 | (0.74) | ||||||||||||||||
| vii. | ENI tax normalization | 0.02 | (0.55) | (0.28) | ||||||||||||||||
| Tax effect of above adjustments | 0.70 | 0.09 | (0.31) | |||||||||||||||||
| Economic net income per share | $ | 1.75 | $ | 1.76 | $ | 1.86 | ||||||||||||||
Limitations of Economic Net Income
Economic net income is the key measure our management uses to evaluate the financial performance of, and make operational decisions for, our business. Economic net income is not audited, and is not a substitute for net income or other performance measures that are derived in accordance with U.S. GAAP. Furthermore, our calculation of economic net income may differ from similarly titled measures provided by other companies.
Because the calculation of economic net income excludes certain ongoing expenses, including amortization expense and certain compensation costs, it has certain material limitations and should not be viewed in isolation or as a substitute for U.S. GAAP measures of earnings.
79
ENI Revenues
The following table reconciles U.S. GAAP Revenue to ENI Revenue for the years ended December 31, 2020, 2019 and 2018:
| Years ended December 31, | |||||||||||||||||
| ($ in millions) | 2020 | 2019 | 2018 | ||||||||||||||
| U.S. GAAP Revenue | $ | 718.5 | $ | 819.5 | $ | 928.2 | |||||||||||
| Include earnings from equity-accounted Affiliate | 2.9 | 2.8 | 2.7 | ||||||||||||||
Exclude revenue from consolidated Funds attributable to non-controlling interests | (5.5) | (6.6) | (3.8) | ||||||||||||||
| Exclude Fund expenses reimbursed by customers | (4.6) | (4.4) | (8.0) | ||||||||||||||
| ENI Revenue | $ | 711.3 | $ | 811.3 | $ | 919.1 | |||||||||||
The following table identifies the components of ENI revenue:
| Years ended December 31, | |||||||||||||||||
| ($ in millions) | 2020 | 2019 | 2018 | ||||||||||||||
Management fees(1) | $ | 697.9 | $ | 807.0 | $ | 905.0 | |||||||||||
Performance fees (2) | 7.8 | (0.1) | 9.8 | ||||||||||||||
| Other income, including equity-accounted Affiliate(3) | 5.6 | 4.4 | 4.3 | ||||||||||||||
| ENI Revenue | $ | 711.3 | $ | 811.3 | $ | 919.1 | |||||||||||
(1)ENI management fees correspond to U.S. GAAP management fees.
(2)ENI performance fees correspond to U.S. GAAP performance fees.
(3)ENI other income is comprised primarily of other revenue under U.S. GAAP, plus our earnings from equity-accounted Affiliate of $2.9 million for the year ended December 31, 2020, $2.8 million for the year ended December 31, 2019 and $2.7 million for the year ended December 31, 2018. Other income also excludes certain Fund expenses initially paid by our Affiliates on the Funds’ behalf that are subsequently reimbursed. Refer to “—Non-GAAP Supplemental Performance Measure—Economic Net Income and Segment Analysis” for a full discussion regarding the items excluded from the calculation of economic net income.
| Years ended December 31, | |||||||||||||||||
| ($ in millions) | 2020 | 2019 | 2018 | ||||||||||||||
| U.S. GAAP other revenue | $ | 7.3 | $ | 6.0 | $ | 9.6 | |||||||||||
| Earnings from equity-accounted Affiliate | 2.9 | 2.8 | 2.7 | ||||||||||||||
| Exclude Fund expenses reimbursed by customers | (4.6) | (4.4) | (8.0) | ||||||||||||||
| ENI other income | $ | 5.6 | $ | 4.4 | $ | 4.3 | |||||||||||
80
ENI Operating Expenses
The largest difference between U.S. GAAP operating expense and ENI operating expense relates to compensation. As shown in the following reconciliation, the Company excludes the impact of key employee equity revaluations. We also exclude the amortization of contingent purchase price and pre-acquisition equity owned by employees, both with a service requirement, associated with the Landmark acquisition. Variable compensation and Affiliate key employee distributions are also segregated out of U.S. GAAP operating expense in order to align with the manner in which these items are contractually calculated at the Affiliate level.
The following table reconciles U.S. GAAP operating expense to ENI operating expense for the years ended December 31, 2020, 2019 and 2018:
| Years ended December 31, | |||||||||||||||||
| ($ in millions) | 2020 | 2019 | 2018 | ||||||||||||||
| U.S. GAAP operating expense | $ | 539.1 | $ | 569.2 | $ | 844.4 | |||||||||||
| Less: items excluded from economic net income | |||||||||||||||||
Amortization of acquisition-related consideration and pre-acquisition employee equity | (6.2) | (32.3) | (70.6) | ||||||||||||||
Non-cash Affiliate key employee equity and profit interest revaluations | 26.1 | 65.9 | (107.2) | ||||||||||||||
| Goodwill impairment and amortization of acquired intangible assets | (23.1) | (6.6) | (6.6) | ||||||||||||||
| Capital transaction costs | (0.2) | (2.7) | (1.6) | ||||||||||||||
Restructuring costs and the impact of a one-time compensation arrangement that includes advances against future compensation payments(1) | (28.2) | (9.2) | (6.5) | ||||||||||||||
| Fund expenses reimbursed by customers | (4.6) | (4.4) | (8.0) | ||||||||||||||
| Funds’ operating expenses | (0.3) | (0.4) | (0.9) | ||||||||||||||
| Less: items segregated out of U.S. GAAP operating expense | |||||||||||||||||
Variable compensation(2) | (159.6) | (184.7) | (230.7) | ||||||||||||||
Affiliate key employee distributions(3) | (41.5) | (53.1) | (76.6) | ||||||||||||||
| ENI operating expense | $ | 301.5 | $ | 341.7 | $ | 335.7 | |||||||||||
(1)For the year ended December 31, 2020, includes $17.0 million costs relating to the impact of a one-time compensation arrangement entered into that includes advances against future compensation payments and restructuring costs which include $1.6 million costs associated with the transfer of an insurance policy from our former Parent and $9.4 million of restructuring costs at the Center and Affiliates. For the year ended December 31, 2019, includes restructuring costs at the Center and the Affiliates of $6.7 million and costs associated with the redomicile to the U.S. of $2.5 million. For the year ended December 31, 2018, includes $1.6 million of costs associated with the redomicile to the U.S. and 2018 CEO transition costs of $4.8 million.
(2)For the year ended December 31, 2020, excludes variable compensation related to restructuring at the Center and the Affiliates of $20.8 million that is included within Restructuring costs, and Fund expenses reimbursed by customers of $0.3 million. For the year ended December 31, 2019, excludes variable compensation related to restructuring at the Center and the Affiliates of $6.7 million that is included within Restructuring costs, as well as $8.0 million variable compensation related to restructuring at an Affiliate that will be reimbursed through a reduction of Affiliate key employee distributions. For the year ended December 31, 2018, excludes variable compensation amounts related to CEO transition of $4.4 million that is included within Restructuring costs, and Fund expenses reimbursed by customers of $0.8 million.
81
(3)For the year ended December 31, 2019, includes an adjustment of $8.0 million, representing the amount of variable compensation related to restructuring at an Affiliate that will be reimbursed through a reduction in Affiliate key employee distributions.
The following table identifies the components of ENI operating expense:
| Years ended December 31, | |||||||||||||||||
| ($ in millions) | 2020 | 2019 | 2018 | ||||||||||||||
Fixed compensation & benefits(1) | $ | 173.3 | $ | 189.7 | $ | 181.4 | |||||||||||
General and administrative expenses(2) | 107.2 | 134.8 | 139.8 | ||||||||||||||
| Depreciation and amortization | 21.0 | 17.2 | 14.5 | ||||||||||||||
| ENI operating expense | $ | 301.5 | $ | 341.7 | $ | 335.7 | |||||||||||
(1)Fixed compensation and benefits include base salaries, payroll taxes and the cost of benefit programs provided. The following table reconciles U.S. GAAP compensation expense to ENI fixed compensation and benefits expense for the years ended December 31, 2020, 2019 and 2018:
| Years ended December 31, | |||||||||||||||||
| ($ in millions) | 2020 | 2019 | 2018 | ||||||||||||||
| Total U.S. GAAP compensation and benefits expense | $ | 388.7 | $ | 416.2 | $ | 696.4 | |||||||||||
Amortization of acquisition-related consideration and pre-acquisition employee equity | (6.2) | (32.3) | (70.6) | ||||||||||||||
Non-cash key employee equity and profit interest revaluations excluded from ENI | 26.1 | 65.9 | (107.2) | ||||||||||||||
Sales-based compensation reclassified to ENI general & administrative expenses | (8.8) | (11.2) | (17.4) | ||||||||||||||
| Affiliate key employee distributions | (41.5) | (53.1) | (76.6) | ||||||||||||||
Compensation related to restructuring expenses and the impact of a one-time arrangement that includes advances against future compensation payments(a) | (20.8) | (6.7) | (4.5) | ||||||||||||||
| Variable compensation | (159.6) | (184.7) | (230.7) | ||||||||||||||
| Fund expenses reimbursed by customers | (4.6) | (4.4) | (8.0) | ||||||||||||||
| ENI fixed compensation and benefits | $ | 173.3 | $ | 189.7 | $ | 181.4 | |||||||||||
(a)For the year ended December 31, 2020, includes $17.0 million costs relating to the impact of a one-time compensation arrangement entered into that includes advances against future compensation payments and $3.8 million of restructuring costs at the Center and Affiliates. For the year ended December 31, 2019, includes $6.7 million of variable compensation associated with restructuring at the Center and the Affiliates. For the year ended December 31, 2018, includes $4.5 million of compensation associated with the 2018 CEO transition, which includes $0.1 million of fixed compensation and benefits and $4.4 million of variable compensation.
(2)The following table reconciles U.S. GAAP general and administrative expense to ENI general and administrative expense:
82
| Years ended December 31, | |||||||||||||||||
| ($ in millions) | 2020 | 2019 | 2018 | ||||||||||||||
| U.S. GAAP general and administrative expense | $ | 106.0 | $ | 128.8 | $ | 126.0 | |||||||||||
| Sales-based compensation | 8.8 | 11.2 | 17.4 | ||||||||||||||
| Capital transaction costs | (0.2) | (2.7) | (1.6) | ||||||||||||||
Restructuring costs(a) | (7.3) | (2.5) | (2.0) | ||||||||||||||
| Additional ENI adjustments | (0.1) | — | — | ||||||||||||||
| ENI general and administrative expense | $ | 107.2 | $ | 134.8 | $ | 139.8 | |||||||||||
(a)Reflects $5.6 million related to restructuring at the Center and $1.6 million of costs associated with the transfer of an insurance policy from our former Parent for the year ended December 31, 2020. Reflects $2.5 million related to our redomicile to the U.S. in the year ended December 31, 2019. Reflects $1.6 million related to our redomicile to the U.S. and $0.4 million of CEO transition costs in the year ended December 31, 2018.
Key Non-GAAP Operating Metrics
The following table shows our key non-GAAP operating metrics for the years ended December 31, 2020, 2019 and 2018. We present these metrics because they are the measures our management uses to evaluate the profitability of our business and are useful to investors because they represent the key drivers and measures of economic performance within our business model. Please see the footnotes below for an explanation of each ratio, its usefulness in measuring the economics and operating performance of our business, and a reference to the most closely related U.S. GAAP measure:
| Years ended December 31, | |||||||||||||||||
| ($ in millions) | 2020 | 2019 | 2018 | ||||||||||||||
Numerator: ENI operating earnings(1) | $ | 250.2 | $ | 284.9 | $ | 352.7 | |||||||||||
Denominator: ENI revenue | $ | 711.3 | $ | 811.3 | $ | 919.1 | |||||||||||
ENI operating margin(2) | 35.2 | % | 35.1 | % | 38.4 | % | |||||||||||
Numerator: ENI operating expense | $ | 301.5 | $ | 341.7 | $ | 335.7 | |||||||||||
Denominator: ENI management fee revenue(3) | $ | 697.9 | $ | 807.0 | $ | 905.0 | |||||||||||
ENI operating expense ratio(4) | 43.2 | % | 42.3 | % | 37.1 | % | |||||||||||
Numerator: ENI variable compensation | $ | 159.6 | $ | 184.7 | $ | 230.7 | |||||||||||
Denominator: ENI earnings before variable compensation(1)(5) | $ | 409.8 | $ | 469.6 | $ | 583.4 | |||||||||||
ENI variable compensation ratio(6) | 38.9 | % | 39.3 | % | 39.5 | % | |||||||||||
Numerator: Affiliate key employee distributions | $ | 41.5 | $ | 53.1 | $ | 76.6 | |||||||||||
Denominator: ENI operating earnings(1) | $ | 250.2 | $ | 284.9 | $ | 352.7 | |||||||||||
ENI Affiliate key employee distributions ratio(7) | 16.6 | % | 18.6 | % | 21.7 | % | |||||||||||
(1)ENI operating earnings represents ENI earnings before Affiliate key employee distributions and is calculated as ENI revenue, less ENI operating expense, less ENI variable compensation. It differs from economic net income because it does not include the effects of Affiliate key employee distributions, net interest expense or income tax expense.
83
The following table reconciles U.S. GAAP operating income (loss) to ENI operating earnings:
| Years ended December 31, | |||||||||||||||||
| ($ in millions) | 2020 | 2019 | 2018 | ||||||||||||||
| U.S. GAAP operating income | $ | 179.4 | $ | 250.3 | $ | 83.8 | |||||||||||
| Include earnings from equity-accounted Affiliate | 2.9 | 2.8 | 2.7 | ||||||||||||||
Exclude the impact of: | |||||||||||||||||
Affiliate key employee-owned equity and profit interest revaluations | (26.1) | (65.9) | 107.2 | ||||||||||||||
| Goodwill impairment and the amortization of acquired intangible assets, acquisition-related consideration | 29.3 | 38.9 | 77.2 | ||||||||||||||
Capital transaction costs | 0.2 | 2.7 | 1.6 | ||||||||||||||
Restructuring costs and the impact of a one-time compensation arrangement that includes advances against future compensation payments(a) | 28.2 | 9.2 | 6.5 | ||||||||||||||
| Affiliate key employee distributions | 41.5 | 53.1 | 76.6 | ||||||||||||||
Variable compensation | 159.6 | 184.7 | 230.7 | ||||||||||||||
| Funds’ operating income | (5.2) | (6.2) | (2.9) | ||||||||||||||
ENI earnings before variable compensation | 409.8 | 469.6 | 583.4 | ||||||||||||||
| Less: ENI variable compensation | (159.6) | (184.7) | (230.7) | ||||||||||||||
| ENI operating earnings | 250.2 | 284.9 | 352.7 | ||||||||||||||
| Less: ENI Affiliate key employee distributions | (41.5) | (53.1) | (76.6) | ||||||||||||||
ENI earnings after Affiliate key employee distributions | $ | 208.7 | $ | 231.8 | $ | 276.1 | |||||||||||
(a)For the year ended December 31, 2020, includes $17.0 million related to the impact of a one-time compensation arrangement entered into that includes advances against future compensation payments, restructuring costs of $1.6 million associated with the transfer of an insurance policy from our former Parent and $9.4 million of restructuring costs at the Center and Affiliates. For the year ended December 31, 2019, includes $6.7 million of restructuring costs at the Center and the Affiliates and $2.5 million of costs incurred in connection with the redomicile to the U.S. For the year ended December 31, 2018. includes $4.8 million related to 2018 CEO transition costs and $1.6 million of costs incurred in connection with the redomicile to the U.S.
(2)The ENI operating margin, which is calculated before Affiliate key employee distributions, is used by management and is useful to investors to evaluate the overall operating margin of the business without regard to our various ownership levels at each of the Affiliates. The ENI operating margin is most comparable to our U.S. GAAP operating margin (excluding the effect of consolidated Funds) of 24.4% for the year ended December 31, 2020, 30.0% for the year ended December 31, 2019 and 8.8% for the year ended December 31, 2018.
The ENI operating margin is important because it gives investors an understanding of the profitability of the total business relative to revenue, irrespective of the ownership position which BSIG has in each of its Affiliates. Management and investors use this ratio when comparing our profitability relative to our peer group and evaluating our ability to manage the cost structure and profitability of our business under different operating environments.
(3)ENI Management fee revenue corresponds to U.S. GAAP management fee revenue.
84
(4)The ENI operating expense ratio is used by management and is useful to investors to evaluate the level of operating expense as measured against our recurring management fee revenue. We have provided this ratio since many operating expenses, including fixed compensation and benefits and general and administrative expense, are generally linked to the overall size of the business. We track this ratio as a key measure of scale economies at BSIG because in our profit sharing economic model, scale benefits both the Affiliate employees and BSIG stockholders. The ENI operating expense ratio is most comparable to the U.S. GAAP operating expense / management fee revenue ratio.
(5)ENI earnings before variable compensation is calculated as ENI revenue, less ENI operating expense.
(6)The ENI variable compensation ratio is used by management and is useful to investors to evaluate consolidated variable compensation as measured against our ENI earnings before variable compensation. Variable compensation is contractually set and calculated individually at each Affiliate, plus Center bonuses. Variable compensation is usually awarded based on a contractual percentage of each Affiliate’s ENI earnings before variable compensation and may be paid in the form of cash or non-cash Affiliate equity or profit interests. Center variable compensation includes cash and BSIG equity. Non-cash variable compensation awards typically vest over several years and are recognized as compensation expense over that service period. The variable compensation ratio at each Affiliate, calculated as variable compensation divided by ENI earnings before variable compensation, will typically be between 25% and 35%. The ENI variable compensation ratio is most comparable to the U.S. GAAP variable compensation ratio.
(7)The ENI Affiliate key employee distribution ratio is used by management and is useful to investors to evaluate Affiliate key employee distributions as measured against our ENI operating earnings. Affiliate key employee distributions represent the share of Affiliate profits after variable compensation that is attributable to Affiliate key employee equity and profit interests holders, according to their ownership interests. The Affiliate key employee distribution ratio at each Affiliate is calculated as Affiliate key employee distributions divided by ENI operating earnings at that Affiliate. At certain Affiliates with tiered equity structures, BSUS and other classes of employee equity holders are entitled to an initial proportionate preference over profits after variable compensation, structured such that before a preference threshold is reached, there would be no required key employee distributions to the tiered equity holders, whereas for profits above the threshold the key employee distribution amount to the tiered equity holders would be calculated based on the tiered key employee ownership percentages. Based on current economic arrangements, employee distributions range from approximately 20% to 40% of marginal ENI operating earnings at each of our consolidated Affiliates. The ENI Affiliate key employee distributions ratio is most comparable to the U.S. GAAP Affiliate key employee distributions ratio.
85
Tax on Economic Net Income
The following table reconciles the United States statutory tax to tax on economic net income:
| Years ended December 31, | |||||||||||||||||
| ($ in millions) | 2020 | 2019 | 2018 | ||||||||||||||
Pre-tax economic net income(1) | $ | 187.1 | $ | 210.8 | $ | 262.5 | |||||||||||
| Intercompany interest expense deductible for U.S. tax purposes | — | (35.5) | (75.4) | ||||||||||||||
| Taxable economic net income | 187.1 | 175.3 | 187.1 | ||||||||||||||
Taxes at the U.S. federal and state statutory rates(2) | (51.1) | (47.9) | (51.1) | ||||||||||||||
| Other reconciling tax adjustments | 7.6 | (2.1) | (11.6) | ||||||||||||||
| Tax on economic net income | (43.5) | (50.0) | (62.7) | ||||||||||||||
Add back intercompany interest expense previously excluded | — | 35.5 | 75.4 | ||||||||||||||
| Economic net income | $ | 143.6 | $ | 160.8 | $ | 199.8 | |||||||||||
Economic net income effective tax rate(3) | 23.2 | % | 23.7 | % | 23.9 | % | |||||||||||
(1)Includes interest income and third party ENI interest expense, as shown in the following table:
| Years ended December 31, | |||||||||||||||||
| ($ in millions) | 2020 | 2019 | 2018 | ||||||||||||||
| U.S. GAAP interest income | $ | 0.6 | $ | 2.2 | $ | 3.2 | |||||||||||
| U.S. GAAP interest expense | (28.5) | (32.2) | (24.9) | ||||||||||||||
| U.S. GAAP net interest expense | (27.9) | (30.0) | (21.7) | ||||||||||||||
Other ENI interest expense exclusions(a) | 6.3 | 9.0 | 8.1 | ||||||||||||||
| ENI net interest income (expense) | (21.6) | (21.0) | (13.6) | ||||||||||||||
ENI earnings after Affiliate key employee distributions(b) | 208.7 | 231.8 | 276.1 | ||||||||||||||
Pre-tax economic net income | $ | 187.1 | $ | 210.8 | $ | 262.5 | |||||||||||
(a)Other ENI interest expense exclusions represent cost of financing on seed capital and co-investments and amortization of debt issuance costs. Other ENI interest expense includes $5.7 million related to the cost of seed and co-investment financing and $0.6 million related to the amortization of debt issuance costs for the year ended December 31, 2020.
(b)ENI earnings after Affiliate key employee distributions is calculated as ENI operating income (ENI revenue, less ENI operating expense, less ENI variable compensation), less Affiliate key employee distributions. Refer to “—Key Non-GAAP Operating Metrics” for a reconciliation from U.S. GAAP operating income to ENI earnings after Affiliate key employee distributions.
(2)Taxed at U.S. Federal and State statutory rate of 27.3%.
(3)The economic net income effective tax rate is calculated by dividing the tax on economic net income by pre-tax economic net income.
86
Segment Analysis
We conduct our operations through three business segments:
•Quant & Solutions—comprised of versatile, often highly-tailored strategies that leverage data and technology in a computational, factor based investment process across a range of asset classes and geographies, including Global, non-U.S., and emerging markets equities, as well as multi-asset and managed volatility products.
•Alternatives—comprised of illiquid and differentiated liquid investment strategies that include private equity, real estate and real assets, including forestry, as well as a growing suite of liquid alternative capabilities in areas such as long/short, market neutral and absolute return.
•Liquid Alpha—comprised of specialized investment strategies with a focus on alpha-generation across market cycles in long-only small-, mid-, and large-cap U.S. and non-U.S. equities, as well as fixed income.
We have a corporate head office that is included in “Other”. The corporate head office supports the segments by providing infrastructure and administrative support in the areas of accounting/finance, operations, information technology, strategy and relationship management, legal, compliance and human resources. The corporate head office expenses are not allocated to the Company’s three reportable segments but the CODM does consider the cost structure of the corporate head office when evaluating the financial performance of the segments.
The primary measure used by the CODM in measuring performance and allocating resources to the segments is Economic Net Income ("ENI"). We define economic net income for the segments as ENI revenue less (i) ENI operating expenses, (ii) variable compensation and (iii) key employee distributions. The ENI adjustments to U.S. GAAP include both reclassifications of U.S. GAAP revenue and expense items, as well as adjustments to U.S. GAAP results, primarily to exclude non-cash, non-economic expenses, or to reflect cash benefits not recognized under U.S. GAAP.
ENI revenue includes management fees, performance fees and other revenue under U.S. GAAP, adjusted to include management fees paid to Affiliates by consolidated Funds and the Company’s share of earnings from equity-accounted Affiliates. ENI revenue is also adjusted to exclude the separate revenues recorded under U.S. GAAP for certain Fund expenses reimbursed to our Affiliates.
ENI operating expenses include compensation and benefits, general and administrative expense, and depreciation and amortization under U.S. GAAP, adjusted to exclude non-cash expenses representing changes in the value of Affiliate equity and profit interests held by Affiliate key employees, non-cash amortization of acquisition-related contingent consideration, as well as the value of employee equity owned pre-acquisition that occurred as a result of the Landmark transaction, goodwill impairment and amortization of acquired intangible assets, capital transaction costs, restructuring costs, the impact of a one-time compensation arrangement entered into that includes advances against future compensation payments, and the separate expenses recorded under U.S. GAAP for certain Fund expenses reimbursed to our Affiliates. Additionally, variable compensation and Affiliate key employee distributions are segregated from ENI operating expenses.
ENI segment results are also adjusted to exclude the portion of consolidated Fund revenues, expenses and investment return recorded under U.S. GAAP.
Refer to the reconciliations of U.S. GAAP revenue to ENI revenue, U.S. GAAP Operating expense to ENI Operating expense, variable compensation and Affiliate key employee distributions disclosed previously within this section.
87
Segment ENI Revenue
The following tables identify the components of segment ENI revenue for the years ended December 31, 2020, 2019 and 2018:
| Years ended December 31, | |||||||||||||||||||||||||||||||||||||||||||||||||||||||||||
| ($ in millions) | 2020 | 2019 | |||||||||||||||||||||||||||||||||||||||||||||||||||||||||
| Quant & Solutions | Alter-natives | Liquid Alpha | Other | Total | Quant & Solutions | Alter-natives | Liquid Alpha | Other | Total | ||||||||||||||||||||||||||||||||||||||||||||||||||
| Management fees | $ | 346.8 | $ | 170.6 | $ | 180.5 | $ | — | $ | 697.9 | $ | 370.8 | $ | 165.0 | $ | 271.2 | $ | — | $ | 807.0 | |||||||||||||||||||||||||||||||||||||||
Performance fees | 8.0 | — | (0.2) | — | 7.8 | 9.8 | 0.3 | (10.2) | — | (0.1) | |||||||||||||||||||||||||||||||||||||||||||||||||
| Other income, including equity-accounted subsidiary | — | 2.2 | 3.0 | 0.4 | 5.6 | — | 1.2 | 2.8 | 0.4 | 4.4 | |||||||||||||||||||||||||||||||||||||||||||||||||
| ENI revenue | $ | 354.8 | $ | 172.8 | $ | 183.3 | $ | 0.4 | $ | 711.3 | $ | 380.6 | $ | 166.5 | $ | 263.8 | $ | 0.4 | $ | 811.3 | |||||||||||||||||||||||||||||||||||||||
| Year ended December 31, | |||||||||||||||||||||||||||||
| ($ in millions) | 2018 | ||||||||||||||||||||||||||||
| Quant & Solutions | Alternatives | Liquid Alpha | Other | Total | |||||||||||||||||||||||||
| Management fees | $ | 377.4 | $ | 208.3 | $ | 319.3 | $ | — | $ | 905.0 | |||||||||||||||||||
Performance fees | 11.6 | 8.5 | (10.3) | — | 9.8 | ||||||||||||||||||||||||
| Other income, including equity-accounted subsidiary | — | 1.3 | 2.6 | 0.4 | 4.3 | ||||||||||||||||||||||||
| ENI revenue | $ | 389.0 | $ | 218.1 | $ | 311.6 | $ | 0.4 | $ | 919.1 | |||||||||||||||||||
Quant & Solutions Segment ENI Revenue
Year ended December 31, 2020 compared to year ended December 31, 2019: Quant & Solutions ENI revenue decreased $(25.8) million, or (6.8)%, from $380.6 million for the year ended December 31, 2019 to $354.8 million for the year ended December 31, 2020. The decrease was attributable to (6.5)% lower management fees driven by lower average AUM primarily resulting from the equity market decline in the first quarter of 2020.
Year ended December 31, 2019 compared to year ended December 31, 2018: Quant & Solutions ENI revenue decreased $(8.4) million, or (2.2)%, from $389.0 million for the year ended December 31, 2018 to $380.6 million for the year ended December 31, 2019. The decrease was attributable to (1.7)% lower management fees, driven by lower average AUM resulting from the fourth quarter 2018 non-U.S. equity market depreciation and (15.5)% lower performance fees driven by underperformance in value-tilted global and non-U.S. strategies in the year ended December 31, 2019.
88
Alternatives Segment ENI Revenue
Year ended December 31, 2020 compared to year ended December 31, 2019: Alternatives ENI revenue increased $6.3 million, or 3.8%, from $166.5 million for the year ended December 31, 2019 to $172.8 million for the year ended December 31, 2020. The increase was attributable to 3.4% higher management fees resulting from inflows and change in net catch-up fees.
Year ended December 31, 2019 compared to year ended December 31, 2018: Alternatives ENI revenue decreased $(51.6) million, or (23.7)%, from $218.1 million for the year ended December 31, 2018 to $166.5 million for the year ended December 31, 2019. The decrease was attributable to (20.8)% lower management fees mainly resulting from placement agent fees paid in 2019, and (96.5)% lower performance fees during the year ended December 31, 2019 due to the real assets strategy as the valuation for certain properties increased in the year ended December 31, 2018, but stayed generally flat in the year ended December 31, 2019.
Liquid Alpha Segment ENI Revenue
Year ended December 31, 2020 compared to year ended December 31, 2019: Liquid Alpha ENI revenue decreased $(80.5) million, or (30.5)%, from $263.8 million for the year ended December 31, 2019 to $183.3 million for the year ended December 31, 2020. The decrease was attributable to (33.4)% lower management fees driven by lower average AUM resulting from the disposition of Copper Rock and Barrow Hanley, equity market decline in the first quarter of 2020, and net outflows over the last twelve months. The change in performance fees was primarily due to fulcrum fees recorded in the year ended December 31, 2019 that did not repeat in the year ended December 31, 2020.
Year ended December 31, 2019 compared to year ended December 31, 2018: Liquid Alpha ENI revenue decreased $(47.8) million, or (15.3)%, from $311.6 million for the year ended December 31, 2018 to $263.8 million for the year ended December 31, 2019. The decrease was attributable to (15.1)% lower management fees driven by fourth quarter 2018 equity market decline and net outflows in 2019. Performance fees were relatively flat for the year ended December 31, 2019 compared to the year ended December 31, 2018.
89
Segment ENI Expense
The following tables identify the components of segment ENI expense for the years ended December 31, 2020, 2019 and 2018:
| Years ended December 31, | |||||||||||||||||||||||||||||||||||||||||||||||||||||||||||
| ($ in millions) | 2020 | 2019 | |||||||||||||||||||||||||||||||||||||||||||||||||||||||||
| Quant & Solutions | Alter-natives | Liquid Alpha | Other | Total | Quant & Solutions | Alter-natives | Liquid Alpha | Other | Total | ||||||||||||||||||||||||||||||||||||||||||||||||||
Fixed compensation & benefits | $ | 73.7 | $ | 45.7 | $ | 43.1 | $ | 10.8 | $ | 173.3 | $ | 79.4 | $ | 44.4 | $ | 50.3 | $ | 15.6 | $ | 189.7 | |||||||||||||||||||||||||||||||||||||||
General and administrative expense | 56.9 | 17.2 | 19.9 | 13.2 | 107.2 | 66.0 | 21.5 | 27.9 | 19.4 | 134.8 | |||||||||||||||||||||||||||||||||||||||||||||||||
Depreciation and amortization | 18.4 | 1.7 | 0.5 | 0.4 | 21.0 | 15.2 | 1.0 | 0.6 | 0.4 | 17.2 | |||||||||||||||||||||||||||||||||||||||||||||||||
Total ENI Operating Expenses | $ | 149.0 | $ | 64.6 | $ | 63.5 | $ | 24.4 | $ | 301.5 | $ | 160.6 | $ | 66.9 | $ | 78.8 | $ | 35.4 | $ | 341.7 | |||||||||||||||||||||||||||||||||||||||
Variable compensation | 72.8 | 39.2 | 44.0 | 3.6 | 159.6 | 75.6 | 36.7 | 62.4 | 10.0 | 184.7 | |||||||||||||||||||||||||||||||||||||||||||||||||
Affiliate key employee distributions | 4.3 | 25.1 | 12.1 | — | 41.5 | 6.4 | 23.0 | 23.7 | — | 53.1 | |||||||||||||||||||||||||||||||||||||||||||||||||
| Total Expenses | $ | 226.1 | $ | 128.9 | $ | 119.6 | $ | 28.0 | $ | 502.6 | $ | 242.6 | $ | 126.6 | $ | 164.9 | $ | 45.4 | $ | 579.5 | |||||||||||||||||||||||||||||||||||||||
| Year ended December 31, | |||||||||||||||||||||||||||||
| ($ in millions) | 2018 | ||||||||||||||||||||||||||||
| Quant & Solutions | Alternatives | Liquid Alpha | Other | Total | |||||||||||||||||||||||||
Fixed compensation & benefits | $ | 72.8 | $ | 38.1 | $ | 51.2 | $ | 19.3 | $ | 181.4 | |||||||||||||||||||
General and administrative expense | 60.9 | 22.8 | 32.6 | 23.5 | 139.8 | ||||||||||||||||||||||||
Depreciation and amortization | 12.6 | 0.9 | 0.7 | 0.3 | 14.5 | ||||||||||||||||||||||||
Total ENI Operating Expenses | $ | 146.3 | $ | 61.8 | $ | 84.5 | $ | 43.1 | $ | 335.7 | |||||||||||||||||||
Variable compensation | 86.2 | 58.9 | 73.9 | 11.7 | 230.7 | ||||||||||||||||||||||||
Affiliate key employee distributions | 9.5 | 34.1 | 33.0 | — | 76.6 | ||||||||||||||||||||||||
| Total Expenses | $ | 242.0 | $ | 154.8 | $ | 191.4 | $ | 54.8 | $ | 643.0 | |||||||||||||||||||
90
Quant & Solutions Segment ENI Expense
Year ended December 31, 2020 compared to year ended December 31, 2019: Quant & Solutions ENI operating expense decreased $(11.6) million, or (7.2)%, from $160.6 million for the year ended December 31, 2019 to $149.0 million for the year ended December 31, 2020. The decrease was driven by (7.2)% lower ENI fixed compensation and benefits expense resulting from headcount reduction and (13.8)% lower ENI general and administrative expense such as travel reflecting the impact of COVID-19 and cost-saving initiatives. Quant & Solutions ENI variable compensation expense, which is based on contractual arrangements, decreased (3.7)% as a result of lower earnings before variable compensation. Affiliate key employee distributions attributable to Quant & Solutions decreased (32.8)%, primarily due to lower Quant & Solutions ENI earnings after variable compensation.
Year ended December 31, 2019 compared to year ended December 31, 2018: Quant & Solutions ENI operating expense increased $14.3 million, or 9.8%, from $146.3 million for the year ended December 31, 2018 to $160.6 million for the year ended December 31, 2019. The increase was driven by 9.1% higher ENI fixed compensation and benefits expense resulting from new hires for initiatives and annual cost of living increases, and 8.4% higher ENI general and administrative expense resulting from new initiatives and additional system costs. Quant & Solutions ENI variable compensation expense, which is based on contractual arrangements, decreased (12.3)%, as a result of lower pre-variable compensation earnings. Affiliate key employee distributions attributable to Quant & Solutions decreased (32.6)%, largely driven by levered distribution structures.
Alternatives Segment ENI Expense
Year ended December 31, 2020 compared to year ended December 31, 2019: Alternatives ENI operating expense decreased $(2.3) million, or (3.4)%, from $66.9 million for the year ended December 31, 2019 to $64.6 million for the year ended December 31, 2020. The decrease was driven by (20.0)% lower ENI general and administrative expenses such as travel reflecting the impact of the COVID-19 pandemic. Alternatives ENI variable compensation expense, which is based on contractual arrangements, increased 6.8% as a result of higher earnings before variable compensation. Affiliate key employee distributions attributable to Alternatives increased 9.1%, primarily driven by higher Alternatives ENI earnings after variable compensation.
Year ended December 31, 2019 compared to year ended December 31, 2018: Alternatives ENI operating expense increased $5.1 million, or 8.3%, from $61.8 million for the year ended December 31, 2018 to $66.9 million for the year ended December 31, 2019. The increase was driven by 16.5% higher ENI fixed compensation and benefits expense resulting from new hires and annual cost of living increases. Alternatives ENI variable compensation expense, which is based on contractual arrangements, decreased (37.7)%, as a result of lower earnings before variable compensation. Affiliate key employee distributions attributable to Alternatives decreased (32.6)%, largely driven by lower profit after variable compensation.
91
Liquid Alpha Segment ENI Expense
Year ended December 31, 2020 compared to year ended December 31, 2019: Liquid Alpha ENI operating expense decreased $(15.3) million, or (19.4)%, from $78.8 million for the year ended December 31, 2019 to $63.5 million for the year ended December 31, 2020. The decrease was driven by (14.3)% lower ENI fixed compensation and benefits expense and (28.7)% lower ENI general and administrative expense driven by the Barrow Hanley and Copper Rock dispositions. Liquid Alpha ENI variable compensation expense, which is based on contractual arrangements, decreased (29.5)%, as a result of lower pre-variable compensation earnings. Affiliate key employee distributions attributable to Liquid Alpha decreased (48.9)%, primarily driven by dispositions and lower Liquid Alpha ENI earnings after variable compensation.
Year ended December 31, 2019 compared to year ended December 31, 2018: Liquid Alpha ENI operating expense decreased $(5.7) million, or (6.7)%, from $84.5 million for the year ended December 31, 2018 to $78.8 million for the year ended December 31, 2019. The decrease was driven by (1.8)% lower ENI fixed compensation and benefits expense resulting from headcount reduction and (14.4)% lower ENI general and administrative expense mainly resulting from lower commissions and other general expenses. Liquid Alpha ENI variable compensation expense, which is based on contractual arrangements, decreased (15.6)%, as a result of lower pre-variable compensation earnings. Affiliate key employee distributions attributable to Liquid Alpha decreased (28.2)%, largely driven by lower profit after variable compensation.
Other ENI Expense
Year ended December 31, 2020 compared to year ended December 31, 2019: Other ENI operating expense decreased $(11.0) million or (31.1)%, from $35.4 million for the year ended December 31, 2019 to $24.4 million for the year ended December 31, 2020. The decrease was driven by (30.8)% lower ENI fixed compensation and benefits expense resulting from a reduction in headcount and (32.0)% lower ENI general and administrative expense resulting from cost-saving initiatives. Other ENI variable compensation expense decreased (64.0)% due to a reduction in headcount.
Year ended December 31, 2019 compared to year ended December 31, 2018: Other ENI operating expense decreased $(7.7) million, or (17.9)%, from $43.1 million for the year ended December 31, 2018 to $35.4 million for the year ended December 31, 2019. The decrease was driven by (19.2)% lower fixed compensation and benefit expense resulting from a reduction in headcount, and (17.4)% lower general and administrative expense resulting from cost-saving initiatives. Other ENI variable compensation expense decreased (14.5)% which was driven by a reduction in headcount.
Capital Resources and Liquidity
Cash Flows
The following table summarizes certain key financial data relating to cash flows. All amounts presented exclude consolidated Funds:
| Years ended December 31, | |||||||||||||||||
| ($ in millions) | 2020 | 2019 | 2018 | ||||||||||||||
Cash provided by (used in)(1)(2) | |||||||||||||||||
| Operating activities | $ | 165.8 | $ | (106.6) | $ | 252.3 | |||||||||||
| Investing activities | 358.6 | 17.7 | 57.6 | ||||||||||||||
| Financing activities | (232.2) | (140.4) | (155.6) | ||||||||||||||
(1)Excludes consolidated Funds.
(2)Cash flow data shown only includes cash flows from continuing operations.
92
Our most significant uses of cash include repayment of third-party borrowings, third-party interest payments, repurchases of shares, payments made to OM plc under the Deferred Tax Asset Deed, seed capital investments, dividends and compensation and general and administrative expenses.
Comparison for the Years Ended December 31, 2020, 2019 and 2018
Net cash (used in) provided by operating activities of continuing operations excluding consolidated Funds increased $272.4 million, or 255.5%, from $(106.6) million used in the year ended December 31, 2019 to $165.8 million provided by the year ended December 31, 2020. The increase was primarily driven by a decrease in operating liabilities as a result of the Landmark earnout that was settled in the year ended December 31, 2019.
Net cash provided by operating activities of continuing operations excluding consolidated Funds decreased $(358.9) million, from $252.3 million for the year ended December 31, 2018 to $(106.6) million for the year ended December 31, 2019. The decrease was primarily driven by a decrease in operating liabilities as a result of the Landmark earnout that was settled in the year ended December 31, 2019.
Net cash provided by investing activities was $358.6 million, $17.7 million and $57.6 million for the years ended December 31, 2020, 2019 and 2018, respectively. Net cash (used in) received from the (purchase) and sale of investments was $90.6 million, $46.6 million and $(25.7) million for the years ended December 31, 2020, 2019 and 2018, respectively. Fluctuations are principally due to the timing of investments or redemptions of seed capital as well as acquisitions or disposals of real estate and forestry assets in which we are co-investing. Net cash used in the purchase of fixed assets was $(27.2) million, $(33.9) million and $(21.7) million for the years ended December 31, 2020, 2019 and 2018, respectively. Proceeds received from the sale of investments in Affiliates was $295.2 million, $5.0 million and $105.0 million for the years ended December 31, 2020, 2019 and 2018, respectively.
Net cash used in financing activities, excluding consolidated Funds, consists of share repurchases, payments made to OM plc, third-party borrowings and dividends paid. Cash used in financing activities was $(232.2) million, $(140.4) million and $(155.6) million for the years ended December 31, 2020, 2019 and 2018, respectively. We paid down $(175.0) million against third party borrowings in 2020, we drew net $175.0 million against third party borrowings in 2019 and we paid down $(33.5) million against third party borrowings in 2018. In 2020 we made payments of $(0.3) million against amounts previously owed to OM plc for the co-investment arrangement, funded $(46.0) million for share repurchases and paid out $(10.9) million in dividends. In 2019 we made payments of $(37.8) million against amounts previously owed to OM plc for the DTA deed and co-investment arrangement, funded $(239.8) million for share repurchases, and paid out $(36.0) million in dividends. In 2018 we paid $(3.9) million against amounts previously owed to OM plc, funded $(71.2) million for share repurchases and paid out $(42.5) million in dividends.
93
Working Capital and Long-Term Debt
The following table summarizes certain key financial data relating to our capital resources and liquid net assets. All amounts presented exclude the non-controlling interest portion of consolidated Funds:
| Years ended December 31, | |||||||||||||||||
| ($ in millions) | 2020 | 2019 | 2018 | ||||||||||||||
Balance Sheet Data(1) | |||||||||||||||||
| Current assets | |||||||||||||||||
| Cash and cash equivalents | $ | 401.9 | $ | 111.3 | $ | 340.6 | |||||||||||
| Investment advisory fees receivable | 112.8 | 151.9 | 159.1 | ||||||||||||||
| Investments | 70.3 | 124.7 | 125.7 | ||||||||||||||
| Total current assets | 585.0 | 387.9 | 625.4 | ||||||||||||||
| Current liabilities | |||||||||||||||||
| Accounts payable and accrued expenses | 33.5 | 41.5 | 54.3 | ||||||||||||||
| Accrued short-term incentive compensation | 120.8 | 137.8 | 171.0 | ||||||||||||||
Other short-term liabilities(2) | 20.3 | 3.7 | 232.8 | ||||||||||||||
| Total current liabilities | 174.6 | 183.0 | 458.1 | ||||||||||||||
| Working Capital | $ | 410.4 | $ | 204.9 | $ | 167.3 | |||||||||||
| Long-term notes payable and other debt | $ | 394.3 | $ | 568.8 | $ | 393.3 | |||||||||||
(1)Excludes the non-controlling interest portion of consolidated Funds.
(2)Excluded from other short-term liabilities for each of the years presented is an income tax reserve relating to net operating losses that does not represent a current obligation of the Company. Puts related to Affiliate equity and profits interests are also excluded on a short-term basis because they are funded through recycling.
Working capital is defined as current assets less current liabilities, excluding the non-controlling interest portion of consolidated Funds. Our net working capital has been positive over the past several years and was $410.4 million at December 31, 2020. Our most significant current liabilities have been accounts payable and accrued compensation expense. Accrued compensation expense has primarily consisted of variable compensation accruals made throughout the year based on contractual arrangements. Our cash management practices generally require that working capital be maintained at each Affiliate at a sufficient level to meet short-term operational needs. Periodic distributions of Affiliate earnings to BSUS and Affiliate key employee equity holders are made according to respective Affiliate distribution policies, with BSUS having the ability to access any surplus cash at each Affiliate as necessary during interim periods.
94
Borrowings and Long-Term Debt
The following table summarizes our financing arrangements as of the dates indicated:
| Amounts outstanding at | |||||||||||||||||||||||
| ($ in millions) | December 31, 2020 | December 31, 2019 | Interest rate | Maturity | |||||||||||||||||||
| Third party borrowings: | |||||||||||||||||||||||
Revolving credit facility(1) | $ | — | $ | 140.0 | LIBOR + 1.50% plus 0.20% commitment fee | August 22, 2022 | |||||||||||||||||
| 4.80% Senior Notes Due 2026 | 272.8 | 272.4 | 4.80% | July 27, 2026 | |||||||||||||||||||
| 5.125% Senior Notes Due 2031 | 121.5 | 121.4 | 5.125% | August 1, 2031 | |||||||||||||||||||
Total third party borrowings | $ | 394.3 | $ | 533.8 | |||||||||||||||||||
Non-recourse borrowing: | |||||||||||||||||||||||
Non-recourse seed capital facility(2) | — | 35.0 | LIBOR + 1.55% plus 0.95% commitment fee | N/A | |||||||||||||||||||
| Total non-recourse borrowing | $ | — | $ | 35.0 | |||||||||||||||||||
| Total borrowings | $ | 394.3 | $ | 568.8 | |||||||||||||||||||
(1)An amendment to the $450 million revolving credit facility was made on November 17, 2020 to reduce the revolving credit facility to $150 million upon consummation of the sale of the Company's equity interests in Barrow Hanley.
(2)We paid down and terminated the non-recourse seed capital facility in the third quarter that was set to expire on January 15, 2021.
Third party borrowings
Revolving Credit Facility
On August 20, 2019, we entered into a $450.0 million senior unsecured revolving credit facility with Citibank, as administrative agent and issuing bank, and RBC Capital Markets and BMO Capital Markets Corp. as joint lead arrangers and joint book runners. The previous revolving credit facility with Citibank with maturity date of October 15, 2019 was terminated.
On September 3, 2020, we along with the Royal Bank of Canada, BMO Harris Bank, N.A., Bank of China, New York Branch, Wells Fargo Bank, National Association, Barclays Bank PLC, Morgan Stanley Bank, N.A., Bank of America N.A., the Bank of New York Mellon and Citibank, N.A., as an issuing bank and administrative agent (collectively, the “Lenders”), entered into an amendment (the “Amendment”) to the revolving credit agreement dated as of August 20, 2019 (the “Original Credit Agreement”, and as amended by the Amendment, the “Amended Credit Agreement”). The Amendment included changes to the Original Credit Agreement to permit the sale of the Company's equity interests in Barrow Hanley (the “Barrow Hanley Sale”). Under the Original Credit Agreement, the Barrow Hanley Sale required consent of the Lenders’ given that Barrow Hanley accounted for more than 10% of our consolidated Adjusted EBITDA. The Amendment provided that, effective immediately upon the consummation of the Barrow Hanley Sale, the Lenders’ commitments under the Amended Credit Agreement would be $150 million. The Barrow Hanley Sale was consummated on November 17, 2020 and the Lenders’ commitments under the Amended Credit Agreement were reduced to $150 million from thereon.
Under the Amended Credit Agreement, the ratio of third-party borrowings to trailing twelve months Adjusted EBITDA, as defined by the Amended Credit Agreement cannot exceed 3.0x, and the interest coverage ratio must not be less than 4.0x. Adjusted EBITDA defined by the Amended Credit Agreement represents Adjusted EBITDA, as defined in the “—Supplemental Liquidity Measure—Adjusted EBITDA” section below, adjusted for the pro forma
95
effect of acquisitions and dispositions. At December 31, 2020, our ratio of third-party borrowings to trailing twelve months Adjusted EBITDA as defined by the Amended Credit Agreement was 2.0x and our interest coverage ratio was 7.1x.
On February 23, 2021, we along with the Lenders, entered into an assignment and assumption and amendment agreement (the “Assignment”) to the Amended Credit Agreement. Pursuant to the Assignment, the Amended Credit Agreement was assigned to and assumed by Acadian and the Amended Credit Agreement was amended (the Amended Credit Agreement, as amended by the Assignment, the “Acadian Credit Agreement”) to, among other things, reduce the Lenders’ commitments thereunder to $125 million. The Acadian Credit Agreement has a maturity date of August 22, 2022.
Borrowings under the Acadian Credit Agreement bear interest, at Acadian’s option, at either the per annum rate equal to (a) the greatest of (i) the prime rate, (ii) the federal funds effective rate plus 0.5% and (iii) the one month Adjusted LIBO Rate plus 1.0%, plus, in each case an additional amount based on its credit rating or (b) the London interbank offered rate for a period, at our, equal to one, three or six months plus an additional amount ranging from 1.5% to 2.0%, with such additional amount based on Acadian’s Leverage Ratio (as defined below). In addition, Acadian is charged a commitment fee based on the average daily unused portion of the revolving credit facility under the Acadian Credit Agreement at a per annum rate ranging from 0.25% to 0.375%, with such amount based on Acadian’s Leverage Ratio.
Under the Acadian Credit Agreement, the ratio of Acadian’s third-party borrowings to Acadian’s trailing twelve months Adjusted EBITDA, as defined by the Acadian Credit Agreement (the “Leverage Ratio”), cannot exceed 2.5x.
Senior Notes
In July 2016, we issued $275.0 million of 4.80% Senior Notes due 2026 (the “2026 Notes”) and $125.0 million of 5.125% Senior Notes due 2031 (the “2031 Notes”). We used the net proceeds of these offerings to finance the acquisition of Landmark in August 2016, purchase seed capital from OM plc, settle a Treasury rate lock contract and pay down the balance of the previous revolving credit facility.
4.80% Senior Notes Due July 2026
The $275.0 million 2026 Notes were sold at a discount of $(0.5) million and we incurred debt issuance costs of $(3.0) million, which are being amortized to interest expense over the ten-year term. The 2026 Notes can be redeemed at any time prior to the scheduled maturity in part or in aggregate, at the greater of 100% of the principal amount at that time or the sum of the remaining scheduled payments discounted at the treasury rate (as defined) plus 0.5%, together with any related accrued and unpaid interest.
5.125% Senior Notes Due August 2031
The $125.0 million 2031 Notes incurred debt issuance costs of $(4.3) million, which are being amortized to interest expense over the fifteen-year term. The 2031 Notes can be redeemed at any time, on or after August 1, 2019, at a redemption price equal to 100.0% of the principal amount together with any related accrued and unpaid interest.
Non-recourse seed capital facility
In July 2017, we entered into a non-recourse seed capital facility collateralized by our seed capital holdings and could borrow up to $65.0 million, so long as the borrowing did not represent more than 50% of the value of the seed capital collateral. The non-recourse seed capital facility was set to expire January 15, 2021 and was paid down in the third quarter and terminated.
As of December 31, 2020, we were in compliance with the required covenants related to borrowings and debt facilities.
96
Other Long-term Liabilities
Other long-term liabilities principally consist of cash-settled Affiliate equity and profit interests liabilities held by certain Affiliate key employees, and voluntary deferred compensation plans. The following table summarizes our other long-term liabilities:
| Years ended December 31, | |||||||||||
| ($ in millions) | 2020 | 2019 | |||||||||
| Share-based payments liability | $ | 213.8 | $ | 221.8 | |||||||
| Affiliate profit interests liability | 41.4 | 94.8 | |||||||||
| Employee equity | 255.2 | 316.6 | |||||||||
| Voluntary deferral plan liability | 72.8 | 88.3 | |||||||||
| Total | $ | 328.0 | $ | 404.9 | |||||||
Share-based payments liability represents the value of Affiliate key employee-owned equity that may under certain circumstances be repurchased by us that is considered an equity award under U.S. GAAP based on the terms and conditions attached to these interests. Profit interests represent the value of Affiliate key employee-owned equity that may under certain circumstances be repurchased by us that is not considered an equity award under U.S. GAAP, but rather a form of compensation arrangement, based on the terms and conditions attached to these interests. Our obligation in any given period in respect of funding these potential repurchases of Affiliate equity is limited to only that portion that may be put to us by Affiliate key employees, which is typically capped annually under the terms of these arrangements such that we are not required to repurchase more than we can reasonably recycle by re-granting the interests in lieu of cash variable compensation owed to Affiliate key employees.
Certain of our and our Affiliates’ key employees are eligible to participate in our voluntary deferral plan, or VDP, which provides our senior personnel the opportunity to voluntarily defer a portion of their compensation. There is a voluntary deferral plan investment balance included in investments on the Consolidated Balance Sheets that corresponds to this deferral liability.
For additional discussion of our compensation programs, please refer to the compensation discussions contained within our definitive proxy statement for our 2021 annual meeting of shareholders incorporated herein by reference.
Supplemental Liquidity Measure—Adjusted EBITDA
As supplemental information, we provide information regarding Adjusted EBITDA, which we define as economic net income before interest, income taxes, depreciation and amortization. Adjusted EBITDA is a non-GAAP liquidity measure that we provide in addition to, but not as a substitute for, cash flows from operating activities. It should be noted that our calculation of Adjusted EBITDA may not be consistent with Adjusted EBITDA as calculated by other companies. We believe Adjusted EBITDA is a useful liquidity metric because it indicates our ability to make further investments in our business, service debt and meet working capital requirements. It is also encapsulated in our line of credit as part of our liquidity covenants.
97
The following table reconciles our U.S. GAAP net income attributable to controlling interests to EBITDA to Adjusted EBITDA to economic net income for the years ended December 31, 2020, 2019 and 2018:
| Years Ended December 31, | |||||||||||||||||
| ($ in millions) | 2020 | 2019 | 2018 | ||||||||||||||
| Net income attributable to controlling interests | $ | 286.7 | $ | 223.9 | $ | 136.4 | |||||||||||
| Net interest expense to third parties | 27.9 | 30.0 | 21.7 | ||||||||||||||
| Income tax expense (including tax expenses related to discontinued operations) | 112.1 | 18.0 | 5.0 | ||||||||||||||
| Depreciation and amortization (including intangible assets) and goodwill impairment | 44.1 | 23.8 | 21.1 | ||||||||||||||
| EBITDA | $ | 470.8 | $ | 295.7 | $ | 184.2 | |||||||||||
| Non-cash compensation costs, including revaluation of Affiliate key employee-owned equity and profit interests | (23.4) | (65.9) | 107.2 | ||||||||||||||
| Amortization of pre-acquisition employee equity | 6.1 | 32.3 | 70.6 | ||||||||||||||
| EBITDA of discontinued operations attributable to controlling interests | — | — | (0.1) | ||||||||||||||
| (Gain) loss on seed and co-investments | (8.2) | (25.0) | 6.4 | ||||||||||||||
| Deferred tax asset deed revaluation | — | — | (20.0) | ||||||||||||||
Restructuring and the impact of a one-time compensation arrangement that includes advances against future compensation payments(1) | (213.2) | 9.2 | (59.3) | ||||||||||||||
| Custody fees on seed portfolio | 0.1 | — | — | ||||||||||||||
| Capital transaction costs | 0.2 | 2.7 | 1.6 | ||||||||||||||
| Adjusted EBITDA | $ | 232.4 | $ | 249.0 | $ | 290.6 | |||||||||||
| ENI net interest expense to third parties | (21.6) | (21.0) | (13.6) | ||||||||||||||
Depreciation and amortization(2) | (23.7) | (17.2) | (14.5) | ||||||||||||||
| Tax on economic net income | (43.5) | (50.0) | (62.7) | ||||||||||||||
| Economic net income | $ | 143.6 | $ | 160.8 | $ | 199.8 | |||||||||||
(1)Included in restructuring for the year ended December 31, 2020 are $9.4 million of restructuring costs at the Center and Affiliates, $1.6 million costs associated with the transfer of an insurance policy from our former Parent, $17.0 million costs relating to the impact of a one-time compensation arrangement entered into that includes advances against future compensation payments, and the gain on sale of Affiliates of $241.3 million. Included in restructuring for the year ended December 31, 2019 are $6.7 million of restructuring costs at the Center and Affiliates and $2.5 million of costs incurred in connection with our redomicile to the U.S. Included in restructuring for the year ended December 31, 2018 is the gain on the sale of Heitman of $65.7 million, $1.6 million of costs associated with our redomicile and $4.8 million related to the 2018 CEO transition.
(2)The year ended December 31, 2020 includes non-cash equity-based award amortization expense.
For a full discussion regarding the items excluded from Adjusted EBITDA above and the calculation of economic net income, refer to “—Non-GAAP Supplemental Performance Measure—Economic Net Income and Segment Analysis.”
Limitations of Adjusted EBITDA
As a non-GAAP, unaudited liquidity measure and derivation of EBITDA, Adjusted EBITDA has certain material limitations. It does not include cash costs associated with capital transactions and excludes certain U.S. GAAP expenses that fall outside the definition of EBITDA. Each of these categories of expense represents costs to us of doing business, and therefore any measure that excludes any or all of these categories of expense has material limitations.
98
Future Capital Needs
We believe that our available cash and cash equivalents to be generated from operations, supplemented by short-term and long-term financing, as necessary, will be sufficient to fund current operations and capital requirements for at least the next twelve months, as well as our day-to-day operations and future investment requirements. Our ability to secure short-term and long-term financing in the future will depend on several factors, including our future profitability, our relative levels of debt and equity and the overall condition of the credit markets.
Commitments, Contingencies and Off-Balance Sheet Obligations
Indemnifications
In the normal course of business, such as through agreements to enter into business combinations with and divestitures of Affiliates, we occasionally enter into contracts that contain a variety of representations and warranties and which provide general indemnifications. Our maximum exposure under these arrangements is unknown, as this would involve future claims that may be made against us that have not yet occurred.
Off-Balance Sheet Obligations
Off-balance sheet arrangements, as defined by the SEC, include certain contractual arrangements pursuant to which a company has an obligation, such as certain contingent obligations, certain guarantee contracts, retained or contingent interests in assets transferred to an unconsolidated entity, certain derivative instruments classified as equity or material variable interests in unconsolidated entities that provide financing, liquidity, market risk or credit risk support. Disclosure is required for any off-balance sheet arrangements that have, or are reasonably likely to have, a material current or future effect on our financial condition, results of operations, liquidity or capital resources. We generally do not enter into off-balance sheet arrangements, other than those described in “Contractual Obligations” as well as Note 6 to our Consolidated Financial Statements included in Item 8 herein, “Variable Interest Entities.”
Contractual Obligations
The following table summarizes our contractual obligations as of December 31, 2020:
| Payments due by period | |||||||||||||||||||||||||||||
| ($ in millions) | Total | Less than 1 year | 1 - 3 years | 3 - 5 years | More than 5 years | ||||||||||||||||||||||||
| Contractual Obligations | |||||||||||||||||||||||||||||
Amounts due to OM plc(1) | $ | 3.4 | $ | 2.8 | $ | — | $ | 0.6 | $ | — | |||||||||||||||||||
| Other third party borrowings | 400.0 | — | — | — | 400.0 | ||||||||||||||||||||||||
| Lease obligations | 132.2 | 13.4 | 20.6 | 20.8 | 77.4 | ||||||||||||||||||||||||
| Co-investment obligations | 33.0 | 29.0 | 4.0 | — | — | ||||||||||||||||||||||||
Other liabilities(2) | 1.2 | 0.1 | 0.1 | 0.1 | 0.9 | ||||||||||||||||||||||||
Maximum Affiliate equity and profits interests repurchase obligations(3) | 66.4 | 5.1 | 10.2 | 10.2 | 40.9 | ||||||||||||||||||||||||
| Total contractual obligations | $ | 636.2 | $ | 50.4 | $ | 34.9 | $ | 31.7 | $ | 519.2 | |||||||||||||||||||
(1)Amounts due to OM plc is comprised of $3.4 million owed under the co-investment deed.
99
(2)Represents the mortgage on a building owned by an Affiliate.
(3)Represents amortized amounts held by Affiliate key employees. Our actual funding of these potential repurchases of Affiliate equity and profits interests is limited to only that portion that may be put to us by Affiliate key employees or that we decide to call to facilitate succession planning that the Affiliates, which is typically capped annually such that we do not repurchase more than we can reasonably recycle by re-granting the interests in lieu of cash variable compensation owed to Affiliate key employees. Any equity or profits interests repurchased by us are used to fund a portion of variable compensation awards resulting in savings in cash variable compensation that offset the negative cash effect of repurchasing the equity.
Critical Accounting Policies and Estimates
Our significant accounting policies are disclosed in Item 8, Financial Statements and Supplementary Data - Note 2, “Significant Accounting Policies." The accounting policies and estimates that we believe are the most critical to an understanding of our results of operations and financial condition are those that require complex management judgment regarding matters that are highly uncertain at the time policies were applied and estimates were made. These accounting policies and estimates are discussed below; however, the additional accounting policy detail in the footnote previously referenced is important to the discussion of each of the topics. Different estimates reasonably could have been used in the current period that would have had a material effect on these Consolidated Financial Statements, and changes in these estimates are likely to occur from period-to-period in the future.
Taxation
We file tax returns directly with the U.S., U.K., state tax authorities and in other foreign jurisdictions. These tax returns represent our filing positions within each jurisdiction and settle our tax liabilities. Each jurisdiction has the right to audit those tax returns and may take different positions with respect to income and expense allocations and taxable earnings determinations. Because the determinations of our annual provisions are subject to judgments and estimates, it is possible it is possible that actual results will vary from those recognized in our Consolidated Financial Statements. As a result, it is likely that additions to, or reductions of, income tax expense will occur each year for prior reporting periods as actual tax returns and tax audits are settled.
Deferred tax assets, net of any associated valuation allowance, have been recognized based on management's belief that taxable income of the appropriate character, more likely than not, will be sufficient to realize the benefits of these assets over time. In the event that actual results differ from our expectations, or if our historical trends of positive operating income changes, we may be required to record a valuation allowance on some or all of these deferred tax assets, which may have a significant effect on our financial condition and results of operations. In assessing whether a valuation allowance should be established against a deferred income tax asset, we consider the nature, frequency and severity of recent losses, forecasts of future profitability, the duration of statutory carryback and carry forward periods, among other factors.
We utilize a specific recognition threshold and measurement attribute for the Consolidated Financial Statement recognition and measurement of a tax position taken or expected to be taken in a tax return. The prescribed two-step process for evaluating a tax position involves first determining whether it is more likely than not that a tax position will be sustained upon examination by the appropriate taxing authorities. If it is, the second step then requires a company to measure this tax position benefit as the largest cumulative amount of benefit that is greater than 50 percent likely of being realized upon ultimate settlement. Unrecognized tax benefits and related interest and penalties, are adjusted periodically to reflect changing facts and circumstances.
100
Goodwill
Goodwill represents the future economic benefits arising from assets acquired in a business combination that are not separately recognized. Goodwill is tested annually for impairment. If, after assessing qualitative and quantitative factors, we believe that it is more likely than not that the fair value of the reporting unit is less than its carrying value, we will record the amount of goodwill impairment as the excess of the carrying amount over the fair value.
In the quantitative impairment test, fair value of the reporting units is generally determined using an income approach where estimated future cash flows are discounted to arrive at a single present value amount. The income approach includes inputs that require significant management judgment, including AUM growth rates, product mix, effective fee rates and discount rates. The annual goodwill impairment test also includes assumptions updated for current market conditions, including our updated forecasts for changes in AUM due to market gains or losses and long-term net flows and the corresponding changes in revenue and expenses. Our estimates for market growth, our market share and costs are based on historical data, various internal estimates and certain external sources, and are based on assumptions that are consistent with the plans and estimates we are using to manage the underlying business. The most sensitive of these assumptions are the estimated cash flows and the use of a weighted average cost of capital as the discount rate to determine present value.
Due to the decline in the Company’s assets under management during the three months ended March 31, 2020, management determined that an interim impairment assessment was necessary as of March 31, 2020. In the first quarter of 2020, the Company performed a quantitative impairment test for the Copper Rock reporting unit which was included within the Liquid Alpha segment prior to its disposition in July 2020. The quantitative impairment test concluded that the fair value of the reporting unit did not exceed its carrying value. Accordingly, the Company recognized a goodwill impairment charge of $16.4 million for the year ended December 31, 2020. We also completed our annual goodwill impairment test as of the first business day of the fourth quarter and no impairment was identified. While we believe all assumptions utilized in our assessment are reasonable and appropriate, changes in these estimates could produce different fair value amounts and therefore different goodwill impairment assessments.
Consolidation
Assessing if an entity is a variable interest entity (VIE) or voting interest entity (VOE) involves judgment and analysis on a structure-by-structure basis. Factors included in this assessment include the legal organization of the entity, the Company’s contractual involvement with the entity and any related party or de facto agent implications of the Company’s involvement with the entity. A VIE, in the context of the company and its managed funds, is a fund that does not have sufficient equity to finance its operations without additional subordinated financial support, or a fund for which the risks and rewards of ownership are not directly linked to voting interests. If the Company is deemed to have the power to direct the activities of the fund that most significantly impact the fund's economic performance, and the obligation to absorb losses/right to receive benefits from the fund that could potentially be significant to the fund, then the Company is deemed to be the fund's primary beneficiary and is required to consolidate the fund.
Determining if the Company is the primary beneficiary of a VIE also requires significant judgment involved to assess if the Company has the power to direct the activities that most significantly affect the fund's economic results and to assess if the Company's interests could be deemed significant. If current financial statements are not available for consolidated VIEs or VOEs, estimation of investment valuation is required, which includes assessing available quantitative and qualitative data. Significant changes in these estimates could impact the reported value of the investments held by consolidated Funds and the related offsetting equity attributable to noncontrolling interests in consolidated entities on the Consolidated Balance Sheets and the other gains and losses of consolidated Funds, net, and related offsetting gains and losses attributable to noncontrolling interests in consolidated entities, net, amounts on the Consolidated Statements of Operations.
101
Share-based compensation plans
We recognize the cost of all share-based payments to directors, senior management and employees, including grants of restricted stock and stock options, as compensation expense in the Consolidated Statements of Operations over the respective vesting periods.
Awards made under the our equity plans are accounted for as equity settled, and the grant date fair value is recognized as compensation expense over the requisite service period, with a corresponding contribution to additional paid-in capital. Valuation of restricted stock awards (“RSAs”) and restricted stock units (“RSUs”) is determined based on our closing share price as quoted on the New York Stock Exchange on the measurement date. For performance-based awards and stock options, a Monte-Carlo simulation model is used to determine the fair value. Key inputs for the model include: assumed reinvestment of dividends, risk-free interest rate and expected volatility. All excess tax benefits and deficiencies on share-based payment awards are recognized as income tax expense or benefit in the Consolidated Statements of Operations. In addition, the tax effects of exercised or vested awards are treated as discrete items in the reporting period in which they occur and excess tax benefits or deficiencies are classified with other income tax cash flows as an operating activity in the Consolidated Statements of Cash Flows. We recognize forfeitures as they occur.
We have compensation arrangements with certain of our Affiliates whereby in exchange for continued service, Affiliate equity is either purchased by or granted to Affiliate key employees and may be repurchased either by Affiliate key employees or by us at a future date, subject to service requirements having been met. Awards of equity made to Affiliate key employees are accounted for as cash settled, with the fair value recognized as compensation expense over the requisite service period, with a corresponding liability carried within other compensation liabilities on the Consolidated Balance Sheets until the award is settled by us. The fair values of the liabilities are determined with the assistance of third party valuation specialists using discounted cash flow analyses which incorporate assumptions for the forecasted earnings information, market risk adjustments, discount rates and post-vesting restrictions. While we believe all assumptions used in determining the fair value of the liabilities are reasonable and appropriate, certain assumptions are subjective and changes in these assumptions could result in different fair value amounts.
Recent Accounting Developments
See discussion of Recent Accounting Developments in Note 2 of the accompanying Consolidated Financial Statements.
Item 7A. Quantitative and Qualitative Disclosures About Market Risk
Market Risk
Our exposure to market risk is directly related to the role of our Affiliates as asset managers. Substantially all of our investment management revenues are derived from our Affiliates’ agreements with their clients. Under these agreements, the revenues we receive are based on the value of our assets under management or the investment performance on client accounts for which we earn performance fees. Accordingly, our revenues and net income may decline as a result of our assets under management decreasing due to depreciation of our investment portfolios. In addition, such depreciation could cause our clients to withdraw their funds in favor of investments offering higher returns or lower risk, which would cause our revenues and net income to decline further.
102
Our model for assessing the impact of market risk on our results uses December 31, 2020 ending AUM and management fee rates as the basis for management fee revenue calculations. With respect to performance fee revenue, we assume that relative investment performance remains the same as it was on December 31, 2020. Therefore, market-driven changes in performance fees, which are typically based on relative performance versus market indices, reflect changes in the underlying AUM used in the calculation rather than differences in relative performance as a result of a changed market environment. The basis for the analysis is performance fees earned for the twelve months ended December 31, 2020.
Our profit sharing economic structure, described more fully in “Management’s Discussion and Analysis of Financial Condition and Results of Operation—The Economics of Our Business,” results in a sharing of market risk between us and our employees. Almost 50% of our ENI cost structure is variable, representing variable compensation and Affiliate key employee distributions. These variable expenses generally are linked in a formulaic manner to the profitability of the business after covering operating expenses, which include base compensation and benefits, general and administrative expenses, and depreciation and amortization. In modeling the impact of market risk, we assume that these operating expenses remain unchanged, but the resulting impact on profit driven by increases or decreases in revenue will change variable compensation and Affiliate key employee distributions in line with their formulaic calculations. Any change in pre-tax profit is tax-effected at our statutory combined state and federal rate of approximately 27% to calculate profit after tax.
The value of our assets under management was $156.7 billion as of December 31, 2020. A 10% increase or decrease in the value of our assets under management, if proportionally distributed over all of our investment strategies, asset classes and client relationships, would cause an annualized increase or decrease in our gross management fee revenues of approximately $67.7 million, including equity-accounted Affiliate, based on our current weighted average fee rate of approximately 43 basis points, including equity-accounted Affiliate. Approximately $18.0 billion, or 11%, of our AUM, including equity-accounted Affiliate, are in accounts subject to performance fees. Of these assets, approximately 70% are in accounts for which performance fees, or management fee adjustments, are calculated based on investment return that differs from the relative benchmark returns. Assuming the market change does not impact our relative performance and high-water mark status of our alternative assets, a 10% increase or decrease in AUM would have no impact to our gross performance fees based on our trailing twelve month performance fees of $7.8 million as of December 31, 2020. The combined impact on our management fees and performance fees would have a direct impact on our earnings and result in an annual change of approximately $24.7 million in our post-tax economic net income, given our current cost structure and operating model.
Equity market risk, interest rate risk, and foreign currency risk are the market risks that could have the greatest impact on our management fees, performance fees and our business profitability. Impacts on our management and performance fees can be calculated based on the percentage of AUM constituting equity investments, fixed income investments, or foreign currency denominated investments, respectively, multiplied by the relevant weighted average management fee and performance fee attributable to that asset class.
•Our equity markets-based AUM includes U.S. equities (including small cap through large cap securities and substantially value or blended investment styles) and global/non-U.S. equities (including global, non-U.S. and emerging markets securities). A 10% increase or decrease in equity markets would cause our $130.6 billion of equity assets under management to increase or decrease by $13.1 billion, resulting in a change in annualized management fee revenue of $48.1 million and an annual change in post-tax economic net income of approximately $18.3 million, given our current cost structure, operating model, and weighted average equity fee rates of 37 basis points at the mix of strategies as of December 31, 2020. Approximately $12.5 billion, or 10%, of our equity markets-based AUM are in accounts subject to performance fees. Of these assets, almost all are in accounts for which performance fees are calculated based on investment return in excess of the relative benchmark returns. Assuming the market change does not impact our relative performance, a 10% change in equity markets would have no material impact from performance fees on our post-tax economic net income, given our current cost structure and operating model.
103
•Foreign currency AUM includes equity and alternative instruments denominated in foreign currencies. A 10% increase or decrease in foreign exchange rates against the U.S. dollar would cause our $99.5 billion of foreign currency denominated AUM to increase or decrease by $10.0 billion, resulting in a change in annualized management fee revenue of $38.4 million and an annual change in post-tax economic net income of $14.9 million, based on weighted average fees earned on our foreign currency denominated AUM of 39 basis points at the mix of strategies as of December 31, 2020. Approximately $12.5 billion, or 13%, of our foreign currency denominated AUM are in accounts subject to performance fees. Of these assets, approximately 85% are in accounts for which performance fees are calculated based on investment return in excess of the relative benchmark returns. Assuming the market change does not impact our relative performance, a 10% change in foreign currency exchange rates would have an immaterial impact from performance fees on our post-tax economic net income, given our current cost structure and operating model.
•Fixed income AUM includes instruments in government bonds, corporate bonds and other fixed income investments in the United States. A change in interest rates, resulting in a 10% increase or decrease in the value of our total fixed income AUM of $1.9 billion, would cause AUM to rise or fall by approximately $0.2 billion. Based on our fixed income weighted average fee rates of 26 basis points, annualized management fees would change by $0.5 million and post-tax economic net income would change by $0.2 million annually. There are currently no material fixed income assets earning performance fees as of the year ended December 31, 2020.
Our investment income primarily represents investments in Affiliates accounted for under the equity method. Exposure to market risks for Affiliates accounted for under the equity method is immaterial and is included in the analysis above.
While the analysis above assumes that market changes occur in a uniform manner across the relevant portfolio, because of our declining fee rates for larger relationships and differences in our fee rates across asset classes, a change in the composition of our assets under management, in particular an increase in the proportion of our total assets under management attributable to strategies, clients or relationships with lower effective fee rates, could have a material negative impact on our overall weighted average fee rate.
As is customary in the asset management industry, clients invest in particular strategies to gain exposure to certain asset classes, which exposes their investment to the benefits and risks of such asset classes. We have not adopted a corporate-level risk management policy regarding client assets, nor have we attempted to hedge at the corporate level or within individual strategies the market risks that would affect the value of our overall assets under management and related revenues. Any reduction in the value of our assets under management would result in a reduction in our revenues.
Interest Rate Risk
We are exposed to interest rate risks primarily through borrowings under our Credit Facility. Interest on borrowings under the Credit Facility is based upon variable interest rates. Borrowings under our Credit Facility were $0.0 million as of December 31, 2020. We currently do not hedge against this interest rate risk. As of December 31, 2020, a hypothetical 10% change in interest rates would have resulted in a $0.4 million change to our interest expense during the twelve months ended December 31, 2020.
104
Item 8. Financial Statements and Supplementary Data.
| Page | ||||||||
| Index to financial statements | ||||||||
105
Report of Independent Registered Public Accounting Firm
To the Shareholders and Board of Directors BrightSphere Investment Group Inc.:
Opinion on the Consolidated Financial Statements
We have audited the accompanying consolidated balance sheets of BrightSphere Investment Group Inc. and subsidiaries (the Company) as of December 31, 2020 and 2019, the related consolidated statements of operations, comprehensive income, changes in shareholders’ equity, and cash flows for each of the years in the three‑year period ended December 31, 2020, and the related notes (collectively, the consolidated financial statements). In our opinion, the consolidated financial statements present fairly, in all material respects, the financial position of the Company as of December 31, 2020 and 2019, and the results of its operations and its cash flows for each of the years in the three‑year period ended December 31, 2020, in conformity with U.S. generally accepted accounting principles.
We also have audited, in accordance with the standards of the Public Company Accounting Oversight Board (United States) (PCAOB), the Company’s internal control over financial reporting as of December 31, 2020, based on criteria established in Internal Control – Integrated Framework (2013) issued by the Committee of Sponsoring Organizations of the Treadway Commission, and our report dated March 1, 2021 expressed an unqualified opinion on the effectiveness of the Company’s internal control over financial reporting.
Basis for Opinion
These consolidated financial statements are the responsibility of the Company’s management. Our responsibility is to express an opinion on these consolidated financial statements based on our audits. We are a public accounting firm registered with the PCAOB and are required to be independent with respect to the Company in accordance with the U.S. federal securities laws and the applicable rules and regulations of the Securities and Exchange Commission and the PCAOB.
We conducted our audits in accordance with the standards of the PCAOB. Those standards require that we plan and perform the audit to obtain reasonable assurance about whether the consolidated financial statements are free of material misstatement, whether due to error or fraud. Our audits included performing procedures to assess the risks of material misstatement of the consolidated financial statements, whether due to error or fraud, and performing procedures that respond to those risks. Such procedures included examining, on a test basis, evidence regarding the amounts and disclosures in the consolidated financial statements. Our audits also included evaluating the accounting principles used and significant estimates made by management, as well as evaluating the overall presentation of the consolidated financial statements. We believe that our audits provide a reasonable basis for our opinion.
Critical Audit Matter
The critical audit matter communicated below is a matter arising from the current period audit of the consolidated financial statements that was communicated or required to be communicated to the audit committee and that: (1) relates to accounts or disclosures that are material to the consolidated financial statements and (2) involved our especially challenging, subjective, or complex judgments. The communication of a critical audit matter does not alter in any way our opinion on the consolidated financial statements, taken as a whole, and we are not, by communicating the critical audit matter below, providing a separate opinion on the critical audit matter or on the accounts or disclosures to which it relates.
Assessment of the fair value measurement of the cash-settled affiliate awards liability
As discussed in Notes 2, 13 and 20 to the consolidated financial statements, the Company records liabilities for equity awards made to certain affiliate key employees. The liability for these awards is revalued each reporting period to its fair value. The share-based payments liability was $213.8 million at December 31, 2020, which included the liability for these awards.
We identified the assessment of the fair value measurement of the cash-settled affiliate awards liability as a critical audit matter. Complex and subjective auditor judgment was required in evaluating the methodologies and key assumptions used in determining the fair value of the liability related to the cash-settled affiliate
106
Report of Independent Registered Public Accounting Firm
awards. The significant assumptions that required complex and subjective auditor judgment include forecasted earnings, market risk adjustments, discount rates, and adjustments to reflect the impact of post-vesting restrictions. Minor changes to these assumptions can have an effect on the Company’s determination of the fair value of the cash-settled affiliate awards liability.
The following are the primary procedures we performed to address this critical audit matter. We evaluated the design and tested the operating effectiveness of certain internal controls over the Company’s process related to the fair value measurement of the cash-settled affiliate awards liability, including controls over the significant assumptions noted above. We compared forecasted earnings to internal financial forecasts and historical results. We also compared certain inputs used in developing the forecasted earnings to third party data. We held discussions with finance personnel of the Company to further evaluate the forecasted earnings used in the discounted cash flow models. We evaluated adjustments to reflect the impact of post-vesting restrictions on awards by comparing the restrictions to underlying plan documents and also assessing when award holders maximize value. We evaluated the mathematical accuracy of the computations used to determine the fair value of the liability and compared the calculated fair values to the amounts recorded. We involved valuation professionals with specialized skills and knowledge, who assisted in:
–evaluating if the methodology used to calculate fair values was appropriate for the awards being valued
–evaluating market risk adjustments
–evaluating the discount rates used by the Company by comparing them against a discount rate range that was developed using publicly available market data
–performing independent calculations of the fair value of the liability using the Company’s forecasted earnings and a combination of independent assumptions and Company assumptions and comparing the result to the amount recorded by the Company.
/s/ KPMG LLP
We have served as the Company’s auditor since 2014.
Boston, Massachusetts
March 1, 2021
107
Report of Independent Registered Public Accounting Firm
To the Shareholders and Board of Directors BrightSphere Investment Group Inc.:
Opinion on Internal Control Over Financial Reporting
We have audited BrightSphere Investment Group Inc. and subsidiaries’ (the Company) internal control over financial reporting as of December 31, 2020, based on criteria established in Internal Control – Integrated Framework (2013) issued by the Committee of Sponsoring Organizations of the Treadway Commission. In our opinion, the Company maintained, in all material respects, effective internal control over financial reporting as of December 31, 2020, based on criteria established in Internal Control – Integrated Framework (2013) issued by the Committee of Sponsoring Organizations of the Treadway Commission.
We also have audited, in accordance with the standards of the Public Company Accounting Oversight Board (United States) (PCAOB), the consolidated balance sheets of the Company as of December 31, 2020 and 2019, the related consolidated statements of operations, comprehensive income, changes in shareholders’ equity, and cash flows for each of the years in the three-year period ended December 31, 2020, and the related notes (collectively, the consolidated financial statements), and our report dated March 1, 2021 expressed an unqualified opinion on those consolidated financial statements.
Basis for Opinion
The Company’s management is responsible for maintaining effective internal control over financial reporting and for its assessment of the effectiveness of internal control over financial reporting, included in the accompanying Report of Management on Internal Control Over Financial Reporting. Our responsibility is to express an opinion on the Company’s internal control over financial reporting based on our audit. We are a public accounting firm registered with the PCAOB and are required to be independent with respect to the Company in accordance with the U.S. federal securities laws and the applicable rules and regulations of the Securities and Exchange Commission and the PCAOB.
We conducted our audit in accordance with the standards of the PCAOB. Those standards require that we plan and perform the audit to obtain reasonable assurance about whether effective internal control over financial reporting was maintained in all material respects. Our audit of internal control over financial reporting included obtaining an understanding of internal control over financial reporting, assessing the risk that a material weakness exists, and testing and evaluating the design and operating effectiveness of internal control based on the assessed risk. Our audit also included performing such other procedures as we considered necessary in the circumstances. We believe that our audit provides a reasonable basis for our opinion.
Definition and Limitations of Internal Control Over Financial Reporting
A company’s internal control over financial reporting is a process designed to provide reasonable assurance regarding the reliability of financial reporting and the preparation of financial statements for external purposes in accordance with generally accepted accounting principles. A company’s internal control over financial reporting includes those policies and procedures that (1) pertain to the maintenance of records that, in reasonable detail, accurately and fairly reflect the transactions and dispositions of the assets of the company; (2) provide reasonable assurance that transactions are recorded as necessary to permit preparation of financial statements in accordance with generally accepted accounting principles, and that receipts and expenditures of the company are being made only in accordance with authorizations of management and directors of the company; and (3) provide reasonable assurance regarding prevention or timely detection of unauthorized acquisition, use, or disposition of the company’s assets that could have a material effect on the financial statements.
Because of its inherent limitations, internal control over financial reporting may not prevent or detect misstatements. Also, projections of any evaluation of effectiveness to future periods are subject to the risk that controls may become inadequate because of changes in conditions, or that the degree of compliance with the policies or procedures may deteriorate.
/s/ KPMG LLP
Boston, Massachusetts
March 1, 2021
108
BrightSphere Investment Group Inc.
Consolidated Balance Sheets
(in millions, except for share and per share data)
| December 31, 2020 | December 31, 2019 | ||||||||||
| Assets | |||||||||||
| Cash and cash equivalents | $ | $ | |||||||||
| Restricted cash | |||||||||||
| Investment advisory fees receivable | |||||||||||
| Income taxes receivable | |||||||||||
| Fixed assets, net | |||||||||||
| Right of use assets | |||||||||||
Investments (includes balances reported at fair value of $ | |||||||||||
| Acquired intangibles, net | |||||||||||
| Goodwill | |||||||||||
| Other assets | |||||||||||
| Deferred tax assets | |||||||||||
| Assets of consolidated Funds: | |||||||||||
| Cash and cash equivalents, restricted | |||||||||||
Investments (includes balances reported at fair value of $ | |||||||||||
| Other assets | |||||||||||
| Total assets | $ | $ | |||||||||
| Liabilities and shareholders’ equity | |||||||||||
| Accounts payable and accrued expenses | $ | $ | |||||||||
| Accrued incentive compensation | |||||||||||
| Due to OM plc | |||||||||||
| Other compensation liabilities | |||||||||||
| Accrued income taxes | |||||||||||
| Operating lease liabilities | |||||||||||
| Other liabilities | |||||||||||
| Debt: | |||||||||||
| Non-recourse borrowings | |||||||||||
| Third party borrowings | |||||||||||
| Liabilities of consolidated Funds: | |||||||||||
| Accounts payable and accrued expenses | |||||||||||
| Securities sold, not yet purchased, at fair value | |||||||||||
| Other liabilities | |||||||||||
| Total liabilities | |||||||||||
| Commitments and contingencies | |||||||||||
| Redeemable non-controlling interests in consolidated Funds | |||||||||||
| Equity: | |||||||||||
Common stock (par value $ | |||||||||||
| Additional paid-in capital | |||||||||||
| Retained deficit | ( | ( | |||||||||
| Accumulated other comprehensive loss | ( | ( | |||||||||
| Non-controlling interests | |||||||||||
| Non-controlling interests in consolidated Funds | |||||||||||
| Total equity and redeemable non-controlling interests in consolidated Funds | |||||||||||
| Total liabilities and equity | $ | $ | |||||||||
See Notes to Consolidated Financial Statements
109
BrightSphere Investment Group Inc.
Consolidated Statements of Operations
(in millions except for per share data)
| For the Years Ended December 31, | |||||||||||||||||
| 2020 | 2019 | 2018 | |||||||||||||||
| Revenue: | |||||||||||||||||
| Management fees | $ | $ | $ | ||||||||||||||
| Performance fees | ( | ||||||||||||||||
| Other revenue | |||||||||||||||||
| Consolidated Funds’ revenue | |||||||||||||||||
| Total revenue | |||||||||||||||||
| Operating expenses: | |||||||||||||||||
| Compensation and benefits | |||||||||||||||||
| General and administrative expense | |||||||||||||||||
| Impairment of goodwill | |||||||||||||||||
| Amortization of acquired intangibles | |||||||||||||||||
| Depreciation and amortization | |||||||||||||||||
| Consolidated Funds’ expense | |||||||||||||||||
| Total operating expenses | |||||||||||||||||
| Operating income | |||||||||||||||||
| Non-operating income and (expense): | |||||||||||||||||
| Investment income | |||||||||||||||||
| Interest income | |||||||||||||||||
| Interest expense | ( | ( | ( | ||||||||||||||
| Revaluation of DTA deed | |||||||||||||||||
| Gain on sale of Affiliates | |||||||||||||||||
| Net consolidated Funds’ investment gains (losses) | ( | ||||||||||||||||
| Total non-operating income | |||||||||||||||||
| Income from continuing operations before taxes | |||||||||||||||||
| Income tax expense | |||||||||||||||||
| Income from continuing operations | |||||||||||||||||
| Gain (loss) on disposal of discontinued operations, net of tax | |||||||||||||||||
| Net income | |||||||||||||||||
| Net income (loss) attributable to non-controlling interests in consolidated Funds | ( | ||||||||||||||||
| Net income attributable to controlling interests | $ | $ | $ | ||||||||||||||
| Earnings per share (basic) attributable to controlling interests | $ | $ | $ | ||||||||||||||
| Earnings per share (diluted) attributable to controlling interests | |||||||||||||||||
| Continuing operations earnings per share (basic) attributable to controlling interests | |||||||||||||||||
| Continuing operations earnings per share (diluted) attributable to controlling interests | |||||||||||||||||
| Weighted average shares outstanding | |||||||||||||||||
| Weighted average diluted shares outstanding | |||||||||||||||||
See Notes to Consolidated Financial Statements
110
BrightSphere Investment Group Inc.
Consolidated Statements of Comprehensive Income
(in millions)
| For the Years Ended December 31, | |||||||||||||||||
| 2020 | 2019 | 2018 | |||||||||||||||
| Net income | $ | $ | $ | ||||||||||||||
| Other comprehensive income (loss): | |||||||||||||||||
| Amortization related to derivative securities, net of tax | |||||||||||||||||
| Foreign currency translation adjustment | ( | ||||||||||||||||
| Total comprehensive income | |||||||||||||||||
Comprehensive income (loss) attributable to non-controlling interests in consolidated Funds | ( | ||||||||||||||||
| Total comprehensive income attributable to controlling interests | $ | $ | $ | ||||||||||||||
See Notes to Consolidated Financial Statements
111
BrightSphere Investment Group Inc.
Consolidated Statements of Changes in Shareholders’ Equity
For the Years Ended December 31, 2020, 2019 and 2018
($ in millions, except share data)
| Common stock (millions) | Common stock, par value | Additional paid-in capital | Retained earnings (deficit) | Accumulated other comprehensive income (loss) | Total shareholders’ equity | Non- controlling interests | Non-controlling interests in consolidated Funds | Total equity | Redeemable non-controlling interests in consolidated Funds | Total equity and redeemable non-controlling interests in consolidated Funds | |||||||||||||||||||||||||||||||||||||||||||||||||||||||
| December 31, 2017 | $ | $ | $ | ( | $ | ( | $ | $ | $ | $ | $ | $ | |||||||||||||||||||||||||||||||||||||||||||||||||||||
| Issuance of common stock | — | — | — | — | — | — | — | — | — | ||||||||||||||||||||||||||||||||||||||||||||||||||||||||
| Repurchase of common stock | ( | — | ( | — | — | ( | — | — | ( | — | ( | ||||||||||||||||||||||||||||||||||||||||||||||||||||||
| Capital contributions | — | — | — | — | — | — | — | ||||||||||||||||||||||||||||||||||||||||||||||||||||||||||
| Equity-based compensation | — | — | — | — | — | — | — | ||||||||||||||||||||||||||||||||||||||||||||||||||||||||||
| Foreign currency translation adjustment | — | — | — | — | ( | ( | — | — | ( | — | ( | ||||||||||||||||||||||||||||||||||||||||||||||||||||||
| Amortization related to derivative securities, net of tax | — | — | — | — | — | — | — | ||||||||||||||||||||||||||||||||||||||||||||||||||||||||||
| Other changes in non-controlling interests | — | — | — | — | — | — | — | — | |||||||||||||||||||||||||||||||||||||||||||||||||||||||||
| Net consolidation (de-consolidation) of Funds | — | — | — | — | — | — | — | ( | ( | ( | ( | ||||||||||||||||||||||||||||||||||||||||||||||||||||||
Dividends to shareholders ($ | — | — | — | ( | — | ( | — | — | ( | — | ( | ||||||||||||||||||||||||||||||||||||||||||||||||||||||
| Net income (loss) | — | — | — | — | — | ( | ( | ||||||||||||||||||||||||||||||||||||||||||||||||||||||||||
| December 31, 2018 | $ | $ | $ | ( | $ | ( | $ | $ | $ | $ | $ | $ | |||||||||||||||||||||||||||||||||||||||||||||||||||||
| Issuance of common stock | $ | — | — | — | — | — | — | — | — | — | |||||||||||||||||||||||||||||||||||||||||||||||||||||||
| Repurchase of common stock | ( | — | ( | — | — | ( | — | — | ( | — | ( | ||||||||||||||||||||||||||||||||||||||||||||||||||||||
| Capital contributions | — | — | — | — | — | — | — | ||||||||||||||||||||||||||||||||||||||||||||||||||||||||||
| Equity-based compensation | — | — | — | — | — | — | — | ||||||||||||||||||||||||||||||||||||||||||||||||||||||||||
| Foreign currency translation adjustment | — | — | — | — | — | — | — | ||||||||||||||||||||||||||||||||||||||||||||||||||||||||||
| Amortization related to derivative securities, net of tax | — | — | — | — | — | — | — | ||||||||||||||||||||||||||||||||||||||||||||||||||||||||||
| Other changes in non-controlling interests | — | — | — | — | — | — | ( | — | ( | — | ( | ||||||||||||||||||||||||||||||||||||||||||||||||||||||
Dividends ($ | — | — | — | ( | — | ( | — | — | ( | — | ( | ||||||||||||||||||||||||||||||||||||||||||||||||||||||
| Net income | — | — | — | — | — | ||||||||||||||||||||||||||||||||||||||||||||||||||||||||||||
| December 31, 2019 | $ | $ | $ | ( | $ | ( | $ | $ | $ | $ | $ | $ | |||||||||||||||||||||||||||||||||||||||||||||||||||||
| Issuance of common stock | — | — | — | — | — | — | |||||||||||||||||||||||||||||||||||||||||||||||||||||||||||
| Retirement of common stock | ( | — | — | — | — | — | — | — | — | — | — | ||||||||||||||||||||||||||||||||||||||||||||||||||||||
| Repurchase of common stock | ( | — | ( | — | — | ( | — | — | ( | — | ( | ||||||||||||||||||||||||||||||||||||||||||||||||||||||
| Capital contributions | — | — | — | — | — | — | — | ||||||||||||||||||||||||||||||||||||||||||||||||||||||||||
| Equity-based compensation | — | — | — | — | — | — | — | ||||||||||||||||||||||||||||||||||||||||||||||||||||||||||
| Foreign currency translation adjustment | — | — | — | — | — | — | — | ||||||||||||||||||||||||||||||||||||||||||||||||||||||||||
| Amortization related to derivative securities, net of tax | — | — | — | — | — | — | — | ||||||||||||||||||||||||||||||||||||||||||||||||||||||||||
| Other changes in non-controlling interests | — | — | — | — | — | — | — | — | |||||||||||||||||||||||||||||||||||||||||||||||||||||||||
| Net de-consolidation of Funds | — | — | — | — | — | — | — | — | — | ( | ( | ||||||||||||||||||||||||||||||||||||||||||||||||||||||
| Other movements | — | — | — | — | — | — | — | ||||||||||||||||||||||||||||||||||||||||||||||||||||||||||
Dividends ($ | — | — | — | ( | — | ( | — | — | ( | — | ( | ||||||||||||||||||||||||||||||||||||||||||||||||||||||
| Net income | — | — | — | — | — | ||||||||||||||||||||||||||||||||||||||||||||||||||||||||||||
| December 31, 2020 | $ | $ | $ | ( | $ | ( | $ | $ | $ | $ | $ | $ | |||||||||||||||||||||||||||||||||||||||||||||||||||||
See Notes to Consolidated Financial Statements
112
BrightSphere Investment Group Inc.
Consolidated Statements of Cash Flows
(in millions)
| For the Years Ended December 31, | |||||||||||||||||
| 2020 | 2019 | 2018 | |||||||||||||||
| Cash flows from operating activities: | |||||||||||||||||
| Net income | $ | $ | $ | ||||||||||||||
| Less: Net (income) loss attributable to non-controlling interests in consolidated Funds | ( | ( | |||||||||||||||
Adjustments to reconcile net income to net cash flows from operating activities from continuing operations: | |||||||||||||||||
| (Gain) loss from discontinued operations, excluding consolidated Funds | ( | ||||||||||||||||
| Impairment of goodwill | |||||||||||||||||
| Amortization of acquired intangibles | |||||||||||||||||
| (Gain) on sale of Affiliates | ( | ||||||||||||||||
| Depreciation and amortization | |||||||||||||||||
| Amortization of debt-related costs | |||||||||||||||||
| Amortization and revaluation of non-cash compensation awards | ( | ( | |||||||||||||||
| Net earnings from Affiliate accounted for using the equity method | ( | ( | ( | ||||||||||||||
| Distributions received from equity method Affiliates | |||||||||||||||||
| Revaluation of DTA Deed | ( | ||||||||||||||||
| Gain on sale of investment in Affiliate | ( | ||||||||||||||||
| Deferred income taxes | ( | ||||||||||||||||
| (Gains) losses on other investments | ( | ( | |||||||||||||||
| Changes in operating assets and liabilities (excluding discontinued operations): | |||||||||||||||||
| (Increase) decrease in investment advisory fees receivable and other amounts due from related parties | |||||||||||||||||
| (Increase) decrease in other receivables, prepayments, deposits and other assets | ( | ||||||||||||||||
| Increase (decrease) in accrued incentive compensation, operating lease liabilities, other liabilities and amounts due to related parties | ( | ( | ( | ||||||||||||||
| Increase (decrease) in accounts payable, accrued expenses and accrued income taxes | ( | ( | ( | ||||||||||||||
Net cash flows from operating activities of continuing operations, excluding consolidated Funds | ( | ||||||||||||||||
| Net income (loss) attributable to non-controlling interests in consolidated Funds | ( | ||||||||||||||||
Adjustments to reconcile net income (loss) attributable to non-controlling interests in consolidated Funds to net cash flows from operating activities from continuing operations of consolidated Funds: | |||||||||||||||||
| Purchase of investments | ( | ( | ( | ||||||||||||||
| Sale of investments | |||||||||||||||||
| Earnings from equity method investees | ( | ( | |||||||||||||||
| Losses on other investments | |||||||||||||||||
| (Increase) decrease in receivables and other assets | ( | ( | |||||||||||||||
| Increase (decrease) in accounts payable and other liabilities | ( | ||||||||||||||||
| Net cash flows from operating activities of continuing operations of consolidated Funds | ( | ( | ( | ||||||||||||||
Net cash flows from operating activities of continuing operations | ( | ||||||||||||||||
113
BrightSphere Investment Group Inc.
Consolidated Statements of Cash Flows (Continued)
(in millions)
| For the Years Ended December 31, | |||||||||||||||||
| 2020 | 2019 | 2018 | |||||||||||||||
| Net cash flows from operating activities of discontinued operations | |||||||||||||||||
| Total net cash flows from operating activities | ( | ||||||||||||||||
| Cash flows from investing activities: | |||||||||||||||||
| Additions of fixed assets | ( | ( | ( | ||||||||||||||
| Proceeds from sale of Affiliates | |||||||||||||||||
| Purchase of investment securities | ( | ( | ( | ||||||||||||||
| Sale of investment securities | |||||||||||||||||
| Cash flows from investing activities of consolidated Funds: | |||||||||||||||||
| Contributions in equity method investees | ( | ( | |||||||||||||||
| Distributions received from equity method investees | |||||||||||||||||
| Consolidation (de-consolidation) of Funds | ( | ( | |||||||||||||||
Net cash flows from investing activities of continuing operations | |||||||||||||||||
| Net cash flows from investing activities of discontinued operations | |||||||||||||||||
| Total net cash flows from investing activities | |||||||||||||||||
| Cash flows from financing activities: | |||||||||||||||||
| Proceeds from third party and non-recourse borrowings | |||||||||||||||||
| Repayment of third party and non-recourse borrowings | ( | ( | ( | ||||||||||||||
| Payment to OM plc for promissory notes | ( | ||||||||||||||||
| Payment to OM plc for DTA Deed | ( | ||||||||||||||||
| Payment to OM plc for co-investment redemptions | ( | ( | ( | ||||||||||||||
| Repurchases of common stock | ( | ( | ( | ||||||||||||||
| Dividends paid to shareholders | ( | ( | ( | ||||||||||||||
| Dividends paid to related parties | ( | ( | ( | ||||||||||||||
| Payment of debt issuance costs | ( | ||||||||||||||||
| Cash flows from financing activities of consolidated Funds: | |||||||||||||||||
| Non-controlling interest capital raised | |||||||||||||||||
| Non-controlling interest capital redeemed | ( | ( | |||||||||||||||
| Redeemable non-controlling interest capital raised | |||||||||||||||||
| Redeemable non-controlling interest capital redeemed | ( | ( | ( | ||||||||||||||
Net cash flows from financing activities of continuing operations | ( | ( | ( | ||||||||||||||
| Net cash flows from financing activities of discontinued operations | |||||||||||||||||
| Total net cash flows from financing activities | ( | ( | ( | ||||||||||||||
| Net increase (decrease) in cash and cash equivalents | ( | ||||||||||||||||
| Cash and cash equivalents at beginning of period | |||||||||||||||||
| Cash and cash equivalents at end of period (including restricted cash and cash at consolidated Funds classified as restricted) | $ | $ | $ | ||||||||||||||
| Supplemental disclosure of cash flow information: | |||||||||||||||||
| Interest paid (excluding consolidated Funds) | $ | $ | $ | ||||||||||||||
| Income taxes paid | $ | $ | $ | ||||||||||||||
| Supplemental disclosure of non-cash investing and financing transactions: | |||||||||||||||||
| Consolidation (de-consolidation) of Funds | $ | ( | $ | $ | ( | ||||||||||||
| Payable for securities purchased by a consolidated Fund | $ | $ | $ | ||||||||||||||
See Notes to Consolidated Financial Statements
114
BrightSphere Investment Group Inc.
Notes to Consolidated Financial Statements
December 31, 2020 and 2019
1) Organization and Description of the Business
BrightSphere Investment Group Inc. (“BrightSphere”, “BSIG” or the “Company”), through its subsidiaries, is a global asset management company with interests in a diverse group of investment management firms (the “Affiliates”) individually headquartered in the United States. The Company provides investment management services globally to predominantly institutional investors, in asset classes that include U.S. and global equities, fixed income, alternative assets, forestry and secondary strategies focused in real estate and private equity. Fees for services are largely asset-based and, as a result, the Company’s revenue fluctuates based on the performance of financial markets and investors’ asset flows in and out of the Company’s products.
The Company’s Affiliates are organized as limited liability companies. The Company generally utilizes a profit-sharing model in structuring its compensation and ownership arrangements with its Affiliates. The Affiliates’ variable compensation is generally based on each firm’s profitability. BSIG and Affiliate key employees share in profits after variable compensation according to their respective ownership interests. The profit-sharing model results in the alignment of BSIG and Affiliate key employee economic interests, which is critical to the Company’s talent management strategy and long-term growth of the business. The Company conducts its operations through the following three reportable segments:
•Quant & Solutions—comprised of versatile, often highly-tailored strategies that leverage data and technology in a computational, factor based investment process across a range of asset classes and geographies, including Global, non-U.S., emerging markets and managed volatility equities, as well as multi-asset products.
•Alternatives—comprised of illiquid and differentiated liquid investment strategies that include private equity, real estate and real assets, including forestry, as well as a growing suite of liquid alternative capabilities in areas such as long/short, market neutral and absolute return.
•Liquid Alpha(1)—comprised of specialized investment strategies with a focus on alpha-generation across market cycles in long-only small-, mid-, and large-cap U.S. and non-U.S. equities, as well as fixed income.
(1)In July 2020, the Company completed the sale of Copper Rock Capital Partners LLC (“Copper Rock”) and in November 2020, the Company completed the sale of Barrow, Hanley, Mewhinney & Strauss, LLC (“Barrow Hanley”). See Note 3, Divestitures, for further discussion.
115
BrightSphere Investment Group Inc.
Notes to Consolidated Financial Statements (Continued)
December 31, 2020 and 2019
1) Organization and Description of the Business (cont.)
On July 12, 2019, the BrightSphere corporate group, which consisted of BrightSphere Investment Group plc, a public company limited by shares incorporated under the laws of England and Wales and its operating subsidiaries (such operating subsidiaries and the holding company collectively, the “BrightSphere Group”), completed a redomestication, resulting in BrightSphere Investment Group Inc., a Delaware corporation, becoming the publicly traded parent company of BrightSphere Group (the “Redomestication”). The scheme of arrangement pursuant to which the Redomestication was effected was approved by the Company’s shareholders and the High Court of Justice of England and Wales. Effective as of the close of business on July 12, 2019, all issued ordinary shares of BrightSphere Investment Group plc were exchanged on a one-for-one basis for newly issued shares of common stock of BrightSphere Investment Group Inc. As a result, all outstanding shareholders of BrightSphere Investment Group plc became common stockholders of BrightSphere Investment Group Inc. The common stock of BrightSphere Investment Group Inc. began trading on July 15, 2019, and the Company’s trading symbol on the NYSE remained unchanged as “BSIG.”
| Ownership percentage following the transactions for: | ||||||||||||||||||||||||||||||||||||||
| Date | Transaction description | Total shares | OM plc | HNA | Paulson | Note | ||||||||||||||||||||||||||||||||
| October 15, 2014 | IPO of BSIG shares by OM plc | % | % | % | (1) | |||||||||||||||||||||||||||||||||
| June 22, 2015 | Secondary public offering by OM plc | % | % | % | (2) | |||||||||||||||||||||||||||||||||
| December 16, 2016 | Secondary public offering by OM plc | % | % | % | (3) | |||||||||||||||||||||||||||||||||
| December 16, 2016 | Repurchase and retirement of shares by BSIG | % | % | % | (4) | |||||||||||||||||||||||||||||||||
| May 12, 2017 | Sale of shares from OM plc to HNA | % | % | % | (5) | |||||||||||||||||||||||||||||||||
| May 19, 2017 | Secondary public offering by OM plc | % | % | % | (6) | |||||||||||||||||||||||||||||||||
| May 19, 2017 | Repurchase and retirement of shares by BSIG | % | % | % | (4) | |||||||||||||||||||||||||||||||||
| November 10, 2017 | Sale of shares from OM plc to HNA | % | % | % | (7) | |||||||||||||||||||||||||||||||||
| November 17, 2017 | Secondary public offering by OM plc | % | % | % | (8) | |||||||||||||||||||||||||||||||||
| November 19, 2018 | Sale of shares from HNA to Paulson | % | % | % | (9) | |||||||||||||||||||||||||||||||||
| February 21, 2019 | Repurchase and retirement of shares by BSIG | % | % | % | (4) | |||||||||||||||||||||||||||||||||
| February 25, 2019 | Repurchase and retirement of shares by BSIG | % | % | % | (4) | |||||||||||||||||||||||||||||||||
| February 25, 2019 | Sale of shares from HNA to Paulson | % | % | % | (9) | |||||||||||||||||||||||||||||||||
(1)Includes 2,231,375 shares purchased by the underwriters of the offering under their overallotment option.
(2)Includes 1,995,000 shares purchased by the underwriters of the offering under their overallotment option.
(3)Includes 1,950,000 shares purchased by the underwriters of the offering under their overallotment option.
(4)Purchased pursuant to the share repurchase program described below. All shares repurchased by the Company were retired.
116
BrightSphere Investment Group Inc.
Notes to Consolidated Financial Statements (Continued)
December 31, 2020 and 2019
1) Organization and Description of the Business (cont.)
(5)Following the May 12, 2017 sale of shares from OM plc to HNA, on May 24, 2017, OM plc appointed Dr. Guang Yang of HNA as an OM plc director.
(6)Includes 2,595,000 shares purchased by the underwriters of the offering under their overallotment option.
(7)Following the November 10, 2017 sale of shares from OM plc to HNA, HNA acquired the right to appoint two directors to the Company’s board.
(8)Upon completion of the November 17, 2017 offering, OM plc indirectly owned 1,000 of the Company’s outstanding ordinary shares.
Share Repurchase Program
On February 3, 2016, the Company’s Board of Directors authorized a $150 million open market share repurchase program, which was approved by shareholders on March 15, 2016. On April 18, 2018, the Company’s Board of Directors approved an amendment to the existing share repurchase contract, to permit the repurchase of shares, from time to time, up to an aggregate limit of $600 million of shares. This amendment was subsequently approved by shareholders on June 19, 2018. For the year ended December 31, 2020, the Company repurchased 6,412,663 shares at a weighted average price of $7.15 per share, or approximately $46.0 million in total, including commissions. In 2019, the Company repurchased 19,479,945 shares at a weighted average price of $12.08 per share, or approximately $235.4 million in total, including commissions. In 2018, the Company repurchased 5,549,861 shares on the open market at a weighted average price of $13.35 per share or approximately $74.2 million in total, including commissions.
On April 29, 2016, at the Company’s Annual General Meeting, shareholders (excluding OM plc) authorized a form of contract by which the Company would be permitted to repurchase shares directly from OM plc. The shareholder authorization does not contain a maximum dollar or share amount for such purchases individually or in aggregate from OM plc. On December 16, 2016 in connection with the secondary offering by OM plc, the Company repurchased 6,000,000 shares directly from OM plc at a price of $14.25 per share. On May 19, 2017 in connection with the secondary offering by OM plc, the Company repurchased 5,000,000 shares directly from OM plc at a price of $14.55 per share.
All shares of common stock repurchased by the Company were retired.
117
BrightSphere Investment Group Inc.
Notes to Consolidated Financial Statements (Continued)
December 31, 2020 and 2019
2) Basis of Presentation and Significant Accounting Policies
The Company’s significant accounting policies are as follows:
Basis of presentation
These Consolidated Financial Statements reflect the historical balance sheets, statements of operations, statements of comprehensive income, statements of changes in shareholders’ equity and statements of cash flows of the Company. Within these Consolidated Financial Statements, OM plc, HNA, Paulson and their related entities, as defined above, are referred to as “related parties.”
The Consolidated Financial Statements are prepared in accordance with accounting principles generally accepted in the United States (“U.S. GAAP”). All dollar amounts, except per-share data in the text and tables herein, are stated in millions unless otherwise indicated. Transactions between the Company and its related parties are included in the Consolidated Financial Statements, however material intercompany balances and transactions among the Company, its consolidated Affiliates and consolidated Funds are eliminated in consolidation.
As a result of the Redomestication on July 12, 2019, discussed in Note 1, the Company revised its equity accounts to reflect a U.S. domiciled company presentation on the Consolidated Statements of Changes in Shareholders’ equity and the Consolidated Balance Sheets for all periods presented. The previously issued ordinary shares of BrightSphere Investment Group plc were exchanged on a one-for-one basis for newly issued shares of common stock of BrightSphere Investment Group Inc. The Redomestication and related internal reorganization was accounted for consistent with a reorganization of entities under common control in accordance with Accounting Standards Codification (“ASC”) 805 Business Combinations. Accordingly, the transfer of the assets and liabilities and exchange of shares was recorded in the new entity (BrightSphere Investment Group Inc.) at their carrying amounts from the transferring entity (BrightSphere Investment Group plc) at the date of transfer.
Revenue recognition
Revenue from contracts with customers
The Company recognizes revenue when a customer obtains control of promised goods or services in an amount that reflects the consideration the entity expects to receive in exchange for those goods or services.
A performance obligation is a promise in a contract to transfer a distinct good or service to the customer, and is the unit of account in accordance with the revenue recognition guidance. A contract’s transaction price is allocated to each distinct performance obligation and recognized as revenue when, or as, the performance obligation is satisfied. The majority of the Company’s contracts have a single performance obligation, as the promise to transfer the individual goods or services is not separately identifiable from other promises in the contracts and, therefore, not distinct. The Company’s management fee revenue is calculated based upon levels of assets under management multiplied by a fee rate. Management fee revenue is typically calculated on a monthly or quarterly basis, but is earned continuously as performance obligations are fulfilled. The transaction price is variable in contracts which calculate AUM on an average basis over a specified period and this variability is resolved at the end of the period, when the actual average AUM for the contract period may be calculated. The Company is able to resolve the variability and calculate the most likely amount to be recognized for any given period by estimating revenue based upon a daily average AUM. For certain of the Company’s Alternative funds, management fee revenue is calculated based on a percentage of assets under management or total capital commitments. These Alternative funds can also
118
BrightSphere Investment Group Inc.
Notes to Consolidated Financial Statements (Continued)
December 31, 2020 and 2019
2) Basis of Presentation and Significant Accounting Policies (cont.)
include “catch-up” provisions such that the Company records revenue for payments of fund management fees back to the initial closing date for funds with multiple closings, less placement fees paid to third parties related to these funds.
All of the Company’s performance obligations are satisfied ratably over time and there is no distinction in the methodology used to recognize management fee revenue in instances where there is more than one performance obligation. Typically, revenue is recognized over time using a time-based output measure to measure progress.
Management fees are recognized monthly as services are rendered. Affiliates that manage tangible property may also earn transaction fees at the time the underlying property is bought and sold. Any fees collected in advance are deferred and recognized as income over the period earned. Dividend income received is recorded on the ex-dividend date.
Performance fees are generally assessed as a percentage of the investment performance realized on a client’s account. Additionally, separate accounts or other products which primarily earn management fees are potentially subject to performance adjustments up or down based on investment performance versus benchmark. Performance fees, including those that are subject to clawback, are recognized when they (i) become billable to customers (based on contractual terms of agreements) and (ii) are not subject to contingent repayment.
The Company is required to capitalize certain costs directly related to the acquisition or fulfillment of a contract with a customer. The Company has noted no instances where sales-based compensation or similar costs met the definition of an incremental cost to acquire a contract with a customer in accordance with revenue recognition guidance. There are no instances where the Company has incurred costs to fulfill a contract with a customer, therefore no intangible assets related to contract acquisition or fulfillment have been recognized.
For each one of its contracts with customers, the Company identifies one or more performance obligations within the contract and then, for each performance obligation, determines if it is a principal (where the nature of its promise is to provide a specified good or service itself) or an agent (where the nature of its promise is to arrange for a good or service to be provided by another party). In instances where a customer reimburses the Company for a cost paid on the customer’s behalf, if the Company is acting as a principal, the reimbursement is recorded on a gross basis and if the Company is acting as an agent, the reimbursement is recorded on a net basis.
Certain Funds reimburse the Company’s Affiliates for certain expenses where the Affiliate is acting as a principal, primarily for compensation expense for field office personnel at several Timber Funds, where revenue is recognized from log and fiber sales upon delivery to the customer. Revenue from expense reimbursement is accrued at cost as the corresponding reimbursable expenses are incurred and is recorded in other revenue in the Company’s Consolidated Statements of Operations.
Revenue from other sources
Other revenue also includes interest income on cash and cash equivalents and revenue from administration and consulting services.
119
BrightSphere Investment Group Inc.
Notes to Consolidated Financial Statements (Continued)
December 31, 2020 and 2019
2) Basis of Presentation and Significant Accounting Policies (cont.)
Compensation arrangements
The Company operates short term variable compensation arrangements where generally, a percentage of each Affiliate’s annual pre-variable compensation earnings, as defined in each arrangement, is allocated to a “pool” of each respective Affiliate’s key employees and subsequently distributed to individuals subject to recommendation and approval of a remuneration committee comprised of both the Company’s and each respective Affiliate’s management. Variable compensation expense is accrued and recognized in the Consolidated Statements of Operations as services are provided by individual employees.
The Company operates longer term profit-interest plans whereby certain Affiliate key employees are granted (or have a right to purchase) awards representing a profits interest in their respective Affiliate, as distinct from an equity interest due to the lack of pari passu voting rights. Under these plans, the Company may award a portion of the aforementioned variable compensation arrangement through issuance of a profits interest in the Affiliate. The awards generally have a - to five-year vesting period from the grant date, and the service period begins at the commencement of the financial period to which the variable compensation relates. Under these plans, Affiliate key employees are eligible to share in the profits of their respective Affiliates based on their respective percentage interest held.
In addition, under certain circumstances, Affiliate key employees are eligible to receive repurchase payments upon exiting the plans based on a multiple of the last twelve months profits of their respective Affiliate, as defined. Profits allocated and movements in the potential repurchase value, determined based on a fixed multiple times trailing twelve month profits, as defined, are recognized as compensation expense. Profit interests compensation liabilities are re-measured at each reporting date at the twelve month earnings multiple, with movements treated as compensation expense in the Company’s Consolidated Statements of Operations.
Share-based compensation plans
The Company recognizes the cost of all share-based payments to directors, senior management and employees, including grants of restricted stock and stock options, as compensation expense in the Consolidated Statements of Operations over the respective vesting periods.
Awards made under the Company’s equity plans are accounted for as equity settled, and the grant date fair value is recognized as compensation expense over the requisite service period, with a corresponding contribution to additional paid-in capital. Valuation of restricted stock awards (“RSAs”) and restricted stock units (“RSUs”) is determined based on the Company’s closing share price as quoted on the New York Stock Exchange on the measurement date. For performance-based awards and stock options, a Monte-Carlo simulation model is used to determine the fair value. Key inputs for the model include: assumed reinvestment of dividends, risk-free interest rate, expected volatility and term. All excess tax benefits and deficiencies on share-based payment awards are recognized as income tax expense or benefit in the Consolidated Statements of Operations. In addition, the tax effects of exercised or vested awards are treated as discrete items in the reporting period in which they occur and excess tax benefits or deficiencies are classified with other income tax cash flows as an operating activity in the Consolidated Statements of Cash Flows. The Company recognizes forfeitures as they occur.
120
BrightSphere Investment Group Inc.
Notes to Consolidated Financial Statements (Continued)
December 31, 2020 and 2019
2) Basis of Presentation and Significant Accounting Policies (cont.)
Consolidation
Affiliates
The Company evaluates each of its Affiliates and other operating entities to determine the appropriate method of accounting. Generally, majority-owned entities or otherwise controlled investments in which the Company holds a controlling financial interest as the principal shareholder, managing member, or general partner are consolidated.
Funds
In the normal course of business, the Company’s Affiliates sponsor and manage certain investment vehicles (the “Funds”). The Company assesses consolidation requirements with respect to its Funds.
In evaluating whether or not a legal entity must be consolidated, the Company determines if such entity is a variable interest entity (“VIE”) or a voting interest entity (“VOE”). A VOE is considered an entity in which (i) the total equity investment at risk is sufficient to enable the entity to finance its activities independently and (ii) the equity holders at risk have the obligation to absorb losses, the right to receive residual returns, and the right to direct the activities of the entity that most significantly impact the entity’s economic performance. A VIE is an entity that lacks one or more of the characteristics of a VOE. Assessing whether an entity is a VIE or VOE involves judgment and analysis. Factors considered in this assessment include the entity’s legal organization, the entity’s capital structure and equity ownership and any related party or de-facto agent implications of the Company’s involvement with the entity. Investments that are determined to be VIEs are consolidated if the Company or a consolidated Affiliate is the primary beneficiary of the investment.
121
BrightSphere Investment Group Inc.
Notes to Consolidated Financial Statements (Continued)
December 31, 2020 and 2019
2) Basis of Presentation and Significant Accounting Policies (cont.)
In evaluating whether the Company is the primary beneficiary, the Company evaluates its economic interests in the entity held either directly by the Company or indirectly through related parties on a proportional basis. The primary beneficiary of the VIE is defined as the variable interest holder that has a controlling financial interest. A controlling financial interest is defined as (i) the power to direct the activities of the VIE that most significantly impacts its economic performance and (ii) the obligation to absorb losses of the entity or the right to receive benefits from the entity that could potentially be significant to the VIE. If no single party satisfies both criteria, but the Company and its related parties satisfy the criteria on a combined basis, then the primary beneficiary is the entity out of the related party group that is most closely associated to the VIE. The consolidation analysis can generally be performed qualitatively, however, if it is not readily apparent that the Company is not the primary beneficiary, a quantitative analysis may also be performed. The Company generally is not the primary beneficiary of Fund VIEs created to manage assets for clients unless the Company’s ownership interest in the fund, including interests of related parties on a proportional basis, is significant.
The Company consolidates VOEs when it has control over significant operating, financial and investing decisions of the entity or holds the majority voting interest.
Upon the occurrence of certain events (such as contributions and redemptions, either by the Company, its Affiliates, or third parties, or amendments to the governing documents of the Company’s investees or sponsored Funds) management reviews and reconsiders its previous conclusion regarding the status of an entity as a VIE or a VOE. Additionally, management continually reconsiders whether the Company is deemed to be a VIE’s primary beneficiary who consolidates such entity.
Investments and Investment Transactions
Valuation of investments held at fair value
Valuation of Fund investments, including Timber Funds, is evaluated pursuant to the fair value methodology discussed below. Other investments are categorized as trading and recorded at estimated fair value. Realized and unrealized gains and losses arising from changes in fair value of investments are reported within net consolidated funds’ investment gains and losses in the Consolidated Statements of Operations. See Note 5 for a summary of the inputs utilized to determine the fair value of other investments held at fair value.
Security transactions
The Company generally records securities transactions on a trade-date basis. Realized gains and losses on securities transactions are generally determined on the average-cost method (net of foreign capital gain taxes) and for certain transactions determined based on the specific identification method.
Income and expense recognition
The Company records interest income on an accrual basis and includes amortization of premiums and accretion of discounts. Dividend income is recorded on the ex-dividend date, net of applicable withholding taxes. Expenses are recorded on an accrual basis.
122
BrightSphere Investment Group Inc.
Notes to Consolidated Financial Statements (Continued)
December 31, 2020 and 2019
2) Basis of Presentation and Significant Accounting Policies (cont.)
Short sales
Certain Funds may sell a security they do not own in anticipation of a decline in the fair value of that security. When a Fund sells a security short, it must borrow the security sold short and deliver it to the broker-dealer through which it made the short sale. The short sales are secured by the long portfolio and available cash. The Fund records a gain, limited to the price at which the Fund sold the security short, or a loss, unlimited in size, upon the termination of a short sale. The amount of the gain or loss will be equal to the proceeds received in entering into the short sale less the cost of buying back the short security to close the short position. While the transaction is open, the Fund will incur an expense for any accrued dividends or interest which is paid to the lender of the securities. These short sales may involve a level of risk in excess of the liability recognized in the accompanying Consolidated Balance Sheets. The extent of such risk cannot be quantified.
Funds’ Derivatives
Certain Funds may use derivative instruments. The Funds’ derivative instruments may include foreign currency exchange contracts, credit default swaps, interest rate swaps, financial futures contracts and warrants. The fair values of derivative instruments are recorded as other assets of consolidated Funds or other liabilities of consolidated Funds on the Company’s Consolidated Balance Sheets. The Funds have used foreign exchange forwards to hedge the risk of movement in exchange rates on financial assets on a limited basis.
The Company’s Funds have not designated any financial instruments for hedge accounting, as defined in the accounting literature, during the periods presented. The gains or losses on Fund’s derivative instruments not designated for hedge accounting are included as net consolidated Funds gains or losses in the Company’s Consolidated Statements of Operations.
Foreign currency translation and transactions
Assets and liabilities of non-U.S. entities for which the local currency is the functional currency are translated at current exchange rates as of the end of the accounting period. The related revenues and expenses are translated at average exchange rates in effect during the period. Net exchange gains and losses resulting from translation are excluded from income and are recorded as part of accumulated other comprehensive income (loss). Transactions denominated in a foreign currency are revalued at the current exchange rate at the transaction date and any related gains and losses are recognized in earnings.
Equity method investments
The Company uses the equity method of accounting for investments that provide the Company with the ability to exercise significant influence over an entity, but that do not meet the requirements for consolidation. Equity method investments includes an Affiliate, Investment Counselors of Maryland, LLC, as well as all unconsolidated Funds over which the Company exercises significant influence.
123
BrightSphere Investment Group Inc.
Notes to Consolidated Financial Statements (Continued)
December 31, 2020 and 2019
2) Basis of Presentation and Significant Accounting Policies (cont.)
Fair value measurements
In accordance with the accounting standards for fair value measurements, fair value is the price that the Company expects to be paid upon the sale of an asset or expects to pay upon the transfer of a liability in an orderly transaction between market participants. There is a three-level hierarchy for fair value measurements based upon the transparency of inputs to the valuation of an asset or liability. Inputs may be observable or unobservable and refer broadly to the assumptions that market participants would use in pricing the asset or liability. Observable inputs reflect the assumptions market participants would use in pricing the asset or liability based on market data obtained from independent sources. Unobservable inputs reflect the Company’s own conclusions about the assumptions that market participants would use in pricing the asset or liability based on the best information available in the circumstances. Each investment is assigned a level based upon the observability of the inputs which are significant to the overall valuation. Assets and liabilities measured and reported at fair value are classified and disclosed in one of the following categories:
•Level I—Quoted prices are available in active markets for identical investments as of the reporting date. The type of investments included in Level I include listed equities and listed derivatives. As required by U.S. GAAP, the Company does not adjust the quoted price for these investments.
•Level II—Pricing inputs are other than quoted prices in active markets, which are either directly or indirectly observable as of the reporting date, and fair value is determined through the use of models or other valuation methodologies utilizing observable market inputs other than quoted prices. Investments which are generally included in this category include corporate bonds and loans, less liquid and restricted equity securities and certain over-the-counter derivatives.
•Level III—Pricing inputs are unobservable for the asset or liability and include assets and liabilities where there is little, if any, market activity for the investment. The inputs into the determination of fair value require significant management judgment or estimation. Investments that are included in this category generally include general and limited partner interests in timber funds, corporate private equity, real estate funds, and funds of hedge funds.
In certain cases, the inputs used to measure fair value may fall into different levels of the fair value hierarchy. In such cases, an investment’s level within the fair value hierarchy is based on the lowest level of input that is significant to the fair value measurement. The Company’s assessment of the significance of a particular input to the fair value measurement in its entirety requires judgment and considers factors specific to the investment. In cases in which the fair value of an investment is established using the net asset value (or its equivalent) as a practical expedient, the investment is not categorized within the fair value hierarchy.
124
BrightSphere Investment Group Inc.
Notes to Consolidated Financial Statements (Continued)
December 31, 2020 and 2019
2) Basis of Presentation and Significant Accounting Policies (cont.)
Use of estimates
The preparation of these Consolidated Financial Statements requires management to make estimates and assumptions that affect the reported amounts of assets and liabilities, the disclosure of contingent assets and liabilities at the date of the financial statements and the reported amounts of revenues and expenses during the period. The year ended December 31, 2020 was characterized by heightened uncertainty due to the COVID-19 pandemic which could impact estimates and assumptions made by management. Actual results could differ significantly from those estimates.
Derivatives and Hedging
The Company may utilize derivative financial instruments to hedge the risk of movement of interest rates and foreign currency on financial assets and liabilities. These derivative financial instruments may or may not qualify as hedges for accounting purposes. The Company records all derivative financial instruments as either assets or liabilities on its Consolidated Balance Sheets and measures these instruments at fair value. For a derivative financial instrument that qualifies as a hedge for accounting purposes and is designated as a hedging instrument, the effective portion of the derivative’s gain or loss is initially reported as a component of other comprehensive income (loss) and subsequently reclassified into earnings over the life of the hedge. The ineffective portion of the gain or loss is recognized in earnings immediately.
Cash and cash equivalents
The Company considers all highly liquid investments, including money market mutual funds, with original maturities of three months or less to be cash equivalents. Cash equivalents are stated at cost, which approximates market value due to the short-term maturity of these investments. Restricted cash represents amounts held in escrow related to the Company's disposition of Barrow Hanley.
Cash held by consolidated Funds is not available to fund general liquidity needs of the Company and is therefore also classified as restricted cash.
125
BrightSphere Investment Group Inc.
Notes to Consolidated Financial Statements (Continued)
December 31, 2020 and 2019
2) Basis of Presentation and Significant Accounting Policies (cont.)
Fixed assets
Fixed assets are recorded at historical cost and depreciated using the straight-line method over its estimated useful lives. The estimated useful lives of office equipment and furniture and fixtures range from to five years . Leasehold improvements are amortized over the shorter of their estimated useful lives or the remaining term of the lease. Computer software developed or obtained for internal use capitalized during the application development stage is amortized using the straight-line method over the estimated useful life of the software, which is generally seven years or less. The estimated useful life of building assets is thirty-nine years . The costs of improvements that extend the life of a fixed asset are capitalized, while the costs of repairs and maintenance are expensed as incurred.
Intangible assets
Acquired Affiliates have identifiable intangible assets arising from contractual or other legal rights with their clients. In determining the value of acquired intangibles, the Company analyzes the net present value of each acquired Affiliate’s existing client relationships based on a number of factors. The Company analyzes the Affiliate’s historical and potential future operating performance, the Affiliate’s historical and potential future rates of attrition among existing clients, the stability and longevity of existing client relationships, the Affiliate’s recent and long-term investment performance, the characteristics of the firm’s products and investment styles, the stability and depth of the Affiliate’s management team and the Affiliate’s history and perceived franchise or brand value. The Company’s acquired intangible assets are predominately definite-life intangible assets and are generally amortized on a straight-line basis over their estimated useful lives, ranging from to sixteen years , reflecting the expected duration of such relationships. The Company also holds an indefinite-life intangible asset related to the trade name associated with the Landmark acquisition.
The Company tests for the possible impairment of definite-life intangibles whenever events or changes in circumstances indicate that the carrying amount of the asset is not recoverable. If such indicators exist, the Company compares the undiscounted cash flows related to the asset to the carrying value of the asset. If the carrying value is greater than the undiscounted cash flows amount, an impairment charge is recorded in the Consolidated Statements of Operations for amounts necessary to reduce the carrying value of the asset to fair value. Indefinite-life intangible assets are tested for impairment annually as of the first business day of the fourth quarter or more frequently if events or changes in circumstances indicate that the asset might be impaired.
Goodwill
The Company records goodwill when the consideration paid in a business acquisition exceeds the fair value of the net total of tangible assets acquired, identifiable intangible assets acquired and liabilities assumed. Goodwill is not amortized, but rather is tested for impairment annually or more frequently if events or circumstances occur that indicate impairment may exist. Factors that could trigger an impairment review include significant underperformance relative to historical or projected future operating results, significant changes in the Company’s use of the acquired assets in a business combination or the strategy for the Company’s overall business, and significant negative industry or economic trends.
126
BrightSphere Investment Group Inc.
Notes to Consolidated Financial Statements (Continued)
December 31, 2020 and 2019
2) Basis of Presentation and Significant Accounting Policies (cont.)
Assets Held for Sale
The Company classifies its long-lived assets to be sold as held for sale in the period (i) it has approved and committed to a plan to sell the asset, (ii) the asset is available for immediate sale in its present condition, (iii) an active program to locate a buyer and other actions required to sell the asset have been initiated, (iv) the sale of the asset is probable, (v) the asset is being actively marketed for sale at a price that is reasonable in relation to its current fair value, and (vi) it is unlikely that significant changes to the plan will be made or that the plan will be withdrawn. The Company initially measures a long-lived asset that is classified as held for sale at the lower of its carrying value or fair value less any costs to sell. Any loss resulting from this measurement is recognized in the period in which the held for sale criteria are met. Conversely, gains are not recognized on the sale of a long-lived asset until the date of sale. Upon designation as an asset held for sale, the Company stops recording depreciation expense on the asset. The Company assesses the fair value of a long-lived asset less any costs to sell at each reporting period and until the asset is no longer classified as held for sale.
127
BrightSphere Investment Group Inc.
Notes to Consolidated Financial Statements (Continued)
December 31, 2020 and 2019
2) Basis of Presentation and Significant Accounting Policies (cont.)
Leases
Contracts are evaluated at inception to determine whether such contract is or contains a lease. The Company leases certain office space and equipment under non-cancelable operating leases. As leases expire, they are normally renewed or replaced in the ordinary course of business. Lease agreements may contain renewal options exercisable by the Company, rent escalation clauses and/or other incentives provided by the landlord. Renewal options that have been determined to be reasonably certain to be exercised are included in the lease term. Rights and obligations attributable to identified leases with a term in excess of twelve months are recognized on the Company’s Consolidated Balance Sheets in the form of right‐of‐use (ROU) assets and lease liabilities are recognized as of the date the underlying assets are available for use, which may be the date the Company gains access to begin leasehold improvements. Lease payments related to short‐term leases with a term of twelve months or less are recognized on a straight‐line basis as short‐term lease expense.
Lease liabilities are initially and subsequently measured as the present value of future lease payments over the lease term. For the purposes of this calculation, lease payments consist of fixed monthly lease payments related to use of the underlying assets. As the Company's leases generally do not have a readily determinable implicit rate, the company uses its incremental borrowing rate to determine the present value of fixed lease payments based on information available at the lease commencement date.
ROU assets are initially valued equal to the corresponding lease liabilities, adjusted for any lease incentives payable to the Company. Subsequently, the amortization of ROU assets is recognized as a component of operating lease expense. The total cost of operating leases is recognized on a straight‐line basis over the life of the related leases, and is composed of imputed interest on lease liabilities measured using the effective interest method and amortization of the ROU asset. Variable lease payments are primarily related to services such as common‐area maintenance and utilities, property taxes and insurance, and are recognized as variable lease expense when incurred.
Earnings per share
The Company calculates basic and diluted earnings per share (“EPS”) by dividing net income by its shares outstanding as outlined below. Basic EPS attributable to the Company’s shareholders is calculated by dividing “Net income attributable to controlling interests” by the weighted-average number of shares outstanding. Diluted EPS is similar to basic EPS, but adjusts for the effect of potential shares of common stock unless they are antidilutive. For periods with a net loss, potential shares of common stock are considered antidilutive.
The Company considers two ways to measure dilution to earnings per share: (a) calculate the net number of shares that would be issued assuming any related proceeds are used to buy back outstanding shares (the treasury stock method), or (b) assume the gross number of shares are issued and calculate any related effects on net income available for shareholders (the if-converted or two-class method). As appropriate, the Company’s policy is to apply the more dilutive methodology upon issuance of such instruments.
128
BrightSphere Investment Group Inc.
Notes to Consolidated Financial Statements (Continued)
December 31, 2020 and 2019
2) Basis of Presentation and Significant Accounting Policies (cont.)
Deferred financing costs
The Company records debt issuance costs of term loans as a direct deduction from the carrying amount of the associated debt liability. For debt issuance costs of revolving credit loans, the Company presents debt issuance costs as an asset and subsequently amortizes the deferred costs ratably over the term of the agreement.
Income taxes
Deferred income taxes are recognized for the effects of temporary differences between the tax basis of an asset or liability and its reported amount in the Consolidated Financial Statements. Deferred tax assets and liabilities are measured using enacted tax rates expected to apply to taxable income in the years in which those temporary differences are expected to be recovered or settled. The effect of a change in tax rates on deferred tax assets and liabilities is recognized in income in the period that includes the enactment date. The Company’s deferred tax assets have been attributable to interest deductions, investment in partnerships, and employee compensation.
Deferred income tax assets are subject to a valuation allowance if, in management’s opinion, it is not more-likely-than-not that these benefits will be realized. In evaluating the Company’s ability to recover its deferred tax assets, the Company considers all available positive and negative evidence including its past operating results, the existence of cumulative earnings or losses in the most recent years and its forecast of future taxable income. In estimating future taxable income, the Company develops assumptions including the amount of future pre-tax operating income and the reversal of temporary differences. These assumptions require significant judgment about the forecasts of future taxable income and are consistent with the plans and estimates the Company is using to manage the underlying businesses.
The Company’s accounting policy is to treat the global intangible low-taxed income taxes which became effective January 1, 2018 as a result of the Tax Cuts and Jobs Act as period costs in the accounting and tax periods in which they are incurred.
A tax benefit should only be recognized if it is more-likely-than-not that the position will be sustained based on its technical merits. The Company recognizes the financial statement benefit of a tax position only after considering the probability that a tax authority would uphold the position in an examination. For tax positions meeting a “more-likely-than-not” threshold, the amount recognized in the financial statements is the largest cumulative amount of benefit greater than 50% likely of being sustained. The more-likely-than-not threshold must continue to be met in each reporting period to support continued recognition of the benefit. Unrecognized tax benefits and related interest and penalties, are adjusted periodically to reflect changing facts and circumstances. The Company’s accounting policy is to classify interest and related charges as a component of income tax expense.
Non-controlling interests
For certain entities that are consolidated, but not 100% owned, the Company reports non-controlling interests as equity on its Consolidated Balance Sheets. The Company's consolidated net income on the Consolidated Statements of Operations includes the income (loss) attributable to non-controlling interest holders of the Company's consolidated Affiliates and Funds. Ownership interests held by Affiliate key employees are categorized as liabilities on the Consolidated Balance Sheets and are revalued each reporting date, with movements treated as compensation expense in the Consolidated Statements of Operations.
129
BrightSphere Investment Group Inc.
Notes to Consolidated Financial Statements (Continued)
December 31, 2020 and 2019
2) Basis of Presentation and Significant Accounting Policies (cont.)
Redeemable non-controlling interests
The Company includes redeemable non-controlling interests related to certain consolidated Funds as temporary equity on the Consolidated Balance Sheets. Non-controlling interests in certain consolidated Funds are subject to monthly or quarterly redemption by the investors. When redeemable amounts become legally payable to investors, they are classified as a liability and included in total liabilities of consolidated Funds on the Consolidated Balance Sheets.
Other comprehensive income (loss)
Other comprehensive income (loss) is defined as the change in equity of a business enterprise during a period from transactions and other events and circumstances, excluding those resulting from investments by and distributions to owners. For the Company’s purposes, comprehensive income (loss) represents net income (loss), as presented in the accompanying Consolidated Statements of Operations, adjusted for net foreign currency translation adjustments and adjustments to the valuation and amortization of certain derivative securities, net of tax.
Recently adopted accounting standards
In August 2018, the FASB issued ASU 2018-13, Fair Value Measurement (Topic 820). This standard modifies the disclosure requirements on fair value measurements and is effective for fiscal years, and interim periods within those fiscal years, beginning after December 15, 2019. The Company adopted the standard on January 1, 2020. This guidance removes the disclosure requirements for the valuation processes for Level III fair value measurements. This guidance also adds new disclosure requirements for the range and weighted average of significant unobservable inputs used to develop fair value measurements categorized within Level III of the fair value hierarchy. The Company has determined that the adoption of this standard did not have a material impact on its Consolidated Financial Statements and related disclosures.
Accounting standards not yet adopted
The Company has considered all other newly issued accounting guidance that is applicable to the Company’s operations and the preparation of the Consolidated Financial Statements, including those that have not yet been adopted. The Company does not believe that any such guidance has or will have a material effect on its Consolidated Financial Statements and related disclosures.
130
BrightSphere Investment Group Inc.
Notes to Consolidated Financial Statements (Continued)
December 31, 2020 and 2019
3) Divestitures
Copper Rock Capital Partners LLC
On July 24, 2020 the Company completed the sale of all of its equity interests in Copper Rock to Spouting Rock Asset Management LLC. The Company recognized a pre-tax gain of $7.2 million during the year ended December 31, 2020.
Barrow, Hanley, Mewhinney & Strauss LLC
On November 17, 2020 the Company completed the sale of all its interests in Barrow Hanley to Perpetual U.S. Holdings Company Inc. (“Perpetual”) for cash consideration totaling $292.3 million. The Company recognized a pre-tax gain of $231.2 million during the year ended December 31, 2020. Operational information for Barrow Hanley is included in the Company’s Liquid Alpha segment until November 17, 2020, the consummation of the sale. Barrow Hanley’s income from continuing operations before taxes was $38.2 million, $106.0 million, and $88.7 million for the year ended December 31, 2020, 2019, and 2018 respectively. The Company also redeemed seed investments of $49.0 million in Barrow Hanley’s investment products as of November 17, 2020 upon consummation of the sale.
Analytic Investors LLC
The Company recorded a pre-tax gain of $2.9 million during the year ended December 31, 2020 upon receipt of cash proceeds from a previously disposed of Affiliate, Analytic Investors LLC.
131
BrightSphere Investment Group Inc.
Notes to Consolidated Financial Statements (Continued)
December 31, 2020 and 2019
4) Investments
Investments are comprised of the following at December 31 (in millions):
| 2020 | 2019 | ||||||||||
Investments of consolidated Funds held at fair value | $ | $ | |||||||||
| Other investments held at fair value | |||||||||||
| Investments related to long-term incentive compensation plans held at fair value | |||||||||||
| Total investments held at fair value | $ | $ | |||||||||
Equity-accounted investments in Affiliate and consolidated Funds(1) | |||||||||||
| Total investments per Consolidated Balance Sheets | $ | $ | |||||||||
In August 2017, the Company executed a non-binding term sheet to sell its stake in Heitman LLC (“Heitman”) to Heitman’s management for cash consideration totaling $110 million. Pursuant to this term sheet, BSIG entered into a redemption agreement on November 17, 2017 and the Company reclassified its investment in Heitman to a cost-method investment. This transaction closed on January 5, 2018 and resulted in a gain of $65.7 million included in the table below.
Investment income is comprised of the following for the years ended December 31 (in millions):
| 2020 | 2019 | 2018 | |||||||||||||||
Realized and unrealized gains (losses) on other investments held at fair value | ( | ||||||||||||||||
| Earnings from equity-accounted investments in Affiliate (Note 7) | |||||||||||||||||
Gain on sale of Affiliate carried at cost | |||||||||||||||||
Total investment income per Consolidated Statements of Operations | $ | $ | $ | ||||||||||||||
Investment gains (losses) on net consolidated funds is comprised of the following for the years ended December 31 (in millions):
| 2020 | 2019 | 2018 | |||||||||||||||
Realized and unrealized gains (losses) on consolidated Funds held at fair value | $ | ( | $ | $ | ( | ||||||||||||
| Earnings from equity-accounted investments | |||||||||||||||||
Total net consolidated Funds’ investment gains (losses) per Consolidated Statements of Operations | $ | $ | $ | ( | |||||||||||||
132
BrightSphere Investment Group Inc.
Notes to Consolidated Financial Statements (Continued)
December 31, 2020 and 2019
5) Fair Value Measurements
The following table summarizes the Company’s assets and liabilities that are measured at fair value on a recurring basis at December 31, 2020 (in millions):
| Quoted prices in active markets (Level I) | Significant other observable inputs (Level II) | Significant unobservable inputs (Level III) | Uncategorized | Total value, December 31, 2020 | |||||||||||||||||||||||||
| Assets of BSIG | |||||||||||||||||||||||||||||
Investments in separate accounts(1) | — | ||||||||||||||||||||||||||||
Investments related to long-term incentive compensation plans(2) | — | ||||||||||||||||||||||||||||
Investments in unconsolidated Funds(3) | |||||||||||||||||||||||||||||
| Total fair value assets | $ | $ | $ | $ | $ | ||||||||||||||||||||||||
The following table summarizes the Company’s assets and liabilities that are measured at fair value on a recurring basis at December 31, 2019 (in millions):
| Quoted prices in active markets (Level I) | Significant other observable inputs (Level II) | Significant unobservable inputs (Level III) | Uncategorized | Total value, December 31, 2019 | |||||||||||||||||||||||||
Assets of BSIG and consolidated Funds(4) | |||||||||||||||||||||||||||||
| Common and preferred stock | $ | $ | $ | $ | — | $ | |||||||||||||||||||||||
| Short-term investment funds | — | ||||||||||||||||||||||||||||
| Bank loans | — | ||||||||||||||||||||||||||||
| Derivatives | — | ||||||||||||||||||||||||||||
| Consolidated Funds total | |||||||||||||||||||||||||||||
Investments in separate accounts(1) | — | ||||||||||||||||||||||||||||
Investments related to long-term incentive compensation plans(2) | — | ||||||||||||||||||||||||||||
Investments in unconsolidated Funds(3) | |||||||||||||||||||||||||||||
| BSIG total | |||||||||||||||||||||||||||||
| Total fair value assets | $ | $ | $ | $ | $ | ||||||||||||||||||||||||
Liabilities of BSIG and consolidated Funds(4) | |||||||||||||||||||||||||||||
| Common stock | $ | ( | $ | $ | $ | — | $ | ( | |||||||||||||||||||||
| Derivatives | ( | ( | — | ( | |||||||||||||||||||||||||
| Consolidated Funds total | ( | ( | ( | ||||||||||||||||||||||||||
| Total fair value liabilities | $ | ( | $ | ( | $ | $ | $ | ( | |||||||||||||||||||||
133
BrightSphere Investment Group Inc.
Notes to Consolidated Financial Statements (Continued)
December 31, 2020 and 2019
5) Fair Value Measurements (cont.)
(1)Investments in separate accounts of $21.3 million at December 31, 2020 consist of approximately 11 % of cash equivalents and 89 % of equity securities, fixed income securities, and other investments. Investments in separate accounts of $44.3 million at December 31, 2019, consist of approximately 3 % of cash equivalents and 97 % of equity securities. The Company values these using the published price of the underlying securities (classified as Level I) or quoted price supported by observable inputs as of the measurement date (classified as Level II).
(2)Investments related to long-term incentive compensation plans of $73.0 million and $88.8 million at December 31, 2020 and December 31, 2019, respectively, are investments in publicly registered daily redeemable funds (some managed by Affiliates), which the Company has classified as trading securities and valued using the published price as of the measurement dates. Accordingly, the Company has classified these investments as Level I.
(3)The uncategorized amounts of $16.2 million and $48.2 million at December 31, 2020 and December 31, 2019, respectively, relate to investments in unconsolidated Funds which consist primarily of investments in Funds advised by Affiliates and are valued using NAV which the Company relies on to determine their fair value as a practical expedient and has therefore not classified these investments in the fair value hierarchy. The fair value amounts presented in this table are intended to permit reconciliation of the fair value hierarchy to amounts presented in the Consolidated Balance Sheets. These unconsolidated Funds consist primarily of real estate investments Funds, UCITS and other investment vehicles. The NAVs that have been provided by investees have been derived from the fair values of the underlying investments as of the measurement dates. UCITS and other investment vehicles are not subject to redemption restrictions.
The real estate investment Funds of $6.2 million and $6.4 million at December 31, 2020 and December 31, 2019, respectively, are subject to longer than monthly or quarterly redemption restrictions, and due to their nature, distributions are received only as cash flows are generated from underlying assets over the life of the Funds. The range of time over which the underlying assets are expected to be liquidated by the investees is approximately to eleven years from December 31, 2020. The valuation process for the underlying real estate investments held by the real estate investment Funds begins with each property or loan being valued by the investment teams. The valuations are then reviewed and approved by the valuation committee, which consists of senior members of the portfolio management, acquisitions, and research teams. For certain properties and loans, the valuation process may also include a valuation by independent appraisers. In connection with this process, changes in fair-value measurements from period to period are evaluated for reasonableness, considering items such as market rents, capitalization and discount rates, and general economic and market conditions.
Investments in unconsolidated Funds categorized as Level III of $2.6 million and $3.0 million at December 31, 2020 and December 31, 2019, respectively, related to investments in Forestry Funds advised by Affiliates and are valued by the general partner of those Funds. Determination of estimated fair value involves subjective judgment because the actual fair value can be determined only through negotiation between parties in a sale transaction and amounts ultimately realized may vary significantly from the fair value presented.
(4)Assets and liabilities measured at fair value are comprised of financial investments managed by the Company’s Affiliates.
134
BrightSphere Investment Group Inc.
Notes to Consolidated Financial Statements (Continued)
December 31, 2020 and 2019
5) Fair Value Measurements (cont.)
Equity securities, including common and preferred stock, short-term investment funds, other investments and derivatives which are traded on a national securities exchange are stated at the last reported sales price on the day of valuation. To the extent these securities are actively traded and valuation adjustments are not applied, they are classified as Level I. The securities that trade in markets that are not considered to be active but are valued based on quoted market prices, dealer quotations or alternative pricing sources supported by observable inputs obtained by the Company from independent pricing services are classified as Level II.
The Company obtains prices from independent pricing services that may utilize broker quotes, but generally the independent pricing services will use various other pricing techniques which take into account appropriate factors such as yield, quality, coupon rate, maturity, type of issue, trading characteristics and other data. The Company has not made adjustments to the prices provided. Assets of consolidated Funds also include investments in bank loans. Interests in senior floating-rate loans for which reliable market participant quotations are readily available are valued at the average mid-point of bid and ask quotations obtained from a third-party pricing service. These assets are classified as Level II. If the pricing services are only able to (a) obtain a single broker quote or (b) utilize a pricing model, such securities are classified as Level III. If the pricing services are unable to provide prices, the Company attempts to obtain one or more broker quotes directly from a dealer or values such securities at the last bid price obtained. In either case, such securities are classified as Level III. The Company performs due diligence procedures over third party pricing vendors to understand their methodology and controls to support their use in the valuation process to ensure compliance with required accounting disclosures.
The following table reconciles the opening balances of Level III financial assets to closing balances at December 31 (in millions):
| Investments in unconsolidated Funds | 2020 | 2019 | |||||||||
| Level III financial assets | |||||||||||
| At beginning of the period | $ | $ | |||||||||
Additions (redemptions) | ( | ||||||||||
Total net fair value losses recognized in net income | ( | ||||||||||
Total Level III financial assets | $ | $ | |||||||||
There were no significant transfers of financial assets or liabilities between Levels II or III during the year ended December 31, 2020.
135
BrightSphere Investment Group Inc.
Notes to Consolidated Financial Statements (Continued)
December 31, 2020 and 2019
6) Variable Interest Entities
The Company, through its Affiliates, sponsors the formation of various entities considered to be variable interest entities (“VIEs”). These VIEs are primarily Funds managed by Affiliates and other partnership interests typically owned entirely by third-party investors. Certain Funds may be capitalized with seed capital investments from the Company and may be owned partially by Affiliate key employees and/or individuals that own minority interests in an Affiliate.
The Company’s determination of whether it is the primary beneficiary of a Fund that is a VIE is based in part on an assessment of whether or not the Company and its related parties are exposed to absorb more than an insignificant amount of the risks and rewards of the entity. Typically the Fund’s investors are entitled to substantially all of the economics of these VIEs with the exception of the management fees and performance fees, if any, earned by the Company or any investment the Company has made into the Funds. The Company generally is not the primary beneficiary of Fund VIEs created to manage assets for clients unless the Company’s ownership interest, including interests of related parties, is substantial.
The following table presents the assets and liabilities of Funds that are VIEs and consolidated by the Company (in millions):
| 2020 | 2019 | ||||||||||
| Assets | |||||||||||
| Investments at fair value | $ | $ | |||||||||
| Other assets of consolidated Funds | |||||||||||
| Total Assets | $ | $ | |||||||||
| Liabilities | |||||||||||
| Liabilities of consolidated Funds | $ | $ | |||||||||
| Total Liabilities | $ | $ | |||||||||
“Investments at fair value” consist of investments in bank loans, common and preferred stock, and other securities. To the extent the Company also has consolidated Funds that are not VIEs, the assets and liabilities of those Funds are not included in the table above. “Other assets of consolidated Funds” consist of assets of consolidated Funds, which is comprised of investments in partnership interests where a portion of return includes carried interest that are accounted for within the scope of ASC 323, Investments - Equity Method and Joint Ventures because the Company has determined it has significant influence.
The assets of consolidated VIEs presented in the table above belong to the investors in those Funds, are available for use only by the Fund to which they belong, and are not available for use by the Company to the extent they are held by non-controlling interests. Any debt or liabilities held by consolidated Funds have no recourse to the Company's general credit.
The Company’s involvement with Funds that are VIEs and not consolidated by the Company is generally limited to that of an investment manager and its investment in the unconsolidated VIE, if any. The Company’s investment in any unconsolidated VIE generally represents an insignificant interest of the Fund’s net assets and assets under management, such that the majority of the VIE’s results are attributable to third parties. The Company’s exposure to risk in these entities is generally limited to any capital contribution it has made or is required to make and any
136
BrightSphere Investment Group Inc.
Notes to Consolidated Financial Statements (Continued)
December 31, 2020 and 2019
6) Variable Interest Entities (cont.)
The following information pertains to unconsolidated VIEs for which the Company holds a variable interest at December 31 (in millions):
| 2020 | 2019 | ||||||||||
| Unconsolidated VIE assets | $ | $ | |||||||||
| Unconsolidated VIE liabilities | $ | $ | |||||||||
| Equity interests on the Consolidated Balance Sheets | $ | $ | |||||||||
Maximum risk of loss(1) | $ | $ | |||||||||
(1)Includes equity investments the Company has made or is required to make and any earned but uncollected management and incentive fees. The Company does not record performance or incentive allocations until the respective measurement period has ended.
137
BrightSphere Investment Group Inc.
Notes to Consolidated Financial Statements (Continued)
December 31, 2020 and 2019
7) Equity Accounted Investees
The following tables present summarized financial information for an Affiliate accounted for under the equity method (in millions):
| For the year ended December 31, | ||||||||||||||||||||
| Statements of Income | 2020 | 2019 | 2018 | |||||||||||||||||
| Net revenues | $ | $ | $ | |||||||||||||||||
| Operating income | ||||||||||||||||||||
| Income before income taxes | ||||||||||||||||||||
| Exclude: non-controlling interests income | ||||||||||||||||||||
| Net income attributable to controlling interests | $ | $ | $ | |||||||||||||||||
BSIG equity in net income of equity method investee(1) | $ | $ | $ | |||||||||||||||||
| As of December 31, | |||||||||||
| Balance Sheets | 2020 | 2019 | |||||||||
| Total assets | $ | $ | |||||||||
| Total liabilities | |||||||||||
Non-controlling interests in subsidiaries | |||||||||||
| Members’ equity | $ | $ | |||||||||
BSIG equity investment and undistributed earnings of affiliated companies, before consolidating and reconciling adjustments | $ | $ | |||||||||
| BSIG investment in equity method investee | $ | $ | |||||||||
(1)ICM, an equity-accounted Affiliate, uses a revenue share model.
138
BrightSphere Investment Group Inc.
Notes to Consolidated Financial Statements (Continued)
December 31, 2020 and 2019
8) Fixed Assets
Fixed assets consisted of the following at December 31 (in millions):
| 2020 | 2019 | ||||||||||
| Leasehold improvements | $ | $ | |||||||||
| Office equipment | |||||||||||
| Furniture and fixtures | |||||||||||
| Building | |||||||||||
| Software and web development | |||||||||||
| Fixed assets, at cost | |||||||||||
| Accumulated depreciation and amortization | ( | ( | |||||||||
| Fixed assets, net | $ | $ | |||||||||
Depreciation and amortization expense for continuing operations was $21.0 million, $17.2 million and $14.5 million for the years ended December 31, 2020, 2019 and 2018, respectively.
9) Leases
The Company has operating leases for corporate offices, data centers, vehicles and certain equipment. The operating leases have remaining lease terms of 1 year to 13 years, some of which include options to extend the leases for up to 5 years, and some of which include options to terminate the leases within 1 year.
The following table summarizes information about the Company’s operating leases for the years ended December 31 (in millions):
| 2020 | 2019 | ||||||||||
| Operating lease cost | $ | $ | |||||||||
| Variable lease cost | |||||||||||
| Sublease income | ( | $ | |||||||||
| Total operating lease expense | $ | $ | |||||||||
Cash paid for amounts included in the measurement of lease liabilities: | |||||||||||
| Operating cash flows from operating leases | $ | $ | |||||||||
ROU asset obtained in exchange for new operating lease liabilities | |||||||||||
In determining the incremental borrowing rate, the Company considered the interest rate yield for the specific interest rate environment and the Company’s credit spread at the inception of the lease. For the years ended December 31, 2020 and 2019, the weighted average remaining lease term was 11.3 years and 4.3 years, respectively, and the weighted average discount rate was 3.5 % and 4.14 %, respectively.
139
BrightSphere Investment Group Inc.
Notes to Consolidated Financial Statements (Continued)
December 31, 2020 and 2019
9) Leases (cont.)
Maturities of operating lease liabilities were as follows (in millions):
| Operating Leases | |||||
| Year Ending December 31, | |||||
| 2021 | $ | ||||
| 2022 | |||||
| 2023 | |||||
| 2024 | |||||
| 2025 | |||||
| Thereafter | |||||
| Total lease payments | |||||
| Less imputed interest | ( | ||||
| Total | $ | ||||
10) Goodwill and Intangible Assets
The following table presents the changes in goodwill in 2020 and 2019 (in millions):
| Quant & Solutions | Alternatives | Liquid Alpha | Total | ||||||||||||||||||||
| Goodwill | $ | $ | $ | $ | |||||||||||||||||||
| Accumulated impairment | ( | ( | ( | ( | |||||||||||||||||||
| December 31, 2018 | $ | $ | $ | $ | |||||||||||||||||||
| Additions | |||||||||||||||||||||||
| Impairments | |||||||||||||||||||||||
| Disposals | |||||||||||||||||||||||
| Goodwill | |||||||||||||||||||||||
| Accumulated impairment | ( | ( | ( | ( | |||||||||||||||||||
| December 31, 2019 | $ | $ | $ | $ | |||||||||||||||||||
| Additions | |||||||||||||||||||||||
| Impairments | ( | ( | |||||||||||||||||||||
Disposals (1) | ( | ( | |||||||||||||||||||||
| Goodwill | |||||||||||||||||||||||
| Accumulated impairment | ( | ( | ( | ( | |||||||||||||||||||
| December 31, 2020 | $ | $ | $ | $ | |||||||||||||||||||
140
BrightSphere Investment Group Inc.
Notes to Consolidated Financial Statements (Continued)
December 31, 2020 and 2019
10) Goodwill and Intangible Assets (cont.)
The 2019 annual impairment assessment determined that no impairment existed at the annual assessment date. Due to the decline in the Company’s assets under management for the three months ended March 31, 2020, management determined that an interim impairment assessment was necessary as of March 31, 2020 with respect to the Copper Rock reporting unit. In the first quarter of 2020, the Company performed a quantitative impairment test for the Copper Rock reporting unit which was included within the Liquid Alpha segment prior to its disposition in July 2020. The quantitative impairment test concluded that the fair value of the reporting unit did not exceed its carrying value. Accordingly, the Company recognized a goodwill impairment charge of $16.4 million for the year end December 31, 2020.
The fair value of the reporting unit was estimated using the income approach, which calculates the fair value based on the present value of estimated future cash flows. Cash flow projections are based on management’s estimates of Assets Under Management (“AUM”) growth rates, product mix and effective fee rates, taking into consideration industry and market conditions. The discount rates used are based on the weighted-average cost of capital adjusted for the relevant risk associated with business-specific characteristics. The Company’s quantitative impairment analysis at March 31, 2020 incorporated revised forecasts that took into account the market disruptions during the quarter and its impact on the results in future periods. Given the significant level of uncertainty that currently exists, management also considered alternative scenarios for market and reporting unit performance over the next several years. If the Company’s AUM are further impacted by the global economic conditions caused by COVID-19, such as adverse and significant declines in the value of global financial markets, additional impairments of goodwill or intangible assets are possible in future periods.
The following table presents the change in definite-lived acquired intangible assets in 2020 and 2019, comprised of client relationships (in millions):
| Gross Book Value | Accumulated Amortization & Impairment | Net Book Value | |||||||||||||||
| December 31, 2018 | $ | $ | ( | $ | |||||||||||||
| Additions | — | ||||||||||||||||
| Amortization | ( | ( | |||||||||||||||
| Disposals | |||||||||||||||||
| December 31, 2019 | $ | $ | ( | $ | |||||||||||||
| Additions | — | ||||||||||||||||
| Amortization | ( | ( | |||||||||||||||
Disposals (1) | ( | ||||||||||||||||
| December 31, 2020 | $ | $ | ( | $ | |||||||||||||
141
BrightSphere Investment Group Inc.
Notes to Consolidated Financial Statements (Continued)
December 31, 2020 and 2019
10) Goodwill and Intangible Assets (cont.)
The Company’s definite-lived acquired intangibles are amortized over their expected useful lives. As of December 31, 2020, these assets were being amortized over remaining useful lives of to nine years . The Company recorded amortization expense of $6.7 million, $6.6 million and $6.6 million, respectively, for the years ended December 31, 2020, 2019 and 2018.
The Company also acquired a $1.0
The 2019 annual impairment assessment of definite and indefinite-lived intangible assets determined that no impairment existed. Due to the decline in the Company’s AUM in the three months ended March 31, 2020, the Company assessed definite and indefinite-lived intangible assets for possible impairment. For indefinite-lived intangible assets, the Company performed a qualitative assessment and determined that it was more likely than not that the indefinite-lived intangible asset was not impaired. For definite-lived intangible assets, no events or changes in circumstances indicated that the carrying amount of these assets may not be recoverable. As such, no impairment charges were determined for the definite and indefinite-lived intangible assets for the year ended December 31, 2020.
The Company estimates that its consolidated annual amortization expense, assuming no useful life changes or additional investments in new or existing Affiliates, for each of the next five fiscal years is as follows (in millions):
| 2021 | $ | ||||
| 2022 | |||||
| 2023 | |||||
| 2024 | |||||
| 2025 | |||||
| Thereafter | |||||
| Total | $ | ||||
142
BrightSphere Investment Group Inc.
Notes to Consolidated Financial Statements
December 31, 2020 and 2019
11) Related Party Transactions
Amounts due for investment advisory fee receivables from related parties were comprised of the following at December 31 (in millions):
| 2020 | 2019 | ||||||||||
Investment advisory fee receivable from unconsolidated Funds(1) | $ | $ | |||||||||
| Total amounts due for investment advisory fee receivables from related parties | $ | $ | |||||||||
Investment in related party consisted of the following at December 31 (in millions):
| 2020 | 2019 | ||||||||||
| Investment in equity-accounted investee (Note 7) | $ | $ | |||||||||
| Total related party investment | $ | $ | |||||||||
Related party transactions included in the Company’s Consolidated Statements of Operations for the years ended December 31 consisted of (in millions):
| Revenues: | 2020 | 2019 | 2018 | ||||||||||||||
Management fees from unconsolidated Funds(1) | |||||||||||||||||
Performance fees from unconsolidated Funds(1) | |||||||||||||||||
| Total related party revenues | $ | $ | $ | ||||||||||||||
(1)Transactions with unconsolidated Affiliate-sponsored Funds are considered related party items on the basis of the Company’s significant influence over the activities of such entities in its capacity as investment advisor thereto. These transactions are comprised of fees for advisory services and investments in unconsolidated funds.
Other related party arrangements
During 2016, the Company and OM plc agreed to amend the Deferred Tax Asset Deed (the “DTA Deed”). Under the terms of the DTA Deed, as amended, the Company agreed to make a payment of the net present value of the future tax benefits due to OM plc valued as of December 31, 2016. This payment, originally valued at $142.6 million, was to be made over three installments, on June 30, 2017, December 31, 2017 and June 30, 2018. The initial payment of $45.5 million was paid to OM plc on June 30, 2017. The reduction of the corporate tax rate and other provisions of the Tax Act resulted in a decrease to the value of the DTA Deed of approximately $51.8 million for the year ended December 31, 2018. In 2018, the Company agreed to terminate the DTA Deed with OM plc. The Company recorded a revaluation gain of $20.0 million in connection with the settlement of the DTA Deed for the year ended December 31, 2018. In the first quarter of 2019, the final cash payment of $32.7 million was made to OM plc to settle the outstanding liability under the DTA Deed.
During 2014, the Company entered into a Seed Capital Management Agreement and a Co-Investment Deed with OM plc and/or OM plc’s subsidiaries. During 2016, the Company and OM plc agreed to amend the Seed Capital Management Agreement. As a result of the amendment, the Company purchased approximately $39.6 million of seed investments from OM plc in September 2016. The Company purchased the remaining seed capital investments
143
BrightSphere Investment Group Inc.
Notes to Consolidated Financial Statements (Continued)
December 31, 2020 and 2019
11) Related Party Transactions (cont.)
covered by the Seed Capital Management Agreement valued at $63.4 million in July 2017, financed in part by borrowings under a non-recourse loan facility (see Note 14) and two promissory notes paid in the first quarter of 2018 in the amount of $4.5 million. Amounts owed to OM plc associated with the Co-investment Deed were $3.4 million at December 31, 2020 and $3.7 million at December 31, 2019, net of tax.
The Company uses the equity-method to account for its interests in Affiliates where it exercises significant influence over their operations, but does not hold a controlling interest. During 2020, 2019 and 2018, the Company recorded earnings in respect of this investee of $2.9 million, $2.8 million and $2.7 million, respectively. The Company also exercises significant influence over unconsolidated Funds; however in order to report in a manner consistent with consolidated Funds, it has elected to apply the fair value option for its investments therein. Additional information with respect to equity-accounted investees is disclosed in Note 7.
Certain Affiliates have provided loans to Affiliate employees. At December 31, 2020 and December 31, 2019 the balance of these loans to Affiliate employees was $8.4 million and $16.1 million, respectively.
As the Company is a member of a group of related businesses, it is possible that the terms of certain related party transactions are not the same as those that would result from transactions with wholly unrelated parties.
144
BrightSphere Investment Group Inc.
Notes to Consolidated Financial Statements (Continued)
December 31, 2020 and 2019
12) Accounts Payable and Accrued Expenses
Accounts payable and accrued expenses consisted of the following at December 31 (in millions):
| 2020 | 2019 | ||||||||||
| Accounts payable | |||||||||||
| Accrued expenses | |||||||||||
| Accrued interest payable | |||||||||||
| Other | |||||||||||
| Total accounts payable and accrued expenses | $ | $ | |||||||||
13) Other Compensation Liabilities
Other compensation liabilities consisted of the following at December 31 (in millions):
| 2020 | 2019 | ||||||||||
| Share-based payments liability (Note 20) | $ | $ | |||||||||
| Profit interests compensation liability | |||||||||||
| Voluntary deferral plan liability (Note 19) | |||||||||||
| Total other compensation liabilities | $ | $ | |||||||||
Profit interests compensation expense amounted to $(9.7 ) million in 2020, $(64.7 ) million in 2019, and $(7.5 ) million in 2018. Redemptions of profit sharing interests from Affiliate key employees for cash were $6.1 million in 2020, $12.0 million in 2019, and $16.1 million in 2018.
145
BrightSphere Investment Group Inc.
Notes to Consolidated Financial Statements (Continued)
December 31, 2020 and 2019
14) Borrowings and Debt
The Company’s borrowings were comprised of the following as of the dates indicated (in millions):
| December 31, 2020 | December 31, 2019 | ||||||||||||||||||||||||||||||||||
| (in millions) | Carrying value | Fair Value | Fair Value Level | Carrying value | Fair Value | Fair Value Level | |||||||||||||||||||||||||||||
Third party borrowings: | |||||||||||||||||||||||||||||||||||
$ | $ | $ | $ | $ | 2 | ||||||||||||||||||||||||||||||
$ | 2 | 2 | |||||||||||||||||||||||||||||||||
$ | 2 | 2 | |||||||||||||||||||||||||||||||||
Total third party borrowings | $ | $ | $ | $ | |||||||||||||||||||||||||||||||
Non-recourse borrowing: | |||||||||||||||||||||||||||||||||||
Non-recourse seed capital facility (1)(4) | $ | $ | $ | $ | 2 | ||||||||||||||||||||||||||||||
Total non-recourse borrowing | $ | $ | $ | $ | |||||||||||||||||||||||||||||||
| Total borrowings | $ | $ | $ | $ | |||||||||||||||||||||||||||||||
(1)Fair value approximates carrying value because the credit facilities have variable interest rates based on selected short term market rates.
(2)An amendment to the $450 million revolving credit facility was made on November 17, 2020 to reduce the revolving credit facility to $150 million upon consummation of the sale of the Company's equity interests in Barrow Hanley.
(3)The difference between the principal amounts and the carrying values of the senior notes in the table above reflects the unamortized debt issuance costs and discounts.
(4)Non-recourse seed capital facility that was set to expire on January 15, 2021 was paid down in the third quarter and terminated.
146
BrightSphere Investment Group Inc.
Notes to Consolidated Financial Statements (Continued)
December 31, 2020 and 2019
14) Borrowings and Debt (cont.)
Revolving credit facility
On September 3, 2020, the Company, Royal Bank of Canada, BMO Harris Bank, N.A., Bank of China, New York Branch, Wells Fargo Bank, National Association, Barclays Bank PLC, Morgan Stanley Bank, N.A., Bank of America N.A., the Bank of New York Mellon and Citibank, N.A., as an issuing bank and administrative agent (collectively, the “Lenders”), entered into an amendment (the “Amendment") to the Revolving Credit Agreement dated as of August 20, 2019 (the “Original Credit Agreement”, and as amended by the Amendment, the “Amended Credit Agreement”). The Amendment included changes to the Original Credit Agreement to permit the sale of the Company's equity interests in Barrow Hanley (the “Barrow Hanley Sale”). Under the Original Credit Agreement, the Barrow Hanley Sale required consent of the Lenders given that Barrow Hanley accounted for more than 10 % of the Company's consolidated Adjusted EBITDA. The Amendment provided that, effective immediately upon the consummation of the Barrow Hanley Sale, the Lenders commitments under the Credit Agreement would be $150 million. The Barrow Hanley Sale was consummated on November 17, 2020 and the Lenders’ commitments under the Amended Credit Agreement were reduced to $150 million from thereon.
Borrowings under the Credit Facility bore interest, at the Company’s option, at either the per annum rate equal to (a) the greatest of (i) the prime rate, (ii) the federal funds effective rate plus 0.5 % and (iii) the one month Adjusted London interbank offered rate (“LIBOR”) plus 1.0 %, plus, in each case an additional amount based on its credit rating or (b) the LIBOR for a period, at the Company’s election, equal to one, two, three or six months plus an additional amount ranging from 1.125 % to 2.00 %, with such additional amount based on its credit rating. In addition, the Company was charged a commitment fee based on the average daily unused portion of the Credit Facility at a per annum rate ranging from 0.125 % to 0.45 %, with such amount based on the Company’s credit rating.
Moody’s Investor Service, Inc. and Standard & Poor’s have each assigned an investment-grade rating to the Company’s senior, unsecured long-term indebtedness. As a result of the assignment of the credit ratings, the Company’s interest rate on outstanding borrowings was set at LIBOR + 1.50 % and the commitment fee on the unused portion of the revolving credit facility was set at 0.20 %. Under the Amended Credit Agreement, the ratio of third-party borrowings to trailing twelve months Adjusted EBITDA as defined by the Amended Credit Agreement cannot exceed 3.0 x, and the interest coverage ratio must not be less than 4.0 x. At December 31, 2020, the Company is in compliance with these debt covenants.
Senior Notes
In July 2016, the Company issued $275.0 million of 4.80 % Senior Notes due 2026 (the “2026 Notes”) and $125.0 million of 5.125 % Senior Notes due 2031 (the “2031 Notes”). The Company used the net proceeds of these offerings to finance the acquisition of Landmark in August 2016, settle an outstanding interest rate lock, purchase seed capital from OM plc and pay down the balance of the Company’s previous revolving credit facility.
The $275.0 million 2026 Notes were sold at a discount of $(0.5 ) million and the Company incurred debt issuance costs of $(3.0 ) million, which are being amortized to interest expense over the ten-year term. The 2026 Notes can be redeemed at any time prior to the scheduled maturity in part or in aggregate, at the greater of the 100 % principal amount at that time or the sum of the remaining scheduled payments discounted at the treasury rate (as defined) plus 0.5 %, together with any related accrued and unpaid interest.
147
BrightSphere Investment Group Inc.
Notes to Consolidated Financial Statements (Continued)
December 31, 2020 and 2019
14) Borrowings and Debt (cont.)
The Company incurred debt issuance costs of $(4.3 ) million in connection with the issuance of the $125.0 million 2031 Notes, which are being amortized to interest expense over the fifteen-year term. The 2031 Notes can be redeemed at any time, on or after August 1, 2019 at a redemption price equal to 100.0 % of the principal amount together with any related accrued and unpaid interest.
The fair value of the senior notes was determined using broker quotes and any recent trading activity for each of the notes listed above, which are considered Level II inputs.
Non-recourse seed capital facility
In July 2017, the Company purchased all remaining seed capital investments covered by the Seed Capital Management Agreement from OM plc for $63.4 million. The Company financed this purchase in part through borrowings under a non-recourse seed capital facility collateralized by its seed capital holdings. The Company entered into this facility as of July 17, 2017, and could borrow up to $65.0 million, so long as the borrowing did not represent more than 50 % of the value of the permitted seed capital collateral. The non-recourse seed facility bears interest at LIBOR +1.55 % with a commitment fee on the unused portion of this facility of 0.95 %. The non-recourse seed capital facility set to expire on January 15, 2021 was paid down in the third quarter and terminated. Per the terms of the Company’s Credit Facility, drawdowns under this facility are excluded from the Company’s third party debt levels for purposes of calculating the Company’s credit ratio covenants.
Interest expense
Interest expense incurred amounted to $28.5 million, $32.2 million and $24.9 million for the years ended December 31, 2020, 2019 and 2018 respectively. Interest expense consists of interest accrued on the long-term debt and credit facilities, commitment fees and amortization of debt-related costs. The weighted average interest rate on all debt obligations, excluding consolidated Funds, was 5.08 %, 5.28 % and 6.08 % in each of 2020, 2019 and 2018, respectively.
148
BrightSphere Investment Group Inc.
Notes to Consolidated Financial Statements (Continued)
December 31, 2020 and 2019
14) Borrowings and Debt (cont.)
As of December 31, 2020, the aggregate maturities of debt commitments, based on their contractual terms, are as follows:
| Future minimum debt commitments | ||||||||
| 2021 | $ | |||||||
| 2022 | ||||||||
| 2023 | ||||||||
| 2024 | ||||||||
| 2025 | ||||||||
| Thereafter | ||||||||
| Total | $ | |||||||
The Company was in compliance with the required covenants related to borrowings and debt facilities as of December 31, 2020.
Subsequent Event
On February 23, 2021, the Company, along with the Lenders, entered into an assignment and assumption and amendment agreement (the “Assignment”) to the Amended Credit Agreement. Pursuant to the Assignment, the Amended Credit Agreement was assigned to and assumed by Acadian and the Amended Credit Agreement was amended (the Amended Credit Agreement, as amended by the Assignment, the “Acadian Credit Agreement”) to, among other things, reduce the Lenders’ commitments thereunder to $125 million. The Acadian Credit Agreement has a maturity date of August 22, 2022.
Borrowings under the Acadian Credit Agreement bear interest, at Acadian’s option, at either the per annum rate equal to (a) the greatest of (i) the prime rate, (ii) the federal funds effective rate plus 0.5 % and (iii) the one month Adjusted LIBOR Rate plus 1.0 %, plus, in each case an additional amount based on its credit rating or (b) the London interbank offered rate for a period, at our, equal to one, three or six months plus an additional amount ranging from 1.5 % to 2.0 %, with such additional amount based on Acadian’s Leverage Ratio (as defined below). In addition, Acadian is charged a commitment fee based on the average daily unused portion of the revolving credit facility under the Acadian Credit Agreement at a per annum rate ranging from 0.25 % to 0.375 %, with such amount based on Acadian’s Leverage Ratio.
Under the Acadian Credit Agreement, the ratio of Acadian’s third-party borrowings to Acadian’s trailing twelve months Adjusted EBITDA, as defined by the Acadian Credit Agreement (the “Leverage Ratio”), cannot exceed 2.5 x.
149
BrightSphere Investment Group Inc.
Notes to Consolidated Financial Statements (Continued)
December 31, 2020 and 2019
15) Income Taxes
Income from continuing operations before income taxes consisted of the following for the years ended December 31 (in millions):
| 2020 | 2019 | 2018 | |||||||||||||||
| Domestic | $ | $ | $ | ||||||||||||||
| Foreign | |||||||||||||||||
| Total | $ | $ | $ | ||||||||||||||
The components of income tax expense from continuing operations for the years ended December 31 are as follows (in millions):
| 2020 | 2019 | 2018 | |||||||||||||||
| Current: | |||||||||||||||||
| Federal | $ | $ | ( | $ | |||||||||||||
| State | |||||||||||||||||
| Foreign | ( | ||||||||||||||||
| Total current expense (benefit) | ( | ||||||||||||||||
| Deferred: | |||||||||||||||||
| Federal | ( | ||||||||||||||||
| State | ( | ( | |||||||||||||||
| Foreign | |||||||||||||||||
| Total deferred expense (benefit) | ( | ||||||||||||||||
| Total tax expense (benefit) | $ | $ | $ | ||||||||||||||
The Company has recognized income tax expense (benefit) related to derivative securities within other comprehensive income of $0.8 million, $0.6 million and $0.4 million in the years ended December 31, 2020, 2019 and 2018, respectively.
The provision for income taxes in 2020, 2019 and 2018 included benefits of $0.4 million, $0.4 million and $0.4 million, respectively, related to the utilization of net operating loss carryforwards.
150
BrightSphere Investment Group Inc.
Notes to Consolidated Financial Statements (Continued)
December 31, 2020 and 2019
15) Income Taxes (cont.)
The reconciliation of the difference between the Company’s U.S. Federal statutory income tax rate and the effective income tax rate for continuing operations for the years ended December 31 is as follows:
| 2020 | 2019 | 2018 | |||||||||||||||
| Tax at U.S. federal statutory income tax rate | % | % | % | ||||||||||||||
| State income taxes, net of federal benefit | % | % | % | ||||||||||||||
| Non-deductible expenses | % | % | % | ||||||||||||||
| DTA Deed liability revaluation adjustment | % | % | % | ||||||||||||||
| Adjustment to liabilities for uncertain tax positions | ( | % | ( | % | ( | % | |||||||||||
| Change in valuation allowance | % | % | ( | % | |||||||||||||
| Write-off of state net operating loss carryforwards | % | % | % | ||||||||||||||
| Effect of foreign operations | % | % | % | ||||||||||||||
| Effect of changes in tax law | % | ( | % | ( | % | ||||||||||||
| Effect of disposal of Affiliates | % | % | % | ||||||||||||||
| Effect of income from non-controlling interest | ( | % | ( | % | % | ||||||||||||
| Impact of increased state tax obligations to deferred tax assets | ( | % | ( | % | % | ||||||||||||
| Impact of Redomestication to deferred tax assets | % | ( | % | % | |||||||||||||
| Other | ( | % | ( | % | % | ||||||||||||
| Effective income tax rate for continuing operations | % | % | % | ||||||||||||||
The Company’s effective income tax rate is higher than the US federal tax rate of 21% primarily due to its state tax obligations, non-deductible tax items and the effects of foreign operations. In connection with the sale of its Affiliates in 2020, the Company recorded tax expense of $77.6 million, including tax impacts of non-deductible tax items.
The Company reduced its liability for uncertain tax positions by $9.1 million, $40.8 million and $47.9 million during the years ended December 31, 2020, 2019 and 2018, respectively, due to the lapse of statute of limitations.
The Coronavirus Aid, Relief, and Economic Security Act (“CARES Act”) contains numerous income tax provisions including some that are effective retroactively. Our Consolidated Balance Sheets reflect the benefit of a provision that increased the business interest limitation under IRC Section 163(j) from 30% to 50% for tax years 2019 and 2020. This provision allowed the Company to utilize more of the deferred tax asset related to interest expense.
In connection with the Redomestication in 2019, the Company revalued certain deferred tax assets that were transferred to the U.S. parent from the former U.K. parent. These deferred tax assets are now measured using applicable U.S. and state income tax rates. The Company’s state tax filing obligations have increased in the normal course of business and in connection with states tax law changes regarding apportionment of income. These changes have resulted in an increase to the state income tax rate and accordingly to the state deferred tax assets.
On December 22, 2017, the Tax Cuts and Jobs Act (the “Tax Act”) was enacted and became effective January 1, 2018. The Tax Act enacted various measures of domestic and international corporate tax reform that were impactful
151
BrightSphere Investment Group Inc.
Notes to Consolidated Financial Statements (Continued)
December 31, 2020 and 2019
15) Income Taxes (cont.)
to the Company including reduction of the federal statutory corporate tax rate from 35% to 21%, new limitations on executive compensation and the deductibility of interest expense, a one-time tax on mandatory deemed repatriation of non-U.S. earnings, and new taxes assessed on foreign earnings. In accordance with SEC issued Staff Accounting Bulletin No. 118, Income Tax Accounting Implications of the Tax Cuts and Jobs Act (“SAB 118”), the Company was permitted to provide provisional amounts for recording the tax effects of the enacted tax law during a specified measurement period, ending one year after the enactment date. The Company recorded a $1.0 million income tax benefit during the year ended December 31, 2018 related to refinement of the Section 965 toll charge tax liability on the mandatory deemed repatriation of foreign earnings.
Additionally, the Company analyzed the impact of the international corporate tax reform measures which became effective January 1, 2018, including the new taxes on foreign earnings known as the global intangible low-taxed income (“GILTI”). The Company has elected to treat GILTI taxes as period costs in the accounting and tax periods in which they are incurred. The Company has recognized tax expense of $0.8 million, $0.5 million and $0.7 million during the years ended December 31, 2020, 2019 and 2018, respectively, related to the GILTI tax.
In 2018, the Deferred Tax Asset Deed was terminated resulting in a tax net impact of $1.6 million. In 2017 the deed was revalued due to the enactment of the Tax Act resulting in a tax impact of $18.1 million.
During 2018, the Company wrote-off its $8.6 million deferred tax asset for state net operating loss carryforwards and released the corresponding $8.6 million valuation allowance, as management has concluded that the tax benefits associated with the state net operating loss carryforwards will not be recognized.
In general, it is the practice and intention of the Company to reinvest earnings of its non-U.S. subsidiaries in those operations. Management has no intention of repatriating earnings of its non-U.S. subsidiaries in the foreseeable future. At December 31, 2020, the Company has not recorded any deferred tax liabilities relating to additional taxes such as foreign withholding and state taxes which could arise on the repatriation of unremitted earnings of its non-U.S. subsidiaries. It is not practical for the Company to determine the potential unrecognized deferred tax liability related to unremitted earnings due to numerous assumptions associated with the determination.
152
BrightSphere Investment Group Inc.
Notes to Consolidated Financial Statements (Continued)
December 31, 2020 and 2019
15) Income Taxes (cont.)
Deferred tax assets and liabilities reflect the expected future tax consequences of temporary differences between the book carrying amounts and tax bases of the Company’s assets and liabilities.
The significant components of deferred tax assets and deferred tax liabilities for the years ended December 31 are as follows (in millions):
| 2020 | 2019 | ||||||||||
| Deferred tax assets: | |||||||||||
| Interest expense | $ | $ | |||||||||
| Federal net operating loss | |||||||||||
| State net operating loss carry forwards | |||||||||||
| Investment in partnerships | |||||||||||
| Intangible assets | |||||||||||
| Employee compensation | |||||||||||
| Other | |||||||||||
| Cash flow hedge | |||||||||||
| Total deferred tax assets | |||||||||||
| Deferred tax liabilities: | |||||||||||
| Right of use assets | |||||||||||
| Investments | |||||||||||
| Total deferred tax liabilities | |||||||||||
| Net deferred tax assets | $ | $ | |||||||||
At December 31, 2020, the Company has tax attributes that carry forward for varying periods. The Company’s federal net operating loss carryforward of $4.4 million originated during 2004 and 2006 and will expire over a to six-year period. The Company’s state net operating loss carryforward of $1.1 million originated in 2018 and 2019 and will expire over a to twenty-year period. In evaluating the Company’s ability to recover its deferred tax assets, the Company considers all available positive and negative evidence including the existence of cumulative income in the most recent fiscal years, changes in the business in which the Company operates, and the Company’s ability to forecast future taxable income. The weight given to the evidence is commensurate with the extent to which it can be objectively verified. The more negative evidence that exists, the more positive evidence that is necessary and the more difficult it is to support a conclusion that a valuation allowance is not needed. The Company has three years of cumulative earnings as of December 31, 2020, 2019 and 2018. As of December 31, 2020, management believes it is more likely than not that the balance of the deferred tax assets will be realized based on forecasted taxable income.
153
BrightSphere Investment Group Inc.
Notes to Consolidated Financial Statements (Continued)
December 31, 2020 and 2019
15) Income Taxes (cont.)
A reconciliation of the change in gross unrecognized tax benefits for the years ended December 31 is as follows (in millions):
| 2020 | 2019 | 2018 | |||||||||||||||
| Balance as of January 1 | $ | $ | $ | ||||||||||||||
| Additions based on current year tax positions | |||||||||||||||||
| Reductions for tax provisions of prior years | ( | ||||||||||||||||
| Reductions related to lapses of statutes of limitations | ( | ( | ( | ||||||||||||||
| Balance as of December 31 | $ | $ | $ | ||||||||||||||
The Company’s liability for uncertain tax positions includes unrecognized benefits of $3.4 million and $11.2 million at December 31, 2020 and 2019, respectively, that if recognized would affect the effective tax rate on income from continuing operations.
The Company recognized $(0.9 ) million, $(5.3 ) million, and $(1.9 ) million in interest and penalties in its income tax provision for the years ended December 31, 2020, 2019, and 2018, respectively. The Company recognizes accrued interest and penalties relating to unrecognized tax benefits as income tax expense. The Company’s liability for uncertain tax positions at December 31, 2020, 2019, and 2018 includes accrued interest and penalties of $0.5 million, $1.4 million and $6.7 million, respectively.
The Company believes that it is reasonably possible that a decrease of up to $3.2 million in unrecognized tax benefits may be necessary within the next twelve months, as the result of a lapse of statute of limitations.
The Company is periodically under examination by various taxing authorities. Examinations are inherently uncertain, may result in payment of additional taxes or the recognition of tax benefits and may be in process for extended periods of time. At December 31, 2020, the Company is subject to examination in two jurisdictions.
The Company and its subsidiaries file tax returns in the U.K., U.S. federal, state, local and other foreign jurisdictions. As of December 31, 2020, the Company is generally no longer subject to income tax examinations by U.S. federal, state, local, or foreign tax authorities for calendar years prior to 2009. In addition, as of December 31, 2020, the Company is no longer subject to income tax examinations by the U.K. for calendar years prior to 2017.
154
BrightSphere Investment Group Inc.
Notes to Consolidated Financial Statements (Continued)
December 31, 2020 and 2019
16) Commitments and Contingencies
Operational commitments
The Company had unfunded commitments to invest up to approximately $33 million in co-investments as of December 31, 2020. These commitments will be funded as required through the end of the respective investment periods ranging through fiscal 2022.
Certain Affiliates operate under regulatory authorities that require that they maintain minimum financial or capital requirements. Management is not aware of any violations of such financial requirements occurring during the period.
Guaranty
The Company entered into a guaranty for an office space security deposit on behalf of an Affiliate in the amount of $2.5 million in January 2020. This represents the maximum potential amount of future (undiscounted) payments that the Company could be required to make under the guaranty in the event of default by the guaranteed party. This guaranty expires in 2022. There are no liabilities recorded on the Consolidated Balance Sheet as of December 31, 2020 related to this guaranty.
Litigation
The Company and its Affiliates are subject to claims, legal proceedings and other contingencies in the ordinary course of their business activities. Each of these matters is subject to various uncertainties, and it is possible that some of these matters may be resolved in a manner unfavorable to the Company or its Affiliates. The Company and its Affiliates establish accruals for matters for which the outcome is probable and can be reasonably estimated. If an insurance claim or other indemnification for a litigation accrual is available to the Company, the associated gain will not be recognized until all contingencies related to the gain have been resolved. As of December 31, 2020, there were no material accruals for claims, legal proceedings or other contingencies.
Indemnifications
In the normal course of business, such as through agreements to enter into business combinations and divestitures of Affiliates, the Company enters into contracts that contain a variety of representations and warranties and which provide general indemnifications. The Company’s maximum exposure under these arrangements is unknown, as this would involve future claims that may be made against the Company that have not yet occurred.
Foreign tax contingency
The Company has clients in non-U.S. jurisdictions which require entities that are conducting certain business activities in such jurisdictions to collect and remit tax assessed on certain fees paid for goods and services provided. The Company does not believe this requirement is applicable based on its limited business activities in these jurisdictions. However, given the fact that uncertainty exists around the requirement, the Company has chosen to evaluate its potential exposure related to non-collection and remittance of these taxes. At December 31, 2020, management of the Company has estimated the potential maximum exposure and concluded that it is not material. No accrual for the potential exposure has been recorded as the probability of incurring any potential liability relating to this exposure is not probable at December 31, 2020.
155
BrightSphere Investment Group Inc.
Notes to Consolidated Financial Statements (Continued)
December 31, 2020 and 2019
16) Commitments and Contingencies (cont.)
Considerations of credit risk
Financial instruments that potentially subject the Company to significant concentrations of credit risk consist principally of cash investments. The Company maintains cash and cash equivalents and short term investments with various financial institutions. These financial institutions are typically located in cities in which the Company and its Affiliates operate. For the Company and certain Affiliates, cash deposits at a financial institution may exceed Federal Deposit Insurance Corporation insurance limits. Additionally, the Company holds insurance policies which cover historical and future tax benefits relating to certain of its deferred tax assets. The insurers of the policies are considered a significant counterparty to the Company.
17) Earnings Per Share
Basic earnings per share is calculated by dividing net income attributable to controlling interests by the weighted average number of shares of common stock outstanding. Diluted earnings per share is similar to basic earnings per share, but is adjusted for the effect of potentially issuable common stock, except when inclusion is antidilutive.
The calculation of basic and diluted earnings per share of common stock for the years ended December 31, 2020, 2019 and 2018 is as follows (dollars in millions, except per share data):
| 2020 | 2019 | 2018 | |||||||||||||||
| Numerator: | |||||||||||||||||
| Net income attributable to controlling interests | $ | $ | $ | ||||||||||||||
Less: Total income available to participating unvested securities(1) | ( | ( | ( | ||||||||||||||
| Total net income attributable to common stock | $ | $ | $ | ||||||||||||||
| Denominator: | |||||||||||||||||
| Weighted-average shares of common stock outstanding—basic | |||||||||||||||||
| Potential shares of common stock: | |||||||||||||||||
| Restricted stock units | |||||||||||||||||
| Employee stock options | |||||||||||||||||
| Weighted-average shares of common stock outstanding—diluted | |||||||||||||||||
| Earnings per share of common stock attributable to controlling interests: | |||||||||||||||||
| Basic | $ | $ | $ | ||||||||||||||
| Diluted | $ | $ | $ | ||||||||||||||
(1)Income available to participating unvested securities includes dividends paid on unvested restricted shares and their proportionate share of undistributed earnings.
156
BrightSphere Investment Group Inc.
Notes to Consolidated Financial Statements (Continued)
December 31, 2020 and 2019
17) Earnings Per Share (cont.)
18) Revenue
Management fees
The Company’s management fees are a function of the fee rates the Affiliates charge to their clients, which are typically expressed in basis points, and the levels of the Company’s assets under management. The most significant driver of increases or decreases in this average fee rate is changes in the mix of the Company’s assets under management caused by net inflows or outflows in certain asset classes or disproportionate market movements. For certain of the Company’s Alternative funds, management fee revenue is calculated based on a percentage of assets under management or total capital commitments. These Alternative funds can also include “catch-up” provisions such that the Company records revenue for payments of fund management fees back to the initial closing date for funds with multiple closings, less placement fees paid to third parties related to these funds.
Performance fees
The Company’s products subject to performance fees earn these fees upon exceeding high-water mark performance thresholds or outperforming a hurdle rate. Conversely, the separate accounts / other products, which primarily earn management fees, are potentially subject to performance adjustments up or down based on investment performance versus benchmarks (i.e. fulcrum fees).
Other revenue
Included in other revenue are certain payroll and benefits costs and expenses paid on behalf of Funds by the Company’s Affiliates. In instances where a customer reimburses the Company for a cost paid on the customer’s behalf, the Company is acting as a principal and the reimbursement is accrued on a gross basis at cost as the corresponding reimbursable expenses are incurred. Revenue from expense reimbursements amounted to $4.6 million, $4.4 million, and $8.0 million for the years ended December 31, 2020, 2019 and 2018, respectively, and is recorded in other revenue in the Company’s Consolidated Statements of Operations. Other revenue may also consist of other miscellaneous revenue, consisting primarily of administration and consulting services.
157
BrightSphere Investment Group Inc.
Notes to Consolidated Financial Statements (Continued)
December 31, 2020 and 2019
18) Revenue (cont.)
Disaggregation of management fee revenue
The Company classifies its revenue (including only consolidated Affiliates that are included in management fee revenue) among the following asset classes:
i.U.S. equity, which includes small cap through large cap securities and substantially value or blended investment styles;
ii.Global / non-U.S. equity, which includes global and international equities including emerging markets;
iii.Fixed income, which includes government bonds, corporate bonds and other fixed income investments in the United States; and
iv.Alternatives, which is comprised of illiquid and differentiated liquid investment strategies that include private equity, real estate and real assets, including forestry, as well as a growing suite of liquid alternative capabilities in areas such as long/short, market neutral and absolute return.
Management fee revenue by segment and asset class is comprised of the following for the years ended December 31 (in millions):
| 2020 | 2019 | 2018 | |||||||||||||||
| Quant & Solutions | |||||||||||||||||
| Global / non-U.S. equity | $ | $ | $ | ||||||||||||||
| Alternatives | |||||||||||||||||
| Alternatives | |||||||||||||||||
Liquid Alpha(1) | |||||||||||||||||
| Global / non-U.S. equity | |||||||||||||||||
| Fixed income | |||||||||||||||||
| U.S. equity | |||||||||||||||||
Management fee revenue | $ | $ | $ | ||||||||||||||
(1)In July 2020, the Company completed the sale of Copper Rock. In November 2020, the Company completed the sale of Barrow Hanley. See Note 3, Divestitures, for further discussion of divestitures. The financial results of Copper Rock are included in the Liquid Alpha segment until July 24, 2020, the completion of the sale. The financial results of Barrow Hanley are included in the Liquid Alpha segment until November 17, 2020, the completion of the sale.
19) Employee Benefits
158
BrightSphere Investment Group Inc.
Notes to Consolidated Financial Statements (Continued)
December 31, 2020 and 2019
19) Employee Benefits (cont.)
The Company also has non-qualified defined contribution plans covering certain senior employees. The Company has established a Deferred Compensation Plan under which the Board of Directors makes awards that may be invested by the recipient in investments deemed available under the plan. Vesting of awards under the Deferred Compensation Plan is based on the number of years of service already provided by the employee at the date of the grant. In addition, the Company has established a Voluntary Deferral Plan that provides officers of the Company the opportunity to voluntarily defer a portion of their compensation. The compensation deferred is deemed to be invested in one or more investment options available under the plan. These non-qualified plans are unfunded, although the Company does make contributions to a Rabbi Trust to hedge its risks in terms of providing returns to employees on their deemed investments held in the plan.
As of December 31, 2020 and 2019, a total of $72.8 million and $88.3 million, respectively, had been recorded as long-term compensation liabilities and a total of $73.0 million and $88.8 million had been invested under the Deferred Compensation and Voluntary Deferral plans, respectively. The change in the fair value of long-term compensation liabilities and the change in fair value of the assets invested under the Deferred Compensation and Voluntary Deferral plans was $9.0 million and $8.4 million, respectively, for the year ended December 31, 2020, $9.5 million and $9.9 million, respectively, for the year ended December 31, 2019, and $0.1 million, and $0.2 million, respectively, for the year ended December 31, 2018. The Company recorded total expenses in relation to its qualified and non-qualified plans within compensation and benefits in its Consolidated Statements of Operations for the years ended December 31, 2020, 2019 and 2018 of $11.5 million, $14.2 million and $14.4 million, respectively.
20) Equity-based Compensation
Cash-settled Affiliate awards
The Company maintains compensation arrangements with certain of its Affiliates whereby in exchange for continued service, Affiliate equity is either purchased by, or granted to Affiliate key employees subject to a limit imposed by the Company, and may be repurchased either by Affiliate key employees or by the Company at a future date at the then applicable fair value, subject to service requirements having been met. Pre-acquisition equity units held by employees of acquired Affiliates that are subject to service conditions are also accounted for as equity-based compensation arrangements. Compensation expense is recognized over the requisite service period equal to the cumulative vested fair value of the award at the end of each period up to vesting date.
The Company accounts for these arrangements as “cash-settled” share-based payments, and accordingly a corresponding share-based payment liability is recorded. The fair value of the liabilities are determined with the assistance of third party valuation specialists using discounted cash flow analyses, which incorporate assumptions for the forecasted earnings information, market risk adjustments, discount rates and post-vesting restrictions. Vested Affiliate equity liabilities are revalued at each period end until settlement date, with changes in the liabilities included within compensation expense.
In conjunction with the Landmark acquisition, BSIG entered into compensation arrangements with employees of Landmark where an additional acquisition-related payment of $207.6 million was earned based on the growth of Landmark’s business. This arrangement was accounted for as cash-settled equity-based compensation and fair valued as of the closing date of the acquisition. The amount vested on December 31, 2018 and was paid in February 2019.
159
BrightSphere Investment Group Inc.
Notes to Consolidated Financial Statements (Continued)
December 31, 2020 and 2019
20) Equity-based Compensation (cont.)
The following table presents the changes in the share-based payments liability for the years ended December 31 (in millions):
| 2020 | 2019 | 2018 | |||||||||||||||
| Balance, beginning of period | $ | $ | $ | ||||||||||||||
| Amortization and revaluation of granted awards | |||||||||||||||||
| Repurchases (cash-settled) | ( | ( | ( | ||||||||||||||
| Balance, end of period | $ | $ | $ | ||||||||||||||
Equity-settled corporate awards
BrightSphere Investment Group equity incentive plan
The Company has established various plans under which it is authorized to grant restricted stock awards (“RSAs”), restricted stock units (“RSUs”), performance-based restricted stock awards (“Performance-based RSAs”), performance-based restricted stock units (“Performance-based RSUs”) and stock option awards. These plans are maintained to provide equity-based compensation arrangements to employees and non-executive directors. Equity ownership encourages employees and directors to act in the best long-term interests of the Company. A total of 14.8 million shares of common stock have been reserved for issuance under the various plans.
Compensation expense recognized by the Company for the years ended December 31, 2020, 2019, and 2018 in relation to these awards was $2.5 million, $5.8 million, and $7.1 million respectively. The related income tax benefit recognized for years ended December 31, 2020, 2019 and 2018 was $0.4 million, $0.5 million and $1.3 million respectively. Unamortized compensation expense related to unvested RSAs, RSUs, Performance-based RSAs, Performance-based RSUs and stock options at December 31, 2020 of $3.6 million is expected to be recognized over a weighted-average period of 1.7 years. The service inception date for annual awards granted in 2020 is deemed to be January 1, 2019. It is anticipated that annual awards for 2020 with a fair value of $0.1 million will be granted during 2021 with a service inception date of January 1, 2020.
The following summarizes the grant date fair value of the instruments granted by the Company during the year ended December 31:
| 2020 | 2019 | 2018 | ||||||||||||||||||||||||||||||||||||
| BrightSphere Investment Group Inc. awards | Shares granted | Weighted average fair value | Shares granted | Weighted average fair value | Shares granted | Weighted average fair value | ||||||||||||||||||||||||||||||||
| RSAs | $ | $ | $ | |||||||||||||||||||||||||||||||||||
| RSUs | ||||||||||||||||||||||||||||||||||||||
| Performance-based RSAs | ||||||||||||||||||||||||||||||||||||||
| Performance-based RSUs | ||||||||||||||||||||||||||||||||||||||
| Stock options | ||||||||||||||||||||||||||||||||||||||
160
BrightSphere Investment Group Inc.
Notes to Consolidated Financial Statements (Continued)
December 31, 2020 and 2019
20) Equity-based Compensation (cont.)
Grants of restricted stock in BrightSphere Investment Group Inc.
The following table summarizes the activity related to restricted stock awards:
| 2020 | 2019 | 2018 | ||||||||||||||||||||||||||||||||||||
| BrightSphere Investment Group Inc. RSAs | Number of shares | Weighted average grant date fair value per share | Number of shares | Weighted average grant date fair value per share | Number of shares | Weighted average grant date fair value per share | ||||||||||||||||||||||||||||||||
Outstanding at beginning of the year | $ | $ | $ | |||||||||||||||||||||||||||||||||||
| Granted during the year | ||||||||||||||||||||||||||||||||||||||
| Forfeited during the year | ( | ( | ( | |||||||||||||||||||||||||||||||||||
| Exercised during the year | ( | ( | ( | |||||||||||||||||||||||||||||||||||
Outstanding at end of the year | $ | $ | $ | |||||||||||||||||||||||||||||||||||
The grant date fair value per share, calculated based on the closing price as quoted on the New York Stock Exchange on the measurement date, is used to determine the fair value of restricted stock awards granted to employees. There were no RSAs granted by the Company during the year ended December 31, 2020. Restricted stock awards under the plan generally have a vesting period of to three years .
Grants of restricted stock units in BrightSphere Investment Group Inc.
The following table summarizes the activity related to restricted stock units:
| 2020 | 2019 | 2018 | ||||||||||||||||||||||||||||||||||||
| BrightSphere Investment Group Inc. RSUs | Number of shares | Weighted average grant date fair value per share | Number of shares | Weighted average grant date fair value per share | Number of shares | Weighted average grant date fair value per share | ||||||||||||||||||||||||||||||||
Outstanding at beginning of the year | $ | $ | $ | |||||||||||||||||||||||||||||||||||
| Granted during the year | ||||||||||||||||||||||||||||||||||||||
| Forfeited during the year | ( | ( | ||||||||||||||||||||||||||||||||||||
| Exercised during the year | ( | ( | ( | |||||||||||||||||||||||||||||||||||
Outstanding at end of the year | $ | $ | $ | |||||||||||||||||||||||||||||||||||
The grant date fair value per share, calculated based on the closing price as quoted on the New York Stock Exchange on the measurement date, is used to determine the fair value of restricted stock units granted to employees. Restricted stock units under the plan generally have a vesting period of to three years .
161
BrightSphere Investment Group Inc.
Notes to Consolidated Financial Statements (Continued)
December 31, 2020 and 2019
20) Equity-based Compensation (cont.)
Grants of Performance-based restricted stock awards in BrightSphere Investment Group Inc.
The following table summarizes the activity related to performance-based restricted stock awards:
| 2020 | 2019 | 2018 | ||||||||||||||||||||||||||||||||||||
| BrightSphere Investment Group Inc. Performance-based RSAs | Number of shares | Weighted average grant date fair value per share | Number of shares | Weighted average grant date fair value per share | Number of shares | Weighted average grant date fair value per share | ||||||||||||||||||||||||||||||||
Outstanding at beginning of the year | $ | $ | $ | |||||||||||||||||||||||||||||||||||
| Granted during the year | ||||||||||||||||||||||||||||||||||||||
| Other movements | ( | |||||||||||||||||||||||||||||||||||||
Outstanding at end of the year | $ | $ | $ | |||||||||||||||||||||||||||||||||||
Other movements includes performance-based RSAs that did not meet the market vesting condition and vested at 0 % during the year ended December 31, 2020. There were no
The Performance-based RSAs granted in 2018 by the Company have a market vesting condition; therefore a Monte-Carlo simulation model has been used to determine the fair value of the restricted units granted to employees. Significant assumptions utilized in the Monte-Carlo simulation model include assumed reinvestment of dividends, the risk-free interest rate of 2.39 %, and expected volatility of 26.57 %, which is based on an average volatility of the Company’s peer group. Performance-based RSAs under the plan have a vesting period of three years .
162
BrightSphere Investment Group Inc.
Notes to Consolidated Financial Statements (Continued)
December 31, 2020 and 2019
20) Equity-based Compensation (cont.)
Grants of Performance-based restricted stock units in BrightSphere Investment Group Inc.
The following table summarizes the activity related to performance-based restricted stock units:
| 2020 | 2019 | 2018 | ||||||||||||||||||||||||||||||||||||
| BrightSphere Investment Group Inc. Performance-based RSUs | Number of shares | Weighted average grant date fair value per share | Number of shares | Weighted average grant date fair value per share | Number of shares | Weighted average grant date fair value per share | ||||||||||||||||||||||||||||||||
Outstanding at beginning of the year | $ | $ | $ | |||||||||||||||||||||||||||||||||||
| Granted during the year | ||||||||||||||||||||||||||||||||||||||
| Exercised during the year | ( | ( | ||||||||||||||||||||||||||||||||||||
| Other movements | ||||||||||||||||||||||||||||||||||||||
| Outstanding at end of the year | $ | $ | $ | |||||||||||||||||||||||||||||||||||
There were no 2.48 %, and expected volatility of 26.11 %, which is based on an average volatility of the Company’s peer group. Performance-based RSUs under the plan have a vesting period of three years .
Grants of Stock Options in BrightSphere Investment Group Inc.
The following tables summarizes the activity related to the Company’s stock option awards:
| 2020 | |||||||||||||||||||||||
| Stock Options | Weighted average exercise price | Weighted average remaining contractual term (in years) | Aggregate intrinsic value | ||||||||||||||||||||
| Outstanding at beginning of the year | $ | ||||||||||||||||||||||
Granted during the year | |||||||||||||||||||||||
Forfeited during the year | ( | ||||||||||||||||||||||
Exercised during the year | ( | ||||||||||||||||||||||
Outstanding at end of the year | $ | ||||||||||||||||||||||
Exercisable at end of the year | $ | $ | |||||||||||||||||||||
163
BrightSphere Investment Group Inc.
Notes to Consolidated Financial Statements (Continued)
December 31, 2020 and 2019
20) Equity-based Compensation (cont.)
| 2019 | |||||||||||||||||||||||
| Stock Options | Weighted average exercise price | Weighted average remaining contractual term (in years) | Aggregate intrinsic value | ||||||||||||||||||||
Outstanding at beginning of the year | $ | ||||||||||||||||||||||
Granted during the year | |||||||||||||||||||||||
Forfeited during the year | |||||||||||||||||||||||
Exercised during the year | |||||||||||||||||||||||
Outstanding at end of the year | $ | $ | |||||||||||||||||||||
Exercisable at end of the year | $ | $ | |||||||||||||||||||||
| 2018 | |||||||||||||||||||||||
| Stock Options | Weighted average exercise price | Weighted average remaining contractual term (in years) | Aggregate intrinsic value | ||||||||||||||||||||
Outstanding at beginning of the year | |||||||||||||||||||||||
Granted during the year | |||||||||||||||||||||||
Forfeited during the year | |||||||||||||||||||||||
Exercised during the year | |||||||||||||||||||||||
Outstanding at end of the year | $ | $ | |||||||||||||||||||||
Exercisable at end of the year | $ | $ | |||||||||||||||||||||
The Company granted stock options with a fair value of $1.8 million, $5.1 million and $11.7 million during the years ended December 31, 2020, 2019 and 2018, respectively. The total fair value of options vested during the years ended December 31, 2020, 2019 and 2018 was $1.5 million, $4.3 million and $2.3 million, respectively. The Company received $0.2 million related to the exercise of options for the year ended December 31, 2020. Shares issued upon exercise of the options represent newly issued shares.
The fair value of the stock options grant was estimated on the grant date using a Monte-Carlo simulation valuation model. The weighted average fair value of stock options granted during the years ended December 31, 2020, 2019 and 2018 was $0.65 , $2.48 and $1.69 per option, respectively, based on the grant date assumptions stated below.
164
BrightSphere Investment Group Inc.
Notes to Consolidated Financial Statements (Continued)
December 31, 2020 and 2019
20) Equity-based Compensation (cont.)
| 2020 | 2019 | 2018 | |||||||||||||||
| Weighted-average grant date fair value per option | $ | $ | $ | ||||||||||||||
| Assumptions: | |||||||||||||||||
Dividend yield (1) | % | % | |||||||||||||||
Expected volatility (2) | % | % | |||||||||||||||
Risk-free interest rate (3) | % | % | |||||||||||||||
Expected life of options (4) | |||||||||||||||||
(1)Dividend yield assumption represents the Company’s expected dividend yield based on its historical dividend payouts and the stock price at the date of grant.
(2)Expected volatility is based upon historical BSIG stock price volatility.
(3)The risk-free rate for periods within the contractual life of the option is based on the U.S. Treasury yield curve at the time of grant.
(4)Expected life of options is based on the contractual term and the expected exercise behavior
165
BrightSphere Investment Group Inc.
Notes to Consolidated Financial Statements (Continued)
December 31, 2020 and 2019
21) Accumulated Other Comprehensive Income (Loss)
The components of accumulated other comprehensive income (loss) for the years ended December 31, 2020, 2019 and 2018 were as follows (in millions):
| Foreign currency translation adjustment | Valuation and amortization of derivative securities | Total | ||||||||||||||||||
| Balance, as of December 31, 2017 | $ | $ | ( | $ | ( | |||||||||||||||
| Foreign currency translation adjustment | ( | ( | ||||||||||||||||||
Amortization related to derivatives securities, before tax | ||||||||||||||||||||
| Tax impact | ( | ( | ||||||||||||||||||
| Other comprehensive income | ( | |||||||||||||||||||
| Balance, as of December 31, 2018 | $ | $ | ( | $ | ( | |||||||||||||||
| Foreign currency translation adjustment | ||||||||||||||||||||
Amortization related to derivatives securities, before tax | ||||||||||||||||||||
| Tax impact | ( | ( | ||||||||||||||||||
| Other comprehensive income (loss) | ||||||||||||||||||||
| Balance, as of December 31, 2019 | $ | ( | $ | ( | ||||||||||||||||
| Foreign currency translation adjustment | ||||||||||||||||||||
Amortization related to derivatives securities, before tax | ||||||||||||||||||||
| Tax impact | ( | ( | ||||||||||||||||||
| Other comprehensive income | ||||||||||||||||||||
| Balance, as of December 31, 2020 | $ | $ | ( | $ | ( | |||||||||||||||
166
BrightSphere Investment Group Inc.
Notes to Consolidated Financial Statements
December 31, 2020 and 2019
22) Non-controlling Interests
Non-controlling interests on the Consolidated Balance Sheets include capital and undistributed profits of certain entities that are consolidated, but not 100% owned, which amounted to $1.7 million at December 31, 2020 and $1.3 million at December 31, 2019.
Non-controlling interests in consolidated Funds
Net income (loss) attributable to non-controlling interests in consolidated Funds in the Consolidated Statements of Operations is comprised of the net income or loss and net gains and losses allocated to equity-holders, other than BSIG, of consolidated Funds. For the years ended December 31, 2020, 2019 and 2018 this net income (loss) was $28.8 million, $16.1 million, and $(6.1 ) million, respectively. Non-controlling interests in consolidated Funds on the Consolidated Balance Sheets represents the share of net assets of the Funds attributable to those equity holders who are restricted in their ability to redeem their interests, which amounted to $80.3 million at December 31, 2020, and $48.8 million at December 31, 2019.
Redeemable non-controlling interests in consolidated Funds on the Consolidated Balance Sheets represents the share of net assets of the Funds attributable to those equity holders who are not restricted in their ability to redeem their interests, which amounted to $0.0 million at December 31, 2020, and $83.9 million at December 31, 2019.
23) Derivatives and Hedging
Cash flow hedge
In July 2015, the Company entered into a series of $300.0 million notional Treasury rate lock contracts which were designated and qualified as cash flow hedges. The Company documented its hedging strategy and risk management objective for this contract in anticipation of a future debt issuance. The Treasury rate lock contract eliminated the impact of fluctuations in the underlying benchmark interest rate for future forecasted debt issuances. The Company assessed the effectiveness of the hedging contract at inception and on a quarterly basis thereafter. The forecasted debt issuances occurred in July 2016 and the Treasury rate lock, which had an accumulated fair value of $(34.4 ) million, was settled. Refer to Note 14, Borrowings and Debt, for additional information on the debt issuances.
Amounts recorded in accumulated other comprehensive income in connection with the settled Treasury rate lock were $3.1 million, net of tax of $0.8 million for the year ended December 31, 2020. As of December 31, 2020, the balance in accumulated other comprehensive income (loss) in connection with the Treasury rate lock contract amounted to $(18.0 ) million, net of tax. This balance will be reclassified to earnings through interest expense over the life of the issued debt. Amounts of $3.1 million, $3.0 million and $2.8 million have been reclassified for the years ended December 31, 2020, 2019 and 2018, respectively. During the next twelve months the Company expects to reclassify approximately $3.3 million to interest expense.
167
BrightSphere Investment Group Inc.
Notes to Consolidated Financial Statements (Continued)
December 31, 2020 and 2019
23) Derivatives and Hedging (cont.)
Derivatives of consolidated Funds
In the normal course of business, the Company’s consolidated Funds may enter into transactions involving derivative financial instruments in connection with Funds’ investing activities. Derivative instruments may be used as substitutes for securities in which the Funds can invest; to hedge portfolio investments or to generate income or gain to the Funds. The Funds may also use derivatives to manage duration; sector and yield curve exposures and credit and spread volatility. Derivative financial instruments base their value upon an underlying asset, index or reference rate. These instruments are subject to various risks, including leverage, market, credit, liquidity and operational risks. The Funds manage the risks associated with derivatives on an aggregate basis, along with the risks associated with its trading and as part of its overall risk management policies.
24) Segment Information
The Company has the following business segments:
•Quant & Solutions—comprised of versatile, often highly-tailored strategies that leverage data and technology in a computational, factor based investment process across a range of asset classes and geographies, including Global, non-U.S., and emerging markets equities, as well as multi-asset and managed volatility products.
•Alternatives—comprised of illiquid and differentiated liquid investment strategies that include private equity, real estate and real assets, including forestry, as well as a growing suite of liquid alternative capabilities in areas such as long/short, market neutral and absolute return.
•Liquid Alpha(1)—comprised of specialized investment strategies with a focus on alpha-generation across market cycles in long-only small-, mid-, and large-cap U.S. and non-U.S. equities, as well as fixed income.
(1)In July 2020, the Company completed the sale of Copper Rock, and in November 2020, the Company completed the sale of Barrow Hanley. See Note 3, Divestitures, for further discussion of divestitures. The financial results of Copper Rock are included in the Liquid Alpha segment until July 24, 2020, the completion of the sale. The financial results of Barrow Hanley are included in the Liquid Alpha segment until November 17, 2020, the completion of the sale.
The Company has a corporate head office that is included in “Other”. The corporate head office supports the segments by providing infrastructure and administrative support in the areas of accounting/finance, information technology, legal, compliance and human resources. The corporate head office expenses are not allocated to the Company’s three business segments but the Chief Operating Decision Maker (“CODM”) does consider the cost structure of the corporate head office when evaluating the financial performance of the segments.
168
BrightSphere Investment Group Inc.
Notes to Consolidated Financial Statements (Continued)
December 31, 2020 and 2019
24) Segment Information (cont.)
Performance Measure
The primary measure used by the CODM in measuring performance and allocating resources to the segments is Economic Net Income ("ENI"). The Company defines economic net income for the segments as ENI revenue less (i) ENI operating expenses, (ii) variable compensation and (iii) key employee distributions. The ENI adjustments to U.S. GAAP include both reclassifications of U.S. GAAP revenue and expense items, as well as adjustments to U.S. GAAP results, primarily to exclude non-cash, non-economic expenses, or to reflect cash benefits not recognized under U.S. GAAP. This measure supplements and should be considered in addition to, and not in lieu of, the Consolidated Statements of Operations prepared in accordance with U.S. GAAP. The Company does not disclose total asset information for its reportable segments as the information is not reviewed by the CODM.
ENI revenue includes management fees, performance fees and other revenue under U.S. GAAP, adjusted to include management fees paid to Affiliates by consolidated Funds and the Company’s share of earnings from its equity-accounted Affiliate. ENI revenue is also adjusted to exclude the separate revenues recorded under U.S. GAAP for certain Fund expenses reimbursed to our Affiliates.
ENI operating expenses include compensation and benefits, general and administrative expense, and depreciation and amortization under U.S. GAAP, adjusted to exclude non-cash expenses representing changes in the value of Affiliate equity and profit interests held by Affiliate key employees, non-cash amortization of acquisition-related contingent consideration, as well as the value of employee equity owned pre-acquisition that occurred as a result of the Landmark transaction, goodwill impairment and amortization of acquired intangible assets, capital transaction costs, restructuring costs, the impact of a one-time compensation arrangement entered into that includes advances against future compensation payments, and the separate expenses recorded under U.S. GAAP for certain Fund expenses reimbursed to Affiliates. Additionally, variable compensation and Affiliate key employee distributions are segregated from ENI operating expenses.
ENI segment results are also adjusted to exclude the portion of consolidated Fund revenues, expenses and investment return recorded under U.S. GAAP.
169
BrightSphere Investment Group Inc.
Notes to Consolidated Financial Statements (Continued)
December 31, 2020 and 2019
24) Segment Information (cont.)
Segment Presentation
The following tables set forth summarized operating results for the Company's three segments and related adjustments necessary to reconcile the segment economic net income to arrive at the Company's consolidated U.S. GAAP net income (loss) for the year ended December 31, 2020 (in millions):
| Quant & Solutions | Alter-natives | Liquid Alpha | Other | Reconciling Adjustments | Total U.S. GAAP(1) | ||||||||||||||||||||||||||||||
| ENI revenue | $ | $ | $ | $ | $ | (a) | $ | ||||||||||||||||||||||||||||
| ENI operating expenses | (b) | ||||||||||||||||||||||||||||||||||
| Earnings before variable compensation | ( | ( | |||||||||||||||||||||||||||||||||
| Variable compensation | (c) | ||||||||||||||||||||||||||||||||||
| ENI operating earnings (after variable comp) | ( | ( | |||||||||||||||||||||||||||||||||
| Affiliate key employee distributions | |||||||||||||||||||||||||||||||||||
| Earnings after Affiliate key employee distributions | ( | ( | |||||||||||||||||||||||||||||||||
| Net interest income (expense) | ( | ( | (d) | ( | |||||||||||||||||||||||||||||||
| Net investment income | (e) | ||||||||||||||||||||||||||||||||||
| Gain on sale of Affiliates | (e) | ||||||||||||||||||||||||||||||||||
| Net income attributable to non-controlling interests in consolidated Funds | ( | (e) | ( | ||||||||||||||||||||||||||||||||
| Income tax (expense) benefit | ( | ( | (f) | ( | |||||||||||||||||||||||||||||||
| Economic net income | $ | $ | $ | $ | ( | $ | $ | ||||||||||||||||||||||||||||
170
BrightSphere Investment Group Inc.
Notes to Consolidated Financial Statements (Continued)
December 31, 2020 and 2019
24) Segment Information (cont.)
The following table presents the financial data for the Company’s three segments for the year ended December 31, 2019 (in millions):
| Quant & Solutions | Alter-natives | Liquid Alpha | Other | Reconciling Adjustments | Total U.S. GAAP(1) | ||||||||||||||||||||||||||||||
| ENI revenue | $ | $ | $ | $ | $ | (a) | $ | ||||||||||||||||||||||||||||
| ENI operating expenses | ( | (b) | |||||||||||||||||||||||||||||||||
Earnings before variable compensation | ( | ||||||||||||||||||||||||||||||||||
| Variable compensation | (c) | ||||||||||||||||||||||||||||||||||
ENI operating earnings (after variable comp) | ( | ||||||||||||||||||||||||||||||||||
Affiliate key employee distributions | ( | (g) | |||||||||||||||||||||||||||||||||
Earnings after Affiliate key employee distributions | ( | ||||||||||||||||||||||||||||||||||
| Net interest income (expense) | ( | ( | (d) | ( | |||||||||||||||||||||||||||||||
| Net investment income | (e) | ||||||||||||||||||||||||||||||||||
Net income attributable to non-controlling interests in consolidated Funds | ( | (e) | ( | ||||||||||||||||||||||||||||||||
| Income tax (expense) benefit | ( | (f) | ( | ||||||||||||||||||||||||||||||||
Economic net income | $ | $ | $ | $ | ( | $ | $ | ||||||||||||||||||||||||||||
171
BrightSphere Investment Group Inc.
Notes to Consolidated Financial Statements (Continued)
December 31, 2020 and 2019
24) Segment Information (cont.)
The following table presents the financial data for the Company’s three segments for the year ended December 31, 2018 (in millions):
| Quant & Solutions | Alter-natives | Liquid Alpha | Other | Reconciling Adjustments | Total U.S. GAAP(1) | ||||||||||||||||||||||||||||||
| ENI revenue | $ | $ | $ | $ | $ | (a) | $ | ||||||||||||||||||||||||||||
| ENI operating expenses | (b) | ||||||||||||||||||||||||||||||||||
Earnings before variable compensation | ( | ( | |||||||||||||||||||||||||||||||||
| Variable compensation | (c) | ||||||||||||||||||||||||||||||||||
ENI operating earnings (after variable comp) | ( | ( | |||||||||||||||||||||||||||||||||
Affiliate key employee distributions | |||||||||||||||||||||||||||||||||||
Earnings after Affiliate key employee distributions | ( | ( | |||||||||||||||||||||||||||||||||
| Net interest income (expense) | ( | ( | (d) | ( | |||||||||||||||||||||||||||||||
| Net investment income | (e) | ||||||||||||||||||||||||||||||||||
Net income attributable to non-controlling interests in consolidated Funds | (e) | ||||||||||||||||||||||||||||||||||
Revaluation of DTA deed | (h) | ||||||||||||||||||||||||||||||||||
| Income tax (expense) benefit | ( | (f) | ( | ||||||||||||||||||||||||||||||||
Gain (loss) on disposal of discontinued operations, net of tax | (e) | ||||||||||||||||||||||||||||||||||
Economic net income | $ | $ | $ | $ | ( | $ | ( | $ | |||||||||||||||||||||||||||
(1)The most directly comparable U.S. GAAP measure of ENI revenue is U.S. GAAP revenue. The most directly comparable U.S. GAAP measure of ENI operating expenses is U.S. GAAP operating expenses, which is comprised of ENI operating expenses, variable compensation and Affiliate key employee distributions above. The most directly comparable U.S. GAAP measure of earnings after Affiliate key employee distributions is U.S. GAAP operating income. The most directly comparable U.S. GAAP measure of ENI is U.S. GAAP net income attributable to controlling interests.
Reconciling Adjustments:
(a)Adjusted to exclude earnings from equity-accounted Affiliate, which are included in U.S. GAAP investment income, and to include consolidated Funds revenues and the separate revenues recorded for certain Fund expenses reimbursed by customers, which are included in U.S. GAAP revenue.
(b)Adjusted to include non-cash amortization expense for acquisition-related consideration and pre-acquisition employee equity, non-cash expenses for key employee equity and profit interest revaluations, capital transaction costs, goodwill impairment and amortization of acquired intangible assets, restructuring costs, consolidated Funds’ operating expenses and the Fund expenses reimbursed by customers, each of which are included in U.S. GAAP operating expenses.
(c)Adjusted to include restructuring costs and the impact of a one-time compensation arrangement entered into during the first quarter of 2020 that includes advances against future compensation payments, which are included in U.S. GAAP compensation expense.
172
BrightSphere Investment Group Inc.
Notes to Consolidated Financial Statements (Continued)
December 31, 2020 and 2019
24) Segment Information (cont.)
(d)Adjusted to include the cost of seed financing and amortization of debt issuance costs, which is included in U.S. GAAP interest expense.
(e)Adjusted to include net investment income (loss), net income (loss) attributable to non-controlling interests in consolidated Funds, and the gain on sale of Affiliates, all of which are included in U.S. GAAP net income attributable to controlling interests.
(f)Adjusted to include the impact of deferred tax attributable to the amortization of goodwill and acquired intangibles. Also adjusted to include tax expense or benefits relating to uncertain tax positions, the tax impact of certain ENI adjustments and other unusual items that are not included in current operating results for ENI purposes.
(g)Adjusted to exclude the amount of variable compensation related to restructuring at an Affiliate, which will be reimbursed through Affiliate key employee distributions.
(h)Adjusted to exclude the revaluation gain associated with the settlement of the DTA Deed with OM plc, which is included in U.S. GAAP non-operating income.
Management fee revenue by principal geographic area is comprised of the following for the years ended December 31, 2020, 2019 and 2018 (in millions):
| Years ended December 31, | |||||||||||||||||
| 2020 | 2019 | 2018 | |||||||||||||||
| U.S. | $ | $ | $ | ||||||||||||||
| Non-U.S. | |||||||||||||||||
Management fee revenue | $ | $ | $ | ||||||||||||||
173
BrightSphere Investment Group Inc.
Notes to Consolidated Financial Statements (Continued)
December 31, 2020 and 2019
25) Selected Quarterly Financial Data (unaudited)
The following is a summary of the quarterly results of operations of the Company for the years ended December 31, 2020 and 2019 ($ in millions, unless otherwise noted):
| 2020 | |||||||||||||||||||||||
| First Quarter | Second Quarter | Third Quarter | Fourth Quarter | ||||||||||||||||||||
| Revenue | $ | $ | $ | $ | |||||||||||||||||||
| Operating income | |||||||||||||||||||||||
Income from continuing operations before income taxes | |||||||||||||||||||||||
| Net income | |||||||||||||||||||||||
Net income attributable to controlling interests | |||||||||||||||||||||||
| Basic earnings per share ($) | $ | $ | $ | $ | |||||||||||||||||||
| Diluted earnings per share ($) | $ | $ | $ | $ | |||||||||||||||||||
| Basic shares outstanding (in millions) | |||||||||||||||||||||||
| Diluted shares outstanding (in millions) | |||||||||||||||||||||||
| 2019 | |||||||||||||||||||||||
| First Quarter | Second Quarter | Third Quarter | Fourth Quarter | ||||||||||||||||||||
| Revenue | $ | $ | $ | $ | |||||||||||||||||||
| Operating income | |||||||||||||||||||||||
Income from continuing operations before income taxes | |||||||||||||||||||||||
| Net income (loss) | |||||||||||||||||||||||
Net income (loss) attributable to controlling interests | |||||||||||||||||||||||
| Basic earnings (loss) per share ($) | $ | $ | $ | $ | |||||||||||||||||||
| Diluted earnings (loss) per share ($) | $ | $ | $ | $ | |||||||||||||||||||
| Basic shares outstanding (in millions) | |||||||||||||||||||||||
| Diluted shares outstanding (in millions) | |||||||||||||||||||||||
174
BrightSphere Investment Group Inc.
Notes to Consolidated Financial Statements (Continued)
December 31, 2020 and 2019
26) Subsequent Events
Sale of Investment Counselors of Maryland
On February 6, 2021 the Company entered into a definitive agreement to sell all of the Company’s interests in Investment Counselors of Maryland (“ICM”), an equity-accounted Affiliate within the Liquid Alpha segment in exchange for approximately $19 million of cash consideration, subject to certain customary closing and post-closing adjustments. As of December 31, 2020 the carrying value of the Company’s investment was $2.0 million. ICM comprised $2.9 million of the Company’s net income attributable to controlling interests of $286.7 million for the year ended December 31, 2020. The transaction is expected to close during second quarter of 2021.
175
Item 9. Changes in and Disagreements With Accountants on Accounting and Financial Disclosure.
None.
Item 9A. Controls and Procedures.
Evaluation of Disclosure Controls and Procedures
Our management, including our principal executive officer, and our principal financial officer, evaluated the effectiveness of our disclosure controls and procedures (as such term is defined in Rules 13a-15(e) and 15d-15(e) under the Exchange Act) at December 31, 2020. Disclosure controls and procedures are designed to ensure that the information we are required to disclose in the reports that we file or submit under the Exchange Act is recorded, processed, summarized and reported within the time period specified in the SEC’s rule and forms. Disclosure controls and procedures include, without limitation, controls and procedures designed to ensure that information we are required to disclose in the reports that we file or submit under the Exchange Act is accumulated and communicated to our management, including our principal executive officer and principal financial officer, to allow timely decisions regarding required disclosure. Our principal executive officer and principal financial officer participated in this evaluation and concluded that, as of December 31, 2020, our disclosure controls and procedures were effective.
Report of Management on Internal Control Over Financial Reporting
Management is responsible for establishing and maintaining adequate internal control over financial reporting.
Management has evaluated the effectiveness of internal control over financial reporting as of December 31, 2020 based on the criteria established in Internal Control - Integrated Framework (2013) issued by the Committee of Sponsoring Organizations of the Treadway Commission. Based on management’s assessment, management concluded that the Company’s internal control over financial reporting was effective as of December 31, 2020.
KPMG LLP, an independent registered public accounting firm, has audited the financial statements that are included in this Annual Report on Form 10-K and expressed an opinion thereon. KPMG LLP has also expressed an opinion on the effectiveness of internal control over financial reporting as of December 31, 2020, which is included herein.
Changes in Internal Control Over Financial Reporting
There have been no changes in our internal control over financial reporting that occurred during the fourth quarter of our fiscal year ended December 31, 2020 that materially affected, or are reasonably likely to materially affect, our internal control over financial reporting.
Item 9B. Other Information.
On February 23, 2021, we along with the Lenders, entered into an assignment and assumption and amendment agreement (the “Assignment”) to the Amended Credit Agreement. Pursuant to the Assignment, the Amended Credit Agreement was assigned to and assumed by Acadian and the Amended Credit Agreement was amended (the Amended Credit Agreement, as amended by the Assignment, the “Acadian Credit Agreement”) to, among other things, reduce the Lenders’ commitments thereunder to $125 million. See “Management’s Discussion and Analysis of Financial Condition and Results of Operations—Capital Resources and Liquidity—Third party borrowings—Revolving Credit Facility” for more information.
176
PART III
Item 10. Directors, Executive Officers and Corporate Governance.
The information required by this Item will be set forth in our definitive proxy statement required to be filed pursuant to Regulation 14A for the 2021 annual meeting of shareholders.
Item 11. Executive Compensation.
The information required by this Item will be set forth in our definitive proxy statement required to be filed pursuant to Regulation 14A for the 2021 annual meeting of shareholders.
Item 12. Security Ownership of Certain Beneficial Owners and Management and Related Stockholder Matters.
The information required by this Item will be set forth in our definitive proxy statement required to be filed pursuant to Regulation 14A for the 2021 annual meeting of shareholders.
Item 13. Certain Relationships and Related Transactions, and Director Independence.
The information required by this Item will be set forth in our definitive proxy statement required to be filed pursuant to Regulation 14A for the 2021 annual meeting of shareholders.
Item 14. Principal Accountant Fees and Services.
The information required by this Item will be set forth in our definitive proxy statement required to be filed pursuant to Regulation 14A for the 2021 annual meeting of shareholders.
177
PART IV
Item 15. Exhibits, Financial Statements Schedules.
(1)Financial Statements: The information required by this Item is contained in Item 8 of Part II of this report.
(2)Financial Statement Schedules: None
(3)Exhibits:
| Exhibit No. | Description | |||||||
| 2.1 | ||||||||
| 2.2 | ||||||||
| 3.1 | ||||||||
| 3.2 | ||||||||
| 4.1 | ||||||||
| 4.2 | ||||||||
| 4.3 | ||||||||
| 4.4 | ||||||||
| 4.5 | ||||||||
| 4.6 | ||||||||
178
| Exhibit No. | Description | |||||||
| 4.7 | ||||||||
| 4.8 | ||||||||
| 4.9 | ||||||||
| 10.1 | ||||||||
| 10.2 | ||||||||
| 10.3 | ||||||||
| 10.4 | ||||||||
| 10.5 | ||||||||
| 10.6 | ||||||||
| 10.7 | ||||||||
| 10.8 | ||||||||
| 10.9 | ||||||||
| 10.10 | ||||||||
179
| Exhibit No. | Description | |||||||
| 10.11 | ||||||||
| 10.12 | ||||||||
| 10.13 | ||||||||
| 10.14 | ||||||||
| 10.15 | ||||||||
| 10.16 | ||||||||
| 10.17 | ||||||||
| 10.18 | ||||||||
| 10.19 | ||||||||
| 10.20 | ||||||||
| 10.21 | ||||||||
| 10.22 | ||||||||
| 10.23 | ||||||||
| 10.24 | ||||||||
180
| Exhibit No. | Description | |||||||
| 10.25 | ||||||||
| 10.26 | ||||||||
| 10.27 | ||||||||
| 10.28 | ||||||||
| 10.29 | ||||||||
| 10.30 | ||||||||
| 10.31 | * | |||||||
| 10.32 | * | |||||||
| 21.1 | * | |||||||
| 23.1 | * | |||||||
| 31.1 | * | |||||||
| 31.2 | * | |||||||
| 32.1 | ** | |||||||
| 32.2 | ** | |||||||
181
| Exhibit No. | Description | |||||||
| 101 | * | Interactive data files pursuant to Rule 405 of Regulation S-T: (i) the Consolidated Balance Sheets as of December 31, 2020 and December 31, 2019; (ii) the Consolidated Statements of Operations for the years ended December 31, 2020, 2019 and 2018; (iii) the Consolidated Statements of Comprehensive Income (Loss) for the years ended December 31, 2020, 2019 and 2018; (iv) the Consolidated Statements of Changes in Shareholders’ Equity for the years ended December 31, 2020, 2019 and 2018; (v) the Consolidated Statements of Cash Flows for the years ended December 31, 2020, 2019 and 2018; and (vi) the Notes to Consolidated Financial Statements. | ||||||
| 104 | * | The cover page of this Annual Report on Form 10-K, formatted in Inline eXtensible Business Reporting Language (embedded within the Inline XBRL document contained in Exhibit 101). | ||||||
_______________________________________________________________________________
* Filed herewith
**Furnished herewith
Item 16. Form 10-K Summary
None.
SIGNATURES
Pursuant to the requirements of Section 13 or 15(d) of the Securities Exchange Act of 1934, the registrant has duly caused this report to be signed on its behalf by the undersigned, thereunto duly authorized.
| BrightSphere Investment Group Inc. | |||||||||||
| Dated: | March 1, 2021 | ||||||||||
| By: | /s/ Suren Rana | ||||||||||
| Suren Rana President and Chief Executive Officer (principal executive officer) | |||||||||||
| /s/ Christina Wiater | |||||||||||
| Christina Wiater Senior Vice President and Principal Financial Officer (principal financial officer and principal accounting officer) | |||||||||||
182
Pursuant to the requirements of the Securities Exchange Act of 1934, this report has been signed below by the following persons on behalf of the registrant and in the capacities and on the dates indicated.
| Signature | Title | Date | |||||||||
| /s/ SUREN RANA | |||||||||||
| Suren Rana | President and Chief Executive Officer | March 1, 2021 | |||||||||
| /s/ JOHN PAULSON | |||||||||||
| John Paulson | Chairman | March 1, 2021 | |||||||||
| /s/ ROBERT J. CHERSI | |||||||||||
| Robert J. Chersi | Director | March 1, 2021 | |||||||||
| /s/ ANDREW KIM | |||||||||||
| Andrew Kim | Director | March 1, 2021 | |||||||||
| /s/ BARBARA TREBBI | |||||||||||
| Barbara Trebbi | Director | March 1, 2021 | |||||||||
183
QuickLinks
Serious News for Serious Traders! Try StreetInsider.com Premium Free!
You May Also Be Interested In
- Four ONDA Partners Earn Placement on D Magazine’s Best Lawyers List
- ROSEN, RECOGNIZED INVESTOR COUNSEL, Encourages CI&T Inc Investors to Inquire About Securities Class Action Investigation – CINT
- Averill & Reaney Attorneys at Law Unveils New Community Recovery Initiative
Create E-mail Alert Related Categories
SEC FilingsSign up for StreetInsider Free!
Receive full access to all new and archived articles, unlimited portfolio tracking, e-mail alerts, custom newswires and RSS feeds - and more!
