

Form S-1/A Clearwater Analytics
 Tweet
Tweet Share
ShareTable of Contents
Index to Financial Statements
As filed with the United States Securities and Exchange Commission on September 21, 2021.
Registration No. 333-259155
UNITED STATES
SECURITIES AND EXCHANGE COMMISSION
Washington, D.C. 20549
Amendment No. 4
to
FORM S-1
REGISTRATION STATEMENT
UNDER
THE SECURITIES ACT OF 1933
Clearwater Analytics Holdings, Inc.
(Exact name of registrant as specified in its charter)
| Delaware | 7372 | 87-1043711 | ||
| (State or other jurisdiction of incorporation or organization) |
(Primary Standard Industrial Classification Code Number) |
(I.R.S. Employer Identification No.) |
777 W. Main Street
Suite 900
Boise, ID 83702
(208) 918-2400
(Address, including zip code, and telephone number, including area code, of registrant’s principal executive offices)
Alphonse Valbrune
Chief Legal Officer
777 W. Main Street
Suite 900
Boise, ID 83702
(208) 918-2400
(Name, address, including zip code, and telephone number, including area code, of agent for service)
Copies of all communications, including communications sent to agent for service, should be sent to:
| Joshua N. Korff, P.C. Ross M. Leff, P.C. Aslam A. Rawoof Kirkland & Ellis LLP 601 Lexington Avenue New York, New York 10022 (212) 446-4800 |
Ryan J. Dzierniejko Michael J. Zeidel Richard L. Oliver Skadden, Arps, Slate, Meagher & Flom LLP One Manhattan West New York, New York 10001 (212) 735-3000 |
Approximate date of commencement of proposed sale to the public: As soon as practicable after the effective date of this Registration Statement.
If any of the securities being registered on this Form are to be offered on a delayed or continuous basis pursuant to Rule 415 under the Securities Act of 1933, check the following box. ☐
If this Form is filed to register additional securities for an offering pursuant to Rule 462(b) under the Securities Act, please check the following box and list the Securities Act registration statement number of the earlier effective registration statement for the same offering. ☐
If this Form is a post-effective amendment filed pursuant to Rule 462(c) under the Securities Act, please check the following box and list the Securities Act registration statement number of the earlier effective registration statement for the same offering. ☐
If this Form is a post-effective amendment filed pursuant to Rule 462(d) under the Securities Act, check the following box and list the Securities Act registration statement number of the earlier effective registration statement for the same offering. ☐
Indicate by check mark whether the registrant is a large accelerated filer, an accelerated filer, a non-accelerated filer, a smaller reporting company or an emerging growth company. See the definitions of “large accelerated filer,” “accelerated filer,” “smaller reporting company” and “emerging growth company” in Rule 12b-2 of the Securities Exchange Act of 1934, as amended “the “Exchange Act”).
| Large accelerated filer | ☐ | Accelerated filer | ☐ | |||
| Non-accelerated filer | ☒ | Smaller reporting company | ☐ | |||
| Emerging growth company | ☒ | |||||
If an emerging growth company, indicate by check mark if the registrant has elected not to use the extended transition period for complying with any new or revised financial accounting standards provided pursuant to Section 7(a)(2)(B) of the Securities Act. ☐
CALCULATION OF REGISTRATION FEE
|
| ||||||||
| Title of Each Class of Securities to be Registered |
Amount to be |
Proposed Maximum Offering Price Per Share(2) |
Proposed Maximum Aggregate Offering Price(1)(2) |
Amount of Registration Fee(3) | ||||
| Class A Common Stock, par value $0.001 per share |
34,500,000 | $16.00 | $552,000,000 | $60,223.20 | ||||
|
| ||||||||
|
| ||||||||
| (1) | Includes 4,500,000 shares of Class A common stock that may be purchased by the underwriters upon the exercise of their option to purchase additional shares. See “Underwriting.” |
| (2) | Estimated solely for the purpose of computing the amount of the registration fee pursuant to Rule 457(a) under the Securities Act of 1933, as amended. |
| (3) | $60,223.20 previously paid. |
The registrant hereby amends this Registration Statement on such date or dates as may be necessary to delay its effective date until the registrant shall file a further amendment which specifically states that this Registration Statement shall thereafter become effective in accordance with Section 8(a) of the Securities Act of 1933 or until this Registration Statement shall become effective on such date as the Securities and Exchange Commission, acting pursuant to said Section 8(a), may determine.
Table of Contents
Index to Financial Statements
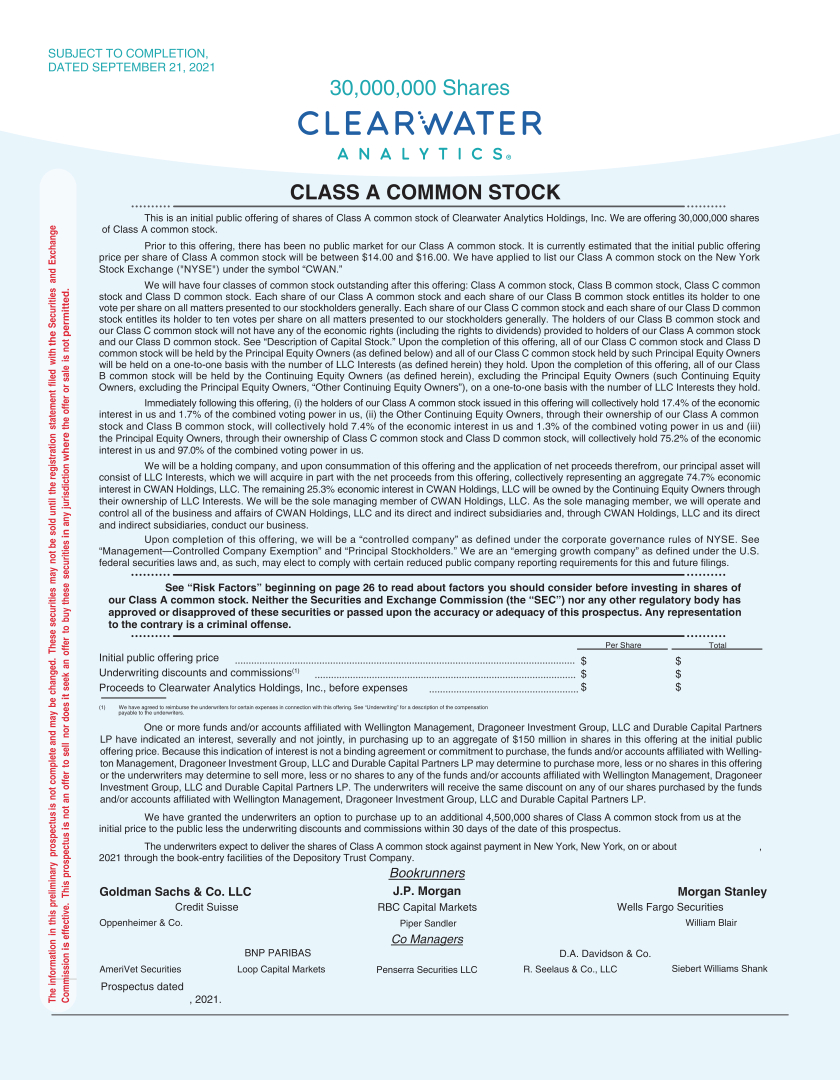
The information in this preliminary prospectus is not complete and may be changed. These securities may not be sold until the registration statement filed with the Securities and Exchange Commission is effective. This prospectus is not an offer to sell nor does it seek an offer to buy these securities in any jurisdiction where the offer or sale is not permitted. SUBJECT TO COMPLETION, DATED SEPTEMBER 20, 2021 Shares clearwater analytics CLASS A COMMON STOCK This is an initial public offering of shares of Class A common stock of Clearwater Analytics Holdings, Inc. We are offering shares of Class A common stock. Prior to this offering, there has been no public market for our Class A common stock. It is currently estimated that the initial public offering price per share of Class A common stock will be between $ and $. We have applied to list our Class A common stock on under the symbol "CWAN." We will have four classes of common stock outstanding after this offering: Class A common stock, Class B common stock, Class C common stock and Class D common stock. Each share of our Class A common stock and each share of our Class B common stock entitles its holder to one vote per share on all matters presented to our stockholders generally. Each share of our Class C common stock and each share of our Class D common stock entitles its holder to ten votes per share on all matters presented to our stockholders generally. The holders of our Class B common stock and our Class C common stock will not have any of the economic rights (including the rights to dividends) provided to holders of our Class A common stock and our Class D common stock. See "Description of Capital Stock." Upon the completion of this offering, all of our Class C common stock and Class D common stock will be held by the Principal Equity Owners (as defined below) and all of our Class C common stock held by such Principal Equity Owners will be held on a one-to-one basis with the number of LLC Interests (as defined herein) they hold. Upon the completion of this offering, all of our Class B common stock will be held by the Continuing Equity Owners (as defined herein), excluding the Principal Equity Owners (such Continuing Equity Owners, excluding the Principal Equity Owners, "Other Continuing Equity Owners"), on a one-to-one basis with the number of LLC Interests they hold. Immediately following this offering, (i) the holders of our Class A common stock issued in this offering will collectively hold % of the economic interest in us and % of the combined voting power in us, (ii) the Other Continuing Equity Owners, through their ownership of our Class A common stock and Class B common stock, will collectively hold % of the economic interest in us and % of the combined voting power in us and (iii) the Principal Equity Owners, through their ownership of Class C common stock and Class D common stock, will collectively hold % of the economic interest in us and % of the combined voting power in us. We will be a holding company, and upon consummation of this offering and the application of net proceeds therefrom, our principal asset will consist of LLC Interests, which we will acquire in part with the net proceeds from this offering, collectively representing an aggregate % economic interest in CWAN Holdings, LLC. The remaining % economic interest in CWAN Holdings, LLC will be owned by the Continuing Equity Owners through their ownership of LLC Interests. We will be the sole managing member of CWAN Holdings, LLC. As the sole managing member, we will operate and control all of the business and affairs of CWAN Holdings, LLC and its direct and indirect subsidiaries and, through CWAN Holdings, LLC and its direct and indirect subsidiaries, conduct our business. Upon completion of this offering, we will be a "controlled company" as defined under the corporate governance rules of See "Management-Controlled Company Exemption" and "Principal Stockholders." We are an "emerging growth company" as defined under the U.S. federal securities laws and, as such, may elect to comply with certain reduced public company reporting requirements for this and future filings. See "Risk Factors" beginning on page 26 to read about factors you should consider before investing in shares of our Class A common stock. Neither the Securities and Exchange Commission (the "SEC") nor any other regulatory body has approved or disapproved of these securities or passed upon the accuracy or adequacy of this prospectus. Any representation to the contrary is a criminal offense. Per Share Total Initial public offering price Underwriting discounts and commissions(1) Proceeds to Clearwater Analytics Holdings, Inc., before expenses $ $ $ $ $ $ (1) One or more funds and/or accounts affiliated with Wellington Management, Dragoneer Investment Group, LLC and Durable Capital Partners LP have indicated an interest, severally and not jointly, in purchasing up to an aggregate of $150 million in shares in this offering at the initial public offering price. Because this indication of interest is not a binding agreement or commitment to purchase, the funds and/or accounts affiliated with Wellington Management, Dragoneer Investment Group, LLC and Durable Capital Partners LP may determine to purchase more, less or no shares in this offering or the underwriters may determine to sell more, less or no shares to any of the funds and/or accounts affiliated with Wellington Management, Dragoneer Investment Group, LLC and Durable Capital Partners LP. The underwriters will receive the same discount on any of our shares purchased by the funds and/or accounts affiliated with Wellington Management, Dragoneer Investment Group, LLC and Durable Capital Partners LP.We have agreed to reimburse the underwriters for certain expenses in connection with this offering. See "Underwriting" for a description of the compensation payable to the underwriters. We have granted the underwriters an option to purchase up to an additional shares of Class A common stock from us at the initial price to the public less the underwriting discounts and commissions within 30 days of the date of this prospectus. The underwriters expect to deliver the shares of Class A common stock against payment in New York, New York, on or about, 2021 through the book-entry facilities of the Depository Trust Company. Joint Bookrunners Prospectus dated , 2021. Joint Bookrunners Goldman Sachs & Co. LLC J.P. Morgan Morgan Stanley Wells Fargo Securities RBC Capital Markets Credit Suisse Piper Sandler William Blair Oppenheimer & Co. Co Managers BNP Paribas D.A. Davidson AmeriVet Securities Loop Capital Markets Penserra Securities LLC R. Seelaus & Co., LLC Siebert Williams Shank
Table of Contents
Index to Financial Statements

Table of Contents
Index to Financial Statements
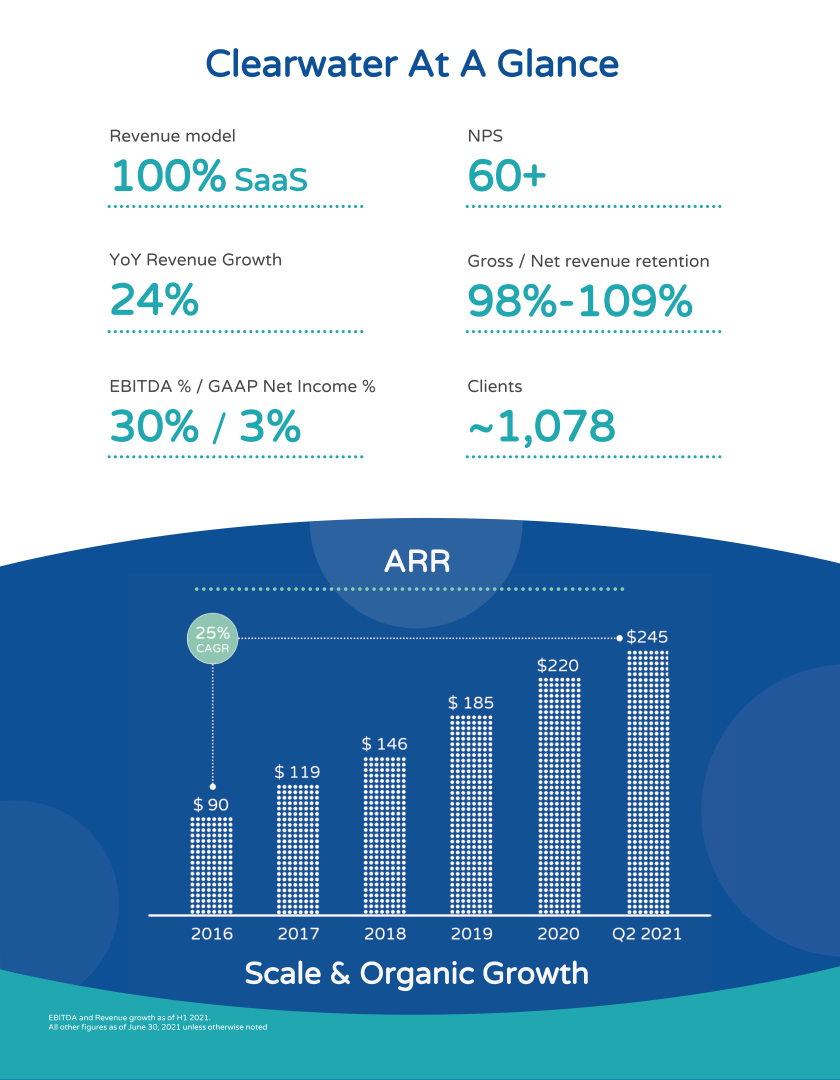
Table of Contents
Index to Financial Statements
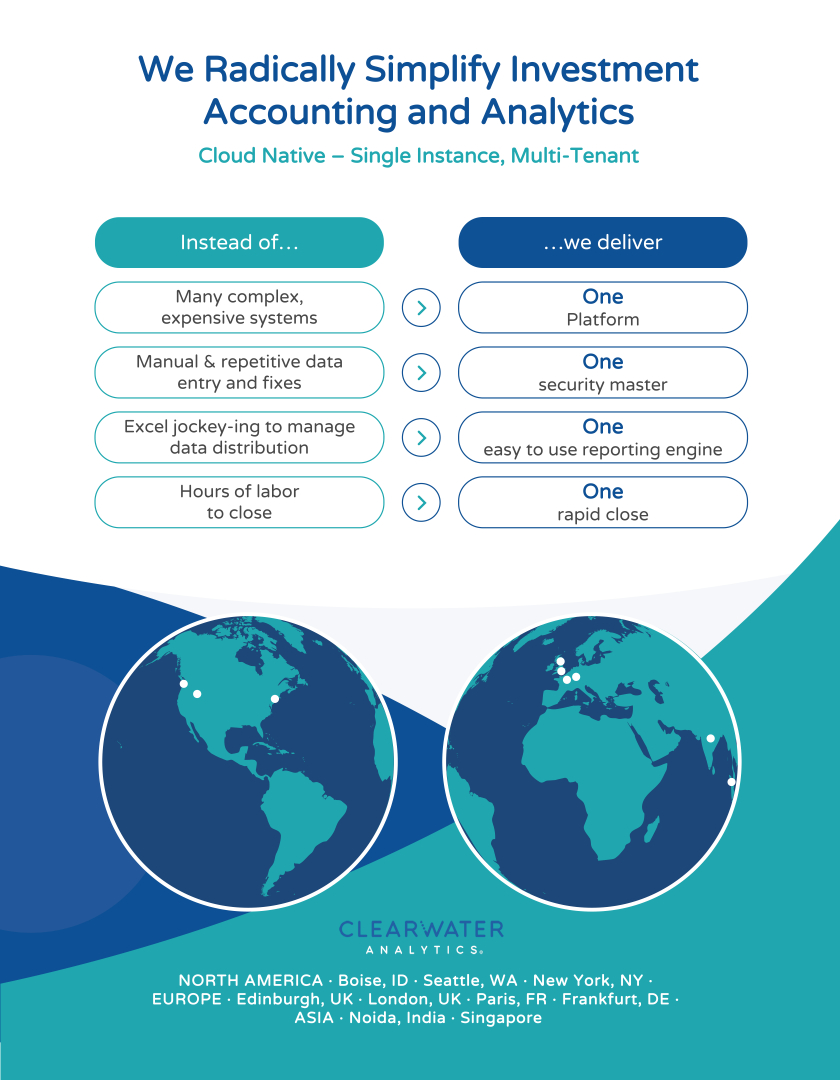
Table of Contents
Index to Financial Statements
| Page | ||||
| ii | ||||
| 1 | ||||
| 1 | ||||
| 17 | ||||
| 23 | ||||
| 26 | ||||
| 56 | ||||
| 58 | ||||
| 59 | ||||
| 64 | ||||
| 65 | ||||
| 67 | ||||
| 69 | ||||
| Management’s Discussion and Analysis of Financial Condition and Results of Operations |
80 | |||
| 103 | ||||
| 121 | ||||
| 128 | ||||
| 140 | ||||
| 144 | ||||
| 152 | ||||
| 153 | ||||
| 162 | ||||
| Material U.S. Federal Income Tax Considerations for Non-U.S. Holders Of Class A Common Stock |
164 | |||
| 169 | ||||
| 177 | ||||
| 177 | ||||
| 177 | ||||
| F-1 | ||||
i
Table of Contents
Index to Financial Statements
We and the underwriters have not authorized anyone to provide you with information or to make any representations other than those contained in this prospectus or in any free writing prospectuses prepared by or on behalf of us or to which we have referred you. We and the underwriters take no responsibility for, and provide no assurance as to the reliability of, any other information that others may give you. This prospectus is an offer to sell only the shares of Class A common stock offered hereby and only under circumstances and in jurisdictions where it is lawful to do so. You should assume that the information appearing in this prospectus is accurate as of the date on the front cover of this prospectus only. Our business, financial condition, results of operations and prospects may have changed since that date.
For investors outside the United States: we and the underwriters have not done anything that would permit this offering or possession or distribution of this prospectus in any jurisdiction where action for that purpose is required, other than in the United States. Persons outside the United States who come into possession of this prospectus must inform themselves about and observe any restrictions relating to the offering of the shares of Class A common stock and the distribution of this prospectus outside the United States.
Organizational Structure
In connection with the closing of this offering, we will undertake certain organizational transactions to reorganize our corporate structure. Unless otherwise stated or the context otherwise requires, all information in this prospectus reflects the consummation of the organizational transactions described in the section titled “Organizational Structure” and this offering, and the application of the proceeds therefrom, which we refer to, collectively, as the “Transactions.” See “Organizational Structure” for a diagram depicting our organizational structure after giving effect to the Transactions, including this offering.
Certain Definitions
As used in this prospectus, unless the context otherwise requires:
| • | “Company,” “we,” “us,” “our,” “Clearwater” and similar references refer, (1) following the consummation of the Transactions, including this offering, to Clearwater Analytics Holdings, Inc., and, unless otherwise stated, all of its direct and indirect subsidiaries, including CWAN Holdings, LLC, and (2) prior to the completion of the Transactions, including this offering, to CWAN Holdings, LLC and, unless otherwise stated, all of its direct and indirect subsidiaries. |
| • | “Blocker Entities” refers to entities affiliated with certain of the Continuing Equity Owners, each of which is a direct or indirect owner of LLC Interests in CWAN Holdings, LLC prior to the Transactions and is taxable as a corporation for U.S. federal income tax purposes. |
| • | “Blocker Shareholders” refers to entities affiliated with certain of the Continuing Equity Owners, each of which is an owner of one or more of the Blocker Entities prior to the Transactions, which will exchange their interests in the Blocker Entities for shares of our Class A common stock, in the case of Other Continuing Equity Owners, and for shares of our Class D common stock, in the case of the Principal Equity Owners, in connection with the consummation of the Transactions. |
| • | “Continuing Equity Owners” refers collectively to direct or indirect holders of LLC Interests and/or our Class B common stock, Class C common stock and/or Class D common stock immediately following consummation of the Transactions, including the Principal Equity Owners and certain of our directors and officers and their respective Permitted Transferees who may, following the consummation of this offering, exchange at each of their respective options, in whole or in part from time to time, their LLC Interests (along with an equal number of shares of Class B common stock or Class C common stock, as the case may be (and such shares shall be immediately cancelled)) for newly issued shares of our Class A common stock or our Class D common stock, as the case may be, as described in “Certain |
ii
Table of Contents
Index to Financial Statements
| Relationships and Related Party Transactions—LLC Agreement,” and additionally holders of shares of our Class D common stock may convert such shares at any time for newly issued shares of our Class A common stock, on a one-for-one basis (in which case their shares of our Class D common stock will be cancelled on a one-for-one basis upon any such issuance). |
| • | “LLC Agreement” refers to CWAN Holdings, LLC’s Third Amended and Restated Limited Liability Company Agreement, which will become effective substantially concurrently with or prior to the consummation of this offering. |
| • | “LLC Interests” refers to the common units of CWAN Holdings, LLC, including those that we purchase with a portion of the net proceeds from this offering. |
| • | “NPS” refers to our net promoter score, which can range from a low of negative 100 to a high of positive 100, that we use to gauge customer satisfaction. NPS benchmarks can vary significantly by industry, but a score greater than zero represents a company having more promoters than detractors. Our methodology of calculating NPS reflects responses from customers who purchase investment accounting and reporting, performance measurement, compliance monitoring and risk analytics solutions from us and choose to respond to the survey question. In particular, it reflects responses given in the second quarter of 2021 and reflects a sample size of 134 responses over that period. NPS gives no weight to customers who decline to answer the survey question. |
| • | “Other Continuing Equity Owners” refers to Continuing Equity Owners who are not also Principal Equity Owners. |
| • | “Permira” refers to Permira Advisers LLC, one of our largest owners through holdings by its affiliates. |
| • | “Permitted Transferee” refers to, subject to the provisions of the LLC Agreement, (a) with respect to any Principal Equity Owner, any of such Principal Equity Owner’s affiliates and (b) with respect to any Other Continuing Equity Owner, any such Other Continuing Equity Owner’s affiliates or, in the case of individuals, members of their immediate family. |
| • | “Principal Equity Owners” refers to Welsh Carson, Warburg Pincus, Permira and their respective affiliates and Permitted Transferees. |
| • | “Transactions” refers to the organizational transactions as described in “Organizational Structure— Transactions” and this offering, and the application of the net proceeds therefrom. |
| • | “Warburg Pincus” refers to Warburg Pincus LLC, one of our largest owners through holdings by its affiliates. |
| • | “Welsh Carson” refers to Welsh, Carson, Anderson & Stowe, one of our largest owners through holdings by its affiliates. |
Trademarks
This prospectus contains references to our trademarks, trade names and service marks, which are protected under applicable intellectual property laws and are our property. This prospectus also contains references to trademarks, trade names and service marks of other companies, which are the property of their respective owners. Solely for convenience, trademarks, trade names and service marks referred to in this prospectus may appear without the ®, ™ or SM symbols, but such references are not intended to indicate, in any way, that we will not assert, to the fullest extent under applicable law, our rights or the rights of any applicable licensor to these trademarks, trade names and service marks. We do not intend our use or display of other parties’ trademarks, trade names or service marks to imply, and such use or display should not be construed to imply, a relationship with, or endorsement or sponsorship of us by, these other parties.
Market and Industry Data
Unless otherwise indicated, information contained in this prospectus concerning our industry, competitive position and the markets in which we operate is based on information from independent industry and research
iii
Table of Contents
Index to Financial Statements
organizations, other third-party sources and management estimates. Management estimates are derived from publicly available information released by independent industry analysts, subscription-based publications and other third-party sources, as well as data from our internal research, and are based on assumptions made by us upon reviewing such data, and our experience in, and knowledge of, such industry and markets, which we believe to be reasonable, but we have not independently verified the accuracy of this information. Any industry forecasts are based on data (including third-party data), models and experience of various professionals and are based on various assumptions, all of which are subject to change without notice. In addition, projections, assumptions and estimates of the future performance of the industry in which we operate and our future performance are necessarily subject to uncertainty and risk due to a variety of factors, including those described in “Risk Factors” and “Cautionary Note Regarding Forward-Looking Statements.” These and other factors could cause results to differ materially from those expressed in the estimates made by the independent parties and by us.
Through and including , 2021 (the 25th day after the date of this prospectus), all dealers effecting transactions in these securities, whether or not participating in this offering, may be required to deliver a prospectus. This is in addition to a dealer’s obligation to deliver a prospectus when acting as an underwriter and with respect to an unsold allotment or subscription.
iv
Table of Contents
Index to Financial Statements
Access to data should not be this hard. With the innovative technologies at our disposal today, data should be at our fingertips, available when and how we want it. The power, intellect, and energy of investment professionals should be focused on making confident decisions based on the data — not in collecting, collating, and reconciling it.
And yet, the financial industry has become mired in legacy, expensive, and inflexible infrastructure fueled by the pervasive misconception that the complexity of this industry is unique and unsolvable. Technology has solved many incredibly complex problems at scale, such that a single click can move supply chains across the globe and deliver a table lamp to your door, while intelligently suggesting the right lightbulbs for you. Similarly, technology now helps orchestrate an ever-growing fleet of cars to take you to the office or airport, on demand. Democratizing industry after industry.
But the perceived notion of the financial industry’s uniqueness ensured that industrywide and even companywide initiatives saw limited success. Businesses responded by giving up on those initiatives and focused on solving their narrow, usually country-specific, functional problems related to accounting, risk, regulatory reporting and compliance. That led to tens and even hundreds of purpose-built applications. And then came the data warehouses and armies of people resulting in incredibly slow, inflexible and inconsistent access to data. Many of us have seen the current state persist for so long that we have acquiesced to the present state of play.
A little company in Boise, Idaho decided not to play the incremental game but to completely revolutionize the approach—at Clearwater, we focused on addressing our client’s growing pains with an innovative approach combining next generation technology with deep industry expertise. Instead of client specific on-premises software, we built a single instance, multi-tenant platform in the cloud that all our clients use simultaneously. Instead of having a separate accounting engine for each asset class and each country, we built a platform that is multi-asset class, multi-currency and multi-basis. Instead of having a unique security master for each client, we have a single security master for all clients. Instead of relying on hundreds of clients for data and then manually reconciling it, we connect directly to the data source and let machines validate the data. Instead of delivering reports once a quarter, month, or even week, we deliver powerful and highly configurable reports every day, on demand.
And while we are a technology company first, what makes this Boise-based company truly unique is its approach to clients. Boise is a city where the hotel receptionist was genuinely concerned about my long flight in. A city where a colleague couldn’t get a taxi at the airport and a complete stranger dropped him off at his hotel. A city where our employees do not view our clients as arms-length transactional counterparties, but as deeply valued personal relationships that endure. As we grow globally and domestically, it is this high integrity, client-first culture that we want to protect and grow.
I am in awe of how our employees—80% of whom are millennials—consistently strive to do the right thing and create lasting impact. Not only do they care about clients, solutions and innovation, they care about the climate, the marginalized, the unjustly vilified and the underprivileged. We can all learn from them. Attracting, retaining and continuing to build an engaged workforce will ensure that our clients are successful, which, in turn, will ensure that Clearwater flourishes. This philosophy will continue to be at the core of how we are building our company.
Clearwater has much to do as a company—we want to accelerate growth in international markets, we want greater market awareness of how we help to solve some of our clients’ most painful challenges through innovation and outstanding client service, and we want to build adjacent solutions to replace other legacy technologies that our clients are forced to rely upon. Having clients give us a Net Promoter Score of 60+ and a gross retention rate of approximately 98% are testament to the sense of wonder we hope to drive with our technology.
1
Table of Contents
Index to Financial Statements
And finally, while we have started by disrupting the investment accounting space, over time we believe that we can truly be a force for good. We believe we can leverage our technology to revolutionize the broader world of investing. As the leading independent repository of fully aggregated, reconciled and validated investment data, we are uniquely situated to provide unprecedented transparency into investment performance and returns. We can therefore enable clients to better evaluate investment alternatives and understand performance at a very granular level.
By providing unprecedented transparency about investment performance, we will help catalyze a rush to meritocracy. Combined with providing digital access to an increasingly larger and more diverse set of users around the globe, we can help democratize the world of investing.
I hope you will join us on this journey.
Sincerely,
Sandeep
2
Table of Contents
Index to Financial Statements
This summary highlights selected information contained elsewhere in this prospectus. It does not contain all of the information that may be important to you and your investment decision. Before investing in our Class A common stock, you should carefully read this entire prospectus, including the matters set forth under the sections of this prospectus captioned “Risk Factors” and “Management’s Discussion and Analysis of Financial Condition and Results of Operations” and our consolidated financial statements and our condensed consolidated interim financial statements and related notes included elsewhere in this prospectus.
Our Mission
Clearwater aspires to be the world’s most trusted and comprehensive technology platform for investment accounting and analytics. Starting by radically simplifying investment accounting, we intend to use the power of our platform to eventually revolutionize the world of investing.
Overview
Clearwater brings transparency to the opaque world of investment accounting and analytics with what we believe is the industry’s most trusted and innovative single instance, multi-tenant technology platform. Our cloud-native software allows clients to radically simplify their investment accounting operations, enabling them to focus on higher-value business functions such as asset allocation strategy and investment selection. Our platform provides comprehensive accounting, data and advanced analytics as well as highly-configurable reporting for global investment assets daily or on-demand, instead of weekly or monthly. We give our clients confidence that they are making the most informed decisions about investment performance, regulatory compliance and risk.
We provide investment accounting and reporting, performance measurement, compliance monitoring and risk analytics solutions for asset managers, insurance companies and large corporations. Every day, Clearwater’s powerful platform aggregates and normalizes data on over $5.6 trillion of global invested assets for over 1,000 clients. We bring modern software to an industry that has long been dominated by difficult-to-use, high cost legacy technologies and processes, which often lack data integrity and traceability, and often require significant manual intervention. The strength of our platform is demonstrated by our approximately 80% win rate for new clients over the prior four years in deals that reached the proposal stage.
The markets we serve are highly complex and changing rapidly. All asset owners and asset managers need timely, accurate and comprehensive information about their investment portfolios in order to effectively make capital allocation decisions, manage risk, measure performance, comply with regulations and communicate to various stakeholders internally and externally. This requires organizations to have a comprehensive, global view of their investment portfolio. A partial view of one asset class or one reporting regime is ineffective: delivering analysis on 95% of the portfolio is inadequate because, more often than not, the opaque final 5% of the portfolio creates disproportionate risk. A single client can invest in over 60 different asset classes, hold assets in over 40 different currencies, be governed by more than 10 accounting regimes and hold positions representing thousands of individual tax lots. These clients often have separate accounting, reporting, performance, compliance and risk management products for each asset class and each country. Furthermore, clients frequently require large teams of people to manually review, compare and enter data, correct errors and build custom reports across multiple disparate systems and spreadsheets. Our platform provides our clients with a single consolidated and transparent view of investment data and analytics.
We believe that client demand for Clearwater’s offering continues to grow not only in the United States, but also in financial centers around the world. Prior to 2008, institutions often invested in a narrower range of asset
1
Table of Contents
Index to Financial Statements
classes for which legacy solutions may have been able to provide adequate accounting, performance measurement, compliance monitoring and risk analytics. Over the past decade, however, clients’ needs have grown meaningfully as a result of industry-wide trends such as:
| • | globalization; |
| • | increased regulatory requirements and complexity; |
| • | higher investment allocations in alternative assets (such as private equity, hedge funds, and derivatives and structured securities); |
| • | greater demand for timely risk management and transparency; and |
| • | pressure to increase speed and accuracy while reducing cost. |
Clients no longer find it sufficient to review investment portfolios on a quarterly, monthly or even weekly basis. Their aged patchworks of on-premises software applications with multiple data warehouses and significant manual intervention exposes them to time delays, a lack of data integrity and traceability, and a significant increase in errors, cost and ultimately risk. For many clients, this has become increasingly untenable.
We allow our clients to replace these legacy systems with modern cloud-native software. Our platform helps clients reduce cost, time, errors and risk and allows them to reallocate resources to other value-creating activities. Our software aggregates, reconciles and validates data from more than 2,500 daily data feeds and more than four million securities that have been modeled across multiple currencies, asset classes and countries. This cleansed and validated data runs through our proprietary accounting, performance, compliance and risk solutions to provide clients with powerful analytics and daily or on-demand configurable reporting. We offer multi-asset class, multi-basis, multi-currency accounting and analytics that provide clients with a comprehensive view of their holdings and related performance. This allows our clients to make better, more timely decisions about their investment portfolios.
Clearwater benefits from powerful network effects. With our single instance, multi-tenant architecture, every client, whether new or existing, enriches our global data set by making it more complete and accurate. Our software continually sources, ingests, models, reconciles and validates the terms, conditions and features of every investment security held by all of our clients. This continuous process helps to create a single repository of comprehensive, accurate investment data (often referred to within the industry as a “Golden Copy” of data) that benefits all our clients to the extent they otherwise have rights to the data. Through this continuous process, we are able to identify and adjudicate data discrepancies that otherwise could introduce error and risk into our clients’ investment portfolios. We believe that a meaningful competitive advantage of this network effect is that we are increasingly seen as the best and most accurate source of investment accounting data and analytics in the industry.
Our team members are passionate about client success. Our clients have direct access to a dedicated client service team, a specialized group of experts devoted to ensuring data is as accurate and current as possible and resolving any challenges our clients may encounter utilizing our platform. We take pride in our extremely high client satisfaction rating with a NPS of 60+, in contrast with competitors who typically score much lower. Our gross revenue retention rate has remained approximately 98% over the past ten quarters, which we believe is a testament to the strength of our offering, our ability to deliver operational efficiency for our clients and our focus on providing exceptional client service. We are able to deliver this service to our clients by attracting, retaining and engaging an outstanding team.
We have a 100% recurring revenue model. We charge our clients a fee that is primarily based on the amount of assets they manage on our platform, subject to contracted minimums. A majority of the assets on our platform
2
Table of Contents
Index to Financial Statements
are high-grade fixed income assets, leading to very low levels of volatility and highly predictable revenue streams. When applicable, we charge additional transaction fees for certain complex asset classes (e.g., derivatives and other financial instruments).
We have achieved significant organic growth in recent periods. Our revenues increased from $168 million in the year ended December 31, 2019 to $203 million in the year ended December 31, 2020, representing an increase of 21%. For the six months ended June 30, 2020 and 2021, our revenues were $95 million and $118 million, respectively, representing year-over-year growth of 24%. We had net income of $8 million and a net loss of $44 million in the years ended December 31, 2019 and 2020, respectively, representing net income margin of 5% and net loss margin of (22%), respectively. For the six months ended June 30, 2020 and 2021, we had net income of $14 million and $3 million, representing net income margin of 14% and 3%, respectively. Our adjusted EBITDA was $51 million and $57 million in the years ended December 31, 2019 and 2020, representing adjusted EBITDA margins of 30% and 28%, respectively. For the six months ended June 30, 2020 and 2021, we had adjusted EBITDA of $31 million and $36 million, representing adjusted EBITDA margins of 33% and 30%, respectively. For additional information on adjusted EBITDA, including a reconciliation of adjusted EBITDA to net income, see “Management’s Discussion and Analysis of Financial Condition and Results of Operations—Non-GAAP Financial Measures.”
Our Industry
We operate in the investment accounting and analytics market, serving a range of clients that own or manage investment assets. Before the global financial crisis in 2008, the investment community generally invested in a relatively small number of asset classes that could be tracked with legacy software tools and processes. Over the ensuing years, the industry has faced several challenges that have strained and broken this fragmented and often manual approach to investment accounting operations. These new developments have included increasingly globalized holdings, growing regulatory complexities, the increasing prominence of complex alternative assets, and pressure to increase speed and accuracy while reducing cost. In light of these developments, asset owners and asset managers began to require a comprehensive, global view of their investment portfolios. These organizations initially reacted by buying dedicated products for each asset class, country and reporting regime, building proprietary data warehouses for different use cases, and increasing employee headcount in accounting and compliance functions. These practices resulted in investment accounting operations that were slow, expensive, inflexible and inconsistent, very often resulting in inaccurate data and reporting. We believe that our purpose-built single instance, multi-tenant technology platform provides clients with a vastly superior solution to their growing needs.
Increasingly Global Investment Portfolios
Investors today increasingly hold positions in globally diversified assets as they search for yield and diversification. As a result, they require a global platform that delivers a multi-asset class, multi-basis, multi-currency solution across different accounting, reporting and regulatory regimes.
High Regulatory Complexity
Increased regulatory requirements within the financial services and investment industries continue to proliferate in jurisdictions around the world. The spread of these new regulations has been accompanied by a nearly six-fold increase in global yearly regulatory alerts and SEC enforcement actions, from approximately 10,000 alerts and enforcement actions in 2008 to nearly 60,000 in 2018, according to SEC press releases and annual reports. Asset owners and asset managers need a robust and dynamic solution to help them achieve and maintain compliance in this complex and ever-evolving environment.
3
Table of Contents
Index to Financial Statements
Growing Importance of Alternative Assets
Investors are increasingly allocating capital to alternative assets and complex financial instruments as part of a search for higher investment returns in the low interest rate environment that has persisted over the past decade. Alternative assets are typically traded less broadly and frequently than traditional investment assets and often have less data readily available about them. This complicates reporting and risk management. Asset owners and asset managers need comprehensive, accurate and timely data regardless of the complexity of their investment holdings.
Rising Demand for Risk Management and Transparency
Investors are seeking the highest quality investment data and portfolio visibility in order to effectively make capital allocation decisions, manage risk and measure performance. Additionally, the rise of environmental, social and governance (ESG) initiatives in investing has increased the need for transparency in portfolio holdings as investors seek to measure compliance with ESG objectives. Asset owners and asset managers need a solution that provides on-demand transparency in order to optimize risk management and provide their stakeholders with the holdings-based visibility that they require.
Pressure to Increase Efficiency
The asset management industry is highly competitive and asset management firms must constantly improve operating efficiency to maintain profitability. Additionally, the growing prominence of passive investment strategies has compressed fees for active asset managers and led to a greater focus on managing overall organizational costs to maintain profitability and operational efficiency. In order to effectively compete, asset owners and asset managers need modern automated solutions that reduce the need for greater headcount, and ultimately lower costs.
Digital Transformation from Legacy Technologies
Many of the challenges that plague asset owners and asset managers result from their reliance upon legacy software products and outdated manual processes. Asset owners and asset managers are seeking cloud-based solutions that address the costly, manual and error-prone deficiencies of these legacy technologies.
Our Market Opportunity
We believe that Clearwater has a significant opportunity to disrupt the global investment accounting and analytics market. Our research suggests that this addressable market is an approximately $10 billion global revenue opportunity when combining Clearwater’s current solutions and client end-markets with new end-markets, geographies and products. From 2015 to 2020, the market growth rates within our current client end-markets were between 5-7% for asset management, 3-7% for insurance and 2-4% for corporations. Our clients tend to be larger entities in these end-markets and generally grow at the higher end of these ranges.
4
Table of Contents
Index to Financial Statements
Our Value Proposition
Clearwater’s purpose-built single instance, multi-tenant technology platform helps clients around the world radically simplify their investment accounting and reporting, performance measurement, compliance monitoring and risk analytics. Our solutions provide our clients with a comprehensive view and single source of truth for their investment portfolios and we believe our solutions deliver unmatched levels of speed, flexibility, traceability, repeatability and auditability, all with no manual labor required of our clients. Some key aspects of our value proposition include:
| • | Single Instance, Multi-Tenant Platform: Our single instance, multi-tenant architecture allows for efficient and continuous upgrades, new features, and updates to adjust for rapidly evolving industry requirements and regulations. Each upgrade and update is made available worldwide. |
| • | Comprehensive View of Global Assets: Clients benefit from having a “single pane of glass” through which to holistically and accurately view their entire investment portfolios, with the flexibility to respond to unique reporting challenges across different regulatory regimes. |
| • | Single Source of Truth for All Accounting, Risk, Compliance and Regulatory Reporting: Our platform automates data aggregation, data reconciliation and data validation of each security in our clients’ investment portfolios. This allows us to deliver our clients data from a “Golden Copy” that is accurate, auditable and traceable. |
| • | Radical Simplification of Investment Accounting Operations: By eliminating the need for our clients to aggregate, reconcile and validate security data, we greatly simplify and expedite their operations, allowing them to quickly close their books, comply with regulatory reporting requirements, reduce costs and free their time to focus on managing their portfolios and performing other higher-value functions. |
| • | Accurate, Timely and Up-to-date Reporting: We offer transparent, on-demand and configurable views of our clients’ portfolios, accessible anytime from anywhere. Additionally, we are committed to frequent and seamless incorporation of new features and functionalities on our platform to meet the evolving business needs of our clients and the latest regulatory demands. |
| • | Powerful Network Effects: Every incremental data source from an additional client improves our global data set by making it more complete and accurate for other clients on our platform that are similarly entitled to access such data. |
Our Platform
Our purpose-built single instance, multi-tenant technology platform radically simplifies our clients’ investment accounting and reporting, performance measurement, compliance monitoring and risk analytics infrastructure and workflow. Our software automates data aggregation, data reconciliation and data validation of each security in our clients’ investment portfolios. This creates a fully reconciled “Golden Copy” of investment portfolio data, which can be trusted for accurate reporting and analytics. Our clients benefit from having a comprehensive “single pane of glass” view for daily visibility into all investment data and analytics.
Purpose-Built Technology Stack
In order to deliver these powerful solutions and benefits, we purpose-built our technology stack to efficiently process millions of daily transactions in a highly scalable and efficient manner. Our platform is built on a single code base and eliminates the need for costly and time-consuming patches and upgrades across multiple, disparate software instances. As new features are developed and deployed, they are made available to all clients. Our system leverages the latest machine learning and artificial intelligence tools to ingest both structured and unstructured data that is transformed into a universal security model that enables network benefits for our clients.
5
Table of Contents
Index to Financial Statements
Our clients access the platform through a web-based interface that is highly configurable and provides a set of tools that enable our clients to derive actionable insights on a daily basis. This allows our clients to view their portfolio data from anywhere with an internet connection. Our intuitive, easy-to-use website allows users to view high-level portfolio information and quickly drill into portfolio specifics down to the most granular security level. Our platform also creates automated feeds to other client systems—such as trade order management systems, data warehouses, enterprise resource planning (ERP) systems and others—eliminating the need for clients to manually enter data from Clearwater’s solution into other client systems.
Our Solutions
Our solutions are offered through one unified Clearwater platform and are detailed below:
| • | Investment Accounting and Reporting: Our accounting solution was built with the flexibility to offer operational and regulatory accounting, from the simple to the complex, on the same platform. Our solution is comprehensive in its capabilities: |
| • | Multi-asset class: We have differentiated global asset class coverage including fixed income, equities, bank loans, commercial and residential mortgages, private capital markets, derivatives and various other alternative assets; |
| • | Multi-basis: A single client can access 15 accounting bases, such as GAAP, Statutory, Tax and IFRS. Our platform has the flexibility to add new accounting bases as our clients’ needs require; and |
| • | Multi-currency: We support clients with more than 40 local currencies, 10 functional currencies and numerous reporting currencies. |
Our platform offers flexible configurations and outputs, customized general ledger entries for multiple accounting bases, and regulatory completeness. A suite of standardized reports automates relevant investment-related disclosures such as Fair Value Hierarchy and Level 3 Roll-forward and can be easily configured to provide the detailed accounting information investment accountants and internal stakeholders need. Our daily reconciliation, flexible reporting and general ledger capabilities ensure that period-end close processes are efficient and accurate.
| • | Performance Measurement: Our solution enables investors to compare separate accounts, set custom benchmarks and track the overall performance of their portfolios. Custom performance reports and return calculations are available and designed to meet applicable GIPS calculation standards for investment managers. Users can drill down into the underlying performance return data at the lot level and track performance attribution per portfolio. |
| • | Compliance Monitoring: Our users can set custom rules to monitor compliance according to their investment policies and standard applicable regulations. All investment activity is checked against those rules as often as a client requires and tracked at the security level. Compliance can be tracked across multiple policies, and notifications are automatically sent if there is a violation. Any compliance policy changes or resolutions can also be documented and referenced for internal audits. |
| • | Risk Analytics: We offer insightful risk analytics to ensure investors have access to their portfolios’ exposure every day. Our risk monitoring solution provides access to critical financial and investment portfolio risk information, so users are able to quickly answer pressing risk-related questions, including exposures by issuer, currency, country, duration, credit rating and more. Users can also view benchmark comparisons and analyze other risk factors, including cash flow forecasting, credit events, shock analysis, value at risk (VaR), and historical trends and exposures. |
6
Table of Contents
Index to Financial Statements
Clearwater Prism
Large asset managers and insurance companies often have a constellation of point solutions and proprietary systems that are typically stitched together in a highly manual and inflexible fashion. Despite causing numerous friction points, our clients find that this legacy infrastructure is very difficult to replace at once. Our Clearwater Prism solution solves one of the most acute needs created by this heterogeneous infrastructure: the need for a single comprehensive view across systems with internally consistent data.
Our Clearwater Prism solution offers our clients a single security master and comprehensive reporting portal for all of their investment data. The Clearwater Prism solution feeds this data into our clients’ existing accounting, compliance, performance and risk systems, including those offered by both Clearwater and other third party software vendors. The outputs from each system are consolidated into one data store and reporting is provided through a single integrated portal with the same level of configurability as with Clearwater’s other solutions.
Our Clearwater Prism solution eliminates manual reconciliation of security data without the need to replace existing systems that are core to our clients’ operations and allows our clients to replace their disparate data warehouses with a single Golden Copy of all investment data and associated reports.
Our Clients
Clearwater serves a broad universe of institutional clients across multiple end-markets. Today, our largest client end-markets are asset management, insurance, and corporate treasury. We are also growing our client base in the public sector with numerous state and local governments. While these end-markets and their clients can be quite different from each other, ultimately all of our clients need timely, accurate and comprehensive information on their investments in order to effectively make capital allocation and portfolio decisions, manage risk, measure performance, comply with regulations, and communicate to various stakeholders both internally and externally. Chief Financial Officers, treasurers, controllers and Chief Operating Officers select our platform to deliver a holistic solution consisting of data aggregation, accounting book of record (ABOR), multi-basis reporting, powerful analytical tools and other key features.
As of June 30, 2021, we had over 1,000 clients across 29 countries. In addition, as of June 30, 2021, we had 50 clients that contributed at least $1,000,000 in annualized recurring revenue.
Our Growth Strategy
| • | Deepen Our Relationships With Existing Clients. We believe our industry-leading NPS of 60+ evidences the depth of our integration into our clients’ investment operations workflows, and contributes to our ability to add incremental assets onto our platform from our existing clients. We believe our culture of client success, coupled with our leading solutions, will continue to generate differentiated levels of retention for the foreseeable future and allow us to grow as our clients grow. |
| • | Continue Expanding Within Our Core Client End-Markets. Our current core end-markets remain significantly unpenetrated today. We will continue to displace legacy products and add clients in these end-markets through our direct sales and marketing efforts and by helping our strategic asset manager clients to win new clients, which in turn brings more assets onto our platform. |
| • | Accelerate International Expansion. With new offices, leadership and sales teams now established in Europe and APAC, we are poised to reach more new clients globally moving forward. We have invested in these geographic markets, recognizing that the challenges international clients experience are very similar to those experienced by our North American clients. |
7
Table of Contents
Index to Financial Statements
| • | Continue Expanding Within Adjacent Client End-Markets. We believe there is a significant opportunity for growth by continuing to target adjacent end-markets. There is a large opportunity to tailor the regulatory reporting and performance management capabilities of our existing solutions to better serve the needs of a range of additional asset owners, such as state and local governments, pension funds, sovereign wealth funds and a variety of alternative asset managers. We believe our existing solutions are suitable to serve the needs of the clients in these end-markets. While we have onboarded our first clients in these end-markets and have built internal teams to service them, we do not currently derive a material amount of revenue from these end-markets. |
| • | Innovate and Develop Adjacent Solutions. We will continue to invest heavily in expanding our functional breadth and depth, improving user experience, increasing automation, and strengthening system performance. Historically, we have sold our solutions as one unified offering. As clients have continued to find innovative uses for our platform in other business functions, we expect to sell and price those newer modules separately. |
| • | Pursue Strategic Partnerships and Acquisitions. We may selectively pursue partnerships and acquisitions that complement our solutions, provide us access to new markets or improve our competitive positioning within existing and new markets, or that otherwise accelerate one or more of our growth objectives. For example, we will consider partnerships and acquisitions focused on improving our technology for complex assets data and our performance and risk management offerings, as well as expansion in Europe, the Middle East and Asia. |
Recent Developments
As of June 30, 2021, we had $432.7 million outstanding under our existing credit agreement with a subsidiary of CWAN Holdings, LLC (as amended from time to time, the “Existing Credit Agreement”). We have entered into negotiations to enter into a new credit agreement arranged by JPMorgan Chase Bank, N.A. (the “New Credit Agreement”). It is anticipated that the New Credit Agreement will provide for a $55 million term loan facility (the “New Term Loan”) and a $125 million revolving facility (the “New Revolving Facility” and, together with the New Term Loan, the “New Facilities”). We expect to use the proceeds of the New Term Loan (and if necessary, cash on hand), to repay a portion of the indebtedness outstanding under our Existing Credit Agreement and to pay certain transaction expenses. The proceeds of the New Revolving Facility are expected to be used for working capital and other general corporate purposes. For a description of the New Credit Agreement, see “Description of Certain Indebtedness.”
Summary Risk Factors
Our business and our ability to execute our strategy are subject to many risks. Before making a decision to invest in our Class A common stock, you should carefully consider all of the risks and uncertainties described in the section of this prospectus captioned “Risk Factors” immediately following this Prospectus Summary and all of the other information in this prospectus. These risks include, but are not limited to, the following:
Risks Related to Our Business and Our Industry
| • | We operate in a highly competitive industry, with many companies competing for business from insurance companies, asset managers, corporations and government entities on the basis of a number of factors, including the quality and breadth of solutions and services provided, ability to innovate, reputation and the prices of services, and this competition could hurt our financial performance and cash flows. |
| • | We have experienced rapid revenue growth over the past several years, which may be difficult to sustain, and we depend on attracting and retaining top talent to continue growing and operating our business, and if we are unable to hire, integrate, develop, motivate and retain our personnel, we may |
8
Table of Contents
Index to Financial Statements
| not be able to maintain or manage our growth, which could have a material adverse effect on our business, financial condition, results of operations and cash flows. |
| • | We are dependent on fees based on the value of the assets on our platform for the vast majority of our revenues, and to the extent market volatility, a downturn in economic conditions or other factors cause negative trends or fluctuations in the value of the assets on our platform, our fee-based revenue and earnings may decline. |
| • | Our clients may seek to negotiate a lower fee percentage or may cease using our services, which could limit the growth of, or decrease, our revenues. |
| • | The COVID-19 pandemic has caused, and is causing, significant harm to the global economy, which in turn could have a material adverse effect on our business, financial condition or results of operations. |
| • | If our investment accounting and reporting solutions, regulatory reporting solutions or risk management or performance analytics solutions fail to perform properly due to undetected errors or similar problems, our business, financial condition, reputation or results of operations could be materially adversely affected. |
| • | We could face liability or incur costs to remediate operational errors or to address possible client dissatisfaction. |
| • | We are substantially dependent on our intellectual property rights, and a failure to protect these rights could adversely affect our business, financial condition or results of operations. |
| • | Our business relies heavily on computer equipment, cloud-based services, electronic delivery systems, networks and telecommunications systems and infrastructure, the Internet and the information technology systems of third parties. Any failures or disruptions in any of the foregoing could result in reduced revenues, increased costs and the loss of clients and could harm our business, financial condition, reputation and results of operations. |
| • | If sources from which we obtain information limit our access to such information or institute or increase fees for accessing such information, our business could be materially and adversely harmed. |
| • | We could face liability for certain information we provide, including information based on data we obtain from other parties. |
| • | If we or our third-party service providers suffer a cybersecurity event, our reputation may be harmed, we may lose clients and we may incur significant liabilities, any of which would harm our business and results of operations. |
| • | Changes to the laws or regulations applicable to us or to our asset manager or insurance industry clients could adversely affect our business, financial condition or results of operations. |
| • | We invest significantly in growth and research and development, and to the extent our research and development investments do not translate into new solutions and services or material enhancements to our current solutions and services, or if we do not use those investments efficiently, our business and results of operations would be harmed. |
| • | As a global organization, our business is susceptible to risks associated with our international operations. |
Risks Related to This Offering and Our Class A Common Stock
| • | We will be a holding company and our principal asset after completion of the Transactions and this offering will be our interest in CWAN Holdings, LLC and, accordingly, we will depend on distributions from CWAN Holdings, LLC to pay our taxes and expenses, including payments under the |
9
Table of Contents
Index to Financial Statements
| Tax Receivable Agreement. CWAN Holdings, LLC’s ability to make such distributions may be subject to various limitations and restrictions. |
| • | Conflicts of interest could arise between our shareholders and the Principal Equity Owners, which may impede business decisions that could benefit our shareholders. |
| • | The Tax Receivable Agreement requires us to make cash payments to the Continuing Equity Owners and the Blocker Shareholders in respect of certain tax benefits to which we may become entitled, and we expect that the payments we will be required to make will be substantial. |
| • | The Principal Equity Owners will continue to have significant influence over us after this offering, including control over decisions that require the approval of stockholders, which could limit your ability to influence the outcome of matters submitted to stockholders for a vote. |
| • | Following the offering, we will be classified as a “controlled company,” and as a result, we qualify for, and intend to rely on, exemptions from certain corporate governance requirements. You will not have the same protections afforded to stockholders of companies that are subject to such requirements. |
Summary of the Transactions
Clearwater Analytics Holdings, Inc., a Delaware corporation, was formed on May 18, 2021 and is the issuer of the Class A common stock offered by this prospectus. Prior to this offering, all of our business operations have been conducted through Carbon Analytics Holdings, LLC and its direct and indirect subsidiaries. In connection with this offering, Carbon Analytics Holdings, LLC changed its name to CWAN Holdings, LLC. Prior to the Transactions, we expect there will initially be one holder of common stock of Clearwater Analytics Holdings, Inc. The following organizational transactions will be consummated in connection with this offering:
| • | we will amend and restate the existing limited liability company agreement of CWAN Holdings, LLC, which will become effective substantially concurrently with or prior to the consummation of this offering, to, among other things, (1) recapitalize all existing ownership interests in CWAN Holdings, LLC into one class of LLC Interests, (2) appoint Clearwater Analytics Holdings, Inc. as the sole managing member of CWAN Holdings, LLC, (3) for strategic business and tax reasons, including to provide liquidity for certain holders of LLC Interests, provide that the Other Continuing Equity Owners are entitled to exchange LLC Interests, together with an equal number of shares of Class B common stock, for shares of Class A common stock on a one-for-one basis or, at our election, for an amount in cash representing the fair market value of shares of Class A common stock net of any underwriters’ discounts, commissions and brokers’ fees that would be payable in connection with a registered offering of such shares as calculated in accordance with the LLC Agreement and (4) for strategic business and tax reasons, including to provide liquidity for certain holders of LLC Interests, provide that Principal Equity Owners are entitled to exchange LLC Interests, together with an equal number of shares of Class C common stock, for shares of Class D common stock on a one-for-one basis or, at our election, for an amount in cash representing the fair market value of shares of Class A common stock net of any underwriters’ discounts, commissions and brokers’ fees that would be payable in connection with a registered offering of such shares as calculated in accordance with the LLC Agreement; |
| • | we will amend and restate Clearwater Analytics Holdings, Inc.’s certificate of incorporation to, among other things, provide (1) for Class A common stock, with each share of our Class A common stock entitling its holder to one vote per share on all matters presented to our stockholders generally, (2) for Class B common stock, with each share of our Class B common stock entitling its holder to one vote per share on all matters presented to our stockholders generally but without economic rights, and that shares of our Class B common stock may only be held by the Other Continuing Equity Owners and their respective Permitted Transferees as described in “Description of Capital Stock—Common Stock—Class B Common Stock,” (3) for Class C common stock, with each share of our Class C |
10
Table of Contents
Index to Financial Statements
| common stock entitling its holder to ten votes per share on all matters presented to our stockholders generally but without economic rights, and that shares of our Class C common stock may only be held by the Principal Equity Owners and their respective permitted transferees as described in “Description of Capital Stock—Common Stock—Class C Common Stock” and (4) for Class D common stock, with each share of our Class D common stock entitling its holder to ten votes per share on all matters presented to our stockholders generally, and that shares of our Class D common stock may only be held by the Principal Equity Owners and their respective permitted transferees as described in “Description of Capital Stock—Common Stock—Class D Common Stock”; The holders of Class B common stock and Class C common stock will have no economic interests in Clearwater Analytics Holdings, Inc. (where “economic interests” means the right to receive any dividends or distributions, whether cash or stock, in connection with common stock). Each share of our Class C common stock and Class D common stock will automatically convert into a share of our Class B common stock and our Class A common stock, respectively, upon the earlier of (i) the date that affiliates of Welsh Carson own less than 5% of our common stock and (ii) the date that is seven years following the closing of our initial public offering. The attributes of our classes of common stock are summarized in the following table: |
| Class of Common Stock |
Votes per Share | Economic Rights | ||||||
| Class A common stock |
1 | Yes | ||||||
| Class B common stock |
1 | No | ||||||
| Class C common stock |
10 | No | ||||||
| Class D common stock |
10 | Yes | ||||||
| • | we will acquire, by means of one or more mergers, the Blocker Entities (the “Blocker Mergers”), with Clearwater Analytics Holdings, Inc. remaining as the surviving corporation, and will (1) issue to the Blocker Shareholders 12,866,089 shares of our Class A common stock, in the case of Other Continuing Equity Owners, and 130,083,755 shares of our Class D common stock, in the case of the Principal Equity Owners, in exchange for all of the Blocker Shareholders’ equity interests in the Blocker Entities, which indirectly includes their LLC Interests, and (2) enter into a tax receivable agreement (the “Tax Receivable Agreement”), each as consideration for the Blocker Mergers; |
| • | we will issue 11,151,110 shares of our Class B common stock to the Other Continuing Equity Owners, which is equal to the number of LLC Interests held by such Other Continuing Equity Owners; |
| • | we will issue 47,377,587 shares of our Class C common stock to the Principal Equity Owners, which is equal to the number of LLC Interests held by such Principal Equity Owners; |
| • | we will issue 30,000,000 shares of our Class A common stock to the purchasers in this offering (or 34,500,000 shares if the underwriters exercise in full their option to purchase additional shares of Class A common stock) in exchange for net proceeds of approximately $412.4 million (or approximately $475.7 million if the underwriters exercise in full their option to purchase additional shares of Class A common stock) based upon an assumed initial public offering price of $15.00 per share (which is the midpoint of the estimated price range set forth on the cover page of this prospectus), less the underwriting discounts and commissions and estimated offering expenses payable by us; |
| • | we will use a portion of the net proceeds from this offering to purchase 30,000,000 LLC Interests (or 34,500,000 LLC Interests if the underwriters exercise in full their option to purchase additional shares of Class A common stock) from CWAN Holdings, LLC at a price per unit equal to the initial public offering price per share of Class A common stock in this offering less the underwriting discounts and commissions; and |
| • | Clearwater Analytics Holdings, Inc. will enter into (1) a second amended and restated registration rights agreement (the “Registration Rights Agreement”) with certain of the Continuing Equity Owners, (2) the Tax Receivable Agreement with certain of the Continuing Equity Owners and the Blocker |
11
Table of Contents
Index to Financial Statements
| Shareholders, (3) tax receivable bonus agreements with certain of our executive officers (the “TRA Bonus Agreements”) and (4) a stockholders’ agreement (the “Stockholders’ Agreement”) with the Principal Equity Owners. For a description of the terms of the Registration Rights Agreement, the Tax Receivable Agreement and the Stockholders’ Agreement, see “Certain Relationships and Related Party Transactions” and a description of the terms of the TRA Bonus Agreements, see “Executive Compensation—TRA Bonus Agreements.” |
Immediately following the consummation of the Transactions (including this offering):
| • | Clearwater Analytics Holdings, Inc. will be a holding company and its principal asset will consist of LLC Interests it acquires as a result of (i) the purchase of such LLC Interests with the net proceeds of this offering and (ii) the Blocker Mergers; |
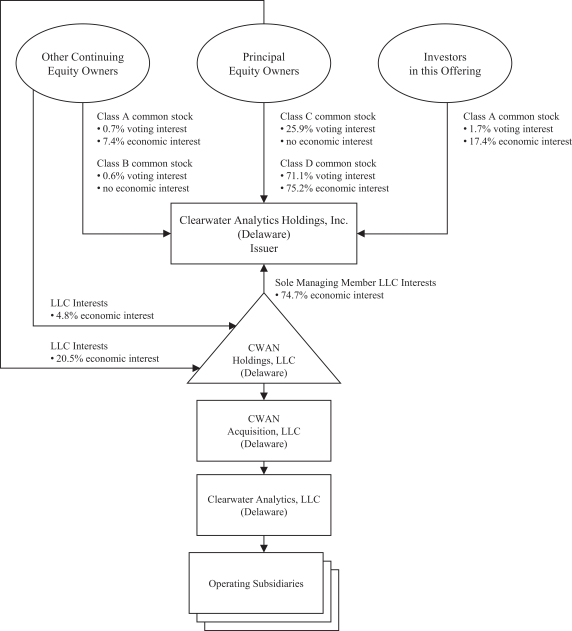
| • | Clearwater Analytics Holdings, Inc. will directly own 172,949,844 LLC Interests of CWAN Holdings, LLC, representing approximately 74.7% of the economic interest in CWAN Holdings, LLC (or 177,449,844 LLC Interests, representing approximately 75.2% of the economic interest in CWAN Holdings, LLC if the underwriters exercise in full their option to purchase additional shares of Class A common stock); |
| • | Clearwater Analytics Holdings, Inc. will be the sole managing member of CWAN Holdings, LLC and will control the business and affairs of CWAN Holdings, LLC and its direct and indirect subsidiaries; |
| • | the Other Continuing Equity Owners will own (1) 11,151,110 LLC Interests of CWAN Holdings, LLC, representing approximately 4.8% of the economic interest in CWAN Holdings, LLC (or approximately 4.7% of the economic interest in CWAN Holdings, LLC if the underwriters exercise in full their option to purchase additional shares of Class A common stock), (2) 12,866,089 shares of Class A common stock of Clearwater Analytics Holdings, Inc., representing approximately 0.7% of the combined voting power of all of Clearwater Analytics Holdings, Inc.’s common stock and approximately 7.4% of the economic interest in Clearwater Analytics Holdings, Inc. (or approximately 0.7% of the combined voting power and approximately 7.3% of the economic interest if the underwriters exercise in full their option to purchase additional shares of Class A common stock), and (3) 11,151,110 shares of Class B common stock of Clearwater Analytics Holdings, Inc., representing in aggregate approximately 0.6% of the combined voting power of all of Clearwater Analytics Holdings, Inc.’s common stock (or approximately 0.6% of the combined voting power of all of Clearwater Analytics Holdings, Inc.’s common stock if the underwriters exercise in full their option to purchase additional shares of Class A common stock) and no economic interest in us; |
| • | the Principal Equity Owners will own (1) 47,377,587 LLC Interests of CWAN Holdings, LLC, representing approximately 20.5% of the economic interest in CWAN Holdings, LLC (or approximately 20.1% of the economic interest in CWAN Holdings, LLC if the underwriters exercise in full their option to purchase additional shares of Class A common stock), (2) 47,377,587 shares of Class C common stock of Clearwater Analytics Holdings, Inc., representing in aggregate approximately 25.9% of the combined voting power of all of Clearwater Analytics Holdings, Inc.’s common stock (or approximately 25.8% of the combined voting power of all of Clearwater Analytics Holdings, Inc.’s common stock if the underwriters exercise in full their option to purchase additional shares of Class A common stock) and no economic interest in us, and (3) 130,083,755 shares of Class D common stock, representing approximately 71.1% of the combined voting power of all of Clearwater Analytics Holdings, Inc.’s common stock and approximately 75.2% of the economic interest in Clearwater Analytics Holdings, Inc. (or approximately 71.0% of the combined voting power and approximately 73.3% of the economic interest if the underwriters exercise in full their option to purchase additional shares of Class A common stock); and |
| • | the purchasers in this offering will own (1) 30,000,000 shares of Class A common stock of Clearwater Analytics Holdings, Inc. (or 34,500,000 shares of Class A common stock of Clearwater Analytics Holdings, Inc. if the underwriters exercise in full their option to purchase additional shares of Class A |
12
Table of Contents
Index to Financial Statements
| common stock), representing approximately 1.7% of the combined voting power of all of Clearwater Analytics Holdings, Inc.’s common stock and approximately 17.4% of the economic interest in Clearwater Analytics Holdings, Inc. (or approximately 1.9% of the combined voting power and approximately 19.4% of the economic interest if the underwriters exercise in full their option to purchase additional shares of Class A common stock), and (2) through Clearwater Analytics Holdings, Inc.’s ownership of LLC Interests, indirectly will hold approximately 13.0% of the economic interest in CWAN Holdings, LLC (or approximately 14.6% of the economic interest in CWAN Holdings, LLC if the underwriters exercise in full their option to purchase additional shares of Class A common stock). |
Immediately following this offering, we will be a holding company, and our principal asset will consist of LLC Interests of CWAN Holdings, LLC. As the sole managing member of CWAN Holdings, LLC, we will operate and control all of the business and affairs of CWAN Holdings, LLC. Accordingly, although we will have a minority economic interest in CWAN Holdings, LLC, we will have the sole voting interest in, and control the management of, CWAN Holdings, LLC. Our corporate structure following this offering, as described above, is commonly referred to as an “Up-C” structure, which is often used by partnerships and limited liability companies when they undertake an initial public offering of their business. The Up-C structure will allow the Continuing Equity Owners to retain their equity ownership in CWAN Holdings, LLC and to continue to realize tax benefits associated with owning interests in an entity that is treated as a partnership, or “passthrough” entity, for U.S. federal income tax purposes following the offering. For more information regarding our structure after the completion of the Transactions, including this offering, see “Organizational Structure” and “Risk Factors—Risks Related to Our Organizational Structure.”
13
Table of Contents
Index to Financial Statements
Ownership Structure
The diagram below depicts our organizational structure after giving effect to the Transactions, including this offering, assuming no exercise by the underwriters of their option to purchase additional shares of Class A common stock.
14
Table of Contents
Index to Financial Statements
Our Principal Equity Owners
Welsh Carson
For over 40 years, Welsh Carson has partnered with outstanding management teams to build leading healthcare and technology companies. Welsh Carson has raised funds with aggregate commitments of approximately $27.0 billion. Welsh Carson targets business-to-business sectors with strong growth and minimal cyclicality and focuses on companies with recurring revenue, sustainable unit economics and quantifiable customer value propositions. Welsh Carson has invested in over 100 technology investments, representing more than $12.0 billion. Selected current and past investments include Avetta, Global Collect, Green Street, Paycom, Quickbase, SRS Indentifix and TransFirst.
Warburg Pincus
Warburg Pincus is a global private equity firm focused on growth investing. The firm’s active portfolio of more than 205 companies is highly diversified by stage, sector and geography, and the firm is an experienced partner to management teams seeking to build durable companies with sustainable value. Founded in 1966, Warburg Pincus has raised 19 private equity funds with capital commitments totaling $99 billion and has invested more than $94 billion in over 940 companies in more than 40 countries. The firm is headquartered in New York with offices in Beijing, Berlin, Hong Kong, Houston, London, Mumbai, San Francisco, São Paulo, Shanghai and Singapore.
Permira
Permira is a leading global investment firm founded in 1985 that invests in successful businesses with growth ambitions. The firm advises the Permira funds with total committed capital of approximately $50 billion (€44 billion) and makes long-term majority and minority investments. The Permira funds have made over 250 private equity investments in four key sectors: Technology, Consumer, Services and Healthcare. The Permira funds have an extensive track record in tech investing, having invested $13.4 billion in 52 companies across enterprise cloud, SaaS, fintech and online marketplaces. The Permira funds have previously backed and helped scale some of the largest and fastest-growing internet and technology businesses globally, including Informatica, Genesys, G2, Klarna, LegalZoom, Allegro, TeamViewer and Zwift. Permira employs over 350 people in 15 offices across Europe, North America, and Asia.
Stockholders’ Agreement
Effective upon the completion of the offering, we will enter into the Stockholders’ Agreement with the Principal Equity Owners (and their respective permitted transferees thereunder party thereto from time to time). Pursuant to the Stockholders’ Agreement, Welsh Carson, Permira and Warburg Pincus will have the right to designate certain of our directors from time to time. The Principal Equity Owners will each additionally agree to take all necessary action, including voting their respective shares of common stock, to cause the election of the directors nominated pursuant to the Stockholders’ Agreement, and will each be entitled to propose the replacement of any of its board nominees whose board service ceases for any reason for so long as such Principal Equity Owner continues to have the right to nominate an individual to such director position. See “Risk Factors—Risks Related to This Offering and Our Class A Common Stock—Provisions in our certificate of incorporation and bylaws, to be adopted upon the consummation of this offering, may have the effect of delaying or preventing a change of control or changes in our management” and “Certain Relationships and Related Party Transactions—Stockholders’ Agreement.”
15
Table of Contents
Index to Financial Statements
Corporate Information
Clearwater Analytics Holdings, Inc., the issuer of the Class A common stock in this offering, was incorporated as a Delaware corporation on May 18, 2021. Our principal executive offices are located at 777 W. Main Street, Suite 900, Boise, ID 83702 and our telephone number is (208) 918-2400. Our principal website address is https://clearwater-analytics.com. Information contained in, or accessible through, our website is not a part of, and is not incorporated into, this prospectus.
Implications of Being an Emerging Growth Company
We qualify as an “emerging growth company” as defined in the Jumpstart Our Business Startups Act of 2012 (the “JOBS Act”). An emerging growth company may take advantage of relief from certain reporting requirements and other burdens that are otherwise applicable generally to public companies. These provisions include:
| • | presenting only two years of audited financial statements; |
| • | an exemption from compliance with the auditor attestation requirements of Section 404 of the Sarbanes-Oxley Act of 2002 (the “Sarbanes-Oxley Act”); |
| • | reduced disclosure about our executive compensation arrangements in our periodic reports, proxy statements and registration statements; and |
| • | exemptions from the requirements of holding nonbinding advisory votes on executive compensation or golden parachute arrangements. |
In addition, under the JOBS Act, emerging growth companies can delay adopting new or revised accounting standards until such time as those standards apply to private companies. We have elected to avail ourselves of this exemption from new or revised accounting standards, and therefore, we will not be subject to the same new or revised accounting standards at the same time as other public companies that are not emerging growth companies or those that have opted out of using such extended transition period, which may make comparison of our financial statements with such other public companies more difficult. We may take advantage of these reporting exemptions until we no longer qualify as an emerging growth company or, with respect to adoption of certain new or revised accounting standards, until we irrevocably elect to opt out of using the extended transition period.
We will remain an emerging growth company until the earliest to occur of (i) the last day of the fiscal year in which we have total annual gross revenues of $1.07 billion or more; (ii) the last day of our fiscal year following the fifth anniversary of the date of the completion of this offering; (iii) the date on which we have, during the previous three-year period, issued more than $1 billion in non-convertible debt; and (iv) the date on which we are deemed to be a “large accelerated filer” under the rules of the SEC.
16
Table of Contents
Index to Financial Statements
| Issuer |
Clearwater Analytics Holdings, Inc. |
| Class A Common Stock Offered by Us |
30,000,000 shares (or 34,500,000 shares if the underwriters exercise in full their option to purchase additional shares). |
| Underwriters’ Option to Purchase Additional Shares of Class A Common Stock from Us |
4,500,000 shares. |
| Shares of Class A Common Stock to Be Outstanding Immediately After This Offering |
42,866,089 shares, representing approximately 2.4% of the combined voting power of all of Clearwater Analytics Holdings, Inc.’s common stock, 24.8% of the economic interest in Clearwater Analytics Holdings, Inc. and 18.5% of the indirect economic interest in CWAN Holdings, LLC. |
| Shares of Class B Common Stock to Be Outstanding Immediately After This Offering |
11,151,110 shares of Class B common stock, representing approximately 0.6% of the combined voting power of all of Clearwater Analytics Holdings, Inc.’s common stock and no economic interest in Clearwater Analytics Holdings, Inc. |
| Shares of Class C Common Stock to Be Outstanding Immediately After This Offering |
47,377,587 shares of Class C common stock, representing approximately 25.9% of the combined voting power of all of Clearwater Analytics Holdings, Inc.’s common stock and no economic interest in Clearwater Analytics Holdings, Inc. |
| Shares of Class D Common Stock to Be Outstanding Immediately After This Offering |
130,083,755 shares of Class D, representing approximately 71.1% of the combined voting power of all of Clearwater Analytics Holdings, Inc.’s common stock, 75.2% of the economic interest in Clearwater Analytics Holdings, Inc. and 56.2% of the indirect economic interest in CWAN Holdings, LLC. |
| LLC Interests to Be Held Directly by Us Immediately After This Offering |
172,949,844 LLC Interests, representing approximately 74.7% of the economic interest in CWAN Holdings, LLC (or 177,449,844 LLC Interests, representing approximately 75.2% of the economic interest in CWAN Holdings, LLC if the underwriters exercise in full their option to purchase additional shares of Class A common stock). |
17
Table of Contents
Index to Financial Statements
| LLC Interests to Be Held Directly by the Other Continuing Equity Owners Immediately After This Offering |
11,151,110 LLC Interests, representing approximately 4.8% of the economic interest in CWAN Holdings, LLC (or approximately 4.7% of the economic interest in CWAN Holdings, LLC if the underwriters exercise in full their option to purchase additional shares of Class A common stock). |
| LLC Interests to Be Held Directly by the Principal Equity Owners Immediately After This Offering |
47,377,587 LLC Interests, representing approximately 20.5% of the economic interest in CWAN Holdings, LLC (or approximately 20.1% of the economic interest in CWAN Holdings, LLC if the underwriters exercise in full their option to purchase additional shares of Class A common stock). |
| Ratio of Shares of Class A Common Stock and Class D Common Stock to LLC Interests |
Our amended and restated certificate of incorporation and the LLC Agreement will require that we and CWAN Holdings, LLC at all times maintain a one-to-one ratio between the aggregate number of shares of Class A common stock and shares of Class D common stock issued by us and the number of LLC Interests owned by us, except as otherwise determined by us. |
| Ratio of Shares of Class B Common Stock and Class C Common Stock to LLC Interests |
Our amended and restated certificate of incorporation and the LLC Agreement will require that we and CWAN Holdings, LLC at all times maintain a one-to-one ratio between the number of shares of Class B common stock and Class C common stock owned by the Other Continuing Equity Owners and the Principal Equity Owners, respectively, and their respective permitted transferees, and the number of LLC Interests owned by such Continuing Equity Owners and Principal Equity Owners, respectively, and their respective permitted transferees, except as otherwise determined by us. Immediately after the Transactions, the Continuing Equity Owners and Principal Equity Owners, respectively, will collectively own 100% of the outstanding shares of our Class B common stock and our Class C common stock. |
| Permitted Holders of Shares of Class B Common Stock, Class C Common Stock and Class D Common Stock |
Only the Other Continuing Equity Owners and the Permitted Transferees of Class B common stock as described in this prospectus will be permitted to hold shares of our Class B common stock. Only the Principal Equity Owners and the permitted transferees of Class C common stock and Class D common stock as described in this prospectus will be permitted to hold shares of our Class C common stock and shares of our Class D common stock. Shares of Class B common stock are exchangeable for shares of Class A common stock only together with an equal number of LLC Interests. Shares of Class C |
18
Table of Contents
Index to Financial Statements
| common stock are exchangeable for shares of Class D common stock only together with an equal number of LLC Interests. See “Certain Relationships and Related Party Transactions—LLC Agreement.” |
| Voting Rights |
Holders of shares of our Class A common stock, Class B common stock, Class C common stock and Class D common stock will vote together as a single class on all matters presented to stockholders for their vote or approval, except as otherwise required by law or our amended and restated certificate of incorporation. Each share of our Class A common stock entitles its holders to one vote per share, each share of our Class B common stock entitles its holders to one vote per share, each share of our Class C common stock entitles its holders to ten votes per share and each share of our Class D common stock entitles its holders to ten votes per share on all matters presented to our stockholders generally. Each share of our Class C common stock and Class D common stock will automatically convert into a share of our Class B common stock and our Class A common stock, respectively, upon the earlier of (i) the date that affiliates of Welsh Carson own less than 5% of our common stock and (ii) the date that is seven years following the closing of our initial public offering. See “Description of Capital Stock.” |
| Exchange and Redemption Rights of Holders of LLC Interests |
The Continuing Equity Owners may, subject to certain exceptions, periodically at their option require CWAN Holdings, LLC to redeem all or a portion of their LLC Interests in exchange for, at our election (determined solely by a majority of our directors who are disinterested), newly issued shares of our Class A common stock (in the case of Other Continuing Equity Owners) and shares of our Class D common stock (in the case of the Principal Equity Owners) on a one-for-one basis or cash, in each case, in accordance with the terms of the LLC Agreement; provided that, at our election (determined solely by a majority of our directors who are disinterested), we may effect a direct exchange by Clearwater Analytics Holdings, Inc. of such Class A common stock, Class D common stock or such cash, as applicable, for such LLC Interests. The Continuing Equity Owners may, subject to certain exceptions, exercise such redemption right for as long as their LLC Interests remain outstanding. See “Certain Relationships and Related Party Transactions—LLC Agreement.” Simultaneously with the payment of cash or shares of Class A common stock or shares of Class D common stock, as applicable, in connection with a redemption or exchange of LLC Interests pursuant to the terms of the LLC Agreement, a number of shares of our Class B common stock or Class C common stock, as the case may be, registered in the name of the redeeming or exchanging Continuing Equity Owner will automatically be transferred to the Company and will be cancelled for no consideration on a one-for-one basis with the number of LLC Interests so redeemed or exchanged. |
19
Table of Contents
Index to Financial Statements
| Tax Receivable Agreement |
We intend to enter into a Tax Receivable Agreement with certain of the Continuing Equity Owners and the Blocker Shareholders and TRA Bonus Agreements with certain of our executive officers substantially concurrently with or prior to the consummation of this offering. The Tax Receivable Agreement provides for the payment by us to certain of the Continuing Equity Owners and the Blocker Shareholders, collectively, of 85% (less payments made under TRA Bonus Agreements) of the amount of tax benefits, if any, that we actually realize, or in some circumstances are deemed to realize, as a result of (i) Clearwater Analytics Holdings, Inc.’s allocable share of the Blocker Entities’ share of existing tax basis acquired in connection with the Transactions and certain tax attributes of the Blocker Entities, like net operating losses, to which Clearwater Analytics Holdings, Inc. will be the successor as a result of the Transactions, (ii) certain increases in the tax basis of assets of CWAN Holdings, LLC and its subsidiaries resulting from purchases or exchanges of LLC Interests, (iii) payments made under TRA Bonus Agreements and (iv) certain other tax benefits related to our entering into the Tax Receivable Agreement, including tax benefits attributable to certain payments that we make under the Tax Receivable Agreement (collectively, the “Tax Attributes”). The payment obligations under the Tax Receivable Agreement are not conditioned upon any LLC Interest holder maintaining a continued ownership interest in us or CWAN Holdings, LLC and the rights of the Continuing Equity Owners and the Blocker Shareholders under the Tax Receivable Agreement are assignable. We expect to benefit from the remaining 15% (taking into account amounts paid pursuant to the TRA Bonus Agreements) of the tax benefits, if any, that we may actually realize. The actual Tax Attributes, as well as any amounts paid to the Continuing Equity Owners and the Blocker Shareholders under the Tax Receivable Agreement, will vary depending on a number of factors, including the timing of any future exchanges, the price of shares of our Class A common stock at the time of any future exchanges, the extent to which such exchanges are taxable, the amount and timing of any payments under TRA Bonus Agreements, the amount and timing of our income and applicable tax rates. The payment obligations under the Tax Receivable Agreement are obligations of Clearwater Analytics Holdings, Inc. and not of CWAN Holdings, LLC. See “Certain Relationships and Related Party Transactions—Tax Receivable Agreement” and “Executive Compensation—TRA Bonus Agreements.” |
| Use of Proceeds |
We expect to receive net proceeds in this offering of approximately $412.4 million based on an assumed initial public offering price of $15.00 per share, which is the midpoint of the estimated price range set forth on the cover page of this prospectus, after deducting estimated underwriting discounts and commissions and offering expenses payable by us. |
20
Table of Contents
Index to Financial Statements
| Clearwater Analytics Holdings, Inc. intends to use the net proceeds from this offering, together with the proceeds from the New Term Loan, to (i) purchase 30,000,000 LLC Interests (or 34,500,000 LLC Interests if the underwriters exercise in full their option to purchase additional shares of Class A common stock) from CWAN Holdings, LLC at a price per unit equal to the initial public offering price per share of Class A common stock in this offering less the underwriting discounts and commissions and (ii) repay approximately $432.7 million of outstanding borrowings under the Existing Credit Agreement and pay any associated prepayment penalties and accrued and unpaid interest to the date of repayment. We intend to use remaining proceeds, if any, for general corporate purposes to support the growth of the business. See “Use of Proceeds” for additional information. |
| Controlled Company |
Upon completion of this offering, the Principal Equity Owners will continue to beneficially own more than 50% of the voting power of our outstanding common stock. As a result, we intend to avail ourselves of the “controlled company” exemptions under the rules of NYSE, including exemptions from certain of the corporate governance listing requirements. See “Management—Controlled Company Exemption” and “Certain Relationships and Related Party Transactions.” |
| Dividend Policy |
We currently do not anticipate paying any cash dividends on our Class A common stock or Class D common stock after this offering or for the foreseeable future. Instead, we anticipate that all of our available funds and earnings in the foreseeable future will be used to repay indebtedness, for working capital, to support our operations and to finance the growth and development of our business. Any future determination relating to dividend policy will be made at the discretion of our board of directors and will depend on a number of factors, including restrictions in our and our subsidiaries’ current and future debt instruments, future earnings, capital requirements, financial condition and prospects, and applicable Delaware law, which provides that dividends are only payable out of surplus or current net profits. Holders of our Class B common stock and our Class C common stock are not entitled to participate in any dividends declared by our board of directors. Furthermore, because we are a holding company, our ability to pay cash dividends on our Class A common stock depends on our receipt of cash distributions from CWAN Holdings, LLC and, through CWAN Holdings, LLC, cash distributions and dividends from our other direct and indirect subsidiaries. See “Dividend Policy.” |
| Listing |
We have applied to list our Class A common stock on NYSE under the symbol “CWAN.” |
| Risk Factors |
See “Risk Factors” and other information included in this prospectus for a discussion of factors you should carefully consider before deciding to invest in shares of our Class A common stock. |
21
Table of Contents
Index to Financial Statements
| Reserved Share Program |
At our request, the underwriters have reserved for sale, at the initial public offering price, up to 5% of the Class A common stock offered by this prospectus for sale to certain of our directors, officers and employees through a reserved share program (the “Reserved Share Program”). The sale of shares will be made by Morgan Stanley & Co. LLC. If these persons purchase reserved shares, it will reduce the number of shares of Class A common stock available for sale to the general public. Any reserved shares of Class A common stock that are not so purchased will be offered by the underwriters to the general public on the same terms as the other shares of Class A common stock offered by this prospectus. See “Underwriting.” |
| Indications of Interest |
One or more funds and/or accounts affiliated with Wellington Management, Dragoneer Investment Group, LLC and Durable Capital Partners LP have indicated an interest, severally and not jointly, in purchasing up to an aggregate of $150 million in shares in this offering at the initial public offering price. Because this indication of interest is not a binding agreement or commitment to purchase, the funds and/or accounts affiliated with Wellington Management, Dragoneer Investment Group, LLC and Durable Capital Partners LP may determine to purchase more, less or no shares in this offering or the underwriters may determine to sell more, less or no shares to any of the funds and/or accounts affiliated with Wellington Management, Dragoneer Investment Group, LLC and Durable Capital Partners LP. The underwriters will receive the same discount on any of our shares purchased by the funds and/or accounts affiliated with Wellington Management, Dragoneer Investment Group, LLC and Durable Capital Partners LP. |
Unless we specifically state otherwise or the context otherwise requires, the share information in this prospectus is based on the number of shares outstanding as of September 10, 2021:
| • | assumes an initial public offering price of $15.00, the midpoint of the estimated price range set forth on the cover page of this prospectus; |
| • | assumes no exercise of the underwriters’ option to purchase up to an additional 4,500,000 shares of Class A common stock from us in this offering; |
| • | excludes 23,004,276 shares of Class A common stock issuable upon the exercise of outstanding options as of September 10, 2021, at a weighted average exercise price of $8.35 per share, under our new 2021 omnibus incentive plan (the “2021 Plan”); |
| • | excludes 375,000 shares of Class A common stock issuable upon the vesting of restricted stock units (“RSUs”) in equal installments annually until June 28, 2025, under our 2021 Plan; |
| • | excludes 1,685,625 shares of our Class A common stock issued upon the vesting and settlement of certain performance-based RSUs and service-based RSUs issuable to certain of our employees and executive officers, pursuant to our 2021 Plan, as more fully described in the section titled “Executive Compensation—Equity Incentive Compensation—Equity Awards Under the 2021 Plan”; |
| • | does not reflect the issuance of up to 20,304,836 shares of Class A common stock that are reserved for future grants or sale under the 2021 Plan; and |
| • | does not reflect the issuance of up to 3,472,178 shares of Class A common stock reserved for future sale under our new 2021 Employee Stock Purchase Plan (the “ESPP”). |
22
Table of Contents
Index to Financial Statements
SUMMARY CONSOLIDATED FINANCIAL AND OTHER DATA
The following table presents summary historical consolidated financial data for CWAN Holdings, LLC and its subsidiaries as of the dates and for the periods indicated, as well as certain pro forma financial data of CWAN Holdings, LLC and Clearwater Analytics Holdings, Inc. The summary consolidated statements of operations data and statements of cash flows data for the years ended December 31, 2020 and 2019 and the summary consolidated balance sheet data as of December 31, 2020 and 2019 are derived from the audited consolidated financial statements of CWAN Holdings, LLC included elsewhere in this prospectus. The summary consolidated statements of operations data and statements of cash flows data for the six months ended June 30, 2021 and 2020 and the summary consolidated balance sheet data as of June 30, 2021 are derived from the unaudited interim condensed consolidated financial statements of CWAN Holdings, LLC included elsewhere in this prospectus.
Historically, our business has been operated through Carbon Analytics Holdings, LLC, together with its subsidiaries. In connection with this offering, Carbon Analytics Holdings, LLC changed its name to CWAN Holdings, LLC. Clearwater Analytics Holdings, Inc. was formed for the purpose of this offering and has engaged to date only in activities in contemplation of this offering. Upon the completion of this offering, Clearwater Analytics Holdings, Inc. will be a holding company and all of our business will continue to be conducted through CWAN Holdings, LLC, together with its subsidiaries, and the financial results of CWAN Holdings, LLC will be consolidated in our financial statements. For more information regarding the organizational transactions and holding company structure, see “Organizational Structure.”
The unaudited interim condensed consolidated financial statements include all normal recurring adjustments necessary, in the opinion of management, to summarize the financial positions and results for the period presented. Our historical results are not necessarily indicative of our results to be expected in any future period, and the historical results for the six months ended June 30, 2021 are not necessarily indicative of the results that may be expected for the full year.
The unaudited pro forma consolidated balance sheet data as of June 30, 2021 presents the consolidated financial position of CWAN Holdings, LLC after giving pro forma effect to the Transactions, excluding this offering, and Clearwater Analytics Holdings, Inc. as adjusted for this offering and the contemplated use of the net proceeds from this offering as described under “Organizational Structure” and “Use of Proceeds” as if such transactions had occurred as of the balance sheet date. The unaudited pro forma consolidated statements of operations data for the year ended December 31, 2020 and the six months ended June 30, 2021 present the consolidated results of operations of CWAN Holdings, LLC after giving pro forma effect to the Transactions, excluding this offering, and Clearwater Analytics Holdings, Inc. as adjusted for this offering and the contemplated use of the net proceeds from this offering as described under “Organizational Structure” and “Use of Proceeds” as if such transactions had occurred on January 1, 2020. The pro forma adjustments are based on available information and upon assumptions that our management believes are reasonable in order to reflect, on a pro forma basis, the impact of the Transactions, excluding this offering, and as further adjusted for this offering, on the historical financial information of CWAN Holdings, LLC. The unaudited pro forma consolidated financial information is subject to change based on the actual initial public offering price, the number of shares of our Class A common stock sold in this offering and other terms of this offering determined at pricing. The unaudited pro forma consolidated financial information is included for informational purposes only and does not purport to reflect the results of operations or financial position of Clearwater Analytics Holdings, Inc. had it operated as a standalone public company during the periods presented.
The summary of our consolidated financial data, our condensed consolidated interim financial data and the pro forma financial data set forth below should be read together with our consolidated financial statements and our condensed consolidated interim financial statements and the related notes, as well as the sections captioned
23
Table of Contents
Index to Financial Statements
“Unaudited Pro Forma Consolidated Financial Information” and “Management’s Discussion and Analysis of Financial Condition and Results of Operations” appearing elsewhere in this prospectus.
| CWAN Holdings, LLC | Pro Forma Clearwater Analytics Holdings, Inc. |
|||||||||||||||||||||||
| Six Months Ended June 30, |
Years Ended December 31, |
Six Months Ended June 30, 2021 |
Year Ended December 31, 2020 |
|||||||||||||||||||||
| 2021 | 2020 | 2020 | 2019 | |||||||||||||||||||||
| (unaudited) | ||||||||||||||||||||||||
| ($ in thousands, except per share amounts) | ||||||||||||||||||||||||
| Consolidated Statements of Operations Data: |
||||||||||||||||||||||||
| Revenue |
$ | 117,770 | $ | 95,109 | $ | 203,222 | $ | 168,001 | $ | 117,770 | $ | 203,222 | ||||||||||||
| Cost of revenue |
29,898 | 26,891 | 53,263 | 47,145 | 31,274 | 56,014 | ||||||||||||||||||
|
|
|
|
|
|
|
|
|
|
|
|
|
|||||||||||||
| Gross profit |
87,872 | 68,218 | 149,959 | 120,856 | 86,496 | 147,208 | ||||||||||||||||||
|
|
|
|
|
|
|
|
|
|
|
|
|
|||||||||||||
| Operating expenses: |
||||||||||||||||||||||||
| Research and development |
32,576 | 24,069 | 55,262 | 39,275 | 36,285 | 62,680 | ||||||||||||||||||
| Sales and marketing |
16,025 | 8,600 | 22,243 | 19,082 | 17,917 | 26,029 | ||||||||||||||||||
| General and administrative |
18,727 | 10,974 | 43,874 | 36,802 | 22,134 | 50,688 | ||||||||||||||||||
| Recapitalization compensation expenses |
— | — | 48,998 | — | — | 48,998 | ||||||||||||||||||
|
|
|
|
|
|
|
|
|
|
|
|
|
|||||||||||||
| Total operating expenses |
67,328 | 43,643 | 170,377 | 95,159 | 76,336 | 188,395 | ||||||||||||||||||
|
|
|
|
|
|
|
|
|
|
|
|
|
|||||||||||||
| Income (loss) from operations |
20,544 | 24,575 | (20,418 | ) | 25,697 | 10,160 | (41,187 | ) | ||||||||||||||||
|
|
|
|
|
|
|
|
|
|
|
|
|
|||||||||||||
| Interest and other expense, net |
(17,024 | ) | (10,730 | ) | (22,910 | ) | (17,892 | ) | (973 | ) | (10,592 | ) | ||||||||||||
|
|
|
|
|
|
|
|
|
|
|
|
|
|||||||||||||
| Income (loss) before income taxes |
3,520 | 13,845 | (43,328 | ) | 7,805 | 9,187 | (51,779 | ) | ||||||||||||||||
| Income taxes |
320 | 210 | 902 | 73 | 320 | 902 | ||||||||||||||||||
|
|
|
|
|
|
|
|
|
|
|
|
|
|||||||||||||
| Net income (loss) |
$ | 3,200 | $ | 13,635 | $ | (44,230 | ) | $ | 7,732 | $ | 8,867 | $ | (52,681 | ) | ||||||||||
|
|
|
|
|
|
|
|
|
|
|
|
|
|||||||||||||
| Net income (loss) attributable to non-controlling interest |
2,242 | (13,318 | ) | |||||||||||||||||||||
|
|
|
|
|
|||||||||||||||||||||
| Net income (loss) attributable to Clearwater Analytics Holdings, Inc. |
$ | 6,625 | $ | (39,363 | ) | |||||||||||||||||||
|
|
|
|
|
|||||||||||||||||||||
| Pro forma net income (loss) per share data(1) (unaudited): |
||||||||||||||||||||||||
| Pro forma weighted average shares outstanding: |
||||||||||||||||||||||||
| Basic |
172,950 | 172,950 | ||||||||||||||||||||||
| Diluted |
240,312 | 231,479 | ||||||||||||||||||||||
| Pro forma net income (loss) per share: |
||||||||||||||||||||||||
| Basic |
$ | 0.04 | $ | (0.23 | ) | |||||||||||||||||||
| Diluted |
$ | 0.04 | $ | (0.23 | ) | |||||||||||||||||||
24
Table of Contents
Index to Financial Statements
| CWAN Holdings, LLC | CWAN Holdings, LLC |
Pro Forma Clearwater Analytics Holdings, Inc.(2) |
||||||||||||||
| As of December 31, | As of June 30, 2021 | |||||||||||||||
| 2020 | 2019 | (unaudited) | ||||||||||||||
| (in thousands) | ||||||||||||||||
| Consolidated Balance Sheet Data: |
||||||||||||||||
| Cash and cash equivalents |
$ | 61,088 | $ | 20,254 | $ | 41,031 | $ | 74,574 | ||||||||
| Total assets |
$ | 115,559 | $ | 63,968 | $ | 120,498 | $ | 152,441 | ||||||||
| Total liabilities |
$ | 460,167 | $ | 264,690 | $ | 449,736 | $ | 78,077 | ||||||||
| Total liabilities and members’ deficit |
$ | 115,559 | $ | 63,968 | $ | 120,498 | $ | 152,441 | ||||||||
| CWAN Holdings, LLC | ||||||||||||||||
| Six Months Ended June 30, |
Years Ended December 31, |
|||||||||||||||
| 2021 | 2020 | 2020 | 2019 | |||||||||||||
| (unaudited) | ||||||||||||||||
| (in thousands) | ||||||||||||||||
| Statement of Cash Flows Data: |
||||||||||||||||
| Net cash provided by (used in) operating activities |
$ | (16,352 | ) | $ | 11,535 | $ | (6,486 | ) | $ | (230,029 | ) | |||||
| Net cash used in investing activities |
$ | (2,231 | ) | $ | (2,386 | ) | $ | (3,806 | ) | $ | (3,372 | ) | ||||
| Net cash provided by (used in) financing activities |
$ | (1,341 | ) | $ | (525 | ) | $ | 51,041 | $ | 237,715 | ||||||
| CWAN Holdings, LLC | ||||||||||||||||
| Six Months Ended June 30, |
Years Ended December 31, |
|||||||||||||||
| 2021 | 2020 | 2020 | 2019 | |||||||||||||
| (in thousands) | ||||||||||||||||
| Other Financial Information (unaudited): |
||||||||||||||||
| Annualized recurring revenue(3) |
$ | 245,033 | $ | 200,492 | $ | 219,901 | $ | 185,041 | ||||||||
| Gross revenue retention rate(4) |
98% | 98% | 98% | 98% | ||||||||||||
| Net revenue retention rate(5) |
109% | 108% | 109% | 111% | ||||||||||||
| Adjusted EBITDA(6) |
$ | 35,618 | $ | 31,297 | $ | 57,050 | $ | 50,783 | ||||||||
| (1) | See the unaudited pro forma consolidated statements of operations for the year ended December 31, 2020 and the six months ended June 30, 2021 in “Unaudited Pro Forma Consolidated Financial Information”. |
| (2) | See the unaudited pro forma consolidated balance sheet at June 30, 2021 in “Unaudited Pro Forma Consolidated Financial Information.” |
| (3) | Annualized recurring revenue is calculated at the end of a period by dividing the recurring revenue in the last month of such period by the number of days in the month and multiplying by 365. |
| (4) | For a definition of gross revenue retention rate, see “Management’s Discussion and Analysis of Financial Condition and Results of Operations—Key Operating Measures.” |
| (5) | For a definition of net revenue retention rate, see “Management’s Discussion and Analysis of Financial Condition and Results of Operations—Key Operating Measures.” |
| (6) | We define Adjusted EBITDA as net income plus (i) interest expense, net, (ii) depreciation and amortization expense, (iii) equity-based compensation, (iv) recapitalization compensation expenses and (v) other expenses. See “Management’s Discussion and Analysis of Financial Condition and Results of Operations—Non-GAAP Financial Measures” for a reconciliation of this non-GAAP measure to its closest GAAP equivalent. |
25
Table of Contents
Index to Financial Statements
Investing in our Class A common stock involves a substantial risk of loss. You should carefully consider these risk factors, together with all of the other information included in this prospectus, before you decide to purchase shares of our Class A common stock. If any of the following risks occur, it could have a material adverse effect on our business, financial condition, results of operations or prospects. In that case, the trading price of our Class A common stock could decline, and you could lose part or all of your investment. Some statements in this prospectus, including statements in the following risk factors, constitute forward-looking statements. See the section of this prospectus captioned “Cautionary Note Regarding Forward-Looking Statements.”
Risks Related to Our Business and Our Industry
We operate in a highly competitive industry, with many companies competing for business from insurance companies, asset managers, corporations and government entities on the basis of a number of factors, including the quality and breadth of solutions and services provided, ability to innovate, reputation and the prices of services, and this competition could hurt our financial performance and cash flows.
The market for financial services software and services is competitive, rapidly evolving and highly sensitive to new product and service introductions, technological innovations and marketing efforts by industry participants. We and our competitors compete based on a variety of factors, including the range of offerings we provide, brand recognition, business reputation, financial strength, stability and continuity of client and other intermediary relationships, quality of service, and level of fees charged for our solutions and services. The market is also highly fragmented and served by numerous firms that target only local markets or specific client types. We compete with many different types of companies that vary in size and scope, including SS&C (Advent, Camera, Maximus, and Singularity), State Street (PAM), SAP, BNY Mellon (Eagle), Simcorp (Dimension), BlackRock (Aladdin), FIS (iWorks) and Northern Trust, and which are discussed in greater detail under “Business—Competition”. In addition, some of our clients, including financial services firms, have developed or may develop the in-house capability to provide the technology, investment reporting and accounting solutions, regulatory reporting solutions and investment risk management and performance analytics solutions and services they have engaged us to perform, obviating the need to hire us.
Some of our current and potential competitors also have significantly greater resources than we do. These resources may allow our competitors to respond more quickly to changes in demand for our solutions and services, and to devote greater resources to developing and promoting their services and to make more attractive offers to potential clients and strategic partners, which could hurt our financial performance. Our competitors may also enter into alliances with each other or other third parties, and through such alliances, acquire increased market share. Increased competition may result in price reductions, reduced gross margins and loss of market share.
Our failure to successfully compete in any of the above-mentioned areas could have a material adverse effect on our business, financial condition, results of operations and cash flows.
We have experienced rapid revenue growth over the past several years, which may be difficult to sustain, and we depend on attracting and retaining top talent to continue growing and operating our business, and if we are unable to hire, integrate, develop, motivate and retain our personnel, we may not be able to maintain or manage our growth, which could have a material adverse effect on our business, financial condition, results of operations and cash flows.
Our revenues for the year ended December 31, 2020 grew 21% compared to the same period in 2019. Continued future growth could place additional demands on our resources and increase our expenses. Our success depends in large part on our ability to attract high-quality management and employees in sales,
26
Table of Contents
Index to Financial Statements
development, software engineering, operations and support functions. In addition to hiring new employees, we must continue to focus on retaining our best talent and preserving our culture, values and entrepreneurial environment. Competition for qualified employees is intense in our industry, and the loss of even a few qualified employees, or an inability to attract, retain and motivate additional highly skilled employees required for the ongoing expansion of our business, could harm our results of operations and impair our ability to grow. To attract and retain key personnel, we use various measures, including an equity incentive program for key executive officers and employees. We may need to invest significant amounts of cash and equity for new and existing employees and we may never realize returns on these investments. In addition, these measures may not be enough to attract and retain the personnel we require to operate our business effectively. If we are not able to effectively increase and retain our talent, our ability to achieve our strategic objectives will be adversely impacted, and our business, financial condition and results of operations will be harmed.
Sustaining growth will also require us to commit additional sales, management, operational and financial resources and to maintain appropriate operational and financial systems. In addition, continued growth increases the challenges involved in:
| • | successfully expanding the range of solutions and services offered to our clients; |
| • | developing and improving our internal administrative infrastructure, particularly our financial, operational, compliance, record-keeping, communications and other internal systems; and |
| • | maintaining high levels of satisfaction with our solutions and services among clients. |
We may not be able to manage our expanding operations effectively or maintain or accelerate our growth, and any failure to do so could adversely affect our business, financial condition, results of operations and cash flows.
We are dependent on fees based on the value of the assets on our platform for the vast majority of our revenues, and to the extent market volatility, a downturn in economic conditions or other factors cause negative trends or fluctuations in the value of the assets on our platform, our fee-based revenue and earnings may decline.
Substantially all of our revenue is derived from fees that are primarily based on the amount of assets on our platform. These fees are stated in basis points, or 1/100th of 1%. Though in substantially all cases we charge a minimum fee regardless of the assets that are loaded onto our platform, our results of operations and financial condition are highly dependent on the value of the assets that our clients maintain on our platform. In particular, we are dependent on the fee-based revenue from our insurance industry clients and asset manager clients, from whom we derived 52% and 31%, respectively, of our total revenue for the year ended December 31, 2020.
Because we provide a majority of our solutions to the financial services industry, we are vulnerable to U.S. and foreign economic conditions and general trends in business and finance, which are affected by many factors beyond our control. For example, customers of our asset manager clients are generally free to change asset managers, and can even withdraw the funds they have invested with asset managers to avoid all securities markets-related risks. Because of significant fluctuations in securities prices or investment underperformance driven by an economic downturn, such an investor may choose to transfer assets to investments that are perceived to be more secure and that are not maintained or managed by our asset manager clients, such as bank deposits and Treasury securities, or to mutual funds. These actions by investors are outside of our control and could materially adversely affect the portfolio market value of the assets that our clients have loaded onto our platform, which could in turn materially adversely affect the portfolio-based fees we receive from our clients. Significant changes in investing patterns or large-scale withdrawal of investment funds could have a material adverse effect on our business, financial condition or results of operations.
Demand for our solutions and services could decline for other client-based reasons as well. Consolidation or limited growth in the industries we serve, including the insurance industry, could reduce the number of our
27
Table of Contents
Index to Financial Statements
clients and potential clients. Political or regulatory events or changes that adversely affect our clients’ businesses, rates of growth, costs of operations and regulatory compliance or the numbers of customers they serve, including decreased demand for our clients’ products and services or adverse conditions in our clients’ markets generally, could decrease demand for our solutions and services and thereby decrease our revenues. Any of the foregoing could have a material adverse effect on our business, financial condition or results of operations.
Our clients may seek to negotiate a lower fee percentage or may cease using our services, which could limit the growth of, or decrease, our revenues.
Our revenues are derived from fees we charge our clients based on an agreed upon basis points rate applied against the average daily value of assets on the platform over a given month, subject to contracted minimums. The basis points are typically tiered based on the amount of assets on platform (e.g., a client would be charged a lower basis point rate on incremental assets after exceeding a certain threshold). In general, the price we charge our clients for our solutions is based on a number of factors including the expected amount of assets on the platform, asset mix (e.g., fixed income, structured products, equities, derivatives or private assets), transaction volume, number of data feeds, and other client-specific factors. Our clients may, for a number of reasons, seek to negotiate a lower basis points fee percentage. For example, an increase in the use of index-linked investment products by the customers of our asset manager clients may result in lower fees being paid to our clients, and our clients may in turn seek to negotiate lower basis points fee percentages for our services. Similarly, the total value of assets reported in our insurance clients’ regulatory filings may decrease, and as a result, such clients may seek a corresponding reduction in our related fees.
In addition, as competition among our clients increases, they may be required to lower the fees they charge to their customers, which could cause them to seek to decrease our fees accordingly. Any of these factors could result in fluctuation or a decline in our portfolio-based fees, which would have a material adverse effect on our business, financial condition or results of operations.
The COVID-19 pandemic has caused, and is causing, significant harm to the global economy, which in turn could have a material adverse effect on our business, financial condition or results of operations.
On March 11, 2020, the World Health Organization declared Coronavirus Disease 2019 (“COVID-19”) a pandemic disease. The COVID-19 pandemic has resulted in authorities implementing numerous measures attempting to contain the spread and impact of COVID-19, such as travel bans and restrictions, quarantines, shelter in place orders, and limitations on business activity, including closures. These measures are, among other things, severely restricting global economic activity, which is disrupting supply chains, lowering certain asset and equity market valuations, significantly increasing unemployment and underemployment levels, increasing insurance costs, decreasing liquidity in certain markets for certain securities and causing significant volatility and disruption in the markets in which we and our clients operate.
In response to COVID-19 concerns, a majority of our employees are working from home, and we expect such work-from-home arrangements will continue as we plan for the phased return of employees to our offices pursuant to enhanced health and safety protocols consistent with guidelines issued by health authorities. Remote work-from-home restrictions makes us more dependent on certain technologies that allow us to operate our business remotely and collaborate without face-to-face meetings both internally and with our clients. To the extent we experience a technological disruption in our work-from-home capabilities, we would anticipate a negative impact on our business operations. Further, to the extent supply chains are disrupted, it may become more difficult to provide necessary technology to our employees working from remote locations.
The extent to which COVID-19, and the related global economic crisis, affect our business, results of operations and financial condition will depend on future developments that are highly uncertain and cannot be predicted, including the scope and duration of the pandemic and any recovery period, future actions taken by governmental authorities, central banks and other third parties in response to the pandemic, and the effects on our
28
Table of Contents
Index to Financial Statements
solutions and services, clients, employees and vendors. If we are not able to respond to and manage the impact of such events effectively, our business, results of operations and financial condition may be materially and adversely affected.
The COVID-19 pandemic, and the related global economic crisis, could also precipitate or aggravate the other risks described in this prospectus, which could materially and adversely affect our business, results of operations and financial condition. Further, the COVID-19 pandemic may also affect our operating and financial results in a manner that is not presently known to us or that we currently do not consider to present significant risks.
If our investment accounting and reporting solutions, regulatory reporting solutions or risk management or performance analytics solutions fail to perform properly due to undetected errors or similar problems, our business, financial condition, reputation or results of operations could be materially adversely affected.
Investment accounting and reporting solutions, regulatory reporting solutions and risk management and performance analytics solutions we develop or license may contain undetected errors or defects despite testing. Such errors can exist at any point in the life cycle of our solutions, but there is an increased risk that they will be found after new services, enhancements or data sources are incorporated into our existing solutions or services. We continually introduce new solutions and services and new versions of our solutions and services, including, for example, in response to new or modified regulations or reporting requirements. Despite internal testing and testing by current and potential clients, our current and future solutions and services may contain serious defects or malfunctions. If we detect any errors before release, we might be required to delay the release of the solution or service for an extended period of time while we address the problem. We might not discover errors that affect our new or current solutions, services or enhancements until after they are deployed or after they have, for example, resulted in incorrect reporting on which our clients are dependent, and we may need to provide new enhancements to correct such errors. Errors may occur that could have a material adverse effect on our business, financial condition or results of operations and could result in harm to our reputation, lost sales, delays in commercial release, claims by affected clients, third-party claims, contractual disputes, contract terminations or renegotiations, or unexpected expenses and diversion of management and other resources to remedy errors. In addition, negative public perception and reputational damage caused by such claims would adversely affect our client relationships and our ability to enter into new contracts. Any of these problems could have a material adverse effect on our business, financial condition, reputation or results of operations.
We could face liability or incur costs to remediate operational errors or to address possible client dissatisfaction.
Operational risk generally refers to the risk of loss resulting from our operations, including, but not limited to, improper or unauthorized execution and processing of transactions and financial and market data, deficiencies in our operating systems, faulty aggregation or incorrect reconciliation of data by our solutions and services, miscalculations of cash balances available for investment purposes, business disruptions and inadequacies or breaches in our internal control processes. We operate in diverse markets and are reliant on the ability of our employees, systems, solutions and services to process large volumes of transactions and financial and market data, often within short time frames. In the event of a breakdown or improper operation of our systems, errors in our solutions and services, human error or improper action by employees, we could suffer financial loss or damage to our reputation, including as a result of allegations (and associated claims for contractual or other remedies) by any client that operational errors on our part resulted in financial or other harm to their business.
In addition, there may be circumstances when our clients are dissatisfied with our solutions and services, even in the absence of an operational error. In such circumstances, we may elect to make payments or otherwise incur increased costs or lower revenues in order to maintain a strong client relationship. In any of the forgoing circumstances, our business, financial condition, reputation or results of operations could be materially adversely affected.
29
Table of Contents
Index to Financial Statements
Our business relies heavily on computer equipment, cloud-based services, electronic delivery systems, networks and telecommunications systems and infrastructure, the Internet and the information technology systems of third parties. Any failures or disruptions in any of the foregoing could result in reduced revenues, increased costs and the loss of clients and could harm our business, financial condition, reputation, and results of operations.
Our business relies heavily on our computer equipment (including our servers), cloud-based services, electronic delivery systems, networks and telecommunications systems and infrastructure, the Internet and the information technology systems of third party providers, and the foregoing may be vulnerable to disruptions, failures or slowdowns caused by fire, earthquake, extreme weather events, power loss, telecommunications failure, terrorist attacks, wars, Internet failures, computer viruses, system errors and miscalculations and other events beyond our control. Furthermore, we rely on agreements with our suppliers, such as our current data hosting and service provider and financial market data providers, and on our clients’ agreements with certain third party data providers, to provide us with access to certain computer equipment, cloud-based services, electronic delivery systems, the Internet, market financial information and information regarding our clients’ assets. A future contractual dispute may arise with one of our suppliers or third party data providers that could cause a disruption or deterioration in our solutions and services, and we are unable to predict whether our agreements with our suppliers or our clients’ agreements with third party data providers can be obtained or renewed on acceptable terms, or at all. An unanticipated disruption, failure or slowdown affecting our key technologies or facilities may have significant ramifications, such as data loss, data corruption, damaged software code, inaccurate accounting of transactions, inaccurate regulatory reporting or inability to provide certain solutions and services to our clients. We maintain off-site back-up facilities for our electronic information and computer equipment, but these facilities could be subject to the same interruptions that may affect our primary facilities. Any significant termination of data access, or disruptions, failures, slowdowns, data loss or data corruption could have a material adverse effect on our business, financial condition or results of operations and result in the loss of clients.
If sources from which we obtain information limit our access to such information or institute or increase fees for accessing such information, our business could be materially and adversely harmed.
Our data aggregation solutions require certain data that we obtain from thousands of sources, including banks, financial institutions, data providers, custodians and other organizations, some of which are not our current clients or in direct contractual privity with us. Although we have a data feed with each of our clients, our access to much of the data we aggregate, reconcile and offer as part of our solutions is facilitated through and reliant upon agreements between our clients and providers of such data, such as asset managers and custodians, and we often do not have direct contractual relationships with such providers. If the sources from which we obtain information that is important to our solutions and services limit or restrict our ability to access or use such information, we may be unable to obtain similar data from other sources on commercially reasonable terms or at all, or we may be required to attempt to obtain such information by other means, such as end-user permissioned data scraping, that could be more costly and time-consuming, and less effective or efficient.
In order to serve our clients, we must have a reliable method from which to obtain client data. In the past, certain of our clients have requested we obtain this data through a web-based retrieval process, which we refer to as a web-based data feed. We sometimes encounter issues with our web-based data feeds, including as a result of our clients’ implementation of new security controls, changes to the layouts of web pages, or the use of software intended to block unauthorized scraping activities. If we are unable to re-institute the web-based data feed, or otherwise obtain the data from our clients through another reliable means, then we may be unable to continue to serve the affected clients. In any event, redesigning our web-based data feeds or being required to obtain data by other reliable means diverts time and resources and may have an adverse effect on our business, financial condition or results of operations.
In the past, a limited number of third parties have either blocked our access to their websites or requested that we cease employing data scraping of their websites to gather information, and we could receive similar,
30
Table of Contents
Index to Financial Statements
additional requests in the future. Any such limitation or restriction may also preclude us from providing our solutions and services on a timely basis, if at all. In addition, if in the future one or more third parties challenge our right to access information from these or other sources, we may be required to negotiate with such sources for access to their information, which may be more costly, or to discontinue certain of our solutions and services entirely. The legal environment surrounding data scraping and similar means of obtaining access to information contained on third-party websites is evolving, and one or more third parties could assert claims against us seeking damages or to prevent us from accessing information from third-party websites in that manner. In the event sources from which we obtain information begin to charge us fees for accessing such information, or block our access to this information entirely, we may be forced to increase the fees that we charge our clients or discontinue certain solutions and services, which could make our solutions and services less attractive, or our gross margins and other financial results could suffer.
We could face liability for certain information we provide, including information based on data we obtain from other parties.
We may be subject to claims for negligence, breach of contract or other claims relating to the information we provide. For example, individuals may take legal action against us if they rely on information we have provided and it contains an error. In addition, we could be subject to claims based upon the content that is accessible from our website through links to other websites. Moreover, we could face liability based on inaccurate information provided to us by others or based on information provided to us by others that have not obtained necessary consents to do so. Defending any such claims could be expensive and time-consuming, and any such claim could materially adversely affect our business, financial condition or results of operations.
If our reputation is harmed, our business, financial condition or results of operations could be materially adversely affected.
Our reputation, which depends on earning and maintaining the trust and confidence of our clients, is critical to our business. Our reputation is vulnerable to many threats that can be difficult or impossible to control, and costly or impossible to remediate. Regulatory inquiries or investigations, lawsuits initiated by our clients or others, employee misconduct, perceptions of conflicts of interest and rumors, among other developments, could substantially damage our reputation, even if they are baseless or satisfactorily addressed. In addition, any perception that the quality of our solutions and services may not be the same or better than that of other providers can also damage our reputation. Any damage to our reputation could harm our ability to attract and retain clients, which would materially adversely affect our business, financial condition and results of operations.
Our revenue can fluctuate from period to period, which could cause our stock price to fluctuate.
Our revenue may fluctuate from period-to-period in the future due to a variety of factors, many of which are beyond our control. Factors relating to our business that may contribute to these fluctuations include the following events, as well as other factors described elsewhere in this prospectus:
| • | a decline or slowdown of the growth in the value of financial market assets, which may reduce the portfolio market value of the assets loaded on our platform from which we derive portfolio-based fees, or reduce demand for our solutions and services generally, and therefore negatively affect our revenues and cash flows; |
| • | unanticipated changes to economic terms in contracts with clients, including renegotiations; |
| • | downward pressure on fees we charge our clients, which would therefore reduce our revenue; |
| • | changes in laws or regulations that could impact our ability to offer solutions and services; |
| • | failure to obtain new clients; |
| • | failure to expand the services offered to existing clients or to apply such services to additional asset portfolios of existing clients; |
31
Table of Contents
Index to Financial Statements
| • | cancellation or non-renewal of existing contracts with clients; |
| • | failure to protect our proprietary technology and intellectual property rights; |
| • | unanticipated delays in connection with the implementation of our services in relation to our clients’ asset portfolios; or |
| • | reduction in the suite of solutions and services provided to existing clients. |
As a result of these and other factors, the results of operations for any quarterly or annual period may differ materially from the results of operations for any prior or future quarterly or annual period and our historical results should not be relied upon as indications of our future performance.
Early termination of our client contracts could have a material adverse effect on our business, financial condition or results of operations.
Our contracts with insurance companies, asset managers, corporations and government entities are generally terminable upon thirty days’ notice by our clients or prior to such time for cause, which may include breach of contract, bankruptcy, insolvency and other reasons. If a significant number of our clients were to terminate their contracts with us and we were unable to obtain a significant number of new clients, our business, financial condition or results of operations could be materially adversely affected.
Because some of our sales efforts are targeted at large financial institutions, corporations and government entities, we face prolonged sales cycles, substantial upfront sales costs and less predictability in completing some of our sales. If our sales cycle lengthens, or if our upfront sales investments do not result in sufficient revenue, our results of operations may be harmed.
We target a portion of our sales efforts at large financial institutions, corporations and government entities, which presents challenges that are different from those we encounter with smaller clients. Because our large clients are often making an enterprise-wide decision to deploy our solutions, we face longer sales cycles, complex client requirements, substantial upfront sales costs, significant contract negotiations and less predictability in completing some of our sales with these clients. Our sales cycle can often last several months or more with our largest clients, who often undertake an extended evaluation process, but this is variable and difficult to predict. We anticipate that we will experience even longer sales cycles, more complex client needs, higher upfront sales costs and less predictability in completing sales with clients located outside of the United States. If our sales cycle lengthens or our upfront sales investments do not generate sufficient revenue to justify our investments in our sales efforts, our results of operations may be harmed.
We may become subject to liability based on the use of our investment accounting and reporting solutions, regulatory reporting solutions and internal risk management and performance analytics solutions by our clients.
Our solutions and services support the investment, financial and regulatory reporting processes of our clients, many of whom have asset portfolios on our system aggregating to billions of dollars. Our clients similarly rely on our solutions to ensure compliance with complex regulatory requirements. Our client agreements have provisions designed to limit our exposure to potential liability claims brought by our clients or third parties based on the use of our solutions and services. However, these provisions have certain exceptions and could be invalidated by unfavorable judicial decisions or by federal, state, foreign or local laws. For instance, use of our solutions as part of the investment process creates the risk that asset manager clients, or the parties whose assets are managed by our clients, may pursue claims against us for very significant dollar amounts, and in a similar vein, our clients or their regulators may pursue claims or investigations against us in connection with regulatory reporting deficiencies associated with our services. Any such claim, lawsuit, investigation or other proceeding, even if the outcome were to be ultimately favorable to us, would involve a significant commitment
32
Table of Contents
Index to Financial Statements
of our management, personnel, financial and other resources and could have a negative impact on our reputation. Such proceedings could therefore have a material adverse effect on our business, financial condition or results of operations.
Furthermore, our clients may use our solutions and services together with software, data or products from other companies. As a result, when problems occur, it might be difficult to identify the source of the problem. Even when our solutions and services do not cause these problems, the existence of these errors might cause us to incur significant costs and divert the attention of our management and technical personnel, any of which could materially adversely affect our business, financial condition or results of operations.
Although we primarily process institutional financial information, we could face liability related to unauthorized access to, disclosure or theft of the personal information we store and process, and could consequently incur significant costs.
Although we primarily process institutional financial information, clients may maintain personal information, including personal investment, accounting and financial information, on our platform and we could be subject to liability if we were to inappropriately disclose any such client’s personal information, inadvertently or otherwise, or if third parties were able to obtain access to our network, circumvent our security, or otherwise gain access to any user’s name, address, portfolio holdings or other personal or financial information that we store or process. Any such event could subject us to claims and liability related to unauthorized access to or use of personal information, including claims by such users and by applicable regulatory authorities, which could cause us to incur significant costs and divert the attention of our management and technical personnel, or cause harm to our reputation, and could therefore have a material adverse effect on our business, financial condition or results of operations.
Our clients are located in the United States and around the world. As a result, we may also collect, process and store the personal information of individuals who live in many different countries. Privacy regulators in some of those countries have publicly stated that foreign entities (including entities based in the United States) may render themselves subject to those countries’ privacy laws and the jurisdiction of such regulators by collecting or storing the personal data of those countries’ residents, even if such entities have no physical or legal presence there. Consequently, we may be obligated to comply with the privacy and data security laws of certain foreign countries. Our potential exposure to foreign countries’ privacy and data security laws may impact our ability to collect and use personal information now and in the future, increase our legal compliance costs and may expose us to significant liability for non-compliance.
We are also subject to various laws and regulations both in the United States, including the California Consumer Privacy Act, and in other countries where we currently operate, including the Data Protection Act 2018 and UK General Data Protection Regulation in the United Kingdom. We have incurred, and will continue to incur, expenses to comply with privacy and security standards and protocols imposed by law, regulation, industry standards or contractual obligations. Increased domestic or international regulation of data collection, processing, transfer and security could require us to modify our operations and incur significant additional expense, which could have a material adverse effect on our business, financial condition or results of operations. Additionally, we are subject to the terms of our privacy policies and privacy-related obligations to third parties. Any failure or perceived failure by us to comply with our privacy policies, our privacy-related obligations to clients or other third parties, or our legal obligations relating to privacy, or any compromise of security that results in the unauthorized access to, disclosure or misuse of personal information may result in governmental or regulatory investigations, enforcement actions, fines, litigation, or negative publicity and could cause clients to lose trust in us, all of which could be costly and have an adverse effect on our business.
33
Table of Contents
Index to Financial Statements
If we or our third-party service providers suffer a cybersecurity event, our reputation may be harmed, we may lose clients and we may incur significant liabilities, any of which would harm our business and results of operations.
Cyberattacks, computer malware, viruses, social engineering (including phishing attacks), ransomware attacks and general hacking are becoming more prevalent generally and in our industry, and we may in the future become the target of third parties seeking unauthorized access to our confidential or sensitive information or that of our clients. In addition, third parties may attempt to fraudulently induce employees, contractors or users to disclose information, including user names and passwords, to gain access to our clients’ data, our data or other confidential or sensitive information, and we may be the target of email scams that attempt to acquire personal information or company assets. While we have security measures in place designed to protect our and our clients’ confidential and sensitive information and prevent unauthorized access to data, these measures may not be effective to prevent a security breach, including as a result of employee error, theft, misuse or malfeasance, third-party actions, unintentional events, or deliberate attacks by individuals or criminal organizations, any of which may result in someone obtaining unauthorized access to our or our clients’ data, including to our trade secret or other confidential and proprietary business information. Because techniques used to sabotage or obtain unauthorized access to systems change frequently and frequently are not recognized until successfully launched against a target, we may be unable to anticipate all such techniques, or react in a timely manner or implement adequate preventative measures against such techniques. We devote significant financial and personnel resources to implement and maintain security measures; however, as cybersecurity threats develop, evolve and grow more complex over time, it may be necessary to make further investments to protect our data and infrastructure.
We use third parties to provide certain data processing services, including hosting services; however, our ability to monitor our third-party service providers’ data security is limited. Because we do not control our third-party service providers, or the processing of data by our third-party service providers, we cannot ensure the measures they take to protect and prevent the loss of our data or our clients’ data are sufficient.
A security breach suffered by us or our third-party service providers, an attack causing outages or unavailability of our solutions and services, or any unauthorized, accidental or unlawful access or loss of data, or the perception that any such event has occurred, could result in a disruption to our solutions and services, litigation, an obligation to notify regulators and affected individuals, the triggering of service availability, indemnification and other contractual obligations to our clients, regulatory investigations, government fines and penalties, reputational damage, loss of sales and clients, mitigation and remediation expenses and other significant costs and liabilities. In addition, we may incur significant costs and operational consequences of investigating, remediating, eliminating and putting in place additional tools and devices designed to prevent future actual or perceived security incidents, as well as the costs to comply with any notification or other obligations resulting from any security incidents. We also cannot be certain that our existing insurance coverage will be available in sufficient amounts to cover the potentially significant losses that may result from a security incident or breach, or will continue to be available on acceptable terms or at all, or that the insurer will not deny coverage as to any future claim. The successful assertion of one or more large claims against us that exceed available insurance coverage, or the occurrence of changes in our insurance policies, including premium increases or the imposition of large deductible or co-insurance requirements, could adversely affect our business, financial condition and results of operations. Further, our clients and their service providers administer access to data and control the entry of such data on their systems. As a result, a client may suffer a cybersecurity event on its own systems, unrelated to our own systems, and a malicious actor could obtain access to the client’s information held on our system. Even if such a breach is unrelated to our own security programs or practices, or if the client failed to adequately protect their system, that breach could result in our incurring significant economic and operational costs in investigating, remediating, eliminating and putting in place additional tools and devices to further protect our clients from their own vulnerabilities, and could also result in reputational harm to us.
The reliability and security of our information technology systems is critical to our operations and the implementation of our growth initiatives. Any cybersecurity event or other material disruption in our information
34
Table of Contents
Index to Financial Statements
technology systems, or delays or difficulties in implementing or integrating new systems or enhancing current systems, could have an adverse effect on our business, and results of operations.
Disruptions, capacity limitations or interference with our use of the data centers that host our solutions and services could result in delays or outages and harm our business.
We currently partially host and intend to increasingly host our cloud service from third-party data center facilities from several global locations operated by Google Cloud Computing Services. Any damage to, failure of or interference with our cloud service that is hosted by Google, or by third-party providers we currently utilize or may utilize in the future, whether as a result of our actions, actions by the third-party data centers, actions by other third parties, or acts of God, could result in interruptions in our cloud service and/or the loss of our or our clients’ data. While the third-party data centers host the server infrastructure, we manage the cloud services through our internal teams, and we need to support version control, changes in cloud software parameters and the evolution of our products, all in a multi-OS environment. As we utilize third-party data centers, we may move or transfer our data and our clients’ data from one region to another. Despite precautions taken during this process, any unsuccessful data transfers may impair the delivery of our solutions. Impairment of, or interruptions in, our cloud services may subject us to claims and litigation, cause our clients to terminate their agreements with us and adversely affect our ability to attract new clients. Our business will also be harmed if our clients and potential clients believe our services are unreliable. Additionally, any limitation of the capacity of our third-party data centers could impede our ability to scale, onboard new clients or expand the usage of existing clients, which could adversely affect our business, financial condition and results of operations.
We do not control, or in some cases have limited control over, the operation of the data center facilities we use to host our solutions and services, and these facilities may be vulnerable to damage or interruption from earthquakes, floods, fires, power loss, telecommunications failures and similar events. They may also be subject to cyberattacks, break-ins, sabotage, intentional criminal acts, acts of vandalism and similar misconduct and to adverse events caused by operator error. Despite precautions taken at these facilities, the occurrence of a natural disaster, an act of terrorism, war or other act of malfeasance, a decision to close the facilities without adequate notice to us, or other unanticipated problems at these facilities could result in lengthy interruptions in our solutions and services and the loss of client data and business, and related claims by our clients against us. We may also incur significant costs for using alternative equipment or facilities or taking other actions in preparation for, or in reaction to, any such events.
Changes to the laws or regulations applicable to us or to our asset manager or insurance industry clients could adversely affect our business, financial condition or results of operations.
We may be adversely affected as a result of new or revised legislation or regulations imposed by the SEC or other U.S. federal or state or foreign governmental regulatory authorities or self-regulatory organizations that supervise the financial markets and insurance industries around the world. In addition, we may be adversely affected by changes in the interpretation or enforcement of existing laws and rules by these governmental authorities and self-regulatory organizations. It is impossible to determine the extent of the impact of any new laws, regulations or initiatives that may be proposed, or whether any current proposals will become law, and it is difficult to predict how any changes or potential changes could affect our business. Changes to laws or regulations could increase our potential liability in connection with the solutions and services that we provide. The introduction of any new laws or regulations could make our ability to comply with applicable laws and regulations more difficult and expensive. Any of the foregoing could have a material adverse effect on our business, financial condition or results of operations.
We may be unable to adapt to rapidly changing technology, evolving industry standards and regulatory requirements and new product and service introductions, which could result in a loss of market share.
Rapidly changing technology, evolving industry standards and regulatory requirements and new product and service introductions characterize the market for our solutions. Our future success will depend in part upon our
35
Table of Contents
Index to Financial Statements
ability to enhance our existing offerings, including to localize them to differing local requirements, and to develop and introduce new solutions and services to keep pace with such changes and developments and to meet changing client needs. The process of developing our platform is extremely complex and is expected to become increasingly complex and expensive in the future due to the introduction of new platforms, operating systems and technologies. Our ability to keep up with technology and business and legal and regulatory changes is subject to a number of risks, including that:
| • | we may find it difficult or costly to update our solutions and services and to develop new solutions and services quickly enough to meet our clients’ needs; |
| • | we may find it difficult or costly to make some features of our software work effectively and securely over the Internet or with new or changed external applications; |
| • | we may find it difficult or costly to update our solutions and services to keep pace with business, evolving industry standards, regulatory and other developments in the industries where our clients operate; |
| • | we may find it difficult or costly to advertise and market our solutions and services; |
| • | we may find it difficult or costly to protect our proprietary technology and intellectual property rights; |
| • | our clients may delay purchases in anticipation of new solutions, services or enhancements; and |
| • | we may be exposed to liability for security breaches that allow unauthorized persons to gain access to confidential information stored on our computers or transmitted over our network. |
Our failure to enhance our platform and to develop and introduce new solutions and services to promptly address the needs of the insurance industry and financial markets could adversely affect our business, financial condition or results of operations.
If government regulation of the Internet or other areas of our business changes, or if attitudes toward use of the Internet change, we may need to change the manner in which we conduct our business or incur greater operating expenses.
The adoption, modification or interpretation of laws or regulations relating to the Internet or other areas of our business could adversely affect the manner in which we conduct our business. Such laws and regulations may cover sales practices, taxes, user privacy, data protection, pricing, content, copyrights, distribution, electronic contracts, consumer protection, broadband residential Internet access and the characteristics and quality of services. Moreover, it is not always clear how certain existing laws governing these matters apply to the Internet. If we are required to comply with new regulations or legislation or new interpretations of existing regulations or legislation, we may be required to incur additional expenses or alter our business model, either of which could have a material adverse effect on our business, financial condition or results of operations.
We are substantially dependent on our intellectual property rights, and a failure to protect these rights could adversely affect our business, financial condition or results of operations.
We have made substantial investments in software and other intellectual property on which our business is highly dependent. We rely on trade secret, trademark and copyright laws, confidentiality and nondisclosure agreements and other contractual and technical security measures to protect our proprietary technology. Any loss of our intellectual property rights, or any significant claim of infringement or indemnity for violation of the intellectual property rights of others, could have a material adverse effect on our business, financial condition or results of operations.
None of our technologies, solutions or services is covered by any issued patent. We are the owner of three copyright registrations, two registered trademarks in the United States and three international trademarks, and we claim common law rights in other trademarks that are not registered. We cannot guarantee that:
| • | our intellectual property rights will provide competitive advantages to us; |
36
Table of Contents
Index to Financial Statements
| • | our ability to assert our intellectual property rights against potential competitors or to settle current or future disputes will not be limited by our agreements with third parties; |
| • | our intellectual property rights will be enforced in jurisdictions where competition may be intense or where legal protection may be weak; |
| • | any of the trademarks, copyrights, trade secrets or other intellectual property rights that we presently employ in our business will not lapse or be invalidated, circumvented, challenged or abandoned; |
| • | our trademark applications will lead to registered trademarks; |
| • | our patent applications will lead to issued patents; or |
| • | competitors will not design around our intellectual property rights or develop similar technologies or offerings; or that we will be able to successfully assert our intellectual property rights against others. |
We are also a party to a number of third-party intellectual property license agreements. Some of these license agreements require us to make one-time payments or ongoing subscription payments. We cannot guarantee that the third-party intellectual property we license will not be licensed to our competitors or others in our industry. In the future, we may need to obtain additional licenses or renew existing license agreements. We are unable to predict whether these license agreements will be obtained or renewed on commercially reasonable terms, or at all. Additionally, we use certain software covered by open source licenses. The terms of many open source licenses have not been interpreted by U.S. courts, and there is a risk that the licenses could be construed in a manner that imposes unanticipated conditions or restrictions on our ability use such software, or that could require us to disclose certain portions of our proprietary source code or re-engineer all or a portion of our solutions and services, any of which could harm our business and result in significant costs.
Third parties may sue us for intellectual property infringement or misappropriation which, if successful, could require us to pay significant damages or make changes to the solutions or services that we offer.
We cannot be certain that our internally developed technology, solutions or services do not and will not infringe the intellectual property rights of others. In addition, we license content, software and other intellectual property rights from third parties and may be subject to claims of infringement if such parties do not possess the necessary intellectual property rights to the products they license to us. We may not have sufficient contractual protection to cover all liability associated with such claims. In addition, we may face additional risk of infringement or misappropriation claims if we hire an employee who possesses third party proprietary information who decides to use such information in connection with our solutions, services or business processes without such third party’s authorization. We have in the past been and may in the future be subject to legal proceedings and claims that we have infringed or misappropriated the intellectual property rights of a third party. Claims may involve patent holding companies who have no relevant product revenues and against whom our own proprietary technology may therefore provide little or no deterrence. In addition, third parties may in the future assert intellectual property infringement claims against our clients, which, in certain circumstances, we have agreed to indemnify. Any intellectual property related infringement or misappropriation claims, whether or not meritorious, could result in costly litigation and could divert management resources and attention. Moreover, should we be found liable for infringement or misappropriation, we may be required to enter into licensing agreements, which may not be available on acceptable terms or at all, pay substantial damages or make changes to the solutions and services that we offer. Any of the foregoing could prevent us from competing effectively, result in substantial costs to us, divert management’s attention and our resources away from our operations and otherwise harm our reputation.
If our intellectual property and proprietary technology are not adequately protected to prevent use or appropriation by our competitors, our business and competitive position would suffer.
Our future success and competitive position depend in part on our ability to protect our intellectual property rights. The steps we have taken to protect our intellectual property rights may be inadequate to prevent the
37
Table of Contents
Index to Financial Statements
misappropriation of our proprietary technology. Others may develop or patent similar or superior technologies, solutions or services. Unauthorized copying or other misappropriation of our proprietary technologies could enable third parties to benefit from our intellectual property rights without paying us for doing so, which could harm our business. Policing unauthorized use of proprietary technology is difficult and expensive and our monitoring and policing activities may not be sufficient to identify any misappropriation and protect our proprietary technology. In addition, third parties may knowingly or unknowingly infringe our trademarks and other intellectual property rights, and litigation may be necessary to protect and enforce our intellectual property rights. If litigation is necessary to protect and enforce our intellectual property rights, any such litigation could be very costly and could divert management attention and resources. If we are unable to protect our intellectual property rights or if third parties independently develop or gain access to our or similar technologies, solutions or services, our business, financial condition and results of operations could be materially adversely affected.
Confidentiality agreements with employees, consultants and others may not adequately prevent disclosure of trade secrets and other proprietary information.
We have devoted substantial resources to the development of our proprietary technologies, solutions and services. In order to protect our proprietary rights, we enter into confidentiality agreements with our employees, consultants and independent contractors. These agreements may not effectively prevent unauthorized disclosure of confidential information or unauthorized parties from copying aspects of our technologies, investment accounting offerings or obtaining and using information that we regard as proprietary. Moreover, these agreements may not provide an adequate remedy in the event of such unauthorized disclosures of confidential information and our rights under such agreements may not be enforceable. In addition, others may independently discover trade secrets and proprietary information, and in such cases we could not assert any trade secret rights against such parties. Costly and time-consuming litigation could be necessary to enforce and determine the scope of our proprietary rights, and failure to obtain or maintain trade secret protection could reduce any competitive advantage we have developed and cause us to lose clients or otherwise harm our business.
Our failure to successfully integrate acquisitions could strain our resources. In addition, there are significant risks associated with growth through acquisitions, which may materially adversely affect our business, financial condition or results of operations.
We expect to grow our business by, among other things, making acquisitions. Acquisitions involve a number of risks. Financing an acquisition could result in dilution from issuing equity securities or a weaker balance sheet from using cash or incurring debt. To the extent we grow our business through acquisitions, any such future acquisitions could present a number of other risks, including:
| • | incorrect assumptions regarding the future results of acquired operations or assets or expected cost reductions or other synergies expected to be realized as a result of acquiring operations or assets; |
| • | failure to integrate the operations or management of any acquired operations or assets successfully and on a timely and cost effective basis; |
| • | insufficient knowledge of the operations and markets of acquired businesses; |
| • | loss of key personnel; |
| • | diversion of management’s attention from existing operations or other priorities; |
| • | increased costs or liabilities as a result of undetected or undisclosed legal, regulatory or financial issues related to acquired operations or assets; and |
| • | inability to secure, on terms we find acceptable, sufficient financing that may be required for any such acquisition or investment. |
In addition, if we are unsuccessful in completing acquisitions of other businesses, operations or assets or if such opportunities for expansion do not arise, our business, financial condition or results of operations could be materially adversely affected.
38
Table of Contents
Index to Financial Statements
We invest significantly in growth and research and development, and to the extent our research and development investments do not translate into new solutions and services or material enhancements to our current solutions and services, or if we do not use those investments efficiently, our business and results of operations would be harmed.
A key element of our strategy is to invest significantly in our growth and research and development efforts to develop new solutions and services and enhance our existing solutions and services to address additional applications and markets. For the year ended December 31, 2020, our research and development expense was approximately 27% of our revenue. If we do not spend our research and development budget efficiently or effectively on compelling innovation and technologies, our business may be harmed and we may not realize the expected benefits of our strategy. Moreover, research and development projects can be technically challenging and expensive. The nature of these research and development cycles may cause us to experience delays between the time we incur expenses associated with research and development and the time we are able to offer compelling solutions and services and generate revenue, if any, from such investment. Additionally, anticipated client demand for an offering we are developing could decrease after the development cycle has commenced, rendering us unable to recover substantial costs associated with the development of such offering. If we expend a significant amount of resources on research and development and our efforts do not lead to the successful introduction or improvement of solutions and services that are competitive in our current or future markets, it would harm our business and results of operations.
As a global organization, our business is susceptible to risks associated with our international operations.
In addition to our U.S. operations, we currently maintain international operations in the United Kingdom and India, and have smaller sales-focused presences in France and Singapore, and have clients located around the globe. Managing a global organization outside of the United States is difficult and time-consuming and introduces risks that we may not face with our operations and sales in the United States. These risks include:
| • | the burdens of complying with a wide variety of foreign regulations, laws and legal standards, including privacy, data security, tax and employment, some of which may be materially different or more stringent than those of the United States; |
| • | regional data privacy laws that apply to the transmission of personal data across international borders; |
| • | lack of familiarity with, and unexpected changes in, foreign regulatory requirements; |
| • | clients’ unfamiliarity with and concerns regarding laws and regulations of the United States that may impact our business operations in their jurisdictions; |
| • | negative, local perception of industries and clients that we may pursue; |
| • | laws and business practices favoring local competitors; |
| • | localization of our solutions and services, including unanticipated costs related to translation into foreign languages and adaptation for local practices and regulatory requirements; |
| • | different pricing environments; |
| • | difficulties in managing and staffing international operations; |
| • | reduced or varied protection for intellectual property rights in some countries; |
| • | compliance with laws and regulations for foreign operations, including the U.S. Foreign Corrupt Practices Act (the “FCPA”), the U.K. Bribery Act, import and export control laws, tariffs, trade barriers, economic sanctions and other regulatory or contractual limitations on our ability to sell our solutions and services in certain foreign markets, and the risks and costs of compliance; |
| • | fluctuations in currency exchange rates; |
| • | potentially adverse tax consequences, including the complexities of foreign value added tax systems, difficulty in interpreting international tax laws and restrictions on the repatriation of earnings; |
39
Table of Contents
Index to Financial Statements
| • | increased financial accounting and reporting burdens and complexities; and |
| • | political, social and economic instability abroad, terrorist attacks and security concerns in general. |
Operating in international markets also requires significant management attention and financial resources. A component of our growth strategy involves the further expansion of our operations and the development of new client relationships in Europe. As we seek to expand internationally, including in Europe, we will need to develop relationships with additional partners and add internal capabilities to effectively manage the operational, financial, legal and regulatory requirements and risks associated with our international operations. The investment we make and additional resources we use to expand our operations, target new international clients, expand our presence globally within our existing clients and manage operational and sales growth in other countries may not produce desired levels of revenue or profitability, which could adversely affect our business and results of operations.
Because our employees are geographically dispersed, we are required to comply with employment-related laws and regulations both in the United States and abroad.
The nature and geographic spread of our business requires that we comply with multiple employment-related legal and regulatory regimes both in the United States and outside the United States. We are subject to the Fair Labor Standards Act, applicable foreign employment standards laws and similar state laws, which govern such matters as time keeping and payroll requirements, minimum wage, overtime, employee and worker classifications and other working conditions. While we believe we are currently in compliance with all such regimes, we may be susceptible to various employment claims and proceedings. Any legal proceedings or claims, even if baseless, fully indemnified or insured, could negatively impact our reputation among our employees, clients and the public, and make it more difficult for us to compete effectively or obtain adequate insurance in the future.
If we are unable to effectively manage certain risks and challenges related to our India operations, our business could be harmed.
Our India operations are a key factor to our success. We believe that our significant presence in India provides certain important advantages for our business, such as direct access to a large pool of skilled professionals and assistance in growing our business internationally. However, it also creates certain risks that we must effectively manage. As of June 30, 2021, 274 of our total employees were based in India. Wage costs in India for skilled professionals are currently lower than in the United States for comparably skilled professionals. However, wages in India are increasing at a faster rate than in the United States, which could result in us incurring increased costs for technical professionals and reduced margins. There is intense competition in India for skilled technical professionals, and we expect such competition to increase. As a result, we may be unable to cost-effectively retain our current employee base in India or hire additional new talent. In addition, India has experienced significant inflation, low growth in gross domestic product and shortages of foreign exchange. India also has experienced civil unrest and terrorism and has been involved in conflicts with neighboring countries. The occurrence of any of these circumstances could result in disruptions to our India operations, which, if continued for an extended period of time, could have a material adverse effect on our business. If we are unable to effectively manage any of the foregoing risks related to our India operations, our development efforts could be impaired, our growth could be slowed and our results of operations could be negatively impacted.
Our results of operations may be harmed if we are required to collect sales or other related taxes for subscriptions to our solutions and services in jurisdictions where we have not historically done so.
States and some local taxing jurisdictions have differing rules and regulations governing sales and use taxes, and these rules and regulations are subject to varying interpretations that may change over time. The application
40
Table of Contents
Index to Financial Statements
of federal, state, local and international tax laws to services provided electronically is evolving. In particular, the applicability of sales taxes to our solutions and services in various jurisdictions is unclear. We collect and remit U.S. sales tax in a number of jurisdictions. It is possible, however, that we could face sales tax audits and that our liability for these taxes could exceed our estimates as state tax authorities could successfully assert that we are obligated to collect additional tax amounts from our paying clients and remit those taxes to those authorities. We could also be subject to audits in states and international jurisdictions for which we have not accrued tax liabilities. In each case, if states are successful in such audits we may be liable for substantial amounts of past sales, use or similar taxes, interest and penalties. A successful assertion that we should be collecting additional sales or other taxes on our services in jurisdictions where we have not historically done so and do not accrue for sales taxes could result in substantial tax liabilities for past sales, discourage organizations from subscribing to our products and services, or otherwise harm our business, results of operations and financial condition.
Risks Related to Our Organizational Structure
We will be a holding company and our principal asset after completion of the Transactions and this offering will be our interest in CWAN Holdings, LLC and, accordingly, we will depend on distributions from CWAN Holdings, LLC to pay our taxes and expenses, including payments under the Tax Receivable Agreement and the TRA Bonus Agreements. CWAN Holdings, LLC’s ability to make such distributions may be subject to various limitations and restrictions.
Upon completion of this offering and the Transactions, we will be a holding company and will have no material assets other than the LLC Interests. As a holding company, we will have no independent means of generating revenue or cash flow, and our ability to pay our taxes and operating expenses, including our obligations under the Tax Receivable Agreement and the TRA Bonus Agreements, or declare and pay dividends, if any, in the future, will depend upon the results of operations and cash flows of CWAN Holdings, LLC and its consolidated subsidiaries and distributions we receive from CWAN Holdings, LLC. Our subsidiaries may not generate sufficient cash flow to distribute funds to us and applicable state law and contractual restrictions may not permit such distributions.
We anticipate that CWAN Holdings, LLC will continue to be treated as a partnership for U.S. federal income tax purposes and, as such, generally will not be subject to any entity-level U.S. federal income tax. Instead, taxable income of CWAN Holdings, LLC will be allocated to holders of the LLC Interests. Accordingly, we and our subsidiaries will be required to pay income taxes on our allocable share of any net taxable income of CWAN Holdings, LLC allocated to us under the terms of the LLC Agreement. Under the terms of the LLC Agreement, CWAN Holdings, LLC is required to make tax distributions to the holders of LLC Interests, including us, on a pro rata basis, unless certain exceptions apply. In addition to tax payments, we will incur expenses related to our operations, including obligations to make payments under the Tax Receivable Agreement and the TRA Bonus Agreements. The tax benefits we may realize as a result of our purchase of LLC Interests and any exchanges of LLC Interests and as a result of payments under the TRA Bonus Agreements, and the resulting amounts we are likely to pay out to the Continuing Equity Owners and the Blocker Shareholders pursuant to the Tax Receivable Agreement depend on various factors and are difficult to quantify with any precision; however, we estimate that such payments may be substantial. See “Certain Relationships and Related Party Transactions—Tax Receivable Agreement” and “Executive Compensation—TRA Bonus Agreements.”
We intend to cause CWAN Holdings, LLC to make cash distributions to the owners of LLC Interests in amounts sufficient to (1) fund all or part of their tax obligations in respect of taxable income allocated to them and (2) cover our operating expenses, including payments under the Tax Receivable Agreement. However, CWAN Holdings, LLC’s ability to make such distributions may be subject to various limitations and restrictions, such as restrictions on distributions that would violate either any contract or agreement to which CWAN Holdings, LLC or its subsidiaries is then a party, including debt agreements, or any applicable law, or that would have the effect of rendering CWAN Holdings, LLC or its subsidiaries insolvent. If we do not have sufficient funds to pay tax or other liabilities or to fund our operations, we may have to borrow funds, which could materially adversely affect our liquidity and financial condition and subject us to various restrictions imposed by any such lenders. To the extent that we are unable to make payments under the Tax Receivable Agreement, such
41
Table of Contents
Index to Financial Statements
payments generally will be deferred and will accrue interest until paid. Nonpayment for a specified period, however, may constitute a breach of a material obligation under the Tax Receivable Agreement and therefore accelerate payments due under the Tax Receivable Agreement, unless, generally, such nonpayment is due to a lack of sufficient funds. See “—Risks Related to This Offering and Our Class A Common Stock,” “Dividend Policy,” and “Certain Relationships and Related Party Transactions—Tax Receivable Agreement.”
Conflicts of interest could arise between our shareholders and the Continuing Equity Owners, which may impede business decisions that could benefit our shareholders.
The Continuing Equity Owners, who, upon consummation of this offering, will be the only holders of LLC Interests other than us, have the right to consent to certain amendments to the LLC Agreement, as well as to certain other matters. The Continuing Equity Owners may exercise these consent rights in a manner that conflicts with the interests of our other shareholders. Circumstances may arise in the future when the interests of the Continuing Equity Owners conflict with the interests of our other shareholders, particularly in the context of acquisitions. As we control CWAN Holdings, LLC, we have certain obligations to the Continuing Equity Owners as holders of LLC Interests that may conflict with fiduciary duties our officers and directors owe to our shareholders. These conflicts may result in decisions that are not in the best interests of our shareholders.
The Tax Receivable Agreement requires us to make cash payments to the Continuing Equity Owners and the Blocker Shareholders in respect of certain tax benefits to which we may become entitled, and we expect that the payments we will be required to make will be substantial.
In connection with the consummation of this offering, we will enter into a Tax Receivable Agreement with the Continuing Equity Owners and the Blocker Shareholders. Pursuant to the Tax Receivable Agreement, we will be required to make cash payments to the Continuing Equity Owners and the Blocker Shareholders, collectively, equal to 85% (less payments made under the TRA Bonus Agreements) of the tax benefits, if any, that we actually realize, or, in some circumstances, are deemed to realize, as a result of the Tax Attributes. We expect that the payments we will be required to make under the Tax Receivable Agreement will be substantial. Assuming no material changes in relevant tax law and that we earn sufficient taxable income to realize all tax benefits that are subject to the Tax Receivable Agreement, we expect that the tax savings associated with the Transactions or exchanges of LLC Interests as described above would aggregate to approximately $704.2 million over 15 years from the date of the completion of this offering, based on an assumed initial public offering price of $15.00 per share of Class A common stock, the midpoint of the estimated price range set forth on the cover page of this prospectus, and assuming all future redemptions or exchanges would occur on the date of this offering. Under this scenario, we would be required to pay the other parties to the Tax Receivable Agreement and under the TRA Bonus Agreements approximately 85% of such amount, or $598.6 million, over the 15-year period from the date of the completion of this offering. The actual amounts we will be required to pay may materially differ from these hypothetical amounts, because potential future tax savings that we will be deemed to realize, and the Tax Receivable Agreement payments and the TRA Bonus Agreement payments made by us, will be calculated based in part on the market value of our common stock at the time of each redemption or exchange of an LLC Interest for cash or a share of common stock and the prevailing applicable federal tax rate (plus the assumed combined state and local tax rate) applicable to us over the life of the Tax Receivable Agreement and will depend on our generating sufficient taxable income to realize the tax benefits that are subject to the Tax Receivable Agreement. See “Certain Relationships and Related Party Transactions—Tax Receivable Agreement” and “Executive Compensation—TRA Bonus Agreements.” Payments under the Tax Receivable Agreement are not conditioned on our existing owners’ continued ownership of us after this offering. See “Certain Relationships and Related Party Transactions—Tax Receivable Agreement.” Payments under the Tax Receivable Agreement will be based on the tax reporting positions that we determine, which tax reporting positions will be based on the advice of our tax advisors. Any payments made by us to the Continuing Equity Owners and the Blocker Shareholders under the Tax Receivable Agreement or to the relevant executive officers under the terms of the TRA Bonus Agreements will generally reduce the amount of overall cash flow that might have otherwise been available to us. To the extent that we are unable to make payments under the Tax Receivable Agreement or the TRA Bonus Agreements, such payments generally will be deferred and will accrue interest until paid. Nonpayment of amounts due under the Tax Receivable Agreement (but not the TRA Bonus Agreements) for a specified period,
42
Table of Contents
Index to Financial Statements
however, may constitute a breach of a material obligation under the Tax Receivable Agreement and therefore accelerate payments due under the Tax Receivable Agreement, unless, generally, such nonpayment is due to a lack of sufficient funds. Furthermore, our future obligation to make payments under the Tax Receivable Agreement and the TRA Bonus Agreements could make us a less attractive target for an acquisition, particularly in the case of an acquirer that cannot use some or all of the tax benefits that may be deemed realized under the Tax Receivable Agreement. The payments under the Tax Receivable Agreement are also not conditioned upon the Continuing Equity Owners or the Blocker Shareholders maintaining a continued ownership interest in CWAN Holdings, LLC. See “Certain Relationships and Related Party Transactions—Tax Receivable Agreement.” The actual amount and timing of any payments under the Tax Receivable Agreement and the TRA Bonus Agreements will vary depending upon a number of factors, including the timing of exchanges by the Continuing Equity Owners and the Blocker Shareholders, the amount and timing of amounts paid under the TRA Bonus Agreements, the amount of gain recognized by the Continuing Equity Owners and the Blocker Shareholders, the amount and timing of the taxable income we generate in the future and the federal tax rates then applicable.
Finally, because we are a holding company with no operations of our own, our ability to make payments under the Tax Receivable Agreement is dependent on the ability of our subsidiaries to make distributions to us.
In certain circumstances, CWAN Holdings, LLC will be required to make distributions to us and the Continuing Equity Owners and the distributions may be substantial.
CWAN Holdings, LLC is treated as a partnership for U.S. federal income tax purposes and, as such, is not subject to U.S. federal income tax. Instead, taxable income is allocated to its members, including us and the Continuing Equity Owners. We intend to cause CWAN Holdings, LLC to make tax distributions quarterly to the holders of LLC Interests (including us), in each case on a pro rata basis based on CWAN Holdings, LLC’s net taxable income, which tax distributions will be based on an assumed tax rate. Thus, CWAN Holdings, LLC will be required to make tax distributions that, in the aggregate, will likely exceed the amount of taxes that it would have paid if it were taxed on its net income at the tax rate applicable to a similarly situated corporate taxpayer. Funds used by CWAN Holdings, LLC to satisfy its tax distribution obligations will not be available for reinvestment in our business. Moreover, these tax distributions may be substantial, and will likely exceed (as a percentage of CWAN Holdings, LLC’s income) the overall effective tax rate applicable to a similarly situated corporate taxpayer. As a result, it is possible that we will receive distributions significantly in excess of our tax liabilities and obligations to make payments under the Tax Receivable Agreement. While our board may choose to distribute such cash balances as dividends on our Class A common stock, it will not be required to do so, and may in its sole discretion choose to use such excess cash for any purpose depending upon the facts and circumstances at the time of determination. See “Dividend Policy.”
The amounts that we may be required to pay to the Continuing Equity Owners and the Blocker Shareholders under the Tax Receivable Agreement and to the relevant executive officers under the TRA Bonus Agreements may be accelerated in certain circumstances and may also significantly exceed the actual tax benefits that we ultimately realize.
The Tax Receivable Agreement provides that if (1) certain mergers, asset sales, other forms of business combination or other changes of control were to occur, (2) we breach any of our material obligations under the Tax Receivable Agreement or (3) at any time, we elect an early termination of the Tax Receivable Agreement, then the Tax Receivable Agreement will terminate and our obligations, or our successor’s obligations, to make payments under the Tax Receivable Agreement and the TRA Bonus Agreements would accelerate and become immediately due and payable. The amount due and payable in that circumstance is based on certain assumptions, including an assumption that we would have sufficient taxable income to fully utilize all potential future tax benefits that are subject to the Tax Receivable Agreement. See “Certain Relationships and Related Party Transactions—Tax Receivable Agreement.” We may need to incur debt to finance payments under the Tax Receivable Agreement and the TRA Bonus Agreements to the extent our cash resources are insufficient to meet our obligations under the Tax Receivable Agreement and the TRA Bonus Agreements as a result of timing discrepancies or otherwise.
43
Table of Contents
Index to Financial Statements
As a result of a change of control, material breach or our election to terminate the Tax Receivable Agreement early, (1) we could be required to make cash payments to the Continuing Equity Owners, the Blocker Shareholders and certain executive officers that are greater than the specified percentage of the actual benefits we ultimately realize in respect of the tax benefits that are subject to the Tax Receivable Agreement and the TRA Bonus Agreements and (2) we would be required to make an immediate cash payment equal to the anticipated future tax benefits that are the subject of the Tax Receivable Agreement discounted in accordance with the Tax Receivable Agreement, which payment may be made significantly in advance of the actual realization, if any, of such future tax benefits. In these situations, our obligations under the Tax Receivable Agreement could have a substantial negative impact on our liquidity and could have the effect of delaying, deferring or preventing certain mergers, asset sales, other forms of business combination, or other changes of control. We may not be able to finance our obligations under the Tax Receivable Agreement and the TRA Bonus Agreements.
We may not be able to realize all or a portion of the tax benefits that are currently expected to result from the Tax Attributes covered by the Tax Receivable Agreement and from payments made under the Tax Receivable Agreement and the TRA Bonus Agreements.
Our ability to realize the tax benefits that we currently expect to be available as a result of the Tax Attributes, the payments made pursuant to the Tax Receivable Agreement, the payments made under the TRA Bonus Agreements and the interest deductions imputed under the Tax Receivable Agreement all depend on a number of assumptions, including that we earn sufficient taxable income each year during the period over which such deductions are available and that there are no adverse changes in applicable law or regulations. Additionally, if our actual taxable income were insufficient or there were additional adverse changes in applicable law or regulations, we may be unable to realize all or a portion of the expected tax benefits and our cash flows and shareholders’ equity could be negatively affected. See “Certain Relationships and Related Party Transactions—Tax Receivable Agreement” and “Executive Compensation—TRA Bonus Agreements.”
We will not be reimbursed for any payments made to the beneficiaries under the Tax Receivable Agreement or the TRA Bonus Agreements if any purported tax benefits are subsequently disallowed by the U.S. Internal Revenue Service (the “IRS”).
If the IRS or a state or local taxing authority challenges the tax basis adjustments and/or deductions that give rise to payments under the Tax Receivable Agreement or the TRA Bonus Agreements and the tax basis adjustments and/or deductions are subsequently disallowed, the recipients of payments under the Tax Receivable Agreement or the TRA Bonus Agreements will not reimburse us for any payments we previously made to them. Any such disallowance would be taken into account in determining future payments under the Tax Receivable Agreement or the TRA Bonus Agreements, as applicable, and may, therefore, reduce the amount of any such future payments. Nevertheless, if the claimed tax benefits from the tax basis adjustments and/or deductions are disallowed, our payments under the Tax Receivable Agreement or the TRA Bonus Agreements could exceed our actual tax savings, and we may not be able to recoup payments under the Tax Receivable Agreement and the TRA Bonus Agreements that were calculated on the assumption that the disallowed tax savings were available.
Unanticipated changes in effective tax rates or adverse outcomes resulting from examination of our income or other tax returns could adversely affect our financial condition and results of operations.
We will be subject to income taxes in the United States and foreign jurisdictions, and our domestic and foreign tax liabilities will be subject to the allocation of expenses in differing jurisdictions. Our future effective tax rates could be subject to volatility or adversely affected by a number of factors, including:
| • | changes in the valuation of our deferred tax assets and liabilities; |
| • | expected timing and amount of the release of any tax valuation allowances; |
| • | tax effects of equity-based compensation; |
| • | costs related to intercompany restructurings; |
| • | changes in tax laws, regulations or interpretations thereof; or |
| • | lower than anticipated future earnings in jurisdictions where we have lower statutory tax rates and higher than anticipated future earnings in jurisdictions where we have higher statutory tax rates. |
44
Table of Contents
Index to Financial Statements
In addition, we may be subject to audits of our income, sales and other transaction taxes by U.S. federal and state authorities. Outcomes from these audits could have an adverse effect on our results of operations and financial condition.
If we were deemed to be an investment company under the Investment Company Act of 1940, as amended (the “1940 Act”), applicable restrictions could make it impractical for us to continue our business as contemplated and could have a material adverse effect on our business, financial condition and results of operations.
Under Sections 3(a)(1)(A) and (C) of the 1940 Act, a company generally will be deemed to be an “investment company” for purposes of the 1940 Act if it (1) is, or holds itself out as being, engaged primarily, or proposes to engage primarily, in the business of investing, reinvesting or trading in securities or (2) is engaged, or proposes to engage, in the business of investing, reinvesting, owning, holding or trading in securities and it owns or proposes to acquire investment securities having a value exceeding 40% of the value of its total assets (exclusive of U.S. government securities and cash items) on an unconsolidated basis. We do not believe that we are an “investment company,” as such term is defined in either of those sections of the 1940 Act.
As the sole managing member of CWAN Holdings, LLC, we will control and manage CWAN Holdings, LLC. On that basis, we believe that our interest in CWAN Holdings, LLC is not an “investment security” under the 1940 Act. Therefore, we have less than 40% of the value of our total assets (exclusive of U.S. government securities and cash items) in “investment securities.” However, if we were to lose the right to manage and control CWAN Holdings, LLC, interests in CWAN Holdings, LLC could be deemed to be “investment securities” under the 1940 Act.
We intend to conduct our operations so that we will not be deemed to be an investment company. However, if we were deemed to be an investment company, restrictions imposed by the 1940 Act, including limitations on our capital structure and our ability to transact with affiliates, could make it impractical for us to continue our business as contemplated and could have a material adverse effect on our business, financial condition and results of operations.
Risks Related to This Offering and Our Class A Common Stock
The Principal Equity Owners will continue to have significant influence over us after this offering, including control over decisions that require the approval of stockholders, which could limit your ability to influence the outcome of matters submitted to stockholders for a vote.
We are currently controlled, and after this offering is completed will continue to be controlled, by the Principal Equity Owners. Upon completion of this offering, the Principal Equity Owners will beneficially own 97.0% of the combined voting power of all of our outstanding common stock. As long as the Principal Equity Owners collectively own or control at least a majority of our outstanding voting power, they will have the ability to exercise substantial control and significant influence over our management and affairs and all corporate actions requiring stockholder approval, irrespective of how our other stockholders may vote, including the election and removal of directors and the size of our board of directors, any amendment of our certificate of incorporation or bylaws, or the approval of any merger or other significant corporate transaction, including a sale of substantially all of our assets. See “Description of Capital Stock.” The concentration of voting power limits your ability to influence corporate matters, and as a result, we may take actions that you do not view as beneficial. As a result, the market price of our Class A common stock could be adversely affected.
In addition, immediately following the offering, the Principal Equity Owners will own 20.5% of the economic interest in CWAN Holdings, LLC. Because they hold a substantial portion of their ownership interests in our business through CWAN Holdings, LLC, these existing holders of LLC Interests may have conflicting interests with holders of our Class A common stock. For example, they may have different tax positions from us which could influence their decisions regarding whether and when to dispose of assets, and whether and when to incur new or refinance existing indebtedness, especially in light of the existence of the Tax Receivable Agreement. In addition, the structuring of future transactions may take into consideration these existing unitholders’ tax considerations even where no similar benefit would accrue to us. See “Certain Relationships and Related Party Transactions—Tax Receivable Agreement.”
45
Table of Contents
Index to Financial Statements
Certain of our stockholders will have the right to engage or invest in the same or similar businesses as us.
In the ordinary course of their business activities, the Principal Equity Owners and their respective affiliates may engage in activities where their interests conflict with our interests or those of our stockholders. Our amended and restated certificate of incorporation will provide that the Principal Equity Owners or any of their respective officers, directors, agents, stockholders, members, partners, affiliates and subsidiaries will have no duty to refrain from engaging directly or indirectly in the same or similar business activities or lines of business as us or any of our subsidiaries, even if the opportunity is one that we might reasonably have pursued or had the ability or desire to pursue if granted the opportunity to do so. No such person will be liable to us for breach of any fiduciary or other duty, as a director or officer or otherwise, by reason of the fact that such person, acting in good faith, pursues or acquires any such business opportunity, directs any such business opportunity to another person or fails to present any such business opportunity, or information regarding any such business opportunity, to us unless, in the case of any such person who is our director or officer, any such business opportunity is expressly offered to such director or officer solely in his or her capacity as our director or officer.
Following the offering, we will be classified as a “controlled company,” and as a result, we qualify for, and intend to rely on, exemptions from certain corporate governance requirements. You will not have the same protections afforded to stockholders of companies that are subject to such requirements.
After the closing of this offering, the Principal Equity Owners will continue to control a majority of our voting power. As a result, we would be a “controlled company” within the meaning of the applicable stock exchange corporate governance standards. Under the rules of NYSE, a company of which more than 50% of the outstanding voting power is held by an individual, group or another company is a “controlled company” and may elect not to comply with certain stock exchange corporate governance requirements, including:
| • | that a majority of our board of directors consist of independent directors; |
| • | that nominating and corporate governance matters be decided solely by independent directors; and |
| • | that employee and officer compensation matters be decided solely by independent directors. |
Following this offering, we intend to utilize these exemptions. As a result, we may not have a majority of independent directors, and our nominating and corporate governance and compensation functions may not be decided solely by independent directors. Accordingly, you will not have the same protections afforded to stockholders of companies that are subject to all of the stock exchange corporate governance requirements.
The requirements of being a public company may strain our resources, divert management’s attention and affect our ability to attract and retain qualified board members and officers.
As a public company, we will be subject to the reporting requirements of the Exchange Act, the listing requirements of NYSE, and other applicable securities rules and regulations. Compliance with these rules and regulations will increase our legal and financial compliance costs, make some activities more difficult, time-consuming or costly and increase demand on our systems and resources. The Exchange Act requires, among other things, that we file annual, quarterly and current reports with respect to our business and results of operations and maintain effective disclosure controls and procedures and internal control over financial reporting. To maintain and, if required, improve our disclosure controls and procedures and internal control over financial reporting to meet this standard, significant resources and management oversight may be required. As a result, management’s attention may be diverted from other business concerns, which could harm our business and results of operations. Although we have already hired additional employees in preparation for these heightened requirements, we may need to hire more employees in the future which would increase our costs and expenses.
We also expect that being a public company will make it more expensive for us to obtain director and officer liability insurance and we may have to choose between reduced coverage or substantially higher costs to obtain coverage. These factors could make it more difficult for us to attract and retain qualified executive officers and members of our board of directors, particularly to serve on our audit committee and compensation committee.
46
Table of Contents
Index to Financial Statements
An active, liquid trading market for our Class A common stock may not develop.
Prior to this offering, there has not been a public market for our Class A common stock. Although we will list our Class A common stock on NYSE, we cannot predict whether an active public market for our Class A common stock will develop or be sustained after this offering. If an active and liquid trading market does not develop, you may have difficulty selling or may not be able to sell any of the shares of our Class A common stock that you purchase.
The price of our Class A common stock may decline or may be subject to significant volatility after this offering.
The market price of our Class A common stock could be subject to significant fluctuations after this offering. The price of our Class A common stock may change in response to fluctuations in our results of operations in future periods and also may change in response to other factors, including factors specific to companies in our industry, many of which are beyond our control. As a result, our stock price may experience significant volatility and may not necessarily reflect our performance. Among other factors that could affect our stock price are:
| • | changes in laws or regulations applicable to our industry or offerings; |
| • | speculation about our business in the press or the investment community; |
| • | price and volume fluctuations in the overall stock market; |
| • | volatility in the market price and trading volume of companies in our industry or companies that investors consider comparable; |
| • | stock price and volume fluctuations attributable to inconsistent trading levels of our shares; |
| • | our ability to protect our intellectual property and other proprietary rights and to operate our business without infringing, misappropriating or otherwise violating the intellectual property and other proprietary rights of others; |
| • | sales of our Class A common stock by us or our significant stockholders, officers and directors; |
| • | redemptions and exchanges by certain of the Continuing Equity Owners of their LLC Interests into shares of Class A common stock; |
| • | the expiration of contractual lock-up agreements; |
| • | the development and sustainability of an active trading market for our Class A common stock; |
| • | success of competitive products or services; |
| • | the public’s response to press releases or other public announcements by us or others, including our filings with the SEC, announcements relating to litigation or significant changes to our key personnel; |
| • | the effectiveness of our internal controls over financial reporting; |
| • | changes in our capital structure, such as future issuances of debt or equity securities; |
| • | our entry into new markets; |
| • | tax developments in the United States, Europe or other markets; |
| • | strategic actions by us or our competitors, such as acquisitions or restructurings; and |
| • | changes in accounting principles. |
Further, the stock markets have experienced extreme price and volume fluctuations that have affected and continue to affect the market prices of equity securities of many companies. These fluctuations often have been unrelated or disproportionate to the operating performance of those companies. In addition, the stock prices of
47
Table of Contents
Index to Financial Statements
many technology companies have experienced wide fluctuations that have often been unrelated to the operating performance of those companies. These broad market and industry fluctuations, as well as general economic, political and market conditions such as recessions, interest rate changes or international currency fluctuations, may cause the market price of our Class A common stock to decline.
You may not be able to resell any of your shares of our Class A common stock at or above the initial public offering price. The initial public offering price will be determined by negotiations between us and the representatives of the underwriters and may not be indicative of prices that will prevail in the trading market, if a trading market develops, after this offering. If the market price of our Class A common stock after this offering does not exceed the initial public offering price, you may not realize any return on your investment and may lose some or all of your investment.
We cannot predict the effect our multiple class structure may have on the trading market for our Class A common stock.
We cannot predict whether our multiple class structure will result in a lower or more volatile market price of our Class A common stock or other adverse consequences. For example, certain index providers have announced restrictions on including companies with multiple class share structures in certain of their indexes. S&P, Dow Jones and FTSE Russell have each announced changes to their eligibility criteria for inclusion of shares of public companies on certain indices, including the S&P 500. These changes exclude companies with multiple classes of shares of common stock or ordinary shares from being added to these indices. Furthermore, other stock indices may take a similar approach to S&P, Dow Jones or FTSE Russell in the future. Exclusion from indices could make our Class A common stock less attractive to investors, and as a result, the market price of our Class A common stock could be adversely affected.
If you purchase shares of our Class A common stock sold in this offering, you will incur immediate and substantial dilution.
If you purchase shares of our Class A common stock in this offering, you will incur immediate and substantial dilution in the amount of $14.68 per share because the initial public offering price will be substantially higher than the pro forma net tangible book value per share of our outstanding Class A common stock. This dilution would result because our earlier investors paid substantially less than the initial public offering price when they purchased their shares. In addition, you may also experience additional dilution upon future equity issuances, the exercise of stock options to purchase Class A common stock granted to our employees and directors under our stock option and equity incentive plans. See “Dilution.”
As an emerging growth company within the meaning of the Securities Act of 1933, as amended (the “Securities Act”), we may utilize certain modified disclosure requirements, and we cannot be certain if these reduced requirements will make our Class A common stock less attractive to investors.
We are an emerging growth company, and for as long as we continue to be an emerging growth company, we intend to take advantage of exemptions from various reporting requirements applicable to other public companies but not to “emerging growth companies,” including not being required to have our independent registered public accounting firm audit our internal control over financial reporting under Section 404 of the Sarbanes-Oxley Act, reduced disclosure obligations regarding executive compensation in our periodic reports and proxy statements, and exemptions from the requirements of holding a nonbinding advisory vote on executive compensation and stockholder approval of any golden parachute compensation not previously approved. We have in this prospectus utilized, and we may in future filings with the SEC continue to utilize, the modified disclosure requirements available to emerging growth companies. As a result, our stockholders may not have access to certain information they may deem important.
48
Table of Contents
Index to Financial Statements
In addition, Section 107 of the JOBS Act also provides that an emerging growth company can utilize the extended transition period provided in Section 7(a)(2)(B) of the Securities Act for complying with new or revised accounting standards. Thus, an emerging growth company can delay the adoption of certain accounting standards until those standards would otherwise apply to private companies. We have elected to not “opt out” of this exemption from complying with new or revised accounting standards, and therefore, we are permitted to adopt new or revised accounting standards at the time private companies adopt the new or revised accounting standard and are permitted to do so until such time that we either (i) irrevocably elect to “opt out” of such extended transition period or (ii) no longer qualify as an emerging growth company.
Following this offering, we could remain an emerging growth company until the earliest to occur of (i) the last day of the fiscal year in which we have total annual gross revenues of $1.07 billion or more; (ii) the last day of our fiscal year following the fifth anniversary of the date of the completion of this offering; (iii) the date on which we have, during the previous three-year period, issued more than $1 billion in non-convertible debt; and (iv) the date on which we are deemed to be a “large accelerated filer” under the rules of the SEC.
A credit ratings downgrade or other negative action by a credit rating organization could adversely affect the trading price of the shares of our Class A common stock.
Credit rating agencies continually revise their ratings for companies they follow. The condition of the financial and credit markets and prevailing interest rates have fluctuated in the past and are likely to fluctuate in the future. In addition, developments in our business and operations could lead to a ratings downgrade for us or our subsidiaries. Any such fluctuation in our or our subsidiaries’ ratings may impact our ability to access debt markets in the future or increase our cost of future debt, which could have a material adverse effect on our operations and financial condition, which in return may adversely affect the trading price of shares of our Class A common stock.
Provisions in our certificate of incorporation and bylaws, to be adopted upon the consummation of this offering, may have the effect of delaying or preventing a change of control or changes in our management.
Our certificate of incorporation and bylaws will contain provisions that could depress the trading price of our Class A common stock by discouraging, delaying or preventing a change of control of our Company or changes in our management that the stockholders of our Company may believe advantageous. These provisions include:
| • | provide for a multi-class common stock structure in which each share of our Class C common stock and each share of our Class D common stock entitles its holder to ten votes per share on all matters presented to our stockholders generally; |
| • | authorizing “blank check” preferred stock that our board of directors could issue to increase the number of outstanding shares to discourage a takeover attempt; |
| • | providing for a classified board of directors with staggered three-year terms, which could delay the ability of stockholders to change the membership of a majority of our board of directors; |
| • | not providing for cumulative voting in the election of directors, which limits the ability of minority stockholders to elect director candidates; |
| • | limiting the ability of stockholders to call a special stockholder meeting; |
| • | prohibiting stockholders from acting by written consent from and after the date on which Welsh Carson, Warburg Pincus and Permira and their affiliates, collectively or singly, cease to beneficially own shares of our common stock representing at least 50% of the voting power of our common stock (the “Trigger Event”); |
| • | establishing advance notice requirements for nominations for election to our board of directors or for proposing matters that can be acted upon by stockholders at stockholder meetings; |
49
Table of Contents
Index to Financial Statements
| • | from and after the Trigger Event, the removal of directors only for cause and only upon the affirmative vote of the holders of at least 66 2/3% in voting power of all the then-outstanding shares of common stock of the Company entitled to vote thereon; |
| • | providing that our board of directors is expressly authorized to amend, alter, rescind or repeal our bylaws; and |
| • | from and after the Trigger Event, requiring the affirmative vote of holders of at least 66 2/3% of the voting power of all of the then-outstanding shares of our common stock to amend provisions of our certificate of incorporation relating to the management of our business, our board of directors, stockholder action by written consent, calling special meetings of stockholders, competition and corporate opportunities, Section 203 of the Delaware General Corporation Law (the “DGCL”), forum selection and the liability of our directors, or to amend, alter, rescind or repeal our bylaws. |
Our certificate of incorporation will also provide that the Court of Chancery of the State of Delaware will be the exclusive forum for substantially all disputes between us and our stockholders, which could limit our stockholders’ ability to obtain a favorable judicial forum for disputes with us or our directors, officers or employees.
Our certificate of incorporation will provide that, unless we consent in writing to the selection of an alternate forum, the Court of Chancery of the State of Delaware will, to the fullest extent permitted by applicable law, be the exclusive forum for any derivative action or proceeding brought on our behalf; any action asserting a breach of fiduciary duty; any action asserting a claim against us arising pursuant to the DGCL, our certificate of incorporation or our bylaws; any action to interpret, apply, enforce or determine the validity of our certificate of incorporation or our bylaws; any action asserting a claim against us that is governed by the internal affairs doctrine; or any action asserting an “internal corporate claim” as defined in Section 115 of the DGCL. The choice of forum provision may limit a stockholder’s ability to bring a claim in a judicial forum that it finds favorable for disputes with us or our directors, officers or other employees, which may discourage such lawsuits against us and our directors, officers and other employees. Alternatively, if a court finds the choice of forum provision contained in our certificate of incorporation to be inapplicable or unenforceable in an action, we may incur additional costs associated with resolving such action in other jurisdictions, which could materially and adversely affect our business, financial condition and results of operations.
Section 27 of the Exchange Act creates exclusive federal jurisdiction over all suits brought to enforce any duty or liability created by the Exchange Act or the rules and regulations thereunder. In addition, Section 22 of the Securities Act creates concurrent jurisdiction for federal and state courts over all suits brought to enforce any duty or liability created by the Securities Act or the rules and regulations thereunder. To prevent having to litigate claims in multiple jurisdictions and the threat of inconsistent or contrary rulings by different courts, among other considerations, our certificate of incorporation will provide that, unless we consent in writing to the selection of an alternate forum, the federal district court for the District of Delaware will be the exclusive forum for the resolution of any complaint asserting a cause of action arising under the Securities Act. We note that there is uncertainty as to whether a court would enforce the choice of forum provision with respect to claims under the federal securities laws, and that investors cannot waive compliance with the Securities Act and the rules and regulations thereunder.
We do not intend to pay any cash distributions or dividends on our Class A common stock in the foreseeable future.
We currently do not anticipate paying any cash dividends on our Class A common stock after this offering or for the foreseeable future. Instead, we anticipate that all of our available funds and earnings in the foreseeable future will be used to repay indebtedness, for working capital, to support our operations and to finance the growth and development of our business. Any future determination relating to dividend policy will be made at the discretion of our board of directors and will depend on a number of factors, including restrictions in our and
50
Table of Contents
Index to Financial Statements
our subsidiaries’ current and future debt instruments, our future earnings, capital requirements, financial condition and prospects, and applicable Delaware law, which provides that dividends are only payable out of surplus or current net profits. Holders of our Class B common stock and Class C common stock are not entitled to participate in any dividends declared by our board of directors. Furthermore, because we are a holding company, our ability to pay cash dividends on our Class A common stock depends on our receipt of cash distributions from CWAN Holdings, LLC and, through CWAN Holdings, LLC, cash distributions and dividends from our other direct and indirect subsidiaries. See “Dividend Policy.”
Our indebtedness could adversely affect our financial flexibility and our competitive position.
As of June 30, 2021, the Existing Credit Agreement had $432.7 million of term loans. We intend to use a portion of the net proceeds from this offering to repay outstanding borrowings under the Existing Credit Agreement and, in connection with this offering, expect to enter into the New Credit Agreement. Our level of indebtedness increases the risk that we may be unable to generate cash sufficient to pay amounts due in respect of our indebtedness. Our indebtedness could have other important consequences to you and significant effects on our business. For example, it could:
| • | increase our vulnerability to adverse changes in general economic, industry and competitive conditions; |
| • | require us to dedicate a substantial portion of our cash flow from operations to make payments on our indebtedness, thereby reducing the availability of our cash flow to fund working capital, capital expenditures and other general corporate purposes; |
| • | limit our flexibility in planning for, or reacting to, changes in our business and the industry in which we operate; |
| • | restrict us from exploiting business opportunities; |
| • | make it more difficult to satisfy our financial obligations, including payments on our indebtedness; |
| • | place us at a disadvantage compared to our competitors that have less debt; and |
| • | limit our ability to borrow additional funds for working capital, capital expenditures, acquisitions, debt service requirements, execution of our business strategy or other general corporate purposes. |
In addition, the New Credit Agreement is expected to contain, and the agreements evidencing or governing any other future indebtedness may contain, restrictive covenants that will limit our ability to engage in activities that may be in our long-term best interests. Our failure to comply with those covenants could result in an event of default that, if not cured or waived, could result in the acceleration of all of our indebtedness. See “Description of Certain Indebtedness.”
The phase-out, replacement or unavailability of LIBOR and/or other interest rate benchmarks could adversely affect our indebtedness.
The interest rates applicable to the Existing Credit Agreement and expected to be applicable to the New Credit Agreement are based on, and the interest rates applicable to certain debt obligations we may incur in the future may be based on, a fluctuating rate of interest determined by reference to the London Interbank Offered Rate (“LIBOR”). In July 2017, the U.K.’s Financial Conduct Authority, which regulates LIBOR, announced that it intends to stop persuading or compelling banks to submit rates for the calculation of LIBOR after 2021. In response to concerns regarding the future of LIBOR, the Board of Governors of the Federal Reserve System and the Federal Reserve Bank of New York convened the Alternative Reference Rates Committee (the “ARRC”) to identify alternatives to LIBOR. The ARRC has recommended a benchmark replacement waterfall to assist issuers in continued capital market entry while safeguarding against LIBOR’s discontinuation. The initial steps in the ARRC’s recommended provision reference variations of the Secured Overnight Financing Rate (“SOFR”),
51
Table of Contents
Index to Financial Statements
calculated using short-term repurchase agreements backed by Treasury securities. At this time, it is not possible to predict whether SOFR will attain market traction as a LIBOR replacement. Additionally, it is uncertain if LIBOR will cease to exist after calendar year 2021, or whether additional reforms to LIBOR may be enacted, or whether alternative reference rates will gain market acceptance as a replacement for LIBOR. In anticipation of LIBOR’s phase-out, the New Credit Agreement is expected to provide for alternative base rates, as well as a transition mechanism for selecting a benchmark replacement rate for LIBOR, with such benchmark replacement rate to be mutually agreed with the administrative agent and subject to the majority lenders not objecting to such benchmark replacement.
There can be no assurance that we will be able to reach any agreement on a replacement benchmark, and there can be no assurance that any agreement we reach will result in effective interest rates at least as favorable to us as our current effective interest rates. The failure to reach an agreement on a replacement benchmark, or the failure to reach an agreement that results in an effective interest rate at least as favorable to us as our current effective interest rates, could result in a significant increase in our debt service obligations, which could adversely affect our financial condition and results of operations. In addition, the overall financing market may be disrupted as a result of the phase-out or replacement of LIBOR, which could have an adverse impact on our ability to refinance, reprice or amend the New Credit Agreement or incur additional indebtedness, on favorable terms or at all.
Our indebtedness may restrict our current and future operations, which could adversely affect our ability to respond to changes in our business and to manage our operations.
The New Credit Agreement is expected to contain, and the agreements evidencing or governing any other future indebtedness may contain, financial restrictions on us and our restricted subsidiaries, including restrictions on our or our restricted subsidiaries’ ability to, among other things:
| • | place liens on our or our restricted subsidiaries’ assets; |
| • | make investments other than permitted investments; |
| • | incur additional indebtedness; |
| • | prepay or redeem certain indebtedness; |
| • | merge, consolidate or dissolve; |
| • | sell assets; |
| • | engage in transactions with affiliates; |
| • | change the nature of our business; |
| • | change our or our subsidiaries’ fiscal year or organizational documents; and |
| • | make restricted payments. |
In addition, we expect to be required to maintain compliance with various financial ratios in the New Credit Agreement. A failure by us or our subsidiaries to comply with the covenants or to maintain the required financial ratios contained in the New Credit Agreement could result in an event of default under such indebtedness, which could adversely affect our ability to respond to changes in our business and manage our operations. Additionally, a default by us under the New Credit Agreement or an agreement governing any other future indebtedness may trigger cross-defaults under any other future agreements governing our indebtedness. Upon the occurrence of an event of default or cross-default under any of the present or future agreements governing our indebtedness, the lenders could elect to declare all amounts outstanding to be due and payable and exercise other remedies as set forth in the agreements. If any of our indebtedness is accelerated, there can be no assurance that our assets will be sufficient to repay this indebtedness in full, which could have a material adverse effect on our ability to continue to operate as a going concern. See “Description of Certain Indebtedness.”
52
Table of Contents
Index to Financial Statements
We may not be able to raise additional capital to execute our current or future business strategies on favorable terms, if at all, or without dilution to our stockholders.
We expect that we may need to raise additional capital to execute our current or future business strategies. However, we do not know what forms of financing, if any, will be available to us. Some financing activities in which we may engage could cause your equity interest in the Company to be diluted, which could cause the value of our Class A common stock to decrease. If financing is not available on acceptable terms, if and when needed, our ability to fund our operations, expand our research and development and sales and marketing functions, develop and enhance our solutions and services, respond to unanticipated events, including unanticipated opportunities, or otherwise respond to competitive pressures would be significantly limited. In any such event, our business, financial condition and results of operations could be materially harmed, and we may be unable to continue our operations.
The price of our Class A common stock could decline if securities analysts do not publish research or if securities analysts or other third parties publish inaccurate or unfavorable research about us.
The trading of our Class A common stock is likely to be influenced by the reports and research that industry or securities analysts publish about us, our business, our market or our competitors. We do not currently have and may never obtain research coverage by securities or industry analysts. If no securities or industry analysts commence coverage of our Company, the trading price for our Class A common stock would be negatively affected. If we obtain securities or industry analyst coverage but one or more analysts downgrade our Class A common stock or publish inaccurate or unfavorable research about our business, our stock price would likely decline. If one or more securities or industry analysts ceases to cover the Company or fails to regularly publish reports on us, we could lose visibility in the financial markets, which in turn could cause our stock price or trading volume to decline.
Future sales of our Class A common stock, or the perception that such sales may occur, could depress our Class A common stock price.
Sales of a substantial number of shares of our Class A common stock in the public market following this offering, or the perception that such sales may occur, could depress the market price of our Class A common stock. Issuing additional shares of our Class A common stock or other equity securities or securities convertible into equity may dilute the economic and voting rights of our existing stockholders or reduce the market price of our Class A common stock or both. Issuing additional shares of our Class B common stock and Class C common stock, as applicable, when issued with corresponding LLC Interests, may also dilute the economic and voting rights of our existing stockholders or reduce the market price of our Class A common stock or both. Additionally, further issuances of our Class D common stock, which is convertible into shares of our Class A common stock, may also dilute the economic and voting rights of our existing stockholders. See “Description of Capital Stock.”
Our executive officers and directors and holders of substantially all of our common stock have agreed with the underwriters not to offer, sell, dispose of or hedge any shares of our Class A common stock or any options to purchase any shares of our Class A common stock, or securities convertible into, exchangeable for, or that represent the right to receive, shares of our Class A common stock, subject to specified limited exceptions described elsewhere in this prospectus, during the period ending 180 days after the date of the final prospectus, (the “Lock-Up Period”) except with the prior written consent of the representatives of the underwriters. As further described in the section titled “Underwriting,” if (i) at least 120 days have elapsed from the date of this prospectus and (ii) the Lock-Up Period is scheduled to expire during a broadly applicable and regularly scheduled period during which trading in the Company’s securities would not be permitted under the Company’s insider trading policy (“Blackout Period”) or within five trading days prior to a Blackout Period, the Lock-Up Period will end on the 10th trading date prior to commencement of the Blackout Period. The lock-up agreements define “trading day” as a day on which the New York Stock Exchange and the Nasdaq Stock Market are open for the buying and selling of securities. Our certificate of incorporation, as expected to be in effect upon the completion of this offering, will authorize us to issue up to 1,500,000,000 shares of Class A common stock, of which 42,866,089 shares of Class A common stock will be outstanding and 1,457,133,911 will be available for issuance, of which 188,612,452 will be available for issuance upon the exchange of outstanding LLC Interests,
53
Table of Contents
Index to Financial Statements
together with an equal number of shares of Class B common stock or Class C common stock, as the case may be, and the conversion of outstanding shares of Class D common stock immediately following the closing of this offering. All shares of our common stock held by the Continuing Equity Owners will be subject to the lock-up agreements described under “Shares Eligible for Future Sale” and “Underwriting.” Shares of our common stock held by our affiliates will continue to be subject to the volume and other restrictions of Rule 144 under the Securities Act. The representatives of the underwriters may, in their sole discretion and at any time, release all or any portion of the shares subject to the lock-up. See “Underwriting.”
Upon the completion of this offering, the holders of an aggregate of 177,461,343 shares of our Class A common stock (on an as-converted basis) or their transferees will be entitled to rights with respect to the registration of their shares under the Securities Act. In addition, immediately following this offering, we intend to file a registration statement registering under the Securities Act the shares of Class A common stock reserved for issuance under the 2021 Plan. See the information under the heading “Shares Eligible for Future Sale” for a more detailed description of the shares that will be available for future sales upon completion of this offering. Sales of our Class A common stock pursuant to these registration rights or this registration statement may make it more difficult for us to sell equity securities in the future at a time and at a price that we deem appropriate. These sales also could cause our stock price to fall and make it more difficult for you to sell shares of our Class A common stock.
An aggregate of approximately 33.3 million shares of our Class D common stock that are beneficially owned by affiliates of Warburg Pincus are pledged to secure obligations of affiliates of Warburg Pincus under a loan agreement with Wells Fargo Bank, National Association, an affiliate of one of the underwriters in this offering. In the case of nonpayment at maturity or another event of default (including but not limited to the borrower’s inability to satisfy certain mandatory prepayments which are triggered off the value of such shares), Wells Fargo Bank, National Association or any transferee (in the event that Wells Fargo Bank, National Association had assigned or otherwise transferred its rights under the pledge to a non-affiliate) may exercise its rights under the applicable loan agreements to foreclose on and sell shares pledged to cover the amount due under the loan, provided that no sales of the pledged shares may be made to third parties until 180 days after the date of this prospectus. Any transfers or sales of such pledged shares may cause the price of our Class A common stock to decline.
If we fail to implement and maintain effective internal controls over financial reporting, we may be unable to accurately or timely report our financial condition or results of operations, which may adversely affect our business.
Our management has not completed an assessment of the effectiveness of our internal control over financial reporting, and our independent registered public accounting firm has not conducted an audit of our internal control over financial reporting. Evaluation by us of our internal control over financial reporting may identify material weaknesses. The identification of a material weakness in our internal control over financial reporting or the failure to remediate existing material weaknesses in our internal control over financial reporting may cause us to be unable to report our financial information on a timely basis and thereby subject us to adverse regulatory consequences, including sanctions by the SEC or violations of NYSE rules. There also could be a negative reaction in the financial markets due to a loss of investor confidence in us and the reliability of our financial statements. This could have a material adverse effect on our business, financial condition and results of operations and could also lead to a decline in the price of our Class A common stock.
We are not currently required to comply with the SEC’s rules implementing Section 404 of the Sarbanes-Oxley Act and are therefore not required to make a formal assessment of the effectiveness of our internal control over financial reporting for that purpose. Upon becoming a public company, we will be required to comply with the SEC’s rules implementing Sections 302 and 404 of the Sarbanes-Oxley Act, which will require our management to certify financial and other information in our quarterly and annual reports and provide an annual management report on the effectiveness of our internal control over financial reporting. To comply with the requirements of being a public company, we will need to implement additional internal controls, reporting systems and procedures and hire additional accounting, finance and legal staff. For as long as we are an “emerging growth company” under the JOBS Act, our independent registered public accounting firm will not be
54
Table of Contents
Index to Financial Statements
required to attest to the effectiveness of our internal control over financial reporting pursuant to Section 404. We could be an “emerging growth company” for up to five years. An independent assessment of the effectiveness of our internal control over financial reporting could detect problems that our management’s assessment might not. Undetected material weaknesses in our internal control over financial reporting could lead to financial statement restatements and require us to incur the expense of remediation. Ensuring that we have adequate internal financial and accounting controls and procedures in place so that we can produce accurate financial statements on a timely basis is a costly and time-consuming effort that will need to be evaluated frequently.
55
Table of Contents
Index to Financial Statements
CAUTIONARY NOTE REGARDING FORWARD-LOOKING STATEMENTS
This prospectus contains forward-looking statements that are based on our management’s beliefs and assumptions and on information currently available to our management. The forward-looking statements are contained principally in the sections captioned “Prospectus Summary,” “Risk Factors,” “Management’s Discussion and Analysis of Financial Condition and Results of Operations” and “Business.” Forward-looking statements include information concerning our possible or assumed future results of operations, business strategies, technology developments, financing and investment plans, dividend policy, competitive position, industry and regulatory environment, potential growth opportunities and the effects of competition. Forward-looking statements include statements that are not historical facts and can be identified by terms such as “anticipate,” “believe,” “could,” “estimate,” “expect,” “intend,” “may,” “plan,” “potential,” “predict,” “project,” “seek,” “should,” “will,” “would” or similar expressions and the negatives of those terms.
Forward-looking statements involve known and unknown risks, uncertainties and other factors that may cause our actual results, performance or achievements to be materially different from any future results, performance or achievements expressed or implied by the forward-looking statements. Given these uncertainties, you should not place undue reliance on forward-looking statements. Also, forward-looking statements represent our management’s beliefs and assumptions only as of the date of this prospectus. You should read this prospectus and the documents that we have filed as exhibits to the registration statement, of which this prospectus is a part, completely and with the understanding that our actual future results may be materially different from what we expect.
Important factors that could cause actual results, performance or achievements to differ materially from our expectations include the following:
| • | we operate in a highly competitive industry, with many companies competing for business from insurance companies, asset managers, corporations and government entities on the basis of a number of factors, including the quality and breadth of solutions and services provided, ability to innovate, reputation and the prices of services, and this competition could hurt our financial performance; |
| • | we have experienced rapid revenue growth over the past several years, which may be difficult to sustain, and we depend on attracting and retaining top talent to continue growing and operating our business, and if we are unable to hire, integrate, develop, motivate and retain our personnel, we may not be able to maintain or manage our growth, which could have a material adverse effect on our business, financial condition or results of operations; |
| • | if our investment accounting and reporting solutions, regulatory reporting solutions or risk management or performance analytics solutions fail to perform properly due to undetected errors or similar problems, our business, financial condition, reputation or results of operations could be materially adversely affected; |
| • | our business relies heavily on computer equipment, cloud-based services, electronic delivery systems, networks and telecommunications systems and infrastructure, the Internet and the information technology systems of third parties. Any failures or disruptions in any of the foregoing could result in reduced revenues, increased costs and the loss of clients and could harm our business, financial condition, reputation and results of operations; |
| • | if we are unable to protect the confidentiality of our trade secrets, our business and competitive position would be harmed; |
| • | if our trademarks and trade names are not adequately protected, we may not be able to build name recognition in our markets of interest, and our competitive position may be harmed; |
| • | we may need to defend ourselves against third-party claims that we are infringing, misappropriating or otherwise violating others’ intellectual property rights, which could divert management’s attention, cause us to incur significant costs, and prevent us from selling or using the technology to which such rights relate; |
56
Table of Contents
Index to Financial Statements
| • | the Principal Equity Owners will continue to have significant influence over us after this offering, including control over decisions that require the approval of stockholders, which could limit your ability to influence the outcome of matters submitted to stockholders for a vote; |
| • | following the offering, we will be classified as a “controlled company,” and as a result, we will qualify for, and intend to rely on, exemptions from certain corporate governance requirements. You will not have the same protections afforded to stockholders of companies that are subject to such requirements. In addition, the Principal Equity Owners’ interests may conflict with our interests and the interests of other stockholders; |
| • | the requirements of being a public company may strain our resources, divert management’s attention and affect our ability to attract and retain qualified board members and officers; and |
| • | provisions in our certificate of incorporation and bylaws, to be adopted upon the consummation of this offering, may have the effect of delaying or preventing a change of control or changes in our management. |
Except as required by law, we assume no obligation to update these forward-looking statements, or to update the reasons actual results could differ materially from those anticipated in these forward-looking statements, even if new information becomes available in the future.
57
Table of Contents
Index to Financial Statements
We estimate, based upon an assumed initial public offering price of $15.00 per share (which is the midpoint of the estimated price range set forth on the cover page of this prospectus), that we will receive net proceeds from this offering of approximately $412.4 million (or $475.7 million if the underwriters exercise in full their option to purchase additional shares of Class A common stock), after deducting the underwriting discounts and commissions and estimated offering expenses payable by us.
Clearwater Analytics Holdings, Inc. intends to use the net proceeds from this offering, together with the proceeds from the New Term Loan, to (i) purchase 30,000,000 LLC Interests (or 34,500,000 LLC Interests if the underwriters exercise in full their option to purchase additional shares of Class A common stock) from CWAN Holdings, LLC at a price per unit equal to the initial public offering price per share of Class A common stock in this offering less the underwriting discounts and commissions and (ii) repay approximately $432.7 million of outstanding borrowings under the Existing Credit Agreement and pay any associated prepayment penalties and accrued and unpaid interest to the date of repayment. We intend to use remaining proceeds, if any, for general corporate purposes to support the growth of the business. The contract interest rate on the indebtedness that we intend to repay was 7.25% annually as of June 30, 2021, and the maturity date is October 31, 2025.
Each $1.00 increase (decrease) in the assumed initial public offering price of $15.00 per share (which is the midpoint of the estimated price range set forth on the cover page of this prospectus) would increase (decrease) the net proceeds to us from this offering by approximately $28.1 million and, in turn, the net proceeds received by CWAN Holdings, LLC from the sale of LLC Interests to Clearwater Analytics Holdings, Inc. by $28.1 million, assuming the number of shares offered, as set forth on the cover page of this prospectus, remains the same, and after deducting the underwriting discounts and commissions and estimated offering expenses payable by us.
Each 1,000,000 share increase (decrease) in the number of shares offered by us in this offering would increase (decrease) the net proceeds to us from this offering and, in turn, the net proceeds received by CWAN Holdings, LLC from the sale of LLC Interests to Clearwater Analytics Holdings, Inc., by approximately $14.1 million, assuming that the price per share for the offering remains at $15.00 (which is the midpoint of the estimated price range set forth on the cover page of this prospectus), and after deducting the underwriting discounts and commissions and estimated offering expenses payable by us.
58
Table of Contents
Index to Financial Statements
Clearwater Analytics Holdings, Inc., a Delaware corporation, was formed on May 18, 2021 and is the issuer of the Class A common stock offered by this prospectus. Prior to this offering and the Transactions (as defined below), all of our business operations have been conducted through Carbon Analytics Holdings, LLC, which changed its name to CWAN Holdings, LLC in connection with this offering, and its direct and indirect subsidiaries. The Continuing Equity Owners are the only owners of CWAN Holdings, LLC. We will consummate the Transactions, excluding this offering, substantially concurrently with or prior to the consummation of this offering.
Existing Organization
CWAN Holdings, LLC is treated as a partnership for U.S. federal income tax purposes and, as such, is generally not subject to any U.S. federal entity-level income taxes. Taxable income or loss of CWAN Holdings, LLC is included in the U.S. federal income tax returns of CWAN Holdings, LLC’s members.
Transactions
We will consummate the following organizational transactions prior to or in connection with this offering:
| • | we will amend and restate the existing limited liability company agreement of CWAN Holdings, LLC, which will become effective substantially concurrently with or prior to the consummation of this offering, to, among other things, (1) recapitalize all existing ownership interests in CWAN Holdings, LLC into one class of LLC Interests, (2) appoint Clearwater Analytics Holdings, Inc. as the sole managing member of CWAN Holdings, LLC, (3) for strategic business and tax reasons, including to provide liquidity for certain holders of LLC Interests, provide that the Other Continuing Equity Owners are entitled to exchange LLC Interests, together with an equal number of shares of Class B common stock, for shares of Class A common stock on a one-for-one basis or, at our election, for an amount in cash representing the fair market value of shares of Class A common stock net of any underwriters’ discounts, commissions and brokers’ fees that would be payable in connection with a registered offering of such shares as calculated in accordance with the LLC Agreement and (4) for strategic business and tax reasons, including to provide liquidity for certain holders of LLC Interests, provide that Principal Equity Owners are entitled to exchange LLC Interests, together with an equal number of shares of Class C common stock, for shares of Class D common stock on a one-for-one basis or, at our election, for an amount in cash representing the fair market value of shares of Class A common stock net of any underwriters’ discounts, commissions and brokers’ fees that would be payable in connection with a registered offering of such shares as calculated in accordance with the LLC Agreement. The holders of Class B common stock and Class C common stock will have no economic interests in Clearwater Analytics Holdings, Inc. (where “economic interests” means the right to receive any dividends or distributions, whether cash or stock, in connection with common stock). Each share of our Class C common stock and Class D common stock will automatically convert into a share of our Class B common stock and our Class A common stock, respectively, upon the earlier of (i) the date that affiliates of Welsh Carson own less than 5% of our common stock and (ii) the date that is seven years following the closing of our initial public offering. The attributes of our classes of common stock are summarized in the following table. For more information, see “Certain Relationships and Related Party Transactions—LLC Agreement.” |
| Class of Common Stock |
Votes per Share | Economic Rights | ||||||
| Class A common stock |
1 | Yes | ||||||
| Class B common stock |
1 | No | ||||||
| Class C common stock |
10 | No | ||||||
| Class D common stock |
10 | Yes | ||||||
| • | we will amend and restate Clearwater Analytics Holdings, Inc.’s certificate of incorporation as described in “Description of Capital Stock”; |
| • | we will effectuate the Blocker Mergers, with Clearwater Analytics Holdings, Inc. remaining as the surviving corporation, and will (1) issue to the Blocker Shareholders 12,866,089 shares of our Class A |
59
Table of Contents
Index to Financial Statements
| common stock and 130,083,755 shares of our Class D common stock, as the case may be, in exchange for all of the Blocker Shareholders’ equity interests in the Blocker Entities, which indirectly includes their LLC Interests, and (2) enter into the Tax Receivable Agreement with the Blocker Shareholders, each as consideration for the Blocker Mergers; |
| • | we will issue 11,151,110 shares of our Class B common stock to the Other Continuing Equity Owners, which is equal to the number of LLC Interests held by such Other Continuing Equity Owners; |
| • | we will issue 47,377,587 shares of our Class C common stock to the Principal Equity Owners, which is equal to the number of LLC Interests held by such Principal Equity Owners; |
| • | we will issue 30,000,000 shares of our Class A common stock to the purchasers in this offering (or 34,500,000 shares if the underwriters exercise in full their option to purchase additional shares of Class A common stock) in exchange for net proceeds of approximately $412.4 million (or approximately $475.7 million if the underwriters exercise in full their option to purchase additional shares of Class A common stock) based upon an assumed initial public offering price of $15.00 per share (which is the midpoint of the estimated price range set forth on the cover page of this prospectus), less the underwriting discounts and commissions and estimated offering expenses payable by us; |
| • | we will use a portion of the net proceeds from this offering to purchase 30,000,000 LLC Interests (or 34,500,000 LLC Interests if the underwriters exercise in full their option to purchase additional shares of Class A common stock) from CWAN Holdings, LLC at a price per unit equal to the initial public offering price per share of Class A common stock in this offering, less the underwriting discounts and commissions; and |
| • | Clearwater Analytics Holdings, Inc. will enter into (1) the Registration Rights Agreement, (2) the Tax Receivable Agreement, (3) the TRA Bonus Agreements and (4) the Stockholders’ Agreement. For a description of the terms of the Registration Rights Agreement, the Tax Receivable Agreement and the Stockholders’ Agreement, see “Certain Relationships and Related Party Transactions” and a description of the terms of the TRA Bonus Agreements, see “Executive Compensation—TRA Bonus Agreements.” |
Organizational Structure Following the Transactions
| • | Clearwater Analytics Holdings, Inc. will be a holding company, and its principal asset will consist of LLC Interests it acquires as a result of (i) the purchase of such LLC Interests with the net proceeds of this offering and (ii) the Blocker Mergers. Clearwater Analytics Holdings, Inc. will directly own 172,949,844 LLC Interests of CWAN Holdings, LLC, representing approximately 74.7% of the economic interest in CWAN Holdings, LLC (or 177,449,844 LLC Interests, representing approximately 75.2% of the economic interest in CWAN Holdings, LLC if the underwriters exercise in full their option to purchase additional shares of Class A common stock); |
| • | Clearwater Analytics Holdings, Inc. will be the sole managing member of CWAN Holdings, LLC and will control the business and affairs of CWAN Holdings, LLC and its direct and indirect subsidiaries; |
| • | the Other Continuing Equity Owners will own (1) 11,151,110 LLC Interests of CWAN Holdings, LLC, representing approximately 4.8% of the economic interest in CWAN Holdings, LLC (or approximately 4.7% of the economic interest in CWAN Holdings, LLC if the underwriters exercise in full their option to purchase additional shares of Class A common stock), (2) 12,866,089 shares of Class A common stock of Clearwater Analytics Holdings, Inc., representing approximately 0.7% of the combined voting power of all of Clearwater Analytics Holdings, Inc.’s common stock and approximately 7.4% of the economic interest in Clearwater Analytics Holdings, Inc. (or approximately 0.7% of the combined voting power and approximately 7.3% of the economic interest if the underwriters exercise in full their option to purchase additional shares of Class A common stock), and (3) 11,151,110 shares of Class B common stock of Clearwater Analytics Holdings, Inc., representing in aggregate approximately 0.6% of the combined voting power of all of Clearwater Analytics Holdings, Inc.’s common stock (or approximately 0.6% of the combined voting power of all of Clearwater Analytics Holdings, Inc.’s |
60
Table of Contents
Index to Financial Statements
| common stock if the underwriters exercise in full their option to purchase additional shares of Class A common stock) and no economic interest in us; |
| • | the Principal Equity Owners will own (1) 47,377,587 LLC Interests of CWAN Holdings, LLC, representing approximately 20.5% of the economic interest in CWAN Holdings, LLC (or approximately 20.1% of the economic interest in CWAN Holdings, LLC if the underwriters exercise in full their option to purchase additional shares of Class A common stock), (2) 47,377,587 shares of Class C common stock of Clearwater Analytics Holdings, Inc., representing in aggregate approximately 25.9% of the combined voting power of all of Clearwater Analytics Holdings, Inc.’s common stock (or approximately 25.8% of the combined voting power of all of Clearwater Analytics Holdings, Inc.’s common stock if the underwriters exercise in full their option to purchase additional shares of Class A common stock) and no economic interest in us, and (3) 130,083,755 shares of Class D common stock, representing approximately 71.1% of the combined voting power of all of Clearwater Analytics Holdings, Inc.’s common stock and approximately 75.2% of the economic interest in Clearwater Analytics Holdings, Inc. (or approximately 71.0% of the combined voting power and approximately 73.3% of the economic interest if the underwriters exercise in full their option to purchase additional shares of Class A common stock); and |
| • | the purchasers in this offering will own (1) 30,000,000 shares of Class A common stock of Clearwater Analytics Holdings, Inc. (or 34,500,000 shares of Class A common stock of Clearwater Analytics Holdings, Inc. if the underwriters exercise in full their option to purchase additional shares of Class A common stock), representing approximately 1.7% of the combined voting power of all of Clearwater Analytics Holdings, Inc.’s common stock and approximately 17.4% of the economic interest in Clearwater Analytics Holdings, Inc. (or approximately 1.9% of the combined voting power and approximately 19.4% of the economic interest if the underwriters exercise in full their option to purchase additional shares of Class A common stock), and (2) through Clearwater Analytics Holdings, Inc.’s ownership of LLC Interests, indirectly will hold approximately 13.0% of the economic interest in CWAN Holdings, LLC (or approximately 14.6% of the economic interest in CWAN Holdings, LLC if the underwriters exercise in full their option to purchase additional shares of Class A common stock). |
Our corporate structure following this offering, as described above, is commonly referred to as an “Up-C” structure, which is often used by partnerships and limited liability companies when they undertake an initial public offering of their business. The Up-C structure will allow the Continuing Equity Owners to retain their equity ownership in CWAN Holdings, LLC and to continue to realize tax benefits associated with owning interests in an entity that is treated as a partnership, or “passthrough” entity, for U.S. federal income tax purposes following the offering. One of the tax benefits to the Continuing Equity Owners associated with this structure is that future taxable income of CWAN Holdings, LLC that is allocated to the Continuing Equity Owners will be taxed on a flow-through basis and therefore will not be subject to corporate taxes at the CWAN Holdings, LLC entity level. Additionally, because the Continuing Equity Owners may redeem or exchange their LLC Interests for newly issued shares of our Class A common stock or Class D common stock, as the case may be, on a one-for-one basis or, at our option, for cash, the Up-C structure also provides the Continuing Equity Owners with potential liquidity that holders of nonpublicly traded limited liability companies are not typically afforded. For more information regarding the redemption and exchange of LLC Interests, see “Certain Relationships and Related Party Transactions—LLC Agreement.”
Because we will own LLC Interests, we will receive the same benefits as the Continuing Equity Owners of equity ownership in an entity treated as a partnership, or “passthrough” entity, for U.S. federal income tax purposes. In addition, as the Continuing Equity Owners redeem or exchange their LLC Interests, we will obtain a step-up in tax basis in our share of CWAN Holdings, LLC assets. This step-up in tax basis will provide us with certain tax benefits, such as future depreciation and amortization deductions that can reduce the taxable income of CWAN Holdings, LLC that is allocable to us. We expect to enter into the Tax Receivable Agreement with certain of the Continuing Equity Owners and the Blocker Shareholders that will provide for the payment by us to such Continuing Equity Owners and Blocker Shareholders, collectively, of 85% (less payments under the TRA Bonus Agreements) of the amount of tax benefits, if any, that we actually realize, or in some circumstances are
61
Table of Contents
Index to Financial Statements
deemed to realize, as a result of the Tax Attributes. For more information regarding such tax benefits, see “Certain Relationships and Related Party Transactions—Tax Receivable Agreement.”
Immediately following this offering, we will be a holding company, and our principal asset will consist of LLC Interests of CWAN Holdings, LLC. As the sole managing member of CWAN Holdings, LLC, we will operate and control all of the business and affairs of CWAN Holdings, LLC. Accordingly, although we will have a minority economic interest in CWAN Holdings, LLC, we will have the sole voting interest in, and control the management of, CWAN Holdings, LLC.
The diagram below depicts our organizational structure after giving effect to the Transactions, including this offering, assuming no exercise by the underwriters of their option to purchase additional shares of Class A common stock:
62
Table of Contents
Index to Financial Statements
As the sole managing member of CWAN Holdings, LLC, we will operate and control all of the business and affairs of CWAN Holdings, LLC and, through CWAN Holdings, LLC and its direct and indirect subsidiaries, conduct our business. As a result, the Company will consolidate CWAN Holdings, LLC and record a significant noncontrolling interest in a consolidated entity in Clearwater Analytics Holdings, Inc.’s consolidated financial statements for the economic interest in CWAN Holdings, LLC held by the Continuing Equity Owners.
Unless otherwise indicated, this prospectus assumes the shares of Class A common stock are offered at $15.00 per share (the midpoint of the estimated price range set forth on the cover page of this prospectus).
Incorporation of Clearwater Analytics Holdings, Inc.
Clearwater Analytics Holdings, Inc., the issuer of the Class A common stock offered by this prospectus, was incorporated as a Delaware corporation on May 18, 2021. Clearwater Analytics Holdings, Inc. has not engaged in any material business or other activities except in connection with its formation and the Transactions. The amended and restated certificate of incorporation of Clearwater Analytics Holdings, Inc. that will become effective immediately prior to the consummation of this offering will, among other things, authorize four classes of common stock, Class A common stock, Class B common stock, Class C common stock and Class D common stock, each having the terms described in “Description of Capital Stock.”
Reclassification and Amendment and Restatement of the LLC Agreement
Prior to or substantially concurrently with the consummation of this offering, the existing limited liability company agreement of CWAN Holdings, LLC will be amended and restated to, among other things, recapitalize its capital structure by creating a single class of LLC Interests and provide for a right of redemption of such LLC Interests in exchange for, at our election (determined solely by a majority of our directors who are disinterested), shares of our Class A common stock, shares of our Class D common stock or cash. See “Certain Relationships and Related Party Transactions—LLC Agreement.”
November 2020 Recapitalization
In November 2020, we completed a recapitalization transaction on behalf of existing unitholders (the “Recapitalization”). In connection with the Recapitalization, we paid approximately $46.4 million in transaction bonuses to our employees and we accelerated the vesting of approximately 3.8 million options. Pursuant to the terms of the transaction bonus and option exercise agreement we entered into with our named executive officers in connection with the Recapitalization, we paid approximately $23.8 million in transaction bonuses to our named executive officers, and accelerated the vesting of approximately 2.9 million options held by them subject to those executive officers’ continued employment with us through the applicable acceleration date and to a 33% clawback in the event such executive officer voluntarily terminates employment with us before 12 months of the closing date of the Recapitalization.
63
Table of Contents
Index to Financial Statements
We currently do not anticipate paying any cash dividends on our Class A common stock or Class D common stock after this offering or for the foreseeable future. Instead, we anticipate that all of our available funds and earnings in the foreseeable future will be used to repay indebtedness, for working capital, to support our operations and to finance the growth and development of our business. Any future determination relating to dividend policy will be made at the discretion of our board of directors and will depend on a number of factors, including restrictions in our and our subsidiaries’ current and future debt instruments, future earnings, capital requirements, financial condition and prospects, and applicable Delaware law, which provides that dividends are only payable out of surplus or current net profits. Holders of our Class B common stock and Class C common stock are not entitled to participate in any dividends declared by our board of directors. Furthermore, because we are a holding company, our ability to pay cash dividends on our Class A common stock depends on our receipt of cash distributions from CWAN Holdings, LLC and, through CWAN Holdings, LLC, cash distributions and dividends from our other direct and indirect subsidiaries. See “Description of Capital Stock,” “Description of Certain Indebtedness” and “Management’s Discussion and Analysis of Financial Condition and Results of Operations—Liquidity and Capital Resources.”
Accordingly, you may need to sell your shares of our Class A common stock to realize a return on your investment, and you may not be able to sell your shares at or above the price you paid for them. See “Risk Factors—Risks Related to This Offering and Our Class A Common Stock—We do not intend to pay any cash distributions or dividends on our Class A common stock in the foreseeable future.”
Immediately following this offering, we will be a holding company, and our principal asset will be LLC Interests. If we decide to pay a dividend in the future, we would need to cause CWAN Holdings, LLC to make distributions to us in an amount sufficient to cover such dividend. If CWAN Holdings, LLC makes such distributions to us, the other holders of LLC Interests will be entitled to receive pro rata distributions. See “Risk Factors—Risks Related to Our Organizational Structure—We will be a holding company and our principal asset after completion of the Transactions and this offering will be our interest in CWAN Holdings, LLC and, accordingly, we will depend on distributions from CWAN Holdings, LLC to pay our taxes and expenses, including payments under the Tax Receivable Agreement. CWAN Holdings, LLC’s ability to make such distributions may be subject to various limitations and restrictions.”
64
Table of Contents
Index to Financial Statements
The following table sets forth our cash and cash equivalents and capitalization as of June 30, 2021, as follows:
| • | of CWAN Holdings, LLC and its subsidiaries on an actual basis; |
| • | of Clearwater Analytics Holdings, Inc. and its subsidiaries on a pro forma basis to give effect to the Transactions, including entering into the Credit Agreement and the sale of the shares of Class A common stock in this offering at an assumed initial public offering price of $15.00 per share (which is the midpoint of the estimated price range set forth on the cover page of this prospectus), after deducing the underwriting discounts and commissions and estimated offering expenses payable by us, and the application of the net proceeds therefrom as described under “Use of Proceeds.” |
For more information, please see “Organizational Structure,” “Use of Proceeds” and “Unaudited Pro Forma Consolidated Financial Information” included elsewhere in this prospectus. You should read this information together with our consolidated financial statements and our condensed consolidated interim financial statements and the related notes included elsewhere in this prospectus and the “Management’s Discussion and Analysis of Financial Condition and Results of Operations” section and other financial information contained in this prospectus.
| As of June 30, 2021 (unaudited) | ||||||||
| (in thousands, except per share and share data) | CWAN Holdings, LLC |
Pro Forma Clearwater Analytics Holdings, Inc.(4) |
||||||
| Cash and cash equivalents |
$ | 41,031 | $ | 74,574 | ||||
|
|
|
|
|
|||||
| Indebtedness: |
||||||||
| Term Loan(1) |
$ | 432,692 | $ | — | ||||
| Revolving Line of Credit(1) |
— | — | ||||||
| New Term Loan(2) |
— | 53,835 | ||||||
| New Revolving Facility(2) |
— | — | ||||||
|
|
|
|
|
|||||
| Total indebtedness |
$ | 432,692 | $ | 53,835 | ||||
|
|
|
|
|
|||||
| Total equity: |
||||||||
| Members’ equity (deficit) |
(329,238 | ) | ||||||
| Class A common stock, par value $0.001; 1,500,000,000 shares authorized, 42,866,089 shares issued and outstanding pro forma |
— | 43 | ||||||
| Class B common stock, par value $0.001; 500,000,000 shares authorized, 11,151,110 shares issued and outstanding pro forma |
— | 11 | ||||||
| Class C common stock, par value $0.001; 500,000,000 shares authorized, 47,377,587 shares issued and outstanding pro forma |
— | 47 | ||||||
| Class D common stock, par value $0.001; 500,000,000 shares authorized, 130,083,755 shares issued and outstanding pro forma |
130 | |||||||
| Additional paid-in capital |
— | 412,345 | ||||||
| Accumulated deficit |
— | (338,212 | ) | |||||
|
|
|
|
|
|||||
| Total members’/stockholders’ equity (deficit) |
$ | (329,238 | ) | $ | 74,364 | |||
|
|
|
|
|
|||||
| Noncontrolling interest(3) |
— | 18,799 | ||||||
|
|
|
|
|
|||||
| Total capitalization(5) |
$ | 103,454 | $ | 128,199 | ||||
|
|
|
|
|
|||||
| (1) | The Existing Credit Agreement (as defined herein) provides a term loan facility of $435 million and a $30 million revolving line of credit. See “Management’s Discussion and Analysis of Financial Condition and Results of Operations—Term Loan Facility and Revolving Line of Credit.” |
| (2) | It is anticipated that the New Credit Agreement will provide for a $55 million term loan facility and a $125 million revolving facility. For a description of the New Credit Agreement, see “Description of Certain Indebtedness.” |
65
Table of Contents
Index to Financial Statements
| (3) | On a pro forma basis, includes the membership interests not owned by us, which represents 25.3% of CWAN Holdings, LLC’s outstanding LLC Interests. Clearwater Analytics Holdings, Inc. will hold 74.7% of the economic interest in CWAN Holdings, LLC, the Other Continuing Equity Owners will hold 4.8% of the economic interest in CWAN Holdings, LLC and the Principal Equity Owners will hold 20.5% of the economic interest in CWAN Holdings, LLC. |
| (4) | Each $1.00 increase (decrease) in the assumed initial public offering price of $15.00 per share (which is the midpoint of the price range set forth on the cover page of this prospectus) would increase (decrease) each of cash and cash equivalents, additional paid-in capital, total members’ stockholders’ equity and total capitalization on a pro forma basis by approximately $28.1 million, assuming the number of shares offered, as set forth on the cover page of this prospectus, remains the same, and after deducting the estimated underwriting discounts and commissions and estimated offering expenses payable by us. |
Each 1,000,000 share increase (decrease) in the number of shares of Class A common stock offered in this offering would increase (decrease) the net proceeds to us from this offering by approximately $14.1 million, assuming that the price per share for the offering remains at $15.00 per share (which is the midpoint of the price range set forth on the cover page of this prospectus), and after deducting the estimated underwriting discounts and commissions and estimated offering expenses payable by us.
| (5) | Total capitalization includes total indebtedness and total members’/ stockholders’ equity (deficit) which is inclusive of noncontrolling interest. |
66
Table of Contents
Index to Financial Statements
Because other than in connection with the Transactions described under “Organizational Structure,” the Continuing Equity Owners do not own any Class A common stock or have any right to receive distributions from Clearwater Analytics Holdings, Inc., we have presented dilution in pro forma net tangible book value per share both before and after this offering assuming that all of the holders of LLC Interests (other than Clearwater Analytics Holdings, Inc.) had their LLC Interests redeemed or exchanged for newly issued shares of Class A common stock (in the case of the Other Continuing Equity Owners) or shares of Class D common stock (in the case of the Principal Equity Owners) on a one-for-one basis and the automatic transfer to the Company and cancellation for no consideration of all of their shares of Class B common stock or Class C common stock (which are not entitled to receive distributions or dividends, whether cash or stock from Clearwater Analytics Holdings, Inc.), as the case may be, in order to more meaningfully present the dilutive impact on the investors in this offering. We refer to the assumed redemption or exchange of all LLC Interests for shares of Class A common stock or shares of Class D common stock as described in the previous sentence as the “Assumed Redemption.”
Dilution is the amount by which the offering price paid by the purchasers of the Class A common stock in this offering exceeds the pro forma net tangible book value per share of Class A common stock after the offering. CWAN Holdings, LLC’s pro forma net tangible book value as of June 30, 2021 prior to this offering and after giving effect to the other Transactions and the Assumed Redemption was a deficit of $329.2 million. Pro forma net tangible book value per share prior to this offering is determined by subtracting our total liabilities from the total book value of our tangible assets and dividing the difference by the number of shares of Class A common stock deemed to be outstanding after giving effect to the Assumed Redemption.
If you invest in our Class A common stock in this offering, your ownership interest will be immediately diluted to the extent of the difference between the initial public offering price per share and the pro forma net tangible book value per share of our Class A common stock after this offering.
Pro forma net tangible book value per share after this offering is determined by subtracting our total liabilities from the total book value of our tangible assets and dividing the difference by the number of shares of Class A common stock deemed to be outstanding, after giving effect to the Transactions, including this offering and the application of the proceeds from this offering as described in “Use of Proceeds,” and the Assumed Redemption. Our pro forma net tangible book value as of June 30, 2021, after giving effect to this offering, would have been approximately $74.4 million, or $0.32 per share of Class A common stock. This amount represents an immediate increase in pro forma net tangible book value of $1.95 per share to our existing stockholders and an immediate dilution in pro forma net tangible book value of approximately $14.68 per share to new investors purchasing shares of Class A common stock in this offering. We determine dilution by subtracting the pro forma net tangible book value per share after this offering from the amount of cash that a new investor paid for a share of Class A common stock.
The following table illustrates this dilution on a per share basis to new investors:
| Assumed initial public offering price per share (the midpoint of the estimated price range set forth on the cover page of this prospectus) |
$ | 15.00 | ||||||
| Pro forma net tangible book value (deficit) per share as of June 30, 2021, before this offering |
$ | (1.63 | ) | |||||
| Increase in net tangible book value per share attributable to new investors participating in this offering |
$ | 1.95 | ||||||
|
|
|
|||||||
| Pro forma net tangible book value per share, after this offering |
$ | 0.32 | ||||||
| Dilution per share to new Class A common stock investors participating in this offering |
$ | 14.68 | ||||||
|
|
|
67
Table of Contents
Index to Financial Statements
The following table summarizes, as of June 30, 2021, after giving effect to the Transactions (including this offering) and the Assumed Redemption, the number of shares of Class A common stock purchased from us, the total consideration paid, or to be paid, to us and the average price per share paid, or to be paid, by existing owners and by the new investors. The calculation below is based on an assumed initial public offering price of $15.00 per share, which is the midpoint of the estimated price range set forth on the cover page of this prospectus, before deducting the underwriting discounts and commissions and estimated offering expenses payable by us.
| Shares Purchased | Total Consideration | Average Price Per Share |
||||||||||||||||||
| Number | Percent | Amount | Percent | |||||||||||||||||
| Continuing Equity Owners |
201,478,541 | 87 | % | $ | 141,828,000 | 24 | % | $ | 0.70 | |||||||||||
| New investors |
30,000,000 | 13 | % | $ | 450,000,000 | 76 | % | $ | 15.00 | |||||||||||
|
|
|
|
|
|
|
|
|
|
|
|||||||||||
| Total |
231,478,541 | 100 | % | $ | 591,828,000 | 100 | % | $ | 2.56 | |||||||||||
|
|
|
|
|
|
|
|
|
|||||||||||||
Each $1.00 increase (decrease) in the assumed initial public offering price of $15.00 per share would increase (decrease) the total consideration paid by new investors and the total consideration paid by all stockholders by $30 million, assuming the number of shares offered by us, as set forth on the cover page of this prospectus, remains the same and after deducting the underwriting discounts and commissions but before estimated offering expenses.
Except as otherwise indicated, the discussion and the tables above assume no exercise of the underwriters’ option to purchase additional shares of Class A common stock. The number of shares of our Class A common stock outstanding after this offering as shown in the tables above is based on the number of shares outstanding as of June 30, 2021, after giving effect to the Transactions and the Assumed Redemption. To the extent that options are issued under our compensatory stock plans or we issue additional shares of common stock in the future, there will be further dilution to investors participating in this offering. In connection with the consummation of this offering, outstanding options to purchase Class B Common Units of CWAN Holdings, LLC will be converted into options to purchase shares of our Class A common stock.
If the underwriters exercise in full their option to purchase additional shares of Class A common stock:
| • | the percentage of shares of common stock held by the Continuing Equity Owners will decrease to approximately 85% of the total number of shares of our common stock outstanding after this offering; and |
| • | the number of shares held by new investors will increase to 34,500,000, or approximately 15% of the total number of shares of our common stock outstanding after this offering. |
68
Table of Contents
Index to Financial Statements
UNAUDITED PRO FORMA CONSOLIDATED FINANCIAL INFORMATION
The following unaudited pro forma consolidated financial information reflects the impact of this offering, after giving effect to the Transactions discussed in the section of the prospectus entitled “Organizational Structure.” Following the completion of the Transactions, Clearwater Analytics Holdings, Inc. will be a holding company whose principal asset will consist of approximately 75% of the outstanding LLC Interests (or approximately 75% of LLC Interests if the underwriters exercise in full their option to purchase additional shares of Class A common stock) that it acquires as a result of the Blocker Mergers and from CWAN Holdings, LLC with the use of net proceeds from this offering. The remaining LLC Interests will be held by the Continuing Equity Owners. Clearwater Analytics Holdings, Inc. will act as the sole managing member of CWAN Holdings, LLC, will operate and control the business and affairs of CWAN Holdings, LLC and its direct and indirect subsidiaries and, through CWAN Holdings, LLC and its direct and indirect subsidiaries, conduct its business.
The following unaudited pro forma consolidated statements of operations for the year ended December 31, 2020 and the six months ended June 30, 2021 give effect to the Transactions, including this offering, as if the same had occurred on January 1, 2020. The unaudited pro forma consolidated balance sheet as of June 30, 2021 presents our unaudited pro forma balance sheet giving effect to the Transactions, including this offering, as if they had occurred on such date.
We have derived the unaudited pro forma consolidated statements of operations data and unaudited pro forma consolidated balance sheet data from the consolidated financial statements and the unaudited consolidated interim financial statements of CWAN Holdings, LLC and its subsidiaries included elsewhere in this prospectus. The historical consolidated financial information of CWAN Holdings, LLC has been adjusted in this unaudited pro forma consolidated financial information to give effect to events that are directly attributable to the Transactions, are factually supportable and, with respect to the consolidated statements of operations data, are expected to have a continuing impact on Clearwater Analytics Holdings, Inc. The unaudited pro forma consolidated financial information reflects adjustments that are described in the accompanying notes and are based on available information and certain assumptions we believe are reasonable but are subject to change.
We refer to the adjustments related to the Transactions, including the impact of the Transaction described in “Organizational Structure,” as the “Pro Forma Transaction Adjustments.” The Pro Forma Transaction Adjustments are described in the notes to the unaudited pro forma consolidated information and principally include:
| • | the amendment and restatement of the limited liability company agreement of CWAN Holdings, LLC to, among other things, appoint Clearwater Analytics Holdings, Inc. as the sole managing member of CWAN Holdings, LLC and provide certain exchange and redemption rights to the Continuing Equity Owners; |
| • | the amendment and restatement of the certificate of incorporation of Clearwater Analytics Holdings, Inc. to create Class A, B, C and D common stock; |
| • | a four-for-one reverse stock split of Clearwater Analytics Holdings, Inc. Class A, B, C and D common stock: |
| • | the mergers of Blocker Entities into Clearwater Analytics Holdings, Inc and the issuance of Class A common stock, Class B common stock, Class C common stock, and Class D common stock to Blocker Shareholders and the Continuing Equity Owners; |
| • | the approximate 29% non-controlling interest in CWAN Holdings, LLC represented by the units not held by Clearwater Analytics Holdings, Inc. after completion of the Transaction Adjustments and prior to the Offering Adjustments; |
| • | the establishment of a provision for income taxes and deferred income taxes including a valuation allowance upon the deferred taxes, to the extent applicable; |
69
Table of Contents
Index to Financial Statements
| • | the execution of the Tax Receivable Agreement between Clearwater Analytics Holdings, Inc. and certain Blocker Shareholders and Continuing Equity Owners; |
| • | the execution of the agreements providing management participation in the Tax Receivable Agreement under certain circumstances (the “TRA Bonus Agreements”). See “Executive Compensation-TRA Bonus Agreements;” and |
| • | the conversion of existing options to purchase Class B Common Units granted under 2017 Equity Incentive Plan into options to purchase Class A common stock governed under the terms of our 2021 Equity Incentive Plan and perform modifications to those option agreements including modification of equity options subject to performance-based vesting being changed to time-based vesting. |
The adjustments related to this offering, which we refer to as the “Pro Forma Offering Adjustments,” are described in the notes to the unaudited pro forma consolidated financial information and principally include the following:
| • | the issuance of 30,000,000 shares of our Class A common stock to the investors in this offering in exchange for net proceeds of approximately $421.9 million (based on an assumed initial public offering price of $15.00 per share, the midpoint of the estimated price range set forth on the cover page of this prospectus), after deducting the underwriting discounts and commissions but before estimated offering expenses payable by us; |
| • | the payment of fees and expenses related to this offering and the application of the net proceeds from the sale of Class A common stock in this offering to |
| (i) | purchase LLC Interests from CWAN Holdings, LLC at a purchase price per unit equal to the initial public offering price per share of Class A common stock less the underwriting discounts and commissions, with such LLC Interests representing approximately 75% of the outstanding LLC Interests, |
| (ii) | repay $432.7 million of outstanding borrowings under the Existing Credit Agreement and pay accrued and unpaid interest to the date of repayment, |
| (iii) | enter into a New Credit Agreement that includes both a $125 million revolving facility and a $55 million term loan facility which is presented net of debt issuance costs, |
| (iv) | the payment of additional expense of $9.5 million associated with this offering (of which $0.4 million has been paid as of June 30, 2021), and |
| (v) | the issuance of 1,685,625 RSUs (as defined below) to employees upon consummation of the offering. |
Except as otherwise indicated, the unaudited pro forma consolidated financial information presented assumes no exercise by the underwriters of their option to purchase additional shares of Class A common stock in the offering.
As a public company, we will be implementing additional procedures and processes for the purpose of addressing the standards and requirements applicable to public companies. We expect to incur additional annual expenses related to these additional procedures and processes and, among other things, additional directors’ and officers’ liability insurance, director fees, additional expenses associated with complying with the reporting requirements of the SEC, transfer agent fees, costs relating to additional accounting, legal and administrative personnel, increased auditing, tax and legal fees, stock exchange listing fees and other public company expenses. We have not included any pro forma adjustments relating to these costs in the information below.
As described in greater detail under the sections titled “Organizational Structure” and “Certain Relationships and Related Party Transactions,” in connection with the completion of this offering, we will enter into the Tax Receivable Agreement with the Continuing Equity Owners and the Blocker Shareholders, which will provide for the payment by Clearwater Analytics Holdings, Inc. to the Continuing Equity Owners and the Blocker Shareholders of 85% (less payments under the TRA Bonus Agreements) of the applicable savings, if
70
Table of Contents
Index to Financial Statements
any, that Clearwater Analytics Holdings, Inc. may realize, or be deemed to realize (using the actual applicable U.S. federal income tax rate in effect for the tax period and an assumed, weighted-average state and local income tax rate based on applicable period apportionment factors), as a result of the Tax Attributes. Due to uncertainty in the amount and timing of tax savings as we currently do not generate taxable income, the unaudited pro forma consolidated financial information assumes that tax attributes of CWAN Holdings, LLC and the Blocker Entities, like net operating losses, to which Clearwater Analytics Holdings, Inc. will be the successor as a result of the Transactions will not be realized.
The unaudited pro forma consolidated financial information is included for informational purposes only. The unaudited pro forma consolidated financial information should not be relied upon as being indicative of our results of operations or financial condition had the Transactions, including this offering, occurred on the dates assumed. The unaudited pro forma consolidated financial information also does not project our results of operations or financial position for any future period or date. The unaudited pro forma consolidated statement of operations and balance sheet data should be read in conjunction with the “Risk Factors,” “Summary Consolidated Financial and Other Data,” “Management’s Discussion and Analysis of Financial Condition and Results of Operations” and our consolidated financial statements and our consolidated interim financial statements and related notes included elsewhere in this prospectus.
71
Table of Contents
Index to Financial Statements
Unaudited pro forma consolidated balance sheet as of June 30, 2021
| CWAN Holdings, LLC Historical |
Pro Forma Transaction Adjustments |
Pro Forma Clearwater Analytics Holdings, Inc. as adjusted before Offering Adjustments(1) |
Pro Forma Offering Adjustments |
Pro Forma Clearwater Analytics Holdings, Inc. |
||||||||||||||||||||
| (in thousands, except share and unit amounts) | ||||||||||||||||||||||||
| Assets |
||||||||||||||||||||||||
| Current assets: |
||||||||||||||||||||||||
| Cash and cash equivalents |
$ | 41,031 | — | $ | 41,031 | $ | 33,543 | (2)(3) | $ | 74,574 | ||||||||||||||
| Accounts receivable, net |
45,075 | — | 45,075 | — | 45,075 | |||||||||||||||||||
| Prepaid and other current assets |
14,233 | — | 14,233 | (1,572 | ) | (2) | 12,661 | |||||||||||||||||
|
|
|
|
|
|
|
|
|
|
|
|||||||||||||||
| Total current assets |
100,339 | — | 100,339 | 31,971 | 132,310 | |||||||||||||||||||
| Property and equipment, net |
9,330 | — | 9,330 | — | 9,330 | |||||||||||||||||||
| Deferred contract costs, non-current |
4,021 | — | 4,021 | — | 4,021 | |||||||||||||||||||
| Debt issuance costs - line of credit |
403 | — | 403 | (28 | ) | (3) | 375 | |||||||||||||||||
| Other non-current assets |
6,405 | — | (5) | 6,405 | — | 6,405 | ||||||||||||||||||
|
|
|
|
|
|
|
|
|
|
|
|||||||||||||||
| Total assets |
$ | 120,498 | $ | — | $ | 120,498 | $ | 31,943 | $ | 152,441 | ||||||||||||||
|
|
|
|
|
|
|
|
|
|
|
|||||||||||||||
| Liabilities and Members’ Deficit |
||||||||||||||||||||||||
| Current liabilities: |
||||||||||||||||||||||||
| Accounts payable |
$ | 601 | — | $ | 601 | $ | — | $ | 601 | |||||||||||||||
| Accrued expenses and other current liabilities |
24,677 | — | 24,677 | (1,172 | ) | (2) | 23,505 | |||||||||||||||||
| Notes payable, current portion |
3,077 | — | 3,077 | (327 | ) | (3) | 2,750 | |||||||||||||||||
|
|
|
|
|
|
|
|
|
|
|
|||||||||||||||
| Total current liabilities |
28,355 | — | 28,355 | (1,499 | ) | 26,856 | ||||||||||||||||||
| Notes payable, less current maturities and unamortized debt issuance costs of $8,370 as of June 30, 2021 |
421,245 | — | 421,245 | (370,160 | ) | (3) | 51,085 | |||||||||||||||||
| Other long-term liabilities |
136 | — | (5) | 136 | — | 136 | ||||||||||||||||||
|
|
|
|
|
|
|
|
|
|
|
|||||||||||||||
| Total liabilities |
449,736 | — | 449,736 | (371,659 | ) | 78,077 | ||||||||||||||||||
| Members’ equity (deficit) |
||||||||||||||||||||||||
| Class A Common units, no par value; 190,960,379 units issued and outstanding at June 30, 2021 |
— | — | — | — | — | |||||||||||||||||||
| Class B Common units, no par value; 10,358,478 units issued and outstanding at June 30, 2021 |
— | — | — | — | — | |||||||||||||||||||
| Members’ deficit |
(329,238 | ) | 329,238 | (6) | — | — | — | |||||||||||||||||
| Stockholders’ equity |
||||||||||||||||||||||||
| Class A common stock, par value $0.001 per share, 1,500,000,000 shares authorized on a pro forma basis, 12,866,089 shares issued and outstanding on a pro forma basis, and 42,866,089 after offering |
— | 13 | (6) | 13 | 30 | (2) | 43 | |||||||||||||||||
| Class B common stock, par value $0.001 per share, 500,000,000 shares authorized on a pro forma basis, 11,151,110 shares issued and outstanding on a pro forma basis |
— | 11 | (6) | 11 | — | 11 | ||||||||||||||||||
| Class C common stock, par value $0.001 per share, 500,000,000 shares authorized on a pro forma basis, 47,377,587 shares issued and outstanding on a pro forma basis |
47 | (6) | 47 | — | 47 | |||||||||||||||||||
| Class D common stock, par value $0.001 per share, 500,000,000 shares authorized on a pro forma basis, 130,083,755 shares issued and outstanding on a pro forma basis |
130 | (6) | 130 | — | 130 | |||||||||||||||||||
| Additional paid-in-capital |
— | — | (6) | — | 412,345 | (2) | 412,345 | |||||||||||||||||
| Accumulated Deficit |
— | (329,439 | ) | (6) | (329,439 | ) | (8,773 | ) | (3) | (338,212 | ) | |||||||||||||
|
|
|
|
|
|
|
|
|
|
|
|||||||||||||||
| Total members’ /stockholders’ equity (deficit) attributable to CWAN Holdings, LLC/ Clearwater Analytics Holdings, Inc. |
(329,238 | ) | (233,594 | ) | (4) | (233,594 | ) | 289,159 | (4) | 55,565 | ||||||||||||||
|
|
|
|
|
|
|
|
|
|
|
|||||||||||||||
| Non-controlling interest |
— | (95,644 | ) | (4) | (95,644 | ) | 114,443 | (4) | 18,799 | |||||||||||||||
|
|
|
|
|
|
|
|
|
|
|
|||||||||||||||
| Total members’ /stockholders’ equity (deficit) |
(329,238 | ) | (329,238 | ) | (329,238 | ) | 403,602 | 74,364 | ||||||||||||||||
|
|
|
|
|
|
|
|
|
|
|
|||||||||||||||
| Total liabilities and members’ /stockholders’ equity |
$ | 120,498 | $ | — | $ | 120,498 | $ | 31,943 | $ | 152,441 | ||||||||||||||
|
|
|
|
|
|
|
|
|
|
|
|||||||||||||||
72
Table of Contents
Index to Financial Statements
Notes to unaudited pro forma consolidated balance sheet
| (1) | Clearwater Analytics Holdings, Inc. was formed on May 18, 2021 and will have no material assets or results of operations until the consummation of the Transactions, and therefore its historical financial position is not shown in a separate column in this unaudited pro forma balance sheet. |
| (2) | Reflects the net effect on cash of the receipt of offering proceeds of $412.4 million, based on the assumed sale of 30,000,000 shares of Class A common stock with a par value of $0.001 at an assumed public offering of $15.00 per share, the midpoint of the estimated range set forth on the cover page of this prospectus, after deducting the underwriting discounts and commissions and estimated offering expenses payable by us. These amounts as described in “Use of Proceeds” relate to: |
| a) | payment of $421.9 million to purchase 30,000,000 LLC Interests from CWAN Holdings, LLC at an assumed initial public offering of $15.00 per share, the midpoint of the estimated range set forth on the cover page of this prospectus after deducting the underwriting discounts and commissions; |
| b) | payment of approximately $9.5 million of estimated offering expenses (of which $0.4 million has been paid as of June 30, 2021) |
| (3) | Reflects the net cash of repayment and issuance of debt: |
| a) | repayment of approximately $432.7 million to repay outstanding borrowings under our Existing Credit Agreement utilizing proceeds. The repayment of our borrowings under the Existing Credit Agreement resulted in a $8.8 million loss on debt repayment as the result of the write-off of unamortized debt issuance costs; |
| b) | entering into the New Credit Agreement that includes both a $125 million revolving facility and a $55 million term loan facility which is presented net of debt issuance costs of $1.2 million |
| (4) | Upon completion of the Transaction Adjustments, we will become the sole managing member of CWAN Holdings, LLC. We will have the sole voting interest in, and control of the management of, CWAN Holdings, LLC. As a result, we will consolidate the financial results of CWAN Holdings, LLC and will report a noncontrolling interest related to the interests in CWAN Holdings, LLC held by the Continuing Equity Owners on our consolidated balance sheet. Immediately following the Transactions, the economic interests held by the noncontrolling interest will be approximately 29%. |
The Transaction Adjustments include adjustments to transfer CWAN Holdings, LLC members’ deficit to accumulated deficit and report a noncontrolling interest equal to the Continuing Equity Owners’ economic interest in CWAN Holdings, LLC of 29%. The following table describes such Transaction adjustments ($ in thousands):
| June 30, 2021 | ||||
| Non-controlling interest |
||||
| Members’ deficit—CWAN Holdings, LLC |
$ | (329,238 | ) | |
| Class A and Class D common stock economic interest in CWAN Holdings, LLC |
71 | % | ||
| Members’ deficit attributable to Class A and Class D common stock |
$ | (233,594 | ) | |
|
|
|
|||
| Members’ deficit attributable to Continuing Equity Owners -non-controlling interest |
$ | (95,644 | ) | |
|
|
|
|||
73
Table of Contents
Index to Financial Statements
The Offering Adjustments include adjustments to report a noncontrolling interest equal to the Continuing Equity Owners’ economic interest in CWAN Holdings, LLC of 25%, after giving effect to the issuance of 30,000,000 shares of Class A common stock in this offering based on the pro forma CWAN Holdings, LLC members’ deficit adjusted for the net proceeds received from the sale of common units, less offering expenses and write off of unamortized debt issuance costs, which are included in stockholders’ equity. If the underwriters were to exercise their options to purchase additional shares of our common stock in full, the economic interest held by the noncontrolling interest would be 25%. The following table describes such offering adjustments ($ in thousands):
| June 30, 2021 | ||||
| Non-controlling interest |
||||
| Members’ deficit—CWAN Holdings, LLC |
$ | (329,238 | ) | |
| Proceeds from offering net of underwriter fee and offering expense |
412,375 | |||
| Costs associated with extinguishment of debt |
(8,773 | ) | ||
|
|
|
|||
| CWAN Holdings LLC members’ equity after the offering |
74,364 | |||
| Continuing Equity Owners’ interest in CWAN Holdings, LLC |
25 | % | ||
|
|
|
|||
| Members’ equity attributable to Continuing Equity Owners—noncontrolling interest |
18,799 | |||
| Less non-controlling interest included in the “Transaction Adjustments” column |
(95,644 | ) | ||
|
|
|
|||
| Non-controlling interest—“Offering Adjustments” column |
$ | 114,443 | ||
| (5) | Clearwater Holdings Analytics, Inc is a C corporation and subject to federal and state income taxes and will file consolidated income tax returns. Due to uncertainty in the amount and timing of tax savings as we currently do not generate taxable income, the unaudited pro forma consolidated financial information assumes that tax attributes of CWAN Holdings, LLC and the Blocker Entities, like net operating losses, to which Clearwater Analytics Holdings, Inc. will be the successor as a result of the Transactions will not be realized. We will not be obligated to make any payments under the Tax Receivable Agreement until these tax benefits are realized. As such, no deferred tax asset and Tax Receivable Agreement liability were reflected in the unaudited pro forma consolidated financial information. |
For financial reporting purposes, we will assess the tax attributes of CWAN Holdings, LLC and Clearwater Analytics Holdings, Inc. in accordance with ASC 740, Income Taxes, to determine if it is more likely than not that we will realize the benefit of any deferred tax assets. Following that assessment, we may recognize a deferred tax asset and liability under the Tax Receivable Agreement, reflecting the expected future realization of such tax benefits. Amounts payable under the Tax Receivable Agreement are contingent upon, among other things, (i) generation of sufficient future taxable income during the term of the Tax Receivable Agreement and (ii) future changes in tax laws. All of the effects of changes in any of our estimates after the date of the offering will be included in net income. Similarly, the effect of subsequent changes in the enacted tax rates, if any, will be included in net income.
Although no Tax Receivable Agreement liability was reflected in the unaudited pro forma consolidated financial information, we expect that the aggregate payments that we may make under the Tax Receivable Agreement will be substantial. Assuming no material changes in the relevant tax law, and that we earn sufficient taxable income to realize all tax benefits that are subject to the Tax Receivable Agreement, we expect that future payments under the Tax Receivable Agreement relating to the purchase by Clearwater Analytics Holdings, Inc. of LLC Interests from CWAN Holdings, LLC and the acquisition of the Blocker Entities from the Blocker Shareholders in connection with this offering to range over the next 15 years from approximately $9.0 million to $75.5 million and decline thereafter. Under the terms of the TRA Bonus Agreements, certain members of management would collectively receive compensation in an amount equal to 4.6% of any Tax Receivable Agreement payments subject to continued employment through the applicable payment date. These estimates are based on an initial public offering price of $15.00 per share of Class A common stock, which is the midpoint of the estimated price range set forth on the cover page of this prospectus and assuming all future redemptions or exchanges would occur on the date of this offering. The actual amounts paid to the Continuing Equity Owners and the Blocker Shareholders under the Tax Receivable Agreement will vary based on a number of factors including: the price of Class A Common
74
Table of Contents
Index to Financial Statements
Stock at the time of any future exchanges; the timing of any future exchanges; the extent to which such exchanges are taxable; the amount and timing of any payments under TRA Bonus Agreements; the amount and timing of our taxable income; and applicable tax rates.
| (6) | To reflect the capital structure of the C corporation, the value of Common Stock in each class, additional paid in capital and accumulated deficit are presented separately on the balance sheet. Each class of common stock has a par value of $0.001 per share. The value is determined by multiplying the number of shares by the par value. The remaining balance of members deficit is included in accumulated deficit. |
In connection with the Transactions we will issue 11,151,110 shares of Class B common stock to the Continuing Equity Owners and 47,377,587 shares of Class C common stock to the Principal Equity Owners, on a one to one basis with the number of common units of CWAN Holdings, LLC. Holders of our Class B and Class C common stock, along with the holders of our Class A and Class D common stock, will have certain voting rights as described under “Description of Capital Stock” but holders of our Class B and Class C common stock will not have an economic interests in the Company.
In connection with the Transactions we will issue 130,083,755 shares of Class D common stock to Principal Equity Owners, on a one to one basis, with the number of common units of CWAN Holdings, LLC. Holders of our Class D common stock will have certain voting rights and are entitled to the economic interest in the Company as described under “Description of Capital Stock”.
Unaudited pro forma consolidated statement of operations for the year ended December 31, 2020
| CWAN Holdings, LLC Historical |
Pro Forma Transaction Adjustments |
Pro Forma Clearwater Analytics Holdings, Inc. as adjusted before Offering Adjustments(a) |
Pro Forma Offering Adjustments |
Pro Forma Clearwater Analytics Holdings, Inc.(d) |
||||||||||||||||||||||||
| (in thousands, except share and unit amounts) | ||||||||||||||||||||||||||||
| Revenue |
$ | 203,222 | $ | — | $ | 203,222 | $ | — | $ | 203,222 | ||||||||||||||||||
| Cost of revenue |
53,263 | 1,794 | (d | ) | 55,057 | 957 | (e | ) | 56,014 | |||||||||||||||||||
|
|
|
|
|
|
|
|
|
|
|
|||||||||||||||||||
| Gross profit |
149,959 | (1,794 | ) | 148,165 | (957 | ) | 147,208 | |||||||||||||||||||||
| Operating expenses: |
||||||||||||||||||||||||||||
| Research and development |
55,262 | 4,838 | (d | ) | 60,100 | 2,580 | (e | ) | 62,680 | |||||||||||||||||||
| Sales and marketing |
22,243 | 2,469 | (d | ) | 24,712 | 1,317 | (e | ) | 26,029 | |||||||||||||||||||
| General and administrative |
43,874 | 4,444 | (d | ) | 48,318 | 2,370 | (e | ) | 50,688 | |||||||||||||||||||
| Recapitalization compensation expenses |
48,998 | — | 48,998 | — | 48,998 | |||||||||||||||||||||||
|
|
|
|
|
|
|
|
|
|
|
|||||||||||||||||||
| Total operating expenses |
170,377 | 11,751 | 182,128 | 6,267 | 188,395 | |||||||||||||||||||||||
|
|
|
|
|
|
|
|
|
|
|
|||||||||||||||||||
| Loss from operations |
(20,418 | ) | (13,545 | ) | (33,963 | ) | (7,224 | ) | (41,187 | ) | ||||||||||||||||||
| Interest and other expense, net |
(22,910 | ) | — | (22,910 | ) | 12,318 | (b | ) | (10,592 | ) | ||||||||||||||||||
|
|
|
|
|
|
|
|
|
|
|
|||||||||||||||||||
| Loss before income taxes |
(43,328 | ) | (13,545 | ) | (56,873 | ) | 5,094 | (51,779 | ) | |||||||||||||||||||
| Income taxes |
902 | — | (c | ) | 902 | — | (c | ) | 902 | |||||||||||||||||||
|
|
|
|
|
|
|
|
|
|
|
|||||||||||||||||||
| Net loss |
$ | (44,230 | ) | $ | (13,545 | ) | $ | (57,775 | ) | $ | 5,094 | $ | (52,681 | ) | ||||||||||||||
|
|
|
|
|
|
|
|
|
|
|
|||||||||||||||||||
| Net loss attributable to non-controlling interest |
(16,784 | ) | (f | ) | (16,784 | ) | 3,466 | (g | ) | (13,318 | ) | |||||||||||||||||
|
|
|
|
|
|
|
|
|
|
|
|||||||||||||||||||
| Net loss attributable to Clearwater Analytics Holdings, Inc. |
$ | (44,230 | ) | $ | 3,239 | $ | (40,991 | ) | $ | 1,628 | $ | (39,363 | ) | |||||||||||||||
|
|
|
|
|
|
|
|
|
|
|
|||||||||||||||||||
| Pro forma net income (loss) per share data(h): |
||||||||||||||||||||||||||||
| Pro forma weighted average shares outstanding: |
||||||||||||||||||||||||||||
| Basic |
172,950 | |||||||||||||||||||||||||||
| Diluted |
231,479 | |||||||||||||||||||||||||||
| Pro forma net income (loss) per share: |
||||||||||||||||||||||||||||
| Basic |
$ | (0.23 | ) | |||||||||||||||||||||||||
| Diluted |
$ | (0.23 | ) | |||||||||||||||||||||||||
75
Table of Contents
Index to Financial Statements
Unaudited pro forma consolidated statement of operations for the six months ended June 30, 2021
| CWAN Holdings, LLC Historical |
Pro Forma Transaction Adjustments |
Pro Forma Clearwater Analytics Holdings, Inc. as adjusted before Offering Adjustments(a) |
Pro Forma Offering Adjustments |
Pro Forma Clearwater Analytics Holdings, Inc.(d) |
||||||||||||||||||||||||
| (in thousands, except share and unit amounts) | ||||||||||||||||||||||||||||
| Revenue |
$ | 117,770 | $ | — | $ | 117,770 | $ | — | $ | 117,770 | ||||||||||||||||||
| Cost of revenue |
29,898 | 897 | (d | ) | 30,795 | 479 | (e | ) | 31,274 | |||||||||||||||||||
|
|
|
|
|
|
|
|
|
|
|
|||||||||||||||||||
| Gross profit |
87,872 | (897 | ) | 86,975 | (479 | ) | 86,496 | |||||||||||||||||||||
| Operating expenses: |
||||||||||||||||||||||||||||
| Research and development |
32,576 | 2,419 | (d | ) | 34,995 | 1,290 | (e | ) | 36,285 | |||||||||||||||||||
| Sales and marketing |
16,025 | 1,234 | (d | ) | 17,259 | 658 | (e | ) | 17,917 | |||||||||||||||||||
| General and administrative |
18,727 | 2,222 | (d | ) | 20,949 | 1,185 | (e | ) | 22,134 | |||||||||||||||||||
| Recapitalization compensation expenses |
— | — | — | — | — | |||||||||||||||||||||||
|
|
|
|
|
|
|
|
|
|
|
|||||||||||||||||||
| Total operating expenses |
67,328 | 5,875 | 73,203 | 3,133 | 76,336 | |||||||||||||||||||||||
|
|
|
|
|
|
|
|
|
|
|
|||||||||||||||||||
| Income from operations |
20,544 | (6,772 | ) | 13,772 | (3,612 | ) | 10,160 | |||||||||||||||||||||
| Interest and other expense, net |
(17,024 | ) | — | (17,024 | ) | 16,051 | (b | ) | (973 | ) | ||||||||||||||||||
|
|
|
|
|
|
|
|
|
|
|
|||||||||||||||||||
| Income before income taxes |
3,520 | (6,772 | ) | (3,252 | ) | 12,439 | 9,187 | |||||||||||||||||||||
| Income taxes |
320 | — | (c | ) | 320 | — | (c | ) | 320 | |||||||||||||||||||
|
|
|
|
|
|
|
|
|
|
|
|||||||||||||||||||
| Net income |
$ | 3,200 | $ | (6,772 | ) | $ | (3,572 | ) | $ | 12,439 | $ | 8,867 | ||||||||||||||||
|
|
|
|
|
|
|
|
|
|
|
|||||||||||||||||||
| Net income attributable to non-controlling interest |
(1,038 | ) | (f | ) | (1,038 | ) | 3,279 | (g | ) | 2,242 | ||||||||||||||||||
|
|
|
|
|
|
|
|
|
|
|
|||||||||||||||||||
| Net income attributable to Clearwater Analytics Holdings, Inc. |
$ | 3,200 | $ | (5,734 | ) | $ | (2,534 | ) | $ | 9,160 | $ | 6,625 | ||||||||||||||||
|
|
|
|
|
|
|
|
|
|
|
|||||||||||||||||||
| Pro forma net income (loss) per share data(h): |
||||||||||||||||||||||||||||
| Pro forma weighted average shares outstanding: |
||||||||||||||||||||||||||||
| Basic |
172,950 | |||||||||||||||||||||||||||
| Diluted |
240,312 | |||||||||||||||||||||||||||
| Pro forma net income (loss) per share: |
||||||||||||||||||||||||||||
| Basic |
$ | 0.04 | ||||||||||||||||||||||||||
| Diluted |
$ | 0.04 | ||||||||||||||||||||||||||
Notes to unaudited pro forma consolidated statements of operations
| (a) | Clearwater Analytics Holdings, Inc. was formed on May 18, 2021 and will have no material assets or results of operations until the consummation of the Transactions, and therefore its historical financial position is not shown in a separate column in this unaudited pro forma balance sheet. |
| (b) | In connection with this offering, we will use proceeds to repay outstanding borrowings of $432.7 million under our Existing Credit Agreement and enter into the New Credit Agreement that includes a $125 million revolving facility and a $55 million term loan facility. Accordingly, pro forma adjustments have been made to reflect a decrease in interest expense of $12.3 million (comprised of a reduction of interest expense of $21.4 million offset by amortization of new debt issuance costs of $0.3 million and $8.8 million non-recurring charge for loss on extinguishment of borrowings), and a reduction of $16.1 million (comprised of a reduction of interest expense of $16.3 million offset by amortization of new |
76
Table of Contents
Index to Financial Statements
| debt issue costs of $0.2 million) for the year ended December 31, 2020 and six month period ended June 30, 2021, respectively. The change in interest expense is computed with an effective interest rate of 2.75%, in each case, as if the borrowings from the Existing Credit Agreement had been repaid, and the borrowings from the New Credit Agreement had been raised on January 1, 2020. The New Credit Agreement is currently under negotiation and terms are subject to change. We estimate that a hypothetical increase or decrease of 100 basis points to the interest rate would increase or decrease, respectively, our pro forma interest expense by approximately $0.5 million and $0.3 million, based on a $55 million debt balance for the year ended December 31, 2020 and the six month period ended June 30, 2021, respectively. |
| (c) | Following this offering and the Transactions, Clearwater Analytics Holdings, Inc. will be subject to U.S. federal income taxes, in addition to state and local taxes, with respect to its allocable share of any net taxable income of CWAN Holdings, LLC. As Clearwater Analytics Holdings, Inc. has historically generated losses, and on a pro forma basis, will continue to have losses following this offering and the Transactions, the unaudited pro forma consolidated statements of operations do not reflect adjustments to our provision for income taxes as we concluded that it is more-likely-than-not that the tax benefit of the Tax Attributes will not be realized. |
| (d) | In connection with the offering, employee equity options will be transferred from CWAN Holdings, LLC to Clearwater Analytics Holdings, Inc. and equity options subject to performance-based vesting are modified to remove the performance-based criteria and only be subject to time-based vesting. The incremental compensation charge resulting from the modification is $49.5 million and will be recognized over the remaining requisite service period of approximately 44 months. The pro forma adjustments decrease operating income by $13.5 million and $6.8 million for the year ended December 31, 2020, and the six-month period ended June 30, 2021, respectively. |
| (e) | In conjunction with the offering, we will grant employees an award of restricted stock units of Clearwater Analytics Holdings, Inc. (“IPO RSUs”) under the 2021 Plan. We will grant a total of 1,685,625 IPO RSUs which will result in a total expense of $25.3 million assuming an initial public offering price of $15.00 per share of Class A common stock, which is the midpoint of the estimated price range set forth on the cover page of this prospectus (with a $1.00 increase or decrease in the initial public offering price increasing or decreasing, respectively, the total expense by $1.7 million) and 100% achievement of performance vesting conditions (if performance vesting achievement is 110%, this would result in total incremental expense of $1.3 million). The expense is expected to be recognized over 42 months, and the expense is reflected in the line item based on the employees’ job function. |
| (f) | Pro forma net income (loss) attributable to non-controlling interest as a result of the Transaction Adjustments is calculated as follows ($ in thousands): |
| Year Ended December 31, |
Six Months Ended June 30, |
|||||||
| 2020 | 2021 | |||||||
| Non-controlling interest |
||||||||
| Net income (loss)—CWAN Holdings, LLC |
$ | (44,230 | ) | $ | 3,200 | |||
| Incremental costs from equity option modification |
(13,545 | ) | (6,772 | ) | ||||
|
|
|
|
|
|||||
| Net loss following the Transaction Adjustments |
$ | (57,775 | ) | $ | (3,572 | ) | ||
| Non-controlling interest immediately following the Transaction Adjustments |
29 | % | 29 | % | ||||
|
|
|
|
|
|||||
| Total net loss attributable to non-controlling interest immediately following the Transaction Adjustments |
$ | (16,784 | ) | $ | (1,038 | ) | ||
|
|
|
|
|
|||||
| (g) | Upon completion of the Offering Adjustments, we will become the sole managing member of CWAN Holdings, LLC. We will have the sole voting interest in, and control of the management of, CWAN Holdings, LLC. As a result, we will consolidate the financial results of CWAN Holdings, LLC and will |
77
Table of Contents
Index to Financial Statements
| report a noncontrolling interest related to the interests in CWAN Holdings, LLC held by the Continuing Equity Owners on our consolidated balance sheet. Immediately following the Transactions, the economic interests held by the noncontrolling interest will be approximately 25%. If the underwriters exercise their option to purchase additional shares of our Class A common stock in full, the economic interests held by the noncontrolling interest will remain approximately 25%. |
Pro forma net income (loss) attributable to non-controlling interests as a result of the Offering Adjustments is calculated as follows ($ in thousands):
| Year Ended December 31, 2020 |
Six Months Ended June 30, 2021 |
|||||||
| Non-controlling interest |
||||||||
| Pro forma net loss prior to Offering Adjustments |
$ | (57,775 | ) | $ | (3,572 | ) | ||
| Reduction in non-controlling interest ownership due to the Offering Adjustments |
4 | % | 4 | % | ||||
|
|
|
|
|
|||||
| Reduction in net income (loss) attributable to non-controlling interest due to Offering Adjustments |
$ | 2,178 | $ | 135 | ||||
|
|
|
|
|
|||||
| Pro forma adjustments to net income (loss) from the Offering Adjustments |
$ | 5,094 | $ | 12,439 | ||||
| Non-controlling interest ownership immediately following the Offering Adjustments |
25 | % | 25 | % | ||||
|
|
|
|
|
|||||
| Non-controlling interest in the pro forma adjustments to net income (loss) from the Offering Adjustments |
$ | 1,288 | $ | 3,145 | ||||
|
|
|
|
|
|||||
| Total net income (loss) attributable to non-controlling interest immediately following the Offering Transactions |
$ | 3,466 | $ | 3,279 | ||||
|
|
|
|
|
|||||
| (h) | Pro forma basic net income (loss) per share is computed by dividing pro forma net income (loss) attributable to controlling interests by the weighted average shares of Class A and Class D common stock outstanding during the period. Pro forma diluted net income (loss) per share is computed by dividing pro forma net income (loss) by the weighted average shares of Class A and Class D common stock outstanding to give effect to potentially dilutive Class A, B, C and D securities. The weighted average share calculation assumes Class B and C were exchanged for Class A common stock at the beginning of the period, and also includes the dilutive effect of equity-based awards. The impact of including IPO RSUs has been considered but not included as to include would be anti-dilutive. This adjustment is made for the purpose of calculating pro forma diluted income (loss) per share only and does not necessarily reflect the amount of exchanges or exercise of options that may occur subsequent to this offering. The weighted average number of shares underlying the basic income (loss) per share calculation reflects only the shares of Class A and Class D common stock outstanding after the offering as they are the only outstanding shares which participate in distributions or dividends by Clearwater Analytics Holdings, Inc. The Class B and Class C common stock is excluded in the basic income (loss) per share calculation as they do not participate in the distributions or dividends by Clearwater Analytics Holdings, Inc. The following table sets forth a reconciliation of the numerators and denominators used to compute pro forma basic and diluted income (loss) per share. |
78
Table of Contents
Index to Financial Statements
| Year Ended December 31, |
Six Months Ended June 30, |
|||||||
| (in thousands, except per share amounts) | 2020 | 2021 | ||||||
| Basic net income (loss) per share |
||||||||
| Numerator |
||||||||
| Net income (loss) |
$ | (52,681 | ) | $ | 8,867 | |||
| Less: Net income (loss) attributable to non-controlling interest |
(13,318 | ) | 2,242 | |||||
| Net income (loss) attributable to Class A and Class D common stockholders-basic |
(39,363 | ) | 6,625 | |||||
|
|
|
|
|
|||||
| Denominator |
||||||||
| Shares of Class A common stock held by Other Continuing Equity Owners |
12,866 | 12,866 | ||||||
| Shares of Class D common stock held by Principal Equity Owners |
130,084 | 130,084 | ||||||
| Shares of Class A common stock sold in this offering |
30,000 | 30,000 | ||||||
|
|
|
|
|
|||||
| Weighted-average shares of Class A and Class D common stock outstanding-basic |
172,950 | 172,950 | ||||||
|
|
|
|
|
|||||
| Basic net income (loss) per share |
$ | (0.23 | ) | $ | 0.04 | |||
|
|
|
|
|
|||||
| Diluted net income (loss) per share: |
||||||||
| Numerator |
||||||||
| Net income (loss) available to Class A and Class D common stockholders |
$ | (39,363 | ) | $ | 6,625 | |||
| Reallocation of net income (loss) assuming conversion of LLC interests |
(13,318 | ) | 2,242 | |||||
| Net income (loss)-diluted |
(52,681 | ) | 8,867 | |||||
| Denominator |
||||||||
| Weighted-average shares of Class A and Class D common stock outstanding-basic |
172,950 | 172,950 | ||||||
| Weighted-average effect of dilutive securities: |
||||||||
| Dilution from equity-based awards |
( | *) | 8,833 | |||||
| Assumed conversion of LLC interests to shares of Class A and Class D common stock |
58,529 | 58,529 | ||||||
|
|
|
|
|
|||||
| Weighted-average shares of Class A and Class D common stock outstanding - diluted |
231,479 | 240,312 | ||||||
|
|
|
|
|
|||||
| Diluted net income (loss) per share |
$ | (0.23 | ) | $ | 0.04 | |||
|
|
|
|
|
|||||
| (*) | To include dilution from equity-based awards would be anti dilutive. |
79
Table of Contents
Index to Financial Statements
MANAGEMENT’S DISCUSSION AND ANALYSIS OF FINANCIAL CONDITION
AND RESULTS OF OPERATIONS
This section presents management’s perspective on our financial condition and results of operations. The following discussion and analysis is intended to highlight and supplement data and information presented elsewhere in this prospectus, including the consolidated financial statements and related notes and the sections of this prospectus captioned “Summary Consolidated Financial and Other Data” and “Business,” and should be read in conjunction therewith. To the extent that this discussion describes prior performance, the descriptions relate only to the periods listed, which may not be indicative of our future performance. In addition to historical financial information, this discussion and analysis contains forward-looking statements that involve risks, uncertainties and assumptions. Our actual results and timing of selected events may differ materially from management’s expectations as a result of many factors, including those discussed under the sections of this prospectus captioned “Cautionary Note Regarding Forward-Looking Statements” and “Risk Factors.” We assume no obligation to update any of these forward-looking statements, except as required by law.
Historically, our business has been operated through Carbon Analytics Holdings, LLC, together with its subsidiaries. In connection with this offering, Carbon Analytics Holdings, LLC changed its name to CWAN Holdings, LLC. Clearwater Analytics Holdings, Inc. was formed for the purpose of this offering and has engaged to date only in activities in contemplation of this offering. Upon the completion of this offering, Clearwater Analytics Holdings, Inc. will be a holding company and all of our business will continue to be conducted through CWAN Holdings, LLC, together with its subsidiaries, and the financial results of CWAN Holdings, LLC will be consolidated in our financial statements. For more information regarding the organizational transactions and holding company structure, see “Organizational Structure.”
Overview
Clearwater brings transparency to the opaque world of investment accounting and analytics with what we believe is the industry’s most trusted and innovative single instance, multi-tenant technology platform. Our cloud-native software allows clients to radically simplify their investment accounting operations, enabling them to focus on higher-value business functions such as asset allocation strategy and investment selection. Our platform provides comprehensive accounting, data and advanced analytics as well as highly-configurable reporting for global investment assets daily or on-demand, instead of weekly or monthly. We give our clients confidence that they are making the most informed decisions about investment performance, regulatory compliance and risk.
We provide investment accounting and reporting, performance measurement, compliance monitoring and risk analytics solutions for asset managers, insurance companies and large corporations. Every day, Clearwater’s powerful platform aggregates and normalizes data on over $5.6 trillion of global invested assets for over 1,000 clients. We bring modern software to an industry that has long been dominated by difficult-to-use, high cost legacy technologies and processes, which often lack data integrity and traceability, and often require significant manual intervention. The strength of our platform is demonstrated by our approximately 80% win rate for new clients over the prior four years in deals that reached the proposal stage.
We allow our clients to replace legacy systems with modern cloud-native software. Our platform helps clients reduce cost, time, errors and risk and allows them to reallocate resources to other value-creating activities. Our software aggregates, reconciles and validates data from more than 2,500 daily data feeds and more than four million securities that have been modeled across multiple currencies, asset classes and countries. This cleansed and validated data runs through our proprietary accounting, performance, compliance and risk solutions to provide clients with powerful analytics and daily or on-demand configurable reporting. We offer multi-asset class, multi-basis, multi-currency accounting and analytics that provide clients with a comprehensive view of their holdings and related performance. This allows our clients to make better, more timely decisions about their investment portfolios.
80
Table of Contents
Index to Financial Statements
Clearwater benefits from powerful network effects. With our single instance, multi-tenant architecture, every client, whether new or existing, enriches our global data set by making it more complete and accurate. Our software continually sources, ingests, models, reconciles and validates the terms, conditions and features of every investment security held by all of our clients. This continuous process helps to create a single repository of comprehensive, accurate investment data (often referred to within the industry as a “Golden Copy” of data) that benefits all our clients to the extent they otherwise have rights to the data. Through this continuous process, we are able to identify and adjudicate data discrepancies that otherwise could introduce error and risk into our clients’ investment portfolios. We believe that a meaningful competitive advantage of this network effect is that we are increasingly seen as the best and most accurate source of investment accounting data and analytics in the industry.
We have a 100% recurring revenue model. We charge our clients a fee that is primarily based on the amount of assets they manage on our platform, subject to contracted minimums. A majority of the assets on our platform are high-grade fixed income assets, leading to very low levels of volatility and highly predictable revenue streams. When applicable, we charge additional transaction fees for certain complex asset classes (e.g., derivatives and other financial instruments).
We have achieved significant organic growth in recent periods. Our revenues increased from $168 million in the year ended December 31, 2019 to $203 million in the year ended December 31, 2020, representing an increase of 21%. For the six months ended June 30, 2020 and 2021, our revenues were $95 million and $118 million, respectively, representing year-over-year growth of 24%. We had net income of $8 million and a net loss of $44 million in the years ended December 31, 2019 and 2020, respectively, representing net income margin of 5% and net loss margin of (22%), respectively. For the six months ended June 30, 2020 and 2021, we had net income of $14 million and $3 million, representing net income margin of 14% and 3%, respectively. Our adjusted EBITDA was $51 million and $57 million in the years ended December 31, 2019 and 2020, representing adjusted EBITDA margins of 30% and 28%, respectively. For the six months ended June 30, 2020 and 2021, we had adjusted EBITDA of $31 million and $36 million, representing adjusted EBITDA margins of 33% and 30%, respectively. For additional information on adjusted EBITDA, including a reconciliation of adjusted EBITDA to net income, see “—Non-GAAP Financial Measures”.
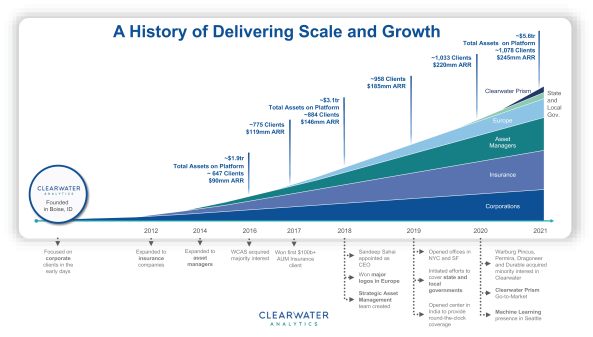
81
Table of Contents
Index to Financial Statements
Key Factors Affecting Our Performance
The growth and future success of our business depends on many factors, including those described below.
| • | Adding New Clients in Established End Markets: Our future growth is dependent upon our ability to continue to add new clients. We are focused on continuing to increase our client base in our established client end-markets of corporations, insurance companies and asset managers, and doing so with increasingly large and sophisticated clients. As we add clients, it takes time to fully onboard their assets to the platform. Our revenue generally increases as assets are added to the platform, while the effort to serve the client is relatively consistent over time. Therefore, we expect revenues and gross margins to increase for a client as the client transitions from the onboarding process to a steady state once assets have been onboarded. In any period, our gross margins may fluctuate based on the relative size and number of clients that we are onboarding at that time. |
| • | Expanding and Retaining Relationships with Existing Clients: Our future growth is dependent upon retaining our existing clients and expanding our relationships with these clients through increases in the amount of their assets on our platform. We have enjoyed consistent gross revenue retention rates of approximately 98% over the past ten quarters. The consistency in revenue retention creates predictability in our business and enables us to better plan our future investments. Our relationships with our clients expands as these clients add more assets to our platform, with our net revenue retention rates (as defined below under “—Key Operating Measures”) above 105% over the past two years. Clients may add assets as a result of acquiring new clients themselves or by acquiring new businesses or simply through organic growth, which produces additional assets that they manage using our platform. We believe that our client service model and technology platform are strong contributing factors in our attractive retention rates. As such, we expect to continue to invest in both our operations and research and development functions to maintain and increase our high levels of client satisfaction, which we believe will lead to strong client retention and expansion. |
| • | International Expansion: We believe that the value provided by our platform is equally applicable to asset owners and asset managers outside of North America, and there is a significant opportunity to expand our client base and usage of our platform internationally. Our future growth is dependent upon our ability to successfully enter new international markets and to expand our client base in our current international markets. Our cost to acquire clients in international markets is currently greater than in North America because there is less awareness of the Clearwater brand and our product capabilities, and we have to date invested less in sales and marketing internationally. For these reasons, we expect to invest more in sales and marketing in international markets relative to North America in order to achieve growth in these international markets. |
| • | Adding New Clients in Adjacent or Nascent End-Markets: Our strategy is to also add new clients in our more nascent end-markets, which include state and local governments, pension funds and sovereign wealth funds, as well as a variety of alternative asset managers. Traditionally, our existing clients have been among our best resources for referring new clients to us, and we will continue to invest in sales and marketing to build awareness of our brand, engage prospective clients and drive adoption of our platform, particularly as it relates to expanding into new end-markets. As we establish our presence in new end-markets, we expect sales and marketing expenditures will be less efficient than in our established verticals and we will become increasingly more efficient at acquiring clients in new end-markets over time. |
| • | Expanding Solutions and Broadening Innovation: Our future growth is dependent upon our continued expansion of our solutions in order to better retain our current clients and to develop new use cases that appeal to new clients. While we believe we will be able to reduce our research and development expenses as a percentage of revenues as we achieve greater scale, our priority is to maintain and grow our technological advantage over our competitors. As we identify opportunities to increase our technological and competitive advantages, we may increase our investments in research and development at rates that are faster than our growth in revenues in order to enhance our long-term growth and profitability. |
82
Table of Contents
Index to Financial Statements
| • | Fluctuations in the Market Value of Assets on the Platform: We generally bill our clients monthly in arrears based on a basis point rate applied to our clients’ assets on our platform, which can be influenced by general economic conditions. While 84% of the assets on our platform were high-grade fixed income securities and structured products as of June 30, 2021 and therefore subject to very low levels of volatility, the value of our clients’ assets on our platform varies on a daily basis due to changes in securities prices, cash flow needs, incremental buying and selling of assets and other strategic priorities of our clients. For these reasons, our revenue is subject to fluctuations based on economic conditions, including market conditions and the changing interest rate environment. |
Key Components of Results of Operations
The following discussion describes certain line items in our consolidated statements of operations.
Revenue
We generate revenue from fees derived from providing clients with access to the solutions and services on our software-as-a-service platform. Sales of our offering include a right to use our software in a hosted environment without taking possession of the software. Our contracts are generally cancellable with 30 days’ notice without penalty. We invoice clients monthly in arrears based on a percentage of the average daily value of assets within a client’s accounts on our platform during that month. Payment terms may vary by contract but generally include a requirement of payment within 30 days following the month in which services are provided. Fees invoiced in advance of the delivery of the Company’s performance obligations are deemed set-up activities and are deferred as a material right and recognized over time, typically 12 months.
Cost of Revenue
Cost of revenue consists of expenses related to delivery of revenue-generating services, including expenses associated with client services, onboarding, reconciliation and agreements related to the purchase of data used in the provision of our services. Salary and benefits for certain personnel associated with supporting these functions, in addition to allocated overhead and depreciation for facilities, are also included in cost of revenue.
Operating Expenses
Research and development expense consists primarily of salary and benefits for our development staff as well as contractors’ fees and other costs associated with the enhancement of our offering, ensuring operational stability and performance and development of new offerings.
Sales and marketing expense consists of the costs of personnel involved in the sales and marketing process, sales commissions, advertising and promotional materials, sales facilities expenses, and the cost of trade shows and seminars.
General and administrative expense consists primarily of personnel costs for information technology, finance, administration, human resources and general management, as well as expenses from legal, corporate technology and accounting service providers.
Interest and Other Expense, Net
Interest and other expense, net primarily relates to interest expense and reflects interest accrued on our outstanding term loan during the course of the applicable period. The accrual of interest varies depending on the timing and amount of borrowings and repayments during the period as well as fluctuations in interest rates. Interest income and foreign currency gains and losses are also included in interest and other expense, net.
83
Table of Contents
Index to Financial Statements
Income Taxes
Income taxes relate to international subsidiaries which are corporations and, therefore, subject to income taxes. The international subsidiaries earn revenue by providing services to the Company on a “cost plus markup” basis. Income taxes are recorded at the statutory rate within income tax expense on the consolidated statement of operations and within income taxes payable on the consolidated balance sheet due to the minimal temporary differences between book expense and the amount of taxes paid within these regimes.
Key Operating Measures
We consider certain operating measures, such as annualized recurring revenue, gross retention rates and net retention rates, in measuring the performance of our business.
Annualized Recurring Revenue
Annualized recurring revenue is calculated at the end of a period by dividing the recurring revenue in the last month of such period by the number of days in the month and multiplying by 365.
The following table summarizes the Company’s annualized recurring revenue as of the dates presented:
| First Quarter |
Second Quarter |
Third Quarter |
Fourth Quarter |
|||||||||||||
| (In thousands) | ||||||||||||||||
| 2021 |
||||||||||||||||
| Annualized recurring revenue |
$ | 232,467 | $ | 245,033 | ||||||||||||
| 2020 |
||||||||||||||||
| Annualized recurring revenue |
$ | 186,521 | $ | 200,492 | $ | 214,877 | $ | 219,901 | ||||||||
| 2019 |
||||||||||||||||
| Annualized recurring revenue |
$ | 158,510 | $ | 167,169 | $ | 178,220 | $ | 185,041 | ||||||||
Because a substantial majority of the assets on our platform have very low levels of volatility with respect to their market value, the growth in annualized recurring revenue is generally not attributable to the fluctuating market value of the assets on our platform. Rather, the growth in annualized recurring revenue is due to an increase in the number of clients using our offering as well as from onboarding more assets of our existing clients onto our platform.
Revenue Retention Rate
Gross revenue retention rate represents annual contract value (“ACV”) at the beginning of the 12-month period ended on the reporting date less client attrition over the prior 12-month period, divided by ACV at the beginning of the 12-month period, expressed as a percentage. ACV is comprised of annualized recurring revenue plus contracted-not-billed revenue, which represents the estimated annual contracted revenue for new and existing client opportunities prior to revenue recognition. In order to arrive at total ACV, we include contracted-not-billed revenue, as it is contracted revenue that has not been recognized but that we expect to produce recognized revenue in the future. Client attrition occurs when a client provides a contract termination notice. The amount of client attrition is calculated as the reduction in annualized revenue of the client at the time of the notice and is recorded in the month the final billing occurs. In the case of client attrition where contracted-not-billed revenue is still present for a client, both annualized recurring revenue and contracted-not-billed revenue associated with such client are deducted from ACV.
Net revenue retention rate is the percentage of recurring revenue retained from clients on the platform for 12 months and includes changes from the addition, removal or value of assets on our platform, contractual
84
Table of Contents
Index to Financial Statements
changes that have an impact to annualized recurring revenues and lost revenue from client attrition. We calculate net revenue retention rate as of a period end by starting with the annualized recurring revenue from clients as of the 12 months prior to such period end. We then calculate the annualized recurring revenue from these clients as of the current period end. We then divide the total current period end annualized recurring revenue by the 12-month prior period end annualized recurring revenue to arrive at the net revenue retention rate.
The following table summarizes our retention rates as of the dates presented:
| First Quarter |
Second Quarter |
Third Quarter |
Fourth Quarter |
|||||||||||||
| 2021 |
||||||||||||||||
| Gross revenue retention rate |
98 | % | 98 | % | ||||||||||||
| Net revenue retention rate |
110 | % | 109 | % | ||||||||||||
| 2020 |
||||||||||||||||
| Gross revenue retention rate |
98 | % | 98 | % | 98 | % | 98 | % | ||||||||
| Net revenue retention rate |
107 | % | 108 | % | 109 | % | 109 | % | ||||||||
| 2019 |
||||||||||||||||
| Gross revenue retention rate |
98 | % | 98 | % | 98 | % | 98 | % | ||||||||
| Net revenue retention rate |
105 | % | 105 | % | 110 | % | 111 | % | ||||||||
Gross revenue retention rates have remained consistently at approximately 98% since 2019. We believe the extremely consistent and high gross revenue retention rate is a testament to the value proposition that our leading solution offers.
Non-GAAP Financial Measures
We also consider certain non-GAAP financial measures that are not prepared in accordance with accounting principles generally accepted in the United States (“GAAP”), such as adjusted EBITDA and adjusted EBITDA Margin, in measuring the performance of our business. The non-GAAP measures are not based on any standardized methodology prescribed by GAAP and are not necessarily comparable to similar measures presented by other companies. However, we believe that this non-GAAP information is useful as an additional means for investors to evaluate our operating performance, when reviewed in conjunction with our GAAP financial statements. These measures should not be considered in isolation or as a substitute for measures prepared in accordance with GAAP, and because these amounts are not determined in accordance with GAAP, they should not be used exclusively in evaluating our business and operations. In addition, undue reliance should not be placed upon non-GAAP or operating information because this information is neither standardized across companies nor subjected to the same control activities and audit procedures that produce our GAAP financial results.
Adjusted EBITDA and Adjusted EBITDA Margin
Adjusted EBITDA and Adjusted EBITDA Margin is a supplemental performance measure that our management uses to assess our operating performance. We define Adjusted EBITDA as net income plus (i) interest expense, net, (ii) depreciation and amortization expense, (iii) equity-based compensation, (iv) Recapitalization compensation expenses and (v) other expenses. We define Adjusted EBITDA Margin as Adjusted EBITDA (as defined above) divided by revenue.
85
Table of Contents
Index to Financial Statements
The following tables reconcile net income (loss) to Adjusted EBITDA and include amounts expressed as a percentage of revenue for the periods indicated.
| Six Months Ended June 30, |
||||||||||||||||
| 2021 | 2020 | |||||||||||||||
| (in thousands) | (%) | (in thousands) | (%) | |||||||||||||
| Net income (loss) |
$ | 3,200 | 3 | % | $ | 13,635 | 14 | % | ||||||||
| Interest expense, net |
16,959 | 14 | % | 10,614 | 11 | % | ||||||||||
| Depreciation and amortization(1) |
1,412 | 1 | % | 1,047 | 1 | % | ||||||||||
| Equity-based compensation |
11,556 | 10 | % | 4,988 | 5 | % | ||||||||||
| Other expenses(1) |
2,491 | 2 | % | 1,013 | 1 | % | ||||||||||
| Adjusted EBITDA |
$ | 35,618 | 30 | % | $ | 31,297 | 33 | % | ||||||||
|
|
|
|
|
|
|
|
|
|||||||||
| Revenue |
$ | 117,770 | 100 | % | $ | 95,109 | 100 | % | ||||||||
| Years Ended December 31, |
||||||||||||||||
| 2020 | 2019 | |||||||||||||||
|
|
|
|
|
|
|
|
|
|||||||||
| (in thousands) | (%) | (in thousands) | (%) | |||||||||||||
| Net income (loss) |
$ | (44,230 | ) | (22 | )% | $ | 7,732 | 5 | % | |||||||
| Interest expense, net |
22,854 | 11 | % | 17,807 | 11 | % | ||||||||||
| Depreciation and amortization(1) |
2,271 | 1 | % | 2,019 | 1 | % | ||||||||||
| Equity-based compensation |
24,602 | 12 | % | 6,233 | 4 | % | ||||||||||
| Recapitalization compensation expenses |
48,998 | 24 | % | — | — | |||||||||||
| Other expenses(2) |
2,555 | 1 | % | 16,992 | 10 | % | ||||||||||
| Adjusted EBITDA |
$ | 57,050 | 28 | % | $ | 50,783 | 30 | % | ||||||||
|
|
|
|
|
|
|
|
|
|||||||||
| Revenue |
$ | 203,222 | 100 | % | $ | 168,001 | 100 | % | ||||||||
| Six Months Ended June 30, |
Years Ended December 31, |
|||||||||||||||
| 2021 | 2020 | 2020 | 2019 | |||||||||||||
| (in thousands) | ||||||||||||||||
| Legal professional service fees |
$ | — | $ | — | $ | — | $ | 14,779 | ||||||||
| Up-C structure expenses |
926 | — | — | — | ||||||||||||
| Management fees and reimbursed expenses |
1,083 | 688 | 1,597 | 1,853 | ||||||||||||
| Income tax expense |
320 | 209 | 902 | 73 | ||||||||||||
| Miscellaneous |
162 | 116 | 56 | 287 | ||||||||||||
|
|
|
|
|
|
|
|
|
|||||||||
| Total other expenses |
$ | 2,491 | $ | 1,013 | $ | 2,555 | $ | 16,992 | ||||||||
|
|
|
|
|
|
|
|
|
|||||||||
| (1) | For the six months ended June 30, 2021 and 2020, and the years ended December 31, 2020 and 2019, depreciation and amortization attributable to: (i) cost of revenue was $771, $513, $1,070 and $1,313, (ii) research and development expenses was $422, $364, $761, and $107, (iii) sales and marketing expenses was $120, $86, $181, and $33, and (iv) general and administrative expenses was $99, $84, $259, $566, respectively. |
| (2) | Other expenses includes professional service fees related to settlement of a legal matter, management fees to our investors, income taxes related to foreign subsidiaries, foreign exchange gains and losses and other expenses that are not reflective of our core operating performance, including the cost of implementing our Up-C structure and entering into the Tax Receivable Agreement. |
86
Table of Contents
Index to Financial Statements
Results of Operations
The following tables set forth our consolidated statements of operations data for the six months ended June 30, 2020 and 2021 and for the years ended December 31, 2019 and 2020. We have derived this data from our audited consolidated financial statements and our unaudited consolidated interim financial statements included elsewhere in this prospectus. This information should be read in conjunction with our audited consolidated financial statements and our unaudited consolidated interim financial statements and related notes included elsewhere in this prospectus.
| Six Months Ended | Years Ended | |||||||||||||||
| June 30, | December 31, | |||||||||||||||
| 2021 | 2020 | 2020 | 2019 | |||||||||||||
| (in thousands) | ||||||||||||||||
| Revenue |
$ | 117,770 | $ | 95,109 | $ | 203,222 | $ | 168,001 | ||||||||
| Cost of revenue |
29,898 | 26,891 | 53,263 | 47,145 | ||||||||||||
|
|
|
|
|
|
|
|
|
|||||||||
| Gross profit |
87,872 | 68,218 | 149,959 | 120,856 | ||||||||||||
|
|
|
|
|
|
|
|
|
|||||||||
| Operating expenses: |
||||||||||||||||
| Research and development |
32,576 | 24,069 | 55,262 | 39,275 | ||||||||||||
| Sales and marketing |
16,025 | 8,600 | 22,243 | 19,082 | ||||||||||||
| General and administrative |
18,727 | 10,974 | 43,874 | 36,802 | ||||||||||||
| Recapitalization compensation expenses |
— | — | 48,998 | — | ||||||||||||
|
|
|
|
|
|
|
|
|
|||||||||
| Total operating expenses |
67,328 | 43,643 | 170,377 | 95,159 | ||||||||||||
|
|
|
|
|
|
|
|
|
|||||||||
| Income (loss) from operations |
20,544 | 24,575 | (20,418 | ) | 25,697 | |||||||||||
| Interest and other expense, net |
(17,024 | ) | (10,730 | ) | (22,910 | ) | (17,892 | ) | ||||||||
|
|
|
|
|
|
|
|
|
|||||||||
| Income (loss) before income taxes |
3,520 | 13,845 | (43,328 | ) | 7,805 | |||||||||||
| Income taxes |
320 | 210 | 902 | 73 | ||||||||||||
|
|
|
|
|
|
|
|
|
|||||||||
| Net income (loss) |
$ | 3,200 | $ | 13,635 | $ | (44,230 | ) | $ | 7,732 | |||||||
|
|
|
|
|
|
|
|
|
|||||||||
The following table sets forth our consolidated statements of operations data expressed as a percentage of revenue for the periods indicated.
| Six Months Ended | Years Ended | |||||||||||||||
| June 30, | December 31, | |||||||||||||||
| 2021 | 2020 | 2020 | 2019 | |||||||||||||
| Revenue |
100 | % | 100 | % | 100 | % | 100 | % | ||||||||
| Cost of revenue |
25 | % | 28 | % | 26 | % | 28 | % | ||||||||
|
|
|
|
|
|
|
|
|
|||||||||
| Gross profit |
75 | % | 72 | % | 74 | % | 72 | % | ||||||||
|
|
|
|
|
|
|
|
|
|||||||||
| Operating expenses: |
||||||||||||||||
| Research and development |
28 | % | 25 | % | 27 | % | 23 | % | ||||||||
| Sales and marketing |
14 | % | 9 | % | 11 | % | 11 | % | ||||||||
| General and administrative |
16 | % | 12 | % | 22 | % | 22 | % | ||||||||
| Recapitalization compensation expenses |
0 | % | 0 | % | 24 | % | 0 | % | ||||||||
|
|
|
|
|
|
|
|
|
|||||||||
| Total operating expenses |
57 | % | 46 | % | 84 | % | 57 | % | ||||||||
|
|
|
|
|
|
|
|
|
|||||||||
| Income (loss) from operations |
17 | % | 26 | % | (10 | %) | 15 | % | ||||||||
| Interest and other expense, net |
(14 | %) | (11 | %) | (11 | %) | (11 | %) | ||||||||
|
|
|
|
|
|
|
|
|
|||||||||
| Income (loss) before income taxes |
3 | % | 15 | % | (21 | %) | 5 | % | ||||||||
| Income taxes |
0 | % | 0 | % | 0 | % | 0 | % | ||||||||
|
|
|
|
|
|
|
|
|
|||||||||
| Net income (loss) |
3 | % | 14 | % | (22 | %) | 5 | % | ||||||||
|
|
|
|
|
|
|
|
|
|||||||||
87
Table of Contents
Index to Financial Statements
The following table presents the Company’s revenue disaggregated by geography, based on billing address of the client for the periods indicated.
| Six Months Ended | Years Ended | |||||||||||||||
| June 30, | December 31, | |||||||||||||||
| 2021 | 2020 | 2020 | 2019 | |||||||||||||
| (in thousands) | ||||||||||||||||
| United States |
$ | 107,346 | $ | 85,477 | $ | 183,745 | $ | 152,112 | ||||||||
| Rest of World |
10,424 | 9,632 | 19,477 | 15,889 | ||||||||||||
|
|
|
|
|
|
|
|
|
|||||||||
| Total revenue |
$ | 117,770 | $ | 95,109 | $ | 203,222 | $ | 168,001 | ||||||||
|
|
|
|
|
|
|
|
|
|||||||||
Comparison of the Six Months Ended June 30, 2021 and 2020 (unaudited)
Revenue
| Six Months Ended June 30, |
||||||||||||||||
| 2021 | 2020 | $ Change | % Change | |||||||||||||
| (in thousands) | ||||||||||||||||
| Revenue |
$ | 117,770 | $ | 95,109 | $ | 22,661 | 24 | % | ||||||||
Revenue increased $22.7 million, or 24%, for the six months ended June 30, 2021 as compared to the corresponding period in 2020. The increase was driven by growth in our client base as we brought new clients onto our platform and also added additional assets onto our platform from existing clients. Average assets loaded on our platform that were billed to customers increased 24% from the six months ended June 30, 2020 to the six months ended June 30, 2021 while the average basis point rate billed to customers decreased by 0.4% from the six months ended June 30, 2020 to the six months ended June 30, 2021.
Cost of Revenue
| Six Months Ended June 30, |
||||||||||||||||
| 2021 | 2020 | $ Change | % Change | |||||||||||||
| (in thousands) | ||||||||||||||||
| Equity-based compensation |
$ | 1,272 | $ | 550 | $ | 722 | 131 | % | ||||||||
| All other cost of revenue |
28,626 | 26,341 | 2,285 | 9 | % | |||||||||||
|
|
|
|
|
|
|
|
|
|||||||||
| Total cost of revenue |
$ | 29,898 | $ | 26,891 | $ | 3,007 | 11 | % | ||||||||
| Percent of revenue |
25% | 28% | ||||||||||||||
88
Table of Contents
Index to Financial Statements
Cost of revenue changed as follows:
| Change From June 30, 2020 to June 30, 2021 |
||||
| (in thousands) | ||||
| Increased payroll and related |
$ | 1,069 | ||
| Increased equity-based compensation |
722 | |||
| Increased data costs |
436 | |||
| Increased outside services and contractors |
322 | |||
| Increased technology |
272 | |||
| Increased depreciation and amortization |
257 | |||
| Decreased travel and entertainment |
(175 | ) | ||
| Other items |
104 | |||
|
|
|
|||
| Total change |
$ | 3,007 | ||
|
|
|
|||
The increase in cost of revenue is primarily due to increased payroll and related costs as a result of headcount growth of additional employees across our client services, onboarding and reconciliation teams and increased data costs to support a larger client base as well as increased equity-based compensation expense due to increased grant-date fair value of equity awards and higher headcount. In addition, the increased utilization of third-party contractors, technology and IT services on operational activities and higher depreciation expense from completion of development projects increased cost of revenue. These increases were partially offset by a reduction in travel and entertainment in response to the COVID-19 pandemic.
Operating Expenses
Research and Development
| Six Months Ended June 30, |
||||||||||||||||
| 2021 | 2020 | $ Change | % Change | |||||||||||||
| (in thousands) | ||||||||||||||||
| Equity-based compensation |
$ | 3,686 | $ | 1,379 | $ | 2,307 | 167 | % | ||||||||
| All other research and development |
28,890 | 22,690 | 6,200 | 27 | % | |||||||||||
|
|
|
|
|
|
|
|
|
|||||||||
| Total research and development |
$ | 32,576 | $ | 24,069 | $ | 8,507 | 35 | % | ||||||||
| Percent of revenue |
28 | % | 25 | % | ||||||||||||
Research and development expense changed as follows:
| Change From June 30, 2020 to June 30, 2021 |
||||
| (in thousands) | ||||
| Increased payroll and related |
$ | 4,076 | ||
| Increased equity-based compensation |
2,307 | |||
| Increased outside services and contractors |
1,156 | |||
| Increased technology |
958 | |||
| Other items |
10 | |||
|
|
|
|||
| Total change |
$ | 8,507 | ||
|
|
|
|||
The increase in research and development expense was primarily due to increased payroll and related costs as a result of headcount growth of additional employees to focus on new offerings as well as increased equity-
89
Table of Contents
Index to Financial Statements
based compensation expense due to increased grant-date fair value of equity awards, higher headcount and strategic hiring to the executive team. In addition, research and development expense increased from higher utilization of third-party contractors, IT services and cloud computing services.
Sales and Marketing
| Six Months Ended | ||||||||||||||||
| June 30, | ||||||||||||||||
| 2021 | 2020 | $ Change | % Change | |||||||||||||
| (in thousands) | ||||||||||||||||
| Equity-based compensation |
$ | 2,127 | $ | 732 | $ | 1,395 | 191 | % | ||||||||
| All other sales and marketing |
13,898 | 7,868 | 6,030 | 77 | % | |||||||||||
|
|
|
|
|
|
|
|
|
|||||||||
| Total sales and marketing |
$ | 16,025 | $ | 8,600 | $ | 7,425 | 86 | % | ||||||||
| Percent of revenue |
14 | % | 9 | % | ||||||||||||
Sales and marketing expense changed as follows:
| Change From June 30, 2020 to June 30, 2021 |
||||
| (in thousands) | ||||
| Increased payroll and related |
$ | 4,628 | ||
| Increased equity-based compensation |
1,395 | |||
| Increased outside services and contractors |
1,070 | |||
| Increased marketing |
227 | |||
| Decreased travel and entertainment |
(167 | ) | ||
| Other items |
272 | |||
|
|
|
|||
| Total change |
$ | 7,425 | ||
|
|
|
|||
The increase in sales and marketing expense is primarily due to increased payroll and related costs as a result of headcount growth of additional employees to expand sales coverage as well as increased equity-based compensation expense due to increased grant-date fair value of equity awards, higher headcount and strategic hiring to the executive team. In addition, sales and marketing expense increased from higher utilization of third-party contractors on marketing activities and higher marketing costs due to increased focus on public relations and branding. These increases were partially offset by a reduction in travel and entertainment costs primarily in response to the COVID-19 pandemic.
General and Administrative
| Six Months Ended June 30, |
|
|
||||||||||||||
| 2021 | 2020 | $ Change | % Change | |||||||||||||
| (in thousands) | ||||||||||||||||
| Equity-based compensation |
$ | 4,471 | $ | 2,327 | $ | 2,144 | 92 | % | ||||||||
| All other general and administrative |
14,256 | 8,647 | 5,609 | 65 | % | |||||||||||
|
|
|
|
|
|
|
|
|
|||||||||
| Total general and administrative |
$ | 18,727 | $ | 10,974 | $ | 7,753 | 71 | % | ||||||||
| Percent of revenue |
16 | % | 12 | % | ||||||||||||
90
Table of Contents
Index to Financial Statements
General and administrative expense changed as follows:
| Change From | ||||
| June 30, 2020 to June 30, 2021 |
||||
| (in thousands) | ||||
| Increased equity-based compensation |
$ | 2,144 | ||
| Increased outside services and contractors |
1,734 | |||
| Increased payroll and related |
1,470 | |||
| Increased recruiting |
934 | |||
| Increased costs associated with Up-C structure |
926 | |||
| Increased technology |
424 | |||
| Decreased travel and entertainment |
(168 | ) | ||
| Other items |
289 | |||
|
|
|
|||
| Total change |
$ | 7,753 | ||
|
|
|
|||
The increase in general and administrative expense was primarily due to increased equity-based compensation expense due to increased grant-date fair value of equity awards and additional headcount, increased costs from higher utilization of third-party contractors on accounting, IT and compliance activities, increased payroll and related costs as a result of headcount growth of additional employees, and increased recruiting costs to support hiring for growth initiatives. In addition, general and administrative expense increased due to accounting and legal professional service costs associated with creating the Up-C structure and developing the Tax Receivable Agreement, and higher utilization of IT services. These increases were partially offset by a reduction in travel and entertainment costs primarily in response to the COVID-19 pandemic.
Interest and Other Expense, Net
| Six Months Ended June 30, |
||||||||||||||||
| 2021 | 2020 | $ Change | % Change | |||||||||||||
| (in thousands) | ||||||||||||||||
| Interest and other expense, net |
$ | (17,024 | ) | $ | (10,730 | ) | $ | (6,294 | ) | 59 | % | |||||
| Percent of revenue |
(14% | ) | (11% | ) | ||||||||||||
The increase in interest and other expense, net was primarily due to increased interest expense related to incremental borrowings following our debt refinancing in October 2020.
Income Taxes
| Six Months Ended |
||||||||||||||||
| June 30, | ||||||||||||||||
| 2021 | 2020 | $ Change | % Change | |||||||||||||
| (in thousands) | ||||||||||||||||
| Income taxes |
$ | 320 | $ | 210 | $ | 110 | 52 | % | ||||||||
The increase in income taxes relates to higher foreign jurisdiction income in the period.
Comparison of the Years Ended December 31, 2020 and 2019
Revenue
| Years Ended | ||||||||||||||||
| December 31, | ||||||||||||||||
| 2020 | 2019 | $ Change | % Change | |||||||||||||
| (in thousands) | ||||||||||||||||
| Revenue |
$ | 203,222 | $ | 168,001 | $ | 35,221 | 21 | % | ||||||||
91
Table of Contents
Index to Financial Statements
Revenue increased $35.2 million, or 21%, in 2020 compared to 2019. The increase was on account of growth in our client base as we brought new clients onto our platform and also added additional assets onto our platform from existing clients. Average assets on our platform that were billed to clients increased 24% from 2019 to 2020 while the average basis point rate billed to customers decreased by 2.7% from 2019 to 2020.
Cost of Revenue
| Years Ended | ||||||||||||||||
| December 31, | ||||||||||||||||
| 2020 | 2019 | $ Change | % Change | |||||||||||||
| (in thousands) | ||||||||||||||||
| Equity-based compensation |
$ | 1,669 | $ | 564 | $ | 1,105 | 196 | % | ||||||||
| All other cost of revenue |
51,594 | 46,581 | 5,013 | 11 | % | |||||||||||
|
|
|
|
|
|
|
|
|
|||||||||
| Total cost of revenue |
$ | 53,263 | $ | 47,145 | $ | 6,118 | 13 | % | ||||||||
| Percent of revenue |
26% | 28% | ||||||||||||||
Cost of revenue changed as follows:
| Change From | ||||
| December 31, 2019 to December 31, 2020 |
||||
| (in thousands) | ||||
| Increased payroll and related |
$ | 4,938 | ||
| Increased equity-based compensation |
1,105 | |||
| Increased facilities and infrastructure expenses |
994 | |||
| Decreased travel and entertainment |
(733 | ) | ||
| Other items |
(186 | ) | ||
|
|
|
|||
| Total change |
$ | 6,118 | ||
|
|
|
|||
The increase in cost of revenue is primarily due to increased payroll and related costs as a result of headcount growth of additional employees across our client services, onboarding and reconciliation teams to support a larger client base, and higher equity-based compensation expense related to the equity award modifications that took place in January 2020 and November 2020. Facilities and infrastructure expenses also increased due to the opening and expansion of offices in Edinburgh, United Kingdom and Noida, India in late 2019, and New York in September 2020. These increases were partially offset by a reduction in travel and entertainment in response to the COVID-19 pandemic.
Research and Development
| Years Ended | ||||||||||||||||
| December 31, | ||||||||||||||||
| 2020 | 2019 | $ Change | % Change | |||||||||||||
| (in thousands) | ||||||||||||||||
| Equity-based compensation |
$ | 4,208 | $ | 1,722 | $ | 2,486 | 144 | % | ||||||||
| All other research and development |
51,054 | 37,553 | 13,501 | 36 | % | |||||||||||
|
|
|
|
|
|
|
|
|
|||||||||
| Total research and development |
$ | 55,262 | $ | 39,275 | $ | 15,987 | 41 | % | ||||||||
| Percent of revenue |
27% | 23% | ||||||||||||||
92
Table of Contents
Index to Financial Statements
Research and development expense changed as follows:
| Change From | ||||
| December 31, 2019 to December 31, 2020 |
||||
| (in thousands) | ||||
| Increased payroll and related |
$ | 9,135 | ||
| Increased technology |
3,604 | |||
| Increased equity-based compensation |
2,486 | |||
| Increased depreciation and amortization |
654 | |||
| Increased facilities and infrastructure expenses |
623 | |||
| Decreased travel and entertainment costs |
(310 | ) | ||
| Other items |
(205 | ) | ||
|
|
|
|||
| Total change |
$ | 15,987 | ||
|
|
|
|||
The increase in research and development expense is primarily due to increased payroll and related costs as a result of headcount growth of additional employees to focus on new offerings, increased technology costs from higher utilization of third-party cloud computing services and other third-party IT services, higher equity-based compensation related to the equity modifications in January and November 2020, and increased allocations of depreciation and facility costs. These increases were partially offset by a reduction in travel and entertainment in response to the COVID-19 pandemic.
Sales and Marketing
| Years Ended | ||||||||||||||||
| December 31, | ||||||||||||||||
| 2020 | 2019 | $ Change | % Change | |||||||||||||
| (in thousands) | ||||||||||||||||
| Equity-based compensation |
$ | 3,911 | $ | 922 | $ | 2,989 | 324 | % | ||||||||
| All other sales and marketing |
18,332 | 18,160 | 172 | 1 | % | |||||||||||
|
|
|
|
|
|
|
|
|
|||||||||
| Total sales and marketing |
$ | 22,243 | $ | 19,082 | $ | 3,161 | 17 | % | ||||||||
| Percent of revenue |
11% | 11% | ||||||||||||||
Sales and marketing expense changed as follows:
| Change From December 31, 2019 to December 31, 2020 |
||||
| (in thousands) | ||||
| Increased equity-based compensation |
$ | 2,989 | ||
| Increased payroll and related |
1,572 | |||
| Increased outside services and contractors |
730 | |||
| Decreased travel and entertainment |
(1,429 | ) | ||
| Decreased marketing |
(579 | ) | ||
| Other items |
(122 | ) | ||
|
|
|
|||
| Total change |
$ | 3,161 | ||
|
|
|
|||
The increase in sales and marketing expense is primarily due to higher equity-based compensation related to the equity award modifications in January and November 2020, higher payroll and related costs due to headcount growth of additional employees to expand sales coverage, and higher utilization of third-party contractors on marketing activities. These increases were partially offset by a reduction in travel and entertainment and marketing costs in response to the COVID-19 pandemic.
93
Table of Contents
Index to Financial Statements
General and Administrative
| Years Ended December 31, |
||||||||||||||||
| 2020 | 2019 | $ Change | % Change | |||||||||||||
| (in thousands) | ||||||||||||||||
| Equity-based compensation |
$ | 14,814 | $ | 3,025 | $ | 11,789 | 390 | % | ||||||||
| All other general and administrative |
29,060 | 33,777 | (4,717 | ) | (14 | %) | ||||||||||
|
|
|
|
|
|
|
|
|
|||||||||
| Total general and administrative |
$ | 43,874 | $ | 36,802 | $ | 7,072 | 19 | % | ||||||||
| Percent of revenue |
22% | 22% | ||||||||||||||
General and administrative expense changed as follows:
| Change From December 31, 2019 to December 31, 2020 |
||||
| (in thousands) | ||||
| Increased equity-based compensation |
$ | 11,789 | ||
| Increased accrued sales tax liability |
8,593 | |||
| Increased payroll and related |
2,000 | |||
| Decreased outside services and contractors |
(13,742 | ) | ||
| Decreased facilities and infrastructure expenses |
(1,426 | ) | ||
| Other items |
(142 | ) | ||
|
|
|
|||
| Total change |
$ | 7,072 | ||
|
|
|
|||
The increase in general and administrative expense is due to higher equity-based compensation related to the equity modifications in January and November 2020, increased accrued sales tax liability due to a change in our estimate of the liability following the completion of a comprehensive review of sales tax reporting obligations across jurisdictions during 2020, and higher payroll and related costs as a result of headcount growth of additional employees and higher bonuses. These increases were partially offset by lower legal expenses relating to legal matters, and a reduction in allocated facility costs.
Recapitalization Compensation Expense
| Years Ended December 31, |
||||||||||||||||
| 2020 | 2019 | $ Change | % Change | |||||||||||||
| (in thousands) | ||||||||||||||||
| Recapitalization compensation expenses |
$ | 48,998 | — | $ | 48,998 | *NMF | ||||||||||
| Percent of revenue |
24% | |||||||||||||||
| * | NMF – not meaningful |
94
Table of Contents
Index to Financial Statements
During November 2020, we completed the Recapitalization transaction on behalf of existing unitholders. The transaction allowed existing unitholders to sell their units to new investors. In connection with the transaction, selling unitholders contributed $49.0 million towards bonuses paid to employees and related payroll taxes in 2020. These amounts have been recorded as Recapitalization compensation expenses within the consolidated statement of operations and as a contribution in members’ deficit within the consolidated balance sheet. The bonuses were paid to employees from departments which have historically been recorded in the below categories in the consolidated statements of operations:
| Year Ended December 31, 2020 |
||||
| (in thousands) | ||||
| Cost of revenue |
$ | 6,205 | ||
| Research and development |
8,891 | |||
| Sales and marketing |
7,951 | |||
| General and administrative |
25,951 | |||
|
|
|
|||
| Total Recapitalization compensation expenses |
$ | 48,998 | ||
|
|
|
|||
Interest and Other Expense, Net
| Years Ended December 31, |
||||||||||||||||
| 2020 | 2019 | $ Change | % Change | |||||||||||||
| (in thousands) | ||||||||||||||||
| Interest and other expense, net |
$ | (22,910 | ) | $ | (17,892 | ) | $ | (5,018 | ) | 28 | % | |||||
| Percent of revenue |
(11% | ) | (11% | ) | ||||||||||||
Interest and other expense, net changed as follows:
| Change From December 31, 2019 to December 31, 2020 |
||||
| (in thousands) | ||||
| Impact of foreign exchange |
$ | 49 | ||
| Increase in interest expense |
(4,781 | ) | ||
| Other items |
(286 | ) | ||
|
|
|
|||
| Total change |
$ | (5,018 | ) | |
|
|
|
|||
The increase in interest and other expense, net increased primarily due to increased interest expense related to incremental borrowings following our debt refinancing in October 2020.
Income Taxes
| Years Ended December 31, |
||||||||||||||||
| 2020 | 2019 | $ Change | % Change | |||||||||||||
| (in thousands) | ||||||||||||||||
| Income taxes |
$ | 902 | $ | 73 | $ | 829 | 1136 | % | ||||||||
Income taxes relate to our international subsidiaries which recognize revenues on “cost plus markup,” and the increase in income taxes is due to growth in our European operations and India.
95
Table of Contents
Index to Financial Statements
Quarterly Results of Operations
The following table represents our unaudited quarterly results of operations. This information should be read in conjunction with our consolidated financial statements and related notes thereto included elsewhere in this prospectus. We have prepared the unaudited consolidated quarterly financial information for the quarters presented on the same basis as our consolidated financial statements. The historical quarterly results presented are not necessarily indicative of the results that may be expected for any future periods.
| Three Months Ended | ||||||||||||||||||||||||
| March 31, 2020 |
June 30, 2020 |
September 30, 2020 |
December 31, 2020 |
March 31, 2021 |
June 30, 2021 |
|||||||||||||||||||
| (in thousands) | ||||||||||||||||||||||||
| Revenue |
$ | 46,463 | $ | 48,646 | $ | 53,355 | $ | 54,758 | $ | 56,894 | $ | 60,876 | ||||||||||||
| Cost of revenue(1) |
13,812 | 13,079 | 12,325 | 14,047 | 14,322 | 15,576 | ||||||||||||||||||
|
|
|
|
|
|
|
|
|
|
|
|
|
|||||||||||||
| Gross profit |
32,651 | 35,567 | 41,030 | 40,711 | 42,572 | 45,300 | ||||||||||||||||||
|
|
|
|
|
|
|
|
|
|
|
|
|
|||||||||||||
| Operating expenses: |
||||||||||||||||||||||||
| Research and development(1) |
11,777 | 12,292 | 14,760 | 16,433 | 15,836 | 16,740 | ||||||||||||||||||
| Sales and marketing(1) |
4,547 | 4,053 | 4,661 | 8,982 | 7,211 | 8,814 | ||||||||||||||||||
| General and administrative(1) |
6,169 | 4,805 | 5,104 | 27,796 | 7,543 | 11,184 | ||||||||||||||||||
| Recapitalization compensation expenses |
— | — | — | 48,998 | — | — | ||||||||||||||||||
|
|
|
|
|
|
|
|
|
|
|
|
|
|||||||||||||
| Total operating expenses |
22,493 | 21,150 | 24,525 | 102,209 | 30,590 | 36,738 | ||||||||||||||||||
|
|
|
|
|
|
|
|
|
|
|
|
|
|||||||||||||
| Income (loss) from operations |
10,158 | 14,417 | 16,505 | (61,498 | ) | 11,982 | 8,562 | |||||||||||||||||
| Interest and other expense, net |
(5,169 | ) | (5,561 | ) | (4,907 | ) | (7,273 | ) | (8,527 | ) | (8,497 | ) | ||||||||||||
|
|
|
|
|
|
|
|
|
|
|
|
|
|||||||||||||
| Income (loss) before income taxes |
4,989 | 8,856 | 11,598 | (68,771 | ) | 3,455 | 65 | |||||||||||||||||
| Income taxes |
162 | 48 | 99 | 593 | 44 | 276 | ||||||||||||||||||
|
|
|
|
|
|
|
|
|
|
|
|
|
|||||||||||||
| Net income (loss) |
$ | 4,827 | $ | 8,808 | $ | 11,499 | $ | (69,364 | ) | $ | 3,411 | $ | (211 | ) | ||||||||||
|
|
|
|
|
|
|
|
|
|
|
|
|
|||||||||||||
| (1) | Includes equity-based compensation expense as follows: |
| Three Months Ended | ||||||||||||||||||||||||
| March 31, 2020 |
June 30, 2020 |
September 30, 2020 |
December 31, 2020 |
March 31, 2021 |
June 30, 2021 |
|||||||||||||||||||
| (in thousands) | ||||||||||||||||||||||||
| Cost of revenue |
$ | 371 | $ | 179 | $ | 174 | $ | 946 | $ | 523 | $ | 749 | ||||||||||||
| Research and development |
906 | 472 | 487 | 2,342 | 1,652 | 2,034 | ||||||||||||||||||
| Sales and marketing |
525 | 207 | 212 | 2,967 | 832 | 1,295 | ||||||||||||||||||
| General and administrative |
1,502 | 825 | 842 | 11,645 | 1,858 | 2,613 | ||||||||||||||||||
|
|
|
|
|
|
|
|
|
|
|
|
|
|||||||||||||
| Total equity-based compensation |
$ | 3,304 | $ | 1,683 | $ | 1,715 | $ | 17,900 | $ | 4,865 | $ | 6,691 | ||||||||||||
|
|
|
|
|
|
|
|
|
|
|
|
|
|||||||||||||
Liquidity and Capital Resources
To date, we have primarily financed our operations through cash flows from operations.
As of June 30, 2021, we had cash and cash equivalents of $41.0 million. Cash and cash equivalents primarily consist of money market mutual funds, which are highly liquid investments purchased with an original or remaining maturity of 90 days or less at the date of purchase. We believe our existing cash and cash equivalents, together with the proceeds from this offering, will be sufficient to meet our operating working capital and capital expenditure requirements over the next 12 months. Our future financing requirements will depend on many factors, including our growth rate, revenue retention rates, the timing and extent of spending to
96
Table of Contents
Index to Financial Statements
support development of our platform and any future investments or acquisitions we may make. Although we currently are not a party to any agreement and do not have any understanding with any third parties with respect to future investments in, or acquisitions of, businesses or technologies, we may enter into these types of arrangements following the effectiveness of the registration statement of which this prospectus forms a part, which could also require us to seek additional equity or debt financing. Additional funds may not be available on terms favorable to us or at all, including as a result of disruptions in the credit markets. See “Risk Factors.”
The following table shows our cash flows from operating activities, investing activities and financing activities for the stated periods:
| Six Months Ended June 30, |
Years Ended December 31, |
|||||||||||||||
| 2021 | 2020 | 2020 | 2019 | |||||||||||||
| (in thousands) | ||||||||||||||||
| Net cash provided by (used in) operating activities |
$ | (16,352 | ) | $ | 11,535 | $ | (6,486 | ) | $ | (230,029 | ) | |||||
| Net cash used in investing activities |
(2,231 | ) | (2,386 | ) | (3,806 | ) | (3,372 | ) | ||||||||
| Net cash provided by (used in) financing activities |
(1,341 | ) | (525 | ) | 51,041 | 237,715 | ||||||||||
| Effect of exchange rate changes on cash and cash equivalents |
(133 | ) | (158 | ) | 85 | 87 | ||||||||||
|
|
|
|
|
|
|
|
|
|||||||||
| Increase (decrease) in cash and cash equivalents |
$ | (20,057 | ) | $ | 8,466 | $ | 40,834 | $ | 4,401 | |||||||
|
|
|
|
|
|
|
|
|
|||||||||
Cash Flows from Operating Activities
Net cash used in operating activities of $16.4 million during the six months ended June 30, 2021 was primarily the result of changes in operating assets and liabilities that decreased operating cash flow by $35.0 million. Accounts receivable increased $12.2 million during the period. The increase is comprised of $7.7 million from growth in revenues and $4.5 million from aging of receivables due to certain clients’ changing their internal systems and processes which caused a delay in remittance of payment. We do not expect any delay in the timing of payment for future invoices with these clients and we do not expect these clients’ accounts receivable to remain at these elevated levels. Prepaid expenses and other assets increased by $11.4 million primarily from the prepayment of management fees to certain affiliates of the Principal Equity Owners in the amount of $9.6 million. Accrued expenses and other liabilities decreased $9.5 million primarily due to payment of sales tax liabilities of $5.4 million, and reimbursement of $4.9 million in excess contribution to investors as part of the Recapitalization.
Net cash provided by operating activities of $11.5 million during the six months ended June 30, 2020 was primarily the result of our net income plus non-cash charges including equity-based compensation, depreciation and amortization. Cash flows resulting from changes in assets and liabilities include an increase accounts receivable, an increase in prepaid expenses and other assets, a decrease in accrued expenses and other liabilities and a decrease in accrued interest on debt. The increase in accounts receivable is a result of growth in revenues during the period. The increase in prepaid expenses was due to prepaid IT costs in preparation for moving to a work from home environment in response to the COVID-19 pandemic. Accrued expenses and other liabilities decreased due to lower accrued bonuses and commissions. Accrued interest on debt decreased due to timing of payments to our lender.
Net cash used in operating activities of $6.5 million during 2020 was primarily the result of our net loss plus non-cash charges including equity-based compensation, depreciation and amortization. Cash flows resulting from changes in assets and liabilities include an increase in accounts receivable, an increase in accrued expenses and other liabilities, an increase in accrued sales tax liability, an increase in deferred commissions, and an increase in accrued interest on debt. Accounts receivable increased as a result of increased revenue and timing of collections.
97
Table of Contents
Index to Financial Statements
Accrued expenses and other liabilities increased due to accrued reimbursement to members of an excess contribution following the Company’s calculation of actual costs incurred related to the Recapitalization. Accrued sales tax liability increased due to a change in our estimate of the liability following the completion of a comprehensive review of sales tax reporting obligations across jurisdictions during 2020. The increase in deferred commissions is due to higher revenues during the period. Accrued interest on debt increased due to incremental borrowings following our debt refinancing in October 2020.
Net cash used in operating activities of $230.0 million during 2019 was primarily due to payment of legal fees and settlement of outstanding legal matters. The Company secured additional borrowing capacity through amendments to our credit facility and raised additional capital from existing investors to fund the settlement of a legal matter and related fees.
Cash Flows from Investing Activities
Net cash used in investing activities of $2.2 million during the six months ended June 30, 2021 was attributable to the purchase of property and equipment.
Net cash used in investing activities of $2.4 million during the six months ended June 30, 2020 was attributable to the purchase of property and equipment.
Net cash used in investing activities of $3.8 million during 2020 was attributable to the purchase of property and equipment.
Net cash used in investing activities of $3.4 million during 2019 was attributable to the purchase of property and equipment.
Cash Flows from Financing Activities
Net cash used in financing activities during the six months ended June 30, 2021 was $1.3 million, of which $1.5 million was from payments on debt, $0.6 million was from the repurchase of common units, $0.4 million was from payment of costs associated with this offering and $0.6 million was from minimum tax withholding paid on behalf of employees for net unit settlement, which was offset by a $1.5 million payment for purchase of common units by newly appointed directors and $0.3 million of proceeds from exercise of options.
Net cash used in financing activities during the six months ended June 30, 2020 was $0.5 million, attributable to payments on debt.
Net cash provided by financing activities during 2020 was $51.0 million, of which $202.7 million was from proceeds from borrowings under an amendment to our credit facility and $49.0 million was from contributions from members for Recapitalization compensation expenses, which was offset by $173.2 million of dividends and distributions to members, $21.6 million for the repayment of borrowings and a $5.8 million payment of debt issuance costs.
Net cash provided by financing activities during 2019 was $237.7 million, of which $137.0 million was from proceeds related to the completion of a rights offering, $2.6 million was from proceeds from the exercise of options and $105.0 million was from proceeds from borrowings under our credit facility, which was offset by a $2.6 million payment of debt issuance costs, $3.8 million for the repurchase of common units and $0.5 million for the repayment of borrowings.
Existing Term Loan Facility and Revolving Line of Credit
On September 1, 2016, we entered into a credit agreement (as amended from time to time, the “Existing Credit Agreement”) with various lenders and Ares Capital Corporation, as Administrative Agent, Lender and
98
Table of Contents
Index to Financial Statements
Issuing Lender, and Golub Capital LLC, as Joint Lead Arranger, Joint Bookrunner and Syndication Agent. The Existing Credit Agreement was amended pursuant to the First Amendment to Credit Agreement, dated as of December 23, 2016, the Second Amendment to Credit Agreement, dated as of March 23, 2018, the Third Amendment to Credit Agreement, dated as of July 3, 2019, the Fourth Amendment to Credit Agreement, dated as of December 3, 2019, and the Fifth Amendment to Credit Agreement, dated as of October 19, 2020.
The Existing Credit Agreement currently provides for a $435 million term loan facility and a $30 million revolving line of credit. The proceeds of the term loan facility and revolving line of credit may be used for general corporate purposes, including to finance dividends, repurchase stock, finance acquisitions or finance other investments. Amounts outstanding under the term loan facility and revolving line of credit are due in full no later than October 31, 2025. The interest rates applicable under the Existing Credit Agreement are based on a fluctuating rate of interest determined by reference to an index rate plus an applicable margin ranging from 4.50% to 5.25% or a LIBOR rate plus an applicable margin ranging from 5.50% to 6.25%. Borrowings under the Existing Credit Agreement were subject to an interest rate equal to 7.25% as of June 30, 2021. In addition, the revolving line of credit is subject to an unused commitment fee, payable quarterly, in an aggregate amount equal to 0.5% of the unutilized commitments.
The following is a summary of our outstanding debt balances under the Existing Credit Agreement as of the end of the periods indicated:
| Six Months Ended June 30, |
Years Ended December 31, |
|||||||||||||||
| 2021 | 2020 | 2020 | 2019 | |||||||||||||
| (in thousands) | ||||||||||||||||
| Term loan facility |
$ | 432,692 | $ | 252,575 | $ | 434,231 | $ | 253,100 | ||||||||
|
|
|
|
|
|
|
|
|
|||||||||
| Total |
$ | 432,692 | $ | 252,575 | $ | 434,231 | $ | 253,100 | ||||||||
|
|
|
|
|
|
|
|
|
|||||||||
The Existing Credit Agreement contains certain customary affirmative covenants and events of default. The negative covenants in the Existing Credit Agreement include, among others, limitations on our ability (subject to negotiated exceptions) to incur additional indebtedness or issue additional preferred stock, incur liens on assets, enter into agreements related to mergers and acquisitions, dispose of assets or pay dividends and distributions. We were in compliance with all covenants under the Existing Credit Agreement as of June 30, 2021, including the consolidated leverage ratio contained in the Existing Credit Agreement, as follows:
| Covenant |
Covenant Requirement |
Ratio Calculation as of June 30, 2021 | ||
| Leverage ratio(1) |
Maximum 8.75x | 5.61x |
| (1) | Calculated as the ratio of total debt to EBITDA (as defined in the Existing Credit Agreement, the calculation of which differs from our calculation of adjusted EBITDA included elsewhere in this prospectus) for the period of four consecutive quarters on the measurement date. |
New Credit Agreement
Clearwater Analytics, LLC (the “Borrower”) has entered into negotiations with respect to a $55 million New Term Loan and a $125 million New Revolving Facility. The New Facilities will be pursuant to a new credit agreement (the “New Credit Agreement”) with JPMorgan Chase Bank, N.A., as administrative agent thereunder, which is expected to be entered into substantially concurrently with this offering.
99
Table of Contents
Index to Financial Statements
It is anticipated that the proceeds of the New Term Loan (and if necessary, cash on hand) will be used to refinance the loans outstanding under the Existing Credit Agreement and pay certain transaction expenses. The New Revolving Facility will be used for working capital and other general corporate purposes (including acquisitions permitted under the New Credit Agreement).
The interest rates applicable to the loans under the New Credit Agreement are anticipated to be based on a fluctuating rate of interest determined by reference to a base rate plus an applicable margin of 0.75% or a LIBOR rate plus an applicable margin of 1.75%, in each case with a step-up of 0.25% if certain secured net leverage levels are not achieved. The applicable margin is adjusted after the completion of each full fiscal quarter based upon the pricing grid in the New Credit Agreement. It is anticipated that the revolving commitment will have an unused commitment fee of 25 basis points, stepping up to 30 basis points if certain secured net leverage levels are not achieved.
It is anticipated that under the New Credit Agreement, the term loans will amortize at a rate of 5.00% per annum, paid quarterly. The New Credit Agreement is anticipated to contain mandatory prepayments to the extent the company incurs certain indebtedness or receives proceeds from certain dispositions or casualty events.
The obligations of the Borrower under the New Credit Agreement are anticipated to be jointly and severally guaranteed by its direct parent and certain of its subsidiaries (collectively, the “Guarantors”, and together with the Borrower, the “Loan Parties”). The obligations of the Loan Parties are anticipated to be secured by a first priority lien on substantially all of their assets, subject to customary exceptions.
The New Credit Agreement is anticipated to contain customary affirmative and negative covenants, including, without limitation, covenants that restrict our ability to borrow money, grant liens, make investments, make restricted payments or dispose of assets, and customary events of default. Specifically, we are required to maintain a consolidated secured net indebtedness to consolidated EBITDA ratio of not more than 4.75:1.00 as of the last day of each fiscal quarter commencing with the fiscal quarter ending December 31, 2021.
Off-Balance Sheet Arrangements
At December 31, 2020 and June 30, 2021, we did not have any relationships with unconsolidated entities or financial partnerships, such as entities often referred to as structured finance or special purpose entities, which would have been established for the purpose of facilitating off-balance sheet arrangements or other contractually narrow or limited purposes. As such, we are not materially exposed to any financing, liquidity, market or credit risk that could arise if we had engaged in such relationships.
Critical Accounting Policies and Estimates
Management’s discussion and analysis of our financial condition and results of operations are based upon our consolidated financial statements and related notes, which have been prepared in accordance with GAAP. We review the accounting policies used in reporting our financial results on a regular basis. The preparation of these financial statements requires us to make estimates and judgments that affect the reported amounts of assets, liabilities, revenues and expenses, and related disclosure of contingent liabilities.
On an ongoing basis, we evaluate the process we use to develop estimates. We base our estimates on historical experience and on other information that we believe is reasonable for making judgments at the time the estimates are made. Actual results may differ from our estimates due to actual outcomes being different from those on which we based our assumptions.
We believe the following accounting policies contain the more significant judgments and estimates used in the preparation of our consolidated financial statements:
| • | Revenue recognition and deferred revenue |
| • | Equity-based compensation |
100
Table of Contents
Index to Financial Statements
Revenue recognition and deferred revenue
We earn revenues primarily from providing access to our Software-as-a-Service platform solution to our clients, and to a lesser degree, from services that support the implementation on the platform. We recognize revenue when we satisfy performance obligations under the terms of the contract in an amount that reflects the consideration we expect to receive in exchange for the services. We determine the appropriate amount of revenue to be recognized using the following steps: (i) identification of contracts with clients, (ii) identification of the performance obligations in the contract, (iii) determination of transaction price, (iv) allocation of contract transaction price to the performance obligation, and (v) recognition of revenue when or as we satisfy a performance obligation. Often contracts contain more than one performance obligation. Performance obligations are the unit of accounting for revenue recognition and generally represent the distinct services that are promised to the client.
We typically bill our clients monthly in arrears based on a percentage of the average of the daily value of the assets within a client’s accounts on our platform. Payment terms may vary by contract but generally include a requirement of payment within 30 days following the month in which services were provided. Clients generally have the right to cancel with 30 days’ notice with no penalty.
Our services allow the client to access the services without taking possession of the software. Non-refundable fees invoiced in advance of the delivery of our performance obligations are deemed set-up activities and are deferred as a material right and recognized over time, typically 12 months. After set-up activities, clients typically receive benefits from implementation services prior to the “go live” date, at which point they can use the platform as intended in the arrangement. We have determined these implementation services are generally a separate performance obligation. As our platform must stand ready to provide the services throughout the contract period, revenues are recognized as the services are provided over time beginning on the date the service is made available as intended in the arrangement.
Deferred revenue generally consists of non-refundable fees invoiced during the period in which we are performing set-up activities. Deferred revenue that will be recognized during the succeeding twelve-month period is recorded as current deferred revenue.
Equity-Based Compensation
We measure and recognize equity-based compensation expense for instruments based on the estimated fair value of equity-based awards on the date of grant using the Black-Scholes option-pricing model. We recognize equity-based compensation expense over the requisite service period on a straight-line basis, which is generally consistent with the vesting of the awards, based on the estimated fair value of the equity-based awards issued to employees and directors that are expected to vest. Equity-based compensation that vests on a performance event, such as annual targets for the Company, begins to be recognized at the date that the performance event becomes probable, and compensation expense is recognized on a straight-line basis over any remaining service period. If there are any modifications of equity-based awards, we may be required to accelerate, increase, decrease or reverse any equity-based compensation expense on the unvested awards.
Recent Accounting Pronouncements
A discussion of recent accounting pronouncements is included in Note 2, “Recently Adopted Accounting Pronouncements” and “Recent Accounting Pronouncement Not Yet Adopted,” in the accompanying consolidated financial statements.
Qualitative and Quantitative Disclosures about Market Risk
We have interest rate risk relating to debt and associated interest expense under the Existing Credit Agreement, which is indexed to LIBOR. At any time, a rise in interest rates could have a material adverse impact
101
Table of Contents
Index to Financial Statements
on our earnings and cash flows. Conversely, a decrease in interest rates could result in a material increase in earnings and cash flows. We estimate that a hypothetical increase or decrease in LIBOR of 100 basis points would increase or decrease, respectively, our interest expense by approximately $2.9 million and $3.8 million on an annual basis, based on our $434.2 million and $432.7 million debt balance under the Existing Credit Agreement at December 31, 2020 and June 30, 2021, respectively.
102
Table of Contents
Index to Financial Statements
Our Mission
Clearwater aspires to be the world’s most trusted and comprehensive technology platform for investment accounting and analytics. Starting by radically simplifying investment accounting, we intend to use the power of our platform to eventually revolutionize the world of investing.
Company Overview
Clearwater brings transparency to the opaque world of investment accounting and analytics with what we believe is the industry’s most trusted and innovative single instance, multi-tenant technology platform. Our cloud-native software allows clients to radically simplify their investment accounting operations, enabling them to focus on higher-value business functions such as asset allocation strategy and investment selection. Our platform provides comprehensive accounting, data and advanced analytics as well as highly-configurable reporting for global investment assets daily or on-demand, instead of weekly or monthly. We give our clients confidence that they are making the most informed decisions about investment performance, regulatory compliance and risk.
We provide investment accounting and reporting, performance measurement, compliance monitoring and risk analytics solutions for asset managers, insurance companies and large corporations. Every day, Clearwater’s powerful platform aggregates and normalizes data on over $5.6 trillion of global invested assets for over 1,000 clients. We bring modern software to an industry that has long been dominated by difficult-to-use, high cost legacy technologies and processes, which often lack data integrity and traceability, and often require significant manual intervention. The strength of our platform is demonstrated by our approximately 80% win rate for new clients over the prior four years in deals that reached the proposal stage.
The markets we serve are highly complex and changing rapidly. All asset owners and asset managers need timely, accurate and comprehensive information about their investment portfolios in order to effectively make capital allocation decisions, manage risk, measure performance, comply with regulations and communicate to various stakeholders internally and externally. This requires organizations to have a comprehensive, global view of their investment portfolio. A partial view of one asset class or one reporting regime is ineffective: delivering analysis on 95% of the portfolio is inadequate because, more often than not, the opaque final 5% of the portfolio creates disproportionate risk. A single client can invest in over 60 different asset classes, hold assets in over 40 different currencies, be governed by more than 10 accounting regimes and hold positions representing thousands of individual tax lots. These clients often have separate accounting, reporting, performance, compliance and risk management products for each asset class and each country. Furthermore, clients frequently require large teams of people to manually review, compare and enter data, correct errors and build custom reports across multiple disparate systems and spreadsheets. Our platform provides our clients with a single consolidated and transparent view of investment data and analytics.
We believe that client demand for Clearwater’s offering continues to grow not only in the United States, but also in financial centers around the world. Prior to 2008, institutions often invested in a narrower range of asset classes for which legacy solutions may have been able to provide adequate accounting, performance measurement, compliance monitoring and risk analytics. Over the past decade, however, clients’ needs have grown meaningfully as a result of industry-wide trends such as:
| • | globalization; |
| • | increased regulatory requirements and complexity; |
| • | higher investment allocations in alternative assets (such as private equity, hedge funds, and derivatives and structured securities); |
103
Table of Contents
Index to Financial Statements
| • | greater demand for timely risk management and transparency; and |
| • | pressure to increase speed and accuracy while reducing cost. |
Clients no longer find it sufficient to review investment portfolios on a quarterly, monthly or even weekly basis. Their aged patchworks of on-premises software applications with multiple data warehouses and significant manual intervention exposes them to time delays, a lack of data integrity and traceability, and a significant increase in errors, cost and ultimately risk. For many clients, this has become increasingly untenable.
We allow our clients to replace these legacy systems with modern cloud-native software. Our platform helps clients reduce cost, time, errors and risk and allows them to reallocate resources to other value-creating activities. Our software aggregates, reconciles and validates data from more than 2,500 daily data feeds and more than four million securities that have been modeled across multiple currencies, asset classes and countries. This cleansed and validated data runs through our proprietary accounting, performance, compliance and risk solutions to provide clients with powerful analytics and daily or on-demand configurable reporting. We offer multi-asset class, multi-basis, multi-currency accounting and analytics that provide clients with a comprehensive view of their holdings and related performance. This allows our clients to make better, more timely decisions about their investment portfolios.
Clearwater benefits from powerful network effects. With our single instance, multi-tenant architecture, every client, whether new or existing, enriches our global data set by making it more complete and accurate. Our software continually sources, ingests, models, reconciles and validates the terms, conditions and features of every investment security held by all of our clients. This continuous process helps to create a single repository of comprehensive, accurate investment data (often referred to within the industry as a “Golden Copy” of data) that benefits all our clients to the extent they otherwise have rights to the data. Through this continuous process, we are able to identify and adjudicate data discrepancies that otherwise could introduce error and risk into our clients’ investment portfolios. We believe that a meaningful competitive advantage of this network effect is that we are increasingly seen as the best and most accurate source of investment accounting data and analytics in the industry.
Our team members are passionate about client success. We strive to be an extension of our clients’ own teams by providing responsive, consistent and effective support. Our clients have direct access to a dedicated client service team, a specialized group of experts devoted to ensuring data is as accurate and current as possible and resolving any challenges our clients may encounter utilizing our platform. We take pride in our extremely high client satisfaction rating with a NPS of 60+, in contrast with competitors who typically score much lower. Our gross revenue retention rate has remained approximately 98% over the past ten quarters, which we believe is a testament to the strength of our offering, our ability to deliver operational efficiency for our clients and our focus on providing exceptional client service. We are able to deliver this service to our clients by attracting, retaining and engaging an outstanding team.
We have a 100% recurring revenue model. We charge our clients a fee that is primarily based on the amount of assets they manage on our platform, subject to contracted minimums. A majority of the assets on our platform are high-grade fixed income assets, leading to very low levels of volatility and highly predictable revenue streams. When applicable, we charge additional transaction fees for certain complex asset classes (e.g., derivatives and other financial instruments).
We have achieved significant organic growth in recent periods. Our revenues increased from $168 million in the year ended December 31, 2019 to $203 million in the year ended December 31, 2020, representing an increase of 21%. For the six months ended June 30, 2020 and 2021, our revenues were $95 million and $118 million, respectively, representing year-over-year growth of 24%. We had net income of $8 million and a net loss of $44 million in the years ended December 31, 2019 and 2020, respectively, representing net income margin of 5% and net loss margin of (22%), respectively. For the six months ended June 30, 2020 and 2021, we
104
Table of Contents
Index to Financial Statements
had net income of $14 million and $3 million, representing net income margins of 14% and 3%, respectively. Our adjusted EBITDA was $51 million and $57 million in the years ended December 31, 2019 and 2020, representing adjusted EBITDA margins of 30% and 28%, respectively. For the six months ended June 30, 2020 and 2021, we had adjusted EBITDA of $31 million and $36 million, representing adjusted EBITDA margins of 33% and 30%, respectively. For additional information on adjusted EBITDA, including a reconciliation of adjusted EBITDA to net income, see “Management’s Discussion and Analysis of Financial Condition and Results of Operations—Non-GAAP Financial Measures”.
Our Industry
We operate in the investment accounting and analytics market, serving a range of clients that own or manage investment assets. Before the global financial crisis in 2008, the investment community generally invested in a relatively small number of asset classes that could be tracked with legacy software tools and processes. Over the ensuing years, the industry has faced several challenges that have strained and broken this fragmented and often manual approach to investment accounting operations. These new developments have included increasingly globalized holdings, growing regulatory complexities, the increasing prominence of complex alternative assets, and pressure to increase speed and accuracy while reducing cost. In light of these developments, asset owners and asset managers began to require a comprehensive, global view of their investment portfolios. These organizations initially reacted by buying dedicated products for each asset class, country and reporting regime, building proprietary data warehouses for different use cases, and increasing employee headcount in accounting and compliance functions. These practices resulted in investment accounting operations that were slow, expensive, inflexible and inconsistent, very often resulting in inaccurate data and reporting. We believe that our purpose-built single instance, multi-tenant technology platform provides clients with a vastly superior solution to their growing needs.
Increasingly Global Investment Portfolios
Investors today increasingly hold positions in globally diversified assets as they search for yield and diversification. As a result, they require a global platform that delivers a multi-asset class, multi-basis, multi-currency solution across different accounting, reporting and regulatory regimes.
High Regulatory Complexity
Increased regulatory requirements within the financial services and investment industries continue to proliferate in jurisdictions around the world, forcing asset owners and asset managers to adapt and operate under a myriad of ever-changing rules. The spread of these new regulations (e.g., CECL, NAIC, Solvency II, IFRS 9 and 17, and others) has been accompanied by a nearly six-fold increase in global yearly regulatory alerts and SEC enforcement actions, from approximately 10,000 alerts and enforcement actions in 2008 to nearly 60,000 in 2018, according to SEC press releases and annual reports. Investors must be responsive to ensure they remain compliant across this vast range of regulations. Failure to do so could lead to investigations and sanctions. Asset owners and asset managers need a robust and dynamic solution to help them achieve and maintain compliance in this complex and ever-evolving environment.
105
Table of Contents
Index to Financial Statements
Global Total Yearly Regulatory Alerts 2008-2018
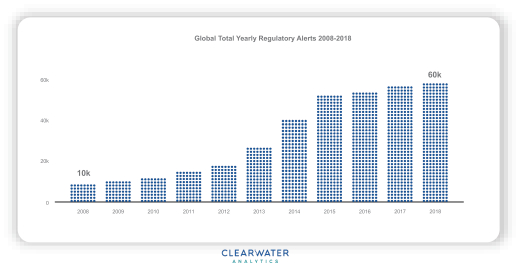
Source: Thomson Reuters, SEC press releases and annual reports.
Growing Importance of Alternative Assets
Investors are increasingly allocating capital to alternative assets and complex financial instruments as part of a search for higher investment returns in the low interest rate environment that has persisted over the past decade. According to a Preqin study from November 2020, investors expect to further increase their allocation to alternative assets over the coming years, particularly within private equity and debt. Alternative assets are typically traded less broadly and frequently than traditional investment assets (such as stocks, corporate bonds, treasury securities, currencies, mutual funds and exchange-traded funds) and often have less data readily available about them. This complicates reporting and risk management. Asset owners and asset managers need comprehensive, accurate and timely data regardless of the complexity of their investment holdings.
Rising Demand for Risk Management and Transparency
Investors are seeking the highest quality investment data and portfolio visibility in order to effectively make capital allocation decisions, manage risk and measure performance. Additionally, the rise of environmental, social and governance (ESG) initiatives in investing has increased the need for transparency in portfolio holdings as investors seek to measure compliance with ESG objectives. Asset owners and asset managers need a solution that provides on-demand transparency in order to optimize risk management and provide their stakeholders with the holdings-based visibility that they require.
Pressure to Increase Efficiency
The asset management industry is highly competitive and asset management firms must constantly improve operating efficiency to maintain profitability. Accounting teams at these firms are continually asked to meet growing regulatory and reporting challenges with fewer resources, an ultimately unsolvable problem with legacy products and processes. Additionally, the growing prominence of passive investment strategies (e.g., through the use of Exchange Traded Funds and Index strategies) has compressed fees for active asset managers and led to a greater focus on managing overall organizational costs to maintain profitability and operational efficiency. In order to effectively compete, asset owners and asset managers need modern automated solutions that reduce the need for greater headcount, and ultimately lower costs.
106
Table of Contents
Index to Financial Statements
Digital Transformation from Legacy Technologies
Many of the challenges that plague asset owners and asset managers result from their reliance upon legacy software products and outdated manual processes. These products typically require on-premises deployments, feature poor system flexibility and data management capabilities, and result in higher total costs of ownership. Asset owners and asset managers are seeking cloud-based solutions that address the costly, manual and error-prone deficiencies of these legacy technologies.
Our Market Opportunity
We believe that Clearwater has a significant opportunity to disrupt the global investment accounting and analytics market. Our research suggests that this addressable market is an approximately $10 billion global revenue opportunity when combining Clearwater’s current solutions and client end-markets with new end-markets, geographies and products. From 2015 to 2020, the market growth rates within our current client end-markets were between 5-7% for asset management, 3-7% for insurance and 2-4% for corporations. Our clients tend to be larger entities in these end-markets and generally grow at the higher end of these ranges.
To arrive at our global addressable market opportunity, we estimated combined assets under management (“AUM”) for targeted asset owners and asset managers at approximately $158 trillion across North America, Europe and APAC. AUM is segmented by client end-market and firm size (by AUM tier), and multiplied by the estimated basis points pricing (based on our actual pricing for comparable existing clients) to derive the total addressable market opportunity.
Our current core client end-markets are asset management, insurance and corporations in North America and Europe, which we believe together represent an approximately $4.7 billion annual revenue opportunity. We believe asset management represents the largest opportunity within our current core end-markets, with an approximately $3.1 billion market opportunity. As of June 2020, asset managers in the United States and Europe had an estimated $38.1 trillion and $30.1 trillion, respectively, in AUM, of which 2% is currently on our platform. Insurance companies represent an approximately $1.3 billion market opportunity. As of June 2020, insurance companies in the United States and Europe had an estimated $12.2 trillion and $12.1 trillion, respectively, in AUM, of which 12% is currently on our platform. Corporations represent an approximately $0.3 billion market opportunity. As of June 2020, corporations in the United States and Europe had an estimated $2.1 trillion and $1.4 trillion, respectively, in AUM, of which 34% is currently on our platform.
When our current core client end markets are viewed geographically, we believe that North America represents 59% of this approximately $4.7 billion market opportunity, while European markets represent 41%. We intend to leverage our strong foundation of client success and innovation to increase our global market share in these core end-markets.
We believe opportunities in adjacent markets account for another approximately $5.4 billion annual revenue opportunity. These opportunities include (i) serving additional asset owners, such as state and local governments, pension funds, and sovereign wealth funds, as well as a variety of alternative asset managers, collectively having an estimated $39.6 trillion in AUM as of June 2020, of which a nominal amount is currently on our platform (estimated as a $2.7 billion opportunity), (ii) our Clearwater Prism solution, having an estimated $100 billion in AUM as of June 2020, of which a nominal amount is currently on our platform (estimated as a $1.4 billion opportunity), and (iii) the APAC market, having an estimated $21.8 trillion in AUM as of June 2020, of which a nominal amount is currently on our platform (estimated as a $1.3 billion opportunity). We are in the early stages of growth within these adjacent markets but believe they represent highly attractive markets.
Our Value Proposition
Clearwater’s purpose-built single instance, multi-tenant technology platform helps clients around the world radically simplify their investment accounting and reporting, performance measurement, compliance monitoring
107
Table of Contents
Index to Financial Statements
and risk analytics. Our solutions provide our clients with a comprehensive view and single source of truth for their investment portfolios and we believe our solutions deliver unmatched levels of speed, flexibility, traceability, repeatability and auditability, all with no manual labor required of our clients. Some key aspects of our value proposition include:
| • | Single Instance, Multi-Tenant Platform: Clearwater’s platform is purpose-built, 100% in the cloud. The single instance, multi-tenant architecture allows for efficient and continuous upgrades, new features, and updates to adjust for rapidly evolving industry requirements and regulations. Each upgrade and update is made available worldwide. |
| • | Comprehensive View of Global Assets: For asset owners and asset managers, we provide comprehensive views and powerful analytics regarding their investment data. We offer investment accounting for $5.6 trillion of assets in our clients’ portfolios globally as of June 30, 2021, including complex derivatives and alternative investments. Clients benefit from having a “single pane of glass” through which to holistically and accurately view their entire investment portfolios, with the flexibility to respond to unique reporting challenges across different regulatory regimes. |
| • | Single Source of Truth for All Accounting, Risk, Compliance and Regulatory Reporting: We completely eliminate the need for clients to manually process and reconcile data from different sources and systems. By leveraging machine learning, automation and our direct connections with approximately 1,000 custodians, more than 1,400 managers, more than 240 trading data sources and all of the leading third party market data providers, our platform automates data aggregation, data reconciliation and data validation of each security in our clients’ investment portfolios. This allows us to deliver our clients data from a “Golden Copy” that is accurate, auditable and traceable. |
| • | Radical Simplification of Investment Accounting Operations: We deliver our clients a single, comprehensive platform that allows them to perform investment accounting, performance measurement, compliance monitoring and risk analytics. By eliminating the need for our clients to aggregate, reconcile and validate security data, we greatly simplify and expedite their operations, allowing them to quickly close their books, comply with regulatory reporting requirements, reduce costs and free their time to focus on managing their portfolios and performing other higher-value functions. |
| • | Accurate, Timely and Up-to-date Reporting: We offer transparent, on-demand and configurable views of our clients’ portfolios, accessible anytime from anywhere. Additionally, we are committed to frequent and seamless incorporation of new features and functionalities on our platform to meet the evolving business needs of our clients and the latest regulatory demands. For example, our clients can switch from a GAAP view to a Tax view to a STAT view, all in a matter of seconds. |
| • | Powerful Network Effects: Every incremental data source from an additional client improves our global data set by making it more complete and accurate for other clients on our platform that are similarly entitled to access such data. Our clients include a number of the leading financial institutions and corporations in the world, and by continually sourcing, ingesting, modeling, reconciling and validating the terms, conditions and features of every investment security held by all of our clients, we create a single repository of comprehensive, accurate investment data that serves to the benefit of other clients. This allows us to identify and adjudicate data discrepancies that otherwise could introduce error and risk into our clients’ investment portfolios. Furthermore, our clients’ analytical needs help us to continue driving best-in-class innovation with our offering. Our single-instance, multi-tenant platform allows us to take full advantage of these innovations as new Clearwater features and functions targeting any client’s needs become immediately available to the entire Clearwater client base. In effect, each client benefits from the breadth of holdings, and the demands and needs of, all other Clearwater clients. We believe that this provides Clearwater with a meaningful competitive advantage because we are increasingly seen as the best and most accurate source of investment accounting data and analytics in the industry. |
108
Table of Contents
Index to Financial Statements
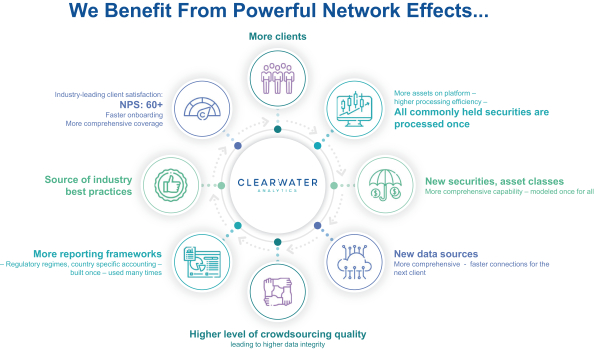
Our Platform
Our purpose-built single instance, multi-tenant technology platform radically simplifies our clients’ investment accounting and reporting, performance measurement, compliance monitoring and risk analytics infrastructure and workflow. Our software automates data aggregation, data reconciliation and data validation of each security in our clients’ investment portfolios. This creates a fully reconciled “Golden Copy” of investment portfolio data, which can be trusted for accurate reporting and analytics. Our clients benefit from having a comprehensive “single pane of glass” view for daily visibility into all investment data and analytics. Our platform often allows clients to eliminate multiple legacy products and systems as well as significant manual labor.
109
Table of Contents
Index to Financial Statements
How It Works
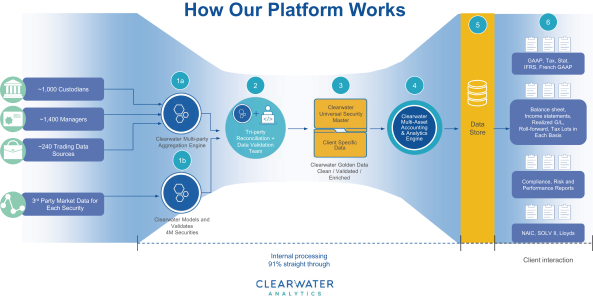
| • | Step 1a: We have established data connections with approximately 1,000 custodians, more than 1,400 managers and more than 240 trading data sources. We pull data for investment securities through these connections into our multi-party aggregation engine. |
| • | Step 1b: Simultaneously, we utilize our connections with the leading third party market data providers, such as Refinitiv, Moody’s and S&P, to pull all necessary market data into our modeling engine so that we can model each security individually in order to fully validate what is presented by various data providers. |
| • | Step 2: We analyze the aggregated data by first applying our machine learning capabilities. Our long operating history and extensive client and data network allows us to efficiently reconcile and validate securities across different geographies, asset classes and currencies. Approximately 91% of portfolios are automatically validated, reconciled and processed without further intervention. The remaining approximately 9% of accounts are flagged for further analysis and reconciled by our reconciliation team. These events happen, for example, when data provided by custodians and asset managers do not agree on items such as trade price or total units, or when custodial payments do not match Clearwater’s model, in which case the incident is flagged to alert the reconciliation team. We resolve these exceptions every day in an effort to ensure that we ultimately achieve 100% reconciliation and validation. |
| • | Step 3: The reconciled and validated data comprises the Clearwater universal security master / “Golden Copy” of investment data. As needed, client specific data allows clients the flexibility to import additional data that is both supplemental and complimentary to Clearwater’s universal security master. |
| • | Step 4: From there, all data flows through to our accounting engine and proprietary risk, performance and compliance models. |
| • | Step 5: Fully reconciled security and portfolio data are aggregated and deposited into our data store. |
| • | Step 6: Finally, we utilize this aggregated, reconciled and validated data to provide clients with configurable daily reports and powerful analytics. Clients see a “single pane of glass” offering a comprehensive view into investment data and analytics across asset classes, accounting basis, currencies and regulatory regimes. |
110
Table of Contents
Index to Financial Statements
Purpose-Built Technology Stack
In order to deliver these powerful solutions and benefits, we purpose-built our technology stack to efficiently process millions of daily transactions in a highly scalable and efficient manner. Our platform is built on a single code base and eliminates the need for costly and time-consuming patches and upgrades across multiple, disparate software instances. As new features are developed and deployed, they are made available to all clients. Our system leverages the latest machine learning and artificial intelligence tools to ingest both structured and unstructured data that is transformed into a universal security model that enables network benefits for our clients.
Our clients access the platform through a web-based interface that is highly configurable and provides a set of tools that enable our clients to derive actionable insights on a daily basis. This allows our clients to view their portfolio data from anywhere with an internet connection. Our intuitive, easy-to-use website allows users to view high-level portfolio information and quickly drill into portfolio specifics down to the most granular security level. Our platform also creates automated feeds to other client systems—such as trade order management systems, data warehouses, enterprise resource planning (ERP) systems and others—eliminating the need for clients to manually enter data from Clearwater’s solution into other client systems.
Our Solutions
Our solutions are offered through one unified Clearwater platform and are detailed below:
| • | Investment Accounting and Reporting: Our accounting solution was built with the flexibility to offer operational and regulatory accounting, from the simple to the complex, on the same platform. Our solution is comprehensive in its capabilities: |
| • | Multi-asset class: We have differentiated global asset class coverage including fixed income, equities, bank loans, commercial and residential mortgages, private capital markets (e.g., general and limited partnerships), derivatives and various other alternative assets; |
| • | Multi-basis: A single client can access 15 accounting bases, such as GAAP, Statutory, Tax and IFRS. Our platform has the flexibility to add new accounting bases as our clients’ needs require; and |
| • | Multi-currency: We support clients with more than 40 local currencies (currency of the country they are domiciled in), 10 functional currencies (currency of the country where their principal business is), and numerous reporting currencies. |
Our platform offers flexible configurations and outputs, customized general ledger entries for multiple accounting bases, and regulatory completeness. A suite of standardized reports automates relevant investment-related disclosures such as Fair Value Hierarchy and Level 3 Roll-forward and can be easily configured to provide the detailed accounting information investment accountants and internal stakeholders need. Our daily reconciliation, flexible reporting and general ledger capabilities ensure that period-end close processes are efficient and accurate.
| • | Performance Measurement: Our solution enables investors to compare separate accounts, set custom benchmarks and track the overall performance of their portfolios. Custom performance reports and return calculations are available and designed to meet applicable GIPS calculation standards for investment managers. Users can drill down into the underlying performance return data at the lot level and track performance attribution per portfolio. |
| • | Compliance Monitoring: Our users can set custom rules to monitor compliance according to their investment policies and standard applicable regulations. All investment activity is checked against those rules as often as a client requires and tracked at the security level. Compliance can be tracked across multiple policies, and notifications are automatically sent if there is a violation. Any compliance policy changes or resolutions can also be documented and referenced for internal audits. |
111
Table of Contents
Index to Financial Statements
| • | Risk Analytics: We offer insightful risk analytics to ensure investors have access to their portfolios’ exposure every day. Our risk monitoring solution provides access to critical financial and investment portfolio risk information, so users are able to quickly answer pressing risk-related questions, including exposures by issuer, currency, country, duration, credit rating and more. Users can also view benchmark comparisons and analyze other risk factors, including cash flow forecasting, credit events, shock analysis, value at risk (VaR), and historical trends and exposures. |
Clearwater Prism
Large asset managers and insurance companies often have a constellation of point solutions and proprietary systems that are typically stitched together in a highly manual and inflexible fashion. Despite causing numerous friction points, our clients find that this legacy infrastructure is very difficult to replace at once. Our Clearwater Prism solution solves one of the most acute needs created by this heterogeneous infrastructure: the need for a single comprehensive view across systems with internally consistent data.
Our Clearwater Prism solution offers our clients a single security master and comprehensive reporting portal for all of their investment data. The Clearwater Prism solution feeds this data into our clients’ existing accounting, compliance, performance and risk systems, including those offered by both Clearwater and other third party software vendors. The outputs from each system are consolidated into one data store and reporting is provided through a single integrated portal with the same level of configurability as with Clearwater’s other solutions.
Our Clearwater Prism solution eliminates manual reconciliation of security data without the need to replace existing systems that are core to our clients’ operations and allows our clients to replace their disparate data warehouses with a single Golden Copy of all investment data and associated reports. We believe that our Clearwater Prism solution provides an immediate benefit to clients while also providing clients the eventual ability to adopt the full Clearwater platform and retire numerous legacy products and systems.
Our Clients
Clearwater serves a broad universe of institutional clients across multiple end-markets. Today, our largest client end-markets are asset management, insurance and corporate treasury. We are also growing our client base in the public sector with numerous state and local governments. While these end-markets and their clients can be quite different from each other, ultimately all of our clients need timely, accurate and comprehensive information on their investments in order to effectively make capital allocation and portfolio decisions, manage risk, measure performance, comply with regulations and communicate to various stakeholders both internally and externally. Chief Financial Officers, treasurers, controllers and Chief Operating Officers select our platform to deliver a holistic solution consisting of data aggregation, accounting book of record (ABOR), multi-basis reporting, powerful analytical tools and other key features.
As of June 30, 2021, we had over 1,000 clients across 29 countries. In addition, as of June 30, 2021, we had 50 clients who contributed at least $1,000,000 in annualized recurring revenue. Our diversified, blue-chip client base of insurance companies, asset managers and large corporations have $2.8 trillion, $1.6 trillion and $1.2 trillion in assets on our platform, respectively. No client accounted for more than 10% of our revenue for the years ended December 31, 2019 and 2020, and our top 10 clients represented less than 30% of total revenue for the years ended December 31, 2019 and 2020.
112
Table of Contents
Index to Financial Statements
The following is a representative list of our clients in each of our core end-markets:
| Asset Management | Insurance | Corporate | ||
| AAM | Arch | Cisco | ||
| Goldman Sachs | CNA | Dell Technologies | ||
| JP Morgan | Delphi Financial Group, Inc. | Merck & Co, Inc. | ||
| Morgan Stanley | Endurance (Sompo) | Moderna | ||
| PIMCO | Partner Re | Intuit | ||
| Global Atlantic Financial Group | ||||
| Mutual of Omaha |
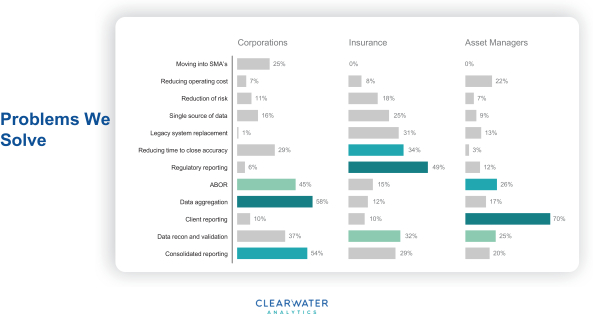
Client Case Studies
The following are representative examples of how clients in each of our core end-markets use our solution to address the unique challenges they face:
Asset Management Customer: AAM
| • | Challenge: AAM is a global asset manager with $29 billion in assets under management. They are responsible for providing all of their clients with a daily view of their portfolios, and for half of these clients AAM completes the regulatory (NAIC) reporting on their behalf. Prior to Clearwater, AAM used a third-party accounting platform that did not have reporting functionality. The lack of reporting required AAM to build manual processes to report to their clients, which created both accuracy and scalability issues. In addition to the operational issues, the lack of a comprehensive reporting portal impeded AAM’s ability to win new clients. |
| • | Clearwater Delivers: Today, Clearwater provides AAM (and its clients) with a single comprehensive view of their portfolios. In addition to daily reconciliation and accounting, Clearwater enables AAM to provide regulatory reports for the majority of its clients in an automated fashion. By automating the manual processes, Clearwater has enabled AAM to grow from $19 billion in assets to nearly $29 billion today without adding any operational headcount, and the enhanced reporting capabilities have been a key driver of AAMs ability to win new mandates. In addition, AAM also is an early adopter of Clearwater Prism which enables AAM to generate custom statements for their clients integrating Clearwater data with client and third-party specific data points. |
113
Table of Contents
Index to Financial Statements
| • | Client Feedback: |
| • | “Clearwater helps us update information, update pricing, and helps us make decisions for the portfolio rapidly. We use the system daily to keep the cash positions of our portfolio invested wisely.” Beth Sanford, CFA, AAM Assistant Portfolio Manager |
| • | “Clearwater allows us to serve our clients more efficiently through greater automation in our daily and period-end operational tasks. Our portfolio management, accounting, and operations teams now have a more scalable process for preparing month-end and regulatory reports, allowing us to be more responsive to our clients while providing an enhanced level of service.” Chelsea Klassa, Chief Compliance Officer. |
Asset Manager Customer: London & Capital
| • | Challenge: London & Capital (L&C) is an EU based asset manager with $5.2 billion in assets under management. L&C differentiates itself in the market by delivering a high-touch client service model that promotes transparency and provides risk management to its clients across a diverse range of asset classes. Prior to Clearwater, providing the level of transparency that their clients demanded required extensive manual data manipulation and system workarounds for L&C’s portfolio managers. The time spent integrating various reports came at the expense of time better spent with their clients and was impeding their ability to deliver the personalized service model that their clients expected. |
| • | Clearwater Delivers: Clearwater has eliminated the need for manual processes and workarounds and today provides L&C with a single comprehensive view of their clients’ portfolios. The Clearwater system is able to provide accurate visibility into L&C’s clients’ accounts, including into the underlying data as well as providing support for regulatory reporting like Solvency II, IFRS 9 and others. Clearwater has freed up significant time for portfolio managers to both spend with existing clients and find new ones. |
| • | Client Feedback: “We rely on Clearwater to provide our clients with the confidence that their portfolios are being managed in accordance with their instructions and that the valuations provided are accurate and independent of us. All this comes through an easily accessible online platform which means that wherever our clients are, across the globe, they have peace of mind.” Kate Miller, Partner, London & Capital |
Insurance Customer: Delphi Financial Group, Inc. (“Delphi”)
| • | Challenge: Delphi is a large North America-based insurance company that manages nearly $50 billion in assets. Prior to Clearwater, their third-party accounting platform was incapable of handling their loan portfolio, and Delphi was forced to set up numerous manual systems that were uploaded to Delphi’s accounting system as separate line items on a monthly basis. This manual process created two major challenges: accuracy, and more importantly, Delphi did not have any intra-month visibility into the performance and risks associated with the loan portfolio. In addition, Delphi utilized 15 different external managers to manage their assets and struggled to effectively reconcile between these managers, their accounting system and their custodians. Finally, Delphi has two journal entry systems and their prior system did not have dual entry capabilities which required Delphi to create yet another manual process. |
| • | Clearwater Delivers: Clearwater has automated Delphi’s manual processes and provides a daily comprehensive view of the entire portfolio across all asset classes. The Clearwater system provides a daily tri-party reconciliation between managers, custodians and Clearwater, eliminating internal reconciliation pain points and completely automating inputs to the journal entry systems. The ability to automate management of the loan portfolio enabled Delphi to expand its portfolio from purely commercial mortgages into residential mortgages. Delphi has grown from less than $35 billion in assets to nearly $50 billion in assets while on the Clearwater system without adding any operational headcount due in part to the automation delivered by the Clearwater platform. |
114
Table of Contents
Index to Financial Statements
| • | Client Feedback: |
| • | “Clearwater has transformed the way we do business. A majority of the higher-risk, manual touchpoints have been automated away, with appropriate data validation checks to ensure a high-quality end product.” Stephen McLoughlin, Manager Delphi Investment Services Team |
Our Go-to-Market Strategy
We seek to deliver exceptional innovation and service to our clients every day. Client success is core to our go-to-market approach and contributes to both our ability to win new clients and retain existing clients.
We have earned an NPS of 60+ in an industry that typically scores much lower. Our high client satisfaction also translates into gross revenue retention rates of approximately 98% over the prior ten quarters. From January 1, 2017 to June 30, 2021, client partners and client referrals, taken together, generated approximately one quarter of our closed deals on a total revenue basis.
As we continue to see significant demand for our offering around the world, we have also grown our sales force to 107 team members globally as of June 30, 2021. We divide this sales force by geography, client end-market and target client size. Our North American sales team includes representatives focused on insurance companies, asset managers, corporations and growth markets. Our international sales team includes representatives focused on insurers and asset managers based in various regions of Europe and APAC. We plan to continue expanding our sales force and adding new target end-markets in the periods ahead.
Our sales force is supported by a global marketing team with 15 team members. We actively grow our sales pipeline through account-based marketing, investment in our digital presence, increased brand awareness and product marketing. We will continue to invest in and build out our global marketing function to drive future pipeline and growth.
Our Revenue Model
We have a 100% recurring revenue model. We charge our clients based on an agreed upon basis points rate applied against their average daily value of assets on the platform over a given month, subject to contracted minimums. The basis points are typically tiered based on the amount of assets on platform (e.g., a client would be charged a lower basis point rate on incremental assets after exceeding a certain threshold). In general, the price we charge our clients for access to our platform is based on a number of factors, including the expected amount of assets on the platform, asset mix (e.g., fixed income, structured products, equities, derivatives or private assets), transaction volume, number of data feeds and other client-specific factors. We do not charge our clients separately for ongoing client service or training. We typically begin charging basis point fees upon contract execution and clients are able to cancel their contracts with 30-days’ notice. We bill our clients monthly in arrears.
We believe our business model is highly resilient, as demonstrated by our performance at the height of the COVID-19-driven market disruption in 2020. As of December 31, 2019, the assets on our platform were 77% high-grade fixed income securities and structured products. While the onset of COVID-19 triggered meaningful broader market volatility, this high quality asset mix actually led to very low levels of overall volatility in client assets on our platform and in our resulting revenue. For example, assets on our platform from existing clients as of December 31, 2019 remained steady with 0.3% growth from December 2019 to March 2020, despite the S&P 500 index’s approximately 21% decline in the same period.
115
Table of Contents
Index to Financial Statements
Our Growth Strategy
We intend to drive the growth of our business and expand our addressable market through the following strategies:
Deepen Our Relationships With Existing Clients
We believe we achieve our industry-leading NPS of 60+ by giving our clients an exceptional and differentiated solution and experience. We believe we are very effective in solving our clients’ challenges in managing investment accounting and reporting, performance measurement, compliance monitoring and risk analytics. Our gross revenue retention rate over the last ten quarters has averaged 98%, and our net revenue retention rate reached 109% in the quarter ending June 30, 2021. For a discussion of gross revenue retention rate and net revenue retention rate, see “Management’s Discussion and Analysis of Financial Condition and Results of Operations—Key Operating Measures.”
We actively seek to strengthen and deepen our client relationships through our client engagement model, which is a set of best practices aimed at increasing client satisfaction, engagement and share of wallet. We conduct quarterly steering committee meetings with key client stakeholders and senior members of Clearwater management and have semi-annual on-site visits to review the client’s business needs, market feedback, our product roadmap and improvement opportunities. We believe that our relentless focus on client success and innovation will continue to result in strong client retention and allow us to grow as our clients grow.
Continue Expanding Within Our Core Client End-Markets
Our current core end-markets (asset management, insurance and corporations) remain significantly unpenetrated today. We continue to drive growth and market-share gains within these end-markets, which have to date been primarily served by legacy products and processes. We will continue to displace legacy products and add clients in these end-markets through our direct sales and marketing efforts and by helping our strategic asset manager clients win new clients, which in turn brings more assets onto our platform. With only approximately 4% market penetration for asset managers and approximately 19% for insurance companies in North America today, we believe that we have significant market opportunity for additional growth. Our competitive win rates for new clients remains approximately 80% over the prior four years in deals that reached the proposal stage, which gives us confidence that our approach works well.
Accelerate International Expansion
With new offices, leadership and sales teams now established in Europe and APAC, we are poised to reach more new clients globally moving forward. We have substantial room to grow our international business as during the year ended December 31, 2020, revenues outside North America represented only 5% of our total revenues, despite these markets representing approximately 40% of our total addressable market. We have invested in these geographic markets recognizing that the challenges international clients experience are very similar to those experienced by our North American clients. We believe our solution is highly effective at addressing client needs regardless of geography. We have seen success in this geographic expansion as our European sales team has achieved win rates that replicate that of our North American business in recent periods.
Continue Expanding Within Adjacent Client End-Markets
We believe there is a significant opportunity for growth by continuing to target adjacent end-markets. There is a large opportunity to tailor the regulatory reporting and performance management capabilities of our existing solutions to better serve the needs of a range of additional asset owners, such as state and local governments, pension funds, sovereign wealth funds and a variety of alternative asset managers. We believe our existing solutions are suitable to serve the needs of the clients in these end-markets. While we have onboarded our first clients in these end-markets and have built internal teams to service them, we do not currently derive a material amount of revenue from these end-markets.
116
Table of Contents
Index to Financial Statements
Innovate and Develop Adjacent Solutions
Clearwater has a long history of innovating and advancing our platform based on client feedback and evolving market needs. We will continue to invest heavily in expanding our functional breadth and depth, improving user experience, increasing automation and strengthening system performance. We intend to utilize emerging technologies including machine learning and robotic process automation to continue driving industry-leading capabilities and performance, keeping the platform at the very forefront of technology. Historically, we have sold our solutions as one unified offering. As clients have continued to find innovative uses for our platform in other business functions, we expect to sell and price those newer modules separately.
Pursue Strategic Partnerships and Acquisitions
We may selectively pursue partnerships and acquisitions that complement our solutions, provide us access to new markets or improve our competitive positioning within existing and new markets, or that otherwise accelerate one or more of our growth objectives. For example, we will consider partnerships and acquisitions focused on improving our technology for complex assets data and our performance and risk management offerings, as well as expansion in Europe, the Middle East and Asia.
Competition
The market for investment accounting and analytics is competitive and highly fragmented. The market is served by large-scale players with broad offerings as well as vendors with only point solutions that target local markets or specific client types, business functions or asset classes. We also face competition from systems developed and serviced internally by our potential clients’ IT departments. We believe that there are currently no competitors who offer a cloud-native platform like ours. We further believe that our solution is more comprehensive than our competitors’ in terms of asset class coverage and functionality. Our competitors primarily utilize legacy, on-premises systems and often employ large operational teams. While some of our competitors may take components or versions of their offerings into the cloud, their core platforms remain underpinned by legacy technologies, making it virtually impossible to ensure consistency, timeliness and auditability.
In each of our core client end-markets we compete with a variety of firms depending on client size, type, location, computing environment and functional requirements. Our principal competitors include large providers of investment operations, accounting and analytics systems such as SS&C (with its Advent, Camra, Maximus, and Singularity products), State Street (with its PAM and outsourced service offerings), SAP, BNY Mellon’s Eagle product, Simcorp’s Dimension, BlackRock’s Aladdin, FIS’s iWorks and Northern Trust. We occasionally see smaller providers of specialized applications and services. We also compete with outsourcers, as well as the internal processing and IT departments of our prospective clients.
We believe the principal factors that drive competition in our market include:
| • | Comprehensive accounting and reporting of global assets on a daily basis; |
| • | Ability to provide a “Golden Copy” / single source of data truth in order to ensure data consistency across all business applications; |
| • | Breadth and quality of solutions; |
| • | Technology differentiation, including single instance, multi-tenant cloud architecture; |
| • | Automated data aggregation and reconciliation capabilities; |
| • | Flexible and integrated reporting; |
| • | Daily and on-demand visibility into investment performance; |
| • | Quality of client service; |
117
Table of Contents
Index to Financial Statements
| • | Reputation with other leading financial institutions and clients; |
| • | Frequent and complete regulatory updates; |
| • | Simplified IT infrastructure and operating costs; |
| • | Scalability, including handling large changes in assets (e.g., M&A); |
| • | Ease of use and quality of user interface; and |
| • | The price of such offerings and return on investment. |
We believe we compete favorably across all of these factors.
Product Development & Engineering
Our product development and engineering teams are focused on extending our market leadership by innovating on both our existing and new solutions. We believe we must pursue relentless and aggressive innovation to maintain our competitive advantage. To meet these goals, we use multidisciplinary teams of highly trained personnel and leverage their expertise across our solutions. We have invested heavily in our product development and engineering teams to ensure a high degree of product functionality and quality.
Our product and engineering management team focuses on near-term and long-term product strategy, identifying and implementing best practices, continual improvement in engineering throughput and quality, integration strategies across third-party products, and continued process automation.
Approximately 35% of our global employee base is dedicated to product development and engineering Our personnel are organized into solution-specific teams and are based principally in Boise, Idaho, Seattle, Washington and Noida, India. We expect to continue our significant investment in product engineering and innovation as we extend our competitive strengths moving forward.
Intellectual Property and Proprietary Rights
We rely on a combination of trademark, copyright and trade secret protection laws in the United States and other jurisdictions, as well as confidentiality procedures, technical measures and contractual restrictions, to protect our proprietary technology and our intellectual property. We seek to control access to and distribution of our proprietary information.
We enter into confidentiality agreements and/or license agreements with our employees, consultants, clients and vendors that generally provide that any confidential or proprietary information developed by us or on our behalf be kept confidential. In the normal course of business, we provide our intellectual property to third parties through licensing or restricted use agreements. We have proprietary know-how in our algorithms, business on-boarding functions and software applications. We have in the past and may in the future pursue patents covering our proprietary technology. We also pursue the registration of certain of our trademarks and service marks in the United States. We have registered the mark “Clearwater” with the U.S. Patent and Trademark Office. In addition, we have registered numerous Internet domain names related to our business. We have established a system of security measures to protect our computer systems from security breaches and computer viruses, including various technology and process-based methods, such as clustered and multi-level firewalls, intrusion detection mechanisms, vulnerability assessments, content filtering, antivirus software and access control mechanisms. We also use encryption techniques for data transmissions. We control and limit access to confidential and proprietary information on a “need to know” basis.
See “Risk Factors — Risks Related to Our Business and Our Industry” for a more comprehensive description of risks related to our intellectual property.
118
Table of Contents
Index to Financial Statements
Regulations
As with any company operating in our field, we are subject to a growing number of local, national and international laws and regulations. These laws are often complex, sometimes contradict other laws, and are frequently evolving. Laws may be interpreted and enforced in different ways in various locations around the world, posing a significant challenge to our global business. This ambiguity includes laws and regulations possibly affecting our business, such as those related to data protection. Changes to such laws and regulations could cause us to incur additional costs and change our practices in order to comply.
Data Protection and Privacy
Users of our solutions and services are located in the United States and around the world. As a result, we may collect and store the personal information of individuals who live in many different countries. Accordingly, we may be subject to those countries’ privacy laws and the jurisdiction of such regulators by collecting or storing the personal data of those countries’ residents, even if we have no physical or legal presence there. Our exposure to foreign countries’ privacy and data security laws may impact our ability to collect and use personal information, increase our legal compliance costs and expose us to liability.
We have incurred, and will continue to incur, expenses to comply with privacy and security standards and protocols imposed by law, regulation, industry standards or contractual obligations. Increased domestic or international regulation of data utilization and distribution practices could require us to modify our operations and incur significant additional expense, which could have a material adverse effect on our business, financial condition or results of operations. See “Risk Factors—Risks Related to Our Business and Our Industry— Although we primarily process institutional financial information, we could face liability related to unauthorized access to, disclosure or theft of the personal information we store and process, and could consequently incur significant costs.”
Anti-Corruption and Sanctions
We are subject to anti-corruption, anti-bribery, anti-money laundering and similar laws imposed by governments around the world with jurisdiction over our operations, which may include, among others, the FCPA, the USA PATRIOT Act and other applicable laws in the jurisdictions in which we operate.
Our Human Capital Management and Culture
As of June 30, 2021, we had 1,259 employees, including approximately 411 in product development and engineering, 128 in sales and marketing, 622 in operations and 98 in executive, general administrative and corporate functions. Of these employees, 652 were located in Boise, Idaho, 132 were located in Edinburgh, United Kingdom, 15 were located in London, United Kingdom, 4 were located in Paris, France, 15 were located in New York, New York, 24 were located in Seattle, Washington, 141 were located remotely within the United States, 2 were located in Singapore, and 274 were located in Noida, India. None of our employees is represented by a labor union. We have never experienced a work stoppage and believe our relationship with our employees to be good.
We have a team-oriented culture and encourage candor from our employees, which we believe helps us to succeed and drive operational excellence. We also seek to, and have a history of, promoting from within our organization as well as hiring top talent from outside of our company to expand our capabilities.
We aim to hire individuals who share our passion, commitment and entrepreneurial spirit. We are also committed to diversity and inclusion because we believe that diversity leads to better outcomes for our business and enables us to better meet the needs of our clients. We recognize the importance of diversity in leadership roles within our company.
119
Table of Contents
Index to Financial Statements
We encourage our employees to operate by a common set of values, which includes being:
| • | Infectiously passionate about Clearwater; |
| • | Intensely committed to our clients; |
| • | Devoted to building an outstanding, engaged team; |
| • | Focused on execution and dedicated to getting things done; |
| • | Continuously innovative and improving; |
| • | Dedicated to building truly differentiated offerings; and |
| • | Committed to having values beyond reproach. |
We believe that operating with purpose, passion and creativity benefits our clients, stockholders, employees and suppliers as well as the communities where we operate and the environment.
Our Facilities
Our headquarters are located in Boise, Idaho. We also lease office space in:
| • | Seattle, Washington; |
| • | New York, New York; |
| • | Edinburgh, United Kingdom; |
| • | London, United Kingdom; |
| • | Singapore; |
| • | Noida, India; and |
| • | Paris, France. |
We believe that our office facilities are adequate for our immediate needs and that additional or substitute space is readily available if needed to accommodate the growth of our operations.
Legal Proceedings
From time to time, we are subject to certain legal proceedings and claims that arise in the normal course of business. In the opinion of our management, we are not involved in any litigation or proceedings with third parties that we believe could have a material adverse effect on our results of operations, financial condition or business.
ESG
Clearwater is focused on positively impacting our community through both company and employee efforts. Through Clearwater Cares, our corporate social responsibility program, we have worked with our employees to identify three company-wide priorities: STEM education, human services and sustainability. We have aligned our global impact programs to these objectives by forming community partnerships in an effort to start with small projects, prove positive impact and then expand our efforts. We offer our employees 16 hours of paid time off to perform volunteer services and provide an employee giving program that supports charities around the world.
120
Table of Contents
Index to Financial Statements
Our Executive Officers and Board of Directors
The following table sets forth certain information concerning the individuals who will serve as our executive officers and directors upon the consummation of this offering.
| Name |
Age | Position(s) Held | ||
| Sandeep Sahai | 58 | Chief Executive Officer and Director | ||
| Jim Cox | 49 | Chief Financial Officer | ||
| Scott Erickson | 42 | President, Americas and New Markets | ||
| Cindy Blendu | 45 | Chief Human Resources and Transformation Officer | ||
| Souvik Das | 50 | Chief Technology Officer | ||
| Susan Ganeshan | 51 | Chief Marketing Officer | ||
| Joseph Kochansky | 53 | President, Product and Technology | ||
| James Price | 46 | Chief Quality Officer | ||
| Gayatri Raman | 46 | President, Europe and Asia | ||
| Subi Sethi | 45 | Chief Client Officer | ||
| Josh Sullivan | 46 | Chief Strategy Officer | ||
| Alphonse Valbrune | 51 | Chief Legal Officer | ||
| Eric Lee | 49 | Director, Chairman of the Board of Directors | ||
| Jacques Aigrain | 66 | Director | ||
| Kathleen A. Corbet | 61 | Director | ||
| Cary Davis | 55 | Director | ||
| Anthony J. deNicola | 57 | Director | ||
| Christopher Hooper | 40 | Director | ||
| Marcus Ryu | 47 | Director | ||
| Andrew Young | 43 | Director |
Sandeep Sahai has been our Chief Executive Officer since July 2018 and a Director since September 2016. Before Clearwater, he held the title of CEO of Solmark from 2014 to June 2018, an investment partnership where he was the lead partner. Previously, Mr. Sahai worked for several years at Headstrong, where he served as Managing Director from 2004 to 2007, President and Chief Operating Officer from 2007 to 2009, and President and Chief Executive Officer from 2009 to 2011. After Headstrong’s acquisition by Genpact in 2011, Mr. Sahai served as Senior Vice President of IT Solutions and Capital Markets at Genpact from 2011 to 2014. He was also a founder and partner of the consulting firm TechSpan, the Chief Executive Officer of SkanSoft and worked with HCL Group. Mr. Sahai also held directorships at AIM Software (Austria) from 2015 to 2019, Simeio Solutions from 2015 to 2020 and Magic Software from 2014 to 2018. In addition, he served as Operating Partner at Welsh Carson beginning in 2014. Mr. Sahai holds an engineering degree from the Indian Institute of Technology, Varanasi and an MBA from the Indian Institute of Management, Kolkata.
Jim Cox has been our Chief Financial Officer since April 2019. Prior to Clearwater, Mr. Cox served as a Chief Financial Officer at Advent Software from 2009 until Advent’s sale to SSNC in 2015 and remained with the company until 2016. He also previously served as Chief Financial Officer at Lithium Technologies from August 2016 to February 2018, Glassdoor from February 2018 to October 2018 and Doximity from December 2018 to March 2019. Mr. Cox began his career in public accounting at Price Waterhouse. Mr. Cox holds a bachelor’s degree in Economics from Ohio University.
Scott Erickson has been our President, Americas and New Markets since June 2021. Before that, he served as our Chief Operating Officer from June 2017 to June 2021. Mr. Erickson joined Clearwater in 2005 and has served in a number of roles leading multiple Clearwater departments, such as Director of Operations and Client Services, Director of Product Management, Director of both Client Services and Product Management, and Director of Sales. Mr. Erickson holds a bachelor’s degree from Whitman College and an MBA from Northwest Nazarene University.
121
Table of Contents
Index to Financial Statements
Cindy Blendu has been our Chief Human Resources and Transformation Officer since November 2018. She added chief human resources officer responsibilities in April 2019. Ms. Blendu founded Headpoint Consulting in June 2018, but has not been actively involved since joining Clearwater. Previously, she served as Global Head of HR at Solera Holdings from May 2017 to April 2018 and before that as Senior Vice President Corporate Functions at Advantia Health from June 2016 to May 2017. Prior to Advantia, Ms. Blendu served at CSC (now DXC Technology), where she was the VP, Strategic HR and Operations and before that led the IT Planning, Governance and IT Program Management functions. She started her career at Deloitte Consulting and after business school spent ten years with Boston Consulting Group. Ms. Blendu holds a bachelor’s degree in accounting and finance from Miami University (Ohio), an MBA from MIT Sloan School of Management and spent two years at the U.S. Coast Guard Academy.
Souvik Das has been our Chief Technology Officer since August 2021. Mr. Das served as Chief Technology Officer at Zenefits from October 2017 to July 2021, where he was responsible for leading engineering, information security, IT and business technology teams. Prior to Zenefits, he served as SVP Engineering at Grand Rounds from May 2016 to September 2017. Mr. Das holds a bachelor’s degree in Computer Science and Engineering from the Indian Institute of Technology, Kharagpur, and a master’s degree in Computer Science from the University of Georgia, Athens.
Susan Ganeshan has been our Chief Marketing Officer since June 2021. Ms. Ganeshan served as Chief Marketing Officer at Granicus from May 2018 to June 2021. Prior to that, she served as Chief Marketing Officer at Clarabidge from May 2014 to November 2017. In the past, she has worked at newBrandAnalytics (acquired by Sprinklr), webMethods (acquired by Software AG), Checkfree (now Fiserv), and Deloitte Consulting. Ms. Ganeshan holds a bachelor’s degree in mathematics from the University of Pittsburgh.
Joseph Kochansky has been our President, Product and Technology since July 2021. Prior to Clearwater, Mr. Kochansky served as Chief Technology Officer at Wilshire from January 2021 to July 2021. He also served as Industry Partner at Motive Partners from December 2020 to July 2021. Mr. Kochansky worked at Blackrock from 1992 to February 2020, where he held a variety of leadership roles in the technology, analytics and portfolio management sectors, including Managing Director, Head of the Aladdin Product Group (APG), Co-Head of the BlackRock Solutions Analytics Team and Head of Equity Trading for the Americas. Mr. Kochansky holds a bachelor’s degree in economics from Duke University.
James Price has been our Chief Quality Officer since April 2020. Mr. Price joined Clearwater Analytics in November 2004 and, prior to his current role, he served as the first software development team lead, and then our Director of Development from 2004 to 2016 and our Chief Technology Officer from 2016 to 2020. Mr. Price previously worked as a software developer at Hewlett Packard, Xpit.com, RateXchange and CQG Inc. as a developer and lead architect. Mr. Price holds a bachelor’s degree in computer science from Utah State University.
Gayatri Raman has been our President, Europe and Asia since June 2021. Previously, she served as our Managing Director, International Business from February 2020 to June 2021. Before joining Clearwater, Ms. Raman was Chief Executive Officer of AIM Software, a leading data management software provider, from March 2017 to October 2019, and before that Chief Operating Officer from 2015 to 2017. Previously, she was Head of Sales for Capgemini’s Capital Markets business. She started her career in consulting with Accenture. Ms. Gayatri holds a bachelor’s degree in engineering from Bombay University.
Subi Sethi has been our Chief Client Officer since January 2020. Before joining Clearwater, Ms. Sethi led the end-to-end operations at UnitedHealth Group’s Optum Global Solutions from March 2014 to January 2020. Prior to joining Optum Global Solutions, she worked with Genpact from 2005 to 2014 across varied leadership positions in functions like Operations, Quality, Transitions and Technology. Ms. Sethi holds a degree in mathematics from Delhi University and a degree in Advanced Management from the Institute of Management Technology, Ghaziabad.
122
Table of Contents
Index to Financial Statements
Josh Sullivan has been our Chief Strategy Officer since June 2021 and, prior to that, was our Head of Product since March 2019. Mr. Sullivan has been an Operating Partner at Welsh Carson since October 2011. Previously, Mr. Sullivan served as Associate Principal at McKinsey & Company. He also worked at Procter & Gamble as an operations manager. Mr. Sullivan holds a bachelor’s degree from Cornell University and an MBA from New York University Stern School of Business.
Alphonse Valbrune has been our Chief Legal Officer since August 2020. Previously, from 2011 to 2020, Mr. Valbrune held several roles within the legal group of Genpact, most recently leading the group of attorneys responsible for the commercial transactions of Genpact’s Banking and Capital Markets vertical. For more than ten years, Mr. Valbrune served as General Counsel and Deputy General Counsel at Headstrong, a global professional services firm. Prior to that, Mr. Valbrune was an associate attorney at Skadden, Arps, Slate, Meagher & Flom, where he specialized in corporate finance and mergers and acquisitions. Mr. Valbrune holds a bachelor’s degree from Harvard College and a JD from Columbia University School of Law.
Eric Lee has been the Chairman of our Board of Directors since September 2016. Mr. Lee is a General Partner at Welsh Carson and a member of the Management and Investment Committees. Mr. Lee joined Welsh Carson in 1999 and helps to lead the firm’s Technology investment practice. He currently serves on the board of directors for several of Welsh Carson’s portfolio companies, including Avetta, Green Street Advisors and Revel Systems. Before joining Welsh Carson, he worked at Goldman Sachs & Co. in the Mergers & Acquisitions and High Technology investment banking groups from 1995 to 1999. Mr. Lee holds a bachelor’s degree from Harvard College.
Jacques Aigrain has been a Director since February 2021. Mr. Aigrain currently serves as Chairman of the board of directors at LyondellBasell NV (since 2011) and Singular Bank SAU (since 2019). He also holds directorships in the London Stock Exchange Group (LSEG Ltd) and WPP Plc, both since 2013. Mr. Aigrain worked for nine years at SwissRe AG, including as Chief Executive Officer, and spent 20 years in global leadership roles at JP Morgan Chase & Co. in New York, London and Paris. Mr. Aigrain holds a master’s degree in economics from Paris Dauphine University and a PhD in economics from Sorbonne University.
Kathleen A. Corbet has been a Director since March 2021. She also serves as principal at Cross Ridge Capital, LLC, a venture capital and management consulting firm she founded in 2008 for early-stage venture firms, government agencies, municipalities and non-profit enterprises. Ms. Corbet currently serves on the boards of Massachusetts Mutual Life Insurance Company (since 2008) and Waveny LifeCare Network (since 2017). In addition, she served as President of Standard & Poor’s from 2004 to 2007. Ms. Corbet held several executive positions with AllianceBernstein from 1993 to 2004, including Chief Executive Officer of the Alliance Fixed Income division from 2000 to 2004. She also held directorships at BlackRock TCP Capital Corp., CEB Inc. and AxiomSL. Ms. Corbet holds a bachelor’s degree in computer science and marketing from Boston College and an MBA from New York University Stern School of Business.
Cary Davis has been a Director since November 2020. Mr. Davis joined Warburg Pincus in 1994 and is responsible for Technology investments in the Software and Financial Technology sectors. He currently serves as a Director of BitSight, Crowdstrike, Cyren, eSentire, Infoblox, Reorg Research and Varo Money. Mr. Davis is Chairman of the American Academy in Rome and a Trustee of the Andy Warhol Foundation. Prior to joining Warburg Pincus, Mr. Davis was an Executive Assistant to Michael Dell at Dell Computer and a consultant at McKinsey & Company. He has also been an adjunct professor at the Columbia University Graduate School of Business, Chairman of the Jewish Community House of Bensonhurst and Chairman of the Boys Prep Charter School. Mr. Davis holds a bachelor’s degree in Economics from Yale University and an MBA from Harvard Business School.
Anthony J. deNicola has been a Director since July 2017. Mr. deNicola is Chairman and a General Partner of Welsh Carson, having joined Welsh Carson in 1994. He joined the Management Committee of Welsh Carson in 2000 and served as its President and Managing Partner from 2007 through March 2021. He currently holds
123
Table of Contents
Index to Financial Statements
directorships in several Welsh Carson portfolio companies, such as Alert Logic, Asurion and Revel Systems. Previously, Mr. deNicola worked in the private equity group at William Blair & Company. He also worked at Goldman Sachs & Co. in the Mergers and Acquisitions Department. Mr. deNicola holds a bachelor’s degree from DePauw University and an MBA from Harvard Business School.
Christopher Hooper has been a Director since July 2017. Mr. Hooper has served since 2017 as a General Partner in the Technology Group at Welsh Carson and leads the firm’s San Francisco office, having originally joined Welsh Carson in 2005. He currently serves as a Director at Green Street and Avetta. Earlier in his career, Mr. Hooper worked as a Principal at Golden Gate Capital in San Francisco and as an Analyst at Lazard in New York. Mr. Hooper holds a bachelor’s degree from Colgate University.
Marcus Ryu has been a Director since March 2021. Mr. Ryu has served as the Chairman of the board of directors of Guidewire Software since August 2019. Since co-founding Guidewire in 2001, he has held many roles in the company, including leading the product, marketing, sales and services teams. Most recently, Mr. Ryu served as Chief Executive Officer from 2010 to 2019, leading Guidewire through its IPO in 2012. Before co-founding Guidewire, he was Vice President of Strategy at Ariba and an Engagement Manager at McKinsey & Company. Mr. Ryu currently serves as Co-founder and President of Braneframe, Inc. since March 2021. He has held directorships at multiple public and private companies, including Checkr, Bloomreach, Procore Technologies, Cornerstone OnDemand, Mulesoft, Opower and Brighter. Mr. Ryu holds a bachelor’s degree from Princeton University and a B.Phil. degree from New College, Oxford University.
Andrew Young has been a Director since November 2020. Mr. Young joined the London office of Permira Advisers in 2011 and relocated to Menlo Park in 2018, where he currently works as a Principal. He also serves on the board of Seismic, Zwift and Klarna. Prior to joining Permira, Mr. Young worked for Pacific Equity Partners as an investment executive in their Sydney and New York offices. Before that, he worked as an associate at Citi. Mr. Young holds a bachelor’s degree in Finance from University of Technology, Sydney and an MBA from London Business School.
Board of Directors
Upon consummation of this offering, our board of directors will consist of nine individuals, including our chairman. We expect our board of directors to determine that Jacques Aigrain and Kathleen A. Corbet are independent directors under the standards of NYSE.
Our certificate of incorporation, which will be effective upon the consummation of this offering, will provide that our board of directors will be divided into three classes of directors, with the classes to be as nearly equal in number as possible, and with the directors serving three-year terms. For further information, see the section entitled “Description of Capital Stock—Antitakeover Effects of Delaware Law, Our Certificate of Incorporation and Our Bylaws.” Our board of directors will be divided among the three classes as follows:
| • | Our class I directors will be Marcus Ryu, Kathleen A. Corbet and Jacques Aigrian, and their terms will expire at the first annual meeting of stockholders following this offering. |
| • | Our class II directors will be Anthony J. deNicola, Christopher Hooper and Sandeep Sahai, and their terms will expire at the second annual meeting of stockholders following this offering. |
| • | Our class III directors will be Eric Lee, Andrew Young and Cary Davis, and their terms will expire at the third annual meeting of stockholders following this offering. |
Our certificate of incorporation will provide that, from and after the Trigger Event, any newly created directorship on our board of directors that results from an increase in the number of directors and any vacancy occurring in our board of directors may only be filled by a majority of the directors then in office, although less than a quorum, or by a sole remaining director (and not by the stockholders).
Pursuant to the CWAN Holdings, LLC’s Second Amended and Restated LLC Agreement, (i) Welsh Carson designated Anthony J. deNicola, Christopher Hooper, Eric Lee, Marcus Ryu and Kathleen A. Corbet as directors,
124
Table of Contents
Index to Financial Statements
(ii) Permira designated Andrew Young as a director, (iii) Warburg Pincus designated Cary Davis as a director, (iv) Permira and Warburg Pincus designated Jacques Aigrain by mutual agreement and (vi) Sandeep Sahai, the Chief Executive Officer, became a director. In connection with this offering, we intend to enter into the Stockholders’ Agreement with the Principal Equity Owners, which will govern matters related to our corporate governance and rights to designate directors. For more information, see “Certain Relationships and Related Party Transactions—Stockholders’ Agreement.” Each director set forth above is expected to continue as a director after the Stockholders’ Agreement becomes effective.
Committees of Our Board of Directors
Our board of directors will establish, effective upon the consummation of this offering, audit, compensation, and nominating and corporate governance committees. The composition, duties and responsibilities of these committees are set forth below. Our board of directors may from time to time establish certain other committees to facilitate the management of the Company.
Audit Committee
Upon the completion of this offering, we will have an audit committee that is responsible for, among other matters: (1) appointing, compensating, retaining, evaluating, terminating and overseeing our independent registered public accounting firm; (2) discussing with our independent registered public accounting firm its independence from us; (3) reviewing with our independent registered public accounting firm the matters required to be reviewed by applicable auditing requirements; (4) approving all audit and permissible non-audit services to be performed by our independent registered public accounting firm; (5) overseeing the financial reporting process and discussing with management and our independent registered public accounting firm the interim and annual financial statements that we file with the SEC; (6) reviewing and monitoring our internal controls, disclosure controls and procedures and compliance with legal and regulatory requirements; (7) establishing procedures for the confidential anonymous submission of concerns regarding questionable accounting, internal controls, auditing and federal securities law matters; and (8) reviewing and approving related person transactions.
Our audit committee will consist of Kathleen A. Corbet, Jacques Aigrain and Christopher Hooper, with Kathleen A. Corbet serving as chairman. Rule 10A-3 under the Exchange Act and NYSE rules require us to have one independent audit committee member upon the listing of our Class A common stock on NYSE, a majority of independent directors within 90 days of the date of listing and all independent audit committee members within one year of the date of listing. We intend to comply with the independence requirements within the time periods specified. Our board of directors has determined that each of Jacques Aigrain and Kathleen A. Corbet is an “audit committee financial expert” as defined by applicable SEC rules and has the requisite financial sophistication as defined under the applicable NYSE rules and regulations. Our board of directors will adopt, effective upon the consummation of this offering, a written charter for the audit committee, which will be available on our website upon the completion of this offering.
Compensation Committee
Upon the completion of this offering, we will have a compensation committee that is responsible for, among other matters: (1) reviewing officer and executive compensation goals, policies, plans and programs; (2) reviewing and approving or recommending to our board of directors or the independent directors, as applicable, the compensation of our directors, Chief Executive Officer and other executive officers; (3) reviewing and approving employment agreements and other similar arrangements between us and our officers and other key executives; and (4) appointing and overseeing any compensation consultants.
Our compensation committee will consist of Eric Lee, Anthony J. deNicola, Andrew Young and Cary Davis, with Eric Lee serving as chairman. As a controlled company, we are not required to ensure that the composition of our compensation committee meets the requirements for independence under current rules and
125
Table of Contents
Index to Financial Statements
regulations of the SEC and NYSE. Each member of the compensation committee will be a nonemployee director, as defined pursuant to Rule 16b-3 promulgated under the Exchange Act, and an outside director, as defined pursuant to Section 162(m) of the Internal Revenue Code of 1986, as amended (the “Code”). Our board of directors will adopt, effective upon the consummation of this offering, a written charter for the committee, which will be available on our website upon the completion of this offering.
Nominating and Corporate Governance Committee
Upon the completion of this offering, we will have a nominating and corporate governance committee that is responsible for, among other matters: (1) identifying individuals qualified to become members of our board of directors, consistent with criteria approved by our board of directors; (2) overseeing the organization of our board of directors to discharge the board’s duties and responsibilities properly and efficiently; and (3) developing and recommending to our board of directors a set of corporate governance guidelines and principles.
Our nominating and corporate governance committee will consist of Eric Lee, Christopher Hooper, Andrew Young and Cary Davis, with Eric Lee serving as chairman. As a controlled company, we are not required to ensure that the composition of our nominating and corporate governance committee meets the requirements for independence under current rules and regulations of the SEC and NYSE. Our board of directors will adopt, effective upon the consummation of this offering, a written charter for the nominating and corporate governance committee, which will be available on our website upon the completion of this offering.
Controlled Company Exemption
Upon completion of this offering, the Principal Equity Owners will continue to control a majority of the voting power of our outstanding common stock. As a result, we will be a “controlled company” under NYSE corporate governance standards. As a controlled company, exemptions under the NYSE standards will free us from the obligation to comply with certain corporate governance requirements, including the requirements:
| • | that a majority of our board of directors consist of independent directors; |
| • | that nominating and corporate governance matters be decided solely by independent directors; and |
| • | that employee and officer compensation matters be decided solely by independent directors. |
Following this offering, we intend to utilize these exemptions. These exemptions do not modify the independence requirements for our audit committee, and we intend to comply with the requirements of Rule 10A-3 under the Exchange Act, and the rules of NYSE within the applicable time frame.
Director Compensation for 2020
We did not have any nonemployee directors who received compensation for their service on our board of directors and committees of our board of directors during 2020.
Non-Employee Director Compensation Program
In 2021, CWAN Holdings, LLC appointed (i) Jacques Aigrain as a member of the board of Carbon Analytics, (ii) Kathleen A. Corbet as a member of the board of CWAN Holdings, LLC, and (iii) Marcus Ryu as a member of the board of CWAN Holdings, LLC and as the Chairman of a committee on globalization insurance that will be formed following this offering. Pursuant to Messrs. Aigrain’s and Ryu’s and Ms. Corbet’s respective board letter agreement, Messrs. Aigrain and Ryu and Ms. Corbet are each eligible to receive an annualized cash retainer equal to $20,000 per calendar year, and following this offering, an annualized cash retainer equal to $40,000. In addition, Mr. Aigrain and Ms. Corbet are eligible to receive an annualized cash retainer equal to
126
Table of Contents
Index to Financial Statements
$5,000 per calendar year, and following this offering, an annualized cash retainer equal to $10,000 for serving on the Audit Committee (increased to $10,000 and $20,000, respectively, if serving as the Chairperson of the Audit Committee). In addition, (i) Mr. Aigrain and Ms. Corbet each received an award of 48,387 options to purchase Class B Common Units and is eligible to receive an additional number of options equal to $200,000 divided by the fair market value of the Class B units of the Company on the date of grant, multiplied by two, on each anniversary of the initial date of grant and invested in Class B Common Units having an investment value equal to $310,000 and $250,000, respectively, and (ii) Mr. Ryu received an award of 279,033 options to purchase Class B Common Units and invested in Class B Common Units having an investment value equal to $1,000,000.
Code of Business Conduct and Ethics
We will adopt, effective upon the consummation of this offering, an amended code of business conduct and ethics that will apply to our directors, officers and employees, including our principal executive officer, principal financial officer, principal accounting officer or controller or persons performing similar functions. A copy of the code will be available on our website.
127
Table of Contents
Index to Financial Statements
“Company,” “we,” “us,” “Clearwater” and similar references refer, (1) following the consummation of the Transactions, including this offering, to Clearwater Analytics Holdings, Inc., and, unless otherwise stated, all of its direct and indirect subsidiaries, including CWAN Holdings, LLC, and (2) prior to the completion of the Transactions, including this offering, to CWAN Holdings, LLC and, unless otherwise stated, all of its direct and indirect subsidiaries.
This section discusses the material components of the executive compensation program for our Chief Executive Officer and our three other most highly compensated officers, whom we refer to as our “named executive officers.” Although the SEC reporting rules only require us to include our Chief Executive Officer and our two other most highly compensated officers as “named executive officers” in this prospectus, we have also included information regarding Mr. Price, our Chief Quality Officer, in order to show a more fulsome picture of our executive compensation programs. For the fiscal year ended December 31, 2020 (“Fiscal 2020”), our named executive officers and their positions were as follows:
| • | Sandeep Sahai, Chief Executive Officer; |
| • | Jim Cox, Chief Financial Officer; |
| • | Scott Erickson, Chief Operating Officer; and |
| • | James Price, Chief Quality Officer. |
This discussion may contain forward-looking statements that are based on our current plans, considerations, expectations and determinations regarding future compensation programs. Actual compensation programs that we adopt in the future may differ materially from the currently planned programs summarized in this discussion.
Summary Compensation Table
| Name and principal position |
Year | Salary(1) ($) |
Option Awards(2) ($) |
Non-Equity Incentive Plan Compensation(3) ($) |
All Other compensation(4) ($) |
Total ($) |
||||||||||||||||||
| Sandeep Sahai |
2020 | 594,000 | 4,003,225 | 750,000 | 33,257,201 | 38,604,426 | ||||||||||||||||||
| Jim Cox |
2020 | 371,000 | 1,241,262 | 243,851 | 9,888,406 | 11,744,519 | ||||||||||||||||||
| Scott Erickson (*) |
2020 | 300,000 | 605,020 | 257,658 | 7,296,058 | 8,458,736 | ||||||||||||||||||
| James Price (*) |
2020 | 280,000 | — | 127,275 | 4,699,583 | 5,106,858 | ||||||||||||||||||
| * | In addition to the amounts set forth in the table above, Messrs. Erickson and Price realized $4,082,455 and $4,559,902, respectively, from the sale of previously held units to new investors and receipt of dividends on such units in connection with the Recapitalization. |
| (1) | Amounts reported in this column reflect the actual base salaries paid to our named executive officers for Fiscal 2020. |
| (2) | Amounts reported in this column reflect the aggregate grant date fair value of the option grants, computed in accordance with FASB ASC Topic 718, made to our named executive officers on January 21, 2020. |
| (3) | Amounts reported in this column reflect annual bonuses paid in February 2021 in respect of Fiscal 2020 performance. |
128
Table of Contents
Index to Financial Statements
| (4) | All Other Compensation paid in Fiscal 2020 is comprised of the following: |
| Name |
Year | 401(k) Contribution $ (a) |
Other Personal Benefits $ (b) |
Transaction Bonus $ (c) |
Settlement of Option Awards $ (d) |
|||||||||||||||
| Sandeep Sahai |
2020 | — | 12,095 | 15,125,992 | 18,119,114 | |||||||||||||||
| Jim Cox |
2020 | 11,400 | 23,464 | 5,715,851 | 4,137,691 | |||||||||||||||
| Scott Erickson |
2020 | 11,400 | 23,447 | 2,000,012 | 5,261,199 | |||||||||||||||
| James Price |
2020 | 11,400 | 23,264 | 1,000,008 | 3,664,911 | |||||||||||||||
| (a) | Amounts reported in this column represent the amount of Company matching contributions made in respect of Fiscal 2020 to account under our 401(k) plan for each of Messrs. Cox, Erickson and Price. |
| (b) | Amounts reported in this column represent health insurance premiums paid by the Company on behalf of each of our named executive officers. |
| (c) | In connection with the Recapitalization, each of our named executive officers entered into a transaction bonus and option exercise agreement with the Company pursuant to which each named executive officer was paid a one-time transaction bonus, one-third of which is subject to forfeiture in the event of a termination of employment for Cause or resignation for any reason other than for Good Reason (each as defined in the 2017 Equity Incentive Plan as defined below) prior to November 2, 2021. Amounts in this column reflect the full amount of the transaction bonuses paid to each of our named executive officers in Fiscal 2020 pursuant to this transaction bonus and option exercise agreement. |
| (d) | In connection with the Recapitalization and pursuant to the terms of the transaction bonus and option exercise agreement, the Company partially accelerated the vesting of options held by each of Messrs. Sahai, Cox and Erickson, and each of our named executive officers exercised a portion of their vested options. The Company accelerated the vesting of 1,908,992 options for Mr. Sahai, 588,095 options for Mr. Cox and 437,252 options for Mr. Erickson. Each of Messrs. Sahai, Cox, Erickson and Price exercised 2,439,984 options, 558,946 options, 677,056 options and 469,700 options, respectively. Amounts in this column reflect the cash amount realized pursuant to the exercise of options in connection with the Recapitalization. |
Narrative Disclosure to Summary Compensation Table
(a) Elements of Compensation
The compensation of our named executive officers generally consists of base salary, annual cash bonus opportunities, long-term incentive compensation in the form of equity awards and other benefits, as described below.
(b) Base Salary
The base salary payable to each named executive officer is intended to provide a fixed component of compensation reflecting his or her skill set, experience, role, responsibilities and contributions. In January 2020, we increased Mr. Sahai’s base salary by $44,000, Mr. Cox’ base salary by $21,000, and Mr. Erickson’s base salary by $50,000. Mr. Price’s base salary did not change in Fiscal 2020. As of the end of Fiscal 2020, our named executive officers were entitled to the following base salaries.
| Named Executive Officer |
Base Salary | |||
| Sandeep Sahai |
$ | 594,000 | ||
| Jim Cox |
$ | 371,000 | ||
| Scott Erickson |
$ | 300,000 | ||
| James Price |
$ | 280,000 | ||
129
Table of Contents
Index to Financial Statements
(c) Annual Cash Bonus Opportunities
Each of our named executive officers was eligible to receive an annual cash incentive award for Fiscal 2020, based on achievement of both individual and company-wide performance measures. The performance objectives include measurable objectives that will contribute to the Company’s strategic goals. The Fiscal 2020 bonuses were targeted at $712,800 for Mr. Sahai, $230,000 for Mr. Cox, $250,000 for Mr. Erickson and $140,000 for Mr. Price. Messrs. Sahai, Cox, Erickson and Price each earned 105%, 106%, 103% and 91% of their respective target bonus for Fiscal 2020, due to the Company’s achievement of its company-wide performance measures and each named executive officer’s achievement of his individual objectives.
(d) Equity Compensation
As of the end of Fiscal 2020, each of our named executive officers held options to purchase Class B Common Units of CWAN Holdings, LLC (“Class B Common Units”), awarded under the Carbon Analytics Holdings LLC 2017 Equity Incentive Plan, as amended from time to time (the “2017 Equity Incentive Plan”).
The named executive officers generally were granted both time-vesting options and performance-vesting options, representing 40% and 60% of the total number of options, respectively. The time-vesting options generally vest in equal 20% installments on each of the first five anniversaries of the grant date, such that all of the time-vesting option would have been fully vested as of the fifth anniversary of the grant date, and the performance-vesting options vesting in equal 20% installments at the end of each of the first five fiscal years after the grant date, based on the achievement of performance objectives set by CWAN Holdings, LLC, in each case subject to each of our named executive officers’ continued employment through the applicable vesting date. Performance-vesting options may partially vest based on partial achievement of performance objectives set by CWAN Holdings, LLC, as determined by the board of CWAN Holdings, LLC. To the extent that any performance-vesting options do not vest based on the achievement of the applicable performance goals for the applicable fiscal year, then, unless otherwise determined by the board of CWAN Holdings, LLC, the performance-vesting options may remain outstanding and eligible to vest based on the achievement of the performance goals for subsequent fiscal year(s). In connection with the consummation of this offering, outstanding options to purchase Class B Common Units granted under the 2017 Equity Incentive Plan will be converted into options to purchase shares of our Class A common stock.
In connection with the Recapitalization, CWAN Holdings, LLC partially accelerated the vesting of options held by Messrs. Sahai, Cox and Erickson pursuant to their respective transaction bonus and option exercise agreement. Specifically, CWAN Holdings, LLC accelerated the vesting of options held by Messrs. Sahai, Cox and Erickson in an amount equal to 1,908,992 options for Mr. Sahai, 588,095 options for Mr. Cox, and 437,252 options for Mr. Erickson, and each of Messrs. Sahai, Cox, Erickson and Price exercised 2,439,984 options, 558,946 options, 677,056 options and 469,700 options, respectively. In addition, each of our named executive officers received a one-time transaction bonus award in the amount equal to $15,125,992 for Mr. Sahai, $5,715,851 for Mr. Cox, $2,000,012 for Mr. Erickson and $1,000,008 for Mr. Price, one-third of which is subject to forfeiture in the event of a termination of employment for Cause or resignation for any reason other than for Good Reason (each as defined in the 2017 Equity Incentive Plan), in each case, within 12 months following the consummation of the Recapitalization.
Each named executive officer’s employment agreement provides that upon a Change in Control (as defined in the 2017 Equity Incentive Plan), the named executive officer’s then unvested options will be eligible to performance-vest as follows: (i) if an affiliate of Welsh Carson’s expected internal rate of return from the Change in Control transaction (including any rollover shares) is at least 20%, then 50% of the then unvested options will vest immediately prior to the Change in Control transaction; (ii) if an affiliate of Welsh Carson’s expected internal rate of return is at least 28%, then 100% of the then unvested options will vest immediately prior to the Change in Control transaction; and (iii) if an affiliate of Welsh Carson’s expected internal rate of return from the Change in Control transaction is between 20% and 28%, then unvested options will vest on a pro-rated basis immediately prior to the Change in Control.
130
Table of Contents
Index to Financial Statements
In connection with the consummation of this offering, outstanding options to purchase Class B Common Units granted under the 2017 Equity Incentive Plan will be converted into options to purchase shares of our Class A common stock.
In addition, in connection with the consummation of this offering, the board of CWAN Holdings, LLC approved the following changes to the terms and conditions of our named executive officers’ (and our other employees’) options: (i) removal of the restrictions on the exercisability of the vested options, and (ii) removal of the performance-vesting criteria such that all unvested options currently outstanding will vest as if they are time-vesting options. In addition, the board of CWAN Holdings, LLC amended the above-described option acceleration terms of the named executive officers (and other executive officers) to provide for accelerated vesting of any then unvested options outstanding at the time of the consummation of this offering to the earlier of a Change in Control or the date that Welsh Carson and its affiliates own less than 5% of the common stock of Clearwater.
In March 2021, we granted Sandeep Sahai, Jim Cox, Scott Erickson and James Price 1,350,000 options, 437,500 options, 437,500 options and 62,500 options, respectively, under the 2017 Equity Incentive Plan. These options have an exercise price of $12.40 and generally vest annually in four equal tranches commencing January 1, 2022, in each case, subject to the executive’s continued employment through the applicable vesting date.
(e) Other Benefits
We currently provide broad-based welfare benefits that are available to all of our employees, including our named executive officers, and include health, dental, life, vision and short- and long-term disability insurance.
In addition, we maintain, and the named executive officers, other than Mr. Sahai, participate in, a 401(k) plan, which is intended to be qualified under Section 401(a) of the Code, which provides eligible employees with an opportunity to save for retirement on a tax-advantaged basis, and we match 4% of an employee’s contributions up to $285,000 of the employee’s eligible earnings. Employees’ pre-tax contributions and our matching contributions are allocated to each participant’s individual account and are then invested in selected investment alternatives according to the participant’s directions.
Outstanding Equity Awards at Fiscal Year End
The following table summarizes the outstanding option awards held by our named executive officers as of December 31, 2020.
| Option Awards | ||||||||||||||||||||
| Name |
Grant Date | Number of securities underlying unexercised options (#) exercisable |
Number of securities underlying unexercised options (#) unexercisable |
Option exercise price ($) |
Option expiration date |
|||||||||||||||
| Sandeep Sahai |
11/14/2017 | (1) | 90,675 | 17,500 | 4.00 | 11/14/2027 | ||||||||||||||
| 11/28/2018 | (2) | 1,316,738 | 1,248,750 | 4.40 | 11/28/2028 | |||||||||||||||
| 1/21/2020 | (3) | 152,578 | 518,600 | 4.40 | 1/21/2030 | |||||||||||||||
| Jim Cox |
5/20/2019 | (4) | 310,050 | 705,000 | 4.40 | 5/20/2029 | ||||||||||||||
| 1/21/2020 | (5) | 47,309 | 160,800 | 4.40 | 1/21/2030 | |||||||||||||||
| Scott Erickson |
11/2/2017 | (6) | 362,700 | 70,000 | 4.00 | 12/31/2027 | ||||||||||||||
| 4/10/2018 | (7) | 35,588 | 33,750 | 4.00 | 12/31/2028 | |||||||||||||||
| 1/1/2019 | (8) | 12,919 | 29,375 | 4.40 | 1/1/2029 | |||||||||||||||
| 1/21/2020 | (9) | 4,601 | 23,953 | 4.40 | 1/21/2030 | |||||||||||||||
| 1/21/2020 | (10) | 17,064 | 58,000 | 4.40 | 1/21/2030 | |||||||||||||||
| James Price |
11/2/2017 | (11) | 280,800 | 480,000 | 4.00 | 12/31/2027 | ||||||||||||||
| 4/10/2018 | (12) | 19,500 | 75,000 | 4.00 | 12/31/2028 | |||||||||||||||
131
Table of Contents
Index to Financial Statements
| (1) | Represents an award of 250,000 options, with 100,000 options subject to time-vesting and 150,000 options subject to performance-vesting. Pursuant to Mr. Sahai’s transaction bonus and option exercise agreement, the Company accelerated the vesting of 33,000 time-vesting options and 49,500 performance-vesting options. In connection with the Recapitalization, Mr. Sahai exercised and settled 141,825 options from this grant. |
| (2) | Represents an award of 4,625,000 options, with 1,850,000 options subject to time-vesting and 2,775,000 options subject to performance-vesting. Pursuant to Mr. Sahai’s transaction bonus and option exercise agreement, the Company accelerated the vesting of 610,500 time-vesting options and 915,750 performance-vesting options. In connection with the Recapitalization, Mr. Sahai exercised and settled 2,059,513 options from this grant. |
| (3) | Represents an award of 909,824 options, with 327,537 options subject to time-vesting, 491,305 options subject to performance-vesting, and 90,982 options vested as of the date the date of grant. Pursuant to Mr. Sahai’s transaction bonus and option exercise agreement, the Company accelerated the vesting of 120,097 time-vesting options and 180,145 performance-vesting options. In connection with the Recapitalization, Mr. Sahai exercised and settled 238,647 options from this grant. |
| (4) | Represents an award of 1,500,000 options, with 600,000 options subject to time-vesting and 900,000 options subject to performance vesting. Pursuant to Mr. Cox’s transaction bonus and option exercise agreement, the Company accelerated the vesting of 198,000 time-vesting options and 297,000 performance-vesting options. In connection with the Recapitalization, Mr. Cox exercised and settled 484,950 options from this grant. |
| (5) | Represents an award of 282,105 options, with 101,558 options subject to time-vesting, 152,337 options subject to performance-vesting, and 28,211 options vested as of the date the date of grant. Pursuant to Mr. Cox’s transaction bonus and option exercise agreement, the Company accelerated the vesting of 37,238 time-vesting options and 55,857 performance-vesting options. In connection with the Recapitalization, Mr. Cox exercised and settled 73,996 options from this grant. |
| (6) | Represents an award of 1,000,000 options, with 400,000 options subject to time-vesting and 600,000 options subject to performance vesting. Pursuant to Mr. Erickson’s transaction bonus and option exercise agreement, the Company accelerated the vesting of 132,000 time-vesting options and 198,000 performance-vesting options. In connection with the Recapitalization, Mr. Erickson exercised and settled 567,300 options from this grant. |
| (7) | Represents an award of 125,000 options, with 50,000 options subject to time-vesting and 75,000 options subject to performance vesting. Pursuant to Mr. Erickson’s transaction bonus and option exercise agreement, the Company accelerated the vesting of 16,500 time-vesting options and 24,750 performance-vesting options. In connection with the Recapitalization, Mr. Erickson exercised and settled 55,663 options from this grant. |
| (8) | Represents an award of 62,500 options, with 25,000 options subject to time-vesting and 37,500 options subject to performance vesting. Pursuant to Mr. Erickson’s transaction bonus and option exercise agreement, the Company accelerated the vesting of 8,250 time-vesting options and 12,375 performance-vesting options. In connection with the Recapitalization, Mr. Erickson exercised and settled 20,206 options from this grant. |
| (9) | Represents an award of 35,750 options, with 14,300 options subject to time-vesting and 21,450 options subject to performance vesting. Pursuant to Mr. Erickson’s transaction bonus and option exercise agreement, the Company accelerated the vesting of 4,719 time-vesting options and 7,079 performance-vesting options. In connection with the Recapitalization, Mr. Erickson exercised and settled 7,197 options from this grant. |
| (10) | Represents an award of 101,755 options, with 36,632 options subject to time-vesting, 54,947 options subject to performance-vesting, and 10,175 options vested as of the date the date of grant. Pursuant to Mr. Erickson’s transaction bonus and option exercise agreement, the Company accelerated the vesting of 13,432 time-vesting options and 20,147 performance-vesting options. In connection with the Recapitalization, Mr. Erickson exercised and settled 26,690 options from this grant. |
| (11) | Represents an award of 1,200,000 options, with 480,000 options subject to time-vesting and 720,000 options subject to performance vesting. In connection with the Recapitalization, Mr. Price exercised and settled 439,200 options from this grant. |
| (12) | Represents an award of 125,000 options, with 50,000 options subject to time-vesting and 75,000 options subject to performance vesting. In connection with the Recapitalization, Mr. Price exercised and settled 30,500 options from this grant. |
132
Table of Contents
Index to Financial Statements
Emerging Growth Company Status
As an emerging growth company, we will be exempt from certain requirements related to executive compensation, including the requirements to hold a nonbinding advisory vote on executive compensation and to provide information relating to the ratio of total compensation of our Chief Executive Officer to the median of the annual total compensation of all of our employees, each as required by the Investor Protection and Securities Reform Act of 2010, which is part of the Dodd-Frank Wall Street Reform and Consumer Protection Act.
Employment Agreements
We are party to employment agreements with Messrs. Sahai, Cox, Erickson and Price, which provide for at-will employment, subject to the severance entitlements described below, and set forth each named executive officer’s initial annual base salary and target annual bonus opportunity (with the rate of each for Fiscal 2020 set forth above), among other terms and conditions.
The employment agreements provide that, upon termination of a named executive officer’s employment by us for any reason other than for “cause,” or by the named executive officer for “good reason,” each as defined therein and summarized below, subject to the named executive officer’s execution, delivery and non-revocation of a general release of all claims in favor of the Company, the named executive officer is entitled to severance.
For Mr. Sahai, severance consists of (i) 12 months of continued base salary payments and (ii) target annual bonus for the year of termination, based on our achievement of target bonus performance measurement for the year of termination and payable at the time that annual bonuses for the applicable fiscal year are paid generally. In addition, upon termination of employment (other than for “cause”), Mr. Sahai’s vested options remain outstanding until the earlier of (i) a Change in Control (as defined in the 2017 Equity Incentive Plan) transaction, upon which the vested options are cancelled in exchange for cash consideration or (ii) the expiration of the term. Mr. Sahai’s employment agreement also provides that upon a transaction that consists of a final sale of the Company or a substantial sale of our equity or assets, the Company may, at our discretion, grant a transaction bonus to Mr. Sahai.
For Mr. Cox, Mr. Erickson, and Mr. Price, severance consists of six months of continued base salary payments.
Under Mr. Sahai’s employment agreement, “cause” generally means: (i) material breach by Mr. Sahai of any term of the employment agreement, or the Company’s policies, his fiduciary duties to the Company, CWAN Analytics, LLC or any of their affiliates, or of any law, statute, or regulation, (ii) misconduct which is materially injurious to the Company, CWAN Analytics, LLC or any of their affiliates, either monetarily or otherwise, or which impairs his ability to effectively perform his duties or responsibilities, (iii) personal conduct which materially impairs his ability to perform his duties or manage subordinate employees, including but not limited to the abuse of alcohol or controlled substances, sexual harassment and discrimination, (iv) habitual or repeated neglect of his duties or responsibilities, (v) failure to comply with any valid and legal directive of the board of directors of the Company, which failure has a material impact on the Company, (vi) appropriation of (or attempted appropriation of) a business opportunity of the Company, CWAN Analytics, LLC, or their affiliates, including attempting to secure or securing any personal profit in connection with an transaction by the Company or its affiliates, (vii) commission or conviction for (or the procedural equivalent or conviction for), or entering of a guilty plea or plea of no content with respect to any felony or a crime, which in the Company’s reasonable judgment, involves moral turpitude, (viii) willful unauthorized disclosure (or attempted disclosure) of confidential information, (ix) intentional injury of another employee or any person in the course of performing services for the Company, or (x) any conflict of interest, including, but not limited to solicitation of business on behalf of a competitor or potential competitor or breach of any fiduciary duty to the Company, CWAN Analytics, LLC or any of their affiliates. With respect to clauses (i) through (iii), if capable of cure, Mr. Sahai must be given a reasonable opportunity to comply with such policy or cure his failure or misconduct to the satisfaction of the board of directors of Company within the reasonable time prescribed by the board of directors of the Company to cure such failure or misconduct as set forth in a written notice of such breach from board of directors of the Company.
133
Table of Contents
Index to Financial Statements
Under Mr. Cox’s, Mr. Erickson’s and Mr. Price’s employment agreements, “cause” generally means any of the named executive officer’s: (i) material breach by the named executive officer of any term of the employment agreement, or the Company’s policies, his fiduciary duties to the Company, Clearwater Analytics, LLC or any of their affiliates, or of any law, statute or regulation, (ii) misconduct which is injurious to the Company, Clearwater Analytics, LLC or any of their affiliates, either monetarily or otherwise, or which impairs his ability to effectively perform his duties or responsibilities, (iii) personal conduct which reflects poorly on the Company, Clearwater Analytics, LLC or named executive officer, or which impairs his ability to perform his duties or manage subordinate employees, including but not limited to the abuse of alcohol or controlled substances, sexual harassment and discrimination, (iv) habitual or repeated neglect of his duties or responsibilities, (v) his failure to comply with any valid and legal directive of the Company or the chief executive officer of the Company, (vi) appropriation of (or attempted appropriation of) a business opportunity of the Company, Clearwater Analytics, LLC or their affiliates, including attempting to secure or securing any personal profit in connection with any transaction by the Company or its affiliates, (vii) commission or conviction for (or the procedural equivalent or conviction for), or entering of a guilty plea or plea of no contest with respect to any felony or a crime, which in the Company’s reasonable judgment, involve moral turpitude, (viii) his willful unauthorized disclosure (or attempted disclosure) of confidential information, (ix) intentional injury of another employee or any person in the course of performing services for the Company or (x) any conflict of interest, including, but not limited to solicitation of business on behalf of a competitor or potential competitor or breach of any fiduciary duty to the Company, Clearwater Analytics, LLC or any of their affiliates. With respect to clauses (i) through (iii), if capable of cure, each name executive officer must be given a reasonable opportunity to comply with such policy or cure his failure or misconduct to the satisfaction of the Company within the reasonable time prescribed by the Company to cure such failure or misconduct as set forth in a written notice of such breach from the Company.
Under Mr. Sahai’s employment agreement, “good reason” generally means the occurrence of any of the following: (i) a reduction, without Mr. Sahai’s consent, of his base salary or target annual bonus opportunity, unless the reduction is generally applicable to substantially all senior executives of the Company, (ii) a relocation of Mr. Sahai’s principal place of employment by more than 50 miles, (iii) material breach of the employment agreement by the Company or (iv) a substantial diminution in Mr. Sahai’s authority or duties that is materially inconsistent with his position of chief executive officer without his consent.
Under Mr. Cox’s, Mr. Erickson’s and Mr. Price’s employment agreements, “good reason” generally means the occurrence of any of the following: (i) a material reduction, without the employee’s consent of his base salary or target annual bonus opportunity, unless the reduction is generally applicable to substantially all senior employees of the Company, (ii) a material breach of the employment agreement by the Company, or (iii) a substantial diminution in the employee’s authority or duties that is materially inconsistent with his position without his consent.
Each named executive officer is subject to non-competition, non-solicitation and non-hire covenants during employment and for 12 months thereafter, as well as perpetual confidentiality, assignment of inventions covenants and non-disparagement covenants.
TRA Bonus Agreements
As described in the section entitled “Certain Relationships and Related Party Transactions—Tax Receivable Agreement,” we intend to enter into a Tax Receivable Agreement with certain of the Continuing Equity Owners and the Blocker Shareholders substantially concurrently with or prior to the consummation of this offering. In addition, we intend to enter into TRA Bonus Agreements substantially concurrently with or prior to the consummation of this offering, pursuant to which certain executive officers, including our named executive officers, will, subject to the terms and conditions of his or her TRA Bonus Agreement, be eligible to receive a cash bonus payment (the “TRA Bonus”). The Tax Receivable Agreement provides for the payment by us to certain of the Continuing Equity Owners and the Blocker Shareholders, collectively, of 85% (less payments under the TRA Bonus Agreements) of the amount of tax benefits, if any, that we actually realize, or in some circumstances are deemed to realize, as a result of the Tax Attributes. We expect to benefit from the remaining 15% (taking into account amounts paid pursuant to the TRA Bonus Agreements) of the tax benefits, if any, that
134
Table of Contents
Index to Financial Statements
we may actually realize. Pursuant to the terms of the TRA Bonus Agreements, when the Continuing Equity Owners and the Blocker Shareholders are paid pursuant to the Tax Receivable Agreement (including in the event of a change of control (as defined in the TRA Bonus Agreements)), the TRA Bonus recipients, including our named executive officers, will be eligible to receive an amount up to 4.6% in the aggregate of the payments that would have been made to certain of the Continuing Equity Owners and Blocker Shareholders under the Tax Receivable Agreement but for the amounts payable under the TRA Bonus Agreements (the “TRA Bonus Pool”), subject to each TRA Bonus recipient’s continued employment through the applicable payment date. Assuming (i) no material changes in relevant tax law and that we earn sufficient taxable income to realize all tax benefits that are subject to the Tax Receivable Agreement and (ii) each TRA Bonus recipient, including our named executive officers, remains employed with us for a period of 15 years, we expect that the aggregate TRA Bonus payable to Messrs. Sahai, Cox, Erickson and Price over such period will be $14,612,573, $5,169,955, $3,378,611 and $2,857,080, respectively. Upon a termination of employment of the TRA Bonus recipients, including our named executive officers (i) by the Company without cause, (ii) by the TRA Bonus recipient for good reason or (iii) due to the TRA Bonus recipient’s death or disability (each as defined in the TRA Bonus Agreements) that occurs during the six month period prior to a change in control, the TRA Bonus recipient, including our named executive officers, will be eligible to receive his or her share of the TRA Bonus.
2017 Equity Incentive Plan
As noted above, our named executive offices received awards of options to purchase Class B Common Units of CWAN Holdings, LLC pursuant to the 2017 Equity Incentive Plan. In connection with the consummation of this offering, outstanding options to purchase Class B Common Units granted under the 2017 Equity Incentive Plan will be converted into options to purchase shares of our Class A common stock, and the 2017 Equity Incentive Plan will be cancelled and terminated, and these converted options will be governed under the terms of our 2021 Plan.
Share Reserve
A maximum number of 28,299,532 Class B Common Units are available for grant under the 2017 Equity Incentive Plan (the “Class B Unit Pool”). For purposes of the Class B Unit Pool, if an award expires or otherwise terminates without all of the Class B Common Units covered by the award having been issued, or is settled in cash, the expiration, termination or settlement will not reduce the number of Class B Common Units that may be available for issuance under the 2017 Equity Incentive Plan. If any Class B Common Units issued under the 2017 Equity Incentive Plan are forfeited back to or repurchased by CWAN Holdings, LLC, then the Class B Common Units will revert to and again become available for issuance under the 2017 Equity Incentive Plan. In addition, any Class B Common Units reacquired by CWAN Holdings, LLC in satisfaction of tax withholding obligations on an award or as consideration for the exercise or purchase price of an award will again become available for issuance under the 2017 Equity Incentive Plan.
Termination
The board of CWAN Holdings, LLC may amend, alter or discontinue the 2017 Equity Incentive Plan at any time; however, the board may not, without the participant’s consent, amend, alter or discontinue an award so as to affect adversely the participant’s economic rights.
Eligibility and Administration
Our employees, members of the board, or any person engaged by us to provide consulting or advisory services and is compensated for those services are eligible to receive grants of (i) an option to purchase Class B Common Units and (ii) profits interest units, which are intended to be treated as “profits interests” for U.S. federal income tax purposes. Subject to the provisions of the 2017 Equity Incentive Plan, the board has the authority and discretion to take any actions it deems necessary or advisable for the administration of the 2017 Equity Incentive Plan.
135
Table of Contents
Index to Financial Statements
Equity Incentive Compensation
Summary of the 2021 Omnibus Incentive Plan (“2021 Plan”)
Prior to the consummation of this offering, our board has adopted, and our shareholders will approve, the 2021 Plan, pursuant to which employees, consultants and directors of our company and our affiliates performing services for us, including our executive officers, will be eligible to receive awards. We anticipate that the 2021 Plan will provide for the grant of stock options, stock appreciation rights (“SARs”), restricted stock, restricted stock units, bonus stock, dividend equivalents, other stock-based awards, substitute awards, annual incentive awards and performance awards intended to align the interests of participants with those of our shareholders. The following description of the 2021 Plan is based on the form we anticipate will be adopted, but as the 2021 Plan has not yet been adopted, the provisions remain subject to change. As a result, the following description is qualified in its entirety by reference to the final 2021 Plan once adopted, a copy of which in substantially final form will be filed as an exhibit to the registration statement of which this prospectus is a part.
Share Reserve
In connection with its approval by the board and adoption by our shareholders, we will reserve 45,369,737 shares of our common stock for issuance under the 2021 Plan, which amount shall be increased on the first day of each fiscal year during the term of the 2021 Plan commencing with the 2022 fiscal year by 5% of the total number of shares of common stock outstanding on the last day of the immediately preceding fiscal year or a lesser amount determined by the board. In addition, the following shares of our common stock will again be available for grant or issuance under the 2021 Plan:
| • | shares subject to awards granted under the 2021 Plan that are subsequently forfeited or cancelled; |
| • | shares subject to awards granted under the 2021 Plan that otherwise terminate without shares being issued; and |
| • | shares surrendered, cancelled or exchanged for cash (but not shares surrendered to pay the exercise price or withholding taxes associated with the award). |
Administration
The 2021 Plan will be administered by our Compensation Committee. The Compensation Committee has the authority to construe and interpret the 2021 Plan, grant awards and make all other determinations necessary or advisable for the administration of the 2021 Plan. Awards under the 2021 Plan may be made subject to “performance conditions” and other terms.
Eligibility
Our employees, consultants and directors, and employees, consultants and directors of our affiliates, will be eligible to receive awards under the 2021 Plan. The Compensation Committee will determine who will receive awards, and the terms and conditions associated with the award.
Term
The 2021 Plan will terminate 10 years from the date our board approves the plan, unless it is terminated earlier by our board.
Award Forms and Limitations
The 2021 Plan authorizes the award of stock awards and performance awards. An aggregate of 45,369,737 shares will be available for issuance under awards granted pursuant to the 2021 Plan.
Stock Options
The 2021 Plan provides for the grant of ISOs only to our employees. Nonqualified options may be granted to our employees, directors and consultants. The exercise price of each option to purchase stock must be at least equal to the fair market value of our common stock on the date of grant. The exercise price of ISOs granted to
136
Table of Contents
Index to Financial Statements
10% or more shareholders must be at least equal to 110% of that value. Options granted under the 2021 Plan may be exercisable at such times and subject to such terms and conditions as the Compensation Committee determines. The maximum term of options granted under the 2021 Plan is 10 years (five years in the case of ISOs granted to 10% or more shareholders).
Stock Appreciation Rights
Stock appreciation rights provide for a payment, or payments, in cash or common stock, to the holder based upon the difference between the fair market value of our common stock on the date of exercise and the stated exercise price of the stock appreciation right. The exercise price must be at least equal to the fair market value of our common stock on the date the stock appreciation right is granted. Stock appreciation rights may vest based on time or achievement of performance conditions, as determined by the Compensation Committee in its discretion.
Restricted Stock
The Compensation Committee may grant awards consisting of shares of our common stock subject to restrictions on sale and transfer. The price (if any) paid by a participant for a restricted stock award will be determined by the Compensation Committee. Unless otherwise determined by the Compensation Committee at the time of award, vesting will cease on the date the participant no longer provides services to us and any unvested shares will be forfeited to or repurchased by us. The Compensation Committee may condition the grant or vesting of shares of restricted stock on the achievement of performance conditions and/or the satisfaction of a time-based vesting schedule.
Restricted Stock Unit Awards
Restricted stock unit awards give recipients the right to acquire a specified number of shares of our common stock (or cash amount) subject to restrictions on sale and transfer. A restricted stock unit award may be settled by cash or delivery of stock or property as deemed approved by the Compensation Committee. The price (if any) paid by a participant for a restricted stock unit award will be determined by the Compensation Committee. Unless otherwise determined by the Compensation Committee at the time of award, vesting will cease on the date the participant no longer provides services to us and any unvested restricted stock unit award will be forfeited. The Compensation Committee may condition the grant or vesting of shares of a restricted stock unit award on the achievement of performance conditions and/or the satisfaction of a time-based vesting schedule.
Performance Awards
A performance award is an award that becomes payable upon the attainment of specific performance goals. A performance award may become payable in cash or in shares of our common stock. These awards are subject to forfeiture prior to settlement due to termination of a participant’s employment or failure to achieve the performance conditions.
Other Cash-Based Awards
The Compensation Committee may grant other cash-based awards to participants in amounts and on terms and conditions determined by them in their discretion. Cash-based awards may be granted subject to vesting conditions or awarded without being subject to conditions or restrictions.
Additional Provisions
Awards granted under the 2021 Plan may not be transferred in any manner other than by will or by the laws of descent and distribution, or as determined by the Compensation Committee. Unless otherwise restricted by our Compensation Committee, awards that are non-ISOs or SARs may be exercised during the lifetime of the participant only by the participant, the participant’s guardian or legal representative or a family member of the
137
Table of Contents
Index to Financial Statements
participant who has acquired the non-ISOs or SARs by a permitted transfer. Awards that are ISOs may be exercised during the lifetime of the participant only by the participant or the participant’s guardian or legal representative.
In the event of a change of control (as defined in the 2021 Plan), the Compensation Committee may, in its discretion, provide for any or all of the following actions: (i) awards may be continued, assumed or substituted with new rights, (ii) awards may be purchased for cash equal to the excess (if any) of the price per share of common stock paid in the change in control transaction over the aggregate exercise price of the awards, (iii) outstanding and unexercised stock options and stock appreciation rights may be terminated prior to the change in control (in which case holders of such unvested awards would be given notice and the opportunity to exercise the awards), or (iv) vesting or lapse of restrictions may be accelerated. All awards will be equitably adjusted in the case of the division of stock and similar transactions.
Equity Awards Under the 2021 Plan
Following the consummation of this offering, we will grant each of our named executive officers an award of restricted stock units of Clearwater (“IPO RSUs”) under the 2021 Plan. We will grant Messrs. Sahai, Cox, Erickson, and Price 430,308, 152,209, 99,488, and 84,122 IPO RSUs, respectively, which will consist of 50% time-vesting IPO RSUs and 50% performance-vesting IPO RSUs. The time-vesting IPO RSUs will generally vest in 25% installments on each of the first four anniversaries of January 1, 2022, in each case, subject to continued employment through the applicable vesting date. The performance-vesting IPO RSUs will vest in 33.33% installments on each of the first three anniversaries of January 1, 2022, based on the achievement of our annual revenue growth rate during the applicable year and, in each case, subject to continued employment through the applicable vesting date. During each annual performance-vesting period, 0% of the performance-vesting IPO RSUs will vest if our annual revenue growth is less than 18%, 80% of the performance-vesting IPO RSUs will vest if our annual revenue growth is between 18% and 20%, 100% of the performance-vesting IPO RSUs will vest if our annual revenue growth is between 20% and 23%, and 110% of the performance-vesting IPO RSUs will vest if our annual revenue growth is between 23% and 26%. In addition, our named executive officers will be eligible to receive an annual grant of restricted stock units beginning with the 2022 fiscal year. We anticipate granting restricted stock units for the 2022 fiscal year to our named executive officers concurrently with the IPO RSUs. These restricted stock units will be subject to the same vesting terms as the IPO RSUs. For the 2022 fiscal year, in addition to the IPO RSUs, we will grant to Messrs. Sahai, Cox, Erickson, and Price 320,582, 273,154, 151,902, and 41,275 restricted stock units, respectively.
2021 Employee Stock Purchase Plan
In order to incentivize employees of the Company, its designated affiliates and subsidiaries (the “Designated Companies”), our board of directors has adopted, and our shareholders will approve, the ESPP, the material terms of which are summarized below, prior to the completion of this offering. This summary is not a complete description of all of the provisions of the ESPP and is qualified in its entirety by reference to the ESPP, a copy of which will be filed as an exhibit to the registration statement of which this prospectus forms a part.
The ESPP includes two components: a “Section 423 Component” and a “Non-Section 423 Component.” The Section 423 Component is intended to qualify as an “employee stock purchase plan” under Section 423 of the Code and will be administered, interpreted and construed in a manner consistent with the requirements of Section 423 of the Code. In addition, the ESPP will authorize the grant of options under the Non-Section 423 Component, which need not qualify as options granted pursuant to an “employee stock purchase plan” under Section 423 of the Code; such options granted under the Non-Section 423 Component will be granted pursuant to separate offerings containing such sub-plans, appendices, rules or procedures as may be adopted by the administrator of the ESPP and designed to achieve tax, securities laws or other objectives for eligible employees and the Designated Companies in locations outside of the United States. Except as otherwise provided or
138
Table of Contents
Index to Financial Statements
determined by the ESPP administrator, the Non-Section 423 Component will operate and be administered in the same manner as the Section 423 Component. Offerings intended to be made under the Non-Section 423 Component will be designated as such by the ESPP administrator at or prior to the time of such offering.
Shares Available for Awards; Administration
A total of 3,472,178 shares of our Class A common stock will initially be reserved for issuance under the ESPP. In addition, the number of shares available for issuance under the ESPP will be increased annually on January 1 of each calendar year beginning in 2022 and ending in and including 2031, by an amount equal to the lesser of (A) 1.0% of the shares outstanding on the final day of the immediately preceding calendar year and (B) such smaller number of shares as is determined by our Board. Our Board or a committee of our Board will administer and will have authority to interpret the terms of the ESPP and determine eligibility of participants. We expect that the compensation committee will be the initial administrator of the ESPP.
Eligibility
We expect that all of our employees and employees of any Designated Company will be eligible to participate in the ESPP, with certain exclusions as determined by the ESPP administrator. However, an employee may not be granted rights to purchase stock under our ESPP if the employee, immediately after the grant, would own (directly or through attribution) stock possessing 5% or more of the total combined voting power of all classes of our stock.
Grant of Rights
Under the ESPP, participants will be offered the option to purchase shares of our Class A common stock at a discount during one or more offering periods, which may be successive or overlapping and will be selected by the ESPP administrator in its sole discretion with respect to which options shall be granted to participants. No offering will commence prior to the date on which our registration statement on Form S-8 is filed with the SEC in respect of the ESPP. The ESPP administrator will designate the terms and conditions of each offering in writing, including the offering period and the purchase period, and may change the duration and timing of offering periods in its discretion. However, in no event may an offering period be longer than 27 months in length.
Option Price
The option purchase price will be 85% of the lesser of the fair market value of a share of our Class A common stock on (a) the applicable grant date and (b) the applicable exercise date, or such other price determined by the administrator.
ESPP Amendment and Termination
The Board may amend, suspend or terminate the ESPP at any time. However, stockholder approval will be obtained for any amendment that increases the aggregate number or changes the type of shares that may be sold pursuant to rights under the ESPP or changes the corporations or classes of corporations whose employees are eligible to participate in the ESPP.
139
Table of Contents
Index to Financial Statements
The following table sets forth certain information regarding the beneficial ownership of our Class A common stock and Class D common stock as of the date of effectiveness of this registration statement, after giving effect to the Transactions described under “Organizational Structure” with respect to:
| • | each person known by us to beneficially own 5% of any class of our outstanding shares; |
| • | each member of our board of directors upon the consummation of this offering and each named executive officer; and |
| • | the members of our board of directors upon the consummation of this offering and our executive officers as a group. |
The number of shares of our Class A common stock and Class D common stock beneficially owned and percentages of beneficial ownership prior to the Transactions set forth below are based on (i) the number of shares of Class A common stock, Class D common stock and LLC Interests (together with the corresponding shares of Class B common stock or Class C common stock, as the case may be) to be issued and outstanding after giving effect to the Transactions (other than this offering) and (ii) an assumed initial public offering price of $15.00 per share, which is the midpoint of the estimated price range set forth on the cover page of this prospectus. The number of shares of our Class A common stock and Class D common stock beneficially owned and percentages of beneficial ownership after the offering set forth below are based on (i) the number of shares of Class A common stock, Class D common stock and LLC Interests (together with the corresponding shares of Class B common stock or Class C common stock, as the case may be) to be issued and outstanding after giving effect to the Transactions, including the use of the net proceeds from our sale of Class A common stock to purchase LLC Interests from the Other Continuing Equity Owners, and (ii) an assumed initial public offering price of $15.00 per share, which is the midpoint of the estimated price range set forth on the cover page of this prospectus. The table below does not reflect any shares of our Class A common stock that may be purchased in this offering by directors, executive officers or beneficial holders of more than 5% of our outstanding common stock, through the Reserved Share Program described in “Underwriting” or the shares of our Class A common stock that may be purchased in the offering by certain of our existing investors and their affiliated entities, including one or more funds and/or accounts affiliated with Calculated DF Holdings, L.P., Durable Capital Master Fund LP and DCP CA Blocker LLC through the indications of interest described in “The Offering—Indications of Interest.”
We have determined beneficial ownership in accordance with the rules of the SEC. Except as indicated by the footnotes below, we believe, based on the information furnished to us, that each person or entity named in the table below has sole voting and investment power with respect to all shares of common stock that he, she or it beneficially owns, subject to applicable community property laws.
140
Table of Contents
Index to Financial Statements
Except as otherwise noted below, the address of each beneficial owner listed in the table below is c/o Clearwater Analytics Holdings, Inc., 777 W. Main Street, Suite 900, Boise, Idaho 83702.
| Class A Common Stock Beneficially Owned(1)(2) |
Class D Common Stock Beneficially Owned(1)(3) |
Combined Voting Power(4) | ||||||||||||||||||||||||||||||||||||||||||||||||||||||
| Prior to the Transactions |
After the Transactions, Assuming No Exercise of the Underwriters’ Option |
After the Transactions, Assuming Full Exercise of the Underwriters’ Option |
Prior to the Transactions |
After the Transactions, Assuming No Exercise of the Underwriters’ Option |
After the Transactions, Including Full Option Exercise |
After the Transactions, Assuming No Exercise of the Underwriters’ Option |
After the Transactions, Assuming Full Exercise of the Underwriters’ Option |
|||||||||||||||||||||||||||||||||||||||||||||||||
| Name of Beneficial Owner | Shares | % | Shares | % | Shares | % | Shares | % | Shares | % | Shares | % | % | % | ||||||||||||||||||||||||||||||||||||||||||
| 5% Stockholders: |
||||||||||||||||||||||||||||||||||||||||||||||||||||||||
| Entities affiliated with Welsh Carson(5) |
— | — | — | — | — | — | 111,015,690 | 62.6 | % | 111,015,690 | 62.6 | % | 111,015,690 | 62.6 | % | 60.7 | % | 60.6 | % | |||||||||||||||||||||||||||||||||||||
| Entities affiliated with Permira(6) |
— | — | — | — | — | — | 33,222,826 | 18.7 | % | 33,222,826 | 18.7 | % | 33,222,826 | 18.7 | % | 18.2 | % | 18.1 | % | |||||||||||||||||||||||||||||||||||||
| Entities affiliated with Warburg Pincus(7) |
— | — | — | — | — | — | 33,222,826 | 18.7 | % | 33,222,826 | 18.7 | % | 33,222,826 | 18.7 | % | 18.2 | % | 18.1 | % | |||||||||||||||||||||||||||||||||||||
| Entities affiliated with Dragoneer(8) |
8,828,717 | 68.6 | % | 8,828,717 | 20.6 | % | 8,828,717 | 18.6 | % | — | — | — | — | — | — | * | * | |||||||||||||||||||||||||||||||||||||||
| Entities affiliated with Durable(9) |
4,037,371 | 31.4 | % | 4,037,371 | 9.4 | % | 4,037,371 | 8.5 | % | — | — | — | — | — | — | * | * | |||||||||||||||||||||||||||||||||||||||
| Named Executive Officers and Directors: |
||||||||||||||||||||||||||||||||||||||||||||||||||||||||
| Sandeep Sahai |
— | — | — | — | — | — | — | — | — | — | — | — | — | — | ||||||||||||||||||||||||||||||||||||||||||
| Jim Cox |
— | — | — | — | — | — | — | — | — | — | — | — | — | — | ||||||||||||||||||||||||||||||||||||||||||
| Scott Erickson |
— | — | — | — | — | — | — | — | — | — | — | — | — | — | ||||||||||||||||||||||||||||||||||||||||||
| James Price |
— | — | — | — | — | — | — | — | — | — | — | — | — | — | ||||||||||||||||||||||||||||||||||||||||||
| Eric Lee(5) |
— | — | — | — | — | — | — | — | — | — | — | — | — | — | ||||||||||||||||||||||||||||||||||||||||||
| Jacques Aigrain |
25,000 | * | 25,000 | * | 25,000 | * | — | — | — | — | — | — | * | * | ||||||||||||||||||||||||||||||||||||||||||
| Kathleen A. Corbet |
20,161 | * | 20,161 | * | 20,161 | * | — | — | — | — | — | — | * | * | ||||||||||||||||||||||||||||||||||||||||||
| Cary Davis(7) |
— | — | — | — | — | — | — | — | — | — | — | — | — | — | ||||||||||||||||||||||||||||||||||||||||||
| Anthony J. deNicola(5) |
— | — | — | — | — | — | — | — | — | — | — | — | — | — | ||||||||||||||||||||||||||||||||||||||||||
| Christopher Hooper(5) |
— | — | — | — | — | — | — | — | — | — | — | — | — | — | ||||||||||||||||||||||||||||||||||||||||||
| Marcus Ryu |
80,645 | * | 80,645 | * | 80,645 | * | — | — | — | — | — | — | * | * | ||||||||||||||||||||||||||||||||||||||||||
| Andrew Young(6) |
— | — | — | — | — | — | — | — | — | — | — | — | — | — | ||||||||||||||||||||||||||||||||||||||||||
| All executive officers as a group (individuals) |
— | — | — | — | — | — | — | — | — | — | — | — | — | — | ||||||||||||||||||||||||||||||||||||||||||
| * | Represents less than 1.0% of outstanding shares or voting power, as applicable. |
| (1) | Each holder of Class C common stock and Class D common stock is entitled to ten votes per share and each holder of Class A common stock and Class B common stock is entitled to one vote per share on all matters submitted to our stockholders for a vote. Our Class B common stock and Class C common stock do not have any of the economic rights (including rights to dividends and distributions upon liquidation) associated with our Class A common stock and Class D common stock. |
141
Table of Contents
Index to Financial Statements
| (2) | The numbers of shares of Class A common stock beneficially owned and percentages of beneficial ownership set forth in the table assume that all LLC Interests (together with the corresponding shares of Class B common stock) held by such Other Continuing Equity Owners have been exchanged for shares of Class A common stock. |
| (3) | The numbers of shares of Class D common stock beneficially owned and percentages of beneficial ownership set forth in the table assume that all LLC Interests (together with the corresponding shares of Class C common stock) held by all Principal Equity Owners have been exchanged for shares of Class D common stock. |
| (4) | Percentage of voting power represents voting power with respect to all shares of our Class A common stock, Class B common stock, Class C common stock and Class D common stock voting together as a single class (subject to class-specific weightings) and as calculated on a fully diluted basis. See “Description of Capital Stock.” |
| (5) | Includes 43,799,730 shares of Class D common stock and 21,189,927 shares of Class C common stock held by WCAS XII Carbon Analytics Acquisition, L.P., 19,838,373 shares of Class D common stock and 24,572,711 shares of Class C common stock held by WCAS XIII Carbon Analytics Acquisition, L.P. and 1,614,949 shares of Class C common stock held by WCAS GP CW LLC, which are collectively referred to herein as Welsh Carson. Mr. Lee and Mr. Hooper each serve as General Partners at Welsh Carson and Mr. DeNicola is the Chairman and a General Partner of Welsh Carson. The general partner of WCAS XII Carbon Analytics Acquisition, L.P. is WCAS XII Associates LLC (“WCAS XII Associates”). The general partner of WCAS XIII Carbon Analytics Acquisition, L.P. and the manager of WCAS GP CW LLC is WCAS XIII Associates LLC (“WCAS XIII Associates”). The managing members of WCAS XII Associates and WCAS XIII Associates are Thomas A. Scully, Sean Traynor, Anthony J. deNicola, D. Scott Mackesy, Brian Regan, Michael Donovan, Eric Lee, Christopher Hooper, Christopher Solomon, Edward Sobol, Gregory Lau, Frances Higgins, Nicholas O’Leary, Jonathan Rather and Ryan Harper. Each of the above listed persons may be deemed to beneficially own the securities owned of record by Welsh Carson. However, each of the above listed persons expressly disclaims ownership of the securities reported by Welsh Carson and its affiliates, except to the extent of their pecuniary interest therein. The address of the foregoing persons is c/o Welsh, Carson, Anderson & Stowe, 599 Lexington Avenue, 18th Floor, New York, New York 10022. |
| (6) | Includes 33,222,826 shares of Class D common stock held by Galibier Purchaser, LLC. Galibier Holdings, LP is the sole member of Galibier Purchaser, LLC. Galibier Holdings, LP acts through its general partner, Galibier Holdings GP, LLC, which acts through its sole member, Gali SCSp, which acts through its general partner, Permira VII GP S.à r.l., whose board of directors consists of Peter Gibbs, Séverine Michel and Cédric Pedoni. Each of Peter Gibbs, Séverine Michel and Cédric Pedoni are directors of Permira VII GP S.à r.l., and as such, may participate in decisions regarding Permira VII GP S.à r.l.’s exercise of voting and investment power in respect of the shares of our Class D common stock held of record by Galibier Purchaser, LLC, but each disclaims beneficial ownership of such shares. Mr. Young is affiliated with Permira and its affiliates, including Galibier Purchaser, LLC, but disclaims ownership of the securities reported by Permira and its affiliates. The address of each the foregoing persons is c/o Permira Advisers LLC, 3000 Sand Hill Road, Building 1, Suite 170, Menlo Park, California 94025. |
| (7) | Includes 33,222,826 shares of Class D common stock held by WP CA Holdco, L.P. (“WP Holdco”). The general partner of WP Holdco is WP CA Holdco GP, LLC (“WP Holdco GP”). The managing members of WP Holdco GP are Warburg Pincus (Callisto) Global Growth (Cayman), L.P. (“WP Callisto”) and Warburg Pincus Financial Sector (Cayman), L.P. (“WP FS”, and together with WP Callisto, the “Holdco GP Managers”). Warburg Pincus LLC (“WP LLC”) is the manager of the Holdco GP Managers. Warburg Pincus (Cayman) Global Growth GP, L.P., (“WP GG Cayman GP”), is the general partner of WP Callisto. Warburg Pincus (Cayman) Financial Sector GP, L.P., (“WP FS Cayman GP”), is the general partner of WP FS. Warburg Pincus (Cayman) Global Growth GP LLC, (“WP GG Cayman GP LLC”), is the general partner of WP GG Cayman GP. Warburg Pincus (Cayman) Financial Sector GP LLC, (“WP FS Cayman GP LLC”), is the general partner of WP FS Cayman GP. Warburg Pincus Partners II (Cayman), L.P., (“WPP II Cayman”), is the managing member of each of WP GG Cayman GP LLC and WP FS Cayman GP LLC. Warburg Pincus (Bermuda) Private Equity GP Ltd., is the general partner of WPP II Cayman. The members of such committee, all of whom expressly disclaim |
142
Table of Contents
Index to Financial Statements
| beneficial ownership of the shares, are Mark M. Colodny, Timothy F. Geithner, Steven G. Glenn, Charles R. Kaye, Vishal Mahadevia, Michael Martin, James Neary, and Daniel Zilberman. All indirect holders of the above referenced shares, as well as Mr. Davis, who is affiliated with WP LLC, disclaim beneficial ownership of all applicable shares except to the extent of their pecuniary interest therein. The address of the foregoing persons is c/o Warburg Pincus LLC, 450 Lexington Avenue, New York, New York 10017. Additionally, all shares of Class D common stock held by WP Holdco are pledged to secure obligations of affiliates of Warburg Pincus under a loan agreement with Wells Fargo Bank, National Association (“Wells Fargo”). In the case of an event of default, Wells Fargo or any transferee (in the event that Wells Fargo had assigned or otherwise transferred its rights under the pledge to a non-affiliate) may exercise its rights under the applicable loan agreement to foreclose on and sell shares pledged to cover the amount due under the loan, provided that no sales of the pledged shares may be made to third parties until 180 days after the date of this prospectus. |
| (8) | Includes 8,828,717 shares of Class A common stock held by Calculated DF Holdings, LP, whose ultimate general partner is controlled by Marc Stad. Mr. Stad may be deemed to share voting and dispositive power with respect to the securities held by such entity. The business address for Calculated DF Holdings, LP and Mr. Stad is c/o Dragoneer Investment Group, LLC, One Letterman Drive, Building D, Suite M500, San Francisco, California 94129. |
| (9) | Includes 2,207,179 shares of Class A common stock held by Durable Capital Master Fund LP (“Durable Master Fund”) and 1,830,192 shares of Class A common stock held by DCP CA Blocker LLC (“Durable CA Blocker”). Durable Capital Partners LP (“Durable Capital Partners”) is the investment adviser to Durable Master Fund, which is the sole member of DCP CA Blocker. Durable Capital Partners GP LLC (“Durable GP”) is the general partner of Durable Capital Partners, and Henry Ellenbogen is the chief investment officer of Durable Capital Partners and the managing member of Durable GP. The principal business address of Durable Master Fund is c/o Durable Capital Partners, 5425 Wisconsin Avenue, Suite 802, Chevy Chase, MD 20815. |
143
Table of Contents
Index to Financial Statements
CERTAIN RELATIONSHIPS AND RELATED PARTY TRANSACTIONS
The following is a summary of transactions to which we are a party in which the amount involved exceeded or exceeds $120,000 and in which any of our directors, executive officers, holders of more than 5% of any class of our voting securities or any member of the immediate family of any of the foregoing persons had or will have a direct or indirect material interest, other than compensation arrangements with directors and executive officers, which are described under “Executive Compensation.”
Services Agreements with Entities Affiliated with the Principal Equity Owners
We receive professional, consulting and advisory services from WCAS XIII Carbon Analytics Acquisition, L.P. and WCAS Management Corporation, each of which are affiliates of Welsh Carson, and from Warburg Pincus LLC, and from Permira. In the years ended December 31, 2020 and 2019, CWAN Holdings, LLC recognized management fees to such affiliates of Welsh Carson, Warburg Pincus LLC, and Permira of approximately $1.6 million and $1.9 million, respectively. During the six months ended June 30, 2021 and 2020, CWAN Holdings, LLC recognized management fees to such affiliates of Welsh Carson, Warburg Pincus LLC, and Permira of approximately $1.2 million and $0.7 million, respectively. During January 2021, CWAN Holdings, LLC made payments in relation to management fees of $6 million to Welsh Carson and $1.8 million to each of Warburg Pincus and Permira. These prepaid management fees relate to the four year period subsequent to the completion of the recapitalization transaction in November 2020 and are being amortized and recognized as expense over four years. The services agreements pursuant to which such fees have been paid will terminate in accordance with their terms upon consummation of this offering, and no such services will be provided afterward.
LLC Agreement
In connection with the Transactions, Clearwater Analytics Holdings, Inc. and the Continuing Equity Owners entered into the LLC Agreement.
As a result of the Transactions, including the entry into the LLC Agreement, we hold LLC Interests in CWAN Holdings, LLC and are the sole managing member of CWAN Holdings, LLC. Accordingly, we operate and control all of the business and affairs of CWAN Holdings, LLC and, through CWAN Holdings, LLC and its direct and indirect subsidiaries, conduct our business.
As the sole managing member of CWAN Holdings, LLC, Clearwater Analytics Holdings, Inc. has the right to determine when distributions will be made to the holders of LLC Interests and the amount of any such distributions (subject to the requirements with respect to the tax distributions described below). If Clearwater Analytics Holdings, Inc. authorizes a distribution, such distribution will be made to the holders of LLC Interests, including Clearwater Analytics Holdings, Inc., pro rata in accordance with their respective ownership of CWAN Holdings, LLC.
Upon the consummation of the Transactions, Clearwater Analytics Holdings, Inc. will become a holding company and its principal asset will be a controlling equity interest in CWAN Holdings, LLC. As such, Clearwater Analytics Holdings, Inc. will have no independent means of generating revenue. CWAN Holdings, LLC will be treated as a partnership for U.S. federal income tax purposes and, as such, will generally not be subject to U.S. federal income tax. Instead, taxable income will be allocated to holders of LLC Interests, including Clearwater Analytics Holdings, Inc. Accordingly, Clearwater Analytics Holdings, Inc. will incur income taxes on its allocable share of any net taxable income of CWAN Holdings, LLC and also may incur expenses related to its operations. The LLC Agreement will require “tax distributions,” as that term is defined in the LLC Agreement, to be made by CWAN Holdings, LLC to its “members,” as that term is defined in the LLC Agreement, unless certain exceptions apply. Tax distributions generally will be made quarterly to each member of CWAN Holdings, LLC including us, on a pro rata basis among the holders of LLC Interests based on CWAN Holdings, LLC’s net taxable income and without regard to any applicable basis adjustment under Section 743(b) of the Code, which means that the amount of tax distributions will be determined based on the holder of LLC Interests who is allocated the largest amount of taxable income on a per LLC Interest basis and at a tax rate that
144
Table of Contents
Index to Financial Statements
will be determined by us, but will be made pro rata based on ownership of LLC Interests. Thus, CWAN Holdings, LLC will be required to make tax distributions that, in the aggregate, will likely exceed the amount of taxes that it would have paid if it were taxed on its net income at the tax rate applicable to a similarly situated corporate taxpayer. The tax rate used to determine tax distributions will apply regardless of the actual final tax liability of any such member. Tax distributions will also be made only to the extent all distributions from CWAN Holdings, LLC for the relevant period were otherwise insufficient to enable each member to cover its tax liabilities as calculated in the manner described above. Clearwater Analytics Holdings, Inc. intends to cause CWAN Holdings, LLC to make distributions or, in the case of certain expenses, payments in an amount sufficient to allow Clearwater Analytics Holdings, Inc. to pay its taxes and operating expenses, including distributions to fund any ordinary course payments due under the Tax Receivable Agreement.
The LLC Agreement generally does not permit transfers of LLC Interests by Continuing Equity Owners, except for transfers to Permitted Transferees, transfers pursuant to the redemption right described below and transfers approved in writing by us, as sole managing manager, and other limited exceptions. Permitted Transferees include (a) with respect to any Principal Equity Owner, any of such Principal Equity Owner’s affiliates and (b) with respect to any Other Continuing Equity Owners, any such Other Continuing Equity Owner’s affiliates or, in the case of individuals, members of their immediate family. In the event of a permitted transfer, such Continuing Equity Owner will be required to simultaneously transfer shares of Class B common stock or Class C common stock (as the case may be) to such transferee equal to the number of LLC Interests that were transferred. The LLC Agreement also provides that, as a general matter, a Continuing Equity Owner will not have the right to transfer LLC Interests if Clearwater Analytics Holdings, Inc. determines that such transfer would be prohibited by law or regulation, would violate other agreements with Clearwater Analytics Holdings, Inc. to which such Principal Equity Owner or Continuing Equity Owner, as applicable, may be subject or would cause or increase the possibility for CWAN Holdings, LLC to be treated as a “publicly traded partnership” taxable as a corporation for U.S. federal income tax purposes, as further described in the LLC Agreement.
The LLC Agreement will allow holders of LLC Interests to exchange their LLC interests for shares of Class A common stock or, if applicable, shares of Class D common stock, on a one-for-one basis or, at our election, for an amount of cash equal to the fair market value of such shares, as calculated in accordance with the LLC Agreement though we may settle any such exchange in cash only to the extent that we have cash available at least equal to the cash price that was received pursuant to a contemporaneous public offering or private sale.
The Continuing Equity Owners may from time to time (subject to the terms of the LLC Agreement) exercise a right to require redemption of LLC Interests in exchange for cash or, at our election, shares of our Class A or Class D common stock (as the case may be) on a one-for-one basis. We may alternatively acquire such LLC Interests for cash in connection with any exercise of such right. We intend to treat such acquisitions of LLC Interests as direct purchases of LLC Interests from the Continuing Equity Owners for U.S. federal income and other applicable tax purposes. CWAN Holdings, LLC (and each of its subsidiaries classified as a partnership for U.S. federal income tax purposes) intends to have in place an election under Section 754 of the Code effective for each taxable year in which an exchange of LLC Interests for Class A common stock or Class D common stock (as the case may be) or cash occurs. As a result, an exchange of LLC Interests is expected to result in (1) an increase in our proportionate share of the existing tax basis of the assets of CWAN Holdings, LLC and its flow-through subsidiaries and (2) an adjustment in the tax basis of the assets of CWAN Holdings, LLC and its flow-through subsidiaries reflected in that proportionate share (“Basis Adjustments”).
Any increases in our share of the tax basis of the assets of CWAN Holdings, LLC and its flow-through subsidiaries as a result of the purchase of LLC Interests or LLC Interest exchanges will generally have the effect of reducing the amounts that we would otherwise be obligated to pay thereafter to various tax authorities. Such basis increases may also decrease gains (or increase losses) on future dispositions of certain assets to the extent tax basis is allocated to those assets.
Each Continuing Equity Owner’s exchange and redemption rights are subject to certain customary limitations, including the expiration of any contractual lock-up period relating to the shares of our Class A
145
Table of Contents
Index to Financial Statements
common stock and Class D common stock (as the case may be) that may be applicable to such Continuing Equity Owner (including a lock-up period of not more than 180 days in connection with any registration of our equity securities) and the absence of any liens or encumbrances on such LLC Interests redeemed. In addition, Continuing Equity Owners cannot exercise exchange or redemption rights during applicable blackout periods. We may impose additional restrictions on exchanges or redemptions that we determine to be necessary or advisable so that CWAN Holdings, LLC does not risk being treated as a “publicly traded partnership” for U.S. federal income tax purposes.
As a holder exchanges LLC Interests and Class B common stock or Class C common stock for shares of Class A common stock or Class D common stock, respectively, or a redemption transaction is effected, the number of LLC Interests held by Clearwater Analytics Holdings, Inc. is correspondingly increased as it acquires the exchanged LLC Interests or funds the redemption transaction, and a corresponding number of shares of Class B common stock or Class C common stock are cancelled.
The LLC Agreement also requires that CWAN Holdings, LLC take actions with respect to its LLC Interests, including issuances, reclassifications, distributions, divisions, or recapitalizations, such that (i) we at all times maintain a ratio of one LLC Interest owned by us, directly or indirectly, for each share of Class A common stock or Class D common stock issued by us, and (ii) CWAN Holdings, LLC at all times maintains (a) a one-to-one ratio between the number of shares of Class A common stock or Class D common stock issued by us and the number of LLC Interests owned by us and (b) a one-to-one ratio between the number of shares of Class B common stock and/or Class C common stock owned by the Continuing Equity Owners and the number of LLC Interests owned by the Continuing Equity Owners. As such, in certain circumstances we, as sole managing member, have the authority to take all actions such that, after giving effect to all issuances, transfers, deliveries, or repurchases, the number of outstanding LLC Interests we own equals, on a one-to-one basis, the number of outstanding shares of Class A common stock and Class D common stock.
This summary does not purport to be complete and is qualified in its entirety by the provisions of our form of LLC Agreement, a copy of which has been filed as an exhibit to the registration statement of which this prospectus forms a part.
Tax Receivable Agreement
We intend to enter into a Tax Receivable Agreement with the Continuing Equity Owners and the Blocker Shareholders. The Tax Receivable Agreement provides for the payment by us to the Continuing Equity Owners and the Blocker Shareholders, collectively, of 85% (less amounts paid pursuant to the TRA Bonus Agreements) of the amount of tax benefits, if any, that we actually realize, or in some circumstances are deemed to realize, as a result of the Tax Attributes. The payment obligations under the Tax Receivable Agreement are not conditioned upon any Continuing Equity Owner or Blocker Shareholder maintaining a continued ownership interest in us or CWAN Holdings, LLC and the rights of the Continuing Equity Owners and the Blocker Shareholders under the Tax Receivable Agreement are assignable. We expect to benefit from the remaining 15% (taking into account amounts paid pursuant to the TRA Bonus Agreements) of the tax benefits, if any, that we may actually realize. For a description of the terms of the TRA Bonus Agreements, see “Executive Compensation—TRA Bonus Agreements.”
For purposes of the Tax Receivable Agreement, the tax benefit deemed realized by us will generally be computed by comparing our actual cash income tax liability to the amount of such taxes that we would have been required to pay had there been no Tax Attributes; provided that, for purposes of determining the tax benefit with respect to state and local income taxes, we will use simplifying assumptions. The Tax Receivable Agreement will generally apply to each of our taxable years, beginning with the taxable year that the Tax Receivable Agreement is entered into. There is no maximum term for the Tax Receivable Agreement and the Tax Receivable Agreement will continue until all such tax benefits have been utilized or expired unless we exercise our right to terminate the Tax Receivable Agreement for an agreed-upon amount equal to the estimated present value of the remaining
146
Table of Contents
Index to Financial Statements
payments to be made under the agreement (calculated with certain assumptions, including as to utilization of the Tax Attributes).
The actual Tax Attributes, as well as any amounts paid to the Continuing Equity Owners and the Blocker Shareholders under the Tax Receivable Agreement, will vary depending on a number of factors, including:
| • | the timing of any future exchanges—for instance, the increase in any tax deductions will vary depending on the fair value, which may fluctuate over time, of the depreciable or amortizable assets of CWAN Holdings, LLC and its flow-through subsidiaries at the time of each exchange; |
| • | the price of shares of our Class A common stock at the time of any future exchanges—the Basis Adjustments (as defined therein) are directly related to the price of shares of our Class A common stock at the time of future exchanges; |
| • | the extent to which such exchanges are taxable—if an exchange is not taxable for any reason, increased tax deductions as a result of the Section 754 election mentioned above will not be available to generate payments under the Tax Receivable Agreement; |
| • | the amount, timing and deductibility of payments under TRA Bonus Agreements—under current law, payments under the TRA Bonus Agreements generally would be expected to give rise to compensatory tax deductions unless certain statutory limitations apply. Because these deductions constitute Tax Attributes, the amounts, timing and deductibility of such payments is not known; |
| • | the amount and timing of our income—the Tax Receivable Agreement generally will require us to pay 85% of the tax benefits from the Tax Attributes as and when those benefits are treated as realized by us under the terms of the Tax Receivable Agreement. If we do not have taxable income in a particular taxable year, we generally will not be required (absent a change of control or other circumstances requiring an early termination payment) to make payments under the Tax Receivable Agreement for that taxable year because no tax benefits will have been actually realized. Nevertheless, any tax benefits with respect to the Tax Attributes that do not result in realized tax benefits in a given taxable year will likely generate tax attributes that may be utilized to generate tax benefits in future (and possibly previous) taxable years. The utilization of any such tax attributes will result in payments under the Tax Receivable Agreement; and |
| • | applicable tax rates—the tax rates in effect at the time a tax benefit is recognized. |
The payment obligations under the Tax Receivable Agreement and the TRA Bonus Agreements are obligations of Clearwater Analytics Holdings, Inc. and not of CWAN Holdings, LLC. Any payments made by us under the Tax Receivable Agreement or the TRA Bonus Agreements will generally reduce the amount of overall cash flow that might have otherwise been available to us or to CWAN Holdings, LLC, and to the extent that we are unable to make payments under the Tax Receivable Agreement or the TRA Bonus Agreements for any reason, the unpaid amounts will be deferred and will accrue interest until paid by us. We anticipate funding ordinary course payments under the Tax Receivable Agreement and the TRA Bonus Agreements from cash flow from operations of CWAN Holdings, LLC and its subsidiaries, borrowings under our credit facilities and/or available cash.
We expect that the aggregate payments that we may make under the Tax Receivable Agreement will be substantial. Assuming no material changes in the relevant tax law, and that we earn sufficient taxable income to realize all tax benefits that are subject to the Tax Receivable Agreement, we expect that future payments under the Tax Receivable Agreement relating to the purchase by Clearwater Analytics Holdings, Inc. of LLC Interests from CWAN Holdings, LLC and the acquisition of the Blocker Entities from the Blocker Shareholders in connection with this offering to range over the next 15 years from approximately $9 million to $75.5 million and decline thereafter. These estimates are based on an initial public offering price of $15.00 per share of Class A common stock, which is the midpoint of the estimated price range set forth on the cover page of this prospectus. Future payments in respect of subsequent exchanges or financing would be in addition to these amounts and are expected to be substantial. The foregoing numbers are merely estimates—the actual payments could differ
147
Table of Contents
Index to Financial Statements
materially. It is possible that future transactions or events could increase or decrease the actual tax benefits realized and the corresponding Tax Receivable Agreement and TRA Bonus Agreement payments. There may be a material negative effect on our liquidity if, as a result of timing discrepancies or otherwise, the payments under the Tax Receivable Agreement or the TRA Bonus Agreements exceed the actual benefits we realize in respect of the Tax Attributes subject to the Tax Receivable Agreement or the TRA Bonus Agreements and/or distributions to Clearwater Analytics Holdings, Inc. by CWAN Holdings, LLC are not sufficient to permit Clearwater Analytics Holdings, Inc. to make payments under the Tax Receivable Agreement or the TRA Bonus Agreements after it has paid taxes.
The Tax Receivable Agreement provides that if (1) certain mergers, asset sales, other forms of business combination, or other changes of control were to occur; (2) we materially breach any of our material obligations under the Tax Receivable Agreement; or (3) at any time, we elect an early termination of the Tax Receivable Agreement, then the Tax Receivable Agreement will terminate, and our obligations, or our successor’s obligations, to make payments under the Tax Receivable Agreement and the TRA Bonus Agreements will accelerate and become due and payable, based on certain assumptions, including an assumption that we would have sufficient taxable income to fully utilize all potential future tax benefits that are subject to the Tax Receivable Agreement and, to the extent applicable, that any LLC Interests that have not been exchanged are deemed exchanged for the fair market value of our Class A common stock at the time of termination.
As a result of a change in control, material breach or our election to terminate the Tax Receivable Agreement early, (1) we could be required to make cash payments to the Continuing Equity Owners, the Blocker Shareholders and certain executive officers that are greater than the specified percentage of the actual benefits we ultimately realize in respect of the tax benefits that are subject to the Tax Receivable Agreement and the TRA Bonus Agreements and (2) we would be required to make an immediate cash payment equal to the anticipated future tax benefits that are the subject of the Tax Receivable Agreement discounted in accordance with the Tax Receivable Agreement, which payment may be made significantly in advance of the actual realization, if any, of such future tax benefits. In these situations, our obligations under the Tax Receivable Agreement and the TRA Bonus Agreements could have a substantial negative impact on our liquidity and could have the effect of delaying, deferring or preventing certain mergers, asset sales, other forms of business combination, or other changes of control. We may not be able to finance our obligations under the Tax Receivable Agreement and the TRA Bonus Agreements.
Payments under the Tax Receivable Agreement and the TRA Bonus Agreements will be based on the tax reporting positions that we determine. Although we are not aware of any issue that would cause the IRS to challenge a tax basis increase or the use of the Tax Attributes, we will not be reimbursed for any cash payments previously made to certain of our Continuing Equity Owners and Blocker Shareholders pursuant to the Tax Receivable Agreement if any tax benefits initially claimed by us are subsequently disallowed, in whole or in part, by the IRS or other applicable taxing authority. For example, if the IRS later asserts that we did not obtain a tax basis increase, among other potential challenges, then we would not be reimbursed for any cash payments previously made to certain of our Continuing Equity Owners and Blocker Shareholders pursuant to the Tax Receivable Agreement with respect to such tax benefits that we had initially claimed. Instead, any excess cash payments made by us pursuant to the Tax Receivable Agreement will be netted against any future cash payments that we might otherwise be required to make under the terms of the Tax Receivable Agreement. Nevertheless, any tax benefits initially claimed by us with respect to the Tax Attributes may not be disallowed for a number of years following the initial time of such payment or, even if challenged early, such excess cash payment may be greater than the amount of future cash payments that we might otherwise be required to make under the terms of the Tax Receivable Agreement. Accordingly, there may not be sufficient future cash payments against which to net. The applicable U.S. federal income tax rules are complex, and the IRS or a court may disagree with our tax reporting positions. As a result, it is possible that we could make cash payments under the Tax Receivable Agreement with respect to the Tax Attributes that are substantially greater than our actual cash tax savings therefrom.
Under the Tax Receivable Agreement, we are required to provide to certain Continuing Equity Owners a schedule setting forth the calculation of payments that are due under the Tax Receivable Agreement and the TRA
148
Table of Contents
Index to Financial Statements
Bonus Agreements with respect to each taxable year in which a payment obligation arises within 120 days after filing our U.S. federal income tax return for such taxable year. This calculation will be based upon the advice of our tax advisors. Payments under the Tax Receivable Agreement will generally be made within five business days after this schedule becomes final pursuant to the procedures set forth in the Tax Receivable Agreement, although interest on such payments will begin to accrue at a rate of the lesser of (i) LIBOR plus 100 basis points and (ii) 6.5% (the “Agreed Rate”) from the due date (without extensions) of such tax return. Any late payments that may be made under the Tax Receivable Agreement will continue to accrue interest at the Agreed Rate until such payments are made, generally including any late payments that we may subsequently make because we did not have enough available cash to satisfy our payment obligations at the time at which they originally arose.
This summary does not purport to be complete and is qualified in its entirety by the provisions of our form of Tax Receivable Agreement, a copy of which has been filed as an exhibit to the registration statement of which this prospectus forms a part.
Registration Rights Agreement
In connection with this offering, we intend to enter into a second amended and restated registration rights agreement, or the “Registration Rights Agreement,” with certain of the Continuing Equity Owners, including certain members of our management. Subject to certain conditions, the Registration Rights Agreement will provide certain of the Continuing Equity Owners with “long-form” demand registrations and “short-form” demand registration rights, as well as shelf registration rights. The Registration Rights Agreement will also provide certain of the Continuing Equity Owners with customary “piggyback” registration rights. The Registration Rights Agreement will contain provisions that require the parties thereto to coordinate with one another with respect to sales of our common stock and will contain certain limitations on the ability of certain of the Continuing Equity Owners and certain members of our management party to the Registration Rights Agreement to offer, sell or otherwise dispose of shares of our common stock. The Registration Rights Agreement will also provide that we will pay certain expenses of these holders relating to such registrations and indemnify them against certain liabilities which may arise under the Securities Act. This summary does not purport to be complete and is qualified in its entirety by the provisions of our form of Registration Rights Agreement, a copy of which has been filed as an exhibit to the registration statement of which this prospectus forms a part.
Stockholders’ Agreement
Effective upon the completion of the offering, we will enter into the Stockholders’ Agreement with the Principal Equity Owners (and their respective permitted transferees thereunder party thereto from time to time). Pursuant to the Stockholders’ Agreement, for so long as the Company is a “controlled company” under the NYSE standards, the board of directors of the Company will be comprised of no more than ten directors, and (i) Welsh Carson will have the right to designate five nominees for election to our board of directors, of which one must be an “independent director,” as defined under the rules of NYSE and qualify as an independent director for purposes of Rule 10A-3 under the Exchange Act and NYSE rules requiring us to have one independent audit committee member upon the listing of our Class A common stock (an “Audit Committee Independent Director”), (ii) Permira will have the right to designate one nominee so long it owns at least 33.3% of the shares of our common stock that it holds immediately following the consummation of this offering (the “Closing Shares”), (iii) Warburg Pincus will have the right to designate one nominee so long as it owns at least 33.3% of its Closing Shares, (iv) Permira and Warburg Pincus will each have the right to designate (by mutual agreement for so long as both have such right and if only one of Warburg Pincus or Permira have such right, the one that has such right) one nominee who would qualify as an Audit Committee Independent Director so long as each owns at least 50% of its Closing Shares, (v) Welsh Carson, Permira and Warburg Pincus will each have the right to designate (by mutual agreement so long as more than one shareholder has such right and if only one of Welsh Carson, Warburg Pincus or Permira have such right, the one that has such right) one nominee who would qualify as an Audit Committee Independent Director so long as, in the case of Permira and Warburg Pincus, it owns at least 33.3% of its Closing Shares and (vi) the Chief Executive Officer of the Company must be nominated as a director. After
149
Table of Contents
Index to Financial Statements
the closing of this offering, the Principal Equity Owners will continue to control a majority of our voting power and, as a result, we will be a “controlled company” within the meaning of the NYSE corporate governance standards. After giving effect to the multi-class common stock structure in which each share of our Class C common stock and each share of our Class D common stock entitles its holder to ten votes per share on all matters presented to our stockholders generally, we expect that we will remain a “controlled company” for so long as the Principal Equity Owners hold at least approximately 9.1% of the issued and outstanding shares of our common stock.
For so long as the Company is not a “controlled company” under the NYSE standards, pursuant to the Stockholders’ Agreement, the board of directors of the Company would be comprised of no more than eleven directors, and (i) Welsh Carson will have the right to designate two nominees so long as it owns at least 5% of the outstanding shares of our common stock, (ii) Permira will have the right to designate one nominee so long as it owns at least the greater of 33.3% of its Closing Shares and 5% of the outstanding shares of our common stock, (iii) Warburg Pincus will have the right to designate one nominee so long as it owns at least the greater of 33.3% of its Closing Shares and 5% of the outstanding shares of our common stock and (iv) the Chief Executive Officer of the Company must be nominated as a director.
The Stockholders’ Agreement will also generally provide that (i) so long as Permira beneficially owns at least 50% of its Closing Shares and is otherwise entitled to designate at least one nominee under the Stockholders’ Agreement, one Permira director nominee will be entitled to be on all committees and Permira will be entitled to appoint up to two non-voting observers at Board meetings; (ii) so long as Warburg Pincus beneficially owns at least 50% of its Closing Shares and is otherwise entitled to designate at least one nominee under the Stockholders’ Agreement, one Warburg Pincus director nominee will be entitled to be on all committees and Warburg Pincus will be entitled to appoint up to two non-voting observers at Board meetings; and (iii) the Welsh Carson director nominees will be entitled to be on all committees and, so long as Welsh Carson is otherwise entitled to designate at least one nominee under the Stockholders’ Agreement, Welsh Carson will be entitled to appoint up to two non-voting observers at Board meetings. The committee designation rights are subject to exceptions with respect to any such committee whose function relates solely to arrangements with the relevant Principal Equity Owner and to the extent that such membership would violate applicable securities laws or the NYSE standards.
The Principal Equity Owners will each additionally agree to take all necessary action, including voting their respective shares of common stock, to cause the election of the directors nominated pursuant to the Stockholders’ Agreement, and will each be entitled to propose the replacement of any of its board nominees whose board service ceases for any reason regardless of each Principal Equity Owner’s beneficial ownership of our common stock at the time of such vacancy. No board member designated in connection with the Stockholders’ Agreement will be required to immediately tender his or her resignation upon the loss of rights by any Principal Equity Owner responsible for his or her designation, and each such director may continue to serve until the end of his or her then current term. The board member designation rights pursuant to the Stockholders’ Agreement will have the effect of making it more difficult for stockholders to change the composition of our board of directors.
Under the Stockholders’ Agreement, prior to the Trigger Event, directors nominated by a Principal Equity Owner and serving as a director shall not be removed by the other Principal Equity Owners without cause.
Under the Stockholders’ Agreement, we have agreed, subject to certain exceptions, to indemnify the Principal Equity Owners, and various affiliated persons and indirect equityholders of the Principal Equity Owners from certain losses arising out of any threatened or actual litigation by reason of the fact that the indemnified person is or was a holder of our common stock or, prior to the completion of the Transactions, of equity interests in CWAN Holdings, LLC.
This summary does not purport to be complete and is qualified in its entirety by the provisions of our form of Stockholders’ Agreement, a copy of which has been filed as an exhibit to the registration statement of which this prospectus forms a part.
150
Table of Contents
Index to Financial Statements
Reserved Share Program
At our request, Morgan Stanley & Co. LLC, a participating underwriter, has reserved for sale, at the initial public offering price, up to 5% of the Class A common stock offered by this prospectus for sale to certain of our directors, officers and employees through the Reserved Share Program. See “Underwriting” for more information.
Indications of Interest
Prior to the date hereof, certain investors, including certain of our existing investors and their affiliated entities, including one or more funds and/or accounts affiliated with Calculated DF Holdings, L.P., Durable Capital Master Fund LP and DCP CA Blocker LLC have indicated an interest, severally and not jointly, in purchasing up to an aggregate of $150 million in shares in this offering at the initial public offering price. Because this indication of interest is not a binding agreement or commitment to purchase, the funds and/or accounts affiliated with Calculated DF Holdings, L.P., Durable Capital Master Fund LP and DCP CA Blocker LLC may determine to purchase more, less or no shares in this offering or the underwriters may determine to sell more, less or no shares to any of the funds and/or accounts affiliated with Calculated DF Holdings, L.P., Durable Capital Master Fund LP and DCP CA Blocker LLC. The underwriters will receive the same discount on any of our shares purchased by the funds and/or accounts affiliated with Calculated DF Holdings, L.P., Durable Capital Master Fund LP and DCP CA Blocker LLC.
Limitation of Liability and Indemnification of Officers and Directors
Our certificate of incorporation and bylaws, each as expected to be in effect upon the consummation of this offering, will provide that we shall indemnify each of our directors and officers to the fullest extent permitted by the DGCL. For further information, see the section entitled “Description of Capital Stock—Indemnification and Limitations on Directors’ Liability.” We intend to enter into customary indemnification agreements with each of our executive officers and directors that provide them with customary indemnification in connection with their service to us or on our behalf.
Review, Approval or Ratification of Transactions with Related Persons
The audit committee of our board of directors will have primary responsibility for reviewing and approving transactions with related parties. Our audit committee charter will provide that the audit committee shall review and approve in advance any related party transactions.
We will adopt, effective upon the consummation of this offering, a formal written policy providing that our executive officers, directors, nominees for election as directors, beneficial owners of more than 5% of any class of our voting stock, any member of the immediate family of any of the foregoing persons, and any firm, corporation or other entity in which any of the foregoing persons is employed, is a general partner or principal or in a similar position, or in which such person has a 5% or greater beneficial ownership interest, is not permitted to enter into a related party transaction with us without the consent of our audit committee, subject to the exceptions described below. In approving or rejecting any such proposal, our audit committee is to consider the relevant facts and circumstances available and deemed relevant to our audit committee, including whether the transaction is on terms no less favorable than terms generally available to an unaffiliated third party under the same or similar circumstances and the extent of the related party’s interest in the transaction. Our audit committee is expected to determine that certain transactions will not require audit committee approval, including certain employment arrangements of executive officers, director compensation, transactions with another company at which a related party’s only relationship is as a non-executive employee or beneficial owner of less than 5% of that company’s shares, transactions where a related party’s interest arises solely from the ownership of our common stock (on an as-adjusted basis) and all holders of our common stock (on an as-exchanged basis) received the same benefit on a pro rata basis, and transactions available to all employees generally.
151
Table of Contents
Index to Financial Statements
DESCRIPTION OF CERTAIN INDEBTEDNESS
The following is a summary of the material provisions relating to our material indebtedness. The following summary does not purport to be complete and is subject to, and qualified in its entirety by reference to, the provisions of the corresponding agreement or instrument, including the definitions of certain terms therein that are not otherwise defined in this prospectus. You should refer to the relevant agreement or instrument for additional information, copies of which will be filed with the SEC once available.
Existing Credit Agreement
On September 1, 2016, Clearwater Analytics, LLC, a Delaware limited liability company, as borrower, and Carbon Analytics Acquisition LLC, a Delaware limited liability company, entered into that certain credit agreement with the lenders party thereto from time to time and Ares Capital Corporation, as Administrative Agent, a Lender and Issuing Lender. The credit agreement was amended pursuant to that certain First Amendment to Credit Agreement, dated as of December 23, 2016, that certain Second Amendment to Credit Agreement, dated as of March 27, 2018, that certain Third Amendment to Credit Agreement, dated as of July 3, 2019, that certain Fourth Amendment to Credit Agreement, dated as of December 3, 2019 and that certain Fifth Amendment to Credit Agreement, dated as of October 19, 2020 (the credit agreement, as amended, the “Existing Credit Agreement”). The loans outstanding under the Existing Credit Agreement will be repaid in full, without premium, in connection with this offering. See “Management’s Discussion and Analysis of Financial Condition and Results of Operations—Existing Term Loan Facility and Revolving Line of Credit.”
New Credit Agreement
Clearwater Analytics, LLC has entered into negotiations with respect to a $55 million New Term Loan and a $125 million New Revolving Facility. The New Facilities will be pursuant to a new credit agreement with JPMorgan Chase Bank, N.A., as administrative agent thereunder, which is expected to be entered into substantially concurrently with this offering.
It is anticipated that the proceeds of the New Term Loan (and if necessary, cash on hand) will be used to refinance the loans outstanding under the Existing Credit Agreement and pay certain transaction expenses. The New Revolving Facility will be used for working capital and other general corporate purposes (including acquisitions permitted under the New Credit Agreement).
The interest rates applicable to the loans under the New Credit Agreement are anticipated to be based on a fluctuating rate of interest determined by reference to a base rate plus an applicable margin of 0.75% or a LIBOR rate plus an applicable margin of 1.75%, in each case with a step-up of 0.25% if certain secured net leverage levels are not achieved. The applicable margin is adjusted after the completion of each full fiscal quarter based upon the pricing grid in the New Credit Agreement. It is anticipated that the revolving commitment will have an unused commitment fee of 25 basis points, stepping up to 30 basis points if certain secured net leverage levels are not achieved.
It is anticipated that under the New Credit Agreement, the term loans will amortize at a rate of 5.00% per annum, paid quarterly. The New Credit Agreement is anticipated to contain mandatory prepayments to the extent the company incurs certain indebtedness or receives proceeds from certain dispositions or casualty events.
The obligations of the Borrower under the New Credit Agreement are anticipated to be jointly and severally guaranteed by its direct parent and certain of its subsidiaries. The obligations of the Loan Parties are anticipated to be secured by a first priority lien on substantially all of their assets, subject to customary exceptions.
The New Credit Agreement is anticipated to contain customary affirmative and negative covenants, including, without limitation, covenants that restrict our ability to borrow money, grant liens, make investments, make restricted payments or dispose of assets, and customary events of default. Specifically, we are required to maintain a consolidated secured net indebtedness to consolidated EBITDA ratio of not more than 4.75:1.00 as of the last day of each fiscal quarter commencing with the fiscal quarter ending December 31, 2021.
152
Table of Contents
Index to Financial Statements
General
Prior to the consummation of this offering, we will file an amended and restated certificate of incorporation and we will adopt our amended and restated bylaws. Our amended and restated certificate of incorporation will authorize capital stock consisting of:
| • | 1,500,000,000 shares of Class A common stock, par value $0.001 per share; |
| • | 500,000,000 shares of Class B common stock, par value $0.001 per share; |
| • | 500,000,000 shares of Class C common stock, par value $0.001 per share ; |
| • | 500,000,000 shares of Class D common stock, par value $0.001 per share ; and |
| • | 100,000,000 shares of preferred stock, par value $0.001 per share. |
We are selling 30,000,000 shares of Class A common stock in this offering (34,500,000 shares if the underwriters exercise in full their option to purchase additional shares of our Class A common stock). We are issuing for nominal consideration 11,151,110 shares of Class B common stock, 47,377,587 shares of Class C common stock and 130,083,755 shares of Class D common stock in connection with the Transactions.
The following summary describes the material provisions of our capital stock. We urge you to read our amended and restated certificate of incorporation and our amended and restated bylaws, which are included as exhibits to the registration statement of which this prospectus forms a part.
Certain provisions of our amended and restated certificate of incorporation and our amended and restated bylaws summarized below may be deemed to have an antitakeover effect and may delay or prevent a tender offer or takeover attempt that a stockholder might consider in its best interests, including those attempts that might result in a premium over the market price for the shares of our Class A common stock.
Common Stock
We have four classes of common stock: Class A, Class B, Class C and Class D. The Class A common stock, Class B common stock, Class C common stock and Class D common stock will generally vote together as a single class on all matters submitted to a vote of stockholders, except as otherwise required by applicable law.
Class A Common Stock
Voting Rights. Holders of shares of our Class A common stock are entitled to one vote for each share held of record on all matters submitted to a vote of stockholders. Holders of shares of our Class A common stock will vote together with holders of our Class B common stock, Class C common stock and Class D common stock as a single class on all matters presented to our stockholders for their vote or approval, except for certain amendments to our amended and restated certificate of incorporation described below or as otherwise required by applicable law or the amended and restated certificate of incorporation.
Dividend Rights. Holders of shares of our Class A common stock are entitled to receive dividends when and if declared by our board of directors out of funds legally available therefor, subject to any statutory or contractual restrictions on the payment of dividends and to any restrictions on the payment of dividends imposed by the terms of any outstanding preferred stock.
Liquidation Rights. Upon our liquidation, dissolution or winding up, any business combination or a sale or disposition of all or substantially all of our assets, the assets legally available for distribution to our stockholders will be distributable ratably among the holders of our Class A common stock and Class D common stock, subject to prior satisfaction of all outstanding debts and other liabilities and the payment of liquidation preferences, if any, on any outstanding preferred stock.
153
Table of Contents
Index to Financial Statements
Other Matters. Our certificate of incorporation will not entitle holders of our Class A common stock to preemptive or conversion rights or other subscription rights. There will be no redemption or sinking fund provisions applicable to our Class A common stock. All outstanding shares of our Class A common stock are, and the shares of our Class A common stock offered in this offering will be, fully paid and nonassessable.
Class B Common Stock
Voting Rights. Each share of our Class B common stock entitles its holders to one vote per share on all matters presented to our stockholders generally. Holders of shares of our Class B common stock will vote together with holders of our Class A common stock, Class C common stock and Class D common stock as a single class on all matters presented to our stockholders for their vote or approval, except for certain amendments to our amended and restated certificate of incorporation described below or as otherwise required by applicable law or the amended and restated certificate of incorporation.
Issuance of Shares. Upon the completion of this offering, the Other Continuing Equity Owners will own 100% of our outstanding Class B common stock, with the number of shares of Class B common stock held by any such Other Continuing Equity Owner being equivalent to the number of LLC Interests held by such Other Continuing Equity Owner. Shares of Class B common stock will be issued in the future only to the extent necessary to maintain a one-to-one ratio between the number of LLC Interests held by the Other Continuing Equity Owners and the number of shares of Class B common stock issued to such Other Continuing Equity Owners. Shares of Class B common stock are transferable only together with an equal number of LLC Interests. Only Permitted Transferees of LLC Interests held by the Other Continuing Equity Owners will be Permitted Transferees of Class B common stock. Each share of Class B common stock and accompanying LLC Interest is required to be converted into one share of Class A common stock immediately prior to any sale or other transfer of such share by an Other Continuing Equity Owner or any of its affiliates or Permitted Transferees to a non-Permitted Transferee. See “Certain Relationships and Related Party Transactions—LLC Agreement.”
Dividend and Distribution Rights. Holders of our Class B common stock do not have any right to receive dividends or to receive a distribution upon dissolution or liquidation.
Exchange rights. Each share of our Class B common stock will be redeemed and canceled by us if the holder exchanges one LLC Interest and such share of Class B common stock for cash or one share of Class A common stock pursuant to the terms of the LLC Agreement. See “Certain Relationships and Related Party Transactions—LLC Agreement.”
Conversion. Each share of our Class B common stock transferred to a non-Permitted Transferee will automatically convert into a share of our Class A common stock immediately prior to such transfer.
Other Matters. Our certificate of incorporation will not entitle holders of our Class B common stock to preemptive or conversion rights or other subscription rights. There will be no redemption or sinking fund provisions applicable to our Class B common stock. All outstanding shares of our Class B common stock are fully paid and nonassessable.
Class C Common Stock
Voting Rights. Each share of our Class C common stock entitles its holders to ten votes per share on all matters presented to our stockholders generally. Holders of shares of our Class C common stock will vote together with holders of our Class A common stock, Class B common stock and Class D common stock as a single class on all matters presented to our stockholders for their vote or approval, except for certain amendments to our amended and restated certificate of incorporation described below or as otherwise required by applicable law or the amended and restated certificate of incorporation.
Issuance of Shares. Upon the completion of this offering, the Principal Equity Owners will own 100% of our outstanding Class C common stock, with the number of shares of Class C common stock held by any such Principal Equity Owner being equivalent to the number of LLC Interests held by such Principal Equity Owner.
154
Table of Contents
Index to Financial Statements
Shares of Class C common stock will be issued in the future only to the extent necessary to maintain a one-to-one ratio between the number of LLC Interests held by the Principal Equity Owners and the number of shares of Class C common stock issued to the Principal Equity Owners. Shares of Class C common stock are transferable only together with an equal number of LLC Interests. Only Permitted Transferees of LLC Interests held by the Principal Equity Owners will be permitted transferees of Class C common stock. Each share of Class C common stock and accompanying LLC Interest is required to be converted into one share of Class A common stock immediately prior to any sale or other transfer of such share by a Principal Equity Owner or any of its affiliates or permitted transferees to a non-permitted transferee. See “Certain Relationships and Related Party Transactions—LLC Agreement.”
Dividend and Distribution Rights. Holders of our Class C common stock do not have any right to receive dividends or to receive a distribution upon dissolution or liquidation.
Exchange rights. Each share of our Class C common stock will be redeemed and canceled by us if the holder exchanges one LLC Interest and such share of Class C common stock for cash or one share of Class A common stock or, if requested by a Principal Equity Owner, Class D common stock, pursuant to the terms of the LLC Agreement. See “Certain Relationships and Related Party Transactions—LLC Agreement.”
Conversion. Shares of our Class C common stock may be exchanged at any time, at the option of the holder, for newly issued shares of our Class B common stock, on a one-for-one basis (in which case their shares of our Class C common stock will be cancelled on a one-for-one basis upon any such issuance). Each share of our Class C common stock will automatically convert into a share of our Class B common stock upon the earlier of (i) the date that affiliates of Welsh Carson own less than 5% of our common stock and (ii) the date that is seven years following the closing of our initial public offering. Each share of our Class C common stock transferred to a non-permitted transferee will automatically convert into a share of our Class A common stock immediately prior to such transfer.
Other Matters. Our certificate of incorporation will not entitle holders of our Class C common stock to preemptive or conversion rights or other subscription rights. There will be no redemption or sinking fund provisions applicable to our Class C common stock. All outstanding shares of our Class C common stock are fully paid and nonassessable.
Class D Common Stock
Voting Rights. Holders of shares of our Class D common stock are entitled to ten votes for each share held of record on all matters presented to our stockholders generally. Holders of shares of our Class D common stock will vote together with holders of our Class A common stock, Class B common stock and Class C common stock as a single class on all matters presented to our stockholders for their vote or approval, except for certain amendments to our amended and restated certificate of incorporation described below or as otherwise required by applicable law or the amended and restated certificate of incorporation.
Dividend Rights. Holders of shares of our Class D common stock are entitled to receive dividends when and if declared by our board of directors out of funds legally available therefor, subject to any statutory or contractual restrictions on the payment of dividends and to any restrictions on the payment of dividends imposed by the terms of any outstanding preferred stock.
Liquidation Rights. Upon our liquidation, dissolution or winding up, any business combination or a sale or disposition of all or substantially all of our assets, the assets legally available for distribution to our stockholders will be distributable ratably among the holders of our Class A common stock and Class D common stock, subject to prior satisfaction of all outstanding debts and other liabilities and the payment of liquidation preferences, if any, on any outstanding preferred stock.
Conversion. Shares of our Class D common stock may be exchanged at any time, at the option of the holder, for newly issued shares of our Class A common stock, on a one-for-one basis (in which case their shares of our
155
Table of Contents
Index to Financial Statements
Class D common stock will be cancelled on a one-for-one basis upon any such issuance). Each share of Class D common stock is required to be converted into one share of Class A common stock immediately prior to any sale or other transfer of such share by a Principal Equity Owner or any of its affiliates or permitted transferees to a non-permitted transferee. Each share of our Class D common stock will automatically convert into a share of our Class A common stock upon the earlier of (i) the date that affiliates of Welsh Carson own less than 5% of our common stock and (ii) the date that is seven years following the closing of our initial public offering.
Other Matters. Our certificate of incorporation will not entitle holders of our Class D common stock to preemptive or conversion rights or other subscription rights. There will be no redemption or sinking fund provisions applicable to our Class D common stock. All outstanding shares of our Class D common stock are fully paid and nonassessable. Upon the completion of this offering the Principal Equity Owners will own 100% of our outstanding Class D common stock, with the number of shares of Class D common stock held by any such Principal Equity Owner being equivalent to the number of LLC Interests held by such Principal Equity Owner.
LLC Interests
Distributions. So long as CWAN Holdings, LLC is treated as a partnership for U.S. federal income tax purposes and to the extent that it has funds available for distribution without violation of applicable law or any contractual obligation, holders of LLC Interests are entitled to certain tax distributions in an amount of cash to be determined in accordance with the LLC Agreement.
Liquidation Rights. Upon liquidation, dissolution or winding up of CWAN Holdings, LLC, the assets legally available for distribution will be distributable ratably among the holders of our Class A common stock and Class D common stock, subject to prior satisfaction of all outstanding debts and other liabilities and the payment of liquidation preferences.
Exchanges. A holder of LLC Interests may, subject to certain exceptions, periodically at its option require CWAN Holdings, LLC to redeem all or a portion of its LLC Interests in exchange for, at our election (determined solely by a majority of our directors who are disinterested), newly issued shares of our Class A common stock (in the case of Other Continuing Equity Owners) and shares of our Class D common stock (in the case of the Principal Equity Owners) on a one-for-one basis or for an amount in cash, in each case, in accordance with the terms of the LLC Agreement; provided that, at our election (determined solely by a majority of our directors who are disinterested), we may effect a direct exchange by Clearwater Analytics Holdings, Inc. of such Class A common stock, Class D common stock or cash, as applicable, for such LLC Interests.
Authorized but Unissued Preferred Stock
Delaware law does not require stockholder approval for any issuance of authorized shares. However, the listing requirements of NYSE, which would apply as long as our Class A common stock is listed on NYSE, require stockholder approval of certain issuances equal to or exceeding 20% of the combined voting power of our Class A common stock. These additional shares may be used for a variety of corporate purposes, including future public offerings to raise additional capital, acquisitions and employee benefit plans.
Unless required by law or by any stock exchange on which our common stock may be listed, the authorized shares of preferred stock will be available for issuance without further action by our stockholders. Our certificate of incorporation will authorize our board of directors to establish, from time to time, the number of shares to be included in each series of preferred stock, and to fix the designation, powers, privileges, preferences and relative participating, optional or other rights, if any, of the shares of each series of preferred stock, and any of its qualifications, limitations or restrictions. Our board of directors will also be able to increase or decrease the number of shares of any series of preferred stock, but not below the number of shares of that series of preferred stock then outstanding, without any further vote or action by the stockholders.
156
Table of Contents
Index to Financial Statements
The existence of unissued and unreserved common stock or preferred stock may enable our board of directors to issue shares to persons friendly to current management, which could render more difficult or discourage an attempt to obtain control of the Company by means of a merger, tender offer, proxy contest or otherwise, and could thereby protect the continuity of our management and possibly deprive stockholders of opportunities to sell their shares of Class A common stock at prices higher than prevailing market prices.
Indemnification and Limitations on Directors’ Liability
Section 145 of the DGCL grants each Delaware corporation the power to indemnify any person who is or was a director, officer, employee or agent of a corporation, against expenses, including attorneys’ fees, judgments, fines and amounts paid in settlement actually and reasonably incurred by him or her in connection with any threatened, pending or completed action, suit or proceeding, whether civil, criminal, administrative or investigative, other than an action by or in the right of the corporation, by reason of serving or having served in any such capacity, if he or she acted in good faith in a manner reasonably believed to be in, or not opposed to, the best interests of the corporation and, with respect to any criminal action or proceeding, had no reasonable cause to believe his or her conduct was unlawful. A Delaware corporation may similarly indemnify any such person in actions by or in the right of the corporation if he or she acted in good faith in a manner reasonably believed to be in, or not opposed to, the best interests of the corporation, except that no indemnification may be made in respect of any claim, issue or matter as to which the person shall have been adjudged to be liable to the corporation unless and only to the extent that the Delaware Court of Chancery or the court in which the action was brought determines that, despite adjudication of liability, but in view of all of the circumstances of the case, the person is fairly and reasonably entitled to indemnity for expenses which the Delaware Court of Chancery or other court shall deem proper.
Section 102(b)(7) of the DGCL enables a corporation in its certificate of incorporation, or an amendment thereto, to eliminate or limit the personal liability of a director to the corporation or its stockholders for monetary damages for violations of the director’s fiduciary duty as a director, except (i) for any breach of the director’s duty of loyalty to the corporation or its stockholders, (ii) for acts or omissions not in good faith or that involve intentional misconduct or a knowing violation of law, (iii) pursuant to Section 174 of the DGCL (providing for director liability with respect to unlawful payment of dividends or unlawful stock purchases or redemptions) or (iv) for any transaction from which a director derived an improper personal benefit. Our certificate of incorporation will provide for such limitation of liability.
Our certificate of incorporation and bylaws will indemnify our directors and officers to the full extent permitted by the DGCL and our certificate of incorporation also allows our board of directors to indemnify other employees. This indemnification will extend to the payment of judgments in actions against officers and directors and to reimbursement of amounts paid in settlement of such claims or actions and may apply to judgments in favor of the corporation or amounts paid in settlement to the corporation. This indemnification will also extend to the payment of attorneys’ fees and expenses of officers and directors in suits against them where the officer or director acted in good faith and in a manner he or she reasonably believed to be in, or not opposed to, the best interests of the Company and, with respect to any criminal action or proceeding, he or she had no reasonable cause to believe his or her conduct was unlawful. This right of indemnification is not exclusive of any right to which the officer or director may be entitled as a matter of law and shall extend and apply to the estates of deceased officers and directors.
We maintain a directors’ and officers’ insurance policy. The policy insures directors and officers against unindemnified losses arising from certain wrongful acts in their capacities as directors and officers and reimburses us for those losses for which we have lawfully indemnified the directors and officers. The policy contains various exclusions that are normal and customary for policies of this type.
We believe that the limitation of liability and indemnification provisions in our certificate of incorporation, bylaws and insurance policies are necessary to attract and retain qualified directors and officers. However, these
157
Table of Contents
Index to Financial Statements
provisions may discourage derivative litigation against directors and officers, even though an action, if successful, might benefit us and other stockholders. Furthermore, a stockholder’s investment may be adversely affected to the extent we pay the costs of settlement and damage awards against directors and officers as required or allowed by these limitation of liability and indemnification provisions.
At present, there is no pending litigation or proceeding involving any of our directors, officers, employees or agents as to which indemnification is sought from us, nor are we aware of any threatened litigation or proceeding that may result in an indemnification claim.
Antitakeover Effects of Delaware Law, Our Certificate of Incorporation and Our Bylaws
Certain provisions of Delaware law, our certificate of incorporation and our bylaws that will be effective upon consummation of the offering could make the acquisition of the Company more difficult and could delay, defer or prevent a tender offer or other takeover attempt that a stockholder might consider to be in its best interests, including takeover attempts that might result in the payment of a premium to stockholders over the market price for their shares. These provisions also may promote the continuity of our management by making it more difficult for a person to remove or change the incumbent members of our board of directors.
Multi-class Common Stock Structure. Holders of shares of our Class A common stock, Class B common stock, Class C common stock and Class D common stock will vote together as a single class on all matters presented to stockholders for their vote or approval, except as otherwise required by law or our amended and restated certificate of incorporation. Each share of our Class A common stock entitles its holder to one vote per share, each share of our Class B common stock entitles its holder to one vote per share, each share of our Class C common stock entitles its holder to ten votes per share and each share of our Class D common stock entitles its holder to ten votes per share on all matters presented to our stockholders generally.
Authorized but Unissued Shares; Undesignated Preferred Stock. The authorized but unissued shares of our common stock will be available for future issuance without stockholder approval except as required by law or by any stock exchange on which our common stock may be listed. These additional shares may be utilized for a variety of corporate purposes, including future public offerings to raise additional capital, acquisitions and employee benefit plans. In addition, our board of directors may authorize, without stockholder approval, the issuance of undesignated preferred stock with voting rights or other rights or preferences designated from time to time by our board of directors. The existence of authorized but unissued shares of common stock or preferred stock may enable our board of directors to render more difficult or to discourage an attempt to obtain control of us by means of a merger, tender offer, proxy contest or otherwise.
Board Classification. Our certificate of incorporation will provide that our board of directors will be divided into three classes of directors, with the classes to be as nearly equal in number as possible, and with the directors serving three-year terms. As a result, approximately one-third of our board of directors will be elected each year. The classification of directors will have the effect of making it more difficult for stockholders to change the composition of our board of directors. Our certificate of incorporation and bylaws will provide that, subject to any rights of holders of preferred stock to elect additional directors under specified circumstances, the number of directors will be fixed from time to time exclusively pursuant to a resolution adopted by our board of directors.
No Cumulative Voting. Our certificate of incorporation will provide that stockholders are not permitted to cumulate votes in the election of directors.
Special Meetings of Stockholders. Our bylaws will provide that special meetings of our stockholders may be called, prior to the Trigger Event, only by or at the direction of our board of directors or our Chairman at the request of holders of not less than a majority of the combined voting power of our Class A common stock, Class B common stock, Class C common stock and Class D common stock and, from and after the Trigger Event, only by or at the direction of our board of directors or our Chairman.
158
Table of Contents
Index to Financial Statements
Stockholder Action by Written Consent. Pursuant to Section 228 of the DGCL, any action required to be taken at any annual or special meeting of the stockholders may be taken without a meeting, without prior notice and without a vote if a consent or consents in writing, setting forth the action so taken, is signed by the holders of outstanding stock having not less than the minimum number of votes that would be necessary to authorize or take such action at a meeting at which all shares of our stock entitled to vote thereon were present and voted, unless our certificate of incorporation provides otherwise. Our certificate of incorporation will preclude stockholder action by written consent from and after the Trigger Event.
Advance Notice Requirements for Stockholder Proposals and Nomination of Directors. Our bylaws will require stockholders seeking to bring business before an annual meeting of stockholders or to nominate individuals for election as directors at an annual or special meeting of stockholders to provide timely notice in writing. To be timely, a stockholder’s notice will need to be sent to and received by our Secretary both (1) at our principal executive offices by hand delivery, overnight courier service, or by certified or registered mail, return receipt required, and (2) by electronic mail, as provided in the bylaws, no later than the close of business on the 90th day, nor earlier than the close of business on the 120th day, prior to the anniversary of the immediately preceding annual meeting of stockholders. However, in the event that the annual meeting is called for a date that is not within 30 days before or 70 days after the anniversary of the immediately preceding annual meeting of stockholders, or if no annual meeting was held in the preceding year, such notice will be timely only if received no earlier than the close of business on the 120th day prior to the annual meeting and no later than the close of business on the later of the 90th day prior to such annual meeting and the 10th day following the date on which a public announcement of the date of the annual meeting was made by us. Our bylaws will also specify requirements as to the form and content of a stockholder’s notice. These provisions may preclude our stockholders from bringing matters before our annual meeting of stockholders or from making nominations for directors at our meetings of stockholders. These provisions may also discourage or deter a potential acquiror from conducting a solicitation of proxies to elect the potential acquiror’s own slate of directors or otherwise attempting to obtain control of the Company.
Removal of Directors; Vacancies. Under the DGCL, unless otherwise provided in our certificate of incorporation, directors serving on a classified board may be removed by the stockholders only for cause. Our certificate of incorporation will provide that from and after the Trigger Event, directors may only be removed for cause, and only by the affirmative vote of holders of at least 66 2/3% in voting power of all the then-outstanding shares of common stock of the Company entitled to vote thereon. Under the Stockholders’ Agreement, prior to the Trigger Event, directors nominated by a Principal Equity Owner and serving as a director shall not be removed by the other Principal Equity Owners without cause. In addition, our certificate of incorporation will also provide that from and after the Trigger Event, any newly created directorship on our board of directors that results from an increase in the number of directors and any vacancy occurring in our board of directors may only be filled by a majority of the directors then in office, although less than a quorum, or by a sole remaining director (and not by the stockholders).
Supermajority Provisions. Our certificate of incorporation and bylaws will provide that our board of directors is expressly authorized to alter, amend, rescind or repeal, in whole or in part, our bylaws without a stockholder vote in any matter not inconsistent with Delaware law and our certificate of incorporation. From and after the Trigger Event, in addition to any vote of the holders of any class or series of capital stock of our Company required therein, our bylaws or applicable law, any amendment, alteration, rescission or repeal of our bylaws by our stockholders will require the affirmative vote of the holders of at least 66 2/3% in voting power of all the then-outstanding shares of stock of our Company entitled to vote thereon, voting together as a single class.
The DGCL provides generally that the affirmative vote of a majority of the outstanding shares entitled to vote thereon, voting together as a single class, is required to amend a corporation’s certificate of incorporation, unless the certificate of incorporation requires a greater percentage. Our certificate of incorporation will provide that the following provisions in our certificate of incorporation may be amended, altered, repealed or rescinded only by the affirmative vote of the holders of at least 66 2/3% in voting power of all the then-outstanding shares of stock of our Company entitled to vote thereon, voting together as a single class:
| • | the provision requiring a 66 2/3% supermajority vote for stockholders to amend our bylaws; |
159
Table of Contents
Index to Financial Statements
| • | the provisions providing for a classified board of directors (the election and term of our directors); |
| • | the provisions regarding removal of directors; |
| • | the provisions regarding stockholder action by written consent; |
| • | the provisions regarding calling special meetings of stockholders; |
| • | the provisions regarding filling vacancies on our board of directors and newly created directorships; |
| • | the provisions regarding competition and corporate opportunities; |
| • | the provisions regarding Section 203 of the DGCL; |
| • | the provisions eliminating monetary damages for breaches of fiduciary duty by a director and governing forum selection; and |
| • | the amendment provision requiring that the above provisions be amended only with a 66 2/3% supermajority vote. |
Section 203 of the Delaware General Corporation Law. Section 203 of the DGCL provides that, subject to certain stated exceptions, a corporation may not engage in a business combination with any “interested stockholder” (as defined below) for a period of three years following the time that such stockholder became an interested stockholder, unless:
| • | prior to such time the board of directors of the corporation approved either the business combination or transaction which resulted in the stockholder becoming an interested stockholder; |
| • | upon consummation of the transaction which resulted in the stockholder becoming an interested stockholder, the interested stockholder owned at least 85% of the voting stock of the corporation outstanding at the time the transaction commenced, excluding shares owned by persons who are directors and also officers and employee stock plans in which participants do not have the right to determine confidentially whether shares held subject to the plan will be tendered in a tender or exchange offer; or |
| • | at or subsequent to such time, the business combination is approved by the board of directors and authorized at an annual or special meeting of stockholders, and not by written consent, by the affirmative vote of 66 2/3% of the outstanding voting stock which is not owned by the interested stockholder. |
An “interested stockholder” is any person (other than the corporation and any direct or indirect majority-owned subsidiary) who owns 15% or more of the outstanding voting stock of the corporation or is an affiliate or associate of the corporation and was the owner of 15% or more of the outstanding voting stock of the corporation at any time within the three-year period immediately prior to the date of determination, and the affiliates and associates of such person.
We intend to opt out of Section 203 of the DGCL; however, our amended and restated certificate of incorporation will contain substantially similar provisions. Our certificate of incorporation will provide that our Principal Equity Owners and their affiliates and any of their respective direct or indirect transferees, and any group as to which such persons are a party, do not constitute “interested stockholders” for purposes of this provision.
Under certain circumstances, this provision will make it more difficult for a person who would be an “interested stockholder” to effect various business combinations with us for a three-year period. This provision may encourage companies interested in acquiring us to negotiate in advance with our board of directors because the stockholder approval requirement would be avoided if our board of directors approves either the business combination or the transaction which results in the stockholder becoming an interested stockholder. These provisions also may have the effect of preventing changes in our board of directors and may make it more difficult to accomplish transactions which stockholders may otherwise deem to be in their best interests.
160
Table of Contents
Index to Financial Statements
Transfer Agent and Registrar
The transfer agent and registrar for our Class A common stock will be American Stock Transfer & Trust Company, LLC.
Listing
We have applied to list our Class A common stock on NYSE under the symbol “CWAN.”
161
Table of Contents
Index to Financial Statements
SHARES ELIGIBLE FOR FUTURE SALE
Prior to this offering, there has been no public market for shares of our Class A common stock. Future sales of shares of our Class A common stock in the public market after this offering, and the availability of shares for future sale, could adversely affect the market prices prevailing from time to time. As described below, only a limited number of shares of common stock will be available for sale shortly after this offering due to contractual and legal restrictions on resale. Nonetheless, sales of substantial amounts of our Class A common stock in the future, or the perception that these sales could occur, could adversely affect prevailing market prices for our Class A common stock and could impair our future ability to raise equity capital.
Upon consummation of the offering, we will have outstanding 42,866,089 shares of Class A common stock (or a maximum of 47,366,089 shares of Class A common stock if the underwriters exercise their option to purchase additional shares), 11,151,110 shares of Class B common stock and 47,377,587 shares of Class C common stock and 130,083,755 shares of Class D common stock. Of these shares, 30,000,000 shares of Class A common stock sold in this offering will be freely tradable in the public market without restriction or further registration under the Securities Act, unless these shares are held by “affiliates,” as that term is defined in Rule 144 under the Securities Act.
The remaining outstanding shares of our common stock will be deemed “restricted securities” as that term is defined under Rule 144. Restricted securities may be sold in the public market only if their offer and sale is registered under the Securities Act or if the offer and sale of those securities qualify for an exemption from registration, including exemptions provided by Rules 144 and 701 under the Securities Act, which are summarized below.
As a result of the lock-up agreements described below and the provisions of Rules 144 or 701, and assuming no exercise of the underwriters’ option to purchase additional shares, all of the shares of our common stock that will be deemed “restricted securities” will be available for sale in the public market beginning 180 days after the date of this prospectus, provided that up to 2,396,437 shares will be eligible to be sold at the commencement of the first trading day after 60 days from the date of this prospectus and up to an additional 2,002,049 shares will be eligible to be sold during the lock-up period as a result of the vesting of outstanding awards.
Rule 144
In general, a person who has beneficially owned restricted shares of our common stock for at least six months would be entitled to sell their securities, provided that (1) such person is not deemed to have been one of our affiliates at the time of, or at any time during the 90 days preceding, a sale, (2) we have been subject to the Exchange Act periodic reporting requirements for at least 90 days before the sale and (3) we are current in our Exchange Act reporting at the time of sale.
Persons who have beneficially owned restricted shares of our common stock for at least six months, but who are our affiliates at the time of, or any time during the 90 days preceding, a sale, would be subject to additional restrictions, by which such person would be entitled to sell within any three-month period only a number of securities that does not exceed the greater of either of the following:
| • | 1% of the number of shares of our Class A common stock then outstanding; and |
| • | the average weekly trading volume of our Class A common stock on NYSE during the four calendar weeks preceding the filing of a notice on Form 144 with respect to the sale. |
Such sales by affiliates must also comply with the manner of sale, current public information and notice provisions of Rule 144.
162
Table of Contents
Index to Financial Statements
Registration Statement on Form S-8
We intend to file a registration statement on Form S-8, which will become effective immediately upon filing, under the Securities Act to register all of the shares of Class A common stock reserved for issuance under the 2021 Plan. Shares covered by the Form S-8 will then be eligible for sale in the public markets, subject to vesting restrictions, any applicable lock-up agreements described below and Rule 144 limitations applicable to affiliates.
Lock-up Agreements
We, our directors and officers, and holders of substantially all of our common stock have agreed with the underwriters that, for a period of 180 days following the date of this prospectus, subject to certain exceptions, we and they will not, directly or indirectly, offer, sell, contract to sell, pledge, grant any option to purchase, make any short sale or otherwise dispose of or hedge any of our shares of common stock, or securities convertible into, exchangeable for, or that represent the right to receive, shares of our common stock. Goldman Sachs & Co. LLC, J.P. Morgan Securities LLC and Morgan Stanley & Co. LLC, in their sole discretion, may at any time release all or any portion of the shares from the restrictions in such agreements.
The lock-up agreements do not contain any pre-established conditions to the waiver by the representatives of the underwriters on behalf of the underwriters of any terms of the lock-up agreements. Any determination to release shares subject to the lock-up agreements would be based on a number of factors at the time of determination, including, but not necessarily limited to, the market price of the Class A common stock, the liquidity of the trading market for the Class A common stock, general market conditions, the number of shares proposed to be sold and the timing, purpose and terms of the proposed sale.
Registration Rights
Upon the completion of this offering and after the expiration of the 180 day lock-up period, the holders of an aggregate of 177,461,343 shares of our common stock or their transferees will be entitled to rights with respect to the registration of their shares of common stock under the Securities Act. Registration of these shares under the Securities Act will result in these shares becoming freely tradable immediately upon the effectiveness of such registration, subject to the restrictions of Rule 144. For a further description of these rights, see the section entitled “Certain Relationships and Related Party Transactions—Registration Rights Agreement.”
163
Table of Contents
Index to Financial Statements
MATERIAL U.S. FEDERAL INCOME TAX CONSIDERATIONS
FOR NON-U.S. HOLDERS OF CLASS A COMMON STOCK
The following discussion is a summary of the material U.S. federal income tax consequences to Non-U.S. Holders (as defined below) of the purchase, ownership and disposition of our Class A common stock issued pursuant to this offering, but does not purport to be a complete analysis of all potential tax considerations relating thereto. The effects of other U.S. federal tax laws, such as estate tax laws, gift tax laws, and any applicable state, local or non-U.S. tax laws are not discussed. This discussion is based on the Code, Treasury regulations promulgated or proposed thereunder (the “Treasury Regulations”), judicial decisions, and published rulings and administrative pronouncements of the IRS, in each case as in effect as of the date hereof. These authorities may change or be subject to differing interpretations. Any such change or differing interpretation may be applied retroactively in a manner that could adversely affect a Non-U.S. Holder of our Class A common stock. We have not sought and will not seek any rulings from the IRS regarding the matters discussed below. There can be no assurance the IRS or a court will not take a contrary position to those discussed below regarding the tax consequences of the purchase, ownership and disposition of our Class A common stock.
This discussion is limited to Non-U.S. Holders who purchase our Class A common stock pursuant to this offering and who hold our Class A common stock as a “capital asset” within the meaning of Section 1221 of the Code (generally, property held for investment). This discussion does not address all U.S. federal income tax consequences relevant to a Non-U.S. Holder’s particular circumstances, including the impact of the Medicare contribution tax on net investment income. In addition, it does not address consequences relevant to Non-U.S. Holders subject to special rules, including, without limitation:
| • | U.S. expatriates and former citizens or long-term residents of the U.S.; |
| • | persons holding our Class A common stock as part of a hedge, straddle or other risk reduction strategy or as part of a conversion transaction or other integrated investment; |
| • | banks, insurance companies and other financial institutions; |
| • | real estate investment trusts or regulated investment companies; |
| • | brokers, dealers or traders in securities or currencies; |
| • | “controlled foreign corporations,” “passive foreign investment companies,” and corporations that accumulate earnings to avoid U.S. federal income tax; |
| • | partnerships or other entities or arrangements treated as partnerships for U.S. federal income tax purposes (and investors therein); |
| • | tax-exempt organizations or governmental organizations; |
| • | persons deemed to sell our Class A common stock under the constructive sale provisions of the Code; |
| • | persons who hold or receive our Class A common stock pursuant to the exercise of any employee stock option or otherwise as compensation; |
| • | persons that own, or are deemed to own, more than 5% of our capital stock (except to the extent specifically set forth below); |
| • | persons that are subject to the “applicable financial statement” rules under the Section 451(b) of the Code; |
| • | “qualified foreign pension funds” (within the meaning of Section 897(1)(2) of the Code) and entities, all of the interests of which are held by qualified foreign pension funds; and |
| • | tax-qualified retirement plans. |
If any entity or arrangement classified as a partnership for U.S. federal income tax purposes holds our Class A common stock, the tax treatment of a partner in the partnership will depend on the status of the partner,
164
Table of Contents
Index to Financial Statements
the activities of the partnership and certain determinations made at the partner level. Accordingly, partnerships holding our Class A common stock and partners in such partnerships should consult their tax advisors regarding the U.S. federal income tax consequences of the purchase, ownership and disposition of shares of our Class A common stock.
INVESTORS ARE URGED TO CONSULT THEIR TAX ADVISORS WITH RESPECT TO THE TAX CONSIDERATIONS RELATED TO THE PURCHASE, OWNERSHIP AND DISPOSITION OF OUR CLASS A COMMON STOCK IN LIGHT OF THEIR PARTICULAR CIRCUMSTANCES, AS WELL AS ANY TAX CONSIDERATIONS RELATED TO THE U.S. FEDERAL ESTATE OR GIFT TAX LAWS OR UNDER THE APPLICABLE LAWS OF ANY STATE, LOCAL OR NON-U.S. TAXING AUTHORITY OR UNDER ANY APPLICABLE INCOME TAX TREATY.
Definition of a Non-U.S. Holder
For purposes of this discussion, a “Non-U.S. Holder” is any beneficial owner of our Class A common stock that is neither a “United States person” nor an entity or arrangement treated as a partnership for U.S. federal income tax purposes. A United States person is any person that, for U.S. federal income tax purposes, is or is treated as any of the following:
| • | an individual who is a citizen or resident of the U.S.; |
| • | a corporation, or other entity treated as a corporation for U.S. federal income tax purposes, created or organized under the laws of the U.S. any state thereof, or the District of Columbia; |
| • | an estate whose income is subject to U.S. federal income tax regardless of its source; or |
| • | a trust that (1) is subject to the primary supervision of a U.S. court and the control of all substantial decisions of the trust is by one or more “United States persons” (within the meaning of Section 7701(a)(30) of the Code), or (2) has a valid election in effect to be treated as a United States person for U.S. federal income tax purposes. |
Distributions
As described in the section entitled “Dividend Policy,” we do not anticipate declaring or paying dividends to holders of our Class A common stock in the foreseeable future. However, if we do make distributions of cash or property on our Class A common stock, such distributions generally will constitute dividends for U.S. federal income tax purposes to the extent paid from our current or accumulated earnings and profits, as determined under U.S. federal income tax principles. Amounts not treated as dividends for U.S. federal income tax purposes will constitute a nontaxable return of capital up to (and will reduce, but not below zero) a Non-U.S. Holder’s adjusted tax basis in its Class A common stock. Any excess amounts generally will be treated as capital gain and will be treated as described below under “—Sale or Other Taxable Disposition.”
Subject to the discussion below on effectively connected income, backup withholding, and the Foreign Account Tax Compliance Act, dividends paid to a Non-U.S. Holder of our Class A common stock will be subject to U.S. federal withholding tax at a rate of 30% of the gross amount of the dividends (or such lower rate specified by an applicable income tax treaty, provided the Non-U.S. Holder furnishes to us or the applicable withholding agent prior to the payment of dividends a valid IRS Form W-8BEN or W-8BEN-E (or other applicable or successor form) certifying under penalty of perjury that such Non-U.S. Holder is not a “United States person” as defined in the Code and qualifies for a reduced treaty rate). A Non-U.S. Holder that does not timely furnish the required documentation, but that qualifies for a reduced treaty rate, may obtain a refund of any excess amounts withheld by timely filing an appropriate claim for refund with the IRS. Non-U.S. Holders are urged to consult their tax advisors regarding their entitlement to benefits under any applicable income tax treaty.
If dividends paid to a Non-U.S. Holder are effectively connected with the Non-U.S. Holder’s conduct of a trade or business within the U.S. (and, if required by an applicable income tax treaty, the Non-U.S. Holder
165
Table of Contents
Index to Financial Statements
maintains a permanent establishment in the U.S. to which such dividends are attributable), the Non-U.S. Holder will be exempt from the U.S. federal withholding tax described above. To claim the exemption, the Non-U.S. Holder must furnish to the applicable withholding agent a valid IRS Form W-8ECI (or a successor form), certifying that the dividends are effectively connected with the Non-U.S. Holder’s conduct of a trade or business within the U.S.
Any such effectively connected dividends will generally be subject to U.S. federal income tax on a net income basis at the regular graduated rates generally applicable to U.S. persons. A Non-U.S. Holder that is a corporation also may be subject to a branch profits tax at a rate of 30% (or such lower rate specified by an applicable income tax treaty) on its effectively connected earnings and profits (as adjusted for certain items), which will include such effectively connected dividends. Non-U.S. Holders are urged to consult their tax advisors regarding any applicable tax treaties that may provide for different rules in their particular circumstances.
Sale or Other Taxable Disposition
Subject to the discussion below on backup withholding and the Foreign Account Tax Compliance Act, a Non-U.S. Holder generally will not be subject to U.S. federal income tax on any gain realized upon the sale or other taxable disposition of our Class A common stock unless:
| • | the gain is effectively connected with the Non-U.S. Holder’s conduct of a trade or business within the U.S. (and, if required by an applicable income tax treaty, the Non-U.S. Holder maintains a permanent establishment in the U.S. to which such gain is attributable); |
| • | the Non-U.S. Holder is a nonresident alien individual present in the U.S. for 183 days or more during the taxable year of the sale or other taxable disposition and certain other requirements are met; or |
| • | our Class A common stock constitutes a U.S. real property interest (a “USRPI”), by reason of our status as a U.S. real property holding corporation (a “USRPHC”), for U.S. federal income tax purposes at any time within the shorter of (1) the five-year period preceding the Non-U.S. Holder’s disposition of our Class A common stock and (2) the Non-U.S. Holder’s holding period for our Class A common stock. |
Gain described in the first bullet point above generally will be subject to U.S. federal income tax on a net basis at the regular graduated rates generally applicable to U.S. persons. A Non-U.S. Holder that is a corporation also may be subject to a branch profits tax at a rate of 30% (or such lower rate specified by an applicable income tax treaty) on its effectively connected earnings and profits (as adjusted for certain items), which will include such effectively connected gain.
A Non-U.S. Holder described in the second bullet point above will be subject to U.S. federal income tax at a rate of 30% (or such lower rate specified by an applicable income tax treaty) on any gain derived from the sale or other taxable disposition, which may generally be offset by U.S. source capital losses of the Non-U.S. Holder for that taxable year (even though the individual is not considered a resident of the U.S.), provided the Non-U.S. Holder has timely filed U.S. federal income tax returns with respect to such losses.
With respect to the third bullet point above, we believe we currently are not, and we do not anticipate that we will become a USRPHC. Because the determination of whether we are a USRPHC depends on the fair market value of our USRPIs relative to the fair market value of our non-USRPIs and our other business assets, there can be no assurance that we currently are not a USRPHC or that will not become one in the future. Even if we are or were to become a USRPHC, gain arising from the sale or other taxable disposition by a Non-U.S. Holder of our Class A common stock will not be subject to U.S. federal income tax if our Class A common stock is “regularly traded,” as defined by applicable Treasury Regulations, on an established securities market during the calendar year in which the sale or other taxable disposition occurs, and such Non-U.S. Holder owned, actually and
166
Table of Contents
Index to Financial Statements
constructively, 5% or less of our Class A common stock throughout the shorter of (1) the five-year period ending on the date of the sale or other taxable disposition or (2) the Non-U.S. Holder’s holding period. If we were to become a USRPHC and our Class A common stock were not considered to be “regularly traded” on an established securities market during the calendar year in which the relevant sale or other taxable disposition by a Non-U.S. Holder occurs, such Non-U.S. Holder (regardless of the percentage of stock owned) would be subject to U.S. federal income tax on a sale or other taxable disposition of our Class A common stock and a 15% withholding tax would apply to the gross proceeds from such disposition.
Non-U.S. Holders are urged to consult their tax advisors regarding potentially applicable income tax treaties that may provide for different rules in their particular circumstances.
Information Reporting and Backup Withholding
Payments of dividends on our Class A common stock generally will not be subject to backup withholding, provided the applicable withholding agent does not have actual knowledge or reason to know the Non-U.S. Holder is a United States person and the Non-U.S. Holder either certifies its non-U.S. status, generally by furnishing a valid IRS Form W-8BEN, W-8BEN-E or W-8ECI (or a successor form), or otherwise establishes an exemption. However, information returns are required to be filed with the IRS in connection with any dividends on our Class A common stock paid to the Non-U.S. Holder, regardless of whether any tax was actually withheld. In addition, proceeds of the sale or other taxable disposition of our Class A common stock within the U.S. or conducted through certain U.S.-related brokers generally will not be subject to backup withholding or information reporting if the applicable withholding agent receives the certification described above and does not have actual knowledge or reason to know that such Non-U.S. Holder is a United States person, or the Non-U.S. Holder otherwise establishes an exemption. If a Non-U.S. Holder does not provide the certification described above or the applicable withholding agent has actual knowledge or reason to know that such Non-U.S. Holder is a United States person, payments of dividends or of proceeds of the sale or other taxable disposition of our Class A common stock may be subject to backup withholding at a rate currently equal to 24% of the gross proceeds of such dividend, sale, or other taxable disposition. Proceeds of a sale or other disposition of our Class A common stock conducted through a non-U.S. office of a non-U.S. broker generally will not be subject to backup withholding or information reporting.
Copies of information returns that are filed with the IRS may also be made available under the provisions of an applicable treaty or agreement to the tax authorities of the country in which the Non-U.S. Holder resides, is established or is organized.
Backup withholding is not an additional tax. Any amounts withheld under the backup withholding rules may be allowed as a refund or a credit against a Non-U.S. Holder’s U.S. federal income tax liability, provided the Non-U.S. Holder timely files the appropriate claim with the IRS and furnishes any required information to the IRS.
Non-U.S. Holders are urged to consult their tax advisors regarding the application of information reporting and backup withholding rules with respect to an investment in our Class A common stock.
Foreign Account Tax Compliance Act
Subject to the discussion below regarding the Proposed Regulations (defined below), withholding taxes may be imposed under Sections 1471 to 1474 of the Code (such Sections commonly referred to as the “Foreign Account Tax Compliance Act,” or “FATCA”) on certain types of payments made to non-U.S. financial institutions and certain other non-U.S. entities. Specifically, a 30% withholding tax may be imposed on dividends on, or gross proceeds from the sale or other disposition of, our Class A common stock paid to a “foreign financial institution” or a “nonfinancial foreign entity” (each as defined in the Code) (including, in some cases, when such foreign financial institution or nonfinancial foreign entity is acting as an intermediary), unless (1) the foreign
167
Table of Contents
Index to Financial Statements
financial institution undertakes certain diligence and reporting obligations, (2) the nonfinancial foreign entity either certifies it does not have any “substantial United States owners” (as defined in the Code) or furnishes identifying information regarding each direct and indirect substantial United States owner, or (3) the foreign financial institution or nonfinancial foreign entity otherwise qualifies for an exemption from these rules. If the payee is a foreign financial institution and is subject to the diligence and reporting requirements in (1) above, it must enter into an agreement with the U.S. Department of the Treasury requiring, among other things, that it undertake to identify accounts held by certain “specified United States persons” or “United States-owned foreign entities” (each as defined in the Code), annually report certain information about such accounts, and withhold 30% on certain payments to noncompliant foreign financial institutions and certain other account holders. Foreign financial institutions or branches thereof located in jurisdictions that have an intergovernmental agreement with the U.S. governing FATCA may be subject to different rules.
Although FATCA withholding could apply to gross proceeds on the disposition of our Class A common stock, on December 13, 2018, the U.S. Department of the Treasury released proposed regulations (the “Proposed Regulations”) the preamble to which specifies that taxpayers may rely on them pending finalization. The Proposed Regulations eliminate FATCA withholding on the gross proceeds from a sale or other disposition of our Class A common stock. There can be no assurance that the Proposed Regulations will be finalized in their present form.
Prospective investors are urged to consult their tax advisors regarding the potential application of withholding under FATCA to their investment in our Class A common stock.
168
Table of Contents
Index to Financial Statements
We and the underwriters named below have entered into an underwriting agreement with respect to the shares of our Class A common stock being offered. Subject to certain conditions, each underwriter has severally agreed to purchase the number of shares of our Class A common stock indicated in the following table. Goldman Sachs & Co. LLC, J.P. Morgan Securities LLC and Morgan Stanley & Co. LLC are the representatives of the underwriters.
| Underwriters |
Number of Shares |
|||
| Goldman Sachs & Co. LLC |
||||
| J.P. Morgan Securities LLC |
||||
| Morgan Stanley & Co. LLC |
||||
| Credit Suisse Securities (USA) LLC |
||||
| RBC Capital Markets, LLC |
||||
| Wells Fargo Securities, LLC |
||||
| Oppenheimer & Co. Inc. |
||||
| Piper Sandler & Co. |
||||
| William Blair & Company, L.L.C. |
||||
| BNP Paribas Securities Corp. |
||||
| D.A. Davidson & Co. |
||||
| AmeriVet Securities, Inc. |
||||
| Loop Capital Markets LLC |
||||
| Penserra Securities LLC |
||||
| R. Seelaus & Co., LLC |
||||
| Siebert Williams Shank & Co., LLC |
||||
|
|
|
|||
| Total |
30,000,000 | |||
|
|
|
|||
The underwriters are committed to take and pay for all of the shares of our Class A common stock being offered, if any are taken, other than the shares covered by the option described below unless and until this option is exercised.
The underwriters have an option to buy up to an additional 4,500,000 shares of our Class A common stock from us to cover sales by the underwriters of a greater number of shares than the total number set forth in the table above. They may exercise that option for 30 days. If any shares are purchased pursuant to this option, the underwriters will severally purchase shares in approximately the same proportion as set forth in the table above.
The following table shows the per share and total underwriting discounts and commissions to be paid to the underwriters by us. Such amounts are shown assuming both no exercise and full exercise of the underwriters’ option to purchase 4,500,000 additional shares.
| No Exercise | Full Exercise | |||||||
| Per Share |
$ | $ | ||||||
| Total |
$ | $ | ||||||
Shares sold by the underwriters to the public will initially be offered at the initial public offering price set forth on the cover page of this prospectus. Any shares sold by the underwriters to securities dealers may be sold at a discount of up to $ per share from the initial public offering price. After the initial offering of the shares, the representatives may change the offering price and the other selling terms. The offering of the shares by the underwriters is subject to receipt and acceptance and subject to the underwriters’ right to reject any order in whole or in part.
169
Table of Contents
Index to Financial Statements
We estimate that the total expenses of the offering, excluding underwriting discounts and commissions, will be approximately $9.5 million. We have also agreed to reimburse the underwriters for up to $30,000 for certain of their out-of-pocket expenses incurred in connection with this offering. In addition, the underwriters have agreed to reimburse us for certain expenses in connection with the offering.
We and our executive officers, directors and holders of substantially all of our common stock have agreed with the underwriters, subject to certain exceptions, not to dispose of or hedge any of their common stock or securities convertible into or exchangeable for shares of common stock during the period from the date of this prospectus continuing through the date 180 days after the date of this prospectus, except with the prior written consent of the representatives.
Notwithstanding the foregoing, if (i) at least 120 days have elapsed from the date of this prospectus and (ii) the Lock-up Period is scheduled to expire during a Blackout Period or within five trading days prior to a Blackout Period, the Lock-up Period will end on the 10th trading date prior to commencement of the Blackout Period.
The restrictions set forth above applicable to our executive officers and directors and the holders of substantially all of our common stock are subject to specified exceptions, including the following:
(a) transfers (i) as a bona fide gift or gifts or as charitable contributions (provided that the donee or donees thereof agree to be bound in writing by the lock-up restrictions and provided further that any such transaction shall not involve a disposition for value), (ii) to any trust for the direct or indirect benefit of the lock-up party or the immediate family of the lock-up party (provided that the trustee of the trust agrees to be bound in writing by the lock-up restrictions, and provided further that any such transaction shall not involve a disposition for value), or (iii) to any beneficiary of or estate of a beneficiary of the lock-up party pursuant to a trust, will, other testamentary document or intestate succession or applicable laws of descent (provided that the beneficiary or the estate of a beneficiary, as applicable, agrees to be bound in writing by the lock-up restrictions, and provided further that any such transaction shall not involve a disposition for value);
(b) transfers to a partnership, limited liability company, corporation or other entity of which the lock-up party and the immediate family of the lock-up party are the legal and beneficial owner of all the outstanding equity securities or similar interests, provided that such partnership, limited liability company, corporation or other entity agrees to be bound in writing by the lock-up restrictions, and provided further that any such transaction shall not involve a disposition for value;
(c) transfers by operation of law, such as pursuant to a qualified domestic order of a court (including a divorce settlement, divorce decree or separation agreement) or regulatory agency, provided that the transferee or transferees agree to be bound in writing by the lock-up restrictions;
(d) transfers in transactions relating to shares of Class A common stock acquired in this offering (if the lock-up party is not one of our officers or directors) or in market transactions after the completion of this offering;
(e) transfers by (i) the exercise of stock options solely with cash granted pursuant to equity incentive plans described herein, and the receipt from us by the lock-up party of shares of our common stock upon such exercise, (ii) transfers of shares of our common stock to us upon the “net” or “cashless” exercise of stock options or other equity awards granted pursuant to equity incentive plans described herein, (iii) transfers of shares of common stock to us for the primary purpose of satisfying any tax or other governmental withholding obligation with respect to any award of equity-based compensation granted pursuant to equity incentive plans described herein or (iv) forfeitures of shares of common stock to us to satisfy tax withholding requirements of the lock-up party or the Company upon the vesting, during the Lock-up Period, of equity based awards granted under equity incentive plans or pursuant to other stock purchase arrangements, in each case described herein, provided that, in each case, the underlying shares shall continue to be subject to the restrictions on transfer set forth in the lock-up agreement, and provided further that no filings under Section 16 of the Exchange Act, or other public filing, report or announcement shall be voluntarily made during the Lock-up Period and, if required, any public report or filing under Section 16(a) of the Exchange Act shall indicate in the footnotes the nature of the transaction;
170
Table of Contents
Index to Financial Statements
(f) transfer pursuant to a bona fide third-party tender offer, merger, consolidation or other similar transaction made to all holders of our capital stock after the consummation of this offering and approved by our board of directors, the result of which is that any “person” (as defined in Section 13(d)(3) of the Exchange Act), or group of persons, other than the Company, CWAN Holdings, LLC or any of the Company’s stockholders and their affiliates as of immediately prior to such transaction, shall become, after the closing of the transaction, the beneficial owner of more than 50% of the total voting power of the voting stock of the Company, provided that, in the event that such tender offer, merger, consolidation or other such transaction is not completed, the lock-up party’s shares shall remain subject to the lock-up provisions;
(g) transfer to us in connection with the repurchase by us from the lock-up party of shares of common stock pursuant to a repurchase right arising upon the termination of the lock-up party’s employment with us, provided that such repurchase right is pursuant to contractual agreements with us, and provided further that no filings under Section 16 of the Exchange Act, or other public filing, report or announcement shall be voluntarily made during the Lock-Up Period and, if required, any public report or filing under Section 16(a) of the Exchange Act shall indicate in the footnotes thereto the nature of the transaction;
(h) if the lock-up party is a corporation, partnership, limited liability company or other business entity, (i) distributions of shares of common stock to limited partners, general partners, members, stockholders or holders of similar interests in the lock-up party (or, in each case, its nominee or custodian) or to any investment fund or other entity controlled or managed by or under common control or common investment management with the lock-up party or (ii) transfers of shares of common stock to affiliates or other entities controlled or managed by the lock-up party or any of its affiliates (other than the Company, CWAN Holdings, LLC or any of their subsidiaries), provided that each distributee and transferee agrees to be bound in writing by the lock-up restrictions, and provided further that any such transaction shall not involve a disposition for value; or
(i) the establishment of a trading plan pursuant to Rule 10b5-1 under the Exchange Act for the transfer of shares of common stock, provided that (i) such plan does not provide for the transfer of common stock during the Lock-Up Period and (ii) no public announcement or filing under the Exchange Act shall be made by or on behalf of the lock-up party or us regarding the establishment of such plan during the Lock-Up Period.
provided that, in the case of clause (a), (b), (c), (d) and (h) above, no filing under Section 16 of the Exchange Act reporting a reduction in beneficial ownership of shares of our Class A common stock, or other public filing, report or announcement shall be required or shall be voluntarily made in connection with such transfer or distribution during the Lock-Up Period (other than any required Schedule 13G (or 13G/A) or Form 13F (or 13F/A) filing or a filing on Form 5, which shall not be filed on or prior to the date that is 120 days after the date of this prospectus).
The lock-up restrictions described above do not apply to us with respect to certain transactions, including in connection with (1) the sale of our Class A common stock to the underwriters pursuant to the underwriting agreement; (2) the issuance of options to purchase our common stock or other equity incentive compensation, in each case pursuant to our equity plans described herein, or under equity plans or similar plans of companies acquired by us in accordance with clause (5) in effect on the date of acquisition; (3) the issuance of our common stock upon the exercise of options, the conversion or exchange of convertible or exchangeable securities, or the settlement of restricted stock units or other equity-based compensation outstanding on the date hereof, provided that such option, restricted stock unit or other security is disclosed herein; (4) our filing of any registration statement on Form S-8 with the SEC relating to the offering of securities pursuant to the terms of our equity plans described herein; and (5) the issuance of our common stock or securities convertible into our common stock in connection with an acquisition or business combination, provided that the aggregate number of shares of our common stock issued pursuant to this clause (5) during the Lock-Up Period shall not exceed 10% of the total number of shares of our common stock issued and outstanding immediately following the completion of this offering.
At our request, Morgan Stanley & Co. LLC, a participating underwriter, has reserved for sale, at the initial public offering price, up to 5% of the Class A common stock offered by this prospectus for sale to certain of our
171
Table of Contents
Index to Financial Statements
directors, officers and employees through the Reserved Share Program. If these persons purchase reserved shares of Class A common stock, it will reduce the number of shares of Class A common stock available for sale to the general public. Any reserved shares of Class A common stock that are not so purchased will be offered by the underwriters to the general public on the same terms as the other shares of Class A common stock offered by this prospectus. Any shares sold in the Reserved Share Program to a party who has entered into a lock-up agreement shall be subject to the provisions of such lock-up agreement.
Prior to the offering, there has been no public market for shares of our Class A common stock. The initial public offering price has been negotiated among us and the representatives. Among the factors to be considered in determining the initial public offering price of the shares, in addition to prevailing market conditions, will be our historical performance, estimates of our business potential and earnings prospects, an assessment of our management and the consideration of the above factors in relation to market valuation of companies in related businesses.
An application has been made to quote the shares of our Class A common stock on NYSE under the symbol “CWAN.”
In connection with the offering, the underwriters may purchase and sell shares of our Class A common stock in the open market. These transactions may include short sales, stabilizing transactions and purchases to cover positions created by short sales. Short sales involve the sale by the underwriters of a greater number of shares than they are required to purchase in the offering, and a short position represents the amount of such sales that have not been covered by subsequent purchases. A “covered short position” is a short position that is not greater than the amount of additional shares for which the underwriters’ option described above may be exercised. The underwriters may cover any covered short position by either exercising their option to purchase additional shares or purchasing shares in the open market. In determining the source of shares to cover the covered short position, the underwriters will consider, among other things, the price of shares available for purchase in the open market as compared to the price at which they may purchase additional shares pursuant to the option described above. “Naked” short sales are any short sales that create a short position greater than the amount of additional shares for which the option described above may be exercised. The underwriters must cover any such naked short position by purchasing shares in the open market. A naked short position is more likely to be created if the underwriters are concerned that there may be downward pressure on the price of the Class A common stock in the open market after pricing that could adversely affect investors who purchase in the offering. Stabilizing transactions consist of various bids for or purchases of Class A common stock made by the underwriters in the open market prior to the completion of the offering.
The underwriters may also impose a penalty bid. This occurs when a particular underwriter repays to the underwriters a portion of the underwriting discount received by it because the representatives have repurchased shares sold by or for the account of such underwriter in stabilizing or short covering transactions.
Purchases to cover a short position and stabilizing transactions, as well as other purchases by the underwriters for their own accounts, may have the effect of preventing or retarding a decline in the market price of shares of our Class A common stock, and together with the imposition of the penalty bid, may stabilize, maintain or otherwise affect the market price of the shares. As a result, the price of the shares may be higher than the price that otherwise might exist in the open market. The underwriters are not required to engage in these activities and may end any of these activities at any time. These transactions may be effected on NYSE, in the over-the-counter market or otherwise.
European Economic Area
In relation to each EEA Member State (each a “Relevant Member State”), no shares of our Class A common stock have been offered or will be offered pursuant to the offering to the public in that Relevant Member State prior to the publication of a prospectus in relation to the shares which has been approved by the competent authority in that Relevant Member State or, where appropriate, approved in another Relevant Member State and
172
Table of Contents
Index to Financial Statements
notified to the competent authority in that Relevant Member State, all in accordance with the Prospectus Regulation, except that the shares may be offered to the public in that Relevant Member State at any time:
| a) | to any legal entity which is a qualified investor as defined under Article 2 of the Prospectus Regulation; |
| b) | to fewer than 150 natural or legal persons (other than qualified investors as defined under Article 2 of the Prospectus Regulation) subject to obtaining the prior consent of the representatives for any such offer; or |
| c) | in any other circumstances falling within Article 1(4) of the Prospectus Regulation, |
provided that no such offer of the shares shall require the company or any underwriters to publish a prospectus pursuant to Article 3 of the Prospectus Regulation or supplement a prospectus pursuant to Article 23 of the Prospectus Regulation.
For the purposes of this provision, the expression an ‘offer to the public’ in relation to the shares in any Relevant Member State means the communication in any form and by any means of sufficient information on the terms of the offer and any shares to be offered so as to enable an investor to decide to purchase any shares, and the expression “Prospectus Regulation” means Regulation (EU) 2017/1129.
Each person in a Relevant Member State who receives any communication in respect of, or who acquires any shares under, the offering contemplated hereby will be deemed to have represented, warranted and agreed to and with each of the underwriters and their affiliates and the company that:
| a) | it is a qualified investor within the meaning of the Prospectus Regulation; and |
| b) | in the case of any shares acquired by it as a financial intermediary, as that term is used in Article 5 of the Prospectus Regulation, (i) the shares acquired by it in the offering have not been acquired on a non-discretionary basis on behalf of, nor have they been acquired with a view to their offer or resale to, persons in any Relevant Member State other than qualified investors, as that term is defined in the Prospectus Regulation, or have been acquired in other circumstances falling within the points (a) to (d) of Article 1(4) of the Prospectus Regulation and the prior consent of the representatives has been given to the offer or resale; or (ii) where the shares have been acquired by it on behalf of persons in any Relevant Member State other than qualified investors, the offer of those shares to it is not treated under the Prospectus Regulation as having been made to such persons. |
The company, the underwriters and their affiliates, and others will rely upon the truth and accuracy of the foregoing representation, acknowledgement and agreement. Notwithstanding the above, a person who is not a qualified investor and who has notified the representatives of such fact in writing may, with the prior consent of the representatives, be permitted to acquire shares in the offering.
United Kingdom
This prospectus and any other material in relation to the shares described herein is only being distributed to, and is only directed at, and any investment or investment activity to which this prospectus relates is available only to, and will be engaged in only with persons who are (i) persons having professional experience in matters relating to investments who fall within the definition of investment professionals in Article 19(5) of the FPO; or (ii) high net worth entities falling within Article 49(2)(a) to (d) of the FPO; (iii) outside the UK; or (iv) persons to whom an invitation or inducement to engage in investment activity (within the meaning of Section 21 of the FSMA) in connection with the issue or sale of any shares may otherwise lawfully be communicated or caused to be communicated, (all such persons together being referred to as “Relevant Persons”). The shares are only available in the UK to, and any invitation, offer or agreement to purchase or otherwise acquire the shares will be engaged in only with, the Relevant Persons. This prospectus and its contents are confidential and should not be distributed, published or reproduced (in whole or in part) or disclosed by recipients to any other person in the UK. Any person in the UK that is not a Relevant Person should not act or rely on this prospectus or any of its contents.
173
Table of Contents
Index to Financial Statements
No shares have been offered or will be offered pursuant to the offering to the public in the United Kingdom prior to the publication of a prospectus in relation to the Shares which has been approved by the Financial Conduct Authority, except that the shares may be offered to the public in the United Kingdom at any time:
| a) | to any legal entity which is a qualified investor as defined under Article 2 of the UK Prospectus Regulation; |
| b) | to fewer than 150 natural or legal persons (other than qualified investors as defined under Article 2 of the UK Prospectus Regulation), subject to obtaining the prior consent of the representatives for any such offer; or |
| c) | in any other circumstances falling within Section 86 of the FSMA. |
provided that no such offer of the shares shall require the company and/or any underwriters or any of their affiliates to publish a prospectus pursuant to Section 85 of the FSMA or supplement a prospectus pursuant to Article 23 of the UK Prospectus Regulation. For the purposes of this provision, the expression an “offer to the public” in relation to the shares in the United Kingdom means the communication in any form and by any means of sufficient information on the terms of the offer and any shares to be offered so as to enable an investor to decide to purchase or subscribe for any shares and the expression “UK Prospectus Regulation” means Regulation (EU) 2017/1129 as it forms part of domestic law by virtue of the European Union (Withdrawal) Act 2018.
Each person in the UK who acquires any shares in the offering or to whom any offer is made will be deemed to have represented, acknowledged and agreed to and with the company, the underwriters and their affiliates that it meets the criteria outlined in this section.
Canada
The shares may be sold in Canada only to purchasers purchasing, or deemed to be purchasing, as principal that are accredited investors, as defined in National Instrument 45-106 Prospectus Exemptions or subsection 73.3(1) of the Securities Act (Ontario), and are permitted clients, as defined in National Instrument 31-103 Registration Requirements, Exemptions, and Ongoing Registrant Obligations. Any resale of the shares must be made in accordance with an exemption form, or in a transaction not subject to, the prospectus requirements of applicable securities laws.
Securities legislation in certain provinces or territories of Canada may provide a purchaser with remedies for rescission or damages if this document (including any amendment thereto) contains a misrepresentation, provided that the remedies for rescission or damages are exercised by the purchaser within the time limit prescribed by the securities legislation of the purchaser’s province or territory. The purchaser should refer to any applicable provisions of the securities legislation of the purchaser’s province or territory of these rights or consult with a legal advisor.
Pursuant to section 3A.3 of National Instrument 33-105 Underwriting Conflicts (NI 33-105), the underwriters are not required to comply with the disclosure requirements of NI 33-105 regarding underwriter conflicts of interest in connection with this offering.
Hong Kong
The shares may not be offered or sold in Hong Kong by means of any document other than (i) in circumstances which do not constitute an offer to the public within the meaning of the Companies (Winding Up and Miscellaneous Provisions) Ordinance (Cap. 32 of the Laws of Hong Kong) (“Companies (Winding Up and Miscellaneous Provisions) Ordinance”) or which do not constitute an invitation to the public within the meaning of the Securities and Futures Ordinance (Cap. 571 of the Laws of Hong Kong) (“Securities and Futures Ordinance”), or (ii) to “professional investors” as defined in the Securities and Futures Ordinance and any rules
174
Table of Contents
Index to Financial Statements
made thereunder, or (iii) in other circumstances which do not result in the document being a “prospectus” as defined in the Companies (Winding Up and Miscellaneous Provisions) Ordinance, and no advertisement, invitation or document relating to the shares may be issued or may be in the possession of any person for the purpose of issue (in each case whether in Hong Kong or elsewhere), which is directed at, or the contents of which are likely to be accessed or read by, the public in Hong Kong (except if permitted to do so under the securities laws of Hong Kong) other than with respect to shares which are or are intended to be disposed of only to persons outside Hong Kong or only to “professional investors” in Hong Kong as defined in the Securities and Futures Ordinance and any rules made thereunder.
Singapore
This prospectus has not been registered as a prospectus with the Monetary Authority of Singapore. Accordingly, this prospectus and any other document or material in connection with the offer or sale, or invitation for subscription or purchase, of the shares may not be circulated or distributed, nor may the shares be offered or sold, or be made the subject of an invitation for subscription or purchase, whether directly or indirectly, to persons in Singapore other than (i) to an institutional investor (as defined under Section 4A of the Securities and Futures Act, Chapter 289 of Singapore (the “SFA”)) under Section 274 of the SFA, (ii) to a relevant person (as defined in Section 275(2) of the SFA) pursuant to Section 275(1) of the SFA, or any person pursuant to Section 275(1A) of the SFA, and in accordance with the conditions specified in Section 275 of the SFA or (iii) otherwise pursuant to, and in accordance with the conditions of, any other applicable provision of the SFA, in each case subject to conditions set forth in the SFA.
Where the shares are subscribed or purchased under Section 275 of the SFA by a relevant person which is a corporation (which is not an accredited investor (as defined in Section 4A of the SFA)) the sole business of which is to hold investments and the entire share capital of which is owned by one or more individuals, each of whom is an accredited investor, the securities (as defined in Section 239(1) of the SFA) of that corporation shall not be transferable for 6 months after that corporation has acquired the shares under Section 275 of the SFA except: (1) to an institutional investor under Section 274 of the SFA or to a relevant person (as defined in Section 275(2) of the SFA), (2) where such transfer arises from an offer in that corporation’s securities pursuant to Section 275(1A) of the SFA, (3) where no consideration is or will be given for the transfer, (4) where the transfer is by operation of law, (5) as specified in Section 276(7) of the SFA, or (6) as specified in Regulation 32 of the Securities and Futures (Offers of Investments) (Shares and Debentures) Regulations 2005 of Singapore (“Regulation 32”)
Where the shares are subscribed or purchased under Section 275 of the SFA by a relevant person which is a trust (where the trustee is not an accredited investor (as defined in Section 4A of the SFA)) whose sole purpose is to hold investments and each beneficiary of the trust is an accredited investor, the beneficiaries’ rights and interest (howsoever described) in that trust shall not be transferable for 6 months after that trust has acquired the shares under Section 275 of the SFA except: (1) to an institutional investor under Section 274 of the SFA or to a relevant person (as defined in Section 275(2) of the SFA), (2) where such transfer arises from an offer that is made on terms that such rights or interest are acquired at a consideration of not less than S$200,000 (or its equivalent in a foreign currency) for each transaction (whether such amount is to be paid for in cash or by exchange of securities or other assets), (3) where no consideration is or will be given for the transfer, (4) where the transfer is by operation of law, (5) as specified in Section 276(7) of the SFA, or (6) as specified in Regulation 32.
Japan
The shares have not been and will not be registered under the Financial Instruments and Exchange Act of Japan (Act No. 25 of 1948, as amended), or the FIEA. The shares may not be offered or sold, directly or indirectly, in Japan or to or for the benefit of any resident of Japan (including any person resident in Japan or any corporation or other entity organized under the laws of Japan) or to others for reoffering or resale, directly or
175
Table of Contents
Index to Financial Statements
indirectly, in Japan or to or for the benefit of any resident of Japan, except pursuant to an exemption from the registration requirements of the FIEA and otherwise in compliance with any relevant laws and regulations of Japan.
India
This document has not been and will not be filed as a prospectus or placement document / private placement offer cum application or letter of offer with any regulatory authority in India. Neither this document nor any other offering document or material relating to the offering has been circulated or distributed nor will it be circulated or distributed to the public or any members of the public in India. This document does not constitute an offer to the public in India to subscribe for or otherwise acquire the securities. This document is for the exclusive use of the persons to whom it is delivered and should not be circulated or distributed or forwarded to any other person.
We estimate that our share of the total expenses of the offering, excluding underwriting discounts and commissions, will be approximately $9.5 million.
We have agreed to indemnify the several underwriters against certain liabilities, including liabilities under the Securities Act.
The underwriters and their respective affiliates are full service financial institutions engaged in various activities, which may include sales and trading, commercial and investment banking, advisory, investment management, investment research, principal investment, hedging, market making, brokerage and other financial and non-financial activities and services. Certain of the underwriters and their respective affiliates have provided, and may in the future provide, a variety of these services to us and to persons and entities with relationships with us, for which they received or will receive customary fees and expenses. Certain of the underwriters and their respective affiliates are our clients. Additionally, Clearwater Analytics, LLC intends to enter into the New Credit Agreement in connection with this offering. We expect that affiliates of Goldman Sachs & Co. LLC, J.P. Morgan Securities LLC, Morgan Stanley & Co. LLC, Credit Suisse Securities (USA) LLC, RBC Capital Markets, LLC and Wells Fargo Securities, LLC will be lenders under the New Credit Agreement, and will receive customary fees and expenses for serving in such roles.
In the ordinary course of their various business activities, the underwriters and their respective affiliates, officers, directors and employees may purchase, sell or hold a broad array of investments and actively traded securities, derivatives, loans, commodities, currencies, credit default swaps and other financial instruments for their own account and for the accounts of their customers, and such investment and trading activities may involve or relate to our assets, securities and/or instruments (directly, as collateral securing other obligations or otherwise) and/or persons and entities with relationships with us. The underwriters and their respective affiliates may also communicate independent investment recommendations, market color or trading ideas and/or publish or express independent research views in respect of such assets, securities or instruments and may at any time hold, or recommend to clients that they should acquire, long and/or short positions in such assets, securities and instruments.
176
Table of Contents
Index to Financial Statements
The validity of the shares of Class A common stock offered hereby will be passed upon for us by Kirkland & Ellis LLP, New York, New York. Skadden, Arps, Slate, Meagher & Flom LLP, New York, New York, is acting as counsel to the underwriters.
The consolidated financial statements of CWAN Holdings, LLC and its subsidiaries as of December 31, 2020 and 2019, and for each of the years then ended have been included in this prospectus and in the registration statement in reliance on the report of KPMG LLP, independent registered public accounting firm, included elsewhere herein and in the registration statement, and upon the authority of said firm as experts in auditing and accounting.
The financial statements of Clearwater Analytics Holdings, Inc. as of May 18, 2021 have been included in this prospectus and in the registration statement in reliance on the report of KPMG LLP, independent registered public accounting firm, included elsewhere herein and in the registration statement, and upon the authority of said firm as experts in auditing and accounting.
WHERE YOU CAN FIND ADDITIONAL INFORMATION
We have filed with the SEC a registration statement on Form S-1 under the Securities Act with respect to the shares of our Class A common stock offered by this prospectus. This prospectus, which constitutes a part of the registration statement, does not contain all of the information set forth in the registration statement, some items of which are contained in exhibits to the registration statement as permitted by the rules and regulations of the SEC. For further information with respect to us and our Class A common stock, we refer you to the registration statement, including the exhibits filed as a part of the registration statement. Statements contained in this prospectus concerning the contents of any contract or other document referred to in or filed as an exhibit to this registration statement are not necessarily complete. If a contract or document has been filed as an exhibit to the registration statement, please see the copy of the contract or document that has been filed. Each statement in this prospectus relating to a contract or document filed as an exhibit is qualified in all respects by the filed exhibit.
The SEC maintains an Internet website that contains reports, proxy statements and other information about issuers, like us, that file electronically with the SEC. The address of that website is www.sec.gov. As a result of this offering, we will become subject to the information and reporting requirements of the Exchange Act and, in accordance with this law, will file periodic reports, proxy statements and other information with the SEC. These periodic reports, proxy statements and other information will be available at website of the SEC referred to above. We also maintain a website at https://clearwater-analytics.com. Upon completion of this offering, you may access these materials free of charge as soon as reasonably practicable after they are electronically filed with, or furnished to, the SEC. Information contained on these websites is not a part of this prospectus, and the inclusion of these website addresses in this prospectus is an inactive textual reference only.
177
Table of Contents
Index to Financial Statements
INDEX TO CONSOLIDATED FINANCIAL STATEMENTS
| Audited Financial Statements of Clearwater Analytics Holdings, Inc. | ||||
| F-2 | ||||
| Balance Sheet as of June 30, 2021 (unaudited) and May 18, 2021 |
F-3 | |||
| F-4 | ||||
| Audited Consolidated Financial Statements of CWAN Holdings, LLC and Subsidiaries | ||||
| F-5 | ||||
| Consolidated Balance Sheets as of June 30, 2021 (unaudited) and December 31, 2020 and 2019 |
F-6 | |||
| F-7 | ||||
| F-8 | ||||
| F-9 | ||||
| F-11 | ||||
| F-12 | ||||
F-1
Table of Contents
Index to Financial Statements
Report of Independent Registered Public Accounting Firm
To the Stockholder and Board of Directors
Clearwater Analytics Holdings, Inc.:
Opinion on the Financial Statements
We have audited the accompanying balance sheet of Clearwater Analytics Holdings, Inc. (the Company) as of May 18, 2021, and the related notes (collectively, the financial statements). In our opinion, the financial statements present fairly, in all material respects, the financial position of the Company as of May 18, 2021, in conformity with U.S. generally accepted accounting principles.
Basis for Opinion
These financial statements are the responsibility of the Company’s management. Our responsibility is to express an opinion on these financial statements based on our audit. We are a public accounting firm registered with the Public Company Accounting Oversight Board (United States) (PCAOB) and are required to be independent with respect to the Company in accordance with the U.S. federal securities laws and the applicable rules and regulations of the Securities and Exchange Commission and the PCAOB.
We conducted our audit in accordance with the standards of the PCAOB. Those standards require that we plan and perform the audit to obtain reasonable assurance about whether the financial statements are free of material misstatement, whether due to error or fraud. Our audit included performing procedures to assess the risks of material misstatement of the financial statements, whether due to error or fraud, and performing procedures that respond to those risks. Such procedures included examining, on a test basis, evidence regarding the amounts and disclosures in the financial statements. Our audit also included evaluating the accounting principles used and significant estimates made by management, as well as evaluating the overall presentation of the financial statements. We believe that our audit provides a reasonable basis for our opinion.
/s/ KPMG LLP
We have served as the Company’s auditor since 2021.
Boise, Idaho
June 10, 2021
F-2
Table of Contents
Index to Financial Statements
CLEARWATER ANALYTICS HOLDINGS, INC.
Balance Sheet
($ in dollars)
| June 30, 2021 | May 18, 2021 | |||||||
| ASSETS |
(unaudited) |
|||||||
| Cash |
$ | 10 | $ | — | ||||
| Related party receivable |
— | 10 | ||||||
|
|
|
|
|
|||||
| Total assets |
$ | 10 | $ | 10 | ||||
|
|
|
|
|
|||||
| STOCKHOLDER’S EQUITY |
||||||||
| Common Stock, par value $0.01 per share, 1,000 shares authorized, 1,000 issued and outstanding |
$ | 10 | $ | 10 | ||||
|
|
|
|
|
|||||
| Total Stockholder’s Equity |
$ | 10 | $ | 10 | ||||
|
|
|
|
|
|||||
The accompanying notes are an integral part of this balance sheet.
F-3
Table of Contents
Index to Financial Statements
Clearwater Analytics Holdings, Inc. (the “Corporation”) was organized as a Delaware corporation on May 18, 2021. The Corporation’s fiscal year end is December 31. Pursuant to a planned reorganization into a holding corporation structure, the Corporation will hold equity ownership of CWAN Holdings, LLC.
The Corporation will be the managing member of CWAN Holdings, LLC and will operate and control all of the businesses and affairs of CWAN Holdings, LLC and, through CWAN Holdings, LLC and its subsidiaries, continue to conduct the business now conducted by these entities.
2. Summary of Significant Accounting Policies
Basis of Accounting
The Balance Sheet has been prepared in accordance with generally accepted accounting principles in the United States (“U.S. GAAP”). Separate statements of operations, comprehensive income, changes in stockholder’s equity and cash flows have not been presented in the financial statements because there have been no activities in this entity or because the single transaction is fully disclosed below.
Unaudited Interim Financial Information
The accompanying interim balance sheet as of June 30, 2021, and the related footnotes are unaudited. The unaudited interim balance sheet has been prepared in accordance with U.S. GAAP. In management’s opinion, the unaudited balance sheet includes all the adjustments necessary to state fairly the Company’s position as of June 30, 2021. Separate interim statements of operations, comprehensive income, changes in stockholder’s equity and cash flows have not been presented in the financial statements because there have been no activities in this entity or because the single transaction is fully disclosed below.
3. Stockholder’s Equity
The Corporation is authorized to issue 1,000 shares of Common Stock, par value $0.01 per share (“Common Stock”). Under the corporation’s certificate of incorporation in effect as of May 18, 2021, all shares of Common Stock are identical. In exchange for a related party receivable of $10, the Corporation has issued 1,000 shares of Common Stock, all of which were held by CWAN Holdings, LLC as of May 18, 2021.
4. Subsequent Events
The Company has evaluated subsequent events through June 10, 2021, the date the financial statements were available to be issued.
The related party receivable was collected on June 9, 2021.
Subsequent Events (unaudited)
In preparing the unaudited balance sheet and the related footnotes as of June 30, 2021, the Company has evaluated subsequent events through August 13, 2021, which is the date these unaudited financial statements were available for issuance.
F-4
Table of Contents
Index to Financial Statements
Report of Independent Registered Public Accounting Firm
To the Members and Board of Directors
CWAN Holdings, LLC:
Opinion on the Consolidated Financial Statements
We have audited the accompanying consolidated balance sheets of CWAN Holdings, LLC (formerly known as Carbon Analytics Holdings, LLC) and subsidiaries (the Company) as of December 31, 2020 and 2019, the related consolidated statements of operations, comprehensive income (loss), members’ deficit, and cash flows for each of the years in the two-year period ended December 31, 2020, and the related notes (collectively, the consolidated financial statements). In our opinion, the consolidated financial statements present fairly, in all material respects, the financial position of the Company as of December 31, 2020 and 2019, and the results of its operations and its cash flows for each of the years in the two-year period ended December 31, 2020, in conformity with U.S. generally accepted accounting principles.
Basis for Opinion
These consolidated financial statements are the responsibility of the Company’s management. Our responsibility is to express an opinion on these consolidated financial statements based on our audits. We are a public accounting firm registered with the Public Company Accounting Oversight Board (United States) (PCAOB) and are required to be independent with respect to the Company in accordance with the U.S. federal securities laws and the applicable rules and regulations of the Securities and Exchange Commission and the PCAOB.
We conducted our audits in accordance with the standards of the PCAOB. Those standards require that we plan and perform the audit to obtain reasonable assurance about whether the consolidated financial statements are free of material misstatement, whether due to error or fraud. Our audits included performing procedures to assess the risks of material misstatement of the consolidated financial statements, whether due to error or fraud, and performing procedures that respond to those risks. Such procedures included examining, on a test basis, evidence regarding the amounts and disclosures in the consolidated financial statements. Our audits also included evaluating the accounting principles used and significant estimates made by management, as well as evaluating the overall presentation of the consolidated financial statements. We believe that our audits provide a reasonable basis for our opinion.
/s/ KPMG LLP
We have served as the Company’s auditor since 2019.
Boise, Idaho
June 10, 2021, except for the third and fourth paragraphs of Note 14, as to which the date is August 13, 2021, and the eighth paragraph of Note 14, as to which the date is September 14, 2021
F-5
Table of Contents
Index to Financial Statements
CWAN HOLDINGS, LLC AND SUBSIDIARIES
Consolidated Balance Sheets
(In thousands)
| June 30, | December 31, | |||||||||||
| 2021 | 2020 | 2019 | ||||||||||
| (unaudited) | ||||||||||||
| ASSETS |
||||||||||||
| Current assets: |
||||||||||||
| Cash and cash equivalents |
$ | 41,031 | $ | 61,088 | $ | 20,254 | ||||||
| Accounts receivable, net |
45,075 | 32,882 | 26,557 | |||||||||
| Prepaid expenses and other current assets |
14,233 | 7,550 | 6,002 | |||||||||
|
|
|
|
|
|
|
|||||||
| Total current assets |
100,339 | 101,520 | 52,813 | |||||||||
| Property and equipment, net |
9,330 | 8,849 | 7,094 | |||||||||
| Deferred contract costs, non-current |
4,021 | 4,580 | 3,799 | |||||||||
| Debt issuance costs – line of credit |
403 | 420 | 262 | |||||||||
| Other non-current assets |
6,405 | 190 | — | |||||||||
|
|
|
|
|
|
|
|||||||
| Total assets |
$ | 120,498 | $ | 115,559 | $ | 63,968 | ||||||
|
|
|
|
|
|
|
|||||||
| LIABILITIES AND MEMBERS’ DEFICIT |
||||||||||||
| Current liabilities: |
||||||||||||
| Accounts payable |
$ | 601 | $ | 1,340 | $ | 1,140 | ||||||
| Accrued expenses and other current liabilities |
24,677 | 33,789 | 16,620 | |||||||||
| Notes payable, current portion |
3,077 | 3,077 | 2,800 | |||||||||
|
|
|
|
|
|
|
|||||||
| Total current liabilities |
28,355 | 38,206 | 20,560 | |||||||||
| Notes payable, less current maturities and unamortized debt issuance costs of $9,327 and $6,229 and $8,370 (unaudited) as of December 31, 2020 and 2019, and June 30, 2021, respectively |
421,245 | 421,827 | 244,071 | |||||||||
| Other long-term liabilities |
136 | 134 | 59 | |||||||||
|
|
|
|
|
|
|
|||||||
| Total liabilities |
449,736 | 460,167 | 264,690 | |||||||||
|
|
|
|
|
|
|
|||||||
| Commitments and contingencies (Note 8) |
||||||||||||
| Total members’ deficit |
(329,238 | ) | (344,608 | ) | (200,722 | ) | ||||||
|
|
|
|
|
|
|
|||||||
| TOTAL LIABILITIES AND MEMBERS’ DEFICIT |
$ | 120,498 | $ | 115,559 | $ | 63,968 | ||||||
|
|
|
|
|
|
|
|||||||
The accompanying notes are an integral part of these consolidated financial statements.
F-6
Table of Contents
Index to Financial Statements
CWAN HOLDINGS, LLC AND SUBSIDIARIES
Consolidated Statements of Operations
(In thousands)
| Six Months Ended June, 30, | Years Ended December 31, | |||||||||||||||
| 2021 | 2020 | 2020 | 2019 | |||||||||||||
| (unaudited) | ||||||||||||||||
| Revenue |
$ | 117,770 | $ | 95,109 | $ | 203,222 | $ | 168,001 | ||||||||
| Cost of revenue |
29,898 | 26,891 | 53,263 | 47,145 | ||||||||||||
|
|
|
|
|
|
|
|
|
|||||||||
| Gross profit |
87,872 | 68,218 | 149,959 | 120,856 | ||||||||||||
| Operating expenses: |
||||||||||||||||
| Research and development |
32,576 | 24,069 | 55,262 | 39,275 | ||||||||||||
| Sales and marketing |
16,025 | 8,600 | 22,243 | 19,082 | ||||||||||||
| General and administrative |
18,727 | 10,974 | 43,874 | 36,802 | ||||||||||||
| Recapitalization compensation expenses |
— | — | 48,998 | — | ||||||||||||
|
|
|
|
|
|
|
|
|
|||||||||
| Total operating expenses |
67,328 | 43,643 | 170,377 | 95,159 | ||||||||||||
|
|
|
|
|
|
|
|
|
|||||||||
| Income (loss) from operations |
20,544 | 24,575 | (20,418 | ) | 25,697 | |||||||||||
| Interest and other expense, net |
(17,024 | ) | (10,730 | ) | (22,910 | ) | (17,892 | ) | ||||||||
|
|
|
|
|
|
|
|
|
|||||||||
| Income (loss) before income taxes |
3,520 | 13,845 | (43,328 | ) | 7,805 | |||||||||||
| Income taxes |
320 | 210 | 902 | 73 | ||||||||||||
|
|
|
|
|
|
|
|
|
|||||||||
| Net income (loss) |
$ | 3,200 | $ | 13,635 | $ | (44,230 | ) | $ | 7,732 | |||||||
|
|
|
|
|
|
|
|
|
|||||||||
The accompanying notes are an integral part of these consolidated financial statements.
F-7
Table of Contents
Index to Financial Statements
CWAN HOLDINGS, LLC AND SUBSIDIARIES
Consolidated Statements of Comprehensive Income (Loss)
(In thousands)
| Six Months Ended June 30, | Years Ended December 31, | |||||||||||||||
| 2021 | 2020 | 2020 | 2019 | |||||||||||||
| (unaudited) | ||||||||||||||||
| Net income (loss) |
$ | 3,200 | $ | 13,635 | $ | (44,230 | ) | $ | 7,732 | |||||||
| Other comprehensive income (loss), net of taxes: |
||||||||||||||||
| Foreign currency translation adjustment |
16 | (149 | ) | 71 | 85 | |||||||||||
|
|
|
|
|
|
|
|
|
|||||||||
| Comprehensive income (loss) |
$ | 3,216 | $ | 13,486 | $ | (44,159 | ) | $ | 7,817 | |||||||
|
|
|
|
|
|
|
|
|
|||||||||
The accompanying notes are an integral part of these consolidated financial statements.
F-8
Table of Contents
Index to Financial Statements
CWAN HOLDINGS, LLC AND SUBSIDIARIES
Consolidated Statements of Members’ Deficit
(In thousands, except share data)
| Class A and Class B Units |
Additional Paid-In Capital |
Accumulated Other Comprehensive Income (Loss) |
Accumulated Deficit |
Members’ Deficit | ||||||||||||||||
| Balance as of December 31, 2018 |
165,628,092 | $ | (141,179 | ) | $ | (98 | ) | $ | (209,308 | ) | $ | (350,585 | ) | |||||||
| Issuance of common units |
31,136,364 | 137,000 | — | — | 137,000 | |||||||||||||||
| Repurchase of common units |
(718,622 | ) | (3,780 | ) | — | — | (3,780 | ) | ||||||||||||
| Exercise of options to purchase common units |
648,333 | 2,593 | — | — | 2,593 | |||||||||||||||
| Equity-based compensation |
— | 6,233 | — | — | 6,233 | |||||||||||||||
| Foreign currency translation adjustment |
— | — | 85 | — | 85 | |||||||||||||||
| Net income |
— | — | — | 7,732 | 7,732 | |||||||||||||||
|
|
|
|
|
|
|
|
|
|
|
|||||||||||
| Balance as of December 31, 2019 |
196,694,167 | $ | 867 | $ | (13 | ) | $ | (201,576 | ) | $ | (200,722 | ) | ||||||||
| Repurchase of common units |
(102,736 | ) | (567 | ) | — | — | (567 | ) | ||||||||||||
| Exercise of options to purchase common units |
4,503,388 | 424 | — | — | 424 | |||||||||||||||
| Dividend to unitholders |
— | (163,258 | ) | — | — | (163,258 | ) | |||||||||||||
| Distributions to unitholders for taxes |
— | (9,926 | ) | — | — | (9,926 | ) | |||||||||||||
| Contributions from selling unitholders |
— | 48,998 | — | — | 48,998 | |||||||||||||||
| Equity-based compensation |
— | 24,602 | — | — | 24,602 | |||||||||||||||
| Foreign currency translation adjustment |
— | — | 71 | — | 71 | |||||||||||||||
| Net loss |
— | — | — | (44,230 | ) | (44,230 | ) | |||||||||||||
|
|
|
|
|
|
|
|
|
|
|
|||||||||||
| Balance as of December 31, 2020 |
201,094,819 | $ | (98,860 | ) | $ | 58 | $ | (245,806 | ) | $ | (344,608 | ) | ||||||||
|
|
|
|
|
|
|
|
|
|
|
|||||||||||
F-9
Table of Contents
Index to Financial Statements
| Six Months Ended June 30, 2020 | ||||||||||||||||||||
| Class A and B Units |
Additional Paid-In Capital |
Accumulated Other Comprehensive Income (Loss) |
Accumulated Deficit |
Members' Deficit |
||||||||||||||||
| Balance as of December 31, 2019 |
196,694,167 | $ | 867 | $ | (13 | ) | $ | (201,576 | ) | $ | (200,722 | ) | ||||||||
| Equity-based compensation (unaudited) |
— | 4,988 | — | — | 4,988 | |||||||||||||||
| Foreign currency translation adjustment (unaudited) |
— | — | (149 | ) | — | (149 | ) | |||||||||||||
| Net income (unaudited) |
— | — | — | 13,635 | 13,635 | |||||||||||||||
|
|
|
|
|
|
|
|
|
|
|
|||||||||||
| Balance as of June 30, 2020 (unaudited) |
196,694,167 | $ | 5,855 | $ | (162 | ) | $ | (187,941 | ) | $ | (182,248 | ) | ||||||||
|
|
|
|
|
|
|
|
|
|
|
|||||||||||
| Six Months Ended June 30, 2021 | ||||||||||||||||||||
| Class A and B Units |
Additional Paid-In Capital |
Accumulated Other Comprehensive Income (Loss) |
Accumulated Deficit |
Members' Deficit |
||||||||||||||||
| Balance as of December 31, 2020 |
201,094,819 | $ | (98,860 | ) | $ | 58 | $ | (245,806 | ) | $ | (344,608 | ) | ||||||||
| Issuance of common units (unaudited) |
125,807 | 1,560 | — | — | 1,560 | |||||||||||||||
| Repurchase of common units (unaudited) |
(50,464 | ) | (626 | ) | — | — | (626 | ) | ||||||||||||
| Exercise of options to purchase common units (unaudited) |
196,059 | 251 | — | — | 251 | |||||||||||||||
| Options withheld for minimum tax obligations for net unit settlement (unaudited) |
(47,364 | ) | (587 | ) | — | — | (587 | ) | ||||||||||||
| Equity-based compensation (unaudited) |
— | 11,556 | — | — | 11,556 | |||||||||||||||
| Foreign currency translation adjustment (unaudited) |
— | — | 16 | — | 16 | |||||||||||||||
| Net income (unaudited) |
— | — | — | 3,200 | 3,200 | |||||||||||||||
|
|
|
|
|
|
|
|
|
|
|
|||||||||||
| Balance as of June 30, 2021 (unaudited) |
201,318,857 | $ | (86,706 | ) | $ | 74 | $ | (242,606 | ) | $ | (329,238 | ) | ||||||||
|
|
|
|
|
|
|
|
|
|
|
|||||||||||
The accompanying notes are an integral part of these consolidated financial statements.
F-10
Table of Contents
Index to Financial Statements
CWAN HOLDINGS, LLC AND SUBSIDIARIES
Consolidated Statements of Cash Flows
(In thousands)
| Six Months Ended June 30, | Years Ended December 31, | |||||||||||||||
| 2021 | 2020 | 2020 | 2019 | |||||||||||||
| (unaudited) | ||||||||||||||||
| OPERATING ACTIVITIES |
||||||||||||||||
| Net income (loss) |
$ | 3,200 | $ | 13,635 | $ | (44,230 | ) | $ | 7,732 | |||||||
| Adjustments to reconcile net income (loss) to net cash used in operating activities: |
||||||||||||||||
| Depreciation |
1,412 | 1,047 | 2,271 | 2,019 | ||||||||||||
| Equity-based compensation |
11,556 | 4,988 | 24,602 | 6,233 | ||||||||||||
| Amortization of deferred contract acquisition costs |
1,511 | 998 | 2,340 | 1,369 | ||||||||||||
| Amortization of debt issuance costs, included in interest expense |
974 | 1,347 | 2,506 | 1,698 | ||||||||||||
| Changes in operating assets and liabilities: |
||||||||||||||||
| Accounts receivable, net |
(12,193 | ) | (2,802 | ) | (6,325 | ) | (5,660 | ) | ||||||||
| Prepaid expenses and other assets |
(11,433 | ) | (897 | ) | (767 | ) | 589 | |||||||||
| Accounts payable |
50 | (574 | ) | 67 | 166 | |||||||||||
| Accrued expenses and other liabilities |
(4,247 | ) | (2,472 | ) | 9,746 | 4,175 | ||||||||||
| Deferred commissions |
(1,245 | ) | (663 | ) | (4,092 | ) | (3,495 | ) | ||||||||
| Accrued sales tax liability |
(5,379 | ) | — | 9,102 | 692 | |||||||||||
| Deferred revenue |
(603 | ) | 2 | (5 | ) | 428 | ||||||||||
| Accrued interest on debt |
45 | (3,070 | ) | (1,776 | ) | 4,025 | ||||||||||
| Other long-term liabilities |
— | (4 | ) | 75 | — | |||||||||||
| Accrued legal matters |
— | — | — | (250,000 | ) | |||||||||||
|
|
|
|
|
|
|
|
|
|||||||||
| Net cash provided by (used in) operating activities |
(16,352 | ) | 11,535 | (6,486 | ) | (230,029 | ) | |||||||||
|
|
|
|
|
|
|
|
|
|||||||||
| INVESTING ACTIVITIES |
||||||||||||||||
| Purchases of property and equipment |
(2,231 | ) | (2,386 | ) | (3,806 | ) | (3,372 | ) | ||||||||
|
|
|
|
|
|
|
|
|
|||||||||
| Net cash used in investing activities |
(2,231 | ) | (2,386 | ) | (3,806 | ) | (3,372 | ) | ||||||||
|
|
|
|
|
|
|
|
|
|||||||||
| FINANCING ACTIVITIES |
||||||||||||||||
| Contributions from selling unitholders |
— | — | 48,998 | — | ||||||||||||
| Proceeds from issuance of common units |
1,560 | — | — | 137,000 | ||||||||||||
| Proceeds from exercise of options |
251 | — | 424 | 2,593 | ||||||||||||
| Minimum tax withholding paid on behalf of employees for net unit settlement |
(587 | ) | — | — | — | |||||||||||
| Dividend distributed to unitholders |
— | — | (163,258 | ) | — | |||||||||||
| Distributions to unitholders for taxes |
— | — | (9,926 | ) | — | |||||||||||
| Repurchase of common units |
(626 | ) | — | (567 | ) | (3,780 | ) | |||||||||
| Proceeds from borrowings |
— | — | 202,688 | 105,000 | ||||||||||||
| Repayment of borrowings |
(1,539 | ) | (525 | ) | (21,557 | ) | (463 | ) | ||||||||
| Payment of debt issuance costs |
|
— |
|
|
— |
|
(5,761 | ) | (2,635 | ) | ||||||
| Payment of costs associated with offering |
(400 | ) | — | — | — | |||||||||||
|
|
|
|
|
|
|
|
|
|||||||||
| Net cash provided by (used in) financing activities |
|
(1,341 |
) |
|
(525 |
) |
51,041 | 237,715 | ||||||||
|
|
|
|
|
|
|
|
|
|||||||||
| Effect of exchange rate changes on cash and cash equivalents |
|
(133 |
) |
|
(158 |
) |
85 | 87 | ||||||||
| Net increase (decrease) in cash and cash equivalent during the period |
(20,057 | ) | 8,466 | 40,834 | 4,401 | |||||||||||
| Cash and cash equivalents, beginning of the year |
61,088 | 20,254 | 20,254 | 15,853 | ||||||||||||
|
|
|
|
|
|
|
|
|
|||||||||
| Cash and cash equivalents, end of the year |
$ | 41,031 | $ | 28,720 | $ | 61,088 | $ | 20,254 | ||||||||
|
|
|
|
|
|
|
|
|
|||||||||
| SUPPLEMENTAL DISCLOSURE OF CASH FLOW INFORMATION |
||||||||||||||||
| Cash paid for interest |
$ | 15,769 | $ | 12,389 | $ | 22,182 | $ | 12,252 | ||||||||
| Cash paid for income taxes |
$ | 57 | $ | 65 | $ | 429 | $ | 68 | ||||||||
| NON-CASH INVESTING AND FINANCING ACTIVITIES |
||||||||||||||||
| Purchases of property and equipment included in accounts payable and accrued expense |
$ | — | $ | — | $ | 489 | $ | 255 | ||||||||
| Direct costs incurred with the offering included in other assets and accrued expenses |
$ | 1,172 | — | — | — | |||||||||||
The accompanying notes are an integral part of these consolidated financial statements.
F-11
Table of Contents
Index to Financial Statements
CWAN HOLDINGS, LLC AND SUBSIDIARIES
Notes to Consolidated Financial Statements
1. Description of Business and Basis of Presentation
Nature of Business
CWAN Holdings, LLC (FKA Carbon Analytics Holdings, LLC and, together with its subsidiaries, the “Company”) provides a Software as a Service (“SaaS”) solution for investment data aggregation, accounting, analytics, and reporting services to insurers, investment managers, corporations, institutional investors and government entities. The SaaS is provisioned to customers via a web-based user interface (“UI”).
The Company’s headquarters are located in Boise, Idaho, with operations in the United States (“U.S.”), United Kingdom (“UK”), India and Singapore.
Clearwater Analytics LLC began operations in 2004. On September 1, 2016, the Company facilitated the merger of Carbon Analytics Merger Sub LLC into Clearwater Analytics LLC (the “Merger”), both wholly owned subsidiaries of the Company. As a result of the Merger and related transactions, investment funds associated with Welsh, Carson, Anderson & Stowe (“WCAS”) acquired a controlling interest in the Company through WCAS XII Carbon Analytics Acquisition L.P. (the “acquirer”).
Liquidity
In 2020, the Company incurred a loss from operations and negative cash flows primarily as a result of the recapitalization transactions described in Note 11 to these financial statements (the “Recap”).
In 2019, the Company incurred negative operating cash flows from legal fees and settlement of outstanding legal matters. The Company secured additional borrowing capacity through the third and fourth amendment to its credit facility and raised additional capital from existing investors to fund the legal matter and related fees. There are no longer any contingencies related to this legal matter.
Management anticipates that the Company’s available cash, future operating cash flow and revolving credit facility will be sufficient to meet all operating obligations for at least twelve months from the date of issuance.
Basis of Presentation
The consolidated financial statements and accompanying notes have been prepared in accordance with U.S. generally accepted accounting principles (“U.S. GAAP”). The consolidated financial statements include the accounts of the Company and its wholly owned subsidiaries. All intercompany balances and transactions have been eliminated through consolidation.
Unaudited Interim Consolidated Financial Information
The accompanying interim consolidated balance sheet as of June 30, 2021 and the consolidated statements of operations, comprehensive income (loss), members’ deficit, and cash flows for the six month periods ended June 30, 2021 and 2020, and the related footnotes, are unaudited. These unaudited interim consolidated financial statements have been prepared in accordance with U.S. GAAP. In management’s opinion, the unaudited interim consolidated financial statements include all the adjustments necessary to state fairly the Company’s financial position as of June 30, 2021 and its results of operations and cash flows for the six month periods ended June 30, 2021 and 2020. The financial data and other information disclosed in these notes to the consolidated financial statements related to these six month periods are unaudited. The results for the six month period ended June 30, 2021 is not necessarily indicative of the results expected for the full year ending December 31, 2021, or any future period.
F-12
Table of Contents
Index to Financial Statements
CWAN HOLDINGS, LLC AND SUBSIDIARIES
Notes to Consolidated Financial Statements
Use of Estimates
The preparation of financial statements in conformity with U.S. GAAP requires management to make certain estimates, judgments and assumptions that affect the reported amounts of assets and liabilities and the related disclosures at the date of the consolidated financial statements, as well as the reported amounts of revenue and expenses during the periods presented. Actual results could differ materially from those estimates.
Items subject to estimates and assumptions include the useful lives and recoverability of long-lived assets, the average period of benefit associated with deferred contract costs, allowances for doubtful accounts, sales reserves, accruals for sales tax liabilities, and the fair value of equity awards. The Company bases its estimates on historical experience and on various other assumptions that are believed to be reasonable, the result of which forms the basis for making judgments about the carrying values of assets and liabilities. To the extent there are material differences between these estimates, judgments, or assumptions and actual results, the Company’s consolidated financial statements will be affected.
2. Significant Accounting Policies
Revenue Recognition
The Company earns revenue primarily from providing access to its SaaS platform solution to its customers, and to a lesser degree, from services that support the implementation on the SaaS platform. The Company recognizes revenue when it satisfies performance obligations under the terms of the contract in an amount that reflects the consideration the Company expects to receive in exchange for the services. The Company determines the appropriate amount of revenue to be recognized using the following steps: (i) identification of contracts with customers, (ii) identification of the performance obligations in the contract, (iii) determination of transaction price, (iv) allocation of contract transaction price to the performance obligations, and (v) recognition of revenue when or as the Company satisfies a performance obligation. Often contracts contain more than one performance obligation. Performance obligations are the unit of accounting for revenue recognition and generally represent the distinct services that are promised to the customer.
The Company typically bills its customers monthly in arrears based on a percentage of the average of the daily value of the assets within a customer’s accounts on the platform. Payment terms may vary by contract but generally include a requirement of payment within 30 days following the month in which services were provided. Customers generally have the right to cancel with 30 days’ notice with no penalty.
The Company’s SaaS services allow the customer to access the services without taking possession of the software. Non-refundable fees invoiced in advance of the delivery of the Company’s performance obligations are deemed set up activities and are deferred as a material right and recognized over time, typically 12 months. After set up activities, customers typically receive benefits from implementation services prior to the “go live” date, at which point they can use the platform as intended in the arrangement. We have determined these implementation services are generally a separate performance obligation. As the Company’s platform must stand ready to provide the services throughout the contract period, revenues are recognized as the services are provided over time beginning on the date the service is made available as intended in the arrangement.
Costs Incurred to Obtain Revenue Contracts
The Company’s incremental direct costs of obtaining a contract consist of sales commissions which are deferred and amortized ratably over the term of economic benefit, which the Company has determined to be four years. These deferred contract costs are classified as current or non-current based on the timing of when the Company expects to recognize the expense. The current and non-current portions of deferred commissions are included in
F-13
Table of Contents
Index to Financial Statements
CWAN HOLDINGS, LLC AND SUBSIDIARIES
Notes to Consolidated Financial Statements
prepaid expenses and other current assets, and deferred contract costs, non-current, respectively, in the Company’s consolidated balance sheets. At December 31, 2020 and 2019, and June 30, 2021 (unaudited), the Company had $7.7 million, $5.7 million and $7.2 million, respectively, of deferred contract costs.
Recoverability of these costs is subject to various business risks. The Company compares the carrying value of these assets with the undiscounted future cash flows expected to be generated by them to determine if there is impairment. No impairment losses were recognized during the twelve months ended December 31, 2020 and 2019, and the six month periods ended June 30, 2021 and 2020 (unaudited).
Deferred Revenue
Deferred revenue (as reflected in accrued expenses and other current liabilities – see Note 4 to these Financial Statements) generally consists of non-refundable fees invoiced during the period in which the Company is performing set-up activities. Deferred revenue that will be recognized during the succeeding twelve-month period is recorded as current deferred revenue. At each of December 31, 2020 and 2019, the Company had $1.4 million of deferred revenue recorded within accrued expenses and other current liabilities in the financial statements. At June 30, 2021 (unaudited) the Company had $0.8 million of deferred revenue recorded within accrued expenses and other current liabilities in the financial statements.
Cash and Cash Equivalents
Cash and cash equivalents consist of cash in banks and highly liquid investments, primarily money market funds, purchased with an original maturity of three months or less at the time of purchase.
Concentration of Credit Risk
Financial instruments that potentially subject the Company to concentrations of credit risk consist principally of cash and cash equivalents and accounts receivable. The Company maintains the vast majority of its cash with United States financial institutions of high credit quality. The Company performs periodic evaluations of the credit standing of such institutions.
Accounts receivable are recorded net of an allowance for doubtful accounts. This allowance is based upon historical loss patterns, the number of days that billings are past due and an evaluation of the potential risk of loss associated with delinquent accounts. Receivables are written-off and charged against its recorded allowance when the Company has exhausted collection efforts without success.
During the years ended December 31, 2020 and 2019, and the six month periods ended June 30, 2021 and 2020 (unaudited), the Company did not have any clients that contributed more than 10% of revenue. As of December 31, 2020 and 2019, and June 30, 2021 (unaudited), the Company did not have any clients that accounted for 10% or more of total accounts receivable.
Fair Value of Financial Instruments
The Company’s financial instruments consist of cash and cash equivalents, accounts receivable, accounts payable, accrued liabilities and notes payable. Cash equivalents are stated at amortized cost, which approximates fair value as of the balance sheet dates, due to the short period of time to maturity. Accounts receivable, accounts payable and accrued liabilities are stated at their carrying value, which approximates fair value due to the short time to the expected receipt or payment. The carrying amounts reported in the consolidated balance sheets for the Company’s notes payable approximates fair value because the interest rate is variable and reflects current market values. As of December 31, 2020 and 2019, and June 30, 2021 (unaudited), the Company has not elected the fair value option for any financial assets or liabilities for which such an election would have been permitted.
F-14
Table of Contents
Index to Financial Statements
CWAN HOLDINGS, LLC AND SUBSIDIARIES
Notes to Consolidated Financial Statements
The Company measures financial assets and liabilities at fair value at each reporting period using a fair value hierarchy that requires the use of observable inputs and minimizes the use of unobservable inputs. The Company defines fair value as the price that would be received from selling an asset or paid by the Company to transfer a liability in an orderly transaction between market participants at the measurement date. Fair value is estimated by applying the following hierarchy, which prioritizes the inputs used to measure fair value into three levels and bases the categorization within the hierarchy upon the lowest level of input that is available and significant to the fair value measurement:
| • | Level I – Quoted prices in active markets for identical assets or liabilities. |
| • | Level II – Observable inputs other than quoted prices in active markets for identical assets and liabilities, quoted prices for identical or similar assets or liabilities in inactive markets, or other inputs that are observable or can be corroborated by observable market data for substantially the full term of the assets or liabilities. |
| • | Level III – Inputs that are generally unobservable and typically reflect management’s estimate of assumptions that market participants would use in pricing the asset or liability. |
The Company classifies its cash equivalents, which are made up of money market accounts, within Level 1 because the Company values these assets using quoted market prices.
Property and Equipment, Net
Property and equipment are stated at cost, less accumulated depreciation. Depreciation is calculated using the straight-line method over the estimated useful lives of the assets, which are generally three to five years. Leasehold improvements are amortized on a straight-line basis over the shorter of the remaining lease term or the estimated useful lives of related improvements. Expenditures for repairs and maintenance are charged to expense in the period incurred.
Costs associated with the development of internal use software incurred during the application and development stage are capitalized and recorded as part of property and equipment, net. Costs related to preliminary project activities and post implementation activities are expensed as incurred. Upgrades and enhancements are capitalized if the expenditures will result in adding functionality to the software.
Depreciation and amortization periods for property and equipment are as follows:
| Property and Equipment |
Estimated Useful Life | |||
| Computer equipment |
3 years | |||
| Furniture and fixtures |
3 – 5 years | |||
| Internally developed software |
4 years | |||
| Leasehold improvements |
|
Lesser of estimated useful life or remaining lease term |
| |
Impairment of Long-Lived Assets
The Company reviews long-lived assets for impairment when circumstances indicate that the carrying amount of an asset may not be recoverable. Recoverability of these assets is measured by a comparison of the carrying amounts to the sum of the future undiscounted cash flows the assets are expected to generate. If a long-lived asset is considered impaired, the impairment equals the amount by which the carrying value of the asset exceeds its fair value. There were no events or changes in business circumstances during the years ended December 31, 2020 or 2019, and the six month period ended June 30, 2021 (unaudited), that indicated the carrying amounts of any long-lived assets were not fully recoverable.
F-15
Table of Contents
Index to Financial Statements
CWAN HOLDINGS, LLC AND SUBSIDIARIES
Notes to Consolidated Financial Statements
Lease Obligations
The Company has entered into various operating lease agreements for its offices. The Company recognizes operating lease costs on a straight-line basis over the term of each agreement, taking into account provisions such as free or escalating base monthly rental payments or deferred payment terms.
Cost of Revenue
Cost of revenue consists of expenses that are related to delivery of revenue generating services, including expenses associated with client services, global delivery, reconciliation, and agreements related to the purchase of data used in the provision of the Company’s services. Certain personnel expenses associated with supporting these functions, including associated allocated overhead expenses, are also included in cost of revenue.
Capitalized software costs are amortized using the straight-line method over the estimated economic life of the related software, which is generally four years, and are recorded as cost of revenue in the consolidated statements of operations.
Research and Development
Research and development costs consist of personnel expenses, including salaries and benefits, bonuses, equity-based compensation and related overhead costs for employees engaged in the design, development and maintenance of the Company’s offerings and other internally used systems and applications.
Equity-Based Compensation
The Company measures and recognizes equity-based compensation expense for instruments based on the estimated fair value of equity-based awards on the date of grant using the Black-Scholes option-pricing model. The Company recognizes equity-based compensation expense over the requisite service period on a straight-line basis, which is generally consistent with the vesting of the awards, based on the estimated fair value of the equity-based awards issued to employees and directors that are expected to vest. Equity-based compensation that vests on a performance event, such as annual targets for the Company, begins to be recognized at the date that the performance event becomes probable, and compensation expense is recognized on a straight-line basis over any remaining service period. If there are any modifications of equity-based awards, the Company may be required to accelerate, increase, decrease, or reverse any equity-based compensation expense on the unvested awards.
Income Taxes
The Company was formed as a limited liability company and elected taxation as a partnership for federal U.S. tax purposes. Earnings and losses are included in the income tax returns of the member and taxed depending on its tax strategies. Accordingly, the Company will likely not incur significant income tax obligations.
As of December 31, 2020, and 2019, and June 30, 2021 (unaudited), the unrecognized tax benefit accrual was $0.
The Company will recognize future accrued interest and penalties related to unrecognized tax benefits in income tax expense if incurred.
The international subsidiaries of the Company are corporations and therefore, subject to income taxes. The international subsidiaries earn revenue by providing services to the Company on a “cost plus markup” basis. Income taxes are recorded at the statutory rate within income tax expense on the consolidated statement of
F-16
Table of Contents
Index to Financial Statements
CWAN HOLDINGS, LLC AND SUBSIDIARIES
Notes to Consolidated Financial Statements
operations and income taxes payable on the consolidated balance sheet due to the minimal temporary differences between book expense and the amount of taxes paid within these regimes. Income (loss) before income taxes consisted of the following (in thousands):
| Six Months Ended June 30, |
Years Ended December 31, |
|||||||||||||||
| 2021 | 2020 | 2020 | 2019 | |||||||||||||
| (unaudited) | ||||||||||||||||
| US Income (loss) |
$ | 2,168 | $ | 13,244 | $ | (46,923 | ) | $ | 6,926 | |||||||
| Foreign Income |
1,352 | 601 | 3,595 | 879 | ||||||||||||
|
|
|
|
|
|
|
|
|
|||||||||
| Income (loss) before income taxes |
$ | 3,520 | $ | 13,845 | $ | (43,328 | ) | $ | 7,805 | |||||||
|
|
|
|
|
|
|
|
|
|||||||||
The average statutory tax rate of foreign subsidiaries for the year ended December 31, 2020 and December 31, 2019 is 23% and 22%, respectively. The average statutory tax rate of foreign subsidiaries for the six month periods ended June 30, 2021 and 2020 (unaudited) is 25% and 23%, respectively.
Debt Issuance Costs
Debt issuance costs are amortized over the period the related obligation is outstanding using the effective interest method. Debt issuance costs related to the term note are included within notes payable on the consolidated balance sheet. Debt issuance costs associated with the line of credit are included as a non-current asset on the consolidated balance sheets. Amortization of debt issuance costs are included in interest expense in the consolidated statements of operations.
Comprehensive Income (Loss)
Comprehensive income (loss) is comprised of two elements: net income (loss) and other comprehensive income (loss). Other comprehensive income (loss) refers to income or (losses) that are recorded as an element of members’ deficit but are excluded from the Company’s net income (loss). For all periods presented, the Company’s other comprehensive income (loss) is comprised of foreign currency translation adjustments related to its foreign subsidiaries.
Foreign Currency
The functional currencies of the Company’s foreign subsidiaries are their local currencies. The assets and liabilities of the Company’s foreign subsidiaries are translated at the spot rate in effect at the applicable reporting date, and the consolidated statements of operations are translated at the average exchange rates in effect during the applicable period. The resulting unrealized cumulative translation adjustment is recorded as a component of accumulated other comprehensive income (loss) in members’ deficit.
The Company has transactions in foreign currencies other than the functional currency. Transactions denominated in currencies other than the functional currency are recorded based on exchange rates at the time the transactions occur. Subsequent changes in exchange rates result in transaction gains and losses which are reflected in the consolidated statements of operations as unrealized (based on the applicable period-end exchange rate) or realized upon settlement of the transactions. Foreign currency gains and losses resulting from transactions denominated in a currency other than the functional currency are included in interest and other expense, net in the consolidated statements of operations. During the years ended December 31, 2020 and 2019, the Company recognized net foreign currency losses of $38,000 and $89,000 , respectively. During the six month periods ended June 30, 2021 and 2020 (unaudited), the Company recognized net foreign currency losses of $13,000 and net foreign currency gain of $40,000, respectively.
F-17
Table of Contents
Index to Financial Statements
CWAN HOLDINGS, LLC AND SUBSIDIARIES
Notes to Consolidated Financial Statements
Recently Adopted Accounting Pronouncements
In August 2018, the FASB issued ASU No. 2018-13, “Fair Value Measurement (Topic 820): Disclosure Framework – Changes to Disclosure Requirements for Fair Value Measurement”. This update eliminates, adds and modifies certain disclosure requirements for fair value measurements. The Company adopted ASU 2018-13 on January 1, 2020 and the impact of the adoption was not material to the Company’s consolidated financial statements.
Recent Accounting Pronouncements Not Yet Adopted
As an Emerging Growth Company, the Company has elected to defer compliance with new or revised financial accounting standards until the Company is required to comply with such standards based on adoption dates for non-issuers.
In February 2016, the FASB issued ASU No. 2016-02, “Leases”. The new guidance requires lessees to recognize on the balance sheet the assets and liabilities for the assets and obligations created by those leases. The standard is effective for the Company beginning January 1, 2022. Early adoption is permitted. The Company is currently evaluating the impact of the adoption of this standard on its consolidated financial statements.
In August 2018, the FASB issued ASU No. 2018-15, “Customer’s Accounting for Implementation Costs That is A Service Contract”. This update provides guidance for determining if a cloud computing arrangement is within the scope of internal-use software guidance and would require capitalization of certain implementation costs. The standard is effective for the Company beginning January 2022. Early adoption is permitted. The Company is currently evaluating the impact of the adoption of this standard on its consolidated financial statements.
3. Revenue recognition
The Company is applying the optional exemption to not disclose transaction price allocated to the remaining performance obligations as the Company’s performance obligations are part of contracts that have an expected original duration of one year or less.
Of the total revenue recognized for the year ended December 31, 2020, $1.4 million was included in the deferred revenue balance as of December 31, 2019. Of the total revenue recognized for the six month period ended June 30, 2021 (unaudited), $0.6 million was included in deferred revenue balance as of December 31, 2020. Revenues recognized from performance obligations satisfied (or partially satisfied) in previous periods were not material. Revenue by geography as presented in Note 12 Segment and Geographic Information is determined based on the billing address of the customer.
F-18
Table of Contents
Index to Financial Statements
CWAN HOLDINGS, LLC AND SUBSIDIARIES
Notes to Consolidated Financial Statements
4. Fair Value Measurements
The following tables set forth the fair value of the Company’s financial assets measured at fair value as of December 31, 2020 and 2019 and June 30, 2021 (unaudited) in accordance with the fair value hierarchy (in thousands):
| June 30, 2021 | ||||||||||||||||
| Level I | Level II | Level III | Total | |||||||||||||
| (unaudited) | ||||||||||||||||
| Financial Assets: |
||||||||||||||||
| Cash and cash equivalents: |
||||||||||||||||
| Money market funds |
$ | 41,031 | $ | — | $ | — | $ | 41,031 | ||||||||
|
|
|
|
|
|
|
|
|
|||||||||
| Total assets measured at fair value |
$ | 41,031 | $ | — | $ | — | $ | 41,031 | ||||||||
|
|
|
|
|
|
|
|
|
|||||||||
| December 31, 2020 | ||||||||||||||||
| Level I | Level II | Level III | Total | |||||||||||||
| Financial Assets: |
||||||||||||||||
| Cash and cash equivalents: |
||||||||||||||||
| Money market funds |
$ | 60,886 | $ | — | $ | — | $ | 60,886 | ||||||||
|
|
|
|
|
|
|
|
|
|||||||||
| Total assets measured at fair value |
$ | 60,886 | $ | — | $ | — | $ | 60,886 | ||||||||
|
|
|
|
|
|
|
|
|
|||||||||
| December 31, 2019 | ||||||||||||||||
| Level I | Level II | Level III | Total | |||||||||||||
| Financial Assets: |
||||||||||||||||
| Cash and cash equivalents: |
||||||||||||||||
| Money market funds |
$ | 17,761 | $ | — | $ | — | $ | 17,761 | ||||||||
|
|
|
|
|
|
|
|
|
|||||||||
| Total assets measured at fair value |
$ | 17,761 | $ | — | $ | — | $ | 17,761 | ||||||||
|
|
|
|
|
|
|
|
|
|||||||||
During the years ended December 31, 2020 and 2019 and the six month period ended June 30, 2021 (unaudited), there were no transfers of assets or liabilities between Level 1, Level 2 and Level 3 of the fair value hierarchy.
5. Balance Sheet Components
Accounts Receivable, net
Accounts receivable, net consisted of the following (in thousands):
| June 30, | December 31, | |||||||||||
| 2021 | 2020 | 2019 | ||||||||||
| (unaudited) | ||||||||||||
| Unbilled accounts receivable |
$ | 23,448 | $ | 23,715 | $ | 18,114 | ||||||
| Billed accounts receivable |
21,662 | 9,200 | 8,486 | |||||||||
| Allowance for doubtful accounts and reserves |
(35 | ) | (33 | ) | (43 | ) | ||||||
|
|
|
|
|
|
|
|||||||
| Accounts receivable, net |
$ | 45,075 | $ | 32,882 | $ | 26,557 | ||||||
|
|
|
|
|
|
|
|||||||
The majority of invoices included within unbilled accounts receivable balance are issued within the first few days of the month directly following the period of service.
F-19
Table of Contents
Index to Financial Statements
CWAN HOLDINGS, LLC AND SUBSIDIARIES
Notes to Consolidated Financial Statements
Prepaid Expenses and Other Current Assets
Prepaid expenses and other current assets consisted of the following (in thousands):
| June 30, | December 31, | |||||||||||
| 2021 | 2020 | 2019 | ||||||||||
| (unaudited) | ||||||||||||
| Prepaid expenses |
$ | 8,462 | $ | 4,141 | $ | 3,130 | ||||||
| Deferred contract costs, current portion |
3,196 | 2,903 | 1,932 | |||||||||
| Deferred costs associated with offering |
1,572 | — | — | |||||||||
| Other current assets |
1,003 | 506 | 940 | |||||||||
|
|
|
|
|
|
|
|||||||
| Prepaid expenses and other current assets |
$ | 14,233 | $ | 7,550 | $ | 6,002 | ||||||
|
|
|
|
|
|
|
|||||||
Property and Equipment, net
Property and equipment, net consisted of the following (in thousands):
| June 30, | December 31, | |||||||||||
| 2021 | 2020 | 2019 | ||||||||||
| (unaudited) | ||||||||||||
| Computer equipment |
$ | 13,265 | $ | 12,248 | $ | 10,133 | ||||||
| Leasehold improvements |
3,029 | 2,965 | 2,568 | |||||||||
| Furniture and fixtures |
981 | 818 | 660 | |||||||||
| Internally developed software |
2,184 | 1,538 | 497 | |||||||||
| Construction in process |
360 | 508 | 179 | |||||||||
|
|
|
|
|
|
|
|||||||
| Total property and equipment |
19,819 | 18,077 | 14,037 | |||||||||
| Less: accumulated depreciation |
(10,489 | ) | (9,228 | ) | (6,943 | ) | ||||||
|
|
|
|
|
|
|
|||||||
| Total property and equipment, net |
$ | 9,330 | $ | 8,849 | $ | 7,094 | ||||||
|
|
|
|
|
|
|
|||||||
Depreciation expense was $2.3 million and $2.0 million for the years ended December 31, 2020 and 2019, respectively. Depreciation expense was $1.4 million and $1.0 million for the six month periods ended June 30, 2021 and 2020 (unaudited), respectively.
Other Non-current Assets
Other Non-current assets consisted of the following (in thousands):
| June 30, | December 31, | |||||||||||
| 2021 | 2020 | 2019 | ||||||||||
| (unaudited) | ||||||||||||
| Prepaid management fee to investors |
$ | 5,617 | $ | — | $ | — | ||||||
| Long term deposits |
180 | 112 | — | |||||||||
| Prepaid IT costs |
608 | 78 | — | |||||||||
|
|
|
|
|
|
|
|||||||
| Other non-current assets |
$ | 6,405 | $ | 190 | $ | — | ||||||
|
|
|
|
|
|
|
|||||||
F-20
Table of Contents
Index to Financial Statements
CWAN HOLDINGS, LLC AND SUBSIDIARIES
Notes to Consolidated Financial Statements
Accrued Expenses and Other Current Liabilities
Accrued expenses and other current liabilities consisted of the following (in thousands):
| June 30, | December 31, | |||||||||||
| 2021 | 2020 | 2019 | ||||||||||
| (unaudited) | ||||||||||||
| Accrued sales tax liability |
$ | 4,615 | $ | 9,994 | $ | 891 | ||||||
| Accrued interest |
2,350 | 2,306 | 4,082 | |||||||||
| Accrued bonus |
3,456 | 4,023 | 2,563 | |||||||||
| Accrued vendor liabilities |
5,247 | 2,369 | 1,555 | |||||||||
| Accrued benefits and retirement |
2,390 | 2,562 | 1,528 | |||||||||
| Deferred revenue |
816 | 1,420 | 1,424 | |||||||||
| Accrued commissions |
1,052 | 2,371 | 1,119 | |||||||||
| Deferred rent |
1,385 | 1,238 | 970 | |||||||||
| Accrued reimbursement to unitholders (Note 11) |
— | 4,880 | — | |||||||||
| Other current liabilities |
3,366 | 2,626 | 2,488 | |||||||||
|
|
|
|
|
|
|
|||||||
| Accrued expenses and other current liabilities |
$ | 24,677 | $ | 33,789 | $ | 16,620 | ||||||
|
|
|
|
|
|
|
|||||||
The Company has a contractual right to collect and remit sales or other related taxes from customers. Any taxes are the responsibility of the customer. In 2019, after considering the evolving changes to many states’ assessment of the taxability of SaaS services, management recorded a reserve for unremitted sales tax. The reserve included an estimate of customers’ self-assessment and self-reporting of their tax liability. Throughout 2020, the Company conducted a comprehensive review of its sales tax reporting obligations across all relevant jurisdictions including contacting customers to determine customer self-assessment of their obligations. After completing the review, management learned that customer self-assessment was much lower than estimated and determined it would not enforce its right to collect past unremitted sales tax from customers. Therefore, the estimated potential sales tax liability for the period prior to December 31, 2019 was increased by $3.9 million. This was accounted for as a change in estimate and recorded in 2020. Beginning in January 2021, the Company commenced collecting and remitting taxes from those customers with obligations.
6. Credit Agreement
On September 1, 2016, the Company entered into a credit agreement with Ares Capital Corporation and Golub Capital LLC (the “Credit Agreement”) that included both a $20 million revolving line of credit (“LC”) and a $175 million term note (“Term Note”). Under the original Credit Agreement, the LC and Term Note were to mature on September 1, 2022. The net proceeds of the Term Note were used to fund the merger with Carbon Analytics Merger Sub LLC. All proceeds from the note went directly from the bank to an escrow agent for disbursement to owners of Clearwater Analytics, LLC. Borrowings under the Credit Agreement bear interest at either the Company selected LIBOR Rate (subject to a 1% floor) or the Index Rate (Prime Rate quoted from the Wall Street Journal), plus the applicable margin. All borrowings are collateralized by all property and assets of the Company. Interest is due at the end of the selected LIBOR period or at the end of the index rate loan term. The Company incurred debt issuance costs of $6.2 million on September 1, 2016.
On March 27, 2018 the Company amended the Credit Agreement to modify the applicable margin rate from 7.5% to 5% for both the Term Note and LC. The Company incurred $2.2 million in debt issue costs related to the modification.
F-21
Table of Contents
Index to Financial Statements
CWAN HOLDINGS, LLC AND SUBSIDIARIES
Notes to Consolidated Financial Statements
On July 3, 2019 and December 3, 2019, the Company entered into the Third and Fourth Amendments to the Credit Agreement. The lenders provided incremental Term Loans of $80 million and $25 million, respectively. The proceeds were used to finance the payment of fees and expenses related to legal matters. The Company incurred a closing fee equal to 2.50% on the incremental term commitments and an amendment fee of 0.25% of the aggregate principal outstanding in the Third Amendment and a closing fee equal to 2.00% in the Fourth Amendment. The Company incurred additional debt issuance costs as a result of the third and fourth amendment in the amount of $2.1 million and $0.5 million, respectively.
On October 19, 2020, the Company entered into the Fifth Amendment to the Credit Agreement. The lenders provided an incremental Term Loan of $202.7 million and increased the amount available to borrow from the LC by $10 million. The proceeds were used to fund distributions to unitholders and a $0.83 per unit dividend to all Class A and B unitholders. The Company incurred a closing fee equal to 2.64% on the incremental term commitment. The Company incurred additional debt issuance costs as a result of the fifth amendment in the amount of $5.8 million. The Amended Credit Agreement extended the maturity of the Credit Agreement and the LC and Term Note now mature on October 31, 2025.
LC
The LC provides available borrowings of up to $30 million, of which the facility was increased by $10 million under the Fifth Amendment to the Credit Agreement. There were no amounts outstanding as of December 31, 2020 and 2019. Borrowings under the line of credit are subject to certain covenants and restrictions on indebtedness. For each of the years ended December 31, 2020 and 2019, the Company incurred an unused commitment expense of $0.3 million recorded in interest and other expenses, net. For the six month periods ended June 30, 2021 and 2020 (unaudited), the Company incurred an unused commitment expense of $0.2 million and $0.1 million, respectively, recorded in interest and other expenses, net.
Term Note
Amounts outstanding on the Term Note totaled $434.2 million and $253.1 million as of December 31, 2020 and 2019, respectively. The interest rates as of December 31, 2020 and 2019 were 7.250% and 7.654%, respectively. The effective interest rates as of December 31, 2020 and 2019 were 7.63% and 8.40%, respectively. Interest on the term note is due at the end of the selected LIBOR period or at the end of the index rate loan term. The Term Note requires a minimum quarterly principal payment of 0.25% of the outstanding principal. For the years ended December 31, 2020 and 2019 and the six month periods ended June 30, 2021 and 2020 (unaudited), the Company paid $22.2 million, $12.3 million, $15.8 million and $12.4 million in interest, respectively. Borrowings are collateralized by all property and assets of the Company.
The LC and term note agreements, including each amendment, contain customary affirmative and negative covenants, including covenants that limit or restrict the Company’s ability to, among other things, incur indebtedness, merge or consolidate, dispose of assets, make investments, make acquisitions, enter into transactions with affiliates, pay dividends or make distributions. The Company is also required to maintain compliance with a consolidated net leverage ratio. The line of credit and term note agreements also includes customary events of default.
F-22
Table of Contents
Index to Financial Statements
CWAN HOLDINGS, LLC AND SUBSIDIARIES
Notes to Consolidated Financial Statements
Future maturities of debt as of December 31, 2020 are as follows (in thousands):
| Year Ending December 31, |
||||
| 2021 |
$ | 3,077 | ||
| 2022 |
3,077 | |||
| 2023 |
3,077 | |||
| 2024 |
3,077 | |||
| 2025 |
421,923 | |||
|
|
|
|||
| Total principal debt |
434,231 | |||
| Unamortized loan costs |
(9,327 | ) | ||
|
|
|
|||
| Net carrying amount |
$ | 424,904 | ||
|
|
|
|||
Future maturities of debt as of June 30, 2021 are as follows (in thousands):
| Period Ending June 30 (unaudited), |
||||
| Remainder of 2021 |
$ | 1,539 | ||
| 2022 |
3,077 | |||
| 2023 |
3,077 | |||
| 2024 |
3,077 | |||
| 2025 |
421,923 | |||
|
|
|
|||
| Total principal debt |
432,692 | |||
| Unamortized loan costs |
(8,370 | ) | ||
|
|
|
|||
| Net carrying amount |
$ | 424,322 | ||
|
|
|
|||
7. Employee Retirement Plan
The Company’s U.S. 401K and international pension plans are defined contribution plans (“the Plans”) that are available to employees that meet certain eligibility requirements. Company cash contributions to the Plans are based on a percentage of employee contributions subject to an annual limitation. The Company reserves the right to amend the Plans at any time.
The Company made contributions of $3.4 million, $2.7 million, $2.1 million and $1.5 million during the periods ended December 31, 2020 and 2019, and June 30, 2021 and 2020 (unaudited), respectively.
8. Commitments and Contingencies
Operating Leases
The Company leases office space for its headquarters in Boise, Idaho, sales offices in New York City, London, and San Francisco, and client service offices in Edinburgh, U.K. and Noida, India under non-cancelable operating leases.
The Boise, Idaho headquarters office has a 10-year lease with two optional 5-year renewal periods. Annual payments are $2.4 million, with a 2% annual increase. The other sales and client service offices have annual payments of $1.0 million a year, some of which have contractual annual increases.
F-23
Table of Contents
Index to Financial Statements
CWAN HOLDINGS, LLC AND SUBSIDIARIES
Notes to Consolidated Financial Statements
The following is a schedule of future minimum lease payments under the Company’s non-cancellable leases as of December 31, 2020 (in thousands):
| Year Ending December 31, |
||||
| 2021 |
$ | 3,109 | ||
| 2022 |
3,179 | |||
| 2023 |
3,229 | |||
| 2024 |
3,198 | |||
| 2025 |
2,999 | |||
| Thereafter |
3,471 | |||
|
|
|
|||
| Total minimum lease payments |
$ | 19,185 | ||
|
|
|
|||
Rent expense was $3.4 million and $2.9 million during the years ended December 31, 2020 and 2019, respectively.
During the six month period ended June 30, 2021, the Company entered into new lease agreements in Bellevue, Seattle, Paris, France and Frankfurt, Germany. The following is a schedule of future minimum lease payments under the Company’s non-cancellable leases as of June 30, 2021 (in thousands):
| Period Ending June 30 (unaudited), |
||||
| Remainder of 2021 |
$ | 1,713 | ||
| 2022 |
3,737 | |||
| 2023 |
3,653 | |||
| 2024 |
3,603 | |||
| 2025 |
3,464 | |||
| Thereafter |
3,859 | |||
|
|
|
|||
| Total minimum lease payments |
$ | 20,029 | ||
|
|
|
|||
Rent expense was $1.8 million and $1.6 million for the six month periods ended June 30, 2021 and 2020 (unaudited), respectively.
Purchase Obligations
The Company has future minimum purchase obligations under arrangements with third parties who provide hosting infrastructure services, cloud services, and SaaS accounting solutions.
The following is a schedule of future minimum purchase obligations as of December 31, 2020 (in thousands):
| Year Ending December 31, |
||||
| 2021 |
$ | 5,142 | ||
| 2022 |
4,510 | |||
| 2023 |
4,436 | |||
|
|
|
|||
| Total future purchase obligations |
$ | 14,088 | ||
|
|
|
|||
As of June 30, 2021 (unaudited), there were no other material changes to the Company’s purchase commitments since December 31, 2020.
F-24
Table of Contents
Index to Financial Statements
CWAN HOLDINGS, LLC AND SUBSIDIARIES
Notes to Consolidated Financial Statements
Litigation
From time to time, in the course of its operations, the Company is party to litigation matters and claims. Litigation can be expensive and disruptive to normal business operations. The results of complex legal proceedings are difficult to predict, and the Company’s view of these matters may change in the future as the litigation and events related thereto unfold. An unfavorable outcome in any legal matter, if material, could have a material adverse effect on the Company’s financial position, liquidity or results of operation in the period in which the unfavorable outcome occurs and potentially in future periods. The Company reviews the status of each legal matter or other claim and records a provision for the liability when it is considered both probable that a liability has been incurred and the amount of the loss can be reasonably estimated. The Company expenses any legal expenses as incurred.
During the year ended December 31, 2020 and 2019, the Company incurred $0.3 million and $14.8 million of legal fees which are reflected in General and Administrative expense in the consolidated statement of operations. During the six month periods ended June 2021 and 2020 (unaudited), the Company incurred $0.1 million and $0 million of legal fees which are reflected in General and Administrative expense in the consolidated statement of operations.
9. Equity-Based Compensation
The Company has an equity incentive plan, the 2017 Equity Incentive Plan (the “Equity Plan”). As of December 31, 2020 and June 30, 2021 (unaudited), a total of 22,500,000 and 28,299,532 units, respectively, were authorized for issuance under the Equity Plan. As of December 31, 2020 and June 30, 2021 (unaudited), the total number of units available for future grants under the Equity Plan was 3,012,902 units and 62,638 units, respectively. Under the Equity Plan, any options that are exercised, purchased, forfeited or used to fulfill tax obligations but do not result in the issuance of a unit do not result in a reduction in the number of units authorized for issuance under the Equity Plan.
Under the Equity Plan, the Company may grant option awards to purchase Class B units or restrictive stock units (“RSUs”) to Company employees, directors and contractors at exercise prices not less than the fair market value as determined by the Board of Directors. Options granted under the Equity Plan expire ten years from the date of grant and are either subject to vesting generally over a five-year period and carry both time-based and performance-based vesting schedules, or generally over a four-year period which carry a time-based vesting schedule. The options were accounted for under ASC 718 as equity-classified awards.
F-25
Table of Contents
Index to Financial Statements
CWAN HOLDINGS, LLC AND SUBSIDIARIES
Notes to Consolidated Financial Statements
Unit activity related to options under the Equity Plan is as follows:
| Units Activity |
Weighted- Average Exercise Price Per Unit |
Weighted- Average Remaining Contractual Term (In Years) |
||||||||||
| Balance – December 31, 2018 |
13,093,333 | $ | 4.52 | 9.25 | ||||||||
| Granted |
4,566,250 | 5.72 | ||||||||||
| Exercised |
(648,333 | ) | 4.00 | |||||||||
| Forfeited |
(1,170,000 | ) | 4.60 | |||||||||
|
|
|
|||||||||||
| Balance – December 31, 2019 |
15,841,250 | $ | 4.88 | 8.55 | ||||||||
| Granted |
6,626,141 | 5.12 | ||||||||||
| Exercised |
(6,796,126 | ) | 4.24 | |||||||||
| Forfeited |
(778,130 | ) | 4.24 | |||||||||
|
|
|
|||||||||||
| Balance – December 31, 2020 |
14,893,135 | $ | 4.60 | 9.19 | ||||||||
| Granted (unaudited) |
9,169,556 | 12.88 | ||||||||||
| Exercised (unaudited) |
(262,136 | ) | 4.08 | |||||||||
| Forfeited (unaudited) |
(530,855 | ) | 7.32 | |||||||||
|
|
|
|||||||||||
| Balance – June 30, 2021 (unaudited) |
23,269,700 | 7.80 | 8.50 | |||||||||
|
|
|
|||||||||||
| Options vested – December 31, 2020 |
4,321,980 | $ | 4.24 | 7.68 | ||||||||
| Options vested and expected to vest – December 31, 2020 |
14,893,135 | $ | 4.60 | 9.19 | ||||||||
| Options vested – June 30, 2021 (unaudited) |
6,381,089 | $ | 4.28 | 7.25 | ||||||||
| Options vested and expected to vest –June 30, 2021 (unaudited) |
23,269,700 | $ | 7.80 | 8.50 | ||||||||
As of December 31, 2020 and June 30, 2021 (unaudited), total unrecognized compensation expense related to unvested options was $14.9 million and $56.1 million, which is expected to be recognized over a weighted average period of 3.24 years and 3.56 years, respectively.
Of the 6,796,126 options which were exercised for the year ended December 31, 2020, there were 2,292,737 options withheld to fulfill the exercise price obligation and did not result in the issuance of a unit (see Note 10, Members’ Deficit).
In general, options which vest over a five-year period are subject to two types of vesting conditions, based on continuous employment over the five-year period:
Time-based vesting – 40% of the units awarded are eligible to vest in substantially equal annual installments on each of the first five anniversaries of employment.
Performance-based vesting – 60% of the units awarded are eligible to vest in equal annual installments upon the achievement of annual targets for the Company determined by the Compensation Committee. The units vest annually when the Compensation Committee approves that annual targets have been achieved. The measurement date of the performance-based vesting portion of employee options is deemed to be the date that the performance vesting targets for the upcoming year are communicated, typically in January.
F-26
Table of Contents
Index to Financial Statements
CWAN HOLDINGS, LLC AND SUBSIDIARIES
Notes to Consolidated Financial Statements
In general, options which vest over a four-year period are subject to time-based vesting conditions based on continuous employment over the four-year period:
Time-based vesting – 25% of the units awarded are eligible to vest on the first anniversary of employment, and 75% are subsequently eligible to vest on a monthly basis over the remaining three-year period of employment.
During June 2021, the Company began to grant RSUs to employees. The summary of RSU activity is as follows (in thousands, except per share data):
| Units Activity |
Weighted- Average Grant Date Fair Value |
Aggregate Intrinsic Value |
||||||||||
| Unvested units as of December 31, 2020 |
— | $ | — | $ | — | |||||||
| Granted (unaudited) |
375,000 | 14.28 | ||||||||||
| Released (unaudited) |
— | — | ||||||||||
| Cancelled (unaudited) |
— | — | ||||||||||
|
|
|
|||||||||||
| Unvested units as of June 30, 2021 (unaudited) |
375,000 | $ | 1,335 | |||||||||
The aggregate intrinsic value of unexercised options is calculated using the fair value of equity awards of $17.84 at June 30, 2021 (unaudited).
As of June 30, 2021 (unaudited), there was $5.4 million of unrecognized equity-based compensation expense related to RSUs.
Determination of Fair Value
The Company estimates the fair value of each option awarded on the date of grant using the Black-Scholes option-pricing model utilizing the assumptions noted below:
Fair Value of Units – the fair value of the common unit underlying the equity-based awards was determined by the Company’s Board of Directors, with input from management and third-party valuations.
Expected Term – the expected term represents the period that the awards are expected to be outstanding. The Company issues “plain vanilla,” awards and the Company determines the expected term using the simplified method. The simplified method deems the term to be the average of the time-to-vesting and the contractual life of the options.
Expected Volatility – the expected unit price volatility for the Company’s units are determined by examining the historical volatilities of its public industry peers, as the Company does not have any trading history of its common units.
Risk-Free Interest Rate – the risk-free interest rate is calculated using the average of the published interest rates of U.S. Treasury zero-coupon issues with maturities that approximate the expected term.
Dividend Rate – the dividend yield assumption is zero, although the Company made a special one-time dividend in conjunction with the recapitalization transaction, the Company has no history of making regular dividends, nor plans to make future dividend payments.
F-27
Table of Contents
Index to Financial Statements
CWAN HOLDINGS, LLC AND SUBSIDIARIES
Notes to Consolidated Financial Statements
The following assumptions were used to calculate the fair value of options granted to employees on the date of grant using the Black-Scholes option-pricing model:
| Six Months Ended June 30, | Year Ended December 31, | |||||||
| 2021 | 2020 | 2020 | 2019 | |||||
| (unaudited) | ||||||||
| Weighted-average grant date fair value per option |
$5.08 | $1.40 | $1.60 | $1.88 | ||||
| Fair value of units |
$12.40 – $14.28 | $4.40 | $4.40 – $12.40 | $5.04 – $5.76 | ||||
| Expected term (in years) |
6.00 – 6.25 | 6.25 | 6.25 | 6.5 | ||||
| Expected volatility |
40% | 30% | 30% | 30% | ||||
| Risk-free interest rates |
0.6 – 1.1% | 0.5 –1.7% | 0.4 – 1.7% | 1.7 – 2.5% | ||||
In addition to the Black-Scholes assumptions discussed immediately above, the forfeiture rate may also have a significant impact on the related equity-based compensation. The forfeiture of options is recognized as forfeitures occur.
Equity-based Compensation Expense
Equity-based compensation expense related to all employee awards was as follows (in thousands):
| Six Months Ended June 30, |
Year Ended December 31, |
|||||||||||||||
| 2021 | 2020 | 2020 | 2019 | |||||||||||||
| (unaudited) | ||||||||||||||||
| Cost of revenue |
$ | 1,272 | $ | 550 | $ | 1,669 | $ | 564 | ||||||||
| Research and development |
3,686 | 1,379 | 4,208 | 1,722 | ||||||||||||
| Sales and marketing |
2,127 | 732 | 3,911 | 922 | ||||||||||||
| General and administrative |
4,471 | 2,327 | 14,814 | 3,025 | ||||||||||||
|
|
|
|
|
|
|
|
|
|||||||||
| Total equity-based compensation |
$ | 11,556 | $ | 4,988 | $ | 24,602 | $ | 6,233 | ||||||||
|
|
|
|
|
|
|
|
|
|||||||||
No income tax benefits have been realized or recognized from equity-based compensation expense.
Modification of option awards
In January 2020, the Company offered to option holders a one-time modification to reduce the exercise price of all equity options with exercise prices greater than $4.40 per unit to $4.40, the ‘fair value’ at the date of modification. In total, 8,778,750 options had their exercise price reduced for 68 option holders who accepted the repricing. The option awards subject to repricing were accounted for as modified awards due to the change in exercise price of option awards as a result of the repricing. The incremental compensation charge resulting from the modification is $1.9 million. For vested option awards, $0.7 million was recognized on the date of modification and for unvested option awards $1.2 million will be recognized over the remaining requisite service period.
In October 2020, in conjunction with the recapitalization transaction described in Note 11, the Company accelerated the vesting on 4,150,845 options for 27 employees. The total incremental expense associated with the acceleration was $18.8 million, recognized on the date of modification. The option awards subject to acceleration were accounted for as modified awards due to the change in the vesting period of existing awards.
F-28
Table of Contents
Index to Financial Statements
CWAN HOLDINGS, LLC AND SUBSIDIARIES
Notes to Consolidated Financial Statements
10. Members’ Deficit
The Company is managed through its Board of Directors (“the Board”) and is governed by the Carbon Analytics Holding LLC Second Amended and Restated LLC Agreement (“LLC Agreement”).
The Board has sole authority and right to manage the business and affairs of the Company. Authorized units in the Company consist of Class A and Class B common units. Unitholders do not have any voting, approval or consent rights under the LLC Agreement with respect to matters of governance of the Company. Common unitholders are entitled one vote per common unit on matters submitted to a vote of the common unitholder. All distributions to unitholders, other than tax distributions, and including those in connection with a liquidity event, will be made to the Class A and Class B common unitholders pro rata based on the number of units held by such unitholders.
At each of December 31, 2020 and 2019, the Company had 190,960,379 outstanding Class A common units. At December 31, 2020 and 2019, the Company had outstanding 10,134,440 and 5,733,788 Class B common units, respectively.
As of June 30, 2021 (unaudited), the Company had 190,960,379 outstanding Class A common units and 10,358,478 outstanding Class B common units.
In November 2019, the Board elected to repurchase 263,622 units from certain unitholders’ interests in the Company.
On December 13, 2019, the Company completed a rights offering to issue 31,136,364 units at a price of $4.40 per unit to raise gross proceeds of $137 million.
On October 9, 2020, the Board declared a dividend. On October 27, 2020, the Company issued a dividend of $0.83 per unit in respect of 196,694,167 existing Class A and Class B units for a total dividend of $163.3 million. The Company funded the dividend with proceeds from the Company’s Fifth Amendment to the Credit Agreement described in Note 6.
On October 28, 2020, the Company distributed $9.9 million to certain Class A unitholders to fulfill tax distribution agreements with those unitholders.
On November 2, 2020 as part of the recapitalization transaction (see Note 11, Recapitalization), certain employees of the Company who were option holders exercised 6,693,390 options of which 2,292,737 were withheld to fulfill the exercise price obligation and 4,400,652 new Class B common units were issued.
During March 2021, the Company issued 125,807 Class B common units to newly appointed Directors at a price of $12.40 per unit (unaudited).
11. Recapitalization
On November 2, 2020, the Company completed a recapitalization transaction on behalf of existing unitholders. The transaction allowed existing unitholders to sell their units to new investors. In addition, option holders were offered the opportunity to exercise and sell a portion of their vested options, which were accelerated in certain cases (See Note 9, Equity-Based Compensation – Modification of option awards). In total 132,658,542 units transferred ownership. After completion of the recapitalization transaction, entities ultimately controlled by WCAS maintained a majority interest in and control of the Company.
F-29
Table of Contents
Index to Financial Statements
CWAN HOLDINGS, LLC AND SUBSIDIARIES
Notes to Consolidated Financial Statements
In connection with the transaction, selling unitholders contributed $49.0 million for bonuses paid to employees and related payroll taxes in 2020. These amounts have been recorded as an expense in the recapitalization compensation expenses category within the consolidated statement of operations and as a contribution in members’ deficit.
The bonuses relate to employees from departments which have historically been recorded as expenses in the below categories in the consolidated statements of operations:
| Year Ended December 31, 2020 |
||||
| Cost of revenue |
$ | 6,205 | ||
| Research and development |
8,891 | |||
| Sales and marketing |
7,951 | |||
| General and administrative |
25,951 | |||
|
|
|
|||
| Total recapitalization compensation |
$ | 48,998 | ||
|
|
|
|||
As of December 31, 2020, the Company calculated the actual costs incurred with the recapitalization compensation expenses and accrued $4.9 million to be reimbursed to unitholders as an excess contribution. The amounts were reimbursed in 2021 (unaudited).
12. Segment and Geographic information
Operating segments are defined as components of an enterprise about which separate financial information is available that is evaluated regularly by the chief operating decision maker, or decision group, in deciding how to allocate resources and assessing performance. The Company’s chief operating decision maker is the Company’s Chief Executive Officer (“CEO”). The Company’s CEO reviews financial information presented on a consolidated basis and makes decisions and allocates resources based on the Company as a whole. The Company has one business activity as a provider of a Software as a Service (“SaaS”) solution for investment data aggregation, accounting, analytics, and reporting services. Accordingly, the Company operates as one operating segment, and all required segment financial information is found in the consolidated financial statements.
The following table presents the Company’s revenue disaggregated by geography, based on billing address of the customer (in thousands):
| Six Months Ended June 30, | Year Ended December 31, | |||||||||||||||
| 2021 | 2020 | 2020 | 2019 | |||||||||||||
| (unaudited) | ||||||||||||||||
| United States |
$ | 107,346 | $ | 85,477 | $ | 183,745 | $ | 152,112 | ||||||||
| Rest of World |
10,424 | 9,632 | 19,477 | 15,889 | ||||||||||||
|
|
|
|
|
|
|
|
|
|||||||||
| Total revenue |
$ | 117,770 | $ | 95,109 | $ | 203,222 | $ | 168,001 | ||||||||
|
|
|
|
|
|
|
|
|
|||||||||
The Company has no significant long-lived assets held outside of the United States.
13. Transactions with Related Parties
In each of the years ended December 31, 2020 and 2019, the Company recognized a management fee to its owners of $1.4 million. In the six month periods ended June 30, 2021 and June 30, 2020 (unaudited), the Company recognized a management fee to its owners of $1.2 million and $0.7 million, respectively.
F-30
Table of Contents
Index to Financial Statements
CWAN HOLDINGS, LLC AND SUBSIDIARIES
Notes to Consolidated Financial Statements
During January 2021 the Company paid $9.6 million (unaudited) in relation to management fees to its owners which is recorded as prepaid management fees within prepaid expenses and other current assets and non-current assets. The prepaid management fees relate to the four-year period subsequent to the completion of the recapitalization transaction and are being amortized over four years.
During the years ended December 31, 2020 and 2019, and six month periods ended June 30, 2021 and 2020 (unaudited), the Company provided services to Clearwater Advisors, a company owned by a significant shareholder of the Company that transferred a significant majority of their shareholdings as a part of the recapitalization described in Note 11. Revenue related to services provided was $0.7 million for each of the years ended December 31, 2020 and 2019, and $0.5 million and $0.3 million for the six month periods ended June 30, 2021 and 2020 (unaudited), respectively.
14. Subsequent Events
The Company has evaluated subsequent events through June 10, 2021, the date the financial statements were available to be issued.
The Company authorized the issuance of approximately 1 million options to Company employees that vest over a five-year period and 5.4 million options to employees that vest over a four-year period. These options were authorized primarily in conjunction with the Company’s annual grant to refresh employee options. The options are granted consistent with the Company’s accounting practices and policies disclosed (see Note 9, Equity-Based Compensation).
In addition to the annual grant to refresh employee options, the Company has issued a further 1.5 million options to newly appointed Directors and new employees that vest over a four-year period.
The unrecognized compensation expense associated with these awards is $38.8 million which is expected to be recognized over a weighted average period of 4.2 years.
Since December 31, 2020, the Board authorized the increase in the option pool by 4.9 million units.
In April 2021, the Company incorporated a subsidiary in France as Clearwater Analytics France SAS.
In May 2021, the Company changed its name from Carbon Analytics Holdings, LLC to CWAN Holdings, LLC.
In connection with preparing for an initial public offering, the Company’s Board of Directors approved a four-for-one reverse unit split of the Company’s Common Unit. The reverse unit split was effective on September 4, 2021. All unit and per unit amounts in the financial statements and notes 6, 9, 10, 11 and 14 have been retroactively adjusted to give effect to the reverse unit split.
Subsequent Events (unaudited)
In preparing the unaudited consolidated financial statements as of June 30, 2021 and for the six month period ended June 30, 2021 and 2020, the Company has evaluated subsequent events through September 14, 2021, which is the date these unaudited financial statements were available for issuance.
Since June 30, 2021, the Company has issued 0.8 million options to Company employees. The unrecognized compensation expense associated with these awards is $6.0 million which is expected to be recognized over a weighted average period of 3.9 years.
F-31
Table of Contents
Index to Financial Statements

Table of Contents
Index to Financial Statements
30,000,000 Shares
Clearwater Analytics Holdings, Inc.
Class A Common Stock

Bookrunners
Goldman Sachs & Co. LLC
J.P. Morgan
Morgan Stanley
Credit Suisse
RBC Capital Markets
Wells Fargo Securities
Oppenheimer & Co.
Piper Sandler
William Blair
Co-Managers
BNP PARIBAS
D.A. Davidson & Co.
AmeriVet Securities
Loop Capital Markets
Penserra Securities LLC
R. Seelaus & Co., LLC
Siebert Williams Shank
Table of Contents
Index to Financial Statements
PART II
INFORMATION NOT REQUIRED IN PROSPECTUS
| Item 13. | Other Expenses of Issuance and Distribution |
The following table sets forth all expenses to be paid by the registrant, other than estimated underwriting discounts and commissions, in connection with this offering. All expenses will be borne by the registrant. All amounts shown are estimates except for the SEC registration fee, the FINRA filing fee and the NYSE listing fee.
| Amount to be Paid | ||||
| SEC Registration Fee |
$ | 60,223 | ||
| FINRA filing fee |
82,800 | |||
| NYSE listing fee |
150,000 | |||
| Printing |
250,000 | |||
| Legal fees and expenses |
4,000,000 | |||
| Accounting fees and expenses |
1,250,000 | |||
| Transfer agent and registrar fees |
15,000 | |||
| Miscellaneous expenses |
3,691,977 | |||
|
|
|
|||
| Total: |
$ | 9,500,000 | ||
|
|
|
|||
| Item 14. | Indemnification of Directors and Officers. |
Section 145 of the DGCL authorizes a corporation’s Board of Directors to grant, and authorizes a court to award, indemnity to officers, directors and other corporate agents. As permitted by Section 102(b)(7) of the DGCL, the registrant’s certificate of incorporation to be in effect upon the closing of this offering includes provisions that eliminate the personal liability of its directors and officers for monetary damages for breach of their fiduciary duty as directors and officers, except for liability (i) for any breach of the director’s duty of loyalty to the corporation or its stockholders, (ii) for acts or omissions not in good faith or which involve intentional misconduct or a knowing violation of law, (iii) for unlawful payments of dividends or unlawful stock repurchases, redemptions or other distributions or (iv) for any transaction from which the director derived an improper personal benefit.
In addition, as permitted by Section 145 of the DGCL, the amended and restated bylaws of the registrant to be in effect upon the closing of this offering provide that:
| • | The registrant shall indemnify its directors and officers for serving the registrant in those capacities or for serving other business enterprises at the registrant’s request, to the fullest extent permitted by Delaware law. Delaware law provides that a corporation may indemnify such person if such person acted in good faith and in a manner such person reasonably believed to be in or not opposed to the best interests of the registrant and, with respect to any criminal action or proceeding, had no reasonable cause to believe such person’s conduct was unlawful. |
| • | The registrant may, in its discretion, indemnify employees and agents in those circumstances where indemnification is permitted by applicable law. |
| • | The registrant is required to advance expenses, as incurred, to its directors and officers in connection with defending a proceeding, except that such director or officer shall undertake to repay such advances if it is ultimately determined that such person is not entitled to indemnification. |
| • | The registrant is not obligated pursuant to the bylaws to indemnify a person with respect to proceedings initiated by that person, except with respect to proceedings authorized by the registrant’s Board of Directors or brought to enforce a right to indemnification. |
II-1
Table of Contents
Index to Financial Statements
| • | The rights conferred in the bylaws are not exclusive, and the registrant is authorized to enter into indemnification agreements with its directors, officers, employees and agents and to obtain insurance to indemnify such persons. |
| • | The registrant may not retroactively amend the bylaw provisions to reduce its indemnification obligations to directors, officers, employees and agents. |
The registrant also maintains directors’ and officers’ insurance to insure such persons against certain liabilities.
The registrant intends to enter into separate indemnification agreements with its directors and officers. Each indemnification agreement will provide, among other things, for indemnification to the fullest extent permitted by law and the registrant’s certificate of incorporation and bylaws against any and all expenses, judgments, fines, penalties and amounts paid in settlement of any claim. The indemnification agreements will provide for the advancement or payment of all expenses to the indemnitee and for reimbursement to us if it is found that such indemnitee is not entitled to such indemnification under applicable law and the registrant’s certificate of incorporation and bylaws.
These indemnification provisions may be sufficiently broad to permit indemnification of the registrant’s officers and directors for liabilities (including reimbursement of expenses incurred) arising under the Securities Act.
Under the Stockholders’ Agreement, a form of which is filed as Exhibit 10.3 to this registration statement, we have agreed, subject to certain exceptions, to indemnify the Principal Equity Owners, and various affiliated persons and indirect equityholders of the Principal Equity Owners from certain losses arising out of any threatened or actual litigation by reason of the fact that the indemnified person is or was a holder of our common stock or, prior to the completion of the Transactions, of equity interests in CWAN Holdings, LLC.
The underwriting agreement, a form of which is filed as Exhibit 1.1 to this registration statement, provides for indemnification by the underwriters of the registrant and its officers and directors for certain liabilities arising under the Securities Act and otherwise.
| Item 15. | Recent Sales of Unregistered Securities. |
Since January 1, 2018 through the filing date of this registration statement, we granted to our directors, officers, employees, consultants and other service providers options to purchase an aggregate of 28,379,447 units of Carbon Analytics Holdings, LLC under the 2017 Equity Incentive Plan with a weighted average exercise price of $7.72 per unit.
Since January 1, 2018 through the filing date of this registration statement, we issued to our directors, officers, employees, consultants and other service providers an aggregate of 4,851,901 units of Carbon Analytics Holdings, LLC pursuant to the exercise of equity options for aggregate consideration of $20,531,244.
Since January 1, 2018 through the filing date of this registration statement, we granted to an officer 375,000 restricted stock units of Carbon Analytics Holdings, LLC under the 2017 Equity Incentive Plan.
The equity options and the units issued upon the exercise of equity options described in this Item 15 were issued, and the restricted stock units described in this Item 15 were granted, pursuant to written compensatory plans or arrangements with our employees, directors, advisors, and consultants, in reliance on the exemption provided by Rule 701 promulgated under the Securities Act, or pursuant to Section 4(a)(2) under the Securities Act.
| Item 16. | Exhibits and Financial Statement Schedules. |
See the Exhibit Index immediately following the signature page hereto, which is incorporated by reference as if fully set forth herein.
II-2
Table of Contents
Index to Financial Statements
| Item 17. | Undertakings. |
The undersigned registrant hereby undertakes to provide to the underwriters at the closing specified in the underwriting agreement certificates in such denominations and registered in such names as required by the underwriters to permit prompt delivery to each purchaser.
Insofar as indemnification for liabilities arising under the Securities Act of 1933 may be permitted to directors, officers and controlling persons of the registrant pursuant to the foregoing provisions, or otherwise, the registrant has been advised that in the opinion of the Securities and Exchange Commission such indemnification is against public policy as expressed in the Act and is, therefore, unenforceable. In the event that a claim for indemnification against such liabilities (other than the payment by the registrant of expenses incurred or paid by a director, officer or controlling person of the registrant in the successful defense of any action, suit or proceeding) is asserted by such director, officer or controlling person in connection with the securities being registered, the registrant will, unless in the opinion of its counsel the matter has been settled by controlling precedent, submit to a court of appropriate jurisdiction the question whether such indemnification by it is against public policy as expressed in the Act and will be governed by the final adjudication of such issue.
The undersigned registrant hereby undertakes that:
| 1. | For purposes of determining any liability under the Securities Act of 1933, the information omitted from the form of prospectus filed as part of this registration statement in reliance upon Rule 430A and contained in a form of prospectus filed by the registrant pursuant to Rule 424(b)(1) or (4) or 497(h) under the Securities Act shall be deemed to be part of this registration statement as of the time it was declared effective. |
| 2. | For the purpose of determining any liability under the Securities Act of 1933, each post-effective amendment that contains a form of prospectus shall be deemed to be a new registration statement relating to the securities offered therein, and the offering of such securities at that time shall be deemed to be the initial bona fide offering thereof. |
II-3
Table of Contents
Index to Financial Statements
EXHIBIT INDEX
Item 16. Exhibits
II-4
Table of Contents
Index to Financial Statements
| ** | Filed herewith |
| *** | Previously filed |
| ¥ | Schedules (or similar attachments) have been omitted pursuant to Item 601(a)(5) of Regulation S-K. The registrant will furnish supplemental copies of any omitted schedules (or similar attachments) to the Securities and Exchange Commission upon request. |
| + | Management contract or compensatory plan or arrangement. |
| # | Portions of this exhibit (indicated by asterisks) have been redacted in accordance with Item 601(b)(10)(iv) of Regulation S-K. |
II-5
Table of Contents
Index to Financial Statements
Pursuant to the requirements of the Securities Act of 1933, as amended, Clearwater Analytics Holdings, Inc. has duly caused this registration statement to be signed on its behalf by the undersigned, thereunto duly authorized, in the City of Boise, State of Idaho, on September 21, 2021.
| Clearwater Analytics Holdings, Inc. | ||
| By: | /s/ Sandeep Sahai | |
| Name: Sandeep Sahai | ||
| Title: Chief Executive Officer | ||
* * * *
Pursuant to the requirements of the Securities Act of 1933, as amended, this registration statement has been signed by the following persons in the capacities and on the dates indicated below.
| Signature |
Title |
Date | ||
| /s/ Sandeep Sahai Sandeep Sahai |
Chief Executive Officer and Director |
September 21, 2021 | ||
| /s/ Jim Cox Jim Cox |
Chief Financial Officer |
September 21, 2021 | ||
| * Eric Lee |
Director |
September 21, 2021 | ||
| * Jacques Aigrain |
Director |
September 21, 2021 | ||
| * Kathleen A. Corbet |
Director |
September 21, 2021 | ||
| * Cary Davis |
Director |
September 21, 2021 | ||
Table of Contents
Index to Financial Statements
| Signature |
Title |
Date | ||
| * Anthony J. deNicola |
Director |
September 21, 2021 | ||
| * Christopher Hooper |
Director |
September 21, 2021 | ||
| * Marcus Ryu |
Director |
September 21, 2021 | ||
| * Andrew Young |
Director |
September 21, 2021 | ||
| * | /s/ Sandeep Sahai | |
| Sandeep Sahai | ||
| Attorney-in-Fact |
Exhibit 23.1
Consent of Independent Registered Public Accounting Firm
We consent to the use of our report dated June 10, 2021 with respect to the financial statements of Clearwater Analytics Holdings, Inc., included herein and to the reference to our firm under the heading “Experts” in the prospectus.
/s/ KPMG LLP
Boise, Idaho
September 21, 2021
Exhibit 23.2
Consent of Independent Registered Public Accounting Firm
We consent to the use of our report dated June 10, 2021, except for the third and fourth paragraphs of Note 14, as to which the date is August 13, 2021, and the eighth paragraph of Note 14, as to which the date is September 14, 2021 with respect to the consolidated financial statements of CWAN Holdings, LLC, included herein and to the reference to our firm under the heading “Experts” in the prospectus.
/s/ KPMG LLP
Boise, Idaho
September 21, 2021
Serious News for Serious Traders! Try StreetInsider.com Premium Free!
You May Also Be Interested In
- Trump Media & Technology (DJT) Declines 17% on Concerns Stockholders May Sell Shares
- HeartCore Signs 14th Go IPO Contract
- Cyngn Inc (CYN) Receives Notice of Allowance for 20th U.S. Patent
Create E-mail Alert Related Categories
SEC FilingsRelated Entities
S1Sign up for StreetInsider Free!
Receive full access to all new and archived articles, unlimited portfolio tracking, e-mail alerts, custom newswires and RSS feeds - and more!
