

Form N-CSRS UNIFIED SERIES TRUST For: Mar 31
 Tweet
Tweet Share
Shareunited
states
securities and exchange commission
washington, d.c. 20549
form n-csr
certified shareholder report of registered management
investment companies
Investment Company Act file number 811-21237
Unified Series Trust
(Exact name of registrant as specified in charter)
225 Pictoria Drive, Suite 450
Cincinnati, OH 45246
(Address of principal executive offices)
(Zip code)
Zachary P. Richmond
Ultimus Fund Solutions, LLC
225 Pictoria Drive, Suite 450
Cincinnati, OH 45246
(Name and address of agent for service)
Registrant's telephone number, including area code: 513-587-3400
Date of fiscal year end: 9/30
Date of reporting period: 3/31/2023
Form N-CSR is to be used by management investment companies to file reports with the Commission not later than 10 days after the transmission to stockholders of any report that is required to be transmitted to stockholders under Rule 30e-1 under the Investment Company Act of 1940 (17 CFR 270.30e-1). The Commission may use the information provided on Form N-CSR in its regulatory, disclosure review, inspection and policymaking roles.
A registrant is required to disclose the information specified by Form N-CSR, and the Commission will make this information public. A registrant is not required to respond to the collection of information contained in Form N-CSR unless the Form displays a currently valid Office of Management and Budget ("OMB") control number. Please direct comments concerning the accuracy of the information collection burden estimate and any suggestions for reducing the burden to Secretary, Securities and Exchange Commission, 450 Fifth Street, NW, Washington, DC 20549-0609. The OMB has reviewed this collection of information under the clearance requirements of 44 U.S.C. § 3507.
Item 1. Reports to Stockholders.
| (a) |

Ballast Small/Mid Cap ETF (MGMT)
NYSE Arca, Inc.
Semi-Annual Report
March 31, 2023
Fund Adviser:
Ballast Asset Management, LP
2911 Turtle Creek Blvd, Suite 840
Dallas, TX 75219
1-866-383-6468
Investment Results (Unaudited)
Average Annual Total Return* as of March 31, 2023
| Since | ||||||
| Inception | ||||||
| December 2, | ||||||
| Six Months | One Year | 2020 | ||||
| Ballast Small/Mid Cap ETF - NAV | 15.72% | (4.31)% | 13.62% | |||
| Ballast Small/Mid Cap ETF - Market Price | 15.87% | (4.45)% | 13.77% | |||
| Russell 2500 Value Index(a) | 10.73% | (10.53)% | 7.55% |
Total annual operating expenses, as disclosed in the Ballast Small/Mid Cap ETF’s (the “Fund”) prospectus dated January 28, 2023, were 1.10% of average daily net assets (1.37% before fee waivers/expense reimbursements by Ballast Asset Management, LP (the “Adviser”)). The Adviser contractually has agreed to waive its management fee and/or reimburse expenses so that total annual Fund operating expenses, excluding portfolio transaction and other investment-related costs (including brokerage fees and commissions); taxes; borrowing costs (such as interest and dividend expenses on securities sold short); acquired fund fees and expenses; fees and expenses associated with investments in other collective investment vehicles or derivative instruments (including for example option and swap fees and expenses); any administrative and/or shareholder servicing fees payable pursuant to a plan adopted by the Board of Trustees; expenses incurred in connection with any merger or reorganization; extraordinary expenses (such as litigation expenses, indemnification of Trust officers and Trustees and contractual indemnification of Fund service providers); and other expenses that the Trustees agree have not been incurred in the ordinary course of the Fund’s business, do not exceed 1.10% through January 31, 2024. This expense cap may not be terminated prior to this date except by the Board of Trustees. Each waiver/expense payment by the Adviser is subject to recoupment by the Adviser from the Fund in the three years following the date the particular waiver/expense payment occurred, but only if such recoupment can be achieved without exceeding the annual expense limitation in effect at the time of the waiver/expense payment and any expense limitation in effect at the time of the recoupment. Additional information pertaining to the Fund’s expense ratios as of March 31, 2023 can be found in the financial highlights.
The performance quoted represents past performance, which does not guarantee future results. The investment return and principal value of an investment will fluctuate so that an investor’s shares, when redeemed, may be worth more or less than their original cost. The returns shown do not reflect deduction of taxes that a shareholder would pay on the Fund distributions or the redemption of Fund shares. Current performance of the Fund may be lower or higher than the performance quoted. The Fund’s investment objectives, risks, charges and expenses should be considered carefully before investing. Performance data current to the most recent month end may be obtained by calling (866) 383-6468. The Fund’s per share net asset value (“NAV”) is the value of one share of the Fund as calculated in accordance with the standard formula for valuing shares. The NAV return is based on the NAV of the Fund and the market return is based on the market price per share of the Fund. The price used to calculate market return (“Market Price”) is determined by using the midpoint between the highest bid and the lowest offer on the primary stock exchange on which the shares of the Fund are listed for trading, as of the time that the Fund’s NAV is calculated. Market Price and NAV returns assume that dividends and capital gain distributions have been reinvested in the Fund at Market Price and NAV, respectively. Since exchange-traded funds are bought and sold at prices set by the market, which can result in a premium or discount to NAV, the returns calculated using Market Price can differ from those calculated using NAV.
| * | Return figures reflect any change in price per share and assume the reinvestment of all distributions. The Fund’s returns reflect any fee reductions during the applicable periods. If such fee reductions had not occurred, the quoted performance would have been lower. Total returns for less than one year are not annualized. |
1
Investment Results (Unaudited) (continued)
| (a) | The Russell 2500 Value Index (the “Index”) is a widely recognized unmanaged index of equity securities and is representative of a broader domestic equity market and range of securities than is found in the Fund’s portfolio. Individuals cannot invest directly in the Index; however, an individual can invest in exchange-traded funds or other investment vehicles that attempt to track the performance of a benchmark index. |
The Fund’s investment objectives, strategies, risks, charges and expenses should be considered carefully before investing. The prospectus contains this and other important information about the Fund and may be obtained by calling (866) 383-6468. Please read it carefully before investing.
The Fund is distributed by Northern Lights Distributors, LLC, Member FINRA/SIPC.
2
Fund Holdings (Unaudited)
Ballast Small/Mid Cap ETF Holdings as of March 31, 2023.*
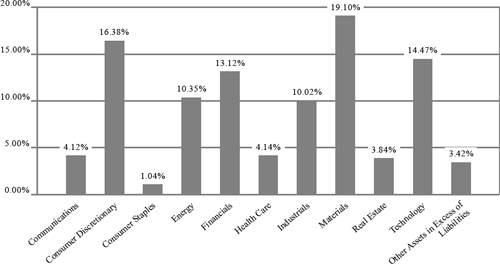
| * | As a percentage of net assets. |
The Fund seeks to generate positive risk adjusted returns as its investment objective.
Portfolio holdings are subject to change.
Availability of Portfolio Schedule (Unaudited)
The Fund files its complete schedule of portfolio holdings with the Securities and Exchange Commission (the “SEC”) for the first and third quarters of each fiscal year as an exhibit to its reports on Form N-PORT. The Fund’s Form N-PORT reports are available on the SEC’s website at www. sec.gov or on the Fund’s website at www.etf.mgmtetf.com.
3
| Ballast Small/Mid Cap ETF |
| Schedule of Investments |
| March 31, 2023 (Unaudited) |
| COMMON STOCKS — 96.58% | Shares | Fair Value | ||||||
| Communications — 4.12% | ||||||||
| Criteo S.A. - ADR(a) | 58,930 | $ | 1,856,590 | |||||
| IAC/InterActiveCorp.(a) | 5,229 | 269,816 | ||||||
| TripAdvisor, Inc.(a) | 36,271 | 720,342 | ||||||
| 2,846,748 | ||||||||
| Consumer Discretionary — 16.38% | ||||||||
| Advance Auto Parts, Inc. | 6,035 | 733,916 | ||||||
| American Eagle Outfitters, Inc. | 70,965 | 953,770 | ||||||
| America’s Car-Mart, Inc.(a) | 19,090 | 1,512,119 | ||||||
| BorgWarner, Inc. | 37,350 | 1,834,259 | ||||||
| Cavco Industries, Inc.(a) | 4,316 | 1,371,366 | ||||||
| Global Business Travel Group Inc.(a) | 186,707 | 1,237,867 | ||||||
| Polished.com, Inc.(a) | 1,093,232 | 568,590 | ||||||
| Wayside Technology Group, Inc. | 58,100 | 3,096,149 | ||||||
| 11,308,036 | ||||||||
| Consumer Staples — 1.04% | ||||||||
| Olaplex Holdings, Inc.(a) | 168,214 | 718,274 | ||||||
| Energy — 10.35% | ||||||||
| CNX Resources Corp.(a) | 60,507 | 969,322 | ||||||
| Epsilon Energy Ltd. | 117,681 | 628,417 | ||||||
| Green Plains, Inc.(a) | 72,957 | 2,260,937 | ||||||
| Kosmos Energy Ltd.(a) | 110,375 | 821,190 | ||||||
| Sitio Royalties Corp. | 35,080 | 792,808 | ||||||
| Solaris Oilfield Infrastructure, Inc., Class A | 195,963 | 1,673,524 | ||||||
| 7,146,198 | ||||||||
| Financials — 13.12% | ||||||||
| Capital Bancorp, Inc. | 81,257 | 1,352,116 | ||||||
| Everest Re Group Ltd. | 4,150 | 1,485,783 | ||||||
| Federal Agricultural Mortgage Corp., Class C | 15,023 | 2,000,914 | ||||||
| International General Insurance Holdings Ltd. | 169,408 | 1,404,392 | ||||||
| International Money Express, Inc.(a) | 53,758 | 1,385,881 | ||||||
| MGIC Investment Corp. | 106,489 | 1,429,083 | ||||||
| 9,058,169 | ||||||||
| Health Care — 4.14% | ||||||||
| Bausch + Lomb Corp.(a) | 84,976 | 1,479,432 | ||||||
| iRadimed Corp. | 16,268 | 640,146 | ||||||
| QuidelOrtho Corp.(a) | 8,300 | 739,447 | ||||||
| 2,859,025 | ||||||||
| Industrials — 10.02% | ||||||||
| AZZ, Inc. | 43,160 | 1,779,918 | ||||||
| Eagle Bulk Shipping, Inc. | 20,300 | 923,650 | ||||||
| Landstar System, Inc. | 9,794 | 1,755,673 | ||||||
| Lennox International, Inc. | 4,316 | 1,084,524 | ||||||
| Timken Co. (The) | 9,090 | 742,835 | ||||||
| XPO, Inc.(a) | 19,682 | 627,856 | ||||||
| 6,914,456 | ||||||||
See accompanying notes which are an integral part of these financial statements.
4
| Ballast Small/Mid Cap ETF |
| Schedule of Investments (continued) |
| March 31, 2023 (Unaudited) |
| COMMON STOCKS — 96.58% (continued) | Shares | Fair Value | ||||||
| Materials — 19.10% | ||||||||
| Bioceres Crop Solutions Corp.(a) | 125,704 | $ | 1,459,423 | |||||
| CONSOL Energy, Inc. | 24,094 | 1,403,957 | ||||||
| Eagle Materials, Inc. | 12,035 | 1,766,136 | ||||||
| Ecovyst, Inc.(a) | 66,790 | 738,030 | ||||||
| Huntsman Corp. | 54,199 | 1,482,885 | ||||||
| Natural Resource Partners, L.P. | 35,134 | 1,833,995 | ||||||
| Northern Technologies International Corp. | 141,183 | 1,670,194 | ||||||
| Perimeter Solutions S.A.(a) | 121,838 | 984,451 | ||||||
| UFP Technologies, Inc.(a) | 14,157 | 1,838,145 | ||||||
| 13,177,216 | ||||||||
| Real Estate — 3.84% | ||||||||
| EPR Properties | 29,050 | 1,106,805 | ||||||
| Lamar Advertising Co., Class A | 15,438 | 1,542,102 | ||||||
| 2,648,907 | ||||||||
| Technology — 14.47% | ||||||||
| Amdocs Ltd. | 16,204 | 1,556,070 | ||||||
| Cass Information Systems, Inc. | 44,820 | 1,941,154 | ||||||
| Extreme Networks, Inc.(a) | 50,400 | 963,648 | ||||||
| F5, Inc.(a) | 7,387 | 1,076,212 | ||||||
| Richardson Electronics Ltd. | 41,482 | 925,878 | ||||||
| Rimini Street, Inc.(a) | 295,231 | 1,216,352 | ||||||
| Teradata Corp.(a) | 57,270 | 2,306,836 | ||||||
| 9,986,150 | ||||||||
| Total Investments — 96.58% (Cost $68,195,954) | 66,663,179 | |||||||
| Other Assets in Excess of Liabilities — 3.42% | 2,359,825 | |||||||
| NET ASSETS — 100.00% | $ | 69,023,004 | ||||||
| (a) | Non-income producing security. |
ADR - American Depositary Receipt.
See accompanying notes which are an integral part of these financial statements.
5
| Ballast Small/Mid Cap ETF |
| Statement of Assets and Liabilities |
| March 31, 2023 (Unaudited) |
| Assets | ||||
| Investments in securities, at fair value (cost $68,195,954) | $ | 66,663,179 | ||
| Cash | 2,403,508 | |||
| Dividends receivable | 22,694 | |||
| Prepaid expenses | 768 | |||
| Total Assets | 69,090,149 | |||
| Liabilities | ||||
| Payable to Adviser, net of waiver | 45,880 | |||
| Payable to affiliates | 6,950 | |||
| Payable to audit and tax | 10,471 | |||
| Other accrued expenses | 3,844 | |||
| Total Liabilities | 67,145 | |||
| Net Assets | $ | 69,023,004 | ||
| Net Assets consist of: | ||||
| Paid-in capital | $ | 75,242,052 | ||
| Accumulated deficit | (6,219,048 | ) | ||
| Net Assets | $ | 69,023,004 | ||
| Shares outstanding (unlimited number of shares authorized, no par value) | 2,075,000 | |||
| Net asset value per share | $ | 33.26 |
See accompanying notes which are an integral part of these financial statements.
6
| Ballast Small/Mid Cap ETF |
| Statement of Operations |
| For the six months ended March 31, 2023 (Unaudited) |
| Investment Income | ||||
| Dividend income | $ | 750,945 | ||
| Total investment income | 750,945 | |||
| Expenses | ||||
| Adviser | 322,454 | |||
| Administration | 32,311 | |||
| Custodian | 14,556 | |||
| Legal | 11,084 | |||
| Compliance services | 9,972 | |||
| Audit and tax | 9,663 | |||
| Trustee | 9,564 | |||
| Transfer agent | 5,383 | |||
| Report printing | 5,018 | |||
| Insurance | 1,552 | |||
| Pricing | 533 | |||
| Miscellaneous | 16,049 | |||
| Total expenses | 438,139 | |||
| Fees waived by Adviser | (64,517 | ) | ||
| Net operating expenses | 373,622 | |||
| Net investment income | 377,323 | |||
| Net Realized and Change in Unrealized Gain (Loss) on Investments | ||||
| Net realized gain (loss) on: | ||||
| Investment securities | (409,368 | ) | ||
| Change in unrealized appreciation on: | ||||
| Investment securities | 9,361,084 | |||
| Net realized and unrealized gain (loss) on investment securities | 8,951,716 | |||
| Net increase in net assets resulting from operations | $ | 9,329,039 |
See accompanying notes which are an integral part of these financial statements.
7
| Ballast Small/Mid Cap ETF |
| Statements of Changes in Net Assets |
| For the Six | For the | |||||||
| Months Ended | Year Ended | |||||||
| March 31, | September 30, | |||||||
| 2023 | 2022 | |||||||
| (Unaudited) | ||||||||
| Increase (Decrease) in Net Assets due to: | ||||||||
| Operations | ||||||||
| Net investment income | $ | 377,323 | $ | 545,617 | ||||
| Net realized loss on investment securities | (409,368 | ) | (1,565,196 | ) | ||||
| Change in unrealized appreciation (depreciation) on investment securities | 9,361,084 | (12,145,398 | ) | |||||
| Net increase (decrease) in net assets resulting from operations | 9,329,039 | (13,164,977 | ) | |||||
| Distributions to Shareholders from: | ||||||||
| Earnings | (593,243 | ) | (120,500 | ) | ||||
| Total distributions | (593,243 | ) | (120,500 | ) | ||||
| Capital Transactions | ||||||||
| Proceeds from shares sold | 7,205,150 | 48,030,316 | ||||||
| Amount paid for shares redeemed | (6,359,153 | ) | (12,811,113 | ) | ||||
| Net increase in net assets resulting from capital transactions | 845,997 | 35,219,203 | ||||||
| Total Increase in Net Assets | 9,581,793 | 21,933,726 | ||||||
| Net Assets | ||||||||
| Beginning of period | $ | 59,441,211 | $ | 37,507,485 | ||||
| End of period | $ | 69,023,004 | $ | 59,441,211 | ||||
| Share Transactions | ||||||||
| Shares sold | 225,000 | 1,375,000 | ||||||
| Shares redeemed | (200,000 | ) | (375,000 | ) | ||||
| Net increase in shares outstanding | 25,000 | 1,000,000 | ||||||
See accompanying notes which are an integral part of these financial statements.
8
| Ballast Small/Mid Cap ETF |
| Financial Highlights |
| (For a share outstanding during each period) |
| For the Six | ||||||||||||
| Months | For the | |||||||||||
| Ended | For the | Period | ||||||||||
| March | Year Ended | Ended | ||||||||||
| 31, 2023 | September | September | ||||||||||
| (Unaudited) | 30, 2022 | 30, 2021(a) | ||||||||||
| Selected Per Share Data: | ||||||||||||
| Net asset value, beginning of period | $ | 29.00 | $ | 35.72 | $ | 25.00 | ||||||
| Investment operations: | ||||||||||||
| Net investment income | 0.18 | 0.30 | 0.02 | |||||||||
| Net realized and unrealized gain (loss) on investments | 4.37 | (6.92 | ) | 10.70 | ||||||||
| Total from investment operations | 4.55 | (6.62 | ) | 10.72 | ||||||||
| Less distributions to shareholders from: | ||||||||||||
| Net investment income | (0.29 | ) | (0.10 | ) | — | |||||||
| Total distributions | (0.29 | ) | (0.10 | ) | — | |||||||
| Net asset value, end of period | $ | 33.26 | $ | 29.00 | $ | 35.72 | ||||||
| Market price, end of period | $ | 33.26 | $ | 29.05 | $ | 35.80 | ||||||
| Total Return(b) | 15.72 | % (c) | (18.60 | )% | 42.88 | % (c) | ||||||
| Ratios and Supplemental Data: | ||||||||||||
| Net assets, end of period (000 omitted) | $ | 69,023 | $ | 59,441 | $ | 37,507 | ||||||
| Ratio of net expenses to average net assets | 1.10 | % (d) | 1.10 | % | 1.10 | % (d) | ||||||
| Ratio of expenses to average net assets before waiver and reimbursement | 1.29 | % (d) | 1.37 | % | 2.08 | % (d) | ||||||
| Ratio of net investment income to average net assets | 1.11 | % (d) | 1.00 | % | 0.10 | % (d) | ||||||
| Portfolio turnover rate(e) | 15 | % (c) | 29 | % | 8 | % (c) | ||||||
| (a) | For the period December 2, 2020 (commencement of operations) to September 30, 2021. |
| (b) | Total return is calculated assuming a purchase of shares at net asset value on the first day and a sale at net asset value on the last day of the period. Distributions are assumed, for the purpose of this calculation, to be reinvested at the ex-dividend date net asset value per share on their respective payment dates. |
| (c) | Not annualized. |
| (d) | Annualized. |
| (e) | Portfolio turnover rate excludes securities received or delivered from in-kind processing of creations or redemptions. |
See accompanying notes which are an integral part of these financial statements.
9
| Ballast Small/Mid Cap ETF |
| Notes to the Financial Statements |
| March 31, 2023 (Unaudited) |
NOTE 1. ORGANIZATION
Ballast Small/Mid Cap ETF (the “Fund”) was organized as a diversified series of Unified Series Trust (the “Trust”) on November 18, 2020, and is registered under the Investment Company Act of 1940, as amended (the “1940 Act”). The Trust is an open-end investment company established under the laws of Ohio by an Agreement and Declaration of Trust dated October 14, 2002, as amended (the “Trust Agreement”). The Trust Agreement permits the Board of Trustees of the Trust (the “Board”) to issue an unlimited number of shares of beneficial interest of separate series. The Fund is one of a series of funds currently authorized by the Board. The Fund’s investment adviser is Ballast Asset Management, LP (the “Adviser”). The Fund seeks to generate positive risk adjusted returns as its investment objective.
NOTE 2. SIGNIFICANT ACCOUNTING POLICIES
The Fund is an investment company and follows accounting and reporting guidance under Financial Accounting Standards Board Accounting Standards Codification (“ASC”) Topic 946, “Financial Services-Investment Companies”. The following is a summary of significant accounting policies followed by the Fund in the preparation of its financial statements. These policies are in conformity with generally accepted accounting principles in the United States of America (“GAAP”).
Estimates – The preparation of financial statements in conformity with GAAP requires management to make estimates and assumptions that affect the reported amounts of assets and liabilities and disclosure of contingent assets and liabilities at the date of the financial statements and the reported amounts of increases and decreases in net assets from operations during the reporting period. Actual results could differ from those estimates.
Federal Income Taxes – The Fund makes no provision for federal income or excise tax. The Fund has qualified and intends to qualify each year as a regulated investment company (“RIC”) under subchapter M of the Internal Revenue Code of 1986, as amended, by complying with the requirements applicable to RICs and by distributing substantially all of its taxable income. The Fund also intends to distribute sufficient net investment income and net realized capital gains, if any, so that it will not be subject to excise tax on undistributed income and gains. If the required amount of net investment income or gains is not distributed, the Fund could incur a tax expense.
As of and during the six months ended March 31, 2023, the Fund did not have any liabilities for any unrecognized tax benefits. The Fund recognizes interest and penalties, if any, related to unrecognized tax benefits as income tax expense in the Statement of Operations when incurred. During the period, the Fund did not incur any interest or
10
| Ballast Small/Mid Cap ETF |
| Notes to the Financial Statements (continued) |
| March 31, 2023 (Unaudited) |
penalties. Management of the Fund has reviewed tax positions taken in tax years that remain subject to examination by all major tax jurisdictions, including federal (i.e., the previous three tax year ends and the interim tax period since then, as applicable) and has concluded that no provision for unrecognized tax benefits or expenses is required in these financial statements and does not expect this to change over the next twelve months.
Expenses – Expenses incurred by the Trust that do not relate to the Fund are allocated to the individual funds of the Trust based on each fund’s relative net assets or another appropriate basis (as determined by the Board). The Adviser has agreed to pay all regular and recurring expenses of the Fund under terms of the investment advisory agreement.
Security Transactions and Related Income – The Fund follows industry practice and records security transactions on the trade date for financial reporting purposes. The specific identification method is used for determining gains or losses for financial statements and income tax purposes. Dividend income is recorded on the ex-dividend date and interest income is recorded on an accrual basis. Distributions received from investments in real estate investment trusts (“REITs”) that represent a return of capital or capital gain are recorded as a reduction of the cost of investment or as a realized gain, respectively. The calendar year-end amounts of ordinary income, capital gains, and return of capital included in distributions received from the Fund’s investments in REITs are reported to the Fund after the end of the calendar year; accordingly, the Fund estimates these amounts for accounting purposes until the characterization of REIT distributions is reported. Estimates are based on the most recent REIT distributions information available. Withholding taxes on foreign dividends and related reclaims have been provided for in accordance with the Fund’s understanding of the applicable country’s tax rules and rates.
Dividends and Distributions – The Fund intends to distribute its net investment income and net realized long-term and short-term capital gains, if any, at least annually. Dividends and distributions to shareholders, which are determined in accordance with income tax regulations, are recorded on the ex-dividend date. The treatment for financial reporting purposes of distributions made to shareholders during the period from net investment income or net realized capital gains may differ from their ultimate treatment for federal income tax purposes. These differences are caused primarily by differences in the timing of the recognition of certain components of income, expense or realized capital gain for federal income tax purposes. Where such differences are permanent in nature, they are reclassified among the components of net assets based on their ultimate characterization for federal income tax purposes. Any such reclassifications will have no effect on net assets, results of operations or net asset value (“NAV”) per share of the Fund.
11
| Ballast Small/Mid Cap ETF |
| Notes to the Financial Statements (continued) |
| March 31, 2023 (Unaudited) |
NOTE 3. SECURITIES VALUATION AND FAIR VALUE MEASUREMENTS
The Fund values its portfolio securities at fair value as of the close of regular trading on the New York Stock Exchange (“NYSE”) (normally 4:00 p.m. Eastern Time) on each business day the NYSE is open for business. Fair value is defined as the price that the Fund would receive upon selling an investment in a timely transaction to an independent buyer in the principal or most advantageous market of the investment. GAAP establishes a three-tier hierarchy to maximize the use of observable market data and minimize the use of unobservable inputs and to establish classification of fair value measurements for disclosure purposes.
Inputs refer broadly to the assumptions that market participants would use in pricing the asset or liability, including assumptions about risk (the risk inherent in a particular valuation technique used to measure fair value including a pricing model and/or the risk inherent in the inputs to the valuation technique). Inputs may be observable or unobservable. Observable inputs are inputs that reflect the assumptions market participants would use in pricing the asset or liability developed based on market data obtained and available from sources independent of the reporting entity. Unobservable inputs are inputs that reflect the reporting entity’s own assumptions about the assumptions market participants would use in pricing the asset or liability developed based on the best information available in the circumstances.
Various inputs are used in determining the value of the Fund’s investments. These inputs are summarized in the three broad levels listed below.
| ● | Level 1 – unadjusted quoted prices in active markets for identical investments and/or registered investment companies where the value per share is determined and published and is the basis for current transactions for identical assets or liabilities at the valuation date |
| ● | Level 2 – other significant observable inputs (including, but not limited to, quoted prices for an identical security in an inactive market, quoted prices for similar securities, interest rates, prepayment speeds, credit risk, etc.) |
| ● | Level 3 – significant unobservable inputs (including the Fund’s own assumptions in determining fair value of investments based on the best information available) |
The inputs used to measure fair value may fall into different levels of the fair value hierarchy. In such cases, for disclosure purposes, the level in the fair value hierarchy which is reported is determined based on the lowest level input that is significant to the fair value measurement in its entirety.
12
| Ballast Small/Mid Cap ETF |
| Notes to the Financial Statements (continued) |
| March 31, 2023 (Unaudited) |
Equity securities that are traded on any stock exchange are generally valued at the last quoted sale price on the security’s primary exchange. Lacking a last sale price, an exchange-traded security is generally valued at its last bid price. Securities traded in the Nasdaq over-the-counter market are generally valued at the Nasdaq Official Closing Price. When using market quotations and when the market is considered active, the security is classified as a Level 1 security. In the event that market quotations are not readily available or are considered unreliable due to market or other events, securities are valued in good faith by the Adviser, as Valuation Designee, under oversight of the Board. The Adviser has adopted written policies and procedures for valuing securities and other assets in circumstances where market quotes are not readily available. In the event that market quotes are not readily available, and the security or asset cannot be valued pursuant to one of the valuation methods, the value of the security or asset will be determined in good faith by the Adviser pursuant to its policies and procedures. The Trust’s administrator maintains a pricing review committee that will review any fair value provided by the Valuation Designee, subject to the ultimate review of the pricing methodology by the Pricing & Liquidity Committee of the Board on a quarterly basis. Under these policies, the securities will be classified as Level 2 or 3 within the fair value hierarchy, depending on the inputs used.
Investments in mutual funds, including money market mutual funds, are generally priced at the ending NAV provided by the service agent of the mutual funds. These securities are categorized as Level 1 securities.
In accordance with the Trust’s valuation policies and fair value determinations pursuant to Rule 2a-5, the Adviser as Valuation Designee is required to consider all appropriate factors relevant to the value of securities for which it has determined other pricing sources are not available or reliable as described above. No single method exists for determining fair value, because fair value depends upon the circumstances of each individual case. As a general principle, the current fair value of a security being valued by the Valuation Designee would be the amount that the Fund might reasonably expect to receive upon the current sale. Methods that are in accordance with this principle may, for example, be based on (i) a multiple of earnings; (ii) a discount from market prices of a similar freely traded security (including a derivative security or a basket of securities traded on other markets, exchanges or among dealers); or (iii) yield to maturity with respect to debt issues, or a combination of these and other methods. Fair-value pricing is permitted if, in the Valuation Designee’s opinion, the validity of market quotations appears to be questionable based on factors such as evidence of a thin market in the security based on a small number of quotations, a significant event occurs after the close of a market but before the Fund’s NAV calculation that may affect a security’s value, or the Valuation Designee is aware of any other data that calls into question the reliability of market quotations.
13
| Ballast Small/Mid Cap ETF |
| Notes to the Financial Statements (continued) |
| March 31, 2023 (Unaudited) |
The following is a summary of the inputs used to value the Fund’s investments as of March 31, 2023:
| Valuation Inputs | ||||||||||||||||
| Assets | Level 1 | Level 2 | Level 3 | Total | ||||||||||||
| Common Stocks (a) | $ | 66,663,179 | $ | — | $ | — | $ | 66,663,179 | ||||||||
| Total | $ | 66,663,179 | $ | — | $ | — | $ | 66,663,179 | ||||||||
| (a) | Refer to Schedule of Investments for sector classifications. |
The Fund did not hold any investments at the end of the reporting period for which significant unobservable inputs (Level 3) were used in determining fair value; therefore, no reconciliation of Level 3 securities is included for this reporting period.
NOTE 4. FEES AND OTHER TRANSACTIONS WITH AFFILIATES AND OTHER SERVICE PROVIDERS
The Adviser, under the terms of the management agreement with the Trust with respect to the Fund (the “Agreement”), manages the Fund’s investments. As compensation for its management services, the Fund is obligated to pay the Adviser a fee computed and accrued daily and paid monthly at an annual rate of 0.95% of the Fund’s average daily net assets. For the six months ended March 31, 2023, before the waiver described below, the Adviser earned a management fee of $322,454 from the Fund.
The Adviser has contractually agreed to waive its management fee and/or reimburse expenses through January 31, 2024 so that total annual operating expenses (excluding portfolio transaction and other investment-related costs (including brokerage fees and commissions); taxes; borrowing costs (such as interest and dividend expenses on securities sold short); acquired fund fees and expenses; fees and expenses associated with investments in other collective investment vehicles or derivative instruments (including for example option and swap fees and expenses); any administrative and/or shareholder servicing fees payable pursuant to a plan adopted by the Board of Trustees; expenses incurred in connection with any merger or reorganization; extraordinary expenses (such as litigation expenses, indemnification of Trust officers and Trustees and contractual indemnification of Fund service providers); and other expenses that the Trustees agree have not been incurred in the ordinary course of the Fund’s business) do not exceed 1.10% of the Fund’s average daily net assets. For the six months ended March 31, 2023, the Adviser waived fees and reimbursed Fund expenses of $64,517. At March 31, 2023, the Fund owed the Adviser $45,880.
Each fee waiver/expense payment by the Adviser is subject to recoupment by the Adviser from the Fund in the three years following the date in which that particular waiver/expense payment occurred, but only if such recoupment can be achieved without exceeding the
14
| Ballast Small/Mid Cap ETF |
| Notes to the Financial Statements (continued) |
| March 31, 2023 (Unaudited) |
annual expense limitation in effect at the time of the waiver/expense payment and any expense limitation in effect at the time of the recoupment. As of March 31, 2023 the Adviser may seek repayment of management fees waived and expense reimbursements pursuant to the aforementioned conditions, from the Fund no later than the dates stated below:
| Recoverable Through | ||||
| September 30, 2024 | $ | 165,632 | ||
| September 30, 2025 | 147,001 | |||
| March 31, 2026 | 64,517 |
Ultimus Fund Solutions, LLC (“Ultimus”) provides administration and fund accounting services to the Fund. The Fund pays Ultimus fees in accordance with the agreements for such services.
Northern Lights Compliance Services, LLC (“NLCS”), an affiliate of Ultimus, provides a Chief Compliance Officer to the Trust, as well as related compliance services, pursuant to a consulting agreement between NLCS and the Trust. Under the terms of such agreement, NLCS receives fees from the Fund, which are approved annually by the Board.
Under the terms of a Distribution Agreement with the Trust, Northern Lights Distributors, LLC (the “Distributor”) serves as principal underwriter to the Fund. The Distributor is an affiliate of Ultimus. The Distributor is compensated by the Adviser (not the Fund) for acting as principal underwriter.
Certain officers and a Trustee of the Trust are also employees of Ultimus and such persons are not paid by the Fund for serving in such capacities.
The Board supervises the business activities of the Trust. Each Trustee serves as a trustee until termination of the Trust unless the Trustee dies, resigns, retires, or is removed. The Chairman of the Board and more than 75% of the Trustees are “Independent Trustees,” which means that they are not “interested persons” as defined in the 1940 Act. The Independent Trustees review and establish compensation at least annually. Each Independent Trustee of the Trust receives annual compensation, which is an established amount paid quarterly per fund in the Trust at the time of the regular quarterly Board meetings. The Chairman of the Board receives the highest compensation, commensurate with his additional duties and each Chair of a committee receives additional compensation as well. Independent Trustees also receive $1,000 for attending any special meeting that requires an in-person approval of a contract and $250 for the first hour and $200 for each additional hour for attending other special meetings. In addition, the Trust reimburses Independent Trustees for out-of-pocket expenses incurred in conjunction with attendance at meetings.
15
| Ballast Small/Mid Cap ETF |
| Notes to the Financial Statements (continued) |
| March 31, 2023 (Unaudited) |
NOTE 5. INVESTMENT TRANSACTIONS
For the period ended March 31, 2023, purchases and sales of investment securities, other than short-term investments, were $9,930,593 and $11,960,951, respectively.
For the period ended March 31, 2023, purchases and sales for in-kind transactions were $7,110,046 and $6,559,515, respectively.
For the period ended March 31, 2023, the Fund had in-kind net realized gains of $1,338,971.
There were no purchases or sales of long-term U.S. government obligations during the period ended March 31, 2023.
NOTE 6. CAPITAL SHARE TRANSACTIONS
Shares are not individually redeemable and may be redeemed by the Fund at NAV only in large blocks known as “Creation Units” of 25,000 shares. Only Authorized Participants or transactions done through an Authorized Participant are permitted to purchase or redeem Creation Units from the Fund. An Authorized Participant is either (i) a broker-dealer or other participant in the clearing process through the Continuous Net Settlement System of the National Securities Clearing Corporation or (ii) a Depository Trust Company participant and, in each case, must have executed a Participant Agreement with the Distributor. Such transactions are generally permitted on an in-kind basis, with a balancing cash component to equate the transaction to the NAV per share of the Fund on the transaction date. Cash may be substituted equivalent to the value of certain securities generally when they are not available in sufficient quantity for delivery, not eligible for trading by the Authorized Participant, or as a result of other market circumstances. In addition, the Fund may impose transaction fees on purchases and redemptions of Fund shares to cover the custodial and other costs incurred by the Fund in effecting trades. A fixed fee payable to the Custodian may be imposed on each creation and redemption transaction regardless of the number of Creation Units involved in the transaction (“Fixed Fee”). Purchases and redemptions of Creation Units for cash or involving cash-in-lieu are required to pay an additional variable charge to compensate the Fund and its ongoing shareholders for brokerage and market impact expenses relating to Creation Unit transactions (“Variable Charge,” and together with the Fixed Fee, the “Transaction Fees”). Transactions in capital shares for the Fund are disclosed in the Statements of Changes in Net Assets. For the six months ended March 31, 2023, the Fund received $8,400 and $0 in fixed fees and variable fees, respectively. The Transaction Fees for the Fund are listed in the table below:
| Fixed Fee | Variable Charge | |
| $350 | 2.00%* |
| * | The maximum Transaction Fee may be up to 2.00% of the amount invested. |
16
| Ballast Small/Mid Cap ETF |
| Notes to the Financial Statements (continued) |
| March 31, 2023 (Unaudited) |
NOTE 7. FEDERAL TAX INFORMATION
At March 31, 2023, the net unrealized appreciation (depreciation) and tax cost of investments for tax purposes was as follows:
| Gross unrealized appreciation | $ | 5,449,741 | ||
| Gross unrealized depreciation | (6,982,516 | ) | ||
| Net unrealized depreciation on investments | $ | (1,532,775 | ) | |
| Tax cost of investments | $ | 68,195,954 |
| (a) | Short-term capital gain distributions are treated as ordinary income for tax purposes. |
At September 30, 2022, the Fund’s most recent fiscal year end, the components of accumulated earnings (deficit) on a tax basis were as follows:
As of September 30, 2022, the Fund had short-term and long-term capital loss carryforwards available to offset future gains and not subject to expiration in the amount of $3,674,008 and $803,539, respectively.
NOTE 8. COMMITMENTS AND CONTINGENCIES
The Trust indemnifies its officers and Trustees for certain liabilities that may arise from their performance of their duties to the Trust or the Fund. Additionally, in the normal course of business, the Trust enters into contracts that contain a variety of representations and warranties which provide general indemnifications. The Trust’s maximum exposure under these arrangements is unknown, as this would involve future claims that may be made against the Trust that have not yet occurred.
NOTE 9. SUBSEQUENT EVENTS
Management of the Fund has evaluated the need for disclosures and/or adjustments resulting from subsequent events through the date at which these financial statements were issued. Based upon this evaluation, management has determined there were no items requiring adjustment of the financial statements or additional disclosure.
17
| Summary of Fund Expenses (Unaudited) |
As a shareholder of the Fund, you incur two types of costs: (1) transaction costs and (2) ongoing costs, including management fees and other Fund expenses. These examples are intended to help you understand your ongoing costs (in dollars) of investing in the Fund and to compare these costs with the ongoing costs of investing in other funds. You may pay brokerage commissions on purchases and sales of exchange-traded fund shares, which are not reflected in the example. The example is based on an investment of $1,000 invested at the beginning of the period and held for the entire period from October 1, 2022 through March 31, 2023.
Actual Expenses
The first line of the table below provides information about actual account values and actual expenses. You may use the information in this line, together with the amount you invested, to estimate the expenses that you paid over the period. Simply divide your account value by $1,000 (for example, an $8,600 account value divided by $1,000 = 8.6), then multiply the result by the number in the first line under the heading “Expenses Paid During Period” to estimate the expenses you paid on your account during this period.
Hypothetical Example for Comparison Purposes
The second line of the table below provides information about hypothetical account values and hypothetical expenses based on the Fund’s actual expense ratio and an assumed rate of return of 5% per year before expenses, which is not the Fund’s actual return. The hypothetical account values and expenses may not be used to estimate the actual ending account balance or expenses you paid for the period. You may use this information to compare the ongoing costs of investing in the Fund and other funds. To do so, compare this 5% hypothetical example with the 5% hypothetical examples that appear in the shareholder reports of other funds.
Expenses shown in the table are meant to highlight your ongoing costs only and do not reflect any transactional costs. Therefore, the second line of the table below is useful in comparing ongoing costs only and will not help you determine the relative total costs of owning different funds. In addition, if transaction costs were included, your costs would have been higher.
| Beginning | Ending | |||||||||||||
| Account | Account | Expenses | ||||||||||||
| Value | Value | Paid | Annualized | |||||||||||
| October 1, | March 31, | During | Expense | |||||||||||
| 2022 | 2023 | Period(a) | Ratio | |||||||||||
| Actual | $ | 1,000.00 | $ | 1,157.20 | $ | 5.92 | 1.10% | |||||||
| Hypothetical(b) | $ | 1,000.00 | $ | 1,019.45 | $ | 5.54 | 1.10% | |||||||
| (a) | Expenses are equal to the Fund’s annualized expense ratios, multiplied by the average account value over the period, multiplied by 182/365 (to reflect the one-half year period). |
| (b) | Hypothetical assumes 5% annual return before expenses. |
18
| Adviser Agreement Renewal (Unaudited) |
The Ballast Small/Mid Cap ETF (the “Fund”) is a series of Unified Series Trust (the “Trust”). The Trust’s Board of Trustees (the “Board” or the “Trustees”) oversees the management of the Fund and, as required by law, considered the approval of the continuance of the Fund’s management agreement with its investment adviser, Ballast Asset Management, LP (“Ballast”). The Board approved the continuance of the management agreement.
The Board requested and evaluated all information that the Trustees deemed reasonably necessary under the circumstances in connection with the approval of the continuance of the management agreement.
The Trustees held a teleconference on November 9, 2022 to review and discuss materials compiled by Ultimus Fund Solutions, LLC, the Trust’s administrator, with regard to the management agreement between the Trust and Ballast. At the Trustees’ quarterly meeting held in November 2022, the Board interviewed certain executives of Ballast including Ballast’s Chief Executive Officer and its Chief Compliance Officer. After discussion, the Trustees, including the Trustees who are not “interested persons” (as that term is defined in the Investment Company Act of 1940) of the Trust or Ballast (the “Independent Trustees”), approved the continuance of the management agreement between the Trust and Ballast for an additional year. The Trustees’ approval of the continuance of the Fund’s management agreement was based on a consideration of all the information provided to the Trustees, and was not the result of any single factor. Some of the factors that figured particularly in the Trustees’ deliberations are described below, although individual Trustees may have evaluated this information differently, ascribing different weights to various factors.
(i) The Nature, Extent, and Quality of Services. The Trustees reviewed and considered information regarding the nature, extent, and quality of services that Ballast provides to the Fund, which include, but are not limited to, providing a continuous investment program for the Fund, adhering to the Fund’s investment restrictions, complying with the Trust’s policies and procedures, and voting proxies on behalf of the Fund. The Trustees considered the qualifications and experience of Ballast’s portfolio manager who is responsible for the day-to-day management of the Fund’s portfolio, as well as the qualifications and experience of the other individuals at Ballast who provide services to the Fund. After a thorough discussion and consideration of the nature, extent and quality of services provided by Ballast, the Trustees concluded that Ballast is providing excellent investment
19
| Adviser Agreement Renewal (Unaudited) (continued) |
management services to the Fund.
(ii) Fund Performance. The Trustees next reviewed and discussed the Fund’s performance for periods ended September 30, 2022. The Trustees observed that that Fund had underperformed the Fund’s benchmark index, the Russell 2500 Value Index, for the one-year period but had outperformed since inception. The Trustees noted that the Fund underperformed its Morningstar Small Blend category for the one-year period but outperformed the category average and median since inception. The Trustees observed that the Fund performed in-line with its peer group over the one-year period and outperformed its peer group since inception. The Trustees considered Ballast’s explanation that the underperformance over the one-year period was due to an overweight position in the consumer discretionary sector and that it had reduced the Fund’s exposure to this sector.
The Trustees next reviewed and discussed the performance of Ballast’s separately managed account that has an investment strategy similar to that of the Fund, noting that the performance of both was substantially similar. It was the consensus of the Trustees that they are very satisfied with the performance of the Fund.
(iii) Fee Rate and Profitability. The Trustees reviewed a fee and expense comparison for the Morningstar Small Blend category, which indicated that the Fund’s management fee and net expense ratio are higher than the average and median for the category. The Trustees noted that the Fund’s management fee and net expense ratio are also higher than the average and median of its peer group. The Trustees considered that the Fund’s management fee is slightly lower than the management fee charged on Ballast’s separately managed accounts. The Trustees also noted Ballast’s explanation that the peer group consists almost exclusively of quantitative and factor-based ETFs which have much lower operating costs than an actively managed ETF such as the Fund. The Trustees further acknowledged that the size of the Fund contributes to its higher net expense ratio.
The Trustees considered a profitability analysis prepared by Ballast for its management of the Fund, which indicated that Ballast is earning a profit as a result of managing the Fund.
The Trustees considered other potential benefits that Ballast may receive in connection with its management of the Fund, including third-party research
20
| Adviser Agreement Renewal (Unaudited) (continued) |
obtained by soft dollars, and noted that Ballast has soft dollar arrangements on behalf of the Fund in accordance with its compliance policies and procedures. After further discussion, the Trustees determined that the current profit was reasonable in light of Ballast’s services provided to the Fund.
After considering the above information, the Trustees concluded that the current management fee represents reasonable compensation in light of the nature and quality of the services that Ballast provides to the Fund, the fees paid by larger funds in the Morningstar category and peer group, and the profitability of Ballast’s services to the Fund.
(iv) Economies of Scale. In determining the reasonableness of the management fee, the Trustees also considered the extent to which Ballast will realize economies of scale as the Fund grows larger. The Trustees determined that, in light of the size of the Fund, it does not appear that Ballast is benefitting from economies of scale in managing the Fund to such an extent that breakpoints in the management fee should be considered at this time.
21
Proxy Voting
A description of the policies and procedures that the Fund uses to determine how to vote proxies relating to portfolio securities and information regarding how the Fund voted those proxies during the most recent twelve month period ended June 30, are available (1) without charge upon request by calling the Fund at (866) 383-6468 and (2) in Fund documents filed with the SEC on the SEC’s website at www.sec.gov.
| TRUSTEES Daniel J. Condon, Chairman David R. Carson Kenneth G.Y. Grant Freddie Jacobs, Jr. Catharine B. McGauley Ronald C. Tritschler |
INDEPENDENT
REGISTERED PUBLIC ACCOUNTING FIRM Cohen & Company, Ltd. 151 North Franklin Street, Suite 575 Chicago, IL 60606 |
| OFFICERS Martin R. Dean, President Gweneth K. Gosselink, Chief Compliance Officer Zachary P. Richmond, Treasurer and Chief Financial Officer Lynn E. Wood, Assistant Chief Compliance Officer |
LEGAL
COUNSEL Thompson Hine LLP 312 Walnut Street, 20th Floor Cincinnati, OH 45202 |
| INVESTMENT
ADVISER Ballast Asset Management, LP 2301 Cedar Springs Road, Suite 450 Dallas, TX 75201 |
CUSTODIAN Brown Brothers Harriman & Co. 50 Post Office Square Boston, MA 02110 |
| DISTRIBUTOR Northern Lights Distributors, LLC 4221 North 203rd Street, Suite 100 Elkhorn, NE 68022 |
ADMINISTRATOR Ultimus Fund Solutions, LLC 225 Pictoria Drive, Suite 450 Cincinnati, OH 45246 |
This report is intended only for the information of shareholders or those who have received the Fund’s prospectus which contains information about the Fund’s management fee and expenses. Please read the prospectus carefully before investing.
Distributed by Northern Lights Distributors, LLC Member FINRA/SIPC
Ballast Small-SAR-23

Semi-Annual Report
March 31, 2023
Fund Adviser:
Pekin
Hardy Strauss, Inc.
227 West Monroe Street, Suite 3625
Chicago, IL 60606
Toll Free (800) 470-1029
www.appleseedfund.com

April 25, 2023
Dear Appleseed Shareholder:
“Winter is coming.”
—Ned Stark, “Game of Thrones”
In the investment world, “winter” can be viewed as a synonym to recession, and, technically, winter is always coming at an uncertain point in the future. However, a number of recent economic signals highlight concerns that winter may be coming sooner rather than later, even though we most certainly do not have a crystal ball to forecast exactly when winter will come nor how severe it may well become.
We have been closely watching the economic indicators and trends provided below:
| ● | Inflation is hitting consumers hard. |
Since 2021, prices in the United States and elsewhere in the developed world have risen at a mid-to-high single-digit clip. The world is paying more for the same amount of goods and services and yet getting less for their money. In short, the quality of living has diminished with lower consumer purchasing power. Across the board, savings rates have fallen in the face of inflation, making the average person less prepared for financial emergencies, forcing many to rely on expensive loans or credit card debt to address unexpected expenses. Demand for discretionary items is falling, which should dampen economic growth.
With inflation squeezing the economy, consumers are more reliant on credit cards to afford increasingly expensive necessities like rent and food (and pricey discretionary items as well). As a result, total U.S. credit card debt spiked to a record $931 billion at the end of 2022, an 18.5% increase relative to 2021.1 Juxtaposed against this increased credit card debt is an unemployment rate that stands at a 53-year low, yet credit card delinquency rates are rising.
| 1 | Source: TransUnion. |
| www.appleseedfund.com | (800) 470-1029 |
1
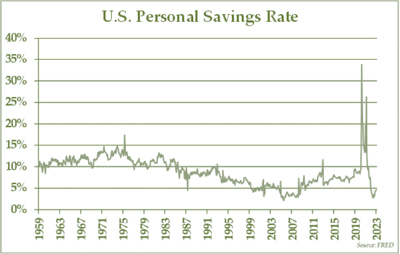
The personal savings rate, which is an important component of the financial security of U.S. households, measures how much of Americans’ disposable income remains after spending on food, rent, debt, and bills. As demonstrated in the chart below, the personal savings rate stands near all-time lows, reflecting the financial struggles of the average household. While some Americans are temporarily draining their savings by spending more to enjoy life post-lockdown, others are reducing savings to cover essentials because their wages simply are not maintaining pace with inflation.
| ● | Noteworthy bank closures are inciting fears. |
In March of 2023, the rapid collapse of Silicon Valley Bank, Silvergate Capital, and Signature Bank, along with the takeover of 166-year-old Credit Suisse by UBS, stoked concerns about the health of the banking system. In response, regulators took surprisingly aggressive steps to stem the contagion. Additional banking regulation and increased expenses for the banks are in the queue, thus placing incremental obstacles for credit formation and economic growth. Moreover, instability in the financial services sector negatively impacts the allocation of resources as well as the assessment and management of financial risks.
| www.appleseedfund.com | (800) 470-1029 |
2
| ● | Corporations are tightening their belts. |
Despite the well-publicized difficulty of hiring over the last few years, even highly profitable companies like Apple, Goldman Sachs, McKinsey, and Disney have announced material cuts in their highly paid work forces. In February 2023, the U.S. Bureau of Labor Statistics announced that there were just 9.9 million job openings; this report represented the first sub-10 million print since May 2021 and was 1.3 million lower than the December 2022 print. Moreover, companies are tapping the breaks on capital spending with particular weakness in more economically sensitive sectors; essentially, corporations are signaling that they are preparing for muted demand and pressured profit margins.
| ● | The return of student loan payments looms ominously. |
During the coronavirus pandemic, the Federal government issued regulations that allowed student loan payments to be temporarily paused. Ceased student loan payments are set to resume in September 2023, which will impact aggregate discretionary spending with more capital directed towards debt paydown. Notably, certain cohorts of Generation Z have never made a single debt repayment in their lives, and those people should feel this loss of discretionary capital more acutely than most.
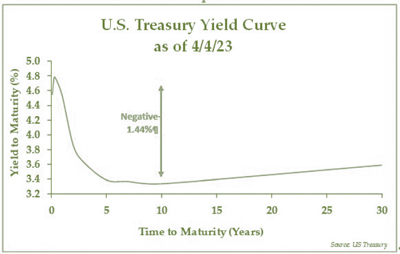
| ● | The inverted yield curve portends an ominous future. |
The yield curve is a chart that plots the interest rates of a specific type of debt at differing maturities. The slope of the yield curve is normally upward sloping, which indicates that investors require more return to invest capital for a longer period. Typically, an upward-sloping yield curve shape indicates stable economic conditions.
An inverted yield curve occurs when short-term interest rates exceed long-term rates, which is unusual because investors normally would not require a higher return to tie up their capital for shorter periods of time. As of March 31, 2023, the 90-day to 10-year U.S. Treasury yield spread
| www.appleseedfund.com | (800) 470-1029 |
3
stood at negative 1.37%, which is quite wide as compared to historical norms. Notably, an inverted Treasury yield curve has been one of the most reliable leading indicators of an impending recession.2
The current shape of the yield curve has serious implications for credit formation. With the Fed Funds target rate of 5% as of March 31, 2023 and banks’ estimated earnings yield on assets below that rate, depositors are moving capital to money market funds, and banks are responding by tightening their lending standards.
| ● | The Federal Reserve’s posture remains hawkish. |
Despite the recent banking turmoil, the Federal Reserve raised the Fed Funds interest rate by another 0.25% in late March, pushing forward with its aggressive campaign to rein in inflation. Federal Reserve officials are now forecasting just one more interest rate increase this year but doing so with an increasingly uncertain tone. These interest rate increases slow economic activity, as they drive up the cost of credit for credit cards, adjustable-rate mortgages, and other variable loans.
| 2 | https://www.chicagofed.org/publications/chicago-fed-letter/2018/404. |
| www.appleseedfund.com | (800) 470-1029 |
4
Moreover, in June 2022, the Federal Reserve began to passively shrink its assets as the underlying securities on its balance sheet matured -- a process called Quantitative Tightening, which drains liquidity out of the financial system. The objectives of Quantitative Tightening are deflationary in nature and are similar to that of raising borrowing costs because it cools down an overheated economy by reducing the amount of money in circulation.
| ● | The U.S. stock market performance is increasingly narrow. |
During the first quarter of 2023, investors rotated back into the beaten-up stocks of technology giants like Apple and Nvidia, leading to massive price gains in the worst-performing sector of 2022. Despite significant volatility, defensive stocks suffered, as most stocks in consumer defensive, healthcare, and utility sectors all ended the quarter with losses. Plus, the energy sector, which led the stock market in 2022 by a large margin, was the worst-performing sector of the stock market. The narrow nature of the recent stock market moves is rather perplexing and is likely indicative of unhealthy, anemic growth as well as a possible recession looming. If the economy was exhibiting healthy growth, then the move in the stock market would be far more broad-based in nature.
| ● | The Federal debt ceiling simply cannot be breached. |
Created by Congress in 1917, the debt ceiling is the approved debt limit for the U.S. government, which now stands at $31.4 trillion. The U.S. Treasury reached the current limit earlier this year, so it has no room to borrow incremental capital, other than to replace maturing debt. Further, Treasury Secretary Janet Yellen is pursuing “extraordinary measures” to keep the government funded. Bumping against the debt ceiling is not necessarily a new issue, as the debt limit has been increased many dozens of times over the years. Both political parties all too often engage in contentious battles with regard to this issue, usually about spending and taxing priorities.
We expect that a debt ceiling agreement will be reached after significant negotiation. However, in today’s highly polarized political environment, it could be a publicly contentious process that could exacerbate market
| www.appleseedfund.com | (800) 470-1029 |
5
volatility and weaken confidence in the economy. Given that the Federal Reserve is trying to tame inflation, a protracted debt ceiling battle that undermines confidence would be counterproductive.
On the other side of this dizzying myriad of headwinds, certain countervailing forces play roles in positively impacting the economy. Next year is an election year, and Congress and the Executive branch will likely use fiscal policy to stimulate the broader economy in order to attract votes. Also, Federal Reserve Chairman Jerome Powell might have to reverse course in its monetary tightening campaign if financial instability increases sufficiently. While it is a backward-looking economic indicator, unemployment rates do stand near all-time lows. In our view, despite these possible countervailing forces, we believe that a recession beginning later this year is more likely than not.
Performance and Portfolio Changes
Over the six months ended 3/31/2023, Appleseed Fund Investor Class has generated an absolute return of 5.42%, outperforming the Morningstar Global Markets Small-Mid Cap Index, which generated a total return of 3.57%. Strong performance was driven by the equity portion of the portfolio and by physical gold but partially offset by weakness in financial services stocks and by our hedging activities with index puts.
During the most recent quarter, Appleseed Fund added three new equity holdings: Medtronic (MDT), Stanley Black & Decker (SWK), and Synovus Financial (SNV). Medtronic is the world’s largest medical device manufacturer, and it holds the number one or number two market share in most of its product segments. Medtronic’s business is heavily weighted towards complicated in-patient procedures, which are typically quite profitable. Industry dynamics are quite attractive with an aging global population and the growth of improved healthcare in emerging markets; furthermore, most of its segments are highly concentrated with just 2-3 players that split each segment’s market share, affording the key participants with significant economies of scale and pricing power. The Company has been recently addressing several temporary headwinds including a strong dollar, inflation, a delayed recovery in surgical volumes from the coronavirus pandemic, and supply chain issues. Once these issues reach the rearview mirror, the Company’s growth and margin expansion plans should transform into reality.
| www.appleseedfund.com | (800) 470-1029 |
6
Stanley Black & Decker is the world’s largest tool manufacturer. It produces power tools, hand tools, storage, digital tool solutions, lifestyle products, outdoor products, engineered fasteners, and other industrial equipment. 2022 was quite a forgettable year for the Company with its stock price falling by roughly 60%. Due to supply chain issues, bloated inventories, inflationary pressures, and weaker demand, the Company badly missed its original 2022 guidance. With recessionary fears, waning earnings momentum, a more elevated leverage profile, and reliance on the U.S. construction market, it is of no surprise how poorly the stock price behaved last year. In our view, the sell-off has been excessive with the stock price trading near March 2020 pandemic lows and at levels otherwise not seen since early 2014. We view the stock at washed-out levels with a favorable profile going forward.
In February 2023, Appleseed Fund took a position in Synovus, a Georgia-based regional bank; retrospective vision being 20/20, our timing with this initial purchase was poor. Synovus’ business performed admirably in 2022 with an expanding net interest margin, achievement of its annual cost and revenue benefits from its 2020 restructuring program, improved non-performing loans, and accelerating loan growth. The business clearly was performing well, and the stock market had not given the Company much credit when we took a partial position earlier this year at attractive valuations.
Indeed, the banking crisis that began the next month wiped out several well-respected regional banks (e.g., Silicon Valley Bank, Signature Bank) and a global bank (e.g., Credit Suisse). The instability in the financial services sector caused investors to throw the baby (Synovus) out with the bath water, despite the attractive economics and compelling valuation associated with Synovus. Today, we believe Synovus to be well capitalized and with strong risk controls. At current levels, we think the risk/return characteristics of this business are that much more attractive, but the entry point on this investment has thus far proved to be early and a little painful.
During the quarter, Appleseed Fund sold two equity investments: Adidas AG (ADS-DE) and Allstate Corporation (ALL). Adidas aggressively made the decision to wind-down the highly profitable Yeezy business due to Kanye West’s anti-Semitic commentary, which was a painful blow to Adidas’ revenues and earnings. That issue, combined with continued weakness in its China business, lowered our long-term expectations in Adidas. However, the stock
| www.appleseedfund.com | (800) 470-1029 |
7
price reacted very positively to the Yeezy exit, and we subsequently sold our Adidas shares at an attractive price. Allstate’s stock price reached our estimate for intrinsic value, so Appleseed Fund exited its position.
Within the equity portion of the portfolio, the three biggest contributors to Appleseed Fund’s performance over the six months were Ardelyx (ARDX), Samsung Electronics (005930-KR), and Adidas. The most significant detractors to Appleseed Fund’s performance over the past six months have been Synovus (SNV), CNB Financial (CCNE), and Rockley Photonics (RKLY).
Currently, Appleseed Fund is generally positioned defensively in light of this bearish outlook on the economy. With regards to equities, we are favoring companies in the consumer staples, healthcare, and agriculture sectors as well as inexpensive, out-of-favor value stocks.
Beyond equities, Appleseed Fund is overweight U.S.Treasury Inflation Protected Securities (TIPS) and physical gold trusts. We own TIPS because, in the current environment, real yields have become attractive for the first time in years. We own gold because gold should help to reduce portfolio volatility and is likely to perform well in an environment where inflation remains persistently elevated even while real growth is slowing.
Appleseed Fund thanks you for your continued support in asking us to manage your investable assets.
Sincerely,
Adam Strauss, CFA
William Pekin, CFA
Joseph Plevelich, CFA
Shaun Roach, CFA
Joshua Strauss, CFA
| www.appleseedfund.com | (800) 470-1029 |
8
The Fund’s Top Ten Holdings can be found at: www.appleseedfund.com.
Diversification does not ensure a profit or guarantee against loss.
Investments in commodities such as gold may be affected by overall market movements, changes in interest rates, and other factors such as embargoes and international economic and political developments. Commodities are assets that have tangible properties, such as oil, metals, and agricultural products. These instruments may subject the Fund to greater volatility than investments in traditional securities.
The views and opinions expressed in this material are those of the authors. While we believe we have a reasonable basis for our appraisals and we have confidence in our opinions, actual results may differ materially from those we anticipate. These opinions are current as of the date of this letter but are subject to change. There is no guarantee that any forecasts or opinions in this material will be realized. Information should not be construed as investment advice nor be considered a recommendation to buy, sell, or hold any particular security.
You should consider the Fund’s investment objectives, risks, charges, and expenses carefully before you invest. The Fund’s prospectus contains important information about the Fund’s investment objectives, potential risks, management fees, charges and expenses, and other information and should be read carefully before investing. You may obtain a current copy of the Fund’s prospectus or performance data current to the most recent month by calling 1-800-470-1029.
Distributed by Ultimus Fund Distributors, LLC (Member FINRA).
| www.appleseedfund.com | (800) 470-1029 |
9
| INVESTMENT RESULTS – (Unaudited) |
| Average Annual Total Returns(a) | ||||||||
| (for the periods ended March 31, 2023) | ||||||||
| Since | Since | |||||||
| Six | One | Five | Ten | Inception | Inception | |||
| Months | Year | Year | Year | (12/08/06) | (1/31/11) | |||
| Appleseed Fund | ||||||||
| Investor Class | 5.42% | -10.73% | 3.88% | 3.93% | 5.61% | N/A | ||
| Institutional Class | 5.46% | -10.54% | 4.07% | 4.13% | N/A | 5.32% | ||
| Morningstar Global Markets Small-Mid Cap Index(b) | 3.57% | -8.82% | 4.67% | 7.18% | 5.91% | 7.04% | ||
| Expense Ratios(c) | ||||||||
| Investor | Institutional | |||||||
| Class | Class | |||||||
| Gross | 1.57% | 1.32% | ||||||
| With Applicable Waivers | 1.23% | 1.04% | ||||||
The performance quoted represents past performance, which does not guarantee future results. The investment return and principal value of an investment will fluctuate so that an investor’s shares, when redeemed, may be worth more or less than their original cost. The returns shown do not reflect deduction of taxes that a shareholder would pay on Appleseed Fund (the “Fund”) distributions or the redemption of Fund shares. Current performance of the Fund may be lower or higher than the performance quoted.The Fund’s investment objectives, risks, charges and expenses should be considered carefully before investing. Performance data current to the most recent month end may be obtained by calling (800) 470-1029.
| (a) | Return figures reflect any change in price per share and assume the reinvestment of all distributions. The Fund’s returns reflect any fee reductions during the applicable period. If such fee reductions had not occurred, the quoted performances would have been lower. Total returns for less than one year are not annualized. |
| (b) | The Morningstar Global Markets Small-Mid Cap Index (the “Morningstar Index”) measures the performance of global equity markets targeting the top 71% to 97% of stocks by market capitalization in both developed and emerging markets. The Morningstar Index does not incorporate Environmental, Social, or Governance (ESG) criteria. The Morningstar Index returns do not reflect the deduction of expenses, which have been deducted from the Fund’s returns. The Morningstar Index returns assume reinvestment of all distributions and do not reflect the deduction of taxes and fees. An individual cannot invest directly in the Morningstar Index. However, an individual may be able to invest in exchange-traded funds or other investment vehicles that attempt to track the performance of a benchmark index. The Fund is not sponsored, endorsed, sold or promoted by Morningstar, Inc. or any of its affiliates (all such entities, collectively, “Morningstar Entities”).The Morningstar Entities make no representation or warranty, express or implied, to individuals who invest in the Fund or any member of the public regarding the advisability of investing in equity securities generally or in the Fund in particular or the ability of the Fund to track the Morningstar Indices or general equity market performance.THE MORNINGSTAR ENTITIES DO NOT GUARANTEE THE ACCURACY AND/OR THE COMPLETENESS OF THE FUNDS OR ANY DATA INCLUDED THEREIN AND MORNINGSTAR ENTITIES SHALL HAVE NO LIABILITY FOR ANY ERRORS, OMISSIONS, OR INTERRUPTIONS THEREIN. You cannot invest directly in an index. |
| (c) | The expense ratios, which include acquired fund fees and expenses of 0.09%, are from the Fund’s prospectus dated January 28, 2023. Pekin Hardy Strauss, Inc. (the “Adviser”) has contractually agreed to waive its management fee and/or reimburse expenses through January 31, 2024 so that total annual operating expenses (excluding portfolio transaction and other investment-related costs (including brokerage fees and commissions); taxes; borrowing costs (such as interest and dividend expenses on |
| www.appleseedfund.com | (800) 470-1029 |
10
| INVESTMENT RESULTS – continued (Unaudited) |
securities sold short); acquired fund fees and expenses; fees and expenses associated with investments in other collective investment vehicles or derivative instruments (including for example option and swap fees and expenses); any amounts payable pursuant to a distribution or service plan adopted in accordance with Rule 12b-1 under the Investment Company Act of 1940; any administrative and/ or shareholder servicing fees payable pursuant to a plan adopted by the Board of Trustees; expenses incurred in connection with any merger or reorganization; extraordinary expenses (such as litigation expenses, indemnification of Trust officers and Trustees and contractual indemnification of Fund service providers); and other expenses that the Trustees agree have not been incurred in the ordinary course of the Fund’s business) do not exceed 0.95% of the Fund’s average daily net assets. Each waiver/ expense payment by the Adviser is subject to recoupment by the Adviser from the Fund in the three years following the date the particular waiver/expense payment occurred, but only if such recoupment can be achieved without exceeding the annual expense limitation in effect at the time of the waiver/ expense payment and any expense limitation in effect at the time of the recoupment. This expense cap may not be terminated prior to this date except by the Board of Trustees upon 60 days’ written notice to the Adviser. Additional information pertaining to the Fund’s expense ratios as of March 31, 2023 can be found in the financial highlights, which do not include acquired fund fees and expenses.
You should consider the Fund’s investment objectives, risks, charges and expenses carefully before you invest. The Fund’s prospectus contains important information about the Fund’s investment objectives, potential risks, management fees, charges and expenses, and other information and should be read carefully before investing. You may obtain a current copy of the Fund’s prospectus or performance data current to the most recent month-end by calling (800) 470-1029.
The Fund is distributed by Ultimus Fund Distributors, LLC, member FINRA/SIPC.
| www.appleseedfund.com | (800) 470-1029 |
11
| FUND HOLDINGS – (Unaudited) |
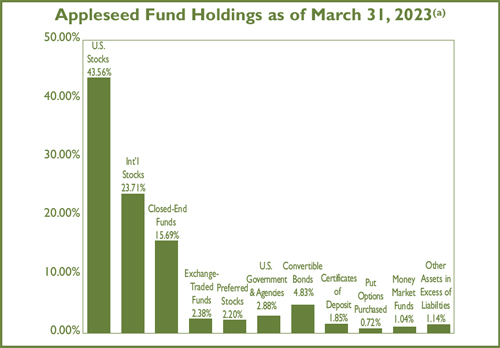
| (a) | As a percentage of net assets. |
The Fund invests primarily in a portfolio of equity securities of companies that are undervalued in the opinion of the Adviser. The investment objective of the Fund is long-term capital appreciation.
Availability of Portfolio Schedule – (Unaudited)
The Fund files its complete schedule of portfolio holdings with the Securities and Exchange Commission (the “SEC”) for the first and third quarters of each fiscal year as an exhibit to its reports on Form N-PORT. The Fund’s Form N-PORT reports are available on the SEC’s website at www.sec.gov and on the Fund’s website at www.appleseedfund.com.
12
| APPLESEED FUND |
| SCHEDULE OF INVESTMENTS – (Unaudited) |
| March 31, 2023 |
| Fair | ||||||||
| Common Stocks — 67.27% | Shares | Value | ||||||
| Canada — 4.31% | ||||||||
| Real Estate — 4.31% | ||||||||
| Boardwalk Real Estate Investment Trust | 85,000 | $ | 3,467,873 | |||||
| Total Canada | 3,467,873 | |||||||
| France — 3.15% | ||||||||
| Communications — 3.15% | ||||||||
| Bollore SA | 410,000 | 2,530,535 | ||||||
| Total France | 2,530,535 | |||||||
| Ireland — 5.51% | ||||||||
| Financials — 3.50% | ||||||||
| AerCap Holdings NV(a) | 50,000 | 2,811,500 | ||||||
| Health Care — 2.01% | ||||||||
| Medtronic PLC | 20,000 | 1,612,400 | ||||||
| Total Ireland | 4,423,900 | |||||||
| Israel — 3.39% | ||||||||
| Industrials — 3.39% | ||||||||
| Ituran Location and Control Ltd. | 125,000 | 2,722,500 | ||||||
| Total Israel | 2,722,500 | |||||||
| Japan — 3.39% | ||||||||
| Technology — 3.39% | ||||||||
| Sony Group Corp. - ADR | 30,000 | 2,719,500 | ||||||
| Total Japan | 2,719,500 | |||||||
| Russia — 0.00% | ||||||||
| Financials — 0.00% | ||||||||
| Moscow Exchange MICEX-RTS PJSC - ADR(a)(b)(c) | 1,300,000 | 167 | ||||||
| Sberbank of Russia PJSC - ADR(a)(b)(c) | 324,000 | 4 | ||||||
| Total Russia | 171 | |||||||
| South Korea — 3.96% | ||||||||
| Technology — 3.96% | ||||||||
| Samsung Electronics Co. Ltd. | 65,000 | 3,185,542 | ||||||
| Total South Korea | 3,185,542 | |||||||
| United States — 43.56% | ||||||||
| Consumer Discretionary — 2.80% | ||||||||
| VF Corporation | 98,000 | 2,245,180 | ||||||
| Consumer Staples — 5.02% | ||||||||
| Herbalife Nutrition Ltd.(a) | 120,000 | 1,932,000 | ||||||
| Sprouts Farmers Market, Inc.(a) | 60,000 | 2,101,800 | ||||||
| 4,033,800 | ||||||||
| Energy — 3.63% | ||||||||
| MRC Global, Inc.(a) | 300,000 | 2,916,000 | ||||||
See accompanying notes which are an integral part of these financial statements.
13
| APPLESEED FUND |
| SCHEDULE OF INVESTMENTS – (Unaudited) continued |
| March 31, 2023 |
| Fair | ||||||||
| Common Stocks — 67.27% — continued | Shares | Value | ||||||
| United States — 43.56% — continued | ||||||||
| Financials — 6.68% | ||||||||
| CNB Financial Corp. | 90,000 | $ | 1,728,000 | |||||
| Evercore, Inc., Class A | 15,000 | 1,730,700 | ||||||
| Synovus Financial Corp. | 62,000 | 1,911,461 | ||||||
| 5,370,161 | ||||||||
| Health Care — 6.43% | ||||||||
| 89Bio, Inc.(a) | 100,000 | 1,523,000 | ||||||
| Ardelyx, Inc.(a) | 650,000 | 3,113,500 | ||||||
| Heron Therapeutics, Inc.(a) | 350,000 | 528,500 | ||||||
| 5,165,000 | ||||||||
| Industrials — 2.01% | ||||||||
| Stanley Black & Decker, Inc. | 20,000 | 1,611,600 | ||||||
| Materials — 7.32% | ||||||||
| CF Industries Holdings, Inc. | 40,000 | 2,899,600 | ||||||
| Mosaic Co. (The) | 65,000 | 2,982,200 | ||||||
| 5,881,800 | ||||||||
| Real Estate — 2.24% | ||||||||
| Alexander & Baldwin, Inc. | 95,000 | 1,796,450 | ||||||
| Technology — 7.43% | ||||||||
| Lumentum Holdings, Inc.(a) | 40,000 | 2,160,400 | ||||||
| Micron Technology, Inc. | 21,000 | 1,267,140 | ||||||
| SS&C Technologies Holdings, Inc. | 45,000 | 2,541,150 | ||||||
| 5,968,690 | ||||||||
| Total United States | 34,988,681 | |||||||
| TOTAL COMMON STOCKS | ||||||||
| (Cost $49,981,172) | 54,038,702 | |||||||
| Closed End Funds — 15.69% | ||||||||
| Canada — 15.69% | ||||||||
| Sprott Physical Gold Trust(a) | 675,000 | 10,435,500 | ||||||
| Sprott Physical Uranium Trust(a) | 185,000 | 2,168,200 | ||||||
| 12,603,700 | ||||||||
| TOTAL CLOSED END FUNDS | ||||||||
| (Cost $10,319,965) | 12,603,700 | |||||||
See accompanying notes which are an integral part of these financial statements.
14
| APPLESEED FUND |
| SCHEDULE OF INVESTMENTS – (Unaudited) continued |
| March 31, 2023 |
| Shares/ | ||||||||
| Principal | Fair | |||||||
| Exchange-Traded Funds — 2.38% | Amount | Value | ||||||
| United States — 2.38% | ||||||||
| VanEck Merk Gold Shares(a) | 100,000 | $ | 1,910,000 | |||||
| TOTAL EXCHANGE-TRADED FUNDS | ||||||||
| (Cost $1,733,120) | 1,910,000 | |||||||
| Preferred Stocks — 2.20% | ||||||||
| United States — 2.20% | ||||||||
| Financials — 2.20% | ||||||||
| Federal National Mortgage Association, Series S, 5.25%(a) | 550,000 | 946,000 | ||||||
| Federal National Mortgage Association, Series T, 8.25%(a) | 550,000 | 819,500 | ||||||
| TOTAL PREFERRED STOCKS | ||||||||
| (Cost $2,587,846) | 1,765,500 | |||||||
| U.S. Government & Agencies — 2.88% | ||||||||
| United States Treasury Inflation Indexed Bonds 0.63%, 1/15/2024(d) | $ | 900,000 | 1,144,516 | |||||
| United States Treasury Inflation Indexed Bonds 0.50%, 1/15/2028(d) | 1,000,000 | 1,171,435 | ||||||
| TOTAL U.S. GOVERNMENT & AGENCIES | ||||||||
| (Cost $2,291,003) | 2,315,951 | |||||||
| Convertible Bonds — 4.83% | ||||||||
| Herbalife Nutrition Ltd., 2.63%, 3/15/2024 | 2,250,000 | 2,137,500 | ||||||
| Lumentum Holdings, Inc., 0.50%, 12/15/2026 | 2,000,000 | 1,740,000 | ||||||
| TOTAL CONVERTIBLE BONDS | ||||||||
| (Cost $4,528,552) | 3,877,500 | |||||||
See accompanying notes which are an integral part of these financial statements.
15
| APPLESEED FUND |
| SCHEDULE OF INVESTMENTS – (Unaudited) continued |
| March 31, 2023 |
| Principal | Fair | |||||||
| Certificates of Deposit — 1.85% | Amount | Value | ||||||
| Community Development Bank, 1.40%, 9/8/2023 | $ | 250,000 | $ | 250,000 | ||||
| Self Help Federal Credit Union, 0.30%, 7/3/2023(e) | 1,000,000 | 988,050 | ||||||
| Spring Bank, 3.50%, 3/29/2024 | 250,000 | 250,000 | ||||||
| TOTAL CERTIFICATES OF DEPOSIT | ||||||||
| (Cost $1,500,000) | 1,488,050 | |||||||
Put Options Purchased — 0.72%
| Number | ||||||||||||||||||
| of | Notional | Exercise | Fair | |||||||||||||||
| Description | Contracts | Amount | Price | Expiration Date | Value | |||||||||||||
| Invesco QQQ | 1,000 | $ | 32,093,000 | $ | 265.00 | May 2023 | $ | 80,000 | ||||||||||
| Invesco QQQ | 900 | 28,883,700 | 275.00 | June 2023 | 221,400 | |||||||||||||
| iShares, Inc. MSCI Germany ETF | 1,375 | 3,913,250 | 19.00 | April 2023 | 4,125 | |||||||||||||
| iShares, Inc. MSCI Germany ETF | 1,350 | 3,842,100 | 20.00 | April 2023 | 1,350 | |||||||||||||
| SPDR S&P 500 ETF Trust | 625 | 25,586,875 | 370.00 | May 2023 | 116,250 | |||||||||||||
| SPDR S&P 500 ETF Trust | 250 | 10,234,750 | 370.00 | June 2023 | 90,500 | |||||||||||||
| SPDR S&P 500 ETF Trust | 150 | 6,140,850 | 390.00 | May 2023 | 64,200 | |||||||||||||
| TOTAL PUT OPTIONS PURCHASED | ||||||||||||||||||
| (Cost $2,068,832) | $ | 577,825 | ||||||||||||||||
See accompanying notes which are an integral part of these financial statements.
16
| APPLESEED FUND |
| SCHEDULE OF INVESTMENTS – (Unaudited) continued |
| March 31, 2023 |
| Fair | ||||||||
| Money Markets Funds — 1.04% | Shares | Value | ||||||
| Federated Hermes Government Obligations Fund, Institutional Class, 4.65%(f) | 831,474 | $ | 831,474 | |||||
| TOTAL MONEY MARKET FUNDS | ||||||||
| (Cost $831,474) | 831,474 | |||||||
| Total Investments — 98.86% | ||||||||
| (Cost $75,841,964) | 79,408,702 | |||||||
| Other Assets in Excess of Liabilities — 1.14% | 911,054 | |||||||
| Net Assets — 100.00% | $ | 80,319,756 | ||||||
| (a) | Non-income producing security. |
| (b) | Security is currently being valued according to the fair value procedures approved by the Board of Trustees. |
| (c) | Illiquid security. The total fair value of these securities as of March 31, 2023 was $171, representing less than 0.00% of net assets. |
| (d) | Principal amount of security is adjusted periodically based on changes in the Consumer Price Index. |
| (e) | Certificates of Deposit purchased through Certificate of Deposit Account Registry Service (“CDARS”). Deposits occur in increments below the standard Federal Deposit Insurance Corporation (“FDIC”) insurance maximum so that both principal and interest are FDIC Insured. |
| (f) | Rate disclosed is the seven day effective yield as of March 31, 2023. |
ADR — American Depositary Receipt
See accompanying notes which are an integral part of these financial statements.
17
| APPLESEED FUND |
| STATEMENT OF ASSETS AND LIABILITIES |
| March 31, 2023 (Unaudited) |
| Assets | ||||
| Investments in securities, at fair value (cost $75,841,964) | $ | 79,408,702 | ||
| Cash | 571,205 | |||
| Receivable for fund shares sold | 9,343 | |||
| Receivable for investments sold | 250,000 | |||
| Dividends receivable | 132,022 | |||
| Tax reclaims receivable | 57,377 | |||
| Prepaid expenses | 22,835 | |||
| Total Assets | 80,451,484 | |||
| Liabilities | ||||
| Payable for fund shares redeemed | 62,471 | |||
| Payable to Adviser, net of waiver | 32,907 | |||
| Payable for Administrative Service Plan fees, Investor Class, net of waiver | 4,673 | |||
| Payable to affiliates | 10,460 | |||
| Other accrued expenses | 21,217 | |||
| Total Liabilities | 131,728 | |||
| Net Assets | $ | 80,319,756 | ||
| Net Assets consist of: | ||||
| Paid-in capital | 79,763,634 | |||
| Accumulated earnings | 556,122 | |||
| Net Assets | $ | 80,319,756 | ||
| Net Assets: Investor Class | $ | 29,114,621 | ||
| Shares outstanding (unlimited number of shares authorized, no par value) | 2,185,805 | |||
| Net asset value, offering and redemption price per share(a) | $ | 13.32 | ||
| Net Assets: Institutional Class | $ | 51,205,135 | ||
| Shares outstanding (unlimited number of shares authorized, no par value) | 3,818,658 | |||
| Net asset value, offering and redemption price per share(a) | $ | 13.41 |
| (a) | The Fund charges a 2.00% redemption fee on shares redeemed within 90 calendar days of purchase. Shares are redeemed at the Net Asset Value if held longer than 90 calendar days. |
See accompanying notes which are an integral part of these financial statements.
18
| APPLESEED FUND |
| STATEMENT OF OPERATIONS |
| For the six months ended March 31, 2023 (Unaudited) |
| Investment Income | ||||
| Dividend income (net of foreign taxes withheld of $23,536) | $ | 411,720 | ||
| Interest income | 30,171 | |||
| Total investment income | 441,891 | |||
| Expenses | ||||
| Adviser | 347,680 | |||
| Administrative services plan, Investor Class | 36,919 | |||
| Administration | 33,304 | |||
| Registration | 20,902 | |||
| Fund accounting | 20,582 | |||
| Transfer agent | 18,489 | |||
| Custodian | 18,247 | |||
| Legal | 11,758 | |||
| Audit and tax | 10,775 | |||
| Report printing | 10,386 | |||
| Trustee | 9,550 | |||
| Chief Compliance Officer | 4,239 | |||
| Insurance | 1,729 | |||
| Pricing | 1,326 | |||
| Miscellaneous | 20,876 | |||
| Total expenses | 566,762 | |||
| Fees and/or expenses reimbursed by Adviser | (141,316 | ) | ||
| Administrative services plan waiver | (8,860 | ) | ||
| Net operating expenses | 416,586 | |||
| Net investment income | 25,305 | |||
| Net Realized and Change in Unrealized Gain (Loss) on Investments | ||||
| Net realized gain (loss) on: | ||||
| Investment securities | 4,035,553 | |||
| Purchased options | (1,361,399 | ) | ||
| Written options | 241,602 | |||
| Foreign currency translations | (17,807 | ) | ||
| Change in unrealized appreciation (depreciation) on: | ||||
| Investment securities | 5,295,488 | |||
| Purchased options | (3,616,521 | ) | ||
| Written options | (245,629 | ) | ||
| Foreign currency translations | 1,595 | |||
| Net realized and unrealized gain (loss) on investment securities, purchased options, written options and foreign currency translations | 4,332,882 | |||
| Net increase in net assets resulting from operations | $ | 4,358,187 |
See accompanying notes which are an integral part of these financial statements.
19
| APPLESEED FUND |
| STATEMENTS OF CHANGES IN NET ASSETS |
| For the | ||||||||
| Six Months | For the | |||||||
| Ended | Year Ended | |||||||
| March 31, 2023 | September 30, | |||||||
| (Unaudited) | 2022 | |||||||
| Increase (Decrease) in Net Assets due to: | ||||||||
| Operations | ||||||||
| Net investment income | $ | 25,305 | $ | 1,169,059 | ||||
| Net realized gain (loss) on investment securities, purchased options, written options and foreign currency translations | 2,897,949 | (41,515 | ) | |||||
| Change in unrealized appreciation (depreciation) on investment securities, purchased options, written options and foreign currency translations | 1,434,933 | (19,568,687 | ) | |||||
| Net increase (decrease) in net assets resulting from operations | 4,358,187 | (18,441,143 | ) | |||||
| Distributions to Shareholders from Earnings: | ||||||||
| Investor Class | (192,869 | ) | (2,410,273 | ) | ||||
| Institutional Class | (331,402 | ) | (4,111,288 | ) | ||||
| Total distributions | (524,271 | ) | (6,521,561 | ) | ||||
| Capital Transactions - Investor Class | ||||||||
| Proceeds from shares sold | 786,930 | 4,089,214 | ||||||
| Reinvestment of distributions | 187,424 | 2,327,948 | ||||||
| Amount paid for shares redeemed | (2,329,017 | ) | (7,706,736 | ) | ||||
| Proceeds from redemption fees(a) | 1,142 | 4,016 | ||||||
| Total Investor Class | (1,353,521 | ) | (1,285,558 | ) | ||||
| Capital Transactions - Institutional Class | ||||||||
| Proceeds from shares sold | 3,231,093 | 10,530,847 | ||||||
| Reinvestment of distributions | 328,360 | 4,077,001 | ||||||
| Amount paid for shares redeemed | (7,345,936 | ) | (11,701,397 | ) | ||||
| Proceeds from redemption fees(a) | — | 668 | ||||||
| Total Institutional Class | (3,786,483 | ) | 2,907,119 | |||||
| Net increase (decrease) in net assets resulting from capital transactions | (5,140,004 | ) | 1,621,561 | |||||
| Total Decrease in Net Assets | (1,306,088 | ) | (23,341,143 | ) | ||||
See accompanying notes which are an integral part of these financial statements.
20
| APPLESEED FUND |
| STATEMENTS OF CHANGES IN NET ASSETS – continued |
| For the | ||||||||
| Six Months | For the | |||||||
| Ended | Year Ended | |||||||
| March 31, 2023 | September 30, | |||||||
| (Unaudited) | 2022 | |||||||
| Net Assets | ||||||||
| Beginning of period | $ | 81,625,844 | $ | 104,966,987 | ||||
| End of period | $ | 80,319,756 | $ | 81,625,844 | ||||
| Share Transactions - Investor Class | ||||||||
| Shares sold | 59,437 | 256,124 | ||||||
| Shares issued in reinvestment of distributions | 14,451 | 142,862 | ||||||
| Shares redeemed | (174,909 | ) | (511,548 | ) | ||||
| Total Investor Class | (101,021 | ) | (112,562 | ) | ||||
| Share Transactions - Institutional Class | ||||||||
| Shares sold | 239,099 | 715,949 | ||||||
| Shares issued in reinvestment of distributions | 25,162 | 248,632 | ||||||
| Shares redeemed | (550,762 | ) | (798,358 | ) | ||||
| Total Institutional Class | (286,501 | ) | 166,223 | |||||
| Net increase (decrease) in shares outstanding | (387,522 | ) | 53,661 | |||||
| (a) | The Fund charges a 2.00% redemption fee on shares redeemed within 90 calendar days of purchase. Shares are redeemed at the Net Asset Value if held longer than 90 calendar days. |
See accompanying notes which are an integral part of these financial statements.
21
[THIS PAGE INTENTIONALLY LEFT BLANK]
| APPLESEED FUND — INVESTOR CLASS |
| FINANCIAL HIGHLIGHTS |
| (For a share outstanding during each period) |
| For the | ||||||||
| Six Months | ||||||||
| Ended | For the | |||||||
| March 31, | Year Ended | |||||||
| 2023 | September 30, | |||||||
| (Unaudited) | 2022 | |||||||
| Selected Per Share Data: | ||||||||
| Net asset value, beginning of period | $ | 12.72 | $ | 16.50 | ||||
| Investment operations: | ||||||||
| Net investment income (loss)(a) | (0.02 | ) | 0.15 | |||||
| Net realized and unrealized gain (loss) on investments | 1.49 | (2.93 | ) | |||||
| Total from investment operations | 1.47 | (2.78 | ) | |||||
| Less distributions to shareholders from: | ||||||||
| Net investment income | — | (0.17 | ) | |||||
| Net realized gains | (0.87 | ) | (0.83 | ) | ||||
| Total distributions | (0.87 | ) | (1.00 | ) | ||||
| Paid-in capital from redemption fees | — | (c) | — | (c) | ||||
| Net asset value, end of period | $ | 13.32 | $ | 12.72 | ||||
| Total Return(d) | 5.42 | % (e) | (18.15 | )% | ||||
| Ratios and Supplemental Data: | ||||||||
| Net assets, end of period (000 omitted) | $ | 29,115 | $ | 29,096 | ||||
| Ratio of net expenses to average net assets(f)(g) | 1.14 | % (h) | 1.14 | % | ||||
| Ratio of expenses to average net assets before waiver and reimbursement(f) | 1.62 | % (h) | 1.48 | % | ||||
| Ratio of net investment income (loss) to average net assets(f) | (0.06 | )% (h) | 1.11 | % | ||||
| Portfolio turnover rate(i) | 39 | % (e) | 110 | % | ||||
| (a) | Recognition of net investment income by the Fund is affected by the timing of the declaration of dividends by the underlying funds in which the Fund invests. |
| (b) | Calculation based on the average number of shares outstanding during the period. |
| (c) | Rounds to less than $0.005 per share. |
| (d) | Total return represents the rate that the investor would have earned or lost on an investment in the Fund, assuming reinvestment of distributions. |
| (e) | Not annualized. |
| (f) | These ratios exclude the impact of expenses of the underlying security holdings as represented in the Schedule of Investments. |
| (g) | Excluding dividend and interest expense, the ratios of net expenses to average net assets were 1.14% for the six months ended March 31, 2023 and 1.14%, 1.14%, 1.14%, 1.14% and 1.25% for the fiscal years ended September 30, 2022, 2021, 2020, 2019 and 2018, respectively. |
| (h) | Annualized. |
| (i) | Portfolio turnover is calculated on the basis on the Fund as a whole without distinguishing among the classes of shares. |
See accompanying notes which are an integral part of these financial statements.
23
| For the | For the | For the | For the | |||||||||||
| Year Ended | Year Ended | Year Ended | Year Ended | |||||||||||
| September 30, | September 30, | September 30, | September 30, | |||||||||||
| 2021 | 2020 | 2019 | 2018 | |||||||||||
| $ | 11.51 | $ | 12.51 | $ | 13.77 | $ | 13.05 | |||||||
| 0.05 | 0.01 | (b) | 0.08 | 0.08 | ||||||||||
| 5.14 | (0.64 | ) | (0.15 | ) | 0.79 | |||||||||
| 5.19 | (0.63 | ) | (0.07 | ) | 0.87 | |||||||||
| (0.21 | ) | (0.37 | ) | (0.01 | ) | (0.09 | ) | |||||||
| — | — | (1.19 | ) | (0.06 | ) | |||||||||
| (0.21 | ) | (0.37 | ) | (1.20 | ) | (0.15 | ) | |||||||
| 0.01 | — | (c) | 0.01 | — | (c) | |||||||||
| $ | 16.50 | $ | 11.51 | $ | 12.51 | $ | 13.77 | |||||||
| 45.55 | % | (5.37 | )% | (0.44 | )% | 6.68 | % | |||||||
| $ | 39,598 | $ | 30,359 | $ | 54,725 | $ | 78,955 | |||||||
| 1.14 | % | 1.14 | % | 1.14 | % | 1.25 | % | |||||||
| 1.43 | % | 1.45 | % | 1.36 | % | 1.45 | % | |||||||
| 0.37 | % | 0.06 | % | 0.72 | % | 0.64 | % | |||||||
| 86 | % | 89 | % | 79 | % | 85 | % | |||||||
See accompanying notes which are an integral part of these financial statements.
24
| APPLESEED FUND — INSTITUTIONAL CLASS |
| FINANCIAL HIGHLIGHTS |
| (For a share outstanding during each period) |
| For the | ||||||||
| Six Months | ||||||||
| Ended | For the | |||||||
| March 31, | Year Ended | |||||||
| 2023 | September 30, | |||||||
| (Unaudited) | 2022 | |||||||
| Selected Per Share Data: | ||||||||
| Net asset value, beginning of period | $ | 12.80 | $ | 16.60 | ||||
| Investment operations: | ||||||||
| Net investment income (loss)(a) | (0.01 | ) | 0.20 | |||||
| Net realized and unrealized gain (loss) on investments | 1.49 | (2.97 | ) | |||||
| Total from investment operations | 1.48 | (2.77 | ) | |||||
| Less distributions to shareholders from: | ||||||||
| Net investment income | — | (0.20 | ) | |||||
| Net realized gains | (0.87 | ) | (0.83 | ) | ||||
| Total distributions | (0.87 | ) | (1.03 | ) | ||||
| Paid-in capital from redemption fees | — | (c) | — | (c) | ||||
| Net asset value, end of period | $ | 13.41 | $ | 12.80 | ||||
| Total Return(d) | 5.46 | % (e) | (17.99 | )% | ||||
| Ratios and Supplemental Data: | ||||||||
| Net assets, end of period (000 omitted) | $ | 51,205 | $ | 52,530 | ||||
| Ratio of net expenses to average net assets(f)(g) | 0.95 | % (h) | 0.95 | % | ||||
| Ratio of expenses to average net assets before waiver and reimbursement(f) | 1.25 | % (h) | 1.23 | % | ||||
| Ratio of net investment income to average net assets(f) | 0.13 | % (h) | 1.25 | % | ||||
| Portfolio turnover rate(i) | 39 | % (e) | 110 | % | ||||
| (a) | Recognition of net investment income by the Fund is affected by the timing of the declaration of dividends by the underlying funds in which the Fund invests. |
| (b) | Calculation based on the average number of shares outstanding during the period. |
| (c) | Rounds to less than $0.005 per share. |
| (d) | Total return represents the rate that the investor would have earned or lost on an investment in the Fund, assuming reinvestment of distributions. |
| (e) | Not annualized. |
| (f) | These ratios exclude the impact of expenses of the underlying security holdings as represented in the Schedule of Investments. |
| (g) | Excluding dividend and interest expense, the ratios of net expenses to average net assets were 0.95% for the six months ended March 31, 2023 and 0.95%, 0.95%, 0.95%, 0.95% and 1.06% for the fiscal years ended September 30, 2022, 2021, 2020, 2019 and 2018, respectively. |
| (h) | Annualized. |
| (i) | Portfolio turnover is calculated on the basis on the Fund as a whole without distinguishing among the classes of shares. |
See accompanying notes which are an integral part of these financial statements.
25
| For the | For the | For the | For the | |||||||||||
| Year Ended | Year Ended | Year Ended | Year Ended | |||||||||||
| September 30, | September 30, | September 30, | September 30, | |||||||||||
| 2021 | 2020 | 2019 | 2018 | |||||||||||
| $ | 11.58 | $ | 12.59 | $ | 13.86 | $ | 13.14 | |||||||
| 0.06 | 0.03 | (b) | 0.14 | 0.12 | ||||||||||
| 5.20 | (0.65 | ) | (0.18 | ) | 0.77 | |||||||||
| 5.26 | (0.62 | ) | (0.04 | ) | 0.89 | |||||||||
| (0.24 | ) | (0.39 | ) | (0.04 | ) | (0.11 | ) | |||||||
| — | — | (1.19 | ) | (0.06 | ) | |||||||||
| (0.24 | ) | (0.39 | ) | (1.23 | ) | (0.17 | ) | |||||||
| — | (c) | — | (c) | — | (c) | — | (c) | |||||||
| $ | 16.60 | $ | 11.58 | $ | 12.59 | $ | 13.86 | |||||||
| 45.85 | % | (5.20 | )% | (0.28 | )% | 6.85 | % | |||||||
| $ | 65,369 | $ | 54,447 | $ | 93,269 | $ | 97,643 | |||||||
| 0.95 | % | 0.95 | % | 0.95 | % | 1.06 | % | |||||||
| 1.19 | % | 1.20 | % | 1.11 | % | 1.20 | % | |||||||
| 0.58 | % | 0.23 | % | 0.95 | % | 0.86 | % | |||||||
| 86 | % | 89 | % | 79 | % | 85 | % | |||||||
See accompanying notes which are an integral part of these financial statements.
26
| APPLESEED FUND |
| NOTES TO FINANCIAL STATEMENTS |
| March 31, 2023 (Unaudited) |
NOTE 1. ORGANIZATION
Appleseed Fund (the “Fund”) is registered under the Investment Company Act of 1940, as amended (the “1940 Act”), as a non-diversified series of Unified Series Trust (the “Trust”) on September 11, 2006. The Trust is an open-end investment company established under the laws of Ohio by an Agreement and Declaration of Trust dated October 14, 2002, as amended (the “Trust Agreement”). The Trust Agreement permits the Board of Trustees of the Trust (the “Board”) to issue an unlimited number of shares of beneficial interest of separate series. The Fund is one of a series of funds currently authorized by the Board. The Fund’s investment adviser is Pekin Hardy Strauss, Inc. (the “Adviser”). The investment objective of the Fund is to provide long-term capital appreciation.
The Fund currently offers two classes of shares, Investor Class and Institutional Class. Investor Class shares were first offered to the public on December 8, 2006; and Institutional Class shares were first offered to the public on January 31, 2011. Each share represents an equal proportionate interest in the assets and liabilities belonging to the applicable class and is entitled to such dividends and distributions out of income belonging to the applicable class as are declared by the Board. The primary difference between the two classes is attributable to the administrative service fee arrangements for the Investor Class. On matters that affect the Fund as a whole, each class has the same voting and other rights and preferences as any other class. On matters that affect only one class, only shareholders of that class may vote. Each class votes separately on matters affecting only that class, or on matters expressly required to be voted on separately by state or federal law. Shares of each class of a series have the same voting and other rights and preferences as the other classes and series of the Trust for matters that affect the Trust as a whole. The Fund may offer additional classes of shares in the future.
Non-Diversification Risk – As a non-diversified fund, the Fund’s portfolio may focus on a limited number of companies. Because the Fund may hold the securities of fewer issuers than a diversified fund, the poor performance of an individual security in the Fund’s portfolio may have a greater negative impact on the Fund’s performance than if the Fund’s assets were diversified among a larger number of portfolio securities.
27
| APPLESEED FUND | |
| NOTES TO FINANCIAL STATEMENTS – continued | |
| March 31, 2023 (Unaudited) | |
NOTE 2. SIGNIFICANT ACCOUNTING POLICIES
The Fund is an investment company and follows accounting and reporting guidance under Financial Accounting Standards Board Accounting Standards Codification (“ASC”) Topic 946, “Financial Services-Investment Companies” including Accounting Standards Update 2013-08. The following is a summary of significant accounting policies followed by the Fund in the preparation of its financial statements. These policies are in conformity with generally accepted accounting principles in the United States of America (“GAAP”).
Estimates – The preparation of financial statements in conformity with GAAP requires management to make estimates and assumptions that affect the reported amounts of assets and liabilities and disclosure of contingent assets and liabilities at the date of the financial statements and the reported amounts of increases and decreases in net assets from operations during the reporting period. Actual results could differ from those estimates.
Foreign Currency Translation – The accounting records of the Fund are maintained in U.S. dollars. Foreign currency amounts are translated into U.S. dollars at the current rate of exchange each business day to determine the value of investments, and other assets and liabilities. Purchases and sales of foreign securities, and income and expenses, are translated at the prevailing rate of exchange on the respective date of these transactions. The Fund does not isolate that portion of the results of operations resulting from changes in foreign exchange rates on investments from fluctuations arising from changes in market prices of securities held. These fluctuations are included with the realized and unrealized gain or loss from investments. Net realized gain (loss) on foreign currency translations on the Statement of Operations represents currency gains (losses) realized between the trade and settlement dates on securities transactions, and the difference between the amount of investment income and foreign withholding taxes recorded on the Fund’s books and the U.S. dollar equivalent amounts actually received or paid. The change in unrealized currency gains (losses) on foreign currency translations for the period is reflected in the Statement of Operations.
28
| APPLESEED FUND | |
| NOTES TO FINANCIAL STATEMENTS – continued | |
| March 31, 2023 (Unaudited) | |
NOTE 2. SIGNIFICANT ACCOUNTING POLICIES — continued
Short Sales – The Fund may make short sales as part of its overall portfolio management strategies or to offset a potential decline in value of a security. The Fund may engage in short sales with respect to various types of securities, including exchange-traded funds (“ETFs”) and futures. A short sale involves the sale of a security that is borrowed from a broker or other institution to complete the sale. The Fund may engage in short sales with respect to securities it owns, as well as securities that it does not own. Short sales expose the Fund to the risk that it will be required to acquire, convert, or exchange securities to replace the borrowed securities (also known as “covering” the short position) at a time when the securities sold short have appreciated in value, thus resulting in a loss to the Fund. The Fund’s investment performance may also suffer if the Fund is required to close out a short position earlier than it had intended. The Fund will be required to pledge its liquid assets to the broker in order to secure its performance on short sales. As a result, the assets pledged may not be available to meet the Fund’s needs for immediate cash or other liquidity. In addition, the Fund may be subject to expenses related to short sales that are not typically associated with investing in securities directly, such as costs of borrowing and margin account maintenance costs associated with the Fund’s open short positions. These types of short sales expenses are sometimes referred to as the “negative cost of carry,” and will tend to cause the Fund to lose money on a short sale even in instances where the price of the underlying security sold short does not change over the duration of the short sale. Dividend expenses on securities sold short and borrowing costs are not covered under the Adviser’s expense limitation agreement with the Fund and, therefore, these expenses will be borne by the shareholders of the Fund. The Fund’s ESG investment screens are not applied to short sales.
Federal Income Taxes – The Fund makes no provision for federal income or excise tax. The Fund has qualified and intends to qualify each year as a regulated investment company (“RIC”) under subchapter M of the Internal Revenue Code of 1986, as amended, by complying with the requirements applicable to RICs and by distributing substantially all of its taxable income. The Fund also intends to distribute sufficient net investment income and net realized capital gains, if any, so that it will not
29
| APPLESEED FUND | |
| NOTES TO FINANCIAL STATEMENTS – continued | |
| March 31, 2023 (Unaudited) | |
NOTE 2. SIGNIFICANT ACCOUNTING POLICIES — continued
be subject to excise tax on undistributed income and gains. If the required amount of net investment income or gains is not distributed, the Fund could incur a tax expense.
As of and during the six months ended March 31, 2023, the Fund did not have any liabilities for any unrecognized tax benefits. The Fund recognizes interest and penalties, if any, related to unrecognized tax benefits as income tax expense in the Statement of Operations when incurred. During the period, the Fund did not incur any interest or penalties. Management of the Fund has reviewed tax positions taken in tax years that remain subject to examination by all major tax jurisdictions, including federal (i.e., the previous three years tax year ends and the interim tax period since then, as applicable) and has concluded that no provision for unrecognized tax benefits or expenses is required in these financial statements and does not expect this to change over the next twelve months.
Expenses – Expenses incurred by the Trust that do not relate to a specific fund of the Trust are allocated to the individual funds based on each fund’s relative net assets or another appropriate basis (as determined by the Board). Expenses specifically attributable to any class are borne by that class. Income, realized gains and losses, unrealized appreciation and depreciation, and fund-wide expenses not allocated to a particular class shall be allocated to each class based on the net assets of that class in relation to the net assets of the entire fund.
Security Transactions and Related Income – The Fund follows industry practice and records security transactions on the trade date for financial reporting purposes. The specific identification method is used for determining gains or losses for financial statements and income tax purposes. Dividend income is recorded on the ex-dividend date and interest income is recorded on an accrual basis. Dividend income from Real Estate Investment Trusts (“REITs”) and distributions from Limited Partnerships are recognized on the ex-date. The calendar year end classification of distributions received from REITs during the fiscal year are reported subsequent to year end; accordingly, the Fund estimates the character of REIT distributions based on the most recent information available. Income or loss from Limited Partnerships is reclassified in
30
| APPLESEED FUND | |
| NOTES TO FINANCIAL STATEMENTS – continued | |
| March 31, 2023 (Unaudited) | |
NOTE 2. SIGNIFICANT ACCOUNTING POLICIES — continued
the components of net assets upon receipt of K-1’s. Discounts and premiums on securities purchased are amortized or accreted using the effective interest method. Withholding taxes on foreign dividends have been provided for in accordance with the Fund’s understanding of the applicable country’s tax rules and rates. The ability of issuers of debt securities held by the Fund to meet their obligations may be affected by economic and political developments in a specific country or region.
Redemption Fees – The Fund charges a 2.00% redemption fee, applicable to each share class, for shares redeemed within 90 calendar days of purchase. These fees are deducted from the redemption proceeds otherwise payable to the shareholder. The Fund will retain the fee charged as an increase in paid-in capital and such fees become part of the Fund’s daily net asset value (“NAV”) calculation.
Dividends and Distributions – The Fund intends to distribute its net investment income and net realized long-term and short-term capital gains, if any, at least annually. Dividends and distributions to shareholders, which are determined in accordance with income tax regulations, are recorded on the ex-dividend date. The treatment for financial reporting purposes of distributions made to shareholders during the period from net investment income or net realized capital gains may differ from their ultimate treatment for federal income tax purposes. These differences are caused primarily by differences in the timing of the recognition of certain components of income, expense or realized capital gain for federal income tax purposes. Where such differences are permanent in nature, they are reclassified among the components of net assets based on their ultimate characterization for federal income tax purposes. Any such reclassifications will have no effect on net assets, results of operations or NAV per share of the Fund.
NOTE 3. SECURITIES VALUATION AND FAIR VALUE MEASUREMENTS
The Fund values its portfolio securities at fair value as of the close of regular trading on the New York Stock Exchange (“NYSE”) (normally 4:00 p.m. Eastern Time) on each business day the NYSE is open for business. Fair value is defined as the price that the Fund would receive upon selling an investment in a timely transaction to an independent buyer
31
| APPLESEED FUND | |
| NOTES TO FINANCIAL STATEMENTS – continued | |
| March 31, 2023 (Unaudited) | |
NOTE 3. SECURITIES VALUATION AND FAIR VALUE MEASUREMENTS — continued
in the principal or most advantageous market of the investment. GAAP establishes a three-tier hierarchy to maximize the use of observable market data and minimize the use of unobservable inputs and to establish classification of fair value measurements for disclosure purposes.
Inputs refer broadly to the assumptions that market participants would use in pricing the asset or liability, including assumptions about risk (the risk inherent in a particular valuation technique used to measure fair value including a pricing model and/or the risk inherent in the inputs to the valuation technique). Inputs may be observable or unobservable. Observable inputs are inputs that reflect the assumptions market participants would use in pricing the asset or liability developed based on market data obtained and available from sources independent of the reporting entity. Unobservable inputs are inputs that reflect the reporting entity’s own assumptions about the assumptions market participants would use in pricing the asset or liability developed based on the best information available in the circumstances.
Various inputs are used in determining the value of the Fund’s investments. These inputs are summarized in the three broad levels listed below.
| ● | Level 1 – unadjusted quoted prices in active markets for identical investments and/or registered investment companies where the value per share is determined and published and is the basis for current transactions for identical assets or liabilities at the valuation date |
| ● | Level 2 – other significant observable inputs (including, but not limited to, quoted prices for an identical security in an inactive market, quoted prices for similar securities, interest rates, prepayment speeds, credit risk, etc.) |
| ● | Level 3 – significant unobservable inputs (including the Fund’s own assumptions in determining fair value of investments based on the best information available) |
32
| APPLESEED FUND | |
| NOTES TO FINANCIAL STATEMENTS – continued | |
| March 31, 2023 (Unaudited) | |
NOTE 3. SECURITIES VALUATION AND FAIR VALUE MEASUREMENTS — continued
The inputs used to measure fair value may fall into different levels of the fair value hierarchy. In such cases, for disclosure purposes, the level in the fair value hierarchy which is reported is determined based on the lowest level input that is significant to the fair value measurement in its entirety.
Equity securities that are traded on any stock exchange are generally valued at the last quoted sale price on the security’s primary exchange. Lacking a last sale price, an exchange-traded security is generally valued at its last bid price. Securities traded in the Nasdaq over-the-counter market are generally valued at the Nasdaq Official Closing Price. When using market quotations and when the market is considered active, the security is classified as a Level 1 security. In the event that market quotations are not readily available or are considered unreliable due to market or other events, securities are valued in good faith by the Adviser, as Valuation Designee, under the oversight of the Board’s Pricing & Liquidity Committee. The Adviser has adopted written policies and procedures for valuing securities and other assets in circumstances where market quotes are not readily available. In the event that market quotes are not readily available, and the security or asset cannot be valued pursuant to one of the valuation methods, the value of the security or asset will be determined in good faith by the Valuation Designee pursuant to its policies and procedures. To assist the Valuation Designee in carrying out the responsibility to determine the fair value of any securities or other assets for which market quotations are not readily available, the Trust has created a fair valuation pricing committee (the “Fair Value Committee”). The Fair Value Committee consists of the following standing members: (a) the Trust’s Treasurer or designee, (b) a representative of Ultimus and (c) on an ad hoc basis at a particular valuation time for which a fair valuation method is being determined for a Fund, a representative of the Adviser, which is the Valuation Designee. The Fair Value Committee will review any fair value provided by the Valuation Designee, subject to the ultimate review of the pricing methodology by the Pricing & Liquidity Committee of the Board on a quarterly basis. Under these policies, the securities will be classified as Level 2 or 3 within the fair value hierarchy, depending on the inputs used.
33
| APPLESEED FUND | |
| NOTES TO FINANCIAL STATEMENTS – continued | |
| March 31, 2023 (Unaudited) | |
NOTE 3. SECURITIES VALUATION AND FAIR VALUE MEASUREMENTS — continued
Investments in mutual funds, including money market mutual funds, are generally priced at the ending NAV provided by the service agent of the mutual funds. These securities are categorized as Level 1 securities.
Debt securities are valued by using the mean between the closing bid and ask prices provided by a pricing service. If the closing bid and ask prices are not readily available, the pricing service may provide a price determined by a matrix pricing method. Matrix pricing is a mathematical technique used to value fixed income securities without relying exclusively on quoted prices. Matrix pricing takes into consideration recent transactions, yield, liquidity, risk, credit quality, coupon, maturity, type of issue and any other factors or market data the pricing service deems relevant for the actual security being priced and for other securities with similar characteristics. These securities will generally be categorized as Level 2 securities. If the Board or the Adviser decides that a price provided by the pricing service does not accurately reflect the fair value of the securities or when prices are not readily available from a pricing service, securities are valued at fair value as determined by the Valuation Designee, in conformity with guidelines adopted by and subject to review of the Board. These securities will generally be categorized as Level 3 securities.
Certificates of deposit are priced at their original cost, which approximates their fair value, through maturity date. These securities will be classified as Level 2 securities.
Option contracts are generally traded on an exchange and are generally valued at the last trade price, as provided by a pricing service. If there is no such reported sale on the valuation date, long positions are valued at the most recent bid price, and short positions are valued at the most recent ask price. The option contracts will generally be categorized as Level 1 securities unless the market is considered inactive or the absence of a last bid or ask price, in which case, they will be categorized as Level 2 securities.
In accordance with the Trust’s valuation policies and fair value determinations pursuant to Rule 2a-5, the Adviser as Valuation Designee is required to consider all appropriate factors relevant to the value of securities for which it has determined other pricing sources are not
34
| APPLESEED FUND | |
| NOTES TO FINANCIAL STATEMENTS – continued | |
| March 31, 2023 (Unaudited) | |
NOTE 3. SECURITIES VALUATION AND FAIR VALUE MEASUREMENTS — continued
available or reliable as described above. No single method exists for determining fair value, because fair value depends upon the circumstances of each individual case. As a general principle, the current fair value of a security being valued by the Valuation Designee would be the amount that the Fund might reasonably expect to receive upon the current sale. Methods that are in accordance with this principle may, for example, be based on (i) a multiple of earnings; (ii) a discount from market prices of a similar freely traded security (including a derivative security or a basket of securities traded on other markets, exchanges or among dealers); or (iii) yield to maturity with respect to debt issues, or a combination of these and other methods. Fair-value pricing is permitted if, in the Valuation Designee’s opinion, the validity of market quotations appears to be questionable based on factors such as evidence of a thin market in the security based on a small number of quotations, a significant event occurs after the close of a market but before the Fund’s NAV calculation that may affect a security’s value, or the Valuation Designee is aware of any other data that calls into question the reliability of market quotations.
The following is a summary of the inputs used to value the Fund’s investments as of March 31, 2023:
| Valuation Inputs | ||||||||||||||||
| Assets | Level 1 | Level 2 | Level 3 | Total | ||||||||||||
| Common Stocks(a) | $ | 54,038,531 | $ | — | $ | 171 | $ | 54,038,702 | ||||||||
| Closed-End Funds | 12,603,700 | — | — | 12,603,700 | ||||||||||||
| Exchange-Traded Funds | 1,910,000 | — | — | 1,910,000 | ||||||||||||
| Preferred Stocks | 1,765,500 | — | — | 1,765,500 | ||||||||||||
| U.S. Government & Agencies | — | 2,315,951 | — | 2,315,951 | ||||||||||||
| Convertible Bonds | — | 3,877,500 | — | 3,877,500 | ||||||||||||
| Certificates of Deposit | — | 1,488,050 | — | 1,488,050 | ||||||||||||
| Put Options Purchased | 577,825 | — | — | 577,825 | ||||||||||||
| Money Market Funds | 831,474 | — | — | 831,474 | ||||||||||||
| Total | $ | 71,727,030 | $ | 7,681,501 | $ | 171 | $ | 79,408,702 | ||||||||
| (a) | Refer to Schedule of Investments for sector classifications. |
35
| APPLESEED FUND | |
| NOTES TO FINANCIAL STATEMENTS – continued | |
| March 31, 2023 (Unaudited) | |
NOTE 3. SECURITIES VALUATION AND FAIR VALUE MEASUREMENTS — continued
A reconciliation of Level 3 investments and disclosures of significant unobservable inputs are presented when the Fund has a significant amount of Level 3 investments at the end of the period in relation to Net Assets. Management has concluded that Level 3 investments are not material in relation to Net Assets.
For the six months ended March 31, 2023, there were no significant changes into/out of Level 3. The transfer into Level 3 investments for the Fund were immaterial, although the unrealized depreciation on these investments was $3,218,298. These securities were impacted by the invasion of Ukraine and sanctions on market conditions in Russia.
From the start of the conflict in Ukraine until March 31, 2023, Russian-held investments were valued at an approximately 99 percent discount from their last traded prices.
NOTE 4. DERIVATIVE TRANSACTIONS
The Fund may engage in options and futures transactions, which are sometimes referred to as derivative transactions. The Fund uses derivative instruments for any purpose consistent with its investment objective, such as for hedging or obtaining interest rate exposure. The Fund also may use derivative instruments to obtain market exposure (that is, for speculative purposes rather than hedging). The Adviser may establish a position in the derivatives market as a substitute for buying, selling, or holding certain securities. The use of derivative instruments may provide a less expensive, more expedient or more specifically focused way to invest than traditional securities would.
Written Options Contracts – The Fund may write options contracts for which premiums received are recorded as liabilities and are subsequently adjusted to the current value of the options written. Premiums received from writing options which expire are treated as realized gains. Premiums received from writing options which are either exercised or closed
36
| APPLESEED FUND | |
| NOTES TO FINANCIAL STATEMENTS – continued | |
| March 31, 2023 (Unaudited) | |
NOTE 4. DERIVATIVE TRANSACTIONS — continued
are offset against the proceeds received or the amount paid on the transaction to determine realized gains or losses. Investing in written options contracts exposes a Fund to equity price risk.
The following tables identify the location and fair value of derivative instruments on the Statement of Assets and Liabilities as of March 31, 2023, and the effect of derivative instruments on the Statement of Operations for the six months ended March 31, 2023.
At March 31, 2023:
| Location of Derivatives on the Statement | ||||||
| Derivatives | of Assets & Liabilities | Amount | ||||
| Equity Price Risk: | ||||||
| Purchased options | Investments in securities, at fair value | $ | 577,825 | |||
For the six months ended March 31, 2023:
| Change in | ||||||||||
| Location of Gain (Loss) on | Realized Gain | Unrealized | ||||||||
| Derivatives on the Statement of | (Loss) on | Depreciation on | ||||||||
| Derivatives | Operation | Derivatives | Derivatives | |||||||
| Equity Price Risk: | ||||||||||
| Purchased options | Net realized gain and change in unrealized appreciation (depreciation) on investment securities | $ | (1,361,399 | ) | $ | (3,616,521 | ) | |||
| Written options | Net realized gain and change in unrealized appreciation (depreciation) on investment securities | 241,602 | (245,629 | ) | ||||||
The following table summarizes the average ending monthly fair value of derivatives outstanding during the six months ended March 31, 2023:
| Average | ||||
| Derivatives | Market Value | |||
| Purchased options | $ | 1,189,260 | ||
NOTE 5. FEES AND OTHER TRANSACTIONS WITH AFFILIATES
The Adviser, under the terms of the management agreement with the Trust with respect to the Fund (the “Agreement”), manages the Fund’s investments. As compensation for its management services, the Fund is obligated to pay the Adviser a management fee computed and accrued
37
| APPLESEED FUND | |
| NOTES TO FINANCIAL STATEMENTS – continued | |
| March 31, 2023 (Unaudited) | |
NOTE 5. FEES AND OTHER TRANSACTIONS WITH AFFILIATES — continued
daily and paid monthly at an annual rate of 0.85% of the Fund’s average daily net assets. For the six months ended March 31, 2023, before the waiver described below, the Adviser earned a fee of $347,680 from the Fund. The Adviser has contractually agreed to waive its management fee and/or reimburse expenses through January 31, 2024 so that total annual operating expenses (excluding portfolio transaction and other investment-related costs (including brokerage fees and commissions); taxes; borrowing costs (such as interest and dividend expenses on securities sold short); acquired fund fees and expenses; fees and expenses associated with investments in other collective investment vehicles or derivative instruments (including for example option and swap fees and expenses); any amounts payable pursuant to a distribution or service plan adopted in accordance with Rule 12b-1 under the 1940 Act; any administrative and/or shareholder servicing fees payable pursuant to a plan adopted by the Board; expenses incurred in connection with any merger or reorganization; extraordinary expenses (such as litigation expenses, indemnification of Trust officers and Trustees and contractual indemnification of Fund service providers); and other expenses that the Trustees agree have not been incurred in the ordinary course of the Fund’s business) do not exceed 0.95% of the Fund’s average daily net assets. For the six months ended March 31, 2023, the Adviser waived management fees of $141,316. At March 31, 2023, the Adviser was owed $32,907 from the Fund for management services.
Each fee waiver/expense payment by the Adviser is subject to recoupment by the Adviser from the Fund in the three years following the date in which that particular waiver/expense payment occurred, but only if such recoupment can be achieved without exceeding the annual expense limitation in effect at the time of the waiver/expense payment and any expense limitation in effect at the time of the recoupment. As of March
38
| APPLESEED FUND | |
| NOTES TO FINANCIAL STATEMENTS – continued | |
| March 31, 2023 (Unaudited) | |
NOTE 5. FEES AND OTHER TRANSACTIONS WITH AFFILIATES — continued
31, 2023 the Adviser may seek repayment of management fees waived and expense reimbursements pursuant to the aforementioned conditions, from the Fund no later than the dates stated below:
| Recoverable through | ||||
| September 30, 2023 | $ | 148,010 | ||
| September 30, 2024 | 251,241 | |||
| September 30, 2025 | 270,978 | |||
| March 31, 2026 | 141,316 |
Ultimus Fund Solutions, LLC (“Ultimus”) provides administration, fund accounting and transfer agent services to the Fund. The Fund pays Ultimus fees in accordance with the agreements for such services.
Northern Lights Compliance Services, LLC (“NLCS”), an affiliate of Ultimus, provides a Chief Compliance Officer to the Trust, as well as related compliance services, pursuant to a consulting agreement between NLCS and the Trust. Under the terms of such agreement, NLCS receives fees from the Fund, which are approved annually by the Board.
Under the terms of a Distribution Agreement with the Trust, Ultimus Fund Distributors, LLC (the “Distributor”) serves as principal underwriter to the Fund. The Distributor is a wholly-owned subsidiary of Ultimus. The Distributor is compensated by the Adviser (not the Fund) for acting as principal underwriter.
Certain officers and a Trustee of the Trust are also employees of Ultimus and such persons are not paid by the Fund for serving in such capacities.
The Board supervises the business activities of the Trust. Each Trustee serves as a trustee until termination of the Trust unless the Trustee dies, resigns, retires, or is removed. The Chairman of the Board and more than 75% of the Trustees are “Independent Trustees,” which means that they are not “interested persons” as defined in the 1940 Act. The Independent Trustees review and establish compensation at least annually. Each Independent Trustee of the Trust receives annual compensation, which is an established amount paid quarterly per fund in the Trust at the time of the regular quarterly Board meetings. The Chairman of the Board receives the highest compensation, commensurate with his additional
39
| APPLESEED FUND | |
| NOTES TO FINANCIAL STATEMENTS – continued | |
| March 31, 2023 (Unaudited) | |
NOTE 5. FEES AND OTHER TRANSACTIONS WITH AFFILIATES — continued
duties and each Chair of a committee receives additional compensation as well. Independent Trustees also receive $1,000 for attending any special meeting that requires an in-person approval of a contract and $250 for the first hour and $200 for each additional hour for attending other special meetings. In addition, the Trust reimburses Independent Trustees for out-of-pocket expenses incurred in conjunction with attendance at meetings.
The Fund has adopted an Administrative Services Plan with respect to Investor Class shares, pursuant to which the Fund pays an annual fee of 0.25% of the average daily net assets of the Fund’s Investor Class shares to reimburse the Adviser for compensating financial intermediaries who provide administrative services to the Investor Class shareholders. The Adviser has contractually agreed to waive its receipt of payments under the Administrative Services Plan, to the extent such payments exceed an annual rate of 0.19% of the average daily net assets of Investor Class shares. This contractual waiver is in effect through January 31, 2024. Financial intermediaries eligible to receive payments under the Administrative Services Plan include mutual fund supermarkets and other platforms sponsored by any 401(k) plan, bank, trust company or broker-dealer that have entered into an agreement with the Fund or the Fund’s distributor to sell the Fund’s Investor Class shares. For purposes of the Administrative Services Plan, administrative services include, but are not limited to (i) acting as record holder and nominee of Investor Class shares beneficially owned by the financial intermediary’s customers; (ii) providing sub-accounting services to such customers; (iii) processing and issuing confirmations with respect to orders to purchase, redeem or exchange Investor Class shares; (iv) processing dividend payments; and (v) providing periodic account statements. For the six months ended March 31, 2023, the Investor Class incurred Administrative Services fees of $36,919 ($28,059 after the waiver described above). At March 31, 2023, $4,673 was owed to the Adviser pursuant to the Administrative Services Plan.
The Trust, with respect to the Investor Class shares of the Fund, has adopted a Distribution Plan under Rule 12b-1 of the 1940 Act, pursuant to which the Fund is authorized to pay a fee of up to 0.25% of the average daily net assets of the Investor Class shares of the Fund to the Fund’s Adviser or
40
| APPLESEED FUND | |
| NOTES TO FINANCIAL STATEMENTS – continued | |
| March 31, 2023 (Unaudited) | |
NOTE 5. FEES AND OTHER TRANSACTIONS WITH AFFILIATES — continued
any bank, broker-dealer, investment adviser or other financial intermediary that assists the Fund in the sale and distribution of its Investor Class shares or that provides shareholder servicing. The Fund does not currently intend to activate the Plan, but may do so upon 60 days’ notice to shareholders. If the Plan is activated, these fees will, over time, increase the cost of your investment and may cost you more than paying other types of sales charges because these fees are paid out of the Fund’s assets on an on-going basis.
NOTE 6. INVESTMENT TRANSACTIONS
For the six months ended March 31, 2023, purchases and sales of investment securities, other than short-term investments, were as follows:
| Purchases | $ | 30,138,342 | ||
| Sales | 37,154,967 |
There were no purchases or sales of long-term U.S. government obligations during the six months ended March 31, 2023.
NOTE 7. FEDERAL TAX INFORMATION
At March 31, 2023, the net unrealized appreciation (depreciation) of investments, including securities sold short and written options, for tax purposes was as follows:
| Gross unrealized appreciation | $ | 10,998,504 | ||
| Gross unrealized depreciation | (9,159,693 | ) | ||
| Net unrealized appreciation on investments | $ | 1,838,811 | ||
| Tax cost of investments . | $ | 77,319,891 |
The tax character of distributions paid for the fiscal year ended September 30, 2022, the Fund’s most recent fiscal year end, was as follows:
| Distributions paid from: | ||||
| Ordinary income(a) | $ | 1,354,411 | ||
| Net long term capital gains | 5,167,150 | |||
| Total distributions paid | $ | 6,521,561 |
| (a) | Short-term capital gain distributions are treated as ordinary income for tax purposes. |
41
| APPLESEED FUND | |
| NOTES TO FINANCIAL STATEMENTS – continued | |
| March 31, 2023 (Unaudited) | |
NOTE 7. FEDERAL TAX INFORMATION — continued
At September 30, 2022, the Fund’s most recent fiscal year end, the components of accumulated earnings (deficit) on a tax basis were as follows:
| Accumulated capital and other losses | $ | (3,678,362 | ) | |
| Unrealized appreciation on investments | 400,568 | |||
| Total accumulated earnings | $ | (3,277,794 | ) |
At September 30, 2022, the difference between book basis and tax basis unrealized appreciation (depreciation) is attributable to the tax deferral of losses on wash sales and basis adjustments for investments in passive foreign investment companies.
Currency and qualified late year ordinary losses and specified gains realized after October 31, and net investment losses realized after December 31 of a Fund’s fiscal year may be deferred and treated as occurring on the first business day of the flowing fiscal year for tax purposes. For the fiscal year ended September 30, 2022, the Fund deferred $631,108 in late year ordinary losses and $3,047,254 in post October losses.
NOTE 8. COMMITMENTS AND CONTINGENCIES
The Trust indemnifies its officers and Trustees for certain liabilities that may arise from their performance of their duties to the Trust or the Fund. Additionally, in the normal course of business, the Trust enters into contracts that contain a variety of representations and warranties which provide general indemnifications. The Trust’s maximum exposure under these arrangements is unknown, as this would involve future claims that may be made against the Trust that have not yet occurred.
NOTE 9. SUBSEQUENT EVENTS
Management of the Fund has evaluated the need for disclosures and/ or adjustments resulting from subsequent events through the date at which these financial statements were issued. Based upon this evaluation, management has determined there were no items requiring adjustment of the financial statements or additional disclosure.
42
| SUMMARY OF FUND EXPENSES – (Unaudited) |
As a shareholder of the Fund, you incur two types of costs: (1) transaction costs, including redemption fees; and (2) ongoing costs, including management fees, distribution (12b-1) fees and other Fund expenses. These examples are intended to help you understand your ongoing costs (in dollars) of investing in the Fund and to compare these costs with the ongoing costs of investing in other funds. You may pay brokerage commissions on purchases and sales of exchange-traded fund shares, which are not reflected in the example. The example is based on an investment of $1,000 invested at the beginning of the period and held for the entire period from October 1, 2022 through March 31, 2023.
Actual Expenses
The first line of the table for each class provides information about actual account values and actual expenses. You may use the information in these lines, together with the amount you invested, to estimate the expenses that you paid over the period. Simply divide your account value by $1,000 (for example, an $8,600 account value divided by $1,000 = 8.60), then multiply the result by the number in the first line under the heading “Expenses Paid During Period” to estimate the expenses you paid on your account during this period.
Hypothetical Example for Comparison Purposes
The second line of the table for each class provides information about hypothetical account values and hypothetical expenses based on the Fund’s actual expense ratios and an assumed rate of return of 5% per year before expenses, which is not the Fund’s actual return. The hypothetical account values and expenses may not be used to estimate the actual ending account balances or expenses you paid for the period. You may use this information to compare the ongoing costs of investing in the Fund and other funds. To do so, compare this 5% hypothetical example with the 5% hypothetical examples that appear in the shareholder reports of other funds.
Expenses shown in the table are meant to highlight your ongoing costs only and do not reflect any transactional costs. Therefore, the second line of the table for each class is useful in comparing ongoing costs only and will not help you determine the relative total costs of owning different funds. In addition, if transaction costs were included, your costs would have been higher.
43
| SUMMARY OF FUND EXPENSES – continued (Unaudited) |
| Beginning | Ending | |||||||||
| Account Value | Account Value | Expenses | Annualized | |||||||
| October 1, | March 31, | Paid During | Expense | |||||||
| APPLESEED FUND | 2022 | 2023 | Period(a) | Ratio | ||||||
| Investor | ||||||||||
| Class | Actual | $1,000.00 | $1,054.20 | $5.84 | 1.14% | |||||
| Hypothetical(b) | $1,000.00 | $1,019.25 | $5.74 | 1.14% | ||||||
| Institutional | ||||||||||
| Class | Actual | $1,000.00 | $1,054.60 | $4.87 | 0.95% | |||||
| Hypothetical(b) | $1,000.00 | $1,020.19 | $4.78 | 0.95% | ||||||
| (a) | Expenses are equal to the Fund’s annualized expense ratios, multiplied by the average account value over the period, multiplied by 182/365 (to reflect the one-half year period). |
| (b) | Hypothetical assumes 5% annual return before expenses. |
44
| PRIVACY NOTICE | |
| Rev: March 2021 | |
| FACTS | WHAT DOES APPLESEED FUND (THE “FUND”) DO WITH YOUR PERSONAL INFORMATION? |
| Why? | Financial companies choose how they share your personal information. Federal law gives consumers the right to limit some but not all sharing. Federal law also requires us to tell you how we collect, share, and protect your personal information. Please read this notice carefully to understand what we do. |
| What? | The types of personal information we collect and share depend on the product or service you have with us. This information can include:
● Social Security number
● account balances and account transactions
● transaction or loss history and purchase history
● checking account information and wire transfer instructions
When you are no longer our customer, we continue to share your information as described in this notice. |
| How? | All financial companies need to share customers’ personal information to run their everyday business. In the section below, we list the reasons financial companies can share their customers’ personal information; the reasons the Fund chooses to share; and whether you can limit this sharing. |
| Reasons we can share your personal information | Does
the Fund share? |
| For
our everyday business purposes— such as to process your transactions, maintain your account(s), respond to court orders and legal investigations, or report to credit bureaus |
Yes |
| For
our marketing purposes— to offer our products and services to you |
No |
| For joint marketing with other financial companies | No |
| For
our affiliates’ everyday business purposes— information about your transactions and experiences |
No |
| For
our affiliates’ everyday business purposes— information about your creditworthiness |
No |
| For nonaffiliates to market to you | No |
| Questions? | Call (800) 470-1029 |
45
| Who we are | |
| Who is providing this notice? | Appleseed Fund Ultimus Fund Distributors, LLC (Distributor) Ultimus Fund Solutions, LLC (Administrator) |
| What we do | |
| How does the Fund protect my personal information? | To protect your personal information from unauthorized access and use, we use security measures that comply with federal law. These measures include computer safeguards and secured files and buildings. Our service providers are held accountable for adhering to strict policies and procedures to prevent any misuse of your nonpublic personal information. |
| How does the Fund collect my personal information? | We collect your personal information, for example, when you
● open an account or deposit money
● buy securities from us or sell securities to us
● make deposits or withdrawals from your account or provide account information
● give us your account information
● make a wire transfer
● tell us who receives the money
● tell us where to send the money
● show your government-issued ID
● show your driver’s license |
| Why can’t I limit all sharing? | Federal law gives you the right to limit only
● sharing for affiliates’ everyday business purposes—information about your creditworthiness
● affiliates from using your information to market to you
● sharing for nonaffiliates to market to you
State laws and individual companies may give you additional rights to limit sharing. |
| Definitions | |
| Affiliates | Companies related by common ownership or control. They can be financial and nonfinancial companies.
● Perkin Hardy Strauss, Inc., the investment adviser to the Fund, could be deemed to be an affiliate. |
| Nonaffiliates | Companies not related by common ownership or control. They can be financial and nonfinancial companies.
● The Fund does not share your personal information with nonaffiliates so they can market to you |
| Joint marketing | A formal agreement between nonaffiliated financial companies that together market financial products or services to you.
● The Fund doesn’t jointly market. |
46
PROXY VOTING
A description of the policies and procedures that the Fund uses to determine how to vote proxies relating to portfolio securities and information regarding how the Fund voted those proxies during the most recent twelve month period ended June 30, are available (1) without charge upon request by calling the Fund at (800) 470-1029 and (2) in Fund documents filed with the SEC on the SEC’s website at www.sec.gov.
TRUSTEES
OFFICERS
NVESTMENT
ADVISER
DISTRIBUTOR |
INDEPENDENT
REGISTERED
LEGAL
COUNSEL
CUSTODIAN
ADMINISTRATOR, |
This report is intended only for the information of shareholders or those who have received the Fund’s prospectus which contains information about the Fund’s management fee and expenses. Please read the prospectus carefully before investing.
Distributed by Ultimus Fund Distributors, LLC
Member FINRA/SIPC

Appleseed-SAR-23

Channel Short Duration Income Fund
Semi-Annual Report
March 31, 2023
Fund Adviser:
Channel
Investment Partners LLC
4601 N. Fairfax Drive, Suite 1200
Arlington, VA 22203
Toll Free (877) 627-8504
Investment Results (Unaudited)
Average Annual Total Returns* as of March 31, 2023
| Six Months | One Year | Five Year | Ten Year | |||||
| Channel Short Duration Income Fund | 6.95% | 1.13% | 2.94% | 1.98% | ||||
| Bloomberg U.S. 1-5 Year Government/Credit Index(a) | 3.04% | (0.33)% | 1.32% | 1.13% | ||||
| Bloomberg U.S. Intermediate Government/Credit Bond Index(b) | 3.91% | (1.66)% | 1.40% | 1.32% |
Total annual operating expenses as disclosed in the Channel Short Duration Income Fund (the “Fund”) prospectus dated January 28, 2023 were 1.15% of average daily net assets (0.95% after fee waivers/expense reimbursement by Channel Investment Partners LLC (the “Adviser”)). The Adviser has contractually agreed to waive its management fee and to the extent necessary, reimburse certain Fund operating expenses through January 31, 2024 so that the total annual operating expenses through, excluding portfolio transaction and other investment-related costs (including brokerage fees and commissions); taxes; borrowing costs (such as interest and dividend expenses on securities sold short); acquired fund fees and expenses; fees and expenses associated with investments in other collective investment vehicles or derivative instruments (including for example option and swap fees and expenses); any amounts payable pursuant to a distribution or service plan adopted in accordance with Rule 12b-1 under the Investment Company Act of 1940; any administrative and/or shareholder servicing fees payable pursuant to a plan adopted by the Board; expenses incurred in connection with any merger or reorganization; extraordinary expenses (such as litigation expenses, indemnification of Trust officers and Trustees and contractual indemnification of Fund service providers); and other expenses that the Trustees agree have not been incurred in the ordinary course of the Fund’s business, do not exceed 0.95% of the Fund’s average daily net assets. This expense cap may not be terminated prior to this date except by the Board upon (60) days’ written notice to the Adviser. Each waiver/ expense payment by the Adviser is subject to recoupment by the Adviser from the Fund in the three years following the date the particular waiver/expense payment occurred, but only if such recoupment can be achieved without exceeding the annual expense limitation in effect at the time of the waiver/expense payment and any expense limitation in effect at the time of the recoupment. Additional information pertaining to the Fund’s expense ratios as of March 31, 2023 can be found in the financial highlights.
The performance quoted represents past performance, which does not guarantee future results. The investment return and principal value of an investment will fluctuate so that an investor’s shares, when redeemed, may be worth more or less than their original cost. The returns shown do not reflect deduction of taxes that a shareholder would pay on Fund distributions or the redemption of Fund shares. Current performance of the Fund may be lower or higher than the performance quoted. The Fund’s investment objectives, risks, charges and expenses should be considered carefully before investing. Performance data current to the most recent month-end may be obtained by calling (877) 627-8504.
| * | Return figures reflect any change in price per share and assume the reinvestment of all distributions. The Fund’s returns reflect any fee reductions during the applicable periods. If such fee reductions had not occurred, the quoted performance would have been lower. Total returns for periods less than one year are not annualized. |
| (a) | The Bloomberg U.S. 1-5 Year Government/Credit Bond Index (the “U.S. 1-5 Year Government/ Credit Bond Index”) is a widely recognized unmanaged index of bond prices and is representative of a broader market and range of securities than is found in the Fund’s portfolio. The U.S. 1-5 Year Government /Credit Bond Index measures performance of U.S. dollar-denominated U.S. Treasury bonds, government related bonds and investment grade U.S. corporate bonds that have a remaining |
2
Investment Results (Unaudited) (continued)
maturity of greater than or equal to one year and less than five years.
| (b) | The Bloomberg U.S. Intermediate Government/Credit Bond Index (the “U.S. Intermediate Government/Credit Bond Index”) is a widely recognized unmanaged index of bond prices and is representative of a broader market and range of securities than is found in the Fund’s portfolio. The U.S. Intermediate Government/Credit Bond Index measures the performance of U.S. Dollar-denominated U.S. Treasury bonds, government-related bonds and investment grade U.S. corporate bonds that have a remaining maturity of greater than one year and less than ten years. The U.S. Intermediate Government/Credit Bond Index assumes reinvestment of all distributions and excludes the effect of taxes and fees. Individuals cannot invest directly in the U.S. Intermediate Government/Credit Bond Index; however, an individual may invest in exchange-traded funds or other investment vehicles that attempt to track the performance of a benchmark index |
You should consider the Fund’s investment objectives, risks, charges and expenses carefully before investing. The Fund’s prospectus contains important information about the Fund’s investment objectives, potential risks, management fees, charges and expenses, and other information and should be read carefully before investing. You may obtain a current copy of the Fund’s prospectus or performance data current to the most recent month-end by calling (877) 627-8504.
The Fund is distributed by Ultimus Fund Distributors, LLC, member FINRA/SIPC.
3
FUND HOLDINGS (Unaudited)
Channel Short Duration Income Fund Holdings as of March 31, 2023*
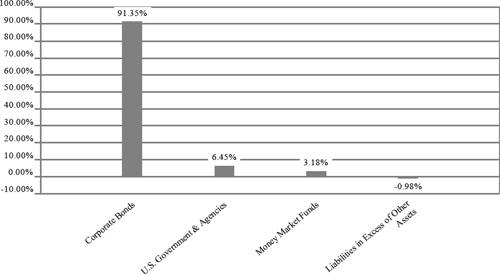
| * | As a percentage of net assets. |
The investment objective of the Channel Short Duration Income Fund is total return, comprised of both income and capital appreciation.
Portfolio holdings are subject to change.
AVAILABILITY OF PORTFOLIO SCHEDULE (Unaudited)
The Fund files its complete schedule of portfolio holdings with the Securities and Exchange Commission (the “SEC”) for the first and third quarters of each fiscal year as an exhibit to its reports on Form N-PORT. The Fund’s Form N-PORT reports are available on the SEC’s website at www.sec.gov.
4
| Channel Short Duration Income Fund |
| Schedule of Investments |
| March 31, 2023 - (Unaudited) |
| Principal | ||||||||
| CORPORATE BONDS — 91.35% | Amount | Fair Value | ||||||
| Corporate Bonds - Domestic — 85.06% | ||||||||
| American Airlines Pass Through Trust, Series 2015-1, 3.70%, 5/1/2023 | $ | 349,104 | $ | 347,251 | ||||
| American Airlines Pass Through Trust, Series 2016-3, 3.75%, 10/15/2025 | 1,157,463 | 1,076,347 | ||||||
| American Airlines Pass Through Trust, Series 2016-2, 3.65%, 12/15/2029 | 1,007,300 | 862,810 | ||||||
| American Electric Power Co., Inc., 2.03%, 3/15/2024 | 500,000 | 485,011 | ||||||
| American Tower Corp., 0.60%, 1/15/2024 | 250,000 | 241,241 | ||||||
| B&G Foods, Inc., 5.25%, 4/1/2025 | 750,000 | 698,746 | ||||||
| Bank of America Corp., 1.32%, 6/19/2026 (SOFRRATE + 115 BPS)(a) | 1,000,000 | 914,910 | ||||||
| Celanese US Holdings LLC, 6.33%, 7/15/2029 | 600,000 | 608,664 | ||||||
| Charles Schwab Corp. (The), 4.00%, 12/31/2049 (3MO LIBOR + 231bps)(a) | 500,000 | 394,372 | ||||||
| Cheniere Energy Partners LP, 4.50%, 10/1/2029 | 500,000 | 467,192 | ||||||
| Comerica Inc, 3.70%, 7/31/2023 | 300,000 | 288,980 | ||||||
| Continental Airlines Pass Through Trust, Series 2012-2 A, 4.00%, 10/29/2024 | 1,548,408 | 1,510,383 | ||||||
| DCP Midstream Operating LP, 5.38%, 7/15/2025 | 600,000 | 599,328 | ||||||
| Delta Air Lines, Inc., Series 2019-1, 3.20%, 4/25/2024 | 825,000 | 808,705 | ||||||
| Discovery Communications LLC, 4.13%, 5/15/2029 | 1,000,000 | 930,527 | ||||||
| DISH DBS Corp., 5.88%, 11/15/2024 | 500,000 | 446,985 | ||||||
| Edison International, 4.70%, 8/15/2025 | 606,000 | 598,161 | ||||||
| Edison International, 5.38%, 9/15/2069 (3MO LIBOR + 370bps) | 400,000 | 355,867 | ||||||
| Enable Midstream Partners LP, 4.95%, 5/15/2028 (FIXED) | 500,000 | 495,766 | ||||||
| Energy Transfer LP, 6.50%, 11/15/2167 (3MO LIBOR + 465bps)(a) | 500,000 | 441,520 | ||||||
| EQT Corp., 6.13%, 2/1/2025(b) | 350,000 | 352,384 | ||||||
| EQT Corp., 5.70%, 4/1/2028 | 600,000 | 603,216 | ||||||
| FedEx Corp Pass Trough Trust, Series 2020-1, 1.88%, 2/20/2034 | 433,159 | 362,959 | ||||||
| Fifth Third Bancorp., 2.38%, 1/28/2025 (FIXED) | 1,000,000 | 929,544 | ||||||
| First Horizon National Corp., 3.55%, 5/26/2023 | 640,000 | 634,315 | ||||||
| Genworth Holdings, Inc., 6.87%, 11/15/2036 (3MO LIBOR + 200bps) | 2,500,000 | 1,645,280 | ||||||
| Gulfport Energy Corp., 8.00%, 5/17/2026 | 500,000 | 496,360 | ||||||
| HSBC Holdings, PLC, 6.16%, 3/9/2029(a) | 250,000 | 257,133 | ||||||
| iHeartCommunications, Inc., 8.38%, 5/1/2027 | 750,000 | 547,335 | ||||||
| MPLX LP, 4.13%, 3/1/2027 | 800,000 | 776,385 | ||||||
| ONEOK Inc., 2.20%, 9/15/2025 | 750,000 | 697,408 | ||||||
| Pioneer Natural Resources Co., 5.10%, 3/29/2026 | 500,000 | 502,150 | ||||||
| Range Resources Corp., 4.88%, 5/15/2025 | 1,500,000 | 1,486,088 | ||||||
| Sabine Pass Liquefaction LLC, 5.88%, 6/30/2026 | 500,000 | 510,850 | ||||||
| T-Mobile USA Inc., 2.63%, 2/15/2029 | 1,000,000 | 883,951 | ||||||
| Truist Financial Corp., 4.00%, 5/1/2025 (FIXED) | 1,000,000 | 966,543 | ||||||
| United Airlines Pass Through Trust, Series 2013-1, 4.30%, 8/15/2025 | 144,545 | 138,466 | ||||||
| United Airlines Pass Through Trust, Series 2014-1, 4.00%, 4/11/2026 | 529,775 | 501,249 | ||||||
| United Airlines Pass Through Trust, Series 2014-2, 3.75%, 9/3/2026 | 928,945 | 869,581 | ||||||
| United Airlines Pass Through Trust, Series 2020-1, 5.88%, 4/15/2029 | 452,720 | 450,180 | ||||||
| TOTAL CORPORATE BONDS - DOMESTIC (Cost $26,369,256) | 26,184,143 | |||||||
See accompanying notes which are an integral part of these financial statements.
5
| Channel Short Duration Income Fund |
| Schedule of Investments (continued) |
| March 31, 2023 - (Unaudited) |
| Principal | ||||||||
| CORPORATE BONDS — 91.35% - continued | Amount | Fair Value | ||||||
| Corporate Bonds - Domestic — 85.06% - continued | ||||||||
| Corporate Bonds - Foreign — 6.29% | ||||||||
| Corporate Bonds - Ireland - 3.59% | ||||||||
| AerCap Ireland Capital DAC, 4.50%, 9/15/2023 | $ | 500,000 | $ | 495,078 | ||||
| AerCap Ireland Capital DAC, 3.00%, 10/29/2028 | 700,000 | 610,970 | ||||||
| 1,106,048 | ||||||||
| Corporate Bonds - Switzerland - 2.70% | ||||||||
| Credit Suisse AG, 3.80%, 6/9/2023 | 450,000 | 442,309 | ||||||
| Credit Suisse AG, 4.75%, 8/9/2024 | 400,000 | 386,730 | ||||||
| 829,039 | ||||||||
| TOTAL CORPORATE BONDS - FOREIGN (Cost $1,857,731) | 1,935,087 | |||||||
| TOTAL CORPORATE BONDS (Cost $28,226,987) | 28,119,230 | |||||||
| U.S. GOVERNMENT & AGENCIES — 6.45% | ||||||||
| United States Treasury Bill, 4.77%, 8/1/2023 | 1,000,000 | 984,161 | ||||||
| Federal Home Loan Bank, 5.43%, 9/28/2023 | 500,000 | 500,784 | ||||||
| Federal Home Loan Bank, 5.35%, 3/15/2024 | 500,000 | 498,897 | ||||||
| TOTAL U.S. GOVERNMENT & AGENCIES (Cost $1,983,989) | 1,983,842 | |||||||
| MONEY MARKET FUNDS - 3.18% | Shares | |||||||
| Fidelity Investments Money Market Government Portfolio, Class I, 4.72%(c) | 977,194 | 977,194 | ||||||
| TOTAL MONEY MARKET FUNDS (Cost $977,194) | 977,194 | |||||||
| TOTAL INVESTMENTS — 100.98% (Cost $31,188,170) | 31,080,266 | |||||||
| Liabilities in Excess of Other Assets — (0.98)% | (302,821 | ) | ||||||
| NET ASSETS — 100.00% | $ | 30,777,445 | ||||||
| (a) | Variable rate security. The rate shown is the effective interest rate as of March 31, 2023. The benchmark on which the rate is calculated is shown parenthetically. |
| (b) | Step bond. Coupon rate is fixed rate that changes on a specified date. The rate shown is the current rate at March 31, 2023. |
| (c) | Rate disclosed is the seven day effective yield as of March 31, 2023. |
See accompanying notes which are an integral part of these financial statements.
6
| Channel Short Duration Income Fund |
| Statement of Assets and Liabilities |
| March 31, 2023 - (Unaudited) |
| Assets | ||||
| Investments in securities at fair value (cost $31,188,170) | $ | 31,080,266 | ||
| Receivable for investments sold | 8,406,551 | |||
| Dividends and interest receivable | 381,567 | |||
| Prepaid expenses | 9,161 | |||
| Total Assets | 39,877,545 | |||
| Liabilities | ||||
| Payable for fund shares redeemed | 10,181 | |||
| Payable for investments purchased | 8,923,656 | |||
| Payable for distribution to shareholders | 141,759 | |||
| Payable to Adviser | 5,691 | |||
| Payable to trustees | 54 | |||
| Other accrued expenses | 18,759 | |||
| Total Liabilities | 9,100,100 | |||
| Net Assets | $ | 30,777,445 | ||
| Net Assets consist of: | ||||
| Paid-in capital | $ | 33,062,669 | ||
| Accumulated deficit | (2,285,224 | ) | ||
| Net Assets | $ | 30,777,445 | ||
| Shares outstanding (unlimited number of shares authorized, no par value) | 3,244,702 | |||
| Net asset value (“NAV”), offering and redemption price per (a) | $ | 9.49 |
| (a) | The Fund charges a 1.00% redemption fee on shares redeemed within 60 days or less of purchase. Shares are redeemed at the NAV if held longer than 60 calendar days. |
See accompanying notes which are an integral part of these financial statements.
7
| Channel Short Duration Income Fund |
| Statement of Operations |
| For the six months ended March 31, 2023 - (Unaudited) |
| Investment Income | ||||
| Interest income | $ | 865,282 | ||
| Dividend income | 12,520 | |||
| Total investment income | 877,802 | |||
| Expenses | ||||
| Adviser | 61,489 | |||
| Custodian | 17,564 | |||
| Fund accounting | 14,389 | |||
| Administration | 14,202 | |||
| Registration | 12,017 | |||
| Legal | 11,030 | |||
| Audit and tax preparation | 9,793 | |||
| Trustee | 9,680 | |||
| Transfer agent | 6,164 | |||
| Compliance services | 5,984 | |||
| Report printing | 4,415 | |||
| Pricing | 4,345 | |||
| Insurance | 1,438 | |||
| Miscellaneous | 14,664 | |||
| Total expenses | 187,174 | |||
| Fees waived by Adviser | (41,115 | ) | ||
| Net operating expenses | 146,059 | |||
| Net investment income | 731,743 | |||
| Net Realized and Change in Unrealized Gain (Loss) on Investments | ||||
| Net realized loss on investment securities transactions | (559,925 | ) | ||
| Net change in unrealized appreciation of investment securities | 1,894,520 | |||
| Net realized and change in unrealized gain on investments | 1,334,595 | |||
| Net increase in net assets resulting from operations | $ | 2,066,338 |
See accompanying notes which are an integral part of these financial statements.
8
| Channel Short Duration Income Fund |
| Statements of Changes in Net Assets |
| For the Six | For the | |||||||
| Months Ended | Year Ended | |||||||
| March 31, | September 30, | |||||||
| 2023 | 2022 | |||||||
| (Unaudited) | ||||||||
| Increase (Decrease) in Net Assets due to: | ||||||||
| Operations | ||||||||
| Net investment income | $ | 731,743 | $ | 791,790 | ||||
| Net realized loss on investment securities transactions | (559,925 | ) | (1,535,606 | ) | ||||
| Net change in unrealized appreciation (depreciation) of investment securities | 1,894,520 | (2,348,604 | ) | |||||
| Net increase (decrease) in net assets resulting from operations | 2,066,338 | (3,092,420 | ) | |||||
| Distributions to Shareholders From: | ||||||||
| Earnings | (739,431 | ) | (1,430,656 | ) | ||||
| Total distributions | (739,431 | ) | (1,430,656 | ) | ||||
| Capital Transactions | ||||||||
| Proceeds from shares sold | 1,302,890 | 5,660,390 | ||||||
| Reinvestment of distributions | 42,173 | 155,647 | ||||||
| Amount paid for shares redeemed | (1,875,656 | ) | (3,697,533 | ) | ||||
| Net increase (decrease) in net assets resulting from capital transactions | (530,593 | ) | 2,118,504 | |||||
| Total Increase (Decrease) in Net Assets | 796,314 | (2,404,572 | ) | |||||
| Net Assets | ||||||||
| Beginning of period | 29,981,131 | 32,385,703 | ||||||
| End of period | $ | 30,777,445 | $ | 29,981,131 | ||||
| Share Transactions | ||||||||
| Shares sold | 140,834 | 564,467 | ||||||
| Shares issued in reinvestment of distributions | 4,521 | 15,787 | ||||||
| Shares redeemed | (200,697 | ) | (374,447 | ) | ||||
| Net increase (decrease) in shares outstanding | (55,342 | ) | 205,807 | |||||
See accompanying notes which are an integral part of these financial statements.
9
| Channel Short Duration Income Fund |
| Financial Highlights |
| (For a share outstanding during each period) |
| For the Six | ||||||||||||||||||||||||
| Months | ||||||||||||||||||||||||
| Ended | For the | For the | For the | For the | For the | |||||||||||||||||||
| March | Year Ended | Year Ended | Year Ended | Year Ended | Year Ended | |||||||||||||||||||
| 31, 2023 | September | September | September | September | September | |||||||||||||||||||
| (Unaudited) | 30, 2022 | 30, 2021 | 30, 2020 | 30, 2019 | 30, 2018 | |||||||||||||||||||
| Selected Per Share Data: | ||||||||||||||||||||||||
| Net asset value, beginning of period | $ | 9.09 | $ | 10.47 | $ | 11.04 | $ | 10.62 | $ | 10.05 | $ | 10.38 | ||||||||||||
| Investment operations: | ||||||||||||||||||||||||
| Net investment income | 0.23 | 0.24 | 0.17 | 0.19 | 0.22 | 0.21 | ||||||||||||||||||
| Net realized and unrealized gain (loss) | 0.40 | (1.19 | ) | 0.24 | 0.43 | 0.57 | (0.33 | ) | ||||||||||||||||
| Total from investment operations | 0.63 | (0.95 | ) | 0.41 | 0.62 | 0.79 | (0.12 | ) | ||||||||||||||||
| Less distributions to shareholders from: | ||||||||||||||||||||||||
| Net investment income | (0.23 | ) | (0.24 | ) | (0.17 | ) | (0.20 | ) | (0.22 | ) | (0.21 | ) | ||||||||||||
| Net realized gains | — | (0.19 | ) | (0.81 | ) | — | — | — | ||||||||||||||||
| Total distributions | (0.23 | ) | (0.43 | ) | (0.98 | ) | (0.20 | ) | (0.22 | ) | (0.21 | ) | ||||||||||||
| Net asset value, end of period | $ | 9.49 | $ | 9.09 | $ | 10.47 | $ | 11.04 | $ | 10.62 | $ | 10.05 | ||||||||||||
| Total Return(a) | 6.95 | % (b) | (9.27 | )% | 3.96 | % | 5.92 | % | 7.98 | % | (1.16 | )% | ||||||||||||
| Ratios and Supplemental Data: | ||||||||||||||||||||||||
| Net assets, end of period (000 omitted) | $ | 30,777 | $ | 29,981 | $ | 32,386 | $ | 30,432 | $ | 37,343 | $ | 36,001 | ||||||||||||
| Ratio of net expenses to average net assets | 0.95 | % (c) | 0.95 | % | 0.95 | % | 0.80 | % | 0.80 | % | 0.80 | % | ||||||||||||
| Ratio of expenses to average net assets before reimbursement/recoupment | 1.22 | % (c) | 1.15 | % | 1.10 | % | 0.89 | % | 0.90 | % | 0.91 | % | ||||||||||||
| Ratio of net investment income to average net assets | 4.76 | % (c) | 2.47 | % | 1.64 | % | 1.73 | % | 2.16 | % | 2.02 | % | ||||||||||||
| Portfolio turnover rate | 2,729 | % (b)(d) | 6,521 | % (d) | 1,659 | % (d) | 178 | % (e) | 18 | % | 21 | % | ||||||||||||
| (a) | Total return represents the rate that the investor would have earned or lost on an investment in the Fund, assuming reinvestment of distributions. |
| (b) | Not annualized. |
| (c) | Annualized. |
| (d) | Turnover may be elevated in times of market volatility as part of a systematic U.S. Treasury trading strategy used to manage overall portfolio risk with the possibility of generating excess returns. |
| (e) | Elevated portfolio turnover rate is due to adviser change during the fiscal year ended September 30, 2020. |
See accompanying notes which are an integral part of these financial statements.
10
| Channel Short Duration Income Fund |
| Notes to the Financial Statements |
| March 31, 2023 - (Unaudited) |
NOTE 1. ORGANIZATION
Channel Short Duration Income Fund (the “Fund”) was organized as a diversified series of Unified Series Trust (the “Trust”) on June 15, 2005, and is registered under the Investment Company Act of 1940, as amended (the “1940 Act”). The Trust is an open-end investment company established under the laws of Ohio by an Agreement and Declaration of Trust dated October 14, 2002, as amended (the “Trust Agreement”). The Trust Agreement permits the Board of Trustees of the Trust (“the Board”) to issue an unlimited number of shares of beneficial interest of separate series. The Fund is one of a series of funds currently authorized by the Board. The Fund commenced operations on October 4, 2005. The investment adviser to the Fund is Channel Investment Partners LLC (the “Adviser”). The Fund seeks to provide total return, comprised of both income and capital appreciation.
NOTE 2. SIGNIFICANT ACCOUNTING POLICIES
The Fund is an investment company and follows accounting and reporting guidance under Financial Accounting Standards Board Accounting Standards Codification (“ASC”) Topic 946, “Financial Services-Investment Companies” including Accounting Standards Update 2013-08. The following is a summary of significant accounting policies followed by the Fund in the preparation of its financial statements. These policies are in conformity with generally accepted accounting principles in the United States of America (“GAAP”).
Estimates – The preparation of financial statements in conformity with GAAP requires management to make estimates and assumptions that affect the reported amounts of assets and liabilities and disclosure of contingent assets and liabilities at the date of the financial statements and the reported amounts of increases and decreases in net assets from operations during the reporting period. Actual results could differ from those estimates.
Federal Income Taxes – The Fund makes no provision for federal income or excise tax. The Fund has qualified and intends to qualify each year as a regulated investment company (“RIC”) under subchapter M of the Internal Revenue Code of 1986, as amended, by complying with the requirements applicable to RICs and by distributing substantially all of its taxable income. The Fund also intends to distribute sufficient net investment income and net realized capital gains, if any, so that it will not be subject to excise tax on undistributed income and gains. If the required amount of net investment income or gains is not distributed, the Fund could incur a tax expense.
As of and during the six months ended March 31, 2023, the Fund did not have any liabilities for any unrecognized tax benefits. The Fund recognizes interest and penalties, if any, related to unrecognized tax benefits as income tax expense in the Statement of Operations when incurred. During the period, the Fund did not incur any interest or
11
| Channel Short Duration Income Fund |
| Notes to the Financial Statements (continued) |
| March 31, 2023 - (Unaudited) |
penalties. Management of the Fund has reviewed tax positions taken in tax years that remain subject to examination by all major tax jurisdictions, including federal (i.e., the previous three tax year ends and the interim tax period since then, as applicable) and has concluded that no provision for unrecognized tax benefits or expenses is required in these financial statements and does not expect this to change over the next twelve months.
Expenses – Expenses incurred by the Trust that do not relate to the Fund are allocated to the individual funds of the Trust based on each Fund’s relative net assets or another appropriate basis (as determined by the Board).
Security Transactions and Related Income – The Fund follows industry practice and records security transactions on the trade date for financial reporting purposes. The specific identification method is used for determining gains or losses for financial statement and income tax purposes. Dividend income is recorded on the ex-dividend date and interest income is recorded on an accrual basis. Non-cash income, if any, is recorded at the fair market value of the securities received. Withholding taxes on foreign dividends, if any, have been provided for in accordance with the Fund’s understanding of the applicable country’s tax rules and rates.
Dividends and Distributions – The Fund intends to distribute substantially all of its net investment income, if any, monthly. The Fund intends to distribute its net realized long-term and short-term capital gains, if any, annually. Distributions to shareholders, which are determined in accordance with income tax regulations, are recorded on the ex-dividend date. The treatment for financial reporting purposes of distributions made to shareholders during the year from net investment income or net realized capital gains may differ from their ultimate treatment for federal income tax purposes. These differences are caused primarily by differences in the timing of the recognition of certain components of income, expense or realized capital gain for federal income tax purposes. Where such differences are permanent in nature, they are reclassified in the components of the net assets based on their ultimate characterization for federal income tax purposes. Any such reclassifications will have no effect on net assets, results of operations or net asset value (“NAV”) per share of the Fund.
NOTE 3. SECURITIES VALUATION AND FAIR VALUE MEASUREMENTS
The Fund values its portfolio securities at fair value as of the close of regular trading on the New York Stock Exchange (“NYSE”) (normally 4:00 p.m. Eastern Time) on each business day the NYSE is open for business. Fair value is defined as the price that the Fund would receive upon selling an investment in a timely transaction to an independent buyer in the principal or most advantageous market of the investment. GAAP establishes a three-tier hierarchy to maximize the use of observable market data and minimize the
12
| Channel Short Duration Income Fund |
| Notes to the Financial Statements (continued) |
| March 31, 2023 - (Unaudited) |
use of unobservable inputs and to establish classification of fair value measurements for disclosure purposes.
Inputs refer broadly to the assumptions that market participants would use in pricing the asset or liability, including assumptions about risk (the risk inherent in a particular valuation technique used to measure fair value including a pricing model and/or the risk inherent in the inputs to the valuation technique). Inputs may be observable or unobservable. Observable inputs are inputs that reflect the assumptions market participants would use in pricing the asset or liability developed based on market data obtained and available from sources independent of the reporting entity. Unobservable inputs are inputs that reflect the reporting entity’s own assumptions about the assumptions market participants would use in pricing the asset or liability developed based on the best information available in the circumstances.
Various inputs are used in determining the value of the Fund’s investments. These inputs are summarized in the three broad levels listed below.
| ● | Level 1 – unadjusted quoted prices in active markets for identical investments and/or registered investment companies where the value per share is determined and published and is the basis for current transactions for identical assets or liabilities at the valuation date |
| ● | Level 2 – other significant observable inputs (including, but not limited to, quoted prices for an identical security in an inactive market, quoted prices for similar securities, interest rates, prepayment speeds, credit risk, etc.) |
| ● | Level 3 – significant unobservable inputs (including the Fund’s own assumptions in determining fair value of investments based on the best information available) |
The inputs used to measure fair value may fall into different levels of the fair value hierarchy. In such cases, for disclosure purposes, the level in the fair value hierarchy which is reported is determined based on the lowest level input that is significant to the fair value measurement in its entirety.
Debt securities are valued by using the mean between the closing bid and ask prices provided by a pricing service. If the closing bid and ask prices are not readily available, the pricing service may provide a price determined by a matrix pricing method. Matrix pricing is a mathematical technique used to value fixed income securities without relying exclusively on quoted prices. Matrix pricing takes into consideration recent transactions, yield, liquidity, risk, credit quality, coupon, maturity, type of issue and any other factors or market data the pricing service deems relevant for the actual security being priced and for other securities with similar characteristics. These securities will generally be categorized
13
| Channel Short Duration Income Fund |
| Notes to the Financial Statements (continued) |
| March 31, 2023 - (Unaudited) |
as Level 2 securities. If the Adviser, decides that a price provided by the pricing service does not accurately reflect the fair value of the securities or when prices are not readily available from a pricing service, securities are valued at fair value as determined by the Adviser, in conformity with the Adviser’s valuation policies and procedures which comply with guidelines adopted by the Board. All fair value pricing and the pricing methodology are subject to review and approval by the Board’s Pricing & Liquidity Committee. These securities will generally be categorized as Level 3 securities.
Investments in mutual funds, including money market mutual funds, are generally priced at the ending NAV provided by the service agent of the mutual funds. These securities are categorized as Level 1 securities.
In accordance with the Trust’s valuation policies and fair value determinations pursuant to Rule 2a-5, the Adviser and the Board’s Pricing & Liquidity Committee are required to consider all appropriate factors relevant to the value of securities for which it has determined other pricing sources are not available or reliable as described above. No single method exists for determining fair value, because fair value depends upon the circumstances of each individual case. As a general principle, the current fair value of a security being valued by the Adviser would be the amount that the Funds might reasonably expect to receive upon the current sale. Methods that are in accordance with this principle may, for example, be based on (i) a multiple of earnings; (ii) a discount from market prices of a similar freely traded security (including a derivative security or a basket of securities traded on other markets, exchanges or among dealers); or (iii) yield to maturity with respect to debt issues, or a combination of these and other methods. Fair-value pricing is permitted if, in the Adviser’s opinion, the validity of market quotations appears to be questionable based on factors such as evidence of a thin market in the security based on a small number of quotations, a significant event occurs after the close of a market but before a Fund’s NAV calculation that may affect a security’s value, or the Adviser is aware of any other data that calls into question the reliability of market quotations.
The following is a summary of the inputs used to value the Fund’s investments as of March 31, 2023:
| Valuation Inputs | ||||||||||||||||
| Assets | Level 1 | Level 2 | Level 3 | Total | ||||||||||||
| Domestic Corporate Bonds | $ | — | $ | 26,184,143 | $ | — | $ | 26,184,143 | ||||||||
| Foreign Corporate Bonds | — | 1,935,087 | — | 1,935,087 | ||||||||||||
| U.S. Government & Agencies | — | 1,983,842 | — | 1,983,842 | ||||||||||||
| Money Market Funds | 977,194 | — | — | 977,194 | ||||||||||||
| Total | $ | 977,194 | $ | 30,103,072 | $ | — | $ | 31,080,266 | ||||||||
14
| Channel Short Duration Income Fund |
| Notes to the Financial Statements (continued) |
| March 31, 2023 - (Unaudited) |
The Fund did not hold any investments at the end of the reporting period for which significant unobservable inputs (Level 3) were used in determining fair value; therefore, no reconciliation of Level 3 securities is included for this reporting period.
NOTE 4. FEES AND OTHER TRANSACTIONS WITH AFFILIATES AND OTHER SERVICE PROVIDERS
The Adviser, under the terms of the management agreement with the Trust with respect to the Fund (the “Agreement”), manages the Fund’s investments. As compensation for its management services, the Fund is obligated to pay the Adviser a management fee computed and accrued daily and paid monthly at an annual rate of 0.40% of the Fund’s average daily net assets. For the six months ended March 31, 2023, the Adviser earned fees of $61,489, from the Fund. At March 31, 2023, the Adviser was owed $5,691 from the Fund.
The Adviser has contractually agreed to waive its management fee and/or reimburse expenses through January 31, 2024 so that the Fund’s total annual operating expenses, excluding portfolio transaction and other investment-related costs (including brokerage fees and commissions); taxes; borrowing costs (such as interest and dividend expenses on securities sold short); acquired fund fees and expenses; fees and expenses associated with investments in other collective investment vehicles or derivative instruments (including, for example, option and swap fees and expenses); any amounts payable pursuant to a distribution or service plan adopted in accordance with Rule 12b-1 under the 1940 Act, as amended; any administrative and/or shareholder servicing fees payable pursuant to a plan adopted by the Board of Trustees; expenses incurred in connection with any merger or reorganization; extraordinary expenses (such as litigation expenses, indemnification of Trust officers and Trustees and contractual indemnification of Fund service providers); and other expenses that the Trustees agree have not been incurred in the ordinary course of Fund’s business, do not exceed 0.95% of the Fund’s average daily net assets. For the six months ended March 31, 2023, the Adviser waived fees of $41,115.
Each waiver/expense payment by the Adviser is subject to recoupment by the Adviser from the Fund in the three years following the date the particular waiver/expense payment occurred, but only if such recoupment can be achieved without exceeding the applicable annual expense limitation in effect at the time of the waiver/expense payment and any expense limitation in effect at the time of recoupment. As of March 31, 2023, the Adviser may seek repayment of management fees waived and expense reimbursements pursuant to the aforementioned conditions, from the Fund no later than the dates stated below:
| Recoverable Through | ||||
| September 30, 2023 | $ | 35,678 | ||
| September 30, 2024 | 44,501 | |||
| September 30, 2025 | 65,182 | |||
| March 31, 2026 | 41,115 |
15
| Channel Short Duration Income Fund |
| Notes to the Financial Statements (continued) |
| March 31, 2023 - (Unaudited) |
Ultimus Fund Solutions, LLC (“Ultimus”) provides administration, fund accounting and transfer agent services to the Fund. The Fund pays Ultimus fees in accordance with the agreements for such services.
Northern Lights Compliance Services, LLC (“NLCS”), an affiliate of Ultimus, provides a Chief Compliance Officer to the Trust, as well as related compliance services, pursuant to a consulting agreement between NLCS and the Trust. Under the terms of such agreement, NLCS receives fees from the Fund, which are approved annually by the Board.
Under the terms of a Distribution Agreement with the Trust, Ultimus Fund Distributors, LLC (the “Distributor”) serves as principal underwriter to the Fund. The Distributor is a wholly-owned subsidiary of Ultimus. The Distributor is compensated by the Adviser (not the Fund) for acting as principal underwriter.
Certain officers and a Trustee of the Trust are also employees of Ultimus and such persons are not paid by the Fund for serving in such capacities.
The Board supervises the business activities of the Trust. Each Trustee serves as a trustee until termination of the Trust unless the Trustee dies, resigns, retires, or is removed. The Chair of the Board and more than 75% of the Trustees are “Independent Trustees,” which means that they are not “interested persons” as defined in the 1940 Act. The Independent Trustees review and establish compensation at least annually. Each Independent Trustee of the Trust receives annual compensation, which is an established amount paid quarterly per fund in the Trust at the time of the regular quarterly Board meetings. The Chair of the Board receives the highest compensation, commensurate with his additional duties and each Chair of a committee receives additional compensation as well. Independent Trustees also receive $1,000 for attending any special meeting that requires an in-person approval of a contract and $250 for the first hour and $200 for each additional hour for attending other special meetings. In addition, the Trust reimburses Independent Trustees for out-of-pocket expenses incurred in conjunction with attendance at meetings.
16
| Channel Short Duration Income Fund |
| Notes to the Financial Statements (continued) |
| March 31, 2023 - (Unaudited) |
NOTE 5. PURCHASES AND SALES OF SECURITIES
For the six months ended March 31, 2023, purchases and sales of investment securities, other than short-term investments and short-term U.S. government obligations were as follows:
| Purchases | ||||
| U.S. Government Obligations | $ | 799,064,467 | ||
| Other | 14,642,029 | |||
| Sales | ||||
| U.S. Government Obligations | $ | 802,753,316 | ||
| Other | 13,345,393 | |||
NOTE 6. FEDERAL TAX INFORMATION
At March 31, 2023, the net unrealized appreciation (depreciation) and tax cost of investments for tax purposes was as follows:
| Gross unrealized appreciation | $ | 561,352 | ||
| Gross unrealized depreciation | (669,256 | ) | ||
| Net unrealized appreciation/(depreciation) on investments | $ | (107,904 | ) | |
| Tax cost of investments | $ | 31,188,170 |
The tax character of distributions paid for the fiscal year ended September 30, 2022, the Fund’s most recent fiscal year end, was as follows:
| Distributions paid from: | ||||
| Ordinary income(a) | $ | 1,138,385 | ||
| Long-term capital gains | 338,851 | |||
| Total distributions paid | $ | 1,477,236 |
| (a) | Short-term capital gain distributions are treated as ordinary income for tax purposes. |
At September 30, 2022, the components of accumulated earnings (deficit) on a tax basis were as follows:
| Undistributed ordinary income | $ | 3,865 | ||
| Distributions payable | 546 | |||
| Accumulated capital and other losses | (1,479,672 | ) | ||
| Unrealized depreciation on investments | (2,136,869 | ) | ||
| Total accumulated deficits | $ | (3,612,130 | ) |
17
| Channel Short Duration Income Fund |
| Notes to the Financial Statements (continued) |
| March 31, 2023 - (Unaudited) |
At September 30, 2022, the difference between book basis and tax basis unrealized appreciation (depreciation) is primarily attributable to the tax deferral of wash sales and dividends payable.
Capital losses and specified gains realized after October 31, and net investment losses realized after December 31 of a Fund’s fiscal year may be deferred and treated as occurring on the first business day of the following fiscal year for tax purposes. For the fiscal year ended September 30, 2022, the Fund deferred $1,479,672 of post October losses.
NOTE 7. COMMITMENTS AND CONTINGENCIES
The Trust indemnifies its officers and Trustees for certain liabilities that may arise from their performance of their duties to the Trust or the Fund. Additionally, in the normal course of business, the Trust enters into contracts that contain a variety of representations and warranties which provide general indemnifications. The Trust’s maximum exposure under these arrangements is unknown, as this would involve future claims that may be made against the Trust that have not yet occurred.
NOTE 8. SUBSEQUENT EVENTS
Management of the Fund has evaluated the need for disclosures and/or adjustments resulting from subsequent events through the date at which these financial statements were issued. Based upon this evaluation, management has determined there were no items requiring adjustment of the financial statements or additional disclosure.
18
| Summary of Fund Expenses (Unaudited) |
As a shareholder of the Fund, you incur two types of costs: (1) transaction costs, including redemption fees; and (2) ongoing costs, including management fees and other Fund expenses. These examples are intended to help you understand your ongoing costs (in dollars) of investing in the Fund and to compare these costs with the ongoing costs of investing in other mutual funds. The example is based on an investment of $1,000 invested at the beginning of the period and held for the entire period from October 1, 2022 through March 31, 2023.
Actual Expenses
The first line of the table below provides information about actual account values and actual expenses. You may use the information in this line, together with the amount you invested, to estimate the expenses that you paid over the period. Simply divide your account value by $1,000 (for example, an $8,600 account value divided by $1,000 = 8.6), then multiply the result by the number in the first line under the heading “Expenses Paid During Period” to estimate the expenses you paid on your account during this period.
Hypothetical Example for Comparison Purposes
The second line of the table below provides information about hypothetical account values and hypothetical expenses based on the Fund’s actual expense ratio and an assumed rate of return of 5% per year before expenses, which is not the Fund’s actual return. The hypothetical account values and expenses may not be used to estimate the actual ending account balance or expenses you paid for the period. You may use this information to compare the ongoing costs of investing in the Fund and other funds. To do so, compare this 5% hypothetical example with the 5% hypothetical examples that appear in the shareholder reports of other funds.
Expenses shown in the table are meant to highlight your ongoing costs only and do not reflect any transactional costs. Therefore, the second line of the table below is useful in comparing ongoing costs only and will not help you determine the relative total costs of owning different funds. In addition, if transaction costs were included, your costs would have been higher.
| Beginning | Ending | |||||||||||||
| Account | Account | Expenses | ||||||||||||
| Value | Value | Paid | Annualized | |||||||||||
| October 1, | March 31, | During | Expense | |||||||||||
| 2022 | 2023 | Period(a) | Ratio | |||||||||||
| Actual | $ | 1,000.00 | $ | 1,069.50 | $ | 4.90 | 0.95% | |||||||
| Hypothetical(b) | $ | 1,000.00 | $ | 1,020.19 | $ | 4.78 | 0.95% | |||||||
| (a) | Expenses are equal to the Fund’s annualized expense ratios, multiplied by the average account value over the period, multiplied by 182/365 (to reflect the one-half year period). |
| (b) | Hypothetical assumes 5% annual return before expenses. |
19
| Investment Advisory Agreement Approval (Unaudited) |
The Channel Short Duration Income Fund (the “Fund”) is a series of Unified Series Trust (the “Trust”). The Trust’s Board of Trustees (the “Board” or “Trustees”) oversees the management of the Fund and, as required by law, considered the approval of the continuance of the Fund’s management agreement with its investment adviser, Channel Investment Partners LLC (“Channel”).
The Board requested and evaluated all information that the Trustees deemed reasonably necessary under the circumstances in connection with the approval of the continuance of the management agreement.
The Trustees held a teleconference on February 15, 2023 to review and discuss materials received from Channel and the Trust CCO, which were compiled by Ultimus Fund Solutions, LLC, the Trust’s administrator, with regard to the renewal of the management agreement between the Trust and Channel. At the Trustees’ quarterly meeting held in February 2023, the Board interviewed Channel’s Managing Member, President, Chief Investment Officer, and Chief Compliance Officer, at which time he reviewed the information previously provided, discussed the Fund’s strategy and its approach to investing, and responded to all questions from the Trustees. After discussion, the Trustees, including the Trustees who are not “interested persons” (as that term is defined in the Investment Company Act of 1940) of the Trust or Channel (the “Independent Trustees”), approved the continuance of the management agreement between the Trust and Channel for an additional year. The Trustees’ approval of the continuance of the Fund’s management agreement was based on a consideration of all the information provided to the Trustees and was not the result of any single factor. Some of the factors that figured particularly in the Trustees’ deliberations are described below, although individual Trustees may have evaluated this information differently, ascribing different weights to various factors.
(i) The Nature, Extent and Quality of Services. The Trustees reviewed and considered information regarding the nature, extent, and quality of services that Channel provides to the Fund, which include, but are not limited to, providing a continuous investment program for the Fund, adhering to the Fund’s investment restrictions, complying with the Trust’s policies and procedures, and voting proxies on behalf of the Fund. The Trustees considered the qualifications and experience of Channel’s portfolio manager who is responsible for the day-to-day management of the Fund’s portfolio, as well as the qualifications and experience of other resources utilized by Channel to provide services to the Fund. The Trustees noted the excellent presentation by Channel which demonstrated a thorough understanding of the market, investment strategies, and analysis. They expressed confidence in the firm and noted that the compliance review concluded Channel’s policies and procedures are reasonably designed to prevent securities law violations. The Trustees concluded that they were impressed with the strong nature, extent, and quality of investment management services provided by Channel to the Fund. They further noted Channel’s commitment to compliance by continuing to rely upon outside resources until the Managing Member can grow the firm.
(ii) Fund Performance. The Trustees next reviewed and discussed the Fund’s performance for periods ended November 30, 2022. The Trustees observed that the Fund had outperformed its peer group, Morningstar Short-Term Bond category, and primary benchmark, the Bloomberg U.S. 1-5 Year Government/Credit Index, for the three-year, five-year and since inception periods but slightly underperformed each of them for the one-year period. The Trustees observed that the Fund had recently won its second Lipper award which demonstrates the success of the Fund. The Trustees observed that some performance could be attributable to difference between the Fund and
20
| Investment Advisory Agreement Approval (Unaudited) (continued) |
these benchmarks, including duration and how Channel manages total return risk. They recalled that Channel attributed underperformance to asset allocation, credit selection, and taking a contrarian view with smaller position sizes than its peers. . Based upon the foregoing, the Trustees concluded the Fund’s performance is also strong.
(iii) Fee Rate and Profitability. The Trustees reviewed a fee and expense comparison for the Fund. The Trustees noted that the Fund’s management fee and net expense ratio is above the averages and medians of the Fund’s Morningstar category and peer group. The Trustees discussed that Channel attributed its higher fees to the relative size of the Fund compared to its peers. The Trustees noted, however, that Channel has committed to continue to waive its management fees and/ or reimburse expenses of the Fund through at least January 31, 2024.
The Trustees also considered a profitability analysis of Channel with respect to the Fund, which showed that Channel is earning a profit before deduction of marketing expenses. The Trustees noted Channel’s representation that it does not enter into soft-dollar transactions on behalf of the Fund. The Trustees concluded that the management fee represents reasonable compensation in light of the nature, extent, and quality of Channel’s services to the Fund.
(iv) Economies of Scale. In determining the reasonableness of the management fee, the Trustees also considered the extent to which Channel will realize economies of scale as the Fund grows. The Trustees determined that, in light of the size of the Fund and Channel’s level of profitability in managing the Fund, it does not appear that Channel is realizing benefits from economies of scale in managing the Fund to such an extent that the management fee for the Fund should be reduced or that breakpoints in the management fee are necessary at this time.
21
| Privacy Notice | |
| Rev: March 2021 |
| FACTS | WHAT DOES CHANNEL SHORT DURATION INCOME FUND (THE “FUND”) DO WITH YOUR PERSONAL INFORMATION? |
| Why? | Financial companies choose how they share your personal information. Federal law gives consumers the right to limit some but not all sharing. Federal law also requires us to tell you how we collect, share, and protect your personal information. Please read this notice carefully to understand what we do. |
| What? | The types of personal information we collect and share depend on the product or service you have with us. This information can include:
■ Social Security number
■ account balances and account transactions
■ transaction or loss history and purchase history
■ checking account information and wire transfer instructions
When you are no longer our customer, we continue to share your information as described in this notice. |
| How? | All financial companies need to share customers’ personal information to run their everyday business. In the section below, we list the reasons financial companies can share their customers’ personal information; the reasons the Fund chooses to share; and whether you can limit this sharing. |
| Reasons we can share your personal information | Does the Fund share? |
For our everyday business purposes— such as to process your transactions, maintain your account(s), respond to court orders and legal investigations, or report to credit bureaus |
Yes |
For our marketing purposes— to offer our products and services to you |
No |
| For joint marketing with other financial companies | No |
For our affiliates’ everyday business purposes— information about your transactions and experiences |
No |
For our affiliates’ everyday business purposes— information about your creditworthiness |
No |
| For nonaffiliates to market to you | No |
| Questions? | Call (877) 627-8504 |
22
| Who we are | |
| Who is providing this notice? | Channel Short Duration Income Fund Ultimus Fund Distributors, LLC (Distributor) Ultimus Fund Solutions, LLC (Administrator) |
| What we do | |
| How does the Fund protect my personal information? | To protect your personal information from unauthorized access and use, we use security measures that comply with federal law. These measures include computer safeguards and secured files and buildings. Our service providers are held accountable for adhering to strict policies and procedures to prevent any misuse of your nonpublic personal information. |
| How does the Fund collect my personal information? | We collect your personal information, for example, when you
■ open an account or deposit money
■ buy securities from us or sell securities to us
■ make deposits or withdrawals from your account
■ give us your account information
■ make a wire transfer
■ tell us who receives the money
■ tell us where to send the money
■ show your government-issued ID
■ show your driver’s license |
| Why can’t I limit all sharing? | Federal law gives you the right to limit only
■ sharing for affiliates’ everyday business purposes— information about your creditworthiness
■ affiliates from using your information to market to you
■ sharing for nonaffiliates to market to you
State laws and individual companies may give you additional rights to limit sharing. |
| Definitions | |
| Affiliates | Companies related by common ownership or control. They can be financial and nonfinancial companies.
■ Channel Investment Partners LLC, the investment adviser to the Fund, could be deemed to be an affiliate. |
| Nonaffiliates | Companies not related by common ownership or control. They can be financial and nonfinancial companies.
■ The Fund does not share your personal information with nonaffiliates so they can market to you |
| Joint marketing | A formal agreement between nonaffiliated financial companies that together market financial products or services to you.
■ The Fund does not jointly market. |
23
Proxy Voting
A description of the policies and procedures that the Fund uses to determine how to vote proxies relating to portfolio securities and information regarding how the Fund voted those proxies during the most recent twelve month period ended June 30, are available (1) without charge upon request by calling the Fund at (877) 627-8504 and (2) in Fund documents filed with the SEC on the SEC’s website at www.sec.gov.
| TRUSTEES Daniel J. Condon, Chairman David R. Carson Kenneth G.Y. Grant Freddie Jacobs, Jr. Catharine B. McGauley Ronald C. Tritschler |
INDEPENDENT
REGISTERED PUBLIC ACCOUNTING FIRM Cohen & Company, Ltd. 151 North Franklin Street, Suite 575 Chicago, IL 60606 |
| OFFICERS Martin R. Dean, President Gweneth K. Gosselink, Chief Compliance Officer Zachary P. Richmond, Treasurer and Chief Financial Officer Lynn E. Wood, Assistant Chief Compliance Officer |
LEGAL
COUNSEL Thompson Hine LLP 312 Walnut Street, 20th Floor Cincinnati, OH 45202 |
| INVESTMENT
ADVISER Channel Investment Partners LLC 4601 N. Fairfax Drive, Suite 1200 Arlington, VA 22203 |
CUSTODIAN Huntington National Bank 41 South High Street Columbus, OH 43215 |
| DISTRIBUTOR Ultimus Fund Distributors, LLC 225 Pictoria Drive, Suite 450 Cincinnati, OH 45246 |
ADMINISTRATOR,
TRANSFER AGENT AND FUND ACCOUNTANT Ultimus Fund Solutions, LLC 225 Pictoria Drive, Suite 450 Cincinnati, OH 45246 |
This report is intended only for the information of shareholders or those who have received the Fund’s prospectus which contains information about the Fund’s management fee and expenses. Please read the prospectus carefully before investing.
Distributed by Ultimus Fund Distributors, LLC
Member FINRA/SIPC
Channel-SAR-23
| (b) | Not applicable. |
Item 2. Code of Ethics. NOT APPLICABLE – disclosed with annual report
Item 3. Audit Committee Financial Expert. NOT APPLICABLE- disclosed with annual report
Item 4. Principal Accountant Fees and Services. NOT APPLICABLE – disclosed with annual report
Item 5. Audit Committee of Listed Companies. Certain series of the registrant that appear in the shareholder report included in Item 1 are listed issuers as defined in Rule 10A-3 under the Securities Exchange Act of 1934, as amended (the “Exchange Act”) and have a separately-designated standing audit committee established in accordance with Section 3(a)(58)A of the Exchange Act. The registrant’s audit committee member is Freddie Jacobs, Jr.
Item 6. Schedule of Investments. Schedule filed with Item 1.
Item 7. Disclosure of Proxy Voting Policies and Procedures for Closed-End Management Investment Companies. NOT APPLICABLE – applies to closed-end funds only
Item 8. Portfolio Managers of Closed-End Investment Companies. NOT APPLICABLE – applies to closed-end funds only
Item 9. Purchases of Equity Securities by Closed-End Management Investment Company and Affiliated Purchasers. NOT APPLICABLE – applies to closed-end funds only
Item 10. Submission of Matters to a Vote of Security Holders.
The registrant has not adopted procedures by which shareholders may recommend nominees to the registrant’s board of trustees.
Item 11. Controls and Procedures.
(a) Based on their evaluation of the registrant’s disclosure controls and procedures (as defined in Rule 30a-3(c) under the Investment Company Act of 1940, as amended (the “Act”)) as of a date within 90 days of the filing date of this report, the registrant’s principal executive officer and principal financial officer have concluded that such disclosure controls and procedures are reasonably designed and are operating effectively to ensure that material information relating to the registrant is made known to them by others within those entities, particularly during the period in which this report is being prepared, and that the information required in filings on Form N-CSR is recorded, processed, summarized, and reported on a timely basis.
(b) There were no significant changes in the registrant’s internal control over financial reporting that occurred during the period covered by this report that have materially affected, or are reasonably likely to materially affect, the registrant’s internal control over financial reporting.
Item 12. Disclosure of Securities Lending Activities for Closed-End Investment Companies.
Not Applicable.
Item 13. Exhibits.
(a) (1) Not Applicable – filed with annual report
(a)(2) Certifications pursuant to Rule 30a-2(a) are attached hereto.
| (1) | Not applicable. |
| (2) | Change in the registrant’s independent public accountants: Not applicable |
(b) Certifications pursuant to Rule 30a-2(b) are furnished herewith.
SIGNATURES
Pursuant to the requirements of the Securities Exchange Act of 1934 and the Investment Company Act of 1940, the registrant has duly caused this report to be signed on its behalf by the undersigned, thereunto duly authorized.
(Registrant) Unified Series Trust
By _/s/ Martin R. Dean ______________
Martin R. Dean, President
Date 6/6/2023_____
Pursuant to the requirements of the Securities Exchange Act of 1934 and the Investment Company Act of 1940, this report has been signed below by the following persons on behalf of the registrant and in the capacities and on the dates indicated.
By ___ /s/ Martin R. Dean ________
Martin R. Dean, President
Date 6/6/2023___
By ___/s/ Zachary P. Richmond ___ __________
Zachary P. Richmond, Treasurer
Date 6/6/2023__
ATTACHMENTS / EXHIBITS
Serious News for Serious Traders! Try StreetInsider.com Premium Free!
You May Also Be Interested In
- Tenaris Announces 2024 First Quarter Results
- West High Yield (W.H.Y.) Resources Ltd. Announces Frankfurt Stock Exchange Listing
- The Eastern Company Declares 335th Consecutive Quarterly Cash Dividend
Create E-mail Alert Related Categories
SEC FilingsSign up for StreetInsider Free!
Receive full access to all new and archived articles, unlimited portfolio tracking, e-mail alerts, custom newswires and RSS feeds - and more!
