

Form N-CSRS Thornburg Income Builder For: Mar 31
 Tweet
Tweet Share
Share
UNITED STATES
SECURITIES AND EXCHANGE COMMISSION
Washington, D.C. 20549
FORM N-CSR
CERTIFIED SHAREHOLDER REPORT OF REGISTERED
MANAGEMENT INVESTMENT COMPANIES
Investment Company Act file number 811-23600
Thornburg Income Builder Opportunities Trust
(Exact name of registrant as specified in charter)
c/o Thornburg Investment Management, Inc.
2300 North Ridgetop Road, Santa Fe, New Mexico 87506
(Address of principal executive offices) (Zip code)
Garrett Thornburg, 2300 North Ridgetop Road, Santa Fe, New Mexico 87506
(Name and address of agent for service)
Registrant’s telephone number, including area code: 505-984-0200
Date of fiscal year end: September 30
Date of reporting period: March 31, 2022
Item 1. Reports to Stockholders
The following annual reports are attached hereto, in order:
Thornburg Income Builder Opportunities Trust

Thornburg Income Builder Opportunities Trust | March 31, 2022 (Unaudited)

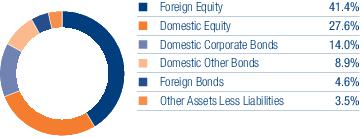
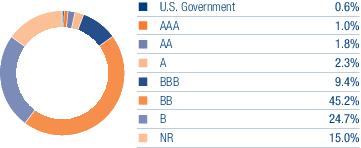
Trust Overview
Thornburg Income Builder Opportunities Trust | March 31, 2022 (Unaudited)
Thornburg Income Builder Opportunities Trust | March 31, 2022 (Unaudited)
| Issuer-Description | SHARES/
PRINCIPAL AMOUNT |
VALUE | |
| Common Stock — 68.7% | |||
| Automobiles & Components — 1.7% | |||
| Automobiles — 1.7% | |||
| Mercedes-Benz Group AG | 133,563 | $ 9,374,718 | |
| Stellantis NV | 74,500 | 1,212,115 | |
| 10,586,833 | |||
| Banks — 5.6% | |||
| Banks — 5.6% | |||
| BNP Paribas SA | 102,998 | 5,885,783 | |
| ING Groep NV | 667,800 | 6,972,449 | |
| JPMorgan Chase & Co. | 56,700 | 7,729,344 | |
| Mitsubishi UFJ Financial Group, Inc. | 1,060,100 | 6,552,624 | |
| Regions Financial Corp. | 321,500 | 7,156,590 | |
| 34,296,790 | |||
| Capital Goods — 2.1% | |||
| Aerospace & Defense — 1.1% | |||
| Lockheed Martin Corp. | 15,990 | 7,057,986 | |
| Industrial Conglomerates — 0.7% | |||
| Siemens AG | 29,400 | 4,070,937 | |
| Machinery — 0.3% | |||
| a | Daimler Truck Holding AG | 66,781 | 1,852,170 |
| 12,981,093 | |||
| Consumer Durables & Apparel — 1.7% | |||
| Household Durables — 0.9% | |||
| Sony Group Corp. Sponsored ADR | 53,225 | 5,466,740 | |
| Textiles, Apparel & Luxury Goods — 0.8% | |||
| LVMH Moet Hennessy Louis Vuitton SE | 7,200 | 5,139,350 | |
| 10,606,090 | |||
| Diversified Financials — 1.4% | |||
| Capital Markets — 1.4% | |||
| CME Group, Inc. | 35,000 | 8,325,100 | |
| 8,325,100 | |||
| Energy — 2.7% | |||
| Oil, Gas & Consumable Fuels — 2.7% | |||
| TotalEnergies SE | 330,000 | 16,697,841 | |
| 16,697,841 | |||
| Food & Staples Retailing — 2.3% | |||
| Food & Staples Retailing — 2.3% | |||
| Tesco plc | 2,250,700 | 8,148,215 | |
| Walgreens Boots Alliance, Inc. | 130,900 | 5,860,393 | |
| 14,008,608 | |||
| Food, Beverage & Tobacco — 1.3% | |||
| Food Products — 0.3% | |||
| Nestle SA | 12,000 | 1,560,224 | |
| Tobacco — 1.0% | |||
| Altria Group, Inc. | 118,100 | 6,170,725 | |
| 7,730,949 | |||
| Insurance — 4.7% | |||
| Insurance — 4.7% | |||
| Assicurazioni Generali SpA | 686,679 | 15,705,823 | |
| Legal & General Group plc | 1,643,600 | 5,827,200 | |
| NN Group NV | 142,000 | 7,196,380 | |
| 28,729,403 | |||
| Materials — 6.8% | |||
| Chemicals — 3.3% |
| See
notes to financial statements. |
Semi-Annual Report | 7 |
Thornburg Income Builder Opportunities Trust | March 31, 2022 (Unaudited)
| Issuer-Description | SHARES/
PRINCIPAL AMOUNT |
VALUE | |
| Fertiglobe plc | 4,873,000 | $ 6,628,506 | |
| LyondellBasell Industries NV Class A | 130,104 | 13,377,293 | |
| Metals & Mining — 3.5% | |||
| BHP Group Ltd. | 370,500 | 14,281,845 | |
| Glencore plc | 1,042,800 | 6,785,190 | |
| b | MMC Norilsk Nickel PJSC ADR | 307,000 | 181,130 |
| b | Severstal PAO GDR | 236,300 | 14,178 |
| 41,268,142 | |||
| Media & Entertainment — 5.2% | |||
| Entertainment — 2.7% | |||
| Nintendo Co. Ltd. | 19,600 | 9,893,333 | |
| a | Sea Ltd. ADR | 52,405 | 6,277,595 |
| Interactive Media & Services — 2.5% | |||
| a | Meta Platforms, Inc. Class A | 50,900 | 11,318,124 |
| Tencent Holdings Ltd. | 91,600 | 4,222,242 | |
| 31,711,294 | |||
| Pharmaceuticals, Biotechnology & Life Sciences — 10.6% | |||
| Biotechnology — 2.2% | |||
| AbbVie, Inc. | 81,677 | 13,240,659 | |
| Pharmaceuticals — 8.4% | |||
| AstraZeneca plc | 116,968 | 15,511,466 | |
| Merck & Co., Inc. | 219,191 | 17,984,621 | |
| Pfizer, Inc. | 246,600 | 12,766,482 | |
| Roche Holding AG | 12,200 | 4,827,073 | |
| 64,330,301 | |||
| Retailing — 1.7% | |||
| Internet & Direct Marketing Retail — 1.7% | |||
| a | Alibaba Group Holding Ltd. | 202,000 | 2,756,636 |
| a | JD.com, Inc. Class A | 4,361 | 123,917 |
| a | MercadoLibre, Inc. | 6,050 | 7,196,354 |
| 10,076,907 | |||
| Semiconductors & Semiconductor Equipment — 6.6% | |||
| Semiconductors & Semiconductor Equipment — 6.6% | |||
| ASML Holding NV | 11,610 | 7,758,051 | |
| Broadcom, Inc. | 14,400 | 9,067,392 | |
| NVIDIA Corp. | 9,100 | 2,483,026 | |
| QUALCOMM, Inc. | 66,300 | 10,131,966 | |
| Taiwan Semiconductor Manufacturing Co. Ltd. Sponsored ADR | 100,682 | 10,497,105 | |
| 39,937,540 | |||
| Software & Services — 5.4% | |||
| Information Technology Services — 2.9% | |||
| a,c | Adyen NV | 2,650 | 5,248,838 |
| Mastercard, Inc. Class A | 22,400 | 8,005,312 | |
| a | Shopify, Inc. Class A | 6,550 | 4,427,538 |
| Software — 2.5% | |||
| Microsoft Corp. | 35,100 | 10,821,681 | |
| a | ServiceNow, Inc. | 7,500 | 4,176,675 |
| 32,680,044 | |||
| Technology Hardware & Equipment — 3.6% | |||
| Communications Equipment — 2.8% | |||
| Cisco Systems, Inc. | 174,100 | 9,707,816 | |
| Telefonaktiebolaget LM Ericsson Class B | 777,800 | 7,090,069 | |
| Electronic Equipment, Instruments & Components — 0.8% | |||
| Keyence Corp. | 11,000 | 5,100,727 | |
| 21,898,612 | |||
| Telecommunication Services — 1.2% | |||
| Diversified Telecommunication Services — 1.2% | |||
| Orange SA | 635,022 | 7,518,469 |
| 8 | Semi-Annual Report |
See notes to financial statements. |
| Issuer-Description | SHARES/
PRINCIPAL AMOUNT |
VALUE | |
| 7,518,469 | |||
| Utilities — 4.1% | |||
| Electric Utilities — 4.1% | |||
| Electricite de France SA | 462,140 | $ 4,337,732 | |
| Endesa SA | 446,400 | 9,733,133 | |
| Enel SpA | 1,681,900 | 11,229,625 | |
| 25,300,490 | |||
| Total Common Stock (Cost $452,194,907) | 418,684,506 | ||
| Preferred Stock — 0.3% | |||
| Diversified Financials — 0.3% | |||
| Diversified Financial Services — 0.3% | |||
| d | Compass Diversified Holdings Series C, 7.875% | 55,631 | 1,441,399 |
| 1,441,399 | |||
| Total Preferred Stock (Cost $1,425,101) | 1,441,399 | ||
| Asset Backed Securities — 3.1% | |||
| Auto Receivables — 1.1% | |||
| Carvana Auto Receivables Trust, | |||
| c | 0.01% due 1/10/2029 | $155,003,000 | 2,082,669 |
| c | Series 2021-P3 Class R, due 9/11/2028 | 2,500 | 1,344,921 |
| c | JPMorgan Chase Bank NA - CACLN, Series 2020 -1 Class R, 33.784% due 1/25/2028 | 932,630 | 1,136,210 |
| c | United Auto Credit Securitization Trust, Series 2022-1 Class R, 0.01% due 11/10/2028 | 6,000 | 2,248,251 |
| 6,812,051 | |||
| Other Asset Backed — 2.0% | |||
| c | Aqua Finance Trust, Series 2020-AA Class D, 7.15% due 7/17/2046 | 750,000 | 772,770 |
| c | Fat Brands Fazoli’s Native I LLC, Series 2021-1 Class A2, 6.00% due 7/25/2051 | 1,500,000 | 1,440,000 |
| b,c | Goldman Home Improvement Trust Series 2021-GRN2 Class R, due 6/20/2051 | 12,500 | 1,180,875 |
| c | LP LMS Asset Securitization Trust, Series 2021-2A Class D, 6.61% due 1/15/2029 | 1,000,000 | 911,843 |
| c | Marlette Funding Trust Series 2021-3A Class R, due 12/15/2031 | 4,500 | 2,032,043 |
| b,c | Mosaic Solar Loan Trust, Series 2021-3A Class R, 0.01% due 6/20/2052 | 8,500,000 | 2,440,350 |
| Upstart Pass-Through Trust, | |||
| c | Series 2021-ST7 Class CERT, 0.01% due 9/20/2029 | 3,000,000 | 2,421,978 |
| c | Series 2021-ST8 Class CERT, 0.01% due 10/20/2029 | 1,000,000 | 835,203 |
| 12,035,062 | |||
| Total Asset Backed Securities (Cost $20,063,868) | 18,847,113 | ||
| Corporate Bonds — 18.0% | |||
| Automobiles & Components — 0.3% | |||
| Construction & Engineering — 0.3% | |||
| c,e | IHS Netherlands Holdco BV, 8.00% due 9/18/2027 | 2,000,000 | 2,010,080 |
| 2,010,080 | |||
| Capital Goods — 1.5% | |||
| Aerospace & Defense — 1.2% | |||
| c | BWX Technologies, Inc., 4.125% due 6/30/2028 | 2,300,000 | 2,217,568 |
| c | Spirit AeroSystems, Inc., 7.50% due 4/15/2025 | 3,000,000 | 3,109,200 |
| c | TransDigm, Inc., 6.25% due 3/15/2026 | 2,000,000 | 2,059,320 |
| Trading Companies & Distributors — 0.3% | |||
| c | IAA, Inc., 5.50% due 6/15/2027 | 2,000,000 | 2,009,760 |
| 9,395,848 | |||
| Commercial & Professional Services — 0.4% | |||
| Commercial Services & Supplies — 0.4% | |||
| c | ACCO Brands Corp., 4.25% due 3/15/2029 | 500,000 | 462,310 |
| c,e | Cimpress plc, 7.00% due 6/15/2026 | 2,000,000 | 1,903,880 |
| 2,366,190 | |||
| Consumer Durables & Apparel — 0.7% |
| See
notes to financial statements. |
Semi-Annual Report | 9 |
Thornburg Income Builder Opportunities Trust | March 31, 2022 (Unaudited)
| Issuer-Description | SHARES/
PRINCIPAL AMOUNT |
VALUE | |
| Household Durables — 0.5% | |||
| c | CD&R Smokey Buyer, Inc., 6.75% due 7/15/2025 | $ 3,000,000 | $ 3,096,660 |
| Leisure Products — 0.2% | |||
| c | Vista Outdoor, Inc., 4.50% due 3/15/2029 | 1,250,000 | 1,149,763 |
| 4,246,423 | |||
| Consumer Services — 0.4% | |||
| Hotels, Restaurants & Leisure — 0.4% | |||
| c | Nathan’s Famous, Inc., 6.625% due 11/1/2025 | 250,000 | 251,163 |
| c | Papa John’s International, Inc., 3.875% due 9/15/2029 | 2,350,000 | 2,150,391 |
| 2,401,554 | |||
| Diversified Financials — 2.1% | |||
| Capital Markets — 1.1% | |||
| c,e | B3 SA - Brasil Bolsa Balcao, 4.125% due 9/20/2031 | 1,750,000 | 1,572,147 |
| c | LPL Holdings, Inc., 4.625% due 11/15/2027 | 3,000,000 | 2,950,200 |
| c | StoneX Group, Inc., 8.625% due 6/15/2025 | 2,000,000 | 2,089,160 |
| Consumer Finance — 0.5% | |||
| FirstCash, Inc., | |||
| c | 4.625% due 9/1/2028 | 2,000,000 | 1,861,420 |
| c | 5.625% due 1/1/2030 | 1,500,000 | 1,442,520 |
| Diversified Financial Services — 0.5% | |||
| c | United Wholesale Mortgage LLC, 5.50% due 11/15/2025 | 3,000,000 | 2,908,590 |
| 12,824,037 | |||
| Energy — 1.8% | |||
| Oil, Gas & Consumable Fuels — 1.8% | |||
| c | Chesapeake Energy Corp., 5.50% due 2/1/2026 | 2,000,000 | 2,050,380 |
| c | Citgo Holding, Inc., 9.25% due 8/1/2024 | 1,000,000 | 1,010,290 |
| Delek Logistics Partners LP/Delek Logistics Finance Corp., 6.75% due 5/15/2025 | 2,000,000 | 2,000,000 | |
| c,e | Parkland Corp., 4.50% due 10/1/2029 | 2,000,000 | 1,854,480 |
| e | Petroleos Mexicanos, 5.95% due 1/28/2031 | 2,000,000 | 1,847,160 |
| Sunoco LP/Sunoco Finance Corp., 5.875% due 3/15/2028 | 2,000,000 | 2,031,240 | |
| 10,793,550 | |||
| Food & Staples Retailing — 0.3% | |||
| Food & Staples Retailing — 0.3% | |||
| c | Albertsons Cos., Inc./Safeway, Inc./New Albertsons LP/Albertsons LLC, 5.875% due 2/15/2028 | 1,500,000 | 1,497,645 |
| 1,497,645 | |||
| Food, Beverage & Tobacco — 1.7% | |||
| Food Products — 0.8% | |||
| Kraft Heinz Foods Co., 4.375% due 6/1/2046 | 2,000,000 | 1,983,200 | |
| c | Post Holdings, Inc., 4.625% due 4/15/2030 | 3,000,000 | 2,705,370 |
| Tobacco — 0.9% | |||
| c | Vector Group Ltd., 10.50% due 11/1/2026 | 5,630,000 | 5,767,428 |
| 10,455,998 | |||
| Health Care Equipment & Services — 1.2% | |||
| Health Care Providers & Services — 0.9% | |||
| Centene Corp., 3.375% due 2/15/2030 | 2,000,000 | 1,883,840 | |
| c | Tenet Healthcare Corp., 5.125% due 11/1/2027 | 3,500,000 | 3,518,060 |
| Health Care Technology — 0.3% | |||
| c | Change Healthcare Holdings LLC/Change Healthcare Finance, Inc., 5.75% due 3/1/2025 | 2,000,000 | 1,999,680 |
| 7,401,580 | |||
| Household & Personal Products — 1.8% | |||
| Household Products — 1.4% | |||
| c | Prestige Brands, Inc., 3.75% due 4/1/2031 | 3,300,000 | 2,945,382 |
| Scotts Miracle-Gro Co., | |||
| 4.375% due 2/1/2032 | 1,500,000 | 1,328,670 | |
| 4.50% due 10/15/2029 | 1,500,000 | 1,405,935 | |
| c | Spectrum Brands, Inc., 3.875% due 3/15/2031 | 3,000,000 | 2,643,300 |
| Personal Products — 0.4% | |||
| c | Edgewell Personal Care Co., 5.50% due 6/1/2028 | 2,500,000 | 2,488,500 |
| 10 | Semi-Annual Report |
See notes to financial statements. |
| Issuer-Description | SHARES/
PRINCIPAL AMOUNT |
VALUE | |
| 10,811,787 | |||
| Insurance — 0.2% | |||
| Insurance — 0.2% | |||
| e | Enstar Group Ltd., 3.10% due 9/1/2031 | $ 1,000,000 | $ 895,430 |
| 895,430 | |||
| Materials — 1.7% | |||
| Chemicals — 0.3% | |||
| c,e | SPCM SA, 3.125% due 3/15/2027 | 2,000,000 | 1,840,640 |
| Containers & Packaging — 0.8% | |||
| Ball Corp., 3.125% due 9/15/2031 | 1,500,000 | 1,339,215 | |
| c | Matthews International Corp., Class C, 5.25% due 12/1/2025 | 3,414,000 | 3,442,917 |
| Metals & Mining — 0.6% | |||
| e | AngloGold Ashanti Holdings plc, 3.375% due 11/1/2028 | 2,500,000 | 2,331,825 |
| c | Stillwater Mining Co., 4.50% due 11/16/2029 | 1,500,000 | 1,394,370 |
| 10,348,967 | |||
| Media & Entertainment — 1.1% | |||
| Media — 1.1% | |||
| CCO Holdings LLC/CCO Holdings Capital Corp., | |||
| c | 4.25% due 1/15/2034 | 2,000,000 | 1,734,280 |
| c | 4.75% due 3/1/2030 | 2,000,000 | 1,922,400 |
| c,e | Telenet Finance Luxembourg Notes Sarl, 5.50% due 3/1/2028 | 3,000,000 | 2,934,330 |
| 6,591,010 | |||
| Real Estate — 0.8% | |||
| Equity Real Estate Investment Trusts — 0.5% | |||
| c | Iron Mountain, Inc., 5.00% due 7/15/2028 | 3,000,000 | 2,928,720 |
| Real Estate Management & Development — 0.3% | |||
| c | Cushman & Wakefield US Borrower LLC, 6.75% due 5/15/2028 | 2,000,000 | 2,089,940 |
| 5,018,660 | |||
| Semiconductors & Semiconductor Equipment — 0.3% | |||
| Semiconductors & Semiconductor Equipment — 0.3% | |||
| c | Qorvo, Inc., 3.375% due 4/1/2031 | 2,000,000 | 1,818,680 |
| 1,818,680 | |||
| Software & Services — 0.9% | |||
| Information Technology Services — 0.7% | |||
| c | Sabre GLBL, Inc., 9.25% due 4/15/2025 | 1,000,000 | 1,109,100 |
| c | Science Applications International Corp., 4.875% due 4/1/2028 | 3,000,000 | 2,972,010 |
| Software — 0.2% | |||
| c | Audatex North America, Inc., 6.125% due 11/1/2023 | 250,000 | 235,755 |
| c | Open Text Holdings, Inc., 4.125% due 12/1/2031 | 1,500,000 | 1,404,450 |
| 5,721,315 | |||
| Telecommunication Services — 0.3% | |||
| Wireless Telecommunication Services — 0.3% | |||
| c,e | Vmed O2 UK Financing I plc, 4.25% due 1/31/2031 | 2,000,000 | 1,823,680 |
| 1,823,680 | |||
| Utilities — 0.5% | |||
| Electric Utilities — 0.5% | |||
| c,e | AES Andres BV, 5.70% due 5/4/2028 | 1,600,000 | 1,513,936 |
| e | Comision Federal de Electricidad, 5.00% due 9/29/2036 | 1,580,000 | 1,542,712 |
| Gas Utilities — 0.0% | |||
| e | Rockpoint Gas Storage Canada Ltd., 7.00% due 3/31/2023 | 148,000 | 147,902 |
| 3,204,550 | |||
| Total Corporate Bonds (Cost $115,028,660) | 109,626,984 | ||
| Convertible Bonds — 0.3% | |||
| Diversified Financials — 0.3% | |||
| Diversified Financial Services — 0.3% |
| See
notes to financial statements. |
Semi-Annual Report | 11 |
Thornburg Income Builder Opportunities Trust | March 31, 2022 (Unaudited)
| Issuer-Description | SHARES/
PRINCIPAL AMOUNT |
VALUE | |
| EZCORP, Inc., 2.375% due 5/1/2025 | $ 2,275,000 | $ 2,020,701 | |
| 2,020,701 | |||
| Total Convertible Bonds (Cost $2,080,412) | 2,020,701 | ||
| Other Government — 0.6% | |||
| c,e | Finance Department Government of Sharjah, 3.625% due 3/10/2033 | 2,000,000 | 1,838,300 |
| c,e | Oman Government International Bond, 5.625% due 1/17/2028 | 1,650,000 | 1,700,853 |
| Total Other Government (Cost $3,736,428) | 3,539,153 | ||
| U.S. Government Agencies — 0.2% | |||
| c,d,f | Farm Credit Bank of Texas, Series 4, 5.70% (5-Yr. CMT + 5.42%), 9/15/2025 | 1,000,000 | 1,040,000 |
| Total U.S. Government Agencies (Cost $1,074,075) | 1,040,000 | ||
| Mortgage Backed — 3.2% | |||
| c | Arroyo Mortgage Trust, Whole Loan Securities Trust CMO, Series 2022-1 Class M1, 3.65% due 12/25/2056 | 1,500,000 | 1,399,492 |
| Citigroup Mortgage Loan Trust, Whole Loan Securities Trust CMO, | |||
| c,f,g | Series 2021-J3 Class A3I1, 0.50% due 9/25/2051 | 5,476,269 | 127,515 |
| c,f,g | Series 2021-J3 Class A5I2, 0.25% due 9/25/2051 | 45,132,010 | 528,230 |
| c,f,g | Series 2021-J3 Class AIOS, 0.08% due 9/25/2051 | 47,312,175 | 149,033 |
| c,f | Series 2021-J3 Class B4, 2.859% due 9/25/2051 | 350,000 | 204,926 |
| c,f | Series 2021-J3 Class B6, 2.859% due 9/25/2051 | 200,000 | 68,167 |
| c,f | CSMC Trust, CMBS, Series 2021-BPNY 4.111% (LIBOR 1 Month + 3.71%) due 8/15/2023 | 2,000,000 | 1,968,681 |
| c,f | GCAT Trust, Whole Loan Securities Trust CMO, Series 2021-CM2 Class A1, 2.352% due 8/25/2066 | 1,476,459 | 1,436,282 |
| c,f | Homeward Opportunities Fund I Trust, , Whole Loan Securities Trust CMO, Series 2020-2 5.514% due 5/25/2065 | 3,000,000 | 2,989,370 |
| JPMorgan Mortgage Trust, Whole Loan Securities Trust CMO, | |||
| c,f,g | Series 2021-11 Class A3X, 0.50% due 1/25/2052 | 3,962,473 | 100,678 |
| c,f,g | Series 2021-11 Class AX1, 0.233% due 1/25/2052 | 71,877,410 | 692,259 |
| c,f,g | Series 2021-11 Class AX4, 0.30% due 1/25/2052 | 9,215,053 | 142,710 |
| c,f | Series 2021-11 Class B5, 3.033% due 1/25/2052 | 740,926 | 503,830 |
| c,f | Series 2021-11 Class B6, 2.935% due 1/25/2052 | 908,870 | 425,361 |
| Mello Mortgage Capital Acceptance, Whole Loan Securities Trust CMO, | |||
| c,f,g | Series 2021-INV2 Class AX1, 0.134% due 8/25/2051 | 112,229,934 | 668,935 |
| c,f,g | Series 2021-INV2 Class AX4, 0.70% due 8/25/2051 | 7,689,794 | 272,826 |
| c,f | Series 2021-INV2 Class B5, 3.334% due 8/25/2051 | 325,247 | 246,929 |
| c,f | Series 2021-INV2 Class B6, 3.092% due 8/25/2051 | 1,565,669 | 780,580 |
| c,f,g | Series 2021-INV3 Class AX1, 0.177% due 10/25/2051 | 29,552,217 | 230,117 |
| c,f,g | Series 2021-INV3 Class AX4, 0.55% due 10/25/2051 | 2,398,719 | 67,618 |
| c,f | Series 2021-INV3 Class B5, 3.227% due 10/25/2051 | 99,001 | 74,379 |
| c,f | Series 2021-INV3 Class B6, 3.172% due 10/25/2051 | 425,966 | 215,181 |
| c,f | MFA Trust, Whole Loan Securities Trust CMO, 4.20% due 12/25/2066 | 2,500,000 | 2,441,335 |
| New Residential Mortgage Loan Trust, Whole Loan Securities Trust CMO, | |||
| c,f,g | Series 2021-INV1 Class AX1, 0.759% due 6/25/2051 | 37,111,999 | 1,583,988 |
| c,f | Series 2021-INV1 Class B5, 3.259% due 6/25/2051 | 379,941 | 288,955 |
| c,f | Series 2021-INV1 Class B6, 2.932% due 6/25/2051 | 680,695 | 370,774 |
| Wells Fargo Mortgage Backed Securities Trust, Whole Loan Securities Trust CMO, | |||
| c,f,g | Series 2021-INV1 Class AIO2, 0.50% due 8/25/2051 | 32,122,152 | 637,625 |
| c,f | Series 2021-INV1 Class B4, 3.327% due 8/25/2051 | 520,748 | 419,053 |
| c,f | Series 2021-INV1 Class B5, 3.327% due 8/25/2051 | 411,639 | 312,022 |
| c,f | Series 2021-INV1 Class B6, 3.327% due 8/25/2051 | 322,368 | 146,817 |
| Total Mortgage Backed (Cost $19,375,661) | 19,493,668 | ||
| Loan Participations — 2.1% | |||
| Consumer Services — 0.3% | |||
| Hotels, Restaurants & Leisure — 0.3% | |||
| h | TKC Holdings, Inc., 6.506% (LIBOR 3 Month + 5.50%) due 5/15/2028 | 1,982,381 | 1,949,672 |
| 1,949,672 | |||
| Media & Entertainment — 0.5% | |||
| Media — 0.5% | |||
| h | DirecTV Financing LLC, 5.75% (LIBOR 1 Month + 5.00%) due 8/2/2027 | 3,342,500 | 3,335,113 |
| 3,335,113 | |||
| Real Estate — 0.5% |
| 12 | Semi-Annual Report |
See notes to financial statements. |
| Issuer-Description | SHARES/
PRINCIPAL AMOUNT |
VALUE | |
| Equity Real Estate Investment Trusts — 0.5% | |||
| h | CoreCivic, Inc., 4.957% (LIBOR 1 Month + 4.50%) due 12/18/2024 | $ 2,802,753 | $ 2,767,718 |
| 2,767,718 | |||
| Software & Services — 0.8% | |||
| Information Technology Services — 0.3% | |||
| h | Vericast Corp., 8.756% (LIBOR 3 Month + 7.75%) due 6/16/2026 | 2,391,890 | 1,977,496 |
| Software — 0.5% | |||
| h | GoTo Group, Inc., 5.218% (LIBOR 1 Month + 4.75%) due 8/31/2027 | 2,977,387 | 2,918,762 |
| 4,896,258 | |||
| Total Loan Participations (Cost $13,000,458) | 12,948,761 | ||
| Rights — 0.0% | |||
| Utilities — 0.0% | |||
| Electric Utilities — 0.0% | |||
| a,b | Electricite de France SA, 4/4/2022 | 462,137 | 171,776 |
| 171,776 | |||
| Total Rights (Cost $0) | 171,776 | ||
| Short-Term Investments — 2.0% | |||
| i | Thornburg Capital Management Fund | 1,213,789 | 12,137,886 |
| Total Short-Term Investments (Cost $12,137,886) | 12,137,886 | ||
| Total Investments — 98.5% (Cost $640,117,456) | $599,951,947 | ||
| Other Assets Less Liabilities — 1.5% | 9,324,452 | ||
| Net Assets — 100.0% | $609,276,399 |
| OUTSTANDING WRITTEN OPTIONS CONTRACTS AT MARCH 31, 2022 | |||||||||
| CONTRACT
DESCRIPTION |
CONTRACT
PARTY* |
CONTRACT
AMOUNT |
EXERCISE
PRICE |
EXPIRATION
DATE |
NOTIONAL
AMOUNT |
PREMIUMS
RECEIVED USD |
VALUE
USD | ||
| WRITTEN CALL OPTIONS – (0.3)% | |||||||||
| BANKS – (0.0)% | |||||||||
| JPMorgan Chase & Co. | GST | 16,500 | USD | 165.00 | 4/01/2022 | USD | 2,249,280 | $ 39,600 | $ 0 |
| Regions Financial Corp. | BOA | 132,500 | USD | 24.00 | 4/14/2022 | USD | 2,949,450 | 38,425 | (15,944) |
| Mitsubishi UFJ Financial Group, Inc. | JPM | 470,000 | JPY | 800.00 | 5/12/2022 | JPY | 353,671,099 | 93,876 | (41,952) |
| 171,901 | (57,896) | ||||||||
| PHARMACEUTICALS, BIOTECHNOLOGY & LIFE SCIENCES – (0.1)% | |||||||||
| AbbVie, Inc. | GST | 13,600 | USD | 149.00 | 4/01/2022 | USD | 2,204,696 | 22,440 | (178,396) |
| Merck & Co., Inc. | GST | 38,200 | USD | 80.00 | 4/22/2022 | USD | 3,134,310 | 46,986 | (107,273) |
| AstraZeneca plc | GST | 24,000 | GBP | 98.00 | 4/14/2022 | GBP | 2,422,800 | 37,872 | (127,134) |
| AstraZeneca plc | GST | 23,800 | GBP | 102.00 | 5/20/2022 | GBP | 2,402,610 | 66,997 | (104,720) |
| AbbVie, Inc. | JPM | 11,400 | USD | 165.00 | 5/06/2022 | USD | 1,848,054 | 26,790 | (30,434) |
| Merck & Co., Inc. | JPM | 37,800 | USD | 85.00 | 5/06/2022 | USD | 3,101,490 | 31,945 | (37,736) |
| 233,030 | (585,693) | ||||||||
| DIVERSIFIED FINANCIALS – (0.0)% | |||||||||
| CME Group, Inc. | BOA | 13,300 | USD | 255.00 | 4/01/2022 | USD | 3,163,538 | 41,895 | (23) |
| MATERIALS – (0.0)% | |||||||||
| LyondellBasell Industries N.V. | GST | 47,200 | USD | 105.00 | 4/14/2022 | USD | 4,853,104 | 84,960 | (73,160) |
| BHP Group Ltd. | BOA | 76,000 | AUD | 54.00 | 5/19/2022 | AUD | 3,915,018 | 42,890 | (66,132) |
| 127,850 | (139,292) | ||||||||
| See
notes to financial statements. |
Semi-Annual Report | 13 |
Thornburg Income Builder Opportunities Trust | March 31, 2022 (Unaudited)
| OUTSTANDING WRITTEN OPTIONS CONTRACTS AT MARCH 31, 2022 | |||||||||
| CONTRACT
DESCRIPTION |
CONTRACT
PARTY* |
CONTRACT
AMOUNT |
EXERCISE
PRICE |
EXPIRATION
DATE |
NOTIONAL
AMOUNT |
PREMIUMS
RECEIVED USD |
VALUE
USD | ||
| RETAILING – (0.0)% | |||||||||
| MercadoLibre, Inc. | BOA | 1,750 | USD | 1,250.00 | 4/08/2022 | USD | 2,081,590 | $ 61,250 | $ (28,619) |
| Alibaba Group Holding Ltd. | BOA | 202,000 | HKD | 130.00 | 4/28/2022 | HKD | 21,593,558 | 129,087 | (43,361) |
| 190,337 | (71,980) | ||||||||
| FOOD & STAPLES RETAILING – (0.0)% | |||||||||
| Walgreens Boots Alliance, Inc. | GST | 61,700 | USD | 50.00 | 4/22/2022 | USD | 2,762,309 | 78,359 | (3,902) |
| Tesco plc | JPM | 826,000 | GBP | 2.80 | 4/14/2022 | GBP | 2,276,373 | 62,520 | (36,554) |
| 140,879 | (40,456) | ||||||||
| SEMICONDUCTORS & SEMICONDUCTOR EQUIPMENT – (0.1)% | |||||||||
| Broadcom, Inc. | JPM | 5,000 | USD | 630.00 | 4/22/2022 | USD | 3,148,400 | 66,850 | (85,782) |
| NVIDIA Corp. | GST | 9,100 | USD | 270.00 | 4/22/2022 | USD | 2,483,026 | 35,581 | (133,709) |
| QUALCOMM, Inc. | JPM | 19,600 | USD | 175.00 | 5/06/2022 | USD | 2,995,272 | 55,860 | (31,897) |
| ASML Holding NV | GST | 3,200 | EUR | 640.00 | 4/29/2022 | EUR | 1,932,935 | 63,291 | (41,324) |
| 221,582 | (292,712) | ||||||||
| ENERGY – (0.0)% | |||||||||
| Total Energies SE | JPM | 58,600 | EUR | 50.00 | 4/14/2022 | EUR | 2,680,346 | 48,646 | (8,245) |
| SOFTWARE & SERVICES – (0.0)% | |||||||||
| Microsoft Corp. | BOA | 10,400 | USD | 310.00 | 4/22/2022 | USD | 3,206,424 | 33,800 | (69,503) |
| Shopify, Inc. Class A | JPM | 1,700 | USD | 950.00 | 4/22/2022 | USD | 1,149,132 | 14,450 | (3,632) |
| Mastercard, Inc. Class A | GST | 5,300 | USD | 357.00 | 5/06/2022 | USD | 1,894,114 | 22,790 | (35,261) |
| ServiceNow, Inc. | JPM | 2,700 | USD | 620.00 | 5/06/2022 | USD | 1,503,603 | 41,850 | (30,041) |
| 112,890 | (138,437) | ||||||||
| FOOD, BEVERAGE & TOBACCO – (0.0)% | |||||||||
| Altria Group, Inc. | BOA | 57,700 | USD | 54.00 | 4/29/2022 | USD | 3,014,825 | 32,889 | (36,597) |
| TELECOMMUNICATION SERVICES – (0.0)% | |||||||||
| Orange SA | JPM | 256,000 | EUR | 10.80 | 4/29/2022 | EUR | 2,739,866 | 50,750 | (47,907) |
| INSURANCE – (0.1)% | |||||||||
| Assicurazioni Generali SpA | JPM | 145,000 | EUR | 19.00 | 4/28/2022 | EUR | 2,997,933 | 67,072 | (314,124) |
| NN Group NV | GST | 61,500 | EUR | 46.50 | 4/14/2022 | EUR | 2,817,395 | 42,738 | (53,858) |
| 109,810 | (367,982) | ||||||||
| MEDIA & ENTERTAINMENT – (0.0)% | |||||||||
| Meta Platforms, Inc. | BOA | 14,100 | USD | 240.00 | 4/22/2022 | USD | 3,135,276 | 25,662 | (27,306) |
| Nintendo Co. Ltd. | JPM | 5,600 | JPY | 67,500.00 | 5/12/2022 | JPY | 344,118,403 | 63,426 | (27,380) |
| 89,088 | (54,686) | ||||||||
| TECHNOLOGY HARDWARE & EQUIPMENT – (0.0)% | |||||||||
| Cisco Systems, Inc. | JPM | 56,200 | USD | 57.00 | 5/06/2022 | USD | 3,133,712 | 30,910 | (43,423) |
| CAPITAL GOODS – (0.0)% | |||||||||
| Siemens Energy AG | BOA | 10,800 | EUR | 140.00 | 4/29/2022 | EUR | 1,351,816 | 17,800 | (10,419) |
| TOTAL WRITTEN CALL OPTIONS | $ 1,620,257 | $ (1,895,748) | |||||||
| WRITTEN PUT OPTIONS – (0.1)% | |||||||||
| DIVERSIFIED FINANCIALS – (0.0)% | |||||||||
| CME Group, Inc. | BOA | 10,300 | USD | 220.00 | 4/01/2022 | USD | 2,449,958 | $ 22,145 | $ (2,431) |
| PHARMACEUTICALS, BIOTECHNOLOGY & LIFE SCIENCES – (0.0)% | |||||||||
| Pfizer, Inc. | GST | 62,700 | USD | 49.00 | 5/06/2022 | USD | 3,245,979 | 50,160 | (52,698) |
| BANKS – (0.0)% | |||||||||
| Regions Financial Corp. | JPM | 153,400 | USD | 20.00 | 5/20/2022 | USD | 3,414,684 | 62,894 | (65,993) |
| 14 | Semi-Annual Report |
See notes to financial statements. |
| OUTSTANDING WRITTEN OPTIONS CONTRACTS AT MARCH 31, 2022 | |||||||||
| CONTRACT
DESCRIPTION |
CONTRACT
PARTY* |
CONTRACT
AMOUNT |
EXERCISE
PRICE |
EXPIRATION
DATE |
NOTIONAL
AMOUNT |
PREMIUMS
RECEIVED USD |
VALUE
USD | ||
| SOFTWARE & SERVICES – (0.0)% | |||||||||
| Microsoft Corp. | JPM | 6,400 | USD | 290.00 | 5/06/2022 | USD | 1,973,184 | $ 35,200 | $ (30,988) |
| UTILITIES – (0.0)% | |||||||||
| Enel SpA | JPM | 465,000 | EUR | 6.00 | 4/28/2022 | EUR | 2,806,508 | 72,180 | (105,841) |
| FOOD & STAPLES RETAILING – (0.1)% | |||||||||
| Tesco plc | JPM | 878,000 | GBP | 2.70 | 5/20/2022 | GBP | 2,419,680 | 57,500 | (83,442) |
| Walgreens Boots Alliance, Inc. | BOA | 67,700 | USD | 46.00 | 4/29/2022 | USD | 3,030,929 | 67,023 | (130,066) |
| 124,523 | (213,508) | ||||||||
| FOOD, BEVERAGE & TOBACCO – (0.0)% | |||||||||
| Altria Group, Inc. | BOA | 63,500 | USD | 49.00 | 5/06/2022 | USD | 3,317,875 | 36,830 | (32,562) |
| TOTAL WRITTEN PUT OPTIONS | $ 403,932 | $ (504,021) | |||||||
| TOTAL | $ 2,024,189 | $ (2,399,769) | |||||||
| * | Counterparties include JPMorgan Chase Bank, N.A. (“JPM”), Bank of America ("BOA") and Goldman Sachs International ("GST"). |
| Footnote Legend | |
| a | Non-income producing. |
| b | Security currently fair valued by the Valuation and Pricing Committee using procedures approved by the Trustees’ Audit Committee. |
| c | Securities exempt from registration under Rule 144A of the Securities Act of 1933, as amended. These securities are restricted but liquid and may only be resold in the ordinary course of business in transactions exempt from registration, normally to qualified institutional buyers. As of March 31, 2022, the aggregate value of these securities in the Fund’s portfolio was $139,058,627, representing 22.82% of the Fund’s net assets. |
| d | Securities are perpetual and, thus, do not have a predetermined maturity date. The date shown, if applicable, reflects the next call date. |
| e | Yankee bond denominated in U.S. dollars and is issued in the U.S. by foreign banks and corporations. |
| f | Variable, floating, step, or fixed to floating rate securities are securities for which interest rate changes are based on changes in a designated base rate or on a predetermined schedule. The rates shown are those in effect on March 31, 2022. |
| g | Interest only. |
| h | The stated coupon rate represents the greater of the LIBOR or the LIBOR floor rate plus a spread at March 31, 2022. |
| i | Investment in Affiliates. |
| See
notes to financial statements. |
Semi-Annual Report | 15 |
Thornburg Income Builder Opportunities Trust | March 31, 2022 (Unaudited)
To simplify the listings of securities, abbreviations are used per the table below:
| COUNTRY
EXPOSURE * (percent of net assets) | |
| United States | 50.5% |
| France | 6.8% |
| United Kingdom | 5.1% |
| Netherlands | 4.5% |
| Japan | 4.4% |
| Italy | 4.4% |
| Australia | 3.5% |
| Taiwan | 2.8% |
| Germany | 2.5% |
| Spain | 1.6% |
| Brazil | 1.4% |
| United Arab Emirates | 1.4% |
| Canada | 1.3% |
| China | 1.2% |
| Sweden | 1.2% |
| Switzerland | 1.0% |
| Mexico | 0.6% |
| Belgium | 0.5% |
| United Republic of Tanzania | 0.4% |
| Nigeria | 0.3% |
| Ireland | 0.3% |
| Oman | 0.3% |
| Dominican Republic | 0.3% |
| South Africa | 0.2% |
| Russian Federation | 0.0%** |
| Other Assets Less Liabilities | 3.5% |
| * | Holdings are classified by country of risk as determined by MSCI and Bloomberg. |
| ** | Country percentage was less than 0.1%. |
| 16 | Semi-Annual Report |
See notes to financial statements. |
Thornburg Income Builder Opportunities Trust | March 31, 2022 (Unaudited)
| ASSETS | |
| Investments at cost | |
| Non-affiliated issuers | $ 627,979,570 |
| Non-controlled affiliated issuers | 12,137,886 |
| Investments at value | |
| Non-affiliated issuers | 587,814,061 |
| Non-controlled affiliated issuers | 12,137,886 |
| Cash | 134,832 |
| Cash segregated as collateral on written options | 8,060,000 |
| Receivable for investments sold | 130,014 |
| Dividends receivable | 1,819,438 |
| Tax reclaims receivable | 331,321 |
| Principal and interest receivable | 2,110,210 |
| Prepaid expenses and other assets | 38,892 |
| Total Assets | 612,576,654 |
| Liabilities | |
| Written options at value (a) | 2,399,769 |
| Payable for investments purchased | 1,874 |
| Payable to investment advisor and other affiliates | 554,554 |
| Payable for market support expense | 94,857 |
| Accounts payable and accrued expenses | 249,201 |
| Total Liabilities | 3,300,255 |
| Net Assets | $ 609,276,399 |
| NET ASSETS CONSIST OF | |
| Net capital paid in on shares of beneficial interest | $ 641,637,660 |
| Accumulated loss | (32,361,261) |
| Net Assets | $ 609,276,399 |
| NET ASSET VALUE | |
| Common Shares Shares: | |
| Net assets applicable to shares outstanding | $ 609,276,399 |
| Shares outstanding | 32,081,883 |
| Net asset value and redemption price per share | $ 18.99 |
| (a) | Premiums received $2,024,189. |
Thornburg Income Builder Opportunities Trust | Six Months Ended March 31, 2022 (Unaudited)
| INVESTMENT INCOME | |
| Dividend income | |
| Non-affiliated issuers | $ 10,584,097 |
| Non-controlled affiliated issuers | 10,035 |
| Dividend taxes withheld | (668,574) |
| Interest income | 4,295,654 |
| Other income | 5,000 |
| Total Income | 14,226,212 |
| EXPENSES | |
| Investment management fees | 3,973,244 |
| Administration fees | 266,494 |
| Transfer agent fees | 16,534 |
| Market support fees | 635,719 |
| Custodian fees | 88,308 |
| Professional fees | 202,700 |
| Trustee and officer fees | 63,617 |
| Other expenses | 122,307 |
| Total Expenses | 5,368,923 |
| Less: | |
| Expenses reimbursed | (124,240) |
| Net Expenses | 5,244,683 |
| Net Investment Income (Loss) | $ 8,981,529 |
| REALIZED AND UNREALIZED GAIN (LOSS) | |
| Net realized gain (loss) on: | |
| Non-affiliated issuer investments | 8,162,004 |
| Options written | 9,984,229 |
| Foreign currency transactions | (1,997,700) |
| Net realized gain (loss) | 16,148,533 |
| Net change in unrealized appreciation (depreciation) on: | |
| Non-affiliated issuers investments | (29,320,868) |
| Options written | 349,517 |
| Foreign currency translations | 6,867 |
| Change in net unrealized appreciation (depreciation) | (28,964,484) |
| Net Realized and Unrealized Gain (Loss) | (12,815,951) |
| Change in Net Assets Resulting from Operations | $ (3,834,422) |
Thornburg Income Builder Opportunities Trust
| Six
Months Ended March 31, 2022* |
Period
Ended September 30, 2021** | |
| INCREASE (DECREASE) IN NET ASSETS FROM | ||
| OPERATIONS | ||
| Net investment income | $ 8,981,529 | $ 2,864,801 |
| Net realized gain (loss) on investments and foreign currency transactions | 16,148,533 | 3,583,528 |
| Net change in unrealized appreciation (depreciation) on investments and foreign currency translations | (28,964,484) | (11,581,379) |
| Net Increase (Decrease) in Net Assets Resulting from Operations | (3,834,422) | (5,133,050) |
| DIVIDENDS TO SHAREHOLDERS | ||
| From distributable earnings | ||
| Common Shares | (20,051,819) | (3,341,970) |
| FUND SHARE TRANSACTIONS | ||
| Common Shares | - | 641,637,660 |
| Net Increase (Decrease) in Net Assets | (23,886,241) | 633,162,640 |
| NET ASSETS | ||
| Beginning of Period | 633,162,640 | — |
| End of Period | $ 609,276,399 | $ 633,162,640 |
| * | Unaudited. |
| ** | Trust commenced operations on July 28, 2021. |
Thornburg Income Builder Opportunities Trust | March 31, 2022 (Unaudited)
Thornburg Income Builder Opportunities Trust | March 31, 2022 (Unaudited)
| TOTAL | LEVEL 1 | LEVEL 2 | LEVEL 3 | |
| Assets | ||||
| Investments in Securities | ||||
| Common Stock | $ 418,684,506 | $ 200,458,632 | $ 218,030,566 | $ 195,308 |
| Preferred Stock | 1,441,399 | 1,441,399 | — | — |
| Asset Backed Securities | 18,847,113 | — | 15,225,888 | 3,621,225 |
| Corporate Bonds | 109,626,984 | — | 109,626,984 | — |
| Convertible Bonds | 2,020,701 | — | 2,020,701 | — |
| Other Government | 3,539,153 | — | 3,539,153 | — |
| U.S. Government Agencies | 1,040,000 | — | 1,040,000 | — |
| Mortgage Backed | 19,493,668 | — | 19,493,668 | — |
| Loan Participations | 12,948,761 | — | 12,948,761 | — |
| Rights | 171,776 | — | — | 171,776 |
| Short-Term Investments | 12,137,886 | 12,137,886 | — | — |
| Total Investments in Securities | $ 599,951,947 | $ 214,037,917 | $ 381,925,721 | $ 3,988,309 |
| Total Assets | $ 599,951,947 | $ 214,037,917 | $ 381,925,721 | $ 3,988,309 |
| Liabilities | ||||
| Other Financial Instruments | ||||
| Written Call Options | $ (1,895,748) | $ — | $ (1,895,748) | $ — |
| Written Put Options | (504,021) | — | (504,021) | — |
| Total Other Financial Instruments | $ (2,399,769) | $ — | $ (2,399,769) | $ — |
| Total Liabilities | $ (2,399,769) | $ — | $ (2,399,769) | $— |
Thornburg Income Builder Opportunities Trust | March 31, 2022 (Unaudited)
| COMMON
STOCK |
ASSET
BACKED SECURITIES |
RIGHTS | TOTAL (e) | |
| Beginning Balance 9/30/2021 | $ – | $ 8,104,568 | $ – | $ 8,104,568 |
| Accrued Discounts (Premiums) | – | (292,923) | – | (290,923) |
| Net Realized Gain (Loss)(a) | (539,735) | 318,991 | – | (220,744) |
| Gross Purchases | 1,649,410 | – | – | 1,649,410 |
| Gross Sales | (1,127,257) | (1,460,000) | – | (2,587,257) |
| Net Change in Unrealized Appreciation (Depreciation)(b)(c) | (13,767,369) | (652,995) | – | (14,420,364) |
| Transfers into Level 3(d) | 13,980,259 | – | 171,776 | 14,152,035 |
| Transfers out of Level 3(d) | – | (2,396,416) | – | (2,396,416) |
| Ending Balance 3/31/2022 | $ 195,308 | $ 3,621,225 | $ 171,776 | 3,988,309 |
| (a) | Amount of net realized gain (loss) from investments recognized in income is included in the Trust’s Statement of Operations for the six months ended March 31, 2022. |
| (b) | Amount of net change in unrealized appreciation (depreciation) on investments recognized in income is included in the Trust’s Statement of Operations for the six months ended March 31, 2022. |
| (c) | The net change in unrealized appreciation (depreciation) attributable to securities owned at March 31, 2022, which were valued using significant unobservable inputs, was $(14,237,874). This is included within net change in unrealized appreciation (depreciation) on investments in the Trust’s Statement of Operations for the six months ended March 31, 2022. |
| (d) | Transfers into or out of Level 3 were out of or into Level 1 or Level 2, and were due to changes in other significant observable inputs available during the six months ended March 31, 2022. Transfers into or out of Level 3 are based on the beginning market value of the period in which they occurred. |
| (e) | Level 3 investments represent 0.65% of total net assets at the six months ended March 31, 2022. Significant fluctuations of the unobservable inputs applied to portfolio securities characterized as Level 3 investments could be expected to increase or decrease the fair value of these portfolio securities. |
| Administrative Services Fee Schedule | |
| Daily Net Assets | Fee Rate |
| Up to $20 billion | 0.100% |
| $20 billion to $40 billion | 0.075 |
| $40 billion to $60 billion | 0.040 |
| Over $60 billion | 0.030 |
| Market
Value 9/30/21 |
Purchases
at Cost |
Sales
Proceeds |
Realized
Gain (Loss) |
Change
in Unrealized Appr./(Depr.) |
Market
Value 3/31/22 |
Dividend
Income | |
| Thornburg Capital Mgmt. Fund | $38,506,112 | $137,810,260 | $(164,178,486) | $- | $- | $12,137,886 | $10,035 |
| Cost of investments for tax purposes | $ 640,117,456 |
| Gross unrealized appreciation on a tax basis | 29,334,305 |
| Gross unrealized depreciation on a tax basis | (69,499,814) |
| Net unrealized appreciation (depreciation) on investments (tax basis) | $ (40,165,509) |
Thornburg Income Builder Opportunities Trust | March 31, 2022 (Unaudited)
| SIX
MONTHS ENDED March 31, 2022 |
PERIOD
ENDED September 30, 2021* | |||
| SHARES | AMOUNT | SHARES | AMOUNT | |
| Common Shares | ||||
| Shares sold | - | $ - | 32,081,883 | $ 641,637,660 |
| Shares issued to shareholders in reinvestment of dividends | - | - | - | - |
| Net increase | - | $ - | 32,081,883 | $ 641,637,660 |
| * Trust commenced operations on July 28, 2021. | ||||
| Type of Derivative(a) | Counter
Party |
Asset
Derivatives |
Liability
Derivatives |
Net
Amount |
| Written Options | GST | $ — | $ (911,436) | $ (911,436) |
| Written Options | BOA | — | (462,965) | (462,965) |
| Written Options | JPM | — | (1,025,368) | (1,025,368) |
| (a) | Generally, the Statement of Assets and Liabilities location for written options is Liabilities - written options at value for liabilities derivatives. |
| Net Realized | Net Change in Unrealized | |||
| Type of Derivative(a) | Gain (Loss) | Appreciation (Depreciation) | ||
| Written Options | $ 9,984,229 | $ 349,517 |
| (a) | Generally, the Statement of Operations location for written option contracts is Net realized gain (loss) on: options written and Net change in unrealized appreciation (depreciation) on: options written. |
| Type of Derivative | Counterparty | Liability Derivatives | Cash Collateral Pledged | Net Amount |
| Written Options | BOA | $ 462,963 | $ (462,963) | $ – |
| Written Options | JPM | 1,025,371 | (1,025,371) | – |
| Written Options | GST | 911,435 | (911,435) | – |
| $ 2,399,769 | $ (2,399,769) | $ – |
Income Builder Opportunities Trust
| 2022 (a) | 2021 (b) | |
| Per Share Performance (For a Share Outstanding throughout the Period)(c) | ||
| Net Asset Value, Beginning of Period | $19.74 | $20.00 |
| Net Investment Income (Loss) | 0.28 | 0.10 |
| Net Realized & Unrealized Gain (Loss) on Investments | (0.40) | (0.26) |
| Total from Investment Operations | (0.12) | (0.16) |
| Dividends from Net Investment Income | (0.63) | (0.10) |
| Dividends from Net Realized Gains | 0.00 | 0.00 |
| Total Dividends | (0.63) | (0.10) |
| Net Assets Value, End of Period | $18.99 | $19.74 |
| Market Value, End of Period | $17.09 | $20.05 |
| Total Return Applicable To Common Shareholders | ||
| Total Return(d) | (0.73)% | (0.79)% |
| Total Return, Market Value(d) | (12.04)% | 0.78% |
| Ratios to Average Net Assets | ||
| Net Investment Income (Loss) Ratio | 2.83% | 2.80% |
| Expenses, After Expense Reductions Ratio | 1.65% | 1.65% |
| Expenses, Before Expense Reductions Ratio | 1.69% | 1.69% |
| Supplemental Data | ||
| Portfolio Turnover Rate(d) | 35.07% | 27.91% |
| Net Assets at End of Period (Thousands) | $609,276 | $633,163 |
| (a) | Unaudited Six Month Period Ended March 31. |
| (b) | The Trust commenced operations on July 28, 2021. |
| (c) | Unless otherwise noted, periods are fiscal years ended September 30. |
| (d) | Not annualized for periods less than one year. |
March 31, 2022 (Unaudited)
March 31, 2022 (Unaudited)
| ■ | Thornburg Investment Income Builder Fund |
| ■ | Thornburg Income Builder Opportunities Trust |
| ■ | Thornburg Summit Fund |
| ■ | Thornburg Global Opportunities Fund |
| ■ | Thornburg International Equity Fund |
| ■ | Thornburg Better World International Fund |
| ■ | Thornburg International Growth Fund |
| ■ | Thornburg Developing World Fund |
| ■ | Thornburg Small/Mid Cap Core Fund |
| ■ | Thornburg Small/Mid Cap Growth Fund |
| ■ | Thornburg Limited Term U.S. Government Fund |
| ■ | Thornburg Limited Term Income Fund |
| ■ | Thornburg Ultra Short Income Fund |
| ■ | Thornburg Strategic Income Fund |
| ■ | Thornburg Short Duration Municipal Fund |
| ■ | Thornburg Limited Term Municipal Fund |
| ■ | Thornburg California Limited Term Municipal Fund |
| ■ | Thornburg New Mexico Intermediate Municipal Fund |
| ■ | Thornburg New York Intermediate Municipal Fund |
| ■ | Thornburg Intermediate Municipal Fund |
| ■ | Thornburg Strategic Municipal Income Fund |


Item 2. Code of Ethics
Not applicable
Item 3. Audit Committee Financial Expert
Not applicable
Item 4. Principal Accountant Fees and Services
Not applicable
Item 5. Audit Committee of Listed Registrants
Not applicable.
Item 6. Schedule of Investments
Filed as part of the reports to shareholders filed under item 1 of this Form.
Item 7. Disclosure of Proxy Voting Policies and Procedures for Closed-End Management Investment Companies
Not applicable.
Item 8. Portfolio Managers of Closed-End Management Investment Companies
Not applicable.
Item 9. Purchases of Equity Securities by Closed-End Management Investment Companies and Affiliated Purchasers.
Not applicable.
Item 10. Submission of Matters to a Vote of Security Holders
The authority to consider candidates recommended by the shareholders in accordance with the Trust’s Procedures for Shareholder Communications is committed to the Governance and Nominating Committee.
Item 11. Controls and Procedures
(a) The principal executive officer and the principal financial officer have concluded that the Trust’s disclosure controls and procedures provide reasonable assurance that material information relating to the Trust is made known to them by the appropriate persons, based on their evaluation of these controls and procedures as of a date within 90 days prior to the filing date of this report.
(b) There was no change in the Trust’s internal control over financial reporting that occurred during the registrant’s second fiscal quarter of the period covered by this report (that is, the registrant’s fourth fiscal quarter) that has materially affected, or is reasonably likely to materially affect, the registrant’s internal control over financial reporting.
Item 12. Disclosure of Securities Lending Activities for Closed-End Management Investment Companies
Not applicable.
Item 13. Exhibits
SIGNATURES
Pursuant to the requirements of the Securities Exchange Act of 1934 and the Investment Company Act of 1940, the registrant has duly caused this report to be signed on its behalf by the undersigned, thereunto duly authorized.
Thornburg Income Builder Opportunities Trust
| By: | /s/ Jason H. Brady | |
| Jason H. Brady | ||
| President and principal executive officer | ||
| Date: | May 18, 2022 | |
Pursuant to the requirements of the Securities Exchange Act of 1934 and the Investment Company Act of 1940, this report has been signed below by the following persons on behalf of the registrant and in the capacities and on the dates indicated.
| By: | /s/ Jason H. Brady | |
| Jason H. Brady | ||
| President and principal executive officer | ||
| Date: | May 18, 2022 | |
| By: | /s/ Curtis Holloway | |
| Curtis Holloway | ||
| Treasurer and principal financial officer | ||
| Date: | May 18, 2022 | |
Item 13(a)(2)
Exhibit 99.CERT
CERTIFICATION
I, Jason H. Brady, certify that:
1. I have reviewed this report on Form N-CSR of Thornburg Income Builder Opportunities Trust;
2. Based on my knowledge, this report does not contain any untrue statement of a material fact or omit to state a material fact necessary to make the statements made, in light of the circumstances under which such statements were made, not misleading with respect to the period covered by this report;
3. Based on my knowledge, the financial statements, and other financial information included in this report, fairly present in all material respects the financial condition, results of operations, changes in net assets, and cash flows (if the financial statements are required to include a statement of cash flows) of the registrant as of, and for, the periods presented in this report;
4. The registrant’s other certifying officer(s) and I are responsible for establishing and maintaining disclosure controls and procedures (as defined in Rule 30a-3(c) under the Investment Company Act of 1940) and internal control over financial reporting (as defined in Rule 30a-3(d) under the Investment Company Act of 1940) for the registrant and have:
(a) Designed such disclosure controls and procedures, or caused such disclosure controls and procedures to be designed under our supervision, to ensure that material information relating to the registrant, including its consolidated subsidiaries, is made known to us by others within those entities, particularly during the period in which this report is being prepared;
(b) Designed such internal control over financial reporting, or caused such internal control over financial reporting to be designed under our supervision, to provide reasonable assurance regarding the reliability of financial reporting and the preparation of financial statements for external purposes in accordance with generally accepted accounting principles;
(c) Evaluated the effectiveness of the registrant’s disclosure controls and procedures and presented in this report our conclusions about the effectiveness of the disclosure controls and procedures, as of a date within 90 days prior to the filing date of this report based on such evaluation; and
(d) Disclosed in this report any change in the registrant’s internal control over financial reporting that occurred during the second fiscal quarter of the period covered by this report that has materially affected, or is reasonably likely to materially affect, the registrant’s internal control over financial reporting; and
5. The registrant’s other certifying officer(s) and I have disclosed to the registrant’s auditors and the audit committee of the registrant’s board of directors (or persons performing the equivalent functions):
(a) All significant deficiencies and material weaknesses in the design or operation of internal control over financial reporting which are reasonably likely to adversely affect the registrant’s ability to record, process, summarize, and report financial information; and
(b) Any fraud, whether or not material, that involves management or other employees who have a significant role in the registrant’s internal control over financial reporting.
| Date: | May 18, 2022 | |||
| /s/ Jason H. Brady | ||||
| Jason H. Brady | ||||
| President and principal executive officer | ||||
Item 13(a)(2)
Exhibit 99.CERT
CERTIFICATION
I, Curtis Holloway, certify that:
1. I have reviewed this report on Form N-CSR of Thornburg Income Builder Opportunities Trust;
2. Based on my knowledge, this report does not contain any untrue statement of a material fact or omit to state a material fact necessary to make the statements made, in light of the circumstances under which such statements were made, not misleading with respect to the period covered by this report;
3. Based on my knowledge, the financial statements, and other financial information included in this report, fairly present in all material respects the financial condition, results of operations, changes in net assets, and cash flows (if the financial statements are required to include a statement of cash flows) of the registrant as of, and for, the periods presented in this report;
4. The registrant’s other certifying officer(s) and I are responsible for establishing and maintaining disclosure controls and procedures (as defined in Rule 30a-3(c) under the Investment Company Act of 1940) and internal control over financial reporting (as defined in Rule 30a-3(d) under the Investment Company Act of 1940) for the registrant and have:
(a) Designed such disclosure controls and procedures, or caused such disclosure controls and procedures to be designed under our supervision, to ensure that material information relating to the registrant, including its consolidated subsidiaries, is made known to us by others within those entities, particularly during the period in which this report is being prepared;
(b) Designed such internal control over financial reporting, or caused such internal control over financial reporting to be designed under our supervision, to provide reasonable assurance regarding the reliability of financial reporting and the preparation of financial statements for external purposes in accordance with generally accepted accounting principles;
(c) Evaluated the effectiveness of the registrant’s disclosure controls and procedures and presented in this report our conclusions about the effectiveness of the disclosure controls and procedures, as of a date within 90 days prior to the filing date of this report based on such evaluation; and
(d) Disclosed in this report any change in the registrant’s internal control over financial reporting that occurred during the second fiscal quarter of the period covered by this report that has materially affected, or is reasonably likely to materially affect, the registrant’s internal control over financial reporting; and
5. The registrant’s other certifying officer(s) and I have disclosed to the registrant’s auditors and the audit committee of the registrant’s board of directors (or persons performing the equivalent functions):
(a) All significant deficiencies and material weaknesses in the design or operation of internal control over financial reporting which are reasonably likely to adversely affect the registrant’s ability to record, process, summarize, and report financial information; and
(b) Any fraud, whether or not material, that involves management or other employees who have a significant role in the registrant’s internal control over financial reporting.
| Date: | May 18, 2022 | |||
| /s/ Curtis Holloway | ||||
| Curtis Holloway | ||||
| Treasurer and principal financial officer | ||||
|
|
Item 13(b) Exhibit 99.906CERT |
Certification Pursuant to Section 906 of the Sarbanes-Oxley Act of 2002 (subsections (a) and (b) of section 1350, chapter 63 of title 18, United States Code)
In connection with the attached Report on Form N-CSR of Thornburg Income Builder Opportunities Trust to be filed with the Securities and Exchange Commission (the “Report”), each of the undersigned officers of the Trust does hereby certify pursuant to Section 906 of the Sarbanes-Oxley Act of 2002 that, to the best of such officer’s knowledge:
1. The Report fully complies with the requirements of 13(a) or 15(d) of the Securities Exchange Act of 1934; and
2. The information contained in the Report fairly presents, in all material respects, the financial condition and results of operations of Thornburg Investment Trust, in respect of the Funds as of, and for, the periods presented in the Report.
| Dated: May 18, 2022 |
| /s/ Jason H. Brady |
| Jason H. Brady |
| President and principal executive officer |
| Dated: May 18, 2022 |
| /s/ Curtis Holloway |
| Curtis Holloway |
| Treasurer and principal financial officer |
A signed original of this written statement required by Section 906, or other document authenticating, acknowledging, or otherwise adopting the signature that appears in typed form within the electronic version of this written statement required by Section 906, has been provided to the Trust and will be retained by the Trust and furnished to the Securities and Exchange Commission or its staff upon request.
This certification is being furnished solely pursuant to Section 906 of the Sarbanes-Oxley Act of 2002 and is not being filed as part of the Report or as a separate disclosure document.
Serious News for Serious Traders! Try StreetInsider.com Premium Free!
You May Also Be Interested In
- Masonite Shareholders Approve Transaction with Owens Corning
- D.A. Davidson Adds Tim Ludwick, Enhancing Financial Sponsors Coverage
- Wells Fargo Expands Down Payment Grant Program to Help Bridge Homeownership Gap
Create E-mail Alert Related Categories
SEC FilingsSign up for StreetInsider Free!
Receive full access to all new and archived articles, unlimited portfolio tracking, e-mail alerts, custom newswires and RSS feeds - and more!
