

Form N-CSRS PUTNAM ASSET ALLOCATION For: Feb 28
 Tweet
Tweet Share
Share| UNITED STATES SECURITIES AND EXCHANGE COMMISSION | ||
| Washington, D.C. 20549 | ||
FORM N-CSR | ||
| CERTIFIED SHAREHOLDER REPORT OF REGISTERED MANAGEMENT INVESTMENT COMPANIES | ||
| Investment Company Act file number: | (811-07121) |
| Exact name of registrant as specified in charter: | Putnam Asset Allocation Funds |
| Address of principal executive offices: | 100 Federal Street, Boston, Massachusetts 02110 |
| Name and address of agent for service: | Stephen Tate, Vice President 100 Federal Street Boston, Massachusetts 02110 |
| Copy to: | Bryan Chegwidden, Esq. Ropes & Gray LLP 1211 Avenue of the Americas New York, New York 10036 |
| Registrant’s telephone number, including area code: | (617) 292-1000 |
| Date of fiscal year end: | August 31, 2022 |
| Date of reporting period: | September 1, 2021 – February 28, 2022 |
Item 1. Report to Stockholders: |
| The following is a copy of the report transmitted to stockholders pursuant to Rule 30e-1 under the Investment Company Act of 1940: | |||
Putnam
Income Strategies
Portfolio
Semiannual report
2 | 28 | 22
Message from the Trustees
April 6, 2022
Dear Fellow Shareholder:
Financial markets have been bumpy in recent months. Investors are weighing the risks of rising inflation, changes in Federal Reserve policy, the latest Covid-19 variants, and the global impact of the Russia-Ukraine conflict.
In times like these, it’s worth remembering the benefits of staying focused on your long-term financial goals. At Putnam, professional, active investors are working for you. They are monitoring risks while looking for strong potential investments for your fund. Learn more in the interview with your fund manager(s) in the following pages.
Thank you for investing with Putnam.


Current performance may be lower or higher than the quoted past performance, which cannot guarantee future results. Share price, principal value, and return will fluctuate, and you may have a gain or a loss when you sell your shares. Performance of fund shares assumes reinvestment of distributions and does not account for taxes. The fund’s shares have no initial sales charge or contingent deferred sales charge. See below and pages 8–9 for additional performance information. For a portion of the periods, the fund had expense limitations, without which returns would have been lower. To obtain the most recent month-end performance, call 1-800-225-1581 toll free.
Returns for periods of less than one year are not annualized.
All Bloomberg indices are provided by Bloomberg Index Services Limited.
* Putnam Income Strategies Blended Benchmark is an unmanaged index administered by Putnam Management, 55% of which is the Bloomberg U.S. Aggregate Bond Index, 21% of which is the Russell 3000 Index, 14% of which is the JPMorgan Developed High Yield Index, 6% of which is the ICE BofA U.S. Treasury Bill Index, and 4% of which is the MSCI EAFE Index (ND).
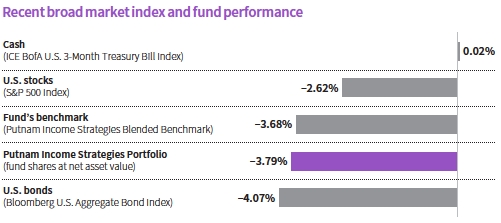
This comparison shows your fund’s performance in the context of broad market indexes for the six months ended 2/28/22. See above and pages 8–9 for additional fund performance information. Index descriptions can be found on page 13.
All Bloomberg indices are provided by Bloomberg Index Services Limited.
| 2 Income Strategies Portfolio |


How were market conditions during the six-month period ended February 28, 2022?
Global financial markets retreated during the period amid increasing headwinds. Early in the period, a recovering global economy, the lifting of mobility restrictions in many countries, and fiscal stimulus supported equities. However, stocks and other risk assets came under pressure due to the spread of Covid-19 variants, rising interest rates, and surging inflation driven by supply chain disruptions and skyrocketing commodity prices. In the final days of the period, stocks plummeted following Russia’s invasion of Ukraine and discussions by Western countries to sanction Russia. The S&P 500 Index, a broad measure of U.S. stock performance, returned –2.62%. International stocks, as measured by the MSCI EAFE Index [ND], returned –6.78%.
Fixed income assets finished the period lower as well. U.S. Treasury bond yields moved higher in response to inflation fears and the Federal Reserve’s increasingly hawkish communications. [Bond prices move inversely to interest rates.] In December 2021, the Fed pivoted toward tighter monetary policy, announcing plans to end its bond-buying stimulus program in March 2022. At its January 2022 policy
| Income Strategies Portfolio 3 |

Allocations are shown as a percentage of the fund’s net assets as of 2/28/22. Cash and net other assets, if any, represent the market value weights of cash, derivatives, short-term securities, and other unclassified assets in the portfolio. Summary information may differ from the portfolio schedule included in the financial statements due to the inclusion of derivative securities, any interest accruals, the exclusion of as-of trades, if any, the use of different classifications of securities for presentation purposes, and rounding. Holdings and allocations may vary over time.

This table shows the fund’s top 10 individual holdings and the percentage of the fund’s net assets that each represented as of 2/28/22. Short-term investments and derivatives, if any, are excluded. Holdings may vary over time.
| 4 Income Strategies Portfolio |
meeting, the Fed indicated it was on track to initiate the first in a series of interest-rate hikes in March 2022. Other global central banks also began scaling back stimulus measures. The European Central Bank further reduced its bond purchases under the Pandemic Emergency Purchase Program, with plans to end the program in March 2022.
Toward period-end, U.S. Treasury bond yields fell slightly and prices rose, as investors piled into perceived safe-haven assets after the United States and its allies imposed unprecedented economic sanctions on Russia. The interest-rate-sensitive Bloomberg U.S. Aggregate Bond Index, a measure of investment-grade fixed income securities, returned –4.07% for the period. The yield on 10-year U.S. Treasury notes, which helps set borrowing costs on everything from mortgages to corporate debt, rose from 1.30% on August 31, 2021, to 1.83% at period-end on February 28, 2022.
How did the fund perform during the reporting period? Could you summarize the fund’s investment strategies?
The fund posted a return of –3.79% for the six-month period ended February 28, 2022, slightly trailing its benchmark, the Putnam Income Strategies Blended Benchmark, which returned –3.68%. Benchmark performance reflected weakness across global fixed income and equity markets.
The fund invests in a combination of bonds and common stocks of U.S. and non-U.S. companies. The target allocation for the portfolio is 25% stocks and 75% bonds, which can also be achieved through derivative exposure. The fund can invest in bonds, including mortgage-backed investments,
ABOUT DERIVATIVES
Derivatives are an increasingly common type of investment instrument, the performance of which is derived from an underlying security, index, currency, or other area of the capital markets. Derivatives employed by the fund’s managers generally serve one of two main purposes: to implement a strategy that may be difficult or more expensive to invest in through traditional securities, or to hedge unwanted risk associated with a particular position.
For example, the fund’s managers might use currency forward contracts to capitalize on an anticipated change in exchange rates between two currencies. This approach would require a significantly smaller outlay of capital than purchasing traditional bonds denominated in the underlying currencies. In another example, the managers may identify a bond that they believe is undervalued relative to its risk of default, but may seek to reduce the interest-rate risk of that bond by using interest-rate swaps, a derivative through which two parties “swap” payments based on the movement of certain rates. In other examples, the managers may use options and futures contracts to hedge against a variety of risks by establishing a combination of long and short exposures to specific equity markets or sectors.
Like any other investment, derivatives may not appreciate in value and may lose money. Derivatives may amplify traditional investment risks through the creation of leverage and may be less liquid than traditional securities. And because derivatives typically represent contractual agreements between two financial institutions, derivatives entail “counterparty risk,” which is the risk that the other party is unable or unwilling to pay. Putnam monitors the counterparty risks we assume. For example, Putnam often enters into collateral agreements that require the counterparties to post collateral on a regular basis to cover their obligations to the fund. Counterparty risk for exchange-traded futures and centrally cleared swaps is mitigated by the daily exchange of margin and other safeguards against default through their respective clearinghouses.
| Income Strategies Portfolio 5 |
with short- to long-term maturities that can be either investment grade or below investment grade in quality. In equities, the fund invests in companies of any size, including growth and value stocks.
What strategies contributed to relative performance, and what detracted?
Overall, our asset allocation decisions slightly improved benchmark-relative performance. The portfolio saw a modest gain from its equity positioning during the six-month period. We held a neutral position to equity risk for most of the period until we moved slightly overweight relative to the benchmark in late January 2022. From this point through the balance of the period, we shifted the equity position between neutral and slightly overweight as different tactical opportunities arose. The portfolio also experienced a small gain from its slight underweight position to interest-rate risk when interest rates moved higher due to rising inflation and the Fed shifted toward tighter monetary policy. Given market conditions, we moved the position to neutral at the beginning of February 2022. Our credit position was closely aligned with the benchmark throughout the period and did not have a significant impact on performance.
Active implementation slightly weakened benchmark-relative performance. Security selection within high yield and global fixed income detracted from performance during the six-month period.
How did the fund use derivatives during the reporting period?
The fund used futures contracts to manage exposure to market risk and to equitize cash. The fund employed total return swaps to hedge sector exposure, to gain and manage exposure to specific sectors or industries, and to manage exposure to specific securities. The fund also used total return swaps to gain exposure to both a basket of securities and to specific markets or countries.
What is your near-term outlook for the markets?
The first few months of calendar 2022 saw significant volatility. Rising inflation, supply

This chart shows how the fund’s top weightings have changed over the past six months. Allocations are shown as a percentage of the fund’s net assets. Current period summary information may differ from the portfolio schedule included in the financial statements due to the inclusion of derivative securities, any interest accruals, the exclusion of as-of trades, if any, the use of different classifications of securities for presentation purposes, and rounding. Holdings and allocations may vary over time.
| 6 Income Strategies Portfolio |
chain disruptions, monetary tightening, and Russia’s invasion of Ukraine fueled sell-offs in stocks and bonds. Looking ahead, we expect volatility to persist and market sentiment to wane as these issues continue to plague markets with no clear resolutions in sight.
Given this backdrop, our outlook on equities is modestly bearish. This view is supported by rising interest rates, a slightly bearish reading from our quantitative model, and concerning developments in Ukraine. These developments indicate we may still be in the early stages of this conflict, in our opinion.
In fixed income, our view on credit is also modestly bearish. Assuming we have moved beyond the pandemic, it’s likely that the United States emerges very close to where it was in the credit cycle in late 2019 before the pandemic began. We also believe the high-yield index has reached peak credit quality and is not likely to improve from here. Our outlook on rate-sensitive fixed income is neutral. Yields have moved higher due to a significant and possibly overdone shift in Fed expectations, in our view. At the end of 2021, markets had priced in three interest-rate hikes for 2022. By the end of the reporting period, markets had more than five rate hikes priced in. We expect a balanced distribution of outcomes moving forward. Against this backdrop, we continue to have conviction in our investment strategies given our ability to adapt the portfolio to changing market conditions.
Thank you, Jason, for your time and insights today.
The views expressed in this report are exclusively those of Putnam Management and are subject to change. They are not meant as investment advice.
Please note that the holdings discussed in this report may not have been held by the fund for the entire period. Portfolio composition is subject to review in accordance with the fund’s investment strategy and may vary in the future. Current and future portfolio holdings are subject to risk.
| Income Strategies Portfolio 7 |
Your fund’s performance
This section shows your fund’s performance, price, and distribution information for periods ended February 28, 2022, the end of the first half of its current fiscal year. In accordance with regulatory requirements for mutual funds, we also include performance information as of the most recent calendar quarter-end and expense information taken from the fund’s current private placement memorandum (PPM). Performance should always be considered in light of a fund’s investment strategy. Data represent past performance. Past performance does not guarantee future results. More recent returns may be less or more than those shown. Investment return and principal value will fluctuate, and you may have a gain or a loss when you sell your shares. Performance information does not reflect any deduction for taxes a shareholder may owe on fund distributions or on the redemption of fund shares. For the most recent month-end performance, call Putnam at 1-800-225-1581. The fund’s shares are not available to all investors. See the Terms and definitions section in this report for a description of the fund’s shares.
Fund performance Total return for periods ended 2/28/22
| Life of fund | Annual average | 1 year | 6 months | |
| The Fund (12/31/19) | ||||
| Net asset value | 10.74% | 4.82% | 2.21% | –3.79% |
Current performance may be lower or higher than the quoted past performance, which cannot guarantee future results. The fund’s shares have no initial sales charge or CDSC.
For a portion of the periods, the fund had expense limitations, without which returns would have been lower.
Comparative index returns For periods ended 2/28/22
| Life of fund | Annual average | 1 year | 6 months | |
| Putnam Income Strategies | ||||
| Blended Benchmark* | 11.24% | 5.04% | 1.40% | –3.68% |
Index results should be compared with fund performance at net asset value.
All Bloomberg indices are provided by Bloomberg Index Services Limited.
* Putnam Income Strategies Blended Benchmark is an unmanaged index administered by Putnam Management, 55% of which is the Bloomberg U.S. Aggregate Bond Index, 21% of which is the Russell 3000 Index, 14% of which is the JPMorgan Developed High Yield Index, 6% of which is the ICE BofA U.S. Treasury Bill Index, and 4% of which is the MSCI EAFE Index (ND).
| 8 Income Strategies Portfolio |
Fund price and distribution information For the six-month period ended 2/28/22
| Distributions | The Fund |
| Number | 6 |
| Income | $0.062 |
| Capital gains | |
| Long-term gains | 0.099 |
| Short-term gains | 0.277 |
| Total | $0.438 |
| Net | |
| asset | |
| Share value | value |
| 8/31/21 | $11.28 |
| 2/28/22 | 10.43 |
The classification of distributions, if any, is an estimate. Final distribution information will appear on your year-end tax forms.
Fund performance as of most recent calendar quarter Total return for periods ended 3/31/22
| Life of fund | Annual average | 1 year | 6 months | |
| The Fund (12/31/19) | ||||
| Net asset value | 9.82% | 4.25% | 0.66% | –2.72% |
See the discussion following the fund performance table on page 8 for information about the calculation of fund performance.
| Income Strategies Portfolio 9 |
Your fund’s expenses
As a mutual fund investor, you pay ongoing expenses, such as management fees, distribution fees (12b-1 fees), and other expenses. In the most recent six-month period, your fund’s expenses were limited; had expenses not been limited, they would have been higher. Using the following information, you can estimate how these expenses affect your investment and compare them with the expenses of other funds. You may also pay one-time transaction expenses, including sales charges (loads) and redemption fees, which are not shown in this section and would have resulted in higher total expenses. For more information, see your fund’s private placement memorandum or talk to your financial representative.
Expense ratios
| Fund | |
| Net expenses for the fiscal year ended 8/31/21*† | 0.23% |
| Total annual operating expenses for the fiscal year ended 8/31/21* | 0.84% |
| Annualized expense ratio for the six-month period ended 2/28/22 | 0.20% |
Fiscal year expense information in this table is taken from the most recent private placement memorandum, is subject to change, and may differ from that shown for the annualized expense ratio and in the financial highlights of this report.
Private placement memorandum expense information also includes the impact of acquired fund fees and expenses of 0.03%, which is not included in the financial highlights or annualized expense ratio. Expenses are shown as a percentage of average net assets.
* Restated to reflect current fees.
† Reflects Putnam Management’s contractual obligation to limit certain fund expenses through 12/30/22.
Expenses per $1,000
The following table shows the expenses you would have paid on a $1,000 investment in the fund from 9/1/21 to 2/28/22. It also shows how much a $1,000 investment would be worth at the close of the period, assuming actual returns and expenses.
| Fund | |
| Expenses paid per $1,000*† | $0.97 |
| Ending value (after expenses) | $962.10 |
* Expenses are calculated using the fund’s annualized expense ratio, which represents the ongoing expenses as a percentage of average net assets for the six months ended 2/28/22.
† Expenses are calculated by multiplying the expense ratio by the average account value for the period; then multiplying the result by the number of days in the period (181); and then dividing that result by the number of days in the year (365).
| 10 Income Strategies Portfolio |
Estimate the expenses you paid
To estimate the ongoing expenses you paid for the six months ended 2/28/22, use the following calculation method. To find the value of your investment on 9/1/21, call Putnam at 1-800-225-1581.

Compare expenses using the SEC’s method
The Securities and Exchange Commission (SEC) has established guidelines to help investors assess fund expenses. Per these guidelines, the following table shows your fund’s expenses based on a $1,000 investment, assuming a hypothetical 5% annualized return. You can use this information to compare the ongoing expenses (but not transaction expenses or total costs) of investing in the fund with those of other funds. All mutual fund shareholder reports will provide this information to help you make this comparison. Please note that you cannot use this information to estimate your actual ending account balance and expenses paid during the period.
| Fund | |
| Expenses paid per $1,000*† | $1.00 |
| Ending value (after expenses) | $1,023.80 |
* Expenses are calculated using the fund’s annualized expense ratio, which represents the ongoing expenses as a percentage of average net assets for the six months ended 2/28/22.
† Expenses are calculated by multiplying the expense ratio by the average account value for the six-month period; then multiplying the result by the number of days in the six-month period (181); and then dividing that result by the number of days in the year (365).
| Income Strategies Portfolio 11 |
Consider these risks before investing
Allocation of assets among asset classes may hurt performance. The value of investments in the fund’s portfolio may fall or fail to rise over extended periods of time for a variety of reasons, including general economic, political, or financial market conditions; investor sentiment and market perceptions; government actions; geopolitical events or changes; and factors related to a specific issuer, asset class, geography, industry, or sector. These and other factors may lead to increased volatility and reduced liquidity in the fund’s portfolio holdings. International investing involves currency, economic, and political risks. If the quantitative models or data that are used in managing the fund prove to be incorrect or incomplete, investment decisions made in reliance on the models or data may not produce the desired results and the fund may realize losses.
Emerging market securities carry illiquidity and volatility risks. Investments in small and/or midsize companies increase the risk of greater price fluctuations. Growth stocks may be more susceptible to earnings disappointments, and value stocks may fail to rebound. Funds that invest in government securities are not guaranteed. Mortgage-backed investments, unlike traditional debt investments, are also subject to prepayment risk, which means that they may increase in value less than other bonds when interest rates decline and decline in value more than other bonds when interest rates rise. Bond investments are subject to interest-rate risk (the risk of bond prices falling if interest rates rise) and credit risk (the risk of an issuer defaulting on interest or principal payments). Default risk is generally higher for non-qualified mortgages. Interest-rate risk is generally greater for longer-term bonds, and credit risk is generally greater for below-investment-grade bonds. Unlike bonds, funds that invest in bonds have fees and expenses.
Our investment techniques, analyses, and judgments may not produce the intended outcome, and the investments we select for the fund may not perform as well as other securities that were not selected for the fund. We, or the fund’s other service providers, may experience disruptions or operating errors that could negatively impact the fund. The use of derivatives may increase these risks by increasing investment exposure (which may be considered leverage) or, in the case of over-the-counter instruments, because of the potential inability to terminate or sell derivatives positions and the potential failure of the other party to the instrument to meet its obligations. You can lose money by investing in the fund.
| 12 Income Strategies Portfolio |
Terms and definitions
Important terms
Total return shows how the value of the fund’s shares changed over time, assuming you held the shares through the entire period and reinvested all distributions in the fund.
Net asset value (NAV) is the price, or value, of one share of a mutual fund, without a sales charge. Net asset values fluctuate with market conditions. They are calculated by dividing the net assets of the class of shares by the number of outstanding shares in the class.
Share class
The fund’s shares require no minimum initial investment amount and no minimum subsequent investment amount. There is no initial or deferred sales charge. They are only available to Putnam fund of funds.
Comparative indexes
Bloomberg U.S. Aggregate Bond Index is an unmanaged index of U.S. investment-grade fixed-income securities.
ICE BofA (Intercontinental Exchange Bank of America) U.S. 3-Month Treasury Bill Index is an unmanaged index that seeks to measure the performance of U.S. Treasury bills available in the marketplace.
ICE BofA U.S. Treasury Bill Index is an unmanaged index that tracks the performance of U.S. dollar-denominated U.S. Treasury bills publicly issued in the U.S. domestic market. Qualifying securities must have a remaining term of at least one month to final maturity and a minimum amount outstanding of $1 billion.
JPMorgan Developed High Yield Index is an unmanaged index of high-yield fixed-income securities issued in developed countries.
MSCI EAFE Index (ND) is an unmanaged index of equity securities from developed countries in Western Europe, the Far East, and Australasia. Calculated with net dividends (ND), this total return index reflects the reinvestment of dividends after the deduction of withholding taxes, using a tax rate applicable to non-resident institutional investors who do not benefit from double taxation treaties.
Putnam Income Strategies Blended Benchmark is an unmanaged index administered by Putnam Management, 55% of which is the Bloomberg U.S. Aggregate Bond Index, 21% of which is the Russell 3000® Index, 14% of which is the JPMorgan Developed High Yield Index, 6% of which is the ICE BofA U.S. Treasury Bill Index, and 4% of which is the MSCI EAFE Index (ND).
Russell 3000® Index is an unmanaged index of the 3,000 largest U.S. companies.
S&P 500® Index is an unmanaged index of common stock performance.
Indexes assume reinvestment of all distributions and do not account for fees. Securities and performance of a fund and an index will differ. You cannot invest directly in an index.
BLOOMBERG® is a trademark and service mark of Bloomberg Finance L.P. and its affiliates (collectively “Bloomberg”). Bloomberg or Bloomberg’s licensors own all proprietary rights in the Bloomberg Indices. Neither Bloomberg nor Bloomberg’s licensors approve or endorse this material, or guarantee the accuracy or completeness of any information herein, or make any warranty, express or implied, as to the results to be obtained therefrom, and to the maximum extent allowed by law, neither shall have any liability or responsibility for injury or damages arising in connection therewith.
Frank Russell Company is the source and owner of the trademarks, service marks, and copyrights related to the Russell Indexes. Russell® is a trademark of Frank Russell Company.
ICE Data Indices, LLC (“ICE BofA”), used with permission. ICE BofA permits use of the ICE BofA indices and related data on an “as is” basis; makes no warranties regarding same; does not guarantee the suitability, quality, accuracy, timeliness, and/or completeness of the ICE BofA indices or any data included in, related to, or derived therefrom; assumes no liability in connection with the use of the foregoing; and does not sponsor, endorse, or recommend Putnam Investments, or any of its products or services.
| Income Strategies Portfolio 13 |
Other information for shareholders
Important notice regarding delivery of shareholder documents
In accordance with Securities and Exchange Commission (SEC) regulations, Putnam sends a single notice of internet availability, or a single printed copy, of annual and semiannual shareholder reports, prospectuses, and proxy statements to Putnam shareholders who share the same address, unless a shareholder requests otherwise. If you prefer to receive your own copy of these documents, please call Putnam at 1-800-225-1581, and Putnam will begin sending individual copies within 30 days.
Proxy voting
Putnam is committed to managing our mutual funds in the best interests of our shareholders. The Putnam funds’ proxy voting guidelines and procedures, as well as information regarding how your fund voted proxies relating to portfolio securities during the 12-month period ended June 30, 2021, are available on the SEC’s website, www.sec.gov. If you have questions about finding forms on the SEC’s website, you may call the SEC at 1-800-SEC-0330. You may also obtain the Putnam funds’ proxy voting guidelines and procedures at no charge by calling Putnam’s Shareholder Services at 1-800-225-1581.
Fund portfolio holdings
The fund will file a complete schedule of its portfolio holdings with the SEC for the first and third quarters of each fiscal year on Form N-PORT within 60 days of the end of such fiscal quarter. Shareholders may obtain the fund’s Form N-PORT on the SEC’s website at www.sec.gov.
Prior to its use of Form N-PORT, the fund filed its complete schedule of its portfolio holdings with the SEC on Form N-Q, which is available online at www.sec.gov.
Trustee and employee fund ownership
Putnam employees and members of the Board of Trustees place their faith, confidence, and, most importantly, investment dollars in Putnam mutual funds. As of February 28, 2022, Putnam employees had approximately $526,000,000 and the Trustees had approximately $77,000,000 invested in Putnam mutual funds. These amounts include investments by the Trustees’ and employees’ immediate family members as well as investments through retirement and deferred compensation plans.
| 14 Income Strategies Portfolio |
Financial statements
These sections of the report, as well as the accompanying Notes, constitute the fund’s financial statements.
The fund’s portfolio lists all the fund’s investments and their values as of the last day of the reporting period. Holdings are organized by asset type and industry sector, country, or state to show areas of concentration and diversification.
Statement of assets and liabilities shows how the fund’s net assets and share price are determined. All investment and non-investment assets are added together. Any unpaid expenses and other liabilities are subtracted from this total. The result is divided by the number of shares to determine the net asset value per share. (For funds with preferred shares, the amount subtracted from total assets includes the liquidation preference of preferred shares.)
Statement of operations shows the fund’s net investment gain or loss. This is done by first adding up all the fund’s earnings — from dividends and interest income — and subtracting its operating expenses to determine net investment income (or loss). Then, any net gain or loss the fund realized on the sales of its holdings — as well as any unrealized gains or losses over the period — is added to or subtracted from the net investment result to determine the fund’s net gain or loss for the fiscal period.
Statement of changes in net assets shows how the fund’s net assets were affected by the fund’s net investment gain or loss, by distributions to shareholders, and by changes in the number of the fund’s shares. It lists distributions and their sources (net investment income or realized capital gains) over the current reporting period and the most recent fiscal year-end. The distributions listed here may not match the sources listed in the Statement of operations because the distributions are determined on a tax basis and may be paid in a different period from the one in which they were earned. Dividend sources are estimated at the time of declaration. Actual results may vary. Any non-taxable return of capital cannot be determined until final tax calculations are completed after the end of the fund’s fiscal period.
Financial highlights provide an overview of the fund’s investment results, per-share distributions, expense ratios, net investment income ratios, and portfolio turnover in one summary table, reflecting the five most recent reporting periods. In a semiannual report, the highlights table also includes the current reporting period.
| Income Strategies Portfolio 15 |
| The fund’s portfolio 2/28/22 (Unaudited) | ||
| COMMON STOCKS (30.9%)* | Shares | Value |
| Basic materials (0.7%) | ||
| Avery Dennison Corp. | 67 | $11,805 |
| Axalta Coating Systems, Ltd. † | 181 | 4,894 |
| Celanese Corp. | 36 | 5,014 |
| Corteva, Inc. | 129 | 6,712 |
| Dow, Inc. | 90 | 5,306 |
| DuPont de Nemours, Inc. | 660 | 51,064 |
| Freeport-McMoRan, Inc. (Indonesia) | 133 | 6,244 |
| Olin Corp. | 112 | 5,769 |
| WestRock Co. | 125 | 5,659 |
| Weyerhaeuser Co. R | 578 | 22,473 |
| 124,940 | ||
| Capital goods (1.9%) | ||
| Acuity Brands, Inc. | 57 | 10,395 |
| AGCO Corp. | 122 | 14,660 |
| Allegion PLC (Ireland) | 120 | 13,742 |
| Axon Enterprise, Inc. † | 43 | 6,031 |
| Carrier Global Corp. | 126 | 5,655 |
| Caterpillar, Inc. | 26 | 4,877 |
| Clean Harbors, Inc. † | 59 | 5,630 |
| Crown Holdings, Inc. | 37 | 4,539 |
| Cummins, Inc. | 29 | 5,919 |
| Deere & Co. | 94 | 33,842 |
| Donaldson Co., Inc. | 94 | 5,101 |
| Dover Corp. | 30 | 4,706 |
| Eaton Corp. PLC | 37 | 5,709 |
| Emerson Electric Co. | 105 | 9,757 |
| Fortive Corp. | 495 | 32,051 |
| General Dynamics Corp. | 179 | 41,967 |
| Graco, Inc. | 83 | 5,983 |
| HEICO Corp. | 41 | 6,048 |
| Honeywell International, Inc. | 76 | 14,421 |
| Johnson Controls International PLC | 272 | 17,669 |
| Lockheed Martin Corp. | 64 | 27,763 |
| Nordson Corp. | 42 | 9,513 |
| Parker Hannifin Corp. | 19 | 5,631 |
| Republic Services, Inc. | 188 | 22,613 |
| Textron, Inc. | 209 | 15,284 |
| Toro Co. (The) | 61 | 5,722 |
| 335,228 | ||
| Communication services (0.9%) | ||
| American Tower Corp. R | 28 | 6,352 |
| AT&T, Inc. | 2,160 | 51,170 |
| Comcast Corp. Class A | 545 | 25,484 |
| Crown Castle International Corp. R | 179 | 29,820 |
| Verizon Communications, Inc. | 778 | 41,755 |
| 154,581 |
16 Income Strategies Portfolio | |
| COMMON STOCKS (30.9%)* cont. | Shares | Value |
| Communications equipment (—%) | ||
| Ciena Corp. † | 89 | $6,089 |
| 6,089 | ||
| Computers (3.4%) | ||
| Apple, Inc. | 2,211 | 365,080 |
| Cisco Systems, Inc./Delaware | 1,051 | 58,614 |
| Dropbox, Inc. Class A † | 255 | 5,786 |
| Fortinet, Inc. † | 120 | 41,342 |
| Nuance Communications, Inc. † | 102 | 5,663 |
| Roper Technologies, Inc. | 13 | 5,827 |
| ServiceNow, Inc. † | 11 | 6,379 |
| Snowflake, Inc. Class A † | 194 | 51,538 |
| SS&C Technologies Holdings, Inc. | 75 | 5,623 |
| Synopsys, Inc. † | 162 | 50,607 |
| 596,459 | ||
| Conglomerates (0.2%) | ||
| 3M Co. | 32 | 4,757 |
| AMETEK, Inc. | 235 | 30,501 |
| 35,258 | ||
| Consumer cyclicals (4.3%) | ||
| Amazon.com, Inc. † | 60 | 184,276 |
| AutoZone, Inc. † | 28 | 52,175 |
| Booking Holdings, Inc. † | 2 | 4,345 |
| Cintas Corp. | 16 | 6,005 |
| Dolby Laboratories, Inc. Class A | 75 | 5,633 |
| Expedia Group, Inc. † | 29 | 5,687 |
| FactSet Research Systems, Inc. | 14 | 5,685 |
| FleetCor Technologies, Inc. † | 23 | 5,387 |
| Ford Motor Co. | 3,293 | 57,825 |
| Gartner, Inc. † | 116 | 32,529 |
| Genuine Parts Co. | 99 | 12,094 |
| Interpublic Group of Cos., Inc. (The) | 336 | 12,365 |
| Liberty Media Corp.-SiriusXM Series A † | 111 | 5,590 |
| Lowe’s Cos., Inc. | 25 | 5,527 |
| Marriott International, Inc./MD Class A † | 215 | 36,580 |
| Mastercard, Inc. Class A | 8 | 2,887 |
| New York Times Co. (The) Class A | 128 | 5,631 |
| News Corp. Class A | 253 | 5,647 |
| O’Reilly Automotive, Inc. † | 80 | 51,939 |
| PayPal Holdings, Inc. † | 103 | 11,529 |
| Rivian Automotive, Inc. Class A † | 111 | 7,499 |
| Ross Stores, Inc. | 63 | 5,758 |
| S&P Global, Inc. | 15 | 5,545 |
| Tapestry, Inc. | 678 | 27,730 |
| Target Corp. | 263 | 52,540 |
| Tesla, Inc. † | 40 | 34,817 |
| Toll Brothers, Inc. | 105 | 5,697 |
| Travel + Leisure Co. | 96 | 5,381 |
| Vail Resorts, Inc. | 21 | 5,472 |
| Walmart, Inc. | 668 | 90,287 |
Income Strategies Portfolio 17 | |
| COMMON STOCKS (30.9%)* cont. | Shares | Value |
| Consumer cyclicals cont. | ||
| Walt Disney Co. (The) † | 37 | $5,493 |
| Wyndham Hotels & Resorts, Inc. | 79 | 6,826 |
| 762,381 | ||
| Consumer staples (2.1%) | ||
| Coca-Cola Co. (The) | 938 | 58,381 |
| Colgate-Palmolive Co. | 658 | 50,633 |
| Copart, Inc. † | 179 | 21,996 |
| Costco Wholesale Corp. | 12 | 6,231 |
| Hershey Co. (The) | 28 | 5,663 |
| ManpowerGroup, Inc. | 68 | 7,227 |
| McDonald’s Corp. | 204 | 49,933 |
| Netflix, Inc. † | 15 | 5,918 |
| PepsiCo, Inc. | 86 | 14,082 |
| Philip Morris International, Inc. | 659 | 66,605 |
| Procter & Gamble Co. (The) | 334 | 52,067 |
| Starbucks Corp. | 195 | 17,899 |
| Tyson Foods, Inc. Class A | 72 | 6,672 |
| Uber Technologies, Inc. † | 163 | 5,873 |
| Wendy’s Co. (The) | 247 | 5,617 |
| 374,797 | ||
| Electronics (1.7%) | ||
| Advanced Micro Devices, Inc. † | 49 | 6,044 |
| Agilent Technologies, Inc. | 165 | 21,509 |
| Cirrus Logic, Inc. † | 63 | 5,473 |
| Garmin, Ltd. | 159 | 17,560 |
| Intel Corp. | 114 | 5,438 |
| Monolithic Power Systems, Inc. | 13 | 5,963 |
| National Instruments Corp. | 141 | 5,661 |
| NVIDIA Corp. | 612 | 149,236 |
| Qualcomm, Inc. | 523 | 89,951 |
| 306,835 | ||
| Energy (0.8%) | ||
| APA Corp. | 175 | 6,235 |
| Chevron Corp. | 223 | 32,112 |
| ConocoPhillips | 62 | 5,881 |
| Exxon Mobil Corp. | 533 | 41,798 |
| Halliburton Co. | 519 | 17,402 |
| Marathon Oil Corp. | 266 | 6,001 |
| Marathon Petroleum Corp. | 174 | 13,549 |
| Phillips 66 | 101 | 8,508 |
| Targa Resources Corp. | 288 | 18,827 |
| 150,313 | ||
| Financials (4.2%) | ||
| Ally Financial, Inc. | 574 | 28,643 |
| American Campus Communities, Inc. R | 113 | 6,081 |
| American Financial Group, Inc. | 42 | 5,686 |
| American International Group, Inc. | 95 | 5,818 |
| Ameriprise Financial, Inc. | 114 | 34,176 |
| Apartment Income REIT Corp. R | 54 | 2,787 |
18 Income Strategies Portfolio | |
| COMMON STOCKS (30.9%)* cont. | Shares | Value |
| Financials cont. | ||
| Apollo Global Management, Inc. | 91 | $5,939 |
| AvalonBay Communities, Inc. R | 20 | 4,772 |
| Berkshire Hathaway, Inc. Class B † | 27 | 8,679 |
| BlackRock, Inc. | 7 | 5,207 |
| Blackstone, Inc. | 47 | 5,991 |
| Brixmor Property Group, Inc. R | 219 | 5,501 |
| Capital One Financial Corp. | 49 | 7,510 |
| Carlyle Group, Inc. (The) | 121 | 5,671 |
| CBRE Group, Inc. Class A † | 245 | 23,728 |
| Chubb, Ltd. | 28 | 5,702 |
| Citigroup, Inc. | 1,157 | 68,529 |
| CubeSmart R | 366 | 17,645 |
| Discover Financial Services | 34 | 4,197 |
| East West Bancorp, Inc. | 144 | 12,609 |
| Equitable Holdings, Inc. | 832 | 27,173 |
| Equity Lifestyle Properties, Inc. R | 64 | 4,776 |
| Evercore, Inc. Class A | 46 | 5,842 |
| Fidelity National Financial, Inc. | 281 | 13,387 |
| First Industrial Realty Trust, Inc. R | 99 | 5,700 |
| Gaming and Leisure Properties, Inc. R | 202 | 9,173 |
| Goldman Sachs Group, Inc. (The) | 235 | 80,203 |
| Invitation Homes, Inc. R | 129 | 4,876 |
| Jones Lang LaSalle, Inc. † | 49 | 12,065 |
| JPMorgan Chase & Co. | 815 | 115,567 |
| Lamar Advertising Co. Class A R | 83 | 9,052 |
| Life Storage, Inc. R | 127 | 16,077 |
| LPL Financial Holdings, Inc. | 32 | 5,790 |
| Marsh & McLennan Cos., Inc. | 43 | 6,683 |
| MetLife, Inc. | 899 | 60,727 |
| MGIC Investment Corp. | 364 | 5,526 |
| New Residential Investment Corp. R | 537 | 5,574 |
| Old Republic International Corp. | 215 | 5,665 |
| OneMain Holdings, Inc. | 108 | 5,506 |
| Orion Office REIT, Inc. † R | 181 | 3,082 |
| PNC Financial Services Group, Inc. (The) | 28 | 5,579 |
| Popular, Inc. (Puerto Rico) | 62 | 5,695 |
| Prologis, Inc. R | 39 | 5,688 |
| Public Storage R | 18 | 6,390 |
| Reinsurance Group of America, Inc. | 50 | 5,543 |
| SEI Investments Co. | 93 | 5,448 |
| Simon Property Group, Inc. R | 58 | 7,978 |
| SLM Corp. | 591 | 11,643 |
| Starwood Property Trust, Inc. R | 234 | 5,579 |
| SVB Financial Group † | 10 | 6,060 |
| Synchrony Financial | 79 | 3,380 |
| Unum Group | 252 | 7,036 |
| W.R. Berkley Corp. | 64 | 5,779 |
| Wells Fargo & Co. | 97 | 5,177 |
| 754,290 |
Income Strategies Portfolio 19 | |
| COMMON STOCKS (30.9%)* cont. | Shares | Value |
| Health care (3.9%) | ||
| Abbott Laboratories | 634 | $76,473 |
| AbbVie, Inc. | 332 | 49,060 |
| ABIOMED, Inc. † | 19 | 5,904 |
| Align Technology, Inc. † | 8 | 4,092 |
| AmerisourceBergen Corp. | 40 | 5,701 |
| Amgen, Inc. | 25 | 5,662 |
| Anthem, Inc. | 14 | 6,326 |
| Baxter International, Inc. | 66 | 5,608 |
| Bio-Rad Laboratories, Inc. Class A † | 9 | 5,634 |
| Boston Scientific Corp. † | 132 | 5,830 |
| Bristol-Myers Squibb Co. | 316 | 21,700 |
| Cardinal Health, Inc. | 108 | 5,833 |
| Cigna Corp. | 25 | 5,945 |
| CVS Health Corp. | 55 | 5,701 |
| Edwards Lifesciences Corp. † | 292 | 32,812 |
| Eli Lilly and Co. | 116 | 28,994 |
| Hologic, Inc. † | 180 | 12,811 |
| IDEXX Laboratories, Inc. † | 11 | 5,856 |
| Illumina, Inc. † | 17 | 5,552 |
| Incyte Corp. † | 89 | 6,079 |
| Intuitive Surgical, Inc. † | 20 | 5,807 |
| IQVIA Holdings, Inc. † | 112 | 25,773 |
| Johnson & Johnson | 34 | 5,595 |
| Laboratory Corp. of America Holdings † | 38 | 10,308 |
| McKesson Corp. | 100 | 27,496 |
| Medtronic PLC | 329 | 34,542 |
| Merck & Co., Inc. | 1,279 | 97,946 |
| Moderna, Inc. † | 122 | 18,739 |
| Molina Healthcare, Inc. † | 50 | 15,344 |
| Pfizer, Inc. | 635 | 29,807 |
| Regeneron Pharmaceuticals, Inc. † | 56 | 34,628 |
| Service Corp. International | 89 | 5,416 |
| Teleflex, Inc. | 17 | 5,717 |
| UnitedHealth Group, Inc. | 38 | 18,083 |
| Vertex Pharmaceuticals, Inc. † | 236 | 54,285 |
| 691,059 | ||
| Semiconductor (0.1%) | ||
| Applied Materials, Inc. | 147 | 19,727 |
| KLA Corp. | 16 | 5,576 |
| 25,303 | ||
| Software (2.8%) | ||
| Adobe, Inc. † | 138 | 64,540 |
| Atlassian Corp PLC Class A (Australia) † | 102 | 31,183 |
| Cadence Design Systems, Inc. † | 265 | 40,129 |
| Electronic Arts, Inc. | 39 | 5,074 |
| Intuit, Inc. | 174 | 82,540 |
| Manhattan Associates, Inc. † | 61 | 8,154 |
| Microsoft Corp. | 877 | 262,039 |
| Workday, Inc. Class A † | 21 | 4,810 |
| 498,469 |
20 Income Strategies Portfolio | |
| COMMON STOCKS (30.9%)* cont. | Shares | Value |
| Technology services (2.6%) | ||
| Accenture PLC Class A | 297 | $93,858 |
| Alphabet, Inc. Class A † | 94 | 253,907 |
| DocuSign, Inc. † | 141 | 16,699 |
| eBay, Inc. | 97 | 5,295 |
| Fidelity National Information Services, Inc. | 52 | 4,952 |
| Kyndryl Holdings, Inc. † | 8 | 127 |
| Meta Platforms, Inc. Class A † | 188 | 39,674 |
| Pinterest, Inc. Class A † | 1,049 | 28,061 |
| Roku, Inc. † | 32 | 4,465 |
| Vimeo, Inc. † | 425 | 5,521 |
| Zebra Technologies Corp. Class A † | 32 | 13,227 |
| 465,786 | ||
| Transportation (0.5%) | ||
| CSX Corp. | 1,415 | 47,983 |
| Ryder System, Inc. | 80 | 6,307 |
| Union Pacific Corp. | 81 | 19,922 |
| United Parcel Service, Inc. Class B | 48 | 10,100 |
| 84,312 | ||
| Utilities and power (0.8%) | ||
| AES Corp. (The) | 954 | 20,253 |
| Ameren Corp. | 66 | 5,673 |
| American Electric Power Co., Inc. | 365 | 33,087 |
| DTE Energy Co. | 48 | 5,836 |
| Duke Energy Corp. | 57 | 5,723 |
| Edison International | 94 | 5,961 |
| Exelon Corp. | 99 | 4,213 |
| FirstEnergy Corp. | 144 | 6,026 |
| Kinder Morgan, Inc. | 907 | 15,782 |
| NRG Energy, Inc. | 235 | 8,892 |
| Southern Co. (The) | 308 | 19,949 |
| Xcel Energy, Inc. | 85 | 5,722 |
| 137,117 | ||
| Total common stocks (cost $5,287,515) | $5,503,217 | |
| INVESTMENT COMPANIES (0.2%)* | Shares | Value |
| SPDR S&P 500 ETF Trust | 57 | $24,888 |
| SPDR S&P MidCap 400 ETF Trust | 7 | 3,398 |
| Total investment companies (cost $28,559) | $28,286 | |
| SHORT-TERM INVESTMENTS (69.9%)* | Principal amount | Value | |
| CAFCO, LLC asset-backed commercial paper 0.230%, 4/22/22 | $250,000 | $249,875 | |
| Interest in $262,174,000 joint tri-party repurchase agreement dated 2/28/2022 with BofA Securities, Inc. due 3/1/2022 — maturity value of $9,091,013 for an effective yield of 0.050% (collateralized by Agency Mortgage-Backed Securities with coupon rates ranging from 2.000% to 3.000% and due dates ranging from 6/20/2050 to 8/20/2050, valued at $267,417,480) | 9,091,000 | 9,091,000 | |
| Liberty Street Funding, LLC asset-backed commercial paper 0.140%, 3/1/22 | 250,000 | 249,999 | |
Income Strategies Portfolio 21 | |
| SHORT-TERM INVESTMENTS (69.9%)* cont. | Principal amount/ shares |
Value | |
| Lloyds Bank PLC commercial paper 0.130%, 3/8/22 | $250,000 | $249,996 | |
| MetLife Short Term Funding, LLC asset-backed commercial paper 0.150%, 3/16/22 |
250,000 | 249,991 | |
| NRW.Bank commercial paper 0.180%, 3/1/22 | 250,000 | 250,000 | |
| Putnam Short Term Investment Fund Class P 0.12% L | Shares | 1,250,000 | 1,250,000 |
| Skandinaviska Enskilda Banken AB commercial paper 0.220%, 3/24/22 | $250,000 | 249,977 | |
| U.S. Treasury Bills 0.055%, 5/19/22 # ∆ § | 300,000 | 299,800 | |
| U.S. Treasury Cash Management Bills 0.173%, 5/3/22 ∆ § | 300,000 | 299,879 | |
| Total short-term investments (cost $12,440,735) | $12,440,517 | ||
| TOTAL INVESTMENTS | ||
| Total investments (cost $17,756,809) | $17,972,020 | |
| Key to holding’s abbreviations | |||
| bp | Basis Points | ||
| ETF | Exchange Traded Fund | ||
| OTC | Over-the-counter | ||
| SPDR | S&P Depository Receipts | ||
| Notes to the fund’s portfolio | |||
| Unless noted otherwise, the notes to the fund’s portfolio are for the close of the fund’s reporting period, which ran from September 1, 2021 through February 28, 2022 (the reporting period). Within the following notes to the portfolio, references to “Putnam Management” represent Putnam Investment Management, LLC, the fund’s manager, an indirect wholly-owned subsidiary of Putnam Investments, LLC and references to “ASC 820” represent Accounting Standards Codification 820 Fair Value Measurements and Disclosures. | |||
| * | Percentages indicated are based on net assets of $17,785,097. | ||
| † | This security is non-income-producing. | ||
| # | This security, in part or in entirety, was pledged and segregated with the broker to cover margin requirements for futures contracts at the close of the reporting period. Collateral at period end totaled $127,923 and is included in Investments in securities on the Statement of assets and liabilities (Notes 1 and 8). | ||
| ∆ | This security, in part or in entirety, was pledged and segregated with the custodian for collateral on certain derivative contracts at the close of the reporting period. Collateral at period end totaled $251,875 and is included in Investments in securities on the Statement of assets and liabilities (Notes 1 and 8). | ||
| § | This security, in part or in entirety, was pledged and segregated with the custodian for collateral on the initial margin on certain centrally cleared derivative contracts at the close of the reporting period. Collateral at period end totaled $40,978 and is included in Investments in securities on the Statement of assets and liabilities (Notes 1 and 8). | ||
| L | Affiliated company (Note 5). The rate quoted in the security description is the annualized 7-day yield of the fund at the close of the reporting period. | ||
| R | Real Estate Investment Trust. | ||
| At the close of the reporting period, the fund maintained liquid assets totaling $1,198,425 to cover certain derivative contracts. | |||
| Unless otherwise noted, the rates quoted in Short-term investments security descriptions represent the weighted average yield to maturity. | |||
| The dates shown on debt obligations are the original maturity dates. | |||
22 Income Strategies Portfolio | |
| FUTURES CONTRACTS OUTSTANDING at 2/28/22 (Unaudited) | ||||||
| Number of contracts |
Notional amount |
Value | Expiration date |
Unrealized appreciation/ (depreciation) |
||
| MSCI EAFE Index (Long) | 5 | $544,775 | $539,950 | Mar-22 | $(31,857) | |
| Russell 2000 Index E-Mini (Long) | 2 | 204,809 | 204,450 | Mar-22 | (17,091) | |
| S&P 500 Index E-Mini (Short) | 4 | 874,788 | 873,600 | Mar-22 | 48,296 | |
| U.S. Treasury Note 5 yr (Short) | 7 | 827,969 | 827,969 | Jun-22 | (6,141) | |
| Unrealized appreciation | 48,296 | |||||
| Unrealized (depreciation) | (55,089) | |||||
| Total | $(6,793) | |||||
| CENTRALLY CLEARED INTEREST RATE SWAP CONTRACTS OUTSTANDING at 2/28/22 (Unaudited) | |||||||
| Notional amount | Value | Upfront premium received (paid) |
Termination date |
Payments made by fund |
Payments received by fund |
Unrealized appreciation/ (depreciation) |
|
| $160,000 | $4,694 | $(2) | 1/3/32 | 1.3265% — Annually | Secured Overnight Financing Rate — Annually | $4,328 | |
| Total | $(2) | $4,328 | |||||
| OTC TOTAL RETURN SWAP CONTRACTS OUTSTANDING at 2/28/22 (Unaudited) | |||||||
| Swap counterparty/ Notional amount |
Value | Upfront premium received (paid) |
Termination date |
Payments received (paid) by fund |
Total return received by or paid by fund |
Unrealized appreciation/ (depreciation) |
|
| Citibank, N.A. | |||||||
| $6,348,348 | $6,266,020 | $— | 9/28/22 | (Secured Overnight Financing Rate plus 0.65%) — Monthly | iShares Core U.S. Aggregate Bond ETF — Monthly | $(77,106) | |
| 766,905 | 756,959 | — | 9/28/22 | (Secured Overnight Financing Rate plus 0.65%) — Monthly | iShares Core U.S. Aggregate Bond ETF — Monthly | (9,807) | |
| 576,381 | 568,906 | — | 9/28/22 | (Secured Overnight Financing Rate plus 0.65%) — Monthly | iShares Core U.S. Aggregate Bond ETF — Monthly | (6,956) | |
| 433,146 | 425,990 | — | 9/28/22 | (Secured Overnight Financing Rate plus 0.65%) — Monthly | iShares Core U.S. Aggregate Bond ETF — Monthly | (6,802) | |
| 214,116 | 211,339 | — | 9/28/22 | (Secured Overnight Financing Rate plus 0.65%) — Monthly | iShares Core U.S. Aggregate Bond ETF — Monthly | (2,584) | |
Income Strategies Portfolio 23 | |
| OTC TOTAL RETURN SWAP CONTRACTS OUTSTANDING at 2/28/22 (Unaudited) cont. | |||||||
| Swap counterparty/ Notional amount |
Value | Upfront premium received (paid) |
Termination date |
Payments received (paid) by fund |
Total return received by or paid by fund |
Unrealized appreciation/ (depreciation) |
|
| Citibank, N.A. cont. | |||||||
| $195,891 | $193,351 | $— | 9/28/22 | (Secured Overnight Financing Rate plus 0.65%) — Monthly | iShares Core U.S. Aggregate Bond ETF — Monthly | $(2,364) | |
| 156,199 | 154,173 | — | 9/28/22 | (Secured Overnight Financing Rate plus 0.65%) — Monthly | iShares Core U.S. Aggregate Bond ETF — Monthly | (1,885) | |
| 1,964,915 | 1,941,479 | — | 9/28/22 | (Secured Overnight Financing Rate plus 0.35%) — Monthly | iShares IBOXX High Yield Corporate Bond ETF — Monthly | (16,961) | |
| 273,855 | 270,589 | — | 9/28/22 | (Secured Overnight Financing Rate plus 0.35%) — Monthly | iShares IBOXX High Yield Corporate Bond ETF — Monthly | (2,364) | |
| 171,392 | 169,348 | — | 9/28/22 | (Secured Overnight Financing Rate plus 0.35%) — Monthly | iShares IBOXX High Yield Corporate Bond ETF — Monthly | (1,479) | |
| 129,147 | 127,178 | — | 9/28/22 | (Secured Overnight Financing Rate plus 0.35%) — Monthly | iShares IBOXX High Yield Corporate Bond ETF — Monthly | (1,550) | |
| 80,700 | 79,738 | — | 9/28/22 | (Secured Overnight Financing Rate plus 0.35%) — Monthly | iShares IBOXX High Yield Corporate Bond ETF — Monthly | (697) | |
| 64,018 | 63,255 | — | 9/28/22 | (Secured Overnight Financing Rate plus 0.35%) — Monthly | iShares IBOXX High Yield Corporate Bond ETF — Monthly | (553) | |
| Upfront premium received | — | Unrealized appreciation | — | ||||
| Upfront premium (paid) | — | Unrealized (depreciation) | (131,108) | ||||
| Total | $— | Total | $(131,108) | ||||
24 Income Strategies Portfolio | |
| CENTRALLY CLEARED TOTAL RETURN SWAP CONTRACTS OUTSTANDING at 2/28/22 (Unaudited) | |||||||
| Notional amount | Value | Upfront premium received (paid) |
Termination date |
Payments received (paid) by fund |
Total return received by or paid by fund |
Unrealized appreciation/ (depreciation) |
|
| $144,000 | $8,857 | $466 | 1/15/32 | 2.78% — At maturity | USA Non-revised Consumer Price Index-Urban (CPI-U) — At maturity | $(8,392) | |
| 630,000 | 29,604 | 237 | 9/13/26 | 2.7375% — At maturity | USA Non-revised Consumer Price Index-Urban (CPI-U) — At maturity | (29,366) | |
| Total | $703 | $(37,758) | |||||
| CENTRALLY CLEARED CREDIT DEFAULT CONTRACTS OUTSTANDING — PROTECTION SOLD at 2/28/22 (Unaudited) |
||||||||
| Referenced debt* | Rating*** | Upfront premium received (paid)** |
Notional amount |
Value | Termi- nation date |
Payments received by fund |
Unrealized appreciation/ (depreciation) |
|
| NA HY Series 37 Index | BB−/P | $(15,707) | $190,000 | $10,714 | 12/20/26 | 500 bp — Quarterly | $(3,727) | |
| Total | $(15,707) | $(3,727) | ||||||
| * Payments related to the referenced debt are made upon a credit default event. | ||||||||
| ** Upfront premium is based on the difference between the original spread on issue and the market spread on day of execution. | ||||||||
| *** Ratings for an underlying index represent the average of the ratings of all the securities included in that index. The Moody’s, Standard & Poor’s or Fitch ratings are believed to be the most recent ratings available at February 28, 2022. Securities rated by Putnam are indicated by “/P.” The Putnam rating categories are comparable to the Standard & Poor’s classifications. | ||||||||
Income Strategies Portfolio 25 | |
Level 1: Valuations based on quoted prices for identical securities in active markets.
Level 2: Valuations based on quoted prices in markets that are not active or for which all significant inputs are observable, either directly or indirectly.
Level 3: Valuations based on inputs that are unobservable and significant to the fair value measurement.
| Valuation inputs | |||
| Investments in securities: | Level 1 | Level 2 | Level 3 |
| Common stocks*: | |||
| Basic materials | $124,940 | $— | $— |
| Capital goods | 335,228 | — | — |
| Communication services | 154,581 | — | — |
| Conglomerates | 35,258 | — | — |
| Consumer cyclicals | 762,381 | — | — |
| Consumer staples | 374,797 | — | — |
| Energy | 150,313 | — | — |
| Financials | 754,290 | — | — |
| Health care | 691,059 | — | — |
| Technology | 1,898,941 | — | — |
| Transportation | 84,312 | — | — |
| Utilities and power | 137,117 | — | — |
| Total common stocks | 5,503,217 | — | — |
| Investment companies | 28,286 | — | — |
| Short-term investments | — | 12,440,517 | — |
| Totals by level | $5,531,503 | $12,440,517 | $— |
| Valuation inputs | |||
| Other financial instruments: | Level 1 | Level 2 | Level 3 |
| Futures contracts | $(6,793) | $— | $— |
| Interest rate swap contracts | — | 4,330 | — |
| Total return swap contracts | — | (169,569) | — |
| Credit default contracts | — | 11,980 | — |
| Totals by level | $(6,793) | $(153,259) | $— |
| * Common stock classifications are presented at the sector level, which may differ from the fund’s portfolio presentation. | |||
The accompanying notes are an integral part of these financial statements.
26 Income Strategies Portfolio | |
Statement of assets and liabilities 2/28/22 (Unaudited)
| ASSETS | |
| Investment in securities, at value (Note 1): | |
| Unaffiliated issuers (identified cost $7,415,809) | $7,631,020 |
| Affiliated issuers (identified cost $1,250,000) (Note 5) | 1,250,000 |
| Repurchase agreements (identified cost $9,091,000) | 9,091,000 |
| Cash | 3,502 |
| Dividends, interest and other receivables | 26,846 |
| Receivable for shares of the fund sold | 54 |
| Receivable for investments sold | 8,224 |
| Receivable from Manager (Note 2) | 16,090 |
| Receivable for variation margin on futures contracts (Note 1) | 2,950 |
| Receivable for variation margin on centrally cleared swap contracts (Note 1) | 9,629 |
| Total assets | 18,039,315 |
| LIABILITIES | |
| Payable for investments purchased | 31,332 |
| Payable for shares of the fund repurchased | 16,165 |
| Payable for custodian fees (Note 2) | 7,185 |
| Payable for Trustee compensation and expenses (Note 2) | 21 |
| Payable for administrative services (Note 2) | 46 |
| Payable for auditing and tax fees | 34,430 |
| Payable for variation margin on futures contracts (Note 1) | 16,328 |
| Payable for variation margin on centrally cleared swap contracts (Note 1) | 12,600 |
| Unrealized depreciation on OTC swap contracts (Note 1) | 131,108 |
| Other accrued expenses | 5,003 |
| Total liabilities | 254,218 |
| Net assets | $17,785,097 |
| REPRESENTED BY | |
| Paid-in capital (Unlimited shares authorized) (Notes 1 and 4) | $17,780,717 |
| Total distributable earnings (Note 1) | 4,380 |
| Total — Representing net assets applicable to capital shares outstanding | $17,785,097 |
| COMPUTATION OF NET ASSET VALUE AND OFFERING PRICE | |
| Net asset value, offering price and redemption price per fund share | |
| ($17,785,097 divided by 1,705,497 shares) | $10.43 |
The accompanying notes are an integral part of these financial statements.
| Income Strategies Portfolio 27 |
Statement of operations Six months ended 2/28/22 (Unaudited)
| INVESTMENT INCOME | |
| Dividends | $41,350 |
| Interest (including interest income of $3,766 from investments in affiliated issuers) (Note 5) | 5,827 |
| Securities lending (net of expenses) (Notes 1 and 5) | 12 |
| Total investment income | 47,189 |
| EXPENSES | |
| Custodian fees (Note 2) | 8,378 |
| Trustee compensation and expenses (Note 2) | 343 |
| Administrative services (Note 2) | 307 |
| Reports to shareholders | 4,135 |
| Auditing and tax fees | 34,419 |
| Other | 1,266 |
| Fees waived and reimbursed by Manager (Note 2) | (30,335) |
| Total expenses | 18,513 |
| Expense reduction (Note 2) | (199) |
| Net expenses | 18,314 |
| Net investment income | 28,875 |
| REALIZED AND UNREALIZED GAIN (LOSS) | |
| Net realized gain (loss) on: | |
| Securities from unaffiliated issuers (Notes 1 and 3) | 292,377 |
| Futures contracts (Note 1) | 45,166 |
| Swap contracts (Note 1) | (426,707) |
| Total net realized loss | (89,164) |
| Change in net unrealized appreciation (depreciation) on: | |
| Securities from unaffiliated issuers | (593,948) |
| Futures contracts | 35,592 |
| Swap contracts | (141,471) |
| Total change in net unrealized depreciation | (699,827) |
| Net loss on investments | (788,991) |
| Net decrease in net assets resulting from operations | $(760,116) |
The accompanying notes are an integral part of these financial statements.
| 28 Income Strategies Portfolio |
Statement of changes in net assets
| INCREASE IN NET ASSETS | Six months ended 2/28/22* | Year ended 8/30/21 |
| Operations | ||
| Net investment income | $28,875 | $56,957 |
| Net realized gain (loss) on investments | (89,164) | 772,181 |
| Change in net unrealized appreciation (depreciation) | ||
| of investments | (699,827) | 486,243 |
| Net increase (decrease) in net assets resulting | ||
| from operations | (760,116) | 1,315,381 |
| Distributions to shareholders (Note 1): | ||
| From ordinary income | ||
| Net investment income | (109,771) | (298,428) |
| Net realized short-term gain on investments | (501,348) | — |
| From net realized long-term gain on investments | (179,182) | — |
| Increase from capital share transactions (Note 4) | 4,013,410 | 2,597,307 |
| Total increase in net assets | 2,462,993 | 3,614,260 |
| NET ASSETS | ||
| Beginning of period | 15,322,104 | 11,707,844 |
| End of period | $17,785,097 | $15,322,104 |
* Unaudited.
The accompanying notes are an integral part of these financial statements.
| Income Strategies Portfolio 29 |
Financial highlights (For a common share outstanding throughout the period)
| INVESTMENT OPERATIONS | LESS DISTRIBUTIONS | RATIOS AND SUPPLEMENTAL DATA | |||||||||||
| Ratio | Ratio of net | ||||||||||||
| Net asset | Net realized | of expenses | investment | ||||||||||
| value, | and unrealized | Total from | From net | From | Net asset | Total return | Net assets, | to average | income (loss) | Portfolio | |||
| beginning | Net investment | gain (loss) | investment | investment | net realized gain | Total | value, end | at net asset | end of period | net assets | to average | turnover | |
| Period ended | of period | income (loss)a | on investments | operations | income | on investments | distributions | of period | value (%)b | (in thousands) | (%)c,d | net assets (%)d | (%) |
| Fund | |||||||||||||
| February 28, 2022** | $11.28 | .02 | (.43) | (.41) | (.06) | (.38) | (.44) | $10.43 | (3.79)* | $17,785 | .10* | .16* | 65* |
| August 31, 2021 | 10.49 | .04 | .96 | 1.00 | (.21) | — | (.21) | 11.28 | 9.68 | 15,322 | .20 | .40 | 144 |
| August 31, 2020† | 10.00 | .05 | .44 | .49 | —e | — | —e | 10.49 | 4.94* | 11,708 | .13* | .53* | 54* |
* Not annualized.
** Unaudited.
† For the period December 31, 2019 (commencement of operations) to August 31, 2020.
a Per share net investment income (loss) has been determined on the basis of the weighted average number of shares outstanding during the period.
b Total return assumes dividend reinvestment.
c Includes amounts paid through expense offset arrangements, if any (Note 2). Also excludes acquired fund fees and expenses, if any.
d Reflects an involuntary contractual expense limitation in effect during the period. As a result of such limitation, the expenses of the fund reflect a reduction of the following amounts (Note 2):
| Percentage of average net assets | ||||
| February 28, 2022 | 0.16% | |||
| August 31, 2021 | 0.93 | |||
| August 31, 2020 | 2.45 |
e Amount represents less than $0.01 per share.
The accompanying notes are an integral part of these financial statements.
| 30 Income Strategies Portfolio | Income Strategies Portfolio 31 |
Notes to financial statements 2/28/22 (Unaudited)
Within the following Notes to financial statements, references to “State Street” represent State Street Bank and Trust Company, references to “the SEC” represent the Securities and Exchange Commission, references to “Putnam Management” represent Putnam Investment Management, LLC, the fund’s manager, an indirect wholly-owned subsidiary of Putnam Investments, LLC and references to “OTC”, if any, represent over-the-counter. Unless otherwise noted, the “reporting period” represents the period from September 1, 2021 through February 28, 2022.
Putnam Income Strategies Portfolio (the fund) is a diversified series of Putnam Asset Allocation Funds (the Trust), a Massachusetts business trust registered under the Investment Company Act of 1940, as amended, as an open-end management investment company. The goal of the fund is to seek total return consistent with preservation of capital. Total return is composed of capital appreciation and income. The fund invests mainly in fixed-income investments, including U.S. and foreign government obligations, corporate obligations and securitized debt instruments (such as mortgage-backed investments) of any credit quality. The fund also invests, to a lesser extent, in equity securities (growth or value stocks or both) of U.S. and foreign companies of any size. The fund also makes other types of investments, such as investments in real estate investment trusts and convertible securities. The fund has a strategic, or typical, allocation between equity and fixed-income investments. Using qualitative analysis and quantitative models and techniques, Putnam Management adjusts portfolio allocations from time to time within a certain range to try to optimize the fund’s performance consistent with its goal. The strategic allocation and the range of allowable allocation for the fund is shown below:
| Class | Strategic Allocation | Range |
| Equity | 25% | 5–50% |
| Fixed-Income | 75% | 50–95% |
Putnam Management may consider, among other factors, a company’s valuation, financial strength, growth potential, competitive position in its industry, projected future earnings, cash flows and dividends when deciding whether to buy or sell equity investments and may also consider, among other factors, credit, interest rate and prepayment risks, as well as general market conditions, when deciding whether to buy or sell fixed-income investments. The fund typically uses derivatives to a significant extent, such as futures, options, certain foreign currency transactions, warrants and swap contracts, for both hedging and non-hedging purposes and may also use derivatives and debt instruments with terms determined by reference to a particular commodity or to all or portions of a commodities index.
The fund’s shares are sold without a front-end sales charge and are not subject to a contingent deferred sales charge. The fund’s shares are only available to Putnam fund of funds. Shares of the fund are sold at net asset value.
In the normal course of business, the fund enters into contracts that may include agreements to indemnify another party under given circumstances. The fund’s maximum exposure under these arrangements is unknown as this would involve future claims that may be, but have not yet been, made against the fund. However, the fund’s management team expects the risk of material loss to be remote.
The fund has entered into contractual arrangements with an investment adviser, administrator, distributor, shareholder servicing agent and custodian, who each provide services to the fund. Unless expressly stated otherwise, shareholders are not parties to, or intended beneficiaries of these contractual arrangements, and these contractual arrangements are not intended to create any shareholder right to enforce them against the service providers or to seek any remedy under them against the service providers, either directly or on behalf of the fund.
Under the fund’s Amended and Restated Agreement and Declaration of Trust, any claims asserted against or on behalf of the Putnam Funds, including claims against Trustees and Officers, must be brought in state and federal courts located within the Commonwealth of Massachusetts.
Note 1: Significant accounting policies
The following is a summary of significant accounting policies consistently followed by the fund in the preparation of its financial statements. The preparation of financial statements is in conformity with accounting principles generally accepted in the United States of America and requires management to make estimates and assumptions that affect the reported amounts of assets and liabilities in the financial statements and the reported amounts of increases and decreases in net assets from operations. Actual results could differ from those estimates. Subsequent events after the Statement of assets and liabilities date through the date that the financial statements were issued have been evaluated in the preparation of the financial statements.
| 32 Income Strategies Portfolio |
Security valuation Portfolio securities and other investments are valued using policies and procedures adopted by the Board of Trustees. The Trustees have formed a Pricing Committee to oversee the implementation of these procedures and have delegated responsibility for valuing the fund’s assets in accordance with these procedures to Putnam Management. Putnam Management has established an internal Valuation Committee that is responsible for making fair value determinations, evaluating the effectiveness of the pricing policies of the fund and reporting to the Pricing Committee.
Investments for which market quotations are readily available are valued at the last reported sales price on their principal exchange, or official closing price for certain markets, and are classified as Level 1 securities under Accounting Standards Codification 820 Fair Value Measurements and Disclosures (ASC 820). If no sales are reported, as in the case of some securities that are traded OTC, a security is valued at its last reported bid price and is generally categorized as a Level 2 security.
Investments in open-end investment companies (excluding exchange-traded funds), if any, which can be classified as Level 1 or Level 2 securities, are valued based on their net asset value. The net asset value of such investment companies equals the total value of their assets less their liabilities and divided by the number of their outstanding shares.
Market quotations are not considered to be readily available for certain debt obligations (including short-term investments with remaining maturities of 60 days or less) and other investments; such investments are valued on the basis of valuations furnished by an independent pricing service approved by the Trustees or dealers selected by Putnam Management. Such services or dealers determine valuations for normal institutional-size trading units of such securities using methods based on market transactions for comparable securities and various relationships, generally recognized by institutional traders, between securities (which consider such factors as security prices, yields, maturities and ratings). These securities will generally be categorized as Level 2.
Many securities markets and exchanges outside the U.S. close prior to the scheduled close of the New York Stock Exchange and therefore the closing prices for securities in such markets or on such exchanges may not fully reflect events that occur after such close but before the scheduled close of the New York Stock Exchange. Accordingly, on certain days, the fund will fair value certain foreign equity securities taking into account multiple factors including movements in the U.S. securities markets, currency valuations and comparisons to the valuation of American Depository Receipts, exchange-traded funds and futures contracts. The foreign equity securities, which would generally be classified as Level 1 securities, will be transferred to Level 2 of the fair value hierarchy when they are valued at fair value. The number of days on which fair value prices will be used will depend on market activity and it is possible that fair value prices will be used by the fund to a significant extent. Securities quoted in foreign currencies, if any, are translated into U.S. dollars at the current exchange rate.
To the extent a pricing service or dealer is unable to value a security or provides a valuation that Putnam Management does not believe accurately reflects the security’s fair value, the security will be valued at fair value by Putnam Management in accordance with policies and procedures approved by the Trustees. Certain investments, including certain restricted and illiquid securities and derivatives, are also valued at fair value following procedures approved by the Trustees. These valuations consider such factors as significant market or specific security events such as interest rate or credit quality changes, various relationships with other securities, discount rates, U.S. Treasury, U.S. swap and credit yields, index levels, convexity exposures, recovery rates, sales and other multiples and resale restrictions. These securities are classified as Level 2 or as Level 3 depending on the priority of the significant inputs.
To assess the continuing appropriateness of fair valuations, the Valuation Committee reviews and affirms the reasonableness of such valuations on a regular basis after considering all relevant information that is reasonably available. Such valuations and procedures are reviewed periodically by the Trustees. The fair value of securities is generally determined as the amount that the fund could reasonably expect to realize from an orderly disposition of such securities over a reasonable period of time. By its nature, a fair value price is a good faith estimate of the value of a security in a current sale and does not reflect an actual market price, which may be different by a material amount.
Joint trading account Pursuant to an exemptive order from the SEC, the fund may transfer uninvested cash balances into a joint trading account along with the cash of other registered investment companies and certain other accounts managed by Putnam Management. These balances may be invested in issues of short-term investments having maturities of up to 90 days.
| Income Strategies Portfolio 33 |
Repurchase agreements The fund, or any joint trading account, through its custodian, receives delivery of the underlying securities, the fair value of which at the time of purchase is required to be in an amount at least equal to the resale price, including accrued interest. Collateral for certain tri-party repurchase agreements, which totaled $9,272,820 at the end of the reporting period, is held at the counterparty’s custodian in a segregated account for the benefit of the fund and the counterparty. Putnam Management is responsible for determining that the value of these underlying securities is at all times at least equal to the resale price, including accrued interest. In the event of default or bankruptcy by the other party to the agreement, retention of the collateral may be subject to legal proceedings.
Security transactions and related investment income Security transactions are recorded on the trade date (the date the order to buy or sell is executed). Gains or losses on securities sold are determined on the identified cost basis.
Interest income, net of any applicable withholding taxes, if any, and including amortization and accretion of premiums and discounts on debt securities, is recorded on the accrual basis. Dividend income, net of any applicable withholding taxes, is recognized on the ex-dividend date except that certain dividends from foreign securities, if any, are recognized as soon as the fund is informed of the ex-dividend date. Non-cash dividends, if any, are recorded at the fair value of the securities received. Dividends representing a return of capital or capital gains, if any, are reflected as a reduction of cost and/or as a realized gain.
Futures contracts The fund uses futures contracts to manage exposure to market risk and to equitize cash.
The potential risk to the fund is that the change in value of futures contracts may not correspond to the change in value of the hedged instruments. In addition, losses may arise from changes in the value of the underlying instruments, if there is an illiquid secondary market for the contracts, if interest or exchange rates move unexpectedly or if the counterparty to the contract is unable to perform. With futures, there is minimal counterparty credit risk to the fund since futures are exchange traded and the exchange’s clearinghouse, as counterparty to all exchange traded futures, guarantees the futures against default. Risks may exceed amounts recognized on the Statement of assets and liabilities. When the contract is closed, the fund records a realized gain or loss equal to the difference between the value of the contract at the time it was opened and the value at the time it was closed.
Futures contracts are valued at the quoted daily settlement prices established by the exchange on which they trade. The fund and the broker agree to exchange an amount of cash equal to the daily fluctuation in the value of the futures contract. Such receipts or payments are known as “variation margin.”
Futures contracts outstanding at period end, if any, are listed after the fund’s portfolio.
Interest rate swap contracts The fund entered into OTC and/or centrally cleared interest rate swap contracts, which are arrangements between two parties to exchange cash flows based on a notional principal amount, to hedge interest rate risk, to gain exposure on interest rates and to hedge prepayment risk.
An OTC and centrally cleared interest rate swap can be purchased or sold with an upfront premium. For OTC interest rate swap contracts, an upfront payment received by the fund is recorded as a liability on the fund’s books. An upfront payment made by the fund is recorded as an asset on the fund’s books. OTC and centrally cleared interest rate swap contracts are marked to market daily based upon quotations from an independent pricing service or market makers. Any change is recorded as an unrealized gain or loss on OTC interest rate swaps. Daily fluctuations in the value of centrally cleared interest rate swaps are settled through a central clearing agent and are recorded in variation margin on the Statement of assets and liabilities and recorded as unrealized gain or loss. Payments, including upfront premiums, received or made are recorded as realized gains or losses at the reset date or the closing of the contract. Certain OTC and centrally cleared interest rate swap contracts may include extended effective dates. Payments related to these swap contracts are accrued based on the terms of the contract.
The fund could be exposed to credit or market risk due to unfavorable changes in the fluctuation of interest rates or if the counterparty defaults, in the case of OTC interest rate contracts, or the central clearing agency or a clearing member defaults, in the case of centrally cleared interest rate swap contracts, on its respective obligation to perform under the contract. The fund’s maximum risk of loss from counterparty risk or central clearing risk is the fair value of the contract. This risk may be mitigated for OTC interest rate swap contracts by having a master netting arrangement between the fund and the counterparty and for centrally cleared interest rate swap contracts through the daily exchange of variation margin. There is minimal counterparty risk with respect to centrally cleared interest rate swap contracts due to the clearinghouse guarantee fund and other resources that are available in the event of a clearing member default. Risk of loss may exceed amounts recognized on the Statement of assets and liabilities.
| 34 Income Strategies Portfolio |
OTC and centrally cleared interest rate swap contracts outstanding, including their respective notional amounts at period end, if any, are listed after the fund’s portfolio.
Total return swap contracts The fund entered into OTC and/or centrally cleared total return swap contracts, which are arrangements to exchange a market-linked return for a periodic payment, both based on a notional principal amount, to hedge sector exposure, to manage exposure to specific sectors or industries, to manage exposure to specific securities, to gain exposure to a basket of securities, to gain exposure to specific markets or countries and to gain exposure to specific sectors or industries.
To the extent that the total return of the security, index or other financial measure underlying the transaction exceeds or falls short of the offsetting interest rate obligation, the fund will receive a payment from or make a payment to the counterparty. OTC and/or centrally cleared total return swap contracts are marked to market daily based upon quotations from an independent pricing service or market maker. Any change is recorded as an unrealized gain or loss on OTC total return swaps. Daily fluctuations in the value of centrally cleared total return swaps are settled through a central clearing agent and are recorded in variation margin on the Statement of assets and liabilities and recorded as unrealized gain or loss. Payments received or made are recorded as realized gains or losses. Certain OTC and/or centrally cleared total return swap contracts may include extended effective dates. Payments related to these swap contracts are accrued based on the terms of the contract. The fund could be exposed to credit or market risk due to unfavorable changes in the fluctuation of interest rates or in the price of the underlying security or index, the possibility that there is no liquid market for these agreements or that the counterparty may default on its obligation to perform. The fund’s maximum risk of loss from counterparty risk or central clearing risk is the fair value of the contract. This risk may be mitigated for OTC total return swap contracts by having a master netting arrangement between the fund and the counterparty and for centrally cleared total return swap contracts through the daily exchange of variation margin. There is minimal counterparty risk with respect to centrally cleared total return swap contracts due to the clearinghouse guarantee fund and other resources that are available in the event of a clearing member default. Risk of loss may exceed amounts recognized on the Statement of assets and liabilities.
OTC and/or centrally cleared total return swap contracts outstanding, including their respective notional amounts at period end, if any, are listed after the fund’s portfolio.
Credit default contracts The fund entered into OTC and/or centrally cleared credit default contracts to hedge credit risk, to hedge market risk and to gain exposure on individual names and/or baskets of securities.
In OTC and centrally cleared credit default contracts, the protection buyer typically makes a periodic stream of payments to a counterparty, the protection seller, in exchange for the right to receive a contingent payment upon the occurrence of a credit event on the reference obligation or all other equally ranked obligations of the reference entity. Credit events are contract specific but may include bankruptcy, failure to pay, restructuring and obligation acceleration. For OTC credit default contracts, an upfront payment received by the fund is recorded as a liability on the fund’s books. An upfront payment made by the fund is recorded as an asset on the fund’s books. Centrally cleared credit default contracts provide the same rights to the protection buyer and seller except the payments between parties, including upfront premiums, are settled through a central clearing agent through variation margin payments. Upfront and periodic payments received or paid by the fund for OTC and centrally cleared credit default contracts are recorded as realized gains or losses at the reset date or close of the contract. The OTC and centrally cleared credit default contracts are marked to market daily based upon quotations from an independent pricing service or market makers. Any change in value of OTC credit default contracts is recorded as an unrealized gain or loss. Daily fluctuations in the value of centrally cleared credit default contracts are recorded in variation margin on the Statement of assets and liabilities and recorded as unrealized gain or loss. Upon the occurrence of a credit event, the difference between the par value and fair value of the reference obligation, net of any proportional amount of the upfront payment, is recorded as a realized gain or loss.
In addition to bearing the risk that the credit event will occur, the fund could be exposed to market risk due to unfavorable changes in interest rates or in the price of the underlying security or index or the possibility that the fund may be unable to close out its position at the same time or at the same price as if it had purchased the underlying reference obligations. In certain circumstances, the fund may enter into offsetting OTC and centrally cleared credit default contracts which would mitigate its risk of loss. Risks of loss may exceed amounts recognized on the Statement of assets and liabilities. The fund’s maximum risk of loss from counterparty risk, either as the protection seller or as the protection buyer, is the fair value of the contract. This risk may be mitigated for OTC credit default contracts by having a master netting arrangement between the fund and the counterparty and for centrally cleared credit default contracts through the daily exchange of variation margin. Counterparty risk is further mitigated with respect to centrally cleared credit default swap contracts due to the clearinghouse
| Income Strategies Portfolio 35 |
guarantee fund and other resources that are available in the event of a clearing member default. Where the fund is a seller of protection, the maximum potential amount of future payments the fund may be required to make is equal to the notional amount.
OTC and centrally cleared credit default contracts outstanding, including their respective notional amounts at period end, if any, are listed after the fund’s portfolio.
Master agreements The fund is a party to ISDA (International Swaps and Derivatives Association, Inc.) Master Agreements that govern OTC derivative and foreign exchange contracts and Master Securities Forward Transaction Agreements that govern transactions involving mortgage-backed and other asset-backed securities that may result in delayed delivery (Master Agreements) with certain counterparties entered into from time to time. The Master Agreements may contain provisions regarding, among other things, the parties’ general obligations, representations, agreements, collateral requirements, events of default and early termination. With respect to certain counterparties, in accordance with the terms of the Master Agreements, collateral pledged to the fund is held in a segregated account by the fund’s custodian and, with respect to those amounts which can be sold or repledged, are presented in the fund’s portfolio.
Collateral pledged by the fund is segregated by the fund’s custodian and identified in the fund’s portfolio. Collateral can be in the form of cash or debt securities issued by the U.S. Government or related agencies or other securities as agreed to by the fund and the applicable counterparty. Collateral requirements are determined based on the fund’s net position with each counterparty.
With respect to ISDA Master Agreements, termination events applicable to the fund may occur upon a decline in the fund’s net assets below a specified threshold over a certain period of time. Termination events applicable to counterparties may occur upon a decline in the counterparty’s long-term or short-term credit ratings below a specified level. In each case, upon occurrence, the other party may elect to terminate early and cause settlement of all derivative and foreign exchange contracts outstanding, including the payment of any losses and costs resulting from such early termination, as reasonably determined by the terminating party. Any decision by one or more of the fund’s counterparties to elect early termination could impact the fund’s future derivative activity.
At the close of the reporting period, the fund had a net liability position of $131,108 on open derivative contracts subject to the Master Agreements. Collateral pledged by the fund at period end for these agreements totaled $251,875 and may include amounts related to unsettled agreements.
Securities lending The fund may lend securities, through its agent, to qualified borrowers in order to earn additional income. The loans are collateralized by cash in an amount at least equal to the fair value of the securities loaned. The fair value of securities loaned is determined daily and any additional required collateral is allocated to the fund on the next business day. The remaining maturities of the securities lending transactions are considered overnight and continuous. The risk of borrower default will be borne by the fund’s agent; the fund will bear the risk of loss with respect to the investment of the cash collateral. Income from securities lending, net of expenses, is included in investment income on the Statement of operations. Cash collateral is invested in Putnam Cash Collateral Pool, LLC, a limited liability company managed by an affiliate of Putnam Management. Investments in Putnam Cash Collateral Pool, LLC are valued at its closing net asset value each business day. There are no management fees charged to Putnam Cash Collateral Pool, LLC. At the close of the reporting period, the fund had no securities out on loan.
Interfund lending The fund, along with other Putnam funds, may participate in an interfund lending program pursuant to an exemptive order issued by the SEC. This program allows the fund to borrow from or lend to other Putnam funds that permit such transactions. Interfund lending transactions are subject to each fund’s investment policies and borrowing and lending limits. Interest earned or paid on the interfund lending transaction will be based on the average of certain current market rates. During the reporting period, the fund did not utilize the program.
Lines of credit The fund participates, along with other Putnam funds, in a $317.5 million unsecured committed line of credit and a $235.5 million unsecured uncommitted line of credit, both provided by State Street. Borrowings may be made for temporary or emergency purposes, including the funding of shareholder redemption requests and trade settlements. Interest is charged to the fund based on the fund’s borrowing at a rate equal to 1.25% plus the higher of (1) the Federal Funds rate and (2) the Overnight Bank Funding Rate for the committed line of credit and 1.30% plus the higher of (1) the Federal Funds rate and (2) the Overnight Bank Funding Rate for the uncommitted line of credit. A closing fee equal to 0.04% of the committed line of credit and 0.04% of the uncommitted line of credit has been paid by the participating funds. In addition, a commitment fee of 0.21% per annum on any unutilized portion of the committed line of credit is allocated to the participating funds based
| 36 Income Strategies Portfolio |
on their relative net assets and paid quarterly. During the reporting period, the fund had no borrowings against these arrangements.
Federal taxes It is the policy of the fund to distribute all of its taxable income within the prescribed time period and otherwise comply with the provisions of the Internal Revenue Code of 1986, as amended (the Code), applicable to regulated investment companies. It is also the intention of the fund to distribute an amount sufficient to avoid imposition of any excise tax under Section 4982 of the Code.
The fund is subject to the provisions of Accounting Standards Codification 740 Income Taxes (ASC 740). ASC 740 sets forth a minimum threshold for financial statement recognition of the benefit of a tax position taken or expected to be taken in a tax return. The fund did not have a liability to record for any unrecognized tax benefits in the accompanying financial statements. No provision has been made for federal taxes on income, capital gains or unrealized appreciation on securities held nor for excise tax on income and capital gains. Each of the fund’s federal tax returns for the prior periods remains subject to examination by the Internal Revenue Service.
Tax cost of investments includes adjustments to net unrealized appreciation (depreciation) which may not necessarily be final tax cost basis adjustments, but closely approximate the tax basis unrealized gains and losses that may be realized and distributed to shareholders. The aggregate identified cost on a tax basis is $17,740,634, resulting in gross unrealized appreciation and depreciation of $536,785 and $465,451, respectively, or net unrealized appreciation of $71,334.
Distributions to shareholders Distributions to shareholders from net investment income are recorded by the fund on the ex-dividend date. Distributions from capital gains, if any, are recorded on the ex-dividend date and paid at least annually. The amount and character of income and gains to be distributed are determined in accordance with income tax regulations, which may differ from generally accepted accounting principles. Dividend sources are estimated at the time of declaration. Actual results may vary. Any non-taxable return of capital cannot be determined until final tax calculations are completed after the end of the fund’s fiscal year. Reclassifications are made to the fund’s capital accounts to reflect income and gains available for distribution (or available capital loss carryovers) under income tax regulations.
Expenses of the Trust Expenses directly charged or attributable to any fund will be paid from the assets of that fund. Generally, expenses of the Trust will be allocated among and charged to the assets of each fund on a basis that the Trustees deem fair and equitable, which may be based on the relative assets of each fund or the nature of the services performed and relative applicability to each fund.
Note 2: Management fee, administrative services and other transactions
The fund does not pay Putnam Management a management fee.
Putnam Management has contractually agreed, through December 30, 2022, to waive fees and/or reimburse the fund’s expenses to the extent necessary to limit the cumulative expenses of the fund, exclusive of brokerage, interest, taxes, investment-related expenses, extraordinary expenses, acquired fund fees and expenses and payments under the fund’s investor servicing contract, investment management contract and distribution plans, on a fiscal year-to-date basis to an annual rate of 0.20% of the fund’s average net assets over such fiscal year-to-date period. During the reporting period, the fund’s expenses were reduced by $30,335 as a result of this limit.
Putnam Investments Limited (PIL), an affiliate of Putnam Management, is authorized by the Trustees to manage a separate portion of the assets of the fund as determined by Putnam Management from time to time. PIL did not manage any portion of the assets of the fund during the reporting period. If Putnam Management were to engage the services of PIL, Putnam Management would pay a quarterly sub-management fee to PIL for its services at an annual rate of 0.35% of the average net assets of the portion of the fund managed by PIL.
The Putnam Advisory Company, LLC (PAC), an affiliate of Putnam Management, is authorized by the Trustees to manage a separate portion of the assets of the fund, as designated from time to time by Putnam Management or PIL. PAC did not manage any portion of the assets of the fund during the reporting period. If Putnam Management or PIL were to engage the services of PAC, Putnam Management or PIL, as applicable, would pay a quarterly sub-advisory fee to PAC for its services at the annual rate of 0.35% of the average net assets of the portion of the fund’s assets for which PAC is engaged as sub-adviser.
The fund reimburses Putnam Management an allocated amount for the compensation and related expenses of certain officers of the fund and their staff who provide administrative services to the fund. The aggregate amount of all such reimbursements is determined annually by the Trustees.
| Income Strategies Portfolio 37 |
Custodial functions for the fund’s assets are provided by State Street. Custody fees are based on the fund’s asset level, the number of its security holdings and transaction volumes.
The fund has entered into expense offset arrangements with State Street whereby State Street’s fees are reduced by credits allowed on cash balances. For the reporting period, the fund’s expenses were reduced by $199 under the expense offset arrangements.
Each Independent Trustee of the fund receives an annual Trustee fee, of which $14, as a quarterly retainer, has been allocated to the fund, and an additional fee for each Trustees meeting attended. Trustees also are reimbursed for expenses they incur relating to their services as Trustees.
The fund has adopted a Trustee Fee Deferral Plan (the Deferral Plan) which allows the Trustees to defer the receipt of all or a portion of Trustees fees payable on or after July 1, 1995. The deferred fees remain invested in certain Putnam funds until distribution in accordance with the Deferral Plan.
The fund has adopted an unfunded noncontributory defined benefit pension plan (the Pension Plan) covering all Trustees of the fund who have served as a Trustee for at least five years and were first elected prior to 2004. Benefits under the Pension Plan are equal to 50% of the Trustee’s average annual attendance and retainer fees for the three years ended December 31, 2005. The retirement benefit is payable during a Trustee’s lifetime, beginning the year following retirement, for the number of years of service through December 31, 2006. Pension expense for the fund is included in Trustee compensation and expenses in the Statement of operations. Accrued pension liability is included in Payable for Trustee compensation and expenses in the Statement of assets and liabilities. The Trustees have terminated the Pension Plan with respect to any Trustee first elected after 2003.
Note 3: Purchases and sales of securities
During the reporting period, the cost of purchases and the proceeds from sales, excluding short-term investments, were as follows:
| Cost of purchases | Proceeds from sales | |
| Investments in securities (Long-term) | $4,563,494 | $3,645,914 |
| U.S. government securities (Long-term) | — | — |
| Total | $4,563,494 | $3,645,914 |
The fund may purchase or sell investments from or to other Putnam funds in the ordinary course of business, which can reduce the fund’s transaction costs, at prices determined in accordance with SEC requirements and policies approved by the Trustees. During the reporting period, purchases or sales of long-term securities from or to other Putnam funds, if any, did not represent more than 5% of the fund’s total cost of purchases and/or total proceeds from sales.
Note 4: Capital shares
At the close of the reporting period, there were an unlimited number of shares of beneficial interest authorized. Transactions, including, if applicable, direct exchanges pursuant to share conversions, in capital shares were as follows:
| SIX MONTHS ENDED 2/28/22 | YEAR ENDED 8/31/21 | |||
| Fund | Shares | Amount | Shares | Amount |
| Shares sold | 706,975 | $7,810,750 | 1,486,056 | $15,945,660 |
| Shares issued in connection with | ||||
| reinvestment of distributions | 73,039 | 790,301 | 28,054 | 298,428 |
| 780,014 | 8,601,051 | 1,514,110 | 16,244,088 | |
| Shares repurchased | (433,323) | (4,587,641) | (1,271,255) | (13,646,781) |
| Net increase | 346,691 | $4,013,410 | 242,855 | $2,597,307 |
At the close of the reporting period, the Putnam Retirement Advantage Funds owned 100% of the outstanding shares of the fund.
| 38 Income Strategies Portfolio |
Note 5: Affiliated transactions
Transactions during the reporting period with any company which is under common ownership or control were as follows:
| Shares | |||||
| outstanding | |||||
| and fair | |||||
| Fair value as | Purchase | Sale | Investment | value as | |
| Name of affiliate | of 8/31/21 | cost | proceeds | income | of 2/28/22 |
| Short-term investments | |||||
| Putnam Cash Collateral | |||||
| Pool, LLC* | $— | $911,140 | $911,140 | $7 | $— |
| Putnam Short Term | |||||
| Investment Fund** | 9,893,170 | 1,250,000 | 9,893,170 | 3,766 | 1,250,000 |
| Total Short-term | |||||
| investments | $9,893,170 | $2,161,140 | $10,804,310 | $3,773 | $1,250,000 |
* No management fees are charged to Putnam Cash Collateral Pool, LLC (Note 1). Investment income shown is included in securities lending income on the Statement of operations. There were no realized or unrealized gains or losses during the period.
** Management fees charged to Putnam Short Term Investment Fund have been waived by Putnam Management. There were no realized or unrealized gains or losses during the period.
Note 6: Market, credit and other risks
In the normal course of business, the fund trades financial instruments and enters into financial transactions where risk of potential loss exists due to changes in the market (market risk) or failure of the contracting party to the transaction to perform (credit risk). The fund may be exposed to additional credit risk that an institution or other entity with which the fund has unsettled or open transactions will default. Investments in foreign securities involve certain risks, including those related to economic instability, unfavorable political developments, and currency fluctuations. The fund may invest in higher-yielding, lower-rated bonds that may have a higher rate of default.
On July 27, 2017, the United Kingdom’s Financial Conduct Authority (“FCA”), which regulates LIBOR, announced its intention to cease compelling banks to provide the quotations needed to sustain LIBOR after 2021. ICE Benchmark Administration, the administrator of LIBOR, ceased publication of most LIBOR settings on a representative basis at the end of 2021 and is expected to cease publication of a majority of U.S. dollar LIBOR settings on a representative basis after June 30, 2023. In addition, global regulators have announced that, with limited exceptions, no new LIBOR-based contracts should be entered into after 2021. LIBOR has historically been a common benchmark interest rate index used to make adjustments to variable-rate loans. It is used throughout global banking and financial industries to determine interest rates for a variety of financial instruments and borrowing arrangements. Actions by regulators have resulted in the establishment of alternative reference rates to LIBOR in most major currencies. Various financial industry groups have been planning for the transition away from LIBOR, but there are obstacles to converting certain longer-term securities and transactions to new reference rates. Markets are developing slowly and questions around liquidity in these rates and how to appropriately adjust these rates to mitigate any economic value transfer at the time of transition remain a significant concern. Neither the effect of the transition process nor its ultimate success can yet be known. The transition process might lead to increased volatility and illiquidity in markets that rely on LIBOR to determine interest rates. It could also lead to a reduction in the value of some LIBOR-based investments and reduce the effectiveness of related transactions, such as hedges. While some LIBOR-based instruments may contemplate a scenario where LIBOR is no longer available by providing for an alternative rate-setting methodology, not all may have such provisions and there may be significant uncertainty regarding the effectiveness of any such alternative methodologies. Since the usefulness of LIBOR as a benchmark could deteriorate during the transition period, these effects could occur at any time.
Beginning in January 2020, global financial markets have experienced, and may continue to experience, significant volatility resulting from the spread of a virus known as Covid–19. The outbreak of Covid–19 has resulted in travel and border restrictions, quarantines, supply chain disruptions, lower consumer demand, and general market uncertainty. The effects of Covid–19 have adversely affected, and may continue to adversely affect, the
| Income Strategies Portfolio 39 |
global economy, the economies of certain nations, and individual issuers, all of which may negatively impact the fund’s performance.
Note 7: Summary of derivative activity
The volume of activity for the reporting period for any derivative type that was held during the period is listed below and was based on an average of the holdings at the end of each fiscal quarter:
| Futures contracts (number of contracts) | 20 |
| Centrally cleared interest rate swap contracts (notional) | $230,000 |
| OTC total return swap contracts (notional) | $11,800,000 |
| Centrally cleared total return swap contracts (notional) | $880,000 |
| Centrally cleared credit default contracts (notional) | $81,000 |
The following is a summary of the fair value of derivative instruments as of the close of the reporting period:
| Fair value of derivative instruments as of the close of the reporting period | ||||
| ASSET DERIVATIVES | LIABILITY DERIVATIVES | |||
| Derivatives not | ||||
| accounted for as | Statement of | Statement of | ||
| hedging instruments | assets and | assets and | ||
| under ASC 815 | liabilities location | Fair value | liabilities location | Fair value |
| Receivables, Net assets — | ||||
| Credit contracts | Unrealized appreciation | $11,980* | Payables | $— |
| Receivables, Net assets — | Payables, Net assets — | |||
| Equity contracts | Unrealized appreciation | 48,296* | Unrealized depreciation | 180,056* |
| Receivables, Net assets — | Payables, Net assets — | |||
| Interest rate contracts | Unrealized appreciation | 4,330* | Unrealized depreciation | 44,602* |
| Total | $64,606 | $224,658 | ||
* Includes cumulative appreciation/depreciation of futures contracts and/or centrally cleared swaps as reported in the fund’s portfolio. Only current day’s variation margin is reported within the Statement of assets and liabilities.
The following is a summary of realized and change in unrealized gains or losses of derivative instruments in the Statement of operations for the reporting period (Note 1):
| Amount of realized gain or (loss) on derivatives recognized in net gain or (loss) on investments | |||
| Derivatives not accounted for as hedging | |||
| instruments under ASC 815 | Futures | Swaps | Total |
| Equity contracts | $(11,767) | $(398,496) | $(410,263) |
| Interest rate contracts | 56,933 | (28,211) | $28,722 |
| Total | $45,166 | $(426,707) | $(381,541) |
| Change in unrealized appreciation or (depreciation) on derivatives recognized in net gain or (loss) | |||
| on investments | |||
| Derivatives not accounted for as hedging | |||
| instruments under ASC 815 | Futures | Swaps | Total |
| Credit contracts | $— | $(3,727) | $(3,727) |
| Equity contracts | 36,818 | (127,146) | $(90,328) |
| Interest rate contracts | (1,226) | (10,598) | $(11,824) |
| Total | $35,592 | $(141,471) | $(105,879) |
| 40 Income Strategies Portfolio |
Note 8: Offsetting of financial and derivative assets and liabilities
The following table summarizes any derivatives, repurchase agreements and reverse repurchase agreements, at the end of the reporting period, that are subject to an enforceable master netting agreement or similar agreement. For securities lending transactions or borrowing transactions associated with securities sold short, if any, see Note 1. For financial reporting purposes, the fund does not offset financial assets and financial liabilities that are subject to the master netting agreements in the Statement of assets and liabilities.
| Barclays | ||||||||||
| Capital, Inc. | BofA | |||||||||
| (clearing | Securities, | JPMorgan | ||||||||
| broker) | Inc. | Citibank, N.A. | Securities LLC | Total | ||||||
| Assets: | ||||||||||
| Centrally cleared interest rate | $— | $— | $— | $— | $— | |||||
| swap contracts§ | ||||||||||
| OTC Total return swap contracts*# | — | — | — | — | — | |||||
| Centrally cleared total return | 9,629 | — | — | — | 9,629 | |||||
| swap contracts§ | ||||||||||
| Centrally cleared credit default | — | — | — | — | — | |||||
| contracts§ | ||||||||||
| Futures contracts§ | — | 2,950 | — | — | 2,950 | |||||
| Repurchase agreements** | — | 9,091,000 | — | — | 9,091,000 | |||||
| Total Assets | $9,629 | $9,093,950 | $— | $— | $9,103,579 | |||||
| Liabilities: | ||||||||||
| Centrally cleared interest rate | $6,034 | $— | $— | $— | $6,034 | |||||
| swap contracts§ | ||||||||||
| OTC Total return swap contracts*# | — | — | 131,108 | — | 131,108 | |||||
| Centrally cleared total return | 6,104 | — | — | — | 6,104 | |||||
| swap contracts§ | ||||||||||
| Centrally cleared credit default | 462 | — | — | — | 462 | |||||
| contracts§ | ||||||||||
| Futures contracts§ | — | 10,414 | — | 5,914 | 16,328 | |||||
| Total Liabilities | $12,600 | $10,414 | $131,108 | $5,914 | $160,036 | |||||
| Total Financial and Derivative | $(2,971) | $9,083,536 | $(131,108) | $(5,914) | $8,943,543 | |||||
| Net Assets | ||||||||||
| Total collateral received (pledged)†## | $— | $9,083,536 | $(131,108) | $— | ||||||
| Net amount | $(2,971) | $— | $— | $(5,914) | ||||||
| Controlled collateral received (including | ||||||||||
| TBA commitments)** | $— | $— | $— | $— | $— | |||||
| Uncontrolled collateral received | $— | $9,272,820 | $— | $— | $9,272,820 | |||||
| Collateral (pledged) (including TBA | ||||||||||
| commitments)** | $— | $— | $(251,875) | $— | $(251,875) | |||||
* Excludes premiums, if any. Included in unrealized appreciation and depreciation on OTC swap contracts on the Statement of assets and liabilities.
** Included with Investments in securities on the Statement of assets and liabilities.
† Additional collateral may be required from certain brokers based on individual agreements.
# Covered by master netting agreement (Note 1).
## Any over-collateralization of total financial and derivative net assets is not shown. Collateral may include amounts related to unsettled agreements.
§ Includes current day’s variation margin only as reported on the Statement of assets and liabilities, which is not collateralized. Cumulative appreciation/(depreciation) for futures contracts and centrally cleared swap contracts is represented in the tables listed after the fund’s portfolio. Collateral pledged for initial margin on futures contracts and centrally cleared swap contracts, which is not included in the table above, amounted to $127,923 and $40,978, respectively.
| Income Strategies Portfolio 41 |
Note 9: New accounting pronouncements
In March 2020, the Financial Accounting Standards Board (FASB) issued Accounting Standards Update (ASU) 2020–04, Reference Rate Reform (Topic 848) — Facilitation of the Effects of Reference Rate Reform on Financial Reporting. The amendments in ASU 2020–04 provide optional temporary financial reporting relief from the effect of certain types of contract modifications due to the planned discontinuation of LIBOR and other interbank-offered based reference rates as of the end of 2021. The discontinuation of LIBOR was subsequently extended to June 30, 2023. ASU 2020–04 is effective for certain reference rate-related contract modifications that occur during the period March 12, 2020 through December 31, 2022. Management expects that the adoption of the guidance will not have a material impact on the fund’s financial statements.
| 42 Income Strategies Portfolio |
Putnam family of funds
The following is a list of Putnam’s open-end mutual funds offered to the public. Investors should carefully consider the investment objective, risks, charges, and expenses of a fund before investing. For a prospectus, or a summary prospectus if available, containing this and other information for any Putnam fund or product, contact your financial advisor or call Putnam Investor Services at 1-800-225-1581. Please read the prospectus carefully before investing.
| Blend | Income |
| Emerging Markets Equity Fund | Convertible Securities Fund |
| Focused Equity Fund | Diversified Income Trust |
| Focused International Equity Fund | Floating Rate Income Fund |
| International Capital Opportunities Fund | Global Income Trust |
| International Equity Fund | Government Money Market Fund* |
| Multi-Cap Core Fund | High Yield Fund |
| Research Fund | Income Fund |
| Money Market Fund† | |
| Global Sector | Mortgage Opportunities Fund |
| Global Health Care Fund | Mortgage Securities Fund |
| Global Technology Fund | Short Duration Bond Fund |
| Ultra Short Duration Income Fund | |
| Growth | |
| Growth Opportunities Fund | Tax-free Income |
| Small Cap Growth Fund | Intermediate-Term Municipal Income Fund |
| Sustainable Future Fund | Short-Term Municipal Income Fund |
| Sustainable Leaders Fund | Strategic Intermediate Municipal Fund |
| Tax Exempt Income Fund | |
| Value | Tax-Free High Yield Fund |
| International Value Fund | |
| Large Cap Value Fund | State tax-free income funds:‡ |
| Small Cap Value Fund | California, Massachusetts, Minnesota, |
| New Jersey, New York, Ohio, and Pennsylvania |
| Income Strategies Portfolio 43 |
| Absolute Return | Asset Allocation (cont.) |
| Fixed Income Absolute Return Fund | Putnam Retirement Advantage Maturity Fund |
| Multi-Asset Absolute Return Fund | Putnam Retirement Advantage 2065 Fund |
| Putnam Retirement Advantage 2060 Fund | |
| Putnam PanAgora§ | Putnam Retirement Advantage 2055 Fund |
| Putnam PanAgora Risk Parity Fund | Putnam Retirement Advantage 2050 Fund |
| Putnam Retirement Advantage 2045 Fund | |
| Asset Allocation | Putnam Retirement Advantage 2040 Fund |
| Dynamic Risk Allocation Fund | Putnam Retirement Advantage 2035 Fund |
| George Putnam Balanced Fund | Putnam Retirement Advantage 2030 Fund |
| Putnam Retirement Advantage 2025 Fund | |
| Dynamic Asset Allocation Balanced Fund | |
| Dynamic Asset Allocation Conservative Fund | RetirementReady® Maturity Fund |
| Dynamic Asset Allocation Growth Fund | RetirementReady® 2065 Fund |
| RetirementReady® 2060 Fund | |
| RetirementReady® 2055 Fund | |
| RetirementReady® 2050 Fund | |
| RetirementReady® 2045 Fund | |
| RetirementReady® 2040 Fund | |
| RetirementReady® 2035 Fund | |
| RetirementReady® 2030 Fund | |
| RetirementReady® 2025 Fund |
* You could lose money by investing in the fund. Although the fund seeks to preserve the value of your investment at $1.00 per share, it cannot guarantee it will do so. An investment in the fund is not insured or guaranteed by the Federal Deposit Insurance Corporation or any other government agency. The fund’s sponsor has no legal obligation to provide financial support to the fund, and you should not expect that the sponsor will provide financial support to the fund at any time.
† You could lose money by investing in the fund. Although the fund seeks to preserve the value of your investment at $1.00 per share, it cannot guarantee it will do so. The fund may impose a fee upon sale of your shares or may temporarily suspend your ability to sell shares if the fund’s liquidity falls below required minimums because of market conditions or other factors. An investment in the fund is not insured or guaranteed by the Federal Deposit Insurance Corporation or any other government agency. The fund’s sponsor has no legal obligation to provide financial support to the fund, and you should not expect that the sponsor will provide financial support to the fund at any time.
‡ Not available in all states.
§ Sub-advised by PanAgora Asset Management.
Check your account balances and the most recent month-end performance in the Individual Investors section at putnam.com.
| 44 Income Strategies Portfolio |
Fund information
Founded over 80 years ago, Putnam Investments was built around the concept that a balance between risk and reward is the hallmark of a well-rounded financial program. We manage funds across income, value, blend, growth, sustainable, asset allocation, absolute return, and global sector categories.
| Investment Manager | Trustees | Richard T. Kircher |
| Putnam Investment | Kenneth R. Leibler, Chair | Vice President and BSA |
| Management, LLC | Liaquat Ahamed | Compliance Officer |
| 100 Federal Street | Ravi Akhoury | |
| Boston, MA 02110 | Barbara M. Baumann | Martin Lemaire |
| Katinka Domotorffy | Vice President and | |
| Investment Sub-Advisors | Catharine Bond Hill | Derivatives Risk Manager |
| Putnam Investments Limited | Paul L. Joskow | |
| 16 St James’s Street | George Putnam, III | Susan G. Malloy |
| London, England SW1A 1ER | Robert L. Reynolds | Vice President and |
| Manoj P. Singh | Assistant Treasurer | |
| The Putnam Advisory Company, LLC | Mona K. Sutphen | |
| 100 Federal Street | Alan G. McCormack | |
| Boston, MA 02110 | Officers | Vice President and |
| Robert L. Reynolds | Derivatives Risk Manager | |
| Marketing Services | President | |
| Putnam Retail Management | Denere P. Poulack | |
| Limited Partnership | James F. Clark | Assistant Vice President, |
| 100 Federal Street | Vice President, Chief Compliance | Assistant Clerk, and |
| Boston, MA 02110 | Officer, and Chief Risk Officer | Assistant Treasurer |
| Custodian | Nancy E. Florek | Janet C. Smith |
| State Street Bank | Vice President, Director of | Vice President, |
| and Trust Company | Proxy Voting and Corporate | Principal Financial Officer, |
| Governance, Assistant Clerk, | Principal Accounting Officer, | |
| Legal Counsel | and Assistant Treasurer | and Assistant Treasurer |
| Ropes & Gray LLP | ||
| Michael J. Higgins | Stephen J. Tate | |
| Vice President, Treasurer, | Vice President and | |
| and Clerk | Chief Legal Officer | |
| Jonathan S. Horwitz | Mark C. Trenchard | |
| Executive Vice President, | Vice President | |
| Principal Executive Officer, | ||
| and Compliance Liaison |
This report is for the information of shareholders of Putnam Income Strategies Portfolio. It may also be used as sales literature when preceded or accompanied by the current PPM, the most recent copy of Putnam’s Quarterly Performance Summary, and Putnam’s Quarterly Ranking Summary. For more recent performance, call Putnam toll free at 1-800-225-1581. Investors should carefully consider the investment objectives, risks, charges, and expenses of a fund, which are described in its prospectus or PPM. For this and other information or to request a PPM, call 1-800-225-1581 toll free. Please read the PPM carefully before investing. The fund’s Statement of Additional Information contains additional information about the fund’s Trustees and is available without charge upon request by calling 1-800-225-1581.

| Item 2. Code of Ethics: |
| Not applicable |
| Item 3. Audit Committee Financial Expert: |
| Not applicable |
| Item 4. Principal Accountant Fees and Services: |
| Not applicable |
| Item 5. Audit Committee of Listed Registrants |
| Not applicable |
| Item 6. Schedule of Investments: |
| The registrant’s schedule of investments in unaffiliated issuers is included in the report to shareholders in Item 1 above. |
| Item 7. Disclosure of Proxy Voting Policies and Procedures For Closed-End Management Investment Companies: |
| Not applicable |
| Item 8. Portfolio Managers of Closed-End Investment Companies |
| Not Applicable |
| Item 9. Purchases of Equity Securities by Closed-End Management Investment Companies and Affiliated Purchasers: |
| Not applicable |
| Item 10. Submission of Matters to a Vote of Security Holders: |
| Not applicable |
| Item 11. Controls and Procedures: |
| (a) The registrant’s principal executive officer and principal financial officer have concluded, based on their evaluation of the effectiveness of the design and operation of the registrant’s disclosure controls and procedures as of a date within 90 days of the filing date of this report, that the design and operation of such procedures are generally effective to provide reasonable assurance that information required to be disclosed by the registrant in this report is recorded, processed, summarized and reported within the time periods specified in the Commission’s rules and forms. |
| (b) Changes in internal control over financial reporting: Not applicable |
| Item 12. Disclosures of Securities Lending Activities for Closed-End Investment Companies: |
| Not Applicable |
| Item 13. Exhibits: |
| (a)(1) Not applicable |
| (b) The certifications required by Rule 30a-2(b) under the Investment Company Act of 1940, as amended, are filed herewith. |
| SIGNATURES |
| Pursuant to the requirements of the Securities Exchange Act of 1934 and the Investment Company Act of 1940, the registrant has duly caused this report to be signed on its behalf by the undersigned, thereunto duly authorized. |
| Putnam Asset Allocation Funds |
| By (Signature and Title): |
| /s/ Janet C. Smith Janet C. Smith Principal Accounting Officer |
| Date: April 28, 2022 |
| Pursuant to the requirements of the Securities Exchange Act of 1934 and the Investment Company Act of 1940, this report has been signed below by the following persons on behalf of the registrant and in the capacities and on the dates indicated. |
| By (Signature and Title): |
| /s/ Jonathan S. Horwitz Jonathan S. Horwitz Principal Executive Officer |
| Date: April 28, 2022 |
| By (Signature and Title): |
| /s/ Janet C. Smith Janet C. Smith Principal Financial Officer |
| Date: April 28, 2022 |
| Certifications | |
| I, Jonathan S. Horwitz, the Principal Executive Officer of the funds listed on Attachment A, certify that: | |
1. I have reviewed each report on Form N-CSR of the funds listed on Attachment A: | |
2. Based on my knowledge, each report does not contain any untrue statements of a material fact or omit to state a material fact necessary to make the statements made, in light of the circumstances under which such statements were made, not misleading with respect to the period covered by each report; | |
3. Based on my knowledge, the financial statements, and other financial information included in each report, fairly present in all material respects the financial condition, results of operations, changes in net assets, and cash flows (if the financial statements are required to include a statement of cash flows) of the registrant as of, and for, the periods presented in each report; | |
4. The registrant’s other certifying officer and I are responsible for establishing and maintaining disclosure controls and procedures (as defined in Rule 30a-3(c) under the Investment Company Act of 1940) and internal control over financial reporting (as defined in Rule 30a-3(d) under the Investment Company Act of 1940) for the registrant and have: | |
a) designed such disclosure controls and procedures, or caused such disclosure controls and procedures to be designed under our supervision, to ensure that material information relating to the registrant, including its consolidated subsidiaries, is made known to us by others within those entities, particularly during the period in which each report is being prepared; | |
b) designed such internal control over financial reporting, or caused such internal control over financial reporting to be designed under our supervision, to provide reasonable assurance regarding the reliability of financial reporting and the preparation of financial statements for external purposes in accordance with generally accepted accounting principles; | |
c) evaluated the effectiveness of the registrant’s disclosure controls and procedures and presented in this report our conclusions about the effectiveness of the disclosure controls and procedures, as of a date within 90 days prior to the filing date of each report based on such evaluation; and | |
d) disclosed in this report any change in the registrant’s internal control over financial reporting that occurred during the period covered by the registrant’s report that has materially affected, or is reasonably likely to materially affect, the registrant’s internal control over financial reporting; and | |
5. The registrant’s other certifying officer and I have disclosed to each registrant’s auditors and the audit committee of each registrant’s board of directors (or persons performing the equivalent functions): | |
a) all significant deficiencies and material weaknesses in the design or operation of internal control over financial reporting which are reasonably likely to adversely affect each registrant’s ability to record, process, summarize, and report financial information; and | |
b) any fraud, whether or not material, that involves management or other employees who have a significant role in each registrant’s internal control over financial reporting. | |
Date: April 28, 2022 | |
/s/ Jonathan S. Horwitz | |
| _______________________ | |
| Jonathan S. Horwitz | |
| Principal Executive Officer | |
Certifications | |
| I, Janet C. Smith, the Principal Financial Officer of the funds listed on Attachment A, certify that: | |
1. I have reviewed each report on Form N-CSR of the funds listed on Attachment A: | |
2. Based on my knowledge, each report does not contain any untrue statements of a material fact or omit to state a material fact necessary to make the statements made, in light of the circumstances under which such statements were made, not misleading with respect to the period covered by each report; | |
3. Based on my knowledge, the financial statements, and other financial information included in each report, fairly present in all material respects the financial condition, results of operations, changes in net assets, and cash flows (if the financial statements are required to include a statement of cash flows) of the registrant as of, and for, the periods presented in each report; | |
4. The registrant’s other certifying officer and I are responsible for establishing and maintaining disclosure controls and procedures (as defined in Rule 30a-3(c) under the Investment Company Act of 1940) and internal control over financial reporting (as defined in Rule 30a-3(d) under the Investment Company Act of 1940) for the registrant and have: | |
a) designed such disclosure controls and procedures, or caused such disclosure controls and procedures to be designed under our supervision, to ensure that material information relating to the registrant, including its consolidated subsidiaries, is made known to us by others within those entities, particularly during the period in which each report is being prepared; | |
b) designed such internal control over financial reporting, or caused such internal control over financial reporting to be designed under our supervision, to provide reasonable assurance regarding the reliability of financial reporting and the preparation of financial statements for external purposes in accordance with generally accepted accounting principles; | |
c) evaluated the effectiveness of the registrant’s disclosure controls and procedures and presented in this report our conclusions about the effectiveness of the disclosure controls and procedures, as of a date within 90 days prior to the filing date of each report based on such evaluation; and | |
d) disclosed in this report any change in the registrant’s internal control over financial reporting that occurred during the period covered by the registrant’s report that has materially affected, or is reasonably likely to materially affect, the registrant’s internal control over financial reporting; and | |
5. The registrant’s other certifying officer and I have disclosed to each registrant’s auditors and the audit committee of each registrant’s board of directors (or persons performing the equivalent functions): | |
a) all significant deficiencies and material weaknesses in the design or operation of internal control over financial reporting which are reasonably likely to adversely affect each registrant’s ability to record, process, summarize, and report financial information; and | |
b) any fraud, whether or not material, that involves management or other employees who have a significant role in each registrant’s internal control over financial reporting. | |
Date: April 28, 2022 | |
/s/ Janet C. Smith | |
| _______________________ | |
| Janet C. Smith | |
| Principal Financial Officer | |
Attachment A | |
Period (s) ended February 28, 2022 | |
| Putnam Emerging Markets Equity Fund | |
| Putnam Floating Rate Income Fund | |
| Putnam Focused Equity Fund | |
| Putnam Global Health Care Fund | |
| Putnam Global Technology Fund | |
| Putnam Income Strategies Portfolio | |
| Putnam International Capital Opportunities Fund | |
| Putnam PanAgora Risk Parity Fund | |
| Putnam Retirement Advantage Fund 2065 | |
| Putnam Retirement Advantage Fund 2060 | |
| Putnam Retirement Advantage Fund 2055 | |
| Putnam Retirement Advantage Fund 2050 | |
| Putnam Retirement Advantage Fund 2045 | |
| Putnam Retirement Advantage Fund 2040 | |
| Putnam Retirement Advantage Fund 2035 | |
| Putnam Retirement Advantage Fund 2030 | |
| Putnam Retirement Advantage Fund 2025 | |
| Putnam Retirement Advantage Maturity Fund | |
| Putnam Small Cap Value Fund |
| Section 906 Certifications | |
| I, Jonathan S. Horwitz, the Principal Executive Officer of the Funds listed on Attachment A, certify that, to my knowledge: | |
1. The form N-CSR of the Funds listed on Attachment A for the period ended February 28, 2022 fully complies with the requirements of Section 13(a) or 15(d) of the Securities Exchange Act of 1934; and | |
2. The information contained in the Form N-CSR of the Funds listed on Attachment A for the period ended February 28, 2022 fairly presents, in all material respects, the financial condition and results of operations of the Funds listed on Attachment A. | |
Date: April 28, 2022 | |
/s/ Jonathan S. Horwitz | |
| ______________________ | |
| Jonathan S. Horwitz | |
| Principal Executive Officer | |
Section 906 Certifications | |
| I, Janet C. Smith, the Principal Financial Officer of the Funds listed on Attachment A, certify that, to my knowledge: | |
1. The form N-CSR of the Funds listed on Attachment A for the period ended February 28, 2022 fully complies with the requirements of Section 13(a) or 15(d) of the Securities Exchange Act of 1934; and | |
2. The information contained in the Form N-CSR of the Funds listed on Attachment A for the period ended February 28, 2022 fairly presents, in all material respects, the financial condition and results of operations of the Funds listed on Attachment A. | |
Date: April 28, 2022 | |
/s/ Janet C. Smith | |
| ______________________ | |
| Janet C. Smith | |
| Principal Financial Officer | |
Attachment A | |
Period (s) ended February 28, 2022 | |
| Putnam Emerging Markets Equity Fund | |
| Putnam Floating Rate Income Fund | |
| Putnam Focused Equity Fund | |
| Putnam Global Health Care Fund | |
| Putnam Global Technology Fund | |
| Putnam Income Strategies Portfolio | |
| Putnam International Capital Opportunities Fund | |
| Putnam PanAgora Risk Parity Fund | |
| Putnam Retirement Advantage Fund 2065 | |
| Putnam Retirement Advantage Fund 2060 | |
| Putnam Retirement Advantage Fund 2055 | |
| Putnam Retirement Advantage Fund 2050 | |
| Putnam Retirement Advantage Fund 2045 | |
| Putnam Retirement Advantage Fund 2040 | |
| Putnam Retirement Advantage Fund 2035 | |
| Putnam Retirement Advantage Fund 2030 | |
| Putnam Retirement Advantage Fund 2025 | |
| Putnam Retirement Advantage Maturity Fund | |
| Putnam Small Cap Value Fund |
Create E-mail Alert Related Categories
SEC FilingsRelated Entities
Putnam InvestmentsSign up for StreetInsider Free!
Receive full access to all new and archived articles, unlimited portfolio tracking, e-mail alerts, custom newswires and RSS feeds - and more!
