

Form N-CSRS KIRR MARBACH PARTNERS For: Mar 31
 Tweet
Tweet Share
ShareUNITED STATES
SECURITIES AND EXCHANGE COMMISSION
Washington, D.C. 20549
SECURITIES AND EXCHANGE COMMISSION
Washington, D.C. 20549
FORM N-CSR
CERTIFIED SHAREHOLDER REPORT OF REGISTERED MANAGEMENT INVESTMENT COMPANIES
Investment Company Act file number 811-09067
Kirr, Marbach Partners Funds, Inc.
(Exact name of registrant as specified in charter)
(Exact name of registrant as specified in charter)
621 Washington Street, Columbus, IN 47201
(Address of principal executive offices) (Zip code)
(Address of principal executive offices) (Zip code)
Kirr, Marbach & Company, LLC, 621 Washington Street, Columbus, IN 47201
(Name and address of agent for service)
(Name and address of agent for service)
(812) 376-9444
Registrant's telephone number, including area code
Date of fiscal year end: September 30, 2023
Date of reporting period: March 31, 2023
Item 1. Report to Stockholders.
|
(a)
|
Kirr, Marbach Partners
Value Fund
|
Semi-Annual Report
|
|
|
www.kmpartnersfunds.com
|
March 31, 2023
|
KIRR, MARBACH PARTNERS
VALUE FUND
“What we anticipate seldom occurs; what we least expected generally happens”
— Benjamin Disraeli
May 10, 2023
Dear Fellow Shareholders:
As we stated in our letter for the fiscal year ending September 30, 2022, the financial markets and economy had been hit by their own metaphorical Hurricane Ian in 2022, with stocks firmly in “bear
market” territory (down more than 20%). Fortunately, U.S. stocks and Value Fund posted strong recoveries in the ensuing six-month period ending March 31, 2023. As you can see in the table below, Value Fund significantly outperformed the S&P 500
for the six-months. We are particularly pleased with performance because Strategas Research Partners calculated ten big technology stocks accounted for 90% of the gain ($2.094 trillion of the
$2.336 trillion increase in the S&P 500’s market capitalization) during the three-months ending March 31, 2023. Fortunately, Value Fund owns Alphabet Inc. and Broadcom, Inc.. Because the advance was extremely narrow, actively-managed funds (like Value Fund) faced a stiff challenge.

1
KIRR, MARBACH PARTNERS
VALUE FUND
Priods ending March 31, 2023(3)
(Total Returns-Dividends Reinvested in Index-Annualized*)
|
KM Value Fund(1)
|
S&P 500 Index(2)
|
|
|
Six-months
|
18.31%
|
15.62%
|
|
One-year*
|
-6.16%
|
-7.73%
|
|
Two-years*
|
2.24%
|
3.30%
|
|
Three-years*
|
21.14%
|
18.60%
|
|
Five-years*
|
4.26%
|
11.19%
|
|
Ten-years*
|
6.27%
|
12.24%
|
|
Since Inception*
|
||
|
December 31, 1998
|
6.92%
|
7.09%
|
The Fund’s Gross Expense Ratio and Net Expense Ratio were 1.66% and 1.45%, respectively, according to the Prospectus dated January 27, 2023. Contractual fee waivers are in effect
until February 28, 2024.
Performance data quoted represents past performance; past performance is no guarantee of future results. The investment return and principal value of an investment will fluctuate so
that an investor’s shares, when redeemed, may be worth more or less than their original cost. Current performance of the fund may be lower or higher than the performance quoted. Performance data current to the most recent month-end may be obtained
by calling 1-800-870-8039. The fund imposes a 1.00% redemption fee on shares held less than 30 days. Performance data quoted does not reflect the redemption fee. If reflected, total returns would be reduced.
|
(1)
|
The performance data quoted assumes the reinvestment of capital gains and income distributions. The performance does not reflect the deduction of taxes that a shareholder would pay on Fund
distributions or the redemption of Fund shares.
|
|
(2)
|
The S&P 500 Index is an unmanaged, capitalization-weighted index generally representative of the U.S. market for large capitalization stocks. This Index cannot be invested in directly.
|
|
(3)
|
One-year, Two-years, Three-years, Five-years, Ten-years and Since Inception returns are Average Annualized Returns.
|
Fed Policy and the Economy
Way back in June of 2020 the U.S. economy was still very much in the grips of the pandemic. Backed by the work and expertise of its 400 PhD economists, Fed officials confidently predicted that by 2022
the U.S. would still be facing 5.5% unemployment and inflation would be running at 1.7%, below its target of 2%. Further, Fed officials expected to keep interest rates close to 0% through
the end of 2022. As Fed Chair Jerome Powell famously stated at the time, “we’re not even thinking about thinking about raising rates.” Think about that!
Fast forward and the CPI (Consumer Price Index) peaked at a 40-year high of 9.1% in June of 2022 and unemployment has been running at 50-year lows, around 3.5%. In March of 2022, the Fed slammed on the
brakes on its “accommodative” monetary policy and abruptly reversed course to “restrictive,” rapidly increasing short-term interest rates from essentially 0% at the start of 2022 to 4.5% at the end of 2022 (currently 5%), the most aggressive cycle of rate increases since the early 1980s. During this campaign, Fed officials have 1) made it clear slaying inflation is their top priority and 2) expressed confidence they
can achieve this without putting the economy through the windshield (tell that to Silicon Valley Bank).
Several economic indicators we look at show the economy is slowing. The illustration below shows the Conference Board Leading Economic Index (LEI—comprised of ten components) has rolled over. The LEI
fell by 0.3% in February (most recent reading), its eleventh consecutive monthly decline. An inverted yield curve occurs when
short-term U.S. Treasury yields exceed long-term yields, indicating investors think the economy will be weaker and interest rates lower in the future. The yield curve has now been inverted for four consecutive quarters, with the gap between the
two-year and ten-year yields of 1.07% on March 8 the biggest
2
KIRR, MARBACH PARTNERS
VALUE FUND
inversion since 1981. Since an inversion has preceded every recent recession, many investors view an inversion as a precursor to a recession. However, not every inversion has been a
harbinger of recession. Every salmon is a fish, but not every fish is a salmon.

The National Bureau of Economic Research (NBER) is the authority determining the start and end of U.S. recessions, defined as a “significant decline in economic activity spread across the economy,
lasting more than a few months, normally visible in real GDP, real income, employment, industrial production and wholesale-retail sales.” The NBER’s pronouncements are based on both a “squishy” definition and backward-looking data, so we would not
be surprised if it turns out we’re already in a recession.
There are a million factors that impact the economy, many of which are dependent on other factors. This makes the economy impossible to predict with any accuracy, but people like the 400 PhDs at the
Fed still try! That doesn’t give us a whole lot of confidence in their predictions.
Cash earning 4% is nice for now, but it’s NOT an investment
As our good friend Jay Mooreland, CFP of the Behavioral Finance Network says, moving to Cash during uncertain times is nothing more than trading potential long-term growth for temporary relief from
negative news and stock price fluctuations. It is not investing.
3
KIRR, MARBACH PARTNERS
VALUE FUND
Investing is owning securities for the long-term with recognition the capital markets have always been uncertain and experienced fluctuation. We never make predictions, especially in writing, but are
pretty sure the possible breaching of the U.S. debt ceiling will be in the headlines before too long. Investors enter the “game” understanding uncertainty and temporary negative returns are the price one must pay to participate in the long-term
wealth generating power of capital markets.
Summary
Investors were subject to a full-blown banking crisis in March, as Silvergate Bank, Silicon Valley Bank and Signature Bank all failed and threatened to take the regional bank sector down with them. The
contagion threatened to go global and Swiss authorities were forced to arrange a hasty “shotgun wedding” between behemoths UBS and Credit Suisse. This “out of the blue” crisis reinforced a couple important points:
|
•
|
The economy/market will do something that surprises us (and the experts). In hindsight we’ll wonder how we didn’t see it.
|
|
•
|
The financial media will emotionalize headlines and short-term market moves to entice you to tune in—so they can achieve better ratings.
|
|
•
|
Conviction, patience and discipline are virtues every investor should develop. They aren’t easy, yet they are essential for your
success. As your adviser, one of our most important roles is helping you ignore the noise and focus on what really matters to your financial success.
|
Percent Change in Top Ten Holdings from Book Cost (as of 3/31/2023)
|
1.
|
AutoZone, Inc.
|
+2186.9
|
%
|
6.
|
Broadcom, Inc.
|
+170.2
|
%
|
|||||
|
2.
|
EMCOR Group, Inc.
|
+3914.6
|
%
|
7.
|
Aon Plc.
|
+220.5
|
%
|
|||||
|
3.
|
MasTec, Inc.
|
+444.7
|
%
|
8.
|
Canadian Pacific Railway Ltd.
|
+2486.2
|
%
|
|||||
|
4.
|
Dollar Tree, Inc.
|
+1975.2
|
%
|
9.
|
Constellation Software Inc
|
+94.5
|
%
|
|||||
|
5.
|
Colliers International Group, Inc.
|
+177.6
|
%
|
10.
|
Alphabet Inc.
|
+72.2
|
%
|
Performance quoted represents past performance and is no guarantee of future results.
Fund holdings and sector allocations are subject to change and are not recommendations to buy or sell any security.
Regards,
 |
 |
|
Mark D. Foster, CFA
|
Mickey Kim, CFA
|
|
President
|
Vice-President, Treasurer and Secretary
|
Past performance is not a guarantee of future results.
Mutual fund investing involves risk. Principal loss is possible.
Value Fund invests in foreign securities, which involves greater volatility and political, economic and currency risks and differences in accounting methods. Value Fund may also
invest in small- and medium-capitalization companies, which tend to have more limited liquidity and greater price volatility than large-capitalization companies.
The Conference Board Leading Economic Index® (LEI) for the
U.S. is one of the key elements in an analytic system designed to signal peaks and troughs in the business cycle. The leading, coincident, and lagging economic indexes are essentially composite averages of several individual leading, coincident, or
lagging indicators. They are constructed to summarize and reveal common turning point patterns in economic data in a clearer and more convincing manner than any individual component – primarily because they smooth out some of the volatility of
individual components. The ten components of Leading Economic Index for the U.S. include:
4
KIRR, MARBACH PARTNERS
VALUE FUND
Average weekly hours, manufacturing
Average weekly initial claims for unemployment insurance
Manufacturers’ new orders, consumer goods and materials
ISM Index of New Orders
Manufacturers’ new orders, nondefense capital goods excluding aircraft orders
Building permits, new private housing units
Stock prices, 500 common stocks
Leading Credit Index™
Interest rate spread, 10-year Treasury bonds less federal funds
Average consumer expectations for business conditions
Please refer to the Schedule of Investments for complete fund holdings information.
The information provided herein represents the opinion of Value Fund’s investment adviser and is not intended to be a forecast of future events, a guarantee of future results, nor investment advice.
This material must be preceded or accompanied by a current Prospectus.
Quasar Distributors, LLC is the Distributor for Value Fund.
5
KIRR, MARBACH PARTNERS
VALUE FUND
Value of $10,000 Investment (Unaudited)
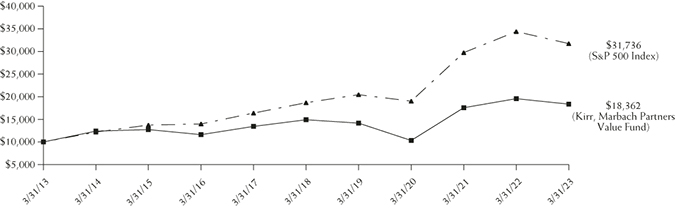
This chart assumes an initial investment of $10,000. Performance reflects fee waivers in effect. In the absence of fee waivers, total return would be reduced. Past performance is not
predictive of future performance. Investment return and principal value will fluctuate, so that your shares, when redeemed maybe worth more or less than their original cost. Performance assumes the reinvestment of capital gains and income
distributions. The performance does not reflect the deduction of taxes that a shareholder would pay on Fund distributions or the redemption of Fund shares.
|
Average Annual Rate of Return (%)
|
||||
|
One Year Ended
|
Five Years Ended
|
Ten Years Ended
|
Since Inception* to
|
|
|
March 31, 2023
|
March 31, 2023
|
March 31, 2023
|
March 31, 2023
|
|
|
Kirr Marbach Partners Value Fund
|
-6.16%
|
4.26%
|
6.27%
|
6.92%
|
|
S&P 500 Index**
|
-7.73%
|
11.19%
|
12.24%
|
7.09%
|
|
*
|
December 31, 1998
|
|
|
**
|
The Standard & Poor’s 500 Index (S&P 500) is an unmanaged, capitalization-weighted index generally representative of the U.S. market for large capitalization stocks. This Index cannot be
invested in directly.
|
6
KIRR, MARBACH PARTNERS
VALUE FUND
Expense Example
March 31, 2023 (Unaudited)
As a shareholder of the Fund, you incur two types of costs: (1) transaction costs, which may include redemption fees; and exchange fees; and (2) ongoing costs, including management fees; distribution
fees; and other Fund expenses. This Example is intended to help you understand your ongoing costs (in dollars) of investing in the Fund and to compare these costs with the ongoing costs of investing in other mutual funds. The Example is based on an
investment of $1,000 invested at the beginning of the period and held for the entire period (October 1, 2022 – March 31, 2023).
Actual Expenses
The first line of the table below provides information about actual account values and actual expenses. Although the Fund charges no sales load or transaction fees, you will be assessed fees for
outgoing wire transfers, returned checks and stop payment orders at prevailing rates charged by U.S. Bancorp Fund Services, LLC, doing business as U.S. Bank Global Fund Services, the Fund’s transfer agent. If you request that a redemption be made by
wire transfer, currently a $15.00 fee is charged by the Fund’s transfer agent. You will be charged a transaction fee equal to 1.00% of the net amount of the redemption if you redeem your shares within 30 days of purchase. IRA accounts will be charged
a $15.00 annual maintenance fee. To the extent the Fund invests in shares of other investment companies as part of its investment strategy, you will indirectly bear your proportionate share of any fees and expenses charged by the underlying funds in
which the Fund invests in addition to the expenses of the Fund. Actual expenses of the underlying funds are expected to vary among the various underlying funds. These expenses are not included in the example below. The example below includes, but is
not limited to, management fees, shareholder servicing fees, fund accounting, custody and transfer agent fees. However, the example below does not include portfolio trading commissions and related expenses, interest expense and other extraordinary
expenses as determined under generally accepted accounting principles. You may use the information in this line, together with the amount you invested, to estimate the expenses that you paid over the period. Simply divide your account value by $1,000
(for example, an $8,600 account value divided by $1,000 = 8.6), then multiply the result by the number in the first line under the heading entitled “Expenses Paid During Period” to estimate the expenses you paid on your account during this period.
Hypothetical Example For Comparison Purposes
The second line of the table below provides information about hypothetical account values and hypothetical expenses based on the Fund’s actual expense ratio and an assumed rate of return of 5% per year
before expenses, which is not the Fund’s actual return. The hypothetical account values and expenses may not be used to estimate the actual ending account balance or expenses you paid for the period. You may use this information to compare the
ongoing costs of investing in the Fund and other funds. To do so, compare this 5% hypothetical example with the 5% hypothetical examples that appear in the shareholder reports of the other funds.
Please note that the expenses shown in the table are meant to highlight your ongoing costs only and do not reflect any transactional costs, such as redemption fees, or exchange fees. Therefore, the
second line of the table is useful in comparing ongoing costs only, and will not help you determine the relative total costs of owning different funds. In addition, if these transactional costs were included, your costs would have been higher.
|
Beginning
|
Ending
|
Expense Paid
|
|
|
Account Value
|
Account Value
|
During Period
|
|
|
10/1/22
|
3/31/23
|
10/1/22 – 3/31/23(1)
|
|
|
Actual
|
$1,000.00
|
$1,183.10
|
$7.89
|
|
Hypothetical (5% return before expenses)
|
1,000.00
|
1,017.70
|
7.29
|
|
(1)
|
Expenses are equal to the Fund’s annualized expense ratio after reimbursement of 1.45% multiplied by the average account value over the period, multiplied by 182/365 to reflect the one-half year
period. The annualized expense ratio prior to reimbursement was 1.56%.
|
7
KIRR, MARBACH PARTNERS
VALUE FUND
Allocation of Portfolio Net Assets (Unaudited)
March 31, 2023

Top Ten Equity Holdings (Unaudited)
as of March 31, 2023
(% of net assets)
|
AutoZone, Inc.
|
6.3%
|
|
EMCOR Group, Inc
|
5.4%
|
|
MasTec, Inc.
|
4.9%
|
|
Dollar Tree, Inc.
|
4.9%
|
|
Colliers International Group, Inc
|
4.8%
|
|
Broadcom, Inc.
|
4.6%
|
|
Aon Plc – Class A
|
4.3%
|
|
Canadian Pacific Railway Ltd.
|
4.1%
|
|
Constellation Software, Inc.
|
4.1%
|
|
Alphabet, Inc. – Class A
|
4.0%
|
8
KIRR, MARBACH PARTNERS
VALUE FUND
Schedule of Investments
March 31, 2023 (Unaudited)
|
Number
|
|||||||
|
of Shares
|
Value
|
||||||
|
COMMON STOCKS – 95.7%
|
|||||||
|
Basic Materials – 2.5%
|
|||||||
|
16,507
|
Innospec, Inc.
|
$
|
1,694,774
|
||||
|
Communications – 8.7%
|
|||||||
|
26,480
|
Alphabet, Inc. – Class A*
|
2,746,770
|
|||||
|
13,190
|
Anterix, Inc.*
|
435,798
|
|||||
|
23,150
|
eBay, Inc.
|
1,027,165
|
|||||
|
5,350
|
Liberty SiriusXM Group – Class A*
|
150,282
|
|||||
|
30,880
|
Liberty SiriusXM Group – Class C*
|
864,331
|
|||||
|
7,170
|
The Walt Disney Co.*
|
717,932
|
|||||
|
5,942,278
|
|||||||
|
Consumer Cyclical – 16.3%
|
|||||||
|
1,733
|
AutoZone, Inc.*
|
4,259,974
|
|||||
|
23,019
|
Dollar Tree, Inc.*
|
3,304,377
|
|||||
|
50,380
|
The Shyft Group, Inc.
|
1,146,145
|
|||||
|
15,043
|
Visteon Corp.*
|
2,359,194
|
|||||
|
11,069,690
|
|||||||
|
Consumer Non Cyclical – 14.4%
|
|||||||
|
119,165
|
Alight, Inc. – Class A*
|
1,097,509
|
|||||
|
36,980
|
API Group Corp.*
|
831,310
|
|||||
|
21,471
|
Brink’s Co.
|
1,434,263
|
|||||
|
30,611
|
Colliers International Group, Inc.
|
3,230,991
|
|||||
|
20,654
|
GXO Logistics, Inc.*
|
1,042,201
|
|||||
|
4,675
|
ICU Medical, Inc.*
|
771,188
|
|||||
|
18,410
|
Inmode Ltd.*
|
588,384
|
|||||
|
20,590
|
Stride, Inc.*
|
808,157
|
|||||
|
9,804,003
|
|||||||
|
Energy – 6.4%
|
|||||||
|
43,825
|
Coterra Energy, Inc.
|
1,075,466
|
|||||
|
17,723
|
Marathon Petroleum Corp.
|
2,389,592
|
|||||
|
4,230
|
Pioneer Natural Resources Co.
|
863,935
|
|||||
|
4,328,993
|
|||||||
|
Financial – 12.2%
|
|||||||
|
9,300
|
Aon Plc – Class A
|
2,932,197
|
|||||
|
6,821
|
Brookfield Asset
|
||||||
|
Management Ltd. – Class A
|
223,183
|
||||||
|
27,285
|
Brookfield Corp.
|
889,218
|
|||||
|
1,816
|
Markel Corp.*
|
2,319,777
|
|||||
|
27,024
|
Voya Financial, Inc.
|
1,931,135
|
|||||
|
8,295,510
|
|||||||
|
Number
|
|||||||
|
of Shares
|
Value
|
||||||
|
Industrials – 19.4%
|
|||||||
|
36,270
|
Canadian Pacific Railway Ltd.
|
$
|
2,790,614
|
||||
|
22,393
|
EMCOR Group, Inc.
|
3,640,878
|
|||||
|
35,164
|
MasTec, Inc.*
|
3,320,888
|
|||||
|
19,485
|
Republic Services, Inc.
|
2,634,762
|
|||||
|
39,844
|
RXO, Inc.*
|
782,536
|
|||||
|
13,169,678
|
|||||||
|
Technology – 13.6%
|
|||||||
|
4,908
|
Broadcom, Inc.
|
3,148,678
|
|||||
|
1,465
|
Constellation Software, Inc.
|
2,754,298
|
|||||
|
54,055
|
Dropbox, Inc. – Class A*
|
1,168,669
|
|||||
|
4,395
|
Lumine Group, Inc.*
|
47,836
|
|||||
|
33,582
|
SS&C Technologies Holdings, Inc.
|
1,896,376
|
|||||
|
2,725
|
Topicus.com, Inc.*
|
194,732
|
|||||
|
9,210,589
|
|||||||
|
Utilities – 2.2%
|
|||||||
|
62,769
|
Vistra Energy Corp.
|
1,506,456
|
|||||
|
TOTAL COMMON STOCKS
|
|||||||
|
(Cost $30,768,775)
|
65,021,971
|
||||||
|
MONEY MARKET FUND – 4.5%
|
|||||||
|
3,060,459
|
First American Government
|
||||||
|
Obligations Fund –
|
|||||||
|
Class X, 4.64%**
|
3,060,459
|
||||||
|
(Cost $3,060,459)
|
|||||||
|
Total Investments
|
|||||||
|
(Cost $33,829,234) – 100.2%
|
68,082,430
|
||||||
|
Other Assets and Liabilities,
|
|||||||
|
Net – (0.2)%
|
(109,677
|
)
|
|||||
|
TOTAL NET ASSETS – 100.0%
|
$
|
67,972,753
|
|||||
|
*
|
Non-income producing security.
|
|
|
**
|
Rate in effect as of March 31, 2023.
|
See Notes to the Financial Statements
9
KIRR, MARBACH PARTNERS
VALUE FUND
Statement of Assets and Liabilities
March 31, 2023
(Unaudited)
|
ASSETS:
|
||||
|
Investments, at current value
|
||||
|
(cost $33,829,234)
|
$
|
68,082,430
|
||
|
Cash
|
1,623
|
|||
|
Prepaid expenses
|
20,757
|
|||
|
Dividends receivable
|
14,805
|
|||
|
Interest receivable
|
14,110
|
|||
|
Receivable for Fund shares sold
|
6,583
|
|||
|
Total Assets
|
68,140,308
|
|||
|
LIABILITIES:
|
||||
|
Payable for legal fees
|
55,281
|
|||
|
Payable to Adviser
|
53,080
|
|||
|
Payable for Fund shares redeemed
|
20,000
|
|||
|
Accrued expenses
|
39,194
|
|||
|
Total liabilities
|
167,555
|
|||
|
NET ASSETS
|
$
|
67,972,753
|
||
|
NET ASSETS CONSIST OF:
|
||||
|
Capital Stock
|
32,224,051
|
|||
|
Total Distributable Earnings
|
35,748,702
|
|||
|
Total Net Assets
|
$
|
67,972,753
|
||
|
Shares outstanding (500,000,000
|
||||
|
shares of $0.01 par value authorized)
|
2,736,351
|
|||
|
Net asset value and offering price per share(1)
|
$
|
24.84
|
||
|
(1)
|
A redemption fee is assessed against shares redeemed within 30 days of purchase.
|
Statement of Operations
Six Months Ended March 31, 2023
(Unaudited)
|
INVESTMENT INCOME:
|
||||
|
Dividend income
|
||||
|
(net of withholding of $3,630)
|
$
|
410,344
|
||
|
Interest income
|
77,930
|
|||
|
Total Investment Income
|
488,274
|
|||
|
EXPENSES:
|
||||
|
Investment Adviser fees
|
333,104
|
|||
|
Legal fees
|
50,323
|
|||
|
Administration fees
|
28,692
|
|||
|
Distribution fees
|
25,005
|
|||
|
Transfer agent fees
|
17,575
|
|||
|
Federal & state registration fees
|
14,415
|
|||
|
Fund accounting fees
|
13,286
|
|||
|
Audit fees
|
11,069
|
|||
|
Postage & printing fees
|
7,257
|
|||
|
Custody fees
|
7,089
|
|||
|
Directors fees
|
5,983
|
|||
|
Other
|
4,391
|
|||
|
Total expenses before reimbursement
|
518,189
|
|||
|
Less: Reimbursement from Investment Adviser
|
(35,189
|
)
|
||
|
Net Expenses
|
483,000
|
|||
|
NET INVESTMENT INCOME
|
5,274
|
|||
|
REALIZED AND UNREALIZED
|
||||
|
GAIN ON INVESTMENTS:
|
||||
|
Net realized gains on investments
|
1,633,363
|
|||
|
Net change in unrealized
|
||||
|
appreciation on investments
|
9,184,636
|
|||
|
Net realized and unrealized
|
||||
|
gain on investments
|
10,817,999
|
|||
|
NET INCREASE IN NET ASSETS
|
||||
|
RESULTING FROM OPERATIONS
|
$
|
10,823,273
|
||
See Notes to the Financial Statements
10
KIRR, MARBACH PARTNERS
VALUE FUND
Statements of Changes in Net Assets
|
Six Months Ended
|
||||||||
|
March 31, 2023
|
Year ended
|
|||||||
|
(Unaudited)
|
September 30, 2022
|
|||||||
|
OPERATIONS:
|
||||||||
|
Net investment income (loss)
|
$
|
5,274
|
$
|
(601,414
|
)
|
|||
|
Net realized gain on investments
|
1,633,363
|
1,901,816
|
||||||
|
Net change in unrealized appreciation (depreciation) on investments
|
9,184,636
|
(12,429,724
|
)
|
|||||
|
Net increase (decrease) in net assets resulting from operations
|
10,823,273
|
(11,129,322
|
)
|
|||||
|
CAPITAL SHARE TRANSACTIONS:
|
||||||||
|
Proceeds from shares sold
|
497,024
|
2,696,741
|
||||||
|
Proceeds from reinvestment of distributions
|
2,174,489
|
2,717,301
|
||||||
|
Payments for shares redeemed
|
(2,534,489
|
)
|
(4,107,579
|
)
|
||||
|
Redemption fees
|
—
|
1
|
||||||
|
Net increase in net assets resulting from capital share transactions
|
137,024
|
1,306,464
|
||||||
|
DISTRIBUTIONS TO SHAREHOLDERS:
|
(2,259,496
|
)
|
(2,823,959
|
)
|
||||
|
TOTAL INCREASE (DECREASE) IN NET ASSETS
|
8,700,801
|
(12,646,817
|
)
|
|||||
|
NET ASSETS:
|
||||||||
|
Beginning of period
|
59,271,952
|
71,918,769
|
||||||
|
End of period
|
$
|
67,972,753
|
$
|
59,271,952
|
||||
|
CHANGES IN SHARES OUTSTANDING:
|
||||||||
|
Shares sold
|
20,482
|
101,382
|
||||||
|
Shares issued to holders in reinvestment of dividends
|
93,890
|
98,275
|
||||||
|
Shares redeemed
|
(103,689
|
)
|
(154,546
|
)
|
||||
|
Net increase in shares outstanding
|
10,683
|
45,111
|
||||||
See Notes to the Financial Statements
11
KIRR, MARBACH PARTNERS
VALUE FUND
Financial Highlights
For a Fund share outstanding throughout the period.
|
March 31, 2023(1)
|
Year Ended September 30, | |||||||||||||||||||||||
|
(Unaudited)
|
2022
|
2021
|
2020
|
2019
|
2018
|
|||||||||||||||||||
|
PER SHARE DATA:
|
||||||||||||||||||||||||
|
Net asset value, beginning of period
|
$
|
21.75
|
$
|
26.83
|
$
|
19.27
|
$
|
22.01
|
$
|
25.49
|
$
|
25.03
|
||||||||||||
|
Investment operations:
|
||||||||||||||||||||||||
|
Net investment gain (loss)
|
—
|
(0.22
|
)
|
(0.14
|
)
|
(0.08
|
)
|
(0.05
|
)
|
(0.10
|
)
|
|||||||||||||
|
Net realized and unrealized
|
||||||||||||||||||||||||
|
gain (loss) on investments
|
3.92
|
(3.79
|
)
|
8.01
|
(2.18
|
)
|
(1.71
|
)
|
2.27
|
|||||||||||||||
|
Total from investment operations
|
3.92
|
(4.01
|
)
|
7.87
|
(2.26
|
)
|
(1.76
|
)
|
2.17
|
|||||||||||||||
|
Less distributions:
|
||||||||||||||||||||||||
|
Dividends from net investment income
|
—
|
—
|
—
|
—
|
—
|
—
|
||||||||||||||||||
|
Dividends from net capital gains
|
(0.83
|
)
|
(1.07
|
)
|
(0.31
|
)
|
(0.48
|
)
|
(1.72
|
)
|
(1.71
|
)
|
||||||||||||
|
Total distributions
|
(0.83
|
)
|
(1.07
|
)
|
(0.31
|
)
|
(0.48
|
)
|
(1.72
|
)
|
(1.71
|
)
|
||||||||||||
|
Paid in capital from redemption fees
|
—
|
—
|
(2)
|
—
|
(2)
|
—
|
—
|
(2)
|
—
|
|||||||||||||||
|
Net asset value, end of period
|
$
|
24.84
|
$
|
21.75
|
$
|
26.83
|
$
|
19.27
|
$
|
22.01
|
$
|
25.49
|
||||||||||||
|
TOTAL RETURN
|
18.31
|
%
|
-15.80
|
%
|
41.12
|
%
|
-10.59
|
%
|
-5.53
|
%
|
8.80
|
%
|
||||||||||||
|
SUPPLEMENTAL DATA AND RATIOS:
|
||||||||||||||||||||||||
|
Net assets, end of period (in millions)
|
$
|
68.0
|
$
|
59.3
|
$
|
71.9
|
$
|
54.1
|
$
|
68.2
|
$
|
79.8
|
||||||||||||
|
Ratio of expenses to average net assets:
|
||||||||||||||||||||||||
|
Before expense reimbursement/recoupment
|
1.56
|
%
|
1.66
|
%
|
1.60
|
%
|
1.64
|
%
|
1.54
|
%
|
1.46
|
%
|
||||||||||||
|
After expense reimbursement/recoupment
|
1.45
|
%
|
1.45
|
%
|
1.45
|
%
|
1.45
|
%
|
1.45
|
%
|
1.45
|
%
|
||||||||||||
|
Ratio of net investment income (loss)
|
||||||||||||||||||||||||
|
to average net assets:
|
||||||||||||||||||||||||
|
Before expense reimbursement/recoupment
|
(0.09
|
)%
|
(1.06
|
)%
|
(0.73
|
)%
|
(0.65
|
)%
|
(0.34
|
)%
|
(0.37
|
)%
|
||||||||||||
|
After expense reimbursement/recoupment
|
0.02
|
%
|
(0.84
|
)%
|
(0.58
|
)%
|
(0.46
|
)%
|
(0.25
|
)%
|
(0.36
|
)%
|
||||||||||||
|
Portfolio turnover rate
|
8
|
%
|
14
|
%
|
9
|
%
|
23
|
%
|
22
|
%
|
14
|
%
|
||||||||||||
|
(1)
|
All ratios for the six month period ended March 31, 2023 have been annualized, except total return and portfolio turnover.
|
|
(2)
|
Less than $0.01 per share.
|
See Notes to the Financial Statements
12
KIRR, MARBACH PARTNERS
VALUE FUND
Notes to the Financial Statements
March 31, 2023 (Unaudited)
1. ORGANIZATION AND SIGNIFICANT ACCOUNTING POLICIES
Kirr, Marbach Partners Funds, Inc. (the “Corporation”) was organized as a Maryland corporation on September 23, 1998 and is registered under the Investment Company Act of 1940, as amended (the “1940
Act”), as an open-end diversified management investment company issuing its shares in series, each series representing a distinct portfolio with its own investment objective and policies. The Fund is an investment company and accordingly follows the
investment company accounting and reporting guidance of the Financial Accounting Standards Board (FASB) Accounting Standards Codification Topic 946 “Financial Services-Investment Companies.” The one series presently authorized is Kirr, Marbach
Partners Value Fund (the “Fund”). The investment objective of the Fund is to seek long-term capital growth. The Fund commenced operations on December 31, 1998.
The following is a summary of significant accounting policies consistently followed by the Fund. These policies are in conformity with generally accepted accounting principles in the United States of
America (“GAAP”).
|
a)
|
Investment Valuation – Securities listed on the Nasdaq National Market are valued at the Nasdaq Official Closing Price (“NOCP”). Other securities traded on a national securities exchange
(including options on indices so traded) are valued at the last sales price on the exchange where the security is primarily traded. Exchange-traded securities for which there were no transactions and Nasdaq-traded securities for which there
is no NOCP are valued at the mean of the bid and asked prices. Securities for which market quotations are not readily available are valued at fair value as determined in good faith under the supervision of the Board of Directors. Foreign
securities have been issued by foreign private issuers registered on United States exchanges in accordance with Section 12 of the Securities Exchange Act of 1934. Debt securities, including short-term debt instruments having maturities less
than 60 days, are valued at the mean between the bid and asked prices as reported by an approved pricing service.
|
|
|
The Fund has performed an analysis of all existing investments to determine the significance and character of all inputs to their fair value determination. Various inputs are used in determining
the value of each of the Fund’s investments. These inputs are summarized in the following three broad categories:
|
|
Level 1 –
|
Unadjusted quoted prices in active markets for identical assets or liabilities that the company has the ability to access.
|
||
|
Level 2 –
|
Observable inputs other than quoted prices included in Level 1 that are observable for the asset or liability either directly or indirectly. These inputs may include quoted prices for the
identical instruments on an inactive market, prices for similar instruments, interest rates, prepayment speeds, credit risk, yield curves, default rates, and similar data.
|
||
|
Level 3 –
|
Unobservable inputs for the asset or liability to the extent that relevant observable inputs are not available, representing the company’s own assumptions about the assumptions that a market
participant would use in valuing the asset or liability, and that would be based on the best information available.
|
|
The availability of observable inputs can vary from security to security and is affected by a wide variety of factors, including, for example, the type of security, whether the security is new
and not yet established in the marketplace, the liquidity of markets, and other characteristics particular to the security. To the extent that valuation is based on models or inputs that are less observable or
|
13
KIRR, MARBACH PARTNERS
VALUE FUND
Notes to the Financial Statements (Continued)
March 31, 2023 (Unaudited)
|
unobservable in the market, the determination of fair value requires more judgment. Accordingly, the degree of judgment exercised in determining fair value is greatest for instruments
categorized in Level 3.
|
||
|
The inputs used to measure fair value may fall into different levels of the fair value hierarchy. In such cases, for disclosure purposes, the level in the fair value hierarchy within which the
fair value measurement falls in its entirety, is determined based on the lowest level input that is significant to the fair value measurement in its entirety.
|
||
|
The inputs or methodology used for valuing securities are not an indication of the risk associated with investing in those securities. The following is a summary of the inputs used to value the
Fund’s investments as of March 31, 2023:
|
|
Level 1
|
Level 2
|
Level 3
|
Total
|
||||||||||||||
|
Common Stocks
|
$
|
65,021,971
|
$
|
—
|
$
|
—
|
$
|
65,021,971
|
|||||||||
|
Short-Term Investment
|
3,060,459
|
—
|
—
|
3,060,459
|
|||||||||||||
|
Total Investments
|
$
|
68,082,430
|
$
|
—
|
$
|
—
|
$
|
68,082,430
|
|||||||||
|
Refer to the Schedule of Investments for industry classifications.
|
||
|
b)
|
Federal Income Taxes – A provision, for federal income taxes or excise taxes, has not been made since the Fund has elected to be taxed as a “regulated investment company” and intends to
distribute substantially all taxable income to its shareholders and otherwise comply with the provisions of the Internal Revenue Code applicable to regulated investment companies. There is no tax liability resulting from unrecognized tax
benefits relating to uncertain income tax positions taken or expected to be taken on the tax return for the fiscal year ended September 30, 2022, or for any other tax years which are open for exam. As of September 30, 2022, open tax years
include the tax years ended September 30, 2019 through 2022. The Fund is also not aware of any tax positions for which it is reasonably possible that the total amounts of unrecognized tax benefits will significantly change in the next twelve
months. The Fund recognizes interest and penalties, if any, related to unrecognized tax benefits as income tax expense in the Statement of Operations. During the period ended March 31, 2023, the Fund did not incur any interest or penalties.
|
|
|
c)
|
Income and Expenses – The Fund is charged for those expenses that are directly attributable to the Fund, such as advisory, administration and certain shareholder service fees.
|
|
|
d)
|
Distributions to Shareholders – Dividends from net investment income and distributions of net realized capital gains, if any, will be declared and paid at least annually. The character of
distributions made during the year from net investment income or net realized gains may differ from the characterization for federal income tax purposes due to differences in the recognition of income, expense and gain items for financial
statement and tax purposes. All short term capital gains are included in ordinary income for tax purposes.
|
|
|
e)
|
Use of Estimates – The preparation of financial statements in conformity with GAAP requires management to make estimates and assumptions that affect the reported amounts of assets and
liabilities and disclosure of contingent assets and liabilities at the date of the financial statements and the reported amounts of revenues and expenses during the reporting year. Actual results could differ from those estimates.
|
14
KIRR, MARBACH PARTNERS
VALUE FUND
Notes to the Financial Statements (Continued)
March 31, 2023 (Unaudited)
|
f)
|
Repurchase Agreements – The Fund may enter into repurchase agreements with certain banks or non-bank dealers. The Adviser will monitor, on an ongoing basis, the value of the underlying
securities to ensure that the value always equals or exceeds the repurchase price plus accrued interest.
|
|
|
g)
|
Security Transactions and Investment Income – The Fund follows industry practice and records security transactions on the trade date. Realized gains and losses on sales of securities are
calculated on the basis of identified cost. Dividend income is recorded on the ex-dividend date and interest income is recorded on an accrual basis. Withholding taxes on foreign dividends have been provided for in accordance with the Fund’s
understanding of the applicable country’s tax rules and regulations. Discounts and premiums on securities purchased are amortized over the expected life of the respective securities.
|
|
|
The Fund distributes all net investment income, if any, and net realized capital gains, if any, annually. Distributions to shareholders are recorded on the ex-dividend date. The treatment for
financial reporting purposes of distributions made to shareholders during the year from net investment income or net realized capital gains may differ from their ultimate treatment for federal income tax purposes. These differences are caused
primarily by differences in the timing of the recognition of certain components of income, expense or realized capital gain for federal income tax purposes. Where such differences are permanent in nature, GAAP requires that they be
reclassified in the components of the net assets based on their ultimate characterization for federal income tax purposes. Any such reclassifications will have no effect on net assets, results of operations or net asset values per share of
the Fund.
|
||
|
h)
|
Recent Market Events Risk – U.S. and international markets have experienced significant periods of volatility in recent years and months due to a number of economic, political and global macro
factors. Continuing uncertainties regarding interest rates, rising inflation, political events, rising government debt in the U.S. and trade tensions also contribute to market volatility. As a result of continuing political tensions and
armed conflicts, including the war between Ukraine and Russia, the U.S. and the European Union imposed sanctions on certain Russian individuals and companies, including certain financial institutions, and have limited certain exports and
imports to and from Russia. The war has contributed to recent market volatility and may continue to do so.
|
|
|
i)
|
Subsequent Events – Management has evaluated Fund related events and transactions that occurred subsequent to March 31, 2023 through the date of issuance of the Fund’s financial statements.
|
2. INVESTMENT TRANSACTIONS
The aggregate purchases and sales of securities, excluding short-term investments, by the Fund for the period ended March 31, 2023 were as follows:
|
Purchases
|
Sales
|
|||||||
|
U.S. Government
|
$
|
—
|
$
|
—
|
||||
|
Other
|
5,070,565
|
6,134,350
|
||||||
15
KIRR, MARBACH PARTNERS
VALUE FUND
Notes to the Financial Statements (Continued)
March 31, 2023 (Unaudited)
At September 30, 2022, the Fund’s most recently completed fiscal year end, the components of distributable earnings on a tax basis were as follows:
|
Cost of Investments
|
$
|
33,628,673
|
||
|
Gross unrealized appreciation
|
$
|
27,858,813
|
||
|
Gross unrealized depreciation
|
$
|
(2,137,403
|
)
|
|
|
Net unrealized appreciation
|
$
|
25,721,410
|
||
|
Undistributed ordinary income
|
$
|
—
|
||
|
Undistributed long-term capital gain
|
$
|
1,901,674
|
||
|
Total distributable earnings
|
$
|
1,901,674
|
||
|
Other accumulated losses
|
$
|
(438,159
|
)
|
|
|
Total accumulated earnings
|
$
|
27,184,925
|
As of September 30, 2022, the Fund’s most recently completed fiscal year end, the Fund did not have any capital loss carryovers. A regulated investment company may elect for any taxable year to treat
any portion of any qualified late year loss as arising on the first day of the next taxable year. Qualified late year losses are certain capital, and ordinary losses which occur during the portion of the Fund’s taxable year subsequent to October
31. For the taxable year ended September 30, 2022, the Fund had $438,159 in qualified late year losses.
The tax character of distributions paid during the period ended March 31, 2023, were as follows:
|
Ordinary Income*
|
Long Term Capital Gains**
|
Total
|
|
$—
|
$2,259,496
|
$2,259,496
|
The tax character of distributions paid during the year ended September 30, 2022, were as follows:
|
Ordinary Income*
|
Long Term Capital Gains**
|
Total
|
|
$1,002,133
|
$1,821,826
|
$2,823,959
|
|
*
|
For Federal income tax purposes, distributions of short-term capital gains are treated as ordinary income.
|
|
**
|
The Fund also designates as distributions of long-term gains, to the extent necessary to fully distribute such capital gains, earnings and profits distributed to shareholders on the redemption
of shares.
|
3. AGREEMENTS
The Fund has entered into an Investment Advisory Agreement with Kirr, Marbach & Company, LLC (the “Investment Adviser”). Pursuant to its advisory agreement with the Fund, the Investment Adviser is
entitled to receive a fee, calculated daily and payable monthly, at the annual rate of 1.00% as applied to the Fund’s daily net assets.
The Investment Adviser has contractually agreed to waive its management fee and/or reimburse the Fund’s other expenses to the extent necessary to ensure that the Fund’s total annual operating expenses
(excluding acquired fund fees and expenses, interest, taxes, brokerage commissions and extraordinary expenses) do not exceed 1.45% of its average daily net assets until February 28, 2024. The Investment Adviser may decide to continue the agreement,
or revise the total annual operating expense limitations after February 28, 2024. Any waiver or reimbursement is subject to later adjustment to allow the Investment Adviser to recoup amounts waived or reimbursed to the extent actual fees and expenses
for a period are less than the expense limitation
16
KIRR, MARBACH PARTNERS
VALUE FUND
Notes to the Financial Statements (Continued)
March 31, 2023 (Unaudited)
cap of 1.45%, provided, however, that the Investment Adviser shall only be entitled to recoup such amounts for a period of thirty-six months following the date on which such fee waiver or expense
reimbursement was made. Waived/reimbursed fees and expenses subject to potential recovery by month of expiration are as follows:
|
Year of expiration
|
Amount
|
|||
|
April 2023 – September 2023
|
$
|
71,779
|
||
|
October 2023 – September 2024
|
104,719
|
|||
|
October 2024 – September 2025
|
152,632
|
|||
|
October 2025 – September 2026
|
35,189
|
|||
|
$
|
364,319
|
|||
As of March 31, 2023, it was possible, but not probable, those amounts would be recovered by the Investment Adviser. At the end of each fiscal year in the future, the Fund will continue to assess the
potential recovery of waived/reimbursed fees and expenses for financial reporting purposes.
Quasar Distributors, LLC, (the “Distributor”), a wholly-owned broker-dealer subsidiary of Foreside serves as principal underwriter of the shares of the Fund and is not affiliated with U.S. Bancorp. The
Board of Trustees of the Fund has approved a new Distribution Agreement to enable Quasar to continue serving as the Fund’s distributor. The Fund’s shares are sold on a no-load basis and, therefore, the Distributor receives no sales commission or
sales load for providing services to the Fund. The Corporation has adopted a plan pursuant to Rule 12b-1 under the 1940 Act (the “12b-1 Plan”), which authorizes the Corporation to pay the Distributor and certain financial intermediaries who assist in
distributing the Fund shares or who provided shareholder services to Fund shareholders a distribution and shareholder servicing fee of up to 0.25% of the Fund’s average daily net assets (computed on an annual basis). All or a portion of the fee may
be used by the Fund or the Distributor to pay its distribution fee and costs of printing reports and prospectuses for potential investors and the costs of other distribution and shareholder servicing expenses. During the period ended March 31, 2023,
the Fund incurred expenses of $25,005 pursuant to the 12b-1 Plan.
U.S Bancorp Fund Services, LLC, doing business as U.S. Bank Global Fund Services (the “Administrator”), serves as transfer agent, administrator and accounting services agent for the Fund. U.S. Bank,
N.A. serves as custodian for the Fund.
The Fund imposes a 1.00% redemption fee on shares held 30 days or less. For the period ended March 31, 2023 and the year ended September 30, 2022, the Fund collected $0 and $1, respectively, in
redemption fees.
17
KIRR, MARBACH PARTNERS
VALUE FUND
Additional Information
March 31, 2023 (Unaudited)
BOARD APPROVAL OF INVESTMENT ADVISORY AGREEMENT
On November 16, 2022, at an in-person meeting of the Board of Directors of the Kirr, Marbach Partners Fund, Inc. (the “Corporation”), the directors, including a majority of the disinterested directors,
approved the continuation of the investment advisory agreement dated June 10, 2005 (the “Advisory Agreement”) between the Corporation and Kirr, Marbach & Company, LLC (the “Adviser”). It was noted that, as described in the Adviser’s memorandum,
the Adviser has significant experience providing investment advice and is qualified to provide investment advisory services to the Fund. In addition, it was noted that the Adviser promoted a culture of compliance. The directors noted the Fund had
lagging returns versus its benchmark. The directors considered the Adviser’s explanation for the Fund’s underperformance, as well as the Adviser’s value-based philosophy and long-term history of rebounding from periods of underperformance. The
directors also noted that a significant percentage of the Fund is owned by Adviser insiders and therefore the directors feel that the Adviser’s interests are aligned with other Fund shareholders. The directors considered information relating to the
Fund’s fees, costs and expense ratios and compared such fees, costs and expense ratios to competitive industry fee structures and expense ratios. Specifically, the directors reviewed charts prepared by the administrator based on data compiled by a
nationally recognized third-party comparative data provider. In connection with this, the directors also considered the control of the Fund’s operating expenses through the expense cap agreement and noted that the current expense cap agreement
maintains an overall reasonable total expense level as evidenced by the comparative data presented at the meeting. In addition, the Board noted that the Adviser is providing substantially similar investment advisory services to the Fund and its
other separate account clients and, with the current expense cap arrangement in place, is providing such services to the Fund at substantially similar rates to those charged to the Adviser’s other clients. The directors considered whether the
Adviser would receive any fall-out benefits through its relationship with the Fund, and it was noted that because none of the other service providers to the Fund are affiliated with the Adviser, there are no identifiable material fall-out benefits
accruing to the Adviser. The directors considered the Adviser’s cost of providing services to the Fund and the profitability of its relationship to the Fund. It was noted that the Adviser’s profitability was in line with its profitability for
providing investment advice to its separate account clients given the current expense cap agreement, and the directors noted that the Adviser’s profit in connection with its services to the Fund appeared reasonable. The directors considered whether
economies of scale were being realized that could justify reduced expenses for the Fund. It was noted that current asset levels decreased from the prior year. During the deliberations, the disinterested directors did not identify any single
consideration or particular piece of information that was all important or controlling in determining whether to approve the Advisory Agreement. The disinterested directors evaluated all information presented to them and determined that the
compensation paid to the Adviser under the Advisory Agreement was fair and reasonable in light of the services to be performed.
18
KIRR, MARBACH PARTNERS
VALUE FUND
Additional Information (Continued)
March 31, 2023 (Unaudited)
STATEMENT REGARDING LIQUIDITY RISK MANAGEMENT PROGRAM
Kirr Marbach & Company, LLC, as liquidity risk management program administrator and Adviser to the Fund provided an annual report to the Board on the adequacy of the Adviser’s Liquidity Risk
Management Program (LRMP) and the effectiveness of its implementation at the Board’s Quarterly meeting on November 16, 2022. At that Meeting, the Adviser discussed with the Board its annual review and assessment of the Fund’s liquidity risk in
accordance with, and taking into account the factors identified in the LRMP, and confirmed to the Board the following information related to the LRMP.
|
•
|
There were no material changes to the Adviser LRMP Program.
|
|
|
•
|
There was no change in status of the Fund as a PHLF.
|
|
|
•
|
The Fund’s investment strategy is appropriate during both normal and reasonably foreseeable stressed conditions.
|
|
|
•
|
The Adviser reviewed the classifications of the Fund’s portfolio investments monthly.
|
|
|
|
o The Adviser uses the ICE Data Services Liquidity Solution offered through USBFS to do the liquidity classifications for
the Fund’s holdings.
|
|
|
|
o The Adviser believes the classifications were appropriate throughout the year.
|
|
|
•
|
The Fund did not acquire any Illiquid Investment if, immediately after the Acquisition, the Fund would have invested more than 15% of its net assets in Illiquid Investments.
|
|
|
•
|
There were no filings of Form N-LIQUID required by the Fund.
|
|
|
•
|
The Fund was generally able to fund redemptions through cash on hand.
|
|
|
|
o Given the Fund’s portfolio is always generally fully invested, when a relatively large redemption is submitted, the Fund
has been required to sell securities to raise cash.
|
|
|
|
• In the interim, US Bank Custody covers overdrafts and charges the Fund at a rate of Prime Interest plus 2%.
|
|
|
|
o The Fund had no redemptions-in-kind for the year ended September 30, 2022.
|
19
KIRR, MARBACH PARTNERS
VALUE FUND
Additional Information (Continued)
March 31, 2023 (Unaudited)
AVAILABILITY OF FUND PORTFOLIO INFORMATION
The Fund files its complete schedule of portfolio holdings with the SEC for the first and third quarters of each fiscal year on Part F of Form N-PORT, which is available on the SEC’s website at
www.sec.gov. The Fund’s Part F of Form N-PORT may be reviewed and copied at the SEC’s Public Reference Room in Washington D.C. For information on the Public Reference Room call 1-800-SEC-0330.
AVAILABILITY OF PROXY VOTING INFORMATION
Both a description of the Fund’s Proxy Voting Policies and Procedures and information about the Fund’s proxy voting record will be available (1) without charge, upon request, by calling 1-800-870-8039,
and (2) on the SEC’s website at www.sec.gov.
20
Directors
Mark Foster, CFA
Mickey Kim, CFA
Jeffrey N. Brown
John Elwood
Thomas J. Thornburg
Principal Officers
Mark D. Foster, CFA, President
Mickey Kim, CFA, Vice President, Treasurer and Secretary
Investment Adviser
Kirr, Marbach & Company, LLC
621 Washington Street
Columbus, IN 47201
Distributor
Quasar Distributors, LLC
111 East Kilbourn Ave., Suite 2200
Milwaukee, WI 53202
Custodian
U.S. Bank, N.A.
1555 North RiverCenter Drive, Suite 302
Milwaukee, WI 53212
Administrator, Transfer Agent And
Dividend – Disbursing Agent
U.S. Bancorp Fund Services, LLC
615 East Michigan Street
Milwaukee, WI 53202
Independent Registered Public Accounting Firm
Tait, Weller & Baker LLP
Two Liberty Place
50 South 16th Street, Suite 2900
Philadelphia, PA 19102
Legal Counsel
Kirkland & Ellis LLP
300 North LaSalle
Chicago, IL 60654
This report should be accompanied or preceded by a prospectus.
The Fund’s Statement of Additional Information contains additional information about the
Fund’s directors and is available without charge upon request by calling 1-800-808-9444.
The Fund’s Proxy Voting Policies and Procedures are available without charge upon request by calling 1-800-808-9444. A description of the Fund’s proxy voting policies and procedures
is available on the Fund’s website, www.kmpartnersfunds.com, or on the SEC’s website, at www.sec.gov. Information regarding how the Fund voted proxies relating to portfolio securities during the twelve months ended June 30, is available without
charge upon request by calling 1-800-808-9444 or on the SEC's website, at www.sec.gov.
Semi-Annual Report
March 31, 2023
|
(b)
|
Not applicable.
|
Item 2. Code of Ethics.
Not applicable for semi-annual reports.
Item 3. Audit Committee Financial Expert.
Not applicable for semi-annual reports.
Item 4. Principal Accountant Fees and Services.
Not applicable for semi-annual reports.
Item 5. Audit Committee of Listed Registrants.
Not applicable for semi-annual reports.
Item 6. Schedule of Investments.
|
(a)
|
Schedule of Investments is included as part of the report to shareholders filed under Item 1 of this Form.
|
|
(b)
|
Not applicable
|
Item 7. Disclosure of Proxy Voting Policies and Procedures for Closed-End Management Investment Companies.
Not applicable to open-end investment companies.
Item 8. Portfolio Managers of Closed-End Management Investment Companies.
Not applicable to open-end investment companies.
Item 9. Purchases of Equity Securities by Closed‑End Management Investment Company and Affiliated Purchases.
Not applicable to open-end investment companies.
Item 10. Submission of Matters to a Vote of Security Holders.
There have been no material changes to the procedures by which shareholders may recommend nominees to the registrant’s board of trustees.
Item 11. Controls and Procedures.
|
(a)
|
The Registrant’s President and Treasurer have reviewed the Registrant's disclosure controls and procedures (as defined in Rule 30a-3(c) under the Investment Company Act of 1940 (the “Act”)) as of a date within 90 days of the filing of
this report, as required by Rule 30a-3(b) under the Act and Rules 13a-15(b) or 15d‑15(b) under the Securities Exchange Act of 1934. Based on their review, such officers have concluded that the disclosure controls and procedures are
effective in ensuring that information required to be disclosed in this report is appropriately recorded, processed, summarized and reported and made known to them by others within the Registrant and by the Registrant’s service provider.
|
|
(b)
|
There were no significant changes in the Registrant's internal control over financial reporting (as defined in Rule 30a-3(d) under the Act) that occurred during the period covered by this report that has materially affected, or is
reasonably likely to materially affect, the Registrant's internal control over financial reporting.
|
Item 12. Disclosure of Securities Lending Activities for Closed-End Management Investment Companies
Not applicable to open-end investment companies.
Item 13. Exhibits.
|
(a)
|
(1) Any code of ethics or amendment thereto, that is subject of the disclosure required by Item 2, to the extent that the registrant intends to satisfy Item 2 requirements through filing an exhibit. Not
applicable for semi-annual reports.
|
(3) Any written solicitation to purchase securities under Rule 23c‑1 under the Act sent or given during the period covered by the report by or on behalf of the registrant to 10 or more
persons. Not applicable to open-end investment companies.
(4) Change in the registrant’s independent public accountant. There was no change in the registrant’s independent public accountant for the period covered by this report.
SIGNATURES
Pursuant to the requirements of the Securities Exchange Act of 1934 and the Investment Company Act of 1940, the registrant has duly caused this report to be signed on its behalf by the undersigned, thereunto duly
authorized.
(Registrant) Kirr, Marbach Partners Funds, Inc.
By (Signature and Title)* /s/ Mr. Mark Foster
Mr. Mark Foster, President
Date June 6, 2023
Pursuant to the requirements of the Securities Exchange Act of 1934 and the Investment Company Act of 1940, this report has been signed below by the
following persons on behalf of the registrant and in the capacities and on the dates indicated.
By (Signature and Title)* /s/
Mr. Mark Foster
Mr. Mark Foster, President
Date June 6, 2023
By (Signature and Title)* /s/ Mr. Mickey Kim
Mr. Mickey Kim, Treasurer
Date June 6, 2023
ATTACHMENTS / EXHIBITS
Serious News for Serious Traders! Try StreetInsider.com Premium Free!
You May Also Be Interested In
- Rubrik Announces Pricing of Upsized Initial Public Offering
- Best’s Market Segment Report: Underwriting Conditions for UAE Insurers on Track to Improve Amid IFRS 17 Transition
- American Riviera Bancorp Announces Results for the First Quarter of 2024
Create E-mail Alert Related Categories
SEC FilingsSign up for StreetInsider Free!
Receive full access to all new and archived articles, unlimited portfolio tracking, e-mail alerts, custom newswires and RSS feeds - and more!
