

Form N-CSRS Index Funds For: Sep 30
 Tweet
Tweet Share
Share
UNITED STATES
SECURITIES AND EXCHANGE COMMISSION
Washington, D.C. 20549
FORM N-CSRS
CERTIFIED SHAREHOLDER REPORT OF REGISTERED
MANAGEMENT INVESTMENT COMPANIES
Investment Company Act file number : 811-21836
Index Funds
(Exact name of registrant as specified in charter)
200 2nd Ave. South #737
St. Petersburg, FL 33701
(Address of principal executive offices) (Zip code)
Michael G. Willis
200 2nd Ave. South #737
St. Petersburg, FL 33701
(Name and address of agent for service)
Registrant’s telephone number, including area code: 1-808-600-5366
Date of fiscal year end: March 31
Date of reporting period: September 30, 2022
Item 1. Reports to Stockholders.
TABLE OF CONTENTS
| Shareholder Letter | 1 |
| Investment Results | 3 |
| Portfolio Illustration | 4 |
| Schedule of Investments | 6 |
| Statement of Assets and Liabilities | 12 |
| Statement of Operations | 13 |
| Statements of Changes in Net Assets | 14 |
| Financial Highlights | 15 |
| Notes to Financial Statements | 16 |
| Liquidity Risk Management Program | 20 |
| Summary of Fund Expenses | 21 |
| Additional Information | 22 |
| Privacy Policy | 23 |
| Index Funds S&P 500® Equal Weight | Shareholder Letter |
| September 30, 2022 (Unaudited) |
Dear Shareholders,
Discussion of the Fund:
The Index Funds S&P 500® Equal Weight (the “Fund”) is a “no-load” index fund with no commissions and no 12b-1 fee. The Fund’s ticker symbol is INDEX. The Fund portfolio holds approximately 500 of the largest publicly traded companies in the U.S., as selected by Standard & Poor’s. This puts the Fund in the “Large Cap Blend” category.
The Fund seeks to track the S&P 500® Equal Weight Index (the “Equal Weight Index”). The Equal Weight Index uses the same 500 constituents as the S&P 500® Market Cap Index (the “Market Cap Index”). The primary difference is that the Equal Weight Index rebalances its holdings periodically so that, over time, they remain substantially equal.* In our view, this equal distribution of holdings leads to better diversification of the Fund’s portfolio and a broader exposure to the growth cycles of all 500 companies instead of overweighting the largest companies.
Discussion of Fund Performance:
During the six months ended September 30, 2022, the Fund returned -18.58% while the Equal Weight Index declined by -18.46%. The performance of the Fund relative to the Equal Weight Index showed tracking error due to cash drag, our cash management process, expenses and trading costs of the Fund. A historical chart of tracking error for INDEX is provided below.
| HISTORICAL TRACKING ERROR FOR INDEX | ||||||
| 2017 | 2018 | 2019 | 2020 | 2021 | 2022 YTD | |
| INDEX | 18.79% | -7.82% | 28.98% | 12.76% | 29.11% | -20.82% |
| S&P 500® EQUAL WEIGHT INDEX | 18.90% | -7.64% | 29.24% | 12.83% | 29.63% | -20.68% |
| TRACKING ERROR | -0.11% | -0.18% | -0.26% | -0.07% | -0.52% | -0.14% |
During the 12 months ended September 30, 2022, the Fund returned -13.72% while the Market Cap Index declined by -15.47%. As noted above, the Fund seeks to track the Equal Weight Index, which is not the same as the Market Cap Index. Return differentials between the Equal Weight Index and the Market Cap Index can occur, for example, when the largest 50 companies within the S&P 500® Index outperform or underperform the other 450 companies within the index. This is because the Market-Cap Index overweight’s the top 50 companies within the index to approximately half of the index, whereas the Equal Weight Index methodology seeks to hold all 500 companies equal over time. This data is provided for informational purposes only, and you should not regard the Market Cap Index as a benchmark for the Fund.
| Semi-Annual Report | September 30, 2022 | 1 |
| Index Funds S&P 500® Equal Weight | Shareholder Letter |
| September 30, 2022 (Unaudited) |
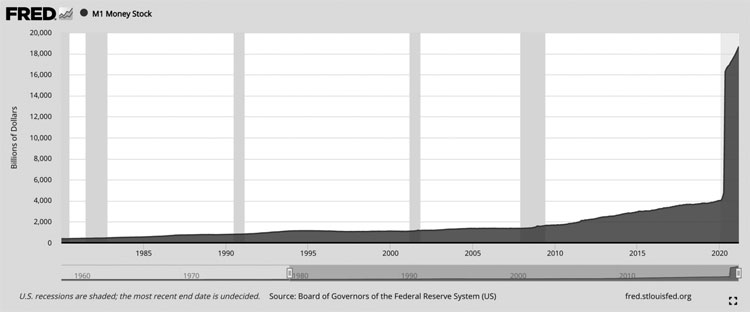
Looking forward, the adviser believes that the Federal Reserve is likely to continue to print trillions of U.S. dollars and inject them into the U.S. market, similar to what was done over the past 12 months. This has caused a sharp increase in the M1 money supply (see chart above). The adviser believes that this dilution of U.S. fiat currency may also lead to a sharp increase in inflation. Historically, S&P 500® Index strategies have given investors the potential to keep up with inflation and grow their portfolios over time. We created the Fund to seek to simplify investing for retail investors. With one simple purchase, you gain access to the potential growth of Americas’ 500 leading companies according to Standard & Poor’s.
Warm Regards,
Michael G. Willis
President, ONEFUND, LLC
The foregoing reflects the thoughts and opinions of ONEFUND, LLC, the adviser to the Fund, and is subject to change without notice. Investors cannot invest directly in an index. Subject to investment risks, including possible loss of principal amount invested.
| * | The S&P 500® Equal Weight Index is an equal weighted version of the S&P 500® Index. The index includes the same constituents as the capitalization weighted S&P 500®, but each company in the S&P 500® Equal Weight Index is allocated a fixed weight - or 0.2% of the index total each quarterly rebalance. It is a broad-based securities market index. Such indices are generally not actively managed and are not subject to fees and expenses typically associated with managed accounts or funds. You cannot invest directly in a broad-based securities index. |
S&P 500® Market Cap Index: The headline market cap indices, the S&P 500®, S&P MidCap 400®, and S&P SmallCap 600®, are widely recognized as leading indicators of U.S. equity market performance. The S&P 500® is the world’s most-tracked index by AUM.
Past performance is not indicative of future results, ordinary brokerage commissions apply, brokerage commissions will reduce returns.
| 2 | www.INDEX.fund |
| Index Funds S&P 500® Equal Weight | Investment Results |
| September 30, 2022 (Unaudited) |
Average Annual Total Returns(a) (for the periods ended September 30, 2022)
| Six Months | One Year | Five Year | Since
Inception (4/30/15) | |
| Index Funds S&P 500® Equal Weight | -18.58% | -13.72% | 7.81% | 8.18% |
| S&P 500® Equal Weight Index | -18.46% | -13.53% | 8.02% | 8.32% |
| Expense Ratios (b) | ||||
| Gross | 0.66% | |||
| With Applicable Waivers | 0.25% | |||
The performance data quoted above represents past performance. Past performance is not a guarantee of future results. Investment return and value of the Fund shares will fluctuate so that an investor’s shares, when sold or redeemed, may be worth more or less than their original cost. Current performance data may be lower or higher than actual performance data quoted. Fund performance current to the most recent month-end is available by calling (844) 464-6339 or by visiting www.INDEX.fund.
| (a) | Return figures reflect any change in price per share and assume the reinvestment of all distributions. The Fund’s returns reflect any fee reductions during the applicable period. If such fee reductions had not occurred, the quoted performances would have been lower. Total returns for less than one year are not annualized. |
| (b) | The expense ratios are from the Fund’s prospectus dated July 29, 2022. ONEFUND, LLC (the “Adviser”) has contractually agreed to waive and/or reimburse fees or expenses in order to limit Total Annual Fund Operating Expenses After Fee Waiver/Expense Reimbursement (excluding acquired fund fees and expenses, brokerage expenses, interest expenses, taxes and extraordinary expenses) to not more than 0.25% of the Fund’s average daily net assets for No Load Class shares. This agreement is in effect through July 31, 2023. This agreement may not be terminated or modified by the Adviser prior to this date except with the approval of the Fund’s Board of Trustees. Additional information pertaining to the Fund’s expense ratios as of September 30, 2022, can be found in the financial highlights. |
You should consider the Fund’s investment objectives, risks, charges and expenses carefully before you invest. The Fund’s prospectus contains important information about the Fund’s investment objectives, potential risks, management fees, charges and expenses, and other information and should be read carefully before investing. You may obtain a current copy of the Fund’s prospectus or performance data current to the most recent month by calling (844) 464-6339.
The Fund is distributed by Ultimus Fund Distributors, LLC, member FINRA/SIPC.
| Semi-Annual Report | September 30, 2022 | 3 |
| Index Funds S&P 500® Equal Weight | Portfolio Illustration |
| September 30, 2022 (Unaudited) |
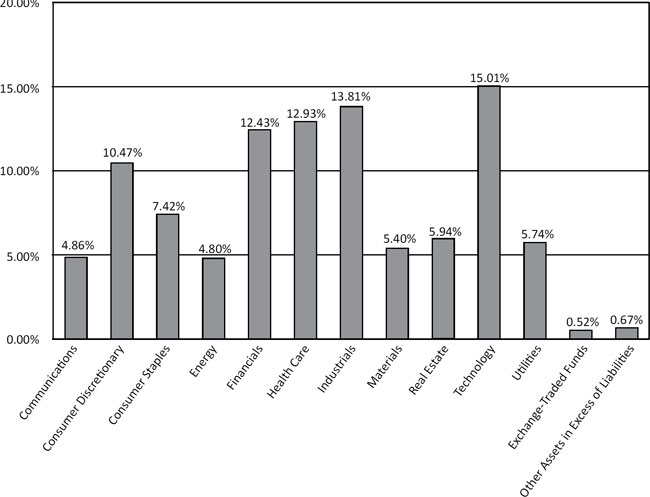
Sector Allocation (as a % of Net Assets)*
Index
Funds S&P 500® Equal Weight
Holdings as of September 30, 2022(a)
| (a) | As a percentage of net assets. |
| * | Holdings are subject to change and may not reflect the current or future position of the portfolio. For Fund compliance purposes, the Fund’s industry classifications refer to any one or more of the industry sub-classifications used by one or more widely recognized market indexes or ratings group indexes, and/or as defined by Fund management. This definition may not apply for purposes of this report, which may combine industry subclassifications for reporting ease. Industries are shown as a percentage of net assets. |
The S&P 500® Equal Weight Index (the “Index”) is a product of S&P Dow Jones Indices LLC or its affiliates (“SPDJI”) and their Third Party Licensors, and has been licensed for use by ONEFUND, LLC (the “Adviser”). Standard & Poor’s® and S&P® are registered trademarks of Standard & Poor’s Financial Services LLC (“S&P”); Dow Jones® is a registered trademark of Dow Jones Trademark Holdings LLC (“Dow Jones”); Third Party Licensor Trademarks are trademarks of the Third Party Licensor and these trademarks have been licensed for use by SPDJI and sublicensed for certain purposes by the Adviser. It is not possible to invest directly in an index. The Index Funds S&P 500® Equal Weight (the “Fund”) is not sponsored, endorsed, sold or promoted by SPDJI, Dow Jones, S&P, any of their respective affiliates (collectively, “S&P Dow Jones Indices”) or their Third Party Licensors. Neither S&P Dow Jones Indices nor its Third Party Licensors make any representation or warranty, express or implied, to the owners of the Fund or any member of the public regarding the advisability of investing in securities generally or in the Fund particularly or the ability of the Index to track general market performance. Past performance of an index is not an indication or guarantee of future results. S&P Dow Jones Indices’ and its Third Party Licensors’ only relationship to the Adviser with respect to the Index is the licensing of the Index and certain trademarks, service marks and/or trade names of S&P Dow Jones Indices and/or its licensors. The Index is determined, composed and calculated by S&P Dow Jones Indices or its Third Party Licensors without regard to the Adviser or the Fund. S&P Dow Jones Indices and its Third Party Licensors have no obligation to take the needs of the Adviser or the owners of the Fund into consideration in determining, composing or calculating the Index. Neither S&P Dow Jones Indices nor its Third Party Licensors are responsible for and have not participated in the determination of the prices, and amount of the Fund or the timing of the issuance or sale of the Fund or in the determination or calculation of the equation by which the Fund is to be converted into cash, surrendered or redeemed, as the case may be. S&P Dow Jones Indices and its Third Party Licensors have no obligation or liability in connection with the administration, marketing or trading of the Fund. There is no assurance that investment products based on the Index will accurately track index performance or provide positive investment returns. S&P
| 4 | www.INDEX.fund |
| Index Funds S&P 500® Equal Weight | Portfolio Illustration |
| September 30, 2022 (Unaudited) |
Dow Jones Indices LLC is not an investment or tax advisor. A tax advisor should be consulted to evaluate the impact of any tax-exempt securities on portfolios and the tax consequences of making any particular investment decision. Inclusion of a security within an index is not a recommendation by S&P Dow Jones Indices to buy, sell, or hold such security, nor is it considered to be investment advice.
NEITHER S&P DOW JONES INDICES NOR ITS THIRD PARTY LICENSORS GUARANTEE THE ADEQUACY, ACCURACY, TIMELINESS AND/OR THE COMPLETENESS OF THE INDEX OR ANY DATA RELATED THERETO OR ANY COMMUNICATION, INCLUDING BUT NOT LIMITED TO, ORAL OR WRITTEN COMMUNICATION (INCLUDING ELECTRONIC COMMUNICATIONS) WITH RESPECT THERETO. S&P DOW JONES INDICES AND ITS THIRD PARTY LICENSORS SHALL NOT BE SUBJECT TO ANY DAMAGES OR LIABILITY FOR ANY ERRORS, OMISSIONS, OR DELAYS THEREIN. S&P DOW JONES INDICES AND ITS THIRD PARTY LICENSORS MAKE NO EXPRESS OR IMPLIED WARRANTIES, AND EXPRESSLY DISCLAIM ALL WARRANTIES, OF MERCHANTABILITY OR FITNESS FOR A PARTICULAR PURPOSE OR USE OR AS TO RESULTS TO BE OBTAINED BY ONEFUND, LLC, OWNERS OF THE FUND, OR ANY OTHER PERSON OR ENTITY FROM THE USE OF THE INDEX OR WITH RESPECT TO ANY DATA RELATED THERETO. WITHOUT LIMITING ANY OF THE FOREGOING, IN NO EVENT WHATSOEVER SHALL S&P DOW JONES INDICES OR ITS THIRD PARTY LICENSORS BE LIABLE FOR ANY INDIRECT, SPECIAL, INCIDENTAL, PUNITIVE, OR CONSEQUENTIAL DAMAGES INCLUDING BUT NOT LIMITED TO, LOSS OF PROFITS, TRADING LOSSES, LOST TIME OR GOODWILL, EVEN IF THEY HAVE BEEN ADVISED OF THE POSSIBLITY OF SUCH DAMAGES, WHETHER IN CONTRACT, TORT, STRICT LIABILITY, OR OTHERWISE. THERE ARE NO THIRD PARTY BENEFICIARIES OF ANY AGREEMENTS OR ARRANG JONES INDICES AND ONEFUND, LLC, OTHER THAN THE LICENSORS OF S&P DOW JONES INDICES.
| Semi-Annual Report | September 30, 2022 | 5 |
| Index Funds S&P 500® Equal Weight | Schedule of Investments |
| September 30, 2022 (Unaudited) |
| Shares | Fair Value | |||||||
| COMMON STOCKS — 98.81% | ||||||||
| Communications — 4.86% | ||||||||
| Activision Blizzard, Inc. | 2,484 | $ | 184,660 | |||||
| Alphabet, Inc., Class A(a) | 926 | 88,572 | ||||||
| Alphabet, Inc., Class C(a) | 828 | 79,612 | ||||||
| AT&T, Inc. | 11,452 | 175,674 | ||||||
| Booking Holdings, Inc.(a) | 99 | 162,678 | ||||||
| Charter Communications, Inc., Class A(a) | 480 | 145,608 | ||||||
| Comcast Corp., Class A | 5,504 | 161,432 | ||||||
| DISH Network Corp., Class A(a) | 10,090 | 139,545 | ||||||
| Electronic Arts, Inc. | 1,513 | 175,069 | ||||||
| Expedia Group, Inc.(a) | 1,786 | 167,330 | ||||||
| Fox Corp., Class A | 3,964 | 121,616 | ||||||
| Fox Corp., Class B | 1,820 | 51,870 | ||||||
| Interpublic Group of Companies, Inc. | 6,831 | 174,874 | ||||||
| Lumen Technologies, Inc. | 19,562 | 142,411 | ||||||
| Match Group, Inc.(a) | 3,133 | 149,601 | ||||||
| Meta Platforms, Inc., Class A(a) | 1,153 | 156,439 | ||||||
| Netflix, Inc.(a) | 835 | 196,592 | ||||||
| News Corp., Class A | 8,495 | 128,360 | ||||||
| News Corp., Class B | 2,632 | 40,585 | ||||||
| Omnicom Group, Inc. | 2,770 | 174,759 | ||||||
| Take-Two Interactive Software, Inc.(a) | 1,526 | 166,334 | ||||||
| T-Mobile US, Inc.(a) | 1,339 | 179,654 | ||||||
| Twitter, Inc.(a) | 4,623 | 202,673 | ||||||
| VeriSign, Inc.(a) | 1,024 | 177,869 | ||||||
| Verizon Communications, Inc. | 4,617 | 175,307 | ||||||
| ViacomCBS, Inc., Class B | 8,244 | 156,966 | ||||||
| Walt Disney Co. (The)(a) | 1,694 | 159,795 | ||||||
| Warner Bros. Discovery, Inc.(a) | 14,968 | 172,132 | ||||||
| 4,208,017 | ||||||||
| Consumer Discretionary — 10.47% | ||||||||
| Advance Auto Parts, Inc. | 1,080 | 168,847 | ||||||
| Amazon.com, Inc.(a) | 1,463 | 165,319 | ||||||
| Aptiv PLC(a) | 2,017 | 157,750 | ||||||
| AutoZone, Inc.(a) | 89 | 190,633 | ||||||
| Bath & Body Works, Inc. | 4,919 | 160,359 | ||||||
| Best Buy Co., Inc. | 2,558 | 162,024 | ||||||
| BorgWarner, Inc. | 5,057 | 158,790 | ||||||
| Caesars Entertainment, Inc.(a) | 4,035 | 130,169 | ||||||
| CarMax, Inc.(a) | 2,143 | 141,481 | ||||||
| Carnival Corp.(a) | 18,753 | 131,834 | ||||||
| Chipotle Mexican Grill, Inc.(a) | 114 | 171,315 | ||||||
| Copart, Inc.(a) | 1,680 | 178,752 | ||||||
| D.R. Horton, Inc. | 2,659 | 179,084 | ||||||
| Darden Restaurants, Inc. | 1,488 | 187,964 | ||||||
| Domino’s Pizza, Inc. | 531 | 164,716 | ||||||
| eBay, Inc. | 4,324 | 159,166 | ||||||
| Etsy, Inc.(a) | 1,766 | 176,830 | ||||||
| Ford Motor Co. | 12,649 | 141,669 | ||||||
| Fortune Brands Home & Security, Inc. | 3,015 | 161,875 | ||||||
| General Motors Co. | 4,724 | 151,593 | ||||||
| Shares | Fair Value | |||||||
| Consumer Discretionary (Continued) | ||||||||
| Genuine Parts Co. | 1,198 | $ | 178,885 | |||||
| Hasbro, Inc. | 2,394 | 161,403 | ||||||
| Hilton Worldwide Holdings, Inc. | 1,435 | 173,090 | ||||||
| Home Depot, Inc. (The) | 651 | 179,637 | ||||||
| Las Vegas Sands Corp.(a) | 5,110 | 191,727 | ||||||
| Lennar Corp., Class A | 2,443 | 182,126 | ||||||
| Live Nation Entertainment, Inc.(a) | 2,094 | 159,228 | ||||||
| LKQ Corp. | 3,635 | 171,390 | ||||||
| Lowe’s Companies, Inc. | 948 | 178,044 | ||||||
| Marriott International, Inc., Class A | 1,201 | 168,308 | ||||||
| Masco Corp. | 3,730 | 174,154 | ||||||
| McDonald’s Corp. | 752 | 173,516 | ||||||
| MGM Resorts International | 5,563 | 165,332 | ||||||
| Mohawk Industries, Inc.(a) | 1,716 | 156,482 | ||||||
| Newell Brands, Inc. | 10,740 | 149,179 | ||||||
| NIKE, Inc., Class B | 1,757 | 146,042 | ||||||
| Norwegian Cruise Lines Holdings Ltd.(a) | 13,358 | 151,747 | ||||||
| NVR, Inc.(a) | 46 | 183,405 | ||||||
| O’Reilly Automotive, Inc.(a) | 270 | 189,905 | ||||||
| Pool Corp. | 548 | 174,379 | ||||||
| PulteGroup, Inc. | 4,669 | 175,088 | ||||||
| Ralph Lauren Corp. | 2,021 | 171,643 | ||||||
| Ross Stores, Inc. | 2,085 | 175,703 | ||||||
| Royal Caribbean Cruises Ltd.(a) | 4,129 | 156,489 | ||||||
| Starbucks Corp. | 2,199 | 185,288 | ||||||
| Tapestry, Inc. | 5,490 | 156,081 | ||||||
| Tesla, Inc.(a) | 651 | 172,677 | ||||||
| TJX Companies, Inc. (The) | 2,928 | 181,887 | ||||||
| Tractor Supply Co. | 971 | 180,489 | ||||||
| Ulta Beauty, Inc.(a) | 441 | 176,925 | ||||||
| VF Corp. | 4,498 | 134,535 | ||||||
| Whirlpool Corp. | 1,217 | 164,063 | ||||||
| Wynn Resorts Ltd.(a) | 3,107 | 195,835 | ||||||
| Yum! Brands, Inc. | 1,680 | 178,651 | ||||||
| 9,053,503 | ||||||||
| Consumer Staples — 7.42% | ||||||||
| Altria Group, Inc. | 4,280 | 172,827 | ||||||
| Archer-Daniels-Midland Co. | 2,132 | 171,519 | ||||||
| Brown-Forman Corp., Class B | 2,655 | 176,743 | ||||||
| Campbell Soup Co. | 4,069 | 191,731 | ||||||
| Church & Dwight Co., Inc. | 2,391 | 170,813 | ||||||
| Clorox Co. (The) | 1,317 | 169,090 | ||||||
| Coca-Cola Co. (The) | 3,130 | 175,343 | ||||||
| Colgate-Palmolive Co. | 2,499 | 175,554 | ||||||
| Conagra Brands, Inc. | 5,675 | 185,175 | ||||||
| Constellation Brands, Inc., Class A | 790 | 181,447 | ||||||
| Costco Wholesale Corp. | 364 | 171,906 | ||||||
| Dollar General Corp. | 788 | 189,009 | ||||||
| Dollar Tree, Inc.(a) | 1,350 | 183,735 | ||||||
| Estee Lauder Companies, Inc. (The), Class A | 772 | 166,675 | ||||||
See Notes to Financial Statements.
| 6 | www.INDEX.fund |
| Index Funds S&P 500® Equal Weight | Schedule of Investments |
| September 30, 2022 (Unaudited) |
| Shares | Fair Value | |||||||
| Consumer Staples (Continued) | ||||||||
| General Mills, Inc. | 2,569 | $ | 196,812 | |||||
| Hershey Co. (The) | 862 | 190,045 | ||||||
| Hormel Foods Corp. | 4,162 | 189,121 | ||||||
| J.M. Smucker Co. (The) | 1,399 | 192,238 | ||||||
| Kellogg Co. | 2,706 | 188,500 | ||||||
| Keurig Dr Pepper, Inc. | 5,041 | 180,569 | ||||||
| Kimberly-Clark Corp. | 1,538 | 173,087 | ||||||
| Kraft Heinz Co. (The) | 5,349 | 178,389 | ||||||
| Kroger Co. (The) | 3,755 | 164,281 | ||||||
| Lamb Weston Holdings, Inc. | 2,453 | 189,813 | ||||||
| McCormick & Co., Inc., Non-Voting Shares | 2,441 | 173,970 | ||||||
| Molson Coors Brewing Co., Class B | 3,738 | 179,387 | ||||||
| Mondelez International, Inc., Class A | 3,180 | 174,359 | ||||||
| Monster Beverage Corp.(a) | 2,110 | 183,486 | ||||||
| PepsiCo, Inc. | 1,126 | 183,830 | ||||||
| Philip Morris International, Inc. | 2,010 | 166,850 | ||||||
| Procter & Gamble Co. (The) | 1,394 | 175,992 | ||||||
| Sysco Corp. | 2,325 | 164,401 | ||||||
| Target Corp. | 1,123 | 166,642 | ||||||
| Tyson Foods, Inc., Class A | 2,581 | 170,165 | ||||||
| Walgreens Boots Alliance, Inc. | 5,382 | 168,995 | ||||||
| Wal-Mart Stores, Inc. | 1,425 | 184,823 | ||||||
| 6,417,322 | ||||||||
| Energy — 4.80% | ||||||||
| APA Corp. | 5,121 | 175,087 | ||||||
| Baker Hughes Co. | 7,724 | 161,895 | ||||||
| Chevron Corp. | 1,219 | 175,134 | ||||||
| ConocoPhillips | 1,741 | 178,174 | ||||||
| Coterra Energy, Inc. | 6,551 | 171,112 | ||||||
| Devon Energy Corp. | 2,847 | 171,190 | ||||||
| Diamondback Energy, Inc. | 1,444 | 173,944 | ||||||
| Enphase Energy, Inc.(a) | 638 | 177,025 | ||||||
| EOG Resources, Inc. | 1,581 | 176,645 | ||||||
| EQT Corp. | 4,100 | 167,075 | ||||||
| Exxon Mobil Corp. | 2,022 | 176,541 | ||||||
| Halliburton Co. | 6,576 | 161,901 | ||||||
| Hess Corp. | 1,593 | 173,621 | ||||||
| Kinder Morgan, Inc. | 10,652 | 177,249 | ||||||
| Marathon Oil Corp. | 7,401 | 167,115 | ||||||
| Marathon Petroleum Corp. | 1,950 | 193,694 | ||||||
| Occidental Petroleum Corp. | 2,972 | 182,629 | ||||||
| ONEOK, Inc. | 3,121 | 159,920 | ||||||
| Phillips 66 | 2,216 | 178,876 | ||||||
| Pioneer Natural Resources Co. | 814 | 176,255 | ||||||
| Schlumberger Ltd. | 4,919 | 176,592 | ||||||
| SolarEdge Technologies, Inc.(a) | 623 | 144,200 | ||||||
| Valero Energy Corp. | 1,721 | 183,889 | ||||||
| Williams Companies, Inc. (The) | 5,952 | 170,406 | ||||||
| 4,150,169 | ||||||||
| Financials — 12.43% | ||||||||
| Aflac, Inc. | 3,152 | 177,142 | ||||||
| Allstate Corp. (The) | 1,542 | 192,024 | ||||||
| Shares | Fair Value | |||||||
| Financials (Continued) | ||||||||
| American Express Co. | 1,231 | $ | 166,074 | |||||
| American International Group, Inc. | 3,544 | 168,269 | ||||||
| Ameriprise Financial, Inc. | 681 | 171,578 | ||||||
| Aon PLC, Class A | 668 | 178,937 | ||||||
| Arthur J. Gallagher & Co. | 1,035 | 177,213 | ||||||
| Assurant, Inc. | 1,191 | 173,017 | ||||||
| Bank of America Corp. | 5,582 | 168,576 | ||||||
| Bank of New York Mellon Corp. (The) | 4,419 | 170,220 | ||||||
| Berkshire Hathaway, Inc., Class B(a) | 683 | 182,375 | ||||||
| BlackRock, Inc. | 280 | 154,078 | ||||||
| Brown & Brown, Inc. | 2,981 | 180,291 | ||||||
| Capital One Financial Corp. | 1,800 | 165,906 | ||||||
| Cboe Global Markets, Inc. | 1,573 | 184,623 | ||||||
| Charles Schwab Corp. (The) | 2,617 | 188,084 | ||||||
| Chubb Ltd. | 1,000 | 181,880 | ||||||
| Cincinnati Financial Corp. | 1,937 | 173,497 | ||||||
| Citigroup, Inc. | 3,849 | 160,388 | ||||||
| Citizens Financial Group, Inc. | 5,128 | 176,198 | ||||||
| CME Group, Inc. | 969 | 171,639 | ||||||
| Coinbase Global, Inc., Class A(a) | 3,226 | 208,044 | ||||||
| Comerica, Inc. | 2,307 | 164,028 | ||||||
| Discover Financial Services | 1,908 | 173,475 | ||||||
| Everest Re Group Ltd. | 690 | 181,084 | ||||||
| Fifth Third Bancorp | 5,457 | 174,406 | ||||||
| First Republic Bank | 1,251 | 163,318 | ||||||
| Franklin Resources, Inc. | 7,393 | 159,097 | ||||||
| Globe Life, Inc. | 1,898 | 189,231 | ||||||
| Goldman Sachs Group, Inc. (The) | 573 | 167,918 | ||||||
| Hartford Financial Services Group, Inc. (The) | 2,910 | 180,245 | ||||||
| Huntington Bancshares, Inc. | 13,793 | 181,792 | ||||||
| Intercontinental Exchange, Inc. | 1,886 | 170,400 | ||||||
| Invesco Ltd. | 11,094 | 151,988 | ||||||
| JPMorgan Chase & Co. | 1,637 | 171,067 | ||||||
| KeyCorp | 10,452 | 167,441 | ||||||
| Lincoln National Corp. | 3,839 | 168,570 | ||||||
| Loews Corp. | 3,430 | 170,951 | ||||||
| M&T Bank Corp. | 1,040 | 183,372 | ||||||
| Marsh & McLennan Companies, Inc. | 1,169 | 174,520 | ||||||
| MetLife, Inc. | 2,884 | 175,290 | ||||||
| Morgan Stanley | 2,180 | 172,242 | ||||||
| Nasdaq, Inc. | 3,083 | 174,744 | ||||||
| Northern Trust Corp. | 1,968 | 168,382 | ||||||
| PNC Financial Services Group, Inc. (The) | 1,187 | 177,362 | ||||||
| Principal Financial Group, Inc. | 2,491 | 179,726 | ||||||
| Progressive Corp. (The) | 1,515 | 176,058 | ||||||
| Prudential Financial, Inc. | 1,981 | 169,930 | ||||||
| Raymond James Financial, Inc. | 1,799 | 177,777 | ||||||
| Regions Financial Corp. | 8,781 | 176,235 | ||||||
| Signature Bank | 1,062 | 160,362 | ||||||
| State Street Corp. | 2,671 | 162,424 | ||||||
| SVB Financial Group(a) | 462 | 155,130 | ||||||
See Notes to Financial Statements.
| Semi-Annual Report | September 30, 2022 | 7 |
| Index Funds S&P 500® Equal Weight | Schedule of Investments |
| September 30, 2022 (Unaudited) |
| Shares | Fair Value | |||||||
| Financials (Continued) | ||||||||
| Synchrony Financial | 5,835 | $ | 164,489 | |||||
| T. Rowe Price Group, Inc. | 1,568 | 164,656 | ||||||
| Travelers Companies, Inc. (The) | 1,188 | 182,002 | ||||||
| Truist Financial Corp. | 4,023 | 175,161 | ||||||
| U.S. Bancorp | 4,099 | 165,272 | ||||||
| W.R. Berkley Corp. | 2,884 | 186,249 | ||||||
| Wells Fargo & Co. | 4,302 | 173,026 | ||||||
| Willis Towers Watson PLC | 912 | 183,257 | ||||||
| Zions Bancorporation | 3,324 | 169,059 | ||||||
| 10,751,789 | ||||||||
| Health Care — 12.93% | ||||||||
| Abbott Laboratories | 1,798 | 173,974 | ||||||
| AbbVie, Inc. | 1,380 | 185,210 | ||||||
| ABIOMED, Inc.(a) | 691 | 169,751 | ||||||
| Agilent Technologies, Inc. | 1,417 | 172,236 | ||||||
| Align Technology, Inc.(a) | 742 | 153,676 | ||||||
| AmerisourceBergen Corp. | 1,325 | 179,312 | ||||||
| Amgen, Inc. | 787 | 177,390 | ||||||
| Anthem, Inc. | 395 | 179,425 | ||||||
| Baxter International, Inc. | 3,277 | 176,499 | ||||||
| Becton, Dickinson and Co. | 742 | 165,340 | ||||||
| Biogen, Inc.(a) | 921 | 245,906 | ||||||
| Bio-Rad Laboratories, Inc., Class A(a) | 383 | 159,765 | ||||||
| Bio-Techne Corp. | 562 | 159,608 | ||||||
| Boston Scientific Corp.(a) | 4,542 | 175,912 | ||||||
| Bristol-Myers Squibb Co. | 2,780 | 197,630 | ||||||
| Cardinal Health, Inc. | 2,791 | 186,104 | ||||||
| Catalent, Inc.(a) | 2,032 | 147,036 | ||||||
| Centene Corp.(a) | 2,120 | 164,957 | ||||||
| Charles River Laboratories International, Inc.(a) | 894 | 175,939 | ||||||
| Cigna Corp. | 666 | 184,795 | ||||||
| Cooper Companies, Inc. (The) | 620 | 163,618 | ||||||
| CVS Health Corp. | 1,909 | 182,061 | ||||||
| Danaher Corp. | 672 | 173,571 | ||||||
| DaVita, Inc.(a) | 2,105 | 174,231 | ||||||
| DENTSPLY SIRONA, Inc. | 5,743 | 162,814 | ||||||
| DexCom, Inc.(a) | 2,099 | 169,053 | ||||||
| Edwards LifeSciences Corp.(a) | 2,014 | 166,417 | ||||||
| Eli Lilly & Co. | 614 | 198,536 | ||||||
| Gilead Sciences, Inc. | 2,987 | 184,268 | ||||||
| HCA Healthcare, Inc. | 888 | 163,206 | ||||||
| Henry Schein, Inc.(a) | 2,625 | 172,646 | ||||||
| Hologic, Inc.(a) | 2,820 | 181,946 | ||||||
| Humana, Inc. | 408 | 197,957 | ||||||
| IDEXX Laboratories, Inc.(a) | 521 | 169,742 | ||||||
| Illumina, Inc.(a) | 927 | 176,862 | ||||||
| Incyte Corp.(a) | 2,701 | 179,995 | ||||||
| Intuitive Surgical, Inc.(a) | 881 | 165,135 | ||||||
| IQVIA Holdings, Inc.(a) | 874 | 158,316 | ||||||
| Johnson & Johnson | 1,177 | 192,275 | ||||||
| Laboratory Corporation of America Holdings | 818 | 167,535 | ||||||
| Shares | Fair Value | |||||||
| Health Care (Continued) | ||||||||
| McKesson Corp. | 532 | $ | 180,811 | |||||
| Medtronic PLC | 2,174 | 175,551 | ||||||
| Merck & Co., Inc. | 2,233 | 192,306 | ||||||
| Mettler-Toledo International, Inc.(a) | 150 | 162,618 | ||||||
| Moderna, Inc.(a) | 1,371 | 162,121 | ||||||
| Molina Healthcare, Inc.(a) | 560 | 184,710 | ||||||
| Organon & Co. | 6,538 | 152,989 | ||||||
| PerkinElmer, Inc. | 1,378 | 165,815 | ||||||
| Pfizer, Inc. | 4,077 | 178,410 | ||||||
| Quest Diagnostics, Inc. | 1,500 | 184,035 | ||||||
| Regeneron Pharmaceuticals, Inc.(a) | 269 | 185,306 | ||||||
| ResMed, Inc. | 826 | 180,316 | ||||||
| STERIS PLC | 927 | 154,142 | ||||||
| Stryker Corp. | 848 | 171,754 | ||||||
| Teleflex, Inc. | 805 | 162,175 | ||||||
| Thermo Fisher Scientific, Inc. | 343 | 173,966 | ||||||
| UnitedHealth Group, Inc. | 372 | 187,875 | ||||||
| Universal Health Services, Inc., Class B | 1,893 | 166,925 | ||||||
| Vertex Pharmaceuticals, Inc.(a) | 668 | 193,413 | ||||||
| Viatris, Inc. | 19,740 | 168,185 | ||||||
| Waters Corp.(a) | 625 | 168,456 | ||||||
| West Pharmaceutical Services, Inc. | 622 | 153,062 | ||||||
| Zimmer Biomet Holdings, Inc. | 1,704 | 178,153 | ||||||
| Zoetis, Inc., Class A | 1,187 | 176,020 | ||||||
| 11,189,763 | ||||||||
| Industrials — 13.81% | ||||||||
| 3M Co. | 1,584 | 175,032 | ||||||
| A.O. Smith Corp. | 3,465 | 168,330 | ||||||
| Alaska Air Group, Inc.(a) | 4,189 | 163,999 | ||||||
| Allegion PLC | 1,958 | 175,593 | ||||||
| American Airlines Group, Inc.(a) | 13,744 | 165,478 | ||||||
| AMETEK, Inc. | 1,551 | 175,899 | ||||||
| Amphenol Corp., Class A | 2,570 | 172,087 | ||||||
| Boeing Co. (The)(a) | 1,238 | 149,897 | ||||||
| Carrier Global Corp. | 4,625 | 164,465 | ||||||
| Caterpillar, Inc. | 1,030 | 169,002 | ||||||
| CH Robinson Worldwide, Inc. | 1,707 | 164,401 | ||||||
| Cintas Corp. | 453 | 175,850 | ||||||
| CSX Corp. | 5,977 | 159,227 | ||||||
| Cummins, Inc. | 893 | 181,734 | ||||||
| Deere & Co. | 524 | 174,958 | ||||||
| Delta Air Lines, Inc.(a) | 5,972 | 167,574 | ||||||
| Dover Corp. | 1,506 | 175,569 | ||||||
| Eaton Corp. PLC | 1,339 | 178,569 | ||||||
| Emerson Electric Co. | 2,303 | 168,626 | ||||||
| Expeditors International of Washington, Inc. | 1,886 | 166,553 | ||||||
| Fastenal Co. | 3,809 | 175,366 | ||||||
| FedEx Corp. | 933 | 138,523 | ||||||
| Fortive Corp. | 2,955 | 172,277 | ||||||
| Generac Holdings, Inc.(a) | 819 | 145,897 | ||||||
| General Dynamics Corp. | 842 | 178,647 | ||||||
See Notes to Financial Statements.
| 8 | www.INDEX.fund |
| Index Funds S&P 500® Equal Weight | Schedule of Investments |
| September 30, 2022 (Unaudited) |
| Shares | Fair Value | |||||||
| Industrials (Continued) | ||||||||
| General Electric, Co. | 2,635 | $ | 163,133 | |||||
| Honeywell International, Inc. | 1,018 | 169,975 | ||||||
| Howmet Aerospace Inc. | 5,357 | 165,692 | ||||||
| Huntington Ingalls Industries, Inc. | 829 | 183,624 | ||||||
| IDEX Corp. | 929 | 185,660 | ||||||
| Illinois Tool Works, Inc. | 944 | 170,534 | ||||||
| Ingersoll Rand, Inc. | 3,883 | 167,979 | ||||||
| Jacobs Solutions, Inc. | 1,560 | 169,244 | ||||||
| JB Hunt Transport Services, Inc. | 1,120 | 175,190 | ||||||
| Johnson Controls International PLC | 3,354 | 165,084 | ||||||
| Keysight Technologies, Inc.(a) | 1,131 | 177,973 | ||||||
| L3 Harris Technologies, Inc. | 826 | 171,668 | ||||||
| Lockheed Martin Corp. | 463 | 178,852 | ||||||
| Nordson Corp. | 832 | 176,609 | ||||||
| Norfolk Southern Corp. | 781 | 163,737 | ||||||
| Northrop Grumman Corp. | 397 | 186,717 | ||||||
| Old Dominion Freight Line, Inc. | 726 | 180,607 | ||||||
| Otis Worldwide Corp. | 2,657 | 169,517 | ||||||
| PACCAR, Inc. | 2,204 | 184,453 | ||||||
| Parker-Hannifin Corp. | 699 | 169,375 | ||||||
| Pentair PLC | 4,139 | 168,168 | ||||||
| Quanta Services, Inc. | 1,329 | 169,302 | ||||||
| Raytheon Technologies Corp. | 2,215 | 181,320 | ||||||
| Republic Services, Inc. | 1,321 | 179,709 | ||||||
| Robert Half International, Inc. | 2,423 | 185,360 | ||||||
| Rockwell Automation, Inc. | 764 | 164,344 | ||||||
| Rollins, Inc. | 5,400 | 187,271 | ||||||
| Roper Technologies, Inc. | 475 | 170,829 | ||||||
| Snap-on, Inc. | 873 | 175,779 | ||||||
| Southwest Airlines Co.(a) | 5,083 | 156,760 | ||||||
| Stanley Black & Decker, Inc. | 2,179 | 163,883 | ||||||
| TE Connectivity Ltd. | 1,521 | 167,858 | ||||||
| Teledyne Technologies, Inc.(a) | 503 | 169,747 | ||||||
| Textron, Inc. | 2,978 | 173,498 | ||||||
| Trane Technologies PLC | 1,190 | 172,324 | ||||||
| Transdigm Group, Inc. | 315 | 165,318 | ||||||
| Trimble, Inc.(a) | 3,092 | 167,803 | ||||||
| Union Pacific Corp. | 841 | 163,844 | ||||||
| United Airlines Holdings, Inc.(a) | 4,968 | 161,609 | ||||||
| United Parcel Service, Inc., Class B | 982 | 158,632 | ||||||
| United Rentals, Inc.(a) | 627 | 169,365 | ||||||
| W.W. Grainger, Inc. | 341 | 166,814 | ||||||
| Wabtec Corp. | 2,138 | 173,926 | ||||||
| Waste Management, Inc. | 1,124 | 180,076 | ||||||
| Xylem, Inc. | 2,014 | 175,943 | ||||||
| 11,948,658 | ||||||||
| Materials — 5.40% | ||||||||
| Air Products & Chemicals, Inc. | 759 | 176,642 | ||||||
| Albemarle Corp. | 649 | 171,622 | ||||||
| Amcor PLC | 15,869 | 170,275 | ||||||
| Avery Dennison Corp. | 1,021 | 166,117 | ||||||
| Ball Corp. | 3,287 | 158,828 | ||||||
| Celanese Corp., Series A | 1,692 | 152,855 | ||||||
| Shares | Fair Value | |||||||
| Materials (Continued) | ||||||||
| CF Industries Holdings, Inc. | 1,881 | $ | 181,046 | |||||
| Corteva, Inc. | 3,120 | 178,308 | ||||||
| Dow, Inc. | 3,862 | 169,658 | ||||||
| DuPont de Nemours, Inc. | 3,340 | 168,336 | ||||||
| Eastman Chemical Co. | 2,082 | 147,926 | ||||||
| Ecolab, Inc. | 1,129 | 163,050 | ||||||
| FMC Corp. | 1,730 | 182,862 | ||||||
| Freeport-McMoRan, Inc. | 6,063 | 165,702 | ||||||
| International Flavors & Fragrances, Inc. | 1,704 | 154,774 | ||||||
| International Paper Co. | 4,675 | 148,198 | ||||||
| Linde PLC | 680 | 183,322 | ||||||
| LyondellBasell Industries N.V., Class A | 2,319 | 174,574 | ||||||
| Martin Marietta Materials, Inc. | 547 | 176,183 | ||||||
| Mosaic Co. (The) | 3,468 | 167,608 | ||||||
| Newmont Corp. | 4,518 | 189,891 | ||||||
| Nucor Corp. | 1,359 | 145,399 | ||||||
| Packaging Corporation of America | 1,398 | 156,981 | ||||||
| PPG Industries, Inc. | 1,522 | 168,470 | ||||||
| Sealed Air Corp. | 3,526 | 156,942 | ||||||
| Sherwin-Williams Co. (The) | 811 | 166,052 | ||||||
| Vulcan Materials Co. | 1,135 | 179,001 | ||||||
| WestRock Co. | 4,779 | 147,623 | ||||||
| 4,668,245 | ||||||||
| Real Estate — 5.94% | ||||||||
| Alexandria Real Estate Equities, Inc. | 1,228 | 172,153 | ||||||
| American Tower Corp. | 746 | 160,166 | ||||||
| AvalonBay Communities, Inc. | 909 | 167,429 | ||||||
| Boston Properties, Inc. | 2,273 | 170,407 | ||||||
| Camden Property Trust | 1,446 | 172,725 | ||||||
| CBRE Group, Inc., Class A(a) | 2,402 | 162,159 | ||||||
| Crown Castle International Corp. | 1,117 | 161,462 | ||||||
| Digital Realty Trust, Inc. | 1,567 | 155,415 | ||||||
| Equinix, Inc. | 296 | 168,377 | ||||||
| Equity Residential | 2,526 | 169,798 | ||||||
| Essex Property Trust, Inc. | 701 | 169,803 | ||||||
| Extra Space Storage, Inc. | 966 | 166,838 | ||||||
| Federal Realty Investment Trust | 1,876 | 169,065 | ||||||
| Healthpeak Properties, Inc. | 7,128 | 163,374 | ||||||
| Host Hotels & Resorts, Inc. | 10,693 | 169,805 | ||||||
| Invitation Homes, Inc. | 4,931 | 166,520 | ||||||
| Iron Mountain, Inc. | 3,532 | 155,302 | ||||||
| Kimco Realty Corp. | 8,861 | 163,131 | ||||||
| Mid-America Apartment Communities, Inc. | 1,129 | 175,075 | ||||||
| Prologis, Inc. | 1,504 | 152,806 | ||||||
| Public Storage | 575 | 168,366 | ||||||
| Realty Income Corp. | 2,920 | 169,944 | ||||||
| Regency Centers Corp. | 3,132 | 168,658 | ||||||
| SBA Communications Corp., Class A | 590 | 167,944 | ||||||
| Simon Property Group, Inc. | 1,879 | 168,640 | ||||||
| UDR, Inc. | 4,065 | 169,551 | ||||||
| Ventas, Inc. | 3,932 | 157,948 | ||||||
See Notes to Financial Statements.
| Semi-Annual Report | September 30, 2022 | 9 |
| Index Funds S&P 500® Equal Weight | Schedule of Investments |
| September 30, 2022 (Unaudited) |
| Shares | Fair Value | |||||||
| Real Estate (Continued) | ||||||||
| VICI Properties, Inc. | 5,783 | $ | 172,623 | |||||
| Vornado Realty Trust | 7,040 | 163,046 | ||||||
| Welltower, Inc. | 2,514 | 161,700 | ||||||
| Weyerhaeuser Co. | 5,634 | 160,907 | ||||||
| 5,141,137 | ||||||||
| Technology — 15.01% | ||||||||
| Accenture PLC, Class A | 671 | 172,648 | ||||||
| Adobe, Inc.(a) | 494 | 135,949 | ||||||
| Advanced Micro Devices, Inc.(a) | 2,283 | 144,651 | ||||||
| Akamai Technologies, Inc.(a) | 2,127 | 170,841 | ||||||
| Analog Devices, Inc. | 1,265 | 176,264 | ||||||
| ANSYS, Inc.(a) | 754 | 167,162 | ||||||
| Apple, Inc. | 1,239 | 171,230 | ||||||
| Applied Materials, Inc. | 2,021 | 165,581 | ||||||
| Arista Networks, Inc.(a) | 1,568 | 177,011 | ||||||
| Autodesk, Inc.(a) | 921 | 172,043 | ||||||
| Automatic Data Processing, Inc. | 798 | 180,499 | ||||||
| Broadcom, Inc. | 374 | 166,060 | ||||||
| Broadridge Financial Solutions, Inc. | 1,131 | 163,226 | ||||||
| Cadence Design Systems, Inc.(a) | 1,116 | 182,387 | ||||||
| CDW Corp. | 1,120 | 174,810 | ||||||
| Ceridian HCM Holding, Inc.(a) | 3,068 | 171,440 | ||||||
| Cisco Systems, Inc. | 4,261 | 170,440 | ||||||
| Cognizant Technology Solutions Corp., Class A | 2,977 | 170,999 | ||||||
| Corning, Inc. | 5,797 | 168,229 | ||||||
| CoStar Group, Inc.(a) | 2,487 | 173,220 | ||||||
| DXC Technology Co.(a) | 7,289 | 178,434 | ||||||
| EPAM Systems, Inc.(a) | 451 | 163,348 | ||||||
| Equifax, Inc. | 989 | 169,544 | ||||||
| F5, Inc.(a) | 1,217 | 176,136 | ||||||
| FactSet Research Systems, Inc. | 431 | 172,447 | ||||||
| Fidelity National Information Services, Inc. | 2,132 | 161,115 | ||||||
| Fiserv, Inc.(a) | 1,832 | 171,420 | ||||||
| FleetCor Technologies, Inc.(a) | 884 | 155,734 | ||||||
| Fortinet, Inc.(a) | 3,639 | 178,784 | ||||||
| Garmin Ltd. | 2,147 | 172,426 | ||||||
| Gartner, Inc.(a) | 637 | 176,252 | ||||||
| Global Payments, Inc. | 1,470 | 158,834 | ||||||
| Hewlett Packard Enterprise Co. | 14,523 | 173,986 | ||||||
| HP, Inc. | 6,901 | 171,973 | ||||||
| Intel Corp. | 6,199 | 159,748 | ||||||
| International Business Machines Corp. | 1,509 | 179,283 | ||||||
| Intuit, Inc. | 434 | 168,097 | ||||||
| Jack Henry & Associates, Inc. | 974 | 177,531 | ||||||
| Juniper Networks, Inc. | 6,716 | 175,422 | ||||||
| KLA Corp. | 544 | 164,631 | ||||||
| Lam Research Corp. | 433 | 158,478 | ||||||
| Leidos Holdings, Inc. | 2,038 | 178,264 | ||||||
| MarketAxess Holdings, Inc. | 734 | 163,308 | ||||||
| MasterCard, Inc., Class A | 581 | 165,202 | ||||||
| Shares | Fair Value | |||||||
| Technology (Continued) | ||||||||
| Microchip Technology, Inc. | 2,917 | $ | 178,024 | |||||
| Micron Technology, Inc. | 3,395 | 170,090 | ||||||
| Microsoft Corp. | 742 | 172,812 | ||||||
| Monolithic Power Systems, Inc. | 437 | 158,806 | ||||||
| Moody’s Corp. | 651 | 158,265 | ||||||
| Motorola Solutions, Inc. | 780 | 174,697 | ||||||
| MSCI, Inc. | 397 | 167,451 | ||||||
| NetApp, Inc. | 2,692 | 166,500 | ||||||
| Nielsen Holdings PLC | 7,001 | 194,067 | ||||||
| NortonLifeLock, Inc. | 8,581 | 172,821 | ||||||
| NVIDIA Corp. | 1,356 | 164,605 | ||||||
| NXP Semiconductors NV | 1,160 | 171,112 | ||||||
| ON Semiconductor Corp.(a) | 2,721 | 169,600 | ||||||
| Oracle Corp. | 2,569 | 156,889 | ||||||
| Paychex, Inc. | 1,538 | 172,579 | ||||||
| Paycom Software, Inc.(a) | 527 | 173,905 | ||||||
| PayPal Holdings, Inc.(a) | 2,027 | 174,464 | ||||||
| PTC, Inc.(a) | 1,626 | 170,080 | ||||||
| Qorvo, Inc.(a) | 2,085 | 165,570 | ||||||
| QUALCOMM, Inc. | 1,477 | 166,871 | ||||||
| S&P Global, Inc. | 528 | 161,225 | ||||||
| salesforce.com, Inc.(a) | 1,199 | 172,464 | ||||||
| Seagate Technology PLC | 2,834 | 150,854 | ||||||
| ServiceNow, Inc.(a) | 415 | 156,708 | ||||||
| Skyworks Solutions, Inc. | 1,900 | 162,013 | ||||||
| Synopsys, Inc.(a) | 573 | 175,057 | ||||||
| Teradyne, Inc. | 2,195 | 164,954 | ||||||
| Texas Instruments, Inc. | 1,142 | 176,758 | ||||||
| Tyler Technologies, Inc.(a) | 506 | 175,835 | ||||||
| Verisk Analytics, Inc. | 1,016 | 173,258 | ||||||
| Visa, Inc., Class A | 950 | 168,768 | ||||||
| Western Digital Corp.(a) | 4,453 | 144,945 | ||||||
| Zebra Technologies Corp., Class A(a) | 634 | 166,114 | ||||||
| 12,993,248 | ||||||||
| Utilities — 5.74% | ||||||||
| AES Corp. | 7,110 | 160,686 | ||||||
| Alliant Energy Corp. | 3,092 | 163,845 | ||||||
| Ameren Corp. | 2,039 | 164,241 | ||||||
| American Electric Power Co., Inc. | 1,863 | 161,056 | ||||||
| American Water Works Co., Inc. | 1,261 | 164,132 | ||||||
| Atmos Energy Corp. | 1,652 | 168,256 | ||||||
| CenterPoint Energy, Inc. | 5,937 | 167,305 | ||||||
| CMS Energy Corp. | 2,792 | 162,606 | ||||||
| Consolidated Edison, Inc. | 1,934 | 165,860 | ||||||
| Constellation Energy Corp. | 2,229 | 185,430 | ||||||
| Dominion Energy, Inc. | 2,345 | 162,063 | ||||||
| DTE Energy Co. | 1,439 | 165,557 | ||||||
| Duke Energy Corp. | 1,775 | 165,111 | ||||||
| Edison International | 2,823 | 159,725 | ||||||
| Entergy Corp. | 1,626 | 163,624 | ||||||
| Evergy, Inc. | 2,780 | 165,132 | ||||||
| Eversource Energy | 2,128 | 165,899 | ||||||
| Exelon Corp. | 4,254 | 159,355 | ||||||
See Notes to Financial Statements.
| 10 | www.INDEX.fund |
| Index Funds S&P 500® Equal Weight | Schedule of Investments |
| September 30, 2022 (Unaudited) |
| Shares | Fair Value | |||||||
| Utilities (Continued) | ||||||||
| FirstEnergy Corp. | 4,698 | $ | 173,826 | |||||
| NextEra Energy, Inc. | 2,169 | 170,071 | ||||||
| Nisource, Inc. | 6,402 | 161,266 | ||||||
| NRG Energy, Inc. | 4,506 | 172,445 | ||||||
| PG&E Corp.(a) | 13,000 | 162,500 | ||||||
| Pinnacle West Capital Corp. | 2,538 | 163,726 | ||||||
| PPL Corp. | 6,534 | 165,637 | ||||||
| Public Service Enterprise Group, Inc. | 2,868 | 161,268 | ||||||
| Sempra Energy | 1,122 | 168,233 | ||||||
| Southern Co. (The) | 2,452 | 166,736 | ||||||
| WEC Energy Group, Inc. | 1,832 | 163,836 | ||||||
| Xcel Energy, Inc. | 2,534 | 162,176 | ||||||
| 4,961,603 | ||||||||
| Total Common Stocks | ||||||||
| (Cost $76,718,409) | 85,483,454 | |||||||
| Shares | Fair Value | |||||||
| EXCHANGE-TRADED FUNDS — 0.52% | ||||||||
| SPDR S&P 500 ETF Trust | 1,250 | $ | 446,475 | |||||
| Total Exchange-Traded Funds | ||||||||
| (Cost $453,779) | 446,475 | |||||||
| Total Investments — 99.33% | ||||||||
| (Cost $77,172,188) | 85,929,929 | |||||||
| Other Assets in Excess of Liabilities — 0.67% | 578,157 | |||||||
| NET ASSETS — 100.00% | $ | 86,508,086 | ||||||
| (a) | Non-income producing security. |
See Notes to Financial Statements.
| Semi-Annual Report | September 30, 2022 | 11 |
| Index Funds S&P 500® Equal Weight | Statement of Assets and Liabilities |
| September 30, 2022 (Unaudited) |
| ASSETS: | ||||
| Investments in securities at fair value (cost $77,172,188) | $ | 85,929,929 | ||
| Cash and cash equivalents | 308,872 | |||
| Receivable for fund shares sold | 497,038 | |||
| Receivable for investments sold | 155,193 | |||
| Dividends receivable | 110,733 | |||
| Tax reclaims receivable | 58 | |||
| Receivable from Investment Adviser | 27,109 | |||
| Prepaid expenses | 60,516 | |||
| Total Assets | 87,089,448 | |||
| LIABILITIES: | ||||
| Payable for fund shares redeemed | 58,432 | |||
| Payable for investments purchased | 453,779 | |||
| Payable to Administrator | 23,525 | |||
| Payable to trustees | 475 | |||
| Other accrued expenses | 45,151 | |||
| Total Liabilities | 581,362 | |||
| NET ASSETS | $ | 86,508,086 | ||
| NET ASSETS CONSIST OF: | ||||
| Paid-in capital | 77,806,636 | |||
| Distributable earnings | 8,701,450 | |||
| NET ASSETS | $ | 86,508,086 | ||
| Shares of beneficial interest outstanding, without par value | 2,253,105 | |||
| Net asset value, offering and redemption price per share(a) | $ | 38.40 |
| (a) | The Fund charges a 0.25% redemption fee on shares redeemed within 30 calendar days of purchase. Shares are redeemed at the Net Asset Value if held longer than 30 calendar days. |
See Notes to Financial Statements.
| 12 | www.INDEX.fund |
| Index Funds S&P 500® Equal Weight | Statement of Operations |
| For the six months ended September 30, 2022 (Unaudited) |
| INVESTMENT INCOME: | ||||
| Dividend income (net of foreign taxes withheld of $178) | $ | 918,666 | ||
| Total investment income | 918,666 | |||
| EXPENSES: | ||||
| Investment Adviser fees (Note 3) | 118,773 | |||
| Fund accounting and administration fees | 55,151 | |||
| Registration expenses | 22,445 | |||
| Printing and postage expenses | 12,854 | |||
| Chief compliance officer fees | 15,041 | |||
| Legal fees | 7,669 | |||
| Transfer agent fees | 15,331 | |||
| Audit and tax preparation fees | 9,276 | |||
| Insurance expenses | 5,877 | |||
| Custodian fees | 7,308 | |||
| Pricing | 5,488 | |||
| Trustee fees and expenses | 475 | |||
| Miscellaneous expenses | 27,977 | |||
| Total expenses | 303,665 | |||
| Fees waived/reimbursed by investment adviser (Note 3) | (185,018 | ) | ||
| Net operating expenses | 118,647 | |||
| NET INVESTMENT INCOME: | 800,019 | |||
| REALIZED AND UNREALIZED GAIN (LOSS) ON INVESTMENTS: | ||||
| Net realized loss on investments | (723,118 | ) | ||
| Net change in unrealized appreciation (depreciation) on investments | (19,482,201 | ) | ||
| NET REALIZED AND CHANGE IN UNREALIZED LOSS ON INVESTMENTS | (20,205,319 | ) | ||
| NET DECREASE IN NET ASSETS RESULTING FROM OPERATIONS | $ | (19,405,300 | ) |
See Notes to Financial Statements.
| Semi-Annual Report | September 30, 2022 | 13 |
| Index Funds S&P 500® Equal Weight | Statements of Changes in Net Assets |
| For the | ||||||||
| Six Months | For the | |||||||
| Ended | Year | |||||||
| September 30, | Ended | |||||||
| 2022 | March 31, | |||||||
| (Unaudited) | 2022 | |||||||
| INCREASE (DECREASE) IN NET ASSETS DUE TO: | ||||||||
| OPERATIONS | ||||||||
| Net investment income | $ | 800,019 | $ | 1,251,197 | ||||
| Net realized gain (loss) on investments | (723,118 | ) | 2,691,170 | |||||
| Net change in unrealized appreciation (depreciation) on investments | (19,482,201 | ) | 6,031,242 | |||||
| Net increase (decrease) in net assets resulting from operations | (19,405,300 | ) | 9,973,609 | |||||
| DISTRIBUTIONS TO SHAREHOLDERS | ||||||||
| From earnings | — | (1,823,466 | ) | |||||
| Total distributions | — | (1,823,466 | ) | |||||
| CAPITAL TRANSACTIONS | ||||||||
| Proceeds from shares sold | 11,942,414 | 44,275,600 | ||||||
| Reinvestment of distributions | — | 1,823,425 | ||||||
| Amount paid for shares redeemed | (8,297,623 | ) | (22,187,378 | ) | ||||
| Proceeds from redemption fees(a) | 1,364 | 3,642 | ||||||
| Net increase in net assets resulting from capital transactions | 3,646,155 | 23,915,289 | ||||||
| Total Increase (Decrease) in Net Assets | (15,759,145 | ) | 32,065,432 | |||||
| NET ASSETS | ||||||||
| Beginning of period | 102,267,231 | 70,201,799 | ||||||
| End of period | $ | 86,508,086 | $ | 102,267,231 | ||||
| SHARE TRANSACTIONS | ||||||||
| Shares sold | 275,688 | 961,781 | ||||||
| Shares issued in reinvestment of distributions | — | 38,954 | ||||||
| Shares redeemed | (191,321 | ) | (480,559 | ) | ||||
| Net increase in shares outstanding | 84,367 | 520,176 | ||||||
| (a) | The Fund charges a 0.25% redemption fee on shares redeemed within 30 calendar days of purchase. Shares are redeemed at the Net Asset Value if held longer than 30 calendar days. |
See Notes to Financial Statements.
| 14 | www.INDEX.fund |
| Index Funds S&P 500® Equal Weight | Financial Highlights |
| (For a share outstanding during each period) |
| For the | ||||||||||||||||||||||||
| Six Months | ||||||||||||||||||||||||
| Ended | ||||||||||||||||||||||||
| September 30, | For the Year | For the Year | For the Year | For the Year | For the Year | |||||||||||||||||||
| 2022 | Ended | Ended | Ended | Ended | Ended | |||||||||||||||||||
| (Unaudited) | March 31, 2022 | March 31, 2021 | March 31, 2020 | March 31, 2019 | March 31, 2018 | |||||||||||||||||||
| SELECTED PER SHARE DATA | ||||||||||||||||||||||||
| Net asset value, beginning of period | $ | 47.16 | $ | 42.58 | $ | 25.34 | $ | 31.19 | $ | 30.04 | $ | 27.27 | ||||||||||||
| Investment operations: | ||||||||||||||||||||||||
| Net investment income(a) | 0.36 | 0.63 | 0.56 | 0.60 | 0.57 | 0.49 | ||||||||||||||||||
| Net realized and unrealized gain (loss) on investments | (9.12 | ) | 4.83 | 17.25 | (5.90 | ) | 1.42 | 2.65 | ||||||||||||||||
| Total from investment operations | (8.76 | ) | 5.46 | 17.81 | (5.30 | ) | 1.99 | 3.14 | ||||||||||||||||
| Less distributions to shareholders from: | ||||||||||||||||||||||||
| Net investment income | — | (0.53 | ) | (0.58 | ) | (0.55 | ) | (0.49 | ) | (0.35 | ) | |||||||||||||
| Net realized gains | — | (0.35 | ) | — | — | (0.35 | ) | (0.02 | ) | |||||||||||||||
| Total distributions | — | (0.88 | ) | (0.58 | ) | (0.55 | ) | (0.84 | ) | (0.37 | ) | |||||||||||||
| Paid-in capital from redemption fees (Note 2) | — | (b) | — | (b) | 0.01 | — | (b) | — | (b) | — | (b) | |||||||||||||
| Net asset value, end of period | $ | 38.40 | $ | 47.16 | $ | 42.58 | $ | 25.34 | $ | 31.19 | $ | 30.04 | ||||||||||||
| Total Return(c) | (18.58 | )% (d) | 12.83 | % | 70.67 | % | (17.44 | )% | 7.02 | % | 11.50 | % | ||||||||||||
| Ratios and Supplemental Data: | ||||||||||||||||||||||||
| Net assets, end of period (000 omitted) | $ | 86,508 | $ | 102,267 | $ | 70,202 | $ | 39,322 | $ | 39,258 | $ | 32,746 | ||||||||||||
| Ratio of expenses to average net assets after expense waiver | 0.25 | % (e) | 0.25 | % | 0.25 | % | 0.25 | % | 0.25 | % | 0.25 | % | ||||||||||||
| Ratio of expenses to average net assets before expense waiver | 0.64 | % (e) | 0.66 | % | 0.86 | % | 1.12 | % | 1.34 | % | 1.98 | % | ||||||||||||
| Ratio of net investment income to average net assets after expense waiver | 1.69 | % (e) | 1.37 | % | 1.61 | % | 1.87 | % | 1.85 | % | 1.68 | % | ||||||||||||
| Portfolio turnover rate | 19 | % (d) | 60 | % | 96 | % | 76 | % | 83 | % | 64 | % | ||||||||||||
| (a) | Calculated using the average shares method. |
| (b) | Less than $0.005 per share. |
| (c) | Total return represents the rate that the investor would have earned or lost on an investment in the Fund, assuming reinvestment of distributions. |
| (d) | Not annualized. |
| (e) | Annualized. |
See Notes to Financial Statements.
| Semi-Annual Report | September 30, 2022 | 15 |
| Index Funds S&P 500® Equal Weight | Notes to Financial Statements |
| September 30, 2022 (Unaudited) |
| 1. ORGANIZATION |
The Index Funds S&P 500® Equal Weight (the “Fund”) is a separate series of Index Funds, an open-end management investment company that was organized as a trust under the laws of the State of Delaware on November 9, 2005 (the “Trust”). The Fund currently offers one class of shares: No Load Shares. The Fund is diversified, as that term is defined in the Investment Company Act of 1940, as amended (the “1940 Act”).
The Fund seeks to achieve its investment objective by investing in a portfolio of assets whose performance, before fees and expenses, is expected to match approximately the performance of the S&P 500® Equal Weight Index (the “Index”). The Fund expects that its portfolio will consist primarily of securities of issuers included in the Index. The Index is designed to measure the performance of approximately 500 U.S. issuers chosen for market size, liquidity and industry grouping, among other factors.
| 2. SIGNIFICANT ACCOUNTING POLICIES |
The following is a summary of significant accounting policies consistently followed by the Fund. These policies are in conformity with accounting principles generally accepted in The United States of America (“GAAP”). The Fund is an investment company and accordingly follows the Investment Company accounting and reporting guidance of the Financial Accounting Standards Board (“FASB”) Accounting Standards Codification Topic 946, “Financial Services-Investment Companies.”
Use of Estimates — The preparation of financial statements in conformity with GAAP requires management to make estimates and assumptions that affect the amounts of assets and liabilities and disclosure of contingent assets and liabilities at the date of the financial statements and the reported amounts of increases and decreases in net assets from operations during the reporting period. Actual results could differ from those estimates.
Investment Transactions — Investment security transactions are accounted for on trade date. Gains and losses on securities sold are determined on a specific identification basis.
Investment Income — Dividend income is recorded on the ex-dividend date. Withholding taxes on foreign dividends have been provided for in accordance with the Fund’s understanding of the applicable country’s tax rules and rates. Interest income, which includes amortization of premium and accretion of discount, is recorded on the accrual basis.
Investment Valuation — The Fund’s portfolio securities are valued as of the close of trading of the New York Stock Exchange (“NYSE”) (normally 4:00 p.m., Eastern Time). Each security, excluding short-term investments, is valued at the last sale price reported by the principal security exchange on which the issue is traded. Money market funds, representing short-term investments, are valued at their daily net asset value. Securities that are traded on the Nasdaq Stock Market, Inc. are valued at the Nasdaq Official Closing Price or if no sale is reported, the mean between the bid and the ask. Securities which are traded over-the-counter are valued at the last sale price or, if no sale, at the mean between the bid and the ask. Securities for which quotations are not readily available are valued at fair value as determined by the investment adviser in accordance with procedures approved by the Board of Trustees (the “Board”). The fair value of a security is the amount which the Fund might reasonably expect to receive upon a current sale. The fair value of a security may differ from the last quoted price and the Fund may not be able to sell a security at the fair value. Market quotations may not be available, for example, if trading in particular securities was halted during the day and not resumed prior to the close of trading on the NYSE. As of September 30, 2022, there were no securities that were internally fair valued.
Fair Value Measurements — A three-tier hierarchy has been established to classify fair value measurements for disclosure purposes. Inputs refer broadly to the assumptions that market participants would use in pricing the asset or liability, including assumptions about risk. Inputs may be observable or unobservable. Observable inputs are inputs that reflect the assumptions market participants would use in pricing the asset or liability that are developed based on market data obtained from sources independent of the reporting entity. Unobservable inputs are inputs that reflect the reporting entity’s own assumptions about the assumptions market participants would use in pricing the asset or liability that are developed based on the best information available. In accordance with the authoritative guidance on fair value measurements and disclosure under GAAP, the Fund discloses fair value of its investments in a hierarchy that prioritizes the inputs to valuation techniques used to measure the fair value.
Various inputs are used in determining the value of the Fund’s investments as of the reporting period end. These inputs are categorized in the following hierarchy under applicable financial accounting standards:
| Level 1 — | Unadjusted quoted prices in active markets for identical, unrestricted assets or liabilities that the Fund has the ability to access at the measurement date; |
| Level 2 — | Quoted prices which are not active, quoted prices for similar assets or liabilities in active markets or inputs other than quoted prices that are observable (either directly or indirectly) for substantially the full term of the asset or liability; and |
| Level 3 — | Significant unobservable prices or inputs (including the Fund’s own assumptions in determining the fair value of investments) where there is little or no market activity for the asset or liability at the measurement date. |
| 16 | www.INDEX.fund |
| Index Funds S&P 500® Equal Weight | Notes to Financial Statements |
| September 30, 2022 (Unaudited) | |
The availability of observable inputs can vary from security to security and is affected by a wide variety of factors, including, for example, the type of security, whether the security is new and not yet established in the marketplace, the liquidity of markets, and other characteristics particular to the security. To the extent that valuation is based on models or inputs that are less observable or unobservable in the market, the determination of fair value requires more judgment. Accordingly, the degree of judgment exercised in determining fair value is greatest for instruments categorized in Level 3.
An investment level within the fair value hierarchy is based on the lowest level input, individually or in the aggregate, that is significant to fair value measurement. The valuation techniques used by the Fund to measure fair value during the six months ended September 30, 2022 maximized the use of observable inputs and minimized the use of unobservable inputs.
The inputs or methodologies used for valuing securities are not necessarily an indication of the risk or liquidity associated with investing in those securities. The following is a summary of the inputs used in valuing the Fund’s investments as of September 30, 2022:
| Investments in Securities at Value | Level 1 | Level 2 | Level 3 | Total | ||||||||||||
| Assets | ||||||||||||||||
| Common Stocks* | $ | 85,483,454 | $ | — | $ | — | $ | 85,483,454 | ||||||||
| Exchange-Traded Funds | 446,475 | — | — | 446,475 | ||||||||||||
| TOTAL | $ | 85,929,929 | $ | — | $ | — | $ | 85,929,929 | ||||||||
| * | See Schedule of Investments for sector classifications. |
The Fund did not hold any investments at the end of the reporting period for which significant unobservable inputs (Level 3) were used in determining fair value; therefore, no reconciliation of Level 3 securities is included for this reporting period.
Cash and Cash Equivalents — Idle cash may be swept into various interest bearing overnight demand deposits and is classified as a cash equivalent on the Statement of Assets and Liabilities. The Fund maintains cash in bank deposit accounts which, at times, may exceed United States federally insured limit of $250,000. Amounts swept overnight are available on the next business day.
Expenses — The Fund bears expenses incurred specifically for the Fund and general Trust expenses.
Distributions to Shareholders — Dividends from net investment income and distributions of net realized capital gains, if any, will be declared and paid at least annually. Income and capital gains distributions are determined in accordance with income tax regulations, which may differ from GAAP. Distributions to shareholders are recorded on the ex-dividend date.
Fees on Redemptions — The Fund charges a redemption fee of 0.25% on redemptions of Fund’s shares occurring within 30 days following the issuance of such shares. The redemption fee is not a fee to finance sales or sales promotion expenses but is paid to the Fund to defray the costs of liquidating an investor and discourage short-term trading of the Fund’s shares. No redemption fee will be imposed on the redemption of shares representing dividends or capital gains distributions, or on amounts representing capital appreciation of shares.
Federal Income Taxes — As of and during the six months ended September 30, 2022, the Fund did not have a liability for any unrecognized tax benefits. The Fund files U.S. federal, state, and local tax returns as required. The Fund’s tax returns are subject to examination by the relevant tax authorities until expiration of the applicable statute of limitations which is generally three years after the filing of the tax return for federal purposes and four years for most state returns. Tax returns for open years have incorporated no uncertain tax positions that require a provision for income taxes. Therefore, no provision is made by the Fund for federal income or excise taxes. The Fund intends to continue to qualify each year as a “regulated investment company” under Subchapter M of the Internal Revenue Code of 1986, as amended. By so qualifying, the Fund will not be subject to federal income taxes to the extent that it distributes substantially all of its taxable or tax-exempt income, if any, for its tax year ended March 31, 2022. In addition, by distributing in each calendar year substantially all of its net investment income, capital gains and certain other amounts, if any, the Fund will not be subject to a federal excise tax. Interest or penalties, if any, will be recorded in the Statement of Operations when incurred.
| 3. ADVISORY FEES, ADMINISTRATION FEES AND OTHER AGREEMENTS |
Investment Advisory Agreement — ONEFUND, LLC (the “Adviser”) currently provides investment advisory services for individuals, trusts, estates and institutions. The Adviser commenced operations in 2004 and is registered as an investment adviser with the Securities and Exchange Commission. The Adviser is entitled to an investment advisory fee, computed daily and payable monthly, of 0.25% of the average daily net assets of the Fund. An officer of the Trust is also an officer of the Adviser.
The Adviser has agreed to waive and/or reimburse fees or expenses in order to limit total annual fund operating expenses after fee waiver/expense reimbursement (excluding acquired fund fees and expenses, brokerage expenses, interest expenses, taxes and extraordinary expenses) to 0.25% of the Fund’s average daily net assets for No Load Shares. The Adviser intends to reimburse fund expenses no less frequently than on a quarterly basis,
| Semi-Annual Report | September 30, 2022 | 17 |
| Index Funds S&P 500® Equal Weight | Notes to Financial Statements |
| September 30, 2022 (Unaudited) | |
but there have been and there may continue to be instances where the Adviser reimburses fund expenses on a less frequent basis. This agreement is in effect through July 31, 2023, and may not be terminated or modified by the Adviser prior to this date except with the approval of the Fund’s Board. Amounts previously waived or reimbursed by the Adviser under this agreement are not subject to subsequent recapture by the Adviser.
Fund Accounting and Administration Fees and Expenses — Ultimus Fund Solutions, LLC (“Ultimus” or the “Administrator”) provides administrative, fund accounting and other services to the Fund under a Master Services Agreement with the Trust (the “Master Services Agreement”). Under the Master Services Agreement, Ultimus is paid fees for its services and is reimbursed for certain out-of-pocket expenses. Administrator fees paid by the Fund for the six months ended September 30, 2022 are disclosed in the Statement of Operations.
Transfer Agent and Shareholder Services Agreement — Ultimus serves as transfer, dividend paying and shareholder servicing agent for the Fund (the “Transfer Agent”) under the Master Services Agreement. Transfer Agent fees paid by the Fund for the six months ended September 30, 2022 are disclosed in the Statement of Operations.
Compliance Services — Ultimus provides Chief Compliance Officer services to the Fund. Additionally, Ultimus provides services in monitoring and testing the policies and procedures of the Trust in conjunction with requirements under Rule 38a-1 under the 1940 Act. Ultimus is compensated under the Master Services Agreement. Compliance services fees paid by the Fund for the six months ended September 30, 2022 are disclosed in the Statement of Operations.
Distributor — The Fund has entered into a Distribution Agreement with Ultimus Fund Distributors, LLC (the “Distributor”) to provide distribution services to the Fund. The Distributor serves as underwriter/distributor of shares of the Fund. Distribution services fees are paid by the Adviser pursuant to the terms set forth in the Distribution Agreement.
| 4. PURCHASES AND SALES OF INVESTMENT SECURITIES |
The aggregate cost of purchases and proceeds from sales of investment securities, excluding short-term securities, are shown below for the six months ended September 30, 2022.
| Cost of Investments | Proceeds from | |||||||
| Purchased | Investments Sold | |||||||
| Index Funds S&P 500® Equal Weight | $ | 21,454,477 | $ | 17,546,778 | ||||
| 5. TAX BASIS INFORMATION |
Distributions are determined in accordance with federal income tax regulations, which differ from GAAP, and, therefore, may differ significantly in amount or character from net investment income and realized gains for financial reporting purposes. Financial reporting records are adjusted for permanent book/tax differences to reflect tax character but are not adjusted for temporary differences. The amounts and characteristics of tax basis distributions and composition of distributable earnings/(accumulated losses) are finalized at fiscal year-end.
The tax character of distributions paid during the fiscal year ended March 31, 2022, were as follows:
| Ordinary Income | Long-Term Capital Gains | |||||||
| Index Funds S&P 500® Equal Weight | $ | 1,761,805 | $ | 61,661 | ||||
As of September 30, 2022, net unrealized appreciation/(depreciation) of investments based on the federal tax cost were as follows:
| Gross Appreciation (excess of value over tax cost) | Gross Depreciation (excess of tax cost over value) | Net Unrealized Appreciation | Cost of Investments for Income Tax Purposes | |||||||||||||
| Index Funds S&P 500® Equal Weight | $ | 12,544,588 | $ | (6,237,402 | ) | $ | 6,307,185 | $ | 79,931,616 | |||||||
The difference between book basis and tax basis is primarily attributable to wash sales.
| 18 | www.INDEX.fund |
| Index Funds S&P 500® Equal Weight | Notes to Financial Statements |
| September 30, 2022 (Unaudited) | |
At March 31, 2022, components of distributable earnings on a tax basis were as follows:
| Index Funds S&P 500® | ||||
| Equal Weight | ||||
| Accumulated ordinary income | $ | 1,539,816 | ||
| Accumulated long-term capital gains | 777,547 | |||
| Net unrealized appreciation on investments | 25,789,387 | |||
| Total | $ | 28,106,750 | ||
Capital Losses — As of March 31, 2022, the Fund did not have any capital loss carryforwards which may reduce the Fund’s taxable income arising from future net realized gains on investments, if any, to the extent permitted by the Code and thus may reduce the amount of the distributions to shareholders which would otherwise be necessary to relieve the Fund of any liability for federal tax pursuant to the Code. During the fiscal year ended March 31, 2022, the Fund utilized capital loss carryforwards of $152,581.
| 6. BENEFICIAL OWNERSHIP |
As of September 30, 2022, the following entities owned beneficially 25% or greater of the Fund’s outstanding shares. The shares are held under omnibus accounts (whereby the transactions of two or more shareholders are combined and carried in the name of the origination broker rather than designated separately).
| Index Funds S&P 500® Equal Weight | Percentage | |
| Charles Schwab & Co. | 41% | |
| TD Ameritrade, Inc. | 31% |
| 7. COMMITMENTS AND CONTINGENCIES |
Under the Trust’s organizational documents, its Officers and Trustees are indemnified against certain liabilities arising out of the performance of their duties to the Fund. In addition, in the normal course of business, the Trust entered into contracts with its service providers, on behalf of the Fund, and others that provide for general indemnifications. The Fund’s maximum exposure under these arrangements is unknown, as this would involve future claims that may be made against the Fund. The Fund expects the risk of loss to be remote.
| 8. SUBSEQUENT EVENTS |
Management of the Fund has evaluated the need for disclosures and/or adjustments resulting from subsequent events through the date at which these financial statements were issued. Based upon this evaluation, management has determined there were no items requiring adjustment of the financial statements or additional disclosure.
| Semi-Annual Report | September 30, 2022 | 19 |
| Index Funds S&P 500® Equal Weight | Liquidity Risk Management Program |
| September 30, 2022 (Unaudited) | |
The Fund has adopted and implemented a written liquidity risk management program (the “Program”) as required by Rule 22e-4 (the “Liquidity Rule”) under the Investment Company Act of 1940, as amended. The Board of Trustees (the “Board”) of the Fund appointed the Adviser as the liquidity program administrator of the Fund’s Liquidity Risk Management Policies and Procedures (“LRM Procedures”). The LRM Procedures require that the Board review an annual written report that addresses the operation of the LRM Procedures and assesses its adequacy and effectiveness of implementation, including the operation of any applicable highly liquid investment minimum, and any material changes to the LRM Procedures. The annual report, covering the period from June 1, 2021 through May 31, 2022 (the “Report”), was presented to the Board for consideration at its meeting held on September 23, 2022. During the review period, (i) there were no changes to the Program; (ii) the Fund invested primarily in highly liquid investments and, therefore, was not required to establish, and did not establish, a highly liquid investment minimum; (iii) the Fund did not invest more than 15% of its net assets in illiquid investments; (iv) the Fund held adequate levels of cash and highly liquid investments to meet shareholder redemption activities in accordance with applicable requirements; and (v) the Fund did not experience unusual stress or disruption to its operations related to purchase and redemption activity. The Report concluded that the LRM Procedures are operating effectively to assess and manage the Fund’s liquidity risk and that the LRM Procedures have been and continue to be adequately and effectively implemented to monitor and, as applicable, respond to the Fund’s liquidity developments.
| 20 | www.INDEX.fund |
| Index Funds S&P 500® Equal Weight | Summary of Fund Expenses |
| September 30, 2022 (Unaudited) | |
As a shareholder of the Index Funds S&P 500® Equal Weight (the “Fund”), you may incur two types of costs: (1) transaction costs, including applicable redemption fees; and (2) ongoing costs, including management fees and other Fund expenses. The following examples are intended to help you understand your ongoing costs (in dollars) of investing in the Fund and to compare these costs with the ongoing costs of investing in other mutual funds. The examples are based on an investment of $1,000 invested on April 1, 2022 and held until September 30, 2022.
Actual Expenses. The first line of each table below provides information about actual account values and actual expenses. You may use the information in this line, together with the amount you invested, to estimate the expenses that you paid over the period. Simply divide your account value by $1,000 (for example, an $8,600 account value divided by $1,000 = 8.6), then multiply the result by the number in the first line under the heading “Expenses Paid During Period” to estimate the expenses you paid on your account during this period.
Hypothetical Example for Comparison Purposes. The second line of the table below provides information about hypothetical account values and hypothetical expenses based on the Fund’s actual expense ratio and an assumed rate of return of 5% per year before expenses, which is not the Fund’s actual return. The hypothetical account values and expenses may not be used to estimate the actual ending account balance or expenses you paid for the period. You may use this information to compare the ongoing costs of investing in the Fund and other mutual funds. To do so, compare this 5% hypothetical example with the 5% hypothetical examples that appear in the shareholder reports of the other funds. The expenses shown in the table are meant to highlight ongoing Fund costs only and do not reflect transaction fees, such as redemption fees or exchange fees. Therefore, the second line of each table below is useful in comparing ongoing costs only, and may not help you determine the relative total costs of owning different funds. In addition, if these transactional costs were included, your costs would have been higher.
| Index Funds S&P 500® Equal Weight | Beginning Account Value April 1, 2022 | Ending Account Value September 30, 2022 | Expenses Paid During Period(a) | Annualized Expense Ratio | ||||
| Actual | $1,000.00 | $ 814.20 | $ 1.14 | 0.25% | ||||
| Hypothetical(b) | $1,000.00 | $1,023.82 | $ 1.27 | 0.25% | ||||
| (a) | Expenses are equal to the Fund’s annualized expense ratios, multiplied by the average account value over the period, multiplied by 183/365 (to reflect the one-half year period). |
| (b) | Hypothetical assumes 5% annual return before expenses. |
| Semi-Annual Report | September 30, 2022 | 21 |
| Index Funds S&P 500® Equal Weight | Additional Information |
| September 30, 2022 (Unaudited) |
| 1. PROXY VOTING POLICIES AND VOTING RECORD |
A copy of the Trust’s Proxy Voting and Disclosure Policy and the Adviser’s Proxy Voting and Disclosure Policy are included as Appendix B to the Fund’s Statement of Additional Information (dated July 29, 2022) and are available, (1) without charge, upon request, by calling (1-844-464-6339) and (2) on the Securities and Exchange Commission’s (“SEC”) website at www.sec.gov. Information regarding how the Fund voted proxies relating to portfolio securities during the most recent 12-month period ended June 30 will be available (1) without charge, upon request, by calling the Fund at the number above and (2) on the SEC’s website at www.sec.gov.
| 2. QUARTERLY PORTFOLIO HOLDINGS |
The Fund files its complete schedule of portfolio holdings with the SEC for the first and third quarters of each fiscal year as an exhibit to its report on Form N-PORT. These filings are available on the SEC’s website at www.sec.gov or on the Fund’s website at www.INDEX.fund.
| 22 | www.INDEX.fund |
| Index Funds S&P 500® Equal Weight | Privacy Policy |
| September 30, 2022 (Unaudited) |
| FACTS | WHAT DOES INDEX FUNDS S&P 500® EQUAL WEIGHT (THE “FUND”) DO WITH YOUR PERSONAL INFORMATION? |
| Why? | Financial companies choose how they share your personal information. Federal law gives consumers the right to limit some but not all sharing. Federal law also requires us to tell you how we collect, share, and protect your personal information. Please read this notice carefully to understand what we do. |
| What? | The types of personal information we collect and share depend on the product or service you have with us. This information can include:
● Social Security number and name and address
● Account balances and transaction history
● Wire transfer instructions
When you are no longer our investor, we continue to share your information as described in this notice. |
| How? | All financial companies need to share customers’ personal information to run their everyday business. In the section below, we list the reasons financial companies can share their customers’ personal information; the reasons the Fund chooses to share; and whether you can limit this sharing. |
| Reasons we can share your personal information | Does the Fund share? | Can
you limit this sharing? |
| For
our everyday business purposes— such as to process your transactions, maintain your account(s), respond to court orders and legal investigations, or report to credit bureaus |
Yes | No |
| For
our marketing purposes— to offer our products and services to you |
No | We don’t share |
| For joint marketing with other financial companies | No | We don’t share |
| For
our affiliates’ everyday business purposes— information about your transactions and experiences |
Yes | No |
| For
our affiliates’ everyday business purposes— information about your creditworthiness |
No | We don’t share |
| For nonaffiliates to market to you | No | We don’t share |
| Questions? |
| Semi-Annual Report | September 30, 2022 | 23 |
| Index Funds S&P 500® Equal Weight | Privacy Policy |
| September 30, 2022 (Unaudited) |
| Who We Are | |
| Who is providing this notice? | Index Funds S&P 500® Equal Weight (the “Fund”) |
| What We Do | |
| How
does the Fund protect my personal information? |
To protect your personal information from unauthorized access and use, we use security measures that seek to comply with federal law. These measures include computer safeguards and secured files and buildings. |
| How
does the Fund collect my personal information? |
We collect your personal information, for example, when you
● Open an account
● Provide account information or give us your contact information
● Make a wire transfer or deposit money
|
| Why can’t I limit all sharing? | Federal law gives you the right to limit only
● sharing for affiliates’ everyday business purposes — information about your creditworthiness
● affiliates from using your information to market to you
● sharing for nonaffiliates to market to you
State laws and individual companies may give you additional rights to limit sharing. |
| Definitions | |
| Affiliates | Companies related by common ownership or control. They can be financial and nonfinancial companies. |
| Nonaffiliates | Companies not related by common ownership or control. They can be financial and nonfinancial companies.
● Nonaffiliates can include third parties who perform services on our behalf, such as accounting, legal or data processing services. |
| Joint marketing | A formal agreement between nonaffiliated financial companies that together market financial products or services to you.
● The Fund doesn’t jointly market |
| 24 | www.INDEX.fund |
Page Intentionally Left Blank.
| (b) | Not applicable. |
Item 2. Code of Ethics.
Not applicable to semiannual reports.
Item 3. Audit Committee Financial Expert.
Not applicable to semiannual reports.
Item 4. Principal Accountant Fees and Services.
Not applicable to semiannual reports.
Item 5. Audit Committee of Listed Registrants.
Not applicable.
Item 6. Investments.
(a) Included as part of the report to Stockholders filed under Item 1 of this Form.
(b) Not applicable.
Item 7. Disclosure of Proxy Voting Policies and Procedures for Closed-End Management Investment Companies.
Not applicable.
Item 8. Portfolio Managers of Closed-End Management Investment Companies.
Not applicable.
Item 9. Purchases of Equity Securities by Closed-End Management Investment Company and Affiliated Purchasers.
Not applicable.
Item 10. Submission of Matters to a Vote of Security Holders.
None.
Item 11. Controls and Procedures.
(a) The registrant’s Principal Executive Officer and Principal Financial Officer have concluded that the registrant's disclosure controls and procedures (as defined in Rule 30a-3(c) under the Act) are effective in design and operation and are sufficient to form the basis of the certifications required by Rule 30a-2 under the Act, based on their evaluation of these disclosure controls and procedures within 90 days of the filing of this report on Form N-CSR.
(b) There were no changes in the registrant’s internal control over financial reporting (as defined in Rule 30a-3(d) under the Act (17 CFR 270.30a-3(d)) that occurred during the period covered by this report that have materially affected or are reasonably likely to materially affect, the registrant’s internal control over financial reporting.
Item 12. Disclosure of Securities Lending Activities for Closed-End Management Investment Companies.
Not applicable.
Item 13. Exhibits.
(a)(1) Not applicable.
(a)(2) Certifications pursuant to Rule 30a-2(a) are attached hereto.
(a)(3) Not applicable.
(a)(4) Not applicable.
(b) Certifications pursuant to Rule 30a-2(b) are furnished herewith.
SIGNATURES
Pursuant to the requirements of the Securities Exchange Act of 1934 and the Investment Company Act of 1940, the registrant has duly caused this report to be signed on its behalf by the undersigned, thereunto duly authorized.
(Registrant) Index Funds.
| By (Signature and Title) | /s/ Michael G. Willis |
Michael G. Willis, President and Principal Executive Officer
| Date | 12/07/2022 |
Pursuant to the requirements of the Securities Exchange Act of 1934 and the Investment Company Act of 1940, this report has been signed below by the following persons on behalf of the registrant and in the capacities and on the dates indicated.
| By (Signature and Title) | /s/ Michael G. Willis |
Michael G. Willis, President and Principal Executive Officer
| Date | 12/07/2022 |
| By (Signature and Title) | /s/ Michael G. Willis |
Michael G. Willis, Treasurer and Principal Financial Officer
| Date | 12/07/2022 |
ATTACHMENTS / EXHIBITS
Serious News for Serious Traders! Try StreetInsider.com Premium Free!
You May Also Be Interested In
- Meta shares dip on softer Q2 revenue guidance, elevated AI spending plans
- IDEX Biometrics 2023 annual report and 2023 executive remuneration report
- Former "Dance Moms" Star Nia Sioux Highlights Mental Health with "Seize the Awkward" in Directorial Debut
Create E-mail Alert Related Categories
SEC FilingsSign up for StreetInsider Free!
Receive full access to all new and archived articles, unlimited portfolio tracking, e-mail alerts, custom newswires and RSS feeds - and more!
