

Form N-CSRS INCOME FUND OF AMERICA For: Jan 31
 Tweet
Tweet Share
ShareUNITED STATES
SECURITIES AND EXCHANGE COMMISSION
Washington, D.C. 20549
FORM N-CSR
Certified Shareholder Report of
Registered Management Investment Companies
Investment Company Act File Number: 811-01880
The Income Fund of America
(Exact Name of Registrant as Specified in Charter)
6455 Irvine Center Drive
Irvine, California 92618
(Address of Principal Executive Offices)
Registrant's telephone number, including area code: (949) 975-5000
Date of fiscal year end: July 31
Date of reporting period: January 31, 2023
Hong T. Le
The Income Fund of America
6455 Irvine Center Drive
Irvine, California 92620
(Name and Address of Agent for Service)
ITEM 1 – Reports to Stockholders
The Income Fund of America®
Semi-annual report |
|

Seeking current
income through
a flexible mix of
stocks and bonds
The Income Fund of America seeks current income while secondarily striving for capital growth.
This fund is one of more than 40 offered by Capital Group, home of American Funds, one of the nation’s largest mutual fund families. For over 90 years, Capital Group has invested with a long-term focus based on thorough research and attention to risk.
Fund results shown in this report, unless otherwise indicated, are for Class F-2 shares. Class A share results are shown at net asset value unless otherwise indicated. If a sales charge (maximum 5.75%) had been deducted from Class A shares, the results would have been lower. Results are for past periods and are not predictive of results for future periods. Current and future results may be lower or higher than those shown. Prices and returns will vary, so investors may lose money. Investing for short periods makes losses more likely. For current information and month-end results, visit capitalgroup.com.
Here are the average annual total returns on a $1,000 investment for periods ended December 31, 2022 (the most recent calendar quarter-end):
| 1 year | 5 years | 10 years | |||||||
| Class F-2 shares | –6.22 | % | 5.61 | % | 7.69 | % | |||
| Class A shares (reflecting 5.75% maximum sales charge) | –11.80 | 4.16 | 6.86 | ||||||
For other share class results visit capitalgroup.com and americanfundsretirement.com.
The total annual fund operating expense ratios are 0.36% for Class F-2 shares and 0.56% for Class A shares as of the prospectus dated October 1, 2022.
Investment results assume all distributions are reinvested and reflect applicable fees and expenses. When applicable, investment results reflect fee waivers and/or expense reimbursements, without which results would have been lower. Visit capitalgroup.com for more information.
The fund’s 30-day yield as of January 31, 2023, was 3.18% for Class F-2 shares and 2.79% for Class A shares, calculated in accordance with the U.S. Securities and Exchange Commission (SEC) formula. The fund’s 12-month distribution rates for Class F-2 shares and Class A shares as of that date were 3.37% and 2.99%, respectively. The Class A share results reflect the 5.75% maximum sales charge. The SEC yield reflects the rate at which the fund is earning income on its current portfolio of securities while the distribution rate reflects the fund’s past dividends paid to shareholders. Accordingly, the fund’s SEC yield and distribution rate may differ.
The return of principal for bond funds and for funds with significant underlying bond holdings is not guaranteed. Fund shares are subject to the same interest rate, inflation and credit risks associated with the underlying bond holdings. High-yield bonds are subject to greater fluctuations in value and risk of loss of income and principal than investment-grade bonds. Bond ratings, which typically range from AAA/ Aaa (highest) to D (lowest), are assigned by credit rating agencies such as Standard & Poor’s, Moody’s and/or Fitch as an indication of an issuer’s creditworthiness. Investing outside the United States may be subject to additional risks, such as currency fluctuations, periods of illiquidity and price volatility. These risks may be heightened in connection with investments in developing countries. Refer to the fund prospectus and the Risk Factors section of this report for more information on these and other risks associated with investing in the fund.
Investments are not FDIC-insured, nor are they deposits of or guaranteed by a bank or any other entity, so they may lose value.
Fellow investors:
Results for The Income Fund of America for the periods ended January 31, 2023, are shown in the table below, as well as results of the fund’s primary benchmark, the blended 65%/35% S&P 500 Index/Bloomberg U.S. Aggregate Index, and its secondary benchmarks, the S&P 500 Index and Bloomberg U.S. Aggregate Index.
For additional information about the fund, its investment results, holdings and portfolio managers, visit capitalgroup.com/individual/investments/fund/amefx. You can also access information about Capital Group’s American Funds and read our insights about the markets, retirement, saving for college, investing fundamentals and more at capitalgroup.com.
Contents
| 1 | Results at a glance |
| 2 | The portfolio at a glance |
| 3 | Investment portfolio |
| 51 | Financial statements |
| 55 | Notes to financial statements |
| 69 | Financial highlights |
For periods ended January 31, 2023, with all distributions reinvested
| Cumulative total returns | Average annual total returns | |||||||||||||||||||
| 6 months | 1 year | 5 years | 10 years | Lifetime (since Class A inception on 12/1/73)1 | ||||||||||||||||
| The Income Fund of America (Class F-2 shares) | 3.42 | % | –1.95 | % | 5.63 | % | 7.69 | % | 10.72 | % | ||||||||||
| The Income Fund of America (Class A shares) | 3.32 | –2.10 | 5.44 | 7.49 | 10.54 | |||||||||||||||
| 65%/35% S&P 500 Index/Bloomberg U.S. Aggregate Index2 | –0.95 | –7.93 | 6.79 | 8.87 | 9.77 | |||||||||||||||
| S&P 500 Index3 | –0.44 | –8.22 | 9.54 | 12.68 | 11.05 | |||||||||||||||
| Bloomberg U.S. Aggregate Index4 | –2.37 | –8.36 | 0.86 | 1.43 | 6.64 | |||||||||||||||
Past results are not predictive of results in future periods.
The market indexes are unmanaged and, therefore, have no expenses. Investors cannot invest directly in an index.
| 1 | Date Capital Research and Management Company became the fund’s investment adviser. |
| 2 | The 65%/35% S&P 500 Index/Bloomberg U.S. Aggregate Index blends the S&P 500 Index with the Bloomberg U.S. Aggregate Index by weighting their total returns at 65% and 35%, respectively. Results assume the blend is rebalanced monthly. |
| 3 | Source: S&P Dow Jones Indices LLC. S&P 500 Index is a market capitalization-weighted index based on the results of approximately 500 widely held common stocks. This index is unmanaged, and its results include reinvested dividends and/or distributions but do not reflect the effect of sales charges, commissions, account fees, expenses or U.S. federal income taxes. |
| 4 | Source: Bloomberg Index Services Ltd. From December 1, 1973, through December 31, 1975, the Bloomberg U.S. Government/Credit Index was used because the Bloomberg U.S. Aggregate Index did not yet exist. Bloomberg U.S. Aggregate Index represents the U.S. investment-grade fixed-rate bond market. This index is unmanaged, and its results include reinvested dividends and/or distributions but do not reflect the effect of sales charges, commissions, account fees, expenses or U.S. federal income taxes. |
| The Income Fund of America | 1 |
January 31, 2023
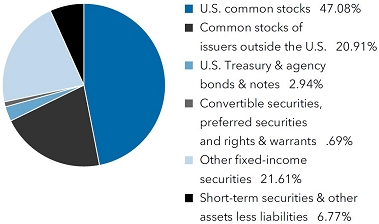
| Investment mix by security type | Percent of net assets |
 | |
Five largest sectors in common stock holdings
| Percent of net assets | ||||
| Financials | 12.09 | % | ||
| Consumer staples | 9.15 | |||
| Health care | 9.13 | |||
| Energy | 6.47 | |||
| Industrials | 6.43 | |||
| Ten largest common stock holdings | ||||
| Percent of net assets | ||||
| Philip Morris International | 2.82 | % | ||
| Gilead Sciences | 2.23 | |||
| Pfizer | 1.91 | |||
| Broadcom | 1.62 | |||
| JPMorgan Chase | 1.60 | |||
| Lockheed Martin | 1.59 | |||
| ConocoPhillips | 1.16 | |||
| AstraZeneca | 1.16 | |||
| BAE Systems | 1.11 | |||
| Microsoft | 1.07 | |||
| Country diversification by domicile | ||||
| Percent of net assets | ||||
| United States | 68.31 | % | ||
| Eurozone* | 6.33 | |||
| Canada | 5.40 | |||
| United Kingdom | 4.66 | |||
| Switzerland | 1.84 | |||
| Japan | 1.30 | |||
| Taiwan | 1.15 | |||
| China | 1.09 | |||
| Other countries | 3.15 | |||
| Short-term securities & other assets less liabilities | 6.77 | |||
| * | Countries using the euro as a common currency; those represented in the fund’s portfolio are Belgium, Finland, France, Germany, Ireland, Italy, Luxembourg, the Netherlands, Portugal and Spain. |
July 31, 2022
| Investment mix by security type | Percent of net assets |
 | |
Five largest sectors in common stock holdings
| Percent of net assets | ||||
| Consumer staples | 9.85 | % | ||
| Financials | 9.74 | |||
| Health care | 8.62 | |||
| Energy | 6.25 | |||
| Real estate | 5.83 | |||
| Ten largest common stock holdings | ||||
| Percent of net assets | ||||
| Pfizer | 2.64 | % | ||
| Philip Morris International | 2.37 | |||
| Broadcom | 1.71 | |||
| CME Group | 1.54 | |||
| Lockheed Martin | 1.50 | |||
| Microsoft | 1.36 | |||
| Crown Castle International | 1.26 | |||
| VICI Properties | 1.25 | |||
| AstraZeneca | 1.19 | |||
| Home Depot | 1.08 | |||
| Country diversification by domicile | ||||
| Percent of net assets | ||||
| United States | 69.95 | % | ||
| United Kingdom | 5.08 | |||
| Canada | 4.89 | |||
| Eurozone† | 4.41 | |||
| Switzerland | 1.59 | |||
| Taiwan | 1.12 | |||
| Other countries | 3.69 | |||
| Short-term securities & other assets less liabilities | 9.27 | |||
| † | Countries using the euro as a common currency; those represented in the fund’s portfolio are Finland, France, Germany, Ireland, Italy, Luxembourg, the Netherlands, Portugal and Spain. |
| 2 | The Income Fund of America |
| Investment portfolio January 31, 2023 | unaudited |
| Common stocks 67.99% | Shares | Value (000) | ||||||
| Financials 12.09% | ||||||||
| JPMorgan Chase & Co. | 13,873,228 | $ | 1,941,697 | |||||
| CME Group, Inc., Class A | 6,952,266 | 1,228,187 | ||||||
| Zurich Insurance Group AG | 1,782,129 | 881,396 | ||||||
| Goldman Sachs Group, Inc. | 2,298,200 | 840,705 | ||||||
| Morgan Stanley | 6,478,093 | 630,513 | ||||||
| DBS Group Holdings, Ltd. | 20,636,900 | 564,942 | ||||||
| Ping An Insurance (Group) Company of China, Ltd., Class H | 71,680,000 | 559,502 | ||||||
| Toronto-Dominion Bank (CAD denominated) | 7,608,387 | 526,420 | ||||||
| Fifth Third Bancorp | 13,635,000 | 494,814 | ||||||
| PNC Financial Services Group, Inc. | 2,581,165 | 427,002 | ||||||
| Apollo Asset Management, Inc. | 5,915,679 | 418,712 | ||||||
| Synchrony Financial | 11,302,951 | 415,157 | ||||||
| Ares Management Corp., Class A | 4,990,000 | 414,120 | ||||||
| T&D Holdings, Inc. (Japan) | 24,100,600 | 386,984 | ||||||
| Postal Savings Bank of China Co., Ltd., Class H1 | 460,417,000 | 312,958 | ||||||
| China Merchants Bank Co., Ltd., Class H | 35,272,500 | 228,968 | ||||||
| China Merchants Bank Co., Ltd., Class A | 13,686,300 | 83,869 | ||||||
| BlackRock, Inc. | 405,980 | 308,224 | ||||||
| Canadian Imperial Bank of Commerce (CAD denominated) | 6,667,000 | 304,350 | ||||||
| Blackstone, Inc., nonvoting shares | 2,929,100 | 281,076 | ||||||
| Power Corporation of Canada, subordinate voting shares | 9,625,253 | 261,077 | ||||||
| B3 SA-Brasil, Bolsa, Balcao | 99,956,000 | 255,192 | ||||||
| Regions Financial Corp. | 10,069,900 | 237,045 | ||||||
| Manulife Financial Corp. | 11,245,400 | 222,533 | ||||||
| Tryg A/S | 8,288,203 | 190,037 | ||||||
| Progressive Corp. | 1,315,000 | 179,300 | ||||||
| Franklin Resources, Inc. | 5,303,503 | 165,469 | ||||||
| ABN AMRO Bank NV | 9,765,620 | 161,715 | ||||||
| ING Groep NV | 10,430,350 | 150,545 | ||||||
| American International Group, Inc. | 2,353,000 | 148,757 | ||||||
| KeyCorp | 7,620,000 | 146,228 | ||||||
| DNB Bank ASA | 7,247,760 | 135,402 | ||||||
| Brookfield Asset Management, Ltd., Class A | 3,712,805 | 121,223 | ||||||
| Truist Financial Corp. | 2,316,800 | 114,427 | ||||||
| Citizens Financial Group, Inc. | 1,936,578 | 83,893 | ||||||
| Principal Financial Group, Inc. | 900,000 | 83,295 | ||||||
| Carlyle Group, Inc. | 2,217,000 | 79,745 | ||||||
| National Bank of Canada | 975,000 | 73,241 | ||||||
| Tokio Marine Holdings, Inc. | 3,327,000 | 69,639 | ||||||
| 3i Group PLC | 3,231,878 | 63,021 | ||||||
| Citigroup, Inc. | 1,200,000 | 62,664 | ||||||
| Qualitas Controladora, SAB de CV1 | 10,711,900 | 59,082 | ||||||
| Grupo Financiero Banorte, SAB de CV, Series O | 6,705,000 | 55,615 | ||||||
| China Pacific Insurance (Group) Co., Ltd., Class H | 18,545,200 | 51,129 | ||||||
| AXA SA | 1,505,000 | 46,916 | ||||||
| Islandsbanki hf. | 54,814,905 | 45,744 | ||||||
| Münchener Rückversicherungs-Gesellschaft AG | 117,000 | 42,139 | ||||||
| Bank Leumi Le Israel BM | 4,406,487 | 38,917 | ||||||
| TISCO Financial Group PCL, foreign registered shares | 10,000,000 | 31,274 | ||||||
| BB Seguridade Participações SA | 3,300,000 | 24,560 | ||||||
| Jonah Energy Parent, LLC2 | 275,936 | 16,313 | ||||||
| ICICI Securities, Ltd. | 2,337,232 | 14,073 | ||||||
| Wells Fargo & Company | 257,318 | 12,060 | ||||||
| Brookfield Corp., Class A | 207,530 | 7,720 | ||||||
| Great-West Lifeco, Inc. | 179,500 | 4,761 | ||||||
| Sberbank of Russia PJSC2,3 | 25,683,200 | — | 4 | |||||
| 14,704,347 | ||||||||
| Consumer staples 9.15% | ||||||||
| Philip Morris International, Inc. | 32,916,006 | 3,431,165 | ||||||
| Altria Group, Inc. | 27,891,305 | 1,256,224 | ||||||
| General Mills, Inc. | 11,847,544 | 928,373 | ||||||
| Procter & Gamble Company | 6,024,489 | 857,767 | ||||||
| British American Tobacco PLC | 20,520,000 | 784,771 | ||||||
| PepsiCo, Inc. | 3,457,312 | 591,269 | ||||||
| The Income Fund of America | 3 |
| Common stocks (continued) | Shares | Value (000) | ||||||
| Consumer staples (continued) | ||||||||
| Kraft Heinz Company | 12,974,240 | $ | 525,846 | |||||
| Nestlé SA | 4,237,617 | 517,123 | ||||||
| Coca-Cola Company | 8,333,900 | 511,035 | ||||||
| Bunge, Ltd. | 4,263,175 | 422,481 | ||||||
| Kimberly-Clark Corp. | 2,285,000 | 297,073 | ||||||
| Walgreens Boots Alliance, Inc. | 7,057,000 | 260,121 | ||||||
| Archer Daniels Midland Company | 2,078,000 | 172,162 | ||||||
| Conagra Brands, Inc. | 4,527,100 | 168,363 | ||||||
| Kellogg Co. | 1,770,000 | 121,387 | ||||||
| Imperial Brands PLC | 4,508,000 | 113,015 | ||||||
| Mondelez International, Inc. | 784,000 | 51,305 | ||||||
| Scandinavian Tobacco Group A/S | 2,878,531 | 50,087 | ||||||
| Danone SA | 875,000 | 47,885 | ||||||
| Viva Wine Group AB1 | 4,081,633 | 17,659 | ||||||
| 11,125,111 | ||||||||
| Health care 9.13% | ||||||||
| Gilead Sciences, Inc. | 32,377,334 | 2,717,753 | ||||||
| Pfizer, Inc. | 52,679,748 | 2,326,338 | ||||||
| AstraZeneca PLC | 10,792,800 | 1,412,112 | ||||||
| Merck & Co., Inc. | 9,030,232 | 969,937 | ||||||
| AbbVie, Inc. | 6,106,742 | 902,271 | ||||||
| Johnson & Johnson | 3,961,870 | 647,449 | ||||||
| CVS Health Corp. | 7,314,349 | 645,272 | ||||||
| Novartis AG | 4,789,328 | 433,150 | ||||||
| Takeda Pharmaceutical Company, Ltd. | 9,878,300 | 311,090 | ||||||
| Medtronic PLC | 3,572,509 | 298,983 | ||||||
| Sanofi | 1,584,600 | 155,713 | ||||||
| Danaher Corp. | 246,538 | 65,180 | ||||||
| Rotech Healthcare, Inc.2,3,5,6 | 543,172 | 58,119 | ||||||
| Bayer AG | 897,900 | 55,694 | ||||||
| Amgen, Inc. | 215,310 | 54,344 | ||||||
| Bristol-Myers Squibb Company | 709,449 | 51,542 | ||||||
| Organon & Co. | 264,123 | 7,958 | ||||||
| 11,112,905 | ||||||||
| Energy 6.47% | ||||||||
| ConocoPhillips | 11,615,860 | 1,415,625 | ||||||
| Exxon Mobil Corp. | 10,235,137 | 1,187,378 | ||||||
| TotalEnergies SE | 14,224,460 | 883,727 | ||||||
| TC Energy Corp. (CAD denominated) | 18,371,344 | 791,574 | ||||||
| Canadian Natural Resources, Ltd. (CAD denominated) | 11,822,070 | 725,646 | ||||||
| Chevron Corp. | 3,748,586 | 652,329 | ||||||
| Tourmaline Oil Corp. | 9,300,220 | 433,435 | ||||||
| Pioneer Natural Resources Company | 1,089,700 | 251,012 | ||||||
| Aker BP ASA | 8,027,297 | 244,580 | ||||||
| Coterra Energy, Inc. | 9,670,000 | 242,040 | ||||||
| Enbridge, Inc.1 | 5,000,000 | 204,850 | ||||||
| Baker Hughes Co., Class A | 5,310,000 | 168,539 | ||||||
| Valero Energy Corp. | 1,000,000 | 140,030 | ||||||
| Equinor ASA1 | 4,220,000 | 128,200 | ||||||
| EOG Resources, Inc. | 864,458 | 114,325 | ||||||
| Chesapeake Energy Corp.1 | 797,242 | 69,137 | ||||||
| Var Energi ASA1 | 16,516,306 | 50,239 | ||||||
| HF Sinclair Corp. | 635,000 | 36,132 | ||||||
| Woodside Energy Group, Ltd. | 1,344,966 | 34,913 | ||||||
| Shell PLC (GBP denominated) | 1,139,982 | 33,484 | ||||||
| Diamond Offshore Drilling, Inc.3 | 2,199,292 | 25,204 | ||||||
| Ascent Resources - Utica, LLC, Class A2,3,6 | 110,214,618 | 22,043 | ||||||
| Altera Infrastructure, LP2,3 | 73,434 | 5,824 | ||||||
| California Resources Corp. | 104,121 | 4,449 | ||||||
| Mesquite Energy, Inc.2,3 | 25,913 | 155 | ||||||
| McDermott International, Ltd.3 | 120,017 | 47 | ||||||
| Bighorn Permian Resources, LLC2 | 17,183 | — | 4 | |||||
| 7,864,917 | ||||||||
| 4 | The Income Fund of America |
| Common stocks (continued) | Shares | Value (000) | ||||||
| Industrials 6.43% | ||||||||
| Lockheed Martin Corp. | 4,183,700 | $ | 1,938,141 | |||||
| BAE Systems PLC | 127,909,564 | 1,351,815 | ||||||
| Raytheon Technologies Corp. | 6,991,551 | 698,106 | ||||||
| Kone OYJ, Class B | 9,340,141 | 510,032 | ||||||
| Norfolk Southern Corp. | 1,972,453 | 484,849 | ||||||
| Siemens AG | 3,081,300 | 478,728 | ||||||
| United Parcel Service, Inc., Class B | 2,279,641 | 422,258 | ||||||
| Caterpillar, Inc. | 997,810 | 251,737 | ||||||
| Cummins, Inc. | 1,000,000 | 249,540 | ||||||
| ManpowerGroup, Inc.5 | 2,722,832 | 237,322 | ||||||
| General Dynamics Corp. | 1,000,000 | 233,060 | ||||||
| Watsco, Inc. | 774,800 | 222,654 | ||||||
| Deutsche Post AG | 4,377,056 | 187,486 | ||||||
| Emerson Electric Co. | 2,025,800 | 182,768 | ||||||
| SGS SA | 70,186 | 171,098 | ||||||
| Illinois Tool Works, Inc. | 399,000 | 94,180 | ||||||
| Honeywell International, Inc. | 146,500 | 30,542 | ||||||
| Inwido AB | 2,500,000 | 27,230 | ||||||
| Singapore Technologies Engineering, Ltd. | 7,015,700 | 19,749 | ||||||
| Regal Rexnord Corp. | 134,000 | 18,653 | ||||||
| Ventia Services Group Pty, Ltd. | 7,954,000 | 13,607 | ||||||
| 7,823,555 | ||||||||
| Real estate 5.52% | ||||||||
| Crown Castle, Inc. REIT | 8,295,061 | 1,228,581 | ||||||
| VICI Properties, Inc. REIT | 35,151,684 | 1,201,484 | ||||||
| Iron Mountain, Inc. REIT | 12,761,822 | 696,540 | ||||||
| Extra Space Storage, Inc. REIT | 3,674,150 | 579,891 | ||||||
| Gaming and Leisure Properties, Inc. REIT | 10,793,948 | 578,124 | ||||||
| Public Storage REIT | 1,138,000 | 346,339 | ||||||
| Regency Centers Corp. REIT | 4,238,000 | 282,378 | ||||||
| Digital Realty Trust, Inc. REIT | 2,128,065 | 243,919 | ||||||
| Federal Realty Investment Trust REIT | 2,100,000 | 234,213 | ||||||
| Prologis, Inc. REIT | 1,657,500 | 214,281 | ||||||
| Lamar Advertising Co. REIT, Class A | 2,003,322 | 213,434 | ||||||
| Boston Properties, Inc. REIT | 2,600,000 | 193,804 | ||||||
| CubeSmart REIT | 3,927,254 | 179,829 | ||||||
| W. P. Carey, Inc. REIT | 1,820,000 | 155,665 | ||||||
| American Tower Corp. REIT | 646,000 | 144,310 | ||||||
| Americold Realty Trust, Inc. REIT | 3,362,200 | 105,607 | ||||||
| Kimco Realty Corp. REIT | 3,048,000 | 68,458 | ||||||
| CTP NV | 1,881,212 | 27,287 | ||||||
| Longfor Group Holdings, Ltd. | 3,664,658 | 12,195 | ||||||
| Selvaag Bolig ASA | 1,912,218 | 6,169 | ||||||
| 6,712,508 | ||||||||
| Utilities 4.39% | ||||||||
| Brookfield Infrastructure Partners, LP5 | 29,787,186 | 1,049,956 | ||||||
| DTE Energy Company | 6,690,800 | 778,608 | ||||||
| National Grid PLC | 42,441,421 | 539,848 | ||||||
| AES Corp. | 18,343,031 | 502,782 | ||||||
| The Southern Co. | 5,472,114 | 370,353 | ||||||
| Dominion Energy, Inc. | 5,548,580 | 353,112 | ||||||
| Public Service Enterprise Group, Inc. | 5,257,819 | 325,617 | ||||||
| FirstEnergy Corp. | 7,209,000 | 295,209 | ||||||
| Duke Energy Corp. | 2,713,965 | 278,046 | ||||||
| Veolia Environnement | 8,888,448 | 263,764 | ||||||
| E.ON SE | 20,824,110 | 226,265 | ||||||
| Edison International | 1,793,100 | 123,545 | ||||||
| CMS Energy Corp. | 1,715,700 | 108,415 | ||||||
| Enel SpA | 11,950,000 | 70,338 | ||||||
| Guangdong Investment, Ltd. | 52,919,000 | 57,616 | ||||||
| 5,343,474 | ||||||||
| The Income Fund of America | 5 |
| Common stocks (continued) | Shares | Value (000) | ||||||
| Information technology 4.31% | ||||||||
| Broadcom, Inc. | 3,371,450 | $ | 1,972,332 | |||||
| Microsoft Corp. | 5,263,730 | 1,304,405 | ||||||
| Taiwan Semiconductor Manufacturing Company, Ltd. | 61,145,300 | 1,078,737 | ||||||
| Taiwan Semiconductor Manufacturing Company, Ltd. (ADR) | 1,543,000 | 143,083 | ||||||
| Texas Instruments, Inc. | 2,200,000 | 389,862 | ||||||
| QUALCOMM, Inc. | 747,000 | 99,508 | ||||||
| Tokyo Electron, Ltd. | 246,000 | 86,326 | ||||||
| Vanguard International Semiconductor Corp. | 22,093,500 | 74,225 | ||||||
| MediaTek, Inc. | 2,086,000 | 50,549 | ||||||
| GlobalWafers Co., Ltd. | 2,423,000 | 42,803 | ||||||
| 5,241,830 | ||||||||
| Consumer discretionary 3.83% | ||||||||
| Home Depot, Inc. | 3,798,052 | 1,231,214 | ||||||
| Restaurant Brands International, Inc. | 11,754,129 | 786,704 | ||||||
| Target Corp. | 4,097,800 | 705,395 | ||||||
| Darden Restaurants, Inc. | 4,751,460 | 703,073 | ||||||
| Industria de Diseño Textil, SA | 18,322,164 | 572,164 | ||||||
| Starbucks Corp. | 4,240,321 | 462,789 | ||||||
| Domino’s Pizza Group PLC5 | 30,671,123 | 118,777 | ||||||
| Puuilo OYJ5 | 5,509,640 | 37,906 | ||||||
| Kindred Group PLC (SDR) | 2,826,533 | 28,493 | ||||||
| NMG Parent, LLC3 | 67,256 | 10,257 | ||||||
| MYT Holding Co., Class B2,3 | 2,070,418 | 3,106 | ||||||
| General Motors Company | 5,900 | 232 | ||||||
| 4,660,110 | ||||||||
| Communication services 3.45% | ||||||||
| Comcast Corp., Class A | 28,878,166 | 1,136,356 | ||||||
| Verizon Communications, Inc. | 13,709,633 | 569,909 | ||||||
| BCE, Inc.1 | 10,984,188 | 519,263 | ||||||
| Nippon Telegraph and Telephone Corp. | 17,285,600 | 517,607 | ||||||
| Publicis Groupe SA | 7,288,267 | 514,155 | ||||||
| Koninklijke KPN NV | 137,211,139 | 468,770 | ||||||
| Interpublic Group of Companies, Inc. | 7,883,500 | 287,432 | ||||||
| Singapore Telecommunications, Ltd. | 50,850,000 | 97,454 | ||||||
| Deutsche Telekom AG | 4,014,400 | 89,312 | ||||||
| Cumulus Media, Inc., Class A1,3 | 217,532 | 1,457 | ||||||
| Clear Channel Outdoor Holdings, Inc.3 | 152,827 | 292 | ||||||
| 4,202,007 | ||||||||
| Materials 3.22% | ||||||||
| Dow, Inc. | 11,470,000 | 680,744 | ||||||
| Rio Tinto PLC | 8,279,420 | 647,255 | ||||||
| Barrick Gold Corp. | 29,365,348 | 574,093 | ||||||
| Vale SA, ordinary nominative shares | 21,311,900 | 396,783 | ||||||
| UPM-Kymmene OYJ | 7,813,526 | 283,366 | ||||||
| Glencore PLC | 41,873,729 | 281,142 | ||||||
| Packaging Corporation of America | 1,294,900 | 184,782 | ||||||
| Akzo Nobel NV | 2,155,420 | 160,322 | ||||||
| Air Products and Chemicals, Inc. | 456,106 | 146,187 | ||||||
| Agnico Eagle Mines, Ltd. (CAD denominated) | 2,467,900 | 139,369 | ||||||
| Fortescue Metals Group, Ltd. | 7,995,309 | 126,829 | ||||||
| BHP Group, Ltd. (CDI) | 2,889,033 | 101,067 | ||||||
| Newmont Corp. | 1,250,000 | 66,162 | ||||||
| Shin-Etsu Chemical Co., Ltd. | 350,000 | 52,131 | ||||||
| BASF SE | 604,000 | 34,422 | ||||||
| Evonik Industries AG | 1,251,800 | 27,714 | ||||||
| Polymetal International PLC3 | 6,162,000 | 17,775 | ||||||
| 3,920,143 | ||||||||
| Total common stocks (cost: $57,799,483,000) | 82,710,907 | |||||||
| 6 | The Income Fund of America |
| Preferred securities 0.29% | Shares | Value (000) | ||||||
| Financials 0.23% | ||||||||
| Itaú Unibanco Holding SA, preferred nominative shares | 23,190,207 | $ | 115,716 | |||||
| Citigroup, Inc., 11.172% preferred shares7 | 2,245,277 | 64,484 | ||||||
| Citigroup, Inc., Series K, 6.875% noncumulative preferred depositary shares | 2,145,767 | 54,717 | ||||||
| Goldman Sachs Group, Inc., Series J, 5.50% preferred depositary shares | 1,200,000 | 29,940 | ||||||
| Wells Fargo & Company, Series Q, Class A, 5.85% noncumulative preferred depositary shares | 555,913 | 13,576 | ||||||
| 278,433 | ||||||||
| Information technology 0.06% | ||||||||
| Samsung Electronics Co., Ltd., nonvoting preferred shares | 1,565,200 | 70,530 | ||||||
| Industrials 0.00% | ||||||||
| ACR III LSC Holdings, LLC, Series B, preferred shares2,3,8 | 3,260 | 1,366 | ||||||
| Consumer discretionary 0.00% | ||||||||
| MYT Holdings, LLC, Series A, 10.00% preferred shares2,3 | 1,427,896 | 1,356 | ||||||
| Total preferred securities (cost: $355,860,000) | 351,685 | |||||||
| Rights & warrants 0.00% | ||||||||
| Consumer discretionary 0.00% | ||||||||
| NMG Parent, LLC, warrants, expire 9/24/20273 | 75,844 | 2,213 | ||||||
| Energy 0.00% | ||||||||
| Constellation Oil Services Holding SA, Class D, warrants, expire 6/10/20712,3 | 28 | — | 4 | |||||
| Total rights & warrants (cost: $459,000) | 2,213 | |||||||
| Convertible stocks 0.40% | ||||||||
| Health care 0.23% | ||||||||
| Becton, Dickinson and Company, Series B, convertible preferred shares, 6.00% 6/1/2023 | 2,467,280 | 124,252 | ||||||
| Danaher Corp., Series B, cumulative convertible preferred shares, 5.00% 4/15/2023 | 82,100 | 110,343 | ||||||
| Boston Scientific Corp., Series A, convertible preferred shares, 5.50% 6/1/2023 | 449,460 | 51,297 | ||||||
| 285,892 | ||||||||
| Utilities 0.09% | ||||||||
| AES Corp., convertible preferred units, 6.875% 2/15/20241 | 1,043,000 | 104,133 | ||||||
| Financials 0.06% | ||||||||
| KKR & Co., Inc., Series C, convertible preferred shares, 6.00% 9/15/2023 | 1,061,031 | 71,683 | ||||||
| Consumer discretionary 0.02% | ||||||||
| Aptiv PLC, Series A, convertible preferred shares, 5.50% 6/15/2023 | 224,000 | 28,222 | ||||||
| Total convertible stocks (cost: $431,911,000) | 489,930 | |||||||
| Convertible bonds & notes 0.00% | Principal amount (000) | |||||||
| Energy 0.00% | ||||||||
| Mesquite Energy, Inc., convertible notes, 13.14% Cash 7/15/20232,8,9 | USD | 577 | 577 | |||||
| Total convertible bonds & notes (cost: $577,000) | 577 | |||||||
| The Income Fund of America | 7 |
| Bonds, notes & other debt instruments 24.55% | Principal amount (000) | Value (000) | ||||||
| Corporate bonds, notes & loans 15.85% | ||||||||
| Financials 3.13% | ||||||||
| ACE INA Holdings, Inc. 3.35% 5/3/2026 | USD | 765 | $ | 742 | ||||
| Advisor Group Holdings, LLC 6.25% 3/1/20288 | 55,717 | 52,708 | ||||||
| AerCap Holdings NV 4.50% 9/15/2023 | 10,000 | 9,946 | ||||||
| AerCap Ireland Capital DAC 1.15% 10/29/2023 | 9,000 | 8,736 | ||||||
| AerCap Ireland Capital DAC 1.65% 10/29/2024 | 25,275 | 23,654 | ||||||
| AerCap Ireland Capital DAC 6.50% 7/15/2025 | 4,315 | 4,396 | ||||||
| AerCap Ireland Capital DAC 1.75% 1/30/2026 | 3,978 | 3,577 | ||||||
| AerCap Ireland Capital DAC 2.45% 10/29/2026 | 23,694 | 21,327 | ||||||
| AerCap Ireland Capital DAC 3.00% 10/29/2028 | 27,689 | 24,424 | ||||||
| AerCap Ireland Capital DAC 3.30% 1/30/2032 | 12,254 | 10,295 | ||||||
| AerCap Ireland Capital DAC 3.40% 10/29/2033 | 4,678 | 3,859 | ||||||
| AerCap Ireland Capital DAC 3.85% 10/29/2041 | 6,777 | 5,298 | ||||||
| AG Merger Sub II, Inc. 10.75% 8/1/20278 | 47,972 | 49,558 | ||||||
| AG TTMT Escrow Issuer, LLC 8.625% 9/30/20278 | 20,131 | 20,836 | ||||||
| AIB Group PLC 7.583% 10/14/2026 (USD-SOFR + 3.456% on 10/14/2025)8,10 | 17,500 | 18,119 | ||||||
| Alliant Holdings Intermediate, LLC 4.25% 10/15/20278 | 20,465 | 18,777 | ||||||
| Alliant Holdings Intermediate, LLC 6.75% 10/15/20278 | 48,446 | 45,388 | ||||||
| Alliant Holdings Intermediate, LLC 5.875% 11/1/20298 | 27,250 | 23,776 | ||||||
| Ally Financial, Inc. 8.00% 11/1/2031 | 11,401 | 12,516 | ||||||
| American International Group, Inc. 2.50% 6/30/2025 | 16,668 | 15,870 | ||||||
| American International Group, Inc. 4.375% 6/30/2050 | 3,450 | 3,150 | ||||||
| AmWINS Group, Inc. 4.875% 6/30/20298 | 32,135 | 28,234 | ||||||
| Aretec Escrow Issuer, Inc. 7.50% 4/1/20298 | 51,178 | 45,488 | ||||||
| Ascensus, Inc., Term Loan, (3-month USD-LIBOR + 6.50%) 11.313% 8/2/20297,11 | 6,070 | 5,412 | ||||||
| AssuredPartners, Inc. 7.00% 8/15/20258 | 435 | 428 | ||||||
| AssuredPartners, Inc. 8.00% 5/15/20278 | 22,939 | 22,559 | ||||||
| AssuredPartners, Inc. 5.625% 1/15/20298 | 22,866 | 19,589 | ||||||
| AXA Equitable Holdings, Inc. 5.00% 4/20/2048 | 1,500 | 1,421 | ||||||
| Banco Santander, SA 5.147% 8/18/2025 | 5,600 | 5,605 | ||||||
| Bangkok Bank PCL 3.733% 9/25/2034 (5-year UST Yield Curve Rate T Note Constant Maturity + 1.90% on 9/25/2029)10 | 8,245 | 7,253 | ||||||
| Bank of America Corp. 1.843% 2/4/2025 (USD-SOFR + 0.67% on 2/4/2024)10 | 20,000 | 19,308 | ||||||
| Bank of America Corp. 2.456% 10/22/2025 (3-month USD-LIBOR + 0.87% on 10/22/2024)10 | 10,750 | 10,281 | ||||||
| Bank of America Corp. 1.319% 6/19/2026 (USD-SOFR + 1.15% on 6/19/2025)10 | 9,700 | 8,887 | ||||||
| Bank of America Corp. 5.08% 1/20/2027 (USD-SOFR + 1.29% on 1/20/2026)10 | 19,896 | 19,977 | ||||||
| Bank of America Corp. 4.376% 4/27/2028 (USD-SOFR + 1.58% on 4/27/2027)10 | 41,000 | 40,115 | ||||||
| Bank of America Corp. 4.948% 7/22/2028 (USD-SOFR + 2.04% on 7/22/2027)10 | 21,627 | 21,677 | ||||||
| Bank of America Corp. 6.204% 11/10/2028 (USD-SOFR + 1.99% on 11/10/2027)10 | 20,842 | 21,993 | ||||||
| Bank of America Corp. 3.419% 12/20/2028 (3-month USD-LIBOR + 1.04% on 12/20/2027)10 | 5,400 | 5,053 | ||||||
| Bank of America Corp. 2.087% 6/14/2029 (USD-SOFR + 1.06% on 6/14/2028)10 | 26,229 | 22,870 | ||||||
| Bank of America Corp. 2.299% 7/21/2032 (USD-SOFR + 1.22% on 7/21/2031)10 | 5,990 | 4,880 | ||||||
| Bank of America Corp. 2.572% 10/20/2032 (USD-SOFR + 1.21% on 10/20/2031)10 | 1,087 | 900 | ||||||
| Bank of America Corp. 2.972% 2/4/2033 (USD-SOFR + 1.33% on 2/4/2032)10 | 7,135 | 6,089 | ||||||
| Bank of America Corp. 4.571% 4/27/2033 (USD-SOFR + 1.83% on 4/27/2032)10 | 26,000 | 25,148 | ||||||
| Bank of America Corp. 5.015% 7/22/2033 (USD-SOFR + 2.16% on 7/22/2032)10 | 16,324 | 16,329 | ||||||
| Bank of New York Mellon Corp. 4.534% 2/1/2029 (USD-SOFR + 1.169% on 2/1/2028)10 | 9,000 | 8,997 | ||||||
| Bank of New York Mellon Corp. 4.705% 2/1/2034 (USD-SOFR + 1.512% on 2/1/2033)10 | 11,369 | 11,330 | ||||||
| Bank of Nova Scotia 1.625% 5/1/2023 | 8,000 | 7,938 | ||||||
| Blackstone Private Credit Fund 7.05% 9/29/20258 | 20,415 | 20,711 | ||||||
| BNP Paribas SA 2.219% 6/9/2026 (USD-SOFR + 2.074% on 6/9/2025)8,10 | 7,800 | 7,274 | ||||||
| BNP Paribas SA 1.323% 1/13/2027 (USD-SOFR + 1.004% on 1/13/2026)8,10 | 12,125 | 10,877 | ||||||
| BNP Paribas SA 2.591% 1/20/2028 (USD-SOFR + 1.228% on 1/20/2027)8,10 | 13,189 | 11,967 | ||||||
| BNP Paribas SA 2.159% 9/15/2029 (USD-SOFR + 1.218% on 9/15/2028)8,10 | 6,375 | 5,411 | ||||||
| BNP Paribas SA 2.871% 4/19/2032 (USD-SOFR + 1.387% on 4/19/2031)8,10 | 10,282 | 8,617 | ||||||
| CaixaBank, SA 6.208% 1/18/2029 (USD-SOFR + 2.70% on 1/18/2028)8,10 | 6,575 | 6,674 | ||||||
| Capital One Financial Corp. 1.343% 12/6/2024 (USD-SOFR + 0.69% on 12/6/2023)10 | 13,075 | 12,634 | ||||||
| Capital One Financial Corp. 4.985% 7/24/2026 (USD-SOFR + 2.16% on 7/24/2025)10 | 9,000 | 8,923 | ||||||
| Castlelake Aviation Finance DAC 5.00% 4/15/20278 | 26,060 | 23,384 | ||||||
| CIT Group, Inc. 3.929% 6/19/2024 (USD-SOFR + 3.827% on 6/19/2023)10 | 11,575 | 11,512 | ||||||
| Citigroup, Inc. 2.014% 1/25/2026 (USD-SOFR + 0.694% on 1/25/2025)10 | 6,069 | 5,710 | ||||||
| Citigroup, Inc. 4.60% 3/9/2026 | 1,300 | 1,293 | ||||||
| Citigroup, Inc. 3.106% 4/8/2026 (USD-SOFR + 2.842% on 3/8/2026)10 | 7,300 | 7,002 | ||||||
| Citigroup, Inc. 5.61% 9/29/2026 (USD-SOFR + 1.546% on 12/29/2025)10 | 17,750 | 18,041 | ||||||
| Citigroup, Inc. 3.07% 2/24/2028 (USD-SOFR + 1.28% on 2/24/2027)10 | 5,855 | 5,446 | ||||||
| Citigroup, Inc. 4.658% 5/24/2028 (USD-SOFR + 1.887% on 5/24/2027)10 | 49,628 | 49,137 | ||||||
| 8 | The Income Fund of America |
| Bonds, notes & other debt instruments (continued) | Principal amount (000) | Value (000) | ||||||
| Corporate bonds, notes & loans (continued) | ||||||||
| Financials (continued) | ||||||||
| Citigroup, Inc. 3.668% 7/24/2028 (3-month USD-LIBOR + 1.39% on 7/24/2027)10 | USD | 700 | $ | 663 | ||||
| Citigroup, Inc. 2.976% 11/5/2030 (USD-SOFR + 1.422% on 11/5/2029)10 | 2,400 | 2,113 | ||||||
| Citigroup, Inc. 2.572% 6/3/2031 (USD-SOFR + 2.107% on 6/3/2030)10 | 14,800 | 12,568 | ||||||
| Citigroup, Inc. 6.27% 11/17/2033 (USD-SOFR + 2.338% on 11/17/2032)10 | 9,891 | 10,781 | ||||||
| CME Group, Inc. 3.75% 6/15/2028 | 6,875 | 6,753 | ||||||
| Coinbase Global, Inc. 3.375% 10/1/20288 | 24,880 | 16,086 | ||||||
| Coinbase Global, Inc. 3.625% 10/1/20318 | 33,190 | 19,385 | ||||||
| Compass Diversified Holdings 5.25% 4/15/20298 | 74,775 | 67,383 | ||||||
| Compass Diversified Holdings 5.00% 1/15/20328 | 26,645 | 21,924 | ||||||
| Corebridge Financial, Inc. 3.50% 4/4/20258 | 9,248 | 8,941 | ||||||
| Corebridge Financial, Inc. 3.65% 4/5/20278 | 22,661 | 21,672 | ||||||
| Corebridge Financial, Inc. 3.85% 4/5/20298 | 15,393 | 14,378 | ||||||
| Corebridge Financial, Inc. 3.90% 4/5/20328 | 7,289 | 6,646 | ||||||
| Corebridge Financial, Inc. 4.35% 4/5/20428 | 1,622 | 1,410 | ||||||
| Corebridge Financial, Inc. 4.40% 4/5/20528 | 3,907 | 3,351 | ||||||
| Crédit Agricole SA 1.907% 6/16/2026 (USD-SOFR + 1.676% on 6/16/2025)8,10 | 10,675 | 9,862 | ||||||
| Crédit Agricole SA 1.247% 1/26/2027 (USD-SOFR + 0.892% on 1/26/2026)8,10 | 4,900 | 4,383 | ||||||
| Credit Suisse Group AG 3.80% 6/9/2023 | 23,303 | 23,043 | ||||||
| Credit Suisse Group AG 4.207% 6/12/2024 (3-month USD-LIBOR + 1.24% on 6/12/2023)8,10 | 9,117 | 8,970 | ||||||
| Credit Suisse Group AG 3.625% 9/9/2024 | 2,990 | 2,854 | ||||||
| Credit Suisse Group AG 7.95% 1/9/2025 | 17,750 | 18,190 | ||||||
| Credit Suisse Group AG 2.593% 9/11/2025 (USD-SOFR + 1.56% on 9/11/2024)8,10 | 4,687 | 4,288 | ||||||
| Credit Suisse Group AG 2.193% 6/5/2026 (USD-SOFR + 2.044% on 6/5/2025)8,10 | 22,225 | 19,537 | ||||||
| Credit Suisse Group AG 1.305% 2/2/2027 (USD-SOFR + 0.98% on 2/2/2026)8,10 | 20,134 | 16,722 | ||||||
| Credit Suisse Group AG 7.50% 2/15/2028 | 9,000 | 9,451 | ||||||
| Credit Suisse Group AG 6.442% 8/11/2028 (USD-SOFR + 3.70% on 8/11/2027)8,10 | 10,260 | 9,929 | ||||||
| Credit Suisse Group AG 3.869% 1/12/2029 (3-month USD-LIBOR + 1.41% on 1/12/2028)8,10 | 3,610 | 3,065 | ||||||
| Credit Suisse Group AG 4.194% 4/1/2031 (USD-SOFR + 3.73% on 4/1/2030)8,10 | 24,910 | 21,127 | ||||||
| Credit Suisse Group AG 3.091% 5/14/2032 (USD-SOFR + 1.73% on 5/14/2031)8,10 | 16,351 | 12,377 | ||||||
| Credit Suisse Group AG 6.537% 8/12/2033 (USD-SOFR + 3.92% on 8/12/2032)8,10 | 750 | 720 | ||||||
| Credit Suisse Group AG 9.016% 11/15/2033 (USD-SOFR + 5.02% on 11/15/2032)8,10 | 13,852 | 15,574 | ||||||
| Danske Bank AS 3.875% 9/12/20238 | 9,604 | 9,513 | ||||||
| Danske Bank AS 3.773% 3/28/2025 (1-year UST Yield Curve Rate T Note Constant Maturity + 1.45% on 3/28/2024)8,10 | 25,000 | 24,398 | ||||||
| Danske Bank AS 4.298% 4/1/2028 (1-year UST Yield Curve Rate T Note Constant Maturity + 1.75% on 4/1/2027)8,10 | 5,000 | 4,821 | ||||||
| Deutsche Bank AG 3.95% 2/27/2023 | 5,345 | 5,339 | ||||||
| Deutsche Bank AG 0.898% 5/28/2024 | 7,500 | 7,090 | ||||||
| Deutsche Bank AG 3.70% 5/30/2024 | 8,653 | 8,457 | ||||||
| Deutsche Bank AG 2.222% 9/18/2024 (USD-SOFR + 2.159% on 9/18/2023)10 | 21,775 | 21,318 | ||||||
| Deutsche Bank AG 3.961% 11/26/2025 (USD-SOFR + 2.581% on 11/26/2024)10 | 58,600 | 56,783 | ||||||
| Deutsche Bank AG 4.10% 1/13/2026 | 33,123 | 32,325 | ||||||
| Deutsche Bank AG 4.10% 1/13/2026 | 834 | 813 | ||||||
| Deutsche Bank AG 2.129% 11/24/2026 (USD-SOFR + 1.87% on 11/24/2025)10 | 35,400 | 31,952 | ||||||
| Deutsche Bank AG 2.311% 11/16/2027 (USD-SOFR + 1.219% on 11/16/2026)10 | 22,338 | 19,756 | ||||||
| Deutsche Bank AG 2.552% 1/7/2028 (USD-SOFR + 1.318% on 1/7/2027)10 | 54,874 | 49,020 | ||||||
| Deutsche Bank AG 6.72% 1/18/2029 (USD-SOFR + 3.18% on 1/18/2028)10 | 6,700 | 7,055 | ||||||
| Deutsche Bank AG 3.547% 9/18/2031 (USD-SOFR + 3.043% on 9/18/2030)10 | 3,900 | 3,393 | ||||||
| Digital Currency Group, Inc., Term Loan, 8.75% 11/12/20262,11 | 6,473 | 5,428 | ||||||
| Digital Currency Group, Inc., Term Loan, (3-month USD-LIBOR + 7.00%) 8.00% 11/30/20262,7,11 | 4,856 | 4,320 | ||||||
| Discover Financial Services 6.70% 11/29/2032 | 1,600 | 1,710 | ||||||
| DNB Bank ASA 5.896% 10/9/2026 (USD-SOFR + 1.95% on 10/9/2025)8,10 | 17,500 | 17,711 | ||||||
| FS Energy and Power Fund 7.50% 8/15/20238 | 42,570 | 42,470 | ||||||
| Goldman Sachs Group, Inc. 3.272% 9/29/2025 (3-month USD-LIBOR + 1.201% on 9/29/2024)10 | 1,100 | 1,066 | ||||||
| Goldman Sachs Group, Inc. 1.431% 3/9/2027 (USD-SOFR + 0.795% on 3/9/2026)10 | 10,650 | 9,547 | ||||||
| Goldman Sachs Group, Inc. 1.542% 9/10/2027 (USD-SOFR + 0.818% on 9/10/2026)10 | 17,000 | 15,019 | ||||||
| Goldman Sachs Group, Inc. 1.948% 10/21/2027 (USD-SOFR + 0.913% on 10/21/2026)10 | 48,202 | 43,167 | ||||||
| Goldman Sachs Group, Inc. 2.64% 2/24/2028 (USD-SOFR + 1.114% on 2/24/2027)10 | 26,963 | 24,735 | ||||||
| Goldman Sachs Group, Inc. 3.615% 3/15/2028 (USD-SOFR + 1.846% on 3/15/2027)10 | 33,910 | 32,309 | ||||||
| Goldman Sachs Group, Inc. 3.691% 6/5/2028 (3-month USD-LIBOR + 1.51% on 6/5/2027)10 | 8,000 | 7,633 | ||||||
| Goldman Sachs Group, Inc. 4.482% 8/23/2028 (USD-SOFR + 1.725% on 8/23/2027)10 | 14,294 | 14,056 | ||||||
| The Income Fund of America | 9 |
| Bonds, notes & other debt instruments (continued) | Principal amount (000) | Value (000) | ||||||
| Corporate bonds, notes & loans (continued) | ||||||||
| Financials (continued) | ||||||||
| Goldman Sachs Group, Inc. 2.615% 4/22/2032 (USD-SOFR + 1.281% on 4/22/2031)10 | USD | 6,523 | $ | 5,454 | ||||
| Goldman Sachs Group, Inc. 3.102% 2/24/2033 (USD-SOFR + 1.41% on 2/24/2032)10 | 37,259 | 31,954 | ||||||
| Goldman Sachs Group, Inc. 3.21% 4/22/2042 (USD-SOFR + 1.513% on 4/22/2041)10 | 7,500 | 5,887 | ||||||
| Groupe BPCE SA 5.70% 10/22/20238 | 16,825 | 16,818 | ||||||
| Groupe BPCE SA 5.15% 7/21/20248 | 18,160 | 17,973 | ||||||
| Groupe BPCE SA 1.625% 1/14/20258 | 8,000 | 7,502 | ||||||
| Groupe BPCE SA 1.00% 1/20/20268 | 10,000 | 8,910 | ||||||
| Groupe BPCE SA 1.652% 10/6/2026 (USD-SOFR + 1.52% on 10/6/2025)8,10 | 6,925 | 6,243 | ||||||
| Groupe BPCE SA 5.975% 1/18/2027 (USD-SOFR + 2.10% on 1/18/2026)8,10 | 22,500 | 22,795 | ||||||
| Groupe BPCE SA 2.277% 1/20/2032 (USD-SOFR + 1.312% on 1/20/2031)8,10 | 7,675 | 6,063 | ||||||
| Hightower Holding, LLC 6.75% 4/15/20298 | 19,215 | 16,565 | ||||||
| HSBC Holdings PLC 4.25% 3/14/2024 | 9,000 | 8,921 | ||||||
| HSBC Holdings PLC 2.099% 6/4/2026 (USD-SOFR + 1.929% on 6/4/2025)10 | 14,000 | 12,980 | ||||||
| HSBC Holdings PLC 4.755% 6/9/2028 (USD-SOFR + 2.11% on 6/9/2027)10 | 281 | 277 | ||||||
| HSBC Holdings PLC 4.583% 6/19/2029 (3-month USD-LIBOR + 1.535% on 6/19/2028)10 | 5,750 | 5,576 | ||||||
| Huarong Finance 2017 Co., Ltd. 4.75% 4/27/2027 | 1,889 | 1,712 | ||||||
| Huarong Finance 2017 Co., Ltd. 4.25% 11/7/2027 | 18,900 | 16,629 | ||||||
| Huarong Finance 2019 Co., Ltd. 4.50% 5/29/2029 | 1,241 | 1,058 | ||||||
| Huarong Finance 2019 Co., Ltd. 3.375% 2/24/2030 | 2,995 | 2,336 | ||||||
| Huarong Finance II Co., Ltd. 5.50% 1/16/2025 | 17,000 | 16,546 | ||||||
| HUB International, Ltd. 7.00% 5/1/20268 | 49,786 | 49,354 | ||||||
| HUB International, Ltd. 5.625% 12/1/20298 | 16,370 | 14,669 | ||||||
| Intercontinental Exchange, Inc. 2.65% 9/15/2040 | 12,025 | 8,979 | ||||||
| Intesa Sanpaolo SpA 5.017% 6/26/20248 | 149,555 | 145,955 | ||||||
| Intesa Sanpaolo SpA 3.25% 9/23/20248 | 1,730 | 1,655 | ||||||
| Intesa Sanpaolo SpA 5.71% 1/15/20268 | 43,165 | 42,439 | ||||||
| Intesa Sanpaolo SpA 3.875% 7/14/20278 | 9,300 | 8,620 | ||||||
| Intesa Sanpaolo SpA 3.875% 1/12/20288 | 2,820 | 2,569 | ||||||
| Intesa Sanpaolo SpA 8.248% 11/21/2033 (1-year UST Yield Curve Rate T Note Constant Maturity + 4.40% on 11/21/2032)8,10 | 10,300 | 11,279 | ||||||
| Iron Mountain Information Management Services, Inc. 5.00% 7/15/20328 | 45,895 | 39,854 | ||||||
| JPMorgan Chase & Co. 3.559% 4/23/2024 (3-month USD-LIBOR + 0.73% on 4/23/2023)10 | 5,400 | 5,380 | ||||||
| JPMorgan Chase & Co. 3.875% 9/10/2024 | 150 | 148 | ||||||
| JPMorgan Chase & Co. 2.301% 10/15/2025 (USD-SOFR + 1.16% on 10/15/2024)10 | 250 | 238 | ||||||
| JPMorgan Chase & Co. 1.561% 12/10/2025 (USD-SOFR + 0.605% on 12/10/2024)10 | 21,994 | 20,609 | ||||||
| JPMorgan Chase & Co. 2.005% 3/13/2026 (USD-SOFR + 1.585% on 3/13/2025)10 | 23,150 | 21,785 | ||||||
| JPMorgan Chase & Co. 4.08% 4/26/2026 (USD-SOFR + 1.32% on 4/26/2025)10 | 15,000 | 14,738 | ||||||
| JPMorgan Chase & Co. 4.323% 4/26/2028 (USD-SOFR + 1.56% on 4/26/2027)10 | 59,000 | 57,857 | ||||||
| JPMorgan Chase & Co. 3.54% 5/1/2028 (3-month USD-LIBOR + 1.38% on 5/1/2027)10 | 350 | 332 | ||||||
| JPMorgan Chase & Co. 2.182% 6/1/2028 (USD-SOFR + 1.89% on 6/1/2027)10 | 4,400 | 3,948 | ||||||
| JPMorgan Chase & Co. 4.851% 7/25/2028 (USD-SOFR + 1.99% on 7/25/2027)10 | 25,679 | 25,688 | ||||||
| JPMorgan Chase & Co. 2.069% 6/1/2029 (USD-SOFR + 1.015% on 6/1/2028)10 | 20,593 | 17,857 | ||||||
| JPMorgan Chase & Co. 2.522% 4/22/2031 (USD-SOFR + 2.04% on 4/22/2030)10 | 4,100 | 3,508 | ||||||
| JPMorgan Chase & Co. 4.586% 4/26/2033 (USD-SOFR + 1.80% on 4/26/2032)10 | 598 | 581 | ||||||
| JPMorgan Chase & Co. 4.912% 7/25/2033 (USD-SOFR + 2.08% on 7/25/2032)10 | 9,160 | 9,133 | ||||||
| JPMorgan Chase & Co. 3.328% 4/22/2052 (USD-SOFR + 1.58% on 4/22/2051)10 | 7,500 | 5,704 | ||||||
| JPMorgan Chase & Co., Series S, 6.75% junior subordinated perpetual bonds (3-month USD-LIBOR + 3.78% on 2/1/2024)10 | 25,901 | 26,178 | ||||||
| Kasikornbank PCL HK 3.343% 10/2/2031 (5-year UST Yield Curve Rate T Note Constant Maturity + 1.70% on 10/2/2026)10 | 8,320 | 7,492 | ||||||
| KBC Groep NV 5.796% 1/19/2029 (1-year UST Yield Curve Rate T Note Constant Maturity + 2.10% on 1/19/2028)8,10 | 2,400 | 2,437 | ||||||
| Liberty Mutual Group, Inc. 4.25% 6/15/20238 | 971 | 967 | ||||||
| Liberty Mutual Group, Inc. 4.569% 2/1/20298 | 3,429 | 3,357 | ||||||
| Lloyds Banking Group PLC 4.05% 8/16/2023 | 6,000 | 5,968 | ||||||
| Lloyds Banking Group PLC 4.582% 12/10/2025 | 7,000 | 6,838 | ||||||
| Lloyds Banking Group PLC 2.438% 2/5/2026 (1-year UST Yield Curve Rate T Note Constant Maturity + 1.00% on 2/5/2025)10 | 5,600 | 5,280 | ||||||
| Lloyds Banking Group PLC 3.75% 3/18/2028 (1-year UST Yield Curve Rate T Note Constant Maturity + 1.80% on 3/18/2027)10 | 12,427 | 11,815 | ||||||
| Lloyds Banking Group PLC 4.976% 8/11/2033 (1-year UST Yield Curve Rate T Note Constant Maturity + 2.30% on 8/11/2032)10 | 9,295 | 9,089 | ||||||
| LPL Holdings, Inc. 4.625% 11/15/20278 | 41,845 | 39,868 | ||||||
| LPL Holdings, Inc. 4.00% 3/15/20298 | 23,370 | 20,950 | ||||||
| LPL Holdings, Inc. 4.375% 5/15/20318 | 22,090 | 19,366 | ||||||
| 10 | The Income Fund of America |
| Bonds, notes & other debt instruments (continued) | Principal amount (000) | Value (000) | ||||||
| Corporate bonds, notes & loans (continued) | ||||||||
| Financials (continued) | ||||||||
| MGIC Investment Corp. 5.25% 8/15/2028 | USD | 5,075 | $ | 4,790 | ||||
| Mitsubishi UFJ Financial Group, Inc. 1.538% 7/20/2027 (1-year UST Yield Curve Rate T Note Constant Maturity + 0.75% on 7/20/2026)10 | 17,000 | 15,054 | ||||||
| Mitsubishi UFJ Financial Group, Inc. 2.341% 1/19/2028 (1-year UST Yield Curve Rate T Note Constant Maturity + 0.83% on 1/19/2027)10 | 5,000 | 4,517 | ||||||
| Mitsubishi UFJ Financial Group, Inc. 4.08% 4/19/2028 (1-year UST Yield Curve Rate T Note Constant Maturity + 1.30% on 4/19/2027)10 | 8,000 | 7,710 | ||||||
| Mizuho Financial Group, Inc. 0.849% 9/8/2024 (3-month USD-LIBOR + 0.61% on 9/8/2023)10 | 5,200 | 5,051 | ||||||
| Mizuho Financial Group, Inc. 1.554% 7/9/2027 (1-year UST Yield Curve Rate T Note Constant Maturity + 0.75% on 7/9/2026)10 | 13,000 | 11,509 | ||||||
| Mizuho Financial Group, Inc. 1.979% 9/8/2031 (3-month USD-LIBOR + 1.27% on 9/8/2030)10 | 4,100 | 3,263 | ||||||
| Mizuho Financial Group, Inc. 5.669% 9/13/2033 (1-year UST Yield Curve Rate T Note Constant Maturity + 2.40% on 9/13/2032)10 | 8,925 | 9,230 | ||||||
| Moody’s Corp. 4.25% 8/8/2032 | 2,235 | 2,171 | ||||||
| Morgan Stanley 3.70% 10/23/2024 | 600 | 590 | ||||||
| Morgan Stanley 4.679% 7/17/2026 (USD-SOFR + 1.669% on 7/17/2025)10 | 12,230 | 12,131 | ||||||
| Morgan Stanley 5.05% 1/28/2027 (USD-SOFR + 1.295% on 1/28/2026)10 | 6,575 | 6,600 | ||||||
| Morgan Stanley 1.593% 5/4/2027 (USD-SOFR + 0.879% on 5/4/2026)10 | 9,869 | 8,867 | ||||||
| Morgan Stanley 1.512% 7/20/2027 (USD-SOFR + 0.858% on 7/20/2026)10 | 30,463 | 27,193 | ||||||
| Morgan Stanley 2.475% 1/21/2028 (USD-SOFR + 1.00% on 1/21/2027)10 | 5,451 | 4,972 | ||||||
| Morgan Stanley 4.21% 4/20/2028 (USD-SOFR + 1.61% on 4/20/2027)10 | 26,000 | 25,258 | ||||||
| Morgan Stanley 6.296% 10/18/2028 (USD-SOFR + 2.44% on 10/18/2027)10 | 4,700 | 4,972 | ||||||
| Morgan Stanley 5.123% 2/1/2029 (USD-SOFR + 1.73% on 2/1/2028)10 | 16,075 | 16,262 | ||||||
| Morgan Stanley 1.928% 4/28/2032 (USD-SOFR + 1.02% on 4/28/2031)10 | 10,000 | 7,953 | ||||||
| Morgan Stanley 2.239% 7/21/2032 (USD-SOFR + 1.178% on 7/21/2031)10 | 3,688 | 3,002 | ||||||
| Morgan Stanley 2.943% 1/21/2033 (USD-SOFR + 1.29% on 1/21/2032)10 | 30,404 | 25,988 | ||||||
| Morgan Stanley 5.297% 4/20/2037 (USD-SOFR + 2.62% on 4/20/2032)10 | 3,226 | 3,131 | ||||||
| MSCI, Inc. 4.00% 11/15/20298 | 19,500 | 17,771 | ||||||
| MSCI, Inc. 3.625% 9/1/20308 | 4,950 | 4,315 | ||||||
| MSCI, Inc. 3.875% 2/15/20318 | 20,959 | 18,524 | ||||||
| MSCI, Inc. 3.625% 11/1/20318 | 11,825 | 10,122 | ||||||
| MSCI, Inc. 3.25% 8/15/20338 | 3,650 | 2,998 | ||||||
| National Australia Bank, Ltd. 1.887% 1/12/20278 | 20,000 | 18,109 | ||||||
| National Financial Partners Corp. 6.875% 8/15/20288 | 18,421 | 15,951 | ||||||
| Navient Corp. 6.125% 3/25/2024 | 29,960 | 29,922 | ||||||
| Navient Corp. 5.875% 10/25/2024 | 15,600 | 15,445 | ||||||
| Navient Corp. 6.75% 6/15/2026 | 15,000 | 14,794 | ||||||
| Navient Corp. 5.00% 3/15/2027 | 19,710 | 18,014 | ||||||
| Navient Corp. 4.875% 3/15/2028 | 3,085 | 2,731 | ||||||
| Navient Corp. 5.50% 3/15/2029 | 72,940 | 64,634 | ||||||
| Navient Corp. 5.625% 8/1/2033 | 10,990 | 8,535 | ||||||
| New York Life Global Funding 4.55% 1/28/20338 | 3,788 | 3,802 | ||||||
| Northwestern Mutual Global Funding 1.75% 1/11/20278 | 10,000 | 9,037 | ||||||
| Onemain Finance Corp. 3.875% 9/15/2028 | 5,974 | 5,026 | ||||||
| Owl Rock Capital Corp. 4.00% 3/30/2025 | 449 | 431 | ||||||
| Owl Rock Capital Corp. 3.75% 7/22/2025 | 12,473 | 11,708 | ||||||
| Owl Rock Capital Corp. 3.40% 7/15/2026 | 6,475 | 5,850 | ||||||
| Owl Rock Capital Corp. 2.625% 1/15/2027 | 20,600 | 17,795 | ||||||
| Owl Rock Capital Corp. 2.875% 6/11/2028 | 1,765 | 1,465 | ||||||
| Owl Rock Capital Corp. II 4.625% 11/26/20248 | 9,285 | 8,899 | ||||||
| Owl Rock Capital Corp. III 3.125% 4/13/2027 | 14,490 | 12,329 | ||||||
| Owl Rock Core Income Corp. 4.70% 2/8/2027 | 17,775 | 16,278 | ||||||
| Oxford Finance, LLC 6.375% 2/1/20278 | 22,660 | 21,703 | ||||||
| PNC Financial Services Group, Inc. 3.90% 4/29/2024 | 3,000 | 2,971 | ||||||
| Prudential Financial, Inc. 4.35% 2/25/2050 | 6,205 | 5,651 | ||||||
| Prudential Financial, Inc. 3.70% 3/13/2051 | 755 | 625 | ||||||
| Prudential Financial, Inc., junior subordinated, 5.625% 6/15/2043 (3-month USD-LIBOR + 3.92% on 6/15/2023)10 | 1,850 | 1,843 | ||||||
| Quicken Loans, LLC 3.625% 3/1/20298 | 6,645 | 5,615 | ||||||
| Rabobank Nederland 4.375% 8/4/2025 | 9,000 | 8,832 | ||||||
| Rocket Mortgage, LLC 2.875% 10/15/20268 | 12,990 | 11,599 | ||||||
| Royal Bank of Canada 1.15% 6/10/2025 | 12,367 | 11,413 | ||||||
| Ryan Specialty Group, LLC 4.375% 2/1/20308 | 23,070 | 20,821 | ||||||
| Santander Holdings USA, Inc. 3.50% 6/7/2024 | 11,250 | 10,990 | ||||||
| Santander Holdings USA, Inc. 2.49% 1/6/202810 | 10,650 | 9,400 | ||||||
| The Income Fund of America | 11 |
| Bonds, notes & other debt instruments (continued) | Principal amount (000) | Value (000) | ||||||
| Corporate bonds, notes & loans (continued) | ||||||||
| Financials (continued) | ||||||||
| Springleaf Finance Corp. 6.125% 3/15/2024 | USD | 20,300 | $ | 20,152 | ||||
| Starwood Property Trust, Inc. 5.50% 11/1/20238 | 5,400 | 5,372 | ||||||
| Starwood Property Trust, Inc. 4.375% 1/15/20278 | 25,050 | 22,515 | ||||||
| State Street Corp. 4.164% 8/4/2033 (USD-SOFR + 1.726% on 8/4/2032)10 | 6,265 | 5,976 | ||||||
| State Street Corp. 4.821% 1/26/2034 (USD-SOFR + 1.567% on 1/26/2033)10 | 7,832 | 7,878 | ||||||
| Sumitomo Mitsui Banking Corp. 2.174% 1/14/2027 | 3,125 | 2,818 | ||||||
| Swiss Re Finance (Luxembourg) SA 5.00% 4/2/2049 (5-year UST Yield Curve Rate T Note Constant Maturity + 3.582% on 4/2/2029)8,10 | 3,800 | 3,688 | ||||||
| Synchrony Bank 5.40% 8/22/2025 | 9,000 | 8,968 | ||||||
| Synchrony Bank 5.625% 8/23/2027 | 9,000 | 8,969 | ||||||
| Synchrony Financial 4.375% 3/19/2024 | 5,095 | 5,040 | ||||||
| Toronto-Dominion Bank 0.75% 9/11/2025 | 6,575 | 5,945 | ||||||
| Toronto-Dominion Bank 1.25% 9/10/2026 | 8,247 | 7,324 | ||||||
| Toronto-Dominion Bank 1.95% 1/12/2027 | 10,000 | 9,101 | ||||||
| Toronto-Dominion Bank 2.45% 1/12/2032 | 7,500 | 6,294 | ||||||
| Truist Financial Corp. 4.873% 1/26/2029 (USD-SOFR + 1.435% on 1/26/2028)10 | 9,000 | 9,055 | ||||||
| Truist Financial Corp. 5.122% 1/26/2034 (USD-SOFR + 1.60% on 1/26/2033)10 | 9,750 | 9,888 | ||||||
| U.S. Bancorp 3.70% 1/30/2024 | 10,000 | 9,894 | ||||||
| U.S. Bancorp 2.375% 7/22/2026 | 6,000 | 5,627 | ||||||
| U.S. Bancorp 4.548% 7/22/2028 (USD-SOFR + 1.66% on 7/27/2027)10 | 9,000 | 8,991 | ||||||
| U.S. Bancorp 4.839% 2/1/2034 (USD-SOFR + 1.60% on 2/1/2033)10 | 9,000 | 8,958 | ||||||
| UBS Group AG 4.125% 9/24/20258 | 4,425 | 4,337 | ||||||
| UBS Group AG 1.364% 1/30/2027 (5-year UST Yield Curve Rate T Note Constant Maturity + 1.08% on 1/30/2026)8,10 | 4,000 | 3,584 | ||||||
| UBS Group AG 1.494% 8/10/2027 (1-year UST Yield Curve Rate T Note Constant Maturity + 0.85% on 8/10/2026)8,10 | 6,925 | 6,101 | ||||||
| UniCredit SpA 4.625% 4/12/20278 | 1,730 | 1,679 | ||||||
| UniCredit SpA 5.861% 6/19/2032 (5-year USD-ICE Swap + 3.703% on 6/19/2027)8,10 | 23,729 | 22,075 | ||||||
| Wells Fargo & Company 1.654% 6/2/2024 (USD-SOFR + 1.60% on 6/2/2023)10 | 6,500 | 6,424 | ||||||
| Wells Fargo & Company 2.406% 10/30/2025 (3-month USD-LIBOR + 0.825% on 10/30/2024)10 | 16,860 | 16,101 | ||||||
| Wells Fargo & Company 2.164% 2/11/2026 (3-month USD-LIBOR + 0.75% on 2/11/2025)10 | 12,000 | 11,327 | ||||||
| Wells Fargo & Company 3.908% 4/25/2026 (USD-SOFR + 1.32% on 4/25/2025)10 | 4,687 | 4,580 | ||||||
| Wells Fargo & Company 2.188% 4/30/2026 (USD-SOFR + 2.00% on 4/30/2025)10 | 9,350 | 8,799 | ||||||
| Wells Fargo & Company 3.526% 3/24/2028 (USD-SOFR + 1.51% on 3/24/2027)10 | 75,547 | 71,881 | ||||||
| Wells Fargo & Company 3.584% 5/22/2028 (3-month USD-LIBOR + 1.31% on 5/22/2027)10 | 281 | 267 | ||||||
| Wells Fargo & Company 2.393% 6/2/2028 (USD-SOFR + 2.10% on 6/2/2027)10 | 3,950 | 3,582 | ||||||
| Wells Fargo & Company 4.808% 7/25/2028 (USD-SOFR + 1.98% on 7/25/2027)10 | 20,170 | 20,137 | ||||||
| Wells Fargo & Company 2.879% 10/30/2030 (3-month USD-LIBOR + 1.17% on 10/30/2029)10 | 3,245 | 2,874 | ||||||
| Wells Fargo & Company 2.572% 2/11/2031 (3-month USD-LIBOR + 1.00% on 2/11/2030)10 | 13,850 | 11,947 | ||||||
| Wells Fargo & Company 5.013% 4/4/2051 (3-month USD-LIBOR + 4.24% on 4/4/2050)10 | 4,150 | 4,097 | ||||||
| Westpac Banking Corp. 2.894% 2/4/2030 (5-year UST Yield Curve Rate T Note Constant Maturity + 1.35% on 2/4/2025)10 | 7,000 | 6,536 | ||||||
| Westpac Banking Corp. 2.668% 11/15/2035 (5-year UST Yield Curve Rate T Note Constant Maturity + 1.75% on 11/15/2030)10 | 11,150 | 8,768 | ||||||
| Westpac Banking Corp. 2.963% 11/16/2040 | 5,075 | 3,659 | ||||||
| 3,806,729 | ||||||||
| Consumer discretionary 2.14% | ||||||||
| Allied Universal Holdco, LLC 6.625% 7/15/20268 | 16,985 | 16,373 | ||||||
| Allied Universal Holdco, LLC 9.75% 7/15/20278 | 21,570 | 20,628 | ||||||
| Allied Universal Holdco, LLC 4.625% 6/1/20288 | 15,680 | 13,545 | ||||||
| Allied Universal Holdco, LLC 6.00% 6/1/20298 | 9,565 | 7,708 | ||||||
| Amazon.com, Inc. 2.70% 6/3/2060 | 8,300 | 5,446 | ||||||
| Asbury Automotive Group, Inc. 4.625% 11/15/20298 | 48,325 | 42,706 | ||||||
| Asbury Automotive Group, Inc. 5.00% 2/15/20328 | 3,365 | 2,906 | ||||||
| Atlas LuxCo 4 SARL 4.625% 6/1/20288 | 10,665 | 9,173 | ||||||
| Bath & Body Works, Inc. 6.625% 10/1/20308 | 14,360 | 14,051 | ||||||
| Bath & Body Works, Inc. 6.875% 11/1/2035 | 23,458 | 21,409 | ||||||
| Bath & Body Works, Inc. 6.75% 7/1/2036 | 2,555 | 2,314 | ||||||
| Boyd Gaming Corp. 4.75% 12/1/2027 | 22,590 | 21,498 | ||||||
| Boyd Gaming Corp. 4.75% 6/15/20318 | 7,005 | 6,313 | ||||||
| 12 | The Income Fund of America |
| Bonds, notes & other debt instruments (continued) | Principal amount (000) | Value (000) | ||||||
| Corporate bonds, notes & loans (continued) | ||||||||
| Consumer discretionary (continued) | ||||||||
| Boyne USA, Inc. 4.75% 5/15/20298 | USD | 31,780 | $ | 28,840 | ||||
| Caesars Entertainment, Inc. 6.25% 7/1/20258 | 37,810 | 37,702 | ||||||
| Caesars Entertainment, Inc. 4.625% 10/15/20298 | 23,185 | 19,856 | ||||||
| Caesars Entertainment, Inc. 7.00% 2/15/20308 | 34,040 | 34,678 | ||||||
| Caesars Resort Collection, LLC 5.75% 7/1/20258 | 5,020 | 5,027 | ||||||
| Carnival Corp. 4.00% 8/1/20288 | 32,200 | 27,871 | ||||||
| CDI Escrow Issuer, Inc. 5.75% 4/1/20308 | 26,335 | 24,988 | ||||||
| Cedar Fair, LP 5.50% 5/1/20258 | 29,490 | 29,307 | ||||||
| Daimler Trucks Finance North America, LLC 1.125% 12/14/20238 | 9,000 | 8,701 | ||||||
| Daimler Trucks Finance North America, LLC 1.625% 12/13/20248 | 5,525 | 5,193 | ||||||
| Daimler Trucks Finance North America, LLC 5.20% 1/17/20258 | 5,483 | 5,513 | ||||||
| Daimler Trucks Finance North America, LLC 3.50% 4/7/20258 | 16,100 | 15,596 | ||||||
| Daimler Trucks Finance North America, LLC 5.15% 1/16/20268 | 4,011 | 4,036 | ||||||
| Daimler Trucks Finance North America, LLC 2.00% 12/14/20268 | 14,225 | 12,816 | ||||||
| Daimler Trucks Finance North America, LLC 3.65% 4/7/20278 | 8,387 | 8,051 | ||||||
| Daimler Trucks Finance North America, LLC 5.125% 1/19/20288 | 1,358 | 1,372 | ||||||
| Daimler Trucks Finance North America, LLC 2.375% 12/14/20288 | 7,500 | 6,549 | ||||||
| Daimler Trucks Finance North America, LLC 2.50% 12/14/20318 | 9,000 | 7,372 | ||||||
| DaimlerChrysler North America Holding Corp. 1.75% 3/10/20238 | 17,000 | 16,947 | ||||||
| DaimlerChrysler North America Holding Corp. 3.65% 2/22/20248 | 9,360 | 9,232 | ||||||
| DaimlerChrysler North America Holding Corp. 0.75% 3/1/20248 | 2,551 | 2,438 | ||||||
| Dana, Inc. 5.625% 6/15/2028 | 1,305 | 1,231 | ||||||
| Fertitta Entertainment, Inc. 4.625% 1/15/20298 | 33,420 | 29,539 | ||||||
| Fertitta Entertainment, Inc. 6.75% 1/15/20308 | 12,760 | 10,606 | ||||||
| First Student Bidco, Inc. 4.00% 7/31/20298 | 35,685 | 29,758 | ||||||
| Ford Motor Co. 2.30% 2/10/2025 | 13,475 | 12,512 | ||||||
| Ford Motor Co. 2.90% 2/10/2029 | 17,000 | 14,203 | ||||||
| Ford Motor Co. 6.10% 8/19/2032 | 28,695 | 28,192 | ||||||
| Ford Motor Credit Company, LLC 3.81% 1/9/2024 | 15,305 | 15,008 | ||||||
| Ford Motor Credit Company, LLC 5.584% 3/18/2024 | 3,280 | 3,260 | ||||||
| Ford Motor Credit Company, LLC 3.664% 9/8/2024 | 11,380 | 10,968 | ||||||
| Ford Motor Credit Company, LLC 5.125% 6/16/2025 | 52,275 | 51,433 | ||||||
| Ford Motor Credit Company, LLC 6.95% 3/6/2026 | 10,335 | 10,581 | ||||||
| Ford Motor Credit Company, LLC 4.542% 8/1/2026 | 32,520 | 30,910 | ||||||
| Ford Motor Credit Company, LLC 2.70% 8/10/2026 | 34,095 | 30,478 | ||||||
| Ford Motor Credit Company, LLC 4.271% 1/9/2027 | 117,666 | 110,116 | ||||||
| Ford Motor Credit Company, LLC 4.95% 5/28/2027 | 57,170 | 54,630 | ||||||
| Ford Motor Credit Company, LLC 4.125% 8/17/2027 | 71,670 | 66,208 | ||||||
| Ford Motor Credit Company, LLC 3.815% 11/2/2027 | 8,215 | 7,424 | ||||||
| Ford Motor Credit Company, LLC 2.90% 2/16/2028 | 19,180 | 16,524 | ||||||
| Ford Motor Credit Company, LLC 5.113% 5/3/2029 | 25,589 | 24,286 | ||||||
| Ford Motor Credit Company, LLC 4.00% 11/13/2030 | 25,134 | 21,985 | ||||||
| General Motors Company 4.35% 4/9/2025 | 2,150 | 2,111 | ||||||
| General Motors Company 6.125% 10/1/2025 | 9,825 | 10,080 | ||||||
| General Motors Company 6.80% 10/1/2027 | 1,438 | 1,532 | ||||||
| General Motors Company 5.40% 10/15/2029 | 23,651 | 23,510 | ||||||
| General Motors Company 5.60% 10/15/2032 | 28,000 | 27,686 | ||||||
| General Motors Company 6.60% 4/1/2036 | 5,110 | 5,351 | ||||||
| General Motors Company 6.75% 4/1/2046 | 12,230 | 12,743 | ||||||
| General Motors Financial Co. 3.70% 5/9/2023 | 4,775 | 4,757 | ||||||
| General Motors Financial Co. 3.80% 4/7/2025 | 4,600 | 4,470 | ||||||
| General Motors Financial Co. 2.75% 6/20/2025 | 9,636 | 9,097 | ||||||
| General Motors Financial Co. 1.25% 1/8/2026 | 2,379 | 2,134 | ||||||
| General Motors Financial Co. 1.50% 6/10/2026 | 24,440 | 21,739 | ||||||
| General Motors Financial Co. 4.00% 10/6/2026 | 1,867 | 1,799 | ||||||
| General Motors Financial Co. 2.35% 2/26/2027 | 18,361 | 16,488 | ||||||
| General Motors Financial Co. 2.70% 8/20/2027 | 15,668 | 14,077 | ||||||
| General Motors Financial Co. 2.40% 4/10/2028 | 9,238 | 8,053 | ||||||
| General Motors Financial Co. 2.40% 10/15/2028 | 15,493 | 13,284 | ||||||
| General Motors Financial Co. 4.30% 4/6/2029 | 6,300 | 5,896 | ||||||
| General Motors Financial Co. 2.35% 1/8/2031 | 17,998 | 14,394 | ||||||
| General Motors Financial Co. 2.70% 6/10/2031 | 13,156 | 10,616 | ||||||
| Grand Canyon University 3.25% 10/1/2023 | 1,250 | 1,234 | ||||||
| Grand Canyon University 4.375% 10/1/2026 | 5,000 | 4,602 | ||||||
| Hanesbrands, Inc. 4.625% 5/15/20248 | 16,610 | 16,341 | ||||||
| Hanesbrands, Inc. 4.875% 5/15/20268 | 36,537 | 34,064 | ||||||
| Hilton Grand Vacations Borrower 5.00% 6/1/20298 | 17,560 | 15,728 | ||||||
| The Income Fund of America | 13 |
| Bonds, notes & other debt instruments (continued) | Principal amount (000) | Value (000) | ||||||
| Corporate bonds, notes & loans (continued) | ||||||||
| Consumer discretionary (continued) | ||||||||
| Hilton Worldwide Holdings, Inc. 4.875% 1/15/2030 | USD | 30,661 | $ | 28,946 | ||||
| Hilton Worldwide Holdings, Inc. 4.00% 5/1/20318 | 22,520 | 19,546 | ||||||
| Home Depot, Inc. 1.50% 9/15/2028 | 25,000 | 21,794 | ||||||
| Home Depot, Inc. 3.90% 12/6/2028 | 1,150 | 1,136 | ||||||
| Home Depot, Inc. 2.95% 6/15/2029 | 5,000 | 4,645 | ||||||
| Home Depot, Inc. 1.875% 9/15/2031 | 7,500 | 6,217 | ||||||
| Home Depot, Inc. 5.95% 4/1/2041 | 12,500 | 14,269 | ||||||
| Home Depot, Inc. 4.50% 12/6/2048 | 601 | 581 | ||||||
| Hyundai Capital America 2.375% 2/10/20238 | 21,815 | 21,798 | ||||||
| Hyundai Capital America 5.75% 4/6/20238 | 5,000 | 5,003 | ||||||
| Hyundai Capital America 1.25% 9/18/20238 | 7,561 | 7,373 | ||||||
| Hyundai Capital America 0.875% 6/14/20248 | 8,000 | 7,546 | ||||||
| Hyundai Capital America 1.00% 9/17/20248 | 10,550 | 9,857 | ||||||
| Hyundai Capital America 2.65% 2/10/20258 | 27,917 | 26,564 | ||||||
| Hyundai Capital America 5.875% 4/7/20258 | 3,300 | 3,335 | ||||||
| Hyundai Capital America 1.80% 10/15/20258 | 1,871 | 1,707 | ||||||
| Hyundai Capital America 1.30% 1/8/20268 | 9,000 | 8,039 | ||||||
| Hyundai Capital America 1.50% 6/15/20268 | 7,628 | 6,783 | ||||||
| Hyundai Capital America 1.65% 9/17/20268 | 10,575 | 9,351 | ||||||
| Hyundai Capital America 3.00% 2/10/20278 | 20,750 | 19,130 | ||||||
| Hyundai Capital America 2.375% 10/15/20278 | 2,371 | 2,106 | ||||||
| Hyundai Capital America 1.80% 1/10/20288 | 7,931 | 6,727 | ||||||
| Hyundai Capital America 2.00% 6/15/20288 | 5,009 | 4,248 | ||||||
| Hyundai Capital America 2.10% 9/15/20288 | 4,875 | 4,134 | ||||||
| Hyundai Capital Services, Inc. 2.125% 4/24/20258 | 2,600 | 2,405 | ||||||
| Hyundai Capital Services, Inc. 1.25% 2/8/20268 | 3,490 | 3,084 | ||||||
| International Game Technology PLC 6.50% 2/15/20258 | 12,729 | 12,877 | ||||||
| International Game Technology PLC 5.25% 1/15/20298 | 71,325 | 68,540 | ||||||
| KB Home 7.25% 7/15/2030 | 10,295 | 10,292 | ||||||
| KIA Corp. 2.375% 2/14/20258 | 4,825 | 4,536 | ||||||
| Kontoor Brands, Inc. 4.125% 11/15/20298 | 5,180 | 4,487 | ||||||
| LCM Investments Holdings II, LLC 4.875% 5/1/20298 | 21,177 | 17,509 | ||||||
| Levi Strauss & Co. 3.50% 3/1/20318 | 31,175 | 26,069 | ||||||
| Lindblad Expeditions, LLC 6.75% 2/15/20278 | 6,830 | 6,707 | ||||||
| Lithia Motors, Inc. 3.875% 6/1/20298 | 37,385 | 31,818 | ||||||
| Lithia Motors, Inc. 4.375% 1/15/20318 | 4,550 | 3,880 | ||||||
| Marriott International, Inc. 2.75% 10/15/2033 | 3,970 | 3,221 | ||||||
| Marriott Ownership Resorts, Inc. 4.50% 6/15/20298 | 2,595 | 2,262 | ||||||
| McDonald’s Corp. 4.60% 9/9/2032 | 5,090 | 5,136 | ||||||
| Melco International Development, Ltd. 5.75% 7/21/20288 | 11,330 | 10,215 | ||||||
| Mercedes-Benz Finance North America, LLC 5.375% 11/26/20258 | 3,350 | 3,404 | ||||||
| Mercedes-Benz Finance North America, LLC 5.25% 11/29/20278 | 6,475 | 6,669 | ||||||
| Merlin Entertainment 5.75% 6/15/20268 | 7,210 | 6,872 | ||||||
| MGM Resorts International 6.00% 3/15/2023 | 5,355 | 5,359 | ||||||
| MGM Resorts International 5.50% 4/15/2027 | 3,617 | 3,493 | ||||||
| Midwest Gaming Borrower, LLC 4.875% 5/1/20298 | 13,870 | 12,156 | ||||||
| Mohegan Gaming & Entertainment 8.00% 2/1/20268 | 7,165 | 6,816 | ||||||
| NCL Corp., Ltd. 5.875% 2/15/20278 | 19,985 | 18,609 | ||||||
| NCL Corp., Ltd. 7.75% 2/15/20298 | 10,560 | 9,094 | ||||||
| Neiman Marcus Group, LLC 7.125% 4/1/20268 | 6,970 | 6,665 | ||||||
| Nissan Motor Acceptance Co., LLC 1.125% 9/16/20248 | 7,850 | 7,280 | ||||||
| Nissan Motor Acceptance Co., LLC 1.85% 9/16/20268 | 17,890 | 15,463 | ||||||
| Nissan Motor Acceptance Co., LLC 2.45% 9/15/20288 | 11,030 | 8,962 | ||||||
| Nissan Motor Co., Ltd. 3.043% 9/15/20238 | 400 | 394 | ||||||
| Nissan Motor Co., Ltd. 3.522% 9/17/20258 | 800 | 756 | ||||||
| Nissan Motor Co., Ltd. 2.00% 3/9/20268 | 16,020 | 14,214 | ||||||
| Nissan Motor Co., Ltd. 2.75% 3/9/20288 | 19,362 | 16,364 | ||||||
| Nissan Motor Co., Ltd. 4.81% 9/17/20308 | 25,200 | 22,800 | ||||||
| Panther BF Aggregator 2, LP 6.25% 5/15/20268 | 4,725 | 4,699 | ||||||
| Panther BF Aggregator 2, LP 8.50% 5/15/20278 | 16,520 | 16,477 | ||||||
| Party City Holdings Inc. (6-month USD-LIBOR + 5.00%) 10.13% 7/15/20257,8 | 6,270 | 752 | ||||||
| Party City Holdings, Inc. 8.75% 2/15/20268 | 90,719 | 8,108 | ||||||
| Party City Holdings, Inc., Term Loan DIP, 14.582% 6/18/20237,11 | 11,049 | 11,167 | ||||||
| Penske Automotive Group, Inc. 3.75% 6/15/2029 | 7,275 | 6,161 | ||||||
| Premier Entertainment Sub, LLC 5.625% 9/1/20298 | 8,850 | 6,373 | ||||||
| Premier Entertainment Sub, LLC 5.875% 9/1/20318 | 7,525 | 5,259 | ||||||
| Real Hero Merger Sub 2, Inc. 6.25% 2/1/20298 | 20,218 | 15,041 | ||||||
| 14 | The Income Fund of America |
| Bonds, notes & other debt instruments (continued) | Principal amount (000) | Value (000) | ||||||
| Corporate bonds, notes & loans (continued) | ||||||||
| Consumer discretionary (continued) | ||||||||
| Royal Caribbean Cruises, Ltd. 11.50% 6/1/20258 | USD | 19,951 | $ | 21,448 | ||||
| Royal Caribbean Cruises, Ltd. 4.25% 7/1/20268 | 22,785 | 19,798 | ||||||
| Royal Caribbean Cruises, Ltd. 5.375% 7/15/20278 | 34,535 | 30,085 | ||||||
| Royal Caribbean Cruises, Ltd. 8.25% 1/15/20298 | 11,457 | 11,985 | ||||||
| Sally Holdings, LLC 5.625% 12/1/2025 | 14,080 | 13,887 | ||||||
| Sands China, Ltd. 5.625% 8/8/2025 | 8,676 | 8,634 | ||||||
| Sands China, Ltd. 4.30% 1/8/2026 | 8,325 | 7,906 | ||||||
| Sands China, Ltd. 2.80% 3/8/202710 | 1,727 | 1,511 | ||||||
| Sands China, Ltd. 5.90% 8/8/2028 | 1,352 | 1,330 | ||||||
| Scientific Games Corp. 8.625% 7/1/20258 | 13,280 | 13,546 | ||||||
| Scientific Games Corp. 7.00% 5/15/20288 | 38,659 | 38,325 | ||||||
| Scientific Games Corp. 7.25% 11/15/20298 | 25,850 | 25,951 | ||||||
| Scientific Games Holdings, LP 6.625% 3/1/20308 | 20,510 | 18,295 | ||||||
| Six Flags Entertainment Corp. 4.875% 7/31/20248 | 11,570 | 11,338 | ||||||
| Six Flags Theme Parks, Inc. 7.00% 7/1/20258 | 1,760 | 1,781 | ||||||
| Sonic Automotive, Inc. 4.625% 11/15/20298 | 37,710 | 31,390 | ||||||
| Sonic Automotive, Inc. 4.875% 11/15/20318 | 14,185 | 11,348 | ||||||
| Stellantis Finance US, Inc. 1.711% 1/29/20278 | 7,175 | 6,330 | ||||||
| Stellantis Finance US, Inc. 5.625% 1/12/20288 | 15,000 | 15,387 | ||||||
| Stellantis Finance US, Inc. 2.691% 9/15/20318 | 5,075 | 4,095 | ||||||
| Stellantis Finance US, Inc. 6.375% 9/12/20328 | 16,425 | 17,161 | ||||||
| Tempur Sealy International, Inc. 4.00% 4/15/20298 | 4,625 | 4,046 | ||||||
| The Gap, Inc. 3.625% 10/1/20298 | 2,507 | 1,928 | ||||||
| The Gap, Inc. 3.875% 10/1/20318 | 1,670 | 1,246 | ||||||
| Toyota Motor Credit Corp. 0.45% 1/11/2024 | 25,283 | 24,274 | ||||||
| Toyota Motor Credit Corp. 0.80% 1/9/2026 | 11,003 | 9,957 | ||||||
| Toyota Motor Credit Corp. 1.90% 1/13/2027 | 10,000 | 9,110 | ||||||
| Travel + Leisure Co. 4.50% 12/1/20298 | 18,020 | 15,523 | ||||||
| Vail Resorts, Inc. 6.25% 5/15/20258 | 9,270 | 9,325 | ||||||
| VICI Properties, LP 4.25% 12/1/20268 | 3,660 | 3,459 | ||||||
| Volkswagen Group of America Finance, LLC 3.125% 5/12/20238 | 2,000 | 1,990 | ||||||
| Volkswagen Group of America Finance, LLC 4.25% 11/13/20238 | 7,365 | 7,305 | ||||||
| Volkswagen Group of America Finance, LLC 2.85% 9/26/20248 | 4,870 | 4,698 | ||||||
| Volkswagen Group of America Finance, LLC 3.35% 5/13/20258 | 6,326 | 6,095 | ||||||
| Volkswagen Group of America Finance, LLC 4.625% 11/13/20258 | 2,575 | 2,549 | ||||||
| Volkswagen Group of America Finance, LLC 1.25% 11/24/20258 | 6,021 | 5,446 | ||||||
| Volkswagen Group of America Finance, LLC 3.20% 9/26/20268 | 8,003 | 7,544 | ||||||
| Volkswagen Group of America Finance, LLC 1.625% 11/24/20278 | 9,175 | 7,924 | ||||||
| Volkswagen Group of America Finance, LLC 4.75% 11/13/20288 | 2,000 | 1,990 | ||||||
| WASH Multifamily Acquisition, Inc. 5.75% 4/15/20268 | 51,235 | 47,342 | ||||||
| Wheel Pros, Inc. 6.50% 5/15/20298 | 20,451 | 8,278 | ||||||
| Wyndham Destinations, Inc. 4.625% 3/1/20308 | 5,750 | 4,896 | ||||||
| Wyndham Worldwide Corp. 4.375% 8/15/20288 | 33,465 | 30,906 | ||||||
| Wynn Las Vegas, LLC 4.25% 5/30/20238 | 15,648 | 15,625 | ||||||
| Wynn Resorts Finance, LLC 7.75% 4/15/20258 | 12,005 | 12,070 | ||||||
| 2,606,130 | ||||||||
| Energy 1.98% | ||||||||
| Antero Midstream Partners, LP 5.375% 6/15/20298 | 14,760 | 13,728 | ||||||
| Antero Resources Corp. 7.625% 2/1/20298 | 5,135 | 5,258 | ||||||
| Antero Resources Corp. 5.375% 3/1/20308 | 52 | 49 | ||||||
| Apache Corp. 4.25% 1/15/2030 | 4,870 | 4,462 | ||||||
| Apache Corp. 6.00% 1/15/2037 | 3,565 | 3,381 | ||||||
| Apache Corp. 5.10% 9/1/2040 | 2,505 | 2,191 | ||||||
| Apache Corp. 4.75% 4/15/2043 | 2,565 | 2,033 | ||||||
| Apache Corp. 5.35% 7/1/2049 | 32,840 | 27,239 | ||||||
| Ascent Resources - Utica, LLC, Term Loan, (3-month USD-LIBOR + 9.00%) 10.00% 11/1/20257,8,11 | 6,827 | 7,254 | ||||||
| Ascent Resources Utica Holdings, LLC 7.00% 11/1/20268 | 30,865 | 29,459 | ||||||
| Ascent Resources Utica Holdings, LLC 9.00% 11/1/20278 | 959 | 1,187 | ||||||
| Ascent Resources Utica Holdings, LLC 8.25% 12/31/20288 | 6,340 | 6,218 | ||||||
| Ascent Resources Utica Holdings, LLC 5.875% 6/30/20298 | 9,090 | 8,013 | ||||||
| Baker Hughes Co. 4.486% 5/1/2030 | 1,650 | 1,626 | ||||||
| BIP-V Chinook Holdco, LLC 5.50% 6/15/20318 | 36,675 | 33,455 | ||||||
| Blue Racer Midstream, LLC 7.625% 12/15/20258 | 10,281 | 10,455 | ||||||
| Bonanza Creek Energy, Inc. 5.00% 10/15/20268 | 23,690 | 22,121 | ||||||
| BP Capital Markets America, Inc. 2.772% 11/10/2050 | 3,032 | 2,106 | ||||||
| The Income Fund of America | 15 |
| Bonds, notes & other debt instruments (continued) | Principal amount (000) | Value (000) | ||||||
| Corporate bonds, notes & loans (continued) | ||||||||
| Energy (continued) | ||||||||
| California Resources Corp. 7.125% 2/1/20268 | USD | 26,405 | $ | 25,741 | ||||
| Canadian Natural Resources, Ltd. 2.05% 7/15/2025 | 3,150 | 2,949 | ||||||
| Canadian Natural Resources, Ltd. 3.85% 6/1/2027 | 2,760 | 2,667 | ||||||
| Canadian Natural Resources, Ltd. 4.95% 6/1/2047 | 534 | 498 | ||||||
| Cenovus Energy, Inc. 5.375% 7/15/2025 | 4,421 | 4,429 | ||||||
| Cenovus Energy, Inc. 4.25% 4/15/2027 | 18,549 | 18,125 | ||||||
| Centennial Resource Production, LLC 6.875% 4/1/20278 | 2,490 | 2,443 | ||||||
| Cheniere Energy Partners, LP 4.50% 10/1/2029 | 32,421 | 30,463 | ||||||
| Cheniere Energy Partners, LP 4.00% 3/1/2031 | 8,070 | 7,248 | ||||||
| Cheniere Energy Partners, LP 3.25% 1/31/2032 | 4,389 | 3,670 | ||||||
| Cheniere Energy, Inc. 4.625% 10/15/2028 | 51,845 | 49,429 | ||||||
| Chesapeake Energy Corp. 4.875% 4/15/202212 | 28,085 | 555 | ||||||
| Chesapeake Energy Corp. 5.50% 2/1/20268 | 19,835 | 19,251 | ||||||
| Chesapeake Energy Corp. 5.875% 2/1/20298 | 31,345 | 30,054 | ||||||
| Chesapeake Energy Corp. 6.75% 4/15/20298 | 18,880 | 18,642 | ||||||
| CNX Midstream Partners, LP 4.75% 4/15/20308 | 8,065 | 6,836 | ||||||
| CNX Resources Corp. 7.25% 3/14/20278 | 26,180 | 26,087 | ||||||
| CNX Resources Corp. 6.00% 1/15/20298 | 34,027 | 31,289 | ||||||
| CNX Resources Corp. 7.375% 1/15/20318 | 22,699 | 22,103 | ||||||
| Comstock Resources, Inc. 6.75% 3/1/20298 | 17,870 | 16,509 | ||||||
| Comstock Resources, Inc. 5.875% 1/15/20308 | 15,235 | 13,082 | ||||||
| Constellation Oil Services Holding SA 13.50% 6/30/20252,8 | 8,658 | 8,659 | ||||||
| Continental Resources, Inc. 5.75% 1/15/20318 | 11,330 | 11,138 | ||||||
| Crescent Energy Finance, LLC 9.25% 2/15/20288 | 15,093 | 15,090 | ||||||
| Crestwood Midstream Partners, LP 8.00% 4/1/20298 | 41,410 | 42,080 | ||||||
| Crestwood Midstream Partners, LP 7.375% 2/1/20318 | 14,441 | 14,547 | ||||||
| Devon Energy Corp. 4.50% 1/15/2030 | 11,418 | 11,048 | ||||||
| Diamond Foreign Asset Co. 9.00% Cash 4/22/20277,8,9 | 2,085 | 2,002 | ||||||
| Diamond Foreign Asset Co. 9.00% Cash 4/22/20279 | 1,889 | 1,813 | ||||||
| DT Midstream, Inc. 4.125% 6/15/20298 | 8,935 | 7,855 | ||||||
| DT Midstream, Inc. 4.375% 6/15/20318 | 8,915 | 7,811 | ||||||
| Ecopetrol SA 8.875% 1/13/2033 | 65,030 | 66,797 | ||||||
| El Paso Pipeline Partners Operating Co., LLC 4.70% 11/1/2042 | 33,265 | 29,416 | ||||||
| Enbridge Energy Partners, LP 5.875% 10/15/2025 | 1,145 | 1,169 | ||||||
| Enbridge Energy Partners, LP 7.375% 10/15/2045 | 3,000 | 3,594 | ||||||
| Enbridge, Inc. 4.00% 10/1/2023 | 2,630 | 2,612 | ||||||
| Enbridge, Inc. 2.50% 1/15/2025 | 1,600 | 1,525 | ||||||
| Energy Transfer Operating, LP 2.90% 5/15/2025 | 3,150 | 3,007 | ||||||
| Energy Transfer Operating, LP 5.00% 5/15/2050 | 7,353 | 6,429 | ||||||
| Energy Transfer Partners, LP 4.50% 4/15/2024 | 1,585 | 1,572 | ||||||
| Energy Transfer Partners, LP 4.75% 1/15/2026 | 8,000 | 7,932 | ||||||
| Energy Transfer Partners, LP 4.20% 4/15/2027 | 2,450 | 2,369 | ||||||
| Energy Transfer Partners, LP 4.95% 6/15/2028 | 3,200 | 3,184 | ||||||
| Enterprise Products Operating, LLC 5.05% 1/10/2026 | 10,321 | 10,475 | ||||||
| Enterprise Products Operating, LLC 5.35% 1/31/2033 | 3,969 | 4,129 | ||||||
| Enterprise Products Operating, LLC 3.20% 2/15/2052 | 400 | 287 | ||||||
| EQM Midstream Partners, LP 4.125% 12/1/2026 | 3,036 | 2,750 | ||||||
| EQM Midstream Partners, LP 6.50% 7/1/20278 | 38,110 | 37,471 | ||||||
| EQM Midstream Partners, LP 5.50% 7/15/2028 | 19,665 | 18,164 | ||||||
| EQM Midstream Partners, LP 4.50% 1/15/20298 | 22,045 | 19,364 | ||||||
| EQM Midstream Partners, LP 7.50% 6/1/20308 | 11,535 | 11,535 | ||||||
| EQM Midstream Partners, LP 4.75% 1/15/20318 | 21,700 | 18,384 | ||||||
| EQT Corp. 6.125% 2/1/202510 | 16,935 | 17,121 | ||||||
| EQT Corp. 5.00% 1/15/2029 | 6,485 | 6,293 | ||||||
| EQT Corp. 7.25% 2/1/203010 | 7,100 | 7,561 | ||||||
| EQT Corp. 3.625% 5/15/20318 | 2,115 | 1,854 | ||||||
| Equinor ASA 3.00% 4/6/2027 | 7,000 | 6,697 | ||||||
| Equinor ASA 3.625% 9/10/2028 | 5,265 | 5,122 | ||||||
| Equinor ASA 3.25% 11/18/2049 | 7,583 | 5,959 | ||||||
| Exxon Mobil Corp. 2.44% 8/16/2029 | 4,315 | 3,910 | ||||||
| Exxon Mobil Corp. 2.61% 10/15/2030 | 1,700 | 1,534 | ||||||
| Exxon Mobil Corp. 3.452% 4/15/2051 | 5,000 | 4,085 | ||||||
| Genesis Energy, LP 6.50% 10/1/2025 | 27,824 | 27,372 | ||||||
| Genesis Energy, LP 6.25% 5/15/2026 | 4,500 | 4,307 | ||||||
| Genesis Energy, LP 8.00% 1/15/2027 | 52,582 | 51,985 | ||||||
| Genesis Energy, LP 7.75% 2/1/2028 | 17,135 | 16,590 | ||||||
| Genesis Energy, LP 8.875% 4/15/2030 | 16,194 | 16,477 | ||||||
| 16 | The Income Fund of America |
| Bonds, notes & other debt instruments (continued) | Principal amount (000) | Value (000) | ||||||
| Corporate bonds, notes & loans (continued) | ||||||||
| Energy (continued) | ||||||||
| Harvest Midstream I, LP 7.50% 9/1/20288 | USD | 17,985 | $ | 17,717 | ||||
| Hess Midstream Operations, LP 4.25% 2/15/20308 | 5,020 | 4,403 | ||||||
| Hess Midstream Operations, LP 5.50% 10/15/20308 | 8,545 | 7,979 | ||||||
| Hess Midstream Partners, LP 5.125% 6/15/20288 | 14,435 | 13,611 | ||||||
| Hilcorp Energy I, LP 6.25% 11/1/20288 | 4,000 | 3,847 | ||||||
| Hilcorp Energy I, LP 5.75% 2/1/20298 | 2,960 | 2,756 | ||||||
| Hilcorp Energy I, LP 6.00% 4/15/20308 | 11,940 | 11,114 | ||||||
| Hilcorp Energy I, LP 6.00% 2/1/20318 | 19,400 | 18,012 | ||||||
| Holly Energy Partners, LP / Holly Energy Finance Corp. 6.375% 4/15/20278 | 4,295 | 4,252 | ||||||
| Kinder Morgan Energy Partners, LP 5.00% 3/1/2043 | 20,000 | 18,163 | ||||||
| Kinder Morgan, Inc. 5.20% 6/1/2033 | 11,443 | 11,415 | ||||||
| Kinder Morgan, Inc. 5.45% 8/1/2052 | 2,683 | 2,578 | ||||||
| MPLX, LP 1.75% 3/1/2026 | 2,200 | 2,004 | ||||||
| MPLX, LP 2.65% 8/15/2030 | 8,351 | 7,129 | ||||||
| MPLX, LP 4.70% 4/15/2048 | 5,147 | 4,450 | ||||||
| Nabors Industries, Inc. 7.375% 5/15/20278 | 6,535 | 6,552 | ||||||
| New Fortress Energy, Inc. 6.75% 9/15/20258 | 23,360 | 22,383 | ||||||
| New Fortress Energy, Inc. 6.50% 9/30/20268 | 47,845 | 44,090 | ||||||
| NGL Energy Operating, LLC 7.50% 2/1/20268 | 161,084 | 153,204 | ||||||
| NGL Energy Partners, LP 6.125% 3/1/2025 | 26,098 | 23,190 | ||||||
| Northern Oil and Gas, Inc. 8.125% 3/1/20288 | 35,360 | 35,269 | ||||||
| NuStar Logistics, LP 6.00% 6/1/2026 | 9,165 | 8,986 | ||||||
| NuStar Logistics, LP 5.625% 4/28/2027 | 2,270 | 2,182 | ||||||
| Oasis Petroleum, Inc. 6.375% 6/1/20268 | 16,763 | 16,532 | ||||||
| Occidental Petroleum Corp. 2.90% 8/15/2024 | 13,065 | 12,537 | ||||||
| Occidental Petroleum Corp. 5.875% 9/1/2025 | 26,705 | 27,063 | ||||||
| Occidental Petroleum Corp. 8.50% 7/15/2027 | 13,000 | 14,397 | ||||||
| Occidental Petroleum Corp. 6.375% 9/1/2028 | 10,370 | 10,786 | ||||||
| Occidental Petroleum Corp. 8.875% 7/15/2030 | 43,590 | 51,386 | ||||||
| Occidental Petroleum Corp. 6.625% 9/1/2030 | 11,445 | 12,164 | ||||||
| Occidental Petroleum Corp. 6.125% 1/1/2031 | 8,850 | 9,250 | ||||||
| Occidental Petroleum Corp. 6.45% 9/15/2036 | 5,400 | 5,687 | ||||||
| Occidental Petroleum Corp. 6.20% 3/15/2040 | 1,500 | 1,517 | ||||||
| Occidental Petroleum Corp. 6.60% 3/15/2046 | 5,125 | 5,464 | ||||||
| ONEOK, Inc. 2.20% 9/15/2025 | 50 | 47 | ||||||
| ONEOK, Inc. 5.85% 1/15/2026 | 5,631 | 5,772 | ||||||
| ONEOK, Inc. 3.10% 3/15/2030 | 134 | 118 | ||||||
| ONEOK, Inc. 6.35% 1/15/2031 | 837 | 890 | ||||||
| ONEOK, Inc. 5.20% 7/15/2048 | 636 | 576 | ||||||
| ONEOK, Inc. 4.50% 3/15/2050 | 285 | 231 | ||||||
| ONEOK, Inc. 7.15% 1/15/2051 | 352 | 393 | ||||||
| Parkland Corp. 4.625% 5/1/20308 | 5,545 | 4,774 | ||||||
| Petróleos Mexicanos 4.625% 9/21/2023 | 4,243 | 4,208 | ||||||
| Petróleos Mexicanos 6.875% 10/16/2025 | 18,955 | 19,008 | ||||||
| Petróleos Mexicanos 6.875% 8/4/2026 | 71,850 | 70,500 | ||||||
| Petróleos Mexicanos 6.49% 1/23/2027 | 5,378 | 5,057 | ||||||
| Petróleos Mexicanos 6.50% 3/13/2027 | 72,935 | 68,947 | ||||||
| Petróleos Mexicanos 6.50% 1/23/2029 | 865 | 784 | ||||||
| Petróleos Mexicanos 8.75% 6/2/2029 | 24,503 | 23,892 | ||||||
| Petróleos Mexicanos 5.95% 1/28/2031 | 6,039 | 4,842 | ||||||
| Petróleos Mexicanos 6.70% 2/16/2032 | 50,565 | 42,042 | ||||||
| Petróleos Mexicanos 6.75% 9/21/2047 | 5,324 | 3,701 | ||||||
| Pioneer Natural Resources Company 2.15% 1/15/2031 | 5,684 | 4,718 | ||||||
| Plains All American Pipeline, LP 3.80% 9/15/2030 | 450 | 409 | ||||||
| Range Resources Corp. 4.875% 5/15/2025 | 2,375 | 2,294 | ||||||
| Range Resources Corp. 8.25% 1/15/2029 | 25,655 | 26,408 | ||||||
| Range Resources Corp. 4.75% 2/15/20308 | 22,135 | 19,856 | ||||||
| Rockies Express Pipeline, LLC 4.95% 7/15/20298 | 11,768 | 10,651 | ||||||
| Sabine Pass Liquefaction, LLC 5.75% 5/15/2024 | 4,247 | 4,272 | ||||||
| Sanchez Energy Corp. 7.25% 2/15/20238,12 | 5,374 | 60 | ||||||
| SM Energy Co. 6.50% 7/15/2028 | 2,975 | 2,834 | ||||||
| Southwestern Energy Co. 5.95% 1/23/202510 | 13,213 | 13,116 | ||||||
| Southwestern Energy Co. 7.75% 10/1/2027 | 7,950 | 8,300 | ||||||
| Southwestern Energy Co. 8.375% 9/15/2028 | 7,755 | 8,154 | ||||||
| Southwestern Energy Co. 5.375% 2/1/2029 | 10,880 | 10,237 | ||||||
| Southwestern Energy Co. 5.375% 3/15/2030 | 39,660 | 36,994 | ||||||
| Southwestern Energy Co. 4.75% 2/1/2032 | 10,135 | 8,947 | ||||||
| The Income Fund of America | 17 |
| Bonds, notes & other debt instruments (continued) | Principal amount (000) | Value (000) | ||||||
| Corporate bonds, notes & loans (continued) | ||||||||
| Energy (continued) | ||||||||
| Statoil ASA 3.25% 11/10/2024 | USD | 850 | $ | 833 | ||||
| Statoil ASA 4.25% 11/23/2041 | 3,000 | 2,824 | ||||||
| Suburban Propane Partners, LP / Suburban Energy Finance Corp. 5.00% 6/1/20318 | 6,125 | 5,337 | ||||||
| Sunoco Logistics Operating Partners, LP 4.00% 10/1/2027 | 1,900 | 1,821 | ||||||
| Sunoco, LP 6.00% 4/15/2027 | 12,160 | 12,169 | ||||||
| Sunoco, LP 5.875% 3/15/2028 | 12,700 | 12,490 | ||||||
| Sunoco, LP 4.50% 5/15/2029 | 12,580 | 11,398 | ||||||
| Sunoco, LP 4.50% 4/30/2030 | 6,950 | 6,201 | ||||||
| Superior Plus, LP and Superior General Partner, Inc. 4.50% 3/15/20298 | 3,825 | 3,386 | ||||||
| Targa Resources Partners, LP 6.50% 7/15/2027 | 4,740 | 4,857 | ||||||
| Targa Resources Partners, LP 6.875% 1/15/2029 | 9,385 | 9,649 | ||||||
| Targa Resources Partners, LP 5.50% 3/1/2030 | 22,550 | 22,031 | ||||||
| Total Capital International 3.127% 5/29/2050 | 8,100 | 6,198 | ||||||
| Total SE 2.986% 6/29/2041 | 7,401 | 5,908 | ||||||
| TransCanada PipeLines, Ltd. 4.10% 4/15/2030 | 5,254 | 5,012 | ||||||
| Transocean Poseidon, Ltd. 6.875% 2/1/20278 | 8,781 | 8,770 | ||||||
| Transocean Titan Financing, Ltd. 8.375% 2/1/20288 | 22,659 | 23,544 | ||||||
| Valero Energy Corp. 4.00% 4/1/2029 | 6,000 | 5,803 | ||||||
| Venture Global Calcasieu Pass, LLC 6.25% 1/15/20308 | 7,746 | 7,900 | ||||||
| Venture Global Calcasieu Pass, LLC 4.125% 8/15/20318 | 36,865 | 32,736 | ||||||
| Weatherford International, Ltd. 11.00% 12/1/20248 | 2,920 | 3,012 | ||||||
| Weatherford International, Ltd. 6.50% 9/15/20288 | 22,665 | 22,576 | ||||||
| Weatherford International, Ltd. 8.625% 4/30/20308 | 63,530 | 64,208 | ||||||
| Western Gas Partners, LP 4.50% 3/1/2028 | 29,990 | 28,374 | ||||||
| Western Gas Partners, LP 5.45% 4/1/2044 | 1,210 | 1,066 | ||||||
| Western Midstream Operating, LP 3.35% 2/1/202510 | 9,602 | 9,181 | ||||||
| Western Midstream Operating, LP 4.75% 8/15/2028 | 3,540 | 3,340 | ||||||
| Western Midstream Operating, LP 4.30% 2/1/203010 | 13,900 | 12,750 | ||||||
| Williams Companies, Inc. 3.50% 11/15/2030 | 2,081 | 1,908 | ||||||
| 2,403,763 | ||||||||
| Health care 1.73% | ||||||||
| AbbVie, Inc. 2.95% 11/21/2026 | 2,890 | 2,736 | ||||||
| AbbVie, Inc. 4.55% 3/15/2035 | 6,750 | 6,629 | ||||||
| AbbVie, Inc. 4.30% 5/14/2036 | 1,003 | 955 | ||||||
| AbbVie, Inc. 4.75% 3/15/2045 | 1,203 | 1,158 | ||||||
| AdaptHealth, LLC 5.125% 3/1/20308 | 15,450 | 13,770 | ||||||
| AmerisourceBergen Corp. 0.737% 3/15/2023 | 4,382 | 4,361 | ||||||
| Amgen, Inc. 4.05% 8/18/2029 | 5,900 | 5,704 | ||||||
| Amgen, Inc. 4.40% 2/22/2062 | 3,999 | 3,424 | ||||||
| Anthem, Inc. 2.375% 1/15/2025 | 2,046 | 1,956 | ||||||
| AstraZeneca Finance, LLC 1.20% 5/28/2026 | 10,098 | 9,126 | ||||||
| AstraZeneca Finance, LLC 1.75% 5/28/2028 | 5,612 | 4,941 | ||||||
| AstraZeneca Finance, LLC 2.25% 5/28/2031 | 2,650 | 2,294 | ||||||
| AstraZeneca PLC 3.375% 11/16/2025 | 4,500 | 4,395 | ||||||
| Avantor Funding, Inc. 4.625% 7/15/20288 | 27,540 | 25,996 | ||||||
| Avantor Funding, Inc. 3.875% 11/1/20298 | 25,835 | 22,748 | ||||||
| Bausch Health Americas, Inc. 9.25% 4/1/20268 | 8,225 | 6,128 | ||||||
| Bausch Health Americas, Inc. 8.50% 1/31/20278 | 6,320 | 3,342 | ||||||
| Bausch Health Companies, Inc. 9.00% 12/15/20258 | 16,475 | 13,000 | ||||||
| Bausch Health Companies, Inc. 7.00% 1/15/20288 | 7,120 | 3,271 | ||||||
| Bausch Health Companies, Inc. 5.00% 1/30/20288 | 19,194 | 8,635 | ||||||
| Bausch Health Companies, Inc. 4.875% 6/1/20288 | 60,725 | 39,115 | ||||||
| Bausch Health Companies, Inc. 5.00% 2/15/20298 | 1,145 | 516 | ||||||
| Bausch Health Companies, Inc. 7.25% 5/30/20298 | 1,325 | 594 | ||||||
| Bausch Health Companies, Inc. 5.25% 2/15/20318 | 17,603 | 7,987 | ||||||
| Baxter International, Inc. 1.322% 11/29/2024 | 21,489 | 20,181 | ||||||
| Baxter International, Inc. 1.915% 2/1/2027 | 21,489 | 19,407 | ||||||
| Baxter International, Inc. 2.272% 12/1/2028 | 11,534 | 10,094 | ||||||
| Bayer US Finance II, LLC 3.875% 12/15/20238 | 3,850 | 3,802 | ||||||
| Bayer US Finance II, LLC 4.25% 12/15/20258 | 14,109 | 13,874 | ||||||
| Bayer US Finance II, LLC 4.40% 7/15/20448 | 13,090 | 10,878 | ||||||
| Boston Scientific Corp. 1.90% 6/1/2025 | 9,109 | 8,572 | ||||||
| Catalent Pharma Solutions, Inc. 5.00% 7/15/20278 | 11,937 | 11,305 | ||||||
| Catalent Pharma Solutions, Inc. 3.125% 2/15/20298 | 17,495 | 14,499 | ||||||
| Catalent Pharma Solutions, Inc. 3.50% 4/1/20308 | 4,915 | 4,067 | ||||||
| Centene Corp. 4.25% 12/15/2027 | 50,425 | 48,431 | ||||||
| 18 | The Income Fund of America |
| Bonds, notes & other debt instruments (continued) | Principal amount (000) | Value (000) | ||||||
| Corporate bonds, notes & loans (continued) | ||||||||
| Health care (continued) | ||||||||
| Centene Corp. 2.45% 7/15/2028 | USD | 47,440 | $ | 41,154 | ||||
| Centene Corp. 4.625% 12/15/2029 | 59,080 | 56,202 | ||||||
| Centene Corp. 3.375% 2/15/2030 | 44,100 | 38,837 | ||||||
| Centene Corp. 3.00% 10/15/2030 | 2,188 | 1,874 | ||||||
| Centene Corp. 2.50% 3/1/2031 | 12,110 | 9,917 | ||||||
| Centene Corp. 2.625% 8/1/2031 | 2,630 | 2,158 | ||||||
| Charles River Laboratories International, Inc. 4.25% 5/1/20288 | 27,840 | 25,794 | ||||||
| Charles River Laboratories International, Inc. 3.75% 3/15/20298 | 2,500 | 2,230 | ||||||
| Community Health Systems, Inc. 5.625% 3/15/20278 | 21,210 | 18,803 | ||||||
| Community Health Systems, Inc. 6.00% 1/15/20298 | 8,870 | 7,797 | ||||||
| Community Health Systems, Inc. 5.25% 5/15/20308 | 29,625 | 23,943 | ||||||
| CVS Health Corp. 4.30% 3/25/2028 | 14,910 | 14,666 | ||||||
| DaVita, Inc. 4.625% 6/1/20308 | 15,055 | 12,700 | ||||||
| Elevance Health, Inc. 4.90% 2/8/2026 | 6,445 | 6,452 | ||||||
| Elevance Health, Inc. 4.75% 2/15/2033 | 3,648 | 3,664 | ||||||
| Elevance Health, Inc. 5.125% 2/15/2053 | 1,546 | 1,556 | ||||||
| Eli Lilly and Company 3.375% 3/15/2029 | 1,353 | 1,298 | ||||||
| Encompass Health Corp. 4.50% 2/1/2028 | 13,743 | 12,848 | ||||||
| Encompass Health Corp. 4.75% 2/1/2030 | 4,560 | 4,186 | ||||||
| GlaxoSmithKline PLC 3.625% 5/15/2025 | 4,625 | 4,555 | ||||||
| Grifols Escrow Issuer SA 4.75% 10/15/20288 | 14,480 | 12,612 | ||||||
| HCA, Inc. 5.875% 2/15/2026 | 13,870 | 14,124 | ||||||
| HCA, Inc. 5.375% 9/1/2026 | 9,680 | 9,742 | ||||||
| HCA, Inc. 3.125% 3/15/20278 | 8,130 | 7,563 | ||||||
| HCA, Inc. 5.625% 9/1/2028 | 20,915 | 21,297 | ||||||
| HCA, Inc. 3.375% 3/15/20298 | 9,299 | 8,424 | ||||||
| HCA, Inc. 3.50% 9/1/2030 | 20,534 | 18,417 | ||||||
| HCA, Inc. 2.375% 7/15/2031 | 305 | 248 | ||||||
| HCA, Inc. 3.625% 3/15/20328 | 10,000 | 8,886 | ||||||
| HCA, Inc. 4.375% 3/15/20428 | 5,000 | 4,260 | ||||||
| HCA, Inc. 4.625% 3/15/20528 | 4,747 | 4,010 | ||||||
| HealthEquity, Inc. 4.50% 10/1/20298 | 22,525 | 20,195 | ||||||
| Iqvia, Inc. 5.00% 5/15/20278 | 11,510 | 11,184 | ||||||
| Jazz Securities DAC 4.375% 1/15/20298 | 14,125 | 12,906 | ||||||
| Mallinckrodt PLC 10.00% 4/15/20258 | 12,820 | 11,202 | ||||||
| Merck & Co., Inc. 1.90% 12/10/2028 | 2,740 | 2,420 | ||||||
| Merck & Co., Inc. 2.75% 12/10/2051 | 5,514 | 3,981 | ||||||
| Molina Healthcare, Inc. 4.375% 6/15/20288 | 25,980 | 24,030 | ||||||
| Molina Healthcare, Inc. 3.875% 11/15/20308 | 12,815 | 11,038 | ||||||
| Molina Healthcare, Inc. 3.875% 5/15/20328 | 32,460 | 27,260 | ||||||
| Mozart Debt Merger Sub, Inc. 5.25% 10/1/20298 | 19,695 | 16,518 | ||||||
| Novant Health, Inc. 3.168% 11/1/2051 | 6,000 | 4,439 | ||||||
| Novartis Capital Corp. 2.00% 2/14/2027 | 3,090 | 2,864 | ||||||
| Option Care Health, Inc. 4.375% 10/31/20298 | 16,705 | 14,453 | ||||||
| Organon Finance 1, LLC 4.125% 4/30/20288 | 28,670 | 25,966 | ||||||
| Owens & Minor, Inc. 4.375% 12/15/2024 | 32,762 | 32,012 | ||||||
| Owens & Minor, Inc. 4.50% 3/31/20298 | 44,090 | 35,979 | ||||||
| Par Pharmaceutical, Inc. 7.50% 4/1/20278 | 67,797 | 53,128 | ||||||
| Pfizer, Inc. 3.45% 3/15/2029 | 4,800 | 4,635 | ||||||
| Radiology Partners, Inc. 9.25% 2/1/20288 | 35,255 | 21,383 | ||||||
| Rede D’Or Finance SARL 4.95% 1/17/2028 | 1,820 | 1,691 | ||||||
| Rede D’Or Finance SARL 4.50% 1/22/2030 | 8,840 | 7,746 | ||||||
| RP Escrow Issuer, LLC 5.25% 12/15/20258 | 13,660 | 11,167 | ||||||
| Select Medical Holdings Corp. 6.25% 8/15/20268 | 18,853 | 18,437 | ||||||
| Shire PLC 2.875% 9/23/2023 | 1,759 | 1,733 | ||||||
| Summa Health 3.511% 11/15/2051 | 2,650 | 1,926 | ||||||
| Surgery Center Holdings 10.00% 4/15/20278 | 9,612 | 9,818 | ||||||
| Tenet Healthcare Corp. 4.625% 7/15/2024 | 5,642 | 5,572 | ||||||
| Tenet Healthcare Corp. 4.875% 1/1/2026 | 106,640 | 103,987 | ||||||
| Tenet Healthcare Corp. 5.125% 11/1/2027 | 13,695 | 13,197 | ||||||
| Tenet Healthcare Corp. 4.25% 6/1/2029 | 35,940 | 32,054 | ||||||
| Tenet Healthcare Corp. 4.375% 1/15/2030 | 10,985 | 9,781 | ||||||
| Teva Pharmaceutical Finance Co. BV 2.80% 7/21/2023 | 11,500 | 11,359 | ||||||
| Teva Pharmaceutical Finance Co. BV 6.00% 4/15/2024 | 76,069 | 75,926 | ||||||
| Teva Pharmaceutical Finance Co. BV 7.125% 1/31/2025 | 26,880 | 27,278 | ||||||
| Teva Pharmaceutical Finance Co. BV 3.15% 10/1/2026 | 100,615 | 90,397 | ||||||
| Teva Pharmaceutical Finance Co. BV 4.75% 5/9/2027 | 98,070 | 91,205 | ||||||
| The Income Fund of America | 19 |
| Bonds, notes & other debt instruments (continued) | Principal amount (000) | Value (000) | ||||||
| Corporate bonds, notes & loans (continued) | ||||||||
| Health care (continued) | ||||||||
| Teva Pharmaceutical Finance Co. BV 6.75% 3/1/2028 | USD | 214,795 | $ | 216,299 | ||||
| Teva Pharmaceutical Finance Co. BV 5.125% 5/9/2029 | 108,360 | 100,064 | ||||||
| Teva Pharmaceutical Finance Co. BV 4.10% 10/1/2046 | 126,935 | 87,185 | ||||||
| Teva Pharmaceutical Finance Co., LLC 6.15% 2/1/2036 | 2,435 | 2,255 | ||||||
| UnitedHealth Group, Inc. 1.15% 5/15/2026 | 5,633 | 5,102 | ||||||
| UnitedHealth Group, Inc. 5.30% 2/15/2030 | 10,000 | 10,520 | ||||||
| UnitedHealth Group, Inc. 2.00% 5/15/2030 | 2,102 | 1,796 | ||||||
| UnitedHealth Group, Inc. 4.20% 5/15/2032 | 3,066 | 3,024 | ||||||
| UnitedHealth Group, Inc. 3.05% 5/15/2041 | 8,325 | 6,660 | ||||||
| UnitedHealth Group, Inc. 3.25% 5/15/2051 | 5,379 | 4,216 | ||||||
| UnitedHealth Group, Inc. 4.75% 5/15/2052 | 3,002 | 2,977 | ||||||
| Valeant Pharmaceuticals International, Inc. 5.50% 11/1/20258 | 67,990 | 57,909 | ||||||
| 2,104,982 | ||||||||
| Communication services 1.57% | ||||||||
| Altice France Holding SA 10.50% 5/15/20278 | 11,630 | 10,007 | ||||||
| Altice France Holding SA 5.125% 7/15/20298 | 71,512 | 56,223 | ||||||
| AT&T, Inc. 1.65% 2/1/2028 | 7,175 | 6,293 | ||||||
| AT&T, Inc. 3.50% 9/15/2053 | 11,419 | 8,438 | ||||||
| British Telecommunications PLC 9.625% 12/15/203010 | 4,011 | 5,062 | ||||||
| CCO Holdings, LLC 5.125% 5/1/20278 | 13,485 | 12,868 | ||||||
| CCO Holdings, LLC 5.00% 2/1/20288 | 13,250 | 12,390 | ||||||
| CCO Holdings, LLC 4.75% 3/1/20308 | 28,837 | 25,232 | ||||||
| CCO Holdings, LLC 4.50% 8/15/20308 | 41,075 | 35,145 | ||||||
| CCO Holdings, LLC 4.25% 2/1/20318 | 43,950 | 36,665 | ||||||
| CCO Holdings, LLC 4.75% 2/1/20328 | 27,835 | 23,699 | ||||||
| CCO Holdings, LLC 4.50% 5/1/2032 | 19,415 | 16,091 | ||||||
| CCO Holdings, LLC 4.50% 6/1/20338 | 37,190 | 30,271 | ||||||
| Centerfield Media Parent, Inc. 6.625% 8/1/20268 | 11,255 | 7,846 | ||||||
| CenturyLink, Inc. 4.00% 2/15/20278 | 45,226 | 38,202 | ||||||
| CenturyLink, Inc. 7.65% 3/15/2042 | 270 | 180 | ||||||
| Charter Communications Operating, LLC 3.70% 4/1/2051 | 15,000 | 9,986 | ||||||
| Charter Communications Operating, LLC 3.90% 6/1/2052 | 5,000 | 3,419 | ||||||
| Cogent Communications Group, Inc. 3.50% 5/1/20268 | 10,700 | 9,920 | ||||||
| Comcast Corp. 2.887% 11/1/2051 | 11,570 | 8,095 | ||||||
| Connect Finco SARL 6.75% 10/1/20268 | 16,600 | 15,894 | ||||||
| CSC Holdings, LLC 3.375% 2/15/20318 | 18,725 | 13,083 | ||||||
| Diamond Sports Group, LLC 6.625% 8/15/20278 | 27,190 | 578 | ||||||
| Directv Financing, LLC 5.875% 8/15/20278 | 46,420 | 42,116 | ||||||
| DIRECTV Financing, LLC, Term Loan, (3-month USD-LIBOR + 5.00%) 9.570% 8/2/20277,11 | 12,798 | 12,610 | ||||||
| DISH Network Corp. 11.75% 11/15/20278 | 64,175 | 66,781 | ||||||
| Embarq Corp. 7.995% 6/1/2036 | 55,817 | 27,023 | ||||||
| Fox Corp. 4.03% 1/25/2024 | 1,120 | 1,108 | ||||||
| Frontier Communications Corp. 5.875% 10/15/20278 | 34,240 | 32,741 | ||||||
| Frontier Communications Corp. 5.00% 5/1/20288 | 49,395 | 44,979 | ||||||
| Frontier Communications Corp. 6.75% 5/1/20298 | 49,388 | 42,413 | ||||||
| Frontier Communications Holdings, LLC 5.875% 11/1/2029 | 12,195 | 9,956 | ||||||
| Frontier Communications Holdings, LLC 6.00% 1/15/20308 | 9,875 | 8,123 | ||||||
| Frontier Communications Holdings, LLC 8.75% 5/15/20308 | 17,175 | 17,823 | ||||||
| Gray Escrow II, Inc. 5.375% 11/15/20318 | 4,650 | 3,582 | ||||||
| Gray Television, Inc. 7.00% 5/15/20278 | 17,880 | 16,291 | ||||||
| iHeartCommunications, Inc. 5.25% 8/15/20278 | 21,050 | 18,880 | ||||||
| Intelsat Jackson Holding Co. 6.50% 3/15/20308 | 18,565 | 16,903 | ||||||
| Kantar Group, LLC, Term Loan B2, (3-month USD-LIBOR + 4.50%) 9.23% 12/4/20267,11 | 6,300 | 5,970 | ||||||
| Lamar Media Corp. 3.75% 2/15/2028 | 5,094 | 4,631 | ||||||
| Lamar Media Corp. 4.875% 1/15/2029 | 21,525 | 20,282 | ||||||
| Lamar Media Corp. 3.625% 1/15/2031 | 8,515 | 7,242 | ||||||
| Liberty Global PLC 5.50% 1/15/20288 | 7,975 | 7,288 | ||||||
| Ligado Networks, LLC 15.50% PIK 11/1/20238,9 | 55,989 | 19,458 | ||||||
| Live Nation Entertainment, Inc. 4.75% 10/15/20278 | 10,000 | 9,263 | ||||||
| Live Nation Entertainment, Inc. 3.75% 1/15/20288 | 5,950 | 5,309 | ||||||
| Meta Platforms, Inc. 3.85% 8/15/2032 | 9,295 | 8,647 | ||||||
| Midas OpCo Holdings, LLC 5.625% 8/15/20298 | 16,750 | 14,699 | ||||||
| Netflix, Inc. 3.625% 6/15/20258 | 290 | 279 | ||||||
| Netflix, Inc. 4.875% 4/15/2028 | 26,324 | 26,259 | ||||||
| Netflix, Inc. 5.875% 11/15/2028 | 39,267 | 40,835 | ||||||
| 20 | The Income Fund of America |
| Bonds, notes & other debt instruments (continued) | Principal amount (000) | Value (000) | ||||||
| Corporate bonds, notes & loans (continued) | ||||||||
| Communication services (continued) | ||||||||
| Netflix, Inc. 6.375% 5/15/2029 | USD | 19,046 | $ | 20,432 | ||||
| Netflix, Inc. 5.375% 11/15/20298 | 39,589 | 40,205 | ||||||
| Netflix, Inc. 4.875% 6/15/20308 | 34,734 | 34,342 | ||||||
| News Corp. 3.875% 5/15/20298 | 17,450 | 15,638 | ||||||
| News Corp. 5.125% 2/15/20328 | 22,780 | 21,477 | ||||||
| Nexstar Broadcasting, Inc. 4.75% 11/1/20288 | 56,875 | 51,412 | ||||||
| Nexstar Escrow Corp. 5.625% 7/15/20278 | 6,480 | 6,182 | ||||||
| SBA Tower Trust 1.631% 11/15/20268 | 23,592 | 20,631 | ||||||
| Scripps Escrow II, Inc. 3.875% 1/15/20298 | 7,300 | 6,107 | ||||||
| Sinclair Television Group, Inc. 4.125% 12/1/20308 | 11,150 | 8,877 | ||||||
| Sirius XM Radio, Inc. 5.00% 8/1/20278 | 4,791 | 4,540 | ||||||
| Sirius XM Radio, Inc. 4.00% 7/15/20288 | 57,450 | 51,210 | ||||||
| Sirius XM Radio, Inc. 4.125% 7/1/20308 | 19,300 | 16,575 | ||||||
| Sirius XM Radio, Inc. 3.875% 9/1/20318 | 34,805 | 28,736 | ||||||
| Sprint Corp. 7.125% 6/15/2024 | 10,000 | 10,225 | ||||||
| Sprint Corp. 7.625% 2/15/2025 | 36,000 | 37,415 | ||||||
| Sprint Corp. 7.625% 3/1/2026 | 29,760 | 31,514 | ||||||
| Sprint Corp. 6.875% 11/15/2028 | 50,192 | 53,763 | ||||||
| Sprint Corp. 8.75% 3/15/2032 | 20,210 | 24,987 | ||||||
| Take-Two Interactive Software, Inc. 3.30% 3/28/2024 | 7,634 | 7,483 | ||||||
| Take-Two Interactive Software, Inc. 4.00% 4/14/2032 | 4,502 | 4,227 | ||||||
| T-Mobile US, Inc. 2.25% 2/15/2026 | 8,000 | 7,426 | ||||||
| T-Mobile US, Inc. 2.625% 4/15/2026 | 6,250 | 5,811 | ||||||
| T-Mobile US, Inc. 2.05% 2/15/2028 | 11,475 | 10,115 | ||||||
| T-Mobile US, Inc. 2.625% 2/15/2029 | 5,585 | 4,890 | ||||||
| T-Mobile US, Inc. 2.40% 3/15/2029 | 2,929 | 2,550 | ||||||
| T-Mobile US, Inc. 2.55% 2/15/2031 | 1,790 | 1,521 | ||||||
| T-Mobile US, Inc. 2.875% 2/15/2031 | 26,123 | 22,363 | ||||||
| T-Mobile US, Inc. 2.70% 3/15/2032 | 6,775 | 5,735 | ||||||
| T-Mobile US, Inc. 3.40% 10/15/2052 | 4,589 | 3,354 | ||||||
| Univision Communications, Inc. 5.125% 2/15/20258 | 5,770 | 5,628 | ||||||
| Univision Communications, Inc. 6.625% 6/1/20278 | 39,575 | 38,834 | ||||||
| Univision Communications, Inc. 4.50% 5/1/20298 | 73,515 | 63,353 | ||||||
| Univision Communications, Inc. 7.375% 6/30/20308 | 9,250 | 9,083 | ||||||
| UPC Broadband Finco BV 4.875% 7/15/20318 | 48,900 | 43,088 | ||||||
| Verizon Communications, Inc. 4.329% 9/21/2028 | 14,870 | 14,676 | ||||||
| Verizon Communications, Inc. 2.55% 3/21/2031 | 6,100 | 5,211 | ||||||
| Verizon Communications, Inc. 3.40% 3/22/2041 | 10,000 | 8,062 | ||||||
| Verizon Communications, Inc. 2.875% 11/20/2050 | 5,625 | 3,832 | ||||||
| Virgin Media O2 4.25% 1/31/20318 | 25,888 | 21,652 | ||||||
| Virgin Media Secured Finance PLC 4.50% 8/15/20308 | 26,070 | 22,520 | ||||||
| VMED O2 UK Financing I PLC 4.75% 7/15/20318 | 1,068 | 910 | ||||||
| Vodafone Group PLC 4.25% 9/17/2050 | 7,275 | 6,045 | ||||||
| VZ Secured Financing BV 5.00% 1/15/20328 | 21,790 | 18,685 | ||||||
| Warner Music Group 3.75% 12/1/20298 | 3,621 | 3,174 | ||||||
| Warner Music Group 3.875% 7/15/20308 | 24,344 | 21,490 | ||||||
| Warner Music Group 3.00% 2/15/20318 | 7,235 | 6,010 | ||||||
| WarnerMedia Holdings, Inc. 3.428% 3/15/20248 | 20,413 | 19,983 | ||||||
| WarnerMedia Holdings, Inc. 3.638% 3/15/20258 | 17,133 | 16,528 | ||||||
| WarnerMedia Holdings, Inc. 3.755% 3/15/20278 | 20,795 | 19,500 | ||||||
| WarnerMedia Holdings, Inc. 4.054% 3/15/20298 | 5,500 | 5,051 | ||||||
| WarnerMedia Holdings, Inc. 4.279% 3/15/20328 | 14,439 | 12,862 | ||||||
| WarnerMedia Holdings, Inc. 5.05% 3/15/20428 | 11,475 | 9,811 | ||||||
| WarnerMedia Holdings, Inc. 5.141% 3/15/20528 | 5,370 | 4,467 | ||||||
| WarnerMedia Holdings, Inc. 5.391% 3/15/20628 | 3,203 | 2,670 | ||||||
| Ziggo Bond Co. BV 5.125% 2/28/20308 | 21,600 | 17,881 | ||||||
| Ziggo Bond Finance BV 4.875% 1/15/20308 | 17,345 | 15,131 | ||||||
| ZipRecruiter, Inc. 5.00% 1/15/20308 | 17,000 | 14,812 | ||||||
| 1,907,770 | ||||||||
| Industrials 1.48% | ||||||||
| AAdvantage Loyalty IP, Ltd. 5.50% 4/20/20268 | 7,905 | 7,758 | ||||||
| Air Lease Corp. 2.875% 1/15/2026 | 21,796 | 20,457 | ||||||
| Air Lease Corp. 2.20% 1/15/2027 | 11,245 | 10,088 | ||||||
| Air Lease Corp. 5.30% 2/1/2028 | 13,000 | 12,985 | ||||||
| Air Lease Corp. 2.10% 9/1/2028 | 5,900 | 5,043 | ||||||
| Allison Transmission Holdings, Inc. 3.75% 1/30/20318 | 25,185 | 21,337 | ||||||
| The Income Fund of America | 21 |
| Bonds, notes & other debt instruments (continued) | Principal amount (000) | Value (000) | ||||||
| Corporate bonds, notes & loans (continued) | ||||||||
| Industrials (continued) | ||||||||
| American Airlines, Inc., Series 2013-2, Class A, 4.95% 7/15/2024 | USD | 1,506 | $ | 1,506 | ||||
| Ashtead Capital, Inc. 5.50% 8/11/20328 | 23,490 | 23,588 | ||||||
| Associated Materials, LLC, Term Loan B, (3-month USD CME Term SOFR + 6.00%) 10.561% 3/8/20297,11 | 29,850 | 25,820 | ||||||
| Atkore, Inc. 4.25% 6/1/20318 | 12,215 | 10,734 | ||||||
| ATS Automation Tooling Systems, Inc. 4.125% 12/15/20288 | 3,975 | 3,566 | ||||||
| Avis Budget Car Rental, LLC 5.75% 7/15/20278 | 12,675 | 11,926 | ||||||
| Avis Budget Group, Inc. 5.375% 3/1/20298 | 18,760 | 16,797 | ||||||
| Avolon Holdings Funding, Ltd. 3.95% 7/1/20248 | 22,645 | 21,951 | ||||||
| Avolon Holdings Funding, Ltd. 2.125% 2/21/20268 | 17,179 | 15,376 | ||||||
| Avolon Holdings Funding, Ltd. 4.25% 4/15/20268 | 8,919 | 8,474 | ||||||
| Avolon Holdings Funding, Ltd. 3.25% 2/15/20278 | 17,000 | 15,360 | ||||||
| Avolon Holdings Funding, Ltd. 2.528% 11/18/20278 | 4,438 | 3,833 | ||||||
| Avolon Holdings Funding, Ltd. 2.75% 2/21/20288 | 10,000 | 8,621 | ||||||
| Boeing Company 1.95% 2/1/2024 | 523 | 507 | ||||||
| Boeing Company 4.875% 5/1/2025 | 55,978 | 56,005 | ||||||
| Boeing Company 2.75% 2/1/2026 | 16,896 | 15,937 | ||||||
| Boeing Company 2.196% 2/4/2026 | 29,049 | 26,868 | ||||||
| Boeing Company 3.10% 5/1/2026 | 1,454 | 1,385 | ||||||
| Boeing Company 5.04% 5/1/2027 | 22,445 | 22,680 | ||||||
| Boeing Company 3.25% 2/1/2028 | 20,952 | 19,573 | ||||||
| Boeing Company 3.25% 3/1/2028 | 1,025 | 956 | ||||||
| Boeing Company 5.15% 5/1/2030 | 67,436 | 68,019 | ||||||
| Boeing Company 3.625% 2/1/2031 | 4,650 | 4,263 | ||||||
| Boeing Company 3.60% 5/1/2034 | 9,000 | 7,727 | ||||||
| Boeing Company 3.25% 2/1/2035 | 475 | 386 | ||||||
| Boeing Company 3.50% 3/1/2039 | 5,544 | 4,341 | ||||||
| Boeing Company 5.705% 5/1/2040 | 23,854 | 24,436 | ||||||
| Boeing Company 3.90% 5/1/2049 | 3,149 | 2,450 | ||||||
| Boeing Company 3.75% 2/1/2050 | 1,805 | 1,391 | ||||||
| Boeing Company 5.805% 5/1/2050 | 33,779 | 34,528 | ||||||
| Bombardier, Inc. 7.125% 6/15/20268 | 45,450 | 45,402 | ||||||
| Bombardier, Inc. 7.875% 4/15/20278 | 94,990 | 95,035 | ||||||
| Bombardier, Inc. 6.00% 2/15/20288 | 32,983 | 31,325 | ||||||
| Bombardier, Inc. 7.50% 2/1/20298 | 9,034 | 9,035 | ||||||
| Burlington Northern Santa Fe, LLC 3.55% 2/15/2050 | 10,000 | 8,266 | ||||||
| BWX Technologies, Inc. 4.125% 6/30/20288 | 5,190 | 4,689 | ||||||
| BWX Technologies, Inc. 4.125% 4/15/20298 | 13,360 | 11,972 | ||||||
| Canadian Pacific Railway, Ltd. 1.75% 12/2/2026 | 3,515 | 3,184 | ||||||
| Canadian Pacific Railway, Ltd. 2.45% 12/2/2031 | 5,255 | 4,540 | ||||||
| Canadian Pacific Railway, Ltd. 3.10% 12/2/2051 | 5,532 | 4,086 | ||||||
| Carrier Global Corp. 2.722% 2/15/2030 | 2,000 | 1,749 | ||||||
| Carrier Global Corp. 3.577% 4/5/2050 | 4,100 | 3,197 | ||||||
| Chart Industries, Inc. 7.50% 1/1/20308 | 11,063 | 11,326 | ||||||
| Clarivate Science Holdings Corp. 3.875% 7/1/20288 | 12,595 | 11,255 | ||||||
| Clarivate Science Holdings Corp. 4.875% 7/1/20298 | 25,820 | 22,754 | ||||||
| Clean Harbors, Inc. 6.375% 2/1/20318 | 14,638 | 14,929 | ||||||
| CoreLogic, Inc. 4.50% 5/1/20288 | 80,461 | 64,083 | ||||||
| CoreLogic, Inc., Term Loan, (3-month USD-LIBOR + 6.50%) 11.125% 6/4/20297,11 | 3,525 | 2,585 | ||||||
| Covanta Holding Corp. 4.875% 12/1/20298 | 19,365 | 16,947 | ||||||
| CSX Corp. 3.80% 3/1/2028 | 1,550 | 1,512 | ||||||
| CSX Corp. 4.50% 3/15/2049 | 3,785 | 3,523 | ||||||
| CSX Corp. 4.50% 11/15/2052 | 9,000 | 8,368 | ||||||
| Dun & Bradstreet Corp. 5.00% 12/15/20298 | 44,192 | 39,189 | ||||||
| General Dynamics Corp. 3.625% 4/1/2030 | 6,433 | 6,213 | ||||||
| General Electric Co., Series D, (3-month USD-LIBOR + 3.33%) 8.099% junior subordinated perpetual bonds7 | 95,170 | 95,194 | ||||||
| Harsco Corp. 5.75% 7/31/20278 | 25,420 | 21,545 | ||||||
| Honeywell International, Inc. 2.30% 8/15/2024 | 4,405 | 4,258 | ||||||
| Howmet Aerospace, Inc. 6.875% 5/1/2025 | 2,815 | 2,903 | ||||||
| Howmet Aerospace, Inc. 5.90% 2/1/2027 | 5,150 | 5,247 | ||||||
| Icahn Enterprises Finance Corp. 4.75% 9/15/2024 | 17,320 | 16,930 | ||||||
| Icahn Enterprises, LP 5.25% 5/15/2027 | 5,855 | 5,459 | ||||||
| Icahn Enterprises, LP 4.375% 2/1/2029 | 9,625 | 8,395 | ||||||
| JELD-WEN Holding, Inc. 4.875% 12/15/20278 | 14,345 | 11,740 | ||||||
| L3Harris Technologies, Inc. 1.80% 1/15/2031 | 8,925 | 7,173 | ||||||
| Labl Escrow Issuer, LLC 10.50% 7/15/20278 | 7,095 | 6,759 | ||||||
| 22 | The Income Fund of America |
| Bonds, notes & other debt instruments (continued) | Principal amount (000) | Value (000) | ||||||
| Corporate bonds, notes & loans (continued) | ||||||||
| Industrials (continued) | ||||||||
| Lockheed Martin Corp. 5.10% 11/15/2027 | USD | 3,805 | $ | 3,951 | ||||
| Lockheed Martin Corp. 5.25% 1/15/2033 | 6,969 | 7,442 | ||||||
| Lockheed Martin Corp. 5.70% 11/15/2054 | 7,398 | 8,413 | ||||||
| LSC Communications, Inc. 8.75% 10/15/20232,8,12 | 25,850 | 78 | ||||||
| LSC Communications, Inc., Term Loan B, (3-month USD-LIBOR + 4.50%) 7.75% 9/30/20222,7,11,12 | 3,697 | 11 | ||||||
| Masco Corp. 1.50% 2/15/2028 | 8,605 | 7,338 | ||||||
| Masco Corp. 2.00% 2/15/2031 | 4,970 | 4,028 | ||||||
| Masco Corp. 3.125% 2/15/2051 | 2,294 | 1,564 | ||||||
| MasTec, Inc. 4.50% 8/15/20288 | 19,290 | 17,897 | ||||||
| Mexico City Airport Trust 3.875% 4/30/20288 | 770 | 737 | ||||||
| Mexico City Airport Trust 5.50% 10/31/2046 | 2,303 | 1,874 | ||||||
| Mexico City Airport Trust 5.50% 7/31/2047 | 4,482 | 3,637 | ||||||
| Mexico City Airport Trust 5.50% 7/31/20478 | 215 | 175 | ||||||
| Mileage Plus Holdings, LLC 6.50% 6/20/20278 | 36,216 | 36,633 | ||||||
| Moog, Inc. 4.25% 12/9/20278 | 11,829 | 10,986 | ||||||
| Mueller Water Products, Inc. 4.00% 6/15/20298 | 5,110 | 4,538 | ||||||
| Norfolk Southern Corp. 4.45% 3/1/2033 | 2,208 | 2,199 | ||||||
| Norfolk Southern Corp. 3.05% 5/15/2050 | 3,727 | 2,714 | ||||||
| Norfolk Southern Corp. 4.55% 6/1/2053 | 2,321 | 2,169 | ||||||
| Northrop Grumman Corp. 3.25% 1/15/2028 | 8,995 | 8,549 | ||||||
| Otis Worldwide Corp. 2.293% 4/5/2027 | 2,440 | 2,239 | ||||||
| PGT Innovations, Inc. 4.375% 10/1/20298 | 19,090 | 16,497 | ||||||
| Raytheon Technologies Corp. 1.90% 9/1/2031 | 7,500 | 6,117 | ||||||
| Roller Bearing Company of America, Inc. 4.375% 10/15/20298 | 3,060 | 2,761 | ||||||
| Rolls-Royce PLC 5.75% 10/15/20278 | 35,800 | 34,862 | ||||||
| Sensata Technologies Holding BV 4.00% 4/15/20298 | 19,310 | 17,361 | ||||||
| Sensata Technologies, Inc. 3.75% 2/15/20318 | 7,225 | 6,143 | ||||||
| Siemens AG 1.20% 3/11/20268 | 20,585 | 18,642 | ||||||
| Siemens AG 1.70% 3/11/20288 | 11,475 | 10,171 | ||||||
| SkyMiles IP, Ltd. 4.75% 10/20/20288 | 36,495 | 35,579 | ||||||
| Spirit AeroSystems, Inc. 9.375% 11/30/20298 | 9,998 | 10,878 | ||||||
| Stericycle, Inc. 3.875% 1/15/20298 | 29,450 | 26,167 | ||||||
| The Brink’s Co. 4.625% 10/15/20278 | 12,800 | 11,957 | ||||||
| TransDigm, Inc. 6.25% 3/15/20268 | 61,602 | 61,650 | ||||||
| TransDigm, Inc. 5.50% 11/15/2027 | 55,399 | 52,967 | ||||||
| TransDigm, Inc. 4.625% 1/15/2029 | 9,870 | 8,918 | ||||||
| Triton Container International, Ltd. 1.15% 6/7/20248 | 3,938 | 3,682 | ||||||
| Triton Container International, Ltd. 3.15% 6/15/20318 | 7,222 | 5,814 | ||||||
| Triumph Group, Inc. 8.875% 6/1/20248 | 18,608 | 18,913 | ||||||
| Triumph Group, Inc. 6.25% 9/15/20248 | 40,765 | 39,407 | ||||||
| Triumph Group, Inc. 7.75% 8/15/2025 | 33,535 | 28,530 | ||||||
| Uber Technologies, Inc. 8.00% 11/1/20268 | 22,165 | 22,713 | ||||||
| Union Pacific Corp. 3.75% 7/15/2025 | 4,720 | 4,643 | ||||||
| Union Pacific Corp. 2.40% 2/5/2030 | 1,931 | 1,702 | ||||||
| Union Pacific Corp. 2.891% 4/6/2036 | 3,245 | 2,713 | ||||||
| Union Pacific Corp. 2.95% 3/10/2052 | 5,000 | 3,632 | ||||||
| United Airlines, Inc. 4.375% 4/15/20268 | 7,700 | 7,319 | ||||||
| United Airlines, Inc. 4.625% 4/15/20298 | 18,680 | 17,068 | ||||||
| United Rentals, Inc. 5.25% 1/15/2030 | 6,840 | 6,627 | ||||||
| United Rentals, Inc. 3.875% 2/15/2031 | 8,600 | 7,580 | ||||||
| United Rentals, Inc. 3.75% 1/15/2032 | 4,750 | 4,114 | ||||||
| United Technologies Corp. 3.95% 8/16/2025 | 5,290 | 5,223 | ||||||
| Vertical U.S. Newco, Inc. 5.25% 7/15/20278 | 9,075 | 8,412 | ||||||
| Virgin Australia Holdings, Ltd. 7.875% 10/15/20218,12 | 1,750 | 10 | ||||||
| WESCO Distribution, Inc. 7.125% 6/15/20258 | 5,905 | 6,007 | ||||||
| WESCO Distribution, Inc. 7.25% 6/15/20288 | 6,435 | 6,601 | ||||||
| Westinghouse Air Brake Technologies Corp. 4.40% 3/15/202410 | 1,491 | 1,472 | ||||||
| 1,797,463 | ||||||||
| Materials 1.12% | ||||||||
| Air Products and Chemicals, Inc. 1.85% 5/15/2027 | 1,857 | 1,693 | ||||||
| Alcoa Nederland Holding BV 5.50% 12/15/20278 | 13,410 | 13,273 | ||||||
| Alcoa Nederland Holding BV 4.125% 3/31/20298 | 6,725 | 6,237 | ||||||
| Allegheny Technologies, Inc. 4.875% 10/1/2029 | 30,055 | 27,536 | ||||||
| Allegheny Technologies, Inc. 5.125% 10/1/2031 | 15,485 | 14,088 | ||||||
| Anglo American Capital PLC 2.25% 3/17/20288 | 6,553 | 5,737 | ||||||
| The Income Fund of America | 23 |
| Bonds, notes & other debt instruments (continued) | Principal amount (000) | Value (000) | ||||||
| Corporate bonds, notes & loans (continued) | ||||||||
| Materials (continued) | ||||||||
| Anglo American Capital PLC 2.625% 9/10/20308 | USD | 16,107 | $ | 13,700 | ||||
| Arconic Corp. 6.00% 5/15/20258 | 10,820 | 10,740 | ||||||
| Arconic Rolled Products Corp. 6.125% 2/15/20288 | 3,300 | 3,175 | ||||||
| Ardagh Group SA 6.50% Cash 6/30/20278,9 | 16,497 | 12,965 | ||||||
| Ardagh Metal Packaging Finance USA, LLC 4.00% 9/1/20298 | 13,540 | 11,217 | ||||||
| Avient Corp. 7.125% 8/1/20308 | 6,900 | 6,960 | ||||||
| Axalta Coating Systems, LLC 4.75% 6/15/20278 | 14,076 | 13,318 | ||||||
| Ball Corp. 6.875% 3/15/2028 | 30,745 | 31,748 | ||||||
| Ball Corp. 3.125% 9/15/2031 | 20,755 | 17,001 | ||||||
| CAN-PACK SA 3.875% 11/15/20298 | 17,050 | 14,178 | ||||||
| Celanese US Holdings, LLC 6.165% 7/15/2027 | 24,000 | 24,326 | ||||||
| Celanese US Holdings, LLC 6.379% 7/15/2032 | 5,829 | 5,877 | ||||||
| Cleveland-Cliffs, Inc. 7.00% 3/15/2027 | 1,300 | 1,293 | ||||||
| Cleveland-Cliffs, Inc. 5.875% 6/1/2027 | 58,860 | 57,959 | ||||||
| Cleveland-Cliffs, Inc. 4.625% 3/1/20298 | 34,930 | 32,614 | ||||||
| Cleveland-Cliffs, Inc. 4.875% 3/1/20318 | 8,989 | 8,408 | ||||||
| CRH America, Inc. 5.125% 5/18/20458 | 350 | 339 | ||||||
| CVR Partners, LP 6.125% 6/15/20288 | 12,450 | 11,286 | ||||||
| Dow Chemical Co. 3.60% 11/15/2050 | 13,746 | 10,669 | ||||||
| Element Solutions, Inc. 3.875% 9/1/20288 | 21,085 | 18,687 | ||||||
| First Quantum Minerals, Ltd. 6.50% 3/1/20248 | 35,546 | 35,539 | ||||||
| First Quantum Minerals, Ltd. 7.50% 4/1/20258 | 81,086 | 79,945 | ||||||
| First Quantum Minerals, Ltd. 6.875% 3/1/20268 | 56,614 | 55,123 | ||||||
| First Quantum Minerals, Ltd. 6.875% 10/15/20278 | 110,196 | 106,965 | ||||||
| FXI Holdings, Inc. 7.875% 11/1/20248 | 40,869 | 36,900 | ||||||
| FXI Holdings, Inc. 12.25% 11/15/20268 | 37,412 | 33,905 | ||||||
| GPC Merger Sub, Inc. 7.125% 8/15/20288 | 13,485 | 11,809 | ||||||
| International Flavors & Fragrances, Inc. 1.832% 10/15/20278 | 3,375 | 2,923 | ||||||
| Kaiser Aluminum Corp. 4.625% 3/1/20288 | 20,295 | 18,550 | ||||||
| Labl, Inc. 8.25% 11/1/20298 | 14,070 | 11,828 | ||||||
| LSB Industries, Inc. 6.25% 10/15/20288 | 21,205 | 19,133 | ||||||
| LYB International Finance III, LLC 2.25% 10/1/2030 | 2,924 | 2,436 | ||||||
| LYB International Finance III, LLC 3.625% 4/1/2051 | 36,739 | 26,981 | ||||||
| LYB International Finance III, LLC 3.80% 10/1/2060 | 4,106 | 2,960 | ||||||
| Mauser Packaging Solutions Holding Company 5.50% 4/15/20248 | 9,890 | 9,895 | ||||||
| Mauser Packaging Solutions Holding Company 7.875% 8/15/20268 | 15,535 | 15,690 | ||||||
| Methanex Corp. 5.125% 10/15/2027 | 90,595 | 86,404 | ||||||
| Mineral Resources, Ltd. 8.50% 5/1/20308 | 30,090 | 31,127 | ||||||
| Nova Chemicals Corp. 4.25% 5/15/20298 | 23,100 | 19,838 | ||||||
| Novelis Corp. 4.75% 1/30/20308 | 27,653 | 25,068 | ||||||
| Novelis Corp. 3.875% 8/15/20318 | 21,782 | 18,417 | ||||||
| Nutrien, Ltd. 1.90% 5/13/2023 | 7,974 | 7,904 | ||||||
| Praxair, Inc. 1.10% 8/10/2030 | 4,407 | 3,533 | ||||||
| SCIH Salt Holdings, Inc. 4.875% 5/1/20288 | 54,585 | 48,106 | ||||||
| SCIH Salt Holdings, Inc. 6.625% 5/1/20298 | 28,925 | 24,779 | ||||||
| Scotts Miracle-Gro Co. 4.50% 10/15/2029 | 18,840 | 16,274 | ||||||
| Scotts Miracle-Gro Co. 4.375% 2/1/2032 | 21,605 | 17,636 | ||||||
| Sealed Air Corp. 4.00% 12/1/20278 | 19,239 | 17,821 | ||||||
| Sealed Air Corp. 6.125% 2/1/20288 | 28,890 | 29,176 | ||||||
| Sherwin-Williams Company 3.80% 8/15/2049 | 10,414 | 8,308 | ||||||
| Silgan Holdings, Inc. 4.125% 2/1/2028 | 12,714 | 11,887 | ||||||
| South32 Treasury, Ltd. 4.35% 4/14/20328 | 2,793 | 2,518 | ||||||
| SPCM SA 3.375% 3/15/20308 | 3,990 | 3,382 | ||||||
| Summit Materials, LLC 6.50% 3/15/20278 | 9,760 | 9,741 | ||||||
| Summit Materials, LLC 5.25% 1/15/20298 | 12,425 | 11,682 | ||||||
| Trivium Packaging BV 5.50% 8/15/20268 | 6,997 | 6,726 | ||||||
| Trivium Packaging BV 8.50% 8/15/20278 | 5,615 | 5,409 | ||||||
| Valvoline, Inc. 4.25% 2/15/20308 | 11,680 | 11,498 | ||||||
| Valvoline, Inc. 3.625% 6/15/20318 | 14,104 | 11,886 | ||||||
| Venator Finance SARL 9.50% 7/1/20258 | 27,717 | 22,035 | ||||||
| Venator Finance SARL 5.75% 7/15/20258 | 59,725 | 21,130 | ||||||
| Venator Finance SARL, Term Loan, (3-month USD-LIBOR + 3.00%) 7.73% 8/8/20247,11 | 3,241 | 2,597 | ||||||
| W. R. Grace Holdings, LLC 5.625% 8/15/20298 | 9,455 | 7,904 | ||||||
| Warrior Met Coal, Inc. 7.875% 12/1/20288 | 40,810 | 40,259 | ||||||
| Westlake Chemical Corp. 5.00% 8/15/2046 | 350 | 316 | ||||||
| Westlake Chemical Corp. 4.375% 11/15/2047 | 300 | 248 | ||||||
| 1,369,215 | ||||||||
| 24 | The Income Fund of America |
| Bonds, notes & other debt instruments (continued) | Principal amount (000) | Value (000) | ||||||
| Corporate bonds, notes & loans (continued) | ||||||||
| Utilities 0.93% | ||||||||
| Abu Dhabi National Energy Company PJSC (TAQA) 4.375% 4/23/20258 | USD | 5,800 | $ | 5,775 | ||||
| Abu Dhabi National Energy Company PJSC (TAQA) 4.375% 6/22/20268 | 200 | 200 | ||||||
| AEP Transmission Co., LLC 3.65% 4/1/2050 | 250 | 206 | ||||||
| AES Corp. 3.30% 7/15/20258 | 17,950 | 17,140 | ||||||
| American Electric Power Company, Inc. 4.30% 12/1/2028 | 3,300 | 3,230 | ||||||
| American Water Cap Corp. 2.80% 5/1/2030 | 1,200 | 1,074 | ||||||
| AmeriGas Partners, LP 5.50% 5/20/2025 | 6,850 | 6,653 | ||||||
| Baltimore Gas & Electric 4.55% 6/1/2052 | 1,950 | 1,840 | ||||||
| Calpine Corp. 5.125% 3/15/20288 | 12,315 | 11,166 | ||||||
| Calpine Corp. 3.75% 3/1/20318 | 12,570 | 10,496 | ||||||
| Colbun SA 3.95% 10/11/20278 | 1,554 | 1,475 | ||||||
| Comisión Federal de Electricidad 4.688% 5/15/20298 | 14,525 | 13,427 | ||||||
| Commonwealth Edison Co. 3.85% 3/15/2052 | 5,225 | 4,448 | ||||||
| Consolidated Edison Company of New York, Inc. 3.60% 6/15/2061 | 8,390 | 6,545 | ||||||
| Dominion Resources, Inc., junior subordinated, 3.071% 8/15/202410 | 2,550 | 2,475 | ||||||
| Duke Energy Corp. 4.50% 8/15/2032 | 12,550 | 12,233 | ||||||
| Duke Energy Corp. 3.50% 6/15/2051 | 4,500 | 3,405 | ||||||
| Duke Energy Indiana, Inc. 4.90% 7/15/2043 | 14,785 | 14,772 | ||||||
| Duke Energy Indiana, Inc. 3.25% 10/1/2049 | 3,100 | 2,310 | ||||||
| Duke Energy Progress, Inc. 4.15% 12/1/2044 | 2,110 | 1,879 | ||||||
| Edison International 3.55% 11/15/2024 | 20,475 | 19,934 | ||||||
| Edison International 4.95% 4/15/2025 | 400 | 398 | ||||||
| Edison International 5.75% 6/15/2027 | 6,745 | 6,919 | ||||||
| Edison International 4.125% 3/15/2028 | 5,866 | 5,579 | ||||||
| Edison International 6.95% 11/15/2029 | 1,650 | 1,793 | ||||||
| EDP Finance BV 3.625% 7/15/20248 | 10,175 | 9,994 | ||||||
| Electricité de France SA 4.75% 10/13/20358 | 8,250 | 7,379 | ||||||
| Electricité de France SA 4.875% 9/21/20388 | 1,750 | 1,547 | ||||||
| Emera US Finance, LP 0.833% 6/15/2024 | 1,675 | 1,575 | ||||||
| Emera US Finance, LP 2.639% 6/15/2031 | 2,100 | 1,713 | ||||||
| Emera, Inc. 6.75% 6/15/2076 (3-month USD-LIBOR + 5.44% on 6/15/2026)10 | 36,024 | 35,515 | ||||||
| Empresa Nacional de Electricidad SA 4.25% 4/15/2024 | 900 | 893 | ||||||
| Enel Società per Azioni 8.75% 9/24/2073 (USD Semi Annual 30/360 (vs. 3-month USD-LIBOR) + 5.88% on 9/24/2023)8,10 | 37,337 | 37,655 | ||||||
| Entergy Corp. 2.80% 6/15/2030 | 6,650 | 5,795 | ||||||
| Entergy Louisiana, LLC 4.20% 9/1/2048 | 5,125 | 4,551 | ||||||
| Eversource Energy 3.80% 12/1/2023 | 4,095 | 4,054 | ||||||
| FirstEnergy Corp. 1.60% 1/15/2026 | 989 | 889 | ||||||
| FirstEnergy Corp. 3.50% 4/1/20288 | 2,500 | 2,339 | ||||||
| FirstEnergy Corp. 4.10% 5/15/20288 | 1,325 | 1,279 | ||||||
| FirstEnergy Corp. 2.65% 3/1/2030 | 2,500 | 2,139 | ||||||
| FirstEnergy Corp. 2.25% 9/1/2030 | 900 | 740 | ||||||
| FirstEnergy Corp. 3.40% 3/1/2050 | 15,250 | 10,852 | ||||||
| FirstEnergy Corp., Series B, 4.15% 7/15/2027 (4.15% on 1/15/2023)10 | 49,187 | 47,067 | ||||||
| FirstEnergy Transmission, LLC 2.866% 9/15/20288 | 10,750 | 9,641 | ||||||
| Georgia Power Co. 2.65% 9/15/2029 | 450 | 397 | ||||||
| Georgia Power Co. 3.70% 1/30/2050 | 1,862 | 1,485 | ||||||
| Gulf Power Co. 3.30% 5/30/2027 | 600 | 576 | ||||||
| Interstate Power and Light Co. 3.25% 12/1/2024 | 3,250 | 3,161 | ||||||
| Israel Electric Corp., Ltd. 8.10% 12/15/20968 | 4,905 | 5,824 | ||||||
| Jersey Central Power & Light Co. 2.75% 3/1/20328 | 1,025 | 868 | ||||||
| Mississippi Power Co. 3.95% 3/30/2028 | 6,437 | 6,212 | ||||||
| Mississippi Power Co. 4.25% 3/15/2042 | 2,550 | 2,207 | ||||||
| Monongahela Power Co. 3.55% 5/15/20278 | 2,550 | 2,442 | ||||||
| Northern States Power Co. 3.20% 4/1/2052 | 4,715 | 3,626 | ||||||
| Pacific Gas and Electric Co. 4.25% 8/1/2023 | 10,400 | 10,355 | ||||||
| Pacific Gas and Electric Co. 1.70% 11/15/2023 | 6,950 | 6,770 | ||||||
| Pacific Gas and Electric Co. 3.85% 11/15/2023 | 8,710 | 8,616 | ||||||
| Pacific Gas and Electric Co. 3.40% 8/15/2024 | 4,510 | 4,383 | ||||||
| Pacific Gas and Electric Co. 3.50% 6/15/2025 | 1,498 | 1,427 | ||||||
| Pacific Gas and Electric Co. 3.15% 1/1/2026 | 43,225 | 40,944 | ||||||
| Pacific Gas and Electric Co. 2.95% 3/1/2026 | 22,350 | 20,882 | ||||||
| Pacific Gas and Electric Co. 3.30% 3/15/2027 | 10,999 | 10,177 | ||||||
| Pacific Gas and Electric Co. 2.10% 8/1/2027 | 1,034 | 908 | ||||||
| Pacific Gas and Electric Co. 3.30% 12/1/2027 | 28,000 | 25,606 | ||||||
| Pacific Gas and Electric Co. 3.00% 6/15/2028 | 7,415 | 6,635 | ||||||
| Pacific Gas and Electric Co. 3.75% 7/1/2028 | 16,225 | 14,924 | ||||||
| The Income Fund of America | 25 |
| Bonds, notes & other debt instruments (continued) | Principal amount (000) | Value (000) | ||||||
| Corporate bonds, notes & loans (continued) | ||||||||
| Utilities (continued) | ||||||||
| Pacific Gas and Electric Co. 4.65% 8/1/2028 | USD | 10,211 | $ | 9,702 | ||||
| Pacific Gas and Electric Co. 4.55% 7/1/2030 | 64,037 | 59,790 | ||||||
| Pacific Gas and Electric Co. 2.50% 2/1/2031 | 28,189 | 22,769 | ||||||
| Pacific Gas and Electric Co. 3.25% 6/1/2031 | 5,850 | 4,971 | ||||||
| Pacific Gas and Electric Co. 6.15% 1/15/2033 | 6,150 | 6,328 | ||||||
| Pacific Gas and Electric Co. 3.30% 8/1/2040 | 4,050 | 2,912 | ||||||
| Pacific Gas and Electric Co. 3.75% 8/15/2042 | 17,045 | 12,435 | ||||||
| Pacific Gas and Electric Co. 3.50% 8/1/2050 | 5,080 | 3,436 | ||||||
| PacifiCorp 3.30% 3/15/2051 | 1,150 | 893 | ||||||
| PacifiCorp, First Mortgage Bonds, 4.125% 1/15/2049 | 11,000 | 9,699 | ||||||
| PG&E Corp. 5.00% 7/1/2028 | 46,990 | 44,091 | ||||||
| PG&E Corp. 5.25% 7/1/2030 | 49,330 | 45,446 | ||||||
| Progress Energy, Inc. 7.00% 10/30/2031 | 4,000 | 4,508 | ||||||
| Public Service Electric and Gas Co. 3.15% 1/1/2050 | 1,950 | 1,501 | ||||||
| Southern California Edison Co. 1.10% 4/1/2024 | 5,000 | 4,777 | ||||||
| Southern California Edison Co. 3.70% 8/1/2025 | 450 | 438 | ||||||
| Southern California Edison Co. 4.70% 6/1/2027 | 1,259 | 1,266 | ||||||
| Southern California Edison Co. 4.20% 3/1/2029 | 14,250 | 13,889 | ||||||
| Southern California Edison Co. 2.85% 8/1/2029 | 8,900 | 7,963 | ||||||
| Southern California Edison Co. 2.25% 6/1/2030 | 754 | 645 | ||||||
| Southern California Edison Co. 2.75% 2/1/2032 | 5,656 | 4,900 | ||||||
| Southern California Edison Co. 5.75% 4/1/2035 | 4,400 | 4,657 | ||||||
| Southern California Edison Co. 5.35% 7/15/2035 | 17,725 | 18,139 | ||||||
| Southern California Edison Co. 5.625% 2/1/2036 | 16,750 | 17,248 | ||||||
| Southern California Edison Co. 5.55% 1/15/2037 | 3,556 | 3,681 | ||||||
| Southern California Edison Co. 5.95% 2/1/2038 | 9,331 | 10,015 | ||||||
| Southern California Edison Co. 4.50% 9/1/2040 | 19,690 | 17,892 | ||||||
| Southern California Edison Co. 4.00% 4/1/2047 | 15,392 | 12,943 | ||||||
| Southern California Edison Co. 4.125% 3/1/2048 | 11,242 | 9,575 | ||||||
| Southern California Edison Co. 3.65% 2/1/2050 | 8,826 | 6,950 | ||||||
| Southern California Edison Co. 3.45% 2/1/2052 | 2,181 | 1,665 | ||||||
| Southern California Edison Co., Series C, 3.60% 2/1/2045 | 11,875 | 9,184 | ||||||
| Southern Co. 4.25% 7/1/2036 | 1,300 | 1,198 | ||||||
| Southern Co. 4.40% 7/1/2046 | 2,100 | 1,883 | ||||||
| Southwestern Electric Power Co. 1.65% 3/15/2026 | 5,075 | 4,616 | ||||||
| Talen Energy Corp. 10.50% 1/15/20268,12 | 10,925 | 4,179 | ||||||
| Talen Energy Corp. 7.25% 5/15/20278 | 84,119 | 87,655 | ||||||
| Talen Energy Corp., Term Loan, (3-month USD CME Term SOFR + 4.75%) 9.008% 11/13/20237,11 | 68,515 | 69,029 | ||||||
| Talen Energy Corp., Term Loan B, (3-month USD-LIBOR + 3.75%) 7.821% 7/8/20267,11 | 29,286 | 29,799 | ||||||
| Talen Energy Supply, LLC 7.625% 6/1/20288 | 9,340 | 9,770 | ||||||
| Venture Global Calcasieu Pass, LLC 3.875% 8/15/20298 | 20,300 | 18,097 | ||||||
| Virginia Electric and Power Co. 2.40% 3/30/2032 | 5,125 | 4,330 | ||||||
| Wisconsin Power and Light Co. 3.65% 4/1/2050 | 350 | 276 | ||||||
| Xcel Energy, Inc. 1.75% 3/15/2027 | 2,900 | 2,611 | ||||||
| Xcel Energy, Inc. 2.60% 12/1/2029 | 3,500 | 3,076 | ||||||
| Xcel Energy, Inc. 2.35% 11/15/2031 | 2,525 | 2,102 | ||||||
| 1,132,343 | ||||||||
| Consumer staples 0.61% | ||||||||
| 7-Eleven, Inc. 0.80% 2/10/20248 | 11,565 | 11,060 | ||||||
| 7-Eleven, Inc. 0.95% 2/10/20268 | 4,700 | 4,202 | ||||||
| 7-Eleven, Inc. 1.30% 2/10/20288 | 6,710 | 5,718 | ||||||
| Albertsons Companies, Inc. 3.50% 3/15/20298 | 10,585 | 9,146 | ||||||
| Altria Group, Inc. 5.80% 2/14/2039 | 16,525 | 15,944 | ||||||
| Altria Group, Inc. 3.40% 2/4/2041 | 8,500 | 5,989 | ||||||
| Altria Group, Inc. 3.875% 9/16/2046 | 3,347 | 2,379 | ||||||
| Altria Group, Inc. 5.95% 2/14/2049 | 11,583 | 10,966 | ||||||
| Altria Group, Inc. 3.70% 2/4/2051 | 15,160 | 10,136 | ||||||
| Anheuser-Busch InBev NV 4.00% 4/13/2028 | 8,025 | 7,888 | ||||||
| Anheuser-Busch InBev NV 4.95% 1/15/2042 | 9,095 | 9,068 | ||||||
| Anheuser-Busch InBev NV 4.60% 4/15/2048 | 700 | 663 | ||||||
| Anheuser-Busch InBev NV 5.55% 1/23/2049 | 3,550 | 3,813 | ||||||
| Anheuser-Busch InBev NV 4.50% 6/1/2050 | 3,400 | 3,234 | ||||||
| B&G Foods, Inc. 5.25% 4/1/2025 | 13,940 | 12,720 | ||||||
| B&G Foods, Inc. 5.25% 9/15/2027 | 21,515 | 17,429 | ||||||
| British American Tobacco International Finance PLC 3.95% 6/15/20258 | 13,039 | 12,681 | ||||||
| 26 | The Income Fund of America |
| Bonds, notes & other debt instruments (continued) | Principal amount (000) | Value (000) | ||||||
| Corporate bonds, notes & loans (continued) | ||||||||
| Consumer staples (continued) | ||||||||
| British American Tobacco International Finance PLC 1.668% 3/25/2026 | USD | 8,990 | $ | 8,118 | ||||
| British American Tobacco PLC 3.222% 8/15/2024 | 8,000 | 7,784 | ||||||
| British American Tobacco PLC 3.215% 9/6/2026 | 8,308 | 7,830 | ||||||
| British American Tobacco PLC 3.557% 8/15/2027 | 1,479 | 1,381 | ||||||
| British American Tobacco PLC 4.448% 3/16/2028 | 8,000 | 7,662 | ||||||
| British American Tobacco PLC 2.259% 3/25/2028 | 9,610 | 8,270 | ||||||
| British American Tobacco PLC 4.742% 3/16/2032 | 8,000 | 7,402 | ||||||
| British American Tobacco PLC 4.39% 8/15/2037 | 3,455 | 2,842 | ||||||
| British American Tobacco PLC 4.54% 8/15/2047 | 26,358 | 20,122 | ||||||
| British American Tobacco PLC 4.758% 9/6/2049 | 13,160 | 10,327 | ||||||
| British American Tobacco PLC 5.282% 4/2/2050 | 1,700 | 1,432 | ||||||
| British American Tobacco PLC 3.984% 9/25/2050 | 7,549 | 5,322 | ||||||
| Central Garden & Pet Co. 4.125% 10/15/2030 | 22,866 | 19,466 | ||||||
| Central Garden & Pet Co. 4.125% 4/30/20318 | 14,745 | 12,385 | ||||||
| Conagra Brands, Inc. 1.375% 11/1/2027 | 2,000 | 1,713 | ||||||
| Conagra Brands, Inc. 4.85% 11/1/2028 | 14,860 | 14,900 | ||||||
| Constellation Brands, Inc. 2.25% 8/1/2031 | 4,463 | 3,685 | ||||||
| Coty, Inc. 5.00% 4/15/20268 | 2,000 | 1,917 | ||||||
| Coty, Inc. 4.75% 1/15/20298 | 14,380 | 13,067 | ||||||
| Darling Ingredients, Inc. 5.25% 4/15/20278 | 19,295 | 18,840 | ||||||
| Darling Ingredients, Inc. 6.00% 6/15/20308 | 10,885 | 10,844 | ||||||
| Edgewell Personal Care Co. 5.50% 6/1/20288 | 2,445 | 2,318 | ||||||
| Energizer Holdings, Inc. 4.375% 3/31/20298 | 14,640 | 12,733 | ||||||
| Imperial Tobacco Finance PLC 6.125% 7/27/20278 | 4,745 | 4,875 | ||||||
| Ingles Markets, Inc. 4.00% 6/15/20318 | 21,200 | 18,292 | ||||||
| JBS USA Lux SA 2.50% 1/15/20278 | 12,702 | 11,329 | ||||||
| JBS USA Lux SA 3.00% 2/2/20298 | 9,210 | 7,917 | ||||||
| JBS USA Lux SA 5.50% 1/15/20308 | 1,120 | 1,090 | ||||||
| JBS USA Lux SA 3.625% 1/15/20328 | 5,113 | 4,278 | ||||||
| JBS USA Lux SA 3.00% 5/15/20328 | 9,000 | 7,146 | ||||||
| JBS USA Lux SA 5.75% 4/1/20338 | 27,150 | 26,690 | ||||||
| Kronos Acquisition Holdings, Inc. 5.00% 12/31/20268 | 26,587 | 24,168 | ||||||
| Kronos Acquisition Holdings, Inc. 7.00% 12/31/20278 | 15,070 | 13,154 | ||||||
| Lamb Weston Holdings, Inc. 4.125% 1/31/20308 | 33,025 | 29,809 | ||||||
| Nestle Skin Health SA, Term Loan B3, (3-month USD-LIBOR + 3.75%) 8.48% 10/1/20267,11 | 45,683 | 44,858 | ||||||
| PepsiCo, Inc. 2.625% 10/21/2041 | 12,500 | 9,757 | ||||||
| PepsiCo, Inc. 3.625% 3/19/2050 | 3,109 | 2,733 | ||||||
| PepsiCo, Inc. 2.75% 10/21/2051 | 6,891 | 5,117 | ||||||
| Performance Food Group, Inc. 5.50% 10/15/20278 | 12,980 | 12,510 | ||||||
| Performance Food Group, Inc. 4.25% 8/1/20298 | 12,645 | 11,300 | ||||||
| Philip Morris International, Inc. 0.875% 5/1/2026 | 10,101 | 9,011 | ||||||
| Philip Morris International, Inc. 5.125% 11/17/2027 | 6,947 | 7,104 | ||||||
| Philip Morris International, Inc. 5.625% 11/17/2029 | 3,350 | 3,501 | ||||||
| Philip Morris International, Inc. 1.75% 11/1/2030 | 9,986 | 8,043 | ||||||
| Post Holdings, Inc. 5.625% 1/15/20288 | 9,935 | 9,574 | ||||||
| Post Holdings, Inc. 5.50% 12/15/20298 | 20,825 | 19,336 | ||||||
| Post Holdings, Inc. 4.625% 4/15/20308 | 34,891 | 30,743 | ||||||
| Prestige Brands International, Inc. 5.125% 1/15/20288 | 8,162 | 7,805 | ||||||
| Prestige Brands International, Inc. 3.75% 4/1/20318 | 8,045 | 6,842 | ||||||
| Reynolds American, Inc. 5.70% 8/15/2035 | 3,130 | 2,999 | ||||||
| Reynolds American, Inc. 5.85% 8/15/2045 | 18,028 | 16,506 | ||||||
| Simmons Foods, Inc. 4.625% 3/1/20298 | 35,247 | 29,931 | ||||||
| US Foods, Inc. 4.625% 6/1/20308 | 12,455 | 11,165 | ||||||
| 740,979 | ||||||||
| Information technology 0.59% | ||||||||
| Almonde, Inc., Term Loan B, (3-month USD-LIBOR + 3.50%) 8.325% 6/13/20247,11 | 16,780 | 15,828 | ||||||
| Almonde, Inc., Term Loan, (3-month USD-LIBOR + 7.25%) 12.075% 6/13/20257,11 | 46,175 | 36,676 | ||||||
| Analog Devices, Inc. 1.70% 10/1/2028 | 4,459 | 3,890 | ||||||
| Analog Devices, Inc. 2.10% 10/1/2031 | 3,937 | 3,316 | ||||||
| Analog Devices, Inc. 2.80% 10/1/2041 | 8,586 | 6,665 | ||||||
| Analog Devices, Inc. 2.95% 10/1/2051 | 5,668 | 4,179 | ||||||
| Apple, Inc. 1.20% 2/8/2028 | 17,000 | 14,798 | ||||||
| Apple, Inc. 3.95% 8/8/2052 | 5,000 | 4,497 | ||||||
| Block, Inc. 3.50% 6/1/2031 | 14,380 | 12,029 | ||||||
| BMC Software, Inc., Term Loan, (3-month USD-LIBOR + 5.50%) 6.128% 3/31/20267,11 | 12,375 | 11,725 | ||||||
| The Income Fund of America | 27 |
| Bonds, notes & other debt instruments (continued) | Principal amount (000) | Value (000) | ||||||
| Corporate bonds, notes & loans (continued) | ||||||||
| Information technology (continued) | ||||||||
| Booz Allen Hamilton, Inc. 4.00% 7/1/20298 | USD | 17,037 | $ | 15,288 | ||||
| Broadcom Corp. 3.875% 1/15/2027 | 6,974 | 6,724 | ||||||
| Broadcom, Inc. 3.15% 11/15/2025 | 954 | 913 | ||||||
| Broadcom, Inc. 4.00% 4/15/20298 | 17,110 | 16,055 | ||||||
| Broadcom, Inc. 4.15% 4/15/20328 | 5,623 | 5,136 | ||||||
| Broadcom, Inc. 2.60% 2/15/20338 | 8,573 | 6,742 | ||||||
| Broadcom, Inc. 3.419% 4/15/20338 | 3,146 | 2,642 | ||||||
| Broadcom, Inc. 3.469% 4/15/20348 | 40,849 | 33,899 | ||||||
| Broadcom, Inc. 3.137% 11/15/20358 | 8,274 | 6,430 | ||||||
| Broadcom, Inc. 3.187% 11/15/20368 | 5,718 | 4,377 | ||||||
| Broadcom, Inc. 4.926% 5/15/20378 | 9,351 | 8,593 | ||||||
| CDK Global, Inc. 7.25% 6/15/20298 | 14,625 | 14,606 | ||||||
| CommScope Finance, LLC 6.00% 3/1/20268 | 31,931 | 30,611 | ||||||
| CommScope Finance, LLC 8.25% 3/1/20278 | 25,331 | 21,582 | ||||||
| CommScope Technologies, LLC 6.00% 6/15/20258 | 1,460 | 1,384 | ||||||
| CommScope Technologies, LLC 5.00% 3/15/20278 | 5,800 | 4,436 | ||||||
| CommScope, Inc. 7.125% 7/1/20288 | 12,619 | 9,901 | ||||||
| Diebold Nixdorf, Inc. 9.375% 7/15/20258 | 88,594 | 58,363 | ||||||
| Diebold Nixdorf, Inc., units, 8.50% PIK or 8.50% Cash 10/15/20268,9 | 55,774 | 28,584 | ||||||
| Diebold Nixdorf, Inc., Term Loan, (USD-SOFR + 5.25%) 6.75% 7/15/20257,11 | 38,484 | 25,015 | ||||||
| Diebold Nixdorf, Inc., Term Loan, (3-month USD CME Term SOFR + 6.40%) 10.887% 7/15/20257,11 | 36,605 | 37,795 | ||||||
| Entegris Escrow Corp. 4.75% 4/15/20298 | 9,145 | 8,584 | ||||||
| Entegris, Inc. 3.625% 5/1/20298 | 30,000 | 25,616 | ||||||
| Fair Isaac Corp. 4.00% 6/15/20288 | 22,105 | 20,553 | ||||||
| Fidelity National Information Services, Inc. 1.65% 3/1/2028 | 1,265 | 1,090 | ||||||
| Fidelity National Information Services, Inc. 2.25% 3/1/2031 | 3,420 | 2,807 | ||||||
| Fidelity National Information Services, Inc. 3.10% 3/1/2041 | 2,027 | 1,518 | ||||||
| Fiserv, Inc. 2.65% 6/1/2030 | 5,402 | 4,714 | ||||||
| Gartner, Inc. 4.50% 7/1/20288 | 17,125 | 16,290 | ||||||
| Gartner, Inc. 3.625% 6/15/20298 | 6,543 | 5,886 | ||||||
| Gartner, Inc. 3.75% 10/1/20308 | 5,300 | 4,704 | ||||||
| Mastercard, Inc. 2.00% 11/18/2031 | 10,603 | 8,907 | ||||||
| Microsoft Corp. 2.875% 2/6/2024 | 6,865 | 6,744 | ||||||
| Microsoft Corp. 2.921% 3/17/2052 | 6,000 | 4,594 | ||||||
| MoneyGram International, Inc. 5.375% 8/1/20268 | 5,870 | 5,976 | ||||||
| NCR Corp. 5.125% 4/15/20298 | 14,700 | 12,824 | ||||||
| Oracle Corp. 2.80% 4/1/2027 | 16,500 | 15,282 | ||||||
| PayPal Holdings, Inc. 2.65% 10/1/2026 | 1,207 | 1,139 | ||||||
| PayPal Holdings, Inc. 2.30% 6/1/2030 | 674 | 575 | ||||||
| Rocket Software, Inc. 6.50% 2/15/20298 | 13,500 | 11,274 | ||||||
| Sabre GLBL, Inc. 7.375% 9/1/20258 | 9,919 | 9,742 | ||||||
| Sabre GLBL, Inc. 11.25% 12/15/20278 | 9,492 | 10,067 | ||||||
| Sabre Holdings Corp. 9.25% 4/15/20258 | 23,525 | 24,168 | ||||||
| Simon Property Group, LP 3.50% 9/1/2025 | 3,750 | 3,643 | ||||||
| Simon Property Group, LP 2.65% 7/15/2030 | 4,100 | 3,563 | ||||||
| Synaptics, Inc. 4.00% 6/15/20298 | 3,700 | 3,209 | ||||||
| Tibco Software Inc., Term Loan A, (3-month USD CME Term SOFR + 4.50%) 9.18% 9/29/20287,11 | 19,930 | 18,336 | ||||||
| TSMC Global, Ltd. 4.375% 7/22/20278 | 2,935 | 2,946 | ||||||
| TSMC Global, Ltd. 4.625% 7/22/20328 | 3,326 | 3,380 | ||||||
| UKG, Inc., Term Loan, (3-month USD-LIBOR + 5.25%) 10.032% 5/3/20277,11 | 15,044 | 14,485 | ||||||
| Unisys Corp. 6.875% 11/1/20278 | 3,200 | 2,428 | ||||||
| VeriSign, Inc. 2.70% 6/15/2031 | 3,020 | 2,598 | ||||||
| Veritas US, Inc. 7.50% 9/1/20258 | 1,665 | 1,101 | ||||||
| Viavi Solutions, Inc. 3.75% 10/1/20298 | 4,675 | 4,085 | ||||||
| Visa, Inc. 3.15% 12/14/2025 | 8,000 | 7,773 | ||||||
| 723,280 | ||||||||
| Real estate 0.57% | ||||||||
| Alexandria Real Estate Equities, Inc. 3.95% 1/15/2028 | 975 | 938 | ||||||
| Alexandria Real Estate Equities, Inc. 2.75% 12/15/2029 | 4,851 | 4,258 | ||||||
| Alexandria Real Estate Equities, Inc. 3.375% 8/15/2031 | 2,375 | 2,154 | ||||||
| Alexandria Real Estate Equities, Inc. 1.875% 2/1/2033 | 7,073 | 5,474 | ||||||
| American Tower Corp. 1.45% 9/15/2026 | 9,408 | 8,340 | ||||||
| American Tower Corp. 3.55% 7/15/2027 | 2,525 | 2,386 | ||||||
| American Tower Corp. 2.30% 9/15/2031 | 2,500 | 2,027 | ||||||
| 28 | The Income Fund of America |
| Bonds, notes & other debt instruments (continued) | Principal amount (000) | Value (000) | ||||||
| Corporate bonds, notes & loans (continued) | ||||||||
| Real estate (continued) | ||||||||
| American Tower Corp. 2.95% 1/15/2051 | USD | 5,000 | $ | 3,299 | ||||
| Anywhere Real Estate Group, LLC 5.75% 1/15/20298 | 32,220 | 25,089 | ||||||
| Anywhere Real Estate Group, LLC 5.25% 4/15/20308 | 21,920 | 16,465 | ||||||
| Boston Properties, Inc. 6.75% 12/1/2027 | 25,000 | 26,487 | ||||||
| Brookfield Property REIT, Inc. 5.75% 5/15/20268 | 17,810 | 16,967 | ||||||
| Brookfield Property REIT, Inc. 4.50% 4/1/20278 | 7,860 | 6,912 | ||||||
| Corporate Office Properties, LP 2.75% 4/15/2031 | 7,219 | 5,642 | ||||||
| Equinix, Inc. 1.45% 5/15/2026 | 15,835 | 14,214 | ||||||
| Equinix, Inc. 3.40% 2/15/2052 | 828 | 614 | ||||||
| Essex Portfolio, LP 3.875% 5/1/2024 | 5,900 | 5,800 | ||||||
| Essex Portfolio, LP 3.50% 4/1/2025 | 1,920 | 1,866 | ||||||
| Extra Space Storage, Inc. 2.35% 3/15/2032 | 2,199 | 1,744 | ||||||
| GLP Capital, LP 3.35% 9/1/2024 | 2,526 | 2,441 | ||||||
| Hospitality Properties Trust 4.35% 10/1/2024 | 4,560 | 4,306 | ||||||
| Howard Hughes Corp. 5.375% 8/1/20288 | 62,215 | 57,709 | ||||||
| Howard Hughes Corp. 4.125% 2/1/20298 | 35,555 | 30,743 | ||||||
| Howard Hughes Corp. 4.375% 2/1/20318 | 61,765 | 51,395 | ||||||
| Invitation Homes Operating Partnership, LP 2.00% 8/15/2031 | 3,800 | 2,952 | ||||||
| Iron Mountain, Inc. 4.875% 9/15/20278 | 10,665 | 10,055 | ||||||
| Iron Mountain, Inc. 5.25% 3/15/20288 | 17,489 | 16,651 | ||||||
| Iron Mountain, Inc. 5.00% 7/15/20288 | 15,096 | 13,896 | ||||||
| Iron Mountain, Inc. 4.875% 9/15/20298 | 9,300 | 8,412 | ||||||
| Iron Mountain, Inc. 5.25% 7/15/20308 | 33,830 | 30,657 | ||||||
| Iron Mountain, Inc. 4.50% 2/15/20318 | 19,670 | 16,881 | ||||||
| Kennedy-Wilson Holdings, Inc. 4.75% 3/1/2029 | 56,615 | 47,636 | ||||||
| Kennedy-Wilson Holdings, Inc. 4.75% 2/1/2030 | 40,257 | 33,086 | ||||||
| Kennedy-Wilson Holdings, Inc. 5.00% 3/1/2031 | 53,703 | 43,886 | ||||||
| Ladder Capital Finance Holdings LLLP 5.25% 10/1/20258 | 4,494 | 4,330 | ||||||
| Ladder Capital Finance Holdings LLLP 4.25% 2/1/20278 | 22,719 | 20,059 | ||||||
| Medical Properties Trust, Inc. 5.00% 10/15/2027 | 6,300 | 5,333 | ||||||
| Medical Properties Trust, Inc. 3.50% 3/15/2031 | 5,178 | 3,632 | ||||||
| Park Intermediate Holdings, LLC 4.875% 5/15/20298 | 14,600 | 12,640 | ||||||
| Public Storage 1.85% 5/1/2028 | 8,037 | 7,089 | ||||||
| Public Storage 1.95% 11/9/2028 | 8,107 | 7,123 | ||||||
| Public Storage 2.30% 5/1/2031 | 6,742 | 5,753 | ||||||
| RHP Hotel Properties, LP 4.50% 2/15/20298 | 12,085 | 10,757 | ||||||
| RLJ Lodging Trust, LP 4.00% 9/15/20298 | 17,780 | 14,934 | ||||||
| Scentre Group 3.50% 2/12/20258 | 5,455 | 5,267 | ||||||
| Scentre Group 3.25% 10/28/20258 | 10,365 | 9,841 | ||||||
| Scentre Group 3.75% 3/23/20278 | 3,000 | 2,836 | ||||||
| Sun Communities Operating, LP 2.30% 11/1/2028 | 6,066 | 5,232 | ||||||
| Sun Communities Operating, LP 2.70% 7/15/2031 | 2,191 | 1,806 | ||||||
| VICI Properties, LP 3.50% 2/15/20258 | 1,320 | 1,258 | ||||||
| VICI Properties, LP 4.625% 6/15/20258 | 11,545 | 11,187 | ||||||
| VICI Properties, LP 3.875% 2/15/20298 | 14,460 | 13,045 | ||||||
| VICI Properties, LP 4.625% 12/1/20298 | 140 | 131 | ||||||
| VICI Properties, LP 4.125% 8/15/20308 | 14,885 | 13,334 | ||||||
| WeWork Companies, LLC 5.00% 7/10/20258 | 41,600 | 17,668 | ||||||
| 694,637 | ||||||||
| Total corporate bonds, notes & loans | 19,287,291 | |||||||
| Mortgage-backed obligations 4.26% | ||||||||
| Federal agency mortgage-backed obligations 3.94% | ||||||||
| Fannie Mae Pool #995265 5.50% 1/1/202413 | 1 | 1 | ||||||
| Fannie Mae Pool #932119 4.50% 11/1/202413 | 73 | 74 | ||||||
| Fannie Mae Pool #AD3149 4.50% 4/1/202513 | 34 | 35 | ||||||
| Fannie Mae Pool #AD6392 4.50% 5/1/202513 | 63 | 64 | ||||||
| Fannie Mae Pool #AD5692 4.50% 5/1/202513 | 36 | 37 | ||||||
| Fannie Mae Pool #AD6119 4.50% 6/1/202513 | 32 | 33 | ||||||
| Fannie Mae Pool #AD8191 4.00% 9/1/202513 | 49 | 49 | ||||||
| Fannie Mae Pool #AI6180 4.00% 7/1/202613 | 32 | 32 | ||||||
| Fannie Mae Pool #AL2940 3.50% 11/1/202713 | 137 | 136 | ||||||
| Fannie Mae Pool #AL8347 4.00% 3/1/202913 | 145 | 144 | ||||||
| Fannie Mae Pool #BM1231 3.50% 11/1/203113 | 131 | 129 | ||||||
| Fannie Mae Pool #BJ5674 3.00% 1/1/203313 | 155 | 151 | ||||||
| Fannie Mae Pool #254767 5.50% 6/1/203313 | 104 | 108 | ||||||
| Fannie Mae Pool #BJ6249 4.00% 9/1/203313 | 143 | 144 | ||||||
| The Income Fund of America | 29 |
| Bonds, notes & other debt instruments (continued) | Principal amount (000) | Value (000) | ||||||
| Mortgage-backed obligations (continued) | ||||||||
| Federal agency mortgage-backed obligations (continued) | ||||||||
| Fannie Mae Pool #MA3541 4.00% 12/1/203313 | USD | 139 | $ | 139 | ||||
| Fannie Mae Pool #BN1085 4.00% 1/1/203413 | 8 | 8 | ||||||
| Fannie Mae Pool #MA3611 4.00% 3/1/203413 | 59 | 59 | ||||||
| Fannie Mae Pool #735228 5.50% 2/1/203513 | 89 | 93 | ||||||
| Fannie Mae Pool #878099 6.00% 4/1/203613 | 124 | 131 | ||||||
| Fannie Mae Pool #880426 6.00% 4/1/203613 | 57 | 59 | ||||||
| Fannie Mae Pool #256308 6.00% 7/1/203613 | 140 | 148 | ||||||
| Fannie Mae Pool #888795 5.50% 11/1/203613 | 598 | 628 | ||||||
| Fannie Mae Pool #AS8554 3.00% 12/1/203613 | 11,109 | 10,629 | ||||||
| Fannie Mae Pool #BE4703 3.00% 12/1/203613 | 553 | 529 | ||||||
| Fannie Mae Pool #936999 6.00% 7/1/203713 | 338 | 351 | ||||||
| Fannie Mae Pool #945832 6.50% 8/1/203713 | 66 | 70 | ||||||
| Fannie Mae Pool #888637 6.00% 9/1/203713 | 921 | 974 | ||||||
| Fannie Mae Pool #950991 6.00% 10/1/203713 | 249 | 259 | ||||||
| Fannie Mae Pool #995674 6.00% 5/1/203813 | 507 | 537 | ||||||
| Fannie Mae Pool #929964 6.00% 9/1/203813 | 300 | 316 | ||||||
| Fannie Mae Pool #AE0967 3.50% 6/1/203913 | 85 | 82 | ||||||
| Fannie Mae Pool #AC0479 6.00% 9/1/203913 | 240 | 251 | ||||||
| Fannie Mae Pool #AE0443 6.50% 10/1/203913 | 108 | 115 | ||||||
| Fannie Mae Pool #932274 4.50% 12/1/203913 | 4,783 | 4,865 | ||||||
| Fannie Mae Pool #AD4927 5.00% 6/1/204013 | 1,321 | 1,359 | ||||||
| Fannie Mae Pool #AE4483 4.00% 9/1/204013 | 1,212 | 1,199 | ||||||
| Fannie Mae Pool #AE8073 4.00% 12/1/204013 | 105 | 104 | ||||||
| Fannie Mae Pool #AE0828 3.50% 2/1/204113 | 35 | 33 | ||||||
| Fannie Mae Pool #AB2470 4.50% 3/1/204113 | 15 | 16 | ||||||
| Fannie Mae Pool #AI3422 5.00% 5/1/204113 | 54 | 55 | ||||||
| Fannie Mae Pool #AI4836 5.00% 6/1/204113 | 47 | 48 | ||||||
| Fannie Mae Pool #MA4387 2.00% 7/1/204113 | 12,289 | 10,809 | ||||||
| Fannie Mae Pool #AI5571 5.00% 7/1/204113 | 44 | 45 | ||||||
| Fannie Mae Pool #AI8482 5.00% 8/1/204113 | 55 | 57 | ||||||
| Fannie Mae Pool #AJ0257 4.00% 9/1/204113 | 38 | 38 | ||||||
| Fannie Mae Pool #AJ4154 4.00% 11/1/204113 | 107 | 106 | ||||||
| Fannie Mae Pool #AB4050 4.00% 12/1/204113 | 205 | 203 | ||||||
| Fannie Mae Pool #AJ4189 4.00% 12/1/204113 | 121 | 120 | ||||||
| Fannie Mae Pool #FS0305 1.50% 1/1/204213 | 40,745 | 34,043 | ||||||
| Fannie Mae Pool #890407 4.00% 2/1/204213 | 281 | 279 | ||||||
| Fannie Mae Pool #AL2745 4.00% 3/1/204213 | 847 | 841 | ||||||
| Fannie Mae Pool #AB5377 3.50% 6/1/204213 | 12,353 | 11,935 | ||||||
| Fannie Mae Pool #AO9140 3.50% 7/1/204213 | 4,068 | 3,930 | ||||||
| Fannie Mae Pool #AU3742 3.50% 8/1/204313 | 8,000 | 7,724 | ||||||
| Fannie Mae Pool #AU8813 4.00% 11/1/204313 | 1,559 | 1,565 | ||||||
| Fannie Mae Pool #AU9348 4.00% 11/1/204313 | 1,097 | 1,101 | ||||||
| Fannie Mae Pool #AU9350 4.00% 11/1/204313 | 912 | 906 | ||||||
| Fannie Mae Pool #FM9416 3.50% 7/1/204513 | 85,888 | 82,028 | ||||||
| Fannie Mae Pool #AL8354 3.50% 10/1/204513 | 4,449 | 4,279 | ||||||
| Fannie Mae Pool #BC0157 3.50% 1/1/204613 | 20,536 | 19,708 | ||||||
| Fannie Mae Pool #AL8522 3.50% 5/1/204613 | 9,581 | 9,190 | ||||||
| Fannie Mae Pool #AS8310 3.00% 11/1/204613 | 1,578 | 1,480 | ||||||
| Fannie Mae Pool #BM1179 3.00% 4/1/204713 | 1,875 | 1,750 | ||||||
| Fannie Mae Pool #947661 6.50% 10/1/204713 | 33 | 33 | ||||||
| Fannie Mae Pool #947554 7.00% 10/1/204713 | 135 | 145 | ||||||
| Fannie Mae Pool #920015 7.00% 10/1/204713 | 34 | 37 | ||||||
| Fannie Mae Pool #CA0770 3.50% 11/1/204713 | 311 | 298 | ||||||
| Fannie Mae Pool #257036 7.00% 11/1/204713 | 9 | 10 | ||||||
| Fannie Mae Pool #CA0854 3.50% 12/1/204713 | 6,003 | 5,751 | ||||||
| Fannie Mae Pool #BM4413 4.50% 12/1/204713 | 3,461 | 3,499 | ||||||
| Fannie Mae Pool #CA1542 4.00% 4/1/204813 | 5,488 | 5,411 | ||||||
| Fannie Mae Pool #BF0293 3.00% 7/1/204813 | 9,028 | 8,303 | ||||||
| Fannie Mae Pool #BF0318 3.50% 8/1/204813 | 7,497 | 7,124 | ||||||
| Fannie Mae Pool #FM1784 4.00% 9/1/204813 | 7,694 | 7,554 | ||||||
| Fannie Mae Pool #CA3184 4.00% 3/1/204913 | 9,999 | 9,848 | ||||||
| Fannie Mae Pool #FM3280 3.50% 5/1/204913 | 22,420 | 21,425 | ||||||
| Fannie Mae Pool #CA3807 3.00% 7/1/204913 | 1,834 | 1,706 | ||||||
| Fannie Mae Pool #CA3806 3.00% 7/1/204913 | 1,197 | 1,116 | ||||||
| Fannie Mae Pool #CA3814 3.50% 7/1/204913 | 32,834 | 31,587 | ||||||
| Fannie Mae Pool #CA3976 4.00% 8/1/204913 | 57,519 | 56,402 | ||||||
| Fannie Mae Pool #FM1668 4.00% 8/1/204913 | 5,614 | 5,503 | ||||||
| 30 | The Income Fund of America |
| Bonds, notes & other debt instruments (continued) | Principal amount (000) | Value (000) | ||||||
| Mortgage-backed obligations (continued) | ||||||||
| Federal agency mortgage-backed obligations (continued) | ||||||||
| Fannie Mae Pool #CA4112 3.50% 9/1/204913 | USD | 37,078 | $ | 35,709 | ||||
| Fannie Mae Pool #FM1589 3.50% 9/1/204913 | 3,166 | 3,013 | ||||||
| Fannie Mae Pool #CA4432 4.00% 10/1/204913 | 6,394 | 6,266 | ||||||
| Fannie Mae Pool #FM1954 3.50% 11/1/204913 | 4,939 | 4,699 | ||||||
| Fannie Mae Pool #CA4756 3.00% 12/1/204913 | 22,311 | 20,652 | ||||||
| Fannie Mae Pool #CA4802 3.50% 12/1/204913 | 27,823 | 26,811 | ||||||
| Fannie Mae Pool #CA4804 3.50% 12/1/204913 | 24,416 | 23,453 | ||||||
| Fannie Mae Pool #FM2092 3.50% 12/1/204913 | 13,537 | 13,003 | ||||||
| Fannie Mae Pool #CA5659 2.50% 5/1/205013 | 396 | 349 | ||||||
| Fannie Mae Pool #CA5968 2.50% 6/1/205013 | 18,192 | 16,150 | ||||||
| Fannie Mae Pool #CA6593 2.50% 8/1/205013 | 802 | 717 | ||||||
| Fannie Mae Pool #CA7028 2.50% 9/1/205013 | 2,759 | 2,473 | ||||||
| Fannie Mae Pool #BN7466 2.00% 10/1/205013 | 145 | 123 | ||||||
| Fannie Mae Pool #CA7599 2.50% 11/1/205013 | 48,834 | 43,815 | ||||||
| Fannie Mae Pool #FM4897 3.00% 11/1/205013 | 31,430 | 29,333 | ||||||
| Fannie Mae Pool #MA4208 2.00% 12/1/205013 | 48,112 | 40,718 | ||||||
| Fannie Mae Pool #CA8046 3.00% 12/1/205013 | 9,379 | 8,736 | ||||||
| Fannie Mae Pool #CA8285 3.00% 12/1/205013 | 3,029 | 2,823 | ||||||
| Fannie Mae Pool #CA8480 2.50% 1/1/205113 | 72,978 | 65,572 | ||||||
| Fannie Mae Pool #CA8828 2.50% 2/1/205113 | 44,554 | 39,613 | ||||||
| Fannie Mae Pool #CA9291 2.50% 2/1/205113 | 7,640 | 6,727 | ||||||
| Fannie Mae Pool #BR4996 2.50% 2/1/205113 | 254 | 224 | ||||||
| Fannie Mae Pool #CA9302 3.00% 2/1/205113 | 43,841 | 41,101 | ||||||
| Fannie Mae Pool #CA8969 3.00% 2/1/205113 | 3,987 | 3,662 | ||||||
| Fannie Mae Pool #CA8968 3.00% 2/1/205113 | 783 | 720 | ||||||
| Fannie Mae Pool #CB0290 2.00% 4/1/205113 | 15,629 | 13,219 | ||||||
| Fannie Mae Pool #BN9135 2.50% 4/1/205113 | 1,909 | 1,683 | ||||||
| Fannie Mae Pool #FM6871 2.50% 4/1/205113 | 211 | 186 | ||||||
| Fannie Mae Pool #BR7222 2.50% 4/1/205113 | 87 | 76 | ||||||
| Fannie Mae Pool #MA4325 2.00% 5/1/205113 | 195,875 | 165,575 | ||||||
| Fannie Mae Pool #BR9366 2.50% 5/1/205113 | 3,612 | 3,172 | ||||||
| Fannie Mae Pool #BT0971 2.50% 5/1/205113 | 1,704 | 1,499 | ||||||
| Fannie Mae Pool #CB0396 2.50% 5/1/205113 | 410 | 360 | ||||||
| Fannie Mae Pool #FM7304 2.50% 5/1/205113 | 281 | 247 | ||||||
| Fannie Mae Pool #CB0520 2.50% 5/1/205113 | 42 | 37 | ||||||
| Fannie Mae Pool #BR7857 2.50% 5/1/205113 | 35 | 31 | ||||||
| Fannie Mae Pool #FM7740 2.50% 6/1/205113 | 2,812 | 2,470 | ||||||
| Fannie Mae Pool #FM7873 2.00% 7/1/205113 | 13,075 | 11,045 | ||||||
| Fannie Mae Pool #CB1134 2.50% 7/1/205113 | 1,922 | 1,688 | ||||||
| Fannie Mae Pool #CB1131 2.50% 7/1/205113 | 22 | 19 | ||||||
| Fannie Mae Pool #BT4304 2.50% 8/1/205113 | 4,781 | 4,196 | ||||||
| Fannie Mae Pool #FM8422 2.50% 8/1/205113 | 543 | 478 | ||||||
| Fannie Mae Pool #MA4399 2.50% 8/1/205113 | 52 | 46 | ||||||
| Fannie Mae Pool #FM8399 2.50% 8/1/205113 | 25 | 22 | ||||||
| Fannie Mae Pool #FM8360 2.50% 8/1/205113 | 23 | 20 | ||||||
| Fannie Mae Pool #BQ6558 2.50% 9/1/205113 | 1,858 | 1,635 | ||||||
| Fannie Mae Pool #FM8692 2.50% 9/1/205113 | 1,347 | 1,184 | ||||||
| Fannie Mae Pool #CB1552 2.50% 9/1/205113 | 561 | 492 | ||||||
| Fannie Mae Pool #BU0341 2.50% 9/1/205113 | 495 | 435 | ||||||
| Fannie Mae Pool #BT7263 2.50% 9/1/205113 | 325 | 286 | ||||||
| Fannie Mae Pool #FM8980 2.50% 9/1/205113 | 242 | 213 | ||||||
| Fannie Mae Pool #CB1624 2.50% 9/1/205113 | 136 | 119 | ||||||
| Fannie Mae Pool #FS1630 2.50% 9/1/205113 | 45 | 39 | ||||||
| Fannie Mae Pool #BT6781 2.50% 10/1/205113 | 8,190 | 7,193 | ||||||
| Fannie Mae Pool #CB1793 2.50% 10/1/205113 | 4,459 | 3,915 | ||||||
| Fannie Mae Pool #BU3295 2.50% 10/1/205113 | 3,632 | 3,189 | ||||||
| Fannie Mae Pool #BU1062 2.50% 10/1/205113 | 1,014 | 891 | ||||||
| Fannie Mae Pool #FM9248 2.50% 10/1/205113 | 991 | 879 | ||||||
| Fannie Mae Pool #BT3032 2.50% 10/1/205113 | 503 | 441 | ||||||
| Fannie Mae Pool #FM9335 2.50% 10/1/205113 | 363 | 319 | ||||||
| Fannie Mae Pool #CB2852 2.00% 11/1/205113 | 184 | 155 | ||||||
| Fannie Mae Pool #FM9764 2.50% 11/1/205113 | 7,985 | 7,008 | ||||||
| Fannie Mae Pool #BT6033 2.50% 11/1/205113 | 1,839 | 1,616 | ||||||
| Fannie Mae Pool #BU3347 2.50% 11/1/205113 | 998 | 876 | ||||||
| Fannie Mae Pool #BU2803 2.50% 11/1/205113 | 998 | 876 | ||||||
| Fannie Mae Pool #BT3056 2.50% 11/1/205113 | 974 | 855 | ||||||
| Fannie Mae Pool #MA4466 2.50% 11/1/205113 | 263 | 231 | ||||||
| The Income Fund of America | 31 |
| Bonds, notes & other debt instruments (continued) | Principal amount (000) | Value (000) | ||||||
| Mortgage-backed obligations (continued) | ||||||||
| Federal agency mortgage-backed obligations (continued) | ||||||||
| Fannie Mae Pool #CB2088 2.50% 11/1/205113 | USD | 143 | $ | 125 | ||||
| Fannie Mae Pool #CB2099 3.00% 11/1/205113 | 2,376 | 2,164 | ||||||
| Fannie Mae Pool #BU3800 2.00% 12/1/205113 | 171 | 144 | ||||||
| Fannie Mae Pool #BU3058 2.50% 12/1/205113 | 5,847 | 5,130 | ||||||
| Fannie Mae Pool #CB2319 2.50% 12/1/205113 | 4,859 | 4,315 | ||||||
| Fannie Mae Pool #CB2375 2.50% 12/1/205113 | 4,790 | 4,232 | ||||||
| Fannie Mae Pool #BT9483 2.50% 12/1/205113 | 2,341 | 2,079 | ||||||
| Fannie Mae Pool #CB2372 2.50% 12/1/205113 | 2,340 | 2,078 | ||||||
| Fannie Mae Pool #BT9510 2.50% 12/1/205113 | 1,873 | 1,665 | ||||||
| Fannie Mae Pool #CB2286 2.50% 12/1/205113 | 1,090 | 968 | ||||||
| Fannie Mae Pool #CB2401 2.50% 12/1/205113 | 998 | 876 | ||||||
| Fannie Mae Pool #FM9672 2.50% 12/1/205113 | 754 | 662 | ||||||
| Fannie Mae Pool #BU7257 2.50% 12/1/205113 | 240 | 211 | ||||||
| Fannie Mae Pool #FM9855 2.50% 12/1/205113 | 219 | 192 | ||||||
| Fannie Mae Pool #BU7526 3.00% 12/1/205113 | 1,033 | 941 | ||||||
| Fannie Mae Pool #CB2613 2.00% 1/1/205213 | 135 | 114 | ||||||
| Fannie Mae Pool #FS0235 2.50% 1/1/205213 | 19,508 | 17,122 | ||||||
| Fannie Mae Pool #FS2534 2.50% 1/1/205213 | 4,860 | 4,269 | ||||||
| Fannie Mae Pool #BV0762 2.50% 1/1/205213 | 2,995 | 2,627 | ||||||
| Fannie Mae Pool #FS0392 2.50% 1/1/205213 | 2,832 | 2,487 | ||||||
| Fannie Mae Pool #FS0381 2.50% 1/1/205213 | 1,064 | 934 | ||||||
| Fannie Mae Pool #FS0176 2.50% 1/1/205213 | 961 | 843 | ||||||
| Fannie Mae Pool #CB2555 2.50% 1/1/205213 | 944 | 829 | ||||||
| Fannie Mae Pool #FS0303 3.00% 1/1/205213 | 2,927 | 2,665 | ||||||
| Fannie Mae Pool #FS0302 3.00% 1/1/205213 | 70 | 64 | ||||||
| Fannie Mae Pool #CB2765 2.00% 2/1/205213 | 31,470 | 26,735 | ||||||
| Fannie Mae Pool #CB3666 2.50% 2/1/205213 | 8,981 | 7,882 | ||||||
| Fannie Mae Pool #FS0546 2.50% 2/1/205213 | 7,091 | 6,223 | ||||||
| Fannie Mae Pool #BT1892 2.50% 2/1/205213 | 1,459 | 1,281 | ||||||
| Fannie Mae Pool #FS1995 2.50% 2/1/205213 | 1,309 | 1,149 | ||||||
| Fannie Mae Pool #BQ7473 2.50% 2/1/205213 | 1,123 | 986 | ||||||
| Fannie Mae Pool #FS0547 2.50% 2/1/205213 | 329 | 290 | ||||||
| Fannie Mae Pool #BV2360 2.50% 2/1/205213 | 289 | 254 | ||||||
| Fannie Mae Pool #FS0647 3.00% 2/1/205213 | 68,420 | 63,407 | ||||||
| Fannie Mae Pool #FS1194 3.00% 2/1/205213 | 13,182 | 12,231 | ||||||
| Fannie Mae Pool #CB2896 3.00% 2/1/205213 | 11,058 | 10,065 | ||||||
| Fannie Mae Pool #BU8803 3.00% 2/1/205213 | 1,929 | 1,757 | ||||||
| Fannie Mae Pool #CB2759 3.00% 2/1/205213 | 238 | 217 | ||||||
| Fannie Mae Pool #CB2758 3.00% 2/1/205213 | 158 | 144 | ||||||
| Fannie Mae Pool #MA4562 2.00% 3/1/205213 | 1,984 | 1,671 | ||||||
| Fannie Mae Pool #CB3063 2.50% 3/1/205213 | 17,743 | 15,572 | ||||||
| Fannie Mae Pool #CB3995 2.50% 3/1/205213 | 9,979 | 8,756 | ||||||
| Fannie Mae Pool #BV2851 2.50% 3/1/205213 | 9,825 | 8,620 | ||||||
| Fannie Mae Pool #CB3744 2.50% 3/1/205213 | 7,734 | 6,786 | ||||||
| Fannie Mae Pool #BV2655 2.50% 3/1/205213 | 5,929 | 5,202 | ||||||
| Fannie Mae Pool #CB3164 2.50% 3/1/205213 | 1,996 | 1,751 | ||||||
| Fannie Mae Pool #BT2188 2.50% 3/1/205213 | 1,614 | 1,416 | ||||||
| Fannie Mae Pool #BV7520 2.50% 3/1/205213 | 487 | 427 | ||||||
| Fannie Mae Pool #CB5013 2.50% 3/1/205213 | 59 | 51 | ||||||
| Fannie Mae Pool #BU8885 2.50% 3/1/205213 | 34 | 30 | ||||||
| Fannie Mae Pool #FS1030 3.00% 3/1/205213 | 27,763 | 25,274 | ||||||
| Fannie Mae Pool #FS0831 3.00% 3/1/205213 | 2,379 | 2,166 | ||||||
| Fannie Mae Pool #CB3410 3.00% 3/1/205213 | 1,673 | 1,522 | ||||||
| Fannie Mae Pool #BV2942 3.00% 3/1/205213 | 848 | 772 | ||||||
| Fannie Mae Pool #BV2954 3.00% 3/1/205213 | 839 | 765 | ||||||
| Fannie Mae Pool #CB3169 3.00% 3/1/205213 | 840 | 765 | ||||||
| Fannie Mae Pool #BV3393 3.00% 3/1/205213 | 358 | 326 | ||||||
| Fannie Mae Pool #CB3120 3.00% 3/1/205213 | 159 | 145 | ||||||
| Fannie Mae Pool #MA4564 3.00% 3/1/205213 | 132 | 120 | ||||||
| Fannie Mae Pool #FS0957 3.00% 3/1/205213 | 68 | 62 | ||||||
| Fannie Mae Pool #CB3177 3.50% 3/1/205213 | 53,786 | 50,517 | ||||||
| Fannie Mae Pool #MA4577 2.00% 4/1/205213 | 32,284 | 27,185 | ||||||
| Fannie Mae Pool #CB3394 2.00% 4/1/205213 | 21,571 | 18,186 | ||||||
| Fannie Mae Pool #FS1598 2.00% 4/1/205213 | 211 | 178 | ||||||
| Fannie Mae Pool #BV4656 2.50% 4/1/205213 | 7,102 | 6,231 | ||||||
| Fannie Mae Pool #BT2292 2.50% 4/1/205213 | 6,975 | 6,119 | ||||||
| Fannie Mae Pool #FS1629 2.50% 4/1/205213 | 3,985 | 3,497 | ||||||
| 32 | The Income Fund of America |
| Bonds, notes & other debt instruments (continued) | Principal amount (000) | Value (000) | ||||||
| Mortgage-backed obligations (continued) | ||||||||
| Federal agency mortgage-backed obligations (continued) | ||||||||
| Fannie Mae Pool #FS1214 2.50% 4/1/205213 | USD | 3,174 | $ | 2,786 | ||||
| Fannie Mae Pool #BV7773 2.50% 4/1/205213 | 2,994 | 2,628 | ||||||
| Fannie Mae Pool #FS1749 2.50% 4/1/205213 | 1,988 | 1,745 | ||||||
| Fannie Mae Pool #BV9612 2.50% 4/1/205213 | 1,199 | 1,054 | ||||||
| Fannie Mae Pool #BV8166 2.50% 4/1/205213 | 754 | 661 | ||||||
| Fannie Mae Pool #BV8156 2.50% 4/1/205213 | 701 | 615 | ||||||
| Fannie Mae Pool #CB3354 2.50% 4/1/205213 | 574 | 504 | ||||||
| Fannie Mae Pool #MA4578 2.50% 4/1/205213 | 122 | 107 | ||||||
| Fannie Mae Pool #BU8905 2.50% 4/1/205213 | 44 | 38 | ||||||
| Fannie Mae Pool #CB3364 3.00% 4/1/205213 | 3,313 | 3,015 | ||||||
| Fannie Mae Pool #BU8945 3.00% 4/1/205213 | 2,991 | 2,722 | ||||||
| Fannie Mae Pool #BV8117 3.00% 4/1/205213 | 1,959 | 1,782 | ||||||
| Fannie Mae Pool #CB3360 3.00% 4/1/205213 | 513 | 467 | ||||||
| Fannie Mae Pool #BV7200 3.00% 4/1/205213 | 506 | 460 | ||||||
| Fannie Mae Pool #BV4694 3.00% 4/1/205213 | 412 | 375 | ||||||
| Fannie Mae Pool #BV9000 3.00% 4/1/205213 | 267 | 243 | ||||||
| Fannie Mae Pool #BV8459 3.00% 4/1/205213 | 229 | 209 | ||||||
| Fannie Mae Pool #FS0983 3.00% 4/1/205213 | 111 | 101 | ||||||
| Fannie Mae Pool #CB3369 3.50% 4/1/205213 | 29,064 | 27,288 | ||||||
| Fannie Mae Pool #CB3417 3.50% 4/1/205213 | 24,904 | 23,387 | ||||||
| Fannie Mae Pool #BV7521 2.50% 5/1/205213 | 10,947 | 9,608 | ||||||
| Fannie Mae Pool #CB3665 2.50% 5/1/205213 | 7,066 | 6,200 | ||||||
| Fannie Mae Pool #CB3571 2.50% 5/1/205213 | 2,906 | 2,550 | ||||||
| Fannie Mae Pool #MA4598 2.50% 5/1/205213 | 662 | 581 | ||||||
| Fannie Mae Pool #CB3495 3.00% 5/1/205213 | 6,028 | 5,485 | ||||||
| Fannie Mae Pool #FS1877 3.00% 5/1/205213 | 2,988 | 2,719 | ||||||
| Fannie Mae Pool #BT7819 3.00% 5/1/205213 | 2,110 | 1,920 | ||||||
| Fannie Mae Pool #CB4281 3.00% 5/1/205213 | 1,717 | 1,563 | ||||||
| Fannie Mae Pool #BW1734 3.00% 5/1/205213 | 998 | 909 | ||||||
| Fannie Mae Pool #BV9645 3.00% 5/1/205213 | 499 | 454 | ||||||
| Fannie Mae Pool #BV9819 3.00% 5/1/205213 | 499 | 454 | ||||||
| Fannie Mae Pool #BV2443 3.00% 5/1/205213 | 393 | 357 | ||||||
| Fannie Mae Pool #BV5578 3.00% 5/1/205213 | 197 | 179 | ||||||
| Fannie Mae Pool #BV8809 3.00% 5/1/205213 | 75 | 68 | ||||||
| Fannie Mae Pool #MA4600 3.50% 5/1/205213 | 1,530 | 1,436 | ||||||
| Fannie Mae Pool #MA4622 2.00% 6/1/205213 | 119 | 100 | ||||||
| Fannie Mae Pool #BU8729 2.00% 6/1/205213 | 50 | 42 | ||||||
| Fannie Mae Pool #BW7323 2.50% 6/1/205213 | 1,993 | 1,749 | ||||||
| Fannie Mae Pool #BV9975 2.50% 6/1/205213 | 1,941 | 1,703 | ||||||
| Fannie Mae Pool #BU8730 2.50% 6/1/205213 | 1,767 | 1,549 | ||||||
| Fannie Mae Pool #BV9700 2.50% 6/1/205213 | 1,754 | 1,539 | ||||||
| Fannie Mae Pool #BV9990 2.50% 6/1/205213 | 974 | 855 | ||||||
| Fannie Mae Pool #BV2515 2.50% 6/1/205213 | 949 | 832 | ||||||
| Fannie Mae Pool #MA4623 2.50% 6/1/205213 | 156 | 137 | ||||||
| Fannie Mae Pool #BW1788 3.00% 6/1/205213 | 1,497 | 1,364 | ||||||
| Fannie Mae Pool #BV0924 3.00% 6/1/205213 | 998 | 908 | ||||||
| Fannie Mae Pool #BV2531 3.00% 6/1/205213 | 876 | 797 | ||||||
| Fannie Mae Pool #BW1797 3.00% 6/1/205213 | 534 | 486 | ||||||
| Fannie Mae Pool #MA4624 3.00% 6/1/205213 | 505 | 460 | ||||||
| Fannie Mae Pool #BW1449 3.00% 6/1/205213 | 504 | 458 | ||||||
| Fannie Mae Pool #BW2935 3.00% 6/1/205213 | 449 | 409 | ||||||
| Fannie Mae Pool #BV5628 4.50% 6/1/205213 | 301 | 298 | ||||||
| Fannie Mae Pool #BV7870 2.00% 7/1/205213 | 95 | 80 | ||||||
| Fannie Mae Pool #FS2239 2.50% 7/1/205213 | 19,888 | 17,449 | ||||||
| Fannie Mae Pool #BW0002 2.50% 7/1/205213 | 681 | 598 | ||||||
| Fannie Mae Pool #BV7830 2.50% 7/1/205213 | 141 | 123 | ||||||
| Fannie Mae Pool #BV7868 2.50% 7/1/205213 | 99 | 87 | ||||||
| Fannie Mae Pool #BW3384 3.00% 7/1/205213 | 990 | 901 | ||||||
| Fannie Mae Pool #BW4143 3.00% 7/1/205213 | 97 | 88 | ||||||
| Fannie Mae Pool #CB4159 4.00% 7/1/205213 | 6,771 | 6,546 | ||||||
| Fannie Mae Pool #BW0015 4.00% 7/1/205213 | 186 | 180 | ||||||
| Fannie Mae Pool #MA4656 4.50% 7/1/205213 | 45,512 | 44,994 | ||||||
| Fannie Mae Pool #FS2535 2.50% 8/1/205213 | 1,992 | 1,749 | ||||||
| Fannie Mae Pool #BV7912 2.50% 8/1/205213 | 1,673 | 1,467 | ||||||
| Fannie Mae Pool #MA4698 3.00% 8/1/205213 | 119 | 109 | ||||||
| Fannie Mae Pool #BV8024 4.00% 8/1/205213 | 8,530 | 8,246 | ||||||
| Fannie Mae Pool #BX3451 2.50% 9/1/205213 | 2,907 | 2,552 | ||||||
| The Income Fund of America | 33 |
| Bonds, notes & other debt instruments (continued) | Principal amount (000) | Value (000) | ||||||
| Mortgage-backed obligations (continued) | ||||||||
| Federal agency mortgage-backed obligations (continued) | ||||||||
| Fannie Mae Pool #FS2805 2.50% 9/1/205213 | USD | 412 | $ | 361 | ||||
| Fannie Mae Pool #BW7780 3.00% 9/1/205213 | 402 | 366 | ||||||
| Fannie Mae Pool #MA4730 3.00% 9/1/205213 | 276 | 251 | ||||||
| Fannie Mae Pool #MA4732 4.00% 9/1/205213 | 57,905 | 55,974 | ||||||
| Fannie Mae Pool #BW7326 4.00% 9/1/205213 | 7,331 | 7,087 | ||||||
| Fannie Mae Pool #BW9348 4.00% 9/1/205213 | 6,363 | 6,151 | ||||||
| Fannie Mae Pool #BW8103 4.00% 9/1/205213 | 5,930 | 5,732 | ||||||
| Fannie Mae Pool #MA4733 4.50% 9/1/205213 | 3,663 | 3,621 | ||||||
| Fannie Mae Pool #BV0958 5.00% 9/1/205213 | 841 | 845 | ||||||
| Fannie Mae Pool #BW1201 5.00% 9/1/205213 | 82 | 82 | ||||||
| Fannie Mae Pool #MA4824 2.50% 10/1/205213 | 2,231 | 1,957 | ||||||
| Fannie Mae Pool #CB5015 3.00% 10/1/205213 | 1,495 | 1,360 | ||||||
| Fannie Mae Pool #MA4781 3.00% 10/1/205213 | 248 | 226 | ||||||
| Fannie Mae Pool #BW8980 4.00% 10/1/205213 | 23,753 | 22,960 | ||||||
| Fannie Mae Pool #BW1210 4.00% 10/1/205213 | 17,801 | 17,207 | ||||||
| Fannie Mae Pool #BW7356 4.00% 10/1/205213 | 14,927 | 14,429 | ||||||
| Fannie Mae Pool #BX0509 4.00% 10/1/205213 | 6,318 | 6,107 | ||||||
| Fannie Mae Pool #BX1202 4.00% 10/1/205213 | 95 | 92 | ||||||
| Fannie Mae Pool #MA4784 4.50% 10/1/205213 | 7,009 | 6,929 | ||||||
| Fannie Mae Pool #BW8981 4.50% 10/1/205213 | 4,582 | 4,530 | ||||||
| Fannie Mae Pool #MA4887 2.50% 11/1/205213 | 441 | 387 | ||||||
| Fannie Mae Pool #MA4854 2.50% 11/1/205213 | 156 | 136 | ||||||
| Fannie Mae Pool #BW1310 4.00% 11/1/205213 | 6,715 | 6,491 | ||||||
| Fannie Mae Pool #BW7491 5.00% 11/1/205213 | 854 | 858 | ||||||
| Fannie Mae Pool #BX1761 5.00% 11/1/205213 | 145 | 145 | ||||||
| Fannie Mae Pool #MA4806 5.00% 11/1/205213 | 119 | 119 | ||||||
| Fannie Mae Pool #BX1274 5.50% 11/1/205213 | 127 | 130 | ||||||
| Fannie Mae Pool #MA4839 4.00% 12/1/205213 | 995 | 962 | ||||||
| Fannie Mae Pool #BW1385 4.00% 12/1/205213 | 399 | 386 | ||||||
| Fannie Mae Pool #MA4840 4.50% 12/1/205213 | 2,895 | 2,862 | ||||||
| Fannie Mae Pool #BW1380 4.50% 12/1/205213 | 499 | 494 | ||||||
| Fannie Mae Pool #BX1076 5.00% 12/1/205213 | 663 | 666 | ||||||
| Fannie Mae Pool #MA4842 5.50% 12/1/205213 | 99 | 101 | ||||||
| Fannie Mae Pool #MA4910 2.50% 1/1/205313 | 998 | 875 | ||||||
| Fannie Mae Pool #BF0167 3.00% 2/1/205713 | 870 | 793 | ||||||
| Fannie Mae Pool #BF0145 3.50% 3/1/205713 | 15,528 | 14,660 | ||||||
| Fannie Mae Pool #BF0264 3.50% 5/1/205813 | 13,207 | 12,517 | ||||||
| Fannie Mae Pool #BF0332 3.00% 1/1/205913 | 68,742 | 62,707 | ||||||
| Fannie Mae Pool #BM6736 4.50% 11/1/205913 | 22,644 | 22,614 | ||||||
| Fannie Mae Pool #BF0497 3.00% 7/1/206013 | 15,769 | 14,298 | ||||||
| Fannie Mae Pool #BF0548 3.00% 7/1/206113 | 5,862 | 5,252 | ||||||
| Fannie Mae, Series 2001-4, Class GA, 9.00% 4/17/20257,13 | — | 4 | — | 4 | ||||
| Fannie Mae, Series 2001-4, Class NA, 9.00% 10/25/20257,13 | — | 4 | — | 4 | ||||
| Fannie Mae, Series 2007-24, Class P, 6.00% 3/25/203713 | 469 | 492 | ||||||
| Fannie Mae, Series 2007-33, Class HE, 5.50% 4/25/203713 | 978 | 1,006 | ||||||
| Fannie Mae, Series 2001-50, Class BA, 7.00% 10/25/204113 | 94 | 97 | ||||||
| Fannie Mae, Series 2002-W3, Class A5, 7.50% 11/25/204113 | 86 | 94 | ||||||
| Fannie Mae, Series 2001-T10, Class A1, 7.00% 12/25/204113 | 110 | 113 | ||||||
| Fannie Mae, Series 2002-W1, Class 2A, 4.889% 2/25/20427,13 | 227 | 224 | ||||||
| Fannie Mae, Series 2013-M14, Class A2, Multi Family, 3.329% 10/25/20237,13 | 2,863 | 2,813 | ||||||
| Fannie Mae, Series 2014-M2, Class A2, Multi Family, 3.513% 12/25/20237,13 | 2,721 | 2,679 | ||||||
| Fannie Mae, Series 2014-M3, Class A2, Multi Family, 3.501% 1/25/20247,13 | 1,907 | 1,875 | ||||||
| Fannie Mae, Series 2014-M9, Class A2, Multi Family, 3.103% 7/25/20247,13 | 4,199 | 4,078 | ||||||
| Fannie Mae, Series 2017-M3, Class A2, Multi Family, 2.471% 12/25/20267,13 | 12,612 | 11,806 | ||||||
| Freddie Mac Pool #J38387 3.00% 1/1/203313 | 31 | 30 | ||||||
| Freddie Mac Pool #G04805 4.50% 12/1/203513 | 2,530 | 2,564 | ||||||
| Freddie Mac Pool #K93766 3.00% 12/1/203613 | 430 | 411 | ||||||
| Freddie Mac Pool #K93772 3.00% 12/1/203613 | 358 | 343 | ||||||
| Freddie Mac Pool #G04553 6.50% 9/1/203813 | 263 | 278 | ||||||
| Freddie Mac Pool #G08353 4.50% 7/1/203913 | 207 | 211 | ||||||
| Freddie Mac Pool #A87892 5.00% 8/1/203913 | 511 | 529 | ||||||
| Freddie Mac Pool #A87873 5.00% 8/1/203913 | 217 | 222 | ||||||
| Freddie Mac Pool #G05937 4.50% 8/1/204013 | 4,888 | 4,977 | ||||||
| Freddie Mac Pool #A96488 5.00% 1/1/204113 | 17 | 17 | ||||||
| Freddie Mac Pool #Q01746 4.50% 7/1/204113 | 147 | 148 | ||||||
| Freddie Mac Pool #Q02676 4.50% 8/1/204113 | 307 | 309 | ||||||
| Freddie Mac Pool #Q02849 4.50% 8/1/204113 | 267 | 270 | ||||||
| 34 | The Income Fund of America |
| Bonds, notes & other debt instruments (continued) | Principal amount (000) | Value (000) | ||||||
| Mortgage-backed obligations (continued) | ||||||||
| Federal agency mortgage-backed obligations (continued) | ||||||||
| Freddie Mac Pool #G07189 4.50% 3/1/204213 | USD | 447 | $ | 455 | ||||
| Freddie Mac Pool #G07221 4.50% 6/1/204213 | 817 | 832 | ||||||
| Freddie Mac Pool #Q23190 4.00% 11/1/204313 | 1,356 | 1,349 | ||||||
| Freddie Mac Pool #Q23185 4.00% 11/1/204313 | 1,148 | 1,154 | ||||||
| Freddie Mac Pool #Z40130 3.00% 1/1/204613 | 5,389 | 5,041 | ||||||
| Freddie Mac Pool #G60559 4.00% 4/1/204613 | 6,156 | 6,079 | ||||||
| Freddie Mac Pool #Q41090 4.50% 6/1/204613 | 554 | 559 | ||||||
| Freddie Mac Pool #Q41909 4.50% 7/1/204613 | 1,288 | 1,297 | ||||||
| Freddie Mac Pool #V82662 4.00% 10/1/204613 | 4,531 | 4,475 | ||||||
| Freddie Mac Pool #Q44400 4.00% 11/1/204613 | 4,131 | 4,077 | ||||||
| Freddie Mac Pool #G61733 3.00% 12/1/204713 | 6,781 | 6,320 | ||||||
| Freddie Mac Pool #G61628 3.50% 9/1/204813 | 669 | 641 | ||||||
| Freddie Mac Pool #SD0045 4.50% 11/1/204813 | 17,888 | 18,100 | ||||||
| Freddie Mac Pool #ZN3568 4.50% 2/1/204913 | 8 | 8 | ||||||
| Freddie Mac Pool #Q63663 3.00% 5/1/204913 | 5,113 | 4,716 | ||||||
| Freddie Mac Pool #SD7503 3.50% 8/1/204913 | 3,658 | 3,508 | ||||||
| Freddie Mac Pool #SD7508 3.50% 10/1/204913 | 14,670 | 14,052 | ||||||
| Freddie Mac Pool #RA1744 4.00% 11/1/204913 | 25,431 | 24,923 | ||||||
| Freddie Mac Pool #QA5125 3.50% 12/1/204913 | 19,847 | 19,125 | ||||||
| Freddie Mac Pool #RA2596 2.50% 5/1/205013 | 15,383 | 13,700 | ||||||
| Freddie Mac Pool #SD7525 2.50% 10/1/205013 | 15,556 | 13,943 | ||||||
| Freddie Mac Pool #SD8106 2.00% 11/1/205013 | 54,142 | 45,821 | ||||||
| Freddie Mac Pool #SD7528 2.00% 11/1/205013 | 22,563 | 19,323 | ||||||
| Freddie Mac Pool #QB8797 2.50% 2/1/205113 | 40 | 35 | ||||||
| Freddie Mac Pool #QC0416 2.50% 4/1/205113 | 2,866 | 2,525 | ||||||
| Freddie Mac Pool #RA5287 2.00% 5/1/205113 | 20,841 | 17,641 | ||||||
| Freddie Mac Pool #RA5288 2.00% 5/1/205113 | 11,685 | 9,891 | ||||||
| Freddie Mac Pool #RA5605 2.50% 7/1/205113 | 998 | 877 | ||||||
| Freddie Mac Pool #SD0926 2.50% 7/1/205113 | 428 | 379 | ||||||
| Freddie Mac Pool #QC6749 3.00% 7/1/205113 | 4,062 | 3,730 | ||||||
| Freddie Mac Pool #QC4360 3.00% 7/1/205113 | 3,280 | 2,995 | ||||||
| Freddie Mac Pool #QC4415 3.00% 7/1/205113 | 499 | 455 | ||||||
| Freddie Mac Pool #QC3826 3.00% 7/1/205113 | 137 | 125 | ||||||
| Freddie Mac Pool #QC5527 2.50% 8/1/205113 | 4,013 | 3,526 | ||||||
| Freddie Mac Pool #QC6209 2.50% 8/1/205113 | 220 | 194 | ||||||
| Freddie Mac Pool #QC6996 2.50% 8/1/205113 | 89 | 78 | ||||||
| Freddie Mac Pool #QC5189 2.50% 8/1/205113 | 40 | 35 | ||||||
| Freddie Mac Pool #QC5996 3.00% 8/1/205113 | 143 | 131 | ||||||
| Freddie Mac Pool #RA5759 2.50% 9/1/205113 | 5,920 | 5,191 | ||||||
| Freddie Mac Pool #SD7545 2.50% 9/1/205113 | 4,224 | 3,757 | ||||||
| Freddie Mac Pool #RA5855 2.50% 9/1/205113 | 1,365 | 1,199 | ||||||
| Freddie Mac Pool #QC6225 2.50% 9/1/205113 | 998 | 876 | ||||||
| Freddie Mac Pool #QC6597 2.50% 9/1/205113 | 994 | 873 | ||||||
| Freddie Mac Pool #QC6821 2.50% 9/1/205113 | 962 | 844 | ||||||
| Freddie Mac Pool #RA5782 2.50% 9/1/205113 | 645 | 575 | ||||||
| Freddie Mac Pool #QC7440 2.50% 9/1/205113 | 187 | 164 | ||||||
| Freddie Mac Pool #RA5826 2.50% 9/1/205113 | 143 | 125 | ||||||
| Freddie Mac Pool #SD0674 2.50% 9/1/205113 | 121 | 107 | ||||||
| Freddie Mac Pool #RA5971 3.00% 9/1/205113 | 28,427 | 26,203 | ||||||
| Freddie Mac Pool #QC6456 3.00% 9/1/205113 | 4,682 | 4,267 | ||||||
| Freddie Mac Pool #QC7504 3.00% 9/1/205113 | 170 | 155 | ||||||
| Freddie Mac Pool #RA6107 2.50% 10/1/205113 | 21,042 | 18,479 | ||||||
| Freddie Mac Pool #QC8778 2.50% 10/1/205113 | 2,963 | 2,602 | ||||||
| Freddie Mac Pool #RA6231 2.50% 11/1/205113 | 6,093 | 5,349 | ||||||
| Freddie Mac Pool #QC9944 2.50% 11/1/205113 | 2,122 | 1,863 | ||||||
| Freddie Mac Pool #RA6411 2.50% 11/1/205113 | 137 | 120 | ||||||
| Freddie Mac Pool #QD0293 2.50% 11/1/205113 | 50 | 44 | ||||||
| Freddie Mac Pool #RA7081 2.50% 12/1/205113 | 11,493 | 10,089 | ||||||
| Freddie Mac Pool #QD3414 2.50% 12/1/205113 | 10,316 | 9,055 | ||||||
| Freddie Mac Pool #RA6483 2.50% 12/1/205113 | 4,153 | 3,669 | ||||||
| Freddie Mac Pool #QD3226 2.50% 12/1/205113 | 1,141 | 1,002 | ||||||
| Freddie Mac Pool #QD2075 2.50% 12/1/205113 | 1,091 | 957 | ||||||
| Freddie Mac Pool #RA6433 2.50% 12/1/205113 | 457 | 401 | ||||||
| Freddie Mac Pool #QD1623 2.50% 12/1/205113 | 80 | 70 | ||||||
| Freddie Mac Pool #QD1626 2.50% 12/1/205113 | 74 | 65 | ||||||
| Freddie Mac Pool #QD2923 2.50% 12/1/205113 | 24 | 21 | ||||||
| Freddie Mac Pool #RA6488 3.00% 12/1/205113 | 272 | 247 | ||||||
| The Income Fund of America | 35 |
| Bonds, notes & other debt instruments (continued) | Principal amount (000) | Value (000) | ||||||
| Mortgage-backed obligations (continued) | ||||||||
| Federal agency mortgage-backed obligations (continued) | ||||||||
| Freddie Mac Pool #SD7552 2.50% 1/1/205213 | USD | 14,108 | $ | 12,498 | ||||
| Freddie Mac Pool #QD4799 2.50% 1/1/205213 | 7,985 | 7,007 | ||||||
| Freddie Mac Pool #RA6633 2.50% 1/1/205213 | 1,992 | 1,748 | ||||||
| Freddie Mac Pool #RA7263 2.50% 1/1/205213 | 1,979 | 1,738 | ||||||
| Freddie Mac Pool #SD7551 3.00% 1/1/205213 | 65,425 | 60,086 | ||||||
| Freddie Mac Pool #SD0803 3.00% 1/1/205213 | 421 | 383 | ||||||
| Freddie Mac Pool #SD8193 2.00% 2/1/205213 | 695 | 586 | ||||||
| Freddie Mac Pool #RA6608 3.00% 2/1/205213 | 2,800 | 2,547 | ||||||
| Freddie Mac Pool #QD7714 3.00% 2/1/205213 | 1,497 | 1,363 | ||||||
| Freddie Mac Pool #RA6804 3.00% 2/1/205213 | 857 | 781 | ||||||
| Freddie Mac Pool #RA6806 3.00% 2/1/205213 | 732 | 666 | ||||||
| Freddie Mac Pool #QD6279 3.00% 2/1/205213 | 673 | 612 | ||||||
| Freddie Mac Pool #RA6808 3.00% 2/1/205213 | 162 | 147 | ||||||
| Freddie Mac Pool #QD7089 3.50% 2/1/205213 | 7,360 | 6,920 | ||||||
| Freddie Mac Pool #SD8199 2.00% 3/1/205213 | 3,550 | 2,992 | ||||||
| Freddie Mac Pool #RA7065 2.00% 3/1/205213 | 863 | 727 | ||||||
| Freddie Mac Pool #QD9879 2.50% 3/1/205213 | 12,894 | 11,315 | ||||||
| Freddie Mac Pool #QD8677 2.50% 3/1/205213 | 10,965 | 9,622 | ||||||
| Freddie Mac Pool #QD8966 2.50% 3/1/205213 | 9,977 | 8,754 | ||||||
| Freddie Mac Pool #QD8942 2.50% 3/1/205213 | 3,250 | 2,852 | ||||||
| Freddie Mac Pool #QD8867 2.50% 3/1/205213 | 1,996 | 1,753 | ||||||
| Freddie Mac Pool #QE0957 2.50% 3/1/205213 | 1,816 | 1,594 | ||||||
| Freddie Mac Pool #RA7021 2.50% 3/1/205213 | 995 | 873 | ||||||
| Freddie Mac Pool #SD7553 3.00% 3/1/205213 | 6,362 | 5,870 | ||||||
| Freddie Mac Pool #QD7947 3.00% 3/1/205213 | 3,001 | 2,732 | ||||||
| Freddie Mac Pool #SD1374 3.00% 3/1/205213 | 2,034 | 1,852 | ||||||
| Freddie Mac Pool #RA6992 3.00% 3/1/205213 | 1,308 | 1,191 | ||||||
| Freddie Mac Pool #QD8673 3.00% 3/1/205213 | 1,038 | 945 | ||||||
| Freddie Mac Pool #RA6989 3.00% 3/1/205213 | 998 | 908 | ||||||
| Freddie Mac Pool #QD7918 3.00% 3/1/205213 | 836 | 761 | ||||||
| Freddie Mac Pool #QD8337 3.00% 3/1/205213 | 649 | 591 | ||||||
| Freddie Mac Pool #QD9327 3.00% 3/1/205213 | 212 | 193 | ||||||
| Freddie Mac Pool #QD8560 3.00% 3/1/205213 | 129 | 117 | ||||||
| Freddie Mac Pool #SD8204 2.00% 4/1/205213 | 45,602 | 38,432 | ||||||
| Freddie Mac Pool #QD9791 2.00% 4/1/205213 | 4,466 | 3,763 | ||||||
| Freddie Mac Pool #SD8205 2.50% 4/1/205213 | 69,193 | 60,710 | ||||||
| Freddie Mac Pool #SD7554 2.50% 4/1/205213 | 30,323 | 26,893 | ||||||
| Freddie Mac Pool #QD9911 2.50% 4/1/205213 | 11,791 | 10,346 | ||||||
| Freddie Mac Pool #QE1005 2.50% 4/1/205213 | 9,239 | 8,107 | ||||||
| Freddie Mac Pool #QE2314 2.50% 4/1/205213 | 4,991 | 4,376 | ||||||
| Freddie Mac Pool #QE0799 2.50% 4/1/205213 | 3,284 | 2,881 | ||||||
| Freddie Mac Pool #QD9578 2.50% 4/1/205213 | 2,989 | 2,622 | ||||||
| Freddie Mac Pool #QE0327 2.50% 4/1/205213 | 1,246 | 1,093 | ||||||
| Freddie Mac Pool #QE0322 2.50% 4/1/205213 | 1,213 | 1,064 | ||||||
| Freddie Mac Pool #QE0170 2.50% 4/1/205213 | 979 | 859 | ||||||
| Freddie Mac Pool #QE0292 2.50% 4/1/205213 | 865 | 759 | ||||||
| Freddie Mac Pool #QE0800 2.50% 4/1/205213 | 862 | 757 | ||||||
| Freddie Mac Pool #SD8206 3.00% 4/1/205213 | 3,539 | 3,221 | ||||||
| Freddie Mac Pool #RA8251 3.00% 4/1/205213 | 1,837 | 1,672 | ||||||
| Freddie Mac Pool #QE0761 3.00% 4/1/205213 | 1,127 | 1,026 | ||||||
| Freddie Mac Pool #RA7130 3.00% 4/1/205213 | 992 | 905 | ||||||
| Freddie Mac Pool #QE1360 3.00% 4/1/205213 | 991 | 904 | ||||||
| Freddie Mac Pool #QD9576 3.00% 4/1/205213 | 873 | 794 | ||||||
| Freddie Mac Pool #QE2315 3.00% 4/1/205213 | 849 | 773 | ||||||
| Freddie Mac Pool #SD1156 3.00% 4/1/205213 | 821 | 747 | ||||||
| Freddie Mac Pool #QE0001 3.00% 4/1/205213 | 123 | 112 | ||||||
| Freddie Mac Pool #QE0768 3.50% 4/1/205213 | 8,711 | 8,179 | ||||||
| Freddie Mac Pool #QD9278 3.50% 4/1/205213 | 4,654 | 4,374 | ||||||
| Freddie Mac Pool #SD8211 2.00% 5/1/205213 | 3,060 | 2,579 | ||||||
| Freddie Mac Pool #QE2346 2.00% 5/1/205213 | 839 | 707 | ||||||
| Freddie Mac Pool #QE2352 2.50% 5/1/205213 | 4,882 | 4,283 | ||||||
| Freddie Mac Pool #SD8212 2.50% 5/1/205213 | 1,736 | 1,523 | ||||||
| Freddie Mac Pool #QE3984 3.00% 5/1/205213 | 2,995 | 2,725 | ||||||
| Freddie Mac Pool #RA8137 3.00% 5/1/205213 | 1,525 | 1,388 | ||||||
| Freddie Mac Pool #QE3080 3.00% 5/1/205213 | 1,099 | 1,000 | ||||||
| Freddie Mac Pool #QE4164 3.00% 5/1/205213 | 998 | 908 | ||||||
| Freddie Mac Pool #QE4001 3.00% 5/1/205213 | 990 | 901 | ||||||
| 36 | The Income Fund of America |
| Bonds, notes & other debt instruments (continued) | Principal amount (000) | Value (000) | ||||||
| Mortgage-backed obligations (continued) | ||||||||
| Federal agency mortgage-backed obligations (continued) | ||||||||
| Freddie Mac Pool #SD8213 3.00% 5/1/205213 | USD | 380 | $ | 346 | ||||
| Freddie Mac Pool #SD8218 2.00% 6/1/205213 | 381 | 321 | ||||||
| Freddie Mac Pool #RA8146 2.50% 6/1/205213 | 1,238 | 1,086 | ||||||
| Freddie Mac Pool #SD8220 3.00% 6/1/205213 | 15,284 | 13,909 | ||||||
| Freddie Mac Pool #QE6097 2.50% 7/1/205213 | 647 | 568 | ||||||
| Freddie Mac Pool #SD8224 2.50% 7/1/205213 | 60 | 52 | ||||||
| Freddie Mac Pool #SD8225 3.00% 7/1/205213 | 249 | 227 | ||||||
| Freddie Mac Pool #QE5759 4.00% 7/1/205213 | 818 | 791 | ||||||
| Freddie Mac Pool #QE6051 4.00% 7/1/205213 | 134 | 130 | ||||||
| Freddie Mac Pool #RA7747 2.50% 8/1/205213 | 11,759 | 10,316 | ||||||
| Freddie Mac Pool #QE8989 2.50% 8/1/205213 | 418 | 366 | ||||||
| Freddie Mac Pool #SD7556 3.00% 8/1/205213 | 55,958 | 51,381 | ||||||
| Freddie Mac Pool #SD8235 3.00% 8/1/205213 | 1,653 | 1,504 | ||||||
| Freddie Mac Pool #QE9057 4.00% 8/1/205213 | 5,474 | 5,292 | ||||||
| Freddie Mac Pool #QE6590 4.00% 8/1/205213 | 23 | 22 | ||||||
| Freddie Mac Pool #RA8029 2.00% 9/1/205213 | 26 | 22 | ||||||
| Freddie Mac Pool #SD8262 2.50% 9/1/205213 | 2,900 | 2,543 | ||||||
| Freddie Mac Pool #SD8242 3.00% 9/1/205213 | 5,183 | 4,715 | ||||||
| Freddie Mac Pool #QF0925 3.00% 9/1/205213 | 869 | 791 | ||||||
| Freddie Mac Pool #QE9625 4.00% 9/1/205213 | 7,068 | 6,832 | ||||||
| Freddie Mac Pool #QE9564 4.00% 9/1/205213 | 44 | 43 | ||||||
| Freddie Mac Pool #QF0671 4.50% 9/1/205213 | 3,413 | 3,374 | ||||||
| Freddie Mac Pool #SD8245 4.50% 9/1/205213 | 1,112 | 1,100 | ||||||
| Freddie Mac Pool #SD8246 5.00% 9/1/205213 | 178,199 | 179,044 | ||||||
| Freddie Mac Pool #RA7938 5.00% 9/1/205213 | 2,946 | 2,960 | ||||||
| Freddie Mac Pool #QE9819 5.00% 9/1/205213 | 785 | 788 | ||||||
| Freddie Mac Pool #SD8271 2.50% 10/1/205213 | 2,616 | 2,295 | ||||||
| Freddie Mac Pool #QF1464 4.00% 10/1/205213 | 6,779 | 6,553 | ||||||
| Freddie Mac Pool #QF1489 4.00% 10/1/205213 | 1,997 | 1,930 | ||||||
| Freddie Mac Pool #QF1925 4.00% 10/1/205213 | 997 | 964 | ||||||
| Freddie Mac Pool #SD8257 4.50% 10/1/205213 | 26,716 | 26,412 | ||||||
| Freddie Mac Pool #QF2008 5.00% 10/1/205213 | 952 | 957 | ||||||
| Freddie Mac Pool #QF1569 5.00% 10/1/205213 | 873 | 877 | ||||||
| Freddie Mac Pool #SD1710 5.00% 10/1/205213 | 655 | 661 | ||||||
| Freddie Mac Pool #QF1305 5.00% 10/1/205213 | 425 | 427 | ||||||
| Freddie Mac Pool #SD8291 2.50% 11/1/205213 | 1,214 | 1,065 | ||||||
| Freddie Mac Pool #SD8283 2.50% 11/1/205213 | 331 | 290 | ||||||
| Freddie Mac Pool #SD8263 3.00% 11/1/205213 | 1,374 | 1,250 | ||||||
| Freddie Mac Pool #QF3364 4.00% 11/1/205213 | 10,898 | 10,534 | ||||||
| Freddie Mac Pool #QF2890 4.00% 11/1/205213 | 881 | 852 | ||||||
| Freddie Mac Pool #QF4090 5.00% 11/1/205213 | 718 | 722 | ||||||
| Freddie Mac Pool #QF2807 5.00% 11/1/205213 | 216 | 217 | ||||||
| Freddie Mac Pool #SD8275 4.50% 12/1/205213 | 97,368 | 96,260 | ||||||
| Freddie Mac Pool #SD8281 6.50% 12/1/205213 | 613 | 635 | ||||||
| Freddie Mac Pool #SD8303 2.50% 1/1/205313 | 1,100 | 965 | ||||||
| Freddie Mac Pool #SD8284 3.00% 1/1/205313 | 1,083 | 985 | ||||||
| Freddie Mac Pool #SD8282 6.50% 1/1/205313 | 1,202 | 1,246 | ||||||
| Freddie Mac Pool #SD8301 6.00% 2/1/205313 | 43 | 44 | ||||||
| Freddie Mac, Series 3257, Class PA, 5.50% 12/15/203613 | 1,048 | 1,088 | ||||||
| Freddie Mac, Series 3286, Class JN, 5.50% 2/15/203713 | 776 | 782 | ||||||
| Freddie Mac, Series 3318, Class JT, 5.50% 5/15/203713 | 406 | 416 | ||||||
| Freddie Mac, Series K733, Class A2, Multi Family, 3.75% 8/25/20257,13 | 5,913 | 5,820 | ||||||
| Freddie Mac, Series K734, Class A2, Multi Family, 3.208% 2/25/202613 | 11,055 | 10,739 | ||||||
| Freddie Mac, Series K067, Class A2, Multi Family, 3.194% 7/25/202713 | 7,695 | 7,436 | ||||||
| Freddie Mac, Series K076, Class A2, Multi Family, 3.90% 4/25/202813 | 4,164 | 4,149 | ||||||
| Freddie Mac, Series K143, Class A2, Multi Family, 2.35% 6/25/203213 | 35,930 | 31,358 | ||||||
| Freddie Mac Seasoned Credit Risk Transfer Trust, Series 2017-1, Class HA, 3.00% 1/25/20567,13 | 6,487 | 6,134 | ||||||
| Freddie Mac Seasoned Credit Risk Transfer Trust, Series 2017-1, Class MA, 3.00% 1/25/205613 | 944 | 890 | ||||||
| Freddie Mac Seasoned Credit Risk Transfer Trust, Series 2017-3, Class HA, 3.25% 7/25/20567,13 | 6,640 | 6,321 | ||||||
| Freddie Mac Seasoned Credit Risk Transfer Trust, Series 2017-2, Class MA, 3.00% 8/25/205613 | 6,980 | 6,590 | ||||||
| Freddie Mac Seasoned Credit Risk Transfer Trust, Series 2017-2, Class HA, 3.00% 8/25/20567,13 | 6,913 | 6,535 | ||||||
| The Income Fund of America | 37 |
| Bonds, notes & other debt instruments (continued) | Principal amount (000) | Value (000) | ||||||
| Mortgage-backed obligations (continued) | ||||||||
| Federal agency mortgage-backed obligations (continued) | ||||||||
| Freddie Mac Seasoned Credit Risk Transfer Trust, Series 2017-4, Class HT, 3.25% 6/25/20577,13 | USD | 1,738 | $ | 1,614 | ||||
| Freddie Mac Seasoned Credit Risk Transfer Trust, Series 2017-4, Class MT, 3.50% 6/25/205713 | 1,441 | 1,361 | ||||||
| Freddie Mac Seasoned Credit Risk Transfer Trust, Series 2017-4, Class M45T, 4.50% 6/25/205713 | 3,032 | 2,958 | ||||||
| Freddie Mac Seasoned Credit Risk Transfer Trust, Series 2019-2, Class MA, 3.50% 8/25/205813 | 8,369 | 8,049 | ||||||
| Freddie Mac Seasoned Credit Risk Transfer Trust, Series 2019-4, Class MA, 3.00% 2/25/205913 | 4,883 | 4,604 | ||||||
| Freddie Mac Seasoned Loan Structured Transaction Trust, Series 2018-2, Class A1, 3.50% 11/25/202813 | 2,436 | 2,354 | ||||||
| Government National Mortgage Assn. 2.00% 2/1/205313,14 | 3,875 | 3,350 | ||||||
| Government National Mortgage Assn. 2.50% 2/1/205313,14 | 10,441 | 9,311 | ||||||
| Government National Mortgage Assn. 3.00% 2/1/205313,14 | 90,000 | 82,716 | ||||||
| Government National Mortgage Assn. 4.00% 2/1/205313,14 | 1,800 | 1,748 | ||||||
| Government National Mortgage Assn. 4.50% 2/1/205313,14 | 46,166 | 45,849 | ||||||
| Government National Mortgage Assn. 2.00% 3/1/205313,14 | 60,300 | 52,181 | ||||||
| Government National Mortgage Assn. 4.00% 3/1/205313,14 | 2,300 | 2,234 | ||||||
| Government National Mortgage Assn. 4.50% 3/1/205313,14 | 45,800 | 45,471 | ||||||
| Government National Mortgage Assn. Pool #783687 4.50% 12/20/204113 | 340 | 343 | ||||||
| Government National Mortgage Assn. Pool #BD3903 4.00% 1/20/204813 | 5,197 | 5,082 | ||||||
| Government National Mortgage Assn. Pool #BE3194 4.00% 1/20/204813 | 1,230 | 1,203 | ||||||
| Government National Mortgage Assn. Pool #MA5192 4.00% 5/20/204813 | 4,116 | 4,049 | ||||||
| Government National Mortgage Assn. Pool #MA8150 4.00% 7/20/205213 | 26 | 25 | ||||||
| Government National Mortgage Assn. Pool #MA8426 4.00% 11/20/205213 | 3,442 | 3,345 | ||||||
| Uniform Mortgage-Backed Security 2.00% 2/1/205313,14 | 341,101 | 286,845 | ||||||
| Uniform Mortgage-Backed Security 2.50% 2/1/205313,14 | 66,878 | 58,583 | ||||||
| Uniform Mortgage-Backed Security 3.00% 2/1/205313,14 | 35,400 | 32,170 | ||||||
| Uniform Mortgage-Backed Security 3.50% 2/1/205313,14 | 21,993 | 20,630 | ||||||
| Uniform Mortgage-Backed Security 4.00% 2/1/205313,14 | 13,371 | 12,916 | ||||||
| Uniform Mortgage-Backed Security 4.50% 2/1/205313,14 | 52,880 | 52,235 | ||||||
| Uniform Mortgage-Backed Security 5.50% 2/1/205313,14 | 44,620 | 45,356 | ||||||
| Uniform Mortgage-Backed Security 6.50% 2/1/205313,14 | 39,100 | 40,465 | ||||||
| Uniform Mortgage-Backed Security 2.00% 3/1/205313,14 | 381,701 | 321,225 | ||||||
| Uniform Mortgage-Backed Security 2.50% 3/1/205313,14 | 88,162 | 77,296 | ||||||
| Uniform Mortgage-Backed Security 3.50% 3/1/205313,14 | 83,400 | 78,264 | ||||||
| Uniform Mortgage-Backed Security 4.00% 3/1/205313,14 | 154,900 | 149,654 | ||||||
| Uniform Mortgage-Backed Security 4.50% 3/1/205313,14 | 2,200 | 2,173 | ||||||
| Uniform Mortgage-Backed Security 5.00% 3/1/205313,14 | 68,030 | 68,275 | ||||||
| Uniform Mortgage-Backed Security 6.00% 3/1/205313,14 | 42,947 | 44,071 | ||||||
| Uniform Mortgage-Backed Security 6.50% 3/1/205313,14 | 1,317 | 1,361 | ||||||
| 4,791,640 | ||||||||
| Commercial mortgage-backed securities 0.21% | ||||||||
| Bank Commercial Mortgage Trust, Series 2019-BN16, Class A4, 4.005% 2/15/205213 | 1,810 | 1,748 | ||||||
| Bank Commercial Mortgage Trust, Series 2019-BN17, Class A4, 3.714% 4/15/205213 | 240 | 228 | ||||||
| Bank Commercial Mortgage Trust, Series 2018-BN10, Class A5, 3.688% 2/15/206113 | 480 | 459 | ||||||
| Bank Commercial Mortgage Trust, Series 2018-BN10, Class A4, 3.428% 2/17/206113 | 301 | 285 | ||||||
| Bank Commercial Mortgage Trust, Series 2018-BN12, Class A4, 4.255% 5/15/20617,13 | 5,772 | 5,659 | ||||||
| Bank Commercial Mortgage Trust, Series 2019-BN19, Class A3, 3.183% 8/15/206113 | 2,403 | 2,197 | ||||||
| Bank Commercial Mortgage Trust, Series 2020-BN26, Class A4, 2.403% 3/15/206313 | 3,772 | 3,266 | ||||||
| Bank Commercial Mortgage Trust, Series 2022-BNK40, Class A4, 3.394% 3/15/20647,13 | 4,590 | 4,193 | ||||||
| Benchmark Mortgage Trust, Series 2018-B8, Class A5, 4.2317% 1/15/205213 | 5,996 | 5,831 | ||||||
| Benchmark Mortgage Trust, Series 2020-B17, Class A5, 2.289% 3/15/205313 | 3,146 | 2,687 | ||||||
| Benchmark Mortgage Trust, Series 2018-B7, Class A4, 4.51% 5/15/20537,13 | 1,844 | 1,822 | ||||||
| BX Trust, Series 2021-SDMF, Class A, (1-month USD-LIBOR + 0.589%) 5.048% 9/15/20347,8,13 | 9,923 | 9,652 | ||||||
| BX Trust, Series 2021-VOLT, Class A, (1-month USD-LIBOR + 0.70%) 5.159% 9/15/20367,8,13 | 7,624 | 7,440 | ||||||
| BX Trust, Series 2021-VOLT, Class B, (1-month USD-LIBOR + 0.95%) 5.409% 9/15/20367,8,13 | 220 | 213 | ||||||
| BX Trust, Series 2021-ARIA, Class A, (1-month USD-LIBOR + 0.899%) 5.358% 10/15/20367,8,13 | 11,621 | 11,265 | ||||||
| BX Trust, Series 2021-ARIA, Class B, (1-month USD-LIBOR + 1.297%) 5.756% 10/15/20367,8,13 | 9,946 | 9,598 | ||||||
| 38 | The Income Fund of America |
| Bonds, notes & other debt instruments (continued) | Principal amount (000) | Value (000) | ||||||
| Mortgage-backed obligations (continued) | ||||||||
| Commercial mortgage-backed securities (continued) | ||||||||
| BX Trust, Series 2022-IND, Class A, (1-month USD CME Term SOFR + 1.491%) 5.969% 4/15/20377,8,13 | USD | 9,915 | $ | 9,865 | ||||
| BX Trust, Series 2021-SOAR, Class A, (1-month USD-LIBOR + 0.67%) 5.124% 6/15/20387,8,13 | 11,509 | 11,237 | ||||||
| BX Trust, Series 2021-SOAR, Class B, (1-month USD-LIBOR + 0.87%) 5.324% 6/15/20387,8,13 | 2,027 | 1,957 | ||||||
| BX Trust, Series 2021-SOAR, Class C, (1-month USD-LIBOR + 1.10%) 5.554% 6/15/20387,8,13 | 1,829 | 1,763 | ||||||
| BX Trust, Series 2021-ACNT, Class A, (1-month USD-LIBOR + 0.85%) 5.309% 11/15/20387,8,13 | 10,508 | 10,299 | ||||||
| Citigroup Commercial Mortgage Trust, Series 2016-GC36, Class A5, 3.616% 2/10/204913 | 1,440 | 1,374 | ||||||
| Citigroup Commercial Mortgage Trust, Series 2016-C1, Class AS, 3.514% 5/10/204913 | 350 | 328 | ||||||
| Commercial Mortgage Trust, Series 2014-LC15, Class AM, 4.198% 4/10/204713 | 550 | 535 | ||||||
| CSAIL Commercial Mortgage Trust, Series 2015-C1, Class B, 4.044% 4/15/20507,13 | 450 | 415 | ||||||
| Deutsche Bank Commercial Mortgage Trust, Series 2016-C1, Class AM, 3.539% 5/10/204913 | 400 | 371 | ||||||
| Extended Stay America Trust, Series 2021-ESH, Class A, (1-month USD-LIBOR + 1.08%) 5.534% 7/15/20387,8,13 | 4,405 | 4,348 | ||||||
| Extended Stay America Trust, Series 2021-ESH, Class B, (1-month USD-LIBOR + 1.38%) 5.84% 7/15/20387,8,13 | 4,021 | 3,937 | ||||||
| Extended Stay America Trust, Series 2021-ESH, Class C, (1-month USD-LIBOR + 1.70%) 6.16% 7/15/20387,8,13 | 4,200 | 4,107 | ||||||
| Extended Stay America Trust, Series 2021-ESH, Class D, (1-month USD-LIBOR + 2.25%) 6.704% 7/15/20387,8,13 | 1,842 | 1,799 | ||||||
| GS Mortgage Securities Trust, Series 2022-SHIP, Class A, (1-month USD CME Term SOFR + 0.731%) 5.209% 8/15/20247,8,13 | 2,633 | 2,621 | ||||||
| GS Mortgage Securities Trust, Series 2022-SHIP, Class B, (1-month USD CME Term SOFR + 1.424%) 5.902% 8/15/20247,8,13 | 879 | 875 | ||||||
| GS Mortgage Securities Trust, Series 2022-SHIP, Class D, (1-month USD CME Term SOFR + 1.607%) 6.085% 8/15/20247,8,13 | 2,032 | 1,985 | ||||||
| GS Mortgage Securities Trust, Series 2022-SHIP, Class C, (1-month USD CME Term SOFR + 1.919%) 7.654% 8/15/20247,8,13 | 1,362 | 1,346 | ||||||
| GS Mortgage Securities Trust, Series 2017-GS7, Class A4, 3.43% 8/10/205013 | 940 | 888 | ||||||
| GS Mortgage Securities Trust, Series 2019-GC38, Class A4, 3.968% 2/10/205213 | 240 | 230 | ||||||
| GS Mortgage Securities Trust, Series 2020-GC47, Class A5, 2.377% 5/12/205313 | 6,571 | 5,661 | ||||||
| JPMBB Commercial Mortgage Securities Trust, Series 2014-C18, Class A5, 4.079% 2/15/204713 | 7,735 | 7,587 | ||||||
| JPMDB Commercial Mortgage Securities Trust, Series 2017-C5, Class A5, 3.694% 3/15/205013 | 1,510 | 1,438 | ||||||
| JPMDB Commercial Mortgage Securities Trust, Series 2017-C7, Class A5, 3.409% 10/15/205013 | 560 | 528 | ||||||
| JPMorgan Chase Commercial Mortgage Securities Trust, Series 2022-OPO, Class A, 3.024% 1/5/20398,13 | 3,928 | 3,443 | ||||||
| JPMorgan Chase Commercial Mortgage Securities Trust, Series 2022-OPO, Class C, 3.377% 1/5/20398,13 | 1,735 | 1,453 | ||||||
| JPMorgan Chase Commercial Mortgage Securities Trust, Series 2022-OPO, Class C, 3.45% 1/5/20397,8,13 | 1,569 | 1,255 | ||||||
| JPMorgan Chase Commercial Mortgage Securities Trust, Series 2021-410T, Class A, 2.287% 3/5/20428,13 | 4,858 | 4,157 | ||||||
| JPMorgan Chase Commercial Mortgage Securities Trust, Series 2016-JP4, Class A4, 3.648% 12/15/20497,13 | 4,810 | 4,605 | ||||||
| LUXE Commercial Mortgage Trust, Series 2021-TRIP, Class A, (1-month USD-LIBOR + 1.05%) 5.504% 10/15/20387,8,13 | 2,054 | 2,003 | ||||||
| LUXE Commercial Mortgage Trust, Series 2021-TRIP, Class B, (1-month USD-LIBOR + 1.40%) 5.854% 10/15/20387,8,13 | 2,856 | 2,754 | ||||||
| Manhattan West Mortgage Trust, Series 2020-1MW, Class A, 2.13% 9/10/20398,13 | 15,628 | 13,738 | ||||||
| MHC Commercial Mortgage Trust, CMO, Series 2021-MHC, Class A, (1-month USD-LIBOR + 0.801%) 5.255% 4/15/20267,8,13 | 6,365 | 6,259 | ||||||
| Morgan Stanley Bank of America Merrill Lynch Trust, Series 2014-C17, Class A5, 3.741% 8/15/204713 | 4,811 | 4,683 | ||||||
| Morgan Stanley Bank of America Merrill Lynch Trust, Series 2015-C22, Class A-4, 3.306% 4/15/204813 | 960 | 920 | ||||||
| Morgan Stanley Bank of America Merrill Lynch Trust, Series 2016-C32, Class A-4, 3.72% 12/15/204913 | 580 | 554 | ||||||
| Morgan Stanley Capital I Trust, Series 2015-UBS8, Class AS, 4.114% 12/15/204813 | 1,000 | 932 | ||||||
| SLG Office Trust, Series 2021-OVA, Class A, 2.585% 7/15/20418,13 | 5,645 | 4,732 | ||||||
| The Income Fund of America | 39 |
| Bonds, notes & other debt instruments (continued) | Principal amount (000) | Value (000) | ||||||
| Mortgage-backed obligations (continued) | ||||||||
| Commercial mortgage-backed securities (continued) | ||||||||
| SREIT Trust, Series 2021-MFP, Class A, (1-month USD-LIBOR + 0.731%) 5.19% 11/15/20387,8,13 | USD | 9,616 | $ | 9,390 | ||||
| StorageMart Commercial Mortgage Trust, Series 2022-MINI, Class A, (1-month USD CME Term SOFR + 1.00%) 5.478% 1/15/20397,8,13 | 19,555 | 19,118 | ||||||
| Wells Fargo Commercial Mortgage Trust, Series 2015-SG1, Class A-4, 3.789% 9/15/204813 | 5,605 | 5,411 | ||||||
| Wells Fargo Commercial Mortgage Trust, Series 2016-C34, Class AS, 3.484% 6/15/204913 | 185 | 171 | ||||||
| Wells Fargo Commercial Mortgage Trust, Series 2016-C37, Class A5, 3.794% 12/15/204913 | 6,015 | 5,782 | ||||||
| Wells Fargo Commercial Mortgage Trust, Series 2019-C54, Class A4, 3.146% 12/15/205213 | 2,405 | 2,178 | ||||||
| Wells Fargo Commercial Mortgage Trust, Series 2016-NXS5, Class AS, 3.988% 1/15/205913 | 150 | 140 | ||||||
| Wells Fargo Commercial Mortgage Trust, Series 2017-RC1, Class A4, 3.631% 1/15/206013 | 480 | 458 | ||||||
| WMRK Commercial Mortgage Trust, Series 2022-WMRK, Class A, (1-month USD CME Term SOFR + 2.789%) 7.267% 11/15/20277,8,13 | 13,994 | 14,024 | ||||||
| 250,197 | ||||||||
| Collateralized mortgage-backed obligations (privately originated) 0.11% | ||||||||
| Arroyo Mortgage Trust, Series 2021-1R, Class A1, 1.175% 10/25/20487,8,13 | 3,101 | 2,631 | ||||||
| Arroyo Mortgage Trust, Series 2020-1, Class A1A, 1.662% 3/25/20558,13 | 387 | 359 | ||||||
| Bellemeade Re, Ltd., Series 2019-3A, Class M1B, (1-month USD-LIBOR + 1.60%) 6.106% 7/25/20297,8,13 | 853 | 853 | ||||||
| BRAVO Residential Funding Trust, Series 2020-RPL2, Class A1, 2.00% 5/25/20597,8,13 | 2,182 | 1,997 | ||||||
| BRAVO Residential Funding Trust, Series 2020-RPL1, Class A1, 2.50% 5/26/20597,8,13 | 1,387 | 1,322 | ||||||
| BRAVO Residential Funding Trust, Series 2022-R1, Class A, 3.125% 1/29/2070 (6.125% on 1/29/2025)8,10,13 | 6,218 | 5,653 | ||||||
| Cascade Funding Mortgage Trust, Series 2020-HB4, Class A, 0.946% 12/26/20307,8,13 | 603 | 587 | ||||||
| Cascade Funding Mortgage Trust, Series 2018-RM2, Class A, 4.00% 10/25/20687,8,13 | 1,115 | 1,086 | ||||||
| Citigroup Mortgage Loan Trust, Series 2020-EXP1, Class A1A, 1.804% 5/25/20607,8,13 | 482 | 442 | ||||||
| COLT Mortgage Loan Trust, Series 2021-5, Class A1, 1.726% 11/26/20667,8,13 | 2,864 | 2,487 | ||||||
| Connecticut Avenue Securities Trust, Series 2021-R01, Class 1M1, (30-day Average USD-SOFR + 0.75%) 5.06% 10/25/20417,8,13 | 268 | 267 | ||||||
| Countrywide Alternative Loan Trust, Series 2005-54CB, Class 2A5, 5.50% 11/25/203513 | 1,739 | 1,037 | ||||||
| Countrywide Alternative Loan Trust, Series 2007-HY4, Class 3A1, 3.438% 6/25/20477,13 | 975 | 820 | ||||||
| Credit Suisse Mortgage Trust, Series 2020-NET, Class A, 2.257% 8/15/20378,13 | 10,711 | 9,749 | ||||||
| Credit Suisse Mortgage Trust, Series 2017-RPL3, Class A1, 2.00% 1/25/20607,8,13 | 5,738 | 5,066 | ||||||
| CS First Boston Mortgage Securities Corp., Series 2004-5, Class IVA1, 6.00% 9/25/203413 | 295 | 285 | ||||||
| Finance of America Structured Securities Trust, Series 2019-JR1, Class A, 2.00% 3/25/20698,13 | 5,727 | 6,183 | ||||||
| Finance of America Structured Securities Trust, Series 2019-JR2, Class A1, 2.00% 6/25/20698,13 | 6,233 | 6,669 | ||||||
| Finance of America Structured Securities Trust, Series 2019-JR3, Class A, 2.00% 9/25/20698,13 | 1,926 | 1,995 | ||||||
| Finance of America Structured Securities Trust, Series 2019-JR4, Class A, 2.00% 11/25/20698,13 | 2,172 | 2,170 | ||||||
| Flagstar Mortgage Trust, Series 2021-5INV, Class A2, 2.50% 7/25/20517,8,13 | 6,865 | 5,763 | ||||||
| Flagstar Mortgage Trust, Series 2021-6INV, Class A4, 2.50% 8/25/20517,8,13 | 6,422 | 5,392 | ||||||
| Flagstar Mortgage Trust, Series 2021-8INV, Class A3, 2.50% 9/25/20517,8,13 | 6,669 | 5,599 | ||||||
| Flagstar Mortgage Trust, Series 2021-10INV, Class A3, 2.50% 10/25/20517,8,13 | 2,905 | 2,439 | ||||||
| Flagstar Mortgage Trust, Series 2021-11INV, Class A4, 2.50% 11/25/20517,8,13 | 7,379 | 6,185 | ||||||
| Freddie Mac Structured Agency Credit Risk Debt Notes, Series 2022-DNA6, Class M1A, (30-day Average USD-SOFR + 2.15%) 6.46% 9/25/20427,8,13 | 2,131 | 2,150 | ||||||
| Home Partners of America Trust, Series 2021-2, Class A, 1.901% 12/17/20268,13 | 6,444 | 5,768 | ||||||
| Hundred Acre Wood Trust, Series 2021-INV1, Class A3, 2.50% 7/25/20517,8,13 | 1,279 | 1,074 | ||||||
| IndyMac INDX Mortgage Loan Trust, Series 2006-AR5, Class 2A1, 3.149% 5/25/20367,13 | 1,342 | 1,155 | ||||||
| JPMorgan Mortgage Trust, Series 2020-INV1, Class A3, 3.50% 8/25/20507,8,13 | 619 | 563 | ||||||
| Legacy Mortgage Asset Trust, Series 2021-GS2, Class A1, 1.75% 4/25/20617,8,13 | 1,132 | 1,071 | ||||||
| Mello Warehouse Securitization Trust, Series 2021-3, Class A, (1-month USD-LIBOR + 0.85%) 5.356% 11/25/20557,8,13 | 6,060 | 5,872 | ||||||
| Onslow Bay Financial Mortgage Loan Trust, Series 2022-J1, Class A2, 2.50% 2/25/20527,8,13 | 5,557 | 4,665 | ||||||
| Progress Residential Trust, Series 2022-SFR3, Class A, 3.20% 4/17/20398,13 | 2,750 | 2,563 | ||||||
| Sequoia Mortgage Trust, Series 2018-CH1, Class A1, 4.00% 2/25/20487,8,13 | 197 | 186 | ||||||
| 40 | The Income Fund of America |
| Bonds, notes & other debt instruments (continued) | Principal amount (000) | Value (000) | ||||||
| Mortgage-backed obligations (continued) | ||||||||
| Collateralized mortgage-backed obligations (privately originated) (continued) | ||||||||
| Structured Adjustable Rate Mortgage Loan Trust, Series 2006-4, Class 6A, 3.764% 5/25/20367,13 | USD | 1,142 | $ | 785 | ||||
| Towd Point Mortgage Trust, Series 2023-1, Class A1, 3.75% 1/25/20638,13 | 7,839 | 7,513 | ||||||
| Treehouse Park Improvement Association No.1 - Anleihen 9.75% 12/1/20332,8 | 10,003 | 8,849 | ||||||
| Verus Securitization Trust, Series 2023-1, Class A1, 5.85% 12/25/2067 (6.85% on 1/1/2027)8,10,13 | 2,209 | 2,213 | ||||||
| VM Fund I, LLC 8.625% 1/15/20282,8 | 16,924 | 16,670 | ||||||
| 138,133 | ||||||||
| Total mortgage-backed obligations | 5,179,970 | |||||||
| U.S. Treasury bonds & notes 2.94% | ||||||||
| U.S. Treasury 2.63% | ||||||||
| U.S. Treasury 2.75% 4/30/2023 | 10,000 | 9,955 | ||||||
| U.S. Treasury 2.75% 7/31/2023 | 16,300 | 16,143 | ||||||
| U.S. Treasury 6.25% 8/15/2023 | 7,100 | 7,159 | ||||||
| U.S. Treasury 0.125% 8/31/2023 | 1,890 | 1,841 | ||||||
| U.S. Treasury 0.25% 3/15/2024 | 14,000 | 13,329 | ||||||
| U.S. Treasury 3.25% 8/31/2024 | 153,693 | 150,926 | ||||||
| U.S. Treasury 4.25% 12/31/2024 | 250,000 | 249,977 | ||||||
| U.S. Treasury 0.25% 8/31/2025 | 32,594 | 29,656 | ||||||
| U.S. Treasury 3.875% 1/15/2026 | 235,671 | 235,616 | ||||||
| U.S. Treasury 0.875% 9/30/2026 | 5,558 | 5,014 | ||||||
| U.S. Treasury 1.125% 10/31/2026 | 1,963 | 1,785 | ||||||
| U.S. Treasury 1.625% 11/30/2026 | 20,000 | 18,517 | ||||||
| U.S. Treasury 2.75% 4/30/2027 | 1,000 | 963 | ||||||
| U.S. Treasury 0.50% 8/31/2027 | 10,000 | 8,687 | ||||||
| U.S. Treasury 3.875% 12/31/2027 | 245,000 | 247,739 | ||||||
| U.S. Treasury 3.50% 1/31/2028 | 486,232 | 483,894 | ||||||
| U.S. Treasury 1.50% 11/30/2028 | 10,000 | 8,901 | ||||||
| U.S. Treasury 3.50% 1/31/2030 | 157,626 | 157,016 | ||||||
| U.S. Treasury 1.50% 2/15/2030 | 31,651 | 27,780 | ||||||
| U.S. Treasury 1.625% 5/15/2031 | 31,156 | 27,092 | ||||||
| U.S. Treasury 4.125% 11/15/2032 | 637,483 | 670,279 | ||||||
| U.S. Treasury 1.375% 11/15/204015 | 149,317 | 103,168 | ||||||
| U.S. Treasury 1.75% 8/15/2041 | 17,045 | 12,405 | ||||||
| U.S. Treasury 2.00% 11/15/2041 | 11,924 | 9,055 | ||||||
| U.S. Treasury 2.375% 2/15/2042 | 72,717 | 58,792 | ||||||
| U.S. Treasury 4.00% 11/15/2042 | 26,252 | 27,103 | ||||||
| U.S. Treasury 2.875% 11/15/2046 | 27,970 | 24,053 | ||||||
| U.S. Treasury 2.875% 5/15/2049 | 25,000 | 21,545 | ||||||
| U.S. Treasury 2.00% 2/15/2050 | 20,000 | 14,253 | ||||||
| U.S. Treasury 2.375% 5/15/2051 | 2,224 | 1,719 | ||||||
| U.S. Treasury 2.00% 8/15/2051 | 1,710 | 1,210 | ||||||
| U.S. Treasury 3.00% 8/15/205215 | 627,855 | 554,260 | ||||||
| 3,199,832 | ||||||||
| U.S. Treasury inflation-protected securities 0.31% | ||||||||
| U.S. Treasury Inflation-Protected Security 0.25% 1/15/202516 | 43,994 | 42,465 | ||||||
| U.S. Treasury Inflation-Protected Security 0.375% 7/15/202516 | 46,263 | 44,772 | ||||||
| U.S. Treasury Inflation-Protected Security 0.125% 10/15/202516 | 6,196 | 5,943 | ||||||
| U.S. Treasury Inflation-Protected Security 0.125% 4/15/202616 | 70,243 | 66,768 | ||||||
| U.S. Treasury Inflation-Protected Security 0.125% 10/15/202616 | 32,686 | 31,090 | ||||||
| U.S. Treasury Inflation-Protected Security 1.625% 10/15/202716 | 75,378 | 76,400 | ||||||
| U.S. Treasury Inflation-Protected Security 0.875% 1/15/202916 | 70,745 | 68,858 | ||||||
| U.S. Treasury Inflation-Protected Security 0.25% 7/15/202916 | 4,947 | 4,635 | ||||||
| U.S. Treasury Inflation-Protected Security 0.125% 1/15/203116 | 43,717 | 39,888 | ||||||
| 380,819 | ||||||||
| Total U.S. Treasury bonds & notes | 3,580,651 | |||||||
| Asset-backed obligations 1.10% | ||||||||
| Aesop Funding, LLC, Series 2017-2A, Class A, 2.97% 3/20/20248,13 | 960 | 958 | ||||||
| Aesop Funding, LLC, Series 2018-1A, Class A, 3.70% 9/20/20248,13 | 1,671 | 1,657 | ||||||
| Aesop Funding, LLC, Series 2018-2A, Class A, 4.00% 3/20/20258,13 | 9,400 | 9,280 | ||||||
| Aesop Funding, LLC, Series 2019-3A, Class A, 2.36% 3/20/20268,13 | 3,125 | 2,958 | ||||||
| Aesop Funding, LLC, Series 2020-1A, Class D, 3.34% 8/20/20268,13 | 8,500 | 7,677 | ||||||
| The Income Fund of America | 41 |
| Bonds, notes & other debt instruments (continued) | Principal amount (000) | Value (000) | ||||||
| Asset-backed obligations (continued) | ||||||||
| Aesop Funding, LLC, Series 2020-2, Class A, 2.02% 2/20/20278,13 | USD | 5,663 | $ | 5,185 | ||||
| Aesop Funding, LLC, Series 2021-1A, Class A, 1.38% 8/20/20278,13 | 29,959 | 26,637 | ||||||
| Aesop Funding, LLC, Series 2021-1A, Class B, 1.63% 8/20/20278,13 | 1,699 | 1,479 | ||||||
| Aesop Funding, LLC, Series 2021-1A, Class C, 2.13% 8/20/20278,13 | 551 | 476 | ||||||
| Aesop Funding, LLC, Series 2021-1A, Class D, 3.71% 8/20/20278,13 | 5,000 | 4,217 | ||||||
| Affirm Asset Securitization Trust, Series 2021-Z2, Class A, 1.17% 11/16/20268,13 | 1,368 | 1,312 | ||||||
| Allegro CLO, Ltd., Series 2016-1A, Class AR2, (3-month USD-LIBOR + 0.95%) 5.742% 1/15/20307,8,13 | 8,237 | 8,185 | ||||||
| Allegro CLO, Ltd., Series 2017-1A, Class AR, (3-month USD-LIBOR + 0.95%) 5.742% 10/16/20307,8,13 | 6,424 | 6,323 | ||||||
| American Credit Acceptance Receivables Trust, Series 2020-3, Class C, 1.85% 6/15/20268,13 | 2,188 | 2,169 | ||||||
| American Credit Acceptance Receivables Trust, Series 2021-1, Class C, 0.83% 3/15/20278,13 | 1,423 | 1,397 | ||||||
| American Credit Acceptance Receivables Trust, Series 2021-1, Class D, 1.14% 3/15/20278,13 | 1,201 | 1,141 | ||||||
| American Credit Acceptance Receivables Trust, Series 2021-3, Class C, 0.98% 11/15/20278,13 | 6,741 | 6,563 | ||||||
| American Credit Acceptance Receivables Trust, Series 2021-3, Class D, 1.34% 11/15/20278,13 | 2,531 | 2,381 | ||||||
| American Express Credit Account Master Trust, Series 2018-9, Class A, (1-month USD-LIBOR + 0.38%) 4.834% 4/15/20267,13 | 20,000 | 20,011 | ||||||
| AmeriCredit Automobile Receivables Trust, Series 2021-2, Class B, 0.69% 1/19/202713 | 3,042 | 2,867 | ||||||
| AmeriCredit Automobile Receivables Trust, Series 2021-2, Class C, 1.01% 1/19/202713 | 3,382 | 3,107 | ||||||
| AmeriCredit Automobile Receivables Trust, Series 2021-2, Class D, 1.29% 6/18/202713 | 7,972 | 7,149 | ||||||
| Ares CLO, Ltd., Series 2017-42A, Class AR, (3-month USD-LIBOR + 0.92%) 5.735% 1/22/20287,8,13 | 9,671 | 9,607 | ||||||
| Avis Budget Rental Car Funding (AESOP), LLC, Series 2020-2A, Class B, 2.96% 2/20/20278,13 | 1,453 | 1,342 | ||||||
| Avis Budget Rental Car Funding (AESOP), LLC, Series 2020-2, Class A, 4.25% 2/20/20278,13 | 4,605 | 4,312 | ||||||
| BA Credit Card Trust, Series 2022-A2, Class A2, 5.00% 4/17/202813 | 14,798 | 15,090 | ||||||
| Ballyrock CLO, Ltd., Series 2019-2A, Class A1AR, (3-month USD-LIBOR + 1.00%) 5.675% 11/20/20307,8,13 | 14,610 | 14,508 | ||||||
| Bankers Healthcare Group Securitization Trust, Series 2021-A, Class A, 1.42% 11/17/20338,13 | 833 | 779 | ||||||
| Blackbird Capital II Aircraft Lease, Ltd. / Blackbird Capital II Aircraft Lease US, LLC, Series 2021-1, Class A, 2.443% 7/15/20468,13 | 8,086 | 6,874 | ||||||
| Blackbird Capital II Aircraft Lease, Ltd. / Blackbird Capital II Aircraft Lease US, LLC, Series 2021-1, Class B, 3.446% 7/15/20468,13 | 1,354 | 1,048 | ||||||
| CarMax Auto Owner Trust, Series 2019-2, Class C, 3.16% 2/18/202513 | 450 | 445 | ||||||
| CarMax Auto Owner Trust, Series 2021-1, Class C, 0.94% 12/15/202613 | 313 | 284 | ||||||
| CarMax Auto Owner Trust, Series 2021-1, Class D, 1.28% 7/15/202713 | 307 | 274 | ||||||
| Carvana Auto Receivables Trust, Series 2021-N4, Class C, 1.72% 9/11/202813 | 1,363 | 1,309 | ||||||
| Carvana Auto Receivables Trust, Series 2021-N4, Class A2, 1.80% 9/11/202813 | 1,948 | 1,793 | ||||||
| Castlelake Aircraft Securitization Trust, Series 2021-1, Class A, 2.868% 5/11/20378,13 | 12,105 | 10,449 | ||||||
| Castlelake Aircraft Securitization Trust, Series 2021-1, Class C, 3.464% 5/11/20378,13 | 7,390 | 6,427 | ||||||
| Castlelake Aircraft Securitization Trust, Series 2021-1, Class C, 6.171% 5/11/20378,13 | 14,334 | 11,903 | ||||||
| Castlelake Aircraft Securitization Trust, Series 2017-1R, Class A, 2.741% 8/15/20418,13 | 2,442 | 2,243 | ||||||
| Cent CLO, Ltd., Series 2014-21A, Class AR, (3-month USD-LIBOR + 0.97%) 5.785% 7/27/20307,8,13 | 19,317 | 19,131 | ||||||
| CF Hippolyta, LLC, Series 2020-1, Class A1, 1.69% 7/15/20608,13 | 24,040 | 21,749 | ||||||
| CF Hippolyta, LLC, Series 2020-1, Class A2, 1.99% 7/15/20608,13 | 5,870 | 5,002 | ||||||
| CF Hippolyta, LLC, Series 2020-1, Class B1, 2.28% 7/15/20608,13 | 5,345 | 4,764 | ||||||
| CF Hippolyta, LLC, Series 2020-1, Class B2, 2.60% 7/15/20608,13 | 569 | 478 | ||||||
| CF Hippolyta, LLC, Series 2021-1, Class A1, 1.53% 3/15/20618,13 | 15,131 | 13,355 | ||||||
| CF Hippolyta, LLC, Series 2021-1, Class B1, 1.98% 3/15/20618,13 | 2,857 | 2,460 | ||||||
| CF Hippolyta, LLC, Series 2022-1, Class A1, 5.97% 8/15/20628,13 | 23,207 | 23,149 | ||||||
| CF Hippolyta, LLC, Series 2022-1, Class A2, 6.11% 8/15/20628,13 | 19,203 | 18,605 | ||||||
| Citibank Credit Card Issuance Trust, Series 2017-A5, Class A5, (1-month USD-LIBOR + 0.62%) 5.128% 4/22/20267,13 | 9,919 | 9,952 | ||||||
| CLI Funding VI, LLC, Series 2020-2A, Class A, 2.03% 9/15/20458,13 | 3,508 | 3,108 | ||||||
| CLI Funding VI, LLC, Series 2020-1A, Class A, 2.08% 9/18/20458,13 | 1,468 | 1,304 | ||||||
| CLI Funding VI, LLC, Series 2020-3A, Class A, 2.07% 10/18/20458,13 | 9,244 | 8,236 | ||||||
| CLI Funding VIII, LLC, Series 2021-1A, Class A, 1.64% 2/18/20468,13 | 16,644 | 14,592 | ||||||
| CLI Funding VIII, LLC, Series 2021-1A, Class A, 2.38% 2/18/20468,13 | 646 | 548 | ||||||
| CPS Auto Receivables Trust, Series 2019-B, Class D, 3.69% 3/17/20258,13 | 95 | 95 | ||||||
| 42 | The Income Fund of America |
| Bonds, notes & other debt instruments (continued) | Principal amount (000) | Value (000) | ||||||
| Asset-backed obligations (continued) | ||||||||
| CPS Auto Receivables Trust, Series 2019-C, Class D, 3.17% 6/16/20258,13 | USD | 460 | $ | 459 | ||||
| CPS Auto Receivables Trust, Series 2021-A, Class C, 0.83% 9/15/20268,13 | 650 | 643 | ||||||
| CPS Auto Receivables Trust, Series 2021-A, Class D, 1.16% 12/15/20268,13 | 883 | 841 | ||||||
| CWHEQ Revolving Home Equity Loan Trust, Series 2006-I, Class 2A, FSA insured, (1-month USD-LIBOR + 0.14%) 4.599% 1/15/20377,13 | 274 | 254 | ||||||
| CWHEQ Revolving Home Equity Loan Trust, Series 2007-B, Class A, FSA insured, (1-month USD-LIBOR + 0.15%) 4.609% 2/15/20377,13 | 481 | 446 | ||||||
| Discover Card Execution Note Trust, Series 2018-A6, Class A6, (1-month USD-LIBOR + 0.39%) 4.844% 3/15/20267,13 | 26,000 | 26,004 | ||||||
| Drive Auto Receivables Trust, Series 2019-3, Class D, 3.18% 10/15/202613 | 11,164 | 11,060 | ||||||
| Drive Auto Receivables Trust, Series 2021-1, Class C, 1.02% 6/15/202713 | 7,522 | 7,372 | ||||||
| Drive Auto Receivables Trust, Series 2021-1, Class D, 1.45% 1/16/202913 | 6,079 | 5,728 | ||||||
| DriveTime Auto Owner Trust, Series 2019-2A, Class D, 3.48% 2/18/20258,13 | 2,836 | 2,824 | ||||||
| DriveTime Auto Owner Trust, Series 2019-3, Class D, 2.96% 4/15/20258,13 | 1,708 | 1,686 | ||||||
| DriveTime Auto Owner Trust, Series 2020-3A, Class C, 1.47% 6/15/20268,13 | 1,961 | 1,910 | ||||||
| DriveTime Auto Owner Trust, Series 2021-1A, Class C, 0.84% 10/15/20268,13 | 1,232 | 1,190 | ||||||
| DriveTime Auto Owner Trust, Series 2022-3, Class A, 6.05% 10/15/20268,13 | 14,240 | 14,298 | ||||||
| DriveTime Auto Owner Trust, Series 2021-1A, Class D, 1.16% 11/16/20268,13 | 671 | 620 | ||||||
| DriveTime Auto Owner Trust, Series 2021-2A, Class B, 0.81% 1/15/20278,13 | 1,769 | 1,744 | ||||||
| DriveTime Auto Owner Trust, Series 2021-2A, Class C, 1.10% 2/16/20278,13 | 1,847 | 1,769 | ||||||
| DriveTime Auto Owner Trust, Series 2021-2A, Class D, 1.50% 2/16/20278,13 | 1,247 | 1,160 | ||||||
| Dryden Senior Loan Fund, CLO, Series 2017-47A, Class A1R, (3-month USD-LIBOR + 0.98%) 5.772% 4/15/20287,8,13 | 19,639 | 19,524 | ||||||
| EDvestinU Private Education Loan, LLC, Series 2021-A, Class A, 1.80% 11/25/20458,13 | 1,608 | 1,403 | ||||||
| Enterprise Fleet Financing, LLC, Series 2022-1, Class A2, 3.03% 1/20/20288,13 | 11,419 | 11,139 | ||||||
| Enterprise Fleet Financing, LLC, Series 2022-3, Class A3, 4.29% 7/20/20298,13 | 3,349 | 3,214 | ||||||
| Enterprise Fleet Financing, LLC, Series 2022-3, Class A2, 4.38% 7/20/20298,13 | 10,200 | 10,035 | ||||||
| Enterprise Fleet Financing, LLC, Series 2022-4, Class A2, 5.76% 10/22/20298,13 | 11,497 | 11,576 | ||||||
| Exeter Automobile Receivables Trust, Series 2019-2A, Class D, 3.71% 3/17/20258,13 | 3,935 | 3,900 | ||||||
| Exeter Automobile Receivables Trust, Series 2020-3A, Class C, 1.32% 7/15/202513 | 811 | 803 | ||||||
| Exeter Automobile Receivables Trust, Series 2019-3A, Class D, 3.11% 8/15/20258,13 | 4,419 | 4,358 | ||||||
| Exeter Automobile Receivables Trust, Series 2022-6, Class A2, 5.73% 11/17/202513 | 2,933 | 2,936 | ||||||
| Exeter Automobile Receivables Trust, Series 2020-1A, Class D, 2.73% 12/15/20258,13 | 1,353 | 1,326 | ||||||
| Exeter Automobile Receivables Trust, Series 2021-2, Class C, 0.98% 6/15/202613 | 5,579 | 5,397 | ||||||
| Exeter Automobile Receivables Trust, Series 2020-3A, Class D, 1.73% 7/15/202613 | 1,786 | 1,727 | ||||||
| Exeter Automobile Receivables Trust, Series 2021-2, Class D, 1.40% 4/15/202713 | 8,065 | 7,474 | ||||||
| Exeter Automobile Receivables Trust, Series 2022-4A, Class C, 4.92% 12/15/202813 | 3,484 | 3,430 | ||||||
| FirstKey Homes Trust, Series 2020-SFR2, Class A, 1.266% 10/19/20378,13 | 10,074 | 9,162 | ||||||
| FirstKey Homes Trust, Series 2022-SFR2, Class A, 4.145% 5/17/20398,13 | 4,215 | 4,089 | ||||||
| Flagship Credit Auto Trust, Series 2022-4, Class A2, 6.15% 9/15/20268,13 | 6,544 | 6,590 | ||||||
| Ford Credit Auto Owner Trust, Series 2018-2, Class A, 3.47% 1/15/20308,13 | 10,105 | 10,025 | ||||||
| Ford Credit Auto Owner Trust, Series 2018-1, Class A, 3.52% 7/15/20308,13 | 5,634 | 5,548 | ||||||
| Ford Credit Auto Owner Trust, Series 2018-1, Class A, 3.19% 7/15/20318,13 | 3,650 | 3,541 | ||||||
| Ford Credit Auto Owner Trust, Series 2020-1, Class A, 2.04% 8/15/20318,13 | 23,146 | 21,914 | ||||||
| GCI Funding I, LLC, Series 2020-1, Class A, 2.82% 10/18/20458,13 | 3,878 | 3,507 | ||||||
| GCI Funding I, LLC, Series 2021-1, Class A, 2.38% 6/18/20468,13 | 1,548 | 1,360 | ||||||
| GCI Funding I, LLC, Series 2021-1, Class B, 3.04% 6/18/20468,13 | 117 | 101 | ||||||
| Global SC Finance V SRL, Series 2020-1A, Class A, 2.17% 10/17/20408,13 | 9,018 | 8,198 | ||||||
| Global SC Finance VII SRL, Series 2020-2A, Class A, 2.26% 11/19/20408,13 | 16,394 | 14,874 | ||||||
| Global SC Finance VII SRL, Series 2021-1A, Class A, 1.86% 4/17/20418,13 | 26,481 | 23,305 | ||||||
| Global SC Finance VII SRL, Series 2021-2A, Class A, 1.95% 8/17/20418,13 | 22,882 | 20,287 | ||||||
| Global SC Finance VII SRL, Series 2021-2A, Class B, 2.49% 8/17/20418,13 | 2,148 | 1,852 | ||||||
| Hertz Vehicle Financing III, LLC, Series 2021-A, Class B, 3.65% 6/30/20232,8,13 | 10,370 | 10,317 | ||||||
| Hertz Vehicle Financing III, LLC, Series 2021-1A, Class A, 1.21% 12/26/20258,13 | 22,756 | 21,190 | ||||||
| Hertz Vehicle Financing III, LLC, Series 2021-1A, Class B, 1.56% 12/26/20258,13 | 3,534 | 3,276 | ||||||
| Hertz Vehicle Financing III, LLC, Series 2021-1A, Class C, 2.05% 12/26/20258,13 | 1,744 | 1,604 | ||||||
| Hertz Vehicle Financing III, LLC, Series 2022-4A, Class A, 3.73% 9/25/20268,13 | 15,340 | 14,797 | ||||||
| Hertz Vehicle Financing III, LLC, Series 2021-2A, Class A, 1.68% 12/27/20278,13 | 18,858 | 16,712 | ||||||
| Hertz Vehicle Financing III, LLC, Series 2021-2A, Class B, 2.12% 12/27/20278,13 | 3,369 | 2,969 | ||||||
| Hertz Vehicle Financing III, LLC, Series 2021-2A, Class C, 2.52% 12/27/20278,13 | 1,850 | 1,608 | ||||||
| Hertz Vehicle Financing III, LLC, Series 2022-2A, Class A, 2.33% 6/26/20288,13 | 8,300 | 7,448 | ||||||
| Hertz Vehicle Financing III, LLC, Series 2022-5A, Class A, 3.89% 9/25/20288,13 | 7,264 | 6,935 | ||||||
| LAD Auto Receivables Trust, Series 2022-1, Class A, 5.21% 6/15/20278,13 | 1,870 | 1,846 | ||||||
| Longfellow Place CLO, Ltd., Series 2013-1A, Class AR3, (3-month USD-LIBOR + 1.00%) 5.792% 4/15/20297,8,13 | 2,292 | 2,284 | ||||||
| Madison Park Funding, Ltd., CLO, Series 2015-17A, Class AR2, (3-month USD-LIBOR + 1.00%) 5.815% 7/21/20307,8,13 | 21,656 | 21,414 | ||||||
| The Income Fund of America | 43 |
| Bonds, notes & other debt instruments (continued) | Principal amount (000) | Value (000) | ||||||
| Asset-backed obligations (continued) | ||||||||
| Marathon CLO, Ltd., Series 2017-9A, Class A1AR, (3-month USD-LIBOR + 1.15%) 5.942% 4/15/20297,8,13 | USD | 7,587 | $ | 7,530 | ||||
| Mercury Financial Credit Card Master Trust, Series 2021-1A, Class A, 1.54% 3/20/20268,13 | 16,100 | 16,100 | ||||||
| Mission Lane Credit Card Master Trust, Series 2021-A, Class A, 1.59% 9/15/20268,13 | 3,039 | 2,958 | ||||||
| Mission Lane Credit Card Master Trust, Series 2022-A, Class A, 6.92% 9/15/20278,13 | 13,019 | 12,772 | ||||||
| Navient Student Loan Trust, Series 2021-C, Class A, 1.06% 10/15/20698,13 | 8,085 | 7,097 | ||||||
| Navient Student Loan Trust, Series 2021-G, Class A, 1.58% 4/15/20708,13 | 10,700 | 9,464 | ||||||
| Navigator Aircraft ABS, Ltd., Series 2021-1, Class A, 2.771% 11/15/20468,13 | 18,275 | 15,566 | ||||||
| Nelnet Student Loan Trust, Series 2021-C, Class AFX, 1.32% 4/20/20628,13 | 17,051 | 15,300 | ||||||
| Nelnet Student Loan Trust, Series 2021-A, Class APT1, 1.36% 4/20/20628,13 | 9,350 | 8,362 | ||||||
| Nelnet Student Loan Trust, Series 2021-B, Class AFX, 1.42% 4/20/20628,13 | 16,363 | 14,722 | ||||||
| New Economy Assets Phase 1 Issuer, LLC, Series 2021-1, Class A1, 1.91% 10/20/20618,13 | 64,437 | 56,217 | ||||||
| Newark BSL CLO 2, Ltd., Series 2017-1A, Class A1R, (3-month USD-LIBOR + 0.97%) 5.788% 7/25/20307,8,13 | 6,870 | 6,822 | ||||||
| Palmer Square Loan Funding, CLO, Series 2021-1, Class A1, (3-month USD-LIBOR + 0.90%) 5.708% 4/20/20297,8,13 | 822 | 817 | ||||||
| Palmer Square Loan Funding, CLO, Series 2021-4A, Class A1, (3-month USD-LIBOR + 0.80%) 5.592% 10/15/20297,8,13 | 16,152 | 16,027 | ||||||
| Palmer Square Loan Funding, CLO, Series 2021-4A, Class A2, (3-month USD-LIBOR + 1.40%) 6.192% 10/15/20297,8,13 | 8,409 | 8,213 | ||||||
| Palmer Square Loan Funding, CLO, Series 2022-5, Class A1, (3-month USD CME Term SOFR + 1.56%) 6.218% 1/15/20317,8,13 | 18,877 | 18,879 | ||||||
| PFS Financing Corp., Series 2022-D, Class A, 4.27% 8/16/20278,13 | 4,091 | 4,052 | ||||||
| PFS Financing Corp., Series 2022-D, Class B, 4.90% 8/16/20278,13 | 431 | 423 | ||||||
| PG&E Wildfire Recovery Funding, LLC, Series 2022-A, Class A2, 4.263% 6/1/203613 | 4,926 | 4,758 | ||||||
| PPM CLO, Ltd., Series 2022-6, Class A, (3-month USD CME Term SOFR + 2.45%) 2.45% 1/20/20317,8,13 | 19,894 | 19,935 | ||||||
| Prestige Auto Receivables Trust, Series 2019-1A, Class C, 2.70% 10/15/20248,13 | 942 | 940 | ||||||
| Prestige Auto Receivables Trust, Series 2019-1A, Class D, 3.01% 8/15/20258,13 | 1,895 | 1,877 | ||||||
| Race Point CLO, Ltd., Series 2015-9A, Class A1A2, (3-month USD-LIBOR + 0.94%) 5.732% 10/15/20307,8,13 | 18,144 | 17,978 | ||||||
| Santander Drive Auto Receivables Trust, Series 2022-5, Class A2, 3.98% 1/15/202513 | 8,401 | 8,370 | ||||||
| Santander Drive Auto Receivables Trust, Series 2019-2, Class D, 3.22% 7/15/202513 | 1,972 | 1,960 | ||||||
| Santander Drive Auto Receivables Trust, Series 2021-2, Class B, 0.59% 9/15/202513 | 702 | 701 | ||||||
| Santander Drive Auto Receivables Trust, Series 2020-1, Class C, 4.11% 12/15/202513 | 12,293 | 12,231 | ||||||
| Santander Drive Auto Receivables Trust, Series 2020-3, Class C, 1.12% 1/15/202613 | 2,631 | 2,611 | ||||||
| Santander Drive Auto Receivables Trust, Series 2022-7, Class A2, 5.81% 1/15/202613 | 3,973 | 3,988 | ||||||
| Santander Drive Auto Receivables Trust, Series 2021-2, Class C, 0.90% 6/15/202613 | 7,703 | 7,532 | ||||||
| Santander Drive Auto Receivables Trust, Series 2022-5, Class A3, 4.11% 8/17/202613 | 8,984 | 8,888 | ||||||
| Santander Drive Auto Receivables Trust, Series 2020-3, Class D, 1.64% 11/16/202613 | 4,422 | 4,270 | ||||||
| Santander Drive Auto Receivables Trust, Series 2022-5, Class B, 4.43% 3/15/202713 | 2,542 | 2,511 | ||||||
| Santander Drive Auto Receivables Trust, Series 2021-2, Class D, 1.35% 7/15/202713 | 4,938 | 4,646 | ||||||
| Santander Drive Auto Receivables Trust, Series 2021-3, Class C, 0.95% 9/15/202713 | 4,974 | 4,824 | ||||||
| Santander Drive Auto Receivables Trust, Series 2021-3, Class D, 1.33% 9/15/202713 | 3,708 | 3,478 | ||||||
| Santander Drive Auto Receivables Trust, Series 2022-5, Class C, 4.74% 10/15/202813 | 2,374 | 2,350 | ||||||
| Slam, Ltd., Series 2021-1, Class A, 2.434% 6/15/20468,13 | 8,107 | 7,018 | ||||||
| Slam, Ltd., Series 2021-1, Class B, 3.422% 6/15/20468,13 | 1,492 | 1,251 | ||||||
| SOLRR Aircraft Aviation Holding, Ltd., Series 2021-1, Class A, 2.636% 10/15/20468,13 | 9,948 | 8,129 | ||||||
| SPRITE, Ltd., Series 2021-1, Class A, 3.75% 11/15/20468,13 | 16,731 | 14,866 | ||||||
| Stellar Jay Ireland DAC, Series 2021-1, Class A, 3.967% 10/15/20418,13 | 7,918 | 6,765 | ||||||
| Stonepeak Infrastructure Partners, Series 2021-1A, Class AA, 2.301% 2/28/20338,13 | 6,062 | 5,464 | ||||||
| Stonepeak Infrastructure Partners, Series 2021-1A, Class A, 2.675% 2/28/20338,13 | 6,050 | 5,292 | ||||||
| Stratus CLO, Ltd., Series 2022-3, Class A, (3-month USD CME Term SOFR + 2.15%) 6.348% 10/20/20317,8,13 | 15,189 | 15,209 | ||||||
| Stratus CLO, Series 2022-3, Class B, (3-month USD CME Term SOFR + 3.05%) 7.127% 10/20/20317,8,13 | 5,706 | 5,699 | ||||||
| SuttonPark Structured Settlements, Series 2021-1, Class A, 1.95% 9/15/20758,13 | 4,817 | 4,425 | ||||||
| TAL Advantage V, LLC, Series 2020-1A, Class A, 2.05% 9/20/20458,13 | 4,642 | 4,142 | ||||||
| Textainer Marine Containers, Ltd., Series 2020-1A, Class A, 2.73% 8/21/20458,13 | 6,752 | 6,247 | ||||||
| Textainer Marine Containers, Ltd., Series 2020-2A, Class A, 2.10% 9/20/20458,13 | 6,620 | 5,942 | ||||||
| Textainer Marine Containers, Ltd., Series 2021-1A, Class A, 1.68% 2/20/20468,13 | 12,680 | 10,981 | ||||||
| Textainer Marine Containers, Ltd., Series 2021-1A, Class B, 2.52% 2/20/20468,13 | 546 | 465 | ||||||
| Textainer Marine Containers, Ltd., Series 2021-2A, Class A, 2.23% 4/20/20468,13 | 16,697 | 14,709 | ||||||
| TIF Funding II, LLC, Series 2020-1A, Class A, 2.09% 8/20/20458,13 | 7,135 | 6,329 | ||||||
| TIF Funding II, LLC, Series 2021-1A, Class A, 1.65% 2/20/20468,13 | 5,637 | 4,821 | ||||||
| 44 | The Income Fund of America |
| Bonds, notes & other debt instruments (continued) | Principal amount (000) | Value (000) | ||||||
| Asset-backed obligations (continued) | ||||||||
| TIF Funding II, LLC, Series 2021-1A, Class B, 2.54% 2/20/20468,13 | USD | 203 | $ | 169 | ||||
| Triton Container Finance VIII, LLC, Series 2020-1, Class A, 2.11% 9/20/20458,13 | 24,929 | 21,997 | ||||||
| Triton Container Finance VIII, LLC, Series 2021-1, Class A, 1.86% 3/20/20468,13 | 13,030 | 11,299 | ||||||
| Triton Container Finance VIII, LLC, Series 2021-1A, Class B, 2.58% 3/20/20468,13 | 516 | 435 | ||||||
| Verizon Master Trust, Series 2023-1, Class A, 4.49% 1/22/2029 (5.24% on 1/20/2026)10,13 | 17,018 | 17,036 | ||||||
| Westlake Automobile Receivables Trust, Series 2022-3, Class A2, 5.24% 7/15/20258,13 | 10,868 | 10,859 | ||||||
| Westlake Automobile Receivables Trust, Series 2020-3A, Class C, 1.24% 11/17/20258,13 | 3,374 | 3,294 | ||||||
| Westlake Automobile Receivables Trust, Series 2020-3A, Class D, 1.65% 2/17/20268,13 | 6,549 | 6,239 | ||||||
| Westlake Automobile Receivables Trust, Series 2023-1, Class A2A, 5.51% 6/15/20268,13 | 4,244 | 4,252 | ||||||
| Westlake Automobile Receivables Trust, Series 2021-2, Class B, 0.62% 7/15/20268,13 | 5,157 | 4,998 | ||||||
| Westlake Automobile Receivables Trust, Series 2021-2, Class C, 0.89% 7/15/20268,13 | 6,654 | 6,300 | ||||||
| Westlake Automobile Receivables Trust, Series 2021-2, Class D, 1.23% 12/15/20268,13 | 4,413 | 4,083 | ||||||
| Westlake Automobile Receivables Trust, Series 2022-1A, Class D, 3.49% 3/15/20278,13 | 2,924 | 2,730 | ||||||
| Westlake Automobile Receivables Trust, Series 2023-1, Class A3, 5.21% 1/18/20288,13 | 1,754 | 1,758 | ||||||
| 1,331,719 | ||||||||
| Municipals 0.30% | ||||||||
| California 0.01% | ||||||||
| Golden State Tobacco Securitization Corp., Enhanced Tobacco Settlement Asset- Backed Bonds, Series 2021-A-1, 2.158% 6/1/2026 | 2,170 | 1,985 | ||||||
| Golden State Tobacco Securitization Corp., Enhanced Tobacco Settlement Asset- Backed Bonds, Series 2021-A-1, 2.332% 6/1/2027 | 3,010 | 2,703 | ||||||
| Golden State Tobacco Securitization Corp., Enhanced Tobacco Settlement Asset- Backed Bonds, Series 2021-B, 2.746% 6/1/2034 | 785 | 665 | ||||||
| Golden State Tobacco Securitization Corp., Enhanced Tobacco Settlement Asset- Backed Bonds, Series 2021-B, 3.293% 6/1/2042 | 1,855 | 1,472 | ||||||
| Golden State Tobacco Securitization Corp., Enhanced Tobacco Settlement Asset- Backed Bonds, Series 2021-B, 3.00% 6/1/2046 | 3,915 | 3,644 | ||||||
| 10,469 | ||||||||
| Guam 0.00% | ||||||||
| A.B. Won Pat International Airport Auth., General Rev. Bonds, Series 2021-A, 3.839% 10/1/2036 | 400 | 335 | ||||||
| A.B. Won Pat International Airport Auth., General Rev. Bonds, Series 2021-A, 4.46% 10/1/2043 | 525 | 424 | ||||||
| 759 | ||||||||
| Illinois 0.24% | ||||||||
| City of Chicago, Board of Education, Unlimited Tax G.O. Bonds (Dedicated Rev.), Series 2010-C, 6.319% 11/1/2029 | 28,045 | 27,861 | ||||||
| City of Chicago, Board of Education, Unlimited Tax G.O. Bonds (Dedicated Rev.), Series 2015-C, 5.25% 12/1/2039 | 120 | 121 | ||||||
| City of Chicago, Board of Education, Unlimited Tax G.O. Bonds (Dedicated Rev.), Series 2009-E, 6.138% 12/1/2039 | 54,555 | 50,788 | ||||||
| City of Chicago, Board of Education, Unlimited Tax G.O. Bonds (Dedicated Rev.), Series 2010-D, 6.519% 12/1/2040 | 11,385 | 10,622 | ||||||
| City of Chicago, Board of Education, Unlimited Tax G.O. Bonds (Qualified School Construction Bonds), Series 2009-G, 1.75% 12/15/2025 | 23,140 | 20,472 | ||||||
| City of Chicago, Board of Education, Unlimited Tax G.O. Rev. Ref. Bonds (Dedicated Rev.), Series 2017-C, 5.00% 12/1/2026 | 110 | 114 | ||||||
| City of Chicago, Board of Education, Unlimited Tax G.O. Rev. Ref. Bonds (Dedicated Rev.), Series 2018-A, Assured Guaranty Municipal insured, 5.00% 12/1/2026 | 100 | 104 | ||||||
| City of Chicago, Board of Education, Unlimited Tax G.O. Rev. Ref. Bonds (Dedicated Rev.), Series 2018-A, Assured Guaranty Municipal insured, 5.00% 12/1/2028 | 650 | 707 | ||||||
| City of Chicago, Board of Education, Unlimited Tax G.O. Rev. Ref. Bonds (Dedicated Rev.), Series 2018-C, Assured Guaranty Municipal insured, 5.00% 12/1/2028 | 800 | 872 | ||||||
| City of Chicago, Board of Education, Unlimited Tax G.O. Rev. Ref. Bonds (Dedicated Rev.), Series 2018-A, Assured Guaranty Municipal insured, 5.00% 12/1/2029 | 300 | 324 | ||||||
| City of Chicago, Board of Education, Unlimited Tax G.O. Rev. Ref. Bonds (Dedicated Rev.), Series 2018-C, Assured Guaranty Municipal insured, 5.00% 12/1/2029 | 550 | 595 | ||||||
| The Income Fund of America | 45 |
| Bonds, notes & other debt instruments (continued) | Principal amount (000) | Value (000) | ||||||
| Municipals (continued) | ||||||||
| Illinois (continued) | ||||||||
| City of Chicago, Board of Education, Unlimited Tax G.O. Rev. Ref. Bonds (Dedicated Rev.), Series 2017-C, 5.00% 12/1/2030 | USD | 220 | $ | 229 | ||||
| City of Chicago, Board of Education, Unlimited Tax G.O. Rev. Ref. Bonds (Dedicated Rev.), Series 2018-A, Assured Guaranty Municipal insured, 5.00% 12/1/2030 | 200 | 215 | ||||||
| City of Chicago, Board of Education, Unlimited Tax G.O. Rev. Ref. Bonds (Dedicated Rev.), Series 2017-D, 5.00% 12/1/2031 | 100 | 104 | ||||||
| City of Chicago, Board of Education, Unlimited Tax G.O. Rev. Ref. Bonds (Dedicated Rev.), Series 2018-A, Assured Guaranty Municipal insured, 5.00% 12/1/2031 | 350 | 377 | ||||||
| City of Chicago, Board of Education, Unlimited Tax G.O. Rev. Ref. Bonds (Dedicated Rev.), Series 2018-A, Assured Guaranty Municipal insured, 5.00% 12/1/2032 | 350 | 376 | ||||||
| City of Chicago, Board of Education, Unlimited Tax G.O. Rev. Ref. Bonds (Dedicated Rev.), Series 2018-A, Assured Guaranty Municipal insured, 5.00% 12/1/2033 | 200 | 214 | ||||||
| City of Chicago, Board of Education, Unlimited Tax G.O. Rev. Ref. Bonds (Dedicated Rev.), Series 2017-H, 5.00% 12/1/2036 | 100 | 102 | ||||||
| City of Chicago, Board of Education, Unlimited Tax G.O. Rev. Ref. Bonds (Dedicated Rev.), Series 2017-G, 5.00% 12/1/2044 | 140 | 141 | ||||||
| City of Chicago, Board of Education, Unlimited Tax G.O. Rev. Ref. Bonds (Dedicated Rev.), Series 2017-H, 5.00% 12/1/2046 | 390 | 391 | ||||||
| City of Chicago, School Reform Board of Trustees of the Board of Education, Unlimited Tax G.O. Bonds (Dedicated Tax Rev.), Series 2012-A, 5.00% 12/1/2042 | 190 | 190 | ||||||
| City of Chicago, School Reform Board of Trustees of the Board of Education, Unlimited Tax G.O. Bonds (Dedicated Tax Rev.), Capital Appreciation Bonds, Series 1998-B-1, National insured, 0% 12/1/2031 | 350 | 246 | ||||||
| G.O. Bonds, Series 2019-A, 4.00% 4/1/2023 | 12,000 | 11,982 | ||||||
| G.O. Bonds, Series 2013-B, 4.91% 4/1/2027 | 3,230 | 3,208 | ||||||
| G.O. Bonds, Pension Funding, Series 2003, 4.95% 6/1/2023 | 3,881 | 3,881 | ||||||
| G.O. Bonds, Pension Funding, Series 2003, 5.10% 6/1/2033 | 155,890 | 154,970 | ||||||
| G.O. Bonds, Taxable Build America Bonds, Series 2010-2, 5.95% 3/1/2023 | 595 | 595 | ||||||
| G.O. Bonds, Taxable Build America Bonds, Series 2010-1, 6.63% 2/1/2035 | 3,775 | 3,961 | ||||||
| G.O. Bonds, Taxable Build America Bonds, Series 2010-3, 6.725% 4/1/2035 | 4,500 | 4,724 | ||||||
| G.O. Bonds, Taxable Build America Bonds, Series 2010-5, 7.35% 7/1/2035 | 350 | 378 | ||||||
| 298,864 | ||||||||
| New York 0.01% | ||||||||
| Dormitory Auth., Taxable State Personal Income Tax Rev. Bonds (General Purpose), Series 2021-C, 1.187% 3/15/2026 (escrowed to maturity) | 4,635 | 4,237 | ||||||
| Dormitory Auth., Taxable State Personal Income Tax Rev. Bonds (General Purpose),Series 2021-C, 1.748% 3/15/2028 | 7,675 | 6,819 | ||||||
| 11,056 | ||||||||
| Ohio 0.02% | ||||||||
| Cleveland-Cuyahoga Port Auth., Federal Lease Rev. Bonds (VA Cleveland Health Care Center Project), Series 2021, 4.425% 5/1/2031 | 27,765 | 24,043 | ||||||
| Wisconsin 0.02% | ||||||||
| Public Fin. Auth., Federal Lease Rev. Bonds (Fort Sam Acquisition Fncg.), Series 2022, 4.95% 3/1/2034 | 22,720 | 21,049 | ||||||
| Total municipals | 366,240 | |||||||
| Bonds & notes of governments & government agencies outside the U.S. 0.10% | ||||||||
| Abu Dhabi (Emirate of) 2.50% 4/16/20258 | 7,800 | 7,514 | ||||||
| Abu Dhabi (Emirate of) 3.125% 4/16/20308 | 7,800 | 7,313 | ||||||
| Abu Dhabi (Emirate of) 1.70% 3/2/20318 | 1,700 | 1,423 | ||||||
| Abu Dhabi (Emirate of) 3.875% 4/16/20508 | 5,350 | 4,608 | ||||||
| Colombia (Republic of) 7.50% 2/2/2034 | 8,970 | 8,876 | ||||||
| European Investment Bank 0.75% 10/26/2026 | 9,910 | 8,847 | ||||||
| Morocco (Kingdom of) 3.00% 12/15/20328 | 6,000 | 4,810 | ||||||
| Morocco (Kingdom of) 4.00% 12/15/20508 | 6,000 | 4,139 | ||||||
| OMERS Finance Trust 3.50% 4/19/20328 | 7,941 | 7,419 | ||||||
| OMERS Finance Trust 4.00% 4/19/20528 | 7,941 | 6,851 | ||||||
| Panama (Republic of) 3.298% 1/19/2033 | 7,940 | 6,647 | ||||||
| 46 | The Income Fund of America |
| Bonds, notes & other debt instruments (continued) | Principal amount (000) | Value (000) | ||||||
| Bonds & notes of governments & government agencies outside the U.S. (continued) | ||||||||
| Panama (Republic of) 4.50% 1/19/2063 | USD | 2,065 | $ | 1,548 | ||||
| Peru (Republic of) 1.862% 12/1/2032 | 8,550 | 6,409 | ||||||
| Peru (Republic of) 2.78% 12/1/2060 | 12,800 | 7,789 | ||||||
| PT Indonesia Asahan Aluminium Tbk 4.75% 5/15/20258 | 3,060 | 3,038 | ||||||
| PT Indonesia Asahan Aluminium Tbk 5.45% 5/15/20308 | 790 | 787 | ||||||
| PT Indonesia Asahan Aluminium Tbk 5.80% 5/15/20508 | 2,310 | 2,099 | ||||||
| Swedish Export Credit Corp. 3.625% 9/3/2024 | 11,420 | 11,239 | ||||||
| United Mexican States 2.659% 5/24/2031 | 9,162 | 7,703 | ||||||
| United Mexican States 4.875% 5/19/2033 | 6,334 | 6,094 | ||||||
| United Mexican States 6.35% 2/9/2035 | 1,149 | 1,222 | ||||||
| United Mexican States 3.771% 5/24/2061 | 5,180 | 3,543 | ||||||
| 119,918 | ||||||||
| Federal agency bonds & notes 0.00% | ||||||||
| Ecopetrol SA 4.625% 11/2/2031 | 970 | 768 | ||||||
| Total bonds, notes & other debt instruments (cost: $31,754,382,000) | 29,866,557 | |||||||
| Shares | ||||||||
| Short-term securities 8.13% | ||||||||
| Money market investments 8.08% | ||||||||
| Capital Group Central Cash Fund 4.46%5,17 | 98,354,808 | 9,834,497 | ||||||
| Money market investments purchased with collateral from securities on loan 0.05% | ||||||||
| Capital Group Central Cash Fund 4.46%5,17,18 | 347,330 | 34,730 | ||||||
| Dreyfus Treasury Obligations Cash Management, Institutional Shares 4.23%17,18 | 6,100,000 | 6,100 | ||||||
| Goldman Sachs Financial Square Government Fund, Institutional Shares 4.23%17,18 | 6,100,000 | 6,100 | ||||||
| Morgan Stanley Institutional Liquidity Funds – Government Portfolio, Institutional Class 4.14%17,18 | 2,200,000 | 2,200 | ||||||
| Invesco Short-Term Investments Trust – Government & Agency Portfolio, Institutional Class 4.30%17,18 | 1,678,099 | 1,678 | ||||||
| BlackRock Liquidity Funds – FedFund, Institutional Shares 4.07%17,18 | 1,600,000 | 1,600 | ||||||
| Fidelity Investments Money Market Government Portfolio, Class I 4.20%17,18 | 1,600,000 | 1,600 | ||||||
| State Street Institutional U.S. Government Money Market Fund, Premier Class 4.18%17,18 | 1,600,000 | 1,600 | ||||||
| 55,608 | ||||||||
| Total short-term securities (cost: $9,888,976,000) | 9,890,105 | |||||||
| Total investment securities 101.36% (cost: $100,231,648,000) | 123,311,974 | |||||||
| Other assets less liabilities (1.36)% | (1,649,670 | ) | ||||||
| Net assets 100.00% | $ | 121,662,304 | ||||||
| The Income Fund of America | 47 |
Futures contracts
| Contracts | Type | Number of contracts | Expiration | Notional amount (000) | Value
and unrealized appreciation (depreciation) at 1/31/2023 (000) | |||||||||
| 2 Year U.S. Treasury Note Futures | Short | 9,205 | March 2023 | USD (1,892,994 | ) | $ | 1,538 | |||||||
| 5 Year U.S. Treasury Note Futures | Long | 20,683 | March 2023 | 2,259,456 | 12,174 | |||||||||
| 10 Year U.S. Treasury Note Futures | Long | 3,038 | March 2023 | 347,898 | 6,237 | |||||||||
| 10 Year Ultra U.S. Treasury Note Futures | Short | 9,597 | March 2023 | (1,163,186 | ) | (6,174 | ) | |||||||
| 20 Year U.S. Treasury Bond Futures | Long | 686 | March 2023 | 89,094 | 2,013 | |||||||||
| 30 Year Ultra U.S. Treasury Bond Futures | Long | 4,746 | March 2023 | 672,746 | 11,575 | |||||||||
| $ | 27,363 | |||||||||||||
Swap contracts
Interest rate swaps
Centrally cleared interest rate swaps
Receive | Pay | Notional amount (000) |
Value at 1/31/2023 (000) |
Upfront premium paid (000) |
Unrealized (depreciation) appreciation at 1/31/2023 (000) |
||||||||||||||||||||||
| Rate | Payment frequency | Rate | Payment frequency | Expiration date | |||||||||||||||||||||||
| 4.1645% | Annual | SOFR | Annual | 1/24/2025 | USD | 7,898 | $ | (13 | ) | $ | — | $ | (13 | ) | |||||||||||||
| 4.18306% | Annual | SOFR | Annual | 1/24/2025 | 449,775 | (612 | ) | — | (612 | ) | |||||||||||||||||
| 4.16253% | Annual | SOFR | Annual | 1/24/2025 | 488,327 | (852 | ) | — | (852 | ) | |||||||||||||||||
| SOFR | Annual | 3.2015% | Annual | 1/19/2033 | 105,329 | 199 | — | 199 | |||||||||||||||||||
| SOFR | Annual | 3.1205% | Annual | 1/20/2033 | 105,351 | 920 | — | 920 | |||||||||||||||||||
| SOFR | Annual | 3.16653% | Annual | 1/24/2033 | 108,884 | 526 | — | 526 | |||||||||||||||||||
| SOFR | Annual | 3.18606% | Annual | 1/24/2033 | 100,671 | 321 | — | 321 | |||||||||||||||||||
| $ | 489 | $ | — | $ | 489 | ||||||||||||||||||||||
Swap contracts
Credit default swaps
Centrally cleared credit default swaps on credit indices — buy protection
| Reference index | Financing rate paid | Payment frequency | Expiration date | Notional amount (000) |
Value
at 1/31/2023 (000) |
Upfront premium (received) paid (000) | Unrealized depreciation at 1/31/2023 (000) | ||||||||||||||||||
| CDX.NA.IG.39 | 1.00% | Quarterly | 12/20/2027 | USD | 105,342 | $ | (1,323 | ) | $ | (83 | ) | $ | (1,240 | ) | |||||||||||
| CDX.NA.HY.39 | 5.00% | Quarterly | 12/20/2027 | 226,205 | (6,228 | ) | 5,612 | (11,840 | ) | ||||||||||||||||
| $ | (7,551 | ) | $ | 5,529 | $ | (13,080 | ) | ||||||||||||||||||
Centrally cleared credit default swaps on credit indices — sell protection
| Financing rate received | Payment frequency | Reference index | Expiration date | Notional amount (000) | 19 |
Value
at 1/31/2023 (000) | 20 |
Upfront premium paid (000) | Unrealized appreciation at 1/31/2023 (000) | ||||||||||||||||
| 5.00% | Quarterly | CDX.NA.HY.37 | 12/20/2026 | USD | 148,497 | $ | 6,785 | $ | 4,416 | $ | 2,369 | ||||||||||||||
| 48 | The Income Fund of America |
Investments in affiliates5
| Value of affiliates at 8/1/2022 (000) | Additions (000) | Reductions (000) | Net realized loss (000) | Net unrealized appreciation (depreciation) (000) | Value of affiliates at 1/31/2023 (000) | Dividend income (000) | ||||||||||||||||||||||
| Common stocks 1.24% | ||||||||||||||||||||||||||||
| Health care 0.05% | ||||||||||||||||||||||||||||
| Rotech Healthcare, Inc.2,3,6 | $ | 55,404 | $ | — | $ | — | $ | — | $ | 2,715 | $ | 58,119 | $ | — | ||||||||||||||
| Industrials 0.20% | ||||||||||||||||||||||||||||
| ManpowerGroup, Inc. | 213,497 | — | — | — | 23,825 | 237,322 | 3,703 | |||||||||||||||||||||
| Utilities 0.86% | ||||||||||||||||||||||||||||
| Brookfield Infrastructure Partners, LP | 1,088,574 | 96,309 | — | — | (134,927 | ) | 1,049,956 | 20,413 | ||||||||||||||||||||
| Consumer discretionary 0.13% | ||||||||||||||||||||||||||||
| Domino’s Pizza Group PLC | 107,070 | — | — | — | 11,707 | 118,777 | 1,199 | |||||||||||||||||||||
| Puuilo OYJ | 27,975 | — | — | — | 9,931 | 37,906 | 814 | |||||||||||||||||||||
| Lumi Gruppen AS21 | 3,793 | — | 1,617 | (9,426 | ) | 7,250 | — | — | ||||||||||||||||||||
| 156,683 | ||||||||||||||||||||||||||||
| Total common stocks | 1,502,080 | |||||||||||||||||||||||||||
| Short-term securities 8.11% | ||||||||||||||||||||||||||||
| Money market investments 8.08% | ||||||||||||||||||||||||||||
| Capital Group Central Cash Fund 4.46%17 | 13,287,019 | 7,548,386 | 11,005,362 | (427 | ) | 4,881 | 9,834,497 | 203,058 | ||||||||||||||||||||
| Money market investments purchased with collateral from securities on loan 0.03% | ||||||||||||||||||||||||||||
| Capital Group Central Cash Fund 4.46%17,18 | 179,877 | 145,147 | 22 | 34,730 | — | 23 | ||||||||||||||||||||||
| Total short-term securities | 9,869,227 | |||||||||||||||||||||||||||
| Total 9.35% | $ | (9,853 | ) | $ | (74,618 | ) | $ | 11,371,307 | $ | 229,187 | ||||||||||||||||||
Restricted securities6
| Acquisition date(s) | Cost (000) | Value (000) | Percent of net assets | ||||||||||||||
| Rotech Healthcare, Inc.2,3,5 | 11/26/2014 | $ | 19,660 | $ | 58,119 | .05 | % | ||||||||||
| Ascent Resources - Utica, LLC, Class A2,3 | 4/25/2016-11/15/2016 | 56,848 | 22,043 | .02 | |||||||||||||
| Total | $ | 76,508 | $ | 80,162 | .07 | % | |||||||||||
| The Income Fund of America | 49 |
| 1 | All or a portion of this security was on loan. The total value of all such securities was $76,003,000, which represented .06% of the net assets of the fund. Refer to Note 5 for more information on securities lending. |
| 2 | Value determined using significant unobservable inputs. |
| 3 | Security did not produce income during the last 12 months. |
| 4 | Amount less than one thousand. |
| 5 | Affiliate of the fund or part of the same “group of investment companies” as the fund, as defined under the Investment Company Act of 1940, as amended. |
| 6 | Restricted security, other than Rule 144A securities or commercial paper issued pursuant to Section 4(a)(2) of the Securities Act of 1933. The total value of all such restricted securities was $80,162,000, which represented .07% of the net assets of the fund. |
| 7 | Coupon rate may change periodically. Reference rate and spread are as of the most recent information available. Some coupon rates are determined by the issuer or agent based on current market conditions; therefore, the reference rate and spread are not available. |
| 8 | Acquired in a transaction exempt from registration under Rule 144A or, for commercial paper, Section 4(a)(2) of the Securities Act of 1933. May be resold in the U.S. in transactions exempt from registration, normally to qualified institutional buyers. The total value of all such securities was $11,502,942,000, which represented 9.45% of the net assets of the fund. |
| 9 | Payment in kind; the issuer has the option of paying additional securities in lieu of cash. Payment methods and rates are as of the most recent payment when available. |
| 10 | Step bond; coupon rate may change at a later date. |
| 11 | Loan participations and assignments; may be subject to legal or contractual restrictions on resale. The total value of all such loans was $386,720,000, which represented .32% of the net assets of the fund. |
| 12 | Scheduled interest and/or principal payment was not received. |
| 13 | Principal payments may be made periodically. Therefore, the effective maturity date may be earlier than the stated maturity date. |
| 14 | Purchased on a TBA basis. |
| 15 | All or a portion of this security was pledged as collateral. The total value of pledged collateral was $121,073,000, which represented .10% of the net assets of the fund. |
| 16 | Index-linked bond whose principal amount moves with a government price index. |
| 17 | Rate represents the seven-day yield at 1/31/2023. |
| 18 | Security purchased with cash collateral from securities on loan. Refer to Note 5 for more information on securities lending. |
| 19 | The maximum potential amount the fund may pay as a protection seller should a credit event occur. |
| 20 | The prices and resulting values for credit default swap indices serve as an indicator of the current status of the payment/performance risk. As the value of a sell protection credit default swap increases or decreases, when compared to the notional amount of the swap, the payment/performance risk may decrease or increase, respectively. |
| 21 | Affiliated issuer during the reporting period but no longer held at 1/31/2023. |
| 22 | Represents net activity. Refer to Note 5 for more information on securities lending. |
| 23 | Dividend income is included with securities lending income in the fund’s statement of operations and is not shown in this table. |
Key to abbreviations
ADR = American Depositary Receipts
Assn. = Association
Auth. = Authority
CAD = Canadian dollars
CDI = CREST Depository Interest
CLO = Collateralized Loan Obligations
CME = CME Group
CMO = Collateralized Mortgage Obligations
DAC = Designated Activity Company
Fin. = Finance
Fncg. = Financing
G.O. = General Obligation
GBP = British pounds
ICE = Intercontinental Exchange, Inc.
LIBOR = London Interbank Offered Rate
PIK = Payment In Kind
Ref. = Refunding
REIT = Real Estate Investment Trust
Rev. = Revenue
SDR = Swedish Depositary Receipts
SOFR = Secured Overnight Financing Rate
TBA = To be announced
USD = U.S. dollars
Refer to the notes to financial statements.
| 50 | The Income Fund of America |
| Statement of assets and liabilities at January 31, 2023 |
unaudited (dollars in thousands) |
| Assets: | ||||||||
| Investment securities, at value (includes $76,003 of investment securities on loan): | ||||||||
| Unaffiliated issuers (cost: $89,111,658) | $ | 111,940,667 | ||||||
| Affiliated issuers (cost: $11,119,990) | 11,371,307 | $ | 123,311,974 | |||||
| Cash | 5,336 | |||||||
| Cash denominated in currencies other than U.S. dollars (cost: $18,244) | 18,228 | |||||||
| Unrealized appreciation on unfunded commitments | 1,644 | |||||||
| Receivables for: | ||||||||
| Sales of investments | 1,265,548 | |||||||
| Sales of fund’s shares | 79,979 | |||||||
| Dividends and interest | 532,698 | |||||||
| Securities lending income | 1 | |||||||
| Variation margin on futures contracts | 5,139 | |||||||
| Variation margin on centrally cleared swap contracts | 1,645 | |||||||
| Other | 1,361 | 1,886,371 | ||||||
| 125,223,553 | ||||||||
| Liabilities: | ||||||||
| Collateral for securities on loan | 55,608 | |||||||
| Unrealized depreciation on unfunded commitments | 74 | |||||||
| Payables for: | ||||||||
| Purchases of investments | 3,365,296 | |||||||
| Repurchases of fund’s shares | 81,518 | |||||||
| Investment advisory services | 20,383 | |||||||
| Services provided by related parties | 23,991 | |||||||
| Trustees’ deferred compensation | 4,361 | |||||||
| Variation margin on futures contracts | 3,939 | |||||||
| Variation margin on centrally cleared swap contracts | 2,517 | |||||||
| Other | 3,562 | 3,505,567 | ||||||
| Net assets at January 31, 2023 | $ | 121,662,304 | ||||||
| Net assets consist of: | ||||||||
| Capital paid in on shares of beneficial interest | $ | 96,529,927 | ||||||
| Total distributable earnings | 25,132,377 | |||||||
| Net assets at January 31, 2023 | $ | 121,662,304 | ||||||
Refer to the notes to financial statements.
| The Income Fund of America | 51 |
Financial statements (continued)
| Statement of assets and liabilities at January 31, 2023 (continued) |
unaudited (dollars and shares in thousands, except per-share amounts) |
Shares of beneficial interest issued and outstanding (no stated par value) —
unlimited shares authorized (5,213,930 total shares outstanding)
| Net assets | Shares outstanding | Net asset value per share | ||||||||||
| Class A | $ | 77,934,786 | 3,338,064 | $ | 23.35 | |||||||
| Class C | 2,046,754 | 89,111 | 22.97 | |||||||||
| Class T | 11 | — | * | 23.35 | ||||||||
| Class F-1 | 2,323,245 | 99,837 | 23.27 | |||||||||
| Class F-2 | 12,875,628 | 552,117 | 23.32 | |||||||||
| Class F-3 | 5,171,181 | 221,628 | 23.33 | |||||||||
| Class 529-A | 1,849,461 | 79,440 | 23.28 | |||||||||
| Class 529-C | 65,068 | 2,802 | 23.22 | |||||||||
| Class 529-E | 56,173 | 2,422 | 23.19 | |||||||||
| Class 529-T | 15 | 1 | 23.35 | |||||||||
| Class 529-F-1 | 12 | 1 | 23.27 | |||||||||
| Class 529-F-2 | 137,352 | 5,882 | 23.35 | |||||||||
| Class 529-F-3 | 13 | 1 | 23.35 | |||||||||
| Class R-1 | 65,850 | 2,842 | 23.17 | |||||||||
| Class R-2 | 366,109 | 15,920 | 23.00 | |||||||||
| Class R-2E | 36,210 | 1,556 | 23.27 | |||||||||
| Class R-3 | 702,247 | 30,227 | 23.23 | |||||||||
| Class R-4 | 817,358 | 35,090 | 23.29 | |||||||||
| Class R-5E | 172,801 | 7,415 | 23.31 | |||||||||
| Class R-5 | 323,390 | 13,852 | 23.35 | |||||||||
| Class R-6 | 16,718,640 | 715,722 | 23.36 | |||||||||
| * | Amount less than one thousand. |
Refer to the notes to financial statements.
| 52 | The Income Fund of America |
Financial statements (continued)
| Statement of operations for the six months ended January 31, 2023 |
Unaudited (dollars in thousands) |
| Investment income: | ||||||||
| Income: | ||||||||
| Dividends (net of non-U.S. taxes of $25,274; also includes $229,187 from affiliates) | $ | 1,693,825 | ||||||
| Interest from unaffiliated issuers | 668,816 | |||||||
| Securities lending income (net of fees) | 3,127 | $ | 2,365,768 | |||||
| Fees and expenses*: | ||||||||
| Investment advisory services | 131,639 | |||||||
| Distribution services | 115,901 | |||||||
| Transfer agent services | 32,721 | |||||||
| Administrative services | 17,825 | |||||||
| 529 plan services | 625 | |||||||
| Reports to shareholders | 1,234 | |||||||
| Registration statement and prospectus | 928 | |||||||
| Trustees’ compensation | 447 | |||||||
| Auditing and legal | 314 | |||||||
| Custodian | 1,278 | |||||||
| Other | 367 | 303,279 | ||||||
| Net investment income | 2,062,489 | |||||||
| Net realized gain and unrealized appreciation: | ||||||||
| Net realized gain (loss) on: | ||||||||
| Investments: | ||||||||
| Unaffiliated issuers | 452,399 | |||||||
| Affiliated issuers | (9,853 | ) | ||||||
| Futures contracts | (21,216 | ) | ||||||
| Forward currency contracts | 11,773 | |||||||
| Swap contracts | (53,996 | ) | ||||||
| Currency transactions | (3,327 | ) | 375,780 | |||||
| Net unrealized appreciation (depreciation) on: | ||||||||
| Investments: | ||||||||
| Unaffiliated issuers | 1,544,845 | |||||||
| Affiliated issuers | (74,618 | ) | ||||||
| Futures contracts | (7,094 | ) | ||||||
| Forward currency contracts | (5,014 | ) | ||||||
| Swap contracts | 8,951 | |||||||
| Currency translations | 3,488 | 1,470,558 | ||||||
| Net realized gain and unrealized appreciation | 1,846,338 | |||||||
| Net increase in net assets resulting from operations | $ | 3,908,827 | ||||||
| * | Additional information related to class-specific fees and expenses is included in the notes to financial statements. |
Refer to the notes to financial statements.
| The Income Fund of America | 53 |
Financial statements (continued)
Statements of changes in net assets
(dollars in thousands)
| Six months ended January 31, 2023* | Year ended July 31, 2022 | |||||||
| Operations: | ||||||||
| Net investment income | $ | 2,062,489 | $ | 4,135,492 | ||||
| Net realized gain | 375,780 | 4,350,957 | ||||||
| Net unrealized appreciation (depreciation) | 1,470,558 | (10,357,644 | ) | |||||
| Net increase (decrease) in net assets resulting from operations | 3,908,827 | (1,871,195 | ) | |||||
| Distributions paid to shareholders | (6,334,897 | ) | (8,514,409 | ) | ||||
| Net capital share transactions | 3,061,375 | 4,896,612 | ||||||
| Total increase (decrease) in net assets | 635,305 | (5,488,992 | ) | |||||
| Net assets: | ||||||||
| Beginning of period | 121,026,999 | 126,515,991 | ||||||
| End of period | $ | 121,662,304 | $ | 121,026,999 | ||||
| * | Unaudited. |
Refer to the notes to financial statements.
| 54 | The Income Fund of America |
| Notes to financial statements | unaudited |
1. Organization
The Income Fund of America (the “fund”) is registered under the Investment Company Act of 1940, as amended (the “1940 Act”), as an open-end, diversified management investment company. The fund seeks current income while secondarily striving for capital growth.
The fund has 21 share classes consisting of six retail share classes (Classes A, C, T, F-1, F-2 and F-3), seven 529 college savings plan share classes (Classes 529-A, 529-C, 529-E, 529-T, 529-F-1, 529-F-2 and 529-F-3) and eight retirement plan share classes (Classes R-1, R-2, R-2E, R-3, R-4, R-5E, R-5 and R-6). The 529 college savings plan share classes can be used to save for college education. The retirement plan share classes are generally offered only through eligible employer-sponsored retirement plans. The fund’s share classes are described further in the following table:
| Share class | Initial sales charge |
Contingent deferred sales charge upon redemption |
Conversion feature | ||||
| Classes A and 529-A | Up to 5.75% for Class A; up to 3.50% for Class 529-A | None (except 1.00% for certain redemptions within 18 months of purchase without an initial sales charge) | None | ||||
| Classes C and 529-C | None | 1.00% for redemptions within one year of purchase | Class C converts to Class A after eight years and Class 529-C converts to Class 529-A after five years | ||||
| Class 529-E | None | None | None | ||||
| Classes T and 529-T* | Up to 2.50% | None | None | ||||
| Classes F-1, F-2, F-3, 529-F-1, 529-F-2 and 529-F-3 | None | None | None | ||||
| Classes R-1, R-2, R-2E, R-3, R-4, R-5E, R-5 and R-6 | None | None | None |
| * | Class T and 529-T shares are not available for purchase. |
Holders of all share classes have equal pro rata rights to the assets, dividends and liquidation proceeds of the fund. Each share class has identical voting rights, except for the exclusive right to vote on matters affecting only its class. Share classes have different fees and expenses (“class-specific fees and expenses”), primarily due to different arrangements for distribution, transfer agent and administrative services. Differences in class-specific fees and expenses will result in differences in net investment income and, therefore, the payment of different per-share dividends by each share class.
2. Significant accounting policies
The fund is an investment company that applies the accounting and reporting guidance issued in Topic 946 by the U.S. Financial Accounting Standards Board. The fund’s financial statements have been prepared to comply with U.S. generally accepted accounting principles (“U.S. GAAP”). These principles require the fund’s investment adviser to make estimates and assumptions that affect reported amounts and disclosures. Actual results could differ from those estimates. Subsequent events, if any, have been evaluated through the date of issuance in the preparation of the financial statements. The fund follows the significant accounting policies described in this section, as well as the valuation policies described in the next section on valuation.
Security transactions and related investment income — Security transactions are recorded by the fund as of the date the trades are executed with brokers. Realized gains and losses from security transactions are determined based on the specific identified cost of the securities. In the event a security is purchased with a delayed payment date, the fund will segregate liquid assets sufficient to meet its payment obligations. Dividend income is recognized on the ex-dividend date and interest income is recognized on an accrual basis. Market discounts, premiums and original issue discounts on fixed-income securities are amortized daily over the expected life of the security.
Class allocations — Income, fees and expenses (other than class-specific fees and expenses), realized gains and losses and unrealized appreciation and depreciation are allocated daily among the various share classes based on their relative net assets. Class-specific fees and expenses, such as distribution, transfer agent and administrative services, are charged directly to the respective share class.
Distributions paid to shareholders — Income dividends and capital gain distributions are recorded on the ex-dividend date.
| The Income Fund of America | 55 |
Currency translation — Assets and liabilities, including investment securities, denominated in currencies other than U.S. dollars are translated into U.S. dollars at the exchange rates supplied by one or more pricing vendors on the valuation date. Purchases and sales of investment securities and income and expenses are translated into U.S. dollars at the exchange rates on the dates of such transactions. The effects of changes in exchange rates on investment securities are included with the net realized gain or loss and net unrealized appreciation or depreciation on investments in the fund’s statement of operations. The realized gain or loss and unrealized appreciation or depreciation resulting from all other transactions denominated in currencies other than U.S. dollars are disclosed separately.
3. Valuation
Capital Research and Management Company (“CRMC”), the fund’s investment adviser, values the fund’s investments at fair value as defined by U.S. GAAP. The net asset value per share is calculated once daily as of the close of regular trading on the New York Stock Exchange, normally 4 p.m. New York time, each day the New York Stock Exchange is open.
Methods and inputs — The fund’s investment adviser uses the following methods and inputs to establish the fair value of the fund’s assets and liabilities. Use of particular methods and inputs may vary over time based on availability and relevance as market and economic conditions evolve.
Equity securities, including depositary receipts, are generally valued at the official closing price of, or the last reported sale price on, the exchange or market on which such securities are traded, as of the close of business on the day the securities are being valued or, lacking any sales, at the last available bid price. Prices for each security are taken from the principal exchange or market on which the security trades.
Fixed-income securities, including short-term securities, are generally valued at evaluated prices obtained from third-party pricing vendors. Vendors value such securities based on one or more of the inputs described in the following table. The table provides examples of inputs that are commonly relevant for valuing particular classes of fixed-income securities in which the fund is authorized to invest. However, these classifications are not exclusive, and any of the inputs may be used to value any other class of fixed-income security.
| Fixed-income class | Examples of standard inputs | |
| All | Benchmark yields, transactions, bids, offers, quotations from dealers and trading systems, new issues, spreads and other relationships observed in the markets among comparable securities; and proprietary pricing models such as yield measures calculated using factors such as cash flows, financial or collateral performance and other reference data (collectively referred to as “standard inputs”) | |
| Corporate bonds, notes & loans; convertible securities | Standard inputs and underlying equity of the issuer | |
| Bonds & notes of governments & government agencies | Standard inputs and interest rate volatilities | |
| Mortgage-backed; asset-backed obligations | Standard inputs and cash flows, prepayment information, default rates, delinquency and loss assumptions, collateral characteristics, credit enhancements and specific deal information | |
| Municipal securities | Standard inputs and, for certain distressed securities, cash flows or liquidation values using a net present value calculation based on inputs that include, but are not limited to, financial statements and debt contracts |
Securities with both fixed-income and equity characteristics, or equity securities traded principally among fixed-income dealers, are generally valued in the manner described for either equity or fixed-income securities, depending on which method is deemed most appropriate by the fund’s investment adviser. The Capital Group Central Cash Fund (“CCF”), a fund within the Capital Group Central Fund Series (“Central Funds”), is valued based upon a floating net asset value, which fluctuates with changes in the value of CCF’s portfolio securities. The underlying securities are valued based on the policies and procedures in CCF’s statement of additional information. Exchange-traded futures are generally valued at the official settlement price of the exchange or market on which such instruments are traded, as of the close of business on the day the futures are being valued. Forward currency contracts are valued based on the spot and forward exchange rates obtained from a third-party pricing vendor. Swaps are generally valued using evaluated prices obtained from third-party pricing vendors who calculate these values based on market inputs that may include the yields of the indices referenced in the instrument and the relevant curve, dealer quotes, default probabilities and recovery rates, other reference data, and terms of the contract.
| 56 | The Income Fund of America |
Securities and other assets for which representative market quotations are not readily available or are considered unreliable by the fund’s investment adviser are fair valued as determined in good faith under fair valuation guidelines adopted by the fund’s investment adviser and approved by the board of trustees as further described. The investment adviser follows fair valuation guidelines, consistent with U.S. Securities and Exchange Commission rules and guidance, to consider relevant principles and factors when making fair value determinations. The investment adviser considers relevant indications of value that are reasonably and timely available to it in determining the fair value to be assigned to a particular security, such as the type and cost of the security, contractual or legal restrictions on resale of the security, relevant financial or business developments of the issuer, actively traded similar or related securities, dealer or broker quotes, conversion or exchange rights on the security, related corporate actions, significant events occurring after the close of trading in the security, and changes in overall market conditions. In addition, the closing prices of equity securities that trade in markets outside U.S. time zones may be adjusted to reflect significant events that occur after the close of local trading but before the net asset value of each share class of the fund is determined. Fair valuations of investments that are not actively trading involve judgment and may differ materially from valuations that would have been used had greater market activity occurred.
Processes and structure — The fund’s board of trustees has designated the fund’s investment adviser to make fair value determinations, subject to board oversight. The investment adviser has established a Joint Fair Valuation Committee (the “Committee”) to administer, implement and oversee the fair valuation process and to make fair value decisions. The Committee regularly reviews its own fair value decisions, as well as decisions made under its standing instructions to the investment adviser’s valuation team. The Committee reviews changes in fair value measurements from period to period, pricing vendor information and market data, and may, as deemed appropriate, update the fair valuation guidelines to better reflect the results of back testing and address new or evolving issues. Pricing decisions, processes and controls over security valuation are also subject to additional internal reviews facilitated by the investment adviser’s global risk management group. The Committee reports changes to the fair valuation guidelines to the board of trustees. The fund’s board and audit committee also regularly review reports that describe fair value determinations and methods.
Classifications — The fund’s investment adviser classifies the fund’s assets and liabilities into three levels based on the inputs used to value the assets or liabilities. Level 1 values are based on quoted prices in active markets for identical securities. Level 2 values are based on significant observable market inputs, such as quoted prices for similar securities and quoted prices in inactive markets. Certain securities trading outside the U.S. may transfer between Level 1 and Level 2 due to valuation adjustments resulting from significant market movements following the close of local trading. Level 3 values are based on significant unobservable inputs that reflect the investment adviser’s determination of assumptions that market participants might reasonably use in valuing the securities. The valuation levels are not necessarily an indication of the risk or liquidity associated with the underlying investment. For example, U.S. government securities are reflected as Level 2 because the inputs used to determine fair value may not always be quoted prices in an active market. The tables on the following page present the fund’s valuation levels as of January 31, 2023 (dollars in thousands):
| The Income Fund of America | 57 |
| Investment securities | ||||||||||||||||
| Level 1 | Level 2 | Level 3 | Total | |||||||||||||
| Assets: | ||||||||||||||||
| Common stocks: | ||||||||||||||||
| Financials | $ | 10,628,864 | $ | 4,059,170 | $ | 16,313 | $ | 14,704,347 | ||||||||
| Consumer staples | 9,594,571 | 1,530,540 | — | 11,125,111 | ||||||||||||
| Health care | 8,687,027 | 2,367,759 | 58,119 | 11,112,905 | ||||||||||||
| Energy | 6,461,752 | 1,375,143 | 28,022 | 7,864,917 | ||||||||||||
| Industrials | 5,063,810 | 2,759,745 | — | 7,823,555 | ||||||||||||
| Real estate | 6,666,857 | 45,651 | — | 6,712,508 | ||||||||||||
| Utilities | 4,185,643 | 1,157,831 | — | 5,343,474 | ||||||||||||
| Information technology | 3,909,190 | 1,332,640 | — | 5,241,830 | ||||||||||||
| Consumer discretionary | 3,889,407 | 767,597 | 3,106 | 4,660,110 | ||||||||||||
| Communication services | 2,514,709 | 1,687,298 | — | 4,202,007 | ||||||||||||
| Materials | 2,188,120 | 1,732,023 | — | 3,920,143 | ||||||||||||
| Preferred securities | 278,433 | 70,530 | 2,722 | 351,685 | ||||||||||||
| Rights & warrants | — | 2,213 | — | * | 2,213 | |||||||||||
| Convertible stocks | 489,930 | — | — | 489,930 | ||||||||||||
| Convertible bonds & notes | — | — | 577 | 577 | ||||||||||||
| Bonds, notes & other debt instruments: | ||||||||||||||||
| Corporate bonds, notes & loans | — | 19,268,795 | 18,496 | 19,287,291 | ||||||||||||
| Mortgage-backed obligations | — | 5,154,451 | 25,519 | 5,179,970 | ||||||||||||
| U.S. Treasury bonds & notes | — | 3,580,651 | — | 3,580,651 | ||||||||||||
| Asset-backed obligations | — | 1,321,402 | 10,317 | 1,331,719 | ||||||||||||
| Municipals | — | 366,240 | — | 366,240 | ||||||||||||
| Bonds & notes of governments & government agencies outside the U.S. | — | 119,918 | — | 119,918 | ||||||||||||
| Federal agency bonds & notes | — | 768 | — | 768 | ||||||||||||
| Short-term securities | 9,890,105 | — | — | 9,890,105 | ||||||||||||
| Total | $ | 74,448,418 | $ | 48,700,365 | $ | 163,191 | $ | 123,311,974 | ||||||||
| Other investments† | ||||||||||||||||
| Level 1 | Level 2 | Level 3 | Total | |||||||||||||
| Assets: | ||||||||||||||||
| Unrealized appreciation on futures contracts | $ | 33,537 | $ | — | $ | — | $ | 33,537 | ||||||||
| Unrealized appreciation on centrally cleared interest rate swaps | — | 1,966 | — | 1,966 | ||||||||||||
| Unrealized appreciation on centrally cleared credit default swaps | — | 2,369 | — | 2,369 | ||||||||||||
| Liabilities: | ||||||||||||||||
| Unrealized depreciation on futures contracts | (6,174 | ) | — | — | (6,174 | ) | ||||||||||
| Unrealized depreciation on centrally cleared interest rate swaps | — | (1,477 | ) | — | (1,477 | ) | ||||||||||
| Unrealized depreciation on centrally cleared credit default swaps | — | (13,080 | ) | — | (13,080 | ) | ||||||||||
| Total | $ | 27,363 | $ | (10,222 | ) | $ | — | $ | 17,141 | |||||||
| * | Amount less than one thousand. |
| † | Futures contracts, interest rate swaps and credit default swaps are not included in the fund’s investment portfolio. |
4. Risk factors
Investing in the fund may involve certain risks including, but not limited to, those described below.
Market conditions — The prices of, and the income generated by, the common stocks and other securities held by the fund may decline –sometimes rapidly or unpredictably – due to various factors, including events or conditions affecting the general economy or particular industries or companies; overall market changes; local, regional or global political, social or economic instability; governmental, governmental agency or central bank responses to economic conditions; and currency exchange rate, interest rate and commodity price fluctuations.
| 58 | The Income Fund of America |
Economies and financial markets throughout the world are highly interconnected. Economic, financial or political events, trading and tariff arrangements, wars, terrorism, cybersecurity events, natural disasters, public health emergencies (such as the spread of infectious disease) and other circumstances in one country or region, including actions taken by governmental or quasi-governmental authorities in response to any of the foregoing, could have impacts on global economies or markets. As a result, whether or not the fund invests in securities of issuers located in or with significant exposure to the countries affected, the value and liquidity of the fund’s investments may be negatively affected by developments in other countries and regions.
Issuer risks — The prices of, and the income generated by, securities held by the fund may decline in response to various factors directly related to the issuers of such securities, including reduced demand for an issuer’s goods or services, poor management performance, major litigation, investigations or other controversies related to the issuer, changes in financial condition or credit rating, changes in government regulations affecting the issuer or its competitive environment and strategic initiatives such as mergers, acquisitions or dispositions and the market response to any such initiatives.
Investing in income-oriented stocks — The value of the fund’s securities and income provided by the fund may be reduced by changes in the dividend policies of, and the capital resources available for dividend payments at, the companies in which the fund invests.
Investing in debt instruments — The prices of, and the income generated by, bonds and other debt securities held by the fund may be affected by factors such as the interest rates, maturities and credit quality of these securities.
Rising interest rates will generally cause the prices of bonds and other debt securities to fall. Also, when interest rates rise, issuers are less likely to refinance existing debt securities in order to enjoy lower interest rates in a higher interest rate environment, causing the market prices of such securities to decline more than they would have declined due to the rise in interest rates alone. A general rise in interest rates may cause investors to sell debt securities on a large scale, which could also adversely affect the price and liquidity of debt securities and could also result in increased redemptions from the fund. Falling interest rates may cause an issuer to redeem, call or refinance a debt security before its stated maturity, which may result in the fund failing to recoup the full amount of its initial investment and having to reinvest the proceeds in lower yielding securities. Longer maturity debt securities generally have greater sensitivity to changes in interest rates and may be subject to greater price fluctuations than shorter maturity debt securities.
Bonds and other debt securities are also subject to credit risk, which is the possibility that the credit strength of an issuer or guarantor will weaken or be perceived to be weaker, and/or an issuer of a debt security will fail to make timely payments of principal or interest and the security will go into default. Changes in actual or perceived creditworthiness may occur quickly. A downgrade or default affecting any of the fund’s securities could cause the value of the fund’s shares to decrease. Lower quality debt securities generally have higher rates of interest and may be subject to greater price fluctuations than higher quality debt securities. Credit risk is gauged, in part, by the credit ratings of the debt securities in which the fund invests. However, ratings are only the opinions of the rating agencies issuing them and are not guarantees as to credit quality or an evaluation of market risk. The fund’s investment adviser relies on its own credit analysts to research issuers and issues in assessing credit and default risks.
Investing in lower rated debt instruments — Lower rated bonds and other lower rated debt securities generally have higher rates of interest and involve greater risk of default or price declines due to changes in the issuer’s creditworthiness than those of higher quality debt securities. The market prices of these securities may fluctuate more than the prices of higher quality debt securities and may decline significantly in periods of general economic difficulty. These risks may be increased with respect to investments in junk bonds.
Investing outside the U.S. — Securities of issuers domiciled outside the U.S., or with significant operations or revenues outside the U.S., may lose value because of adverse political, social, economic or market developments (including social instability, regional conflicts, terrorism and war) in the countries or regions in which the issuers operate or generate revenue. These securities may also lose value due to changes in foreign currency exchange rates against the U.S. dollar and/or currencies of other countries. Issuers of these securities may be more susceptible to actions of foreign governments, such as nationalization, currency blockage or the imposition of price controls, sanctions, or punitive taxes, each of which could adversely impact the value of these securities. Securities markets in certain countries may be more volatile and/or less liquid than those in the U.S. Investments outside the U.S. may also be subject to different regulatory, legal, accounting, auditing, financial reporting and recordkeeping requirements, and may be more difficult to value, than those in the U.S. In addition, the value of investments outside the U.S. may be reduced by foreign taxes, including foreign withholding taxes on interest and dividends. Further, there may be increased risks of delayed settlement of securities purchased or sold by the fund, which could impact the liquidity of the fund’s portfolio. The risks of investing outside the U.S. may be heightened in connection with investments in emerging markets.
| The Income Fund of America | 59 |
Management — The investment adviser to the fund actively manages the fund’s investments. Consequently, the fund is subject to the risk that the methods and analyses, including models, tools and data, employed by the investment adviser in this process may be flawed or incorrect and may not produce the desired results. This could cause the fund to lose value or its investment results to lag relevant benchmarks or other funds with similar objectives.
5. Certain investment techniques
Securities lending — The fund has entered into securities lending transactions in which the fund earns income by lending investment securities to brokers, dealers or other institutions. Each transaction involves three parties: the fund, acting as the lender of the securities, a borrower, and a lending agent that acts as an intermediary.
Securities lending transactions are entered into by the fund under a securities lending agent agreement with the lending agent. The lending agent facilitates the exchange of securities between the fund and approved borrowers, ensures that securities loans are properly coordinated and documented, marks-to-market the value of collateral daily, secures additional collateral from a borrower if it falls below preset terms, and may reinvest cash collateral on behalf of the fund according to agreed parameters. The lending agent provides indemnification to the fund against losses resulting from a borrower default. Although risk is mitigated by the collateral and indemnification, the fund could experience a delay in recovering its securities and a potential loss of income or value if a borrower fails to return securities, collateral investments decline in value or the lending agent fails to perform.
The borrower is required to post highly liquid assets, such as cash or U.S. government securities, as collateral for the loan in an amount at least equal to the value of the securities loaned. Investments made with cash collateral are recognized as assets in the fund’s investment portfolio. The same amount is recorded as a liability in the fund’s statement of assets and liabilities. While securities are on loan, the fund will continue to receive the equivalent of the interest, dividends or other distributions paid by the issuer, as well as a portion of the interest on the investment of the collateral. Additionally, although the fund does not have the right to vote on securities while they are on loan, the fund has a right to consent on corporate actions and a right to recall loaned securities to vote. A borrower is obligated to return loaned securities at the conclusion of a loan or, during the pendency of a loan, on demand from the fund.
As of January 31, 2023, the total value of securities on loan was $76,003,000, and the total value of collateral received was $78,764,000. Collateral received includes cash of $55,608,000 and U.S. government securities of $23,156,000. Investment securities purchased from cash collateral are disclosed in the fund’s investment portfolio as short-term securities. Securities received as collateral are not recognized as fund assets. The contractual maturity of cash collateral received under the securities lending agreement is classified as overnight and continuous.
Index-linked bonds — The fund has invested in index-linked bonds, which are fixed-income securities whose principal value is periodically adjusted to a government price index. Over the life of an index-linked bond, interest is paid on the adjusted principal value. Increases or decreases in the principal value of index-linked bonds are recorded as interest income in the fund’s statement of operations.
Mortgage dollar rolls — The fund has entered into mortgage dollar roll transactions in which the fund sells a mortgage-backed security to a counterparty and simultaneously enters into an agreement with the same counterparty to buy back a similar security on a specific future date at a predetermined price. Mortgage dollar rolls are accounted for as purchase and sale transactions. Portfolio turnover rates excluding and including mortgage dollar rolls are presented at the end of the fund’s financial highlights table.
Loan transactions — The fund has entered into loan transactions in which the fund acquires a loan either through an agent, by assignment from another holder, or as a participation interest in another holder’s portion of a loan. The loan is often administered by a financial institution that acts as agent for the holders of the loan, and the fund may be required to receive approval from the agent and/or borrower prior to the sale of the investment. The loan’s interest rate and maturity date may change based on the terms of the loan, including potential early payments of principal.
Unfunded commitments — The fund has participated in transactions that involve unfunded commitments, which may obligate the fund to purchase new or additional bonds if certain contingencies are met. As of January 31, 2023, the fund’s maximum exposure of unfunded bond commitments was $18,386,000, which would represent .02% of the net assets of the fund should such commitments become due. Unrealized appreciation of $1,644,000 is disclosed as unrealized appreciation on unfunded commitments and unrealized depreciation of $74,000 is disclosed as unrealized depreciation on unfunded commitments in the fund’s statement of assets and liabilities. Both are included in net unrealized appreciation on investments in unaffiliated issuers in the fund’s statement of operations.
| 60 | The Income Fund of America |
Futures contracts — The fund has entered into futures contracts, which provide for the future sale by one party and purchase by another party of a specified amount of a specific financial instrument for a specified price, date, time and place designated at the time the contract is made. Futures contracts are used to strategically manage the fund’s interest rate sensitivity by increasing or decreasing the duration of the fund or a portion of the fund’s portfolio.
Upon entering into futures contracts, and to maintain the fund’s open positions in futures contracts, the fund is required to deposit with a futures broker, known as a futures commission merchant (“FCM”), in a segregated account in the name of the FCM an amount of cash, U.S. government securities or other liquid securities, known as initial margin. The margin required for a particular futures contract is set by the exchange on which the contract is traded to serve as collateral, and may be significantly modified from time to time by the exchange during the term of the contract.
On a daily basis, the fund pays or receives variation margin based on the increase or decrease in the value of the futures contracts and records variation margin on futures contracts in the statement of assets and liabilities. Futures contracts may involve a risk of loss in excess of the variation margin shown on the fund’s statement of assets and liabilities. The fund records realized gains or losses at the time the futures contract is closed or expires. Net realized gains or losses and net unrealized appreciation or depreciation from futures contracts are recorded in the fund’s statement of operations. The average month-end notional amount of futures contracts while held was $5,352,419,000.
Forward currency contracts — The fund has entered into forward currency contracts, which represent agreements to exchange currencies on specific future dates at predetermined rates. The fund’s investment adviser uses forward currency contracts to manage the fund’s exposure to changes in exchange rates. Upon entering into these contracts, risks may arise from the potential inability of counterparties to meet the terms of their contracts and from possible movements in exchange rates.
On a daily basis, the fund’s investment adviser values forward currency contracts and records unrealized appreciation or depreciation for open forward currency contracts in the fund’s statement of assets and liabilities. Realized gains or losses are recorded at the time the forward currency contract is closed or offset by another contract with the same broker for the same settlement date and currency.
Closed forward currency contracts that have not reached their settlement date are included in the respective receivables or payables for closed forward currency contracts in the fund’s statement of assets and liabilities. Net realized gains or losses from closed forward currency contracts and net unrealized appreciation or depreciation from open forward currency contracts are recorded in the fund’s statement of operations. As of January 31, 2023, the fund did not have any open forward currency contracts. The average month-end notional amount of open forward currency contracts while held was $213,950,000.
Swap contracts — The fund has entered into swap agreements, which are two-party contracts entered into primarily by institutional investors for a specified time period. In a typical swap transaction, two parties agree to exchange the returns earned or realized from one or more underlying assets or rates of return. Swap agreements can be traded on a swap execution facility (SEF) and cleared through a central clearinghouse (cleared), traded over-the-counter (OTC) and cleared, or traded bilaterally and not cleared. Because clearing interposes a central clearinghouse as the ultimate counterparty to each participant’s swap, and margin is required to be exchanged under the rules of the clearinghouse, central clearing is intended to decrease (but not eliminate) counterparty risk relative to uncleared bilateral swaps. To the extent the fund enters into bilaterally negotiated swap transactions, the fund will enter into swap agreements only with counterparties that meet certain credit standards and subject to agreed collateralized procedures. The term of a swap can be days, months or years and certain swaps may be less liquid than others.
Upon entering into a centrally cleared swap contract, the fund is required to deposit cash, U.S. government securities or other liquid securities, which is known as initial margin. Generally, the initial margin required for a particular swap is set and held as collateral by the clearinghouse on which the contract is cleared. The amount of initial margin required may be significantly modified from time to time by the clearinghouse during the term of the contract.
On a daily basis, interest accruals related to the exchange of future payments are recorded as a receivable and payable in the fund’s statement of assets and liabilities for centrally cleared swaps and as unrealized appreciation or depreciation in the fund’s statement of assets and liabilities for bilateral swaps. For centrally cleared swaps, the fund also pays or receives a variation margin based on the increase or decrease in the value of the swaps, including accrued interest as applicable, and records variation margin in the statement of assets and liabilities. The fund records realized gains and losses on both the net accrued interest and any gain or loss recognized at the time the swap is closed or expires. Net realized gains or losses, as well as any net unrealized appreciation or depreciation, from swaps are recorded in the fund’s statement of operations.
| The Income Fund of America | 61 |
Swap agreements can take different forms. The fund has entered into the following types of swap agreements:
Interest rate swaps — The fund has entered into interest rate swaps, which seek to manage the interest rate sensitivity of the fund by increasing or decreasing the duration of the fund or a portion of the fund’s portfolio. An interest rate swap is an agreement between two parties to exchange or swap payments based on changes in an interest rate or rates. Typically, one interest rate is fixed and the other is variable based on a designated short-term interest rate such as the Secured Overnight Financing Rate (SOFR), prime rate or other benchmark, or on an inflation index such as the U.S. Consumer Price Index (which is a measure that examines the weighted average of prices of a basket of consumer goods and services and measures changes in the purchasing power of the U.S. dollar and the rate of inflation). In other types of interest rate swaps, known as basis swaps, the parties agree to swap variable interest rates based on different designated short-term interest rates. Interest rate swaps generally do not involve the delivery of securities or other principal amounts. Rather, cash payments are exchanged by the parties based on the application of the designated interest rates to a notional amount, which is the predetermined dollar principal of the trade upon which payment obligations are computed. Accordingly, the fund’s current obligation or right under the swap agreement is generally equal to the net amount to be paid or received under the swap agreement based on the relative value of the position held by each party. The average month-end notional amount of interest rate swaps while held was $1,366,235,000.
Credit default swap indices — The fund has entered into centrally cleared credit default swap indices, including CDX and iTraxx indices (collectively referred to as “CDSIs”), in order to assume exposure to a diversified portfolio of credits or to hedge against existing credit risks. A CDSI is based on a portfolio of credit default swaps with similar characteristics, such as credit default swaps on high-yield bonds. In a typical CDSI transaction, one party (the protection buyer) is obligated to pay the other party (the protection seller) a stream of periodic payments over the term of the contract. If a credit event, such as a default or restructuring, occurs with respect to any of the underlying reference obligations, the protection seller must pay the protection buyer the loss on those credits.
The fund may enter into a CDSI transaction as either protection buyer or protection seller. If the fund is a protection buyer, it would pay the counterparty a periodic stream of payments over the term of the contract and would not recover any of those payments if no credit events were to occur with respect to any of the underlying reference obligations. However, if a credit event did occur, the fund, as a protection buyer, would have the right to deliver the referenced debt obligations or a specified amount of cash, depending on the terms of the applicable agreement, and to receive the par value of such debt obligations from the counterparty protection seller. As a protection seller, the fund would receive fixed payments throughout the term of the contract if no credit events were to occur with respect to any of the underlying reference obligations. If a credit event were to occur, however, the value of any deliverable obligation received by the fund, coupled with the periodic payments previously received by the fund, may be less than the full notional value that the fund, as a protection seller, pays to the counterparty protection buyer, effectively resulting in a loss of value to the fund. Furthermore, as a protection seller, the fund would effectively add leverage to its portfolio because it would have investment exposure to the notional amount of the swap transaction. The average month-end notional amount of credit default swaps while held was $1,190,702,000.
| 62 | The Income Fund of America |
The following tables identify the location and fair value amounts on the fund’s statement of assets and liabilities and the effect on the fund’s statement of operations resulting from the fund’s use of futures contracts, forward currency contracts, interest rate swaps and credit default swaps as of, or for the six months ended, January 31, 2023 (dollars in thousands):
| Assets | Liabilities | |||||||||||||
| Contracts | Risk type | Location on statement of assets and liabilities | Value | Location on statement of assets and liabilities | Value | |||||||||
| Futures | Interest | Unrealized appreciation* | $ | 33,537 | Unrealized depreciation* | $ | 6,174 | |||||||
| Swap (centrally cleared) | Interest | Unrealized appreciation* | 1,966 | Unrealized depreciation* | 1,477 | |||||||||
| Swap (centrally cleared) | Credit | Unrealized appreciation* | 2,369 | Unrealized depreciation* | 13,080 | |||||||||
| $ | 37,872 | $ | 20,731 | |||||||||||
| Net realized (loss) gain | Net unrealized (depreciation) appreciation | |||||||||||||
| Contracts | Risk type | Location on statement of operations | Value | Location on statement of operations | Value | |||||||||
| Futures | Interest | Net realized loss on futures contracts | $ | (21,216 | ) | Net unrealized depreciation on futures contracts | $ | (7,094 | ) | |||||
| Forward currency | Currency | Net realized gain on forward currency contracts | 11,773 | Net unrealized depreciation on forward currency contracts | (5,014 | ) | ||||||||
| Swap | Interest | Net realized gain on swap contracts | 229 | Net unrealized appreciation on swap contracts | 489 | |||||||||
| Swap | Credit | Net realized loss on swap contracts | (54,225 | ) | Net unrealized appreciation on swap contracts | 8,462 | ||||||||
| $ | (63,439 | ) | $ | (3,157 | ) | |||||||||
| * | Includes cumulative appreciation/depreciation on futures contracts, centrally cleared interest rate swaps and centrally cleared credit default swaps as reported in the applicable tables following the fund’s investment portfolio. Only current day’s variation margin is reported within the fund’s statement of assets and liabilities. |
Collateral — The fund receives or pledges highly liquid assets, such as cash or U.S. government securities, as collateral due to securities lending and its use of futures contracts, forward currency contracts, interest rate swaps, credit default swaps and future delivery contracts. For securities lending, the fund receives collateral in exchange for lending investment securities. The lending agent may reinvest cash collateral from securities lending transactions according to agreed parameters. Cash collateral reinvested by the lending agent, if any, is disclosed in the fund’s investment portfolio. For futures contracts, centrally cleared interest rate swaps and centrally cleared credit default swaps, the fund pledges collateral for initial and variation margin by contract. For forward currency contracts, the fund either receives or pledges collateral based on the net gain or loss on unsettled contracts by counterparty. For future delivery contracts, the fund either receives or pledges collateral based on the net gain or loss on unsettled contracts by certain counterparties. The purpose of the collateral is to cover potential losses that could occur in the event that either party cannot meet its contractual obligation. Non-cash collateral pledged by the fund, if any, is disclosed in the fund’s investment portfolio, and cash collateral pledged by the fund, if any, is held in a segregated account with the fund’s custodian, which is reflected as pledged cash collateral in the fund’s statement of assets and liabilities.
6. Taxation and distributions
Federal income taxation — The fund complies with the requirements under Subchapter M of the Internal Revenue Code applicable to regulated investment companies and intends to distribute substantially all of its net taxable income and net capital gains each year. The fund is not subject to income taxes to the extent such distributions are made. Therefore, no federal income tax provision is required.
As of and during the period ended January 31, 2023, the fund did not have a liability for any unrecognized tax benefits. The fund recognizes interest and penalties, if any, related to unrecognized tax benefits as income tax expense in the statement of operations. During the period, the fund did not incur any significant interest or penalties.
The fund’s tax returns are generally not subject to examination by federal, state and, if applicable, non-U.S. tax authorities after the expiration of each jurisdiction’s statute of limitations, which is typically three years after the date of filing but can be extended in certain jurisdictions.
| The Income Fund of America | 63 |
Non-U.S. taxation — Dividend and interest income are recorded net of non-U.S. taxes paid. The fund may file withholding tax reclaims in certain jurisdictions to recover a portion of amounts previously withheld. As a result of rulings from European courts, the fund filed for additional reclaims related to prior years. These reclaims are recorded when the amount is known and there are no significant uncertainties on collectability. During the six months ended January 31, 2023, the fund recognized $1,190,000 in reclaims (net of $28,000 in fees and the effect of realized gain or loss from currency translations) and $22,000 in interest related to European court rulings, which is included in dividend income and interest income, respectively, in the fund’s statement of operations. Gains realized by the fund on the sale of securities in certain countries, if any, may be subject to non-U.S. taxes. If applicable, the fund records an estimated deferred tax liability based on unrealized gains to provide for potential non-U.S. taxes payable upon the sale of these securities.
Distributions — Distributions determined on a tax basis may differ from net investment income and net realized gains for financial reporting purposes. These differences are due primarily to different treatment for items such as currency gains and losses; short-term capital gains and losses; capital losses related to sales of certain securities within 30 days of purchase; cost of investments sold and income on certain investments. The fiscal year in which amounts are distributed may differ from the year in which the net investment income and net realized gains are recorded by the fund for financial reporting purposes.
The components of distributable earnings on a tax basis are reported as of the fund’s most recent year-end. As of July 31, 2022, the components of distributable earnings on a tax basis were as follows (dollars in thousands):
| Undistributed ordinary income | $ | 1,693,960 | ||
| Undistributed long-term capital gains | 4,106,178 |
As of January 31, 2023, the tax basis unrealized appreciation (depreciation) and cost of investments were as follows (dollars in thousands):
| Gross unrealized appreciation on investments | $ | 26,449,008 | ||
| Gross unrealized depreciation on investments | (3,160,669 | ) | ||
| Net unrealized appreciation on investments | 23,288,339 | |||
| Cost of investments | 100,030,831 |
Distributions paid were characterized for tax purposes as follows (dollars in thousands):
| Six months ended January 31, 2023 | Year ended July 31, 2022 | |||||||||||||||||||||||
| Share class | Ordinary income | Long-term capital gains | Total distributions paid | Ordinary income | Long-term capital gains | Total distributions paid | ||||||||||||||||||
| Class A | $ | 1,411,938 | $ | 2,636,411 | $ | 4,048,349 | $ | 2,381,084 | $ | 3,111,969 | $ | 5,493,053 | ||||||||||||
| Class C | 31,417 | 71,660 | 103,077 | 55,874 | 100,545 | 156,419 | ||||||||||||||||||
| Class T | — | * | — | * | — | * | — | * | — | * | — | * | ||||||||||||
| Class F-1 | 41,647 | 78,844 | 120,491 | 72,699 | 98,385 | 171,084 | ||||||||||||||||||
| Class F-2 | 243,431 | 432,771 | 676,202 | 395,103 | 476,920 | 872,023 | ||||||||||||||||||
| Class F-3 | 98,821 | 173,874 | 272,695 | 155,715 | 181,655 | 337,370 | ||||||||||||||||||
| Class 529-A | 33,269 | 62,982 | 96,251 | 56,284 | 74,403 | 130,687 | ||||||||||||||||||
| Class 529-C | 957 | 2,253 | 3,210 | 1,710 | 3,189 | 4,899 | ||||||||||||||||||
| Class 529-E | 957 | 1,935 | 2,892 | 1,628 | 2,378 | 4,006 | ||||||||||||||||||
| Class 529-T | — | * | 1 | 1 | 1 | 1 | 2 | |||||||||||||||||
| Class 529-F-1 | — | * | — | * | — | * | — | * | — | * | — | * | ||||||||||||
| Class 529-F-2 | 2,566 | 4,585 | 7,151 | 3,986 | 4,783 | 8,769 | ||||||||||||||||||
| Class 529-F-3 | — | * | — | * | — | * | — | * | — | * | — | * | ||||||||||||
| Class R-1 | 979 | 2,300 | 3,279 | 1,539 | 2,762 | 4,301 | ||||||||||||||||||
| Class R-2 | 5,323 | 12,494 | 17,817 | 8,533 | 15,271 | 23,804 | ||||||||||||||||||
| Class R-2E | 593 | 1,286 | 1,879 | 956 | 1,506 | 2,462 | ||||||||||||||||||
| Class R-3 | 11,905 | 24,364 | 36,269 | 20,260 | 30,261 | 50,521 | ||||||||||||||||||
| Class R-4 | 14,603 | 27,609 | 42,212 | 25,053 | 33,177 | 58,230 | ||||||||||||||||||
| Class R-5E | 3,114 | 5,672 | 8,786 | 5,026 | 6,162 | 11,188 | ||||||||||||||||||
| Class R-5 | 6,183 | 10,837 | 17,020 | 10,490 | 12,596 | 23,086 | ||||||||||||||||||
| Class R-6 | 320,795 | 556,521 | 877,316 | 532,394 | 630,111 | 1,162,505 | ||||||||||||||||||
| Total | $ | 2,228,498 | $ | 4,106,399 | $ | 6,334,897 | $ | 3,728,335 | $ | 4,786,074 | $ | 8,514,409 | ||||||||||||
| * | Amount less than one thousand. |
| 64 | The Income Fund of America |
7. Fees and transactions with related parties
CRMC, the fund’s investment adviser, is the parent company of American Funds Distributors®, Inc. (“AFD”), the principal underwriter of the fund’s shares, and American Funds Service Company® (“AFS”), the fund’s transfer agent. CRMC, AFD and AFS are considered related parties to the fund.
Investment advisory services — The fund has an investment advisory and service agreement with CRMC that provides for monthly fees accrued daily. These fees are based on a series of decreasing annual rates beginning with 0.250% on the first $500 million of daily net assets and decreasing to 0.121% on such assets in excess of $115 billion. The agreement also provides for monthly fees, accrued daily, based on a rate of 2.25% of the fund’s monthly gross income. For the six months ended January 31, 2023, the investment advisory services fees were $131,639,000, which were equivalent to an annualized rate of 0.222% of average daily net assets.
Class-specific fees and expenses — Expenses that are specific to individual share classes are accrued directly to the respective share class. The principal class-specific fees and expenses are further described below:
Distribution services — The fund has plans of distribution for all share classes, except Class F-2, F-3, 529-F-2, 529-F-3, R-5E, R-5 and R-6 shares. Under the plans, the board of trustees approves certain categories of expenses that are used to finance activities primarily intended to sell fund shares and service existing accounts. The plans provide for payments, based on an annualized percentage of average daily net assets, ranging from 0.25% to 1.00% as noted in this section. In some cases, the board of trustees has limited the amounts that may be paid to less than the maximum allowed by the plans. All share classes with a plan may use up to 0.25% of average daily net assets to pay service fees, or to compensate AFD for paying service fees, to firms that have entered into agreements with AFD to provide certain shareholder services. The remaining amounts available to be paid under each plan are paid to dealers to compensate them for their sales activities.
| Share class | Currently approved limits | Plan limits | ||||||
| Class A | 0.25 | % | 0.25 | % | ||||
| Class 529-A | 0.25 | 0.50 | ||||||
| Classes C, 529-C and R-1 | 1.00 | 1.00 | ||||||
| Class R-2 | 0.75 | 1.00 | ||||||
| Class R-2E | 0.60 | 0.85 | ||||||
| Classes 529-E and R-3 | 0.50 | 0.75 | ||||||
| Classes T, F-1, 529-T, 529-F-1 and R-4 | 0.25 | 0.50 | ||||||
For Class A and 529-A shares, distribution-related expenses include the reimbursement of dealer and wholesaler commissions paid by AFD for certain shares sold without a sales charge. These share classes reimburse AFD for amounts billed within the prior 15 months but only to the extent that the overall annual expense limits are not exceeded. As of January 31, 2023, unreimbursed expenses subject to reimbursement totaled $12,556,000 for Class A shares. There were no unreimbursed expenses subject to reimbursement for Class 529-A shares.
Transfer agent services — The fund has a shareholder services agreement with AFS under which the fund compensates AFS for providing transfer agent services to each of the fund’s share classes. These services include recordkeeping, shareholder communications and transaction processing. In addition, the fund reimburses AFS for amounts paid to third parties for performing transfer agent services on behalf of fund shareholders.
Administrative services — The fund has an administrative services agreement with CRMC under which the fund compensates CRMC for providing administrative services to all share classes. Administrative services are provided by CRMC and its affiliates to help assist third parties providing non-distribution services to fund shareholders. These services include providing in-depth information on the fund and market developments that impact fund investments. Administrative services also include, but are not limited to, coordinating, monitoring and overseeing third parties that provide services to fund shareholders. The agreement provides the fund the ability to charge an administrative services fee at the annual rate of 0.05% of the average daily net assets attributable to each share class of the fund. Currently the fund pays CRMC an administrative services fee at the annual rate of 0.03% of the average daily net assets attributable to each share class of the fund for CRMC’s provision of administrative services.
529 plan services — Each 529 share class is subject to service fees to compensate the Virginia College Savings Plan (“Virginia529”) for its oversight and administration of the CollegeAmerica 529 college savings plan. The fees are based on the combined net assets invested in Class 529 and ABLE shares of the American Funds. Class ABLE shares are offered on other American Funds by Virginia529 through ABLEAmerica®, a tax-advantaged savings program for individuals with disabilities. Virginia529 is not considered a related party to the fund.
| The Income Fund of America | 65 |
The quarterly fees are based on a series of decreasing annual rates beginning with 0.09% on the first $20 billion of the combined net assets invested in the American Funds and decreasing to 0.03% on such assets in excess of $75 billion. The fees for any given calendar quarter are accrued and calculated on the basis of the average net assets of Class 529 and ABLE shares of the American Funds for the last month of the prior calendar quarter. For the six months ended January 31, 2023, the 529 plan services fees were $625,000, which were equivalent to 0.060% of the average daily net assets of each 529 share class.
For the six months ended January 31, 2023, class-specific expenses under the agreements were as follows (dollars in thousands):
| Distribution | Transfer agent | Administrative | 529 plan | ||||||
| Share class | services | services | services | services | |||||
| Class A | $ 95,533 | $21,680 | $11,464 | Not applicable | |||||
| Class C | 10,468 | 600 | 315 | Not applicable | |||||
| Class T | — | — | * | — | * | Not applicable | |||
| Class F-1 | 2,740 | 1,397 | 342 | Not applicable | |||||
| Class F-2 | Not applicable | 6,660 | 1,877 | Not applicable | |||||
| Class F-3 | Not applicable | 14 | 737 | Not applicable | |||||
| Class 529-A | 2,154 | 464 | 272 | $549 | |||||
| Class 529-C | 332 | 17 | 10 | 20 | |||||
| Class 529-E | 139 | 6 | 8 | 17 | |||||
| Class 529-T | — | — | * | — | * | — | * | ||
| Class 529-F-1 | — | — | * | — | * | — | * | ||
| Class 529-F-2 | Not applicable | 11 | 20 | 39 | |||||
| Class 529-F-3 | Not applicable | — | * | — | * | — | * | ||
| Class R-1 | 331 | 31 | 10 | Not applicable | |||||
| Class R-2 | 1,344 | 628 | 54 | Not applicable | |||||
| Class R-2E | 110 | 38 | 5 | Not applicable | |||||
| Class R-3 | 1,755 | 529 | 106 | Not applicable | |||||
| Class R-4 | 995 | 403 | 119 | Not applicable | |||||
| Class R-5E | Not applicable | 124 | 24 | Not applicable | |||||
| Class R-5 | Not applicable | 72 | 47 | Not applicable | |||||
| Class R-6 | Not applicable | 47 | 2,415 | Not applicable | |||||
| Total class-specific expenses | $115,901 | $32,721 | $17,825 | $625 |
| * | Amount less than one thousand. |
Trustees deferred compensation — Trustees who are unaffiliated with CRMC may elect to defer the cash payment of part or all of their compensation. These deferred amounts, which remain as liabilities of the fund, are treated as if invested in shares of the fund or other American Funds. These amounts represent general, unsecured liabilities of the fund and vary according to the total returns of the selected funds. Trustees’ compensation of $447,000 in the fund’s statement of operations reflects $315,000 in current fees (either paid in cash or deferred) and a net increase of $132,000 in the value of the deferred amounts.
Affiliated officers and trustees — Officers and certain trustees of the fund are or may be considered to be affiliated with CRMC, AFD and AFS. No affiliated officers or trustees received any compensation directly from the fund.
Investment in CCF — The fund holds shares of CCF, an institutional prime money market fund managed by CRMC. CCF invests in high-quality, short-term money market instruments. CCF is used as the primary investment vehicle for the fund’s short-term instruments. CCF shares are only available for purchase by CRMC, its affiliates, and other funds managed by CRMC or its affiliates, and are not available to the public. CRMC does not receive an investment advisory services fee from CCF.
Security transactions with related funds — The fund purchased investment securities from, and sold investment securities to, other funds managed by CRMC (or funds managed by certain affiliates of CRMC) under procedures adopted by the fund’s board of trustees. The funds involved in such transactions are considered related by virtue of having a common investment adviser (or affiliated investment advisers), common trustees and/or common officers. Each transaction was executed at the current market price of the security and no brokerage commissions or fees were paid in accordance with Rule 17a-7 of the 1940 Act. During the six months ended January 31, 2023, the fund engaged in such purchase and sale transactions with related funds in the amounts of $401,365,000 and $253,995,000, respectively, which generated $19,294,000 of net realized gains from such sales.
| 66 | The Income Fund of America |
Interfund lending — Pursuant to an exemptive order issued by the SEC, the fund, along with other CRMC-managed funds (or funds managed by certain affiliates of CRMC), may participate in an interfund lending program. The program provides an alternate credit facility that permits the funds to lend or borrow cash for temporary purposes directly to or from one another, subject to the conditions of the exemptive order. The fund did not lend or borrow cash through the interfund lending program at any time during the six months ended January 31, 2023.
8. Indemnifications
The fund’s organizational documents provide board members and officers with indemnification against certain liabilities or expenses in connection with the performance of their duties to the fund. In the normal course of business, the fund may also enter into contracts that provide general indemnifications. The fund’s maximum exposure under these arrangements is unknown since it is dependent on future claims that may be made against the fund. The risk of material loss from such claims is considered remote. Insurance policies are also available to the fund’s board members and officers.
9. Capital share transactions
Capital share transactions in the fund were as follows (dollars and shares in thousands):
| Sales* | Reinvestments of distributions | Repurchases* | Net increase (decrease) | |||||||||||||||||||||||||||||
| Share class | Amount | Shares | Amount | Shares | Amount | Shares | Amount | Shares | ||||||||||||||||||||||||
| Six months ended January 31, 2023 | ||||||||||||||||||||||||||||||||
| Class A | $ | 2,136,635 | 92,692 | $ | 3,964,194 | 171,331 | $ | (4,691,225 | ) | (203,930 | ) | $ | 1,409,604 | 60,093 | ||||||||||||||||||
| Class C | 105,891 | 4,663 | 102,046 | 4,482 | (349,313 | ) | (15,348 | ) | (141,376 | ) | (6,203 | ) | ||||||||||||||||||||
| Class T | — | — | — | — | — | — | — | — | ||||||||||||||||||||||||
| Class F-1 | 75,586 | 3,241 | 118,695 | 5,148 | (175,131 | ) | (7,623 | ) | 19,150 | 766 | ||||||||||||||||||||||
| Class F-2 | 1,301,747 | 56,685 | 650,432 | 28,155 | (1,480,733 | ) | (64,495 | ) | 471,446 | 20,345 | ||||||||||||||||||||||
| Class F-3 | 664,593 | 28,954 | 269,956 | 11,681 | (512,033 | ) | (22,272 | ) | 422,516 | 18,363 | ||||||||||||||||||||||
| Class 529-A | 81,756 | 3,548 | 96,215 | 4,171 | (159,615 | ) | (6,903 | ) | 18,356 | 816 | ||||||||||||||||||||||
| Class 529-C | 8,028 | 349 | 3,208 | 139 | (15,849 | ) | (684 | ) | (4,613 | ) | (196 | ) | ||||||||||||||||||||
| Class 529-E | 2,597 | 112 | 2,892 | 126 | (5,932 | ) | (257 | ) | (443 | ) | (19 | ) | ||||||||||||||||||||
| Class 529-T | — | — | 1 | — | † | — | — | 1 | — | † | ||||||||||||||||||||||
| Class 529-F-1 | — | — | 1 | 1 | — | — | 1 | 1 | ||||||||||||||||||||||||
| Class 529-F-2 | 16,074 | 697 | 7,149 | 309 | (14,053 | ) | (607 | ) | 9,170 | 399 | ||||||||||||||||||||||
| Class 529-F-3 | — | — | 1 | — | † | — | — | 1 | — | † | ||||||||||||||||||||||
| Class R-1 | 4,838 | 212 | 3,280 | 142 | (8,744 | ) | (379 | ) | (626 | ) | (25 | ) | ||||||||||||||||||||
| Class R-2 | 28,011 | 1,235 | 17,806 | 781 | (40,412 | ) | (1,793 | ) | 5,405 | 223 | ||||||||||||||||||||||
| Class R-2E | 3,302 | 145 | 1,879 | 81 | (5,021 | ) | (220 | ) | 160 | 6 | ||||||||||||||||||||||
| Class R-3 | 58,342 | 2,543 | 36,189 | 1,572 | (105,947 | ) | (4,613 | ) | (11,416 | ) | (498 | ) | ||||||||||||||||||||
| Class R-4 | 60,909 | 2,647 | 42,190 | 1,828 | (83,368 | ) | (3,654 | ) | 19,731 | 821 | ||||||||||||||||||||||
| Class R-5E | 15,263 | 672 | 8,786 | 381 | (7,877 | ) | (344 | ) | 16,172 | 709 | ||||||||||||||||||||||
| Class R-5 | 18,220 | 798 | 16,982 | 734 | (22,457 | ) | (979 | ) | 12,745 | 553 | ||||||||||||||||||||||
| Class R-6 | 554,038 | 24,207 | 876,197 | 37,859 | (614,844 | ) | (26,566 | ) | 815,391 | 35,500 | ||||||||||||||||||||||
| Total net increase (decrease) | $ | 5,135,830 | 223,400 | $ | 6,218,099 | 268,921 | $ | (8,292,554 | ) | (360,667 | ) | $ | 3,061,375 | 131,654 | ||||||||||||||||||
Refer to the end of the table for footnotes.
| The Income Fund of America | 67 |
| Sales* | Reinvestments of distributions | Repurchases* | Net increase (decrease) | |||||||||||||||||||||||||||||
| Share class | Amount | Shares | Amount | Shares | Amount | Shares | Amount | Shares | ||||||||||||||||||||||||
| Year ended July 31, 2022 | ||||||||||||||||||||||||||||||||
| Class A | $ | 4,830,451 | 191,918 | $ | 5,372,610 | 215,676 | $ | (8,105,210 | ) | (322,218 | ) | $ | 2,097,851 | 85,376 | ||||||||||||||||||
| Class C | 279,345 | 11,231 | 154,852 | 6,295 | (794,138 | ) | (31,978 | ) | (359,941 | ) | (14,452 | ) | ||||||||||||||||||||
| Class T | — | — | — | — | — | — | — | — | ||||||||||||||||||||||||
| Class F-1 | 89,769 | 3,576 | 168,566 | 6,784 | (379,542 | ) | (15,113 | ) | (121,207 | ) | (4,753 | ) | ||||||||||||||||||||
| Class F-2 | 2,800,552 | 111,603 | 839,636 | 33,786 | (2,224,438 | ) | (88,814 | ) | 1,415,750 | 56,575 | ||||||||||||||||||||||
| Class F-3 | 1,041,311 | 41,338 | 334,976 | 13,476 | (846,178 | ) | (33,630 | ) | 530,109 | 21,184 | ||||||||||||||||||||||
| Class 529-A | 180,280 | 7,171 | 130,662 | 5,260 | (268,561 | ) | (10,676 | ) | 42,381 | 1,755 | ||||||||||||||||||||||
| Class 529-C | 15,533 | 619 | 4,898 | 197 | (36,918 | ) | (1,465 | ) | (16,487 | ) | (649 | ) | ||||||||||||||||||||
| Class 529-E | 6,359 | 254 | 4,005 | 162 | (11,689 | ) | (465 | ) | (1,325 | ) | (49 | ) | ||||||||||||||||||||
| Class 529-T | — | — | 1 | — | † | — | — | 1 | — | † | ||||||||||||||||||||||
| Class 529-F-1 | — | — | 1 | — | † | — | — | 1 | — | † | ||||||||||||||||||||||
| Class 529-F-2 | 27,550 | 1,100 | 8,773 | 353 | (19,956 | ) | (789 | ) | 16,367 | 664 | ||||||||||||||||||||||
| Class 529-F-3 | — | — | 1 | 1 | — | — | 1 | 1 | ||||||||||||||||||||||||
| Class R-1 | 9,602 | 385 | 4,300 | 173 | (16,154 | ) | (641 | ) | (2,252 | ) | (83 | ) | ||||||||||||||||||||
| Class R-2 | 68,858 | 2,773 | 23,787 | 966 | (100,318 | ) | (4,035 | ) | (7,673 | ) | (296 | ) | ||||||||||||||||||||
| Class R-2E | 6,836 | 271 | 2,462 | 99 | (8,543 | ) | (344 | ) | 755 | 26 | ||||||||||||||||||||||
| Class R-3 | 125,211 | 4,995 | 50,394 | 2,030 | (206,893 | ) | (8,240 | ) | (31,288 | ) | (1,215 | ) | ||||||||||||||||||||
| Class R-4 | 149,919 | 5,956 | 58,215 | 2,342 | (263,091 | ) | (10,370 | ) | (54,957 | ) | (2,072 | ) | ||||||||||||||||||||
| Class R-5E | 23,999 | 960 | 11,188 | 450 | (24,391 | ) | (971 | ) | 10,796 | 439 | ||||||||||||||||||||||
| Class R-5 | 34,505 | 1,387 | 23,038 | 926 | (120,463 | ) | (4,661 | ) | (62,920 | ) | (2,348 | ) | ||||||||||||||||||||
| Class R-6 | 1,530,260 | 60,967 | 1,161,044 | 46,644 | (1,250,654 | ) | (50,020 | ) | 1,440,650 | 57,591 | ||||||||||||||||||||||
| Total net increase (decrease) | $ | 11,220,340 | 446,504 | $ | 8,353,409 | 335,620 | $ | (14,677,137 | ) | (584,430 | ) | $ | 4,896,612 | 197,694 | ||||||||||||||||||
| * | Includes exchanges between share classes of the fund. |
| † | Amount less than one thousand. |
10. Investment transactions
The fund engaged in purchases and sales of investment securities, excluding short-term securities and U.S. government obligations, if any, of $51,117,216,000 and $49,150,423,000, respectively, during the six months ended January 31, 2023.
| 68 | The Income Fund of America |
| Income (loss) from investment operations1 | Dividends and distributions | |||||||||||||||||||||||||||||||||||||||||||||||||||
| Year ended | Net asset value, beginning of year | Net investment income | Net gains (losses) on securities (both realized and unrealized) | Total from investment operations | Dividends (from net investment income) | Distributions (from capital gains) | Total dividends and distributions | Net asset value, end of year | Total return2,3 | Net assets, end of year (in millions) | Ratio of expenses to average net assets before reimburse- ments4 | Ratio of expenses to average net assets after reimburse- ments3,4 | Ratio of net income to average net assets3 | |||||||||||||||||||||||||||||||||||||||
| Class A: | ||||||||||||||||||||||||||||||||||||||||||||||||||||
| 1/31/20235,6 | $ | 23.83 | $ | .40 | $ | .38 | $ | .78 | $ | (.44 | ) | $ | (.82 | ) | $ | (1.26 | ) | $ | 23.35 | 3.32 | %7 | $ | 77,935 | .57 | %8 | .57 | %8 | 3.42 | %8 | |||||||||||||||||||||||
| 7/31/2022 | 25.92 | .81 | (1.18 | ) | (.37 | ) | (.74 | ) | (.98 | ) | (1.72 | ) | 23.83 | (1.60 | ) | 78,105 | .56 | .56 | 3.23 | |||||||||||||||||||||||||||||||||
| 7/31/2021 | 21.88 | .75 | 4.04 | 4.79 | (.75 | ) | — | (.75 | ) | 25.92 | 22.23 | 82,740 | .56 | .56 | 3.11 | |||||||||||||||||||||||||||||||||||||
| 7/31/2020 | 22.56 | .73 | (.17 | ) | .56 | (.74 | ) | (.50 | ) | (1.24 | ) | 21.88 | 2.59 | 71,103 | .57 | .57 | 3.32 | |||||||||||||||||||||||||||||||||||
| 7/31/2019 | 23.28 | .72 | .13 | .85 | (.69 | ) | (.88 | ) | (1.57 | ) | 22.56 | 4.22 | 73,594 | .56 | .56 | 3.23 | ||||||||||||||||||||||||||||||||||||
| 7/31/2018 | 22.87 | .73 | .84 | 1.57 | (.66 | ) | (.50 | ) | (1.16 | ) | 23.28 | 6.98 | 75,284 | .55 | .55 | 3.16 | ||||||||||||||||||||||||||||||||||||
| Class C: | ||||||||||||||||||||||||||||||||||||||||||||||||||||
| 1/31/20235,6 | 23.46 | .31 | .37 | .68 | (.35 | ) | (.82 | ) | (1.17 | ) | 22.97 | 2.95 | 7 | 2,047 | 1.31 | 8 | 1.31 | 8 | 2.67 | 8 | ||||||||||||||||||||||||||||||||
| 7/31/2022 | 25.54 | .61 | (1.16 | ) | (.55 | ) | (.55 | ) | (.98 | ) | (1.53 | ) | 23.46 | (2.35 | ) | 2,236 | 1.31 | 1.31 | 2.46 | |||||||||||||||||||||||||||||||||
| 7/31/2021 | 21.57 | .56 | 3.98 | 4.54 | (.57 | ) | — | (.57 | ) | 25.54 | 21.31 | 2,803 | 1.31 | 1.31 | 2.37 | |||||||||||||||||||||||||||||||||||||
| 7/31/2020 | 22.25 | .56 | (.16 | ) | .40 | (.58 | ) | (.50 | ) | (1.08 | ) | 21.57 | 1.82 | 2,906 | 1.32 | 1.32 | 2.58 | |||||||||||||||||||||||||||||||||||
| 7/31/2019 | 22.98 | .54 | .13 | .67 | (.52 | ) | (.88 | ) | (1.40 | ) | 22.25 | 3.41 | 4,279 | 1.34 | 1.34 | 2.45 | ||||||||||||||||||||||||||||||||||||
| 7/31/2018 | 22.59 | .54 | .82 | 1.36 | (.47 | ) | (.50 | ) | (.97 | ) | 22.98 | 6.11 | 4,917 | 1.34 | 1.34 | 2.36 | ||||||||||||||||||||||||||||||||||||
| Class T: | ||||||||||||||||||||||||||||||||||||||||||||||||||||
| 1/31/20235,6 | 23.83 | .43 | .38 | .81 | (.47 | ) | (.82 | ) | (1.29 | ) | 23.35 | 3.45 | 7,9 | — | 10 | .29 | 8,9 | .29 | 8,9 | 3.69 | 8,9 | |||||||||||||||||||||||||||||||
| 7/31/2022 | 25.92 | .88 | (1.19 | ) | (.31 | ) | (.80 | ) | (.98 | ) | (1.78 | ) | 23.83 | (1.35 | )9 | — | 10 | .31 | 9 | .31 | 9 | 3.47 | 9 | |||||||||||||||||||||||||||||
| 7/31/2021 | 21.88 | .81 | 4.04 | 4.85 | (.81 | ) | — | (.81 | ) | 25.92 | 22.52 | 9 | — | 10 | .32 | 9 | .32 | 9 | 3.35 | 9 | ||||||||||||||||||||||||||||||||
| 7/31/2020 | 22.57 | .78 | (.17 | ) | .61 | (.80 | ) | (.50 | ) | (1.30 | ) | 21.88 | 2.81 | 9 | — | 10 | .33 | 9 | .33 | 9 | 3.55 | 9 | ||||||||||||||||||||||||||||||
| 7/31/2019 | 23.29 | .77 | .13 | .90 | (.74 | ) | (.88 | ) | (1.62 | ) | 22.57 | 4.44 | 9 | — | 10 | .35 | 9 | .35 | 9 | 3.43 | 9 | |||||||||||||||||||||||||||||||
| 7/31/2018 | 22.88 | .78 | .84 | 1.62 | (.71 | ) | (.50 | ) | (1.21 | ) | 23.29 | 7.19 | 9 | — | 10 | .34 | 9 | .34 | 9 | 3.36 | 9 | |||||||||||||||||||||||||||||||
| Class F-1: | ||||||||||||||||||||||||||||||||||||||||||||||||||||
| 1/31/20235,6 | 23.75 | .39 | .38 | .77 | (.43 | ) | (.82 | ) | (1.25 | ) | 23.27 | 3.29 | 7 | 2,323 | .62 | 8 | .62 | 8 | 3.36 | 8 | ||||||||||||||||||||||||||||||||
| 7/31/2022 | 25.84 | .79 | (1.18 | ) | (.39 | ) | (.72 | ) | (.98 | ) | (1.70 | ) | 23.75 | (1.68 | ) | 2,353 | .63 | .63 | 3.15 | |||||||||||||||||||||||||||||||||
| 7/31/2021 | 21.82 | .73 | 4.03 | 4.76 | (.74 | ) | — | (.74 | ) | 25.84 | 22.12 | 2,683 | .63 | .63 | 3.06 | |||||||||||||||||||||||||||||||||||||
| 7/31/2020 | 22.50 | .72 | (.17 | ) | .55 | (.73 | ) | (.50 | ) | (1.23 | ) | 21.82 | 2.53 | 3,365 | .63 | .63 | 3.27 | |||||||||||||||||||||||||||||||||||
| 7/31/2019 | 23.22 | .70 | .13 | .83 | (.67 | ) | (.88 | ) | (1.55 | ) | 22.50 | 4.15 | 4,022 | .65 | .65 | 3.14 | ||||||||||||||||||||||||||||||||||||
| 7/31/2018 | 22.82 | .71 | .83 | 1.54 | (.64 | ) | (.50 | ) | (1.14 | ) | 23.22 | 6.84 | 4,243 | .64 | .64 | 3.07 | ||||||||||||||||||||||||||||||||||||
| Class F-2: | ||||||||||||||||||||||||||||||||||||||||||||||||||||
| 1/31/20235,6 | 23.80 | .42 | .38 | .80 | (.46 | ) | (.82 | ) | (1.28 | ) | 23.32 | 3.42 | 7 | 12,876 | .37 | 8 | .37 | 8 | 3.62 | 8 | ||||||||||||||||||||||||||||||||
| 7/31/2022 | 25.89 | .87 | (1.19 | ) | (.32 | ) | (.79 | ) | (.98 | ) | (1.77 | ) | 23.80 | (1.40 | ) | 12,656 | .36 | .36 | 3.44 | |||||||||||||||||||||||||||||||||
| 7/31/2021 | 21.86 | .80 | 4.03 | 4.83 | (.80 | ) | — | (.80 | ) | 25.89 | 22.46 | 12,303 | .36 | .36 | 3.31 | |||||||||||||||||||||||||||||||||||||
| 7/31/2020 | 22.54 | .77 | (.16 | ) | .61 | (.79 | ) | (.50 | ) | (1.29 | ) | 21.86 | 2.81 | 9,894 | .37 | .37 | 3.52 | |||||||||||||||||||||||||||||||||||
| 7/31/2019 | 23.27 | .76 | .12 | .88 | (.73 | ) | (.88 | ) | (1.61 | ) | 22.54 | 4.36 | 9,425 | .39 | .39 | 3.40 | ||||||||||||||||||||||||||||||||||||
| 7/31/2018 | 22.86 | .77 | .84 | 1.61 | (.70 | ) | (.50 | ) | (1.20 | ) | 23.27 | 7.16 | 8,675 | .38 | .38 | 3.33 | ||||||||||||||||||||||||||||||||||||
| Class F-3: | ||||||||||||||||||||||||||||||||||||||||||||||||||||
| 1/31/20235,6 | 23.81 | .43 | .38 | .81 | (.47 | ) | (.82 | ) | (1.29 | ) | 23.33 | 3.47 | 7 | 5,171 | .26 | 8 | .26 | 8 | 3.72 | 8 | ||||||||||||||||||||||||||||||||
| 7/31/2022 | 25.90 | .89 | (1.18 | ) | (.29 | ) | (.82 | ) | (.98 | ) | (1.80 | ) | 23.81 | (1.30 | ) | 4,840 | .25 | .25 | 3.54 | |||||||||||||||||||||||||||||||||
| 7/31/2021 | 21.87 | .82 | 4.04 | 4.86 | (.83 | ) | — | (.83 | ) | 25.90 | 22.57 | 4,717 | .26 | .26 | 3.42 | |||||||||||||||||||||||||||||||||||||
| 7/31/2020 | 22.56 | .80 | (.18 | ) | .62 | (.81 | ) | (.50 | ) | (1.31 | ) | 21.87 | 2.88 | 3,680 | .26 | .26 | 3.63 | |||||||||||||||||||||||||||||||||||
| 7/31/2019 | 23.28 | .78 | .13 | .91 | (.75 | ) | (.88 | ) | (1.63 | ) | 22.56 | 4.52 | 3,343 | .28 | .28 | 3.50 | ||||||||||||||||||||||||||||||||||||
| 7/31/2018 | 22.87 | .79 | .84 | 1.63 | (.72 | ) | (.50 | ) | (1.22 | ) | 23.28 | 7.27 | 2,747 | .28 | .28 | 3.43 | ||||||||||||||||||||||||||||||||||||
| Class 529-A: | ||||||||||||||||||||||||||||||||||||||||||||||||||||
| 1/31/20235,6 | 23.76 | .39 | .38 | .77 | (.43 | ) | (.82 | ) | (1.25 | ) | 23.28 | 3.31 | 7 | 1,850 | .61 | 8 | .61 | 8 | 3.38 | 8 | ||||||||||||||||||||||||||||||||
| 7/31/2022 | 25.85 | .80 | (1.18 | ) | (.38 | ) | (.73 | ) | (.98 | ) | (1.71 | ) | 23.76 | (1.64 | ) | 1,868 | .59 | .59 | 3.19 | |||||||||||||||||||||||||||||||||
| 7/31/2021 | 21.83 | .74 | 4.02 | 4.76 | (.74 | ) | — | (.74 | ) | 25.85 | 22.14 | 1,987 | .60 | .60 | 3.07 | |||||||||||||||||||||||||||||||||||||
| 7/31/2020 | 22.51 | .72 | (.17 | ) | .55 | (.73 | ) | (.50 | ) | (1.23 | ) | 21.83 | 2.55 | 1,740 | .62 | .62 | 3.27 | |||||||||||||||||||||||||||||||||||
| 7/31/2019 | 23.23 | .70 | .13 | .83 | (.67 | ) | (.88 | ) | (1.55 | ) | 22.51 | 4.15 | 1,704 | .64 | .64 | 3.15 | ||||||||||||||||||||||||||||||||||||
| 7/31/2018 | 22.83 | .71 | .83 | 1.54 | (.64 | ) | (.50 | ) | (1.14 | ) | 23.23 | 6.87 | 1,733 | .63 | .63 | 3.08 | ||||||||||||||||||||||||||||||||||||
Refer to the end of the table for footnotes.
| The Income Fund of America | 69 |
Financial highlights (continued)
| Income (loss) from investment operations1 | Dividends and distributions | |||||||||||||||||||||||||||||||||||||||||||||||||||
| Year ended | Net asset value, beginning of year | Net investment income | Net gains (losses) on securities (both realized and unrealized) | Total from investment operations | Dividends (from net investment income) | Distributions (from capital gains) | Total dividends and distributions | Net asset value, end of year | Total return2,3 | Net assets, end of year (in millions) | Ratio of expenses to average net assets before reimburse- ments4 | Ratio of expenses to average net assets after reimburse- ments3,4 | Ratio of net income to average net assets3 | |||||||||||||||||||||||||||||||||||||||
| Class 529-C: | ||||||||||||||||||||||||||||||||||||||||||||||||||||
| 1/31/20235,6 | $ | 23.70 | $ | .30 | $ | .38 | $ | .68 | $ | (.34 | ) | $ | (.82 | ) | $ | (1.16 | ) | $ | 23.22 | 2.92 | %7 | $ | 65 | 1.37 | %8 | 1.37 | %8 | 2.61 | %8 | |||||||||||||||||||||||
| 7/31/2022 | 25.78 | .61 | (1.18 | ) | (.57 | ) | (.53 | ) | (.98 | ) | (1.51 | ) | 23.70 | (2.40 | ) | 71 | 1.35 | 1.35 | 2.41 | |||||||||||||||||||||||||||||||||
| 7/31/2021 | 21.76 | .56 | 4.02 | 4.58 | (.56 | ) | — | (.56 | ) | 25.78 | 21.26 | 94 | 1.33 | 1.33 | 2.34 | |||||||||||||||||||||||||||||||||||||
| 7/31/2020 | 22.43 | .56 | (.16 | ) | .40 | (.57 | ) | (.50 | ) | (1.07 | ) | 21.76 | 1.79 | 103 | 1.36 | 1.36 | 2.56 | |||||||||||||||||||||||||||||||||||
| 7/31/2019 | 23.15 | .53 | .13 | .66 | (.50 | ) | (.88 | ) | (1.38 | ) | 22.43 | 3.37 | 271 | 1.38 | 1.38 | 2.41 | ||||||||||||||||||||||||||||||||||||
| 7/31/2018 | 22.73 | .53 | .83 | 1.36 | (.44 | ) | (.50 | ) | (.94 | ) | 23.15 | 6.06 | 322 | 1.39 | 1.39 | 2.30 | ||||||||||||||||||||||||||||||||||||
| Class 529-E: | ||||||||||||||||||||||||||||||||||||||||||||||||||||
| 1/31/20235,6 | 23.67 | .36 | .38 | .74 | (.40 | ) | (.82 | ) | (1.22 | ) | 23.19 | 3.20 | 7 | 56 | .84 | 8 | .84 | 8 | 3.14 | 8 | ||||||||||||||||||||||||||||||||
| 7/31/2022 | 25.76 | .74 | (1.18 | ) | (.44 | ) | (.67 | ) | (.98 | ) | (1.65 | ) | 23.67 | (1.89 | ) | 58 | .83 | .83 | 2.95 | |||||||||||||||||||||||||||||||||
| 7/31/2021 | 21.75 | .68 | 4.02 | 4.70 | (.69 | ) | — | (.69 | ) | 25.76 | 21.90 | 64 | .83 | .83 | 2.84 | |||||||||||||||||||||||||||||||||||||
| 7/31/2020 | 22.43 | .67 | (.17 | ) | .50 | (.68 | ) | (.50 | ) | (1.18 | ) | 21.75 | 2.31 | 59 | .84 | .84 | 3.05 | |||||||||||||||||||||||||||||||||||
| 7/31/2019 | 23.16 | .65 | .12 | .77 | (.62 | ) | (.88 | ) | (1.50 | ) | 22.43 | 3.87 | 64 | .86 | .86 | 2.92 | ||||||||||||||||||||||||||||||||||||
| 7/31/2018 | 22.76 | .66 | .83 | 1.49 | (.59 | ) | (.50 | ) | (1.09 | ) | 23.16 | 6.63 | 69 | .86 | .86 | 2.84 | ||||||||||||||||||||||||||||||||||||
| Class 529-T: | ||||||||||||||||||||||||||||||||||||||||||||||||||||
| 1/31/20235,6 | 23.83 | .42 | .38 | .80 | (.46 | ) | (.82 | ) | (1.28 | ) | 23.35 | 3.42 | 7,9 | — | 10 | .34 | 8,9 | .34 | 8,9 | 3.64 | 8,9 | |||||||||||||||||||||||||||||||
| 7/31/2022 | 25.92 | .87 | (1.19 | ) | (.32 | ) | (.79 | ) | (.98 | ) | (1.77 | ) | 23.83 | (1.39 | )9 | — | 10 | .35 | 9 | .35 | 9 | 3.44 | 9 | |||||||||||||||||||||||||||||
| 7/31/2021 | 21.88 | .80 | 4.04 | 4.84 | (.80 | ) | — | (.80 | ) | 25.92 | 22.47 | 9 | — | 10 | .36 | 9 | .36 | 9 | 3.31 | 9 | ||||||||||||||||||||||||||||||||
| 7/31/2020 | 22.57 | .77 | (.17 | ) | .60 | (.79 | ) | (.50 | ) | (1.29 | ) | 21.88 | 2.75 | 9 | — | 10 | .39 | 9 | .39 | 9 | 3.50 | 9 | ||||||||||||||||||||||||||||||
| 7/31/2019 | 23.29 | .75 | .13 | .88 | (.72 | ) | (.88 | ) | (1.60 | ) | 22.57 | 4.38 | 9 | — | 10 | .41 | 9 | .41 | 9 | 3.37 | 9 | |||||||||||||||||||||||||||||||
| 7/31/2018 | 22.88 | .76 | .84 | 1.60 | (.69 | ) | (.50 | ) | (1.19 | ) | 23.29 | 7.12 | 9 | — | 10 | .41 | 9 | .41 | 9 | 3.30 | 9 | |||||||||||||||||||||||||||||||
| Class 529-F-1: | ||||||||||||||||||||||||||||||||||||||||||||||||||||
| 1/31/20235,6 | 23.75 | .41 | .38 | .79 | (.45 | ) | (.82 | ) | (1.27 | ) | 23.27 | 3.39 | 7,9 | — | 10 | .43 | 8,9 | .43 | 8,9 | 3.56 | 8,9 | |||||||||||||||||||||||||||||||
| 7/31/2022 | 25.84 | .84 | (1.18 | ) | (.34 | ) | (.77 | ) | (.98 | ) | (1.75 | ) | 23.75 | (1.49 | )9 | — | 10 | .43 | 9 | .43 | 9 | 3.36 | 9 | |||||||||||||||||||||||||||||
| 7/31/2021 | 21.82 | .78 | 4.03 | 4.81 | (.79 | ) | — | (.79 | ) | 25.84 | 22.40 | 9 | — | 10 | .37 | 9 | .37 | 9 | 3.55 | 9 | ||||||||||||||||||||||||||||||||
| 7/31/2020 | 22.50 | .77 | (.16 | ) | .61 | (.79 | ) | (.50 | ) | (1.29 | ) | 21.82 | 2.80 | 94 | .38 | .38 | 3.52 | |||||||||||||||||||||||||||||||||||
| 7/31/2019 | 23.23 | .75 | .13 | .88 | (.73 | ) | (.88 | ) | (1.61 | ) | 22.50 | 4.36 | 92 | .40 | .40 | 3.39 | ||||||||||||||||||||||||||||||||||||
| 7/31/2018 | 22.83 | .77 | .82 | 1.59 | (.69 | ) | (.50 | ) | (1.19 | ) | 23.23 | 7.10 | 81 | .40 | .40 | 3.32 | ||||||||||||||||||||||||||||||||||||
| Class 529-F-2: | ||||||||||||||||||||||||||||||||||||||||||||||||||||
| 1/31/20235,6 | 23.83 | .42 | .38 | .80 | (.46 | ) | (.82 | ) | (1.28 | ) | 23.35 | 3.42 | 7 | 137 | .34 | 8 | .34 | 8 | 3.65 | 8 | ||||||||||||||||||||||||||||||||
| 7/31/2022 | 25.92 | .87 | (1.19 | ) | (.32 | ) | (.79 | ) | (.98 | ) | (1.77 | ) | 23.83 | (1.39 | ) | 131 | .35 | .35 | 3.45 | |||||||||||||||||||||||||||||||||
| 7/31/20215,11 | 21.40 | .60 | 4.54 | 5.14 | (.62 | ) | — | (.62 | ) | 25.92 | 24.24 | 7 | 125 | .36 | 8 | .36 | 8 | 3.24 | 8 | |||||||||||||||||||||||||||||||||
| Class 529-F-3: | ||||||||||||||||||||||||||||||||||||||||||||||||||||
| 1/31/20235,6 | 23.83 | .43 | .37 | .80 | (.46 | ) | (.82 | ) | (1.28 | ) | 23.35 | 3.44 | 7 | — | 10 | .32 | 8 | .32 | 8 | 3.66 | 8 | |||||||||||||||||||||||||||||||
| 7/31/2022 | 25.92 | .88 | (1.19 | ) | (.31 | ) | (.80 | ) | (.98 | ) | (1.78 | ) | 23.83 | (1.35 | ) | — | 10 | .31 | .31 | 3.48 | ||||||||||||||||||||||||||||||||
| 7/31/20215,11 | 21.40 | .60 | 4.55 | 5.15 | (.63 | ) | — | (.63 | ) | 25.92 | 24.28 | 7 | — | 10 | .38 | 8 | .32 | 8 | 3.28 | 8 | ||||||||||||||||||||||||||||||||
| Class R-1: | ||||||||||||||||||||||||||||||||||||||||||||||||||||
| 1/31/20235,6 | 23.66 | .30 | .38 | .68 | (.35 | ) | (.82 | ) | (1.17 | ) | 23.17 | 2.90 | 7 | 66 | 1.34 | 8 | 1.34 | 8 | 2.64 | 8 | ||||||||||||||||||||||||||||||||
| 7/31/2022 | 25.73 | .61 | (1.16 | ) | (.55 | ) | (.54 | ) | (.98 | ) | (1.52 | ) | 23.66 | (2.33 | ) | 68 | 1.34 | 1.34 | 2.44 | |||||||||||||||||||||||||||||||||
| 7/31/2021 | 21.73 | .56 | 4.01 | 4.57 | (.57 | ) | — | (.57 | ) | 25.73 | 21.26 | 76 | 1.34 | 1.34 | 2.34 | |||||||||||||||||||||||||||||||||||||
| 7/31/2020 | 22.41 | .56 | (.17 | ) | .39 | (.57 | ) | (.50 | ) | (1.07 | ) | 21.73 | 1.75 | 81 | 1.36 | 1.36 | 2.54 | |||||||||||||||||||||||||||||||||||
| 7/31/2019 | 23.13 | .53 | .14 | .67 | (.51 | ) | (.88 | ) | (1.39 | ) | 22.41 | 3.38 | 99 | 1.37 | 1.37 | 2.41 | ||||||||||||||||||||||||||||||||||||
| 7/31/2018 | 22.73 | .54 | .83 | 1.37 | (.47 | ) | (.50 | ) | (.97 | ) | 23.13 | 6.09 | 116 | 1.37 | 1.37 | 2.33 | ||||||||||||||||||||||||||||||||||||
Refer to the end of the table for footnotes.
| 70 | The Income Fund of America |
Financial highlights (continued)
| Income (loss) from investment operations1 | Dividends and distributions | |||||||||||||||||||||||||||||||||||||||||||||||||||
| Year ended | Net asset value, beginning of year | Net investment income | Net gains (losses) on securities (both realized and unrealized) | Total from investment operations | Dividends (from net investment income) | Distributions (from capital gains) | Total dividends and distributions | Net asset value, end of year | Total return2,3 | Net assets, end of year (in millions) | Ratio of expenses to average net assets before reimburse- ments4 | Ratio of expenses to average net assets after reimburse- ments3,4 | Ratio of net income to average net assets3 | |||||||||||||||||||||||||||||||||||||||
| Class R-2: | ||||||||||||||||||||||||||||||||||||||||||||||||||||
| 1/31/20235,6 | $ | 23.49 | $ | .30 | $ | .37 | $ | .67 | $ | (.34 | ) | $ | (.82 | ) | $ | (1.16 | ) | $ | 23.00 | 2.92 | %7 | $ | 366 | 1.36 | %8 | 1.36 | %8 | 2.62 | %8 | |||||||||||||||||||||||
| 7/31/2022 | 25.57 | .61 | (1.17 | ) | (.56 | ) | (.54 | ) | (.98 | ) | (1.52 | ) | 23.49 | (2.38 | ) | 369 | 1.34 | 1.34 | 2.44 | |||||||||||||||||||||||||||||||||
| 7/31/2021 | 21.60 | .55 | 3.99 | 4.54 | (.57 | ) | — | (.57 | ) | 25.57 | 21.26 | 409 | 1.35 | 1.35 | 2.33 | |||||||||||||||||||||||||||||||||||||
| 7/31/2020 | 22.28 | .55 | (.16 | ) | .39 | (.57 | ) | (.50 | ) | (1.07 | ) | 21.60 | 1.76 | 385 | 1.37 | 1.37 | 2.52 | |||||||||||||||||||||||||||||||||||
| 7/31/2019 | 23.01 | .53 | .13 | .66 | (.51 | ) | (.88 | ) | (1.39 | ) | 22.28 | 3.37 | 439 | 1.38 | 1.38 | 2.41 | ||||||||||||||||||||||||||||||||||||
| 7/31/2018 | 22.62 | .54 | .82 | 1.36 | (.47 | ) | (.50 | ) | (.97 | ) | 23.01 | 6.09 | 488 | 1.37 | 1.37 | 2.34 | ||||||||||||||||||||||||||||||||||||
| Class R-2E: | ||||||||||||||||||||||||||||||||||||||||||||||||||||
| 1/31/20235,6 | 23.75 | .34 | .38 | .72 | (.38 | ) | (.82 | ) | (1.20 | ) | 23.27 | 3.07 | 7 | 36 | 1.06 | 8 | 1.06 | 8 | 2.92 | 8 | ||||||||||||||||||||||||||||||||
| 7/31/2022 | 25.83 | .69 | (1.18 | ) | (.49 | ) | (.61 | ) | (.98 | ) | (1.59 | ) | 23.75 | (2.08 | ) | 37 | 1.05 | 1.05 | 2.73 | |||||||||||||||||||||||||||||||||
| 7/31/2021 | 21.81 | .63 | 4.02 | 4.65 | (.63 | ) | — | (.63 | ) | 25.83 | 21.62 | 39 | 1.06 | 1.06 | 2.62 | |||||||||||||||||||||||||||||||||||||
| 7/31/2020 | 22.49 | .62 | (.17 | ) | .45 | (.63 | ) | (.50 | ) | (1.13 | ) | 21.81 | 2.06 | 35 | 1.07 | 1.07 | 2.82 | |||||||||||||||||||||||||||||||||||
| 7/31/2019 | 23.22 | .60 | .13 | .73 | (.58 | ) | (.88 | ) | (1.46 | ) | 22.49 | 3.66 | 36 | 1.08 | 1.08 | 2.71 | ||||||||||||||||||||||||||||||||||||
| 7/31/2018 | 22.82 | .61 | .83 | 1.44 | (.54 | ) | (.50 | ) | (1.04 | ) | 23.22 | 6.40 | 28 | 1.08 | 1.08 | 2.63 | ||||||||||||||||||||||||||||||||||||
| Class R-3: | ||||||||||||||||||||||||||||||||||||||||||||||||||||
| 1/31/20235,6 | 23.72 | .36 | .37 | .73 | (.40 | ) | (.82 | ) | (1.22 | ) | 23.23 | 3.12 | 7 | 702 | .91 | 8 | .91 | 8 | 3.08 | 8 | ||||||||||||||||||||||||||||||||
| 7/31/2022 | 25.80 | .72 | (1.17 | ) | (.45 | ) | (.65 | ) | (.98 | ) | (1.63 | ) | 23.72 | (1.92 | ) | 729 | .90 | .90 | 2.88 | |||||||||||||||||||||||||||||||||
| 7/31/2021 | 21.79 | .66 | 4.02 | 4.68 | (.67 | ) | — | (.67 | ) | 25.80 | 21.78 | 824 | .90 | .90 | 2.78 | |||||||||||||||||||||||||||||||||||||
| 7/31/2020 | 22.46 | .65 | (.15 | ) | .50 | (.67 | ) | (.50 | ) | (1.17 | ) | 21.79 | 2.27 | 792 | .92 | .92 | 2.97 | |||||||||||||||||||||||||||||||||||
| 7/31/2019 | 23.19 | .63 | .13 | .76 | (.61 | ) | (.88 | ) | (1.49 | ) | 22.46 | 3.80 | 954 | .93 | .93 | 2.86 | ||||||||||||||||||||||||||||||||||||
| 7/31/2018 | 22.78 | .64 | .84 | 1.48 | (.57 | ) | (.50 | ) | (1.07 | ) | 23.19 | 6.60 | 1,057 | .92 | .92 | 2.78 | ||||||||||||||||||||||||||||||||||||
| Class R-4: | ||||||||||||||||||||||||||||||||||||||||||||||||||||
| 1/31/20235,6 | 23.78 | .39 | .37 | .76 | (.43 | ) | (.82 | ) | (1.25 | ) | 23.29 | 3.26 | 7 | 817 | .61 | 8 | .61 | 8 | 3.38 | 8 | ||||||||||||||||||||||||||||||||
| 7/31/2022 | 25.86 | .80 | (1.17 | ) | (.37 | ) | (.73 | ) | (.98 | ) | (1.71 | ) | 23.78 | (1.61 | ) | 815 | .60 | .60 | 3.18 | |||||||||||||||||||||||||||||||||
| 7/31/2021 | 21.84 | .74 | 4.02 | 4.76 | (.74 | ) | — | (.74 | ) | 25.86 | 22.13 | 940 | .60 | .60 | 3.07 | |||||||||||||||||||||||||||||||||||||
| 7/31/2020 | 22.52 | .72 | (.16 | ) | .56 | (.74 | ) | (.50 | ) | (1.24 | ) | 21.84 | 2.55 | 925 | .61 | .61 | 3.28 | |||||||||||||||||||||||||||||||||||
| 7/31/2019 | 23.24 | .70 | .13 | .83 | (.67 | ) | (.88 | ) | (1.55 | ) | 22.52 | 4.15 | 1,018 | .63 | .63 | 3.16 | ||||||||||||||||||||||||||||||||||||
| 7/31/2018 | 22.83 | .71 | .84 | 1.55 | (.64 | ) | (.50 | ) | (1.14 | ) | 23.24 | 6.90 | 1,154 | .63 | .63 | 3.07 | ||||||||||||||||||||||||||||||||||||
| Class R-5E: | ||||||||||||||||||||||||||||||||||||||||||||||||||||
| 1/31/20235,6 | 23.79 | .41 | .38 | .79 | (.45 | ) | (.82 | ) | (1.27 | ) | 23.31 | 3.40 | 7 | 173 | .41 | 8 | .41 | 8 | 3.57 | 8 | ||||||||||||||||||||||||||||||||
| 7/31/2022 | 25.87 | .85 | (1.17 | ) | (.32 | ) | (.78 | ) | (.98 | ) | (1.76 | ) | 23.79 | (1.45 | ) | 159 | .40 | .40 | 3.39 | |||||||||||||||||||||||||||||||||
| 7/31/2021 | 21.85 | .80 | 4.02 | 4.82 | (.80 | ) | — | (.80 | ) | 25.87 | 22.45 | 162 | .39 | .39 | 3.25 | |||||||||||||||||||||||||||||||||||||
| 7/31/2020 | 22.54 | .75 | (.16 | ) | .59 | (.78 | ) | (.50 | ) | (1.28 | ) | 21.85 | 2.73 | 41 | .41 | .41 | 3.45 | |||||||||||||||||||||||||||||||||||
| 7/31/2019 | 23.26 | .74 | .14 | .88 | (.72 | ) | (.88 | ) | (1.60 | ) | 22.54 | 4.38 | 21 | .42 | .42 | 3.34 | ||||||||||||||||||||||||||||||||||||
| 7/31/2018 | 22.85 | .78 | .82 | 1.60 | (.69 | ) | (.50 | ) | (1.19 | ) | 23.26 | 7.14 | 6 | .41 | .41 | 3.38 | ||||||||||||||||||||||||||||||||||||
| Class R-5: | ||||||||||||||||||||||||||||||||||||||||||||||||||||
| 1/31/20235,6 | 23.83 | .43 | .38 | .81 | (.47 | ) | (.82 | ) | (1.29 | ) | 23.35 | 3.45 | 7 | 323 | .31 | 8 | .31 | 8 | 3.68 | 8 | ||||||||||||||||||||||||||||||||
| 7/31/2022 | 25.92 | .88 | (1.18 | ) | (.30 | ) | (.81 | ) | (.98 | ) | (1.79 | ) | 23.83 | (1.34 | ) | 317 | .30 | .30 | 3.48 | |||||||||||||||||||||||||||||||||
| 7/31/2021 | 21.88 | .81 | 4.04 | 4.85 | (.81 | ) | — | (.81 | ) | 25.92 | 22.55 | 406 | .30 | .30 | 3.38 | |||||||||||||||||||||||||||||||||||||
| 7/31/2020 | 22.56 | .79 | (.17 | ) | .62 | (.80 | ) | (.50 | ) | (1.30 | ) | 21.88 | 2.87 | 371 | .31 | .31 | 3.56 | |||||||||||||||||||||||||||||||||||
| 7/31/2019 | 23.28 | .77 | .13 | .90 | (.74 | ) | (.88 | ) | (1.62 | ) | 22.56 | 4.47 | 445 | .32 | .32 | 3.46 | ||||||||||||||||||||||||||||||||||||
| 7/31/2018 | 22.87 | .78 | .84 | 1.62 | (.71 | ) | (.50 | ) | (1.21 | ) | 23.28 | 7.21 | 449 | .33 | .33 | 3.38 | ||||||||||||||||||||||||||||||||||||
| Class R-6: | ||||||||||||||||||||||||||||||||||||||||||||||||||||
| 1/31/20235,6 | 23.84 | .43 | .38 | .81 | (.47 | ) | (.82 | ) | (1.29 | ) | 23.36 | 3.47 | 7 | 16,719 | .26 | 8 | .26 | 8 | 3.72 | 8 | ||||||||||||||||||||||||||||||||
| 7/31/2022 | 25.93 | .89 | (1.18 | ) | (.29 | ) | (.82 | ) | (.98 | ) | (1.80 | ) | 23.84 | (1.29 | ) | 16,215 | .25 | .25 | 3.54 | |||||||||||||||||||||||||||||||||
| 7/31/2021 | 21.89 | .82 | 4.05 | 4.87 | (.83 | ) | — | (.83 | ) | 25.93 | 22.59 | 16,144 | .25 | .25 | 3.42 | |||||||||||||||||||||||||||||||||||||
| 7/31/2020 | 22.58 | .79 | (.17 | ) | .62 | (.81 | ) | (.50 | ) | (1.31 | ) | 21.89 | 2.88 | 12,922 | .26 | .26 | 3.61 | |||||||||||||||||||||||||||||||||||
| 7/31/2019 | 23.30 | .78 | .13 | .91 | (.75 | ) | (.88 | ) | (1.63 | ) | 22.58 | 4.52 | 10,202 | .28 | .28 | 3.51 | ||||||||||||||||||||||||||||||||||||
| 7/31/2018 | 22.88 | .80 | .84 | 1.64 | (.72 | ) | (.50 | ) | (1.22 | ) | 23.30 | 7.31 | 8,478 | .28 | .28 | 3.44 | ||||||||||||||||||||||||||||||||||||
Refer to the end of the table for footnotes.
| The Income Fund of America | 71 |
Financial highlights (continued)
| Six
months ended January 31, 20235,6,7 | Year ended July 31, | |||||||||||||||||||||||
| Portfolio turnover rate for all share classes12,13 | 2022 | 2021 | 2020 | 2019 | 2018 | |||||||||||||||||||
| Excluding mortgage dollar roll transactions | 25 | % | 40 | % | 44 | % | 58 | % | 48 | % | 53 | % | ||||||||||||
| Including mortgage dollar roll transactions | 54 | % | 72 | % | 133 | % | 117 | % | 67 | % | 70 | % | ||||||||||||
| 1 | Based on average shares outstanding. |
| 2 | Total returns exclude any applicable sales charges, including contingent deferred sales charges. |
| 3 | This column reflects the impact, if any, of certain reimbursements from CRMC. During one of the years shown, CRMC reimbursed a portion of transfer agent services fees for Class 529-F-3 shares. |
| 4 | Ratios do not include expenses of any Central Funds. The fund indirectly bears its proportionate share of the expenses of any Central Funds. |
| 5 | Based on operations for a period that is less than a full year. |
| 6 | Unaudited. |
| 7 | Not annualized. |
| 8 | Annualized. |
| 9 | All or a significant portion of assets in this class consisted of seed capital invested by CRMC and/or its affiliates. Fees for distribution services are not charged or accrued on these seed capital assets. If such fees were paid by the fund on seed capital assets, fund expenses would have been higher and net income and total return would have been lower. |
| 10 | Amount less than $1 million. |
| 11 | Class 529-F-2 and 529-F-3 shares began investment operations on October 30, 2020. |
| 12 | Refer to Note 5 for more information on mortgage dollar rolls. |
| 13 | Rates do not include the portfolio activity of Capital Group Central Cash Fund. |
Refer to the notes to financial statements.
| 72 | The Income Fund of America |
| Expense example | unaudited |
As a fund shareholder, you incur two types of costs: (1) transaction costs, such as initial sales charges on purchase payments and contingent deferred sales charges on redemptions (loads), and (2) ongoing costs, including management fees, distribution and service (12b-1) fees, and other expenses. This example is intended to help you understand your ongoing costs (in dollars) of investing in the fund so you can compare these costs with the ongoing costs of investing in other mutual funds. The example is based on an investment of $1,000 invested at the beginning of the period and held for the entire six-month period (August 1, 2022, through January 31, 2023).
Actual expenses:
The first line of each share class in the table on the following page provides information about actual account values and actual expenses. You may use the information in this line, together with the amount you invested, to estimate the expenses that you paid over the period. Simply divide your account value by $1,000 (for example, an $8,600 account value divided by $1,000 = 8.6), then multiply the result by the number in the first line under the heading titled “Expenses paid during period” to estimate the expenses you paid on your account during this period.
Hypothetical example for comparison purposes:
The second line of each share class in the table on the following page provides information about hypothetical account values and hypothetical expenses based on the actual expense ratio for the share class and an assumed rate of return of 5.00% per year before expenses, which is not the actual return of the share class. The hypothetical account values and expenses may not be used to estimate the actual ending account balance or expenses you paid for the period. You may use this information to compare the ongoing costs of investing in the fund and other funds. To do so, compare this 5.00% hypothetical example with the 5.00% hypothetical examples that appear in the shareholder reports of the other funds.
Notes:
Retirement plan participants may be subject to certain fees charged by the plan sponsor, and Class F-1, F-2, F-3, 529-F-1, 529-F-2 and 529-F-3 shareholders may be subject to fees charged by financial intermediaries, typically ranging from 0.75% to 1.50% of assets annually depending on services offered. You can estimate the impact of these fees by adding the amount of the fees to the total estimated expenses you paid on your account during the period as calculated above. In addition, your ending account value would be lower by the amount of these fees.
Note that the expenses shown in the table on the following page are meant to highlight your ongoing costs only and do not reflect any transactional costs, such as sales charges (loads). Therefore, the second line of each share class in the table is useful in comparing ongoing costs only and will not help you determine the relative total costs of owning different funds. In addition, if these transactional costs were included, your costs would have been higher.
| The Income Fund of America | 73 |
Expense example (continued)
| Beginning account value 8/1/2022 | Ending account value 1/31/2023 | Expenses paid during period* | Annualized expense ratio | |||||||||||||
| Class A – actual return | $ | 1,000.00 | $ | 1,033.17 | $ | 2.92 | .57 | % | ||||||||
| Class A – assumed 5% return | 1,000.00 | 1,022.33 | 2.91 | .57 | ||||||||||||
| Class C – actual return | 1,000.00 | 1,029.47 | 6.70 | 1.31 | ||||||||||||
| Class C – assumed 5% return | 1,000.00 | 1,018.60 | 6.67 | 1.31 | ||||||||||||
| Class T – actual return | 1,000.00 | 1,034.50 | 1.49 | .29 | ||||||||||||
| Class T – assumed 5% return | 1,000.00 | 1,023.74 | 1.48 | .29 | ||||||||||||
| Class F-1 – actual return | 1,000.00 | 1,032.93 | 3.18 | .62 | ||||||||||||
| Class F-1 – assumed 5% return | 1,000.00 | 1,022.08 | 3.16 | .62 | ||||||||||||
| Class F-2 – actual return | 1,000.00 | 1,034.20 | 1.90 | .37 | ||||||||||||
| Class F-2 – assumed 5% return | 1,000.00 | 1,023.34 | 1.89 | .37 | ||||||||||||
| Class F-3 – actual return | 1,000.00 | 1,034.73 | 1.33 | .26 | ||||||||||||
| Class F-3 – assumed 5% return | 1,000.00 | 1,023.89 | 1.33 | .26 | ||||||||||||
| Class 529-A – actual return | 1,000.00 | 1,033.07 | 3.13 | .61 | ||||||||||||
| Class 529-A – assumed 5% return | 1,000.00 | 1,022.13 | 3.11 | .61 | ||||||||||||
| Class 529-C – actual return | 1,000.00 | 1,029.16 | 7.01 | 1.37 | ||||||||||||
| Class 529-C – assumed 5% return | 1,000.00 | 1,018.30 | 6.97 | 1.37 | ||||||||||||
| Class 529-E – actual return | 1,000.00 | 1,031.98 | 4.30 | .84 | ||||||||||||
| Class 529-E – assumed 5% return | 1,000.00 | 1,020.97 | 4.28 | .84 | ||||||||||||
| Class 529-T – actual return | 1,000.00 | 1,034.19 | 1.74 | .34 | ||||||||||||
| Class 529-T – assumed 5% return | 1,000.00 | 1,023.49 | 1.73 | .34 | ||||||||||||
| Class 529-F-1 – actual return | 1,000.00 | 1,033.86 | 2.20 | .43 | ||||||||||||
| Class 529-F-1 – assumed 5% return | 1,000.00 | 1,023.04 | 2.19 | .43 | ||||||||||||
| Class 529-F-2 – actual return | 1,000.00 | 1,034.24 | 1.74 | .34 | ||||||||||||
| Class 529-F-2 – assumed 5% return | 1,000.00 | 1,023.49 | 1.73 | .34 | ||||||||||||
| Class 529-F-3 – actual return | 1,000.00 | 1,034.41 | 1.64 | .32 | ||||||||||||
| Class 529-F-3 – assumed 5% return | 1,000.00 | 1,023.59 | 1.63 | .32 | ||||||||||||
| Class R-1 – actual return | 1,000.00 | 1,029.00 | 6.85 | 1.34 | ||||||||||||
| Class R-1 – assumed 5% return | 1,000.00 | 1,018.45 | 6.82 | 1.34 | ||||||||||||
| Class R-2 – actual return | 1,000.00 | 1,029.20 | 6.96 | 1.36 | ||||||||||||
| Class R-2 – assumed 5% return | 1,000.00 | 1,018.35 | 6.92 | 1.36 | ||||||||||||
| Class R-2E – actual return | 1,000.00 | 1,030.74 | 5.43 | 1.06 | ||||||||||||
| Class R-2E – assumed 5% return | 1,000.00 | 1,019.86 | 5.40 | 1.06 | ||||||||||||
| Class R-3 – actual return | 1,000.00 | 1,031.16 | 4.66 | .91 | ||||||||||||
| Class R-3 – assumed 5% return | 1,000.00 | 1,020.62 | 4.63 | .91 | ||||||||||||
| Class R-4 – actual return | 1,000.00 | 1,032.59 | 3.13 | .61 | ||||||||||||
| Class R-4 – assumed 5% return | 1,000.00 | 1,022.13 | 3.11 | .61 | ||||||||||||
| Class R-5E – actual return | 1,000.00 | 1,034.01 | 2.10 | .41 | ||||||||||||
| Class R-5E – assumed 5% return | 1,000.00 | 1,023.14 | 2.09 | .41 | ||||||||||||
| Class R-5 – actual return | 1,000.00 | 1,034.50 | 1.59 | .31 | ||||||||||||
| Class R-5 – assumed 5% return | 1,000.00 | 1,023.64 | 1.58 | .31 | ||||||||||||
| Class R-6 – actual return | 1,000.00 | 1,034.68 | 1.33 | .26 | ||||||||||||
| Class R-6 – assumed 5% return | 1,000.00 | 1,023.89 | 1.33 | .26 | ||||||||||||
| * | The “expenses paid during period” are equal to the “annualized expense ratio,” multiplied by the average account value over the period, multiplied by the number of days in the period, and divided by 365 (to reflect the one-half year period). |
| 74 | The Income Fund of America |
Approval of Investment Advisory and Service Agreement
The fund’s board has approved the continuation of the fund’s Investment Advisory and Service Agreement (the “agreement”) with Capital Research and Management Company (“CRMC”) for an additional one-year term through January 31, 2024. The board approved the agreement following the recommendation of the fund’s Contracts Committee (the “committee”), which is composed of all the fund’s independent board members. The board and the committee determined in the exercise of their business judgment that the fund’s advisory fee structure was fair and reasonable in relation to the services provided, and that approving the agreement was in the best interests of the fund and its shareholders.
In reaching this decision, the board and the committee took into account their interactions with CRMC as well as information furnished to them throughout the year and otherwise provided to them, as well as information prepared specifically in connection with their review of the agreement, and were advised by their independent counsel with respect to the matters considered. They considered the following factors, among others, but did not identify any single issue or particular piece of information that, in isolation, was the controlling factor, and each board and committee member did not necessarily attribute the same weight to each factor.
1. Nature, extent and quality of services
The board and the committee considered the depth and quality of CRMC’s investment management process, including its global research capabilities; the experience, capability and integrity of its senior management and other personnel; the low turnover rates of its key personnel; the overall financial strength and stability of CRMC and the Capital Group organization; the resources and systems CRMC devotes to investment management (the manner in which the fund’s assets are managed, including liquidity management), financial, investment operations, compliance, trading, proxy voting, shareholder communications, and other services; and the ongoing evolution of CRMC’s organizational structure designed to maintain and strengthen these qualities. The board and the committee also considered the nature, extent and quality of administrative and shareholder services provided by CRMC to the fund under the agreement and other agreements, as well as the benefits to fund shareholders from investing in a fund that is part of a large family of funds. The board and the committee considered the risks assumed by CRMC in providing services to the fund, including operational, business, financial, reputational, regulatory and litigation risks. The board and the committee concluded that the nature, extent and quality of the services provided by CRMC have benefited and should continue to benefit the fund and its shareholders.
2. Investment results
The board and the committee considered the investment results of the fund in light of its objective. They compared the fund’s investment results with those of other funds (including funds that currently form the basis of the Lipper index for the category in which the fund is included) and data such as relevant market and fund indexes over various periods (including the fund’s lifetime) through June 30, 2022. They generally placed greater emphasis on investment results over longer term periods. On the basis of this evaluation and the board’s and the committee’s ongoing review of investment results, and considering the relative market conditions during certain reporting periods, the board and the committee concluded that the fund’s investment results have been satisfactory for renewal of the agreement, and that CRMC’s record in managing the fund indicated that its continued management should benefit the fund and its shareholders.
3. Advisory fees and total expenses
The board and the committee compared the advisory fees and total expense levels of the fund to those of other relevant funds. They observed that the fund’s advisory fees and expenses generally compared favorably to those of other similar funds included in the comparable Lipper category. The board and the committee also considered the breakpoint discounts in the fund’s advisory fee structure that reduce the level of fees charged by CRMC to the fund as fund assets increase. In addition, they reviewed information regarding the effective advisory fees charged to non-mutual fund clients by CRMC and its affiliates. They noted that, to the extent there were differences between the advisory fees paid by the fund and the advisory fees paid by those clients, the differences appropriately reflected the investment, operational, regulatory and market differences between advising the fund and the other clients. The board and the committee concluded that the fund’s cost structure was fair and reasonable in relation to the services provided, as well as in relation to the risks assumed by the adviser in sponsoring and managing the fund, and that the fund’s shareholders receive reasonable value in return for the advisory fees and other amounts paid to CRMC by the fund.
| The Income Fund of America | 75 |
4. Ancillary benefits
The board and the committee considered a variety of other benefits that CRMC and its affiliates receive as a result of CRMC’s relationship with the fund and other American Funds, including fees for administrative services provided to certain share classes; fees paid to CRMC’s affiliated transfer agent; sales charges and distribution fees received and retained by the fund’s principal underwriter, an affiliate of CRMC; and possible ancillary benefits to CRMC and its institutional management affiliates in managing other investment vehicles. The board and the committee reviewed CRMC’s portfolio trading practices, noting that CRMC bears the cost of third-party research. The board and committee also noted that CRMC benefitted from the use of commissions from portfolio transactions made on behalf of the fund to facilitate payment to certain broker-dealers for research to comply with regulatory requirements applicable to these firms, with all such amounts reimbursed by CRMC. The board and the committee took these ancillary benefits into account in evaluating the reasonableness of the advisory fees and other amounts paid to CRMC by the fund.
5. Adviser financial information
The board and the committee reviewed information regarding CRMC’s costs of providing services to the American Funds, including personnel, systems and resources of investment, compliance, trading, accounting and other administrative operations. They considered CRMC’s costs and related cost allocation methodology as well as its track record of investing in technology, infrastructure and staff to maintain and expand services and capabilities, respond to industry and regulatory developments, and attract and retain qualified personnel. They noted information regarding the compensation structure for CRMC’s investment professionals. They reviewed information on the profitability of the investment adviser and its affiliates. The board and the committee also compared CRMC’s profitability and compensation data to the reported results and data of a number of large, publicly held investment management companies. The board and the committee noted the competitiveness and cyclicality of both the mutual fund industry and the capital markets, and the importance in that environment of CRMC’s long-term profitability for maintaining its independence, company culture and management continuity. They further considered the breakpoint discounts in the fund’s advisory fee structure and CRMC’s sharing of potential economies of scale, or efficiencies, through breakpoints and other fee reductions and costs voluntarily absorbed. The board and the committee concluded that the fund’s advisory fee structure reflected a reasonable sharing of benefits between CRMC and the fund’s shareholders.
| 76 | The Income Fund of America |
| Liquidity Risk Management Program | unaudited |
The fund has adopted a liquidity risk management program (the “program”). The fund’s board has designated Capital Research and Management Company (“CRMC”) as the administrator of the program. Personnel of CRMC or its affiliates conduct the day-to-day operation of the program pursuant to policies and procedures administered by the Capital Group Liquidity Risk Management Committee.
Under the program, CRMC manages the fund’s liquidity risk, which is the risk that the fund could not meet shareholder redemption requests without significant dilution of remaining shareholders’ interests in the fund. This risk is managed by monitoring the degree of liquidity of the fund’s investments, limiting the amount of the fund’s illiquid investments, and utilizing various risk management tools and facilities available to the fund for meeting shareholder redemptions, among other means. CRMC’s process of determining the degree of liquidity of the fund’s investments is supported by one or more third-party liquidity assessment vendors.
The fund’s board reviewed a report prepared by CRMC regarding the operation and effectiveness of the program for the period October 1, 2021, through September 30, 2022. No significant liquidity events impacting the fund were noted in the report. In addition, CRMC provided its assessment that the program had been effective in managing the fund’s liquidity risk.
| The Income Fund of America | 77 |
This page was intentionally left blank.
| 78 | The Income Fund of America |
This page was intentionally left blank.
| The Income Fund of America | 79 |
This page was intentionally left blank.
| 80 | The Income Fund of America |
This page was intentionally left blank.
| The Income Fund of America | 81 |
This page was intentionally left blank.
| 82 | The Income Fund of America |
This page was intentionally left blank.
| The Income Fund of America | 83 |
Office of the fund
6455 Irvine Center Drive
Irvine, CA 92618-4518
Investment adviser
Capital Research and Management Company
333 South Hope Street
Los Angeles, CA 90071-1406
Transfer agent for shareholder accounts
American Funds Service Company
(Write to the address nearest you.)
P.O. Box 6007
Indianapolis, IN 46206-6007
P.O. Box 2280
Norfolk, VA 23501-2280
Custodian of assets
JPMorgan Chase Bank
270 Park Avenue
New York, NY 10017-2070
Counsel
Morgan, Lewis & Bockius LLP
One Federal Street
Boston, MA 02110-1726
Independent registered public accounting firm
Deloitte & Touche LLP
695 Town Center Drive
Suite 1000
Costa Mesa, CA 92626-7188
Principal underwriter
American Funds Distributors, Inc.
333 South Hope Street
Los Angeles, CA 90071-1406
| 84 | The Income Fund of America |
Investors should carefully consider investment objectives, risks, charges and expenses. This and other important information is contained in the fund prospectus and summary prospectus, which can be obtained from your financial professional and should be read carefully before investing. You may also call American Funds Service Company (AFS) at (800) 421-4225 or visit the Capital Group website at capitalgroup.com.
“American Funds Proxy Voting Procedures and Principles” — which describes how we vote proxies relating to portfolio securities — is available on our website or upon request by calling AFS. The fund files its proxy voting record with the U.S. Securities and Exchange Commission (SEC) for the 12 months ended June 30 by August 31. The proxy voting record is available free of charge on the SEC website at sec.gov and on our website.
The Income Fund of America files a complete list of its portfolio holdings with the SEC for the first and third quarters of each fiscal year on Form NPORT-P. The list of portfolio holdings is available free of charge on the SEC website and on our website.
This report is for the information of shareholders of The Income Fund of America, but it also may be used as sales literature when preceded or accompanied by the current prospectus or summary prospectus, which gives details about charges, expenses, investment objectives and operating policies of the fund. If used as sales material after March 31, 2023, this report must be accompanied by an American Funds statistical update for the most recently completed calendar quarter.
BLOOMBERG® is a trademark and service mark of Bloomberg Finance L.P. and its affiliates (collectively “Bloomberg”). Bloomberg or Bloomberg’s licensors own all proprietary rights in the Bloomberg Indices. Neither Bloomberg nor Bloomberg’s licensors approves or endorses this material, or guarantees the accuracy or completeness of any information herein, or makes any warranty, express or implied, as to the results to be obtained therefrom and, to the maximum extent allowed by law, neither shall have any liability or responsibility for injury or damages arising in connection therewith.
The S&P 500 Index (“Index”) is a product of S&P Dow Jones Indices LLC and/or its affiliates and has been licensed for use by Capital Group. Copyright © 2023 S&P Dow Jones Indices LLC, a division of S&P Global, and/or its affiliates. All rights reserved. Redistribution or reproduction in whole or in part is prohibited without written permission of S&P Dow Jones Indices LLC.
American Funds Distributors, Inc., member FINRA.
The Capital Advantage®
Since 1931, Capital Group, home of American Funds, has helped investors pursue long-term investment success. Our consistent approach — in combination with The Capital SystemTM — has resulted in superior outcomes.
Aligned with investor success
We base our decisions on a long-term perspective, which we believe aligns our goals with the interests of our clients. Our portfolio managers average 27 years of investment industry experience, including 21 years at our company, reflecting a career commitment to our long-term approach.1
The Capital System
The Capital System combines individual accountability with teamwork. Funds using The Capital System are divided into portions that are managed independently by investment professionals with diverse backgrounds, ages and investment approaches. An extensive global research effort is the backbone of our system.
American Funds’ superior outcomes
Equity funds have beaten their Lipper peer indexes in 90% of 10-year periods and 99% of 20-year periods.2 Fixed income funds have helped investors achieve diversification through attention to correlation between bonds and equities.3 Fund management fees have been among the lowest in the industry.4
| 1 | Investment industry experience as of December 31, 2021. | |
| 2 | Based on Class F-2 share results for rolling calendar-year periods starting the first full calendar year after each fund’s inception through December 31, 2021. Periods covered are the shorter of the fund’s lifetime or since the comparable Lipper index inception date (except Capital Income Builder and SMALLCAP World Fund, for which the Lipper average was used). Expenses differ for each share class, so results will vary. | |
| 3 | Based on Class F-2 share results as of December 31, 2021. Thirteen of the 17 fixed income American Funds that have been in existence for the three-year period showed a three-year correlation below 0.3. S&P 500 Index was used as an equity market proxy. Correlation based on monthly total returns. Correlation is a statistical measure of how two securities move in relation to each other. A correlation ranges from –1 to 1. A positive correlation close to 1 implies that as one security moves, either up or down, the other security will move in “lockstep,” in the same direction. A negative correlation close to –1 indicates that the securities have moved in the opposite direction. | |
| 4 | On average, our management fees were in the lowest quintile 63% of the time, based on the 20-year period ended December 31, 2021, versus comparable Lipper categories, excluding funds of funds. |
Class F-2 shares were first offered on August 1, 2008. Class F-2 share results prior to the date of first sale are hypothetical based on the results of the original share class of the fund without a sales charge, adjusted for typical estimated expenses. Results for certain funds with an inception date after August 1, 2008, also include hypothetical returns because those funds’ Class F-2 shares sold after the funds’ date of first offering. Visit capitalgroup.com for more information on specific expense adjustments and the actual dates of first sale.
All Capital Group trademarks mentioned are owned by The Capital Group Companies, Inc., an affiliated company or fund. All other company and product names mentioned are the property of their respective companies.

ITEM 2 – Code of Ethics
Not applicable for filing of semi-annual reports to shareholders.
ITEM 3 – Audit Committee Financial Expert
Not applicable for filing of semi-annual reports to shareholders.
ITEM 4 – Principal Accountant Fees and Services
Not applicable for filing of semi-annual reports to shareholders.
ITEM 5 – Audit Committee of Listed Registrants
Not applicable to this Registrant, insofar as the Registrant is not a listed issuer as defined in Rule 10A-3 under the Securities Exchange Act of 1934.
ITEM 6 – Schedule of Investments
Not applicable, insofar as the schedule is included as part of the report to shareholders filed under Item 1 of this Form.
ITEM 7 – Disclosure of Proxy Voting Policies and Procedures for Closed-End Management Investment Companies.
Not applicable to this Registrant, insofar as the Registrant is not a closed-end management investment company.
ITEM 8 – Portfolio Managers of Closed-End Management Investment Companies
Not applicable to this Registrant, insofar as the Registrant is not a closed-end management investment company.
ITEM 9 – Purchases of Equity Securities by Closed-End Management Investment Company and Affiliated Purchasers
Not applicable to this Registrant, insofar as the Registrant is not a closed-end management investment company.
ITEM 10 – Submission of Matters to a Vote of Security Holders
There have been no material changes to the procedures by which shareholders may recommend nominees to the Registrant’s board of trustees since the Registrant last submitted a proxy statement to its shareholders. The procedures are as follows. The Registrant has a nominating and governance committee comprised solely of persons who are not considered ‘‘interested persons’’ of the Registrant within the meaning of the Investment Company Act of 1940, as amended. The committee periodically reviews such issues as the board’s composition, responsibilities, committees, compensation and other relevant issues, and recommends any appropriate changes to the full board of trustees. While the committee normally is able to identify from its own resources an ample number of qualified candidates, it will consider shareholder suggestions of persons to be considered as nominees to fill future vacancies on the board. Such suggestions must be sent in writing to the nominating and governance committee of the Registrant, c/o the Registrant’s Secretary, and must be accompanied by complete biographical and occupational data on the prospective nominee, along with a written consent of the prospective nominee for consideration of his or her name by the nominating and governance committee.
ITEM 11 – Controls and Procedures
| (a) | The Registrant’s Principal Executive Officer and Principal Financial Officer have concluded, based on their evaluation of the Registrant’s disclosure controls and procedures (as such term is defined in Rule 30a-3 under the Investment Company Act of 1940), that such controls and procedures are adequate and reasonably designed to achieve the purposes described in paragraph (c) of such rule. |
| (b) |
There were no changes in the Registrant’s internal controls over financial reporting (as defined in Rule 30a-3(d) under the Investment Company Act of 1940) that occurred during the Registrant’s semi-annual period covered by this report that has materially affected, or is reasonably likely to materially affect, the Registrant’s internal control over financial reporting.
|
ITEM 12 – Exhibits
| (a)(1) | Not applicable for filing of semi-annual reports to shareholders. |
| (a)(2) | The certifications required by Rule 30a-2 of the Investment Company Act of 1940 and Sections 302 and 906 of the Sarbanes-Oxley Act of 2002 are attached as exhibits hereto. |
SIGNATURES
Pursuant to the requirements of the Securities Exchange Act of 1934 and the Investment Company Act of 1940, the Registrant has duly caused this report to be signed on its behalf by the undersigned, thereunto duly authorized.
| THE INCOME FUND OF AMERICA | |
| By __/s/ Donald H. Rolfe____________________ | |
|
Donald H. Rolfe, Principal Executive Officer | |
| Date: March 31, 2023 |
Pursuant to the requirements of the Securities Exchange Act of 1934 and the Investment Company Act of 1940, this report has been signed below by the following persons on behalf of the Registrant and in the capacities and on the dates indicated.
| By __/s/ Donald H. Rolfe_______ |
|
Donald H. Rolfe, Principal Executive Officer |
| Date: March 31, 2023 |
| By ___/s/ Hong T. Le __________ |
|
Hong T. Le, Treasurer and Principal Financial Officer |
| Date: March 31, 2023 |
ATTACHMENTS / EXHIBITS
Serious News for Serious Traders! Try StreetInsider.com Premium Free!
You May Also Be Interested In
- Jeff Blackburn Joins DoorDash Board of Directors
- Park National Corporation reports financial results for first quarter 2024
- Cosmos Health Receives Nasdaq Notice on Late Filing of Its Form 10-K
Create E-mail Alert Related Categories
SEC FilingsSign up for StreetInsider Free!
Receive full access to all new and archived articles, unlimited portfolio tracking, e-mail alerts, custom newswires and RSS feeds - and more!
