

Form N-CSRS FIDELITY SELECT PORTFOLI For: Jul 31
 Tweet
Tweet Share
ShareUNITED STATES
SECURITIES AND EXCHANGE COMMISSION
Washington, D.C. 20549
FORM N-CSR
CERTIFIED SHAREHOLDER REPORT OF REGISTERED
MANAGEMENT INVESTMENT COMPANIES
Investment Company Act file number 811-03114
Fidelity Select Portfolios
(Exact name of registrant as specified in charter)
245 Summer St., Boston, MA 02210
(Address of principal executive offices) (Zip code)
Cynthia Lo Bessette, Secretary
245 Summer St.
Boston, Massachusetts 02210
(Name and address of agent for service)
Registrant's telephone number, including area code:
617-563-7000
Date of fiscal year end: | January 31 |
Date of reporting period: | July 31, 2021 |
Item 1.
Reports to Stockholders
Fidelity® Telecom and Utilities Fund
Semi-Annual Report
July 31, 2021

Contents
|
Board Approval of Investment Advisory Contracts and Management Fees | |
To view a fund's proxy voting guidelines and proxy voting record for the 12-month period ended June 30, visit http://www.fidelity.com/proxyvotingresults or visit the Securities and Exchange Commission's (SEC) web site at http://www.sec.gov.
You may also call 1-800-544-8544 to request a free copy of the proxy voting guidelines.
Standard & Poor's, S&P and S&P 500 are registered service marks of The McGraw-Hill Companies, Inc. and have been licensed for use by Fidelity Distributors Corporation.
Other third-party marks appearing herein are the property of their respective owners.
All other marks appearing herein are registered or unregistered trademarks or service marks of FMR LLC or an affiliated company. © 2021 FMR LLC. All rights reserved.
This report and the financial statements contained herein are submitted for the general information of the shareholders of the Fund. This report is not authorized for distribution to prospective investors in the Fund unless preceded or accompanied by an effective prospectus.
A fund files its complete schedule of portfolio holdings with the SEC for the first and third quarters of each fiscal year on Form N-PORT. Forms N-PORT are available on the SEC’s web site at http://www.sec.gov. A fund's Forms N-PORT may be reviewed and copied at the SEC’s Public Reference Room in Washington, DC. Information regarding the operation of the SEC's Public Reference Room may be obtained by calling 1-800-SEC-0330.
For a complete list of a fund's portfolio holdings, view the most recent holdings listing, semiannual report, or annual report on Fidelity's web site at http://www.fidelity.com, http://www.institutional.fidelity.com, or http://www.401k.com, as applicable.
NOT FDIC INSURED •MAY LOSE VALUE •NO BANK GUARANTEE
Neither the Fund nor Fidelity Distributors Corporation is a bank.
Note to Shareholders:
Early in 2020, the outbreak and spread of a new coronavirus emerged as a public health emergency that had a major influence on financial markets, primarily based on its impact on the global economy and the outlook for corporate earnings. The virus causes a respiratory disease known as COVID-19. On March 11, 2020 the World Health Organization declared the COVID-19 outbreak a pandemic, citing sustained risk of further global spread.
In the weeks following, as the crisis worsened, we witnessed an escalating human tragedy with wide-scale social and economic consequences from coronavirus-containment measures. The outbreak of COVID-19 prompted a number of measures to limit the spread, including travel and border restrictions, quarantines, and restrictions on large gatherings. In turn, these resulted in lower consumer activity, diminished demand for a wide range of products and services, disruption in manufacturing and supply chains, and – given the wide variability in outcomes regarding the outbreak – significant market uncertainty and volatility. Amid the turmoil, global governments and central banks took unprecedented action to help support consumers, businesses, and the broader economies, and to limit disruption to financial systems.
The situation continues to unfold, and the extent and duration of its impact on financial markets and the economy remain highly uncertain. Extreme events such as the coronavirus crisis are “exogenous shocks” that can have significant adverse effects on mutual funds and their investments. Although multiple asset classes may be affected by market disruption, the duration and impact may not be the same for all types of assets.
Fidelity is committed to helping you stay informed amid news about COVID-19 and during increased market volatility, and we’re taking extra steps to be responsive to customer needs. We encourage you to visit our websites, where we offer ongoing updates, commentary, and analysis on the markets and our funds.
Investment Summary (Unaudited)
Top Ten Stocks as of July 31, 2021
| % of fund's net assets | |
| AT&T, Inc. | 14.4 |
| T-Mobile U.S., Inc. | 8.3 |
| Verizon Communications, Inc. | 7.1 |
| Sempra Energy | 6.4 |
| Exelon Corp. | 6.4 |
| NextEra Energy, Inc. | 4.9 |
| Southern Co. | 4.9 |
| FirstEnergy Corp. | 4.9 |
| Evergy, Inc. | 4.6 |
| CenterPoint Energy, Inc. | 4.3 |
| 66.2 |
Top Five Industries as of July 31, 2021
| % of fund's net assets | |
| Electric Utilities | 42.8 |
| Diversified Telecommunication Services | 21.5 |
| Multi-Utilities | 14.6 |
| Wireless Telecommunication Services | 8.9 |
| Independent Power and Renewable Electricity Producers | 8.2 |
Asset Allocation (% of fund's net assets)
| As of July 31, 2021* | ||
| Stocks | 97.8% | |
| Short-Term Investments and Net Other Assets (Liabilities) | 2.2% | |

* Foreign investments - 0.3%
Schedule of Investments July 31, 2021 (Unaudited)
Showing Percentage of Net Assets
| Common Stocks - 97.8% | |||
| Shares | Value (000s) | ||
| COMMUNICATION SERVICES - 30.4% | |||
| Diversified Telecommunication Services - 21.5% | |||
| AT&T, Inc. | 4,956,500 | $139,030 | |
| Verizon Communications, Inc. | 1,238,904 | 69,106 | |
| 208,136 | |||
| Wireless Telecommunication Services - 8.9% | |||
| T-Mobile U.S., Inc. (a) | 559,369 | 80,560 | |
| Telephone & Data Systems, Inc. | 236,054 | 5,276 | |
| 85,836 | |||
| TOTAL COMMUNICATION SERVICES | 293,972 | ||
| INDUSTRIALS - 0.8% | |||
| Commercial Services & Supplies - 0.3% | |||
| Charah Solutions, Inc. (a)(b) | 557,916 | 2,622 | |
| Electrical Equipment - 0.5% | |||
| Sunrun, Inc. (a) | 96,000 | 5,085 | |
| TOTAL INDUSTRIALS | 7,707 | ||
| REAL ESTATE - 1.0% | |||
| Equity Real Estate Investment Trusts (REITs) - 1.0% | |||
| SBA Communications Corp. Class A | 28,900 | 9,855 | |
| UTILITIES - 65.6% | |||
| Electric Utilities - 42.8% | |||
| American Electric Power Co., Inc. | 348,562 | 30,715 | |
| Duke Energy Corp. | 283,100 | 29,757 | |
| Edison International | 552,728 | 30,124 | |
| Entergy Corp. | 213,263 | 21,949 | |
| Evergy, Inc. | 688,388 | 44,897 | |
| Exelon Corp. | 1,323,151 | 61,923 | |
| FirstEnergy Corp. | 1,238,477 | 47,458 | |
| NextEra Energy, Inc. | 611,284 | 47,619 | |
| NRG Energy, Inc. | 495,926 | 20,452 | |
| PG&E Corp. (a) | 3,727,774 | 32,767 | |
| Southern Co. | 745,190 | 47,595 | |
| 415,256 | |||
| Independent Power and Renewable Electricity Producers - 8.2% | |||
| Brookfield Renewable Corp. | 73,500 | 3,119 | |
| NextEra Energy Partners LP (b) | 297,154 | 23,038 | |
| Sunnova Energy International, Inc. (a) | 190,914 | 7,274 | |
| The AES Corp. | 1,580,104 | 37,448 | |
| Vistra Corp. | 461,141 | 8,831 | |
| 79,710 | |||
| Multi-Utilities - 14.6% | |||
| CenterPoint Energy, Inc. | 1,645,704 | 41,900 | |
| Dominion Energy, Inc. | 355,348 | 26,605 | |
| NiSource, Inc. | 432,400 | 10,711 | |
| Sempra Energy | 474,471 | 61,990 | |
| 141,206 | |||
| TOTAL UTILITIES | 636,172 | ||
| TOTAL COMMON STOCKS | |||
| (Cost $740,553) | 947,706 | ||
| Money Market Funds - 2.2% | |||
| Fidelity Cash Central Fund 0.06% (c) | 1,494,626 | 1,495 | |
| Fidelity Securities Lending Cash Central Fund 0.06% (c)(d) | 20,083,349 | 20,085 | |
| TOTAL MONEY MARKET FUNDS | |||
| (Cost $21,580) | 21,580 | ||
| TOTAL INVESTMENT IN SECURITIES - 100.0% | |||
| (Cost $762,133) | 969,286 | ||
| NET OTHER ASSETS (LIABILITIES) - 0.0% | 166 | ||
| NET ASSETS - 100% | $969,452 |
Legend
(a) Non-income producing
(b) Security or a portion of the security is on loan at period end.
(c) Affiliated fund that is generally available only to investment companies and other accounts managed by Fidelity Investments. The rate quoted is the annualized seven-day yield of the fund at period end. A complete unaudited listing of the fund's holdings as of its most recent quarter end is available upon request. In addition, each Fidelity Central Fund's financial statements are available on the SEC's website or upon request.
(d) Investment made with cash collateral received from securities on loan.
Affiliated Central Funds
Information regarding fiscal year to date income earned by the Fund from investments in Fidelity Central Funds is as follows:
| Fund | Income earned |
| (Amounts in thousands) | |
| Fidelity Cash Central Fund | $1 |
| Fidelity Securities Lending Cash Central Fund | 6 |
| Total | $7 |
Amounts in the income column in the above table include any capital gain distributions from underlying funds, which are presented in the corresponding line-item in the Statement of Operations, if applicable. Amount for Fidelity Securities Lending Cash Central Fund represents the income earned on investing cash collateral, less rebates paid to borrowers and any lending agent fees associated with the loan, plus any premium payments received for lending certain types of securities.
Fiscal year to date information regarding the Fund's investments in Fidelity Central Funds, including the ownership percentage, is presented below.
| Fund (Amounts in thousands) | Value, beginning of period | Purchases | Sales Proceeds | Realized Gain/Loss | Change in Unrealized appreciation (depreciation) | Value, end of period | % ownership, end of period |
| Fidelity Cash Central Fund 0.06% | $12,154 | $62,822 | $73,482 | $1 | $-- | $1,495 | 0.0% |
| Fidelity Securities Lending Cash Central Fund 0.06% | 1,958 | 99,557 | 81,430 | -- | -- | 20,085 | 0.1% |
| Total | $14,112 | $162,379 | $154,912 | $1 | $-- | $21,580 |
Investment Valuation
The following is a summary of the inputs used, as of July 31, 2021, involving the Fund's assets and liabilities carried at fair value. The inputs or methodology used for valuing securities may not be an indication of the risk associated with investing in those securities. For more information on valuation inputs, and their aggregation into the levels used below, please refer to the Investment Valuation section in the accompanying Notes to Financial Statements.
| Valuation Inputs at Reporting Date: | ||||
| Description | Total | Level 1 | Level 2 | Level 3 |
| (Amounts in thousands) | ||||
| Investments in Securities: | ||||
| Equities: | ||||
| Communication Services | $293,972 | $293,972 | $-- | $-- |
| Industrials | 7,707 | 7,707 | -- | -- |
| Real Estate | 9,855 | 9,855 | -- | -- |
| Utilities | 636,172 | 636,172 | -- | -- |
| Money Market Funds | 21,580 | 21,580 | -- | -- |
| Total Investments in Securities: | $969,286 | $969,286 | $-- | $-- |
See accompanying notes which are an integral part of the financial statements.
Financial Statements
Statement of Assets and Liabilities
| Amounts in thousands (except per-share amount) | July 31, 2021 (Unaudited) | |
| Assets | ||
| Investment in securities, at value (including securities loaned of $19,707) — See accompanying schedule: Unaffiliated issuers (cost $740,553) | $947,706 | |
| Fidelity Central Funds (cost $21,580) | 21,580 | |
| Total Investment in Securities (cost $762,133) | $969,286 | |
| Receivable for investments sold | 16,563 | |
| Receivable for fund shares sold | 128 | |
| Dividends receivable | 4,377 | |
| Distributions receivable from Fidelity Central Funds | 1 | |
| Prepaid expenses | 5 | |
| Other receivables | 139 | |
| Total assets | 990,499 | |
| Liabilities | ||
| Payable for fund shares redeemed | $352 | |
| Accrued management fee | 315 | |
| Other affiliated payables | 147 | |
| Other payables and accrued expenses | 148 | |
| Collateral on securities loaned | 20,085 | |
| Total liabilities | 21,047 | |
| Net Assets | $969,452 | |
| Net Assets consist of: | ||
| Paid in capital | $739,193 | |
| Total accumulated earnings (loss) | 230,259 | |
| Net Assets | $969,452 | |
| Net Asset Value, offering price and redemption price per share ($969,452 ÷ 34,631 shares) | $27.99 |
See accompanying notes which are an integral part of the financial statements.
Statement of Operations
| Amounts in thousands | Six months ended July 31, 2021 (Unaudited) | |
| Investment Income | ||
| Dividends | $15,132 | |
| Income from Fidelity Central Funds (including $6 from security lending) | 7 | |
| Total income | 15,139 | |
| Expenses | ||
| Management fee | ||
| Basic fee | $2,086 | |
| Performance adjustment | (28) | |
| Transfer agent fees | 721 | |
| Accounting fees | 163 | |
| Custodian fees and expenses | 3 | |
| Independent trustees' fees and expenses | 2 | |
| Registration fees | 20 | |
| Audit | 24 | |
| Legal | 1 | |
| Miscellaneous | 4 | |
| Total expenses before reductions | 2,996 | |
| Expense reductions | (49) | |
| Total expenses after reductions | 2,947 | |
| Net investment income (loss) | 12,192 | |
| Realized and Unrealized Gain (Loss) | ||
| Net realized gain (loss) on: | ||
| Investment securities: | ||
| Unaffiliated issuers | 22,092 | |
| Fidelity Central Funds | 1 | |
| Total net realized gain (loss) | 22,093 | |
| Change in net unrealized appreciation (depreciation) on investment securities | 3,915 | |
| Net gain (loss) | 26,008 | |
| Net increase (decrease) in net assets resulting from operations | $38,200 |
See accompanying notes which are an integral part of the financial statements.
Statement of Changes in Net Assets
| Amounts in thousands | Six months ended July 31, 2021 (Unaudited) | Year ended January 31, 2021 |
| Increase (Decrease) in Net Assets | ||
| Operations | ||
| Net investment income (loss) | $12,192 | $21,960 |
| Net realized gain (loss) | 22,093 | 719 |
| Change in net unrealized appreciation (depreciation) | 3,915 | (54,293) |
| Net increase (decrease) in net assets resulting from operations | 38,200 | (31,614) |
| Distributions to shareholders | (9,836) | (39,465) |
| Share transactions | ||
| Proceeds from sales of shares | 26,575 | 75,202 |
| Reinvestment of distributions | 8,811 | 35,200 |
| Cost of shares redeemed | (62,518) | (219,083) |
| Net increase (decrease) in net assets resulting from share transactions | (27,132) | (108,681) |
| Total increase (decrease) in net assets | 1,232 | (179,760) |
| Net Assets | ||
| Beginning of period | 968,220 | 1,147,980 |
| End of period | $969,452 | $968,220 |
| Other Information | ||
| Shares | ||
| Sold | 954 | 2,901 |
| Issued in reinvestment of distributions | 319 | 1,375 |
| Redeemed | (2,244) | (8,627) |
| Net increase (decrease) | (971) | (4,351) |
See accompanying notes which are an integral part of the financial statements.
Financial Highlights
Fidelity Telecom and Utilities Fund
| Six months ended (Unaudited) July 31, | Years endedJanuary 31, | |||||
| 2021 | 2021 | 2020 | 2019 | 2018 | 2017 | |
| Selected Per–Share Data | ||||||
| Net asset value, beginning of period | $27.20 | $28.73 | $25.40 | $26.24 | $25.32 | $22.31 |
| Income from Investment Operations | ||||||
| Net investment income (loss)A | .35 | .58 | .69 | .64 | .57 | .57 |
| Net realized and unrealized gain (loss) | .72 | (1.08) | 4.57 | 1.00 | 1.91 | 3.26 |
| Total from investment operations | 1.07 | (.50) | 5.26 | 1.64 | 2.48 | 3.83 |
| Distributions from net investment income | (.20) | (.62) | (.76) | (.61) | (.55) | (.67) |
| Distributions from net realized gain | (.08) | (.40) | (1.17) | (1.87) | (1.01) | (.15) |
| Total distributions | (.28) | (1.03)B | (1.93) | (2.48) | (1.56) | (.82) |
| Net asset value, end of period | $27.99 | $27.20 | $28.73 | $25.40 | $26.24 | $25.32 |
| Total ReturnC,D | 3.95% | (1.47)% | 21.02% | 6.41% | 9.88% | 17.41% |
| Ratios to Average Net AssetsE,F | ||||||
| Expenses before reductions | .61%G | .67% | .75% | .70% | .55% | .57% |
| Expenses net of fee waivers, if any | .61%G | .67% | .75% | .70% | .55% | .57% |
| Expenses net of all reductions | .60%G | .66% | .74% | .68% | .54% | .56% |
| Net investment income (loss) | 2.49%G | 2.25% | 2.48% | 2.49% | 2.15% | 2.33% |
| Supplemental Data | ||||||
| Net assets, end of period (in millions) | $969 | $968 | $1,148 | $974 | $961 | $992 |
| Portfolio turnover rateH | 44%G | 60% | 48% | 77% | 63% | 41% |
A Calculated based on average shares outstanding during the period.
B Total distributions per share do not sum due to rounding.
C Total returns for periods of less than one year are not annualized.
D Total returns would have been lower if certain expenses had not been reduced during the applicable periods shown.
E Fees and expenses of any underlying mutual funds or exchange-traded funds (ETFs) are not included in the Fund's expense ratio. The Fund indirectly bears its proportionate share of these expenses. For additional expense information related to investments in Fidelity Central Funds, please refer to the "Investments in Fidelity Central Funds" note found in the Notes to Financial Statements section of the most recent Annual or Semi-Annual report.
F Expense ratios reflect operating expenses of the class. Expenses before reductions do not reflect amounts reimbursed, waived, or reduced through arrangements with the investment advisor, brokerage services, or other offset arrangements, if applicable, and do not represent the amount paid by the class during periods when reimbursements, waivers or reductions occur.
G Annualized
H Amount does not include the portfolio activity of any underlying mutual funds or exchange-traded funds (ETFs).
See accompanying notes which are an integral part of the financial statements.
Notes to Financial Statements (Unaudited)
For the period ended July 31, 2021
(Amounts in thousands except percentages)
1. Organization.
Fidelity Telecom and Utilities Fund (the Fund) is a non-diversified fund of Fidelity Select Portfolios (the Trust) and is authorized to issue an unlimited number of shares. Share transactions on the Statement of Changes in Net Assets may contain exchanges between affiliated funds. The Trust is registered under the Investment Company Act of 1940, as amended (the 1940 Act), as an open-end management investment company organized as a Massachusetts business trust.
2. Investments in Fidelity Central Funds.
Funds may invest in Fidelity Central Funds, which are open-end investment companies generally available only to other investment companies and accounts managed by the investment adviser and its affiliates. The Schedule of Investments lists any Fidelity Central Funds held as an investment as of period end, but does not include the underlying holdings of each Fidelity Central Fund. An investing fund indirectly bears its proportionate share of the expenses of the underlying Fidelity Central Funds.
Based on its investment objective, each Fidelity Central Fund may invest or participate in various investment vehicles or strategies that are similar to those of the investing fund. These strategies are consistent with the investment objectives of the investing fund and may involve certain economic risks which may cause a decline in value of each of the Fidelity Central Funds and thus a decline in the value of the investing fund.
| Fidelity Central Fund | Investment Manager | Investment Objective | Investment Practices | Expense Ratio(a) |
| Fidelity Money Market Central Funds | Fidelity Management & Research Company LLC (FMR) | Each fund seeks to obtain a high level of current income consistent with the preservation of capital and liquidity. | Short-term Investments | Less than .005% to .01% |
(a) Expenses expressed as a percentage of average net assets and are as of each underlying Central Fund's most recent annual or semi-annual shareholder report.
A complete unaudited list of holdings for each Fidelity Central Fund is available upon request or at the Securities and Exchange Commission website at www.sec.gov. In addition, the financial statements of the Fidelity Central Funds which contain the significant accounting policies (including investment valuation policies) of those funds, and are not covered by the Report of Independent Registered Public Accounting Firm, are available on the Securities and Exchange Commission website or upon request.
3. Significant Accounting Policies.
The Fund is an investment company and applies the accounting and reporting guidance of the Financial Accounting Standards Board (FASB) Accounting Standards Codification Topic 946 Financial Services - Investment Companies. The financial statements have been prepared in conformity with accounting principles generally accepted in the United States of America (GAAP), which require management to make certain estimates and assumptions at the date of the financial statements. Actual results could differ from those estimates. Subsequent events, if any, through the date that the financial statements were issued have been evaluated in the preparation of the financial statements. The Fund's Schedule of Investments lists any underlying mutual funds or exchange-traded funds (ETFs) but does not include the underlying holdings of these funds. The following summarizes the significant accounting policies of the Fund:
Investment Valuation. Investments are valued as of 4:00 p.m. Eastern time on the last calendar day of the period. The Board of Trustees (the Board) has delegated the day to day responsibility for the valuation of the Fund's investments to the Fair Value Committee (the Committee) established by the Fund's investment adviser. In accordance with valuation policies and procedures approved by the Board, the Fund attempts to obtain prices from one or more third party pricing vendors or brokers to value its investments. When current market prices, quotations or currency exchange rates are not readily available or reliable, investments will be fair valued in good faith by the Committee, in accordance with procedures adopted by the Board. Factors used in determining fair value vary by investment type and may include market or investment specific events. The frequency with which these procedures are used cannot be predicted and they may be utilized to a significant extent. The Committee oversees the Fund's valuation policies and procedures and reports to the Board on the Committee's activities and fair value determinations. The Board monitors the appropriateness of the procedures used in valuing the Fund's investments and ratifies the fair value determinations of the Committee.
The Fund categorizes the inputs to valuation techniques used to value its investments into a disclosure hierarchy consisting of three levels as shown below:
- Level 1 – quoted prices in active markets for identical investments
- Level 2 – other significant observable inputs (including quoted prices for similar investments, interest rates, prepayment speeds, etc.)
- Level 3 – unobservable inputs (including the Fund's own assumptions based on the best information available)
Valuation techniques used to value the Fund's investments by major category are as follows:
Equity securities, including restricted securities, for which market quotations are readily available, are valued at the last reported sale price or official closing price as reported by a third party pricing vendor on the primary market or exchange on which they are traded and are categorized as Level 1 in the hierarchy. In the event there were no sales during the day or closing prices are not available, securities are valued at the last quoted bid price or may be valued using the last available price and are generally categorized as Level 2 in the hierarchy. For foreign equity securities, when market or security specific events arise, comparisons to the valuation of American Depositary Receipts (ADRs), futures contracts, Exchange-Traded Funds (ETFs) and certain indexes as well as quoted prices for similar securities may be used and would be categorized as Level 2 in the hierarchy. For equity securities, including restricted securities, where observable inputs are limited, assumptions about market activity and risk are used and these securities may be categorized as Level 3 in the hierarchy.
Investments in open-end mutual funds including the Fidelity Central Funds, are valued at their closing net asset value (NAV) each business day and are categorized as Level 1 in the hierarchy
Changes in valuation techniques may result in transfers in or out of an assigned level within the disclosure hierarchy. The aggregate value of investments by input level as of July 31, 2021 is included at the end of the Fund's Schedule of Investments.
Investment Transactions and Income. For financial reporting purposes, the Fund's investment holdings and NAV include trades executed through the end of the last business day of the period. The NAV per share for processing shareholder transactions is calculated as of the close of business of the New York Stock Exchange (NYSE), normally 4:00 p.m. Eastern time and includes trades executed through the end of the prior business day. Gains and losses on securities sold are determined on the basis of identified cost. Dividend income is recorded on the ex-dividend date, except for certain dividends from foreign securities where the ex-dividend date may have passed, which are recorded as soon as the Fund is informed of the ex-dividend date. Non-cash dividends included in dividend income, if any, are recorded at the fair market value of the securities received. Income and capital gain distributions from Fidelity Central Funds, if any, are recorded on the ex-dividend date. Certain distributions received by the Fund represent a return of capital or capital gain. The Fund determines the components of these distributions subsequent to the ex-dividend date, based upon receipt of tax filings or other correspondence relating to the underlying investment. These distributions are recorded as a reduction of cost of investments and/or as a realized gain.
Expenses. Expenses directly attributable to a fund are charged to that fund. Expenses attributable to more than one fund are allocated among the respective funds on the basis of relative net assets or other appropriate methods. Expenses included in the accompanying financial statements reflect the expenses of that fund and do not include any expenses associated with any underlying mutual funds or exchange-traded funds. Although not included in a fund's expenses, a fund indirectly bears its proportionate share of these expenses through the net asset value of each underlying mutual fund or exchange-traded fund. Expense estimates are accrued in the period to which they relate and adjustments are made when actual amounts are known.
Deferred Trustee Compensation. Under a Deferred Compensation Plan (the Plan) for certain Funds, certain independent Trustees have elected to defer receipt of a portion of their annual compensation. Deferred amounts are invested in affiliated mutual funds, are marked-to-market and remain in a fund until distributed in accordance with the Plan. The investment of deferred amounts and the offsetting payable to the Trustees presented below are included in the accompanying Statement of Assets and Liabilities in other receivables and other payables and accrued expenses, as applicable.
| Fidelity Telecom and Utilities Fund | $123 |
Income Tax Information and Distributions to Shareholders. Each year, the Fund intends to qualify as a regulated investment company under Subchapter M of the Internal Revenue Code, including distributing substantially all of its taxable income and realized gains. As a result, no provision for U.S. Federal income taxes is required. The Fund files a U.S. federal tax return, in addition to state and local tax returns as required. The Fund's federal income tax returns are subject to examination by the Internal Revenue Service (IRS) for a period of three fiscal years after they are filed. State and local tax returns may be subject to examination for an additional fiscal year depending on the jurisdiction.
Distributions are declared and recorded on the ex-dividend date. Income and capital gain distributions are determined in accordance with income tax regulations, which may differ from GAAP.
Capital accounts within the financial statements are adjusted for permanent book-tax differences. These adjustments have no impact on net assets or the results of operations. Capital accounts are not adjusted for temporary book-tax differences which will reverse in a subsequent period.
Book-tax differences are primarily due to deferred trustees compensation and losses deferred due to excise tax regulations, and wash sales.
As of period end, the cost and unrealized appreciation (depreciation) in securities, and derivatives if applicable, for federal income tax purposes were as follows:
| Gross unrealized appreciation | $228,259 |
| Gross unrealized depreciation | (22,001) |
| Net unrealized appreciation (depreciation) | $206,258 |
| Tax cost | $763,028 |
The Fund elected to defer to its next fiscal year approximately $826,986 of ordinary losses recognized during the period January 1,2021 to January 31, 2021.
4. Purchases and Sales of Investments.
Purchases and sales of securities, other than short-term securities and in-kind transactions, as applicable, are noted in the table below.
| Purchases ($) | Sales ($) | |
| Fidelity Telecom and Utilities Fund | 210,293 | 239,161 |
5. Fees and Other Transactions with Affiliates.
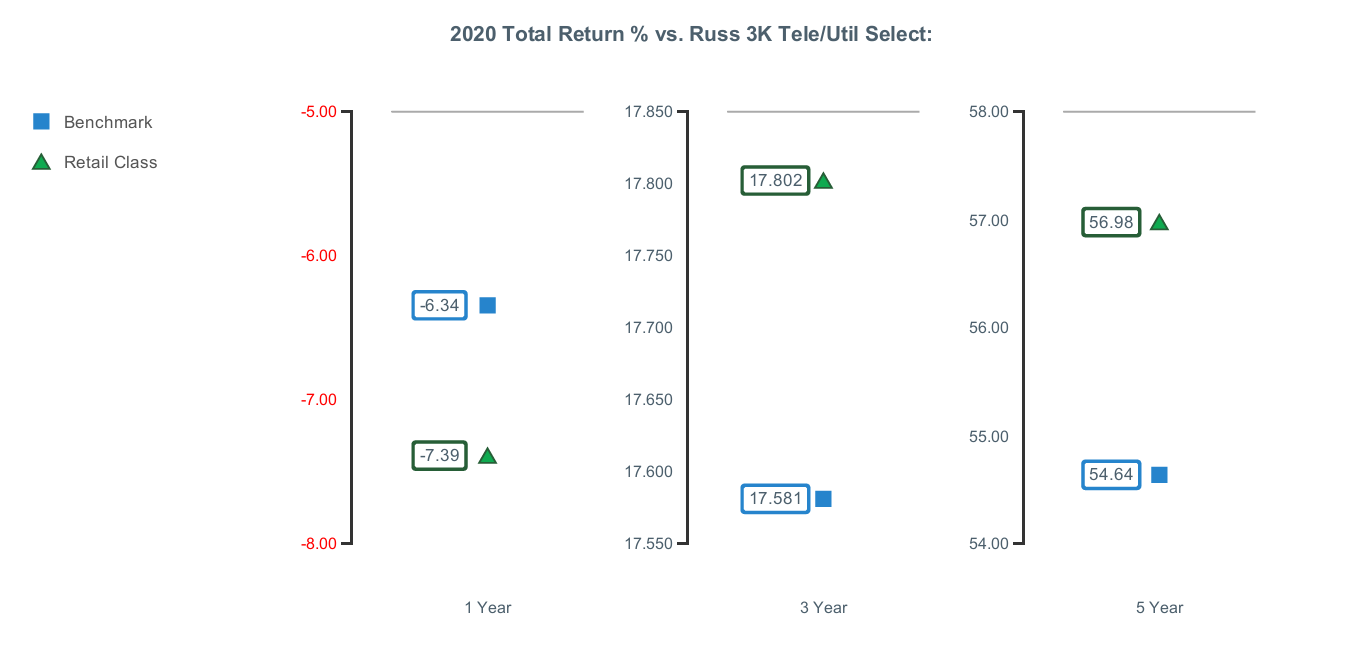
Management Fee. Fidelity Management & Research Company LLC (the investment adviser) and its affiliates provide the Fund with investment management related services for which the Fund pays a monthly management fee. The management fee is the sum of an individual fund fee rate that is based on an annual rate of .20% of the Fund's average net assets and an annualized group fee rate that averaged .23% during the period. The group fee rate is based upon the monthly average net assets of a group of registered investment companies with which the investment adviser has management contracts. The group fee rate decreases as assets under management increase and increases as assets under management decrease. In addition, the management fee is subject to a performance adjustment (up to a maximum of +/- .15% of the Fund's average net assets over a 36 month performance period). The upward or downward adjustment to the management fee is based on the Fund's relative investment performance as compared to its benchmark index, the Russell 3000 Telecom and Utilities Select Index effective September 21, 2020 (Russell 3000 Utilities Index prior to September 21, 2020), over the same 36 month performance period. For the reporting period, the total annualized management fee rate, including the performance adjustment, was .42% of the Fund's average net assets. The performance adjustment included in the management fee rate may be higher or lower than the maximum performance adjustment rate due to the difference between the average net assets for the reporting and performance periods.
Transfer Agent Fees. Fidelity Investments Institutional Operations Company LLC (FIIOC), an affiliate of the investment adviser, is the Fund's transfer, dividend disbursing and shareholder servicing agent. FIIOC receives account fees and asset-based fees that vary according to account size and type of account. FIIOC pays for typesetting, printing and mailing of shareholder reports, except proxy statements. For the period, the transfer agent fees were equivalent to an annualized rate of .15% of average net assets.
Accounting Fees. Fidelity Service Company, Inc. (FSC), an affiliate of the investment adviser, maintains the Fund's accounting records. The accounting fee is based on the level of average net assets for each month. For the period, the fees were equivalent to the following annualized rates:
| % of Average Net Assets | |
| Fidelity Telecom and Utilities Fund | .03 |
Brokerage Commissions. A portion of portfolio transactions were placed with brokerage firms which are affiliates of the investment adviser. Brokerage commissions are included in net realized gain (loss) and change in net unrealized appreciation (depreciation) in the Statement of Operations. The commissions paid to these affiliated firms were as follows:
| Amount | |
| Fidelity Telecom and Utilities Fund | $8 |
Interfund Trades. Funds may purchase from or sell securities to other Fidelity Funds under procedures adopted by the Board. The procedures have been designed to ensure these interfund trades are executed in accordance with Rule 17a-7 of the 1940 Act. Any interfund trades are included within the respective purchases and sales amounts shown in the Purchases and Sales of Investments note and are noted in the table below.
| Purchases ($) | Sales ($) | |
| Fidelity Telecom and Utilities Fund | – | 2,073 |
6. Committed Line of Credit.
Certain Funds participate with other funds managed by the investment adviser or an affiliate in a $4.25 billion credit facility (the "line of credit") to be utilized for temporary or emergency purposes to fund shareholder redemptions or for other short-term liquidity purposes. The participating funds have agreed to pay commitment fees on their pro-rata portion of the line of credit, which are reflected in Miscellaneous expenses on the Statement of Operations, and are listed below. During the period, there were no borrowings on this line of credit.
| Amount | |
| Fidelity Telecom and Utilities Fund | $1 |
7. Security Lending.
Funds lend portfolio securities from time to time in order to earn additional income. Lending agents are used, including National Financial Services (NFS), an affiliate of the investment adviser. Pursuant to a securities lending agreement, NFS will receive a fee, which is capped at 9.9% of a fund's daily lending revenue, for its services as lending agent. A fund may lend securities to certain qualified borrowers, including NFS. On the settlement date of the loan, a fund receives collateral (in the form of U.S. Treasury obligations, letters of credit and/or cash) against the loaned securities and maintains collateral in an amount not less than 100% of the market value of the loaned securities during the period of the loan. The market value of the loaned securities is determined at the close of business of a fund and any additional required collateral is delivered to a fund on the next business day. A fund or borrower may terminate the loan at any time, and if the borrower defaults on its obligation to return the securities loaned because of insolvency or other reasons, a fund may apply collateral received from the borrower against the obligation. A fund may experience delays and costs in recovering the securities loaned. Any cash collateral received is invested in the Fidelity Securities Lending Cash Central Fund. Any loaned securities are identified as such in the Schedule of Investments, and the value of loaned securities and cash collateral at period end, as applicable, are presented in the Statement of Assets and Liabilities. Security lending income represents the income earned on investing cash collateral, less rebates paid to borrowers and any lending agent fees associated with the loan, plus any premium payments received for lending certain types of securities. Security lending income is presented in the Statement of Operations as a component of income from Fidelity Central Funds. Affiliated security lending activity, if any, was as follows:
| Total Security Lending Fees Paid to NFS | Security Lending Income From Securities Loaned to NFS | Value of Securities Loaned to NFS at Period End | |
| Fidelity Telecom and Utilities Fund | $1 | $– | $– |
8. Expense Reductions.
Commissions paid to certain brokers with whom the investment adviser, or its affiliates, places trades on behalf of the Fund include an amount in addition to trade execution, which may be rebated back to the Fund to offset expenses. This amount totaled $42 for the period.
In addition, during the period the investment adviser or an affiliate reimbursed and/or waived a portion of operating expenses in the amount of $7.
9. Other.
Fund's organizational documents provide former and current trustees and officers with a limited indemnification against liabilities arising in connection with the performance of their duties to the fund. In the normal course of business, the fund may also enter into contracts that provide general indemnifications. The fund's maximum exposure under these arrangements is unknown as this would be dependent on future claims that may be made against the fund. The risk of material loss from such claims is considered remote.
10. Coronavirus (COVID-19) Pandemic.
An outbreak of COVID-19 first detected in China during December 2019 has since spread globally and was declared a pandemic by the World Health Organization during March 2020. Developments that disrupt global economies and financial markets, such as the COVID-19 pandemic, may magnify factors that affect the Fund's performance.
Shareholder Expense Example
As a shareholder, you incur two types of costs: (1) transaction costs, which may include sales charges (loads) on purchase payments or redemption proceeds, as applicable and (2) ongoing costs, which generally include management fees, distribution and/or service (12b-1) fees and other Fund expenses. This Example is intended to help you understand your ongoing costs (in dollars) of investing in a fund and to compare these costs with the ongoing costs of investing in other mutual funds.
The Example is based on an investment of $1,000 invested at the beginning of the period and held for the entire period (February 1, 2021 to July 31, 2021).
Actual Expenses
The first line of the accompanying table provides information about actual account values and actual expenses. You may use the information in this line, together with the amount you invested, to estimate the expenses that you paid over the period. Simply divide your account value by $1,000.00 (for example, an $8,600 account value divided by $1,000.00 = 8.6), then multiply the result by the number in the first line for a class/Fund under the heading entitled "Expenses Paid During Period" to estimate the expenses you paid on your account during this period. If any fund is a shareholder of any underlying mutual funds or exchange-traded funds (ETFs) (the Underlying Funds), such fund indirectly bears its proportional share of the expenses of the Underlying Funds in addition to the direct expenses incurred presented in the table. These fees and expenses are not included in the annualized expense ratio used to calculate the expense estimate in the table below.
Hypothetical Example for Comparison Purposes
The second line of the accompanying table provides information about hypothetical account values and hypothetical expenses based on the actual expense ratio and an assumed rate of return of 5% per year before expenses, which is not the actual return. The hypothetical account values and expenses may not be used to estimate the actual ending account balance or expenses you paid for the period. You may use this information to compare the ongoing costs of investing in the Fund and other funds. To do so, compare this 5% hypothetical example with the 5% hypothetical examples that appear in the shareholder reports of the other funds. If any fund is a shareholder of any Underlying Funds, such fund indirectly bears its proportional share of the expenses of the Underlying Funds in addition to the direct expenses as presented in the table. These fees and expenses are not included in the annualized expense ratio used to calculate the expense estimate in the table below.
Please note that the expenses shown in the table are meant to highlight your ongoing costs only and do not reflect any transaction costs. Therefore, the second line of the table is useful in comparing ongoing costs only, and will not help you determine the relative total costs of owning different funds.
| Annualized Expense Ratio-A | Beginning Account Value February 1, 2021 | Ending Account Value July 31, 2021 | Expenses Paid During Period-B February 1, 2021 to July 31, 2021 |
|
| Fidelity Telecom and Utilities Fund | .61% | |||
| Actual | $1,000.00 | $1,039.50 | $3.08 | |
| Hypothetical-C | $1,000.00 | $1,021.77 | $3.06 |
A Annualized expense ratio reflects expenses net of applicable fee waivers.
B Expenses are equal to the annualized expense ratio, multiplied by the average account value over the period, multiplied by 181/ 365 (to reflect the one-half year period). The fees and expenses of any Underlying Funds are not included in each annualized expense ratio.
C 5% return per year before expenses
Board Approval of Investment Advisory Contracts and Management Fees
Fidelity Telecom and Utilities Fund
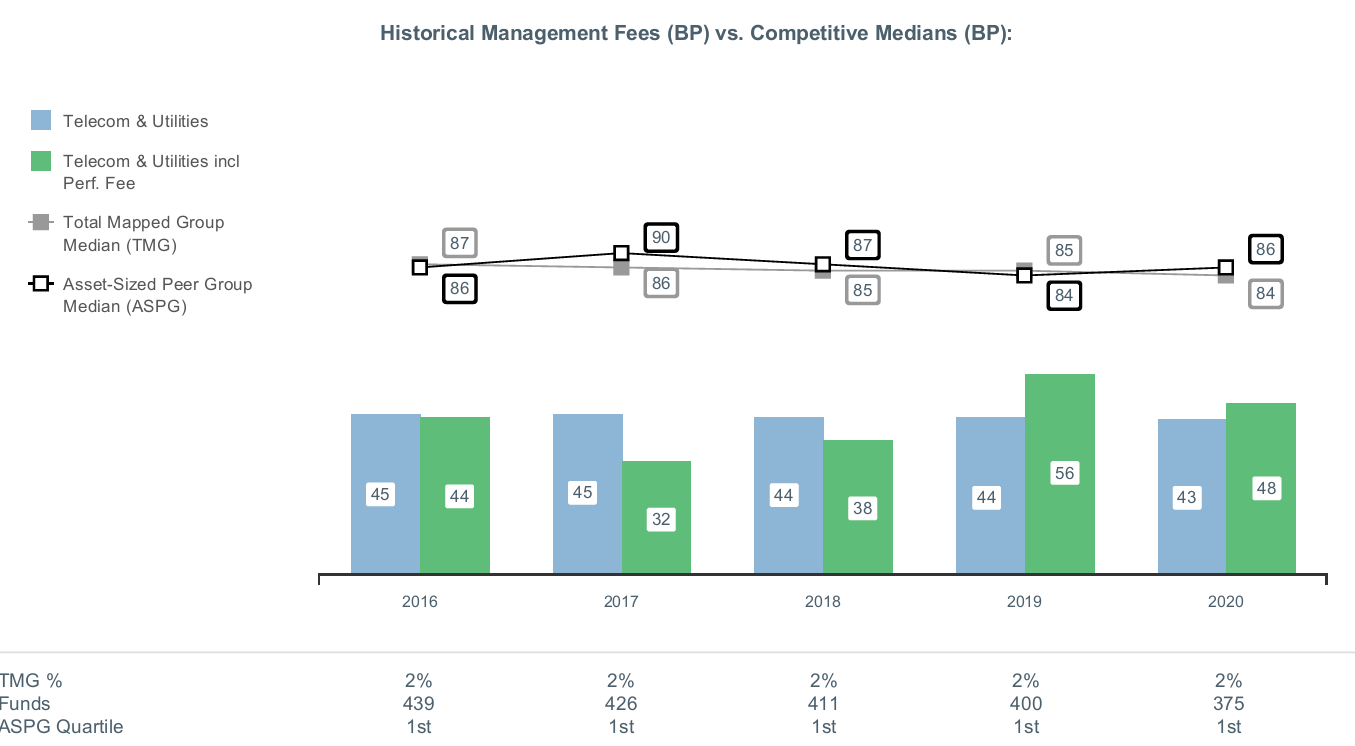
Each year, the Board of Trustees, including the Independent Trustees (together, the Board), votes on the renewal of the management contract with Fidelity Management & Research Company LLC (FMR) and the sub-advisory agreements (together, the Advisory Contracts) for the fund. FMR and the sub-advisers are referred to herein as the Investment Advisers. The Board, assisted by the advice of fund counsel and Independent Trustees' counsel, requests and considers a broad range of information relevant to the renewal of the Advisory Contracts throughout the year.The Board meets regularly and, at each of its meetings, covers an extensive agenda of topics and materials and considers factors that are relevant to its annual consideration of the renewal of the fund's Advisory Contracts, including the services and support provided to the fund and its shareholders. The Board has established various standing committees (Committees), each composed of and chaired by Independent Trustees with varying backgrounds, to which the Board has assigned specific subject matter responsibilities in order to enhance effective decision-making by the Board. The Board, acting directly and through its Committees, requests and receives information concerning the annual consideration of the renewal of the fund's Advisory Contracts. The Board also meets as needed to review matters specifically related to the Board's annual consideration of the renewal of the Advisory Contracts. Members of the Board may also meet with trustees of other Fidelity funds through joint ad hoc committees to discuss certain matters relevant to all of the Fidelity funds.At its May 2021 meeting, the Board unanimously determined to renew the fund's Advisory Contracts. In reaching its determination, the Board considered all factors it believed relevant, including (i) the nature, extent, and quality of the services provided to the fund and its shareholders (including the investment performance of the fund); (ii) the competitiveness of the fund's management fee and total expense ratio relative to peer funds; (iii) the total costs of the services provided by and the profits realized by Fidelity from its relationships with the fund; and (iv) the extent to which, if any, economies of scale exist and are realized as the fund grows, and whether any economies of scale are appropriately shared with fund shareholders.In considering whether to renew the Advisory Contracts for the fund, the Board reached a determination, with the assistance of fund counsel and Independent Trustees' counsel and through the exercise of its business judgment, that the renewal of the Advisory Contracts was in the best interests of the fund and its shareholders and that the compensation payable under the Advisory Contracts was fair and reasonable. The Board's decision to renew the Advisory Contracts was not based on any single factor, but rather was based on a comprehensive consideration of all the information provided to the Board at its meetings throughout the year. The Board, in reaching its determination to renew the Advisory Contracts, was aware that shareholders of the fund have a broad range of investment choices available to them, including a wide choice among funds offered by Fidelity's competitors, and that the fund's shareholders, who have the opportunity to review and weigh the disclosure provided by the fund in its prospectus and other public disclosures, have chosen to invest in this fund, which is part of the Fidelity family of funds. Nature, Extent, and Quality of Services Provided. The Board considered Fidelity's staffing as it relates to the fund, including the backgrounds of investment personnel of Fidelity, and also considered the fund's investment objective, strategies, and related investment philosophy. The Independent Trustees also had discussions with senior management of Fidelity's investment operations and investment groups. The Board considered the structure of the investment personnel compensation program and whether this structure provides appropriate incentives to act in the best interests of the fund. Additionally, the Board considered the portfolio managers' investments, if any, in the funds that they manage. Resources Dedicated to Investment Management and Support Services. The Board and the Fund Oversight and Research Committees reviewed the general qualifications and capabilities of Fidelity's investment staff, including its size, education, experience, and resources, as well as Fidelity's approach to recruiting, training, managing, and compensating investment personnel. The Board noted that Fidelity has continued to increase the resources devoted to non-U.S. offices, including expansion of Fidelity's global investment organization. The Board also noted that Fidelity's analysts have extensive resources, tools and capabilities that allow them to conduct sophisticated quantitative and fundamental analysis, as well as credit analysis of issuers, counterparties and guarantors. Further, the Board considered that Fidelity's investment professionals have sufficient access to global information and data so as to provide competitive investment results over time, and that those professionals also have access to sophisticated tools that permit them to assess portfolio construction and risk and performance attribution characteristics continuously, as well as to transmit new information and research conclusions rapidly around the world. Additionally, in its deliberations, the Board considered Fidelity's trading, risk management, compliance, and technology and operations capabilities and resources, which are integral parts of the investment management process. The Board also considered Fidelity's investments in business continuity planning, and its success in continuously providing services to the fund notwithstanding the severe disruptions caused by the COVID-19 pandemic. Shareholder and Administrative Services. The Board considered (i) the nature, extent, quality, and cost of advisory, administrative, and shareholder services performed by the Investment Advisers and their affiliates under the Advisory Contracts and under separate agreements covering transfer agency, pricing and bookkeeping, and securities lending services for the fund; (ii) the nature and extent of the supervision of third party service providers, principally custodians, subcustodians, and pricing vendors; and (iii) the resources devoted to, and the record of compliance with, the fund's compliance policies and procedures. The Board also reviewed the allocation of fund brokerage, including allocations to brokers affiliated with the Investment Advisers, the use of brokerage commissions to pay fund expenses, and the use of "soft" commission dollars to pay for research services.The Board noted that the growth of fund assets over time across the complex allows Fidelity to reinvest in the development of services designed to enhance the value and convenience of the Fidelity funds as investment vehicles. These services include 24-hour access to account information and market information over the Internet and through telephone representatives, investor education materials and asset allocation tools, and the expanded availability of Fidelity Investor Centers.The Board noted that, in the past, it and the boards of certain other Fidelity funds had formed an ad hoc Committee on Transfer Agency Fees to review the variety of transfer agency fee structures throughout the industry and Fidelity's competitive positioning with respect to industry participants. Investment in a Large Fund Family. The Board considered the benefits to shareholders of investing in a Fidelity fund, including the benefits of investing in a fund that is part of a large family of funds offering a variety of investment disciplines and providing a large variety of mutual fund investor services. The Board noted that Fidelity had taken, or had made recommendations that resulted in the Fidelity funds taking, a number of actions over the previous year that benefited particular funds, including: (i) continuing to dedicate additional resources to Fidelity's investment research process, which includes meetings with management of issuers of securities in which the funds invest, and to the support of the senior management team that oversees asset management; (ii) continuing efforts to enhance Fidelity's global research capabilities; (iii) launching new funds and ETFs with innovative structures, strategies and pricing and making other enhancements to meet client needs; (iv) launching new share classes of existing funds; (v) eliminating purchase minimums and broadening eligibility requirements for certain funds and share classes; (vi) approving the reduction in the holding period for the Class C to Class A conversion policy; (vii) reducing management fees and total expenses for certain target date funds and classes and index funds; (viii) lowering expenses for certain existing funds and classes by implementing or lowering expense caps; (ix) rationalizing product lines and gaining increased efficiencies from fund mergers, liquidations, and share class consolidations; (x) continuing to develop, acquire and implement systems and technology to improve services to the funds and shareholders, strengthen information security, and increase efficiency; and (xi) continuing to implement enhancements to further strengthen Fidelity's product line to increase investors' probability of success in achieving their investment goals, including retirement income goals. Investment Performance. The Board considered whether the fund has operated in accordance with its investment objective, as well as its record of compliance with its investment restrictions and its performance history.The Board took into account discussions that occur at Board meetings throughout the year with representatives of the Investment Advisers about fund investment performance. In this regard the Board noted that as part of regularly scheduled fund reviews and other reports to the Board on fund performance, the Board considers annualized return information for the fund for different time periods, measured against an appropriate securities market index (benchmark index). In its evaluation of fund investment performance, the Board gave particular attention to information indicating changes in performance of certain Fidelity funds for specific time periods and discussed with the Investment Advisers the reasons for any overperformance or underperformance.In addition to reviewing absolute and relative fund performance, the Independent Trustees periodically consider the appropriateness of fund performance metrics in evaluating the results achieved. In general, the Independent Trustees believe that fund performance should be evaluated based on net performance (after fees and expenses) of both the highest performing and lowest performing fund share classes, where applicable, compared to appropriate benchmark indices, over appropriate time periods that may include full market cycles, taking into account relevant factors including the following: general market conditions; issuer-specific information; and fund cash flows and other factors.The Independent Trustees recognize that shareholders evaluate performance on a net basis over their own holding periods, for which one-, three-, and five-year periods are often used as a proxy. For this reason, the performance information reviewed by the Board also included net cumulative total return information for the fund and an appropriate benchmark index for the most recent one-, three-, and five-year periods ended September 30, 2020, as shown below.Fidelity Telecom and Utilities Fund
Fidelity Telecom and Utilities Fund
Liquidity Risk Management Program
The Securities and Exchange Commission adopted Rule 22e-4 under the Investment Company Act of 1940 (the Liquidity Rule) to promote effective liquidity risk management throughout the open-end investment company industry, thereby reducing the risk that funds will be unable to meet their redemption obligations and mitigating dilution of the interests of fund shareholders.
The Fund has adopted and implemented a liquidity risk management program pursuant to the Liquidity Rule (the Program) effective December 1, 2018. The Program is reasonably designed to assess and manage the Fund’s liquidity risk and to comply with the requirements of the Liquidity Rule. The Fund’s Board of Trustees (the Board) has designated the Fund’s investment adviser as administrator of the Program. The Fidelity advisers have established a Liquidity Risk Management Committee (the LRM Committee) to manage the Program for each of the Fidelity Funds. The LRM Committee monitors the adequacy and effectiveness of implementation of the Program and on a periodic basis assesses each Fund’s liquidity risk based on a variety of factors including (1) the Fund’s investment strategy, (2) portfolio liquidity and cash flow projections during normal and reasonably foreseeable stressed conditions, (3) shareholder redemptions, (4) borrowings and other funding sources and (5) in the case of exchange-traded funds, certain additional factors including the effect of the Fund’s prices and spreads, market participants, and basket compositions on the overall liquidity of the Fund’s portfolio, as applicable.
In accordance with the Program, each of the Fund’s portfolio investments is classified into one of four liquidity categories described below based on a determination of a reasonable expectation for how long it would take to convert the investment to cash (or sell or dispose of the investment) without significantly changing its market value.
- Highly liquid investments – cash or convertible to cash within three business days or less
- Moderately liquid investments – convertible to cash in three to seven calendar days
- Less liquid investments – can be sold or disposed of, but not settled, within seven calendar days
- Illiquid investments – cannot be sold or disposed of within seven calendar days
Liquidity classification determinations take into account a variety of factors including various market, trading and investment-specific considerations, as well as market depth, and generally utilize analysis from a third-party liquidity metrics service.
The Liquidity Rule places a 15% limit on a fund’s illiquid investments and requires funds that do not primarily hold assets that are highly liquid investments to determine and maintain a minimum percentage of the fund’s net assets to be invested in highly liquid investments (highly liquid investment minimum or HLIM). The Program includes provisions reasonably designed to comply with the 15% limit on illiquid investments and for determining, periodically reviewing and complying with the HLIM requirement as applicable.
At a recent meeting of the Fund’s Board of Trustees, the LRM Committee provided a written report to the Board pertaining to the operation, adequacy, and effectiveness of implementation of the Program for the annual period from December 1, 2019 through November 30, 2020. The report concluded that the Program has been implemented and is operating effectively and is reasonably designed to assess and manage the Fund’s liquidity risk.
![]()
UIF-SANN-0921
1.706447.123
Item 2.
Code of Ethics
Not applicable.
Item 3.
Audit Committee Financial Expert
Not applicable.
Item 4.
Principal Accountant Fees and Services
Not applicable.
Item 5.
Audit Committee of Listed Registrants
Not applicable.
Item 6.
Investments
(a)
Not applicable.
(b)
Not applicable
Item 7.
Disclosure of Proxy Voting Policies and Procedures for Closed-End Management Investment Companies
Not applicable.
Item 8.
Portfolio Managers of Closed-End Management Investment Companies
Not applicable.
Item 9.
Purchase of Equity Securities by Closed-End Management Investment Company and Affiliated Purchasers
Not applicable.
Item 10.
Submission of Matters to a Vote of Security Holders
There were no material changes to the procedures by which shareholders may recommend nominees to the Fidelity Select Portfolios’s Board of Trustees.
Item 11.
Controls and Procedures
(a)(i) The President and Treasurer and the Chief Financial Officer have concluded that the Fidelity Select Portfolios’s (the “Trust”) disclosure controls and procedures (as
defined in Rule 30a-3(c) under the Investment Company Act) provide reasonable assurances that material information relating to the Trust is made known to them by the appropriate persons, based on their evaluation of these controls and procedures as of a date within 90 days of the filing date of this report.
(a)(ii) There was no change in the Trust’s internal control over financial reporting (as defined in Rule 30a-3(d) under the Investment Company Act) that occurred during the period covered by this report that has materially affected, or is reasonably likely to materially affect, the Trust’s internal control over financial reporting.
Item 12.
Disclosure of Securities Lending Activities for Closed-End Management
Investment Companies
Not applicable.
Item 13.
Exhibits
| (a) | (1) | Not applicable. |
| (a) | (2) | |
| (a) | (3) | Not applicable. |
| (b) | |
SIGNATURES
Pursuant to the requirements of the Securities Exchange Act of 1934 and the Investment Company Act of 1940, the registrant has duly caused this report to be signed on its behalf by the undersigned, thereunto duly authorized.
Fidelity Select Portfolios
| By: | /s/Stacie M. Smith |
| | Stacie M. Smith |
| | President and Treasurer |
| | |
| Date: | September 21, 2021 |
Pursuant to the requirements of the Securities Exchange Act of 1934 and the Investment Company Act of 1940, this report has been signed below by the following persons on behalf of the registrant and in the capacities and on the dates indicated.
| By: | /s/Stacie M. Smith |
| | Stacie M. Smith |
| | President and Treasurer |
| | |
| Date: | September 21, 2021 |
| By: | /s/John J. Burke III |
| | John J. Burke III |
| | Chief Financial Officer |
| | |
| Date: | September 21, 2021 |
Exhibit EX-99.CERT
I, Stacie M. Smith, certify that:
1.
I have reviewed this report on Form N-CSR of Fidelity Select Portfolios;
2.
Based on my knowledge, this report does not contain any untrue statement of a material fact or omit to state a material fact necessary to make the statements made, in light of the circumstances under which such statements were made, not misleading with respect to the period covered by this report;
3.
Based on my knowledge, the financial statements, and other financial information included in this report, fairly present in all material respects the financial condition, results of operations, changes in net assets, and cash flows (if the financial statements are required to include a statement of cash flows) of the registrant as of, and for, the periods presented in this report;
4.
The registrant's other certifying officer(s) and I are responsible for establishing and maintaining disclosure controls and procedures (as defined in Rule 30a-3(c) under the Investment Company Act of 1940) and internal control over financial reporting (as defined in Rule 30a-3(d) under the Investment Company Act of 1940) for the registrant and have:
a.
Designed such disclosure controls and procedures, or caused such disclosure controls and procedures to be designed under our supervision, to ensure that material information relating to the registrant, including its consolidated subsidiaries, is made known to us by others within those entities, particularly during the period in which this report is being prepared;
b.
Designed such internal control over financial reporting, or caused such internal control over financial reporting to be designed under our supervision, to provide reasonable assurance regarding the reliability of financial reporting and the preparation of financial statements for external purposes in accordance with generally accepted accounting principles;
c.
Evaluated the effectiveness of the registrant's disclosure controls and procedures and presented in this report our conclusions about the effectiveness of the disclosure controls and procedures, as of a date within 90 days prior to the filing date of this report based upon such evaluation; and
d.
Disclosed in this report any change in the registrant’s internal control over financial reporting that occurred during the period covered by this report that has materially affected, or is reasonably likely to materially affect, the registrant’s internal control over financial reporting; and
5.
The registrant's other certifying officer(s) and I have disclosed to the registrant's auditors and the audit committee of the registrant's board of directors (or persons performing the equivalent functions):
a.
All significant deficiencies and material weaknesses in the design or operation of internal control over financial reporting which are reasonably likely to adversely affect the registrant's ability to record, process, summarize, and report financial information; and
b.
Any fraud, whether or not material, that involves management or other employees who have a significant role in the registrant's internal control over financial reporting.
Date:
September 21, 2021
/s/Stacie M. Smith |
Stacie M. Smith |
President and Treasurer |
I, John J. Burke III, certify that:
1.
I have reviewed this report on Form N-CSR of Fidelity Select Portfolios;
2.
Based on my knowledge, this report does not contain any untrue statement of a material fact or omit to state a material fact necessary to make the statements made, in light of the circumstances under which such statements were made, not misleading with respect to the period covered by this report;
3.
Based on my knowledge, the financial statements, and other financial information included in this report, fairly present in all material respects the financial condition, results of operations, changes in net assets, and cash flows (if the financial statements are required to include a statement of cash flows) of the registrant as of, and for, the periods presented in this report;
4.
The registrant's other certifying officer(s) and I are responsible for establishing and maintaining disclosure controls and procedures (as defined in Rule 30a-3(c) under the Investment Company Act of 1940) and internal control over financial reporting (as defined in Rule 30a-3(d) under the Investment Company Act of 1940) for the registrant and have:
a.
Designed such disclosure controls and procedures, or caused such disclosure controls and procedures to be designed under our supervision, to ensure that material information relating to the registrant, including its consolidated subsidiaries, is made known to us by others within those entities, particularly during the period in which this report is being prepared;
b.
Designed such internal control over financial reporting, or caused such internal control over financial reporting to be designed under our supervision, to provide reasonable assurance regarding the reliability of financial reporting and the preparation of financial statements for external purposes in accordance with generally accepted accounting principles;
c.
Evaluated the effectiveness of the registrant's disclosure controls and procedures and presented in this report our conclusions about the effectiveness of the disclosure controls and procedures, as of a date within 90 days prior to the filing date of this report based upon such evaluation; and
d.
Disclosed in this report any change in the registrant’s internal control over financial reporting that occurred during the period covered by this report that has materially affected, or is reasonably likely to materially affect, the registrant’s internal control over financial reporting; and
5.
The registrant's other certifying officer(s) and I have disclosed to the registrant's auditors and the audit committee of the registrant's board of directors (or persons performing the equivalent functions):
a.
All significant deficiencies and material weaknesses in the design or operation of internal control over financial reporting which are reasonably likely to adversely affect the registrant's ability to record, process, summarize, and report financial information; and
b.
Any fraud, whether or not material, that involves management or other employees who have a significant role in the registrant's internal control over financial reporting.
Date:
September 21, 2021
/s/John J. Burke III |
John J. Burke III |
Chief Financial Officer |
Exhibit EX-99.906CERT
Certification Pursuant to Section 906 of the Sarbanes-Oxley Act of 2002 (subsections (a) and (b) of section 1350, chapter 63 of title 18, United States Code)
In connection with the attached Report of Fidelity Select Portfolios (the “Trust”) on Form N-CSR to be filed with the Securities and Exchange Commission (the “Report”), each of the undersigned officers of the Trust does hereby certify that, to the best of such officer’s knowledge:
1.
The Report fully complies with the requirements of 13(a) or 15(d) of the Securities Exchange Act of 1934; and
2.
The information contained in the Report fairly presents, in all material respects, the financial condition and results of operations of the Trust as of, and for, the periods presented in the Report.
Dated: September 21, 2021
/s/Stacie M. Smith |
Stacie M. Smith |
President and Treasurer |
Dated: September 21, 2021
/s/John J. Burke III |
John J. Burke III |
Chief Financial Officer |
A signed original of this written statement required by Section 906, or other document authenticating, acknowledging, or otherwise adopting the signature that appears in typed form within the electronic version of this written statement required by Section 906, has been provided to the Trust and will be retained by the Trust and furnished to the Securities and Exchange Commission or its staff upon request.
Serious News for Serious Traders! Try StreetInsider.com Premium Free!
You May Also Be Interested In
- GameChange Solar Secures Over 500 MW of Solar Projects in Southern Africa
- Invitation to presentation of the interim report January-March 2024 for Truecaller AB (publ)
- Senzime Wins Another Major US Veterans Affairs Contract; Expands Reach of TetraGraph System
Create E-mail Alert Related Categories
SEC FilingsSign up for StreetInsider Free!
Receive full access to all new and archived articles, unlimited portfolio tracking, e-mail alerts, custom newswires and RSS feeds - and more!
