

Form N-CSRS FIDELITY SALEM STREET For: Jul 31
 Tweet
Tweet Share
ShareUNITED STATES
SECURITIES AND EXCHANGE COMMISSION
Washington, D.C. 20549
FORM N-CSR
CERTIFIED SHAREHOLDER REPORT OF REGISTERED
MANAGEMENT INVESTMENT COMPANIES
Investment Company Act file number 811-02105
Fidelity Salem Street Trust
(Exact name of registrant as specified in charter)
245 Summer St., Boston, MA 02210
(Address of principal executive offices) (Zip code)
Cynthia Lo Bessette, Secretary
245 Summer St.
Boston, Massachusetts 02210
(Name and address of agent for service)
Registrant's telephone number, including area code:
617-563-7000
Date of fiscal year end: | January 31 |
Date of reporting period: | July 31, 2021 |
Item 1.
Reports to Stockholders
Fidelity® Tax-Free Bond Fund
Semi-Annual Report
July 31, 2021

Contents
To view a fund's proxy voting guidelines and proxy voting record for the 12-month period ended June 30, visit http://www.fidelity.com/proxyvotingresults or visit the Securities and Exchange Commission's (SEC) web site at http://www.sec.gov.
You may also call 1-800-544-8544 to request a free copy of the proxy voting guidelines.
Standard & Poor's, S&P and S&P 500 are registered service marks of The McGraw-Hill Companies, Inc. and have been licensed for use by Fidelity Distributors Corporation.
Other third-party marks appearing herein are the property of their respective owners.
All other marks appearing herein are registered or unregistered trademarks or service marks of FMR LLC or an affiliated company. © 2021 FMR LLC. All rights reserved.
This report and the financial statements contained herein are submitted for the general information of the shareholders of the Fund. This report is not authorized for distribution to prospective investors in the Fund unless preceded or accompanied by an effective prospectus.
A fund files its complete schedule of portfolio holdings with the SEC for the first and third quarters of each fiscal year on Form N-PORT. Forms N-PORT are available on the SEC’s web site at http://www.sec.gov. A fund's Forms N-PORT may be reviewed and copied at the SEC’s Public Reference Room in Washington, DC. Information regarding the operation of the SEC's Public Reference Room may be obtained by calling 1-800-SEC-0330.
For a complete list of a fund's portfolio holdings, view the most recent holdings listing, semiannual report, or annual report on Fidelity's web site at http://www.fidelity.com, http://www.institutional.fidelity.com, or http://www.401k.com, as applicable.
NOT FDIC INSURED •MAY LOSE VALUE •NO BANK GUARANTEE
Neither the Fund nor Fidelity Distributors Corporation is a bank.
Note to Shareholders:
Early in 2020, the outbreak and spread of a new coronavirus emerged as a public health emergency that had a major influence on financial markets, primarily based on its impact on the global economy and the outlook for corporate earnings. The virus causes a respiratory disease known as COVID-19. On March 11, 2020 the World Health Organization declared the COVID-19 outbreak a pandemic, citing sustained risk of further global spread.
In the weeks following, as the crisis worsened, we witnessed an escalating human tragedy with wide-scale social and economic consequences from coronavirus-containment measures. The outbreak of COVID-19 prompted a number of measures to limit the spread, including travel and border restrictions, quarantines, and restrictions on large gatherings. In turn, these resulted in lower consumer activity, diminished demand for a wide range of products and services, disruption in manufacturing and supply chains, and – given the wide variability in outcomes regarding the outbreak – significant market uncertainty and volatility. Amid the turmoil, global governments and central banks took unprecedented action to help support consumers, businesses, and the broader economies, and to limit disruption to financial systems.
The situation continues to unfold, and the extent and duration of its impact on financial markets and the economy remain highly uncertain. Extreme events such as the coronavirus crisis are “exogenous shocks” that can have significant adverse effects on mutual funds and their investments. Although multiple asset classes may be affected by market disruption, the duration and impact may not be the same for all types of assets.
Fidelity is committed to helping you stay informed amid news about COVID-19 and during increased market volatility, and we’re taking extra steps to be responsive to customer needs. We encourage you to visit our websites, where we offer ongoing updates, commentary, and analysis on the markets and our funds.
Investment Summary (Unaudited)
Top Five States as of July 31, 2021
| % of fund's net assets | |
| Illinois | 16.7 |
| Florida | 6.9 |
| New York | 6.8 |
| Texas | 6.0 |
| New Jersey | 5.6 |
Top Five Sectors as of July 31, 2021
| % of fund's net assets | |
| General Obligations | 26.4 |
| Health Care | 20.7 |
| Transportation | 17.5 |
| Education | 7.3 |
| Special Tax | 6.9 |
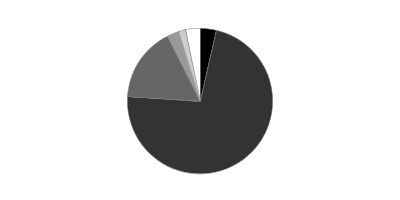
Quality Diversification (% of fund's net assets)
| As of July 31, 2021 | ||
| AAA | 3.6% | |
| AA,A | 72.3% | |
| BBB | 16.7% | |
| BB and Below | 2.6% | |
| Not Rated | 1.7% | |
| Short-Term Investments and Net Other Assets | 3.1% | |
We have used ratings from Moody's Investors Service, Inc. Where Moody's® ratings are not available, we have used S&P® ratings. All ratings are as of the date indicated and do not reflect subsequent changes.
Schedule of Investments July 31, 2021 (Unaudited)
Showing Percentage of Net Assets
| Municipal Bonds - 96.9% | |||
| Principal Amount | Value | ||
| Alabama - 1.6% | |||
| Auburn Univ. Gen. Fee Rev. Series 2018 A, 5% 6/1/43 | 1,800,000 | 2,229,687 | |
| Homewood Edl. Bldg. Auth. Rev. Series 2019 A: | |||
| 4% 12/1/33 | $285,000 | $335,461 | |
| 4% 12/1/35 | 930,000 | 1,089,813 | |
| 4% 12/1/37 | 1,250,000 | 1,454,136 | |
| 4% 12/1/38 | 240,000 | 278,587 | |
| 4% 12/1/39 | 1,700,000 | 1,968,849 | |
| 4% 12/1/41 | 4,070,000 | 4,694,102 | |
| 4% 12/1/44 | 2,400,000 | 2,751,190 | |
| 4% 12/1/49 | 560,000 | 637,471 | |
| Lower Alabama Gas District Bonds (No. 2 Proj.) Series 2020, 4%, tender 12/1/25 (a) | 24,380,000 | 27,833,332 | |
| Montgomery Med. Clinic Facilities Series 2015: | |||
| 5% 3/1/26 | 60,000 | 70,091 | |
| 5% 3/1/27 | 115,000 | 133,069 | |
| 5% 3/1/28 | 125,000 | 143,959 | |
| 5% 3/1/29 | 105,000 | 120,353 | |
| 5% 3/1/30 | 125,000 | 142,635 | |
| 5% 3/1/36 | 2,450,000 | 2,762,518 | |
| Southeast Energy Auth. Rev. Bonds: | |||
| (Proj. No. 2) Series 2021 B1: | |||
| 4% 6/1/29 | 1,335,000 | 1,628,306 | |
| 4% 6/1/30 | 1,010,000 | 1,246,811 | |
| 4% 6/1/31 | 875,000 | 1,094,919 | |
| Bonds (Proj. No. 2) Series 2021 B1, 4%, tender 12/1/31 (a) | 21,345,000 | 26,849,920 | |
| TOTAL ALABAMA | 77,465,209 | ||
| Alaska - 0.2% | |||
| Alaska Gen. Oblig. Series 2016 A, 5% 8/1/31 | 4,340,000 | 5,113,457 | |
| Alaska Int'l. Arpts. Revs. Series 2016 B: | |||
| 5% 10/1/31 | 1,685,000 | 1,995,547 | |
| 5% 10/1/33 | 2,200,000 | 2,605,462 | |
| TOTAL ALASKA | 9,714,466 | ||
| Arizona - 2.1% | |||
| Arizona Board of Regents Ctfs. of Prtn. (Univ. of Arizona Univ. Revs.) Series 2018 B: | |||
| 5% 6/1/26 | 1,100,000 | 1,334,119 | |
| 5% 6/1/27 | 500,000 | 622,301 | |
| 5% 6/1/29 | 1,725,000 | 2,195,354 | |
| 5% 6/1/30 | 1,470,000 | 1,858,943 | |
| Arizona Health Facilities Auth. Rev. (Banner Health Sys. Proj.) Series 2007 B, 3 month U.S. LIBOR + 0.810% 0.907%, tender 1/1/37 (a)(b) | 1,000,000 | 995,882 | |
| Arizona Indl. Dev. Auth. Lease Rev. Series 2020 A: | |||
| 4% 9/1/37 | 410,000 | 493,495 | |
| 4% 9/1/38 | 445,000 | 534,364 | |
| 4% 9/1/39 | 400,000 | 479,148 | |
| 4% 9/1/40 | 435,000 | 520,055 | |
| 4% 9/1/46 | 1,000,000 | 1,180,838 | |
| 5% 9/1/31 | 195,000 | 257,869 | |
| 5% 9/1/32 | 300,000 | 395,496 | |
| 5% 9/1/33 | 415,000 | 545,283 | |
| 5% 9/1/34 | 350,000 | 458,457 | |
| Arizona Indl. Dev. Auth. Rev. (Provident Group-Eastern Michigan Univ. Parking Proj.) Series 2018: | |||
| 5% 5/1/37 | 1,090,000 | 1,176,353 | |
| 5% 5/1/43 | 1,000,000 | 1,067,029 | |
| Arizona State Univ. Revs. Series 2021 C: | |||
| 5% 7/1/32 | 1,220,000 | 1,674,088 | |
| 5% 7/1/34 | 1,250,000 | 1,701,733 | |
| 5% 7/1/35 | 1,000,000 | 1,358,815 | |
| Glendale Gen. Oblig. Series 2017, 5% 7/1/24 | 3,475,000 | 3,954,397 | |
| Glendale Indl. Dev. Auth. (Terraces of Phoenix Proj.) Series 2018 A: | |||
| 5% 7/1/38 | 155,000 | 167,556 | |
| 5% 7/1/48 | 200,000 | 213,603 | |
| Maricopa County Indl. Dev. Auth. (Creighton Univ. Proj.) Series 2020, 5% 7/1/47 | 2,000,000 | 2,515,313 | |
| Maricopa County Indl. Dev. Auth. Sr. Living Facilities Series 2016: | |||
| 5.75% 1/1/36 (c) | 585,000 | 614,678 | |
| 6% 1/1/48 (c) | 2,825,000 | 2,946,470 | |
| Maricopa County Unified School District #48 Scottsdale Series 2017 B: | |||
| 5% 7/1/29 | 1,150,000 | 1,441,432 | |
| 5% 7/1/30 | 1,500,000 | 1,872,607 | |
| 5% 7/1/31 | 800,000 | 994,847 | |
| 5% 7/1/32 | 3,250,000 | 4,030,541 | |
| Phoenix Civic Impt. Board Arpt. Rev.: | |||
| Series 2015 A, 5% 7/1/45 | 3,170,000 | 3,696,204 | |
| Series 2017 B: | |||
| 5% 7/1/30 | 4,000,000 | 4,975,263 | |
| 5% 7/1/34 | 2,000,000 | 2,483,434 | |
| 5% 7/1/35 | 2,000,000 | 2,483,040 | |
| Series 2019 A, 5% 7/1/44 | 5,615,000 | 7,129,908 | |
| Phoenix Civic Impt. Corp. Series 2019 A: | |||
| 5% 7/1/30 | 1,100,000 | 1,345,528 | |
| 5% 7/1/32 | 355,000 | 431,166 | |
| 5% 7/1/36 | 595,000 | 715,589 | |
| 5% 7/1/37 | 520,000 | 623,815 | |
| 5% 7/1/38 | 830,000 | 993,694 | |
| 5% 7/1/45 | 7,200,000 | 8,503,258 | |
| Phoenix Civic Impt. Corp. District Rev. (Plaza Expansion Proj.) Series 2005 B, 5.5% 7/1/38 (Nat'l. Pub. Fin. Guarantee Corp. Insured) | 5,000,000 | 7,722,044 | |
| Phoenix Civic Impt. Corp. Wtr. Sys. Rev. Series 2020 A, 5% 7/1/44 | 8,430,000 | 11,015,728 | |
| Phoenix IDA Student Hsg. Rev. (Downtown Phoenix Student Hsg. II LLC Arizona State Univ. Proj.) Series 2019 A: | |||
| 5% 7/1/49 | 1,125,000 | 1,361,638 | |
| 5% 7/1/54 | 3,530,000 | 4,258,237 | |
| Pima County Swr. Sys. Rev. Series 2012 A, 5% 7/1/27 | 1,000,000 | 1,043,442 | |
| Salt Verde Finl. Corp. Sr. Gas Rev. Series 2007, 5.25% 12/1/23 | 2,500,000 | 2,769,057 | |
| TOTAL ARIZONA | 99,152,111 | ||
| California - 4.5% | |||
| Bay Area Toll Auth. San Francisco Bay Toll Bridge Rev. Bonds Series C, 2.1%, tender 4/1/22 (a) | 3,585,000 | 3,596,476 | |
| California Gen. Oblig.: | |||
| Series 2004: | |||
| 5.25% 12/1/33 | 35,000 | 35,134 | |
| 5.5% 4/1/30 | 5,000 | 5,020 | |
| Series 2012, 5.25% 4/1/35 | 2,920,000 | 3,017,908 | |
| Series 2017, 5% 11/1/29 | 6,225,000 | 7,891,597 | |
| Series 2020: | |||
| 4% 11/1/37 | 8,715,000 | 10,798,753 | |
| 4% 11/1/38 | 8,000,000 | 9,873,346 | |
| 4% 11/1/39 | 3,500,000 | 4,308,779 | |
| 4% 11/1/40 | 2,500,000 | 3,064,264 | |
| Series 2021: | |||
| 5% 9/1/31 (d) | 17,210,000 | 23,853,115 | |
| 5% 9/1/32 (d) | 6,055,000 | 8,363,989 | |
| California Health Facilities Fing. Auth. Rev. Series 2013 A, 5% 8/15/52 (Pre-Refunded to 8/15/23 @ 100) | 15,070,000 | 16,550,079 | |
| California Hsg. Fin. Agcy. Series 2021 1, 3.5% 11/20/35 | 1,831,303 | 2,181,513 | |
| California Muni. Fin. Auth. Student Hsg. (CHF-Davis I, LLC - West Village Student Hsg. Proj.) Series 2018: | |||
| 5% 5/15/35 | 2,140,000 | 2,714,512 | |
| 5% 5/15/38 | 3,000,000 | 3,787,947 | |
| 5% 5/15/43 | 4,000,000 | 5,006,290 | |
| California Pub. Fin. Auth. Univ. Hsg. Rev.: | |||
| (Claremont Colleges Proj.) Series 2017 A, 5% 7/1/27 (c) | 340,000 | 307,518 | |
| (NCCD - Claremont Properties LLC - Claremont Colleges Proj.) Series 2017 A, 5% 7/1/47 (c) | 280,000 | 254,318 | |
| California Pub. Works Board Lease Rev. (Coalinga State Hosp. Proj.) Series 2013 E, 5% 6/1/26 | 5,265,000 | 5,731,917 | |
| California Statewide Cmntys. Dev. Auth. Series 2016: | |||
| 5% 5/15/25 | 1,000,000 | 1,171,722 | |
| 5% 5/15/26 | 1,000,000 | 1,211,371 | |
| 5% 5/15/27 | 1,000,000 | 1,211,371 | |
| 5% 5/15/28 | 1,000,000 | 1,207,685 | |
| 5% 5/15/32 | 1,250,000 | 1,495,234 | |
| 5% 5/15/33 | 1,500,000 | 1,791,165 | |
| 5% 5/15/40 | 1,000,000 | 1,181,225 | |
| California Statewide Cmntys. Dev. Auth. Rev. Series 2015, 5% 2/1/45 | 2,275,000 | 2,397,961 | |
| Carlsbad Unified School District Series 2009 B, 6% 5/1/34 (Pre-Refunded to 5/1/24 @ 100) | 1,450,000 | 1,678,365 | |
| Golden State Tobacco Securitization Corp. Tobacco Settlement Rev.: | |||
| Series 2013 A, 5% 6/1/29 | 2,500,000 | 2,722,828 | |
| Series 2017 A1: | |||
| 5% 6/1/22 | 1,555,000 | 1,616,845 | |
| 5% 6/1/23 | 1,780,000 | 1,934,353 | |
| 5% 6/1/24 | 1,000,000 | 1,131,168 | |
| Los Angeles Dept. of Wtr. & Pwr. Rev. Series 2021 B, 5% 7/1/51 | 14,995,000 | 19,636,716 | |
| Merced Union High School District Series A, 0% 8/1/21 (Nat'l. Pub. Fin. Guarantee Corp. Insured) | 1,455,000 | 1,455,000 | |
| Poway Unified School District: | |||
| (District #2007-1 School Facilities Proj.) Series 2008 A, 0% 8/1/32 | 1,300,000 | 1,100,436 | |
| Series B: | |||
| 0% 8/1/33 | 4,350,000 | 3,595,073 | |
| 0% 8/1/37 | 8,000,000 | 5,918,848 | |
| 0% 8/1/38 | 4,225,000 | 3,031,512 | |
| 0% 8/1/39 | 7,220,000 | 5,024,839 | |
| 0% 8/1/41 | 4,900,000 | 3,200,087 | |
| Poway Unified School District Pub. Fing. Series 2015 A: | |||
| 5% 9/1/27 | 1,050,000 | 1,239,737 | |
| 5% 9/1/30 | 1,370,000 | 1,591,639 | |
| Riverside Swr. Rev. Series 2015 A: | |||
| 5% 8/1/30 | 2,880,000 | 3,389,507 | |
| 5% 8/1/31 | 1,630,000 | 1,915,537 | |
| Sacramento City Fing. Auth. Rev. Series A, 0% 12/1/26 (Nat'l. Pub. Fin. Guarantee Corp. Insured) | 1,600,000 | 1,519,335 | |
| Sacramento County Arpt. Sys. Rev. Series 2016 B, 5% 7/1/41 | 1,770,000 | 2,126,139 | |
| San Diego Cmnty. College District Series 2011, 0% 8/1/35 | 3,000,000 | 2,393,876 | |
| San Diego Unified School District: | |||
| Series 2008 C: | |||
| 0% 7/1/34 | 1,300,000 | 1,069,902 | |
| 0% 7/1/37 | 5,105,000 | 3,843,012 | |
| Series 2008 E, 0% 7/1/47 (e) | 2,600,000 | 2,609,150 | |
| San Francisco City & County Arpts. Commission Int'l. Arpt. Rev. Series 2019 B, 5% 5/1/49 | 2,930,000 | 3,695,521 | |
| San Jose Fing. Auth. Lease Rev. (Civic Ctr. Proj.) Series 2013 A: | |||
| 5% 6/1/24 (Pre-Refunded to 6/1/23 @ 100) | 1,000,000 | 1,089,456 | |
| 5% 6/1/27 (Pre-Refunded to 6/1/23 @ 100) | 1,000,000 | 1,089,456 | |
| San Marcos Unified School District Series 2010 B, 0% 8/1/47 | 3,700,000 | 2,010,955 | |
| Santa Rosa Wastewtr. Rev. Series 2002 B, 0% 9/1/25 (AMBAC Insured) | 1,700,000 | 1,649,012 | |
| Tobacco Securitization Auth. Southern California Tobacco Settlement Series 2019 A1: | |||
| 5% 6/1/27 | 1,000,000 | 1,249,957 | |
| 5% 6/1/28 | 1,510,000 | 1,938,215 | |
| 5% 6/1/29 | 1,000,000 | 1,314,437 | |
| Univ. of California Revs. Series 2017 AV, 5% 5/15/36 | 1,610,000 | 2,004,279 | |
| Washington Township Health Care District Gen. Oblig. Series 2013 B, 5.5% 8/1/38 | 2,000,000 | 2,251,087 | |
| Yuba City Unified School District Series A, 0% 9/1/22 (Nat'l. Pub. Fin. Guarantee Corp. Insured) | 1,000,000 | 994,114 | |
| TOTAL CALIFORNIA | 216,040,602 | ||
| Colorado - 0.6% | |||
| Arkansas River Pwr. Auth. Rev. Series 2018 A: | |||
| 5% 10/1/38 | 1,450,000 | 1,749,277 | |
| 5% 10/1/43 | 5,810,000 | 6,941,433 | |
| Colorado Health Facilities Auth.: | |||
| (Parkview Episcopal Med. Ctr., Co. Proj.) Series 2017: | |||
| 5% 9/1/23 | 270,000 | 295,265 | |
| 5% 9/1/24 | 225,000 | 255,542 | |
| 5% 9/1/25 | 260,000 | 305,461 | |
| 5% 9/1/28 | 2,200,000 | 2,709,998 | |
| (Parkview Med. Ctr., Inc. Proj.) Series 2016, 5% 9/1/46 | 3,700,000 | 4,272,283 | |
| Series 2019 A, 4% 11/1/39 | 2,980,000 | 3,574,976 | |
| Series 2019 A2, 4% 8/1/49 | 2,900,000 | 3,364,977 | |
| Colorado Hsg. & Fin. Auth. Series 2019 H, 4.25% 11/1/49 | 1,110,000 | 1,245,243 | |
| Colorado Univ. Co. Hosp. Auth. Rev. Bonds Series 2017C-2, 5%, tender 3/1/22 (a) | 3,825,000 | 3,839,411 | |
| TOTAL COLORADO | 28,553,866 | ||
| Connecticut - 2.6% | |||
| Connecticut Gen. Oblig.: | |||
| Series 2015 B, 5% 6/15/32 | 1,550,000 | 1,807,907 | |
| Series 2016 E: | |||
| 5% 10/15/26 | 2,030,000 | 2,505,416 | |
| 5% 10/15/29 | 2,930,000 | 3,592,843 | |
| Series 2018 F: | |||
| 5% 9/15/25 | 1,950,000 | 2,324,451 | |
| 5% 9/15/27 | 1,000,000 | 1,267,926 | |
| 5% 9/15/28 | 4,500,000 | 5,852,965 | |
| Series 2020 A: | |||
| 4% 1/15/33 | 8,435,000 | 10,371,814 | |
| 4% 1/15/34 | 7,005,000 | 8,586,117 | |
| 5% 1/15/40 | 2,765,000 | 3,573,576 | |
| Connecticut Health & Edl. Facilities Auth. Rev.: | |||
| (Sacred Heart Univ., CT. Proj.) Series 2017 I-1: | |||
| 5% 7/1/34 | 1,050,000 | 1,268,719 | |
| 5% 7/1/35 | 1,200,000 | 1,448,219 | |
| 5% 7/1/36 | 400,000 | 481,792 | |
| 5% 7/1/37 | 1,555,000 | 1,869,283 | |
| 5% 7/1/42 | 3,780,000 | 4,524,158 | |
| Bonds Series 2020 B: | |||
| 5%, tender 1/1/25 (a) | 4,450,000 | 5,126,393 | |
| 5%, tender 1/1/27 (a) | 4,710,000 | 5,775,754 | |
| Series 2016 K, 4% 7/1/46 | 4,465,000 | 4,878,754 | |
| Series 2017 B, 5% 7/1/29 | 9,780,000 | 12,970,101 | |
| Series 2019 A: | |||
| 5% 7/1/34 (c) | 1,325,000 | 1,437,010 | |
| 5% 7/1/49 (c) | 2,040,000 | 2,158,025 | |
| Series 2020 A, 4% 7/1/39 | 3,000,000 | 3,540,042 | |
| Series 2020 C, 4% 7/1/45 | 4,220,000 | 4,917,562 | |
| Series 2020 K: | |||
| 5% 7/1/37 | 1,000,000 | 1,292,583 | |
| 5% 7/1/38 | 1,500,000 | 1,934,501 | |
| 5% 7/1/39 | 1,550,000 | 1,994,277 | |
| 5% 7/1/44 (c) | 1,295,000 | 1,574,014 | |
| Series G, 5% 7/1/50 (c) | 1,100,000 | 1,328,975 | |
| Series K1: | |||
| 5% 7/1/31 | 1,500,000 | 1,790,556 | |
| 5% 7/1/35 | 1,280,000 | 1,509,721 | |
| Series N: | |||
| 4% 7/1/39 | 1,235,000 | 1,406,694 | |
| 4% 7/1/49 | 1,475,000 | 1,653,752 | |
| 5% 7/1/32 | 550,000 | 684,353 | |
| 5% 7/1/33 | 500,000 | 619,899 | |
| 5% 7/1/34 | 250,000 | 309,062 | |
| Connecticut Hsg. Fin. Auth. Series 2019 B1, 4% 5/15/49 | 1,490,000 | 1,691,397 | |
| Connecticut State Revolving Fund Gen. Rev. Series 2017 A: | |||
| 5% 5/1/33 | 3,125,000 | 3,863,485 | |
| 5% 5/1/35 | 2,325,000 | 2,864,227 | |
| Hbr. Point Infrastructure Impt. District Series 2017: | |||
| 5% 4/1/30 (c) | 2,430,000 | 2,876,242 | |
| 5% 4/1/39 (c) | 3,125,000 | 3,635,256 | |
| New Haven Gen. Oblig. Series 2016 A, 5% 8/15/25 (FSA Insured) | 570,000 | 673,205 | |
| Univ. of Connecticut Gen. Oblig. Series 2019 A: | |||
| 5% 11/1/25 | 1,020,000 | 1,216,025 | |
| 5% 11/1/26 | 1,735,000 | 2,134,156 | |
| TOTAL CONNECTICUT | 125,331,207 | ||
| Delaware - 0.3% | |||
| Delaware Trans. Auth. (U.S. 301 Proj.) Series 2015, 5% 6/1/55 | 13,000,000 | 14,994,353 | |
| District Of Columbia - 0.9% | |||
| District of Columbia Gen. Oblig. Series 2017 A, 5% 6/1/33 | 2,300,000 | 2,855,137 | |
| District of Columbia Hosp. Rev. Series 2015: | |||
| 5% 7/15/29 | 4,000,000 | 4,764,224 | |
| 5% 7/15/30 | 6,495,000 | 7,729,611 | |
| Metropolitan Washington Arpts. Auth. Dulles Toll Road Rev. (Dulles Metrorail and Cap. Impt. Projs.) Series 2019 A: | |||
| 5% 10/1/33 | 1,250,000 | 1,573,765 | |
| 5% 10/1/34 | 2,000,000 | 2,513,510 | |
| 5% 10/1/36 | 2,000,000 | 2,508,289 | |
| Metropolitan Washington DC Arpts. Auth. Sys. Rev. Series 2019 B: | |||
| 5% 10/1/21 | 3,490,000 | 3,517,642 | |
| 5% 10/1/23 | 2,250,000 | 2,487,155 | |
| 5% 10/1/25 | 2,310,000 | 2,758,922 | |
| Washington Convention & Sports Auth. Series 2018 A: | |||
| 5% 10/1/22 | 3,210,000 | 3,389,761 | |
| 5% 10/1/22 | 2,040,000 | 2,153,260 | |
| Washington D.C. Metropolitan Transit Auth. Rev. Series 2017 B, 5% 7/1/33 | 4,545,000 | 5,626,608 | |
| TOTAL DISTRICT OF COLUMBIA | 41,877,884 | ||
| Florida - 6.9% | |||
| Brevard County School Board Ctfs. of Prtn.: | |||
| Series 2014, 5% 7/1/27 | 1,700,000 | 1,929,205 | |
| Series 2015 C, 5% 7/1/27 | 1,455,000 | 1,709,464 | |
| Broward County Arpt. Sys. Rev. Series 2012 P-2, 5% 10/1/21 | 1,630,000 | 1,642,964 | |
| Broward County School Board Ctfs. of Prtn.: | |||
| (Broward County School District Proj.) Series 2016 A, 5% 7/1/28 | 1,595,000 | 1,940,351 | |
| Series 2012 A, 5% 7/1/24 | 4,345,000 | 4,532,120 | |
| Series 2015 A: | |||
| 5% 7/1/24 | 940,000 | 1,067,030 | |
| 5% 7/1/26 | 3,635,000 | 4,290,885 | |
| Series 2016, 5% 7/1/32 | 1,020,000 | 1,223,292 | |
| Cap. Projs. Fin. Auth. Student Hsg. Rev. (Cap. Projs. Ln. Prog. - Florida Univs.) Series 2020 A, 5% 10/1/29 | 1,650,000 | 2,092,008 | |
| Central Florida Expressway Auth. Sr. Lien Rev. Series 2021: | |||
| 4% 7/1/34 (FSA Insured) | 4,250,000 | 5,325,258 | |
| 4% 7/1/35 (FSA Insured) | 4,120,000 | 5,152,360 | |
| 4% 7/1/37 (FSA Insured) | 4,575,000 | 5,680,447 | |
| 4% 7/1/38 (FSA Insured) | 2,860,000 | 3,539,052 | |
| 4% 7/1/39 (FSA Insured) | 2,305,000 | 2,844,710 | |
| Duval County School Board Ctfs. of Prtn. Series 2015 B, 5% 7/1/29 | 6,380,000 | 7,441,738 | |
| Escambia County Health Facilities Auth. Health Facilities Rev. Series 2020 A, 4% 8/15/45 | 2,390,000 | 2,794,489 | |
| Florida Higher Edl. Facilities Fing. Auth.: | |||
| (St. Leo Univ. Proj.) Series 2019, 5% 3/1/49 | 4,800,000 | 5,568,093 | |
| Series 2019, 5% 10/1/27 | 650,000 | 801,908 | |
| Florida Hsg. Fin. Corp. Rev. Series 2019 1, 4% 7/1/50 | 4,400,000 | 4,896,587 | |
| Florida Mid-Bay Bridge Auth. Rev.: | |||
| Series 2015 A, 5% 10/1/35 | 2,600,000 | 2,983,239 | |
| Series 2015 C, 5% 10/1/35 | 2,000,000 | 2,277,384 | |
| Florida Muni. Pwr. Agcy. Rev.: | |||
| (Pwr. Supply Proj.) Series 2017 A, 5% 10/1/28 | 400,000 | 518,251 | |
| (Requirements Pwr. Supply Proj.) Series 2016 A: | |||
| 5% 10/1/30 | 985,000 | 1,198,702 | |
| 5% 10/1/31 | 1,075,000 | 1,309,026 | |
| (St. Lucie Proj.) Series 2012 A, 5% 10/1/26 | 1,125,000 | 1,187,659 | |
| Series 2015 B, 5% 10/1/29 | 1,250,000 | 1,478,335 | |
| Gainesville Utils. Sys. Rev. Series 2017 A: | |||
| 5% 10/1/30 | 2,810,000 | 3,535,214 | |
| 5% 10/1/35 | 5,000,000 | 6,230,911 | |
| Halifax Hosp. Med. Ctr. Rev. Series 2015: | |||
| 4% 6/1/27 | 585,000 | 657,831 | |
| 5% 6/1/24 | 835,000 | 943,518 | |
| 5% 6/1/28 | 655,000 | 761,936 | |
| Hillsborough County Aviation Auth. Rev. Series 2018 F, 5% 10/1/48 | 2,500,000 | 3,142,270 | |
| Hillsborough County School Board Ctfs. of Prtn. Series 2015 A, 5% 7/1/26 | 8,000,000 | 9,422,978 | |
| Indian River County School Board Ctfs. of Prtn. Series 2014, 5% 7/1/24 | 2,600,000 | 2,927,909 | |
| Jacksonville Health Care Facilities (Baptist Med. Ctr. Proj.) Series 2017: | |||
| 5% 8/15/26 | 2,000,000 | 2,431,087 | |
| 5% 8/15/34 | 2,750,000 | 3,362,027 | |
| Jacksonville Sales Tax Rev. Series 2012, 5% 10/1/25 | 2,250,000 | 2,378,996 | |
| Lake County School Board Ctfs. of Prtn. Series 2014 A, 5% 6/1/29 (Pre-Refunded to 6/1/24 @ 100) | 1,500,000 | 1,703,377 | |
| Miami Beach Health Facilities Auth. Hosp. Rev. Series 2014 A, 5% 11/15/39 | 1,530,000 | 1,704,318 | |
| Miami-Dade County Aviation Rev.: | |||
| Series 2014 A, 5% 10/1/37 | 8,500,000 | 9,693,850 | |
| Series 2014 B, 5% 10/1/34 | 2,225,000 | 2,542,793 | |
| Series 2016 A, 5% 10/1/41 | 8,500,000 | 10,295,496 | |
| Series 2020 A: | |||
| 4% 10/1/35 | 1,600,000 | 1,949,532 | |
| 4% 10/1/41 | 1,200,000 | 1,438,577 | |
| 5% 10/1/31 | 2,140,000 | 2,839,542 | |
| Miami-Dade County Cap. Asset Acquisition Series 2012 A, 5% 10/1/24 (Pre-Refunded to 10/1/22 @ 100) | 1,000,000 | 1,057,209 | |
| Miami-Dade County Expressway Auth.: | |||
| Series 2010 A, 5% 7/1/40 | 3,300,000 | 3,310,012 | |
| Series 2014 A: | |||
| 5% 7/1/25 | 1,430,000 | 1,625,485 | |
| 5% 7/1/27 | 1,000,000 | 1,134,202 | |
| 5% 7/1/28 | 2,225,000 | 2,514,587 | |
| 5% 7/1/29 | 1,010,000 | 1,141,453 | |
| 5% 7/1/44 | 18,800,000 | 21,003,089 | |
| Series 2014 B, 5% 7/1/30 | 2,500,000 | 2,825,379 | |
| Miami-Dade County Gen. Oblig. (Bldg. Better Cmntys. Prog.) Series 2016 A: | |||
| 5% 7/1/27 | 9,895,000 | 12,447,777 | |
| 5% 7/1/28 | 10,385,000 | 13,414,188 | |
| Miami-Dade County School Board Ctfs. of Prtn.: | |||
| Series 2014 D, 5% 11/1/25 | 6,655,000 | 7,656,373 | |
| Series 2015 A, 5% 5/1/29 | 12,370,000 | 14,345,346 | |
| Series 2015 B, 5% 5/1/27 | 2,980,000 | 3,472,731 | |
| Series 2016 A, 5% 5/1/32 | 10,000,000 | 11,925,657 | |
| Series 2016 B, 5% 8/1/26 | 4,505,000 | 5,477,170 | |
| Miami-Dade County Transit Sales Surtax Rev. Series 2012, 5% 7/1/22 | 765,000 | 798,089 | |
| Orange County Health Facilities Auth.: | |||
| Series 2012 A, 5% 10/1/42 (Pre-Refunded to 4/1/22 @ 100) | 6,315,000 | 6,519,444 | |
| Series 2012 B, 5% 10/1/42 (Pre-Refunded to 4/1/22 @ 100) | 2,500,000 | 2,580,936 | |
| Orange County School Board Ctfs. of Prtn. Series 2015 C, 5% 8/1/28 (Pre-Refunded to 8/1/25 @ 100) | 5,000,000 | 5,930,205 | |
| Orlando & Orange County Expressway Auth. Rev. Series 2012, 5% 7/1/23 (Pre-Refunded to 7/1/22 @ 100) | 1,150,000 | 1,201,195 | |
| Palm Beach County School Board Ctfs. of Prtn.: | |||
| Series 2015 D: | |||
| 5% 8/1/28 | 1,980,000 | 2,339,769 | |
| 5% 8/1/29 | 6,765,000 | 7,970,631 | |
| Series 2018 A, 5% 8/1/24 | 760,000 | 867,929 | |
| Pinellas County Idr (Drs. Kiran & Pallavi Patel 2017 Foundation for Global Understanding, Inc. Proj.) Series 2019: | |||
| 5% 7/1/29 | 200,000 | 233,695 | |
| 5% 7/1/39 | 400,000 | 484,787 | |
| Saint Lucie County School Board Ctfs. of Prtn. Series 2013 A, 5% 7/1/26 | 2,515,000 | 2,735,465 | |
| South Florida Wtr. Mgmt. District Ctfs. of Prtn. Series 2015: | |||
| 5% 10/1/27 | 500,000 | 602,224 | |
| 5% 10/1/28 | 4,000,000 | 4,805,521 | |
| 5% 10/1/30 | 2,000,000 | 2,390,543 | |
| 5% 10/1/32 | 3,310,000 | 3,952,991 | |
| South Miami Health Facilities Auth. Hosp. Rev. (Baptist Med. Ctr., FL. Proj.) Series 2017: | |||
| 5% 8/15/29 | 1,480,000 | 1,855,339 | |
| 5% 8/15/32 | 3,920,000 | 4,892,191 | |
| 5% 8/15/35 | 705,000 | 877,148 | |
| 5% 8/15/37 | 5,000,000 | 6,203,638 | |
| 5% 8/15/42 | 3,400,000 | 4,206,390 | |
| 5% 8/15/47 | 5,200,000 | 6,415,068 | |
| Tallahassee Health Facilities Rev.: | |||
| (Tallahassee Memorial Healthcare, Inc. Proj.) Series 2016 A: | |||
| 5% 12/1/21 | 35,000 | 35,541 | |
| 5% 12/1/29 | 1,425,000 | 1,671,051 | |
| 5% 12/1/36 | 1,100,000 | 1,273,987 | |
| Series 2015 A, 5% 12/1/40 | 1,000,000 | 1,135,315 | |
| Tampa Tax Allocation (H. Lee Moffitt Cancer Ctr. Proj.) Series 2012 A, 5% 9/1/25 | 900,000 | 942,889 | |
| Volusia County Edl. Facilities Auth. Rev. (Embry-Riddle Aeronautical Univ., Inc. Proj.) Series 2020 A: | |||
| 5% 10/15/44 | 760,000 | 948,742 | |
| 5% 10/15/49 | 1,420,000 | 1,763,158 | |
| Volusia County School Board Ctfs. of Prtn.: | |||
| (Florida Master Lease Prog.) Series 2016 A: | |||
| 5% 8/1/30 (Build America Mutual Assurance Insured) | 1,160,000 | 1,380,708 | |
| 5% 8/1/31 (Build America Mutual Assurance Insured) | 2,215,000 | 2,631,030 | |
| (Master Lease Prog.) Series 2014 B, 5% 8/1/22 | 810,000 | 849,296 | |
| TOTAL FLORIDA | 327,232,292 | ||
| Georgia - 3.1% | |||
| Brookhaven Dev. Auth. Rev. Series 2019 A, 5% 7/1/36 | 1,520,000 | 1,971,287 | |
| Burke County Indl. Dev. Auth. Poll. Cont. Rev. Bonds (Georgia Pwr. Co. Plant Vogtle Proj.): | |||
| Series 1995 5, 2.05%, tender 11/19/21 (a) | 2,725,000 | 2,739,396 | |
| Series 2013 1st, 2.925%, tender 3/12/24 (a) | 9,600,000 | 10,226,029 | |
| Colquitt County Dev. Auth. Rev. Series C, 0% 12/1/21 (Escrowed to Maturity) | 3,000,000 | 2,999,115 | |
| Coweta County Dev. Auth. Rev. (Piedmont Healthcare, Inc. Proj.) Series 2019 A, 5% 7/1/44 | 6,440,000 | 8,188,546 | |
| DeKalb County Wtr. & Swr. Rev. Series 2011 A, 5.25% 10/1/36 | 1,000,000 | 1,008,174 | |
| DeKalb Private Hosp. Auth. Rev. Series 2019 B, 5% 7/1/35 | 1,360,000 | 1,770,678 | |
| Fulton County Dev. Auth. Rev.: | |||
| Series 2019 C, 5% 7/1/38 | 1,230,000 | 1,587,865 | |
| Series 2019: | |||
| 4% 6/15/49 | 1,180,000 | 1,382,392 | |
| 5% 6/15/52 | 4,315,000 | 5,425,639 | |
| Fulton County Wtr. & Swr. Rev. Series 2013, 5% 1/1/32 | 10,000,000 | 10,663,055 | |
| Georgia Muni. Elec. Auth. Pwr. Rev.: | |||
| Series 2019 A: | |||
| 4% 1/1/49 | 6,100,000 | 6,974,979 | |
| 5% 1/1/30 | 415,000 | 531,938 | |
| 5% 1/1/32 | 935,000 | 1,187,124 | |
| 5% 1/1/34 | 1,920,000 | 2,422,947 | |
| 5% 1/1/35 | 925,000 | 1,164,801 | |
| 5% 1/1/36 | 1,140,000 | 1,431,128 | |
| 5% 1/1/37 | 1,115,000 | 1,396,382 | |
| 5% 1/1/38 | 1,150,000 | 1,436,524 | |
| 5% 1/1/44 | 2,990,000 | 3,693,720 | |
| Series C, 5% 1/1/22 | 2,900,000 | 2,957,129 | |
| Series GG, 5% 1/1/23 | 1,600,000 | 1,707,842 | |
| Georgia Muni. Gas Auth. Rev. (Gas Portfolio III Proj.): | |||
| Series R, 5% 10/1/21 | 1,225,000 | 1,234,561 | |
| Series S, 5% 10/1/24 | 1,575,000 | 1,662,351 | |
| Hosp. Auth. of Savannah Auth. Rev. Series 2019 A: | |||
| 4% 7/1/35 | 4,895,000 | 5,785,614 | |
| 4% 7/1/39 | 2,500,000 | 2,927,048 | |
| 4% 7/1/43 | 2,615,000 | 3,037,270 | |
| Main Street Natural Gas, Inc. Bonds: | |||
| Series 2018 C, 4%, tender 12/1/23 (a) | 24,120,000 | 26,030,410 | |
| Series 2019 B, 4%, tender 12/2/24 (a) | 6,040,000 | 6,719,299 | |
| Monroe County Dev. Auth. Poll. Cont. Rev. Bonds (Georgia Pwr. Co. Plant Scherer Proj.) Series 2009 1, 2.05%, tender 11/19/21 (a) | 2,750,000 | 2,764,529 | |
| Private Colleges & Univs. Auth. Rev.: | |||
| (The Savannah College of Art and Design Projs.) Series 2014: | |||
| 5% 4/1/28 | 2,560,000 | 2,856,609 | |
| 5% 4/1/44 | 9,105,000 | 9,968,853 | |
| Series 2020 B: | |||
| 5% 9/1/25 | 3,555,000 | 4,228,775 | |
| 5% 9/1/31 | 1,125,000 | 1,517,510 | |
| 5% 9/1/33 | 2,500,000 | 3,350,568 | |
| TOTAL GEORGIA | 144,950,087 | ||
| Hawaii - 0.2% | |||
| Hawaii Gen. Oblig.: | |||
| Series 2017 FK, 5% 5/1/33 | 4,200,000 | 5,192,523 | |
| Series 2020 C: | |||
| 4% 7/1/37 | 1,100,000 | 1,345,748 | |
| 4% 7/1/38 | 1,250,000 | 1,525,712 | |
| TOTAL HAWAII | 8,063,983 | ||
| Idaho - 0.3% | |||
| Idaho Health Facilities Auth. Rev. Series 2015 ID: | |||
| 5% 12/1/24 | 500,000 | 578,989 | |
| 5.5% 12/1/26 | 1,200,000 | 1,431,112 | |
| 5.5% 12/1/27 | 3,250,000 | 3,867,729 | |
| Idaho Hsg. & Fin. Assoc. Single Family Mtg.: | |||
| (Idaho St Garvee Proj.) Series 2017 A: | |||
| 5% 7/15/22 | 1,850,000 | 1,935,041 | |
| 5% 7/15/23 | 880,000 | 962,674 | |
| 5% 7/15/24 | 705,000 | 802,366 | |
| 5% 7/15/25 | 705,000 | 831,209 | |
| 5% 7/15/26 | 500,000 | 608,442 | |
| 5% 7/15/27 | 1,765,000 | 2,211,032 | |
| Series 2019 A, 4% 1/1/50 | 525,000 | 585,389 | |
| TOTAL IDAHO | 13,813,983 | ||
| Illinois - 16.7% | |||
| Chicago Board of Ed.: | |||
| Series 1998 B1, 0% 12/1/21 (Nat'l. Pub. Fin. Guarantee Corp. Insured) | 1,505,000 | 1,502,766 | |
| Series 1999 A, 5.25% 12/1/21 (Nat'l. Pub. Fin. Guarantee Corp. Insured) | 1,160,000 | 1,178,000 | |
| Series 2011 A: | |||
| 5% 12/1/41 | 1,865,000 | 1,891,314 | |
| 5.25% 12/1/41 | 1,510,000 | 1,532,538 | |
| 5.5% 12/1/39 | 2,700,000 | 2,742,958 | |
| Series 2012 A, 5% 12/1/42 | 2,815,000 | 2,951,999 | |
| Series 2015 C, 5.25% 12/1/39 | 800,000 | 899,760 | |
| Series 2016 B, 6.5% 12/1/46 | 400,000 | 502,312 | |
| Series 2017 A, 7% 12/1/46 (c) | 1,400,000 | 1,862,342 | |
| Series 2017 C: | |||
| 5% 12/1/22 | 1,370,000 | 1,452,680 | |
| 5% 12/1/23 | 2,730,000 | 3,011,460 | |
| 5% 12/1/24 | 1,840,000 | 2,104,182 | |
| 5% 12/1/25 | 2,830,000 | 3,339,991 | |
| 5% 12/1/26 | 500,000 | 607,444 | |
| Series 2017 D: | |||
| 5% 12/1/24 | 1,805,000 | 2,064,156 | |
| 5% 12/1/31 | 1,955,000 | 2,408,534 | |
| Series 2017 H, 5% 12/1/36 | 440,000 | 536,740 | |
| Series 2018 A: | |||
| 5% 12/1/24 | 1,590,000 | 1,818,287 | |
| 5% 12/1/29 | 4,445,000 | 5,635,908 | |
| 5% 12/1/31 | 850,000 | 1,073,623 | |
| Series 2018 C, 5% 12/1/46 | 8,695,000 | 10,710,996 | |
| Series 2019 A: | |||
| 5% 12/1/25 | 2,500,000 | 2,950,522 | |
| 5% 12/1/26 | 2,100,000 | 2,551,263 | |
| 5% 12/1/29 | 3,095,000 | 4,024,116 | |
| 5% 12/1/30 | 4,045,000 | 5,227,372 | |
| 5% 12/1/32 | 1,700,000 | 2,183,807 | |
| Series 2021 A: | |||
| 5% 12/1/37 | 360,000 | 465,164 | |
| 5% 12/1/38 | 1,075,000 | 1,386,094 | |
| 5% 12/1/39 | 4,500,000 | 5,789,194 | |
| Chicago Gen. Oblig. Series 2020 A: | |||
| 5% 1/1/26 | 1,660,000 | 1,963,498 | |
| 5% 1/1/27 | 7,650,000 | 9,308,284 | |
| 5% 1/1/28 | 700,000 | 873,594 | |
| 5% 1/1/29 | 3,860,000 | 4,926,030 | |
| 5% 1/1/30 | 7,450,000 | 9,692,329 | |
| Chicago Midway Arpt. Rev. Series 2016 B: | |||
| 4% 1/1/35 | 815,000 | 921,117 | |
| 5% 1/1/36 | 4,500,000 | 5,310,016 | |
| 5% 1/1/37 | 5,300,000 | 6,252,086 | |
| 5% 1/1/41 | 6,000,000 | 7,086,521 | |
| 5% 1/1/46 | 8,470,000 | 9,989,087 | |
| Chicago O'Hare Int'l. Arpt. Rev.: | |||
| Series 2013 D, 5% 1/1/27 | 5,175,000 | 5,525,327 | |
| Series 2016 B, 5% 1/1/34 | 2,835,000 | 3,361,797 | |
| Series 2016 C: | |||
| 5% 1/1/32 | 4,750,000 | 5,638,365 | |
| 5% 1/1/33 | 1,305,000 | 1,547,701 | |
| 5% 1/1/34 | 1,510,000 | 1,790,587 | |
| Series 2016 D, 5% 1/1/52 | 7,075,000 | 8,538,579 | |
| Series 2017 B: | |||
| 5% 1/1/34 | 1,515,000 | 1,849,209 | |
| 5% 1/1/35 | 2,540,000 | 3,095,267 | |
| 5% 1/1/36 | 1,650,000 | 2,006,007 | |
| 5% 1/1/37 | 6,400,000 | 7,766,669 | |
| 5% 1/1/38 | 2,250,000 | 2,727,792 | |
| 5% 1/1/39 | 5,000,000 | 6,055,421 | |
| Series 2018 B, 5% 1/1/53 | 1,125,000 | 1,392,498 | |
| Chicago Transit Auth.: | |||
| Series 2014, 5.25% 12/1/49 | 12,000,000 | 13,869,418 | |
| Series 2017, 5% 12/1/46 | 1,900,000 | 2,285,803 | |
| Chicago Transit Auth. Cap. Grant Receipts Rev. Series 2017: | |||
| 5% 6/1/22 | 980,000 | 1,019,100 | |
| 5% 6/1/23 | 880,000 | 956,684 | |
| 5% 6/1/24 | 1,495,000 | 1,696,552 | |
| 5% 6/1/25 | 745,000 | 877,777 | |
| 5% 6/1/26 | 1,595,000 | 1,935,323 | |
| Chicago Wtr. Rev. Series 2017, 5.25% 11/1/33 (FSA Insured) | 445,000 | 446,543 | |
| Cook County Forest Preservation District Series 2012 C, 5% 12/15/22 | 1,230,000 | 1,280,952 | |
| Cook County Gen. Oblig.: | |||
| Series 2011 A, 5.25% 11/15/28 | 1,625,000 | 1,648,200 | |
| Series 2012 C: | |||
| 5% 11/15/23 | 4,375,000 | 4,644,908 | |
| 5% 11/15/24 | 3,500,000 | 3,715,798 | |
| 5% 11/15/25 (FSA Insured) | 5,800,000 | 6,158,906 | |
| Series 2016 A, 5% 11/15/29 | 6,110,000 | 7,404,438 | |
| Grundy & Will Counties Cmnty. School Gen. Oblig. Series 2018, 5% 2/1/29 | 675,000 | 825,498 | |
| Illinois Dev. Fin. Auth. Retirement Hsg. Regency Park Rev. Series 1991 A, 0% 7/15/23 (Escrowed to Maturity) | 5,600,000 | 5,566,276 | |
| Illinois Fin. Auth. Academic Facilities (Provident Group UIUC Properties LLC Univ. of Illinois at Urbana-Champaign Proj.) Series 2019 A: | |||
| 5% 10/1/31 | 200,000 | 259,490 | |
| 5% 10/1/32 | 290,000 | 375,191 | |
| 5% 10/1/33 | 500,000 | 644,920 | |
| 5% 10/1/35 | 300,000 | 385,271 | |
| 5% 10/1/36 | 300,000 | 384,476 | |
| 5% 10/1/37 | 350,000 | 447,384 | |
| 5% 10/1/38 | 375,000 | 478,336 | |
| 5% 10/1/39 | 645,000 | 820,939 | |
| Illinois Fin. Auth. Rev.: | |||
| (Bradley Univ. Proj.) Series 2017 C, 5% 8/1/31 | 2,360,000 | 2,812,259 | |
| (Depaul Univ. Proj.) Series 2016 A: | |||
| 4% 10/1/31 | 1,480,000 | 1,710,210 | |
| 5% 10/1/33 | 1,500,000 | 1,809,234 | |
| (Northwestern Memorial Hosp.,IL. Proj.) Series 2017 A: | |||
| 5% 7/15/25 | 795,000 | 939,723 | |
| 5% 7/15/27 | 1,300,000 | 1,634,571 | |
| 5% 7/15/30 | 1,490,000 | 1,876,595 | |
| (OSF Healthcare Sys.) Series 2018 A: | |||
| 4.125% 5/15/47 | 11,085,000 | 12,861,765 | |
| 5% 5/15/43 | 10,000,000 | 12,382,247 | |
| (Presence Health Proj.) Series 2016 C: | |||
| 5% 2/15/26 | 1,425,000 | 1,723,629 | |
| 5% 2/15/29 | 3,455,000 | 4,263,269 | |
| 5% 2/15/36 | 2,390,000 | 2,914,155 | |
| (Rosalind Franklin Univ. Research Bldg. Proj.) Series 2017 C, 5% 8/1/49 | 490,000 | 576,147 | |
| (Rush Univ. Med. Ctr. Proj.) Series 2015 A, 5% 11/15/34 | 1,200,000 | 1,390,462 | |
| Bonds Series 2017 B, 5%, tender 12/15/22 (a) | 3,045,000 | 3,246,415 | |
| Series 2012 A, 5% 5/15/23 (Pre-Refunded to 5/15/22 @ 100) | 700,000 | 726,850 | |
| Series 2012: | |||
| 4% 9/1/32 | 3,020,000 | 3,138,962 | |
| 5% 9/1/22 | 800,000 | 842,497 | |
| 5% 9/1/32 | 4,000,000 | 4,208,455 | |
| 5% 9/1/38 | 5,400,000 | 5,675,380 | |
| 5% 11/15/43 (Pre-Refunded to 11/15/22 @ 100) | 1,640,000 | 1,740,400 | |
| Series 2013: | |||
| 4% 5/15/33 (Pre-Refunded to 5/15/22 @ 100) | 1,055,000 | 1,085,515 | |
| 5% 11/15/24 | 1,115,000 | 1,182,192 | |
| 5% 11/15/27 | 400,000 | 423,571 | |
| Series 2015 A: | |||
| 5% 11/15/31 | 3,500,000 | 4,125,728 | |
| 5% 11/15/45 | 9,750,000 | 11,421,092 | |
| Series 2015 B, 5% 11/15/23 | 1,845,000 | 2,041,067 | |
| Series 2015 C: | |||
| 5% 8/15/35 | 3,340,000 | 3,895,148 | |
| 5% 8/15/44 | 15,400,000 | 17,826,741 | |
| Series 2016 A: | |||
| 5% 7/1/33 | 1,850,000 | 2,202,012 | |
| 5% 7/1/34 | 1,000,000 | 1,188,164 | |
| 5% 8/15/34 (Pre-Refunded to 8/15/26 @ 100) | 1,800,000 | 2,202,113 | |
| 5% 7/1/36 | 1,530,000 | 1,812,250 | |
| 5.25% 8/15/29 (Pre-Refunded to 8/15/26 @ 100) | 1,015,000 | 1,254,344 | |
| Series 2016 B: | |||
| 5% 8/15/30 | 3,000,000 | 3,701,984 | |
| 5% 8/15/33 | 4,585,000 | 5,634,415 | |
| 5% 8/15/34 | 2,415,000 | 2,963,102 | |
| Series 2016 C: | |||
| 3.75% 2/15/34 | 725,000 | 825,410 | |
| 4% 2/15/36 | 3,085,000 | 3,552,345 | |
| 4% 2/15/41 | 9,155,000 | 10,458,852 | |
| 4% 2/15/41 (Pre-Refunded to 2/15/27 @ 100) | 420,000 | 495,346 | |
| 5% 2/15/22 | 3,600,000 | 3,694,953 | |
| 5% 2/15/24 | 325,000 | 365,163 | |
| 5% 2/15/30 | 13,250,000 | 16,326,431 | |
| 5% 2/15/31 | 2,080,000 | 2,557,764 | |
| 5% 2/15/41 | 3,475,000 | 4,216,766 | |
| Series 2016: | |||
| 4% 2/15/41 (Pre-Refunded to 2/15/27 @ 100) | 20,000 | 23,588 | |
| 5% 12/1/29 | 1,030,000 | 1,248,024 | |
| 5% 12/1/46 | 2,660,000 | 3,153,482 | |
| Series 2017 A, 5% 8/1/47 | 430,000 | 506,002 | |
| Series 2017: | |||
| 5% 1/1/28 | 3,075,000 | 3,817,462 | |
| 5% 7/1/28 | 2,745,000 | 3,408,054 | |
| 5% 7/1/33 | 3,365,000 | 4,131,610 | |
| 5% 7/1/34 | 2,765,000 | 3,391,188 | |
| 5% 7/1/35 | 2,290,000 | 2,806,839 | |
| Series 2018 A: | |||
| 4.25% 1/1/44 | 1,895,000 | 2,195,160 | |
| 5% 1/1/44 | 11,470,000 | 13,901,598 | |
| Series 2019: | |||
| 4% 9/1/37 | 400,000 | 464,247 | |
| 4% 9/1/39 | 1,000,000 | 1,154,129 | |
| 5% 9/1/30 | 190,000 | 244,075 | |
| 5% 9/1/38 | 900,000 | 1,124,810 | |
| Illinois Gen. Oblig.: | |||
| Series 2006, 5.5% 1/1/31 | 1,945,000 | 2,655,040 | |
| Series 2012 A: | |||
| 4% 1/1/23 | 1,220,000 | 1,239,142 | |
| 5% 1/1/33 | 1,700,000 | 1,734,085 | |
| Series 2012: | |||
| 5% 8/1/21 | 1,695,000 | 1,695,000 | |
| 5% 3/1/23 | 1,500,000 | 1,541,197 | |
| 5% 8/1/23 | 1,675,000 | 1,830,370 | |
| 5% 3/1/36 | 1,000,000 | 1,027,524 | |
| Series 2013 A, 5% 4/1/35 | 900,000 | 957,699 | |
| Series 2013: | |||
| 5% 7/1/22 | 320,000 | 333,965 | |
| 5.5% 7/1/38 | 2,000,000 | 2,163,645 | |
| Series 2014: | |||
| 5% 2/1/23 | 1,880,000 | 2,012,535 | |
| 5% 4/1/24 | 3,945,000 | 4,424,852 | |
| 5% 2/1/25 | 2,245,000 | 2,498,093 | |
| 5% 2/1/27 | 1,225,000 | 1,359,865 | |
| 5% 4/1/28 | 580,000 | 647,922 | |
| 5% 5/1/28 | 3,325,000 | 3,716,797 | |
| 5% 5/1/32 | 1,400,000 | 1,558,067 | |
| 5% 5/1/33 | 1,600,000 | 1,778,799 | |
| 5.25% 2/1/29 | 3,000,000 | 3,350,427 | |
| 5.25% 2/1/30 | 2,700,000 | 3,016,099 | |
| 5.25% 2/1/31 | 1,305,000 | 1,456,744 | |
| Series 2016: | |||
| 5% 2/1/23 | 880,000 | 942,037 | |
| 5% 6/1/25 | 4,465,000 | 5,218,396 | |
| 5% 2/1/26 | 1,000,000 | 1,193,499 | |
| 5% 6/1/26 | 610,000 | 734,027 | |
| 5% 2/1/27 | 3,745,000 | 4,579,676 | |
| 5% 2/1/28 | 3,495,000 | 4,245,856 | |
| 5% 2/1/29 | 3,285,000 | 3,971,001 | |
| Series 2017 A: | |||
| 5% 12/1/23 | 1,100,000 | 1,218,202 | |
| 5% 12/1/26 | 3,350,000 | 4,079,948 | |
| Series 2017 D, 5% 11/1/25 | 16,310,000 | 19,320,464 | |
| Series 2018 A: | |||
| 5% 10/1/26 | 1,500,000 | 1,820,905 | |
| 5% 10/1/28 | 3,500,000 | 4,435,835 | |
| Series 2019 B: | |||
| 5% 9/1/21 | 3,105,000 | 3,116,815 | |
| 5% 9/1/22 | 3,050,000 | 3,206,749 | |
| 5% 9/1/23 | 3,105,000 | 3,404,318 | |
| 5% 9/1/24 | 3,105,000 | 3,536,330 | |
| Series 2021 A: | |||
| 5% 3/1/32 | 105,000 | 138,434 | |
| 5% 3/1/35 | 750,000 | 978,197 | |
| 5% 3/1/36 | 600,000 | 779,840 | |
| 5% 3/1/37 | 750,000 | 971,455 | |
| 5% 3/1/46 | 3,000,000 | 3,809,597 | |
| Illinois Hsg. Dev. Auth. Series 2021, 3% 4/1/51 | 7,720,000 | 8,536,334 | |
| Illinois Hsg. Dev. Auth. Multi-family Hsg. Rev. Series 2019, 2.9% 7/1/35 | 4,904,596 | 5,323,956 | |
| Illinois Muni. Elec. Agcy. Pwr. Supply Series 2015 A: | |||
| 5% 2/1/23 | 1,075,000 | 1,152,381 | |
| 5% 2/1/29 | 10,000,000 | 11,764,778 | |
| 5% 2/1/31 | 1,890,000 | 2,222,723 | |
| Illinois Toll Hwy. Auth. Toll Hwy. Rev.: | |||
| Series 2014 A, 5% 12/1/22 | 6,565,000 | 6,995,156 | |
| Series 2015 A, 5% 1/1/37 | 4,445,000 | 5,199,748 | |
| Series 2016 A: | |||
| 5% 12/1/31 | 945,000 | 1,123,279 | |
| 5% 12/1/32 | 6,700,000 | 7,954,345 | |
| Series 2019 A, 5% 1/1/44 | 1,125,000 | 1,419,868 | |
| Series A: | |||
| 5% 1/1/37 | 1,250,000 | 1,660,686 | |
| 5% 1/1/41 | 2,010,000 | 2,645,457 | |
| 5% 1/1/45 | 21,880,000 | 28,251,112 | |
| Kane & DeKalb Counties Cmnty. Unit School District #302 Series 2004, 0% 2/1/22 (Nat'l. Pub. Fin. Guarantee Corp. Insured) | 5,025,000 | 5,005,364 | |
| Kane, McHenry, Cook & DeKalb Counties Unit School District #300: | |||
| Series 2015: | |||
| 5% 1/1/27 | 1,500,000 | 1,737,963 | |
| 5% 1/1/28 | 2,780,000 | 3,218,968 | |
| Series 2017, 5% 1/1/29 | 1,030,000 | 1,291,450 | |
| Kendall, Kane & Will Counties Cmnty. Unit School District #308 Series 2016, 5% 2/1/33 | 10,875,000 | 12,917,587 | |
| McHenry & Kane Counties Cmnty. Consolidated School District #158 Series 2004, 0% 1/1/24 (FSA Insured) | 1,600,000 | 1,565,957 | |
| McHenry County Cmnty. School District #200 Series 2006 B: | |||
| 0% 1/15/24 (Pre-Refunded to 1/15/24 @ 100) | 4,260,000 | 4,177,788 | |
| 0% 1/15/25 | 4,440,000 | 4,292,141 | |
| 0% 1/15/26 | 3,335,000 | 3,170,716 | |
| Metropolitan Pier & Exposition: | |||
| (McCormick Place Expansion Proj.): | |||
| Series 2010 B1: | |||
| 0% 6/15/43 (FSA Insured) | 32,700,000 | 19,915,451 | |
| 0% 6/15/45 (FSA Insured) | 12,145,000 | 6,926,053 | |
| 0% 6/15/47 (FSA Insured) | 10,605,000 | 5,722,321 | |
| Series 2012 B, 0% 12/15/51 | 5,900,000 | 2,719,835 | |
| Series 2017 B: | |||
| 5% 12/15/28 | 2,000,000 | 2,488,473 | |
| 5% 12/15/32 | 900,000 | 1,110,480 | |
| Series 2020 A, 5% 6/15/50 | 23,245,000 | 29,038,358 | |
| Series 2022 A, 4% 12/15/42 (d) | 5,725,000 | 6,658,981 | |
| Railsplitter Tobacco Settlement Auth. Rev. Series 2017: | |||
| 5% 6/1/23 | 1,250,000 | 1,360,372 | |
| 5% 6/1/24 | 1,635,000 | 1,853,438 | |
| Univ. of Illinois Rev.: | |||
| Series 2013: | |||
| 6% 10/1/42 | 1,935,000 | 2,147,640 | |
| 6.25% 10/1/38 | 1,900,000 | 2,122,577 | |
| Series 2018 A, 5% 4/1/29 | 3,940,000 | 5,014,802 | |
| Will County Cmnty. Unit School District #365-U Series 2007 B, 0% 11/1/26 (FSA Insured) | 3,175,000 | 3,040,953 | |
| Will County Illinois Series 2016, 5% 11/15/41 (Pre-Refunded to 11/15/25 @ 100) | 13,255,000 | 15,910,618 | |
| TOTAL ILLINOIS | 794,005,004 | ||
| Indiana - 1.4% | |||
| Beech Grove School Bldg. Corp. Series 1996, 5.625% 7/5/24 (Escrowed to Maturity) | 1,140,000 | 1,232,474 | |
| Indiana Fin. Auth. Hosp. Rev. (Parkview Health Sys. Proj.) Series 2017 A: | |||
| 5% 11/1/24 | 1,000,000 | 1,152,927 | |
| 5% 11/1/28 | 450,000 | 585,298 | |
| 5% 11/1/29 | 1,400,000 | 1,860,072 | |
| 5% 11/1/30 | 315,000 | 426,780 | |
| Indiana Fin. Auth. Rev.: | |||
| (Butler Univ. Proj.) Series 2019, 4% 2/1/44 | 2,595,000 | 3,016,817 | |
| Series 2015 A, 5.25% 2/1/32 | 2,940,000 | 3,482,447 | |
| Series 2015, 5% 3/1/36 | 4,500,000 | 5,062,188 | |
| Series 2016: | |||
| 5% 9/1/27 | 1,850,000 | 2,235,254 | |
| 5% 9/1/31 | 1,835,000 | 2,197,043 | |
| Indiana Fin. Auth. Wastewtr. Util. Rev.: | |||
| (CWA Auth. Proj.): | |||
| Series 2012 A, 5% 10/1/37 | 1,700,000 | 1,794,940 | |
| Series 2014 A: | |||
| 5% 10/1/25 | 1,200,000 | 1,381,118 | |
| 5% 10/1/26 | 1,750,000 | 2,010,061 | |
| (CWA Auth. Proj.) Series 2014 A, 5% 10/1/27 | 1,750,000 | 2,006,438 | |
| (CWA Auth. Proj.) Series 2015 A, 5% 10/1/29 | 2,295,000 | 2,632,285 | |
| Series 2011 A, 5.25% 10/1/26 | 1,000,000 | 1,008,310 | |
| Series 2011 B, 5% 10/1/41 | 2,000,000 | 2,015,814 | |
| Indiana Hsg. & Cmnty. Dev. Auth.: | |||
| (Glasswater Creek of Whitestown Proj.) Series 2020, 5.375% 10/1/40 (c) | 1,760,000 | 1,861,641 | |
| Series 2021 B, 3% 7/1/50 | 1,245,000 | 1,371,361 | |
| Indiana Muni. Pwr. Agcy. Pwr. Supply Sys. Rev. Series 2017 A: | |||
| 5% 1/1/32 | 4,000,000 | 5,028,468 | |
| 5% 1/1/34 | 2,000,000 | 2,499,352 | |
| Indianapolis Local Pub. Impt. (Courthouse and Jail Proj.) Series 2019 A, 5% 2/1/49 | 3,275,000 | 4,091,354 | |
| Indianapolis Wtr. Sys. Rev. Series 2018 A, 5% 10/1/32 | 3,000,000 | 3,853,802 | |
| Lake Central Multi-District School Bldg. Corp. Series 2012 B, 5% 1/15/30 (Pre-Refunded to 1/15/23 @ 100) | 4,300,000 | 4,607,174 | |
| Saint Joseph County Econ. Dev. Auth. Rev. (St. Mary's College Proj.): | |||
| Series 2019: | |||
| 4% 4/1/39 | 1,000,000 | 1,142,242 | |
| 4% 4/1/46 | 2,240,000 | 2,525,597 | |
| 5% 4/1/40 | 2,240,000 | 2,758,869 | |
| Series 2020: | |||
| 4% 4/1/37 | 1,660,000 | 1,904,412 | |
| 5% 4/1/29 | 1,030,000 | 1,306,332 | |
| TOTAL INDIANA | 67,050,870 | ||
| Iowa - 0.3% | |||
| Iowa Fin. Auth. Rev.: | |||
| Series 2018 B, 5% 2/15/48 | 2,500,000 | 3,079,127 | |
| Series A: | |||
| 5% 5/15/43 | 820,000 | 958,088 | |
| 5% 5/15/48 | 945,000 | 1,099,076 | |
| Tobacco Settlement Auth. Tobacco Settlement Rev.: | |||
| Series 2021 A2, 4% 6/1/49 | 2,800,000 | 3,291,872 | |
| Series 2021 B1, 4% 6/1/49 | 3,605,000 | 4,255,787 | |
| TOTAL IOWA | 12,683,950 | ||
| Kansas - 0.2% | |||
| Johnson County Unified School District # 233 Series 2016 A, 5% 9/1/21 | 750,000 | 752,880 | |
| Wyandotte County/Kansas City Unified Govt. Util. Sys. Rev. Series 2016 A: | |||
| 5% 9/1/40 | 4,200,000 | 4,906,365 | |
| 5% 9/1/45 | 5,125,000 | 5,953,892 | |
| TOTAL KANSAS | 11,613,137 | ||
| Kentucky - 3.1% | |||
| Ashland Med. Ctr. Rev.: | |||
| (Ashland Hosp. Corp. d/b/a King's Daughters Med. Ctr. Proj.) Series 2016 A, 5% 2/1/40 | 1,200,000 | 1,382,470 | |
| Series 2019: | |||
| 5% 2/1/28 | 50,000 | 62,636 | |
| 5% 2/1/32 | 65,000 | 82,302 | |
| Boyle County Edl. Facilities Rev. Series 2017, 5% 6/1/37 | 1,680,000 | 2,029,572 | |
| Kenton County Arpt. Board Arpt. Rev.: | |||
| Series 2016: | |||
| 5% 1/1/24 | 800,000 | 893,058 | |
| 5% 1/1/27 | 1,500,000 | 1,792,492 | |
| 5% 1/1/33 | 1,300,000 | 1,538,041 | |
| Series 2019, 5% 1/1/44 | 2,245,000 | 2,814,340 | |
| Kentucky Econ. Dev. Fin. Auth.: | |||
| Series 2019 A1: | |||
| 5% 8/1/33 | 1,000,000 | 1,283,096 | |
| 5% 8/1/44 | 1,000,000 | 1,253,584 | |
| Series 2019 A2, 5% 8/1/49 | 2,500,000 | 3,117,520 | |
| Kentucky Econ. Dev. Fin. Auth. Hosp. Rev.: | |||
| Series 2015 A: | |||
| 5% 6/1/25 | 50,000 | 57,163 | |
| 5% 6/1/26 | 55,000 | 63,513 | |
| 5% 6/1/27 | 55,000 | 63,268 | |
| 5% 6/1/28 | 60,000 | 68,738 | |
| 5% 6/1/29 | 65,000 | 74,169 | |
| 5% 6/1/30 | 65,000 | 73,890 | |
| Series 2017 B: | |||
| 5% 8/15/32 | 2,680,000 | 3,293,186 | |
| 5% 8/15/33 | 1,325,000 | 1,624,353 | |
| 5% 8/15/35 | 1,500,000 | 1,832,666 | |
| Kentucky State Property & Buildings Commission Rev.: | |||
| (Proj. No. 119) Series 2018: | |||
| 5% 5/1/27 | 2,255,000 | 2,795,852 | |
| 5% 5/1/29 | 1,865,000 | 2,356,256 | |
| 5% 5/1/30 | 1,250,000 | 1,573,927 | |
| 5% 5/1/31 | 535,000 | 674,377 | |
| 5% 5/1/32 | 280,000 | 352,004 | |
| 5% 5/1/33 | 630,000 | 790,001 | |
| 5% 5/1/34 | 720,000 | 900,581 | |
| 5% 5/1/35 | 425,000 | 526,095 | |
| 5% 5/1/36 | 360,000 | 444,558 | |
| Series 2016 B, 5% 11/1/26 | 11,900,000 | 14,610,048 | |
| Series A: | |||
| 4% 11/1/38 | 635,000 | 736,821 | |
| 5% 11/1/27 | 5,245,000 | 6,589,408 | |
| 5% 11/1/28 | 6,415,000 | 8,229,010 | |
| 5% 11/1/29 | 3,840,000 | 4,925,609 | |
| 5% 11/1/30 | 2,150,000 | 2,745,010 | |
| Kentucky, Inc. Pub. Energy Bonds Series A, 4%, tender 6/1/26 (a) | 31,480,000 | 36,396,254 | |
| Louisville & Jefferson County: | |||
| Bonds: | |||
| Series 2020 B, 5%, tender 10/1/23 (a) | 4,200,000 | 4,633,217 | |
| Series 2020 C, 5%, tender 10/1/26 (a) | 1,440,000 | 1,764,417 | |
| Series 2020 D, 5%, tender 10/1/29 (a) | 1,730,000 | 2,263,849 | |
| Series 2013 A: | |||
| 5.5% 10/1/33 | 1,275,000 | 1,412,281 | |
| 5.75% 10/1/38 | 3,105,000 | 3,452,420 | |
| Series 2016 A: | |||
| 5% 10/1/31 | 6,400,000 | 7,710,289 | |
| 5% 10/1/32 | 7,745,000 | 9,312,909 | |
| 5% 10/1/33 | 4,400,000 | 5,280,015 | |
| Series 2020 A: | |||
| 4% 10/1/40 | 1,155,000 | 1,349,937 | |
| 5% 10/1/37 | 2,875,000 | 3,669,845 | |
| TOTAL KENTUCKY | 148,895,047 | ||
| Louisiana - 0.2% | |||
| Louisiana Pub. Facilities Auth. Hosp. Rev. (Franciscan Missionaries of Our Lady Health Sys. Proj.) Series 2017 A, 5% 7/1/47 | 1,700,000 | 2,049,292 | |
| Louisiana Pub. Facilities Auth. Rev. (Tulane Univ. of Louisiana Proj.) Series 2016 A: | |||
| 5% 12/15/25 | 445,000 | 532,250 | |
| 5% 12/15/27 | 2,000,000 | 2,456,930 | |
| 5% 12/15/29 | 1,200,000 | 1,465,286 | |
| Tobacco Settlement Fing. Corp. Series 2013 A, 5% 5/15/23 | 2,500,000 | 2,711,866 | |
| TOTAL LOUISIANA | 9,215,624 | ||
| Maine - 1.0% | |||
| Maine Health & Higher Edl. Facilities Auth. Rev.: | |||
| (Eastern Maine Healthcare Systems Proj.) Series 2013, 5% 7/1/43 (Pre-Refunded to 7/1/23 @ 100) | 2,210,000 | 2,412,239 | |
| Series 2013, 5% 7/1/33 (Pre-Refunded to 7/1/23 @ 100) | 1,000,000 | 1,091,511 | |
| Series 2016 A: | |||
| 4% 7/1/41 | 1,185,000 | 1,298,094 | |
| 4% 7/1/46 | 1,765,000 | 1,922,513 | |
| 5% 7/1/41 | 480,000 | 552,068 | |
| 5% 7/1/46 | 330,000 | 377,434 | |
| Series 2018 A: | |||
| 5% 7/1/30 | 1,185,000 | 1,490,627 | |
| 5% 7/1/31 | 1,100,000 | 1,378,389 | |
| 5% 7/1/34 | 2,000,000 | 2,486,917 | |
| 5% 7/1/35 | 2,745,000 | 3,408,577 | |
| 5% 7/1/36 | 3,250,000 | 4,024,148 | |
| 5% 7/1/37 | 3,000,000 | 3,706,207 | |
| 5% 7/1/38 | 2,275,000 | 2,805,446 | |
| 5% 7/1/43 | 4,500,000 | 5,543,328 | |
| Series 2018, 5% 7/1/48 | 4,235,000 | 5,189,149 | |
| Maine Tpk. Auth. Tpk. Rev.: | |||
| Series 2015, 5% 7/1/37 | 1,700,000 | 1,983,626 | |
| Series 2018: | |||
| 5% 7/1/33 | 700,000 | 880,566 | |
| 5% 7/1/34 | 1,000,000 | 1,254,727 | |
| 5% 7/1/35 | 1,100,000 | 1,378,290 | |
| 5% 7/1/36 | 2,000,000 | 2,500,328 | |
| TOTAL MAINE | 45,684,184 | ||
| Maryland - 0.8% | |||
| City of Westminster Series 2016, 5% 11/1/31 | 1,975,000 | 2,327,648 | |
| Maryland Cmnty. Dev. Admin Dept. Hsg. & Cmnty. Dev.: | |||
| Series 2019 B, 4% 9/1/49 | 3,010,000 | 3,335,941 | |
| Series 2019 C, 3.5% 3/1/50 | 2,580,000 | 2,827,749 | |
| Maryland Health & Higher Edl. Facilities Auth. Rev.: | |||
| (Medstar Health, Inc. Proj.) Series 2017 A, 5% 5/15/45 | 1,655,000 | 2,032,645 | |
| Series 2015, 5% 7/1/40 | 2,000,000 | 2,278,020 | |
| Series 2016 A: | |||
| 4% 7/1/42 | 780,000 | 860,831 | |
| 5% 7/1/35 | 2,055,000 | 2,439,554 | |
| 5% 7/1/38 | 1,125,000 | 1,327,519 | |
| Maryland Trans. Auth. Trans. Facility Projs. Rev. Series 2020: | |||
| 4% 7/1/45 | 4,095,000 | 4,928,086 | |
| 4% 7/1/50 | 11,620,000 | 13,909,266 | |
| Washington Metropolitan Area Transit Auth. Series 2021 A, 5% 7/15/41 | 2,750,000 | 3,674,873 | |
| TOTAL MARYLAND | 39,942,132 | ||
| Massachusetts - 2.9% | |||
| Massachusetts Commonwealth Trans. Fund Rev. Series 2021 A, 5% 6/1/51 | 5,475,000 | 7,039,961 | |
| Massachusetts Dev. Fin. Agcy. Rev.: | |||
| (Lesley Univ. Proj.) Series 2016, 5% 7/1/39 | 1,015,000 | 1,201,360 | |
| (Univ. of Massachusetts Health Cr., Inc. Proj.) Series 2017 L, 4% 7/1/44 | 10,000,000 | 11,319,954 | |
| (Wentworth Institute of Technology Proj.) Series 2017: | |||
| 5% 10/1/30 | 1,165,000 | 1,397,453 | |
| 5% 10/1/33 | 1,355,000 | 1,613,967 | |
| Series 2015 D, 5% 7/1/44 | 2,575,000 | 2,939,560 | |
| Series 2016 A, 5% 1/1/47 | 7,000,000 | 8,177,672 | |
| Series 2019, 5% 9/1/59 | 13,125,000 | 16,362,590 | |
| Series 2020 A: | |||
| 4% 7/1/45 | 10,370,000 | 12,131,476 | |
| 5% 10/15/26 | 5,360,000 | 6,655,850 | |
| Series A, 4% 6/1/49 | 6,745,000 | 7,699,684 | |
| Series BB1, 5% 10/1/46 | 4,230,000 | 5,095,831 | |
| Series J2, 5% 7/1/53 | 2,500,000 | 3,065,660 | |
| Series M: | |||
| 4% 10/1/50 | 10,565,000 | 12,415,394 | |
| 5% 10/1/45 | 7,960,000 | 10,135,311 | |
| Massachusetts Gen. Oblig.: | |||
| Series 2017 A, 5% 4/1/36 | 1,280,000 | 1,588,574 | |
| Series 2019 C, 5% 5/1/49 | 3,725,000 | 4,745,219 | |
| Series E: | |||
| 5% 11/1/45 | 3,850,000 | 5,033,400 | |
| 5% 11/1/50 | 13,120,000 | 17,073,724 | |
| TOTAL MASSACHUSETTS | 135,692,640 | ||
| Michigan - 2.0% | |||
| Detroit Downtown Dev. Auth. Tax Series A, 5% 7/1/37 (FSA Insured) | 1,035,000 | 1,161,058 | |
| Detroit Gen. Oblig. Series 2021 A, 5% 4/1/46 | 1,950,000 | 2,417,307 | |
| Great Lakes Wtr. Auth. Sew Disp. Sys. Series 2018 A: | |||
| 5% 7/1/43 | 1,500,000 | 1,853,329 | |
| 5% 7/1/48 | 6,500,000 | 7,988,371 | |
| Jackson County Series 2019: | |||
| 4% 5/1/32 (Build America Mutual Assurance Insured) | 2,170,000 | 2,624,904 | |
| 4% 5/1/33 (Build America Mutual Assurance Insured) | 2,235,000 | 2,695,626 | |
| Kalamazoo Hosp. Fin. Auth. Hosp. Facilities Rev. Series 2016, 5% 5/15/28 | 1,455,000 | 1,760,682 | |
| Michigan Bldg. Auth. Rev. (Facilities Prog.) Series 2015 I, 5% 4/15/28 | 2,000,000 | 2,389,107 | |
| Michigan Fin. Auth. Rev.: | |||
| (Charter County of Wayne Criminal Justice Ctr. Proj.) Series 2018, 5% 11/1/43 | 1,845,000 | 2,292,312 | |
| (Trinity Health Proj.) Series 2017, 5% 12/1/42 | 1,035,000 | 1,282,043 | |
| Series 2012: | |||
| 5% 11/15/36 | 1,300,000 | 1,373,492 | |
| 5% 11/15/42 | 2,950,000 | 3,109,727 | |
| Series 2013, 5% 8/15/29 | 3,865,000 | 4,238,295 | |
| Series 2015 MI, 5% 12/1/25 | 3,000,000 | 3,528,398 | |
| Series 2016: | |||
| 5% 11/15/32 | 4,815,000 | 5,859,423 | |
| 5% 11/15/41 | 1,085,000 | 1,306,001 | |
| Series 2019 A, 5% 11/15/48 | 1,645,000 | 2,088,641 | |
| Series 2020 A, 4% 6/1/49 | 2,190,000 | 2,567,077 | |
| Michigan Hosp. Fin. Auth. Rev.: | |||
| Bonds (Ascension Health Cr. Group Proj.) Series F5, 2.4%, tender 3/15/23 (a) | 1,720,000 | 1,782,271 | |
| Series 2008 C: | |||
| 5% 12/1/32 | 305,000 | 384,394 | |
| 5% 12/1/32 (Pre-Refunded to 12/1/27 @ 100) | 40,000 | 50,713 | |
| Michigan Strategic Fund Ltd. Oblig. Rev. Bonds Series CC, 1.45%, tender 9/1/21 (a) | 6,380,000 | 6,386,286 | |
| Portage Pub. Schools Series 2016: | |||
| 5% 11/1/33 | 1,000,000 | 1,203,421 | |
| 5% 11/1/36 | 1,250,000 | 1,497,151 | |
| 5% 11/1/37 | 1,000,000 | 1,195,140 | |
| Warren Consolidated School District Series 2016: | |||
| 5% 5/1/28 | 4,100,000 | 5,000,597 | |
| 5% 5/1/29 | 4,230,000 | 5,148,002 | |
| Wayne County Arpt. Auth. Rev.: | |||
| Series 2015 D: | |||
| 5% 12/1/30 | 1,300,000 | 1,547,977 | |
| 5% 12/1/31 | 2,300,000 | 2,738,728 | |
| 5% 12/1/40 (FSA Insured) | 3,000,000 | 3,545,404 | |
| Series 2015 G: | |||
| 5% 12/1/31 | 1,500,000 | 1,786,127 | |
| 5% 12/1/32 | 1,500,000 | 1,786,127 | |
| 5% 12/1/33 | 2,000,000 | 2,381,503 | |
| Series 2015, 5% 12/1/29 | 1,600,000 | 1,905,202 | |
| Series 2017 A: | |||
| 5% 12/1/28 | 600,000 | 756,004 | |
| 5% 12/1/29 | 550,000 | 687,215 | |
| 5% 12/1/30 | 700,000 | 872,669 | |
| 5% 12/1/33 | 350,000 | 436,613 | |
| 5% 12/1/37 | 500,000 | 621,545 | |
| 5% 12/1/37 | 270,000 | 334,700 | |
| Series 2017 C, 5% 12/1/28 | 1,100,000 | 1,386,783 | |
| TOTAL MICHIGAN | 93,970,365 | ||
| Minnesota - 1.4% | |||
| Duluth Econ. Dev. Auth. Health Care Facilities Rev. Series 2018 A: | |||
| 5% 2/15/48 | 7,080,000 | 8,592,315 | |
| 5% 2/15/58 | 11,845,000 | 14,304,065 | |
| Maple Grove Health Care Sys. Rev.: | |||
| Series 2015, 5% 9/1/27 | 1,285,000 | 1,503,011 | |
| Series 2017: | |||
| 4% 5/1/22 | 500,000 | 513,540 | |
| 5% 5/1/23 | 500,000 | 540,225 | |
| 5% 5/1/24 | 1,200,000 | 1,349,139 | |
| Minneapolis & Saint Paul Hsg. & Redev. Auth. Health Care Sys. Rev. (Allina Health Sys. Proj.) Series 2017 A: | |||
| 5% 11/15/24 | 1,780,000 | 2,055,191 | |
| 5% 11/15/25 | 1,365,000 | 1,631,991 | |
| Minnesota Gen. Oblig. Series 2019 A, 5% 8/1/29 | 6,140,000 | 8,202,999 | |
| Minnesota Higher Ed. Facilities Auth. Rev. Series 2018 A: | |||
| 5% 10/1/29 | 1,000,000 | 1,249,632 | |
| 5% 10/1/32 | 715,000 | 880,541 | |
| 5% 10/1/33 | 875,000 | 1,074,680 | |
| 5% 10/1/45 | 1,035,000 | 1,242,165 | |
| Minnesota Hsg. Fin. Agcy.: | |||
| Series B, 4% 8/1/41 | 1,345,000 | 1,622,883 | |
| Series D: | |||
| 4% 8/1/38 | 2,400,000 | 2,918,188 | |
| 4% 8/1/40 | 2,600,000 | 3,145,096 | |
| 4% 8/1/41 | 1,705,000 | 2,057,261 | |
| 4% 8/1/43 | 1,930,000 | 2,318,269 | |
| Saint Cloud Health Care Rev. Series 2019: | |||
| 4% 5/1/49 | 3,460,000 | 3,915,755 | |
| 5% 5/1/48 | 4,325,000 | 5,385,016 | |
| Shakopee Sr. Hsg. Rev. Bonds Series 2018, 5.85%, tender 11/1/25 (a)(c) | 3,335,000 | 3,632,051 | |
| TOTAL MINNESOTA | 68,134,013 | ||
| Mississippi - 0.1% | |||
| Mississippi Home Corp. Series 2021 B: | |||
| 3% 6/1/51 | 3,215,000 | 3,555,434 | |
| 5% 6/1/28 | 745,000 | 947,757 | |
| TOTAL MISSISSIPPI | 4,503,191 | ||
| Missouri - 0.8% | |||
| Cape Girardeau County Indl. Dev. Auth.: | |||
| (South Eastern Health Proj.) Series 2017 A, 5% 3/1/27 | 30,000 | 36,438 | |
| (Southeast Hosp. Proj.) Series 2017 A, 5% 3/1/29 | 1,470,000 | 1,769,728 | |
| Kansas City Spl. Oblig. (Downtown Streetcar Proj.) Series 2014 A: | |||
| 5% 9/1/21 | 295,000 | 296,072 | |
| 5% 9/1/22 | 500,000 | 501,814 | |
| 5% 9/1/23 | 400,000 | 401,462 | |
| Kansas City San. Swr. Sys. Rev. Series 2018 B: | |||
| 5% 1/1/26 | 240,000 | 288,292 | |
| 5% 1/1/28 | 500,000 | 636,900 | |
| 5% 1/1/33 | 475,000 | 595,721 | |
| Kansas City Wtr. Rev. Series 2020 A, 4% 12/1/39 | 1,260,000 | 1,566,109 | |
| Missouri Health & Edl. Facilities Rev.: | |||
| Series 2015 B: | |||
| 3.125% 2/1/27 | 400,000 | 437,124 | |
| 3.25% 2/1/28 | 400,000 | 437,713 | |
| 4% 2/1/40 | 400,000 | 444,388 | |
| 5% 2/1/34 | 3,115,000 | 3,578,053 | |
| 5% 2/1/36 | 1,200,000 | 1,372,321 | |
| 5% 2/1/45 | 1,900,000 | 2,151,429 | |
| Series 2019 A: | |||
| 4% 10/1/48 | 2,150,000 | 2,485,453 | |
| 5% 10/1/46 | 4,225,000 | 5,229,721 | |
| Missouri Hsg. Dev. Commission Single Family Mtg. Rev. Series 2019, 4% 5/1/50 | 645,000 | 718,734 | |
| Saint Louis Arpt. Rev.: | |||
| Series 2019 A: | |||
| 5% 7/1/44 | 1,400,000 | 1,759,811 | |
| 5% 7/1/49 | 1,150,000 | 1,438,037 | |
| Series A, 5.25% 7/1/26 (FSA Insured) | 3,000,000 | 3,698,999 | |
| Saint Louis County Indl. Dev. Auth. Sr. Living Facilities Rev. Series 2018 A, 5.125% 9/1/48 | 2,660,000 | 3,021,298 | |
| The Indl. Dev. Auth. of Hannibal (Hannibal Reg'l. Healthcare Sys. Proj.) Series 2017: | |||
| 5% 10/1/42 | 3,425,000 | 4,110,843 | |
| 5% 10/1/47 | 2,125,000 | 2,536,324 | |
| TOTAL MISSOURI | 39,512,784 | ||
| Montana - 0.0% | |||
| Montana Board Hsg. Single Family Series 2019 B, 4% 6/1/50 | 345,000 | 392,037 | |
| Nebraska - 0.8% | |||
| Central Plains Energy Proj. Gas Supply Bonds Series 2019, 4%, tender 8/1/25 (a) | 14,295,000 | 16,204,335 | |
| Douglas County Neb Edl. Facilities Rev. (Creighton Univ. Proj.) Series 2017, 4% 7/1/33 | 775,000 | 900,297 | |
| Lincoln Elec. Sys. Rev. Series 2018: | |||
| 5% 9/1/31 | 2,000,000 | 2,464,132 | |
| 5% 9/1/32 | 3,735,000 | 4,592,436 | |
| 5% 9/1/33 | 2,240,000 | 2,749,592 | |
| Nebraska Invt. Fin. Auth. Single Family Hsg. Rev. Series 2020 A, 3.5% 9/1/50 | 1,560,000 | 1,728,920 | |
| Nebraska Pub. Pwr. District Rev.: | |||
| Series 2016 A: | |||
| 5% 1/1/32 | 1,670,000 | 1,987,141 | |
| 5% 1/1/34 | 1,000,000 | 1,188,696 | |
| Series 2016 B, 5% 1/1/32 | 5,000,000 | 5,949,524 | |
| TOTAL NEBRASKA | 37,765,073 | ||
| Nevada - 1.1% | |||
| Carson City Hosp. Rev. (Carson Tahoe Hosp. Proj.) Series 2017: | |||
| 5% 9/1/37 | 2,705,000 | 3,275,243 | |
| 5% 9/1/42 | 6,665,000 | 8,064,156 | |
| Clark County Arpt. Rev. Series 2019 A: | |||
| 5% 7/1/24 | 2,750,000 | 3,135,420 | |
| 5% 7/1/25 | 2,170,000 | 2,568,986 | |
| 5% 7/1/26 | 1,345,000 | 1,645,738 | |
| Las Vegas Valley Wtr. District Wtr. Impt. Gen. Oblig.: | |||
| Series 2012 B, 5% 6/1/42 | 3,260,000 | 3,380,336 | |
| Series 2016 A: | |||
| 5% 6/1/35 | 4,150,000 | 4,989,296 | |
| 5% 6/1/36 | 6,000,000 | 7,203,961 | |
| Series 2016 B: | |||
| 5% 6/1/34 | 7,495,000 | 9,018,695 | |
| 5% 6/1/36 | 2,700,000 | 3,241,782 | |
| Nevada Hsg. Division Single Family Mtg. Rev. Series 2019 B, 4% 10/1/49 | 1,060,000 | 1,177,900 | |
| Tahoe-Douglas Visitors Auth. Series 2020, 5% 7/1/51 | 3,000,000 | 3,495,007 | |
| TOTAL NEVADA | 51,196,520 | ||
| New Hampshire - 1.0% | |||
| Nat'l. Finnance Auth. Series 2020 1, 4.125% 1/20/34 | 5,099,828 | 6,201,817 | |
| New Hampshire Health & Ed. Facilities Auth.: | |||
| (Concord Hosp.) Series 2017, 5% 10/1/42 | 2,000,000 | 2,424,036 | |
| (Dartmouth-Hitchcock Oblgtd Grp Proj.): | |||
| Series 2018 A: | |||
| 5% 8/1/31 | 1,300,000 | 1,627,001 | |
| 5% 8/1/32 | 250,000 | 312,522 | |
| 5% 8/1/34 | 3,000,000 | 3,744,629 | |
| 5% 8/1/36 | 2,000,000 | 2,491,148 | |
| 5% 8/1/37 | 2,400,000 | 2,984,667 | |
| Series 2018, 5% 8/1/35 | 2,750,000 | 3,428,401 | |
| (Partners Healthcare Sys., Inc. Proj.) Series 2017, 5% 7/1/41 | 2,100,000 | 2,592,111 | |
| Series 2017: | |||
| 5% 7/1/36 | 1,200,000 | 1,425,131 | |
| 5% 7/1/44 | 1,895,000 | 2,221,135 | |
| New Hampshire Health & Ed. Facilities Auth. Rev.: | |||
| Series 2012: | |||
| 4% 7/1/23 | 1,000,000 | 1,032,320 | |
| 4% 7/1/32 | 900,000 | 920,125 | |
| Series 2016: | |||
| 4% 10/1/38 | 1,165,000 | 1,304,007 | |
| 5% 10/1/28 | 3,000,000 | 3,637,176 | |
| 5% 10/1/32 | 5,160,000 | 6,167,234 | |
| 5% 10/1/38 | 3,765,000 | 4,461,673 | |
| TOTAL NEW HAMPSHIRE | 46,975,133 | ||
| New Jersey - 5.6% | |||
| New Jersey Econ. Dev. Auth.: | |||
| (White Horse HMT Urban Renewal LLC Proj.) Series 2020, 5% 1/1/40 (c) | 855,000 | 881,370 | |
| Series A, 5% 11/1/36 | 5,185,000 | 6,582,145 | |
| Series QQQ: | |||
| 4% 6/15/34 | 800,000 | 971,076 | |
| 4% 6/15/36 | 1,100,000 | 1,329,271 | |
| 4% 6/15/39 | 1,000,000 | 1,199,302 | |
| 4% 6/15/41 | 1,000,000 | 1,194,712 | |
| 4% 6/15/46 | 1,500,000 | 1,774,356 | |
| 4% 6/15/50 | 2,000,000 | 2,355,834 | |
| 5% 6/15/31 | 1,100,000 | 1,450,709 | |
| 5% 6/15/33 | 200,000 | 262,071 | |
| New Jersey Econ. Dev. Auth. Rev.: | |||
| (Black Horse EHT Urban Renewal LLC Proj.) Series 2019 A, 5% 10/1/39 (c) | 750,000 | 775,333 | |
| (New Jersey Gen. Oblig. Proj.): | |||
| Series 2015 XX, 5% 6/15/25 | 6,215,000 | 7,274,819 | |
| Series 2017 B, 5% 11/1/24 | 10,000,000 | 11,452,302 | |
| (Provident Montclair Proj.) Series 2017: | |||
| 5% 6/1/27 (FSA Insured) | 40,000 | 49,810 | |
| 5% 6/1/28 (FSA Insured) | 60,000 | 74,268 | |
| 5% 6/1/29 (FSA Insured) | 45,000 | 55,375 | |
| Series 2013: | |||
| 5% 3/1/23 | 7,040,000 | 7,571,324 | |
| 5% 3/1/24 | 6,200,000 | 6,664,293 | |
| 5% 3/1/25 | 700,000 | 752,531 | |
| Series 2014 PP, 5% 6/15/26 | 6,000,000 | 6,791,249 | |
| Series 2015 XX: | |||
| 5% 6/15/22 | 1,525,000 | 1,588,428 | |
| 5% 6/15/23 | 1,000,000 | 1,089,176 | |
| 5% 6/15/26 | 15,000,000 | 17,528,621 | |
| Series 2016 AAA: | |||
| 5% 6/15/41 | 2,510,000 | 3,008,536 | |
| 5.5% 6/15/30 | 4,995,000 | 6,195,272 | |
| Series 2016 BBB, 5% 6/15/22 | 3,120,000 | 3,249,768 | |
| Series LLL, 4% 6/15/49 | 2,810,000 | 3,262,889 | |
| Series MMM, 4% 6/15/36 | 800,000 | 949,780 | |
| New Jersey Edl. Facility Series 2016 A, 5% 7/1/29 | 2,625,000 | 3,119,166 | |
| New Jersey Gen. Oblig. Series 2020 A: | |||
| 4% 6/1/30 | 2,830,000 | 3,517,641 | |
| 4% 6/1/31 | 1,065,000 | 1,343,884 | |
| 4% 6/1/32 | 715,000 | 916,460 | |
| 5% 6/1/29 | 3,180,000 | 4,189,499 | |
| New Jersey Health Care Facilities Fing. Auth. Rev.: | |||
| Series 2016 A: | |||
| 5% 7/1/22 | 155,000 | 161,399 | |
| 5% 7/1/23 | 550,000 | 596,779 | |
| 5% 7/1/24 | 460,000 | 518,157 | |
| 5% 7/1/25 | 1,055,000 | 1,229,235 | |
| 5% 7/1/25 | 495,000 | 576,750 | |
| 5% 7/1/26 | 155,000 | 186,141 | |
| 5% 7/1/27 | 235,000 | 281,345 | |
| 5% 7/1/28 | 35,000 | 41,687 | |
| 5% 7/1/28 | 685,000 | 815,869 | |
| 5% 7/1/30 | 1,000,000 | 1,219,237 | |
| Series 2016: | |||
| 4% 7/1/48 | 1,800,000 | 1,995,189 | |
| 5% 7/1/41 | 2,190,000 | 2,560,367 | |
| New Jersey Higher Ed. Student Assistance Auth. Student Ln. Rev. Series 2019 A: | |||
| 5% 12/1/21 | 1,435,000 | 1,458,116 | |
| 5% 12/1/23 | 1,005,000 | 1,115,286 | |
| 5% 12/1/24 | 580,000 | 667,448 | |
| 5% 12/1/25 | 1,065,000 | 1,263,123 | |
| New Jersey Tpk. Auth. Tpk. Rev. Series 2021 A: | |||
| 4% 1/1/42 | 4,290,000 | 5,191,882 | |
| 4% 1/1/51 | 5,000,000 | 5,978,689 | |
| New Jersey Trans. Trust Fund Auth.: | |||
| (Trans. Prog.) Series 2019 AA, 5.25% 6/15/43 | 16,055,000 | 20,255,845 | |
| Series 2005 B, 5.25% 12/15/22 (AMBAC Insured) | 400,000 | 427,537 | |
| Series 2010 A, 0% 12/15/27 | 7,395,000 | 6,796,546 | |
| Series 2014 AA, 5% 6/15/24 | 15,000,000 | 16,987,718 | |
| Series 2014 BB2, 5% 6/15/34 | 5,690,000 | 7,513,832 | |
| Series 2016 A: | |||
| 5% 6/15/27 | 945,000 | 1,138,452 | |
| 5% 6/15/28 | 3,225,000 | 3,861,967 | |
| 5% 6/15/29 | 3,550,000 | 4,230,009 | |
| Series 2016 A-2, 5% 6/15/23 | 2,495,000 | 2,715,531 | |
| Series 2018 A: | |||
| 5% 12/15/32 | 3,205,000 | 4,048,499 | |
| 5% 12/15/34 | 1,000,000 | 1,261,091 | |
| Series 2021 A: | |||
| 4% 6/15/38 (d) | 540,000 | 627,691 | |
| 5% 6/15/32 | 3,560,000 | 4,735,882 | |
| 5% 6/15/33 | 1,000,000 | 1,326,386 | |
| Series 2022 A: | |||
| 4% 6/15/41 (d) | 4,900,000 | 5,644,197 | |
| 4% 6/15/42 (d) | 3,290,000 | 3,776,890 | |
| Series 2022 AA: | |||
| 5% 6/15/29 (d) | 8,000,000 | 9,888,081 | |
| 5% 6/15/35 (d) | 625,000 | 799,220 | |
| 5% 6/15/36 (d) | 7,325,000 | 9,325,009 | |
| Series A: | |||
| 4% 12/15/39 | 1,000,000 | 1,179,387 | |
| 4.25% 12/15/38 | 2,485,000 | 2,932,895 | |
| Series AA: | |||
| 4% 6/15/38 | 2,815,000 | 3,376,631 | |
| 4% 6/15/45 | 6,000,000 | 7,104,353 | |
| 5% 6/15/25 | 2,380,000 | 2,787,446 | |
| 5% 6/15/29 | 1,340,000 | 1,395,545 | |
| 5% 6/15/37 | 3,000,000 | 3,887,804 | |
| 5% 6/15/50 | 3,345,000 | 4,239,415 | |
| TOTAL NEW JERSEY | 267,541,828 | ||
| New Mexico - 0.1% | |||
| New Mexico Mtg. Fin. Auth. Series 2019 D, 3.75% 1/1/50 | 1,440,000 | 1,594,762 | |
| Santa Fe Retirement Fac.: | |||
| Series 2019 A: | |||
| 2.25% 5/15/24 | 115,000 | 115,411 | |
| 5% 5/15/34 | 230,000 | 265,409 | |
| 5% 5/15/39 | 170,000 | 194,908 | |
| 5% 5/15/44 | 180,000 | 205,046 | |
| 5% 5/15/49 | 355,000 | 403,180 | |
| Series 2019 B1, 2.625% 5/15/25 | 190,000 | 190,848 | |
| TOTAL NEW MEXICO | 2,969,564 | ||
| New York - 6.8% | |||
| Dorm. Auth. New York Univ. Rev.: | |||
| (Memorial Sloan-Kettring Cancer Ctr.) Series 2017 1, 5% 7/1/42 | 1,555,000 | 1,913,516 | |
| Series 2016 A: | |||
| 5% 7/1/23 | 30,000 | 32,732 | |
| 5% 7/1/25 | 70,000 | 82,153 | |
| 5% 7/1/32 | 2,500,000 | 3,002,321 | |
| Hudson Yards Infrastructure Corp. New York Rev.: | |||
| Series 2012 A, 5.75% 2/15/47 | 1,680,000 | 1,686,892 | |
| Series 2017 A: | |||
| 5% 2/15/33 | 3,595,000 | 4,392,008 | |
| 5% 2/15/39 | 10,000,000 | 12,085,358 | |
| 5% 2/15/42 | 9,860,000 | 11,873,940 | |
| Long Island Pwr. Auth. Elec. Sys. Rev. Series 2017: | |||
| 5% 9/1/33 | 500,000 | 622,687 | |
| 5% 9/1/35 | 2,000,000 | 2,498,377 | |
| 5% 9/1/36 | 1,135,000 | 1,410,762 | |
| MTA Hudson Rail Yards Trust Oblig. Series 2016 A, 5% 11/15/56 | 17,050,000 | 18,374,372 | |
| New York City Gen. Oblig.: | |||
| Series 2015 C, 5% 8/1/27 | 1,600,000 | 1,860,092 | |
| Series 2016 C and D, 5% 8/1/28 | 1,500,000 | 1,799,396 | |
| Series 2016 E, 5% 8/1/28 | 2,550,000 | 3,107,307 | |
| Series 2021 A1: | |||
| 5% 8/1/28 | 5,880,000 | 7,610,842 | |
| 5% 8/1/29 | 6,405,000 | 8,475,181 | |
| Series C, 5% 8/1/26 | 1,715,000 | 2,105,015 | |
| New York City Muni. Wtr. Fin. Auth. Wtr. & Swr. Sys. Rev.: | |||
| Series 2012 EE, 5.25% 6/15/30 | 6,300,000 | 6,581,315 | |
| Series 2020 GG1, 5% 6/15/50 | 2,730,000 | 3,505,580 | |
| New York City Transitional Fin. Auth. Bldg. Aid Rev. Series S1, 5% 7/15/27 | 2,000,000 | 2,093,116 | |
| New York City Transitional Fin. Auth. Rev.: | |||
| Series 2015 E1, 5% 2/1/41 | 1,615,000 | 1,856,219 | |
| Series 2016 A, 5% 5/1/40 | 1,950,000 | 2,329,518 | |
| Series 2017 B, 5% 8/1/40 | 2,000,000 | 2,406,446 | |
| Series 2019 B1, 5% 8/1/34 | 2,000,000 | 2,550,307 | |
| Series E, 5% 2/1/43 | 4,155,000 | 5,051,150 | |
| New York Convention Ctr. Dev. Corp. Rev. Series 2015: | |||
| 5% 11/15/28 | 7,205,000 | 8,536,631 | |
| 5% 11/15/29 | 5,000,000 | 5,921,772 | |
| New York Dorm. Auth. Mental Health Svcs. Facilities Impt. Rev. Series 2012 A, 5% 5/15/23 | 2,000,000 | 2,077,372 | |
| New York Dorm. Auth. Sales Tax Rev.: | |||
| Series 2016 A: | |||
| 5% 3/15/31 | 4,400,000 | 5,396,359 | |
| 5% 3/15/32 | 1,945,000 | 2,383,229 | |
| 5% 3/15/34 | 3,200,000 | 3,911,932 | |
| Series 2018 C, 5% 3/15/38 | 8,285,000 | 10,442,169 | |
| New York Metropolitan Trans. Auth. Rev.: | |||
| Series 2012 D, 5% 11/15/25 | 9,500,000 | 10,052,380 | |
| Series 2014 B, 5.25% 11/15/44 | 2,215,000 | 2,463,048 | |
| Series 2014 C, 5% 11/15/21 | 2,500,000 | 2,533,559 | |
| Series 2016 B, 5% 11/15/21 | 1,950,000 | 1,976,154 | |
| Series 2017 C-2: | |||
| 0% 11/15/29 | 2,275,000 | 1,999,185 | |
| 0% 11/15/33 | 5,600,000 | 4,408,090 | |
| Series 2020 D: | |||
| 4% 11/15/46 | 33,385,000 | 39,032,350 | |
| 4% 11/15/47 | 2,335,000 | 2,727,554 | |
| Series 2021 A1, 4% 11/15/45 | 22,000,000 | 25,950,456 | |
| New York State Urban Dev. Corp.: | |||
| Series 2020 C, 5% 3/15/47 | 4,600,000 | 5,926,523 | |
| Series 2020 E: | |||
| 4% 3/15/44 | 24,275,000 | 28,653,038 | |
| 4% 3/15/45 | 19,700,000 | 23,184,044 | |
| New York Urban Dev. Corp. Rev.: | |||
| (New York State Gen. Oblig. Proj.) Series 2017 A, 5% 3/15/34 | 3,700,000 | 4,535,385 | |
| Gen. Oblig. (New York State Gen. Oblig. Proj.) Series 2017 A, 5% 3/15/32 | 3,130,000 | 3,845,485 | |
| Series 2017 C, 5% 3/15/31 | 2,375,000 | 2,971,103 | |
| Oneida County Local Dev. Corp. Rev. (Mohawk Valley Health Sys. Proj.) Series 2019 A: | |||
| 4% 12/1/32 (FSA Insured) | 1,000,000 | 1,189,307 | |
| 5% 12/1/25 (FSA Insured) | 630,000 | 697,618 | |
| 5% 12/1/30 (FSA Insured) | 1,500,000 | 1,955,802 | |
| Suffolk County Econ. Dev. Corp. Rev. Series 2021: | |||
| 5.125% 11/1/41 (c) | 600,000 | 632,707 | |
| 5.375% 11/1/54 (c) | 1,020,000 | 1,074,977 | |
| Triborough Bridge & Tunnel Auth. Series 2021 A1, 5% 5/15/51 | 4,300,000 | 5,647,951 | |
| Triborough Bridge & Tunnel Auth. Revs. Series 2012 B, 5% 11/15/22 | 1,970,000 | 2,094,777 | |
| TOTAL NEW YORK | 321,527,559 | ||
| New York And New Jersey - 0.1% | |||
| Port Auth. of New York & New Jersey Series 194, 5.25% 10/15/55 | 3,365,000 | 4,001,952 | |
| North Carolina - 1.4% | |||
| Charlotte Ctfs. of Prtn. (Convention Facility Projs.) Series 2019 A, 5% 6/1/46 | 2,380,000 | 3,039,698 | |
| Charlotte Int'l. Arpt. Rev.: | |||
| Series 2017 A: | |||
| 5% 7/1/35 | 2,000,000 | 2,483,040 | |
| 5% 7/1/42 | 2,875,000 | 3,573,346 | |
| Series 2017 C: | |||
| 4% 7/1/36 | 1,500,000 | 1,746,877 | |
| 4% 7/1/37 | 1,500,000 | 1,747,095 | |
| 5% 7/1/29 | 2,575,000 | 3,217,376 | |
| Nash Health Care Sys. Health Care Facilities Rev.: | |||
| Series 2003, 5.5% 11/1/26 (FSA Insured) | 1,200,000 | 1,204,920 | |
| Series 2012, 5% 11/1/41 | 1,730,000 | 1,763,544 | |
| New Hanover County Hosp. Rev. Series 2017: | |||
| 5% 10/1/27 (Escrowed to Maturity) | 220,000 | 276,492 | |
| 5% 10/1/29 (Pre-Refunded to 10/1/27 @ 100) | 3,500,000 | 4,398,741 | |
| 5% 10/1/42 (Pre-Refunded to 10/1/27 @ 100) | 1,820,000 | 2,287,345 | |
| North Carolina Med. Care Commission Health Care Facilities Rev.: | |||
| Series 2019 A: | |||
| 5% 12/1/29 | 1,390,000 | 1,770,541 | |
| 5% 12/1/30 | 1,440,000 | 1,823,756 | |
| 5% 12/1/32 | 1,095,000 | 1,378,489 | |
| 5% 12/1/33 | 800,000 | 1,004,352 | |
| Series 2021 A: | |||
| 4% 3/1/36 | 900,000 | 1,013,748 | |
| 4% 3/1/51 | 1,895,000 | 2,086,538 | |
| North Carolina Muni. Pwr. Agcy. #1 Catawba Elec. Rev.: | |||
| Series 2015 A, 5% 1/1/28 | 3,500,000 | 4,150,081 | |
| Series 2015 C, 5% 1/1/29 | 8,000,000 | 9,461,046 | |
| North Carolina Tpk. Auth. Triangle Expressway Sys. Series 2019: | |||
| 4% 1/1/55 | 3,225,000 | 3,685,401 | |
| 5% 1/1/43 | 4,500,000 | 5,591,197 | |
| 5% 1/1/44 | 5,610,000 | 6,952,383 | |
| 5% 1/1/49 | 2,000,000 | 2,463,295 | |
| TOTAL NORTH CAROLINA | 67,119,301 | ||
| Ohio - 2.4% | |||
| Akron Bath Copley Hosp. District Rev. Series 2016, 5.25% 11/15/46 | 4,200,000 | 5,044,639 | |
| Allen County Hosp. Facilities Rev. Bonds (Mercy Health) Series 2017 B, 5%, tender 5/5/22 (a) | 1,600,000 | 1,656,655 | |
| American Muni. Pwr., Inc. (Solar Electricity Prepayment Proj.) Series 2019 A: | |||
| 5% 2/15/38 | 1,500,000 | 1,883,226 | |
| 5% 2/15/39 | 1,000,000 | 1,252,922 | |
| 5% 2/15/44 | 3,150,000 | 3,910,474 | |
| American Muni. Pwr., Inc. Rev.: | |||
| (Greenup Hydroelectric Proj.): | |||
| Series 2016 A, 5% 2/15/41 | 4,000,000 | 4,727,311 | |
| Series 2016, 5% 2/15/46 | 1,280,000 | 1,516,497 | |
| (Prairie State Energy Campus Proj.) Series 2015, 5% 2/15/28 | 5,900,000 | 6,571,727 | |
| Series 2012 B, 5% 2/15/42 | 705,000 | 722,940 | |
| Buckeye Tobacco Settlement Fing. Auth. Series 2020 A2: | |||
| 5% 6/1/27 | 2,250,000 | 2,809,936 | |
| 5% 6/1/29 | 4,100,000 | 5,361,599 | |
| 5% 6/1/34 | 1,210,000 | 1,581,857 | |
| Cleveland Arpt. Sys. Rev. Series 2016 A: | |||
| 5% 1/1/26 (FSA Insured) | 500,000 | 578,028 | |
| 5% 1/1/27 (FSA Insured) | 2,175,000 | 2,510,411 | |
| 5% 1/1/31 (FSA Insured) | 1,000,000 | 1,154,212 | |
| Cleveland Income Tax Rev. Series 2018 A: | |||
| 5% 10/1/35 | 2,000,000 | 2,497,412 | |
| 5% 10/1/37 | 1,250,000 | 1,554,762 | |
| 5% 10/1/38 | 1,500,000 | 1,862,433 | |
| Columbus City School District Series 2016 A, 5% 12/1/32 | 1,000,000 | 1,206,465 | |
| Fairfield County Hosp. Facilities Rev. (Fairfield Med. Ctr. Proj.) Series 2013: | |||
| 5% 6/15/25 | 70,000 | 74,470 | |
| 5% 6/15/26 | 75,000 | 79,565 | |
| 5% 6/15/27 | 80,000 | 84,627 | |
| 5% 6/15/28 | 85,000 | 89,650 | |
| 5.25% 6/15/43 | 5,000,000 | 5,194,185 | |
| Franklin County Rev. (Trinity Health Proj.) Series 2017, 5% 12/1/47 | 8,235,000 | 10,108,387 | |
| Hamilton County Convention Facilities Auth. Rev. Series 2014, 5% 12/1/26 | 1,900,000 | 2,089,794 | |
| Lake County Hosp. Facilities Rev.: | |||
| Series 2008 C, 6% 8/15/43 | 400,000 | 401,426 | |
| Series 2015: | |||
| 5% 8/15/26 | 1,170,000 | 1,368,533 | |
| 5% 8/15/27 | 65,000 | 75,663 | |
| Lancaster Port Auth. Gas Rev. Bonds Series 2019, 5%, tender 2/1/25 (a) | 11,070,000 | 12,742,976 | |
| Muskingum County Hosp. Facilities (Genesis Healthcare Sys. Obligated Group Proj.) Series 2013: | |||
| 5% 2/15/27 | 170,000 | 180,950 | |
| 5% 2/15/44 | 1,900,000 | 1,994,870 | |
| 5% 2/15/48 | 4,400,000 | 4,614,056 | |
| Ohio Gen. Oblig. Series 2018 A, 5% 6/15/37 | 3,470,000 | 4,170,059 | |
| Ohio Higher Edl. Facility Commission Rev. Series 2019, 4% 10/1/44 | 1,775,000 | 2,029,963 | |
| Ohio Hosp. Facilities Rev. Series 2017 A, 5% 1/1/31 | 2,500,000 | 3,162,734 | |
| Ohio Hosp. Rev. Series 2020 A, 4% 1/15/50 | 825,000 | 959,863 | |
| Ohio Hsg. Fin. Agcy. Residential Mtg. Rev. (Mtg. Backed Securities Prog.) Series 2019 B, 4.5% 3/1/50 | 495,000 | 556,723 | |
| Ohio Tpk. Commission Tpk. Rev. (Infrastructure Proj.) Series 2005 A, 0% 2/15/42 | 5,800,000 | 3,651,456 | |
| Scioto County Hosp. Facilities Rev.: | |||
| Series 2016, 5% 2/15/29 | 1,265,000 | 1,498,945 | |
| Series 2019, 5% 2/15/29 | 3,080,000 | 3,626,532 | |
| Univ. of Akron Gen. Receipts Series 2019 A: | |||
| 4% 1/1/28 | 3,700,000 | 4,457,750 | |
| 5% 1/1/30 | 1,800,000 | 2,381,207 | |
| Wood County Hosp. Facilities Rev. (Wood County Hosp. Proj.) Series 2012: | |||
| 5% 12/1/32 | 140,000 | 142,756 | |
| 5% 12/1/32 (Pre-Refunded to 12/1/22 @ 100) | 280,000 | 297,734 | |
| 5% 12/1/42 | 175,000 | 177,036 | |
| 5% 12/1/42 (Pre-Refunded to 12/1/22 @ 100) | 355,000 | 377,485 | |
| TOTAL OHIO | 114,992,901 | ||
| Oklahoma - 0.3% | |||
| Grand River Dam Auth. Rev. Series 2014 A, 5% 6/1/39 | 7,000,000 | 7,865,535 | |
| Oklahoma City Pub. Property Auth. Hotel Tax Rev. Series 2015: | |||
| 5% 10/1/24 | 1,105,000 | 1,267,717 | |
| 5% 10/1/32 | 1,100,000 | 1,302,643 | |
| Oklahoma Dev. Fin. Auth. Health Sys. Rev. (OU Medicine Proj.) Series 2018 B: | |||
| 5% 8/15/27 | 30,000 | 36,770 | |
| 5% 8/15/28 | 30,000 | 37,581 | |
| 5% 8/15/29 | 10,000 | 12,502 | |
| Oklahoma Dev. Fin. Auth. Rev. (Oklahoma City Univ. Proj.) Series 2019, 5% 8/1/44 | 1,685,000 | 2,048,820 | |
| TOTAL OKLAHOMA | 12,571,568 | ||
| Oregon - 0.9% | |||
| Oregon Bus. Dev. Commission Recovery Zone Facility Bonds (Intel Corp. Proj.) Series 232, 2.4%, tender 8/14/23 (a) | 18,000,000 | 18,751,352 | |
| Oregon State Hsg. & Cmnty. Svcs. Dept. Series 2019 A, 4% 7/1/50 | 5,935,000 | 6,603,859 | |
| Polk Marion & Benton School District # 13J Series B, 0% 12/15/38 | 2,115,000 | 1,483,422 | |
| Washington, Multnomah & Yamhill County School District #1J Series 2017: | |||
| 5% 6/15/33 | 1,080,000 | 1,340,146 | |
| 5% 6/15/35 | 3,135,000 | 3,876,645 | |
| 5% 6/15/36 | 3,000,000 | 3,702,275 | |
| 5% 6/15/37 | 4,000,000 | 4,926,676 | |
| 5% 6/15/38 | 3,000,000 | 3,689,186 | |
| TOTAL OREGON | 44,373,561 | ||
| Pennsylvania - 4.5% | |||
| Allegheny County Hosp. Dev. Auth. Rev. Series 2019 A, 4% 7/15/36 | 2,500,000 | 2,992,596 | |
| Bucks County Indl. Dev. Auth. Hosp. Rev. Series 2021: | |||
| 5% 7/1/37 | 1,470,000 | 1,874,897 | |
| 5% 7/1/39 | 2,930,000 | 3,718,338 | |
| Cap. Region Wtr. Wtr. Rev. Series 2018: | |||
| 5% 7/15/26 | 1,000,000 | 1,195,257 | |
| 5% 7/15/38 | 1,000,000 | 1,255,467 | |
| Centre County Pennsylvania Hosp. Auth. Rev. (Mount Nittany Med. Ctr. Proj.) Series 2018 A, 5% 11/15/24 | 1,000,000 | 1,152,113 | |
| Coatesville Area School District Series 2017: | |||
| 5% 8/1/21 (Escrowed to Maturity) | 920,000 | 920,000 | |
| 5% 8/1/22 (Escrowed to Maturity) | 25,000 | 26,212 | |
| 5% 8/1/22 (FSA Insured) | 235,000 | 246,014 | |
| 5% 8/1/23 (FSA Insured) | 450,000 | 492,094 | |
| Dauphin County Gen. Auth. (Pinnacle Health Sys. Proj.) Series 2016 A, 5% 6/1/29 | 1,330,000 | 1,613,221 | |
| Delaware County Auth. Rev. Series 2017, 5% 7/1/26 | 1,180,000 | 1,397,683 | |
| Doylestown Hosp. Auth. Hosp. Rev. Series 2016 A, 5% 7/1/46 | 830,000 | 944,708 | |
| Lehigh County Gen. Purp. Hosp. Rev. Series 2019 A: | |||
| 4% 7/1/37 | 2,000,000 | 2,390,976 | |
| 4% 7/1/38 | 2,180,000 | 2,600,719 | |
| 4% 7/1/39 | 2,500,000 | 2,975,970 | |
| 5% 7/1/44 | 2,500,000 | 3,170,207 | |
| Lehigh County Indl. Dev. Auth. Poll. Cont. Rev. Bonds: | |||
| (PPL Elec. Utils. Corp. Proj.) Series 2016 A, 1.8%, tender 9/1/22 (a) | 2,450,000 | 2,489,818 | |
| Series B, 1.8%, tender 8/15/22 (a) | 3,255,000 | 3,305,747 | |
| Monroeville Fin. Auth. UPMC Rev. Series 2012, 5% 2/15/26 | 1,700,000 | 2,046,895 | |
| Montgomery County Higher Ed. & Health Auth. Rev.: | |||
| Series 2014 A, 5% 10/1/23 | 2,355,000 | 2,556,646 | |
| Series 2016 A: | |||
| 5% 10/1/28 | 40,000 | 46,234 | |
| 5% 10/1/29 | 45,000 | 51,747 | |
| 5% 10/1/30 | 4,350,000 | 4,979,656 | |
| 5% 10/1/32 | 140,000 | 159,544 | |
| 5% 10/1/36 | 4,655,000 | 5,271,698 | |
| 5% 10/1/40 | 2,545,000 | 2,865,692 | |
| Series 2019, 4% 9/1/44 | 5,165,000 | 6,029,546 | |
| Montgomery County Indl. Dev. Auth. Series 2015 A, 5.25% 1/15/36 | 3,005,000 | 3,402,535 | |
| Northampton County Gen. Purp. Auth. Hosp. Rev. (St. Luke's Univ. Health Network Proj.) Series 2018 A, 4% 8/15/48 | 7,240,000 | 8,175,696 | |
| Pennsylvania Ctfs. Prtn. Series 2018 A: | |||
| 5% 7/1/35 | 750,000 | 924,975 | |
| 5% 7/1/36 | 1,000,000 | 1,229,269 | |
| 5% 7/1/37 | 800,000 | 981,870 | |
| 5% 7/1/38 | 750,000 | 918,401 | |
| 5% 7/1/43 | 2,000,000 | 2,423,098 | |
| Pennsylvania Higher Edl. Facilities Auth. Rev.: | |||
| (Drexel Univ. Proj.) Series 2016, 5% 5/1/35 | 1,585,000 | 1,891,523 | |
| Series 2016: | |||
| 5% 5/1/29 | 1,000,000 | 1,199,920 | |
| 5% 5/1/31 | 1,000,000 | 1,197,396 | |
| Pennsylvania Pub. School Bldg. Auth. School Rev. (The School District of The City of Harrisburg Proj.) Series 2016 A: | |||
| 5% 12/1/29 | 4,865,000 | 5,958,999 | |
| 5% 12/1/29 (Pre-Refunded to 12/1/26 @ 100) | 765,000 | 944,398 | |
| Pennsylvania State Univ. Series 2020 A, 4% 9/1/50 | 4,100,000 | 4,857,937 | |
| Pennsylvania Tpk. Commission Tpk. Rev. Series 2021 A, 4% 12/1/50 | 18,000,000 | 21,238,711 | |
| Philadelphia Arpt. Rev. Series 2017 A: | |||
| 5% 7/1/28 | 500,000 | 623,187 | |
| 5% 7/1/29 | 500,000 | 623,092 | |
| 5% 7/1/30 | 550,000 | 683,380 | |
| 5% 7/1/31 | 600,000 | 743,004 | |
| 5% 7/1/32 | 550,000 | 679,587 | |
| 5% 7/1/33 | 600,000 | 741,227 | |
| 5% 7/1/42 | 2,390,000 | 2,953,413 | |
| 5% 7/1/47 | 2,000,000 | 2,472,373 | |
| Philadelphia Auth. for Indl. Dev. Series 2017, 5% 11/1/47 | 11,090,000 | 12,971,985 | |
| Philadelphia Gas Works Rev.: | |||
| Series 16 A, 4% 8/1/45 (FSA Insured) | 2,315,000 | 2,760,100 | |
| Series 2015: | |||
| 5% 8/1/26 | 1,000,000 | 1,180,393 | |
| 5% 8/1/27 | 1,000,000 | 1,176,912 | |
| 5% 8/1/28 | 2,000,000 | 2,348,619 | |
| Philadelphia Gen. Oblig.: | |||
| Series 2019 A: | |||
| 5% 8/1/23 | 1,740,000 | 1,908,999 | |
| 5% 8/1/25 | 4,665,000 | 5,530,998 | |
| Series 2019 B: | |||
| 5% 2/1/33 | 1,600,000 | 2,080,054 | |
| 5% 2/1/36 | 1,485,000 | 1,908,063 | |
| 5% 2/1/37 | 1,915,000 | 2,450,904 | |
| Philadelphia School District: | |||
| Series 2016 F, 5% 9/1/29 | 3,475,000 | 4,210,228 | |
| Series 2018 A: | |||
| 5% 9/1/34 | 1,450,000 | 1,828,439 | |
| 5% 9/1/35 | 1,000,000 | 1,257,699 | |
| Series 2018 B, 5% 9/1/43 | 1,395,000 | 1,727,955 | |
| Series 2019 A: | |||
| 4% 9/1/35 | 2,305,000 | 2,774,417 | |
| 4% 9/1/36 | 2,000,000 | 2,401,753 | |
| 5% 9/1/31 | 1,165,000 | 1,517,907 | |
| 5% 9/1/33 | 2,060,000 | 2,677,656 | |
| 5% 9/1/33 | 6,870,000 | 8,899,109 | |
| Pittsburgh & Allegheny County Parking Sys. Series 2017: | |||
| 5% 12/15/35 | 1,125,000 | 1,402,462 | |
| 5% 12/15/37 | 500,000 | 621,572 | |
| Pittsburgh Wtr. & Swr. Auth. Wtr. & Swr. Sys. Rev. Series 2019 B, 5% 9/1/32 (FSA Insured) | 2,000,000 | 2,782,300 | |
| Pocono Mountains Indl. Park Auth. (St. Luke's Hosp. - Monroe Proj.) Series 2015 A, 5% 8/15/40 | 1,795,000 | 2,015,482 | |
| Southcentral Pennsylvania Gen. Auth. Rev. Series 2019 A: | |||
| 4% 6/1/44 | 1,490,000 | 1,738,118 | |
| 4% 6/1/49 | 3,545,000 | 4,099,504 | |
| 5% 6/1/44 | 2,595,000 | 3,288,121 | |
| 5% 6/1/49 | 4,145,000 | 5,224,993 | |
| State Pub. School Bldg. Auth. Lease Rev. (Philadelphia School District Proj.) Series 2015 A, 5% 6/1/26 | 735,000 | 859,865 | |
| Union County Hosp. Auth. Rev. Series 2018 B: | |||
| 5% 8/1/33 | 1,000,000 | 1,179,172 | |
| 5% 8/1/38 | 3,205,000 | 3,775,436 | |
| 5% 8/1/48 | 2,850,000 | 3,356,432 | |
| TOTAL PENNSYLVANIA | 215,589,333 | ||
| Rhode Island - 0.4% | |||
| Rhode Island Health & Edl. Bldg. Corp. Higher Ed. Facilities Rev.: | |||
| Series 2016 B: | |||
| 5% 9/1/31 | 4,875,000 | 5,614,737 | |
| 5% 9/1/36 | 185,000 | 211,716 | |
| Series 2016, 5% 5/15/39 | 3,285,000 | 3,772,031 | |
| Rhode Island Hsg. & Mtg. Fin. Corp.: | |||
| Series 2019 70, 4% 10/1/49 | 1,240,000 | 1,371,712 | |
| Series 2021 74, 3% 4/1/49 | 5,390,000 | 5,938,727 | |
| TOTAL RHODE ISLAND | 16,908,923 | ||
| South Carolina - 2.9% | |||
| Charleston County Arpt. District Series 2019: | |||
| 5% 7/1/43 | 1,600,000 | 2,035,313 | |
| 5% 7/1/48 | 12,000,000 | 15,193,997 | |
| Scago Edl. Facilities Corp. for Colleton School District (School District of Colleton County Proj.) Series 2015, 5% 12/1/24 | 4,535,000 | 5,218,756 | |
| South Carolina Hsg. Fin. & Dev. Auth. Mtg. Rev. Series 2019 A, 4% 1/1/50 | 1,730,000 | 1,953,863 | |
| South Carolina Jobs-Econ. Dev. Auth. Series 2019 C, 5% 7/1/32 | 4,320,000 | 5,522,311 | |
| South Carolina Pub. Svc. Auth. Rev.: | |||
| Series 2013 E, 5.5% 12/1/53 | 14,025,000 | 15,615,795 | |
| Series 2014 A: | |||
| 5% 12/1/49 | 16,565,000 | 18,548,581 | |
| 5.5% 12/1/54 | 14,400,000 | 16,298,660 | |
| Series 2015 A, 5% 12/1/50 | 2,045,000 | 2,360,004 | |
| Series 2015 E, 5.25% 12/1/55 | 3,265,000 | 3,859,395 | |
| Series 2016 B: | |||
| 5% 12/1/35 | 3,630,000 | 4,412,772 | |
| 5% 12/1/36 | 5,445,000 | 6,611,625 | |
| Series 2016 C: | |||
| 5% 12/1/22 | 500,000 | 531,860 | |
| 5% 12/1/23 | 840,000 | 932,595 | |
| 5% 12/1/24 | 515,000 | 594,500 | |
| 5% 12/1/25 | 600,000 | 715,872 | |
| 5% 12/1/26 | 1,000,000 | 1,227,812 | |
| 5% 12/1/27 | 1,600,000 | 1,961,500 | |
| South Carolina Trans. Infrastructure Bank Rev. Series 2015 A, 5% 10/1/23 | 1,430,000 | 1,580,396 | |
| Spartanburg County Reg'l. Health Series 2017 A: | |||
| 4% 4/15/43 | 9,915,000 | 11,427,328 | |
| 4% 4/15/48 | 6,915,000 | 7,960,775 | |
| 5% 4/15/48 | 9,380,000 | 11,458,677 | |
| TOTAL SOUTH CAROLINA | 136,022,387 | ||
| South Dakota - 0.2% | |||
| South Dakota Health & Edl. Facilities Auth. Rev.: | |||
| Series 2014 B, 5% 11/1/44 | 5,000,000 | 5,677,542 | |
| Series 2017: | |||
| 5% 7/1/30 | 850,000 | 1,043,997 | |
| 5% 7/1/35 | 725,000 | 880,480 | |
| TOTAL SOUTH DAKOTA | 7,602,019 | ||
| Tennessee - 0.8% | |||
| Chattanooga Health Ed. & Hsg. Facility Board Rev.: | |||
| Series 2019 A1, 4% 8/1/44 | 1,800,000 | 2,099,878 | |
| Series 2019 A2: | |||
| 5% 8/1/37 | 860,000 | 1,093,188 | |
| 5% 8/1/44 | 1,190,000 | 1,491,765 | |
| Greeneville Health & Edl. Facilities Board Series 2018 A: | |||
| 5% 7/1/23 | 500,000 | 545,541 | |
| 5% 7/1/24 | 1,000,000 | 1,090,477 | |
| 5% 7/1/25 | 1,000,000 | 1,089,872 | |
| Nashville and Davidson County Metropolitan Govt. Health & Edl. Facilities Board Rev. (Lipscomb Univ. Proj.) Series 2019 A: | |||
| 4% 10/1/49 | 2,590,000 | 2,921,090 | |
| 5.25% 10/1/58 | 7,775,000 | 9,526,742 | |
| Shelby County Health Edl. & Hsg. Facilities Board Rev. (Methodist Le Bonheur Health Proj.) Series 2017 A: | |||
| 5% 5/1/22 | 705,000 | 730,408 | |
| 5% 5/1/23 | 1,600,000 | 1,734,587 | |
| 5% 5/1/25 | 1,300,000 | 1,513,897 | |
| 5% 5/1/27 | 1,230,000 | 1,514,106 | |
| 5% 5/1/29 | 1,240,000 | 1,505,587 | |
| 5% 5/1/30 | 2,395,000 | 2,892,070 | |
| 5% 5/1/31 | 1,260,000 | 1,520,615 | |
| Tennessee Energy Acquisition Corp. Bonds (Gas Rev. Proj.) Series A, 4%, tender 5/1/23 (a) | 6,645,000 | 7,046,282 | |
| TOTAL TENNESSEE | 38,316,105 | ||
| Texas - 6.0% | |||
| Arlington Spl. Tax Rev. Series 2018 C, 5% 2/15/45 (Build America Mutual Assurance Insured) | 820,000 | 821,341 | |
| Austin Wtr. & Wastewtr. Sys. Rev. Series 2016, 5% 11/15/37 | 4,010,000 | 4,917,096 | |
| Central Reg'l. Mobility Auth.: | |||
| Series 2015 A: | |||
| 5% 1/1/40 | 2,000,000 | 2,303,617 | |
| 5% 1/1/45 | 1,000,000 | 1,151,083 | |
| Series 2016: | |||
| 5% 1/1/40 | 3,000,000 | 3,518,009 | |
| 5% 1/1/46 | 1,800,000 | 2,110,879 | |
| Series 2020 A, 5% 1/1/49 | 3,940,000 | 4,956,871 | |
| Series 2020 B, 5% 1/1/45 | 1,750,000 | 2,210,652 | |
| Corpus Christi Util. Sys. Rev. Series 2012, 5% 7/15/23 | 3,400,000 | 3,556,081 | |
| Cypress-Fairbanks Independent School District Series 2016, 5% 2/15/27 | 1,885,000 | 2,270,587 | |
| Dallas Area Rapid Transit Sales Tax Rev.: | |||
| Series 2016 A, 5% 12/1/33 | 1,625,000 | 1,936,510 | |
| Series 2020 A, 5% 12/1/45 | 1,435,000 | 1,854,685 | |
| Dallas Fort Worth Int'l. Arpt. Rev. Series 2020 B: | |||
| 4% 11/1/34 | 3,410,000 | 4,241,947 | |
| 4% 11/1/35 | 3,030,000 | 3,761,765 | |
| Dallas Independent School District Bonds: | |||
| Series 2016, 5%, tender 2/15/22 (a) | 30,000 | 30,784 | |
| Series B6, 5%, tender 2/15/22 (a) | 775,000 | 795,455 | |
| Grand Parkway Trans. Corp. Series 2018 A: | |||
| 5% 10/1/36 | 5,000,000 | 6,294,821 | |
| 5% 10/1/37 | 10,000,000 | 12,576,668 | |
| 5% 10/1/43 | 5,500,000 | 6,865,728 | |
| Harris County Cultural Ed. Facilities Fin. Corp. Med. Facilities Rev. (Baylor College of Medicine Proj.) Series 2012 A, 5% 11/15/37 (Pre-Refunded to 11/15/22 @ 100) | 3,800,000 | 4,037,720 | |
| Harris County Toll Road Rev. (Harris County Toll Road Auth. Proj.) Series 2018 A, 5% 8/15/33 | 2,000,000 | 2,512,329 | |
| Houston Arpt. Sys. Rev. Series 2018 D: | |||
| 5% 7/1/29 | 1,900,000 | 2,436,043 | |
| 5% 7/1/30 | 2,500,000 | 3,188,690 | |
| 5% 7/1/31 | 2,250,000 | 2,865,679 | |
| 5% 7/1/32 | 2,000,000 | 2,545,434 | |
| 5% 7/1/39 | 7,080,000 | 8,888,812 | |
| Houston Gen. Oblig. Series 2017 A, 5% 3/1/29 | 1,080,000 | 1,333,022 | |
| Houston Util. Sys. Rev.: | |||
| Series 2014 C, 5% 5/15/28 | 1,485,000 | 1,677,329 | |
| Series 2016 B, 5% 11/15/33 | 1,400,000 | 1,724,887 | |
| Irving Hosp. Auth. Hosp. Rev. Series 2017 A: | |||
| 5% 10/15/33 | 1,055,000 | 1,245,841 | |
| 5% 10/15/34 | 1,670,000 | 1,972,259 | |
| 5% 10/15/35 | 1,215,000 | 1,432,088 | |
| 5% 10/15/44 | 835,000 | 983,302 | |
| Lower Colorado River Auth. Rev.: | |||
| (LCRA Transmission Svcs. Corp. Proj.) Series 2018: | |||
| 5% 5/15/33 | 4,510,000 | 5,677,981 | |
| 5% 5/15/35 | 2,125,000 | 2,666,066 | |
| Series 2015 B: | |||
| 5% 5/15/30 | 4,500,000 | 5,262,030 | |
| 5% 5/15/31 | 7,200,000 | 8,410,382 | |
| Series 2015 D: | |||
| 5% 5/15/27 | 1,500,000 | 1,757,711 | |
| 5% 5/15/29 | 2,150,000 | 2,514,081 | |
| New Hope Cultural Ed. Facilities Fin. Corp. (Childrens Med. Ctr. of Dallas) Series 2017 A: | |||
| 5% 8/15/28 | 1,500,000 | 1,875,609 | |
| 5% 8/15/47 | 1,205,000 | 1,473,133 | |
| Newark Higher Ed. Fin. Corp. (Abilene Christian Univ. Proj.) Series 2016 A, 5% 4/1/29 | 2,100,000 | 2,476,542 | |
| North Texas Tollway Auth. Rev.: | |||
| (Sr. Lien Proj.) Series 2017 A: | |||
| 5% 1/1/30 | 1,425,000 | 1,689,360 | |
| 5% 1/1/34 | 1,000,000 | 1,216,459 | |
| 5% 1/1/35 | 1,300,000 | 1,581,886 | |
| 5% 1/1/36 | 1,200,000 | 1,456,792 | |
| 5% 1/1/37 | 4,705,000 | 5,701,412 | |
| (Sub Lien Proj.) Series 2017 B: | |||
| 5% 1/1/30 | 265,000 | 313,275 | |
| 5% 1/1/31 | 370,000 | 435,878 | |
| 5% 1/1/33 | 1,500,000 | 1,818,794 | |
| Series 2008 I, 6.2% 1/1/42 (Pre-Refunded to 1/1/25 @ 100) | 1,700,000 | 2,043,993 | |
| Series 2014: | |||
| 5% 1/1/23 | 375,000 | 401,070 | |
| 5% 1/1/23 | 575,000 | 614,519 | |
| 5% 1/1/24 | 820,000 | 916,102 | |
| 5% 1/1/24 | 1,680,000 | 1,875,422 | |
| Series 2015 A, 5% 1/1/32 | 1,550,000 | 1,777,088 | |
| Series 2015 B, 5% 1/1/31 | 7,115,000 | 8,186,062 | |
| Series 2016 A: | |||
| 5% 1/1/32 | 3,000,000 | 3,567,406 | |
| 5% 1/1/39 | 1,000,000 | 1,186,257 | |
| Series 2017 A, 5% 1/1/43 | 4,100,000 | 5,049,866 | |
| Series 2018, 0% 1/1/29 (Assured Guaranty Corp. Insured) | 15,110,000 | 13,889,278 | |
| San Antonio Elec. & Gas Sys. Rev.: | |||
| Series 2012, 5.25% 2/1/25 | 1,600,000 | 1,876,424 | |
| Series 2017: | |||
| 5% 2/1/32 | 1,250,000 | 1,559,053 | |
| 5% 2/1/34 | 1,500,000 | 1,862,385 | |
| San Antonio Independent School District Series 2016, 5% 8/15/31 | 2,010,000 | 2,444,356 | |
| San Antonio Wtr. Sys. Rev. Series 2012, 5% 5/15/26 | 2,560,000 | 2,657,696 | |
| Southwest Higher Ed. Auth. Rev.: | |||
| (Southern Methodist Univ. Proj.) Series 2016 A: | |||
| 5% 10/1/40 | 3,525,000 | 4,228,626 | |
| 5% 10/1/45 | 4,000,000 | 4,790,099 | |
| (Southern Methodist Univ., TX. Proj.) Series 2017: | |||
| 5% 10/1/32 | 750,000 | 922,317 | |
| 5% 10/1/41 | 1,500,000 | 1,832,303 | |
| Tarrant County Cultural Ed. Facilities Fin. Corp. Hosp. Rev. Series 2015, 5% 9/1/30 | 5,000,000 | 5,560,138 | |
| Tarrant County Cultural Ed. Facilities Fin. Corp. Rev. Series 2016 A: | |||
| 5% 2/15/25 | 395,000 | 459,852 | |
| 5% 2/15/41 | 8,335,000 | 10,012,389 | |
| Texas Dept. of Hsg. & Cmnty. Affairs Multi-family Hsg. Rev. Series 2019, 2.95% 7/1/36 | 3,572,502 | 3,805,379 | |
| Texas Dept. of Hsg. & Cmnty. Affairs Single Family Mtg. Rev.: | |||
| Series 2019 A, 4% 3/1/50 | 3,600,000 | 4,096,434 | |
| Series A, 3.5% 3/1/51 | 3,095,000 | 3,489,725 | |
| Texas Gen. Oblig. Series 2016, 5% 4/1/41 | 3,120,000 | 3,721,340 | |
| Texas Private Activity Bond Surface Trans. Corp. (LBJ Infrastructure Group LLC I-635 Managed Lanes Proj.) Series 2020 A: | |||
| 4% 12/31/36 | 2,035,000 | 2,451,235 | |
| 4% 6/30/37 | 3,000,000 | 3,602,710 | |
| 4% 12/31/37 | 4,000,000 | 4,803,613 | |
| 4% 12/31/38 | 2,250,000 | 2,693,330 | |
| Texas State Univ. Sys. Fing. Rev.: | |||
| Series 2017 A: | |||
| 5% 3/15/28 | 3,045,000 | 3,791,673 | |
| 5% 3/15/31 | 2,000,000 | 2,461,847 | |
| Series 2019 A: | |||
| 4% 3/15/34 | 2,250,000 | 2,688,798 | |
| 4% 3/15/35 | 2,000,000 | 2,385,370 | |
| Texas Wtr. Dev. Board Rev.: | |||
| Series 2018 B, 5% 4/15/49 | 1,870,000 | 2,372,807 | |
| Series 2020: | |||
| 5% 8/1/25 | 1,000,000 | 1,186,953 | |
| 5% 8/1/26 | 2,400,000 | 2,943,125 | |
| Univ. of Houston Univ. Revs. Series 2017 A: | |||
| 5% 2/15/30 | 3,145,000 | 3,753,130 | |
| 5% 2/15/33 | 3,500,000 | 4,162,543 | |
| Univ. of Texas Permanent Univ. Fund Rev. Series 2016 B, 5% 7/1/29 | 940,000 | 1,138,951 | |
| TOTAL TEXAS | 282,607,069 | ||
| Utah - 1.2% | |||
| Salt Lake City Arpt. Rev.: | |||
| Series 2017 B: | |||
| 5% 7/1/34 | 1,640,000 | 2,018,309 | |
| 5% 7/1/35 | 1,500,000 | 1,844,753 | |
| 5% 7/1/36 | 1,500,000 | 1,844,992 | |
| 5% 7/1/37 | 1,000,000 | 1,230,146 | |
| 5% 7/1/47 | 1,525,000 | 1,865,496 | |
| Series 2018 B: | |||
| 5% 7/1/43 | 3,000,000 | 3,740,214 | |
| 5% 7/1/48 | 3,000,000 | 3,729,239 | |
| Series 2021 B: | |||
| 5% 7/1/46 (d) | 5,535,000 | 7,223,708 | |
| 5% 7/1/51 (d) | 22,305,000 | 29,020,953 | |
| Utah County Hosp. Rev. Series 2020 A, 5% 5/15/50 | 2,015,000 | 2,584,325 | |
| TOTAL UTAH | 55,102,135 | ||
| Vermont - 0.2% | |||
| Vermont Edl. & Health Bldg. Fin. Agcy. Rev.: | |||
| (Champlain College Proj.) Series 2016 A: | |||
| 5% 10/15/41 | 2,400,000 | 2,762,515 | |
| 5% 10/15/46 | 2,800,000 | 3,204,064 | |
| (Middlebury College Proj.) Series 2020, 4% 11/1/50 | 4,500,000 | 5,226,465 | |
| TOTAL VERMONT | 11,193,044 | ||
| Virginia - 1.1% | |||
| Chesapeake Gen. Oblig. Series 2020 A: | |||
| 5% 8/1/34 | 1,185,000 | 1,595,626 | |
| 5% 8/1/35 | 1,305,000 | 1,753,038 | |
| Fredericksburg Econ. Dev. Auth. Rev. Series 2014, 5% 6/15/26 | 1,960,000 | 2,215,015 | |
| Stafford County Econ. Dev. Auth. Hosp. Facilities Rev.: | |||
| (Mary Washington Hosp. Proj.) Series 2016, 3% 6/15/29 | 370,000 | 398,813 | |
| Series 2016: | |||
| 4% 6/15/37 | 345,000 | 386,144 | |
| 5% 6/15/28 | 1,000,000 | 1,200,684 | |
| 5% 6/15/33 | 225,000 | 265,765 | |
| 5% 6/15/36 | 1,000,000 | 1,176,768 | |
| Virginia College Bldg. Auth. Edl. Facilities Rev.: | |||
| (21St Century Collage and Equip. Programs) Series 2021 A, 4% 2/1/35 | 17,055,000 | 21,157,887 | |
| Series 2015 A, 5% 1/1/40 | 1,400,000 | 1,595,448 | |
| Virginia Commonwealth Trans. Board Rev. (Virginia Gen. Oblig. Proj.) Series 2017 A: | |||
| 5% 5/15/32 | 475,000 | 593,933 | |
| 5% 5/15/33 | 2,000,000 | 2,494,789 | |
| Virginia Pub. Bldg. Auth. Pub. Facilities Rev. Series 2021 A1: | |||
| 5% 8/1/26 | 5,000,000 | 6,128,732 | |
| 5% 8/1/27 | 5,000,000 | 6,331,740 | |
| Winchester Econ. Dev. Auth. Series 2015, 5% 1/1/44 | 2,500,000 | 2,906,108 | |
| TOTAL VIRGINIA | 50,200,490 | ||
| Washington - 3.2% | |||
| Chelan County Pub. Util. District #1 Columbia River-Rock Island Hydro-Elec. Sys. Rev. Series A, 0% 6/1/28 (Nat'l. Pub. Fin. Guarantee Corp. Insured) | 1,200,000 | 1,114,648 | |
| Port of Seattle Rev. Series 2016: | |||
| 5% 2/1/25 | 1,250,000 | 1,453,197 | |
| 5% 2/1/28 | 2,000,000 | 2,393,283 | |
| Spokane Pub. Facilities District Hotel/Motel Tax & Sales/Use Tax Rev. Series 2013 B, 5% 12/1/26 (Pre-Refunded to 6/1/23 @ 100) | 3,880,000 | 4,227,837 | |
| Tacoma Elec. Sys. Rev. Series 2017: | |||
| 5% 1/1/37 | 1,000,000 | 1,211,190 | |
| 5% 1/1/38 | 1,000,000 | 1,209,416 | |
| Tobacco Settlement Auth. Rev. Series 2013, 5% 6/1/22 | 3,500,000 | 3,639,385 | |
| Washington Gen. Oblig.: | |||
| Series 2015 C: | |||
| 5% 2/1/33 | 1,500,000 | 1,738,153 | |
| 5% 2/1/34 | 2,400,000 | 2,778,324 | |
| Series 2017 D, 5% 2/1/33 | 2,100,000 | 2,584,168 | |
| Series 2018 D, 5% 8/1/33 | 5,450,000 | 6,817,747 | |
| Series 2021 A, 5% 8/1/43 | 2,005,000 | 2,620,776 | |
| Series 2021 C, 5% 2/1/43 | 29,830,000 | 39,406,346 | |
| Series R-2017 A: | |||
| 5% 8/1/27 | 945,000 | 1,158,855 | |
| 5% 8/1/28 | 945,000 | 1,158,855 | |
| 5% 8/1/30 | 945,000 | 1,157,806 | |
| Washington Health Care Facilities Auth. Rev.: | |||
| (Overlake Hosp. Med. Ctr., WA. Proj.) Series 2017 B: | |||
| 5% 7/1/29 | 405,000 | 510,915 | |
| 5% 7/1/31 | 860,000 | 1,074,535 | |
| 5% 7/1/34 | 2,645,000 | 3,281,017 | |
| 5% 7/1/35 | 2,350,000 | 2,911,303 | |
| 5% 7/1/36 | 2,250,000 | 2,781,529 | |
| 5% 7/1/42 | 9,220,000 | 11,276,037 | |
| (Providence Health Systems Proj.): | |||
| Series 2012 A, 5% 10/1/24 | 6,700,000 | 7,088,176 | |
| Series 2018 B: | |||
| 5% 10/1/30 | 1,200,000 | 1,537,481 | |
| 5% 10/1/31 | 1,500,000 | 1,915,058 | |
| 5% 10/1/32 | 1,035,000 | 1,319,670 | |
| 5% 10/1/33 | 2,500,000 | 3,182,921 | |
| (Virginia Mason Med. Ctr. Proj.) Series 2017: | |||
| 5% 8/15/29 | 2,250,000 | 2,722,876 | |
| 5% 8/15/30 | 1,000,000 | 1,203,506 | |
| Series 2015, 5% 1/1/26 | 2,000,000 | 2,341,288 | |
| Series 2017 B, 4% 8/15/41 | 7,250,000 | 8,353,343 | |
| Series 2019 A1: | |||
| 5% 8/1/34 | 1,895,000 | 2,424,435 | |
| 5% 8/1/37 | 1,000,000 | 1,271,149 | |
| Series 2019 A2: | |||
| 5% 8/1/35 | 2,855,000 | 3,647,331 | |
| 5% 8/1/39 | 1,120,000 | 1,417,707 | |
| Series 2020, 5% 9/1/55 | 10,080,000 | 12,958,595 | |
| Washington Higher Ed. Facilities Auth. Rev. (Whitworth Univ. Proj.) Series 2016 A: | |||
| 5% 10/1/34 | 1,600,000 | 1,885,669 | |
| 5% 10/1/35 | 1,000,000 | 1,176,701 | |
| 5% 10/1/40 | 1,625,000 | 1,897,647 | |
| Washington Hsg. Fin. Commission Nonprofit Hsg. Rev. (Judson Park Proj.) Series 2018: | |||
| 4% 7/1/28 (c) | 100,000 | 107,476 | |
| 5% 7/1/33 (c) | 325,000 | 357,646 | |
| 5% 7/1/38 (c) | 100,000 | 109,340 | |
| 5% 7/1/48 (c) | 300,000 | 325,458 | |
| TOTAL WASHINGTON | 153,748,795 | ||
| West Virginia - 0.2% | |||
| West Virginia Hosp. Fin. Auth. Hosp. Rev. Series 2018 A, 5% 1/1/33 | 1,840,000 | 2,309,171 | |
| West Virginia Parkways Auth. Series 2021, 5% 6/1/47 | 6,000,000 | 7,874,108 | |
| TOTAL WEST VIRGINIA | 10,183,279 | ||
| Wisconsin - 1.5% | |||
| Blue Ridge Healthcare Pub. Fin. Auth. Series 2020 A, 4% 1/1/45 | 1,500,000 | 1,741,615 | |
| Pub. Fin. Auth. Sr Liv Rev. (Mary's Woods At Marylhurst, Inc. Proj.) Series 2017 A: | |||
| 5% 5/15/25 (c) | 530,000 | 586,418 | |
| 5% 5/15/28 (c) | 580,000 | 643,018 | |
| 5.25% 5/15/37 (c) | 190,000 | 210,667 | |
| 5.25% 5/15/42 (c) | 235,000 | 260,112 | |
| 5.25% 5/15/47 (c) | 235,000 | 260,112 | |
| 5.25% 5/15/52 (c) | 435,000 | 481,483 | |
| Pub. Fin. Auth. Edl. Facilities Series 2018 A: | |||
| 5.25% 10/1/43 | 610,000 | 717,130 | |
| 5.25% 10/1/48 | 610,000 | 714,130 | |
| Pub. Fin. Auth. Hosp. Rev. Series 2019 A, 5% 10/1/44 | 4,565,000 | 5,640,089 | |
| Pub. Fin. Auth. Wisconsin Retirement Facility Rev. Series 2018: | |||
| 5% 10/1/43 (c) | 515,000 | 574,690 | |
| 5% 10/1/48 (c) | 660,000 | 733,993 | |
| 5% 10/1/53 (c) | 1,710,000 | 1,898,118 | |
| Roseman Univ. of Health: | |||
| Series 2020, 5% 4/1/50 (c) | 1,085,000 | 1,300,636 | |
| Series 2021 A, 4.5% 6/1/56 (d) | 7,965,000 | 7,965,000 | |
| Series 2021 B, 6.5% 6/1/56 (d) | 3,825,000 | 3,825,000 | |
| Wisconsin Health & Edl. Facilities: | |||
| Bonds Series 2018 B, 5%, tender 1/29/25 (a) | 10,000,000 | 11,600,496 | |
| Series 2014: | |||
| 4% 5/1/33 | 1,475,000 | 1,574,393 | |
| 5% 5/1/23 | 1,410,000 | 1,520,860 | |
| 5% 5/1/25 | 775,000 | 867,136 | |
| Series 2015, 5% 12/15/44 | 10,000,000 | 11,433,346 | |
| Series 2017 A: | |||
| 5% 9/1/30 (Pre-Refunded to 9/1/27 @ 100) | 1,270,000 | 1,589,232 | |
| 5% 9/1/32 (Pre-Refunded to 9/1/27 @ 100) | 1,100,000 | 1,376,501 | |
| Series 2019 A: | |||
| 2.25% 11/1/26 | 1,055,000 | 1,056,336 | |
| 5% 11/1/39 | 4,210,000 | 4,608,831 | |
| Series 2019 B1, 2.825% 11/1/28 | 1,190,000 | 1,192,463 | |
| Series 2019 B2, 2.55% 11/1/27 | 760,000 | 761,272 | |
| Wisconsin Health & Edl. Facilities Auth. Rev. Series 2012: | |||
| 5% 10/1/24 | 1,400,000 | 1,478,490 | |
| 5% 6/1/27 | 1,000,000 | 1,037,168 | |
| 5% 6/1/39 | 1,190,000 | 1,232,814 | |
| Wisconsin St Gen. Fund Annual Appropriation Series 2019 A, 5% 5/1/29 | 3,000,000 | 3,740,875 | |
| TOTAL WISCONSIN | 72,622,424 | ||
| TOTAL MUNICIPAL BONDS | |||
| (Cost $4,225,990,650) | 4,599,615,984 | ||
| Shares | Value | ||
| Money Market Funds - 4.8% | |||
| Fidelity Tax-Free Cash Central Fund 0.04% (f)(g) | |||
| (Cost $225,330,014) | 225,275,643 | 225,343,208 | |
| TOTAL INVESTMENT IN SECURITIES - 101.7% | |||
| (Cost $4,451,320,664) | 4,824,959,192 | ||
| NET OTHER ASSETS (LIABILITIES) - (1.7)% | (78,483,139) | ||
| NET ASSETS - 100% | $4,746,476,053 |
Legend
(a) Coupon rates for floating and adjustable rate securities reflect the rates in effect at period end.
(b) Coupon is indexed to a floating interest rate which may be multiplied by a specified factor and/or subject to caps or floors.
(c) Security exempt from registration under Rule 144A of the Securities Act of 1933. These securities may be resold in transactions exempt from registration, normally to qualified institutional buyers. At the end of the period, the value of these securities amounted to $35,702,094 or 0.8% of net assets.
(d) Security or a portion of the security purchased on a delayed delivery or when-issued basis.
(e) Security initially issued in zero coupon form which converts to coupon form at a specified rate and date. The rate shown is the rate at period end.
(f) Information in this report regarding holdings by state and security types does not reflect the holdings of the Fidelity Tax-Free Cash Central Fund.
(g) Affiliated fund that is available only to investment companies and other accounts managed by Fidelity Investments. The rate quoted is the annualized seven-day yield of the fund at period end. A complete unaudited listing of the fund's holdings as of its most recent quarter end is available upon request. In addition, each Fidelity Central Fund's financial statements are available on the SEC's website or upon request.
Affiliated Central Funds
Information regarding fiscal year to date income earned by the Fund from investments in Fidelity Central Funds is as follows:
| Fund | Income earned |
| Fidelity Tax-Free Cash Central Fund | $46,700 |
| Total | $46,700 |
Amounts in the income column in the above table include any capital gain distributions from underlying funds, which are presented in the corresponding line-item in the Statement of Operations, if applicable.
Fiscal year to date information regarding the Fund's investments in Fidelity Central Funds, including the ownership percentage, is presented below.
| Fund | Value, beginning of period | Purchases | Sales Proceeds | Realized Gain/Loss | Change in Unrealized appreciation (depreciation) | Value, end of period | % ownership, end of period |
| Fidelity Tax-Free Cash Central Fund 0.04% | $144,334,000 | $347,725,981 | $266,731,000 | $1,033 | $13,194 | $225,343,208 | 19.2% |
| Total | $144,334,000 | $347,725,981 | $266,731,000 | $1,033 | $13,194 | $225,343,208 |
Investment Valuation
The following is a summary of the inputs used, as of July 31, 2021, involving the Fund's assets and liabilities carried at fair value. The inputs or methodology used for valuing securities may not be an indication of the risk associated with investing in those securities. For more information on valuation inputs, and their aggregation into the levels used below, please refer to the Investment Valuation section in the accompanying Notes to Financial Statements.
| Valuation Inputs at Reporting Date: | ||||
| Description | Total | Level 1 | Level 2 | Level 3 |
| Investments in Securities: | ||||
| Municipal Securities | $4,599,615,984 | $-- | $4,599,615,984 | $-- |
| Money Market Funds | 225,343,208 | 225,343,208 | -- | -- |
| Total Investments in Securities: | $4,824,959,192 | $225,343,208 | $4,599,615,984 | $-- |
Other Information
The distribution of municipal securities by revenue source, as a percentage of total Net Assets, is as follows (Unaudited):
| General Obligations | 26.4% |
| Health Care | 20.7% |
| Transportation | 17.5% |
| Education | 7.3% |
| Special Tax | 6.9% |
| Electric Utilities | 6.5% |
| Others* (Individually Less Than 5%) | 14.7% |
| 100.0% |
* Includes net other assets
See accompanying notes which are an integral part of the financial statements.
Financial Statements
Statement of Assets and Liabilities
| July 31, 2021 (Unaudited) | ||
| Assets | ||
| Investment in securities, at value — See accompanying schedule: Unaffiliated issuers (cost $4,225,990,650) | $4,599,615,984 | |
| Fidelity Central Funds (cost $225,330,014) | 225,343,208 | |
| Total Investment in Securities (cost $4,451,320,664) | $4,824,959,192 | |
| Cash | 142,805 | |
| Receivable for fund shares sold | 2,053,414 | |
| Interest receivable | 42,203,513 | |
| Distributions receivable from Fidelity Central Funds | 5,853 | |
| Receivable from investment adviser for expense reductions | 801,053 | |
| Other receivables | 4,592 | |
| Total assets | 4,870,170,422 | |
| Liabilities | ||
| Payable for investments purchased on a delayed delivery basis | $115,050,792 | |
| Payable for fund shares redeemed | 1,857,756 | |
| Distributions payable | 4,965,725 | |
| Accrued management fee | 1,362,456 | |
| Other affiliated payables | 397,678 | |
| Other payables and accrued expenses | 59,962 | |
| Total liabilities | 123,694,369 | |
| Net Assets | $4,746,476,053 | |
| Net Assets consist of: | ||
| Paid in capital | $4,363,267,072 | |
| Total accumulated earnings (loss) | 383,208,981 | |
| Net Assets | $4,746,476,053 | |
| Net Asset Value, offering price and redemption price per share ($4,746,476,053 ÷ 384,278,900 shares) | $12.35 |
See accompanying notes which are an integral part of the financial statements.
Statement of Operations
| Six months ended July 31, 2021 (Unaudited) | ||
| Investment Income | ||
| Interest | $60,137,957 | |
| Income from Fidelity Central Funds | 46,700 | |
| Total income | 60,184,657 | |
| Expenses | ||
| Management fee | $7,907,008 | |
| Transfer agent fees | 2,018,717 | |
| Accounting fees and expenses | 320,297 | |
| Custodian fees and expenses | 21,090 | |
| Independent trustees' fees and expenses | 5,815 | |
| Registration fees | 79,041 | |
| Audit | 30,131 | |
| Legal | 6,897 | |
| Miscellaneous | 11,101 | |
| Total expenses before reductions | 10,400,097 | |
| Expense reductions | (4,773,263) | |
| Total expenses after reductions | 5,626,834 | |
| Net investment income (loss) | 54,557,823 | |
| Realized and Unrealized Gain (Loss) | ||
| Net realized gain (loss) on: | ||
| Investment securities: | ||
| Unaffiliated issuers | 9,447,493 | |
| Fidelity Central Funds | 1,033 | |
| Total net realized gain (loss) | 9,448,526 | |
| Change in net unrealized appreciation (depreciation) on: | ||
| Investment securities: | ||
| Unaffiliated issuers | 27,731,550 | |
| Fidelity Central Funds | 13,194 | |
| Total change in net unrealized appreciation (depreciation) | 27,744,744 | |
| Net gain (loss) | 37,193,270 | |
| Net increase (decrease) in net assets resulting from operations | $91,751,093 |
See accompanying notes which are an integral part of the financial statements.
Statement of Changes in Net Assets
| Six months ended July 31, 2021 (Unaudited) | Year ended January 31, 2021 | |
| Increase (Decrease) in Net Assets | ||
| Operations | ||
| Net investment income (loss) | $54,557,823 | $109,918,319 |
| Net realized gain (loss) | 9,448,526 | 7,566,446 |
| Change in net unrealized appreciation (depreciation) | 27,744,744 | 22,377,211 |
| Net increase (decrease) in net assets resulting from operations | 91,751,093 | 139,861,976 |
| Distributions to shareholders | (54,521,728) | (121,502,501) |
| Share transactions | ||
| Proceeds from sales of shares | 511,055,266 | 1,043,223,645 |
| Reinvestment of distributions | 25,383,751 | 57,315,370 |
| Cost of shares redeemed | (302,102,740) | (1,102,822,650) |
| Net increase (decrease) in net assets resulting from share transactions | 234,336,277 | (2,283,635) |
| Total increase (decrease) in net assets | 271,565,642 | 16,075,840 |
| Net Assets | ||
| Beginning of period | 4,474,910,411 | 4,458,834,571 |
| End of period | $4,746,476,053 | $4,474,910,411 |
| Other Information | ||
| Shares | ||
| Sold | 41,757,520 | 87,410,198 |
| Issued in reinvestment of distributions | 2,080,780 | 4,802,393 |
| Redeemed | (24,783,596) | (94,544,900) |
| Net increase (decrease) | 19,054,704 | (2,332,309) |
See accompanying notes which are an integral part of the financial statements.
Financial Highlights
Fidelity Tax-Free Bond Fund
| Six months ended (Unaudited) July 31, | Years endedJanuary 31, | |||||
| 2021 | 2021 | 2020 | 2019 | 2018 | 2017 | |
| Selected Per–Share Data | ||||||
| Net asset value, beginning of period | $12.25 | $12.13 | $11.37 | $11.39 | $11.30 | $11.77 |
| Income from Investment Operations | ||||||
| Net investment income (loss)A | .146 | .312 | .337 | .340 | .352 | .377 |
| Net realized and unrealized gain (loss) | .100 | .152 | .772 | .003 | .139 | (.408) |
| Total from investment operations | .246 | .464 | 1.109 | .343 | .491 | (.031) |
| Distributions from net investment income | (.146) | (.312) | (.337) | (.340) | (.352) | (.377) |
| Distributions from net realized gain | – | (.032) | (.012) | (.023) | (.049) | (.062) |
| Total distributions | (.146) | (.344) | (.349) | (.363) | (.401) | (.439) |
| Redemption fees added to paid in capitalA | – | – | – | – | – | –B |
| Net asset value, end of period | $12.35 | $12.25 | $12.13 | $11.37 | $11.39 | $11.30 |
| Total ReturnC,D | 2.03% | 3.94% | 9.87% | 3.09% | 4.38% | (.31)% |
| Ratios to Average Net AssetsE,F | ||||||
| Expenses before reductions | .46%G | .46% | .46% | .46% | .46% | .46% |
| Expenses net of fee waivers, if any | .25%G | .25% | .25% | .25% | .25% | .25% |
| Expenses net of all reductions | .25%G | .25% | .25% | .25% | .25% | .25% |
| Net investment income (loss) | 2.42%G | 2.62% | 2.86% | 3.02% | 3.06% | 3.21% |
| Supplemental Data | ||||||
| Net assets, end of period (000 omitted) | $4,746,476 | $4,474,910 | $4,458,835 | $3,611,503 | $3,777,700 | $3,121,388 |
| Portfolio turnover rateH | 7%G | 19% | 8% | 23% | 17% | 23% |
A Calculated based on average shares outstanding during the period.
B Amount represents less than $.0005 per share.
C Total returns for periods of less than one year are not annualized.
D Total returns would have been lower if certain expenses had not been reduced during the applicable periods shown.
E Fees and expenses of any underlying mutual funds or exchange-traded funds (ETFs) are not included in the Fund's expense ratio. The Fund indirectly bears its proportionate share of these expenses. For additional expense information related to investments in Fidelity Central Funds, please refer to the "Investments in Fidelity Central Funds" note found in the Notes to Financial Statements section of the most recent Annual or Semi-Annual report.
F Expense ratios reflect operating expenses of the class. Expenses before reductions do not reflect amounts reimbursed, waived, or reduced through arrangements with the investment advisor, brokerage services, or other offset arrangements, if applicable, and do not represent the amount paid by the class during periods when reimbursements, waivers or reductions occur.
G Annualized
H Amount does not include the portfolio activity of any underlying mutual funds or exchange-traded funds (ETFs).
See accompanying notes which are an integral part of the financial statements.
Notes to Financial Statements (Unaudited)
For the period ended July 31, 2021
1. Organization.
Fidelity Tax-Free Bond Fund (the Fund) is a fund of Fidelity Salem Street Trust (the Trust) and is authorized to issue an unlimited number of shares. Share transactions on the Statement of Changes in Net Assets may contain exchanges between affiliated funds. The Trust is registered under the Investment Company Act of 1940, as amended (the 1940 Act), as an open-end management investment company organized as a Massachusetts business trust.
2. Investments in Fidelity Central Funds.
Funds may invest in Fidelity Central Funds, which are open-end investment companies generally available only to other investment companies and accounts managed by the investment adviser and its affiliates. The Schedule of Investments lists any Fidelity Central Funds held as an investment as of period end, but does not include the underlying holdings of each Fidelity Central Fund. An investing fund indirectly bears its proportionate share of the expenses of the underlying Fidelity Central Funds.
Based on its investment objective, each Fidelity Central Fund may invest or participate in various investment vehicles or strategies that are similar to those of the investing fund. These strategies are consistent with the investment objectives of the investing fund and may involve certain economic risks which may cause a decline in value of each of the Fidelity Central Funds and thus a decline in the value of the investing fund.
| Fidelity Central Fund | Investment Manager | Investment Objective | Investment Practices | Expense Ratio |
| Fidelity Money Market Central Funds | Fidelity Management & Research Company LLC (FMR) | Each fund seeks to obtain a high level of current income consistent with the preservation of capital and liquidity. | Short-term Investments | Less than .005% to .01% |
A complete unaudited list of holdings for each Fidelity Central Fund is available upon request or at the Securities and Exchange Commission website at www.sec.gov. In addition, the financial statements of the Fidelity Central Funds which contain the significant accounting policies (including investment valuation policies) of those funds, and are not covered by the Report of Independent Registered Public Accounting Firm, are available on the Securities and Exchange Commission website or upon request.
3. Significant Accounting Policies.
The Fund is an investment company and applies the accounting and reporting guidance of the Financial Accounting Standards Board (FASB) Accounting Standards Codification Topic 946 Financial Services - Investment Companies. The financial statements have been prepared in conformity with accounting principles generally accepted in the United States of America (GAAP), which require management to make certain estimates and assumptions at the date of the financial statements. Actual results could differ from those estimates. Subsequent events, if any, through the date that the financial statements were issued have been evaluated in the preparation of the financial statements. The Fund's Schedule of Investments lists any underlying mutual funds or exchange-traded funds (ETFs) but does not include the underlying holdings of these funds. The following summarizes the significant accounting policies of the Fund:
Investment Valuation. Investments are valued as of 4:00 p.m. Eastern time on the last calendar day of the period. The Board of Trustees (the Board) has delegated the day to day responsibility for the valuation of the Fund's investments to the Fair Value Committee (the Committee) established by the Fund's investment adviser. In accordance with valuation policies and procedures approved by the Board, the Fund attempts to obtain prices from one or more third party pricing vendors or brokers to value its investments. When current market prices, quotations or currency exchange rates are not readily available or reliable, investments will be fair valued in good faith by the Committee, in accordance with procedures adopted by the Board. Factors used in determining fair value vary by investment type and may include market or investment specific events, changes in interest rates and credit quality. The frequency with which these procedures are used cannot be predicted and they may be utilized to a significant extent. The Committee oversees the Fund's valuation policies and procedures and reports to the Board on the Committee's activities and fair value determinations. The Board monitors the appropriateness of the procedures used in valuing the Fund's investments and ratifies the fair value determinations of the Committee.
The Fund categorizes the inputs to valuation techniques used to value its investments into a disclosure hierarchy consisting of three levels as shown below:
- Level 1 – quoted prices in active markets for identical investments
- Level 2 – other significant observable inputs (including quoted prices for similar investments, interest rates, prepayment speeds, etc.)
- Level 3 – unobservable inputs (including the Fund's own assumptions based on the best information available)
Valuation techniques used to value the Fund's investments by major category are as follows:
Debt securities, including restricted securities, are valued based on evaluated prices received from third party pricing vendors or from brokers who make markets in such securities. Municipal securities are valued by pricing vendors who utilize matrix pricing which considers yield or price of bonds of comparable quality, coupon, maturity and type or by broker-supplied prices. When independent prices are unavailable or unreliable, debt securities may be valued utilizing pricing methodologies which consider similar factors that would be used by third party pricing vendors. Debt securities are generally categorized as Level 2 in the hierarchy but may be Level 3 depending on the circumstances.
Investments in open-end mutual funds, including the Fidelity Central Funds, are valued at their closing net asset value (NAV) each business day and are categorized as Level 1 in the hierarchy.
Changes in valuation techniques may result in transfers in or out of an assigned level within the disclosure hierarchy. The aggregate value of investments by input level as of July 31, 2021 is included at the end of the Fund's Schedule of Investments.
Investment Transactions and Income. For financial reporting purposes, the Fund's investment holdings and NAV include trades executed through the end of the last business day of the period. The NAV per share for processing shareholder transactions is calculated as of the close of business of the New York Stock Exchange (NYSE), normally 4:00 p.m. Eastern time and includes trades executed through the end of the prior business day. Gains and losses on securities sold are determined on the basis of identified cost. Income and capital gain distributions from Fidelity Central Funds, if any, are recorded on the ex-dividend date. Interest income is accrued as earned and includes coupon interest and amortization of premium and accretion of discount on debt securities as applicable. Debt obligations may be placed on non-accrual status and related interest income may be reduced by ceasing current accruals and writing off interest receivables when the collection of all or a portion of interest has become doubtful based on consistently applied procedures. A debt obligation is removed from non-accrual status when the issuer resumes interest payments or when collectability of interest is reasonably assured.
Expenses. Expenses directly attributable to a fund are charged to that fund. Expenses attributable to more than one fund are allocated among the respective funds on the basis of relative net assets or other appropriate methods. Expenses included in the accompanying financial statements reflect the expenses of that fund and do not include any expenses associated with any underlying mutual funds or exchange-traded funds. Although not included in a fund's expenses, a fund indirectly bears its proportionate share of these expenses through the net asset value of each underlying mutual fund or exchange-traded fund. Expense estimates are accrued in the period to which they relate and adjustments are made when actual amounts are known.
Income Tax Information and Distributions to Shareholders. Each year, the Fund intends to qualify as a regulated investment company under Subchapter M of the Internal Revenue Code, including distributing substantially all of its taxable income and realized gains. As a result, no provision for U.S. Federal income taxes is required. The Fund files a U.S. federal tax return, in addition to state and local tax returns as required. The Fund's federal income tax returns are subject to examination by the Internal Revenue Service (IRS) for a period of three fiscal years after they are filed. State and local tax returns may be subject to examination for an additional fiscal year depending on the jurisdiction.
Distributions are declared and recorded daily and paid monthly from net investment income. Distributions from realized gains, if any, are declared and recorded on the ex-dividend date. Income and capital gain distributions are determined in accordance with income tax regulations, which may differ from GAAP.
Capital accounts within the financial statements are adjusted for permanent book-tax differences. These adjustments have no impact on net assets or the results of operations. Capital accounts are not adjusted for temporary book-tax differences which will reverse in a subsequent period.
Book-tax differences are primarily due to the short-term gain distributions from the Fidelity Central Funds, market discount and excise tax regulations.
The Fund purchases municipal securities whose interest, in the opinion of the issuer, is free from federal income tax. There is no assurance that the IRS will agree with this opinion. In the event the IRS determines that the issuer does not comply with relevant tax requirements, interest payments from a security could become federally taxable, possibly retroactively to the date the security was issued.
As of period end, the cost and unrealized appreciation (depreciation) in securities, and derivatives if applicable, for federal income tax purposes were as follows:
| Gross unrealized appreciation | $374,233,290 |
| Gross unrealized depreciation | (261,476) |
| Net unrealized appreciation (depreciation) | $373,971,814 |
| Tax cost | $4,450,987,378 |
The Fund elected to defer to its next fiscal year approximately $33,824 of capital losses recognized during the period November 1, 2020 January 31, 2021.
Delayed Delivery Transactions and When-Issued Securities. During the period, certain Funds transacted in securities on a delayed delivery or when-issued basis. Payment and delivery may take place after the customary settlement period for that security. The price of the underlying securities and the date when the securities will be delivered and paid for are fixed at the time the transaction is negotiated. Securities purchased on a delayed delivery or when-issued basis are identified as such in the Schedule of Investments. Compensation for interest forgone in the purchase of a delayed delivery or when-issued debt security may be received. With respect to purchase commitments, each applicable Fund identifies securities as segregated in its records with a value at least equal to the amount of the commitment. Payables and receivables associated with the purchases and sales of delayed delivery securities having the same coupon, settlement date and broker are offset. Delayed delivery or when-issued securities that have been purchased from and sold to different brokers are reflected as both payables and receivables in the Statement of Assets and Liabilities under the caption "Delayed delivery", as applicable. Losses may arise due to changes in the value of the underlying securities or if the counterparty does not perform under the contract's terms, or if the issuer does not issue the securities due to political, economic, or other factors.
Restricted Securities (including Private Placements). Funds may invest in securities that are subject to legal or contractual restrictions on resale. These securities generally may be resold in transactions exempt from registration or to the public if the securities are registered. Disposal of these securities may involve time-consuming negotiations and expense, and prompt sale at an acceptable price may be difficult. Information regarding restricted securities held at period end is included at the end of the Schedule of Investments, if applicable.
4. Purchases and Sales of Investments.
Purchases and sales of securities, other than short-term securities and in-kind transactions, as applicable, are noted in the table below.
| Purchases ($) | Sales ($) | |
| Fidelity Tax-Free Bond Fund | 424,203,395 | 143,137,356 |
5. Fees and Other Transactions with Affiliates.
Management Fee. Fidelity Management & Research Company LLC (the investment adviser) and its affiliates provide the Fund with investment management related services for which the Fund pays a monthly management fee. The management fee is the sum of an individual fund fee rate that is based on an annual rate of .25% of the Fund's average net assets and an annualized group fee rate that averaged .10% during the period. The group fee rate is based upon the monthly average net assets of a group of registered investment companies with which the investment adviser has management contracts. The group fee rate decreases as assets under management increase and increases as assets under management decrease. For the reporting period, the total annualized management fee rate was .35% of the Fund's average net assets.
Transfer Agent Fees. Fidelity Investments Institutional Operations Company LLC (FIIOC), an affiliate of the investment adviser, is the transfer, dividend disbursing and shareholder servicing agent for the Fund. FIIOC receives account fees and asset-based fees that vary according to account size and type of account. FIIOC pays for typesetting, printing and mailing of shareholder reports, except proxy statements. For the period, transfer agent fees were equivalent to an annualized rate of .09% of average net assets.
Accounting Fees. Fidelity Service Company, Inc. (FSC), an affiliate of the investment adviser, maintains the Fund's accounting records. The accounting fee is based on the level of average net assets for each month. For the period, the fees were equivalent to the following annualized rates:
| % of Average Net Assets | |
| Fidelity Tax-Free Bond Fund | .01 |
Interfund Trades. Funds may purchase from or sell securities to other Fidelity Funds under procedures adopted by the Board. The procedures have been designed to ensure these interfund trades are executed in accordance with Rule 17a-7 of the 1940 Act. Any interfund trades are included within the respective purchases and sales amounts shown in the Purchases and Sales of Investments note.
6. Committed Line of Credit.
Certain Funds participate with other funds managed by the investment adviser or an affiliate in a $4.25 billion credit facility (the "line of credit") to be utilized for temporary or emergency purposes to fund shareholder redemptions or for other short-term liquidity purposes. The participating funds have agreed to pay commitment fees on their pro-rata portion of the line of credit, which are reflected in Miscellaneous expenses on the Statement of Operations, and are listed below. During the period, there were no borrowings on this line of credit.
| Amount | |
| Fidelity Tax-Free Bond Fund | $4,112 |
7. Expense Reductions.
The investment adviser contractually agreed to reimburse the Fund to the extent annual operating expenses exceeded .25% of average net assets. This reimbursement will remain in place through May 31, 2022. Some expenses, for example the compensation of the independent Trustees, and certain miscellaneous expenses such as proxy and shareholder meeting expenses, are excluded from this reimbursement. During the period this reimbursement reduced the Fund's expenses by $4,752,168.
In addition, through arrangements with the Fund's custodian, credits realized as a result of certain uninvested cash balances were used to reduce the Fund's expenses by $1,731.
In addition, during the period the investment adviser or an affiliate reimbursed and/or waived a portion of operating expenses in the amount of $19,364.
8. Other.
Fund's organizational documents provide former and current trustees and officers with a limited indemnification against liabilities arising in connection with the performance of their duties to the fund. In the normal course of business, the fund may also enter into contracts that provide general indemnifications. The fund's maximum exposure under these arrangements is unknown as this would be dependent on future claims that may be made against the fund. The risk of material loss from such claims is considered remote.
9. Coronavirus (COVID-19) Pandemic.
An outbreak of COVID-19 first detected in China during December 2019 has since spread globally and was declared a pandemic by the World Health Organization during March 2020. Developments that disrupt global economies and financial markets, such as the COVID-19 pandemic, may magnify factors that affect the Fund's performance.
Shareholder Expense Example
As a shareholder, you incur two types of costs: (1) transaction costs, which may include sales charges (loads) on purchase payments or redemption proceeds, as applicable and (2) ongoing costs, which generally include management fees, distribution and/or service (12b-1) fees and other Fund expenses. This Example is intended to help you understand your ongoing costs (in dollars) of investing in a fund and to compare these costs with the ongoing costs of investing in other mutual funds.
The Example is based on an investment of $1,000 invested at the beginning of the period and held for the entire period (February 1, 2021 to July 31, 2021).
Actual Expenses
The first line of the accompanying table provides information about actual account values and actual expenses. You may use the information in this line, together with the amount you invested, to estimate the expenses that you paid over the period. Simply divide your account value by $1,000.00 (for example, an $8,600 account value divided by $1,000.00 = 8.6), then multiply the result by the number in the first line for a class/Fund under the heading entitled "Expenses Paid During Period" to estimate the expenses you paid on your account during this period. If any fund is a shareholder of any underlying mutual funds or exchange-traded funds (ETFs) (the Underlying Funds), such fund indirectly bears its proportional share of the expenses of the Underlying Funds in addition to the direct expenses incurred presented in the table. These fees and expenses are not included in the annualized expense ratio used to calculate the expense estimate in the table below.
Hypothetical Example for Comparison Purposes
The second line of the accompanying table provides information about hypothetical account values and hypothetical expenses based on the actual expense ratio and an assumed rate of return of 5% per year before expenses, which is not the actual return. The hypothetical account values and expenses may not be used to estimate the actual ending account balance or expenses you paid for the period. You may use this information to compare the ongoing costs of investing in the Fund and other funds. To do so, compare this 5% hypothetical example with the 5% hypothetical examples that appear in the shareholder reports of the other funds. If any fund is a shareholder of any Underlying Funds, such fund indirectly bears its proportional share of the expenses of the Underlying Funds in addition to the direct expenses as presented in the table. These fees and expenses are not included in the annualized expense ratio used to calculate the expense estimate in the table below.
Please note that the expenses shown in the table are meant to highlight your ongoing costs only and do not reflect any transaction costs. Therefore, the second line of the table is useful in comparing ongoing costs only, and will not help you determine the relative total costs of owning different funds.
| Annualized Expense Ratio-A | Beginning Account Value February 1, 2021 | Ending Account Value July 31, 2021 | Expenses Paid During Period-B February 1, 2021 to July 31, 2021 |
|
| Fidelity Tax-Free Bond Fund | .25% | |||
| Actual | $1,000.00 | $1,020.30 | $1.25 | |
| Hypothetical-C | $1,000.00 | $1,023.55 | $1.25 |
A Annualized expense ratio reflects expenses net of applicable fee waivers.
B Expenses are equal to the annualized expense ratio, multiplied by the average account value over the period, multiplied by 181/ 365 (to reflect the one-half year period). The fees and expenses of any Underlying Funds are not included in each annualized expense ratio.
C 5% return per year before expenses
Liquidity Risk Management Program
The Securities and Exchange Commission adopted Rule 22e-4 under the Investment Company Act of 1940 (the Liquidity Rule) to promote effective liquidity risk management throughout the open-end investment company industry, thereby reducing the risk that funds will be unable to meet their redemption obligations and mitigating dilution of the interests of fund shareholders.
The Fund has adopted and implemented a liquidity risk management program pursuant to the Liquidity Rule (the Program) effective December 1, 2018. The Program is reasonably designed to assess and manage the Fund’s liquidity risk and to comply with the requirements of the Liquidity Rule. The Fund’s Board of Trustees (the Board) has designated the Fund’s investment adviser as administrator of the Program. The Fidelity advisers have established a Liquidity Risk Management Committee (the LRM Committee) to manage the Program for each of the Fidelity Funds. The LRM Committee monitors the adequacy and effectiveness of implementation of the Program and on a periodic basis assesses each Fund’s liquidity risk based on a variety of factors including (1) the Fund’s investment strategy, (2) portfolio liquidity and cash flow projections during normal and reasonably foreseeable stressed conditions, (3) shareholder redemptions, (4) borrowings and other funding sources and (5) in the case of exchange-traded funds, certain additional factors including the effect of the Fund’s prices and spreads, market participants, and basket compositions on the overall liquidity of the Fund’s portfolio, as applicable.
In accordance with the Program, each of the Fund’s portfolio investments is classified into one of four liquidity categories described below based on a determination of a reasonable expectation for how long it would take to convert the investment to cash (or sell or dispose of the investment) without significantly changing its market value.
- Highly liquid investments – cash or convertible to cash within three business days or less
- Moderately liquid investments – convertible to cash in three to seven calendar days
- Less liquid investments – can be sold or disposed of, but not settled, within seven calendar days
- Illiquid investments – cannot be sold or disposed of within seven calendar days
Liquidity classification determinations take into account a variety of factors including various market, trading and investment-specific considerations, as well as market depth, and generally utilize analysis from a third-party liquidity metrics service.
The Liquidity Rule places a 15% limit on a fund’s illiquid investments and requires funds that do not primarily hold assets that are highly liquid investments to determine and maintain a minimum percentage of the fund’s net assets to be invested in highly liquid investments (highly liquid investment minimum or HLIM). The Program includes provisions reasonably designed to comply with the 15% limit on illiquid investments and for determining, periodically reviewing and complying with the HLIM requirement as applicable.
At a recent meeting of the Fund’s Board of Trustees, the LRM Committee provided a written report to the Board pertaining to the operation, adequacy, and effectiveness of implementation of the Program for the annual period from December 1, 2019 through November 30, 2020. The report concluded that the Program has been implemented and is operating effectively and is reasonably designed to assess and manage the Fund’s liquidity risk.
![]()
SFB-SANN-0921
1.762414.120
Fidelity® Series Large Cap Value Index Fund
Semi-Annual Report
July 31, 2021
Contents
To view a fund's proxy voting guidelines and proxy voting record for the 12-month period ended June 30, visit http://www.fidelity.com/proxyvotingresults or visit the Securities and Exchange Commission's (SEC) web site at http://www.sec.gov.
You may also call 1-800-544-8544 to request a free copy of the proxy voting guidelines.
Standard & Poor's, S&P and S&P 500 are registered service marks of The McGraw-Hill Companies, Inc. and have been licensed for use by Fidelity Distributors Corporation.
Other third-party marks appearing herein are the property of their respective owners.
All other marks appearing herein are registered or unregistered trademarks or service marks of FMR LLC or an affiliated company. © 2021 FMR LLC. All rights reserved.
This report and the financial statements contained herein are submitted for the general information of the shareholders of the Fund. This report is not authorized for distribution to prospective investors in the Fund unless preceded or accompanied by an effective prospectus.
A fund files its complete schedule of portfolio holdings with the SEC for the first and third quarters of each fiscal year on Form N-PORT. Forms N-PORT are available on the SEC’s web site at http://www.sec.gov. A fund's Forms N-PORT may be reviewed and copied at the SEC’s Public Reference Room in Washington, DC. Information regarding the operation of the SEC's Public Reference Room may be obtained by calling 1-800-SEC-0330.
For a complete list of a fund's portfolio holdings, view the most recent holdings listing, semiannual report, or annual report on Fidelity's web site at http://www.fidelity.com, http://www.institutional.fidelity.com, or http://www.401k.com, as applicable.
NOT FDIC INSURED •MAY LOSE VALUE •NO BANK GUARANTEE
Neither the Fund nor Fidelity Distributors Corporation is a bank.
Note to Shareholders:
Early in 2020, the outbreak and spread of a new coronavirus emerged as a public health emergency that had a major influence on financial markets, primarily based on its impact on the global economy and the outlook for corporate earnings. The virus causes a respiratory disease known as COVID-19. On March 11, 2020 the World Health Organization declared the COVID-19 outbreak a pandemic, citing sustained risk of further global spread.
In the weeks following, as the crisis worsened, we witnessed an escalating human tragedy with wide-scale social and economic consequences from coronavirus-containment measures. The outbreak of COVID-19 prompted a number of measures to limit the spread, including travel and border restrictions, quarantines, and restrictions on large gatherings. In turn, these resulted in lower consumer activity, diminished demand for a wide range of products and services, disruption in manufacturing and supply chains, and – given the wide variability in outcomes regarding the outbreak – significant market uncertainty and volatility. Amid the turmoil, global governments and central banks took unprecedented action to help support consumers, businesses, and the broader economies, and to limit disruption to financial systems.
The situation continues to unfold, and the extent and duration of its impact on financial markets and the economy remain highly uncertain. Extreme events such as the coronavirus crisis are “exogenous shocks” that can have significant adverse effects on mutual funds and their investments. Although multiple asset classes may be affected by market disruption, the duration and impact may not be the same for all types of assets.
Fidelity is committed to helping you stay informed amid news about COVID-19 and during increased market volatility, and we’re taking extra steps to be responsive to customer needs. We encourage you to visit our websites, where we offer ongoing updates, commentary, and analysis on the markets and our funds.
Investment Summary (Unaudited)
Top Ten Stocks as of July 31, 2021
| % of fund's net assets | |
| Berkshire Hathaway, Inc. Class B | 2.6 |
| JPMorgan Chase & Co. | 2.3 |
| Johnson & Johnson | 2.2 |
| UnitedHealth Group, Inc. | 1.8 |
| Procter & Gamble Co. | 1.7 |
| The Walt Disney Co. | 1.5 |
| Bank of America Corp. | 1.4 |
| Comcast Corp. Class A | 1.3 |
| Exxon Mobil Corp. | 1.2 |
| Pfizer, Inc. | 1.2 |
| 17.2 |
Top Market Sectors as of July 31, 2021
| % of fund's net assets | |
| Financials | 20.5 |
| Health Care | 17.6 |
| Industrials | 12.0 |
| Information Technology | 10.2 |
| Communication Services | 8.4 |
| Consumer Staples | 7.2 |
| Consumer Discretionary | 5.7 |
| Utilities | 4.9 |
| Real Estate | 4.7 |
| Energy | 4.7 |
Asset Allocation (% of fund's net assets)
| As of July 31, 2021* | ||
| Stocks and Equity Futures | 100% | |

* Foreign investments - 4.9%
Schedule of Investments July 31, 2021 (Unaudited)
Showing Percentage of Net Assets
| Common Stocks - 99.7% | |||
| Shares | Value | ||
| COMMUNICATION SERVICES - 8.4% | |||
| Diversified Telecommunication Services - 2.2% | |||
| AT&T, Inc. | 2,131,908 | $59,800,019 | |
| Lumen Technologies, Inc. | 328,231 | 4,093,041 | |
| Verizon Communications, Inc. | 1,236,758 | 68,986,361 | |
| 132,879,421 | |||
| Entertainment - 2.2% | |||
| Activision Blizzard, Inc. | 230,431 | 19,268,640 | |
| Electronic Arts, Inc. | 85,485 | 12,306,421 | |
| Live Nation Entertainment, Inc. (a) | 24,697 | 1,948,346 | |
| Madison Square Garden Sports Corp. (a) | 3,472 | 565,033 | |
| Take-Two Interactive Software, Inc. (a) | 27,269 | 4,728,990 | |
| The Walt Disney Co. (a) | 514,264 | 90,520,749 | |
| World Wrestling Entertainment, Inc. Class A | 1,784 | 88,094 | |
| Zynga, Inc. (a) | 156,250 | 1,578,125 | |
| 131,004,398 | |||
| Interactive Media & Services - 1.4% | |||
| Alphabet, Inc.: | |||
| Class A (a) | 12,443 | 33,528,037 | |
| Class C (a) | 11,800 | 31,912,156 | |
| IAC (a) | 22,791 | 3,128,976 | |
| TripAdvisor, Inc. (a) | 11,436 | 433,996 | |
| Twitter, Inc. (a) | 208,188 | 14,521,113 | |
| Vimeo, Inc. (a) | 2,957 | 132,474 | |
| 83,656,752 | |||
| Media - 2.2% | |||
| Altice U.S.A., Inc. Class A (a) | 19,135 | 588,019 | |
| Cable One, Inc. | 759 | 1,432,984 | |
| Charter Communications, Inc. Class A (a) | 2,083 | 1,549,856 | |
| Comcast Corp. Class A | 1,361,147 | 80,076,278 | |
| Discovery Communications, Inc.: | |||
| Class A (a) | 49,146 | 1,425,725 | |
| Class C (non-vtg.) (a) | 94,107 | 2,551,241 | |
| DISH Network Corp. Class A (a) | 74,064 | 3,102,541 | |
| Fox Corp.: | |||
| Class A | 96,334 | 3,435,270 | |
| Class B | 45,069 | 1,498,094 | |
| Interpublic Group of Companies, Inc. | 116,837 | 4,131,356 | |
| Liberty Broadband Corp.: | |||
| Class A (a) | 7,367 | 1,264,693 | |
| Class C (a) | 45,251 | 8,031,600 | |
| Liberty Media Corp.: | |||
| Liberty Formula One Group Series C (a) | 59,304 | 2,783,137 | |
| Liberty Media Class A (a)(b) | 7,190 | 298,097 | |
| Liberty SiriusXM Series A (a) | 23,694 | 1,106,273 | |
| Liberty SiriusXM Series C (a) | 48,445 | 2,238,159 | |
| News Corp.: | |||
| Class A | 116,357 | 2,865,873 | |
| Class B | 35,919 | 844,456 | |
| Nexstar Broadcasting Group, Inc. Class A | 11,447 | 1,683,510 | |
| Omnicom Group, Inc. | 63,510 | 4,624,798 | |
| Sirius XM Holdings, Inc. (b) | 268,684 | 1,738,385 | |
| The New York Times Co. Class A | 49,189 | 2,153,494 | |
| ViacomCBS, Inc.: | |||
| Class A | 2,505 | 111,548 | |
| Class B | 173,769 | 7,112,365 | |
| 136,647,752 | |||
| Wireless Telecommunication Services - 0.4% | |||
| T-Mobile U.S., Inc. (a) | 175,810 | 25,320,156 | |
| TOTAL COMMUNICATION SERVICES | 509,508,479 | ||
| CONSUMER DISCRETIONARY - 5.7% | |||
| Auto Components - 0.3% | |||
| Aptiv PLC (a) | 65,749 | 10,970,221 | |
| BorgWarner, Inc. | 71,421 | 3,498,201 | |
| Gentex Corp. | 72,015 | 2,450,670 | |
| Lear Corp. | 17,890 | 3,130,392 | |
| QuantumScape Corp. Class A (a)(b) | 9,807 | 224,678 | |
| 20,274,162 | |||
| Automobiles - 0.7% | |||
| Ford Motor Co. (a) | 1,167,601 | 16,288,034 | |
| General Motors Co. (a) | 410,258 | 23,319,065 | |
| Harley-Davidson, Inc. | 45,651 | 1,808,693 | |
| Thor Industries, Inc. (b) | 9,386 | 1,110,927 | |
| 42,526,719 | |||
| Distributors - 0.1% | |||
| Genuine Parts Co. | 42,120 | 5,345,870 | |
| LKQ Corp. (a) | 83,376 | 4,231,332 | |
| 9,577,202 | |||
| Diversified Consumer Services - 0.1% | |||
| Bright Horizons Family Solutions, Inc. (a) | 3,668 | 548,366 | |
| Chegg, Inc. (a) | 9,928 | 879,919 | |
| Frontdoor, Inc. (a) | 8,170 | 399,840 | |
| Grand Canyon Education, Inc. (a) | 13,709 | 1,266,300 | |
| H&R Block, Inc. | 10,444 | 256,400 | |
| Service Corp. International | 48,747 | 3,046,200 | |
| Terminix Global Holdings, Inc. (a) | 38,323 | 2,011,958 | |
| 8,408,983 | |||
| Hotels, Restaurants & Leisure - 1.7% | |||
| ARAMARK Holdings Corp. | 68,301 | 2,399,414 | |
| Boyd Gaming Corp. (a) | 19,207 | 1,094,799 | |
| Caesars Entertainment, Inc. (a) | 22,531 | 1,968,308 | |
| Carnival Corp. (a)(b) | 253,991 | 5,498,905 | |
| Darden Restaurants, Inc. | 12,443 | 1,815,185 | |
| Domino's Pizza, Inc. | 3,689 | 1,938,533 | |
| Hilton Worldwide Holdings, Inc. (a) | 26,961 | 3,544,023 | |
| Hyatt Hotels Corp. Class A (a) | 12,033 | 961,076 | |
| Marriott Vacations Worldwide Corp. (a) | 12,410 | 1,828,862 | |
| McDonald's Corp. | 183,213 | 44,467,627 | |
| MGM Resorts International | 121,677 | 4,566,538 | |
| Norwegian Cruise Line Holdings Ltd. (a)(b) | 110,093 | 2,645,535 | |
| Penn National Gaming, Inc. (a) | 43,609 | 2,981,983 | |
| Planet Fitness, Inc. (a) | 7,767 | 584,311 | |
| Royal Caribbean Cruises Ltd. (a) | 65,352 | 5,023,608 | |
| Six Flags Entertainment Corp. (a) | 14,220 | 590,841 | |
| Travel+Leisure Co. | 8,503 | 440,455 | |
| Wyndham Hotels & Resorts, Inc. | 10,084 | 726,653 | |
| Yum China Holdings, Inc. | 115,693 | 7,194,948 | |
| Yum! Brands, Inc. | 81,384 | 10,693,044 | |
| 100,964,648 | |||
| Household Durables - 0.7% | |||
| D.R. Horton, Inc. | 58,235 | 5,557,366 | |
| Garmin Ltd. | 45,135 | 7,095,222 | |
| Leggett & Platt, Inc. | 39,643 | 1,904,053 | |
| Lennar Corp.: | |||
| Class A | 80,593 | 8,474,354 | |
| Class B | 5,109 | 441,162 | |
| Mohawk Industries, Inc. (a) | 16,861 | 3,286,209 | |
| Newell Brands, Inc. | 113,346 | 2,805,314 | |
| NVR, Inc. (a) | 327 | 1,707,790 | |
| PulteGroup, Inc. | 55,362 | 3,037,713 | |
| Toll Brothers, Inc. | 19,874 | 1,177,932 | |
| TopBuild Corp. (a) | 1,674 | 339,303 | |
| Whirlpool Corp. | 18,270 | 4,047,536 | |
| 39,873,954 | |||
| Internet & Direct Marketing Retail - 0.1% | |||
| Doordash, Inc. | 3,010 | 524,613 | |
| Qurate Retail, Inc. Series A | 111,037 | 1,316,899 | |
| Wayfair LLC Class A (a)(b) | 9,990 | 2,411,186 | |
| 4,252,698 | |||
| Leisure Products - 0.1% | |||
| Brunswick Corp. | 20,231 | 2,112,116 | |
| Hasbro, Inc. | 38,128 | 3,791,448 | |
| Hayward Holdings, Inc. (b) | 11,316 | 272,602 | |
| Polaris, Inc. | 5,260 | 689,428 | |
| 6,865,594 | |||
| Multiline Retail - 0.7% | |||
| Dollar General Corp. | 40,834 | 9,499,622 | |
| Dollar Tree, Inc. (a) | 69,078 | 6,893,294 | |
| Kohl's Corp. | 46,664 | 2,370,531 | |
| Nordstrom, Inc. (a) | 5,116 | 169,340 | |
| Ollie's Bargain Outlet Holdings, Inc. (a)(b) | 19,451 | 1,810,888 | |
| Target Corp. | 81,898 | 21,379,473 | |
| 42,123,148 | |||
| Specialty Retail - 0.8% | |||
| Advance Auto Parts, Inc. | 19,491 | 4,133,261 | |
| AutoNation, Inc. (a) | 15,154 | 1,838,635 | |
| AutoZone, Inc. (a) | 5,159 | 8,375,998 | |
| Bath & Body Works, Inc. | 29,733 | 2,380,721 | |
| Best Buy Co., Inc. | 57,405 | 6,449,452 | |
| Burlington Stores, Inc. (a) | 1,158 | 387,698 | |
| CarMax, Inc. (a) | 44,440 | 5,952,738 | |
| Dick's Sporting Goods, Inc. (b) | 18,733 | 1,950,855 | |
| Foot Locker, Inc. | 26,793 | 1,528,809 | |
| Gap, Inc. | 59,999 | 1,750,171 | |
| Leslie's, Inc. | 3,664 | 89,218 | |
| Lithia Motors, Inc. Class A (sub. vtg.) | 7,838 | 2,956,650 | |
| O'Reilly Automotive, Inc. (a) | 14,293 | 8,630,685 | |
| Penske Automotive Group, Inc. | 9,479 | 839,839 | |
| Petco Health & Wellness Co., Inc. (b) | 20,979 | 432,797 | |
| Vroom, Inc. (a)(b) | 25,657 | 950,335 | |
| Williams-Sonoma, Inc. | 5,346 | 810,988 | |
| 49,458,850 | |||
| Textiles, Apparel & Luxury Goods - 0.4% | |||
| Capri Holdings Ltd. (a) | 44,017 | 2,478,597 | |
| Carter's, Inc. (b) | 12,863 | 1,257,230 | |
| Columbia Sportswear Co. | 11,127 | 1,108,472 | |
| Deckers Outdoor Corp. (a) | 7,180 | 2,949,903 | |
| Hanesbrands, Inc. | 41,566 | 758,995 | |
| PVH Corp. (a) | 21,164 | 2,214,178 | |
| Ralph Lauren Corp. | 14,121 | 1,603,016 | |
| Skechers U.S.A., Inc. Class A (sub. vtg.) (a) | 34,868 | 1,871,714 | |
| Tapestry, Inc. (a) | 74,865 | 3,166,790 | |
| Under Armour, Inc.: | |||
| Class A (sub. vtg.) (a) | 56,111 | 1,147,470 | |
| Class C (non-vtg.) (a) | 59,073 | 1,034,959 | |
| VF Corp. | 34,467 | 2,764,253 | |
| 22,355,577 | |||
| TOTAL CONSUMER DISCRETIONARY | 346,681,535 | ||
| CONSUMER STAPLES - 7.2% | |||
| Beverages - 0.9% | |||
| Brown-Forman Corp.: | |||
| Class A | 6,885 | 460,538 | |
| Class B (non-vtg.) | 27,537 | 1,952,924 | |
| Constellation Brands, Inc. Class A (sub. vtg.) | 48,222 | 10,818,123 | |
| Keurig Dr. Pepper, Inc. | 208,390 | 7,337,412 | |
| Molson Coors Beverage Co. Class B | 53,192 | 2,600,557 | |
| Monster Beverage Corp. (a) | 7,974 | 752,108 | |
| PepsiCo, Inc. | 70,092 | 11,000,939 | |
| The Coca-Cola Co. | 340,660 | 19,427,840 | |
| 54,350,441 | |||
| Food & Staples Retailing - 1.5% | |||
| Albertsons Companies, Inc. (b) | 46,179 | 997,466 | |
| Casey's General Stores, Inc. | 10,990 | 2,172,833 | |
| Costco Wholesale Corp. | 8,578 | 3,686,138 | |
| Grocery Outlet Holding Corp. (a)(b) | 25,968 | 860,060 | |
| Kroger Co. | 222,991 | 9,075,734 | |
| U.S. Foods Holding Corp. (a) | 65,860 | 2,261,632 | |
| Walgreens Boots Alliance, Inc. | 214,008 | 10,090,477 | |
| Walmart, Inc. | 428,141 | 61,031,500 | |
| 90,175,840 | |||
| Food Products - 1.7% | |||
| Archer Daniels Midland Co. | 166,057 | 9,916,924 | |
| Beyond Meat, Inc. (a)(b) | 2,075 | 254,603 | |
| Bunge Ltd. | 40,966 | 3,180,191 | |
| Campbell Soup Co. (b) | 58,142 | 2,541,968 | |
| Conagra Brands, Inc. | 139,695 | 4,678,386 | |
| Darling Ingredients, Inc. (a) | 45,618 | 3,150,835 | |
| Flowers Foods, Inc. (b) | 56,011 | 1,319,619 | |
| General Mills, Inc. | 182,085 | 10,717,523 | |
| Hormel Foods Corp. (b) | 84,357 | 3,912,478 | |
| Ingredion, Inc. | 19,986 | 1,754,971 | |
| Kellogg Co. | 41,718 | 2,643,252 | |
| Lamb Weston Holdings, Inc. | 30,621 | 2,044,564 | |
| McCormick & Co., Inc. (non-vtg.) | 74,405 | 6,262,669 | |
| Mondelez International, Inc. | 416,139 | 26,324,953 | |
| Pilgrim's Pride Corp. (a) | 8,285 | 183,513 | |
| Post Holdings, Inc. (a) | 17,578 | 1,798,933 | |
| Seaboard Corp. | 74 | 304,140 | |
| The Hain Celestial Group, Inc. (a) | 24,899 | 993,719 | |
| The Hershey Co. | 6,173 | 1,104,226 | |
| The J.M. Smucker Co. | 31,630 | 4,147,009 | |
| The Kraft Heinz Co. | 198,020 | 7,617,829 | |
| Tyson Foods, Inc. Class A | 85,646 | 6,120,263 | |
| 100,972,568 | |||
| Household Products - 2.1% | |||
| Church & Dwight Co., Inc. | 69,297 | 5,999,734 | |
| Colgate-Palmolive Co. | 117,065 | 9,306,668 | |
| Kimberly-Clark Corp. | 49,976 | 6,782,743 | |
| Procter & Gamble Co. | 726,660 | 103,352,852 | |
| Reynolds Consumer Products, Inc. | 16,279 | 463,138 | |
| Spectrum Brands Holdings, Inc. | 12,447 | 1,087,245 | |
| The Clorox Co. | 7,068 | 1,278,531 | |
| 128,270,911 | |||
| Personal Products - 0.0% | |||
| Coty, Inc. Class A (a) | 86,584 | 755,878 | |
| Herbalife Nutrition Ltd. (a) | 26,778 | 1,364,071 | |
| 2,119,949 | |||
| Tobacco - 1.0% | |||
| Altria Group, Inc. | 245,376 | 11,787,863 | |
| Philip Morris International, Inc. | 464,736 | 46,515,426 | |
| 58,303,289 | |||
| TOTAL CONSUMER STAPLES | 434,192,998 | ||
| ENERGY - 4.7% | |||
| Energy Equipment & Services - 0.4% | |||
| Baker Hughes Co. Class A | 219,743 | 4,667,341 | |
| Halliburton Co. | 250,204 | 5,174,219 | |
| NOV, Inc. (a) | 116,271 | 1,605,703 | |
| Schlumberger Ltd. | 417,343 | 12,031,999 | |
| 23,479,262 | |||
| Oil, Gas & Consumable Fuels - 4.3% | |||
| Antero Midstream GP LP (b) | 99,358 | 943,901 | |
| APA Corp. | 112,448 | 2,108,400 | |
| Cabot Oil & Gas Corp. | 103,099 | 1,649,584 | |
| Chevron Corp. | 577,383 | 58,783,363 | |
| Cimarex Energy Co. | 24,009 | 1,565,387 | |
| ConocoPhillips Co. | 402,874 | 22,585,116 | |
| Continental Resources, Inc. (b) | 17,400 | 594,210 | |
| Devon Energy Corp. | 201,013 | 5,194,176 | |
| Diamondback Energy, Inc. | 28,325 | 2,184,707 | |
| DT Midstream, Inc. (a) | 28,810 | 1,221,544 | |
| EOG Resources, Inc. | 153,295 | 11,169,074 | |
| EQT Corp. (a) | 83,014 | 1,526,627 | |
| Exxon Mobil Corp. | 1,263,925 | 72,764,162 | |
| Hess Corp. | 77,073 | 5,891,460 | |
| HollyFrontier Corp. | 44,701 | 1,314,209 | |
| Kinder Morgan, Inc. | 580,423 | 10,087,752 | |
| Marathon Oil Corp. | 233,659 | 2,708,108 | |
| Marathon Petroleum Corp. | 194,410 | 10,735,320 | |
| Occidental Petroleum Corp. | 220,023 | 5,742,600 | |
| ONEOK, Inc. | 132,268 | 6,873,968 | |
| Phillips 66 Co. | 130,582 | 9,588,636 | |
| Pioneer Natural Resources Co. | 35,657 | 5,183,458 | |
| Targa Resources Corp. | 67,159 | 2,828,065 | |
| The Williams Companies, Inc. | 362,482 | 9,080,174 | |
| Valero Energy Corp. | 121,760 | 8,154,267 | |
| 260,478,268 | |||
| TOTAL ENERGY | 283,957,530 | ||
| FINANCIALS - 20.5% | |||
| Banks - 8.0% | |||
| Bank of America Corp. | 2,250,679 | 86,336,046 | |
| Bank of Hawaii Corp. (b) | 11,836 | 990,792 | |
| Bank OZK | 36,688 | 1,493,568 | |
| BOK Financial Corp. | 9,106 | 764,995 | |
| Citigroup, Inc. | 616,826 | 41,709,774 | |
| Citizens Financial Group, Inc. | 104,270 | 4,396,023 | |
| Comerica, Inc. | 41,584 | 2,855,157 | |
| Commerce Bancshares, Inc. | 31,715 | 2,243,202 | |
| Cullen/Frost Bankers, Inc. | 17,026 | 1,827,230 | |
| East West Bancorp, Inc. | 42,062 | 2,992,711 | |
| Fifth Third Bancorp | 209,250 | 7,593,683 | |
| First Citizens Bancshares, Inc. (b) | 1,804 | 1,411,792 | |
| First Hawaiian, Inc. | 38,684 | 1,064,971 | |
| First Horizon National Corp. | 163,082 | 2,519,617 | |
| First Republic Bank | 52,282 | 10,196,036 | |
| FNB Corp., Pennsylvania | 94,648 | 1,084,666 | |
| Huntington Bancshares, Inc./Ohio | 437,026 | 6,153,326 | |
| JPMorgan Chase & Co. | 897,647 | 136,244,862 | |
| KeyCorp | 288,467 | 5,671,261 | |
| M&T Bank Corp. | 38,253 | 5,120,164 | |
| PacWest Bancorp | 35,035 | 1,395,094 | |
| Peoples United Financial, Inc. | 126,763 | 1,990,179 | |
| Pinnacle Financial Partners, Inc. | 22,151 | 1,984,951 | |
| PNC Financial Services Group, Inc. | 126,616 | 23,096,025 | |
| Popular, Inc. | 24,686 | 1,796,153 | |
| Prosperity Bancshares, Inc. | 26,624 | 1,815,491 | |
| Regions Financial Corp. | 286,702 | 5,519,014 | |
| Signature Bank | 16,803 | 3,813,777 | |
| Sterling Bancorp | 52,285 | 1,135,107 | |
| SVB Financial Group (a) | 16,673 | 9,169,483 | |
| Synovus Financial Corp. | 40,710 | 1,665,039 | |
| Truist Financial Corp. | 400,822 | 21,816,741 | |
| U.S. Bancorp | 400,560 | 22,247,102 | |
| Umpqua Holdings Corp. | 65,388 | 1,233,872 | |
| Webster Financial Corp. | 26,906 | 1,294,179 | |
| Wells Fargo & Co. | 1,234,613 | 56,718,121 | |
| Western Alliance Bancorp. | 14,284 | 1,325,841 | |
| Wintrust Financial Corp. | 16,839 | 1,202,305 | |
| Zions Bancorp NA | 48,104 | 2,508,624 | |
| 484,396,974 | |||
| Capital Markets - 4.8% | |||
| Affiliated Managers Group, Inc. | 12,371 | 1,960,061 | |
| Ameriprise Financial, Inc. | 15,329 | 3,948,137 | |
| Ares Management Corp. | 4,917 | 352,106 | |
| Bank of New York Mellon Corp. | 239,234 | 12,279,881 | |
| BlackRock, Inc. Class A | 42,660 | 36,993,472 | |
| Carlyle Group LP | 48,366 | 2,441,032 | |
| Cboe Global Markets, Inc. | 31,703 | 3,755,854 | |
| Charles Schwab Corp. | 468,142 | 31,810,249 | |
| CME Group, Inc. | 106,973 | 22,692,182 | |
| Evercore, Inc. Class A | 11,933 | 1,577,543 | |
| FactSet Research Systems, Inc. | 1,576 | 563,073 | |
| Franklin Resources, Inc. | 86,185 | 2,546,767 | |
| Goldman Sachs Group, Inc. | 93,068 | 34,889,332 | |
| Interactive Brokers Group, Inc. | 23,965 | 1,482,475 | |
| Intercontinental Exchange, Inc. | 165,910 | 19,880,995 | |
| Invesco Ltd. | 99,391 | 2,423,153 | |
| Janus Henderson Group PLC (b) | 50,912 | 2,130,158 | |
| Jefferies Financial Group, Inc. | 65,210 | 2,164,320 | |
| KKR & Co. LP | 164,048 | 10,459,700 | |
| Lazard Ltd. Class A | 30,436 | 1,436,579 | |
| Moody's Corp. | 2,511 | 944,136 | |
| Morgan Stanley | 414,344 | 39,768,737 | |
| Morningstar, Inc. | 649 | 163,957 | |
| MSCI, Inc. | 6,959 | 4,147,286 | |
| NASDAQ, Inc. | 34,045 | 6,357,223 | |
| Northern Trust Corp. | 61,216 | 6,908,226 | |
| Raymond James Financial, Inc. | 34,822 | 4,508,753 | |
| S&P Global, Inc. | 20,977 | 8,993,259 | |
| SEI Investments Co. | 32,648 | 1,984,998 | |
| State Street Corp. | 103,642 | 9,031,364 | |
| Stifel Financial Corp. | 30,410 | 2,023,481 | |
| T. Rowe Price Group, Inc. | 44,947 | 9,176,380 | |
| Tradeweb Markets, Inc. Class A | 31,276 | 2,712,567 | |
| Virtu Financial, Inc. Class A | 27,795 | 715,443 | |
| 293,222,879 | |||
| Consumer Finance - 0.9% | |||
| Ally Financial, Inc. | 110,422 | 5,671,274 | |
| American Express Co. | 70,797 | 12,073,012 | |
| Capital One Financial Corp. | 133,740 | 21,625,758 | |
| Credit Acceptance Corp. (a)(b) | 2,560 | 1,241,011 | |
| Discover Financial Services | 40,887 | 5,083,072 | |
| OneMain Holdings, Inc. | 26,438 | 1,612,718 | |
| Santander Consumer U.S.A. Holdings, Inc. | 17,957 | 736,776 | |
| SLM Corp. | 95,897 | 1,805,741 | |
| Synchrony Financial | 140,680 | 6,614,774 | |
| 56,464,136 | |||
| Diversified Financial Services - 2.7% | |||
| Berkshire Hathaway, Inc. Class B (a) | 559,735 | 155,768,656 | |
| Equitable Holdings, Inc. | 114,382 | 3,530,972 | |
| Voya Financial, Inc. (b) | 35,894 | 2,311,574 | |
| 161,611,202 | |||
| Insurance - 3.8% | |||
| AFLAC, Inc. | 200,244 | 11,013,420 | |
| Alleghany Corp. (a) | 3,582 | 2,375,224 | |
| Allstate Corp. | 89,054 | 11,581,473 | |
| American Financial Group, Inc. | 20,203 | 2,555,477 | |
| American International Group, Inc. | 256,141 | 12,128,276 | |
| Aon PLC (b) | 27,436 | 7,134,183 | |
| Arch Capital Group Ltd. (a) | 88,161 | 3,438,279 | |
| Arthur J. Gallagher & Co. | 60,320 | 8,403,179 | |
| Assurant, Inc. | 17,998 | 2,840,264 | |
| Assured Guaranty Ltd. | 21,617 | 1,033,509 | |
| Athene Holding Ltd. (a) | 34,410 | 2,223,574 | |
| Axis Capital Holdings Ltd. | 23,016 | 1,170,824 | |
| Brighthouse Financial, Inc. (a) | 25,599 | 1,102,293 | |
| Brown & Brown, Inc. | 65,821 | 3,580,662 | |
| Chubb Ltd. | 133,579 | 22,540,120 | |
| Cincinnati Financial Corp. | 44,662 | 5,264,757 | |
| CNA Financial Corp. | 8,326 | 366,427 | |
| Erie Indemnity Co. Class A | 2,320 | 428,945 | |
| Everest Re Group Ltd. | 9,134 | 2,309,349 | |
| Fidelity National Financial, Inc. | 82,380 | 3,674,972 | |
| First American Financial Corp. | 31,737 | 2,136,217 | |
| Globe Life, Inc. | 30,233 | 2,814,995 | |
| GoHealth, Inc. (a) | 2,021 | 17,785 | |
| Hanover Insurance Group, Inc. | 10,664 | 1,449,238 | |
| Hartford Financial Services Group, Inc. | 106,372 | 6,767,387 | |
| Kemper Corp. | 18,113 | 1,195,639 | |
| Lemonade, Inc. (a)(b) | 10,177 | 886,010 | |
| Lincoln National Corp. | 47,898 | 2,951,475 | |
| Loews Corp. | 66,105 | 3,545,211 | |
| Markel Corp. (a) | 3,357 | 4,049,113 | |
| Marsh & McLennan Companies, Inc. | 133,701 | 19,683,461 | |
| Mercury General Corp. | 7,967 | 484,633 | |
| MetLife, Inc. | 221,071 | 12,755,797 | |
| Old Republic International Corp. | 83,402 | 2,056,693 | |
| Primerica, Inc. | 11,694 | 1,709,897 | |
| Principal Financial Group, Inc. | 80,115 | 4,977,545 | |
| Progressive Corp. | 174,304 | 16,586,769 | |
| Prudential Financial, Inc. | 117,619 | 11,794,833 | |
| Reinsurance Group of America, Inc. | 20,226 | 2,228,501 | |
| RenaissanceRe Holdings Ltd. | 8,145 | 1,243,660 | |
| The Travelers Companies, Inc. | 74,943 | 11,160,512 | |
| Unum Group | 60,820 | 1,666,468 | |
| W.R. Berkley Corp. | 41,145 | 3,010,580 | |
| White Mountains Insurance Group Ltd. | 897 | 1,015,018 | |
| Willis Towers Watson PLC | 38,299 | 7,892,658 | |
| 229,245,302 | |||
| Mortgage Real Estate Investment Trusts - 0.2% | |||
| AGNC Investment Corp. | 156,111 | 2,477,482 | |
| Annaly Capital Management, Inc. | 416,248 | 3,533,946 | |
| New Residential Investment Corp. | 129,378 | 1,262,729 | |
| Starwood Property Trust, Inc. | 81,749 | 2,127,926 | |
| 9,402,083 | |||
| Thrifts & Mortgage Finance - 0.1% | |||
| MGIC Investment Corp. | 100,942 | 1,397,037 | |
| New York Community Bancorp, Inc. | 134,782 | 1,587,732 | |
| TFS Financial Corp. | 14,565 | 283,726 | |
| UWM Holdings Corp. Class A (b) | 6,517 | 49,725 | |
| 3,318,220 | |||
| TOTAL FINANCIALS | 1,237,660,796 | ||
| HEALTH CARE - 17.6% | |||
| Biotechnology - 1.5% | |||
| Amgen, Inc. | 30,360 | 7,333,154 | |
| Biogen, Inc. (a) | 44,710 | 14,608,098 | |
| BioMarin Pharmaceutical, Inc. (a) | 54,382 | 4,172,731 | |
| Exact Sciences Corp. (a) | 3,844 | 414,537 | |
| Exelixis, Inc. (a) | 13,144 | 221,476 | |
| Gilead Sciences, Inc. | 374,666 | 25,585,941 | |
| Horizon Therapeutics PLC (a) | 52,914 | 5,292,458 | |
| Incyte Corp. (a) | 7,937 | 613,927 | |
| Ionis Pharmaceuticals, Inc. (a) | 3,267 | 121,336 | |
| Iovance Biotherapeutics, Inc. (a) | 30,098 | 670,282 | |
| Mirati Therapeutics, Inc. (a) | 1,967 | 314,838 | |
| Natera, Inc. (a) | 1,569 | 179,682 | |
| Regeneron Pharmaceuticals, Inc. (a) | 26,710 | 15,347,833 | |
| Repligen Corp. (a) | 936 | 229,975 | |
| Sage Therapeutics, Inc. (a) | 15,276 | 668,019 | |
| Seagen, Inc. (a) | 4,260 | 653,441 | |
| Ultragenyx Pharmaceutical, Inc. (a) | 4,953 | 395,398 | |
| United Therapeutics Corp. (a) | 13,153 | 2,392,925 | |
| Vertex Pharmaceuticals, Inc. (a) | 46,386 | 9,350,490 | |
| 88,566,541 | |||
| Health Care Equipment & Supplies - 4.2% | |||
| Abbott Laboratories | 259,203 | 31,358,379 | |
| Baxter International, Inc. | 149,965 | 11,599,793 | |
| Becton, Dickinson & Co. | 86,240 | 22,055,880 | |
| Boston Scientific Corp. (a) | 423,295 | 19,302,252 | |
| Danaher Corp. | 179,395 | 53,368,219 | |
| Dentsply Sirona, Inc. | 64,784 | 4,278,335 | |
| Envista Holdings Corp. (a) | 47,953 | 2,065,815 | |
| Globus Medical, Inc. (a) | 21,882 | 1,819,926 | |
| Hill-Rom Holdings, Inc. | 19,828 | 2,745,385 | |
| Hologic, Inc. (a) | 75,615 | 5,674,150 | |
| ICU Medical, Inc. (a) | 5,917 | 1,202,867 | |
| Integra LifeSciences Holdings Corp. (a) | 21,592 | 1,563,045 | |
| Masimo Corp. (a) | 4,089 | 1,113,803 | |
| Medtronic PLC | 400,704 | 52,616,442 | |
| Quidel Corp. (a)(b) | 11,177 | 1,581,210 | |
| ResMed, Inc. | 4,279 | 1,163,032 | |
| STERIS PLC | 25,409 | 5,537,892 | |
| Stryker Corp. | 59,616 | 16,152,359 | |
| Tandem Diabetes Care, Inc. (a) | 1,080 | 117,364 | |
| Teleflex, Inc. | 11,470 | 4,558,522 | |
| The Cooper Companies, Inc. | 14,429 | 6,085,719 | |
| Zimmer Biomet Holdings, Inc. | 62,249 | 10,172,732 | |
| 256,133,121 | |||
| Health Care Providers & Services - 4.4% | |||
| Acadia Healthcare Co., Inc. (a) | 26,399 | 1,629,346 | |
| agilon health, Inc. (a)(b) | 917 | 33,736 | |
| Amedisys, Inc. (a) | 1,097 | 285,900 | |
| AmerisourceBergen Corp. | 43,775 | 5,347,992 | |
| Anthem, Inc. | 73,094 | 28,068,827 | |
| Cardinal Health, Inc. | 35,418 | 2,103,121 | |
| Centene Corp. (a) | 172,567 | 11,839,822 | |
| Chemed Corp. | 3,425 | 1,630,369 | |
| Cigna Corp. | 101,791 | 23,360,017 | |
| CVS Health Corp. | 392,820 | 32,352,655 | |
| DaVita HealthCare Partners, Inc. (a) | 6,221 | 748,075 | |
| Encompass Health Corp. | 12,391 | 1,031,551 | |
| Henry Schein, Inc. (a) | 41,985 | 3,365,098 | |
| Humana, Inc. | 38,475 | 16,384,964 | |
| Laboratory Corp. of America Holdings (a) | 29,139 | 8,629,515 | |
| McKesson Corp. | 40,701 | 8,296,085 | |
| Molina Healthcare, Inc. (a) | 14,579 | 3,980,213 | |
| Oak Street Health, Inc. (a)(b) | 2,935 | 185,022 | |
| Premier, Inc. | 36,358 | 1,295,799 | |
| Quest Diagnostics, Inc. | 38,864 | 5,510,915 | |
| Signify Health, Inc. (b) | 6,742 | 177,449 | |
| UnitedHealth Group, Inc. | 261,402 | 107,755,132 | |
| Universal Health Services, Inc. Class B | 22,597 | 3,624,785 | |
| 267,636,388 | |||
| Health Care Technology - 0.3% | |||
| Cerner Corp. | 89,871 | 7,224,730 | |
| Certara, Inc. | 4,257 | 115,833 | |
| Change Healthcare, Inc. (a) | 73,635 | 1,598,616 | |
| Teladoc Health, Inc. (a)(b) | 43,717 | 6,489,789 | |
| 15,428,968 | |||
| Life Sciences Tools & Services - 1.4% | |||
| Adaptive Biotechnologies Corp. (a) | 3,498 | 128,237 | |
| Agilent Technologies, Inc. | 9,415 | 1,442,660 | |
| Bio-Rad Laboratories, Inc. Class A (a) | 6,323 | 4,675,922 | |
| Charles River Laboratories International, Inc. (a) | 946 | 384,946 | |
| IQVIA Holdings, Inc. (a) | 28,776 | 7,127,815 | |
| PerkinElmer, Inc. | 33,388 | 6,084,295 | |
| PPD, Inc. (a) | 28,295 | 1,304,965 | |
| QIAGEN NV (a) | 67,665 | 3,572,035 | |
| Syneos Health, Inc. (a) | 26,411 | 2,368,274 | |
| Thermo Fisher Scientific, Inc. | 106,706 | 57,622,307 | |
| Waters Corp. (a) | 1,283 | 500,126 | |
| 85,211,582 | |||
| Pharmaceuticals - 5.8% | |||
| Bristol-Myers Squibb Co. | 666,690 | 45,248,250 | |
| Catalent, Inc. (a) | 37,046 | 4,438,481 | |
| Elanco Animal Health, Inc. (a) | 132,700 | 4,839,569 | |
| Eli Lilly & Co. | 53,127 | 12,936,425 | |
| Jazz Pharmaceuticals PLC (a) | 17,664 | 2,994,401 | |
| Johnson & Johnson | 786,376 | 135,413,947 | |
| Merck & Co., Inc. | 756,109 | 58,122,099 | |
| Nektar Therapeutics (a)(b) | 52,755 | 833,001 | |
| Organon & Co. (a) | 75,611 | 2,193,475 | |
| Perrigo Co. PLC | 39,816 | 1,912,362 | |
| Pfizer, Inc. | 1,666,152 | 71,327,967 | |
| Royalty Pharma PLC | 39,611 | 1,513,140 | |
| Viatris, Inc. | 360,352 | 5,070,153 | |
| Zoetis, Inc. Class A | 7,381 | 1,496,129 | |
| 348,339,399 | |||
| TOTAL HEALTH CARE | 1,061,315,999 | ||
| INDUSTRIALS - 12.0% | |||
| Aerospace & Defense - 2.6% | |||
| BWX Technologies, Inc. | 7,050 | 404,882 | |
| Curtiss-Wright Corp. | 12,172 | 1,439,948 | |
| General Dynamics Corp. | 75,027 | 14,707,543 | |
| HEICO Corp. | 9,041 | 1,222,795 | |
| HEICO Corp. Class A | 15,911 | 1,929,845 | |
| Hexcel Corp. (a)(b) | 24,954 | 1,357,997 | |
| Howmet Aerospace, Inc. | 108,167 | 3,550,041 | |
| Huntington Ingalls Industries, Inc. | 11,741 | 2,408,431 | |
| L3Harris Technologies, Inc. | 60,957 | 13,821,390 | |
| Lockheed Martin Corp. | 9,311 | 3,460,619 | |
| Mercury Systems, Inc. (a) | 16,414 | 1,083,324 | |
| Northrop Grumman Corp. | 41,117 | 14,926,293 | |
| Raytheon Technologies Corp. | 452,228 | 39,321,225 | |
| Spirit AeroSystems Holdings, Inc. Class A | 22,032 | 952,003 | |
| Teledyne Technologies, Inc. (a) | 13,697 | 6,201,591 | |
| Textron, Inc. | 67,263 | 4,641,820 | |
| The Boeing Co. (a) | 159,826 | 36,197,392 | |
| TransDigm Group, Inc. (a) | 10,975 | 7,035,963 | |
| Virgin Galactic Holdings, Inc. (a) | 3,388 | 101,606 | |
| 154,764,708 | |||
| Air Freight & Logistics - 0.3% | |||
| C.H. Robinson Worldwide, Inc. | 31,597 | 2,817,504 | |
| Expeditors International of Washington, Inc. | 13,607 | 1,745,098 | |
| FedEx Corp. | 41,342 | 11,573,693 | |
| XPO Logistics, Inc. (a) | 4,104 | 569,184 | |
| 16,705,479 | |||
| Airlines - 0.3% | |||
| Alaska Air Group, Inc. (a) | 36,347 | 2,109,216 | |
| American Airlines Group, Inc. (a)(b) | 190,333 | 3,878,987 | |
| Copa Holdings SA Class A (a)(b) | 9,374 | 664,710 | |
| JetBlue Airways Corp. (a) | 94,495 | 1,397,581 | |
| Southwest Airlines Co. (a) | 176,137 | 8,898,441 | |
| United Airlines Holdings, Inc. (a) | 96,394 | 4,503,528 | |
| 21,452,463 | |||
| Building Products - 0.9% | |||
| A.O. Smith Corp. | 39,439 | 2,773,745 | |
| Allegion PLC | 6,380 | 871,508 | |
| Armstrong World Industries, Inc. | 7,318 | 791,661 | |
| Builders FirstSource, Inc. (a) | 61,083 | 2,718,194 | |
| Carrier Global Corp. | 137,953 | 7,621,903 | |
| Fortune Brands Home & Security, Inc. | 30,678 | 2,990,185 | |
| Johnson Controls International PLC | 213,526 | 15,250,027 | |
| Lennox International, Inc. | 10,153 | 3,344,703 | |
| Masco Corp. | 75,410 | 4,502,731 | |
| Owens Corning | 31,053 | 2,986,056 | |
| The AZEK Co., Inc. (a) | 14,835 | 539,549 | |
| Trane Technologies PLC | 36,515 | 7,434,819 | |
| 51,825,081 | |||
| Commercial Services & Supplies - 0.5% | |||
| ADT, Inc. (b) | 47,317 | 496,355 | |
| Cintas Corp. | 1,675 | 660,252 | |
| Clean Harbors, Inc. (a) | 15,131 | 1,437,445 | |
| Driven Brands Holdings, Inc. | 10,829 | 344,579 | |
| MSA Safety, Inc. | 7,770 | 1,278,010 | |
| Republic Services, Inc. | 62,649 | 7,415,136 | |
| Rollins, Inc. | 4,744 | 181,838 | |
| Stericycle, Inc. (a) | 27,266 | 1,923,616 | |
| Waste Management, Inc. | 105,911 | 15,702,365 | |
| 29,439,596 | |||
| Construction & Engineering - 0.2% | |||
| AECOM (a) | 41,674 | 2,623,795 | |
| MasTec, Inc. (a) | 16,753 | 1,695,906 | |
| Quanta Services, Inc. | 41,247 | 3,749,352 | |
| Valmont Industries, Inc. | 6,200 | 1,469,090 | |
| 9,538,143 | |||
| Electrical Equipment - 1.1% | |||
| Acuity Brands, Inc. | 10,540 | 1,848,505 | |
| AMETEK, Inc. | 68,739 | 9,558,158 | |
| ChargePoint Holdings, Inc. Class A (a)(b) | 40,968 | 968,893 | |
| Eaton Corp. PLC | 118,782 | 18,773,495 | |
| Emerson Electric Co. | 177,995 | 17,957,916 | |
| Hubbell, Inc. Class B | 16,136 | 3,234,623 | |
| nVent Electric PLC | 49,713 | 1,571,428 | |
| Regal Beloit Corp. | 12,110 | 1,782,955 | |
| Rockwell Automation, Inc. | 13,602 | 4,181,527 | |
| Sensata Technologies, Inc. PLC (a) | 46,364 | 2,717,858 | |
| Shoals Technologies Group, Inc. | 30,450 | 885,791 | |
| Sunrun, Inc. (a) | 59,429 | 3,147,954 | |
| 66,629,103 | |||
| Industrial Conglomerates - 1.9% | |||
| 3M Co. | 147,415 | 29,179,325 | |
| Carlisle Companies, Inc. | 9,445 | 1,910,157 | |
| General Electric Co. | 2,607,344 | 33,765,105 | |
| Honeywell International, Inc. | 162,591 | 38,012,150 | |
| Roper Technologies, Inc. | 31,280 | 15,369,115 | |
| 118,235,852 | |||
| Machinery - 2.0% | |||
| AGCO Corp. | 16,777 | 2,216,409 | |
| Allison Transmission Holdings, Inc. | 7,743 | 309,023 | |
| Caterpillar, Inc. | 22,566 | 4,665,521 | |
| Colfax Corp. (a) | 34,917 | 1,601,992 | |
| Crane Co. | 14,663 | 1,425,683 | |
| Cummins, Inc. | 43,566 | 10,111,669 | |
| Donaldson Co., Inc. | 32,943 | 2,180,497 | |
| Dover Corp. | 42,783 | 7,149,895 | |
| Flowserve Corp. | 38,821 | 1,633,976 | |
| Fortive Corp. | 97,408 | 7,077,665 | |
| Gates Industrial Corp. PLC (a) | 21,079 | 381,741 | |
| Graco, Inc. | 19,005 | 1,483,910 | |
| IDEX Corp. | 22,630 | 5,129,995 | |
| Illinois Tool Works, Inc. | 9,656 | 2,188,726 | |
| Ingersoll Rand, Inc. (a) | 111,801 | 5,463,715 | |
| ITT, Inc. | 25,673 | 2,513,643 | |
| Middleby Corp. (a) | 11,476 | 2,197,539 | |
| Nordson Corp. | 14,343 | 3,243,383 | |
| Oshkosh Corp. | 20,364 | 2,434,516 | |
| Otis Worldwide Corp. | 128,165 | 11,477,176 | |
| PACCAR, Inc. | 101,610 | 8,432,614 | |
| Parker Hannifin Corp. | 31,990 | 9,981,840 | |
| Pentair PLC | 49,274 | 3,630,016 | |
| Snap-On, Inc. | 15,912 | 3,468,498 | |
| Stanley Black & Decker, Inc. | 48,124 | 9,482,834 | |
| Timken Co. | 19,181 | 1,524,890 | |
| Toro Co. | 1,711 | 194,609 | |
| Westinghouse Air Brake Co. | 54,061 | 4,588,157 | |
| Woodward, Inc. | 17,115 | 2,080,499 | |
| Xylem, Inc. | 18,194 | 2,289,715 | |
| 120,560,346 | |||
| Marine - 0.0% | |||
| Kirby Corp. (a) | 17,709 | 1,025,528 | |
| Professional Services - 0.8% | |||
| CACI International, Inc. Class A (a) | 6,927 | 1,849,232 | |
| Clarivate Analytics PLC (a) | 122,785 | 2,799,498 | |
| CoStar Group, Inc. (a) | 26,177 | 2,325,826 | |
| Dun & Bradstreet Holdings, Inc. (a) | 47,582 | 997,319 | |
| Equifax, Inc. | 22,327 | 5,818,416 | |
| FTI Consulting, Inc. (a) | 10,019 | 1,459,768 | |
| IHS Markit Ltd. | 111,328 | 13,007,564 | |
| Jacobs Engineering Group, Inc. | 38,528 | 5,210,912 | |
| Leidos Holdings, Inc. | 42,080 | 4,478,154 | |
| Manpower, Inc. | 16,188 | 1,919,573 | |
| Nielsen Holdings PLC | 106,529 | 2,523,672 | |
| Robert Half International, Inc. | 3,997 | 392,545 | |
| Science Applications Internati | 17,286 | 1,509,068 | |
| TransUnion Holding Co., Inc. | 18,097 | 2,172,726 | |
| Verisk Analytics, Inc. | 17,183 | 3,263,739 | |
| 49,728,012 | |||
| Road & Rail - 1.2% | |||
| AMERCO | 2,671 | 1,570,441 | |
| CSX Corp. | 675,743 | 21,840,014 | |
| J.B. Hunt Transport Services, Inc. | 2,821 | 475,197 | |
| Kansas City Southern | 19,809 | 5,304,850 | |
| Knight-Swift Transportation Holdings, Inc. Class A | 47,917 | 2,380,996 | |
| Landstar System, Inc. | 1,274 | 200,018 | |
| Norfolk Southern Corp. | 74,511 | 19,211,171 | |
| Old Dominion Freight Lines, Inc. | 2,411 | 648,921 | |
| Ryder System, Inc. | 15,522 | 1,182,000 | |
| Schneider National, Inc. Class B | 15,289 | 343,085 | |
| TuSimple Holdings, Inc. (a)(b) | 9,481 | 348,901 | |
| Uber Technologies, Inc. (a) | 69,348 | 3,013,864 | |
| Union Pacific Corp. | 72,958 | 15,960,292 | |
| 72,479,750 | |||
| Trading Companies & Distributors - 0.2% | |||
| Air Lease Corp. Class A | 31,976 | 1,354,503 | |
| Fastenal Co. | 19,274 | 1,055,637 | |
| MSC Industrial Direct Co., Inc. Class A (b) | 13,417 | 1,196,394 | |
| SiteOne Landscape Supply, Inc. (a) | 6,274 | 1,096,570 | |
| United Rentals, Inc. (a) | 14,082 | 4,640,723 | |
| Univar, Inc. (a) | 49,720 | 1,220,129 | |
| W.W. Grainger, Inc. | 2,348 | 1,043,874 | |
| Watsco, Inc. | 9,735 | 2,749,553 | |
| 14,357,383 | |||
| TOTAL INDUSTRIALS | 726,741,444 | ||
| INFORMATION TECHNOLOGY - 10.2% | |||
| Communications Equipment - 1.5% | |||
| Arista Networks, Inc. (a) | 1,902 | 723,502 | |
| Ciena Corp. (a) | 45,954 | 2,671,766 | |
| Cisco Systems, Inc. | 1,261,276 | 69,836,852 | |
| F5 Networks, Inc. (a) | 17,749 | 3,665,346 | |
| Juniper Networks, Inc. | 96,664 | 2,720,125 | |
| Lumentum Holdings, Inc. (a) | 22,557 | 1,894,562 | |
| Motorola Solutions, Inc. | 49,555 | 11,096,356 | |
| Ubiquiti, Inc. (b) | 215 | 67,317 | |
| ViaSat, Inc. (a) | 18,420 | 914,369 | |
| 93,590,195 | |||
| Electronic Equipment & Components - 0.6% | |||
| Amphenol Corp. Class A | 50,329 | 3,648,349 | |
| Arrow Electronics, Inc. (a) | 21,876 | 2,593,837 | |
| Avnet, Inc. | 29,476 | 1,217,948 | |
| Coherent, Inc. (a) | 742 | 182,487 | |
| Corning, Inc. | 150,226 | 6,288,460 | |
| IPG Photonics Corp. (a) | 10,014 | 2,184,654 | |
| Jabil, Inc. | 9,025 | 537,349 | |
| Keysight Technologies, Inc. (a) | 31,011 | 5,102,860 | |
| Littelfuse, Inc. | 7,145 | 1,900,499 | |
| National Instruments Corp. | 39,171 | 1,727,833 | |
| SYNNEX Corp. | 12,371 | 1,478,829 | |
| Trimble, Inc. (a) | 74,666 | 6,383,943 | |
| Vontier Corp. | 23,121 | 747,964 | |
| 33,995,012 | |||
| IT Services - 3.1% | |||
| Accenture PLC Class A | 37,198 | 11,817,061 | |
| Akamai Technologies, Inc. (a) | 47,923 | 5,746,926 | |
| Alliance Data Systems Corp. | 14,855 | 1,385,229 | |
| Amdocs Ltd. | 38,550 | 2,972,591 | |
| Automatic Data Processing, Inc. | 10,153 | 2,128,373 | |
| Broadridge Financial Solutions, Inc. | 3,183 | 552,219 | |
| Cognizant Technology Solutions Corp. Class A | 157,122 | 11,553,181 | |
| Concentrix Corp. (a) | 12,554 | 2,055,466 | |
| DXC Technology Co. (a) | 75,627 | 3,023,567 | |
| Euronet Worldwide, Inc. (a) | 4,415 | 630,550 | |
| Fastly, Inc. Class A (a)(b) | 31,560 | 1,517,089 | |
| Fidelity National Information Services, Inc. | 184,883 | 27,556,811 | |
| Fiserv, Inc. (a) | 166,344 | 19,147,858 | |
| FleetCor Technologies, Inc. (a) | 18,740 | 4,839,043 | |
| Genpact Ltd. | 51,843 | 2,582,300 | |
| Global Payments, Inc. | 87,488 | 16,921,054 | |
| GoDaddy, Inc. (a) | 44,942 | 3,768,387 | |
| IBM Corp. | 266,705 | 37,594,737 | |
| Jack Henry & Associates, Inc. | 16,261 | 2,830,877 | |
| Paychex, Inc. | 12,318 | 1,402,035 | |
| Paysafe Ltd. (a) | 91,721 | 989,670 | |
| Snowflake Computing, Inc. | 2,108 | 560,138 | |
| SolarWinds, Inc. (a)(b) | 21,028 | 236,355 | |
| StoneCo Ltd. Class A (a) | 4,499 | 264,721 | |
| The Western Union Co. | 91,489 | 2,123,460 | |
| Twilio, Inc. Class A (a) | 34,730 | 12,974,781 | |
| VeriSign, Inc. (a) | 29,397 | 6,360,629 | |
| WEX, Inc. (a) | 4,371 | 829,310 | |
| 184,364,418 | |||
| Semiconductors & Semiconductor Equipment - 2.9% | |||
| Analog Devices, Inc. | 93,739 | 15,693,783 | |
| Brooks Automation, Inc. | 3,803 | 338,505 | |
| Cirrus Logic, Inc. (a) | 17,268 | 1,426,164 | |
| Cree, Inc. (a) | 34,377 | 3,188,811 | |
| First Solar, Inc. (a) | 31,584 | 2,717,487 | |
| Intel Corp. | 1,206,362 | 64,805,767 | |
| Marvell Technology, Inc. | 240,768 | 14,568,872 | |
| Maxim Integrated Products, Inc. | 4,177 | 417,324 | |
| Microchip Technology, Inc. | 11,734 | 1,679,370 | |
| Micron Technology, Inc. | 288,229 | 22,360,806 | |
| MKS Instruments, Inc. | 2,589 | 405,023 | |
| NXP Semiconductors NV | 56,982 | 11,760,515 | |
| ON Semiconductor Corp. (a) | 57,946 | 2,263,371 | |
| Qorvo, Inc. (a) | 33,690 | 6,387,287 | |
| Skyworks Solutions, Inc. | 25,967 | 4,791,171 | |
| Texas Instruments, Inc. | 104,750 | 19,967,445 | |
| 172,771,701 | |||
| Software - 1.7% | |||
| ANSYS, Inc. (a) | 15,170 | 5,589,538 | |
| Black Knight, Inc. (a) | 45,308 | 3,751,955 | |
| C3.Ai, Inc. (b) | 3,980 | 200,393 | |
| CDK Global, Inc. | 30,756 | 1,475,980 | |
| Ceridian HCM Holding, Inc. (a) | 38,508 | 3,789,187 | |
| Citrix Systems, Inc. | 23,758 | 2,393,619 | |
| Cloudflare, Inc. (a) | 4,297 | 509,753 | |
| Datto Holding Corp. (b) | 7,028 | 183,361 | |
| Dolby Laboratories, Inc. Class A | 19,136 | 1,858,106 | |
| Duck Creek Technologies, Inc. (a) | 16,610 | 729,677 | |
| Dynatrace, Inc. (a) | 3,200 | 204,384 | |
| FireEye, Inc. (a) | 49,241 | 994,668 | |
| Guidewire Software, Inc. (a) | 25,004 | 2,880,461 | |
| Jamf Holding Corp. (a)(b) | 2,386 | 78,285 | |
| Manhattan Associates, Inc. (a) | 8,788 | 1,402,828 | |
| McAfee Corp. | 3,221 | 87,192 | |
| Medallia, Inc. (a) | 14,072 | 476,619 | |
| N-able, Inc. (a)(b) | 10,292 | 142,030 | |
| NortonLifeLock, Inc. | 120,435 | 2,989,197 | |
| Nuance Communications, Inc. (a) | 52,651 | 2,890,540 | |
| Oracle Corp. | 35,329 | 3,078,569 | |
| Pegasystems, Inc. | 673 | 85,902 | |
| Salesforce.com, Inc. (a) | 222,852 | 53,914,584 | |
| SS&C Technologies Holdings, Inc. | 66,809 | 5,237,158 | |
| Synopsys, Inc. (a) | 16,564 | 4,770,266 | |
| Teradata Corp. (a) | 4,687 | 232,756 | |
| Tyler Technologies, Inc. (a) | 1,607 | 791,672 | |
| VMware, Inc. Class A (a)(b) | 15,076 | 2,317,784 | |
| 103,056,464 | |||
| Technology Hardware, Storage & Peripherals - 0.4% | |||
| Dell Technologies, Inc. (a) | 41,968 | 4,054,948 | |
| Hewlett Packard Enterprise Co. | 387,732 | 5,622,114 | |
| HP, Inc. | 242,934 | 7,013,505 | |
| NCR Corp. (a) | 24,998 | 1,109,911 | |
| NetApp, Inc. | 22,364 | 1,779,951 | |
| Pure Storage, Inc. Class A (a) | 5,029 | 98,166 | |
| Western Digital Corp. (a) | 91,517 | 5,942,199 | |
| Xerox Holdings Corp. | 45,529 | 1,098,615 | |
| 26,719,409 | |||
| TOTAL INFORMATION TECHNOLOGY | 614,497,199 | ||
| MATERIALS - 3.8% | |||
| Chemicals - 1.9% | |||
| Air Products & Chemicals, Inc. | 65,964 | 19,197,503 | |
| Albemarle Corp. U.S. | 34,658 | 7,140,934 | |
| Ashland Global Holdings, Inc. | 16,403 | 1,395,403 | |
| Axalta Coating Systems Ltd. (a) | 51,285 | 1,543,679 | |
| Celanese Corp. Class A | 21,355 | 3,326,468 | |
| CF Industries Holdings, Inc. | 63,746 | 3,011,999 | |
| Corteva, Inc. | 220,084 | 9,415,194 | |
| Diversey Holdings Ltd. (a) | 3,448 | 57,513 | |
| Dow, Inc. | 206,958 | 12,864,509 | |
| DuPont de Nemours, Inc. | 158,926 | 11,927,396 | |
| Eastman Chemical Co. | 40,475 | 4,562,342 | |
| Ecolab, Inc. | 9,171 | 2,025,232 | |
| Element Solutions, Inc. | 69,051 | 1,615,103 | |
| FMC Corp. | 28,688 | 3,068,182 | |
| Huntsman Corp. | 62,837 | 1,659,525 | |
| International Flavors & Fragrances, Inc. | 74,263 | 11,186,978 | |
| LyondellBasell Industries NV Class A | 68,742 | 6,828,143 | |
| NewMarket Corp. | 1,998 | 631,188 | |
| Olin Corp. | 39,589 | 1,861,871 | |
| PPG Industries, Inc. | 40,796 | 6,670,962 | |
| RPM International, Inc. | 15,858 | 1,373,144 | |
| The Chemours Co. LLC | 23,767 | 790,253 | |
| The Mosaic Co. | 102,977 | 3,215,972 | |
| Valvoline, Inc. | 53,960 | 1,655,493 | |
| Westlake Chemical Corp. | 7,908 | 655,731 | |
| 117,680,717 | |||
| Construction Materials - 0.3% | |||
| Eagle Materials, Inc. | 12,256 | 1,732,018 | |
| Martin Marietta Materials, Inc. | 18,541 | 6,735,945 | |
| Vulcan Materials Co. | 39,425 | 7,096,106 | |
| 15,564,069 | |||
| Containers & Packaging - 0.7% | |||
| Amcor PLC | 459,482 | 5,311,612 | |
| Aptargroup, Inc. | 19,574 | 2,523,480 | |
| Ardagh Group SA | 5,448 | 127,211 | |
| Avery Dennison Corp. | 11,571 | 2,437,778 | |
| Ball Corp. | 67,498 | 5,459,238 | |
| Berry Global Group, Inc. (a) | 40,247 | 2,587,480 | |
| Crown Holdings, Inc. | 33,916 | 3,383,460 | |
| Graphic Packaging Holding Co. | 60,246 | 1,154,916 | |
| International Paper Co. | 116,709 | 6,741,112 | |
| Packaging Corp. of America | 27,945 | 3,954,218 | |
| Sealed Air Corp. | 20,664 | 1,172,682 | |
| Silgan Holdings, Inc. | 24,887 | 1,008,421 | |
| Sonoco Products Co. | 29,919 | 1,908,533 | |
| WestRock Co. | 77,624 | 3,819,877 | |
| 41,590,018 | |||
| Metals & Mining - 0.9% | |||
| Alcoa Corp. (a) | 55,670 | 2,235,151 | |
| Cleveland-Cliffs, Inc. (a)(b) | 135,797 | 3,394,925 | |
| Freeport-McMoRan, Inc. | 308,598 | 11,757,584 | |
| Newmont Corp. | 239,167 | 15,024,471 | |
| Nucor Corp. | 89,090 | 9,267,142 | |
| Reliance Steel & Aluminum Co. | 18,880 | 2,966,992 | |
| Royal Gold, Inc. | 19,530 | 2,373,286 | |
| Southern Copper Corp. | 2,184 | 143,358 | |
| Steel Dynamics, Inc. | 48,621 | 3,133,623 | |
| United States Steel Corp. | 79,696 | 2,110,350 | |
| 52,406,882 | |||
| Paper & Forest Products - 0.0% | |||
| Louisiana-Pacific Corp. | 28,199 | 1,563,353 | |
| TOTAL MATERIALS | 228,805,039 | ||
| REAL ESTATE - 4.7% | |||
| Equity Real Estate Investment Trusts (REITs) - 4.5% | |||
| Alexandria Real Estate Equities, Inc. | 43,613 | 8,781,041 | |
| American Campus Communities, Inc. | 40,811 | 2,053,201 | |
| American Homes 4 Rent Class A | 82,852 | 3,479,784 | |
| Americold Realty Trust | 75,230 | 2,922,686 | |
| Apartment Income (REIT) Corp. | 46,575 | 2,451,708 | |
| AvalonBay Communities, Inc. | 41,567 | 9,470,210 | |
| Boston Properties, Inc. | 46,546 | 5,463,569 | |
| Brixmor Property Group, Inc. | 88,249 | 2,031,492 | |
| Camden Property Trust (SBI) | 28,160 | 4,206,822 | |
| CoreSite Realty Corp. | 2,790 | 385,606 | |
| Cousins Properties, Inc. | 44,189 | 1,755,187 | |
| CubeSmart | 59,814 | 2,970,363 | |
| CyrusOne, Inc. | 36,494 | 2,600,927 | |
| Digital Realty Trust, Inc. | 83,698 | 12,902,884 | |
| Douglas Emmett, Inc. | 49,642 | 1,658,043 | |
| Duke Realty Corp. | 111,576 | 5,676,987 | |
| EPR Properties | 21,986 | 1,105,896 | |
| Equinix, Inc. | 7,734 | 6,345,051 | |
| Equity Lifestyle Properties, Inc. | 24,445 | 2,048,491 | |
| Equity Residential (SBI) | 109,897 | 9,245,635 | |
| Essex Property Trust, Inc. | 19,322 | 6,339,548 | |
| Extra Space Storage, Inc. | 35,621 | 6,203,041 | |
| Federal Realty Investment Trust (SBI) | 22,999 | 2,703,072 | |
| First Industrial Realty Trust, Inc. | 38,337 | 2,100,101 | |
| Gaming & Leisure Properties | 65,701 | 3,110,285 | |
| Healthcare Trust of America, Inc. | 64,864 | 1,854,462 | |
| Healthpeak Properties, Inc. | 160,731 | 5,942,225 | |
| Highwoods Properties, Inc. (SBI) | 30,693 | 1,463,749 | |
| Host Hotels & Resorts, Inc. (a) | 208,453 | 3,320,656 | |
| Hudson Pacific Properties, Inc. | 43,589 | 1,188,236 | |
| Invitation Homes, Inc. | 169,266 | 6,885,741 | |
| Iron Mountain, Inc. | 25,207 | 1,103,058 | |
| JBG SMITH Properties | 36,796 | 1,200,653 | |
| Kilroy Realty Corp. | 34,593 | 2,396,257 | |
| Kimco Realty Corp. | 123,023 | 2,624,081 | |
| Lamar Advertising Co. Class A | 3,202 | 341,333 | |
| Life Storage, Inc. | 22,748 | 2,669,705 | |
| Medical Properties Trust, Inc. | 172,747 | 3,632,869 | |
| Mid-America Apartment Communities, Inc. | 33,939 | 6,553,621 | |
| National Retail Properties, Inc. | 52,058 | 2,544,074 | |
| Omega Healthcare Investors, Inc. | 70,058 | 2,541,704 | |
| Park Hotels & Resorts, Inc. (a) | 69,780 | 1,290,930 | |
| Prologis (REIT), Inc. | 219,971 | 28,165,087 | |
| Public Storage | 10,611 | 3,315,725 | |
| Rayonier, Inc. | 41,208 | 1,553,954 | |
| Realty Income Corp. | 111,431 | 7,832,485 | |
| Regency Centers Corp. | 50,343 | 3,292,936 | |
| Rexford Industrial Realty, Inc. | 40,002 | 2,460,923 | |
| SBA Communications Corp. Class A | 26,906 | 9,174,677 | |
| Simon Property Group, Inc. | 12,760 | 1,614,395 | |
| SL Green Realty Corp. | 20,937 | 1,558,969 | |
| Spirit Realty Capital, Inc. | 34,205 | 1,717,775 | |
| Store Capital Corp. | 72,801 | 2,634,668 | |
| Sun Communities, Inc. | 32,949 | 6,461,628 | |
| UDR, Inc. | 88,030 | 4,840,770 | |
| Ventas, Inc. | 111,775 | 6,681,910 | |
| VEREIT, Inc. | 68,215 | 3,340,489 | |
| VICI Properties, Inc. (b) | 160,112 | 4,993,893 | |
| Vornado Realty Trust | 52,315 | 2,275,703 | |
| Weingarten Realty Investors (SBI) | 35,508 | 1,143,003 | |
| Welltower, Inc. | 124,561 | 10,819,368 | |
| Weyerhaeuser Co. | 223,436 | 7,536,496 | |
| WP Carey, Inc. | 52,606 | 4,244,778 | |
| 271,224,616 | |||
| Real Estate Management & Development - 0.2% | |||
| CBRE Group, Inc. (a) | 94,300 | 9,096,178 | |
| Howard Hughes Corp. (a) | 12,328 | 1,142,929 | |
| Jones Lang LaSalle, Inc. (a) | 15,238 | 3,391,522 | |
| Opendoor Technologies, Inc. (a) | 82,341 | 1,220,294 | |
| 14,850,923 | |||
| TOTAL REAL ESTATE | 286,075,539 | ||
| UTILITIES - 4.9% | |||
| Electric Utilities - 3.1% | |||
| Alliant Energy Corp. | 74,573 | 4,364,758 | |
| American Electric Power Co., Inc. | 149,287 | 13,155,170 | |
| Avangrid, Inc. (b) | 16,982 | 885,441 | |
| Duke Energy Corp. | 229,597 | 24,132,941 | |
| Edison International | 111,193 | 6,060,019 | |
| Entergy Corp. | 59,761 | 6,150,602 | |
| Evergy, Inc. | 68,169 | 4,445,982 | |
| Eversource Energy | 102,367 | 8,831,201 | |
| Exelon Corp. | 291,180 | 13,627,224 | |
| FirstEnergy Corp. | 162,197 | 6,215,389 | |
| Hawaiian Electric Industries, Inc. | 31,501 | 1,365,253 | |
| IDACORP, Inc. | 15,028 | 1,584,703 | |
| NextEra Energy, Inc. | 585,266 | 45,592,221 | |
| NRG Energy, Inc. | 39,663 | 1,635,702 | |
| OGE Energy Corp. | 59,480 | 2,007,450 | |
| PG&E Corp. (a) | 450,343 | 3,958,515 | |
| Pinnacle West Capital Corp. | 33,575 | 2,805,191 | |
| PPL Corp. | 229,782 | 6,518,915 | |
| Southern Co. | 315,616 | 20,158,394 | |
| Xcel Energy, Inc. | 160,563 | 10,958,425 | |
| 184,453,496 | |||
| Gas Utilities - 0.1% | |||
| Atmos Energy Corp. | 38,546 | 3,800,250 | |
| National Fuel Gas Co. | 26,073 | 1,340,934 | |
| UGI Corp. | 61,959 | 2,849,494 | |
| 7,990,678 | |||
| Independent Power and Renewable Electricity Producers - 0.1% | |||
| Brookfield Renewable Corp. | 28,451 | 1,207,460 | |
| The AES Corp. | 196,932 | 4,667,288 | |
| Vistra Corp. | 142,798 | 2,734,582 | |
| 8,609,330 | |||
| Multi-Utilities - 1.4% | |||
| Ameren Corp. | 75,902 | 6,369,696 | |
| CenterPoint Energy, Inc. | 173,217 | 4,410,105 | |
| CMS Energy Corp. | 86,162 | 5,323,950 | |
| Consolidated Edison, Inc. | 102,404 | 7,554,343 | |
| Dominion Energy, Inc. | 240,376 | 17,996,951 | |
| DTE Energy Co. | 57,534 | 6,749,889 | |
| MDU Resources Group, Inc. | 59,436 | 1,885,310 | |
| NiSource, Inc. | 116,731 | 2,891,427 | |
| Public Service Enterprise Group, Inc. | 150,393 | 9,358,956 | |
| Sempra Energy | 94,114 | 12,295,994 | |
| WEC Energy Group, Inc. | 94,126 | 8,861,022 | |
| 83,697,643 | |||
| Water Utilities - 0.2% | |||
| American Water Works Co., Inc. | 54,152 | 9,211,797 | |
| Essential Utilities, Inc. | 66,792 | 3,280,823 | |
| 12,492,620 | |||
| TOTAL UTILITIES | 297,243,767 | ||
| TOTAL COMMON STOCKS | |||
| (Cost $4,332,645,279) | 6,026,680,325 | ||
| Money Market Funds - 1.4% | |||
| Fidelity Cash Central Fund 0.06% (c) | 18,057,656 | 18,061,268 | |
| Fidelity Securities Lending Cash Central Fund 0.06% (c)(d) | 67,252,037 | 67,258,763 | |
| TOTAL MONEY MARKET FUNDS | |||
| (Cost $85,319,654) | 85,320,031 | ||
| TOTAL INVESTMENT IN SECURITIES - 101.1% | |||
| (Cost $4,417,964,933) | 6,112,000,356 | ||
| NET OTHER ASSETS (LIABILITIES) - (1.1)% | (67,457,526) | ||
| NET ASSETS - 100% | $6,044,542,830 |
| Futures Contracts | |||||
| Number of contracts | Expiration Date | Notional Amount | Value | Unrealized Appreciation/(Depreciation) | |
| Purchased | |||||
| Equity Index Contracts | |||||
| CME E-mini S&P 500 Index Contracts (United States) | 45 | Sept. 2021 | $9,876,375 | $312,104 | $312,104 |
| CME E-mini S&P MidCap 400 Index Contracts (United States) | 40 | Sept. 2021 | 10,794,800 | 203,669 | 203,668 |
| TOTAL FUTURES CONTRACTS | $515,772 |
The notional amount of futures purchased as a percentage of Net Assets is 0.3%
Legend
(a) Non-income producing
(b) Security or a portion of the security is on loan at period end.
(c) Affiliated fund that is generally available only to investment companies and other accounts managed by Fidelity Investments. The rate quoted is the annualized seven-day yield of the fund at period end. A complete unaudited listing of the fund's holdings as of its most recent quarter end is available upon request. In addition, each Fidelity Central Fund's financial statements are available on the SEC's website or upon request.
(d) Investment made with cash collateral received from securities on loan.
Affiliated Central Funds
Information regarding fiscal year to date income earned by the Fund from investments in Fidelity Central Funds is as follows:
| Fund | Income earned |
| Fidelity Cash Central Fund | $3,917 |
| Fidelity Securities Lending Cash Central Fund | 73,411 |
| Total | $77,328 |
Amounts in the income column in the above table include any capital gain distributions from underlying funds, which are presented in the corresponding line-item in the Statement of Operations, if applicable. Amount for Fidelity Securities Lending Cash Central Fund represents the income earned on investing cash collateral, less rebates paid to borrowers and any lending agent fees associated with the loan, plus any premium payments received for lending certain types of securities.
Fiscal year to date information regarding the Fund's investments in Fidelity Central Funds, including the ownership percentage, is presented below.
| Fund | Value, beginning of period | Purchases | Sales Proceeds | Realized Gain/Loss | Change in Unrealized appreciation (depreciation) | Value, end of period | % ownership, end of period |
| Fidelity Cash Central Fund 0.06% | $5,509,023 | $516,628,654 | $504,077,989 | $1,580 | $-- | $18,061,268 | 0.0% |
| Fidelity Securities Lending Cash Central Fund 0.06% | 56,536,826 | 257,372,263 | 246,650,326 | -- | -- | 67,258,763 | 0.2% |
| Total | $62,045,849 | $774,000,917 | $750,728,315 | $1,580 | $-- | $85,320,031 |
Investment Valuation
The following is a summary of the inputs used, as of July 31, 2021, involving the Fund's assets and liabilities carried at fair value. The inputs or methodology used for valuing securities may not be an indication of the risk associated with investing in those securities. For more information on valuation inputs, and their aggregation into the levels used below, please refer to the Investment Valuation section in the accompanying Notes to Financial Statements.
| Valuation Inputs at Reporting Date: | ||||
| Description | Total | Level 1 | Level 2 | Level 3 |
| Investments in Securities: | ||||
| Equities: | ||||
| Communication Services | $509,508,479 | $509,508,479 | $-- | $-- |
| Consumer Discretionary | 346,681,535 | 346,681,535 | -- | -- |
| Consumer Staples | 434,192,998 | 434,192,998 | -- | -- |
| Energy | 283,957,530 | 283,957,530 | -- | -- |
| Financials | 1,237,660,796 | 1,237,660,796 | -- | -- |
| Health Care | 1,061,315,999 | 1,061,315,999 | -- | -- |
| Industrials | 726,741,444 | 726,741,444 | -- | -- |
| Information Technology | 614,497,199 | 614,497,199 | -- | -- |
| Materials | 228,805,039 | 228,805,039 | -- | -- |
| Real Estate | 286,075,539 | 286,075,539 | -- | -- |
| Utilities | 297,243,767 | 297,243,767 | -- | -- |
| Money Market Funds | 85,320,031 | 85,320,031 | -- | -- |
| Total Investments in Securities: | $6,112,000,356 | $6,112,000,356 | $-- | $-- |
| Derivative Instruments: | ||||
| Assets | ||||
| Futures Contracts | $515,772 | $515,772 | $-- | $-- |
| Total Assets | $515,772 | $515,772 | $-- | $-- |
| Total Derivative Instruments: | $515,772 | $515,772 | $-- | $-- |
Value of Derivative Instruments
The following table is a summary of the Fund's value of derivative instruments by primary risk exposure as of July 31, 2021. For additional information on derivative instruments, please refer to the Derivative Instruments section in the accompanying Notes to Financial Statements.
| Primary Risk Exposure / Derivative Type | Value | |
| Asset | Liability | |
| Equity Risk | ||
| Futures Contracts(a) | $515,772 | $0 |
| Total Equity Risk | 515,772 | 0 |
| Total Value of Derivatives | $515,772 | $0 |
(a) Reflects gross cumulative appreciation (depreciation) on futures contracts as presented in the Schedule of Investments. In the Statement of Assets and Liabilities, the period end daily variation margin is included in receivable or payable for daily variation margin on futures contracts, and the net cumulative appreciation (depreciation) is included in Total accumulated earnings (loss).
See accompanying notes which are an integral part of the financial statements.
Financial Statements
Statement of Assets and Liabilities
| July 31, 2021 (Unaudited) | ||
| Assets | ||
| Investment in securities, at value (including securities loaned of $64,294,997) — See accompanying schedule: Unaffiliated issuers (cost $4,332,645,279) | $6,026,680,325 | |
| Fidelity Central Funds (cost $85,319,654) | 85,320,031 | |
| Total Investment in Securities (cost $4,417,964,933) | $6,112,000,356 | |
| Segregated cash with brokers for derivative instruments | 1,315,500 | |
| Receivable for investments sold | 20,919,838 | |
| Receivable for fund shares sold | 86,228 | |
| Dividends receivable | 7,514,079 | |
| Distributions receivable from Fidelity Central Funds | 14,396 | |
| Other receivables | 53 | |
| Total assets | 6,141,850,450 | |
| Liabilities | ||
| Payable to custodian bank | $104 | |
| Payable for fund shares redeemed | 29,909,895 | |
| Payable for daily variation margin on futures contracts | 87,318 | |
| Other payables and accrued expenses | 62,346 | |
| Collateral on securities loaned | 67,247,957 | |
| Total liabilities | 97,307,620 | |
| Net Assets | $6,044,542,830 | |
| Net Assets consist of: | ||
| Paid in capital | $4,145,453,284 | |
| Total accumulated earnings (loss) | 1,899,089,546 | |
| Net Assets | $6,044,542,830 | |
| Net Asset Value, offering price and redemption price per share ($6,044,542,830 ÷ 388,038,948 shares) | $15.58 |
See accompanying notes which are an integral part of the financial statements.
Statement of Operations
| Six months ended July 31, 2021 (Unaudited) | ||
| Investment Income | ||
| Dividends | $58,879,682 | |
| Interest | 412 | |
| Income from Fidelity Central Funds (including $73,411 from security lending) | 77,328 | |
| Total income | 58,957,422 | |
| Expenses | ||
| Custodian fees and expenses | $78,760 | |
| Independent trustees' fees and expenses | 7,450 | |
| Interest | 4,044 | |
| Total expenses | 90,254 | |
| Net investment income (loss) | 58,867,168 | |
| Realized and Unrealized Gain (Loss) | ||
| Net realized gain (loss) on: | ||
| Investment securities: | ||
| Unaffiliated issuers | 327,466,874 | |
| Fidelity Central Funds | 1,580 | |
| Futures contracts | 2,019,411 | |
| Total net realized gain (loss) | 329,487,865 | |
| Change in net unrealized appreciation (depreciation) on: | ||
| Investment securities: | ||
| Unaffiliated issuers | 612,138,073 | |
| Futures contracts | 313,678 | |
| Total change in net unrealized appreciation (depreciation) | 612,451,751 | |
| Net gain (loss) | 941,939,616 | |
| Net increase (decrease) in net assets resulting from operations | $1,000,806,784 |
See accompanying notes which are an integral part of the financial statements.
Statement of Changes in Net Assets
| Six months ended July 31, 2021 (Unaudited) | Year ended January 31, 2021 | |
| Increase (Decrease) in Net Assets | ||
| Operations | ||
| Net investment income (loss) | $58,867,168 | $106,397,256 |
| Net realized gain (loss) | 329,487,865 | (153,667,926) |
| Change in net unrealized appreciation (depreciation) | 612,451,751 | 354,685,681 |
| Net increase (decrease) in net assets resulting from operations | 1,000,806,784 | 307,415,011 |
| Distributions to shareholders | (5,262,265) | (128,478,104) |
| Share transactions | ||
| Proceeds from sales of shares | 632,266,941 | 1,540,722,235 |
| Reinvestment of distributions | 5,262,265 | 128,478,104 |
| Cost of shares redeemed | (932,801,852) | (540,744,199) |
| Net increase (decrease) in net assets resulting from share transactions | (295,272,646) | 1,128,456,140 |
| Total increase (decrease) in net assets | 700,271,873 | 1,307,393,047 |
| Net Assets | ||
| Beginning of period | 5,344,270,957 | 4,036,877,910 |
| End of period | $6,044,542,830 | $5,344,270,957 |
| Other Information | ||
| Shares | ||
| Sold | 42,807,475 | 131,746,213 |
| Issued in reinvestment of distributions | 369,541 | 10,082,192 |
| Redeemed | (63,326,122) | (46,286,207) |
| Net increase (decrease) | (20,149,106) | 95,542,198 |
See accompanying notes which are an integral part of the financial statements.
Financial Highlights
Fidelity Series Large Cap Value Index Fund
| Six months ended (Unaudited) July 31, | Years endedJanuary 31, | |||||
| 2021 | 2021 | 2020 | 2019 | 2018 | 2017 | |
| Selected Per–Share Data | ||||||
| Net asset value, beginning of period | $13.09 | $12.91 | $12.02 | $13.22 | $11.75 | $9.68 |
| Income from Investment Operations | ||||||
| Net investment income (loss)A | .15 | .29 | .33 | .32 | .30 | .26 |
| Net realized and unrealized gain (loss) | 2.35 | .23 | 1.46 | (.96) | 1.69 | 2.10 |
| Total from investment operations | 2.50 | .52 | 1.79 | (.64) | 1.99 | 2.36 |
| Distributions from net investment income | (.01) | (.29) | (.34) | (.33) | (.30) | (.19) |
| Distributions from net realized gain | – | (.05) | (.57) | (.22) | (.22) | (.10) |
| Total distributions | (.01) | (.34) | (.90)B | (.56)B | (.52) | (.29) |
| Net asset value, end of period | $15.58 | $13.09 | $12.91 | $12.02 | $13.22 | $11.75 |
| Total ReturnC,D | 19.13% | 4.14% | 14.94% | (4.73)% | 17.16% | 24.44% |
| Ratios to Average Net AssetsE,F | ||||||
| Expenses before reductions | - %G,H | - %H | - %H | - %H | .03% | .10% |
| Expenses net of fee waivers, if any | - %G,H | - %H | - %H | - %H | .03% | .10% |
| Expenses net of all reductions | - %G,H | - %H | - %H | - %H | .03% | .10% |
| Net investment income (loss) | 1.99%G | 2.49% | 2.58% | 2.52% | 2.39% | 2.41% |
| Supplemental Data | ||||||
| Net assets, end of period (000 omitted) | $6,044,543 | $5,344,271 | $4,036,878 | $3,698,418 | $4,024,272 | $1,529,003 |
| Portfolio turnover rateI | 46%G | 21% | 31% | 19% | 17% | 16% |
A Calculated based on average shares outstanding during the period.
B Total distributions per share do not sum due to rounding.
C Total returns for periods of less than one year are not annualized.
D Total returns would have been lower if certain expenses had not been reduced during the applicable periods shown.
E Fees and expenses of any underlying mutual funds or exchange-traded funds (ETFs) are not included in the Fund's expense ratio. The Fund indirectly bears its proportionate share of these expenses. For additional expense information related to investments in Fidelity Central Funds, please refer to the "Investments in Fidelity Central Funds" note found in the Notes to Financial Statements section of the most recent Annual or Semi-Annual report.
F Expense ratios reflect operating expenses of the class. Expenses before reductions do not reflect amounts reimbursed, waived, or reduced through arrangements with the investment advisor, brokerage services, or other offset arrangements, if applicable, and do not represent the amount paid by the class during periods when reimbursements, waivers or reductions occur.
G Annualized
H Amount represents less than .005%.
I Amount does not include the portfolio activity of any underlying mutual funds or exchange-traded funds (ETFs).
See accompanying notes which are an integral part of the financial statements.
Notes to Financial Statements (Unaudited)
For the period ended July 31, 2021
1. Organization.
Fidelity Series Large Cap Value Index Fund (the Fund) is a fund of Fidelity Salem Street Trust (the Trust) and is authorized to issue an unlimited number of shares. Shares are offered only to certain other Fidelity funds and Fidelity managed 529 plans. The Trust is registered under the Investment Company Act of 1940, as amended (the 1940 Act), as an open-end management investment company organized as a Massachusetts business trust.
2. Investments in Fidelity Central Funds.
Funds may invest in Fidelity Central Funds, which are open-end investment companies generally available only to other investment companies and accounts managed by the investment adviser and its affiliates. The Schedule of Investments lists any Fidelity Central Funds held as an investment as of period end, but does not include the underlying holdings of each Fidelity Central Fund. An investing fund indirectly bears its proportionate share of the expenses of the underlying Fidelity Central Funds.
Based on its investment objective, each Fidelity Central Fund may invest or participate in various investment vehicles or strategies that are similar to those of the investing fund. These strategies are consistent with the investment objectives of the investing fund and may involve certain economic risks which may cause a decline in value of each of the Fidelity Central Funds and thus a decline in the value of the investing fund.
| Fidelity Central Fund | Investment Manager | Investment Objective | Investment Practices | Expense Ratio(a) |
| Fidelity Money Market Central Funds | Fidelity Management & Research Company LLC (FMR) | Each fund seeks to obtain a high level of current income consistent with the preservation of capital and liquidity. | Short-term Investments | Less than .005% to .01% |
(a) Expenses expressed as a percentage of average net assets and are as of each underlying Central Fund's most recent annual or semi-annual shareholder report.
A complete unaudited list of holdings for each Fidelity Central Fund is available upon request or at the Securities and Exchange Commission website at www.sec.gov. In addition, the financial statements of the Fidelity Central Funds which contain the significant accounting policies (including investment valuation policies) of those funds, and are not covered by the Report of Independent Registered Public Accounting Firm, are available on the Securities and Exchange Commission website or upon request.
3. Significant Accounting Policies.
The Fund is an investment company and applies the accounting and reporting guidance of the Financial Accounting Standards Board (FASB) Accounting Standards Codification Topic 946 Financial Services - Investment Companies. The financial statements have been prepared in conformity with accounting principles generally accepted in the United States of America (GAAP), which require management to make certain estimates and assumptions at the date of the financial statements. Actual results could differ from those estimates. Subsequent events, if any, through the date that the financial statements were issued have been evaluated in the preparation of the financial statements. The Fund's Schedule of Investments lists any underlying mutual funds or exchange-traded funds (ETFs) but does not include the underlying holdings of these funds. The following summarizes the significant accounting policies of the Fund:
Investment Valuation. Investments are valued as of 4:00 p.m. Eastern time on the last calendar day of the period. The Board of Trustees (the Board) has delegated the day to day responsibility for the valuation of the Fund's investments to the Fair Value Committee (the Committee) established by the Fund's investment adviser. In accordance with valuation policies and procedures approved by the Board, the Fund attempts to obtain prices from one or more third party pricing vendors or brokers to value its investments. When current market prices, quotations or currency exchange rates are not readily available or reliable, investments will be fair valued in good faith by the Committee, in accordance with procedures adopted by the Board. Factors used in determining fair value vary by investment type and may include market or investment specific events. The frequency with which these procedures are used cannot be predicted and they may be utilized to a significant extent. The Committee oversees the Fund's valuation policies and procedures and reports to the Board on the Committee's activities and fair value determinations. The Board monitors the appropriateness of the procedures used in valuing the Fund's investments and ratifies the fair value determinations of the Committee.
The Fund categorizes the inputs to valuation techniques used to value its investments into a disclosure hierarchy consisting of three levels as shown below:
- Level 1 – quoted prices in active markets for identical investments
- Level 2 – other significant observable inputs (including quoted prices for similar investments, interest rates, prepayment speeds, etc.)
- Level 3 – unobservable inputs (including the Fund's own assumptions based on the best information available)
Valuation techniques used to value the Fund's investments by major category are as follows:
Equity securities, including restricted securities, for which market quotations are readily available, are valued at the last reported sale price or official closing price as reported by a third party pricing vendor on the primary market or exchange on which they are traded and are categorized as Level 1 in the hierarchy. In the event there were no sales during the day or closing prices are not available, securities are valued at the last quoted bid price or may be valued using the last available price and are generally categorized as Level 2 in the hierarchy. For foreign equity securities, when market or security specific events arise, comparisons to the valuation of American Depositary Receipts (ADRs), futures contracts, Exchange-Traded Funds (ETFs) and certain indexes as well as quoted prices for similar securities may be used and would be categorized as Level 2 in the hierarchy. For equity securities, including restricted securities, where observable inputs are limited, assumptions about market activity and risk are used and these securities may be categorized as Level 3 in the hierarchy.
Futures contracts are valued at the settlement price established each day by the board of trade or exchange on which they are traded and are categorized as Level 1 in the hierarchy. Investments in open-end mutual funds, including the Fidelity Central Funds, are valued at their closing net asset value (NAV) each business day and are categorized as Level 1 in the hierarchy.
Changes in valuation techniques may result in transfers in or out of an assigned level within the disclosure hierarchy. The aggregate value of investments by input level as of July 31, 2021 is included at the end of the Fund's Schedule of Investments.
Investment Transactions and Income. For financial reporting purposes, the Fund's investment holdings and NAV include trades executed through the end of the last business day of the period. The NAV per share for processing shareholder transactions is calculated as of the close of business of the New York Stock Exchange (NYSE), normally 4:00 p.m. Eastern time and includes trades executed through the end of the prior business day. Gains and losses on securities sold are determined on the basis of identified cost and include proceeds received from litigation. Dividend income is recorded on the ex-dividend date, except for certain dividends from foreign securities where the ex-dividend date may have passed, which are recorded as soon as the Fund is informed of the ex-dividend date. Non-cash dividends included in dividend income, if any, are recorded at the fair market value of the securities received. Income and capital gain distributions from Fidelity Central Funds, if any, are recorded on the ex-dividend date. Certain distributions received by the Fund represent a return of capital or capital gain. The Fund determines the components of these distributions subsequent to the ex-dividend date, based upon receipt of tax filings or other correspondence relating to the underlying investment. These distributions are recorded as a reduction of cost of investments and/or as a realized gain. Interest income is accrued as earned and includes coupon interest and amortization of premium and accretion of discount on debt securities as applicable.
Expenses. Expenses directly attributable to a fund are charged to that fund. Expenses attributable to more than one fund are allocated among the respective funds on the basis of relative net assets or other appropriate methods. Expenses included in the accompanying financial statements reflect the expenses of that fund and do not include any expenses associated with any underlying mutual funds or exchange-traded funds. Although not included in a fund's expenses, a fund indirectly bears its proportionate share of these expenses through the net asset value of each underlying mutual fund or exchange-traded fund. Expense estimates are accrued in the period to which they relate and adjustments are made when actual amounts are known.
Income Tax Information and Distributions to Shareholders. Each year, the Fund intends to qualify as a regulated investment company under Subchapter M of the Internal Revenue Code, including distributing substantially all of its taxable income and realized gains. As a result, no provision for U.S. Federal income taxes is required. The Fund files a U.S. federal tax return, in addition to state and local tax returns as required. The Fund's federal income tax returns are subject to examination by the Internal Revenue Service (IRS) for a period of three fiscal years after they are filed. State and local tax returns may be subject to examination for an additional fiscal year depending on the jurisdiction.
Distributions are declared and recorded on the ex-dividend date. Income and capital gain distributions are determined in accordance with income tax regulations, which may differ from GAAP.
Capital accounts within the financial statements are adjusted for permanent book-tax differences. These adjustments have no impact on net assets or the results of operations. Capital accounts are not adjusted for temporary book-tax differences which will reverse in a subsequent period.
Book-tax differences are primarily due to certain deemed distributions, futures contracts, partnerships, capital loss carryforwards, passive foreign investment companies(PFIC) and losses deferred due to wash sales.
As of period end, the cost and unrealized appreciation (depreciation) in securities, and derivatives if applicable, for federal income tax purposes were as follows:
| Gross unrealized appreciation | $1,826,300,368 |
| Gross unrealized depreciation | (226,316,693) |
| Net unrealized appreciation (depreciation) | $1,599,983,675 |
| Tax cost | $4,512,532,453 |
Capital loss carryforwards are only available to offset future capital gains of the Fund to the extent provided by regulations and may be limited. The capital loss carryforward information presented below, including any applicable limitation, is estimated as of prior fiscal period end and is subject to adjustment.
| No expiration | |
| Short-term | $(7,721,908) |
| Long-term | (14,427,658) |
| Total capital loss carryforward | $(22,149,566) |
4. Derivative Instruments.
Risk Exposures and the Use of Derivative Instruments. The Fund's investment objective allows the Fund to enter into various types of derivative contracts, including futures contracts. Derivatives are investments whose value is primarily derived from underlying assets, indices or reference rates and may be transacted on an exchange or over-the-counter (OTC). Derivatives may involve a future commitment to buy or sell a specified asset based on specified terms, to exchange future cash flows at periodic intervals based on a notional principal amount, or for one party to make one or more payments upon the occurrence of specified events in exchange for periodic payments from the other party.
The Fund used derivatives to increase returns and to manage exposure to certain risks as defined below. The success of any strategy involving derivatives depends on analysis of numerous economic factors, and if the strategies for investment do not work as intended, the Fund may not achieve its objectives.
The Fund's use of derivatives increased or decreased its exposure to the following risk:
| Equity Risk | Equity risk relates to the fluctuations in the value of financial instruments as a result of changes in market prices (other than those arising from interest rate risk or foreign exchange risk), whether caused by factors specific to an individual investment, its issuer, or all factors affecting all instruments traded in a market or market segment. |
The Fund is also exposed to additional risks from investing in derivatives, such as liquidity risk and counterparty credit risk. Liquidity risk is the risk that the Fund will be unable to close out the derivative in the open market in a timely manner. Counterparty credit risk is the risk that the counterparty will not be able to fulfill its obligation to the Fund. Counterparty credit risk related to exchange-traded futures contracts may be mitigated by the protection provided by the exchange on which they trade.
Investing in derivatives may involve greater risks than investing in the underlying assets directly and, to varying degrees, may involve risk of loss in excess of any initial investment and collateral received and amounts recognized in the Statement of Assets and Liabilities. In addition, there may be the risk that the change in value of the derivative contract does not correspond to the change in value of the underlying instrument.
Futures Contracts. A futures contract is an agreement between two parties to buy or sell a specified underlying instrument for a fixed price at a specified future date. The Fund used futures contracts to manage its exposure to the stock market.
Upon entering into a futures contract, a fund is required to deposit either cash or securities (initial margin) with a clearing broker in an amount equal to a certain percentage of the face value of the contract. Futures contracts are marked-to-market daily and subsequent daily payments (variation margin) are made or received by a fund depending on the daily fluctuations in the value of the futures contracts and are recorded as unrealized appreciation or (depreciation). This receivable and/or payable, if any, is included in daily variation margin on futures contracts in the Statement of Assets and Liabilities. Realized gain or (loss) is recorded upon the expiration or closing of a futures contract. The net realized gain (loss) and change in net unrealized appreciation (depreciation) on futures contracts during the period is presented in the Statement of Operations.
Any open futures contracts at period end are presented in the Schedule of Investments under the caption "Futures Contracts". The notional amount at value reflects each contract's exposure to the underlying instrument or index at period end and is representative of volume of activity during the period. Cash deposited to meet initial margin requirements is presented as segregated cash with brokers for derivative instruments in the Statement of Assets and Liabilities.
5. Purchases and Sales of Investments.
Purchases and sales of securities, other than short-term securities and in-kind transactions, as applicable, are noted in the table below.
| Purchases ($) | Sales ($) | |
| Fidelity Series Large Cap Value Index Fund | 1,329,257,569 | 1,562,801,606 |
6. Fees and Other Transactions with Affiliates.
Management Fee. Fidelity Management & Research Company LLC (the investment adviser) and its affiliates provide the Fund with investment management related services for which the Fund does not pay a management fee. Under the management contract, the investment adviser or an affiliate pays all ordinary operating expenses of the Fund, except custody fees, fees and expenses of the independent Trustees, and certain miscellaneous expenses such as proxy and shareholder meeting expenses.
Sub-Adviser. Geode Capital Management, LLC (Geode), serves as sub-adviser for the Fund. Geode provides discretionary investment advisory services to the Fund and is paid by the investment adviser for providing these services.
Interfund Lending Program. Pursuant to an Exemptive Order issued by the Securities and Exchange Commission (the SEC), the Fund, along with other registered investment companies having management contracts with Fidelity Management & Research Company LLC (FMR), or other affiliated entities of FMR, may participate in an interfund lending program. This program provides an alternative credit facility allowing the Fund to borrow from, or lend money to, other participating affiliated funds. At period end, there were no interfund loans outstanding. Activity in this program during the period for which loans were outstanding was as follows:
| Borrower or Lender | Average Loan Balance | Weighted Average Interest Rate | Interest Expense | |
| Fidelity Series Large Cap Value Index Fund | Borrower | $54,784,667 | .30% | $4,044 |
Interfund Trades. Funds may purchase from or sell securities to other Fidelity Funds under procedures adopted by the Board. The procedures have been designed to ensure these interfund trades are executed in accordance with Rule 17a-7 of the 1940 Act. Any interfund trades are included within the respective purchases and sales amounts shown in the Purchases and Sales of Investments note.
7. Committed Line of Credit.
Certain Funds participate with other funds managed by the investment adviser or an affiliate in a $4.25 billion credit facility (the "line of credit") to be utilized for temporary or emergency purposes to fund shareholder redemptions or for other short-term liquidity purposes. The commitment fees on the pro-rata portion of the line of credit are borne by the investment adviser. During the period, there were no borrowings on this line of credit.
8. Security Lending.
Funds lend portfolio securities from time to time in order to earn additional income. Lending agents are used, including National Financial Services (NFS), an affiliate of the investment adviser. Pursuant to a securities lending agreement, NFS will receive a fee, which is capped at 9.9% of a fund's daily lending revenue, for its services as lending agent. A fund may lend securities to certain qualified borrowers, including NFS. On the settlement date of the loan, a fund receives collateral (in the form of U.S. Treasury obligations, letters of credit and/or cash) against the loaned securities and maintains collateral in an amount not less than 100% of the market value of the loaned securities during the period of the loan. The market value of the loaned securities is determined at the close of business of a fund and any additional required collateral is delivered to a fund on the next business day. A fund or borrower may terminate the loan at any time, and if the borrower defaults on its obligation to return the securities loaned because of insolvency or other reasons, a fund may apply collateral received from the borrower against the obligation. A fund may experience delays and costs in recovering the securities loaned. Any cash collateral received is invested in the Fidelity Securities Lending Cash Central Fund. Any loaned securities are identified as such in the Schedule of Investments, and the value of loaned securities and cash collateral at period end, as applicable, are presented in the Statement of Assets and Liabilities. Security lending income represents the income earned on investing cash collateral, less rebates paid to borrowers and any lending agent fees associated with the loan, plus any premium payments received for lending certain types of securities. Security lending income is presented in the Statement of Operations as a component of income from Fidelity Central Funds. Affiliated security lending activity, if any, was as follows:
| Total Security Lending Fees Paid to NFS | Security Lending Income From Securities Loaned to NFS | Value of Securities Loaned to NFS at Period End | |
| Fidelity Series Large Cap Value Index Fund | $7,573 | $134 | $– |
9. Other.
Fund's organizational documents provide former and current trustees and officers with a limited indemnification against liabilities arising in connection with the performance of their duties to the fund. In the normal course of business, the fund may also enter into contracts that provide general indemnifications. The fund's maximum exposure under these arrangements is unknown as this would be dependent on future claims that may be made against the fund. The risk of material loss from such claims is considered remote.
At the end of the period, mutual funds and accounts managed by the investment adviser or its affiliates were the owners of record of all of the outstanding shares of the Fund.
10. Coronavirus (COVID-19) Pandemic.
An outbreak of COVID-19 first detected in China during December 2019 has since spread globally and was declared a pandemic by the World Health Organization during March 2020. Developments that disrupt global economies and financial markets, such as the COVID-19 pandemic, may magnify factors that affect the Fund's performance.
Shareholder Expense Example
As a shareholder, you incur two types of costs: (1) transaction costs, which may include sales charges (loads) on purchase payments or redemption proceeds, as applicable and (2) ongoing costs, which generally include management fees, distribution and/or service (12b-1) fees and other Fund expenses. This Example is intended to help you understand your ongoing costs (in dollars) of investing in a fund and to compare these costs with the ongoing costs of investing in other mutual funds.
The Example is based on an investment of $1,000 invested at the beginning of the period and held for the entire period (February 1, 2021 to July 31, 2021).
Actual Expenses
The first line of the accompanying table provides information about actual account values and actual expenses. You may use the information in this line, together with the amount you invested, to estimate the expenses that you paid over the period. Simply divide your account value by $1,000.00 (for example, an $8,600 account value divided by $1,000.00 = 8.6), then multiply the result by the number in the first line for a class/Fund under the heading entitled "Expenses Paid During Period" to estimate the expenses you paid on your account during this period. If any fund is a shareholder of any underlying mutual funds or exchange-traded funds (ETFs) (the Underlying Funds), such fund indirectly bears its proportional share of the expenses of the Underlying Funds in addition to the direct expenses incurred presented in the table. These fees and expenses are not included in the annualized expense ratio used to calculate the expense estimate in the table below.
Hypothetical Example for Comparison Purposes
The second line of the accompanying table provides information about hypothetical account values and hypothetical expenses based on the actual expense ratio and an assumed rate of return of 5% per year before expenses, which is not the actual return. The hypothetical account values and expenses may not be used to estimate the actual ending account balance or expenses you paid for the period. You may use this information to compare the ongoing costs of investing in the Fund and other funds. To do so, compare this 5% hypothetical example with the 5% hypothetical examples that appear in the shareholder reports of the other funds. If any fund is a shareholder of any Underlying Funds, such fund indirectly bears its proportional share of the expenses of the Underlying Funds in addition to the direct expenses as presented in the table. These fees and expenses are not included in the annualized expense ratio used to calculate the expense estimate in the table below.
Please note that the expenses shown in the table are meant to highlight your ongoing costs only and do not reflect any transaction costs. Therefore, the second line of the table is useful in comparing ongoing costs only, and will not help you determine the relative total costs of owning different funds.
| Annualized Expense Ratio-A | Beginning Account Value February 1, 2021 | Ending Account Value July 31, 2021 | Expenses Paid During Period-B February 1, 2021 to July 31, 2021 |
|
| Fidelity Series Large Cap Value Index Fund | - %-C | |||
| Actual | $1,000.00 | $1,191.30 | $--D | |
| Hypothetical-E | $1,000.00 | $1,024.79 | $--D |
A Annualized expense ratio reflects expenses net of applicable fee waivers.
B Expenses are equal to the annualized expense ratio, multiplied by the average account value over the period, multiplied by 181/ 365 (to reflect the one-half year period). The fees and expenses of any Underlying Funds are not included in each annualized expense ratio.
C Amount represents less than .005%.
D Amount represents less than $.005.
E 5% return per year before expenses
Liquidity Risk Management Program
The Securities and Exchange Commission adopted Rule 22e-4 under the Investment Company Act of 1940 (the Liquidity Rule) to promote effective liquidity risk management throughout the open-end investment company industry, thereby reducing the risk that funds will be unable to meet their redemption obligations and mitigating dilution of the interests of fund shareholders.
The Fund has adopted and implemented a liquidity risk management program pursuant to the Liquidity Rule (the Program) effective December 1, 2018. The Program is reasonably designed to assess and manage the Fund’s liquidity risk and to comply with the requirements of the Liquidity Rule. The Fund’s Board of Trustees (the Board) has designated the Fund’s investment adviser as administrator of the Program. The Fidelity advisers have established a Liquidity Risk Management Committee (the LRM Committee) to manage the Program for each of the Fidelity Funds. The LRM Committee monitors the adequacy and effectiveness of implementation of the Program and on a periodic basis assesses each Fund’s liquidity risk based on a variety of factors including (1) the Fund’s investment strategy, (2) portfolio liquidity and cash flow projections during normal and reasonably foreseeable stressed conditions, (3) shareholder redemptions, (4) borrowings and other funding sources and (5) in the case of exchange-traded funds, certain additional factors including the effect of the Fund’s prices and spreads, market participants, and basket compositions on the overall liquidity of the Fund’s portfolio, as applicable.
In accordance with the Program, each of the Fund’s portfolio investments is classified into one of four liquidity categories described below based on a determination of a reasonable expectation for how long it would take to convert the investment to cash (or sell or dispose of the investment) without significantly changing its market value.
- Highly liquid investments – cash or convertible to cash within three business days or less
- Moderately liquid investments – convertible to cash in three to seven calendar days
- Less liquid investments – can be sold or disposed of, but not settled, within seven calendar days
- Illiquid investments – cannot be sold or disposed of within seven calendar days
Liquidity classification determinations take into account a variety of factors including various market, trading and investment-specific considerations, as well as market depth, and generally utilize analysis from a third-party liquidity metrics service.
The Liquidity Rule places a 15% limit on a fund’s illiquid investments and requires funds that do not primarily hold assets that are highly liquid investments to determine and maintain a minimum percentage of the fund’s net assets to be invested in highly liquid investments (highly liquid investment minimum or HLIM). The Program includes provisions reasonably designed to comply with the 15% limit on illiquid investments and for determining, periodically reviewing and complying with the HLIM requirement as applicable.
At a recent meeting of the Fund’s Board of Trustees, the LRM Committee provided a written report to the Board pertaining to the operation, adequacy, and effectiveness of implementation of the Program for the annual period from December 1, 2019 through November 30, 2020. The report concluded that the Program has been implemented and is operating effectively and is reasonably designed to assess and manage the Fund’s liquidity risk.
![]()
XS6-SANN-0921
1.967966.107
Fidelity® SAI Tax-Free Bond Fund
Offered exclusively to certain clients of the Adviser or its affiliates - not available for sale to the general public. Fidelity SAI is a product name of Fidelity® funds dedicated to certain programs affiliated with Strategic Advisers LLC.
Semi-Annual Report
July 31, 2021
Contents
To view a fund's proxy voting guidelines and proxy voting record for the 12-month period ended June 30, visit http://www.fidelity.com/proxyvotingresults or visit the Securities and Exchange Commission's (SEC) web site at http://www.sec.gov.
You may also call 1-800-544-3455 to request a free copy of the proxy voting guidelines.
Standard & Poor's, S&P and S&P 500 are registered service marks of The McGraw-Hill Companies, Inc. and have been licensed for use by Fidelity Distributors Corporation.
Other third-party marks appearing herein are the property of their respective owners.
All other marks appearing herein are registered or unregistered trademarks or service marks of FMR LLC or an affiliated company. © 2021 FMR LLC. All rights reserved.
This report and the financial statements contained herein are submitted for the general information of the shareholders of the Fund. This report is not authorized for distribution to prospective investors in the Fund unless preceded or accompanied by an effective prospectus.
A fund files its complete schedule of portfolio holdings with the SEC for the first and third quarters of each fiscal year on Form N-PORT. Forms N-PORT are available on the SEC’s web site at http://www.sec.gov. A fund's Forms N-PORT may be reviewed and copied at the SEC’s Public Reference Room in Washington, DC. Information regarding the operation of the SEC's Public Reference Room may be obtained by calling 1-800-SEC-0330.
For a complete list of a fund's portfolio holdings, view the most recent holdings listing, semiannual report, or annual report on Fidelity's web site at http://www.fidelity.com, http://www.institutional.fidelity.com, or http://www.401k.com, as applicable.
NOT FDIC INSURED •MAY LOSE VALUE •NO BANK GUARANTEE
Neither the Fund nor Fidelity Distributors Corporation is a bank.
Note to Shareholders:
Early in 2020, the outbreak and spread of a new coronavirus emerged as a public health emergency that had a major influence on financial markets, primarily based on its impact on the global economy and the outlook for corporate earnings. The virus causes a respiratory disease known as COVID-19. On March 11, 2020 the World Health Organization declared the COVID-19 outbreak a pandemic, citing sustained risk of further global spread.
In the weeks following, as the crisis worsened, we witnessed an escalating human tragedy with wide-scale social and economic consequences from coronavirus-containment measures. The outbreak of COVID-19 prompted a number of measures to limit the spread, including travel and border restrictions, quarantines, and restrictions on large gatherings. In turn, these resulted in lower consumer activity, diminished demand for a wide range of products and services, disruption in manufacturing and supply chains, and – given the wide variability in outcomes regarding the outbreak – significant market uncertainty and volatility. Amid the turmoil, global governments and central banks took unprecedented action to help support consumers, businesses, and the broader economies, and to limit disruption to financial systems.
The situation continues to unfold, and the extent and duration of its impact on financial markets and the economy remain highly uncertain. Extreme events such as the coronavirus crisis are “exogenous shocks” that can have significant adverse effects on mutual funds and their investments. Although multiple asset classes may be affected by market disruption, the duration and impact may not be the same for all types of assets.
Fidelity is committed to helping you stay informed amid news about COVID-19 and during increased market volatility, and we’re taking extra steps to be responsive to customer needs. We encourage you to visit our websites, where we offer ongoing updates, commentary, and analysis on the markets and our funds.
Investment Summary (Unaudited)
The information in the following tables is based on the direct investments of the Fund.Top Five States as of July 31, 2021
| % of fund's net assets | |
| Illinois | 12.5 |
| Other | 7.9 |
| New York | 6.9 |
| Texas | 6.6 |
| Pennsylvania | 4.9 |
Top Five Sectors as of July 31, 2021
| % of fund's net assets | |
| General Obligations | 27.3 |
| Transportation | 17.5 |
| Health Care | 16.1 |
| Education | 11.6 |
| Special Tax | 7.4 |
Quality Diversification (% of fund's net assets)
| As of July 31, 2021 | ||
| AAA | 7.4% | |
| AA,A | 68.0% | |
| BBB | 15.3% | |
| BB and Below | 2.3% | |
| Not Rated | 1.1% | |
| Short-Term Investments and Net Other Assets | 5.9% | |

We have used ratings from Moody's Investors Service, Inc. Where Moody's® ratings are not available, we have used S&P® ratings. All ratings are as of the date indicated and do not reflect subsequent changes.
Schedule of Investments July 31, 2021 (Unaudited)
Showing Percentage of Net Assets
| Municipal Bonds - 94.3% | |||
| Principal Amount | Value | ||
| Alabama - 1.1% | |||
| Homewood Edl. Bldg. Auth. Rev. Series 2019 A: | |||
| 4% 12/1/36 | $1,025,000 | $1,195,630 | |
| 4% 12/1/38 | 1,705,000 | 1,979,131 | |
| 4% 12/1/41 | 1,345,000 | 1,551,245 | |
| 4% 12/1/44 | 1,200,000 | 1,375,595 | |
| 4% 12/1/49 | 1,450,000 | 1,650,593 | |
| Lower Alabama Gas District Bonds (No. 2 Proj.) Series 2020, 4%, tender 12/1/25 (a) | 8,505,000 | 9,709,700 | |
| Mobile Indl. Dev. Board Poll. Cont. Rev. Bonds (Alabama Pwr. Co. Barry Plant Proj.) Series 2008, 2.9%, tender 12/12/23 (a) | 4,000,000 | 4,242,248 | |
| Montgomery Med. Clinic Facilities Series 2015, 5% 3/1/25 | 1,400,000 | 1,590,659 | |
| TOTAL ALABAMA | 23,294,801 | ||
| Alaska - 0.3% | |||
| Alaska Hsg. Fin. Corp. Series 2021 A: | |||
| 4% 6/1/30 | 1,100,000 | 1,369,373 | |
| 5% 6/1/27 | 750,000 | 936,368 | |
| 5% 12/1/27 | 1,000,000 | 1,265,325 | |
| 5% 6/1/28 | 1,315,000 | 1,684,924 | |
| Alaska Int'l. Arpts. Revs. Series 2016 A, 5% 10/1/26 | 1,415,000 | 1,680,934 | |
| TOTAL ALASKA | 6,936,924 | ||
| Arizona - 0.9% | |||
| Arizona State Univ. Revs. Series 2021 C: | |||
| 5% 7/1/39 | 1,545,000 | 2,075,897 | |
| 5% 7/1/40 | 1,545,000 | 2,071,621 | |
| Chandler Indl. Dev. Auth. Indl. Dev. Rev. Bonds (Intel Corp. Proj.) Series 2005, 2.4%, tender 8/14/23 (a) | 265,000 | 276,227 | |
| Maricopa County Indl. Dev. Auth.: | |||
| (Creighton Univ. Proj.) Series 2020, 5% 7/1/47 | 600,000 | 754,594 | |
| Bonds Series 2019 B, 5%, tender 9/1/24 (a) | 650,000 | 748,368 | |
| Maricopa County Indl. Dev. Auth. Sr. Living Facilities: | |||
| (Christian Care Mesa II, Inc.) Series 2014 A, 4.5% 1/1/39 | 450,000 | 481,353 | |
| Series 2016: | |||
| 5.75% 1/1/36 (b) | 400,000 | 420,293 | |
| 6% 1/1/48 (b) | 875,000 | 912,623 | |
| Maricopa County Spl. Health Care District Gen. Oblig. Series 2018 C, 5% 7/1/36 | 2,300,000 | 2,878,839 | |
| Phoenix Civic Impt. Board Arpt. Rev. Series 2019 A, 5% 7/1/44 | 1,700,000 | 2,158,654 | |
| Phoenix Civic Impt. Corp. Series 2019 A: | |||
| 5% 7/1/32 | 865,000 | 1,050,587 | |
| 5% 7/1/39 | 500,000 | 597,349 | |
| 5% 7/1/45 | 2,565,000 | 3,029,286 | |
| Western Maricopa Ed. Ctr. District Series 2019 B, 5% 7/1/24 | 1,380,000 | 1,571,245 | |
| TOTAL ARIZONA | 19,026,936 | ||
| California - 3.5% | |||
| California Edl. Facilities Auth. Rev. Series 2018 A, 5% 10/1/42 | 1,340,000 | 1,655,622 | |
| California Gen. Oblig.: | |||
| Series 2017, 5% 11/1/29 | 2,375,000 | 3,010,850 | |
| Series 2020, 4% 11/1/45 | 4,200,000 | 4,741,510 | |
| Series 2021, 5% 9/1/29 (c) | 10,215,000 | 13,583,973 | |
| California Hsg. Fin. Agcy. Series 2021 1, 3.5% 11/20/35 | 766,360 | 912,916 | |
| California Muni. Fin. Auth. Rev. Series 2017 A: | |||
| 5% 7/1/42 | 1,000,000 | 1,211,988 | |
| 5.25% 11/1/36 | 515,000 | 611,324 | |
| California Muni. Fin. Auth. Student Hsg. (CHF-Davis I, LLC - West Village Student Hsg. Proj.) Series 2018: | |||
| 5% 5/15/34 | 2,635,000 | 3,347,692 | |
| 5% 5/15/39 | 1,175,000 | 1,480,812 | |
| California Pub. Fin. Auth. Univ. Hsg. Rev.: | |||
| (Claremont Colleges Proj.) Series 2017 A, 5% 7/1/27 (b) | 100,000 | 90,446 | |
| (NCCD - Claremont Properties LLC - Claremont Colleges Proj.) Series 2017 A, 5% 7/1/47 (b) | 100,000 | 90,828 | |
| California Statewide Cmntys. Dev. Auth. Rev. Series 2015, 5% 2/1/45 | 800,000 | 843,239 | |
| Golden State Tobacco Securitization Corp. Tobacco Settlement Rev. Series 2017 A1, 5% 6/1/28 | 1,000,000 | 1,238,028 | |
| Los Angeles Dept. Arpt. Rev. Series B, 5% 5/15/45 | 9,000,000 | 11,839,789 | |
| Los Angeles Dept. of Wtr. & Pwr. Rev. Series 2021 B, 5% 7/1/51 | 6,660,000 | 8,721,609 | |
| Middle Fork Proj. Fin. Auth. Series 2020: | |||
| 5% 4/1/24 | 2,745,000 | 3,074,788 | |
| 5% 4/1/25 | 2,885,000 | 3,346,774 | |
| 5% 4/1/26 | 2,030,000 | 2,429,494 | |
| San Diego Assoc. of Governments (Mid-Coast Corridor Transit Proj.) Series 2019 A: | |||
| 5% 11/15/25 | 2,000,000 | 2,309,916 | |
| 5% 11/15/26 | 2,000,000 | 2,385,551 | |
| San Diego County Reg'l. Arpt. Auth. Arpt. Rev. Series 2019 A, 5% 7/1/49 | 2,850,000 | 3,561,430 | |
| San Francisco City & County Arpts. Commission Int'l. Arpt. Rev. Series 2019 B, 5% 5/1/49 | 465,000 | 586,491 | |
| Washington Township Health Care District Rev.: | |||
| Series 2017 A, 5% 7/1/35 | 800,000 | 962,454 | |
| Series 2017 B: | |||
| 5% 7/1/29 | 485,000 | 593,389 | |
| 5% 7/1/30 | 970,000 | 1,180,192 | |
| TOTAL CALIFORNIA | 73,811,105 | ||
| Colorado - 2.7% | |||
| Colorado Health Facilities Auth.: | |||
| Bonds: | |||
| Series 2018 B, 5%, tender 11/20/25 (a) | 1,000,000 | 1,199,471 | |
| Series 2019 B, 5%, tender 8/1/26 (a) | 755,000 | 902,295 | |
| Series 2018 A, 4% 11/15/48 | 960,000 | 1,110,233 | |
| Series 2019 A: | |||
| 4% 11/1/39 | 905,000 | 1,085,689 | |
| 5% 11/1/22 | 1,800,000 | 1,908,235 | |
| 5% 11/1/26 | 1,495,000 | 1,835,464 | |
| 5% 11/15/39 | 1,250,000 | 1,620,652 | |
| Colorado Hsg. & Fin. Auth.: | |||
| Series 2019 F, 4.25% 11/1/49 | 390,000 | 437,117 | |
| Series 2019 H, 4.25% 11/1/49 | 220,000 | 246,805 | |
| Colorado Reg'l. Trans. District Sales Tax Rev. (Fastracks Proj.) Series 2021 B, 5% 11/1/28 | 3,775,000 | 4,916,190 | |
| Colorado State Bldg. Excellent Schools Today Ctfs. of Prtn. Series 2018 N: | |||
| 5% 3/15/37 | 2,000,000 | 2,477,315 | |
| 5% 3/15/38 | 2,000,000 | 2,472,985 | |
| Colorado Univ. Co. Hosp. Auth. Rev. Series 2012 A, 5% 11/15/42 | 6,480,000 | 6,864,442 | |
| Denver City & County Board Wtr. Rev.: | |||
| Series 2020 A: | |||
| 5% 9/15/45 | 5,415,000 | 7,090,310 | |
| 5% 9/15/46 | 8,300,000 | 10,858,202 | |
| Series 2020 B, 5% 9/15/27 | 2,290,000 | 2,913,034 | |
| Univ. of Colorado Enterprise Sys. Rev. Bonds Series 2019 C, 2%, tender 10/15/24 (a) | 6,725,000 | 7,075,848 | |
| Vauxmont Metropolitan District: | |||
| Series 2019, 5% 12/15/26 (FSA Insured) | 135,000 | 158,715 | |
| Series 2020: | |||
| 5% 12/1/22 (FSA Insured) | 165,000 | 174,944 | |
| 5% 12/1/50 (FSA Insured) | 1,500,000 | 1,879,255 | |
| TOTAL COLORADO | 57,227,201 | ||
| Connecticut - 4.0% | |||
| Bridgeport Gen. Oblig. Series 2019 A: | |||
| 5% 2/1/23 (Build America Mutual Assurance Insured) | 630,000 | 675,448 | |
| 5% 2/1/25 (Build America Mutual Assurance Insured) | 670,000 | 777,136 | |
| Connecticut Gen. Oblig.: | |||
| Series 2011 D, 5% 11/1/22 | 155,000 | 156,860 | |
| Series 2014 H, 5% 11/15/21 | 1,550,000 | 1,571,764 | |
| Series 2015 B, 5% 6/15/32 | 265,000 | 309,094 | |
| Series 2016 B: | |||
| 5% 5/15/25 | 1,000,000 | 1,178,418 | |
| 5% 5/15/26 | 545,000 | 664,112 | |
| Series 2017 A, 5% 4/15/33 | 245,000 | 300,188 | |
| Series 2018 A, 5% 4/15/38 | 1,000,000 | 1,249,544 | |
| Series 2018 F, 5% 9/15/22 | 235,000 | 247,987 | |
| Series 2019 A, 5% 4/15/26 | 655,000 | 795,983 | |
| Series 2019 B, 5% 2/15/23 | 7,000,000 | 7,530,398 | |
| Series 2020 A: | |||
| 4% 1/15/34 | 2,250,000 | 2,757,854 | |
| 5% 1/15/40 | 2,000,000 | 2,584,865 | |
| Series 2021 D: | |||
| 5% 7/15/24 (c) | 1,150,000 | 1,313,579 | |
| 5% 7/15/25 (c) | 1,905,000 | 2,256,737 | |
| 5% 7/15/26 (c) | 1,905,000 | 2,332,790 | |
| 5% 7/15/27 (c) | 2,540,000 | 3,205,571 | |
| 5% 7/15/28 (c) | 2,920,000 | 3,782,232 | |
| Series A, 5% 3/1/27 | 1,000,000 | 1,123,333 | |
| Series C, 5% 6/1/23 | 2,000,000 | 2,081,750 | |
| Connecticut Health & Edl. Facilities Auth. Rev.: | |||
| (Sacred Heart Univ., CT. Proj.) Series 2017 I-1, 5% 7/1/42 | 3,335,000 | 3,991,552 | |
| Bonds: | |||
| Series 2010 A4, 2%, tender 2/8/22 (a) | 805,000 | 813,051 | |
| Series 2014 A, 1.1%, tender 2/7/23 (a) | 6,000,000 | 6,087,353 | |
| Series 2020 B: | |||
| 5%, tender 1/1/25 (a) | 2,405,000 | 2,770,556 | |
| 5%, tender 1/1/27 (a) | 1,780,000 | 2,182,769 | |
| Series U1, 2%, tender 2/8/22 (a) | 105,000 | 106,050 | |
| Series 2019 A: | |||
| 5% 7/1/27 (b) | 555,000 | 607,551 | |
| 5% 7/1/34 (b) | 685,000 | 742,907 | |
| Series 2019 Q-1: | |||
| 5% 11/1/24 | 460,000 | 528,571 | |
| 5% 11/1/26 | 500,000 | 612,417 | |
| Series 2020 K: | |||
| 4% 7/1/45 | 2,865,000 | 3,336,352 | |
| 5% 7/1/40 | 1,050,000 | 1,348,427 | |
| Series A, 5% 7/1/26 | 1,000,000 | 1,138,897 | |
| Series K1, 5% 7/1/33 | 815,000 | 968,493 | |
| Series K3, 5% 7/1/43 | 350,000 | 406,886 | |
| Series R: | |||
| 4% 7/1/36 | 1,000,000 | 1,147,303 | |
| 5% 6/1/32 | 550,000 | 727,538 | |
| 5% 6/1/33 | 375,000 | 494,452 | |
| 5% 6/1/34 | 575,000 | 755,753 | |
| 5% 6/1/35 | 870,000 | 1,141,383 | |
| Connecticut Hsg. Fin. Auth. Series 2021 B1, 3% 11/15/49 | 1,610,000 | 1,775,332 | |
| Connecticut Spl. Tax Oblig. Trans. Infrastructure Rev.: | |||
| Series 2012 A, 5% 1/1/24 | 410,000 | 438,360 | |
| Series A, 5% 9/1/33 | 5,000,000 | 5,693,548 | |
| Stratford Gen. Oblig. Series 2019: | |||
| 5% 1/1/22 | 1,400,000 | 1,427,344 | |
| 5% 1/1/24 | 1,520,000 | 1,690,952 | |
| 5% 1/1/28 | 3,890,000 | 4,773,181 | |
| Univ. of Connecticut Gen. Oblig.: | |||
| Series 2016 A, 5% 3/15/22 | 450,000 | 463,667 | |
| Series 2019 A, 5% 11/1/25 | 495,000 | 590,130 | |
| TOTAL CONNECTICUT | 83,656,418 | ||
| Delaware - 0.1% | |||
| Delaware Gen. Oblig. Series 2020 A, 5% 1/1/30 | 2,240,000 | 3,016,844 | |
| District Of Columbia - 1.6% | |||
| District of Columbia Gen. Oblig. Series 2017 D, 5% 6/1/42 | 500,000 | 614,971 | |
| District of Columbia Rev. Series 2018: | |||
| 5% 10/1/23 | 350,000 | 383,529 | |
| 5% 10/1/25 | 495,000 | 581,087 | |
| 5% 10/1/26 | 830,000 | 1,003,323 | |
| 5% 10/1/27 | 905,000 | 1,122,860 | |
| 5% 10/1/43 | 3,080,000 | 3,783,326 | |
| District of Columbia Wtr. & Swr. Auth. Pub. Util. Rev. Bonds Series 2019 C, 1.75%, tender 10/1/24 (a) | 3,225,000 | 3,367,004 | |
| Metropolitan Washington Arpts. Auth. Dulles Toll Road Rev. (Dulles Metrorail and Cap. Impt. Projs.): | |||
| Series 2019 A: | |||
| 5% 10/1/38 | 1,500,000 | 1,875,639 | |
| 5% 10/1/44 | 8,000,000 | 9,932,865 | |
| Series 2019 B, 5% 10/1/47 | 7,500,000 | 9,450,437 | |
| Metropolitan Washington DC Arpts. Auth. Sys. Rev. Series 2019 B, 5% 10/1/25 | 1,605,000 | 1,916,913 | |
| TOTAL DISTRICT OF COLUMBIA | 34,031,954 | ||
| Florida - 4.4% | |||
| Atlantic Beach Health Care Facilities Series A, 5% 11/15/43 | 845,000 | 975,241 | |
| Broward County School Board Ctfs. of Prtn. Series 2016, 5% 7/1/26 | 1,470,000 | 1,781,126 | |
| Cap. Projs. Fin. Auth. Student Hsg. Rev. (Cap. Projs. Ln. Prog. - Florida Univs.) Series 2020 A, 5% 10/1/30 | 750,000 | 964,263 | |
| Central Florida Expressway Auth. Sr. Lien Rev.: | |||
| Orlando & Orange County Expressway Auth. Rev. Series 2017, 5% 7/1/39 | 2,000,000 | 2,454,900 | |
| Series 2021: | |||
| 4% 7/1/38 (FSA Insured) | 1,140,000 | 1,410,671 | |
| 4% 7/1/39 (FSA Insured) | 995,000 | 1,227,977 | |
| 5% 7/1/32 (FSA Insured) | 3,000,000 | 4,119,999 | |
| 5% 7/1/33 (FSA Insured) | 2,660,000 | 3,622,068 | |
| Escambia County Health Facilities Auth. Health Facilities Rev. Series 2020 A, 4% 8/15/45 | 820,000 | 958,779 | |
| Florida Higher Edl. Facilities Fing. Auth.: | |||
| (St. Leo Univ. Proj.) Series 2019: | |||
| 5% 3/1/22 | 350,000 | 358,346 | |
| 5% 3/1/23 | 400,000 | 425,853 | |
| 5% 3/1/24 | 250,000 | 273,596 | |
| 5% 3/1/25 | 670,000 | 753,953 | |
| Series 2019: | |||
| 5% 10/1/22 | 225,000 | 236,679 | |
| 5% 10/1/23 | 250,000 | 273,582 | |
| Florida Hsg. Fin. Corp. Rev. Series 2019 1, 4% 7/1/50 | 9,130,000 | 10,160,417 | |
| Florida Mid-Bay Bridge Auth. Rev. Series 2015 A: | |||
| 5% 10/1/29 | 2,475,000 | 2,868,354 | |
| 5% 10/1/35 | 1,000,000 | 1,147,400 | |
| Hillsborough County Aviation Auth. Rev. Series 2018 F: | |||
| 5% 10/1/37 | 1,510,000 | 1,924,865 | |
| 5% 10/1/43 | 2,000,000 | 2,527,724 | |
| Hillsborough County School Board Ctfs. of Prtn. Series 2020 A, 5% 7/1/27 | 5,000,000 | 6,237,166 | |
| Lee County School Board Ctfs. Series 2019 A: | |||
| 5% 8/1/27 | 4,005,000 | 5,001,899 | |
| 5% 8/1/28 | 2,020,000 | 2,582,879 | |
| Lee Memorial Health Sys. Hosp. Rev. Series 2019 A1: | |||
| 5% 4/1/26 | 1,000,000 | 1,202,402 | |
| 5% 4/1/44 | 3,235,000 | 4,036,337 | |
| Manatee County School District Series 2017, 5% 10/1/28 (FSA Insured) | 2,500,000 | 3,112,644 | |
| Miami-Dade County Aviation Rev. Series 2020 A, 4% 10/1/37 | 2,000,000 | 2,420,234 | |
| Miami-Dade County School Board Ctfs. of Prtn. Series 2015 B, 5% 5/1/28 | 1,715,000 | 1,993,017 | |
| Miami-Dade County School District Series 2015, 5% 3/15/26 | 1,545,000 | 1,808,381 | |
| Miami-Dade County Wtr. & Swr. Rev. Series 2019 B, 4% 10/1/49 | 4,000,000 | 4,706,713 | |
| Orange County School Board Ctfs. of Prtn. Series 2015 D, 5% 8/1/30 (Pre-Refunded to 8/1/25 @ 100) | 875,000 | 1,037,786 | |
| Pasco County School Board Ctfs. of Prtn. Series 2018 A, 5% 8/1/35 (Build America Mutual Assurance Insured) | 2,000,000 | 2,511,578 | |
| South Miami Health Facilities Auth. Hosp. Rev. (Baptist Med. Ctr., FL. Proj.) Series 2017, 5% 8/15/28 | 1,550,000 | 1,944,370 | |
| St. Johns County School Board (School Board of St. Johns County, Florida Master Lease Prog.) Series 2019 A: | |||
| 5% 7/1/24 | 800,000 | 908,611 | |
| 5% 7/1/25 | 1,455,000 | 1,714,425 | |
| Tallahassee Health Facilities Rev.: | |||
| (Tallahassee Memorial Healthcare, Inc. Proj.) Series 2016 A, 5% 12/1/55 | 1,020,000 | 1,161,383 | |
| Series 2015 A, 5% 12/1/40 | 1,680,000 | 1,907,328 | |
| Tampa Hosp. Rev. (H. Lee Moffitt Cancer Ctr. Proj.): | |||
| Series 2016 B, 5% 7/1/37 | 960,000 | 1,130,820 | |
| Series 2020 B: | |||
| 4% 7/1/45 | 3,000,000 | 3,517,633 | |
| 5% 7/1/40 | 700,000 | 898,281 | |
| Tampa Tax Allocation (H. Lee Moffitt Cancer Ctr. Proj.) Series 2020 A: | |||
| 0% 9/1/38 | 1,000,000 | 606,311 | |
| 0% 9/1/39 | 850,000 | 491,622 | |
| 0% 9/1/40 | 1,000,000 | 551,403 | |
| 0% 9/1/41 | 1,000,000 | 526,321 | |
| 0% 9/1/42 | 1,000,000 | 501,923 | |
| 0% 9/1/45 | 1,850,000 | 813,049 | |
| Volusia County Edl. Facilities Auth. Rev. (Embry-Riddle Aeronautical Univ., Inc. Proj.) Series 2020 A: | |||
| 5% 10/15/44 | 245,000 | 305,844 | |
| 5% 10/15/49 | 455,000 | 564,956 | |
| TOTAL FLORIDA | 92,661,109 | ||
| Georgia - 2.4% | |||
| Brookhaven Dev. Auth. Rev. Series 2019 A, 5% 7/1/36 | 1,000,000 | 1,296,899 | |
| Burke County Indl. Dev. Auth. Poll. Cont. Rev. Bonds (Georgia Pwr. Co. Plant Vogtle Proj.): | |||
| Series 1994: | |||
| 2.15%, tender 6/13/24 (a) | 6,360,000 | 6,676,688 | |
| 2.25%, tender 5/25/23 (a) | 1,840,000 | 1,904,762 | |
| Series 2013 1st, 2.925%, tender 3/12/24 (a) | 2,320,000 | 2,471,290 | |
| Coweta County Dev. Auth. Rev. (Piedmont Healthcare, Inc. Proj.) Series 2019 A, 5% 7/1/44 | 5,000,000 | 6,357,567 | |
| Fayette County Hosp. Auth. Rev. Bonds (Piedmont Healthcare, Inc. Proj.) Series 2019 A, 5%, tender 7/1/24 (a) | 800,000 | 889,154 | |
| Fulton County Dev. Auth. Rev.: | |||
| Series 2019 C, 5% 7/1/28 | 1,350,000 | 1,745,891 | |
| Series 2019, 4% 6/15/49 | 190,000 | 222,589 | |
| Georgia Muni. Elec. Auth. Pwr. Rev.: | |||
| Series 2019 A: | |||
| 4% 1/1/49 | 1,855,000 | 2,121,080 | |
| 5% 1/1/26 | 1,225,000 | 1,459,637 | |
| 5% 1/1/30 | 410,000 | 525,529 | |
| 5% 1/1/39 | 1,215,000 | 1,514,665 | |
| 5% 1/1/44 | 1,590,000 | 1,964,219 | |
| Series C, 5% 1/1/22 | 100,000 | 101,970 | |
| Series HH, 5% 1/1/22 | 1,825,000 | 1,860,952 | |
| Hosp. Auth. of Savannah Auth. Rev. Series 2019 A: | |||
| 4% 7/1/36 | 1,480,000 | 1,744,747 | |
| 4% 7/1/43 | 1,545,000 | 1,794,487 | |
| Main Street Natural Gas, Inc. Bonds: | |||
| Series 2018 A, 4%, tender 9/1/23 (a) | 770,000 | 825,223 | |
| Series 2019 B, 4%, tender 12/2/24 (a) | 2,640,000 | 2,936,912 | |
| Monroe County Dev. Auth. Poll. Cont. Rev. (Georgia Pwr. Co. Plant Scherer Proj.) Series 1995, 2.25% 7/1/25 | 1,110,000 | 1,144,873 | |
| Private Colleges & Univs. Auth. Rev.: | |||
| (The Savannah College of Art and Design Projs.) Series 2014, 5% 4/1/44 | 2,000,000 | 2,189,754 | |
| Series 2020 B: | |||
| 4% 9/1/38 | 3,000,000 | 3,681,956 | |
| 5% 9/1/25 | 1,355,000 | 1,611,812 | |
| 5% 9/1/31 | 1,385,000 | 1,868,223 | |
| Series A: | |||
| 5% 6/1/22 | 420,000 | 436,112 | |
| 5% 6/1/23 | 420,000 | 455,388 | |
| 5% 6/1/24 | 695,000 | 778,209 | |
| TOTAL GEORGIA | 50,580,588 | ||
| Hawaii - 0.8% | |||
| Hawaii Gen. Oblig.: | |||
| Series 2020 C, 4% 7/1/40 | 930,000 | 1,130,195 | |
| Series FG, 5% 10/1/27 | 1,000,000 | 1,232,718 | |
| Honolulu City & County Gen. Oblig.: | |||
| (Honolulu Rail Transit Proj.) Series 2020 B, 5% 3/1/29 | 7,055,000 | 9,248,367 | |
| Series 2018 A, 5% 9/1/41 | 2,000,000 | 2,513,854 | |
| Series 2019 A, 5% 9/1/24 | 765,000 | 877,963 | |
| Honolulu City and County Wastewtr. Sys. Series 2015 A, 5% 7/1/40 (Pre-Refunded to 7/1/25 @ 100) | 885,000 | 1,048,508 | |
| TOTAL HAWAII | 16,051,605 | ||
| Idaho - 0.4% | |||
| Idaho Hsg. & Fin. Assoc. Single Family Mtg.: | |||
| Series 2019 A, 4% 1/1/50 | 110,000 | 122,653 | |
| Series 2021 A: | |||
| 5% 7/15/29 | 3,000,000 | 3,944,125 | |
| 5% 7/15/30 | 1,000,000 | 1,338,941 | |
| 5% 7/15/31 | 640,000 | 871,844 | |
| 5% 7/15/32 | 1,250,000 | 1,694,257 | |
| TOTAL IDAHO | 7,971,820 | ||
| Illinois - 12.5% | |||
| Champaign County Cmnty. Unit: | |||
| Series 2019: | |||
| 4% 6/1/26 | 100,000 | 115,850 | |
| 4% 6/1/27 | 830,000 | 982,592 | |
| 4% 6/1/28 | 625,000 | 746,915 | |
| 4% 6/1/29 | 1,550,000 | 1,878,880 | |
| 4% 6/1/30 | 1,000,000 | 1,236,897 | |
| 4% 6/1/31 | 1,250,000 | 1,532,579 | |
| 4% 6/1/34 | 1,000,000 | 1,195,314 | |
| 4% 6/1/35 | 1,290,000 | 1,538,282 | |
| 4% 6/1/36 | 1,575,000 | 1,873,082 | |
| Series 2020 A: | |||
| 5% 1/1/29 | 675,000 | 858,114 | |
| 5% 1/1/30 | 625,000 | 791,873 | |
| 5% 1/1/31 | 850,000 | 1,072,294 | |
| 5% 1/1/33 | 1,650,000 | 2,069,348 | |
| Chicago Board of Ed.: | |||
| Series 1998 B1, 0% 12/1/21 (Nat'l. Pub. Fin. Guarantee Corp. Insured) | 60,000 | 59,911 | |
| Series 1999, 0% 12/1/22 (Berkshire Hathaway Assurance Corp. Insured) (FGIC Insured) | 1,465,000 | 1,459,328 | |
| Series 2011 A: | |||
| 5% 12/1/41 | 60,000 | 60,847 | |
| 5.5% 12/1/39 | 170,000 | 172,705 | |
| Series 2012 A, 5% 12/1/42 | 55,000 | 57,677 | |
| Series 2015 C: | |||
| 5.25% 12/1/35 | 2,000,000 | 2,259,734 | |
| 5.25% 12/1/39 | 45,000 | 50,612 | |
| Series 2016 A, 7% 12/1/44 | 3,200,000 | 3,947,697 | |
| Series 2017 C, 5% 12/1/25 | 290,000 | 342,261 | |
| Series 2017 D, 5% 12/1/31 | 865,000 | 1,065,669 | |
| Series 2017 H, 5% 12/1/36 | 650,000 | 792,911 | |
| Series 2018 A, 5% 12/1/27 | 185,000 | 230,374 | |
| Series 2018 C: | |||
| 5% 12/1/24 | 100,000 | 114,358 | |
| 5% 12/1/25 | 505,000 | 596,005 | |
| 5% 12/1/27 | 505,000 | 628,860 | |
| 5% 12/1/46 | 1,590,000 | 1,958,652 | |
| Series 2019 A: | |||
| 5% 12/1/21 | 185,000 | 187,803 | |
| 5% 12/1/23 | 2,150,000 | 2,371,662 | |
| 5% 12/1/28 | 240,000 | 305,774 | |
| 5% 12/1/30 | 575,000 | 743,075 | |
| 5% 12/1/31 | 600,000 | 772,830 | |
| Series 2021 A: | |||
| 5% 12/1/35 | 3,500,000 | 4,541,663 | |
| 5% 12/1/36 | 1,250,000 | 1,619,459 | |
| 5% 12/1/38 | 1,425,000 | 1,837,381 | |
| Series 2021 B, 5% 12/1/36 | 1,200,000 | 1,554,680 | |
| Chicago Gen. Oblig. Series 2020 A: | |||
| 5% 1/1/26 | 2,090,000 | 2,472,115 | |
| 5% 1/1/27 | 1,520,000 | 1,849,489 | |
| 5% 1/1/30 | 1,745,000 | 2,270,217 | |
| 5% 1/1/32 | 1,300,000 | 1,670,387 | |
| Chicago Midway Arpt. Rev.: | |||
| Series 2013 B, 5% 1/1/25 | 620,000 | 661,332 | |
| Series 2016 B, 5% 1/1/46 | 6,905,000 | 8,143,406 | |
| Chicago O'Hare Int'l. Arpt. Rev.: | |||
| Series 2013 D, 5% 1/1/25 | 500,000 | 533,848 | |
| Series 2015 B, 5% 1/1/32 | 1,000,000 | 1,152,372 | |
| Series 2016 D, 5% 1/1/52 | 1,205,000 | 1,454,274 | |
| Series 2018 B: | |||
| 5% 1/1/36 | 2,250,000 | 2,849,972 | |
| 5% 1/1/37 | 3,250,000 | 4,106,726 | |
| 5% 1/1/48 | 10,000,000 | 12,422,704 | |
| 5% 1/1/53 | 385,000 | 476,544 | |
| Cook County Cmnty. Consolidated School District No. 59 Series 2020: | |||
| 4% 3/1/24 | 900,000 | 987,730 | |
| 5% 3/1/25 | 850,000 | 990,838 | |
| 5% 3/1/26 | 1,235,000 | 1,485,459 | |
| 5% 3/1/27 | 1,245,000 | 1,546,539 | |
| 5% 3/1/28 | 1,350,000 | 1,717,128 | |
| Cook County Gen. Oblig. Series 2021 A: | |||
| 5% 11/15/31 | 3,650,000 | 4,890,348 | |
| 5% 11/15/32 | 2,400,000 | 3,207,736 | |
| 5% 11/15/33 | 2,350,000 | 3,130,315 | |
| Illinois Fin. Auth. Academic Facilities (Provident Group UIUC Properties LLC Univ. of Illinois at Urbana-Champaign Proj.) Series 2019 A: | |||
| 5% 10/1/27 | 240,000 | 300,712 | |
| 5% 10/1/28 | 200,000 | 256,715 | |
| 5% 10/1/44 | 1,000,000 | 1,247,250 | |
| 5% 10/1/49 | 1,250,000 | 1,550,749 | |
| 5% 10/1/51 | 1,000,000 | 1,238,727 | |
| Illinois Fin. Auth. Rev.: | |||
| (Northwestern Memorial Hosp.,IL. Proj.) Series 2017 A, 5% 7/15/25 | 300,000 | 354,613 | |
| (OSF Healthcare Sys.) Series 2018 A: | |||
| 4.125% 5/15/47 | 5,150,000 | 5,975,470 | |
| 5% 5/15/43 | 50,000 | 61,911 | |
| (Presence Health Proj.) Series 2016 C, 5% 2/15/36 | 1,000,000 | 1,219,312 | |
| Bonds Series E, 2.25%, tender 4/29/22 (a) | 330,000 | 335,230 | |
| Series 2012 A, 5% 5/15/22 | 1,000,000 | 1,037,516 | |
| Series 2013, 4.25% 5/15/43 (Pre-Refunded to 5/15/22 @ 100) | 405,000 | 417,506 | |
| Series 2015 A: | |||
| 4.125% 11/15/37 | 680,000 | 764,225 | |
| 5% 11/15/45 | 10,000,000 | 11,713,940 | |
| Series 2016 A: | |||
| 5% 2/15/24 | 850,000 | 953,889 | |
| 5% 8/15/25 | 1,175,000 | 1,395,527 | |
| Series 2016 C, 5% 2/15/31 | 2,500,000 | 3,074,235 | |
| Series 2016: | |||
| 4% 12/1/35 | 360,000 | 412,766 | |
| 5% 12/1/40 | 2,150,000 | 2,566,679 | |
| 5% 12/1/46 | 12,400,000 | 14,700,442 | |
| Series 2017 A, 5% 1/1/35 | 3,000,000 | 3,599,543 | |
| Series 2018 A: | |||
| 4.25% 1/1/44 | 55,000 | 63,712 | |
| 5% 1/1/38 | 215,000 | 263,143 | |
| 5% 10/1/41 | 3,000,000 | 3,731,012 | |
| 5% 1/1/44 | 320,000 | 387,839 | |
| Series 2019, 4% 9/1/35 | 450,000 | 525,218 | |
| Illinois Gen. Oblig.: | |||
| Series 2006, 5.5% 1/1/28 | 5,000,000 | 6,392,229 | |
| Series 2012: | |||
| 5% 8/1/21 | 10,000 | 10,000 | |
| 5% 8/1/22 | 60,000 | 62,852 | |
| 5% 8/1/24 | 1,000,000 | 1,047,866 | |
| Series 2013, 5% 7/1/22 | 40,000 | 41,746 | |
| Series 2014: | |||
| 5% 2/1/22 | 215,000 | 220,149 | |
| 5% 2/1/23 | 180,000 | 192,689 | |
| 5% 2/1/26 | 550,000 | 610,407 | |
| Series 2016: | |||
| 5% 2/1/26 | 5,270,000 | 6,289,741 | |
| 5% 2/1/27 | 615,000 | 752,070 | |
| Series 2017 D, 5% 11/1/25 | 1,185,000 | 1,403,725 | |
| Series 2018 A: | |||
| 5% 10/1/24 | 500,000 | 571,154 | |
| 5% 10/1/28 | 1,000,000 | 1,267,381 | |
| 5% 10/1/29 | 1,600,000 | 2,014,749 | |
| Series 2018 B, 5% 10/1/26 | 1,000,000 | 1,213,372 | |
| Series 2019 B: | |||
| 5% 9/1/21 | 500,000 | 501,903 | |
| 5% 9/1/22 | 490,000 | 515,183 | |
| 5% 9/1/23 | 500,000 | 548,199 | |
| 5% 9/1/24 | 500,000 | 569,457 | |
| Series 2021 A: | |||
| 5% 3/1/32 | 195,000 | 257,092 | |
| 5% 3/1/33 | 1,000,000 | 1,313,188 | |
| 5% 3/1/34 | 1,000,000 | 1,308,039 | |
| 5% 3/1/46 | 2,000,000 | 2,539,732 | |
| Illinois Toll Hwy. Auth. Toll Hwy. Rev.: | |||
| Series 2014 A, 5% 12/1/22 | 1,300,000 | 1,385,179 | |
| Series 2015 A, 5% 1/1/37 | 470,000 | 549,805 | |
| Series 2019 A, 5% 1/1/44 | 490,000 | 618,432 | |
| Series A: | |||
| 5% 1/1/38 | 1,010,000 | 1,338,656 | |
| 5% 1/1/41 | 220,000 | 289,552 | |
| 5% 1/1/45 | 13,450,000 | 17,366,429 | |
| Kane & DeKalb Counties Cmnty. Unit School District #302 Series 2018, 5% 2/1/26 | 2,010,000 | 2,381,653 | |
| Kane County School District No. 131 Series 2020 A: | |||
| 4% 12/1/30 (FSA Insured) | 460,000 | 549,691 | |
| 4% 12/1/31 (FSA Insured) | 615,000 | 732,367 | |
| 4% 12/1/33 (FSA Insured) | 255,000 | 301,999 | |
| 4% 12/1/35 (FSA Insured) | 275,000 | 324,391 | |
| 4% 12/1/36 (FSA Insured) | 250,000 | 294,448 | |
| 4% 12/1/38 (FSA Insured) | 580,000 | 680,129 | |
| Metropolitan Pier & Exposition: | |||
| (McCormick Place Expansion Proj.) Series 2010 B1: | |||
| 0% 6/15/43 (FSA Insured) | 3,200,000 | 1,948,913 | |
| 0% 6/15/46 (FSA Insured) | 8,000,000 | 4,443,366 | |
| 0% 6/15/47 (FSA Insured) | 2,525,000 | 1,362,457 | |
| Series 2017 A, 5% 6/15/57 | 6,625,000 | 7,948,534 | |
| Series 2020 A: | |||
| 4% 6/15/50 | 8,955,000 | 10,313,437 | |
| 5% 6/15/50 | 7,310,000 | 9,131,873 | |
| Series 2020 B, 5% 6/15/42 | 2,695,000 | 3,459,311 | |
| Series 2022 A: | |||
| 0% 12/15/35 (c) | 780,000 | 556,107 | |
| 0% 12/15/36 (c) | 1,035,000 | 713,998 | |
| 0% 6/15/40 (c) | 1,055,000 | 644,865 | |
| 0% 6/15/41 (c) | 1,450,000 | 855,518 | |
| Northern Illinois Univ. Revs. Series 2020 B: | |||
| 4% 4/1/36 (Build America Mutual Assurance Insured) | 1,300,000 | 1,540,409 | |
| 4% 4/1/38 (Build America Mutual Assurance Insured) | 1,300,000 | 1,531,482 | |
| 4% 4/1/40 (Build America Mutual Assurance Insured) | 870,000 | 1,021,350 | |
| Railsplitter Tobacco Settlement Auth. Rev. Series 2017, 5% 6/1/27 | 1,200,000 | 1,449,722 | |
| Univ. of Illinois Board of Trustees Ctfs. of Prtn. Series 2014 C, 5% 3/15/23 | 215,000 | 231,952 | |
| Univ. of Illinois Rev. Series 2018 A, 5% 4/1/29 | 100,000 | 127,279 | |
| TOTAL ILLINOIS | 263,527,535 | ||
| Indiana - 0.6% | |||
| Indiana Fin. Auth. Health Sys. Rev. Bonds Series 2019 B, 2.25%, tender 7/1/25 (a) | 580,000 | 618,018 | |
| Indiana Fin. Auth. Hosp. Rev. Bonds Series 2015 B, 1.65%, tender 1/1/22 (a) | 965,000 | 971,106 | |
| Indiana Fin. Auth. Rev. (DePauw Univ. Proj.) Series 2019, 5% 7/1/22 | 1,510,000 | 1,572,476 | |
| Indiana Health Facility Fing. Auth. Rev. Bonds Series 2001 A2, 2%, tender 2/1/23 (a) | 340,000 | 348,741 | |
| Indiana Hsg. & Cmnty. Dev. Auth.: | |||
| (Glasswater Creek of Whitestown Proj.) Series 2020, 5.375% 10/1/40 (b) | 695,000 | 735,137 | |
| Series 2019 B, 3.5% 1/1/49 | 670,000 | 734,878 | |
| Series 2021 B, 5% 1/1/23 | 500,000 | 534,069 | |
| Series A: | |||
| 3.75% 1/1/49 | 3,170,000 | 3,521,053 | |
| 5% 1/1/28 | 325,000 | 408,636 | |
| 5% 7/1/28 | 325,000 | 413,507 | |
| 5% 1/1/29 | 325,000 | 416,836 | |
| 5% 7/1/29 | 270,000 | 349,898 | |
| Saint Joseph County Econ. Dev. Auth. Rev. (St. Mary's College Proj.): | |||
| Series 2019, 5% 4/1/43 | 1,555,000 | 1,903,224 | |
| Series 2020, 5% 4/1/32 | 765,000 | 964,028 | |
| TOTAL INDIANA | 13,491,607 | ||
| Iowa - 0.6% | |||
| Iowa Fin. Auth. Rev.: | |||
| Series 2018 B, 5% 2/15/48 | 1,000,000 | 1,231,651 | |
| Series 2019 A2, 2.875% 5/15/49 | 505,000 | 509,942 | |
| Series A, 5% 5/15/48 | 120,000 | 139,565 | |
| Iowa Higher Ed. Ln. Auth. Rev. (Grinnell College Proj.) Series 2017, 5% 12/1/46 | 5,925,000 | 7,205,390 | |
| Tobacco Settlement Auth. Tobacco Settlement Rev.: | |||
| Series 2021 A2, 4% 6/1/49 | 1,200,000 | 1,410,802 | |
| Series 2021 B1, 4% 6/1/49 | 1,550,000 | 1,829,811 | |
| TOTAL IOWA | 12,327,161 | ||
| Kentucky - 3.7% | |||
| Ashland Med. Ctr. Rev. Series 2019: | |||
| 4% 2/1/36 | 760,000 | 881,741 | |
| 4% 2/1/37 | 575,000 | 665,271 | |
| 5% 2/1/24 | 1,180,000 | 1,311,462 | |
| 5% 2/1/25 | 945,000 | 1,088,982 | |
| Boyle County Edl. Facilities Rev. Series 2017, 5% 6/1/37 | 320,000 | 386,585 | |
| Carroll County Poll. Ctlr Rev. Bonds (Kentucky Utils. Co. Proj.) Series 2016 A, 1.55%, tender 9/1/26 (a) | 6,750,000 | 6,910,942 | |
| Kenton County Arpt. Board Arpt. Rev. Series 2019: | |||
| 5% 1/1/38 | 730,000 | 925,374 | |
| 5% 1/1/39 | 690,000 | 872,905 | |
| 5% 1/1/49 | 2,500,000 | 3,126,536 | |
| Kentucky Econ. Dev. Fin. Auth.: | |||
| Bonds Series 2009 B, 2.7%, tender 11/10/21 (a) | 355,000 | 357,289 | |
| Series 2019 A2, 5% 8/1/49 | 3,400,000 | 4,239,828 | |
| Kentucky State Property & Buildings Commission Rev.: | |||
| (Proj. No. 112) Series 2016 B, 5% 11/1/27 | 1,095,000 | 1,342,384 | |
| (Proj. No. 119) Series 2018: | |||
| 5% 5/1/28 | 1,000,000 | 1,268,162 | |
| 5% 5/1/38 | 4,000,000 | 4,919,860 | |
| Series 2017: | |||
| 5% 4/1/25 | 3,425,000 | 3,992,201 | |
| 5% 4/1/26 | 3,470,000 | 4,177,659 | |
| Series A: | |||
| 4% 11/1/34 | 1,250,000 | 1,460,630 | |
| 4% 11/1/35 | 400,000 | 466,656 | |
| 4% 11/1/36 | 1,000,000 | 1,165,391 | |
| 4% 11/1/37 | 1,250,000 | 1,453,238 | |
| 5% 11/1/22 | 1,400,000 | 1,485,272 | |
| 5% 8/1/27 | 400,000 | 470,121 | |
| 5% 11/1/29 | 1,105,000 | 1,417,395 | |
| Series B: | |||
| 5% 8/1/21 | 110,000 | 110,000 | |
| 5% 8/1/23 | 1,330,000 | 1,456,091 | |
| 5% 8/1/25 | 2,965,000 | 3,494,700 | |
| 5% 8/1/26 | 1,910,000 | 2,325,328 | |
| 5% 5/1/27 | 2,000,000 | 2,479,691 | |
| Series C, 5% 11/1/21 | 1,055,000 | 1,067,701 | |
| Kentucky, Inc. Pub. Energy: | |||
| Bonds: | |||
| Series A, 4%, tender 6/1/26 (a) | 11,515,000 | 13,313,306 | |
| Series C1, 4%, tender 6/1/25 (a) | 2,000,000 | 2,248,915 | |
| Series A: | |||
| 4% 6/1/23 | 585,000 | 624,867 | |
| 4% 12/1/24 | 500,000 | 559,767 | |
| 4% 6/1/25 | 585,000 | 663,906 | |
| Louisville & Jefferson County: | |||
| Bonds: | |||
| Series 2020 B, 5%, tender 10/1/23 (a) | 1,530,000 | 1,687,815 | |
| Series 2020 C, 5%, tender 10/1/26 (a) | 525,000 | 643,277 | |
| Series 2020 D, 5%, tender 10/1/29 (a) | 630,000 | 824,407 | |
| Series 2016 A, 5% 10/1/31 | 95,000 | 114,450 | |
| Series 2020 A, 4% 10/1/39 | 1,500,000 | 1,756,292 | |
| TOTAL KENTUCKY | 77,756,397 | ||
| Louisiana - 0.8% | |||
| Calcasieu Parish Memorial Hosp. (Lake Charles Memorial Hosp. Proj.) Series 2019: | |||
| 4% 12/1/22 | 815,000 | 842,084 | |
| 4% 12/1/23 | 1,135,000 | 1,213,202 | |
| 4% 12/1/24 | 1,145,000 | 1,253,921 | |
| Louisiana Pub. Facilities Auth. Hosp. Rev. (Franciscan Missionaries of Our Lady Health Sys. Proj.) Series 2017 A, 5% 7/1/47 | 2,020,000 | 2,435,041 | |
| Louisiana Pub. Facilities Auth. Rev.: | |||
| (Ochsner Clinic Foundation Proj.) Series 2017, 5% 5/15/27 | 885,000 | 1,100,690 | |
| Series 2018 E: | |||
| 5% 7/1/32 | 1,470,000 | 1,862,789 | |
| 5% 7/1/33 | 1,195,000 | 1,510,092 | |
| 5% 7/1/34 | 1,385,000 | 1,745,431 | |
| St. John Baptist Parish Rev.: | |||
| (Marathon Oil Corp.) Series 2017, 2.2% 6/1/37 (a) | 1,495,000 | 1,571,204 | |
| Bonds (Marathon Oil Corp.) Series 2017: | |||
| 2%, tender 4/1/23 (a) | 1,410,000 | 1,443,756 | |
| 2.1%, tender 7/1/24 (a) | 680,000 | 705,584 | |
| TOTAL LOUISIANA | 15,683,794 | ||
| Maine - 0.2% | |||
| Maine Health & Higher Edl. Facilities Auth. Rev.: | |||
| (Eastern Maine Healthcare Systems Proj.) Series 2013, 5% 7/1/43 (Pre-Refunded to 7/1/23 @ 100) | 100,000 | 109,151 | |
| Series 2013: | |||
| 5% 7/1/22 (Escrowed to Maturity) | 400,000 | 417,619 | |
| 5% 7/1/33 (Pre-Refunded to 7/1/23 @ 100) | 395,000 | 431,147 | |
| Series 2017 B, 5% 7/1/33 | 280,000 | 340,861 | |
| Maine Hsg. Auth. Mtg. Series C, 3.5% 11/15/46 | 3,035,000 | 3,198,805 | |
| Maine Tpk. Auth. Tpk. Rev. Series 2018, 5% 7/1/47 | 500,000 | 614,127 | |
| TOTAL MAINE | 5,111,710 | ||
| Maryland - 1.9% | |||
| Anne Arundel County Gen. Oblig. Series 2021: | |||
| 5% 10/1/26 | 5,425,000 | 6,699,995 | |
| 5% 4/1/28 | 6,575,000 | 8,474,085 | |
| Maryland Cmnty. Dev. Admin Dept. Hsg. & Cmnty. Dev.: | |||
| Series 2019 B, 4% 9/1/49 | 585,000 | 648,347 | |
| Series 2019 C: | |||
| 5% 9/1/27 | 725,000 | 908,904 | |
| 5% 9/1/28 | 115,000 | 147,511 | |
| Maryland Econ. Dev. Auth. Rev. (Ports America Chesapeake LLC. Proj.) Series 2017 A, 5% 6/1/24 | 1,000,000 | 1,126,939 | |
| Maryland Gen. Oblig. First Series 2016, 5% 6/1/26 | 1,785,000 | 2,027,077 | |
| Maryland Health & Higher Edl. Series 2021 A, 5% 6/1/31 | 350,000 | 467,534 | |
| Maryland Health & Higher Edl. Facilities Auth. Rev. Series 2020 B: | |||
| 5% 4/15/24 | 705,000 | 795,547 | |
| 5% 4/15/25 | 920,000 | 1,077,510 | |
| Maryland Trans. Auth. Trans. Facility Projs. Rev. Series 2020: | |||
| 4% 7/1/45 | 1,645,000 | 1,979,658 | |
| 4% 7/1/50 | 960,000 | 1,149,130 | |
| 5% 7/1/40 | 4,930,000 | 6,484,537 | |
| Washington Metropolitan Area Transit Auth. Series 2021 A: | |||
| 5% 7/15/26 | 2,580,000 | 3,163,633 | |
| 5% 7/15/27 | 3,700,000 | 4,672,009 | |
| TOTAL MARYLAND | 39,822,416 | ||
| Massachusetts - 4.6% | |||
| Massachusetts Commonwealth Trans. Fund Rev.: | |||
| (Rail Enhancement Prog.) Series 2021 B, 5% 6/1/37 | 4,455,000 | 5,644,121 | |
| Series 2021 A, 5% 6/1/51 | 7,990,000 | 10,273,842 | |
| Massachusetts Dept. of Trans. Metropolitan Hwy. Sys. Rev. Bonds Series 2019 A, 5%, tender 1/1/23 (a) | 5,195,000 | 5,549,745 | |
| Massachusetts Dev. Fin. Agcy. Rev.: | |||
| Caregroup, Inc. Series 2015 H-1, 5% 7/1/25 | 1,375,000 | 1,621,336 | |
| Series 2017 A, 5% 1/1/36 | 2,415,000 | 2,942,155 | |
| Series 2017, 5% 7/1/47 | 945,000 | 1,101,537 | |
| Series 2018, 5% 1/1/43 | 1,335,000 | 1,605,040 | |
| Series 2019 K: | |||
| 5% 7/1/25 | 825,000 | 972,801 | |
| 5% 7/1/26 | 1,085,000 | 1,322,282 | |
| 5% 7/1/27 | 1,305,000 | 1,635,630 | |
| Series 2019: | |||
| 5% 7/1/25 | 655,000 | 768,996 | |
| 5% 7/1/26 | 370,000 | 448,510 | |
| 5% 7/1/28 | 550,000 | 698,937 | |
| 5% 7/1/29 | 500,000 | 648,838 | |
| 5% 9/1/59 | 3,730,000 | 4,650,092 | |
| Series 2020 A: | |||
| 4% 7/1/45 | 3,660,000 | 4,281,697 | |
| 5% 10/15/25 | 350,000 | 419,879 | |
| 5% 10/15/27 | 7,500,000 | 9,599,756 | |
| 5% 10/15/28 | 7,340,000 | 9,663,048 | |
| Series 2021 V, 5% 7/1/55 | 5,320,000 | 8,766,018 | |
| Series A, 4% 6/1/49 | 2,365,000 | 2,699,741 | |
| Series J2, 5% 7/1/53 | 3,775,000 | 4,629,146 | |
| Series M: | |||
| 4% 10/1/50 | 3,725,000 | 4,377,411 | |
| 5% 10/1/45 | 2,805,000 | 3,571,551 | |
| Massachusetts Gen. Oblig.: | |||
| Series 2019 C, 5% 5/1/49 | 1,630,000 | 2,076,431 | |
| Series E, 5% 11/1/50 | 3,395,000 | 4,418,086 | |
| Massachusetts School Bldg. Auth. Dedicated Sales Tax Rev. Series A, 5% 2/15/49 | 2,500,000 | 2,986,936 | |
| TOTAL MASSACHUSETTS | 97,373,562 | ||
| Michigan - 2.3% | |||
| Detroit Downtown Dev. Auth. Tax Series A, 5% 7/1/37 (FSA Insured) | 150,000 | 168,269 | |
| Detroit Gen. Oblig. Series 2021 A, 5% 4/1/50 | 800,000 | 987,938 | |
| Flint Hosp. Bldg. Auth. Rev. Series 2020: | |||
| 4% 7/1/41 | 1,060,000 | 1,195,113 | |
| 5% 7/1/25 | 465,000 | 533,449 | |
| 5% 7/1/26 | 425,000 | 500,730 | |
| 5% 7/1/27 | 660,000 | 796,118 | |
| 5% 7/1/28 | 925,000 | 1,138,599 | |
| Grand Rapids Pub. Schools Series 2019, 5% 11/1/26 (FSA Insured) | 920,000 | 1,134,337 | |
| Lake Orion Cmnty. School District Series 2019, 5% 5/1/24 | 500,000 | 565,225 | |
| Lansing Cmnty. College Series 2019, 5% 5/1/44 | 5,070,000 | 6,330,340 | |
| Michigan Fin. Auth. Rev.: | |||
| (Detroit Wtr. and Sewage Dept. Wtr. Supply Sys. Rev. Rfdg. Local Proj.) Series 2014 C3, 5% 7/1/22 (FSA Insured) | 630,000 | 657,903 | |
| (Henry Ford Health Sys. Proj.) Series 2016, 5% 11/15/25 | 4,220,000 | 5,047,412 | |
| (Trinity Health Proj.) Series 2017, 5% 12/1/37 | 1,000,000 | 1,249,347 | |
| Bonds: | |||
| Series 2019 B, 3.5%, tender 11/15/22 (a) | 620,000 | 643,747 | |
| Series 2019 MI2, 5%, tender 2/1/25 (a) | 740,000 | 858,609 | |
| Series 2015 A: | |||
| 5% 8/1/26 | 1,675,000 | 1,910,707 | |
| 5% 8/1/27 | 2,680,000 | 3,055,403 | |
| Series 2015, 5% 11/15/28 | 1,405,000 | 1,638,314 | |
| Series 2016, 5% 11/15/26 | 850,000 | 1,046,754 | |
| Series 2019 A: | |||
| 4% 12/1/49 | 795,000 | 938,810 | |
| 5% 11/15/48 | 290,000 | 368,210 | |
| Series 2020 A, 4% 6/1/49 | 865,000 | 1,013,937 | |
| Oakland Univ. Rev.: | |||
| Series 2016, 5% 3/1/41 | 810,000 | 951,746 | |
| Series 2019 A, 5% 3/1/31 | 580,000 | 748,106 | |
| Series 2019: | |||
| 5% 3/1/32 | 650,000 | 835,738 | |
| 5% 3/1/33 | 625,000 | 801,371 | |
| 5% 3/1/34 | 700,000 | 895,016 | |
| 5% 3/1/35 | 700,000 | 893,261 | |
| 5% 3/1/36 | 800,000 | 1,019,231 | |
| 5% 3/1/37 | 900,000 | 1,143,823 | |
| 5% 3/1/38 | 1,325,000 | 1,680,649 | |
| 5% 3/1/39 | 900,000 | 1,139,227 | |
| Royal Oak Hosp. Fin. Auth. Hosp. Rev. Series 2014 D, 5% 9/1/23 | 525,000 | 577,467 | |
| Univ. of Michigan Rev.: | |||
| Series 2017 A, 5% 4/1/24 | 1,245,000 | 1,406,630 | |
| Series 2020 A, 5% 4/1/50 | 4,000,000 | 5,175,536 | |
| TOTAL MICHIGAN | 49,047,072 | ||
| Minnesota - 0.6% | |||
| City of White Bear Lake (YMCA of Greater Twin Cities Proj.) Series 2018: | |||
| 5% 6/1/23 | 515,000 | 552,016 | |
| 5% 6/1/27 | 500,000 | 594,284 | |
| Duluth Econ. Dev. Auth. Health Care Facilities Rev. Series 2018 A, 5% 2/15/43 | 500,000 | 609,889 | |
| Hennepin County Reg'l. Railroad Auth. Series 2019, 5% 12/1/28 | 2,120,000 | 2,780,541 | |
| Minnesota Higher Ed. Facilities Auth. Rev.: | |||
| Series 2016 A, 5% 5/1/46 | 1,460,000 | 1,572,760 | |
| Series 2018 A, 5% 10/1/45 | 5,000 | 6,001 | |
| Saint Cloud Health Care Rev. Series 2019: | |||
| 4% 5/1/49 | 540,000 | 611,129 | |
| 5% 5/1/48 | 675,000 | 840,436 | |
| Shakopee Sr. Hsg. Rev. Bonds Series 2018, 5.85%, tender 11/1/25 (a)(b) | 1,340,000 | 1,459,355 | |
| St. Paul Hsg. & Redev. Auth. Health Care Facilities Rev. Series 2015 A, 5% 7/1/29 | 2,240,000 | 2,638,434 | |
| TOTAL MINNESOTA | 11,664,845 | ||
| Mississippi - 0.2% | |||
| Mississippi Hosp. Equip. & Facilities Auth.: | |||
| Bonds Series II, 5%, tender 3/1/27 (a) | 605,000 | 722,493 | |
| Series I: | |||
| 5% 10/1/22 | 400,000 | 422,449 | |
| 5% 10/1/23 | 550,000 | 605,449 | |
| 5% 10/1/24 | 535,000 | 611,413 | |
| 5% 10/1/26 | 650,000 | 790,873 | |
| 5% 10/1/28 | 1,000,000 | 1,275,611 | |
| TOTAL MISSISSIPPI | 4,428,288 | ||
| Missouri - 1.4% | |||
| Kansas City Wtr. Rev. Series 2020 A: | |||
| 4% 12/1/32 | 675,000 | 842,910 | |
| 4% 12/1/34 | 400,000 | 498,750 | |
| 4% 12/1/36 | 700,000 | 872,814 | |
| 4% 12/1/37 | 500,000 | 622,557 | |
| 4% 12/1/40 | 500,000 | 620,221 | |
| 5% 12/1/28 | 580,000 | 755,886 | |
| 5% 12/1/29 | 350,000 | 466,511 | |
| 5% 12/1/30 | 660,000 | 900,087 | |
| 5% 12/1/35 | 600,000 | 809,344 | |
| Missouri Health & Edl. Facilities Rev.: | |||
| Series 2017 A, 5% 10/1/42 | 2,350,000 | 2,840,690 | |
| Series 2019 A: | |||
| 4% 10/1/48 | 4,785,000 | 5,531,577 | |
| 5% 10/1/46 | 460,000 | 569,390 | |
| Missouri Hsg. Dev. Commission Single Family Mtg. Rev.: | |||
| Series 2019, 4% 5/1/50 | 155,000 | 172,719 | |
| Series 2021 A, 3% 5/1/52 | 2,905,000 | 3,197,818 | |
| Saint Louis Arpt. Rev.: | |||
| Series 2017 A, 5% 7/1/22 (FSA Insured) | 1,695,000 | 1,770,391 | |
| Series 2019 C: | |||
| 5% 7/1/26 | 1,440,000 | 1,758,052 | |
| 5% 7/1/27 | 2,430,000 | 3,053,688 | |
| Series A, 5.25% 7/1/26 (FSA Insured) | 2,790,000 | 3,440,069 | |
| Saint Louis County Indl. Dev. Auth. Sr. Living Facilities Rev. Series 2018 A, 5.125% 9/1/48 | 55,000 | 62,470 | |
| TOTAL MISSOURI | 28,785,944 | ||
| Montana - 0.0% | |||
| Montana Board Hsg. Single Family Series 2019 B, 4% 6/1/50 | 75,000 | 85,225 | |
| Nebraska - 0.7% | |||
| Central Plains Energy Proj. Gas Supply Bonds Series 2019, 4%, tender 8/1/25 (a) | 13,400,000 | 15,189,792 | |
| Nevada - 1.1% | |||
| Clark County Arpt. Rev. Series 2019 A, 5% 7/1/26 | 1,255,000 | 1,535,614 | |
| Clark County School District: | |||
| Series 2015 C, 5% 6/15/26 | 3,000,000 | 3,583,890 | |
| Series 2016 B, 5% 6/15/26 | 1,675,000 | 2,033,034 | |
| Series 2017 A: | |||
| 5% 6/15/22 | 2,520,000 | 2,627,973 | |
| 5% 6/15/24 | 250,000 | 283,834 | |
| 5% 6/15/25 | 5,945,000 | 6,996,596 | |
| 5% 6/15/26 | 215,000 | 260,957 | |
| Series 2017 C, 5% 6/15/22 | 210,000 | 218,998 | |
| Series A, 5% 6/15/27 | 1,305,000 | 1,635,287 | |
| Nevada Hsg. Division Single Family Mtg. Rev.: | |||
| Series 2019 A, 4% 4/1/49 | 2,360,000 | 2,618,437 | |
| Series 2019 B, 4% 10/1/49 | 250,000 | 277,807 | |
| TOTAL NEVADA | 22,072,427 | ||
| New Hampshire - 0.3% | |||
| Nat'l. Finnance Auth. Series 2020 1, 4.125% 1/20/34 | 1,778,326 | 2,162,593 | |
| New Hampshire Health & Ed. Facilities Auth.: | |||
| (Dartmouth-Hitchcock Oblgtd Grp Proj.) Series 2018 A, 5% 8/1/34 | 315,000 | 393,186 | |
| Series 2017, 5% 7/1/44 | 2,335,000 | 2,736,860 | |
| New Hampshire Health & Ed. Facilities Auth. Rev.: | |||
| (Covenant Health Sys., Inc. Proj.) Series 2012, 5% 7/1/42 | 1,695,000 | 1,754,806 | |
| Series 2016, 5% 10/1/23 | 170,000 | 186,983 | |
| TOTAL NEW HAMPSHIRE | 7,234,428 | ||
| New Jersey - 4.3% | |||
| Camden County Impt. Auth. Health Care Redev. Rev. Series 2014 A, 5% 2/15/26 | 1,000,000 | 1,111,587 | |
| New Jersey Econ. Dev. Auth.: | |||
| (White Horse HMT Urban Renewal LLC Proj.) Series 2020, 5% 1/1/40 (b) | 310,000 | 319,561 | |
| Series A, 5% 11/1/31 | 2,735,000 | 3,513,984 | |
| New Jersey Econ. Dev. Auth. Lease Rev. (State House Proj.) Series 2017 B: | |||
| 5% 6/15/26 | 1,000,000 | 1,206,155 | |
| 5% 6/15/35 | 580,000 | 730,924 | |
| New Jersey Econ. Dev. Auth. Rev.: | |||
| (Black Horse EHT Urban Renewal LLC Proj.) Series 2019 A, 5% 10/1/39 (b) | 220,000 | 227,431 | |
| (Provident Montclair Proj.) Series 2017, 5% 6/1/25 (FSA Insured) | 1,035,000 | 1,212,120 | |
| Series 2013 NN, 5% 3/1/27 | 1,055,000 | 1,133,172 | |
| Series 2014 PP, 5% 6/15/26 | 1,000,000 | 1,131,875 | |
| Series 2015 XX: | |||
| 5% 6/15/22 | 3,285,000 | 3,421,631 | |
| 5% 6/15/23 | 3,500,000 | 3,812,117 | |
| Series 2016 A, 5% 7/15/27 | 1,000,000 | 1,205,059 | |
| Series 2016 BBB: | |||
| 5% 6/15/23 | 1,400,000 | 1,524,847 | |
| 5.5% 6/15/30 | 230,000 | 285,268 | |
| Series 2018 EEE: | |||
| 5% 6/15/28 | 590,000 | 746,238 | |
| 5% 6/15/34 | 1,500,000 | 1,892,545 | |
| Series LLL: | |||
| 4% 6/15/44 | 2,935,000 | 3,427,855 | |
| 4% 6/15/49 | 2,690,000 | 3,123,548 | |
| Series MMM: | |||
| 4% 6/15/35 | 1,160,000 | 1,381,181 | |
| 4% 6/15/36 | 450,000 | 534,251 | |
| New Jersey Edl. Facility Series 2016 E, 5% 7/1/22 | 765,000 | 797,011 | |
| New Jersey Gen. Oblig. Series 2020 A: | |||
| 4% 6/1/30 | 1,060,000 | 1,317,562 | |
| 4% 6/1/31 | 400,000 | 504,745 | |
| 4% 6/1/32 | 270,000 | 346,076 | |
| 5% 6/1/29 | 1,195,000 | 1,574,356 | |
| New Jersey Health Care Facilities Fing. Auth. Rev.: | |||
| Bonds: | |||
| Series 2019 B1, 5%, tender 7/1/24 (a) | 1,360,000 | 1,543,642 | |
| Series 2019 B2, 5%, tender 7/1/25 (a) | 1,665,000 | 1,956,648 | |
| Series 2019 B3, 5%, tender 7/1/26 (a) | 1,695,000 | 2,054,312 | |
| Series 2016: | |||
| 4% 7/1/48 | 200,000 | 221,688 | |
| 5% 7/1/28 | 1,170,000 | 1,403,476 | |
| 5% 7/1/41 | 90,000 | 105,221 | |
| New Jersey Higher Ed. Student Assistance Auth. Student Ln. Rev. Series 2019 A: | |||
| 5% 12/1/21 | 285,000 | 289,591 | |
| 5% 12/1/23 | 200,000 | 221,948 | |
| 5% 12/1/24 | 115,000 | 132,339 | |
| 5% 12/1/25 | 215,000 | 254,997 | |
| New Jersey Tobacco Settlement Fing. Corp. Series 2018 A, 5% 6/1/28 | 1,000,000 | 1,282,098 | |
| New Jersey Tpk. Auth. Tpk. Rev.: | |||
| Series 2021 A: | |||
| 4% 1/1/42 | 1,710,000 | 2,069,491 | |
| 4% 1/1/51 | 2,000,000 | 2,391,476 | |
| Series D, 5% 1/1/28 | 1,000,000 | 1,210,157 | |
| New Jersey Trans. Trust Fund Auth.: | |||
| (Trans. Prog.) Series 2019 AA, 5.25% 6/15/43 | 1,945,000 | 2,453,916 | |
| Series 2010 A, 0% 12/15/27 | 1,205,000 | 1,107,483 | |
| Series 2018 A: | |||
| 5% 12/15/32 | 355,000 | 448,430 | |
| 5% 12/15/34 | 1,350,000 | 1,702,473 | |
| Series 2021 A: | |||
| 4% 6/15/38 (c) | 800,000 | 929,913 | |
| 5% 6/15/33 | 4,520,000 | 5,995,263 | |
| Series 2022 A, 4% 6/15/40 (c) | 3,340,000 | 3,857,062 | |
| Series 2022 AA: | |||
| 5% 6/15/30 (c) | 1,970,000 | 2,475,299 | |
| 5% 6/15/31 (c) | 4,790,000 | 6,121,367 | |
| Series A: | |||
| 4% 12/15/39 | 1,000,000 | 1,179,387 | |
| 4.25% 12/15/38 | 2,515,000 | 2,968,302 | |
| Series AA: | |||
| 4% 6/15/39 | 1,040,000 | 1,247,645 | |
| 4% 6/15/50 | 2,280,000 | 2,685,650 | |
| 5% 6/15/29 | 405,000 | 421,788 | |
| 5% 6/15/36 | 1,150,000 | 1,494,507 | |
| 5% 6/15/50 | 500,000 | 633,694 | |
| Series BB, 4% 6/15/44 | 1,300,000 | 1,495,874 | |
| Newark Port Auth. Hsg. Auth. Rev. Series 2007, 5.25% 1/1/26 (Nat'l. Pub. Fin. Guarantee Corp. Insured) | 1,000,000 | 1,144,096 | |
| Rutgers State Univ. Rev. Series Q: | |||
| 5% 5/1/22 | 275,000 | 284,932 | |
| 5% 5/1/23 | 215,000 | 232,612 | |
| TOTAL NEW JERSEY | 90,497,876 | ||
| New Mexico - 0.6% | |||
| Albuquerque Brnl Co. Wtr. Utl Series 2018, 5% 7/1/28 | 1,000,000 | 1,218,150 | |
| New Mexico Hosp. Equip. Ln. Council Rev. Bonds Series 2019 B, 5%, tender 8/1/25 (a) | 1,460,000 | 1,717,468 | |
| New Mexico Mtg. Fin. Auth.: | |||
| Series 2019 C, 4% 1/1/50 | 960,000 | 1,068,116 | |
| Series 2019 D, 3.75% 1/1/50 | 345,000 | 382,078 | |
| New Mexico Muni. Energy Acquisition Auth. Gas Supply Rev.: | |||
| Bonds Series 2019 A, 5%, tender 5/1/25 (a) | 5,000,000 | 5,811,775 | |
| Series 2019 A: | |||
| 4% 5/1/23 | 590,000 | 628,928 | |
| 4% 11/1/23 | 200,000 | 216,862 | |
| 4% 5/1/24 | 675,000 | 743,815 | |
| Santa Fe Retirement Fac.: | |||
| Series 2019 A: | |||
| 2.25% 5/15/24 | 35,000 | 35,125 | |
| 5% 5/15/34 | 70,000 | 80,777 | |
| 5% 5/15/39 | 50,000 | 57,326 | |
| 5% 5/15/44 | 50,000 | 56,957 | |
| 5% 5/15/49 | 105,000 | 119,250 | |
| Series 2019 B1, 2.625% 5/15/25 | 55,000 | 55,245 | |
| TOTAL NEW MEXICO | 12,191,872 | ||
| New York - 6.8% | |||
| Dorm. Auth. New York Univ. Rev. Series 2017 A, 5% 7/1/46 | 1,265,000 | 1,543,444 | |
| Hudson Yards Infrastructure Corp. New York Rev. Series 2017 A, 5% 2/15/42 | 3,700,000 | 4,455,738 | |
| Long Island Pwr. Auth. Elec. Sys. Rev.: | |||
| Bonds Series 2019 B, 1.65%, tender 9/1/24 (a) | 2,600,000 | 2,687,580 | |
| Series 2018, 5% 9/1/36 | 250,000 | 319,440 | |
| MTA Hudson Rail Yards Trust Oblig. Series 2016 A, 5% 11/15/56 | 300,000 | 323,303 | |
| New York City Gen. Oblig.: | |||
| Series 2021 A1: | |||
| 5% 8/1/28 | 2,385,000 | 3,087,051 | |
| 5% 8/1/29 | 2,595,000 | 3,433,739 | |
| Series B, 5% 10/1/42 | 2,000,000 | 2,557,611 | |
| New York City Hsg. Dev. Corp. Multifamily Hsg. Bonds: | |||
| Series 2021 C2, 0.7%, tender 7/1/25 (a) | 1,265,000 | 1,272,924 | |
| Series 2021, 0.6%, tender 7/1/25 (a) | 1,675,000 | 1,682,306 | |
| New York City Transitional Fin. Auth. Bldg. Aid Rev.: | |||
| (New York State Gen. Oblig. Proj.) Series 2015 S-1, 5% 7/15/35 | 7,000,000 | 8,095,861 | |
| Series 2018 S2, 5% 7/15/35 | 1,075,000 | 1,340,490 | |
| New York City Transitional Fin. Auth. Rev.: | |||
| Series 2018 A2, 5% 8/1/39 | 1,800,000 | 2,232,756 | |
| Series 2018 B, 5% 8/1/45 | 7,150,000 | 8,806,693 | |
| New York City Trust Cultural Resources Rev. Series 2021, 5% 7/1/31 | 3,600,000 | 4,965,191 | |
| New York Dorm. Auth. Rev. Bonds: | |||
| Series 2019 B1, 5%, tender 5/1/22 (a) | 1,200,000 | 1,213,936 | |
| Series 2019 B2, 5%, tender 5/1/24 (a) | 880,000 | 973,043 | |
| Series 2019 B3, 5%, tender 5/1/26 (a) | 635,000 | 752,908 | |
| New York Metropolitan Trans. Auth. Dedicated Tax Fund Rev. Series 2012 A, 0% 11/15/32 | 5,515,000 | 4,667,390 | |
| New York Metropolitan Trans. Auth. Rev.: | |||
| Series 2017 C1, 5% 11/15/34 | 1,465,000 | 1,826,563 | |
| Series 2017 D, 5% 11/15/35 | 2,000,000 | 2,488,276 | |
| Series 2020 A, 5% 2/1/23 | 3,020,000 | 3,233,750 | |
| Series 2020 D, 4% 11/15/46 | 13,530,000 | 15,818,712 | |
| Series 2021 A1, 4% 11/15/45 | 8,500,000 | 10,026,313 | |
| Series D1, 5% 11/1/25 | 2,050,000 | 2,166,507 | |
| New York State Dorm. Auth. Series 2017 A, 5% 2/15/31 | 1,000,000 | 1,234,582 | |
| New York State Urban Dev. Corp.: | |||
| Series 2020 A, 4% 3/15/45 | 1,250,000 | 1,482,892 | |
| Series 2020 C: | |||
| 5% 3/15/43 | 5,000,000 | 6,480,604 | |
| 5% 3/15/47 | 10,000,000 | 12,883,745 | |
| Series 2020 E: | |||
| 4% 3/15/44 | 9,300,000 | 10,977,271 | |
| 4% 3/15/45 | 7,500,000 | 8,826,413 | |
| Oneida County Local Dev. Corp. Rev. (Mohawk Valley Health Sys. Proj.) Series 2019 A, 5% 12/1/26 (FSA Insured) | 1,625,000 | 1,796,277 | |
| Suffolk County Econ. Dev. Corp. Rev. Series 2021: | |||
| 4.625% 11/1/31 (b) | 250,000 | 261,141 | |
| 5.375% 11/1/54 (b) | 935,000 | 985,396 | |
| Triborough Bridge & Tunnel Auth. Series 2021 A1, 5% 5/15/51 | 1,875,000 | 2,462,769 | |
| Triborough Bridge & Tunnel Auth. Revs. Series 2018 A, 5% 11/15/44 | 4,000,000 | 4,970,472 | |
| TOTAL NEW YORK | 142,333,087 | ||
| New York And New Jersey - 0.4% | |||
| Port Auth. of New York & New Jersey: | |||
| (H. Lee Moffitt Cancer Ctr. Proj.) Series 2016, 5% 11/15/41 | 5,000,000 | 6,009,878 | |
| Series 194, 5.25% 10/15/55 | 1,335,000 | 1,587,699 | |
| TOTAL NEW YORK AND NEW JERSEY | 7,597,577 | ||
| North Carolina - 1.0% | |||
| Charlotte Ctfs. of Prtn. (Convention Facility Projs.) Series 2019 A, 4% 6/1/39 | 875,000 | 1,053,567 | |
| New Hanover County Hosp. Rev. Series 2017: | |||
| 5% 10/1/27 (Escrowed to Maturity) | 55,000 | 69,123 | |
| 5% 10/1/42 (Pre-Refunded to 10/1/27 @ 100) | 465,000 | 584,404 | |
| North Carolina Med. Care Commission Health Care Facilities Rev. Bonds: | |||
| Series 2019 B, 2.2%, tender 12/1/22 (a) | 780,000 | 792,475 | |
| Series 2019 C, 2.55%, tender 6/1/26 (a) | 1,345,000 | 1,446,401 | |
| North Carolina Tpk. Auth. Triangle Expressway Sys. Series 2019, 5% 1/1/49 | 14,000,000 | 17,243,068 | |
| TOTAL NORTH CAROLINA | 21,189,038 | ||
| North Dakota - 0.1% | |||
| North Dakota Hsg. Fin. Agcy. Series 2021 A, 3% 1/1/52 | 910,000 | 1,004,357 | |
| Ohio - 4.2% | |||
| Akron Bath Copley Hosp. District Rev.: | |||
| Series 2016, 5.25% 11/15/46 | 3,735,000 | 4,486,126 | |
| Series 2020, 5% 11/15/31 | 385,000 | 514,230 | |
| Allen County Hosp. Facilities Rev. Bonds (Mercy Health) Series 2017 B, 5%, tender 5/5/22 (a) | 500,000 | 517,705 | |
| American Muni. Pwr., Inc. Rev.: | |||
| (Greenup Hydroelectric Proj.): | |||
| Series 2016 A, 5% 2/15/41 | 1,000,000 | 1,181,828 | |
| Series 2016, 5% 2/15/46 | 1,735,000 | 2,055,565 | |
| Bonds Series 2019 A, 2.3%, tender 2/15/22 (a) | 900,000 | 901,400 | |
| Chillicothe Hosp. Facilities Rev. (Adena Health Sys. Oblig. Group Proj.) Series 2017, 5% 12/1/47 | 1,000,000 | 1,215,944 | |
| Cleveland Arpt. Sys. Rev. Series 2016 A: | |||
| 5% 1/1/24 (FSA Insured) | 1,200,000 | 1,339,897 | |
| 5% 1/1/25 (FSA Insured) | 730,000 | 846,890 | |
| Cleveland State Univ. Gen. Receipts Series 2012, 5% 6/1/37 | 2,500,000 | 2,535,495 | |
| Columbus Gen. Oblig.: | |||
| Series 2016 2, 5% 7/1/25 | 1,900,000 | 2,247,712 | |
| Series 2019 A, 5% 4/1/33 | 2,430,000 | 3,159,482 | |
| Fairfield County Hosp. Facilities Rev. (Fairfield Med. Ctr. Proj.) Series 2013, 4.25% 6/15/24 | 385,000 | 405,373 | |
| Franklin County Hosp. Facilities Rev. Bonds (U.S. Health Corp. of Columbus Proj.) Series 2011 B, 5%, tender 5/15/23 (a) | 200,000 | 216,745 | |
| Hamilton County Healthcare Facilities Rev. Series 2012, 5.25% 6/1/26 | 495,000 | 512,190 | |
| Hamilton County Healthcare Rev. (Life Enriching Cmntys. Proj.) Series 2016, 5% 1/1/51 | 1,000,000 | 1,111,291 | |
| Hamilton County Hosp. Facilities Rev. (Trihealth, Inc. Obligated Group Proj.) Series 2017 A, 5% 8/15/33 | 825,000 | 1,008,694 | |
| Lancaster Port Auth. Gas Rev. Bonds Series 2019, 5%, tender 2/1/25 (a) | 4,415,000 | 5,082,226 | |
| Miami County Hosp. Facilities Rev. (Kettering Health Network Obligated Group Proj.) Series 2019: | |||
| 5% 8/1/23 | 435,000 | 476,882 | |
| 5% 8/1/45 | 3,550,000 | 4,412,838 | |
| Muskingum County Hosp. Facilities (Genesis Healthcare Sys. Obligated Group Proj.) Series 2013, 4% 2/15/23 | 1,075,000 | 1,119,661 | |
| Ohio Higher Edl. Facility Commission Rev.: | |||
| (Case Western Reserve Univ. Proj.) Series 2016, 5% 12/1/22 | 715,000 | 761,452 | |
| (Kenyon College 2020 Proj.) Series 2020: | |||
| 4% 7/1/40 | 730,000 | 860,378 | |
| 5% 7/1/35 | 2,625,000 | 3,374,128 | |
| 5% 7/1/42 | 4,525,000 | 5,709,489 | |
| (Kenyon College, Oh. Proj.) Series 2017, 5% 7/1/42 | 1,700,000 | 2,052,843 | |
| Ohio Hosp. Rev. Series 2020 A, 4% 1/15/50 | 285,000 | 331,589 | |
| Ohio Hsg. Fin. Agcy. Residential Mtg. Rev. (Mtg. Backed Securities Prog.) Series 2019 B, 4.5% 3/1/50 | 110,000 | 123,716 | |
| Ohio Major New State Infrastructure Rev. Series 2021 1A: | |||
| 5% 12/15/31 | 1,400,000 | 1,952,418 | |
| 5% 12/15/32 | 1,735,000 | 2,463,366 | |
| Ohio Spl. Oblig. Series 2020 A: | |||
| 5% 2/1/23 | 1,365,000 | 1,465,606 | |
| 5% 2/1/24 | 3,580,000 | 4,011,163 | |
| 5% 2/1/26 | 1,145,000 | 1,380,338 | |
| Ohio Tpk. Commission Tpk. Rev. Series A, 5% 2/15/51 | 9,280,000 | 12,110,603 | |
| Ross County Hosp. Facilities Rev. (Adena Health Sys. Obligated Group Proj.) Series 2019: | |||
| 5% 12/1/21 | 335,000 | 340,205 | |
| 5% 12/1/22 | 360,000 | 382,590 | |
| 5% 12/1/23 | 500,000 | 552,400 | |
| 5% 12/1/24 | 525,000 | 601,525 | |
| 5% 12/1/25 | 460,000 | 544,276 | |
| 5% 12/1/26 | 600,000 | 730,359 | |
| Scioto County Hosp. Facilities Rev.: | |||
| Series 2016: | |||
| 5% 2/15/26 | 1,940,000 | 2,323,314 | |
| 5% 2/15/27 | 1,615,000 | 1,931,808 | |
| Series 2019, 5% 2/15/29 | 745,000 | 877,197 | |
| Univ. of Akron Gen. Receipts Series 2019 A, 5% 1/1/26 | 1,800,000 | 2,151,720 | |
| Univ. of Cincinnati Gen. Receipts Series 2016 C, 5% 6/1/41 | 5,000,000 | 6,012,954 | |
| TOTAL OHIO | 88,393,611 | ||
| Oklahoma - 0.1% | |||
| Oklahoma Dev. Fin. Auth. Health Sys. Rev. (OU Medicine Proj.) Series 2018 B, 5% 8/15/23 | 750,000 | 814,585 | |
| Oklahoma Dev. Fin. Auth. Rev. (Oklahoma City Univ. Proj.) Series 2019: | |||
| 4% 8/1/21 | 380,000 | 380,000 | |
| 4% 8/1/22 | 475,000 | 491,195 | |
| 5% 8/1/26 | 360,000 | 430,432 | |
| 5% 8/1/44 | 660,000 | 802,505 | |
| TOTAL OKLAHOMA | 2,918,717 | ||
| Oregon - 0.9% | |||
| Medford Hosp. Facilities Auth. Rev. (Asante Projs.) Series 2020 A: | |||
| 5% 8/15/36 | 1,300,000 | 1,714,540 | |
| 5% 8/15/38 | 3,700,000 | 4,854,804 | |
| Oregon Bus. Dev. Commission Recovery Zone Facility Bonds (Intel Corp. Proj.) Series 232, 2.4%, tender 8/14/23 (a) | 1,695,000 | 1,765,752 | |
| Oregon State Hsg. & Cmnty. Svcs. Dept. Series 2019 A, 4% 7/1/50 | 10,220,000 | 11,371,767 | |
| TOTAL OREGON | 19,706,863 | ||
| Pennsylvania - 4.9% | |||
| Bucks County Indl. Dev. Auth. Hosp. Rev. Series 2021: | |||
| 5% 7/1/36 | 605,000 | 774,006 | |
| 5% 7/1/38 | 1,210,000 | 1,539,499 | |
| Centre County Pennsylvania Hosp. Auth. Rev. (Mount Nittany Med. Ctr. Proj.) Series 2016 A, 5% 11/15/46 | 4,000,000 | 4,687,416 | |
| Commonwealth Fing. Auth. Rev.: | |||
| Series 2019 B, 5% 6/1/26 | 680,000 | 826,178 | |
| Series 2020 A: | |||
| 5% 6/1/29 | 1,750,000 | 2,285,452 | |
| 5% 6/1/32 | 3,000,000 | 3,977,266 | |
| Dauphin County Gen. Auth. (Pinnacle Health Sys. Proj.) Series 2016 A, 5% 6/1/34 | 1,140,000 | 1,371,636 | |
| Doylestown Hosp. Auth. Hosp. Rev. Series 2019, 5% 7/1/49 | 1,020,000 | 1,225,122 | |
| Lehigh County Gen. Purp. Hosp. Rev. Series 2019 A: | |||
| 5% 7/1/22 | 1,500,000 | 1,566,859 | |
| 5% 7/1/23 | 900,000 | 983,972 | |
| 5% 7/1/24 | 1,700,000 | 1,937,192 | |
| 5% 7/1/26 | 1,900,000 | 2,322,760 | |
| 5% 7/1/27 | 2,000,000 | 2,517,299 | |
| 5% 7/1/28 | 2,080,000 | 2,685,088 | |
| Lehigh County Indl. Dev. Auth. Poll. Cont. Rev. Bonds (PPL Elec. Utils. Corp. Proj.) Series 2016 A, 1.8%, tender 9/1/22 (a) | 505,000 | 513,207 | |
| Montgomery County Higher Ed. & Health Auth. Rev.: | |||
| Series 2016 A, 5% 10/1/40 | 2,685,000 | 3,023,334 | |
| Series 2019: | |||
| 4% 9/1/36 | 750,000 | 890,565 | |
| 4% 9/1/37 | 750,000 | 888,208 | |
| 4% 9/1/38 | 1,700,000 | 2,008,996 | |
| 4% 9/1/39 | 1,100,000 | 1,297,056 | |
| 4% 9/1/44 | 250,000 | 291,846 | |
| 5% 9/1/22 | 600,000 | 630,330 | |
| 5% 9/1/23 | 500,000 | 547,334 | |
| 5% 9/1/24 | 675,000 | 767,738 | |
| Series 2020: | |||
| 5% 4/1/22 | 325,000 | 334,522 | |
| 5% 4/1/23 | 360,000 | 386,342 | |
| 5% 4/1/24 | 365,000 | 406,379 | |
| 5% 4/1/25 | 280,000 | 322,504 | |
| 5% 4/1/26 | 330,000 | 391,604 | |
| 5% 4/1/27 | 630,000 | 767,973 | |
| Montgomery County Indl. Dev. Auth. Series 2015 A, 5.25% 1/15/36 | 1,060,000 | 1,200,229 | |
| Pennsylvania Econ. Dev. Fing. Auth. Series 2020 A: | |||
| 5% 4/15/24 | 550,000 | 620,639 | |
| 5% 4/15/25 | 750,000 | 878,405 | |
| 5% 4/15/26 | 2,500,000 | 3,026,399 | |
| Pennsylvania Econ. Dev. Fing. Auth. Solid Waste Disp. Rev. Bonds (Waste Mgmt., Inc. Proj.) Series 2009, 2.8%, tender 12/1/21 (a) | 200,000 | 201,773 | |
| Pennsylvania Higher Edl. Facilities Auth. Rev.: | |||
| Series 2012: | |||
| 5% 5/1/31 (Pre-Refunded to 11/1/22 @ 100) | 1,035,000 | 1,097,787 | |
| 5% 11/1/42 | 1,370,000 | 1,432,132 | |
| Series 2016, 5% 5/1/34 | 1,600,000 | 1,911,611 | |
| Series 2018 A, 5% 2/15/48 | 940,000 | 1,153,894 | |
| Pennsylvania State Univ. Series 2020 A, 4% 9/1/50 | 1,480,000 | 1,753,597 | |
| Pennsylvania Tpk. Commission Tpk. Rev.: | |||
| Series 2016, 5% 6/1/36 | 2,000,000 | 2,386,001 | |
| Series 2021 A: | |||
| 4% 12/1/43 | 3,000,000 | 3,575,507 | |
| 4% 12/1/46 | 5,000,000 | 5,926,995 | |
| 4% 12/1/50 | 1,000,000 | 1,179,928 | |
| Philadelphia Auth. for Indl. Dev.: | |||
| Series 2015 1, 5% 4/1/33 | 530,000 | 612,837 | |
| Series 2017, 5% 11/1/47 | 1,040,000 | 1,216,489 | |
| Philadelphia Gen. Oblig.: | |||
| Series 2019 A, 5% 8/1/26 | 1,165,000 | 1,423,474 | |
| Series 2019 B: | |||
| 5% 2/1/34 | 2,250,000 | 2,914,455 | |
| 5% 2/1/35 | 2,750,000 | 3,547,089 | |
| 5% 2/1/36 | 2,415,000 | 3,103,012 | |
| Philadelphia School District: | |||
| Series 2018 A, 5% 9/1/26 | 1,400,000 | 1,709,498 | |
| Series 2019 A: | |||
| 4% 9/1/35 | 1,250,000 | 1,504,565 | |
| 5% 9/1/23 | 660,000 | 724,362 | |
| 5% 9/1/26 | 2,000,000 | 2,442,140 | |
| 5% 9/1/30 | 1,335,000 | 1,746,452 | |
| 5% 9/1/32 | 1,000,000 | 1,300,172 | |
| 5% 9/1/34 | 620,000 | 803,638 | |
| 5% 9/1/44 | 1,450,000 | 1,835,072 | |
| Series 2019 B: | |||
| 5% 9/1/25 | 1,360,000 | 1,608,648 | |
| 5% 9/1/26 | 1,105,000 | 1,349,282 | |
| Philadelphia Wtr. & Wastewtr. Rev. Series 2018 A, 5% 10/1/22 | 1,000,000 | 1,056,848 | |
| Pittsburgh Wtr. & Swr. Auth. Wtr. & Swr. Sys. Rev. Series 2019 A, 5% 9/1/44 (FSA Insured) | 450,000 | 571,858 | |
| Southcentral Pennsylvania Gen. Auth. Rev. Series 2019 A: | |||
| 4% 6/1/44 | 235,000 | 274,133 | |
| 4% 6/1/49 | 555,000 | 641,812 | |
| 5% 6/1/44 | 405,000 | 513,175 | |
| 5% 6/1/49 | 645,000 | 813,057 | |
| State Pub. School Bldg. Auth. Lease Rev. (The School District of Philadelphia Proj.) Series 2016 A, 5% 6/1/32 (FSA Insured) | 885,000 | 1,080,898 | |
| Union County Hosp. Auth. Rev. Series 2018 B, 5% 8/1/48 | 1,430,000 | 1,684,104 | |
| TOTAL PENNSYLVANIA | 102,989,650 | ||
| Pennsylvania, New Jersey - 0.1% | |||
| Delaware River Port Auth. Pennsylvania & New Jersey Rev. Series 2018 B, 5% 1/1/24 | 2,250,000 | 2,509,989 | |
| Rhode Island - 0.0% | |||
| Rhode Island Hsg. & Mtg. Fin. Corp. Series 2019 70, 4% 10/1/49 | 245,000 | 271,024 | |
| South Carolina - 1.1% | |||
| Charleston County Arpt. District Series 2019, 5% 7/1/48 | 1,875,000 | 2,374,062 | |
| Greenville Hosp. Sys. Facilities Rev. Series 2012, 5% 5/1/23 | 1,400,000 | 1,449,222 | |
| Patriots Energy Group Fing. Agcy. Bonds Series 2018 A, 4%, tender 2/1/24 (a) | 540,000 | 585,627 | |
| South Carolina Hsg. Fin. & Dev. Auth. Mtg. Rev. Series 2019 A, 4% 1/1/50 | 340,000 | 383,996 | |
| South Carolina Jobs-Econ. Dev. Auth. Series 2019 C, 5% 7/1/33 | 1,305,000 | 1,663,287 | |
| South Carolina Pub. Svc. Auth. Rev.: | |||
| Series 2013 B, 5% 12/1/38 | 2,300,000 | 2,538,485 | |
| Series 2014 C: | |||
| 5% 12/1/26 | 100,000 | 114,856 | |
| 5% 12/1/39 | 1,000,000 | 1,140,673 | |
| 5% 12/1/46 | 4,675,000 | 5,331,931 | |
| Series 2016 A, 5% 12/1/33 | 220,000 | 263,790 | |
| Series A, 5% 12/1/23 | 790,000 | 877,084 | |
| Series B, 5% 12/1/24 | 2,520,000 | 2,909,010 | |
| Spartanburg County Reg'l. Health Series 2017 A, 5% 4/15/48 | 2,470,000 | 3,017,370 | |
| TOTAL SOUTH CAROLINA | 22,649,393 | ||
| South Dakota - 0.1% | |||
| South Dakota Health & Edl. Facilities Auth. Rev. Bonds Series 2019 A, 5%, tender 7/1/24 (a) | 1,595,000 | 1,787,981 | |
| Tennessee - 2.1% | |||
| Chattanooga Health Ed. & Hsg. Facility Board Rev.: | |||
| Series 2019 A1, 5% 8/1/25 | 615,000 | 724,335 | |
| Series 2019 A2, 5% 8/1/44 | 2,250,000 | 2,820,564 | |
| Jackson Hosp. Rev. Series 2018 A: | |||
| 5% 4/1/27 | 630,000 | 781,291 | |
| 5% 4/1/28 | 420,000 | 534,071 | |
| 5% 4/1/41 | 500,000 | 617,542 | |
| Nashville and Davidson County Metropolitan Govt. Gen. Oblig. Series 2021 C: | |||
| 5% 1/1/27 | 11,000,000 | 13,670,910 | |
| 5% 1/1/30 | 12,750,000 | 17,085,756 | |
| Nashville and Davidson County Metropolitan Govt. Health & Edl. Facilities Board Rev. (Lipscomb Univ. Proj.) Series 2019 A: | |||
| 4% 10/1/49 | 410,000 | 462,412 | |
| 5.25% 10/1/58 | 1,225,000 | 1,500,998 | |
| Tennergy Corp. Gas Rev. Bonds Series 2019 A, 5%, tender 10/1/24 (a) | 2,025,000 | 2,304,158 | |
| Tennessee Energy Acquisition Corp. Bonds (Gas Rev. Proj.) Series A, 4%, tender 5/1/23 (a) | 100,000 | 106,039 | |
| Tennessee Hsg. Dev. Agcy. Residential Series 2021 1, 3% 7/1/51 | 3,010,000 | 3,317,229 | |
| TOTAL TENNESSEE | 43,925,305 | ||
| Texas - 6.6% | |||
| Austin Wtr. & Wastewtr. Sys. Rev. Series 2016, 5% 11/15/33 | 2,000,000 | 2,468,825 | |
| Central Reg'l. Mobility Auth.: | |||
| Series 2018, 5% 1/1/25 | 1,000,000 | 1,156,055 | |
| Series 2020 B: | |||
| 4% 1/1/34 | 280,000 | 337,493 | |
| 4% 1/1/35 | 225,000 | 270,536 | |
| 4% 1/1/36 | 245,000 | 293,335 | |
| 4% 1/1/37 | 350,000 | 417,901 | |
| 4% 1/1/38 | 465,000 | 553,989 | |
| 4% 1/1/39 | 600,000 | 713,182 | |
| 4% 1/1/40 | 230,000 | 272,886 | |
| 5% 1/1/27 | 200,000 | 246,754 | |
| 5% 1/1/28 | 230,000 | 291,486 | |
| 5% 1/1/29 | 850,000 | 1,103,551 | |
| 5% 1/1/30 | 400,000 | 530,674 | |
| 5% 1/1/31 | 200,000 | 263,698 | |
| 5% 1/1/32 | 200,000 | 263,662 | |
| 5% 1/1/33 | 300,000 | 393,468 | |
| Series 2021 B: | |||
| 5% 1/1/30 | 1,000,000 | 1,326,685 | |
| 5% 1/1/32 | 1,275,000 | 1,718,653 | |
| 5% 1/1/39 | 1,300,000 | 1,702,677 | |
| 5% 1/1/46 | 3,500,000 | 4,515,026 | |
| Series 2021 C, 5% 1/1/27 | 3,765,000 | 4,471,965 | |
| Collin County Series 2019, 5% 2/15/26 | 2,315,000 | 2,792,018 | |
| Cypress-Fairbanks Independent School District Bonds Series 2014 B1, 1.25%, tender 8/15/22 (a) | 890,000 | 900,124 | |
| Dallas Fort Worth Int'l. Arpt. Rev. Series 2020 B: | |||
| 4% 11/1/34 | 1,410,000 | 1,754,002 | |
| 4% 11/1/35 | 1,255,000 | 1,558,091 | |
| Dallas Independent School District: | |||
| Series 2014 A, 5% 8/15/26 | 1,315,000 | 1,504,415 | |
| Series 2019: | |||
| 5% 2/15/23 | 1,000,000 | 1,075,127 | |
| 5% 2/15/24 | 700,000 | 782,147 | |
| 5% 2/15/25 | 1,000,000 | 1,159,966 | |
| Dallas Wtrwks. & Swr. Sys. Rev. Series 2017, 5% 10/1/46 | 500,000 | 615,217 | |
| Denton County Gen. Oblig. Series 2020: | |||
| 4% 5/15/26 | 2,510,000 | 2,937,119 | |
| 4% 5/15/27 | 1,935,000 | 2,317,733 | |
| Denton Independent School District Bonds Series 2014 B, 2%, tender 8/1/24 (a) | 670,000 | 704,591 | |
| Fort Worth Gen. Oblig. Series 2016: | |||
| 5% 3/1/25 | 1,000,000 | 1,166,859 | |
| 5% 3/1/27 | 1,000,000 | 1,206,834 | |
| Gregg County Health Facilities Dev. Series 2012 C, 5% 7/1/42 (Pre-Refunded to 7/1/22 @ 100) | 800,000 | 835,237 | |
| Harris County Toll Road Rev. Series 2018 A, 5% 8/15/43 | 500,000 | 622,223 | |
| Houston Arpt. Sys. Rev. Series 2018 D, 5% 7/1/39 | 2,175,000 | 2,730,673 | |
| Houston Convention and Entertainment Facilities Dept. Hotel Occupancy Tax and Spl. Rev. Series 2019, 5% 9/1/33 | 765,000 | 952,925 | |
| Houston Gen. Oblig. Series 2017 A, 5% 3/1/31 | 1,250,000 | 1,534,589 | |
| Houston Util. Sys. Rev.: | |||
| Series 2017 B, 5% 11/15/35 | 1,000,000 | 1,251,314 | |
| Series 2020 C, 5% 11/15/28 | 2,400,000 | 3,126,411 | |
| Series 2021 A: | |||
| 5% 11/15/26 | 380,000 | 470,869 | |
| 5% 11/15/28 | 1,580,000 | 2,058,220 | |
| Irving Hosp. Auth. Hosp. Rev. Series 2017 A, 5% 10/15/35 | 410,000 | 483,256 | |
| Lower Colorado River Auth. Rev. (LCRA Transmission Svcs. Corp. Proj.): | |||
| Series 2018: | |||
| 5% 5/15/43 | 1,500,000 | 1,845,999 | |
| 5% 5/15/48 | 1,700,000 | 2,079,955 | |
| Series 2020, 5% 5/15/28 | 2,250,000 | 2,872,954 | |
| Midlothian Independent School District Bonds Series 2013 C, 2%, tender 8/1/24 (a) | 565,000 | 592,266 | |
| Newark Higher Ed. Fin. Corp. (Abilene Christian Univ. Proj.) Series 2016 A, 5% 4/1/28 | 1,550,000 | 1,831,331 | |
| North East Texas Independent School District Bonds Series 2019, 2.2%, tender 8/1/24 (a) | 345,000 | 361,381 | |
| North Texas Tollway Auth. Rev.: | |||
| Series 2016 A, 5% 1/1/30 | 750,000 | 892,933 | |
| Series 2017 A, 5% 1/1/39 | 4,000,000 | 4,953,456 | |
| Series 2018: | |||
| 4% 1/1/38 | 1,835,000 | 2,137,215 | |
| 5% 1/1/35 | 500,000 | 618,751 | |
| Series 2019 A: | |||
| 5% 1/1/23 | 2,000,000 | 2,137,457 | |
| 5% 1/1/24 | 2,100,000 | 2,344,278 | |
| 5% 1/1/38 | 5,000,000 | 6,317,950 | |
| Series 2019 B, 5% 1/1/25 | 645,000 | 748,040 | |
| Series 2021 B, 4% 1/1/33 | 2,000,000 | 2,486,896 | |
| Pasadena Independent School District Bonds Series 2015 B, 1.5%, tender 8/15/24 (a) | 2,325,000 | 2,404,756 | |
| Plano Independent School District Series 2016 A, 5% 2/15/23 | 1,000,000 | 1,075,288 | |
| San Antonio Elec. & Gas Sys. Rev. Bonds: | |||
| Series 2018, 2.75%, tender 12/1/22 (a) | 1,400,000 | 1,446,129 | |
| Series 2020, 1.75%, tender 12/1/25 (a) | 10,750,000 | 11,374,361 | |
| Tarrant County Cultural Ed. Facilities Fin. Corp. Hosp. Rev.: | |||
| (Scott & White Healthcare Proj.) Series 2013 A, 5% 8/15/43 (Pre-Refunded to 8/15/23 @ 100) | 2,285,000 | 2,509,910 | |
| Series 2020, 5% 12/1/24 | 550,000 | 635,696 | |
| Tarrant County Cultural Ed. Facilities Fin. Corp. Retirement Facility Rev. (Buckner Retirement Svcs., Inc.) Series 2016 B, 5% 11/15/40 | 950,000 | 1,114,062 | |
| Tarrant County Cultural Ed. Facilities Fin. Corp. Rev.: | |||
| Series 2016 A, 5% 2/15/47 | 8,000,000 | 9,583,800 | |
| Series 2018 A, 5% 7/1/22 | 800,000 | 835,281 | |
| Texas Dept. of Hsg. & Cmnty. Affairs Multi-family Hsg. Rev. Series 2019, 2.95% 7/1/36 | 725,208 | 772,482 | |
| Texas Dept. of Hsg. & Cmnty. Affairs Single Family Mtg. Rev. Series 2019 A, 4% 3/1/50 | 860,000 | 978,592 | |
| Texas Gen. Oblig. Bonds Series 2019 C2, 1.85%, tender 8/1/22 (a) | 95,000 | 95,094 | |
| Texas Private Activity Bond Surface Trans. Corp. (LBJ Infrastructure Group LLC I-635 Managed Lanes Proj.) Series 2020 A: | |||
| 4% 6/30/36 | 825,000 | 993,744 | |
| 4% 6/30/38 | 2,100,000 | 2,513,775 | |
| 4% 12/31/39 | 1,750,000 | 2,087,843 | |
| Texas Pub. Fin. Auth. Lease Rev. Series 2019, 5% 2/1/25 | 1,150,000 | 1,337,378 | |
| Texas State Univ. Sys. Fing. Rev. Series 2019 A: | |||
| 5% 3/15/24 | 1,435,000 | 1,615,498 | |
| 5% 3/15/25 | 1,500,000 | 1,753,343 | |
| 5% 3/15/26 | 1,855,000 | 2,244,329 | |
| Texas Trans. Commission Series 2019 A, 0% 8/1/41 | 1,500,000 | 695,507 | |
| Texas Wtr. Dev. Board Rev.: | |||
| Series 2017 A, 5% 4/15/23 | 1,000,000 | 1,083,779 | |
| Series 2018 A, 5% 10/15/43 | 1,000,000 | 1,257,056 | |
| Series 2018 B, 5% 4/15/49 | 1,000,000 | 1,268,881 | |
| TOTAL TEXAS | 139,749,907 | ||
| Utah - 1.1% | |||
| Salt Lake City Arpt. Rev.: | |||
| Series 2017 B, 5% 7/1/47 | 4,000,000 | 4,893,105 | |
| Series 2018 B, 5% 7/1/48 | 1,000,000 | 1,243,080 | |
| Series 2021 B: | |||
| 5% 7/1/46 (c) | 2,465,000 | 3,217,062 | |
| 5% 7/1/51 (c) | 9,920,000 | 12,906,875 | |
| Utah Gen. Oblig. Series 2020, 5% 7/1/26 | 1,000,000 | 1,224,690 | |
| TOTAL UTAH | 23,484,812 | ||
| Vermont - 0.1% | |||
| Vermont Hsg. Fin. Agcy. Series A, 3.75% 11/1/50 | 1,765,000 | 1,965,399 | |
| Virginia - 1.4% | |||
| Norfolk Series 2019, 5% 8/1/27 | 2,150,000 | 2,716,842 | |
| Roanoke Econ. Dev. Auth. Edl. Facilities Series 2018 A, 5% 9/1/27 | 500,000 | 613,805 | |
| Salem Econ. Dev. Auth. Series 2020: | |||
| 4% 4/1/38 | 280,000 | 322,572 | |
| 4% 4/1/39 | 250,000 | 287,122 | |
| 4% 4/1/40 | 280,000 | 320,738 | |
| 4% 4/1/45 | 750,000 | 849,144 | |
| 5% 4/1/22 | 225,000 | 231,592 | |
| 5% 4/1/24 | 300,000 | 332,664 | |
| 5% 4/1/26 | 350,000 | 412,007 | |
| 5% 4/1/27 | 350,000 | 422,368 | |
| 5% 4/1/28 | 440,000 | 542,473 | |
| 5% 4/1/29 | 575,000 | 722,586 | |
| 5% 4/1/49 | 1,000,000 | 1,221,045 | |
| Virginia Gen. Oblig. Series 2018 A, 5% 6/1/27 | 1,975,000 | 2,491,562 | |
| Virginia Pub. Bldg. Auth. Pub. Facilities Rev. Series 2021 A1: | |||
| 5% 8/1/26 | 6,985,000 | 8,561,839 | |
| 5% 8/1/27 | 7,460,000 | 9,446,955 | |
| York County Econ. Dev. Auth. Poll. Cont. Rev. Bonds (Virginia Elec. and Pwr. Co. Proj.) Series 2009 A, 1.9%, tender 6/1/23 (a) | 300,000 | 307,465 | |
| TOTAL VIRGINIA | 29,802,779 | ||
| Washington - 3.0% | |||
| King County Hsg. Auth. Rev. Series 2019, 3% 11/1/22 | 1,140,000 | 1,178,765 | |
| Spokane Pub. Facilities District Hotel/Motel Tax & Sales/Use Tax Rev. Series 2017, 5% 12/1/38 | 1,175,000 | 1,360,059 | |
| Univ. of Washington Univ. Revs. Series 2020 A, 5% 4/1/50 | 3,250,000 | 4,177,595 | |
| Washington Fed. Hwy. Grant Anticipation Rev. (SR 520 Corridor Prog.) Series 2012 F, 5% 9/1/21 | 480,000 | 481,847 | |
| Washington Gen. Oblig.: | |||
| Series 2015 C, 5% 2/1/24 | 1,250,000 | 1,401,881 | |
| Series 2016 C, 5% 2/1/39 | 2,560,000 | 3,043,328 | |
| Series 2017 D, 5% 2/1/35 | 500,000 | 614,519 | |
| Series 2018 C, 5% 2/1/41 | 1,000,000 | 1,247,190 | |
| Series 2021 A, 5% 8/1/43 | 900,000 | 1,176,408 | |
| Series 2021 C, 5% 2/1/44 | 13,040,000 | 17,190,256 | |
| Washington Health Care Facilities Auth. Rev.: | |||
| (Overlake Hosp. Med. Ctr., WA. Proj.) Series 2017 B: | |||
| 5% 7/1/31 | 45,000 | 56,226 | |
| 5% 7/1/42 | 560,000 | 684,879 | |
| (Providence Health Systems Proj.) Series 2012 A, 5% 10/1/24 | 200,000 | 211,587 | |
| (Virginia Mason Med. Ctr. Proj.) Series 2017: | |||
| 5% 8/15/25 | 245,000 | 284,134 | |
| 5% 8/15/26 | 225,000 | 268,323 | |
| Series 2015, 5% 1/1/25 | 1,000,000 | 1,152,740 | |
| Series 2017 A, 4% 7/1/42 | 5,780,000 | 6,657,643 | |
| Series 2017: | |||
| 4% 8/15/42 | 7,000,000 | 7,722,252 | |
| 5% 8/15/36 | 500,000 | 594,074 | |
| Series 2020: | |||
| 5% 9/1/38 | 2,000,000 | 2,633,101 | |
| 5% 9/1/45 | 2,250,000 | 2,916,629 | |
| 5% 9/1/50 | 2,500,000 | 3,226,003 | |
| Washington Higher Ed. Facilities Auth. Rev. (Whitworth Univ. Proj.) Series 2016 A: | |||
| 5% 10/1/25 | 430,000 | 508,080 | |
| 5% 10/1/26 | 2,010,000 | 2,447,901 | |
| 5% 10/1/34 | 1,510,000 | 1,779,600 | |
| TOTAL WASHINGTON | 63,015,020 | ||
| Wisconsin - 1.5% | |||
| Pub. Fin. Auth. Edl. Facilities Series 2018 A: | |||
| 5.25% 10/1/43 | 530,000 | 623,080 | |
| 5.25% 10/1/48 | 530,000 | 620,474 | |
| Pub. Fin. Auth. Hosp. Rev. Series 2019 A, 5% 10/1/44 | 745,000 | 920,453 | |
| Roseman Univ. of Health: | |||
| Series 2020, 5% 4/1/50 (b) | 395,000 | 473,503 | |
| Series 2021 A, 4.5% 6/1/56 (c) | 3,540,000 | 3,540,000 | |
| Series 2021 B, 6.5% 6/1/56 (c) | 1,700,000 | 1,700,000 | |
| Wisconsin Gen. Oblig.: | |||
| Series 2014 4, 5% 5/1/25 | 1,240,000 | 1,432,248 | |
| Series 2021 A: | |||
| 5% 5/1/33 | 510,000 | 647,883 | |
| 5% 5/1/36 | 5,685,000 | 7,183,497 | |
| Wisconsin Health & Edl. Facilities: | |||
| Series 2018, 5% 4/1/34 | 2,000,000 | 2,542,974 | |
| Series 2019 A: | |||
| 2.25% 11/1/26 | 325,000 | 325,411 | |
| 5% 11/1/25 | 240,000 | 263,402 | |
| 5% 11/1/29 | 170,000 | 191,096 | |
| 5% 12/1/30 | 300,000 | 392,826 | |
| 5% 12/1/31 | 300,000 | 391,338 | |
| 5% 12/1/32 | 350,000 | 455,221 | |
| 5% 12/1/33 | 350,000 | 453,824 | |
| 5% 12/1/34 | 350,000 | 452,690 | |
| 5% 12/1/35 | 450,000 | 580,954 | |
| 5% 7/1/44 | 500,000 | 591,208 | |
| 5% 11/1/46 | 1,445,000 | 1,565,865 | |
| 5% 7/1/49 | 2,000,000 | 2,356,724 | |
| Series 2019 B, 5% 7/1/38 | 355,000 | 422,642 | |
| Series 2019 B1, 2.825% 11/1/28 | 365,000 | 365,756 | |
| Series 2019 B2, 2.55% 11/1/27 | 235,000 | 235,393 | |
| Series 2019: | |||
| 5% 10/1/24 | 270,000 | 307,922 | |
| 5% 10/1/26 | 550,000 | 668,888 | |
| Wisconsin Hsg. & Econ. Dev. Auth. Series 2021 A, 3% 3/1/52 | 925,000 | 1,021,673 | |
| Wisconsin St Gen. Fund Annual Appropriation Series 2019 A, 5% 5/1/29 | 500,000 | 623,479 | |
| TOTAL WISCONSIN | 31,350,424 | ||
| Wyoming - 0.2% | |||
| Wyoming Cmnty. Dev. Auth. Hsg. Rev. Series 2019 3, 3.75% 12/1/49 | 3,175,000 | 3,424,477 | |
| TOTAL MUNICIPAL BONDS | |||
| (Cost $1,877,012,877) | 1,984,628,666 | ||
| Municipal Notes - 0.1% | |||
| New York - 0.1% | |||
| New York Metropolitan Trans. Auth. Rev. BAN Series 2018 C, 5% 9/1/21 | |||
| (Cost $3,006,458) | 3,000,000 | 3,011,210 | |
| Shares | Value | ||
| Money Market Funds - 7.9% | |||
| Fidelity Tax-Free Cash Central Fund 0.04% (d)(e) | |||
| (Cost $165,168,723) | 165,131,209 | 165,180,740 | |
| TOTAL INVESTMENT IN SECURITIES - 102.3% | |||
| (Cost $2,045,188,058) | 2,152,820,616 | ||
| NET OTHER ASSETS (LIABILITIES) - (2.3)% | (47,599,772) | ||
| NET ASSETS - 100% | $2,105,220,844 |
Security Type Abbreviations
BAN – BOND ANTICIPATION NOTE
Legend
(a) Coupon rates for floating and adjustable rate securities reflect the rates in effect at period end.
(b) Security exempt from registration under Rule 144A of the Securities Act of 1933. These securities may be resold in transactions exempt from registration, normally to qualified institutional buyers. At the end of the period, the value of these securities amounted to $7,326,172 or 0.3% of net assets.
(c) Security or a portion of the security purchased on a delayed delivery or when-issued basis.
(d) Information in this report regarding holdings by state and security types does not reflect the holdings of the Fidelity Tax-Free Cash Central Fund.
(e) Affiliated fund that is available only to investment companies and other accounts managed by Fidelity Investments. The rate quoted is the annualized seven-day yield of the fund at period end. A complete unaudited listing of the fund's holdings as of its most recent quarter end is available upon request. In addition, each Fidelity Central Fund's financial statements are available on the SEC's website or upon request.
Affiliated Central Funds
Information regarding fiscal year to date income earned by the Fund from investments in Fidelity Central Funds is as follows:
| Fund | Income earned |
| Fidelity Tax-Free Cash Central Fund | $37,586 |
| Total | $37,586 |
Amounts in the income column in the above table include any capital gain distributions from underlying funds, which are presented in the corresponding line-item in the Statement of Operations, if applicable.
Fiscal year to date information regarding the Fund's investments in Fidelity Central Funds, including the ownership percentage, is presented below.
| Fund | Value, beginning of period | Purchases | Sales Proceeds | Realized Gain/Loss | Change in Unrealized appreciation (depreciation) | Value, end of period | % ownership, end of period |
| Fidelity Tax-Free Cash Central Fund 0.04% | $128,530,960 | $261,898,009 | $225,261,000 | $719 | $12,052 | $165,180,740 | 14.0% |
| Total | $128,530,960 | $261,898,009 | $225,261,000 | $719 | $12,052 | $165,180,740 |
Investment Valuation
The following is a summary of the inputs used, as of July 31, 2021, involving the Fund's assets and liabilities carried at fair value. The inputs or methodology used for valuing securities may not be an indication of the risk associated with investing in those securities. For more information on valuation inputs, and their aggregation into the levels used below, please refer to the Investment Valuation section in the accompanying Notes to Financial Statements.
| Valuation Inputs at Reporting Date: | ||||
| Description | Total | Level 1 | Level 2 | Level 3 |
| Investments in Securities: | ||||
| Municipal Securities | $1,987,639,876 | $-- | $1,987,639,876 | $-- |
| Money Market Funds | 165,180,740 | 165,180,740 | -- | -- |
| Total Investments in Securities: | $2,152,820,616 | $165,180,740 | $1,987,639,876 | $-- |
Other Information
The distribution of municipal securities by revenue source, as a percentage of total Net Assets, is as follows (Unaudited):
| General Obligations | 27.3% |
| Transportation | 17.5% |
| Health Care | 16.1% |
| Education | 11.6% |
| Special Tax | 7.3% |
| Others* (Individually Less Than 5%) | 20.2% |
| 100.0% |
* Includes net other assets
See accompanying notes which are an integral part of the financial statements.
Financial Statements
Statement of Assets and Liabilities
| July 31, 2021 (Unaudited) | ||
| Assets | ||
| Investment in securities, at value — See accompanying schedule: Unaffiliated issuers (cost $1,880,019,335) | $1,987,639,876 | |
| Fidelity Central Funds (cost $165,168,723) | 165,180,740 | |
| Total Investment in Securities (cost $2,045,188,058) | $2,152,820,616 | |
| Cash | 109,987 | |
| Receivable for investments sold | 893 | |
| Receivable for fund shares sold | 1,174,912 | |
| Interest receivable | 18,178,177 | |
| Distributions receivable from Fidelity Central Funds | 4,737 | |
| Prepaid expenses | 1,584 | |
| Receivable from investment adviser for expense reductions | 187,353 | |
| Other receivables | 756 | |
| Total assets | 2,172,479,015 | |
| Liabilities | ||
| Payable for investments purchased on a delayed delivery basis | $63,010,461 | |
| Payable for fund shares redeemed | 558,665 | |
| Distributions payable | 3,027,199 | |
| Accrued management fee | 606,770 | |
| Other payables and accrued expenses | 55,076 | |
| Total liabilities | 67,258,171 | |
| Net Assets | $2,105,220,844 | |
| Net Assets consist of: | ||
| Paid in capital | $1,997,029,951 | |
| Total accumulated earnings (loss) | 108,190,893 | |
| Net Assets | $2,105,220,844 | |
| Net Asset Value, offering price and redemption price per share ($2,105,220,844 ÷ 190,194,336 shares) | $11.07 |
See accompanying notes which are an integral part of the financial statements.
Statement of Operations
| Six months ended July 31, 2021 (Unaudited) | ||
| Investment Income | ||
| Interest | $19,985,991 | |
| Income from Fidelity Central Funds | 37,586 | |
| Total income | 20,023,577 | |
| Expenses | ||
| Management fee | $3,425,874 | |
| Custodian fees and expenses | 10,126 | |
| Independent trustees' fees and expenses | 2,441 | |
| Registration fees | 51,130 | |
| Audit | 29,412 | |
| Legal | 2,533 | |
| Miscellaneous | 4,434 | |
| Total expenses before reductions | 3,525,950 | |
| Expense reductions | (1,086,779) | |
| Total expenses after reductions | 2,439,171 | |
| Net investment income (loss) | 17,584,406 | |
| Realized and Unrealized Gain (Loss) | ||
| Net realized gain (loss) on: | ||
| Investment securities: | ||
| Unaffiliated issuers | 1,811,197 | |
| Fidelity Central Funds | 719 | |
| Total net realized gain (loss) | 1,811,916 | |
| Change in net unrealized appreciation (depreciation) on: | ||
| Investment securities: | ||
| Unaffiliated issuers | 17,563,917 | |
| Fidelity Central Funds | 12,052 | |
| Total change in net unrealized appreciation (depreciation) | 17,575,969 | |
| Net gain (loss) | 19,387,885 | |
| Net increase (decrease) in net assets resulting from operations | $36,972,291 |
See accompanying notes which are an integral part of the financial statements.
Statement of Changes in Net Assets
| Six months ended July 31, 2021 (Unaudited) | Year ended January 31, 2021 | |
| Increase (Decrease) in Net Assets | ||
| Operations | ||
| Net investment income (loss) | $17,584,406 | $32,502,806 |
| Net realized gain (loss) | 1,811,916 | (1,228,392) |
| Change in net unrealized appreciation (depreciation) | 17,575,969 | 20,868,388 |
| Net increase (decrease) in net assets resulting from operations | 36,972,291 | 52,142,802 |
| Distributions to shareholders | (17,580,399) | (33,083,617) |
| Share transactions | ||
| Proceeds from sales of shares | 443,056,429 | 1,110,999,262 |
| Reinvestment of distributions | 101 | 223 |
| Cost of shares redeemed | (154,848,927) | (935,959,504) |
| Net increase (decrease) in net assets resulting from share transactions | 288,207,603 | 175,039,981 |
| Total increase (decrease) in net assets | 307,599,495 | 194,099,166 |
| Net Assets | ||
| Beginning of period | 1,797,621,349 | 1,603,522,183 |
| End of period | $2,105,220,844 | $1,797,621,349 |
| Other Information | ||
| Shares | ||
| Sold | 40,539,312 | 105,747,535 |
| Issued in reinvestment of distributions | 9 | 21 |
| Redeemed | (14,163,920) | (89,175,378) |
| Net increase (decrease) | 26,375,401 | 16,572,178 |
See accompanying notes which are an integral part of the financial statements.
Financial Highlights
Fidelity SAI Tax-Free Bond Fund
| Six months ended (Unaudited) July 31, | Years endedJanuary 31, | |||
| 2021 | 2021 | 2020 | 2019 A | |
| Selected Per–Share Data | ||||
| Net asset value, beginning of period | $10.97 | $10.89 | $10.19 | $10.00 |
| Income from Investment Operations | ||||
| Net investment income (loss)B | .097 | .215 | .241 | .081 |
| Net realized and unrealized gain (loss) | .101 | .085 | .735 | .176 |
| Total from investment operations | .198 | .300 | .976 | .257 |
| Distributions from net investment income | (.098) | (.216) | (.248) | (.067) |
| Distributions from net realized gain | – | (.004) | (.028) | – |
| Total distributions | (.098) | (.220) | (.276) | (.067) |
| Net asset value, end of period | $11.07 | $10.97 | $10.89 | $10.19 |
| Total ReturnC,D | 1.82% | 2.83% | 9.68% | 2.58% |
| Ratios to Average Net AssetsE,F | ||||
| Expenses before reductions | .36%G | .36% | .43% | .60%G,H |
| Expenses net of fee waivers, if any | .25%G | .25% | .25% | .25%G |
| Expenses net of all reductions | .25%G | .25% | .25% | .25%G |
| Net investment income (loss) | 1.80%G | 2.02% | 2.28% | 2.38%G |
| Supplemental Data | ||||
| Net assets, end of period (000 omitted) | $2,105,221 | $1,797,621 | $1,603,522 | $489,517 |
| Portfolio turnover rateI | 8%G | 32% | 12% | 2%J |
A For the period October 2, 2018 (commencement of operations) to January 31, 2019.
B Calculated based on average shares outstanding during the period.
C Total returns for periods of less than one year are not annualized.
D Total returns would have been lower if certain expenses had not been reduced during the applicable periods shown.
E Fees and expenses of any underlying mutual funds or exchange-traded funds (ETFs) are not included in the Fund's expense ratio. The Fund indirectly bears its proportionate share of these expenses. For additional expense information related to investments in Fidelity Central Funds, please refer to the "Investments in Fidelity Central Funds" note found in the Notes to Financial Statements section of the most recent Annual or Semi-Annual report.
F Expense ratios reflect operating expenses of the class. Expenses before reductions do not reflect amounts reimbursed, waived, or reduced through arrangements with the investment advisor, brokerage services, or other offset arrangements, if applicable, and do not represent the amount paid by the class during periods when reimbursements, waivers or reductions occur.
G Annualized
H Audit fees are not annualized.
I Amount does not include the portfolio activity of any underlying mutual funds or exchange-traded funds (ETFs).
J Amount not annualized.
See accompanying notes which are an integral part of the financial statements.
Notes to Financial Statements (Unaudited)
For the period ended July 31, 2021
1. Organization.
Fidelity SAI Tax-Free Bond Fund (the Fund) is a fund of Fidelity Salem Street Trust (the Trust) and is authorized to issue an unlimited number of shares. Shares are offered exclusively to certain clients of Fidelity Management & Research Company LLC (FMR) or its affiliates. The Trust is registered under the Investment Company Act of 1940, as amended (the 1940 Act), as an open-end management investment company organized as a Massachusetts business trust.
2. Investments in Fidelity Central Funds.
Funds may invest in Fidelity Central Funds, which are open-end investment companies generally available only to other investment companies and accounts managed by the investment adviser and its affiliates. The Schedule of Investments lists any Fidelity Central Funds held as an investment as of period end, but does not include the underlying holdings of each Fidelity Central Fund. An investing fund indirectly bears its proportionate share of the expenses of the underlying Fidelity Central Funds.
Based on its investment objective, each Fidelity Central Fund may invest or participate in various investment vehicles or strategies that are similar to those of the investing fund. These strategies are consistent with the investment objectives of the investing fund and may involve certain economic risks which may cause a decline in value of each of the Fidelity Central Funds and thus a decline in the value of the investing fund.
| Fidelity Central Fund | Investment Manager | Investment Objective | Investment Practices | Expense Ratio(a) |
| Fidelity Money Market Central Funds | Fidelity Management & Research Company LLC (FMR) | Each fund seeks to obtain a high level of current income consistent with the preservation of capital and liquidity. | Short-term Investments | Ranged from less than .005% to .01% |
(a) Expenses expressed as a percentage of average net assets and are as of each underlying Central Fund's most recent annual or semi-annual shareholder report.
A complete unaudited list of holdings for each Fidelity Central Fund is available upon request or at the Securities and Exchange Commission website at www.sec.gov. In addition, the financial statements of the Fidelity Central Funds which contain the significant accounting policies (including investment valuation policies) of those funds, and are not covered by the Report of Independent Registered Public Accounting Firm, are available on the Securities and Exchange Commission website or upon request.
3. Significant Accounting Policies.
The Fund is an investment company and applies the accounting and reporting guidance of the Financial Accounting Standards Board (FASB) Accounting Standards Codification Topic 946 Financial Services - Investment Companies. The financial statements have been prepared in conformity with accounting principles generally accepted in the United States of America (GAAP), which require management to make certain estimates and assumptions at the date of the financial statements. Actual results could differ from those estimates. Subsequent events, if any, through the date that the financial statements were issued have been evaluated in the preparation of the financial statements. The Fund's Schedule of Investments lists any underlying mutual funds or exchange-traded funds (ETFs) but does not include the underlying holdings of these funds. The following summarizes the significant accounting policies of the Fund:
Investment Valuation. Investments are valued as of 4:00 p.m. Eastern time on the last calendar day of the period. The Board of Trustees (the Board) has delegated the day to day responsibility for the valuation of the Fund's investments to the Fair Value Committee (the Committee) established by the Fund's investment adviser. In accordance with valuation policies and procedures approved by the Board, the Fund attempts to obtain prices from one or more third party pricing vendors or brokers to value its investments. When current market prices, quotations or currency exchange rates are not readily available or reliable, investments will be fair valued in good faith by the Committee, in accordance with procedures adopted by the Board. Factors used in determining fair value vary by investment type and may include market or investment specific events, changes in interest rates and credit quality. The frequency with which these procedures are used cannot be predicted and they may be utilized to a significant extent. The Committee oversees the Fund's valuation policies and procedures and reports to the Board on the Committee's activities and fair value determinations. The Board monitors the appropriateness of the procedures used in valuing the Fund's investments and ratifies the fair value determinations of the Committee.
The Fund categorizes the inputs to valuation techniques used to value its investments into a disclosure hierarchy consisting of three levels as shown below:
- Level 1 – quoted prices in active markets for identical investments
- Level 2 – other significant observable inputs (including quoted prices for similar investments, interest rates, prepayment speeds, etc.)
- Level 3 – unobservable inputs (including the Fund's own assumptions based on the best information available)
Valuation techniques used to value the Fund's investments by major category are as follows:
Debt securities, including restricted securities, are valued based on evaluated prices received from third party pricing vendors or from brokers who make markets in such securities. Municipal securities are valued by pricing vendors who utilize matrix pricing which considers yield or price of bonds of comparable quality, coupon, maturity and type or by broker-supplied prices. When independent prices are unavailable or unreliable, debt securities may be valued utilizing pricing methodologies which consider similar factors that would be used by third party pricing vendors. Debt securities are generally categorized as Level 2 in the hierarchy but may be Level 3 depending on the circumstances.
Investments in open-end mutual funds, including the Fidelity Central Funds, are valued at their closing net asset value (NAV) each business day and are categorized as Level 1 in the hierarchy.
Changes in valuation techniques may result in transfers in or out of an assigned level within the disclosure hierarchy. The aggregate value of investments by input level as of July 31, 2021 is included at the end of the Fund's Schedule of Investments.
Investment Transactions and Income. For financial reporting purposes, the Fund's investment holdings and NAV include trades executed through the end of the last business day of the period. The NAV per share for processing shareholder transactions is calculated as of the close of business of the New York Stock Exchange (NYSE), normally 4:00 p.m. Eastern time and includes trades executed through the end of the prior business day. Gains and losses on securities sold are determined on the basis of identified cost. Income and capital gain distributions from Fidelity Central Funds, if any, are recorded on the ex-dividend date. Interest income is accrued as earned and includes coupon interest and amortization of premium and accretion of discount on debt securities as applicable. Debt obligations may be placed on non-accrual status and related interest income may be reduced by ceasing current accruals and writing off interest receivables when the collection of all or a portion of interest has become doubtful based on consistently applied procedures. A debt obligation is removed from non-accrual status when the issuer resumes interest payments or when collectability of interest is reasonably assured.
Expenses. Expenses directly attributable to a fund are charged to that fund. Expenses attributable to more than one fund are allocated among the respective funds on the basis of relative net assets or other appropriate methods. Expenses included in the accompanying financial statements reflect the expenses of that fund and do not include any expenses associated with any underlying mutual funds or exchange-traded funds. Although not included in a fund's expenses, a fund indirectly bears its proportionate share of these expenses through the net asset value of each underlying mutual fund or exchange-traded fund. Expense estimates are accrued in the period to which they relate and adjustments are made when actual amounts are known.
Income Tax Information and Distributions to Shareholders. Each year, the Fund intends to qualify as a regulated investment company under Subchapter M of the Internal Revenue Code, including distributing substantially all of its taxable income and realized gains. As a result, no provision for U.S. Federal income taxes is required. The Fund files a U.S. federal tax return, in addition to state and local tax returns as required. The Fund's federal income tax returns are subject to examination by the Internal Revenue Service (IRS) for a period of three fiscal years after they are filed. State and local tax returns may be subject to examination for an additional fiscal year depending on the jurisdiction.
Distributions are declared and recorded daily and paid monthly from net investment income. Distributions from realized gains, if any, are declared and recorded on the ex-dividend date. Income and capital gain distributions are determined in accordance with income tax regulations, which may differ from GAAP.
Capital accounts within the financial statements are adjusted for permanent book-tax differences. These adjustments have no impact on net assets or the results of operations. Capital accounts are not adjusted for temporary book-tax differences which will reverse in a subsequent period.
Book-tax differences are primarily due to market discount and capital loss carryforwards.
As of period end, the cost and unrealized appreciation (depreciation) in securities, and derivatives if applicable, for federal income tax purposes were as follows:
| Gross unrealized appreciation | $107,997,038 |
| Gross unrealized depreciation | (345,781) |
| Net unrealized appreciation (depreciation) | $107,651,257 |
| Tax cost | $2,045,169,359 |
Capital loss carryforwards are only available to offset future capital gains of the Fund to the extent provided by regulations and may be limited. The capital loss carryforward information presented below, including any applicable limitation, is estimated as of prior fiscal period end and is subject to adjustment.
| No expiration | |
| Short-term | $(1,223,163) |
Delayed Delivery Transactions and When-Issued Securities. During the period, certain Funds transacted in securities on a delayed delivery or when-issued basis. Payment and delivery may take place after the customary settlement period for that security. The price of the underlying securities and the date when the securities will be delivered and paid for are fixed at the time the transaction is negotiated. Securities purchased on a delayed delivery or when-issued basis are identified as such in the Schedule of Investments. Compensation for interest forgone in the purchase of a delayed delivery or when-issued debt security may be received. With respect to purchase commitments, each applicable Fund identifies securities as segregated in its records with a value at least equal to the amount of the commitment. Payables and receivables associated with the purchases and sales of delayed delivery securities having the same coupon, settlement date and broker are offset. Delayed delivery or when-issued securities that have been purchased from and sold to different brokers are reflected as both payables and receivables in the Statement of Assets and Liabilities under the caption "Delayed delivery", as applicable. Losses may arise due to changes in the value of the underlying securities or if the counterparty does not perform under the contract's terms, or if the issuer does not issue the securities due to political, economic, or other factors.
Restricted Securities (including Private Placements). Funds may invest in securities that are subject to legal or contractual restrictions on resale. These securities generally may be resold in transactions exempt from registration or to the public if the securities are registered. Disposal of these securities may involve time-consuming negotiations and expense, and prompt sale at an acceptable price may be difficult. Information regarding restricted securities held at period end is included at the end of the Schedule of Investments, if applicable.
4. Purchases and Sales of Investments.
Purchases and sales of securities, other than short-term securities and in-kind transactions, as applicable, are noted in the table below.
| Purchases ($) | Sales ($) | |
| Fidelity SAI Tax-Free Bond Fund | 374,445,178 | 73,858,470 |
5. Fees and Other Transactions with Affiliates.
Management Fee. Fidelity Management & Research Company LLC (the investment adviser) and its affiliates provide the Fund with investment management related services for which the Fund pays a monthly management fee. The management fee is the sum of an individual fund fee rate that is based on an annual rate of .25% of the Fund's average net assets and an annualized group fee rate that averaged .10% during the period. The group fee rate is based upon the monthly average net assets of a group of registered investment companies with which the investment adviser has management contracts. The group fee rate decreases as assets under management increase and increases as assets under management decrease. For the reporting period, the total annualized management fee rate was .35% of the Fund's average net assets.
Interfund Trades. Funds may purchase from or sell securities to other Fidelity Funds under procedures adopted by the Board. The procedures have been designed to ensure these interfund trades are executed in accordance with Rule 17a-7 of the 1940 Act. Any interfund trades are included within the respective purchases and sales amounts shown in the Purchases and Sales of Investments note.
6. Committed Line of Credit.
Certain Funds participate with other funds managed by the investment adviser or an affiliate in a $4.25 billion credit facility (the "line of credit") to be utilized for temporary or emergency purposes to fund shareholder redemptions or for other short-term liquidity purposes. The participating funds have agreed to pay commitment fees on their pro-rata portion of the line of credit, which are reflected in Miscellaneous expenses on the Statement of Operations, and are listed below. During the period, there were no borrowings on this line of credit.
| Amount | |
| Fidelity SAI Tax-Free Bond Fund | $1,735 |
7. Expense Reductions.
The investment adviser contractually agreed to reimburse the Fund to the extent annual operating expenses exceeded .25% of average net assets. This reimbursement will remain in place through May 31, 2022. Some expenses, for example the compensation of the independent Trustees, and certain miscellaneous expenses such as proxy and shareholder meeting expenses, are excluded from this reimbursement. During the period this reimbursement reduced the Fund's expenses by $1,077,892.
Through arrangements with the Fund's custodian, credits realized as a result of certain uninvested cash balances were used to reduce the Fund's expenses by $538.
In addition, during the period the investment adviser or an affiliate reimbursed and/or waived a portion of operating expenses in the amount of $8,349.
8. Other.
Fund's organizational documents provide former and current trustees and officers with a limited indemnification against liabilities arising in connection with the performance of their duties to the fund. In the normal course of business, the fund may also enter into contracts that provide general indemnifications. The fund's maximum exposure under these arrangements is unknown as this would be dependent on future claims that may be made against the fund. The risk of material loss from such claims is considered remote.
9. Coronavirus (COVID-19) Pandemic.
An outbreak of COVID-19 first detected in China during December 2019 has since spread globally and was declared a pandemic by the World Health Organization during March 2020. Developments that disrupt global economies and financial markets, such as the COVID-19 pandemic, may magnify factors that affect the Fund's performance.
Shareholder Expense Example
As a shareholder, you incur two types of costs: (1) transaction costs, which may include sales charges (loads) on purchase payments or redemption proceeds, as applicable and (2) ongoing costs, which generally include management fees, distribution and/or service (12b-1) fees and other Fund expenses. This Example is intended to help you understand your ongoing costs (in dollars) of investing in a fund and to compare these costs with the ongoing costs of investing in other mutual funds.
The Example is based on an investment of $1,000 invested at the beginning of the period and held for the entire period (February 1, 2021 to July 31, 2021).
Actual Expenses
The first line of the accompanying table provides information about actual account values and actual expenses. You may use the information in this line, together with the amount you invested, to estimate the expenses that you paid over the period. Simply divide your account value by $1,000.00 (for example, an $8,600 account value divided by $1,000.00 = 8.6), then multiply the result by the number in the first line for a class/Fund under the heading entitled "Expenses Paid During Period" to estimate the expenses you paid on your account during this period. If any fund is a shareholder of any underlying mutual funds or exchange-traded funds (ETFs) (the Underlying Funds), such fund indirectly bears its proportional share of the expenses of the Underlying Funds in addition to the direct expenses incurred presented in the table. These fees and expenses are not included in the annualized expense ratio used to calculate the expense estimate in the table below.
Hypothetical Example for Comparison Purposes
The second line of the accompanying table provides information about hypothetical account values and hypothetical expenses based on the actual expense ratio and an assumed rate of return of 5% per year before expenses, which is not the actual return. The hypothetical account values and expenses may not be used to estimate the actual ending account balance or expenses you paid for the period. You may use this information to compare the ongoing costs of investing in the Fund and other funds. To do so, compare this 5% hypothetical example with the 5% hypothetical examples that appear in the shareholder reports of the other funds. If any fund is a shareholder of any Underlying Funds, such fund indirectly bears its proportional share of the expenses of the Underlying Funds in addition to the direct expenses as presented in the table. These fees and expenses are not included in the annualized expense ratio used to calculate the expense estimate in the table below.
Please note that the expenses shown in the table are meant to highlight your ongoing costs only and do not reflect any transaction costs. Therefore, the second line of the table is useful in comparing ongoing costs only, and will not help you determine the relative total costs of owning different funds.
| Annualized Expense Ratio-A | Beginning Account Value February 1, 2021 | Ending Account Value July 31, 2021 | Expenses Paid During Period-B February 1, 2021 to July 31, 2021 |
|
| Fidelity SAI Tax-Free Bond Fund | .25% | |||
| Actual | $1,000.00 | $1,018.20 | $1.25 | |
| Hypothetical-C | $1,000.00 | $1,023.55 | $1.25 |
A Annualized expense ratio reflects expenses net of applicable fee waivers.
B Expenses are equal to the annualized expense ratio, multiplied by the average account value over the period, multiplied by 181/ 365 (to reflect the one-half year period). The fees and expenses of any Underlying Funds are not included in each annualized expense ratio.
C 5% return per year before expenses
Liquidity Risk Management Program
The Securities and Exchange Commission adopted Rule 22e-4 under the Investment Company Act of 1940 (the Liquidity Rule) to promote effective liquidity risk management throughout the open-end investment company industry, thereby reducing the risk that funds will be unable to meet their redemption obligations and mitigating dilution of the interests of fund shareholders.
The Fund has adopted and implemented a liquidity risk management program pursuant to the Liquidity Rule (the Program) effective December 1, 2018. The Program is reasonably designed to assess and manage the Fund’s liquidity risk and to comply with the requirements of the Liquidity Rule. The Fund’s Board of Trustees (the Board) has designated the Fund’s investment adviser as administrator of the Program. The Fidelity advisers have established a Liquidity Risk Management Committee (the LRM Committee) to manage the Program for each of the Fidelity Funds. The LRM Committee monitors the adequacy and effectiveness of implementation of the Program and on a periodic basis assesses each Fund’s liquidity risk based on a variety of factors including (1) the Fund’s investment strategy, (2) portfolio liquidity and cash flow projections during normal and reasonably foreseeable stressed conditions, (3) shareholder redemptions, (4) borrowings and other funding sources and (5) in the case of exchange-traded funds, certain additional factors including the effect of the Fund’s prices and spreads, market participants, and basket compositions on the overall liquidity of the Fund’s portfolio, as applicable.
In accordance with the Program, each of the Fund’s portfolio investments is classified into one of four liquidity categories described below based on a determination of a reasonable expectation for how long it would take to convert the investment to cash (or sell or dispose of the investment) without significantly changing its market value.
- Highly liquid investments – cash or convertible to cash within three business days or less
- Moderately liquid investments – convertible to cash in three to seven calendar days
- Less liquid investments – can be sold or disposed of, but not settled, within seven calendar days
- Illiquid investments – cannot be sold or disposed of within seven calendar days
Liquidity classification determinations take into account a variety of factors including various market, trading and investment-specific considerations, as well as market depth, and generally utilize analysis from a third-party liquidity metrics service.
The Liquidity Rule places a 15% limit on a fund’s illiquid investments and requires funds that do not primarily hold assets that are highly liquid investments to determine and maintain a minimum percentage of the fund’s net assets to be invested in highly liquid investments (highly liquid investment minimum or HLIM). The Program includes provisions reasonably designed to comply with the 15% limit on illiquid investments and for determining, periodically reviewing and complying with the HLIM requirement as applicable.
At a recent meeting of the Fund’s Board of Trustees, the LRM Committee provided a written report to the Board pertaining to the operation, adequacy, and effectiveness of implementation of the Program for the annual period from December 1, 2019 through November 30, 2020. The report concluded that the Program has been implemented and is operating effectively and is reasonably designed to assess and manage the Fund’s liquidity risk.
![]()
STF-SANN-0921
1.9887621.102
Item 2.
Code of Ethics
Not applicable.
Item 3.
Audit Committee Financial Expert
Not applicable.
Item 4.
Principal Accountant Fees and Services
Not applicable.
Item 5.
Audit Committee of Listed Registrants
Not applicable.
Item 6.
Investments
(a)
Not applicable.
(b)
Not applicable
Item 7.
Disclosure of Proxy Voting Policies and Procedures for Closed-End Management Investment Companies
Not applicable.
Item 8.
Portfolio Managers of Closed-End Management Investment Companies
Not applicable.
Item 9.
Purchase of Equity Securities by Closed-End Management Investment Company and Affiliated Purchasers
Not applicable.
Item 10.
Submission of Matters to a Vote of Security Holders
There were no material changes to the procedures by which shareholders may recommend nominees to the Fidelity Salem Street Trust’s Board of Trustees.
Item 11.
Controls and Procedures
(a)(i) The President and Treasurer and the Chief Financial Officer have concluded that the Fidelity Salem Street Trust’s (the “Trust”) disclosure controls and procedures (as defined in Rule 30a-3(c) under the Investment Company Act) provide reasonable
assurances that material information relating to the Trust is made known to them by the appropriate persons, based on their evaluation of these controls and procedures as of a date within 90 days of the filing date of this report.
(a)(ii) There was no change in the Trust’s internal control over financial reporting (as defined in Rule 30a-3(d) under the Investment Company Act) that occurred during the period covered by this report that has materially affected, or is reasonably likely to materially affect, the Trust’s internal control over financial reporting.
Item 12.
Disclosure of Securities Lending Activities for Closed-End Management
Investment Companies
Not applicable.
Item 13.
Exhibits
| (a) | (1) | Not applicable. |
| (a) | (2) | |
| (a) | (3) | Not applicable. |
| (b) | |
SIGNATURES
Pursuant to the requirements of the Securities Exchange Act of 1934 and the Investment Company Act of 1940, the registrant has duly caused this report to be signed on its behalf by the undersigned, thereunto duly authorized.
Fidelity Salem Street Trust
| By: | /s/Laura M. Del Prato |
| | Laura M. Del Prato |
| | President and Treasurer |
| | |
| Date: | September 21, 2021 |
Pursuant to the requirements of the Securities Exchange Act of 1934 and the Investment Company Act of 1940, this report has been signed below by the following persons on behalf of the registrant and in the capacities and on the dates indicated.
| By: | /s/Laura M. Del Prato |
| | Laura M. Del Prato |
| | President and Treasurer |
| | |
| Date: | September 21, 2021 |
| By: | /s/John J. Burke III |
| | John J. Burke III |
| | Chief Financial Officer |
| | |
| Date: | September 21, 2021 |
Exhibit EX-99.CERT
I, Laura M. Del Prato, certify that:
1.
I have reviewed this report on Form N-CSR of Fidelity Salem Street Trust;
2.
Based on my knowledge, this report does not contain any untrue statement of a material fact or omit to state a material fact necessary to make the statements made, in light of the circumstances under which such statements were made, not misleading with respect to the period covered by this report;
3.
Based on my knowledge, the financial statements, and other financial information included in this report, fairly present in all material respects the financial condition, results of operations, changes in net assets, and cash flows (if the financial statements are required to include a statement of cash flows) of the registrant as of, and for, the periods presented in this report;
4.
The registrant's other certifying officer(s) and I are responsible for establishing and maintaining disclosure controls and procedures (as defined in Rule 30a-3(c) under the Investment Company Act of 1940) and internal control over financial reporting (as defined in Rule 30a-3(d) under the Investment Company Act of 1940) for the registrant and have:
a.
Designed such disclosure controls and procedures, or caused such disclosure controls and procedures to be designed under our supervision, to ensure that material information relating to the registrant, including its consolidated subsidiaries, is made known to us by others within those entities, particularly during the period in which this report is being prepared;
b.
Designed such internal control over financial reporting, or caused such internal control over financial reporting to be designed under our supervision, to provide reasonable assurance regarding the reliability of financial reporting and the preparation of financial statements for external purposes in accordance with generally accepted accounting principles;
c.
Evaluated the effectiveness of the registrant's disclosure controls and procedures and presented in this report our conclusions about the effectiveness of the disclosure controls and procedures, as of a date within 90 days prior to the filing date of this report based upon such evaluation; and
d.
Disclosed in this report any change in the registrant’s internal control over financial reporting that occurred during the period covered by this report that has materially affected, or is reasonably likely to materially affect, the registrant’s internal control over financial reporting; and
5.
The registrant's other certifying officer(s) and I have disclosed to the registrant's auditors and the audit committee of the registrant's board of directors (or persons performing the equivalent functions):
a.
All significant deficiencies and material weaknesses in the design or operation of internal control over financial reporting which are reasonably likely to adversely affect the registrant's ability to record, process, summarize, and report financial information; and
b.
Any fraud, whether or not material, that involves management or other employees who have a significant role in the registrant's internal control over financial reporting.
Date:
September 21, 2021
/s/Laura M. Del Prato |
Laura M. Del Prato |
President and Treasurer |
I, John J. Burke III, certify that:
1.
I have reviewed this report on Form N-CSR of Fidelity Salem Street Trust;
2.
Based on my knowledge, this report does not contain any untrue statement of a material fact or omit to state a material fact necessary to make the statements made, in light of the circumstances under which such statements were made, not misleading with respect to the period covered by this report;
3.
Based on my knowledge, the financial statements, and other financial information included in this report, fairly present in all material respects the financial condition, results of operations, changes in net assets, and cash flows (if the financial statements are required to include a statement of cash flows) of the registrant as of, and for, the periods presented in this report;
4.
The registrant's other certifying officer(s) and I are responsible for establishing and maintaining disclosure controls and procedures (as defined in Rule 30a-3(c) under the Investment Company Act of 1940) and internal control over financial reporting (as defined in Rule 30a-3(d) under the Investment Company Act of 1940) for the registrant and have:
a.
Designed such disclosure controls and procedures, or caused such disclosure controls and procedures to be designed under our supervision, to ensure that material information relating to the registrant, including its consolidated subsidiaries, is made known to us by others within those entities, particularly during the period in which this report is being prepared;
b.
Designed such internal control over financial reporting, or caused such internal control over financial reporting to be designed under our supervision, to provide reasonable assurance regarding the reliability of financial reporting and the preparation of financial statements for external purposes in accordance with generally accepted accounting principles;
c.
Evaluated the effectiveness of the registrant's disclosure controls and procedures and presented in this report our conclusions about the effectiveness of the disclosure controls and procedures, as of a date within 90 days prior to the filing date of this report based upon such evaluation; and
d.
Disclosed in this report any change in the registrant’s internal control over financial reporting that occurred during the period covered by this report that has materially affected, or is reasonably likely to materially affect, the registrant’s internal control over financial reporting; and
5.
The registrant's other certifying officer(s) and I have disclosed to the registrant's auditors and the audit committee of the registrant's board of directors (or persons performing the equivalent functions):
a.
All significant deficiencies and material weaknesses in the design or operation of internal control over financial reporting which are reasonably likely to adversely affect the registrant's ability to record, process, summarize, and report financial information; and
b.
Any fraud, whether or not material, that involves management or other employees who have a significant role in the registrant's internal control over financial reporting.
Date:
September 21, 2021
/s/John J. Burke III |
John J. Burke III |
Chief Financial Officer |
Exhibit EX-99.906CERT
Certification Pursuant to Section 906 of the Sarbanes-Oxley Act of 2002 (subsections (a) and (b) of section 1350, chapter 63 of title 18, United States Code)
In connection with the attached Report of Fidelity Salem Street Trust (the “Trust”) on Form N-CSR to be filed with the Securities and Exchange Commission (the “Report”), each of the undersigned officers of the Trust does hereby certify that, to the best of such officer’s knowledge:
1.
The Report fully complies with the requirements of 13(a) or 15(d) of the Securities Exchange Act of 1934; and
2.
The information contained in the Report fairly presents, in all material respects, the financial condition and results of operations of the Trust as of, and for, the periods presented in the Report.
Dated: September 21, 2021
/s/Laura M. Del Prato |
Laura M. Del Prato |
President and Treasurer |
Dated: September 21, 2021
/s/John J. Burke III |
John J. Burke III |
Chief Financial Officer |
A signed original of this written statement required by Section 906, or other document authenticating, acknowledging, or otherwise adopting the signature that appears in typed form within the electronic version of this written statement required by Section 906, has been provided to the Trust and will be retained by the Trust and furnished to the Securities and Exchange Commission or its staff upon request.
Serious News for Serious Traders! Try StreetInsider.com Premium Free!
You May Also Be Interested In
- Hormel Foods Announces Retirement of Jeff Grev, Vice President of Legislative Affairs
- Dimensional Fund Advisors Ltd. : Form 8.3 - DS SMITH PLC - Ordinary Shares
- The Baby Gifting Company Achieves B Corp Certification
Create E-mail Alert Related Categories
SEC FilingsSign up for StreetInsider Free!
Receive full access to all new and archived articles, unlimited portfolio tracking, e-mail alerts, custom newswires and RSS feeds - and more!
