

Form N-CSRS DEUTSCHE DWS TAX FREE For: Nov 30
 Tweet
Tweet Share
ShareUNITED STATES
SECURITIES AND EXCHANGE COMMISSION
WASHINGTON, D. C. 20549
FORM N-CSRS
Investment Company Act file number: 811-03632
Deutsche DWS Tax Free Trust
(Exact Name of Registrant as Specified in Charter)
875 Third Avenue
New York, NY 10022-6225
(Address of Principal Executive Offices) (Zip Code)
Registrant’s Telephone Number, including Area Code: (212) 454-4500
Diane Kenneally
100 Summer Street
Boston, MA 02110
(Name and Address of Agent for Service)
| Date of fiscal year end: | 5/31 |
| Date of reporting period: | 11/30/2022 |
| ITEM 1. | REPORT TO STOCKHOLDERS |
| (a) | |


Contents
| 4 |
|
| 5 |
|
| 9 |
|
| 10 |
|
| 11 |
|
| 29 |
|
| 31 |
|
| 32 |
|
| 33 |
|
| 37 |
|
| 47 |
|
| 49 |
|
| 53 |
NOT FDIC/NCUA INSURED NO BANK GUARANTEE MAY LOSE VALUE
NOT A DEPOSIT NOT INSURED BY ANY FEDERAL GOVERNMENT AGENCY
| 2 |
| |
DWS Intermediate Tax-Free Fund |
| DWS
Intermediate Tax-Free Fund |
| |
3 |


| 4 |
| |
DWS Intermediate Tax-Free Fund |
| Class A |
6-Month‡ |
1-Year |
5-Year |
10-Year |
| Average Annual Total Returns as of 11/30/22 | ||||
| Unadjusted for Sales Charge |
–1.10% |
–7.78% |
0.98% |
1.15% |
| Adjusted for the Maximum Sales Charge (max 2.75% load) |
–3.82% |
–10.32% |
0.42% |
0.87% |
| Bloomberg Municipal Bond 1-15 Year Blend (1-17) Index†
|
–0.40% |
–6.25% |
1.51% |
1.80% |
| Average Annual Total Returns as of 9/30/22 (most recent calendar quarter end)
| ||||
| Unadjusted for Sales Charge |
|
–10.23% |
0.22% |
1.02% |
| Adjusted for the Maximum Sales Charge (max 2.75% load) |
|
–12.70% |
–0.34% |
0.74% |
| Bloomberg Municipal Bond 1-15 Year Blend (1-17) Index†
|
|
–8.87% |
0.76% |
1.64% |
| Class C |
6-Month‡ |
1-Year |
5-Year |
10-Year |
| Average Annual Total Returns as of 11/30/22 | ||||
| Unadjusted for Sales Charge |
–1.47% |
–8.47% |
0.24% |
0.40% |
| Adjusted for the Maximum Sales Charge (max 1.00% CDSC) |
–2.45% |
–8.47% |
0.24% |
0.40% |
| Bloomberg Municipal Bond 1-15 Year Blend (1-17) Index†
|
–0.40% |
–6.25% |
1.51% |
1.80% |
| Average Annual Total Returns as of 9/30/22 (most recent calendar quarter end)
| ||||
| Unadjusted for Sales Charge |
|
–10.90% |
–0.53% |
0.27% |
| Adjusted for the Maximum Sales Charge (max 1.00% CDSC) |
|
–10.90% |
–0.53% |
0.27% |
| Bloomberg Municipal Bond 1-15 Year Blend (1-17) Index†
|
|
–8.87% |
0.76% |
1.64% |
| Class S |
6-Month‡ |
1-Year |
5-Year |
10-Year |
| Average Annual Total Returns as of 11/30/22 | ||||
| No Sales Charges |
–0.97% |
–7.55% |
1.23% |
1.39% |
| Bloomberg Municipal Bond 1-15 Year Blend (1-17) Index†
|
–0.40% |
–6.25% |
1.51% |
1.80% |
| Average Annual Total Returns as of 9/30/22 (most recent calendar quarter end)
| ||||
| No Sales Charges |
|
–10.00% |
0.47% |
1.26% |
| Bloomberg Municipal Bond 1-15 Year Blend (1-17) Index†
|
|
–8.87% |
0.76% |
1.64% |
| DWS
Intermediate Tax-Free Fund |
| |
5 |
| Institutional Class |
6-Month‡ |
1-Year |
5-Year |
10-Year |
| Average Annual Total Returns as of 11/30/22 | ||||
| No Sales Charges |
–0.97% |
–7.55% |
1.23% |
1.41% |
| Bloomberg Municipal Bond 1-15 Year Blend (1-17) Index†
|
–0.40% |
–6.25% |
1.51% |
1.80% |
| Average Annual Total Returns as of 9/30/22 (most recent calendar quarter end)
| ||||
| No Sales Charges |
|
–10.00% |
0.47% |
1.28% |
| Bloomberg Municipal Bond 1-15 Year Blend (1-17) Index†
|
|
–8.87% |
0.76% |
1.64% |
| 6 |
| |
DWS Intermediate Tax-Free Fund |
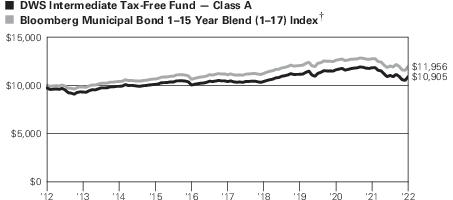 Yearly periods ended November 30
| † |
Bloomberg Municipal Bond 1–15 Year Blend (1–17) Index is a sub-index of the Bloomberg
Municipal Bond Index. It is a rules-based market value-weighted index of bonds with
maturities of one year to 17 years designed for the tax-exempt bond market. |
| ‡ |
Total returns shown for periods less than one year are not annualized. |
| DWS
Intermediate Tax-Free Fund |
| |
7 |
| |
Class A |
Class C |
Class S |
Institutional Class |
| Net Asset Value | ||||
| 11/30/22 |
$10.75 |
$10.75 |
$10.75 |
$10.75 |
| 5/31/22 |
$11.00 |
$11.00 |
$11.00 |
$11.00 |
| Distribution Information as of 11/30/22 | ||||
| Income Dividends, Six Months |
$.13 |
$.09 |
$.14 |
$.14 |
| November Income Dividend |
$.0231 |
$.0165 |
$.0253 |
$.0253 |
| SEC 30-day Yield‡‡ |
2.93% |
2.27% |
3.26% |
3.25% |
| Tax Equivalent Yield‡‡ |
4.95% |
3.83% |
5.51% |
5.49% |
| Current Annualized Distribution Rate‡‡ |
2.61% |
1.87% |
2.86% |
2.86% |
| ‡‡
|
The SEC yield is net investment income per share earned over the month ended November 30, 2022, shown as an annualized percentage of the maximum offering price per share on the last day of the period. The SEC yield is computed in accordance with a standardized method prescribed by the Securities and Exchange Commission. The SEC yields would have been 2.88%, 2.20%, 3.10% and 3.19% for Class A, Class C, Class S and Institutional Class shares, respectively, had certain expenses not been reduced. Tax equivalent yield is based on the Fund’s yield and a marginal income tax rate of 40.8%. Current annualized distribution rate is the latest monthly dividend shown as an annualized percentage of net asset value on November 30, 2022. Distribution rate simply measures the level of dividends and is not a complete measure of performance. The current annualized distribution rates would have been 2.56%, 1.80%, 2.70% and 2.80% for Class A, Class C, Class S and Institutional Class shares, respectively, had certain expenses not been reduced. Yields and distribution rates are historical, not guaranteed and will fluctuate. |
| 8 |
| |
DWS Intermediate Tax-Free Fund |
| DWS
Intermediate Tax-Free Fund |
| |
9 |
| Asset Allocation (As a % of Investment Portfolio excluding Open-End Investment Companies) |
11/30/22 |
5/31/22 |
| Revenue Bonds |
77% |
71% |
| General Obligation Bonds |
13% |
14% |
| Lease Obligations |
8% |
10% |
| Escrow to Maturity/Prerefunded Bonds |
2% |
3% |
| Other |
0% |
0% |
| Variable Rate Demand Notes |
0% |
2% |
| Variable Rate Demand Preferred Shares |
— |
0% |
| |
100% |
100% |
| Interest Rate Sensitivity |
11/30/22 |
5/31/22 |
| Effective Maturity |
5.9 years |
5.3 years |
| Modified Duration |
4.8 years |
4.5 years |
| Quality (As a % of Investment Portfolio excluding Open-End Investment Companies) |
11/30/22 |
5/31/22 |
| AAA |
10% |
11% |
| AA |
43% |
41% |
| A |
29% |
31% |
| BBB |
12% |
10% |
| BB |
2% |
2% |
| B |
— |
0% |
| Not Rated |
4% |
5% |
| |
100% |
100% |
| Top Five State Allocations (As a % of Investment Portfolio excluding Open-End Investment Companies) |
11/30/22 |
5/31/22 |
| New York |
12% |
12% |
| California |
11% |
12% |
| Georgia |
8% |
8% |
| Pennsylvania |
7% |
7% |
| Texas |
7% |
9% |
| 10 |
| |
DWS Intermediate Tax-Free Fund |
| |
Principal
Amount ($) |
Value ($) | |
| Municipal Investments 99.2% |
| ||
| Alabama 1.8% |
| ||
| Alabama, Black Belt Energy Gas District Gas Project Revenue: |
|
|
|
| Series D-1, 4.0%, Mandatory Put 6/1/2027 @ 100, 7/1/2052, LIQ: Royal Bank of Canada |
|
1,335,000 |
1,340,704 |
| Series B-1, 4.0%, Mandatory Put 10/1/2027 @ 100, 4/1/2053 |
|
2,615,000 |
2,565,840 |
| Jackson, Black Belt Energy Gas District Gas Project Revenue, 4.0%, Mandatory Put 12/1/2026 @ 100, 10/1/2052 |
|
7,000,000 |
6,932,352 |
| Southeast Energy Authority, Energy Authority A Cooperative District, Series B-1, 5.0%, Mandatory Put 8/1/2028 @ 100, 5/1/2053 |
|
3,635,000 |
3,732,662
|
| |
|
|
14,571,558 |
| Arizona 2.6% |
| ||
| Arizona, Industrial Development Authority, Authority Hospital Revenue Bond, Phoenix Childrens Hospital: |
|
|
|
| Series A, 5.0%, 2/1/2030 |
|
600,000 |
675,860 |
| Series A, 5.0%, 2/1/2031 |
|
1,200,000 |
1,368,975 |
| Arizona, Salt River Project Agricultural Improvement and Power District, Electric System Revenue: |
|
|
|
| Series A, 5.0%, 1/1/2028 |
|
1,160,000 |
1,290,901 |
| Series A, 5.0%, 1/1/2029 |
|
1,605,000 |
1,817,484 |
| Arizona, State Industrial Development Authority Revenue, “A” , Series 2019-2, 3.625%, 5/20/2033 |
|
4,728,760 |
4,554,462 |
| Arizona, State Industrial Development Authority, Education Revenue, Odyssey Preparatory Academy Project, 144A, 4.375%, 7/1/2039 |
|
1,500,000 |
1,288,570 |
| Chandler, AZ, Industrial Development Authority, AMT, 5.0%, Mandatory Put 6/3/2024 @ 100, 6/1/2049 |
|
7,235,000 |
7,341,804 |
| Maricopa County, AZ, Industrial Development Authority, Education Revenue, Legency Traditional School Project, Series B, 144A, 5.0%, 7/1/2039 |
|
1,000,000 |
966,060 |
| Yavapai County, AZ, Industrial Development Authority, Solid Waste Disposal Revenue, Waste Management, Inc. Project, Series A-2, AMT, 2.2%, Mandatory Put 6/3/2024 @ 100, 3/1/2028 |
|
1,750,000 |
1,695,340
|
| |
|
|
20,999,456 |
| DWS
Intermediate Tax-Free Fund |
| |
11 |
| |
Principal
Amount ($) |
Value ($) | |
| California 11.2% |
| ||
| Anaheim, CA, Housing & Public Improvements Authority, Electric Utility Distribution System: |
|
|
|
| Series E, 5.0%, 10/1/2028 |
|
1,000,000 |
1,106,550 |
| Series E, 5.0%, 10/1/2029 |
|
1,000,000 |
1,106,366 |
| California, Bay Area Water Supply & Conservation Agency, Capital Cost Recovery Preparation: |
|
|
|
| Series A, 5.0%, 10/1/2029 (a) |
|
1,250,000 |
1,410,447 |
| Series A, 5.0%, 10/1/2030 (a) |
|
1,285,000 |
1,470,832 |
| California, Bay Area Toll Authority, Toll Bridge Revenue: |
|
|
|
| Series D, MUNIPSA + 0.30%, 2.2% (b), Mandatory Put 4/1/2027 @ 100, 4/1/2056 |
|
3,000,000 |
2,926,572 |
| Series C, MUNIPSA + 0.45%, 2.35% (b), Mandatory Put 4/1/2026 @ 100, 4/1/2056 |
|
1,000,000 |
987,868 |
| California, Federal Home Loan Mortgage Corp., Multi-Family Variable Rate Certificates: |
|
|
|
| Series M-049, 3.05%, 4/15/2034 |
|
2,260,000 |
1,952,972 |
| Series M-050, 144A, AMT, 3.05%, 6/15/2037 |
|
6,870,000 |
5,920,641 |
| “A", Series ML-05, 3.35%, 11/25/2033, GTY: Freddie Mac |
|
585,291 |
549,012 |
| California, Golden State Tobacco Securitization Corp., Tobacco Settlement, Series A-1, Prerefunded 6/1/2028 @ 100, 5.0%, 6/1/2032 |
|
5,000,000 |
5,630,074 |
| California, Infrastructure & Economic Development Bank, California Academy of Science, Series A, MUNIPSA + 0.35%, 2.25% (b), Mandatory Put 8/1/2024 @ 100, 8/1/2047 |
|
1,430,000 |
1,408,999 |
| California, Metropolitan Water District of Southern California, Series E, MUNIPSA + 0.14%, 2.04% (b), Mandatory Put 5/21/2024 @100, 7/1/2037 |
|
2,120,000 |
2,103,198 |
| California, Municiple District Water & Waste Water Revenue, Series B, MUNIPSA + 0.1%, 2.0% (b), Mandatory Put 7/1/2024 @ 100, 7/1/2046 |
|
3,910,000 |
3,881,137 |
| California, Public Finance Authority Revenue, Enso VIillage Project, Series A, 144A, 5.0%, 11/15/2036 |
|
1,000,000 |
910,761 |
| California, State General Obligation, Various Purposes, 5.0%, 4/1/2036 |
|
7,000,000 |
7,739,996 |
| California, State Housing Finance Agency, Multi-Family Green Tax-Exempt Mortgage Backed Bonds, Noble Towers Apartment, Series N, 2.35%, 12/1/2035 |
|
9,530,767 |
8,379,616 |
| California, State Pollution Control Finance Authority, Solid Waste Disposal Revenue, Waste Management Project, Series A, AMT, 2.5%, Mandatory Put 5/1/2024 @ 100, 11/1/2038 |
|
5,500,000 |
5,372,103 |
| California, State Public Works Board Lease Revenue, A Various Captial Projects, Series C, 5.0%, 8/1/2029 |
|
2,400,000 |
2,744,390 |
| 12 |
| |
DWS Intermediate Tax-Free Fund |
| |
Principal
Amount ($) |
Value ($) | |
| California, State Public Works Board, Lease Revenue, Series A, 5.0%, 8/1/2033 |
|
3,500,000 |
4,120,558 |
| Los Angeles County, CA, Los Angeles County Public Works Financing Authority, Lease Revenue, Series G, 5.0%, 12/1/2031 |
|
1,500,000 |
1,787,695 |
| Los Angeles, CA, Department of Airports Revenue, Los Angeles International Airport: |
|
|
|
| AMT, 5.5%, 5/15/2036 |
|
1,820,000 |
2,046,857 |
| AMT, 5.5%, 5/15/2037 |
|
4,985,000 |
5,577,706 |
| San Francisco, CA, City & County Airports Commission, International Airport Revenue, Series A, AMT, 5.0%, 5/1/2035 |
|
7,000,000 |
7,394,521 |
| Santa Barbara County, CA, Solid Waste System Revenue, Certificates of Participation: |
|
|
|
| Series B, AMT, 5.0%, 12/1/2034 |
|
5,000,000 |
5,412,572 |
| Series B, AMT, 5.0%, 12/1/2035 |
|
5,000,000 |
5,392,236 |
| Turlock, CA, Irrigation District Revenue, 5.0%, 1/1/2033 |
|
2,620,000 |
2,971,501
|
| |
|
|
90,305,180 |
| Colorado 2.1% |
| ||
| Colorado, General Obligation, Vauxmont Metropolitan District, 3.25%, 12/15/2050, INS: AGMC |
|
1,643,000 |
1,357,940 |
| Colorado, State Housing & Finance Authority, Series H, 4.25%, 11/1/2049 |
|
1,675,000 |
1,688,013 |
| Denver City & County, CO, Airport Revenue, Series D, AMT, 5.75%, 11/15/2037 |
|
1,375,000 |
1,560,940 |
| Denver City & County, CO, Airport Revenue System, Series A, AMT, 5.0%, 12/1/2035 |
|
10,000,000 |
10,459,723 |
| Denver, CO, Convention Center Hotel Authority Revenue: |
|
|
|
| 5.0%, 12/1/2027 |
|
500,000 |
514,543 |
| 5.0%, 12/1/2033 |
|
500,000 |
507,136 |
| 5.0%, 12/1/2034 |
|
1,000,000 |
1,009,569
|
| |
|
|
17,097,864 |
| Connecticut 1.7% |
| ||
| Connecticut, State General Obligation, Series B, 3.0%, 6/1/2037 |
|
1,075,000 |
945,237 |
| Connecticut, State Housing Finance Program Authority Revenue, Series A-1, 4.0%, 11/15/2047 |
|
1,765,000 |
1,766,722 |
| Connecticut, State Special Tax Obligation Revenue, Transportation Infrastructure Purpose: |
|
|
|
| Series A, 5.0%, 10/1/2027 |
|
8,000,000 |
8,149,787 |
| Seies C, 5.0%, 1/1/2030 |
|
1,000,000 |
1,140,915 |
| Series A, 5.0%, 7/1/2038 |
|
1,565,000 |
1,765,705
|
| |
|
|
13,768,366 |
| DWS
Intermediate Tax-Free Fund |
| |
13 |
| |
Principal
Amount ($) |
Value ($) | |
| Delaware 0.3% |
| ||
| Delaware, Delaware River & Bay Authority Revenue, 5.0%, 1/1/2031 |
|
2,000,000 |
2,313,812 |
| Florida 5.3% |
| ||
| Broward County, FL, Airport Revenue System, Series A, AMT, 5.0%, 10/1/2037 |
|
2,365,000 |
2,478,686 |
| Escambia County, FL, Housing Finance Authority Single Family Mortgage Revenue, County Program, Series A, 4.75%, 4/1/2050 |
|
2,355,000 |
2,396,078 |
| Florida, Capital Project Finance Authority, Student Housing Revenue, Series A-1, 5.0%, 10/1/2029 |
|
1,650,000 |
1,683,360 |
| Florida, Capital Trust Agency, Educational Growth Fund, Charter Educational Foundation Project, Seies A-1, 144A, 3.375%, 7/1/2031 |
|
2,100,000 |
1,846,698 |
| Florida, Development Finance Corp., Educational Facilities Revenue, Mater Academy Projects: |
|
|
|
| 144A, 5.0%, 11/15/2030 |
|
1,000,000 |
917,856 |
| Series A, 5.0%, 6/15/2035 |
|
1,000,000 |
1,022,612 |
| Florida, Development Finance Corp., Brightline Florida Passenger Rail Expansion Project, Series A, 144A, AMT, 7.25%, Mandatory Put 10/3/2023 @ 104, 7/1/2057 |
|
1,000,000 |
993,813 |
| Florida, Development Finance Corp., Surface Transportation Facilities Revenue, Virgin Trains USA Passenger Rail Project: |
|
|
|
| Series A, 144A, AMT, 6.375%, Mandatory Put 1/1/2026 @ 100, 1/1/2049 |
|
2,000,000 |
1,827,281 |
| Series A, 144A, AMT, 6.5%, Mandatory Put 1/1/2029 @ 100, 1/1/2049 |
|
1,685,000 |
1,517,027 |
| Florida, Reedy Creek Improvement District, Series A, 4.0%, 6/1/2032 |
|
1,500,000 |
1,564,829 |
| Florida, State Department of Transportation, Florida Right-of-Way Acquisition & Bridge Construction, Series A, 4.0%, 7/1/2034 |
|
5,000,000 |
5,197,949 |
| Florida, Tohopekaliga Water Utility System Revenue, 4.0%, 10/1/2032 |
|
2,145,000 |
2,250,692 |
| Jacksonville, FL, Special Revenue, Series C, 5.25%, 10/1/2036 |
|
5,000,000 |
5,668,316 |
| Lake County, FL, Educational Facilities Revenue, Imagine South Lake Charter School Project, Series A, 144A, 5.0%, 1/15/2029 |
|
680,000 |
687,530 |
| Lee County, FL, School Board Certificates of Participation, Series A, 5.0%, 8/1/2027 |
|
4,360,000 |
4,500,703 |
| 14 |
| |
DWS Intermediate Tax-Free Fund |
| |
Principal
Amount ($) |
Value ($) | |
| Miami-Dade County, FL, School Board, Certificates of Participation, Series D, 5.0%, 2/1/2029 |
|
7,000,000 |
7,395,754 |
| Village, FL, Community Development District No. 13, Special Assessment Revenue, 3.0%, 5/1/2029 |
|
965,000 |
843,211 |
| |
|
|
42,792,395 |
| Georgia 7.9% |
| ||
| Atlanta, GA, Water & Wastewater Revenue, Series B, 5.25%, 11/1/2027, INS: AGMC |
|
10,000,000 |
10,903,162 |
| Burke County, GA, Development Authority, Pollution Control Revenue, Georgia Power Co., Plant Vogtle Project, 2.25%, Mandatory Put 5/25/2023 @ 100, 10/1/2032 |
|
1,000,000 |
992,482 |
| Burke County, GA, Development Authority, Pollution Control Revenue, Oglethorpe Power Corp., Series E, 3.25%, Mandatory Put 2/3/2025 @ 100, 11/1/2045 |
|
8,800,000 |
8,693,893 |
| Cobb County, GA, Kennestone Hospital Authority, Wellstar Health System, Inc. Project: |
|
|
|
| Series B, 4.0%, 4/1/2032 |
|
200,000 |
203,571 |
| Series B, 4.0%, 4/1/2033 |
|
200,000 |
202,937 |
| Series B, 4.0%, 4/1/2034 |
|
250,000 |
253,139 |
| Series B, 4.0%, 4/1/2035 |
|
225,000 |
226,434 |
| Series B, 4.0%, 4/1/2036 |
|
250,000 |
250,548 |
| DeKalb County, GA, Water & Sewer Revenue, Series A, 5.25%, 10/1/2029 |
|
10,300,000 |
10,320,116 |
| Georgia, George L Smith II World Congress Center Authority, Convention Center Hotel Second Tier Revenue, Series B, 144A, 5.0%, 1/1/2036 |
|
1,250,000 |
1,169,892 |
| Georgia, Main Street Natural Gas, Inc., Gas Project Revenue, Series A, 5.5%, 9/15/2024, GTY: Merrill Lynch & Co. |
|
1,705,000 |
1,759,860 |
| Georgia, Main Street Natural Gas, Inc., Gas Supply Revenue: |
|
|
|
| Series C, 4.0%, Mandatory Put 12/1/2023 @ 100, 8/1/2048, LIQ: Royal Bank of Canada |
|
8,250,000 |
8,280,748 |
| Series B, 4.0%, Mandatory Put 12/2/2024 @ 100, 8/1/2049, GTY: TD Bank NA |
|
5,000,000 |
5,033,373 |
| Series A, 4.0%, Mandatory Put 12/1/2029 @ 100, 9/1/2052 |
|
10,000,000 |
9,717,019 |
| Series A, 5.0%, 5/15/2035, GTY: Macquarie Group Ltd. |
|
3,135,000 |
3,247,528 |
| Monroe County, GA, Development Authority, Pollution Control Revenue, Georgia Power Co. Plant Scherer Project, Series 1st, 2.25%, 7/1/2025 |
|
2,295,000 |
2,181,038
|
| |
|
|
63,435,740 |
| DWS
Intermediate Tax-Free Fund |
| |
15 |
| |
Principal
Amount ($) |
Value ($) | |
| Hawaii 0.6% |
| ||
| Hawaii, State General Obligation, Series FK, 4.0%, 5/1/2032 |
|
4,400,000 |
4,569,503 |
| Illinois 6.2% |
| ||
| Chicago, IL, Board of Education, Series B, 4.0%, 12/1/2038 |
|
5,000,000 |
4,456,112 |
| Chicago, IL, O’Hare International Airport Revenue: |
|
|
|
| AMT, 5.0%, 1/1/2035 |
|
715,000 |
762,216 |
| AMT, 5.0%, 1/1/2036 |
|
500,000 |
530,263 |
| Chicago, IL, O’Hare International Airport Revenue, Senior Lien, Series A, AMT, 5.0%, 1/1/2036 |
|
2,500,000 |
2,607,452 |
| Chicago, IL, Waterworks Revenue: |
|
|
|
| Series 2017-2, 5.0%, 11/1/2023 |
|
650,000 |
662,498 |
| Series 2017-2, 5.0%, 11/1/2024 |
|
1,000,000 |
1,036,053 |
| Illinois, Regional Transportation Authority, Series A, 5.5%, 7/1/2024, INS: NATL |
|
5,000,000 |
5,211,024 |
| Illinois, State Finance Authority Revenue, Series A, 5.0%, 10/1/2032 |
|
1,000,000 |
1,163,744 |
| Illinois, State General Obligation: |
|
|
|
| 5.0%, 8/1/2023 |
|
7,150,000 |
7,227,357 |
| 5.0%, 11/1/2024 |
|
5,325,000 |
5,466,131 |
| 5.0%, 3/1/2031 |
|
2,500,000 |
2,659,828 |
| Series B, 5.25%, 10/1/2037 |
|
2,000,000 |
2,118,848 |
| 5.5%, 5/1/2024 |
|
500,000 |
513,893 |
| 5.5%, 5/1/2025 |
|
1,500,000 |
1,561,843 |
| Series C, 5.5%, 10/1/2039 |
|
2,000,000 |
2,139,977 |
| Illinois, State Municipal Electric Agency, Power Supply Revenue, Series A, 5.0%, 2/1/2028 |
|
6,500,000 |
6,837,847 |
| Illinois, State Toll Highway Authority Revenue, Series A, 5.0%, 1/1/2028 |
|
1,250,000 |
1,252,148 |
| Springfield, IL, Electric Revenue, Senior Lien, 5.0%, 3/1/2029 |
|
3,500,000 |
3,631,939
|
| |
|
|
49,839,173 |
| Indiana 1.0% |
| ||
| Indiana, Finance Authority Revenue, Deaconess Health System, Series B, MUNIPSA + 0.3%, 2.2% (b), Mandatory Put 3/1/2027 @ 100, 3/1/2039 |
|
2,450,000 |
2,387,774 |
| Indiana, Rockport Pollution Control Revenue, Michigan Power Co. Project, Series A, 3.05%, 6/1/2025 |
|
3,700,000 |
3,712,306 |
| Indiana, State Finance Authority Revenue, BHI Senior Living Obligated Group, 5.0%, 11/15/2033 |
|
2,000,000 |
2,001,986
|
| |
|
|
8,102,066 |
| 16 |
| |
DWS Intermediate Tax-Free Fund |
| |
Principal
Amount ($) |
Value ($) | |
| Iowa 0.5% |
| ||
| Iowa, State Student Loan Liquidity Corp., Senior Revenue, Series B, AMT, 3.0%, 12/1/2039 |
|
455,000 |
427,997 |
| Iowa, Tobacco Settlement Authority Revenue, Series B-1, 4.0%, 6/1/2049 |
|
3,410,000 |
3,391,230
|
| |
|
|
3,819,227 |
| Louisiana 0.2% |
| ||
| New Orleans, LA, Aviation Board Special Facility Revenue, Parking Facilities Corp., Consol Garage System, Series A, 5.0%, 10/1/2035, INS: AGMC |
|
1,250,000 |
1,336,167 |
| Maryland 1.7% |
| ||
| Maryland, General Obligation, 5.0%, 6/1/2029 |
|
10,000,000 |
11,410,218 |
| Maryland, State General Obligation, Series D, 4.0%, 8/1/2029 |
|
1,250,000 |
1,350,270 |
| Maryland, State of Maryland Department of Transportation, Series 2022B, 5.0%, 12/1/2029 |
|
1,000,000 |
1,148,392
|
| |
|
|
13,908,880 |
| Massachusetts 1.9% |
| ||
| Massachusetts, State Development Finance Agency Revenue, CareGroup Obligated Group: |
|
|
|
| Series J-2, 5.0%, 7/1/2033 |
|
1,000,000 |
1,069,884 |
| Series J-2, 5.0%, 7/1/2034 |
|
2,000,000 |
2,130,073 |
| Massachusetts, State Development Finance Agency Revenue, Northeastern University, 5.0%, 10/1/2037 |
|
1,250,000 |
1,391,267 |
| Massachusetts, State Educational Financing Authority, Series B, AMT, 3.0%, 7/1/2035 |
|
450,000 |
449,978 |
| Massachusetts, State Educational Financing Authority, Educational Loan Revenue Bonds, Issue M, Series B, AMT, 2.0%, 7/1/2037 |
|
545,000 |
448,194 |
| Massachusetts, State Port Authority: |
|
|
|
| Series A, AMT, 5.0%, 7/1/2035 |
|
5,000,000 |
5,332,298 |
| Series A, AMT, 5.0%, 7/1/2036 |
|
4,000,000 |
4,251,204
|
| |
|
|
15,072,898 |
| Michigan 2.2% |
| ||
| Michigan, State Finance Authority Revenue, Henry Ford Health System, 5.0%, 11/15/2031 |
|
10,700,000 |
11,209,351 |
| Michigan, State Strategic Fund Ltd., Obligation Revenue, Graphic International LLC, Coated Recycled Board Machine Project, AMT, 4.0%, Mandatory Put 10/1/2026 @ 100, 10/1/2061 |
|
265,000 |
256,299 |
| Michigan, State Strategic Fund Ltd., Obligation Revenue, Improvement Project: |
|
|
|
| Series I-75, AMT, 5.0%, 6/30/2032 |
|
1,320,000 |
1,349,184 |
| DWS
Intermediate Tax-Free Fund |
| |
17 |
| |
Principal
Amount ($) |
Value ($) | |
| Series I-75, AMT, 5.0%, 12/31/2032 |
|
700,000 |
715,397 |
| Series I-75, AMT, 5.0%, 12/31/2033 |
|
1,600,000 |
1,631,504 |
| Michigan, Trunk Line Revenue, Rebuilding Michigan Program, Series A, 4.0%, 11/15/2036 |
|
2,500,000 |
2,576,726
|
| |
|
|
17,738,461 |
| Minnesota 0.2% |
| ||
| Minnesota, State Office of Higher Education Revenue, AMT, 2.65%, 11/1/2038 |
|
2,290,000 |
1,873,905 |
| Mississippi 1.1% |
| ||
| Mississippi, State Gaming Tax Revenue: |
|
|
|
| Series E, 5.0%, 10/15/2028 |
|
4,755,000 |
4,990,869 |
| Series A, 5.0%, 10/15/2036 |
|
4,000,000 |
4,282,085
|
| |
|
|
9,272,954 |
| Missouri 0.7% |
| ||
| Missouri, Higher Education Loan Authority Revenue, Taxable Student Loan Asset Back Notes, Series 2021-1, 1.53%, 1/25/2061 |
|
5,977,336 |
5,163,229 |
| Missouri, Plaza At Noah’s Ark Community Improvement District, 3.0%, 5/1/2030 |
|
725,000 |
640,207 |
| |
|
|
5,803,436 |
| Montana 0.5% |
| ||
| Montana, Montana Facility Finance Authority, Billings Clinic Obligated Group: |
|
|
|
| Series A, 5.0%, 8/15/2029 |
|
1,200,000 |
1,337,926 |
| Series A, 5.0%, 8/15/2030 |
|
1,275,000 |
1,440,882 |
| Series A, 5.0%, 8/15/2031 |
|
1,000,000 |
1,137,951
|
| |
|
|
3,916,759 |
| Nebraska 1.0% |
| ||
| Nebraska, Public Power District Revenue: |
|
|
|
| Series A, 5.0%, 1/1/2035 |
|
1,410,000 |
1,574,481 |
| Series A, 5.0%, 1/1/2037 |
|
2,750,000 |
3,041,612 |
| Series A, 5.0%, 1/1/2038 |
|
3,000,000 |
3,300,891
|
| |
|
|
7,916,984 |
| Nevada 0.5% |
| ||
| Clark County, NV, General Obligation, 4.0%, 12/1/2035 |
|
3,000,000 |
3,074,499 |
| Sparks, NV, Tourism Improvement District #1 Revenue, Sales Tax, Series A, 144A, 2.75%, 6/15/2028 |
|
1,500,000 |
1,330,416
|
| |
|
|
4,404,915 |
| 18 |
| |
DWS Intermediate Tax-Free Fund |
| |
Principal
Amount ($) |
Value ($) | |
| New Hampshire 0.8% |
| ||
| New Hampshire, Business Finance Authority Revenue: |
|
|
|
| Series 2022-2, 4.0%, 10/20/2036 |
|
2,994,003 |
2,760,987 |
| 4.375%, 9/20/2036 |
|
3,979,443 |
3,811,413
|
| |
|
|
6,572,400 |
| New Jersey 3.3% |
| ||
| New Jersey, State Covid-19 General Obligation Emergency Bonds: |
|
|
|
| Series A, 4.0%, 6/1/2030 |
|
1,035,000 |
1,091,023 |
| Series A, 4.0%, 6/1/2031 |
|
1,530,000 |
1,621,640 |
| New Jersey, State Economic Development Authority Revenue, White Horse HMT Urban Renewal LLC Project, 144A, 5.0%, 1/1/2040 |
|
1,505,000 |
1,141,124 |
| New Jersey, State Economic Development Authority, Motor Vehicle Surcharge Revenue, Series A, 3.125%, 7/1/2029 |
|
915,000 |
897,289 |
| New Jersey, State Higher Education Assistance Authority, Student Loan Revenue: |
|
|
|
| Series B, AMT, 2.5%, 12/1/2040 |
|
830,000 |
676,027 |
| Series B, AMT, 3.25%, 12/1/2039 |
|
1,500,000 |
1,351,835 |
| Series B, AMT, 3.5%, 12/1/2039 |
|
2,000,000 |
1,936,791 |
| Series B, AMT, 4.0%, 12/1/2041 |
|
5,000,000 |
4,905,930 |
| New Jersey, State Transportation Trust Fund Authority Revenue, Federal Highway Reimbursement Notes, Series A, 5.0%, 6/15/2029 |
|
970,000 |
1,022,428 |
| New Jersey, State Transportation Trust Fund Authority, Transportation Systems: |
|
|
|
| Series A, 5.0%, 6/15/2033 |
|
2,500,000 |
2,779,765 |
| Series A, 5.0%, 6/15/2034 |
|
1,700,000 |
1,864,129 |
| 5.0%, 6/15/2036 |
|
2,000,000 |
2,126,982 |
| 5.0%, 6/15/2038 (a) |
|
2,000,000 |
2,117,935 |
| New Jersey, Tobacco Settlement Financing Corp., Series A, 5.0%, 6/1/2030 |
|
3,000,000 |
3,130,719
|
| |
|
|
26,663,617 |
| New Mexico 0.3% |
| ||
| New Mexico, State Mortgage Finance Authority, Series C, 4.0%, 1/1/2050 |
|
2,575,000 |
2,577,005 |
| New York 12.0% |
| ||
| Broome County, NY, Local Development Corp., Revenue, United Health Services Hospitals, Inc., Project: |
|
|
|
| 3.0%, 4/1/2035, INS: AGMC |
|
1,820,000 |
1,558,252 |
| 3.0%, 4/1/2036, INS: AGMC |
|
1,750,000 |
1,472,988 |
| DWS
Intermediate Tax-Free Fund |
| |
19 |
| |
Principal
Amount ($) |
Value ($) | |
| New York, Metropolitan Transportation Authority Revenue: |
|
|
|
| Series B, 5.0%, 11/15/2028 |
|
3,170,000 |
3,311,269 |
| Series C-1, 5.0%, 11/15/2028 |
|
1,200,000 |
1,246,327 |
| Series A-2, 5.0%, Mandatory Put 5/15/2030 @100, 11/15/2045 |
|
5,335,000 |
5,647,716 |
| New York, State Dormitory Authority Revenues, Non-State Supported Debt, North Shore-Long Island Jewish Obligated Group, Series A, 5.0%, 5/1/2028 |
|
8,820,000 |
9,136,114 |
| New York, State Liberty Development Corp. Revenue, A World Trade Center Project, Series A, 1.9%, 11/15/2031 |
|
800,000 |
639,649 |
| New York, State Liberty Development Corporation, Second Priority Liberty Revenue, “1” , 2.45%, 9/15/2069 |
|
5,000,000 |
4,586,566 |
| New York, State Thruway Authority, Series J, 5.0%, 1/1/2028 |
|
10,000,000 |
10,222,585 |
| New York, State Transportation Development Corp., Special Facility Revenue, Delta Air Lines, Inc., LaGuardia Airport Terminals C&D Redevelopment Project, AMT, 5.0%, 1/1/2026 |
|
3,970,000 |
4,023,317 |
| New York, State Transportation Development Corp., Special Facility Revenue, Terminal 4 John F. Kennedy International Airport Project, AMT, 5.0%, 12/1/2030 |
|
5,000,000 |
5,223,930 |
| New York, State Urban Development Corp., Personal Income Tax Revenue, Series C, 5.0%, 3/15/2036 |
|
5,000,000 |
5,531,349 |
| New York, Utility Debt Securitization Authority, Restructuring Revenue, Series TE, 5.0%, 12/15/2038 |
|
7,000,000 |
8,067,522 |
| New York City, NY, Municipal Water Finance Authority, Water & Sewer Systems Revenue, Series FF-2, 4.0%, 6/15/2036 |
|
3,000,000 |
3,050,805 |
| New York City, NY, Transitional Finance Authority Revenue, Future Tax Secured: |
|
|
|
| Series A, 4.0%, 11/1/2034 |
|
2,500,000 |
2,577,774 |
| Series B1, 5.0%, 11/1/2027 |
|
750,000 |
772,548 |
| Series B1, 5.0%, 11/1/2028 |
|
1,175,000 |
1,208,674 |
| Series B1, 5.0%, 11/1/2029 |
|
935,000 |
961,665 |
| New York City, NY, Transitional Finance Authority, Building Aid Revenue: |
|
|
|
| Series S-2, 5.0%, 7/15/2028 |
|
6,750,000 |
7,125,144 |
| Series S-3, 5.0%, 7/15/2035 |
|
5,000,000 |
5,390,097 |
| New York, NY, General Obligation: |
|
|
|
| Series B-3, 1.96% (c), 12/1/2022 |
|
450,000 |
450,000 |
| Series C, 4.0%, 8/1/2037 |
|
1,000,000 |
1,005,087 |
| Series D-1, 5.0%, 8/1/2029 |
|
8,620,000 |
8,742,138 |
| Troy, NY, Capital Resource Corp. Revenue, Rensselaer Polytechnic Institute: |
|
|
|
| Series A, 5.0%, 9/1/2030 |
|
1,345,000 |
1,479,946 |
| 20 |
| |
DWS Intermediate Tax-Free Fund |
| |
Principal
Amount ($) |
Value ($) | |
| Series A, 5.0%, 9/1/2031 |
|
2,020,000 |
2,197,528 |
| Series A, 5.0%, 9/1/2032 |
|
1,250,000 |
1,354,572
|
| |
|
|
96,983,562 |
| North Carolina 0.5% |
| ||
| North Carolina, State Turnpike Authority, Monroe Expressway System: |
|
|
|
| 5.0%, 7/1/2035 |
|
820,000 |
932,823 |
| 5.0%, 7/1/2036 |
|
1,000,000 |
1,132,669 |
| 5.0%, 7/1/2037 |
|
1,000,000 |
1,127,491 |
| 5.0%, 7/1/2038 |
|
500,000 |
561,850 |
| |
|
|
3,754,833 |
| North Dakota 0.4% |
| ||
| North Dakota, State Housing Finance Agency, Home Mortgage Program, Series B, MUNIPSA + 0.2%, 2.1% (b), Mandatory Put 7/1/2024 @100, 1/1/2043 |
|
3,075,000 |
3,075,000 |
| Ohio 2.9% |
| ||
| City of Akron, OH, City of Akron, Income Tax Revenue: |
|
|
|
| 4.0%, 12/1/2029 |
|
1,500,000 |
1,600,356 |
| 4.0%, 12/1/2030 |
|
1,210,000 |
1,285,999 |
| 4.0%, 12/1/2031 |
|
1,105,000 |
1,167,340 |
| Ohio, Air Quality Development Authority, Series A, AMT, 4.25%, Mandatory Put 6/1/2027 @ 100, 11/1/2039 |
|
1,000,000 |
996,039 |
| Ohio, Akron, Bath & Copley Joint Township Hospital District Revenue, Summa Health System, 4.0%, 11/15/2035 |
|
1,665,000 |
1,532,989 |
| Ohio, Higher Educational Facility Commission, University of Daytona: |
|
|
|
| Series B, 5.0%, 2/1/2029 |
|
1,100,000 |
1,201,522 |
| Series B, 5.0%, 2/1/2030 |
|
1,810,000 |
1,993,499 |
| Series B, 5.0%, 2/1/2031 |
|
2,420,000 |
2,683,194 |
| Ohio, Hospital Facility Revenue, Cleveland Clinic Health System Obligated Group, Series B, 5.0%, 1/1/2029 |
|
1,715,000 |
1,917,509 |
| Ohio, State Hospital Revenue, Aultman Health Foundation, 144A, 5.0%, 12/1/2028 |
|
5,000,000 |
4,959,604 |
| Ohio, State Turnpike Commission, Infrastructure Projects: |
|
|
|
| Series A, 5.0%, 2/15/2029 |
|
1,155,000 |
1,302,143 |
| Series A, 5.0%, 2/15/2030 |
|
1,155,000 |
1,325,044 |
| Series A-1, 5.25%, 2/15/2029 |
|
1,310,000 |
1,317,454
|
| |
|
|
23,282,692 |
| DWS
Intermediate Tax-Free Fund |
| |
21 |
| |
Principal
Amount ($) |
Value ($) | |
| Oregon 0.3% |
| ||
| Oregon, State Housing & Community Services Department, Mortgage Revenue, Series A, 4.5%, 1/1/2049 |
|
2,780,000 |
2,805,036 |
| Pennsylvania 7.3% |
| ||
| Allegheny County, PA, Hospital Development Authority, Allegheny Health Network Obligated Group, Series A, 5.0%, 4/1/2034 |
|
5,000,000 |
5,298,823 |
| Montgomery County, PA, Higher Education & Health Authority, State Presbyterian Homes, Inc. Project: |
|
|
|
| 5.0%, 12/1/2027 |
|
2,735,000 |
2,779,541 |
| 5.0%, 12/1/2032 |
|
2,745,000 |
2,771,560 |
| Montgomery County, PA, Industrial Development Authority, Meadowood Senior Living Project, Series A, 5.0%, 12/1/2033 |
|
8,435,000 |
8,527,819 |
| Pennsylvania, Higher Education Assistance Agency Education Loan Revenue: |
|
|
|
| Series A, AMT, 2.45%, 6/1/2041 |
|
4,240,000 |
3,506,708 |
| Series A, AMT, 2.625%, 6/1/2042 |
|
610,000 |
506,140 |
| Pennsylvania, State Certificates of Participation: |
|
|
|
| Series A, 5.0%, 7/1/2029 |
|
300,000 |
328,689 |
| Series A, 5.0%, 7/1/2031 |
|
850,000 |
933,362 |
| Pennsylvania, State Economic Development Financing Authority Revenue, UPMC Obligated Group, Series A, 5.0%, 2/1/2028 |
|
3,000,000 |
3,083,518 |
| Pennsylvania, State Economic Development Financing Authority, Solid Waste Disposal Revenue, Waste Management, Inc. Project, AMT, 2.15%, Mandatory Put 7/1/2024 @ 100, 7/1/2041, GTY: Waste Management, Inc. |
|
1,250,000 |
1,208,041 |
| Pennsylvania, State Housing Finance Agency, Single Family Mortgage Revenue: |
|
|
|
| Series 119, AMT, 3.5%, 10/1/2041 |
|
965,000 |
961,560 |
| Series 122, AMT, 4.0%, 10/1/2046 |
|
2,860,000 |
2,862,862 |
| Pennsylvania, State Turnpike Commission Revenue: |
|
|
|
| Series C, 5.0%, 12/1/2028 |
|
2,950,000 |
3,079,403 |
| Series B, 5.0%, 6/1/2029 |
|
5,000,000 |
5,298,098 |
| Series C, Prerefunded 12/1/2023 @ 100, 5.5%, 12/1/2026 |
|
2,120,000 |
2,181,466 |
| Series C, Prerefunded 12/1/2023 @ 100, 5.5%, 12/1/2027 |
|
2,820,000 |
2,901,761 |
| Series C, Prerefunded 12/1/2023 @ 100, 5.5%, 12/1/2028 |
|
1,000,000 |
1,028,993 |
| Philadelphia, PA, Authority for Industrial Development Charter School Revenue Bond, 144A, 5.0%, 6/15/2040 |
|
900,000 |
844,940 |
| 22 |
| |
DWS Intermediate Tax-Free Fund |
| |
Principal
Amount ($) |
Value ($) | |
| Philadelphia, PA, School District: |
|
|
|
| Series F, 5.0%, 9/1/2030 |
|
8,970,000 |
9,504,096 |
| Series F, Prerefunded 9/1/2026 @ 100, 5.0%, 9/1/2030 |
|
30,000 |
32,457 |
| Pittsburgh, PA, Water & Sewer System Revenue, First Lien, Series C, MUNIPSA + 0.65%, 2.55% (b), Mandatory Put 12/1/2023 @ 100, 9/1/2040, INS: AGMC |
|
1,000,000 |
999,006 |
| |
|
|
58,638,843 |
| Rhode Island 0.4% |
| ||
| New Jersey, Tobacco Settlement Financing Corp., Series B, 4.5%, 6/1/2045 |
|
3,000,000 |
2,979,010 |
| South Carolina 0.0% |
| ||
| South Carolina, State Housing Finance & Development Authority, Mortgage Revenue, Series A, 4.0%, 1/1/2050 |
|
280,000 |
280,146 |
| Tennessee 1.2% |
| ||
| Greeneville, TN, Health & Educational Facilities Board, Hospital Revenue, Ballad Health Obligation Group, Series A, 5.0%, 7/1/2035 |
|
2,500,000 |
2,591,360 |
| Memphis & Shelby County, TN, New Memphis Arena Public Building Authority, City of Memphis Project: |
|
|
|
| Step-up Coupon, 0% to 4/1/2026, 4.0% to 4/1/2029 |
|
1,100,000 |
976,861 |
| Step-up Coupon, 0% to 4/1/2026, 4.0% to 4/1/2030 |
|
750,000 |
664,424 |
| Metropolitan Nashville, TN, Airport Authority Revenue, Series B, AMT, 5.5%, 7/1/2038 (a) |
|
1,625,000 |
1,783,213 |
| Shelby County, TN, State General Obligation, Series B, 4.0%, 4/1/2034 |
|
3,330,000 |
3,481,168 |
| Tennessee, Housing Development Agency, Residential Financing Program Revenue, Series 1C, AMT, 3.0%, 7/1/2038 |
|
110,000 |
109,833 |
| |
|
|
9,606,859 |
| Texas 6.5% |
| ||
| Austin, TX, Water & Wastewater System Revenue, 5.0%, 11/15/2038 (a) |
|
3,500,000 |
3,971,223 |
| Central Texas, Regional Mobility Authority Revenue, Senior Lien, Series E, 4.0%, 1/1/2037 |
|
1,500,000 |
1,496,331 |
| City of Austin, Tx, City of Austin, Airport System Revenue, AMT, 5.0%, 11/15/2033 |
|
1,250,000 |
1,362,284 |
| Dallas, Fort Worth International Airport, Series B, 5.0%, 11/1/2037 |
|
1,200,000 |
1,335,539 |
| Houston, TX, Airport Revenue System, Series A, AMT, 4.0%, 7/1/2038 |
|
2,000,000 |
1,919,065 |
| Houston, TX, Hotel Occupancy Tax And Special Revenue, Convention And Entertainment Facilities Department: |
|
|
|
| 5.0%, 9/1/2027 |
|
1,590,000 |
1,724,537 |
| DWS
Intermediate Tax-Free Fund |
| |
23 |
| |
Principal
Amount ($) |
Value ($) | |
| 5.0%, 9/1/2028 |
|
1,350,000 |
1,477,752 |
| Houston, TX, Utility Systems Revenue, First Lien, Series A, 5.0%, 11/15/2033 |
|
1,525,000 |
1,727,589 |
| Lower Colorado, TX, Lower Colorado River Authority, 5.0%, 5/15/2032, INS: AGMC |
|
2,685,000 |
3,078,164 |
| North Texas, Tollway Authority Revenue, Series A, 5.25%, 1/1/2038 |
|
2,500,000 |
2,790,282 |
| Northside, TX, Independent School District, 1.6%, Mandatory Put 8/1/2024 @ 100, 8/1/2049 |
|
2,940,000 |
2,849,281 |
| San Antonio, TX, Water Systems Revenue, Junior Lien, Series E, 5.0%, 5/15/2027 |
|
1,900,000 |
1,919,941 |
| Texas, Aldine Independent School District, 4.0%, 2/15/2032 |
|
3,000,000 |
3,114,697 |
| Texas, New Hope Cultural Education Facilities Finance Corp., Education Revenue, Cumberland Academy Project, Series A, 144A, 5.0%, 8/15/2040 |
|
6,000,000 |
5,630,509 |
| Texas, State Department of Housing & Community Affairs, 2.17%, 5/1/2038 |
|
5,862,311 |
4,702,576 |
| Texas, State Municipal Gas Acquisition & Supply Corp. I, Gas Supply Revenue, Series D, 6.25%, 12/15/2026, GTY: Merrill Lynch & Co. |
|
5,755,000 |
6,014,289 |
| Texas, State Private Activity Bond, Surface Transportation Corp. Revenue, Senior Lien Revenue: |
|
|
|
| Series A, 4.0%, 12/31/2035 |
|
500,000 |
473,513 |
| Series A, 4.0%, 12/31/2036 |
|
2,000,000 |
1,877,836 |
| Texas, State Water Development Board, Series A, 4.0%, 10/15/2032 |
|
5,000,000 |
5,222,538
|
| |
|
|
52,687,946 |
| Utah 0.7% |
| ||
| Salt Lake City, UT, Airport Revenue, Series A, AMT, 5.0%, 7/1/2035 |
|
5,000,000 |
5,218,050 |
| Utah, State Telecommunication Open Infrastructure Agency Sales Tax and Telecommunications Revenue, 5.25%, 6/1/2037 (a) |
|
250,000 |
279,463 |
| |
|
|
5,497,513 |
| Virginia 4.4% |
| ||
| Hampton Roads, VA, Transportation Accountability Commission Revenue, Senior Lien Revenue: |
|
|
|
| Series A, 4.0%, 7/1/2036 |
|
2,070,000 |
2,102,569 |
| Series A, 4.0%, 7/1/2038 |
|
4,370,000 |
4,426,155 |
| Virginia, Small Business Financing Authority: |
|
|
|
| AMT, 4.0%, 1/1/2030 |
|
1,500,000 |
1,496,075 |
| AMT, 4.0%, 7/1/2030 |
|
1,000,000 |
996,914 |
| 24 |
| |
DWS Intermediate Tax-Free Fund |
| |
Principal
Amount ($) |
Value ($) | |
| Virginia, State College Building Authority, Educational Facilities Revenue, 21st Century College, Series B, 4.0%, 2/1/2029 |
|
18,755,000 |
19,500,348 |
| Virginia, State Public School Authority, School Financing, Series B, 4.0%, 8/1/2029 |
|
7,060,000 |
7,326,090
|
| |
|
|
35,848,151 |
| Washington 4.4% |
| ||
| King County, WA, Junior Lien Sewer Revenue, Series A, MUNIPSA + 0.23%, 2.13% (b), Mandatory Put 1/1/2027 @ 100, 1/1/2040 |
|
3,845,000 |
3,742,579 |
| Port of Seattle, WA: |
|
|
|
| AMT, 5.0%, 8/1/2036 |
|
3,570,000 |
3,817,485 |
| AMT, 5.0%, 8/1/2037 |
|
5,000,000 |
5,321,854 |
| Washington, Central Puget Sound Regional Transit Authority Sales & Use Taxes Revenue, Motor Vehicle Excise Tax Improvement, Green Bond, Series 2A, MUNIPSA + 0.2%, 2.1% (b), Mandatory Put 11/1/2026 @ 100, 11/1/2045 |
|
5,385,000 |
5,237,463 |
| Washington, Seattle Municipal Light & Power Revenue, Series B, MUNIPSA + 0.25%, 2.15% (b), Mandatory Put 11/1/2026 @ 100, 5/1/2045 |
|
895,000 |
874,406 |
| Washington, State Convention Center Public Facilities District: |
|
|
|
| Series B, 3.0%, 7/1/2036 |
|
5,185,000 |
4,159,059 |
| 4.0%, 7/1/2031 |
|
3,000,000 |
2,711,153 |
| Washington, State General Obligation: |
|
|
|
| Series R-2021A, 5.0%, 6/1/2030 |
|
1,000,000 |
1,155,420 |
| Series R-2021A, 5.0%, 6/1/2031 |
|
750,000 |
862,327 |
| Series R-2021A, 5.0%, 6/1/2032 |
|
1,000,000 |
1,146,731 |
| Washington, State Health Care Facilities Authority Revenue, Virginia Mason Medical Center, 5.0%, 8/15/2029 |
|
2,300,000 |
2,415,918 |
| Washington, State Housing Finance Commission, Horizon House Project: |
|
|
|
| 144A, 5.0%, 1/1/2028 |
|
750,000 |
766,493 |
| 144A, 5.0%, 1/1/2029 |
|
840,000 |
856,562 |
| 144A, 5.0%, 1/1/2031 |
|
1,030,000 |
1,045,641 |
| 144A, 5.0%, 1/1/2033 |
|
1,050,000 |
1,061,213
|
| |
|
|
35,174,304 |
| DWS
Intermediate Tax-Free Fund |
| |
25 |
| |
Principal
Amount ($) |
Value ($) | |
| West Virginia 0.5% |
| ||
| West Virginia, State Economic Development Authority, Solid Waste Disposal Facility, Arch Resources Project, Series A, AMT, 4.125%, Mandatory Put 7/1/2025 @ 100, 7/1/2045 |
|
1,250,000 |
1,219,362 |
| West Virginia, State Hospital Finance Authority Revenue, State University Health System Obligated Group, Series A, 5.0%, 6/1/2032 |
|
2,400,000 |
2,518,500
|
| |
|
|
3,737,862 |
| Wisconsin 0.3% |
| ||
| Wisconsin, General Obligation, Series 1, 5.0%, 5/1/2028 (a) |
|
2,310,000 |
2,577,020 |
| Puerto Rico 0.6% |
| ||
| Puerto Rico, General Obligation: |
|
|
|
| Series A1, 4.0%, 7/1/2033 |
|
1,000,000 |
871,340 |
| Series A1, 5.75%, 7/1/2031 |
|
1,910,000 |
1,961,925 |
| Puerto Rico, Sales Tax Financing Corp., Sales Tax Revenue, Series A-1, Zero Coupon, 7/1/2031 |
|
3,000,000 |
1,948,347
|
| |
|
|
4,781,612 |
| Other 1.2% |
| ||
| Federal Home Loan Mortgage Corp., Multi-Family Variable Rate Certificates: |
|
|
|
| “A” , Series M-024, AMT, 2.304%, 5/15/2027 |
|
375,000 |
349,448 |
| “A” , Series M-051, 144A, 2.65%, 6/15/2035 |
|
7,700,000 |
6,307,102 |
| Freddie Mac, Multi-Family, “Class A” , 3.4%, 1/25/2036,
GTY: Freddie Mac |
|
1,415,701 |
1,314,989 |
| Freddie Mac Multi-Family ML Certificates, “A-CA” , Series
2020-ML08, 1.896%, 11/25/2037, GTY: Freddie Mac |
|
2,750,871 |
2,148,715
|
| |
|
|
10,120,254 |
| Total Municipal Investments (Cost $831,101,845) |
800,503,364 | ||
| Government & Agency Obligations 0.4% |
| ||
| U.S. Treasury Obligations |
| ||
| U.S. Treasury Note, 0.875%, 11/15/2030 (Cost $3,706,648) |
|
3,800,000 |
3,087,649 |
| |
Shares |
Value ($) | |
| Open-End Investment Companies 0.8% |
| ||
| BlackRock Liquidity Funds MuniCash Portfolio, Institutional Shares, 1.8% (d) (Cost $6,193,442) |
|
6,192,960 |
6,193,579 |
| 26 |
| |
DWS Intermediate Tax-Free Fund |
| |
|
% of Net
Assets |
Value ($) |
| Total Investment Portfolio (Cost $841,001,935) |
100.4 |
809,784,592 | |
| Other Assets and Liabilities, Net |
(0.4) |
(3,293,572) | |
| Net Assets |
100.0 |
806,491,020 | |
| (a) |
When-issued security. |
| (b) |
Variable or floating rate security. These securities are shown at their current rate as of November 30, 2022. For securities based on a published reference rate and spread, the reference rate and spread are indicated within the description above. Certain variable rate securities are not based on a published reference rate and spread but adjust periodically based on current market conditions, prepayment of underlying positions and/or other variables. Securities with a floor or ceiling feature are disclosed at the inherent rate, where applicable. |
| (c) |
Variable rate demand notes are securities whose interest rates are reset periodically (usually daily mode or weekly mode) by remarketing agents based on current market levels, and are not directly set as a fixed spread to a reference rate. These securities may be redeemed at par by the holder through a put or tender feature, and are shown at their current rates as of November 30, 2022. Date shown reflects the earlier of demand date or stated maturity date. |
| (d) |
Current yield; not a coupon rate. |
| 144A: Security exempt from registration under Rule 144A of the Securities Act of 1933. These securities may be resold in transactions exempt from registration, normally to qualified institutional buyers. |
| AGMC: Assured Guaranty Municipal Corp. |
| AMT: Subject to alternative minimum tax. |
| GTY: Guaranty Agreement |
| INS: Insured |
| LIQ: Liquidity Facility |
| MUNIPSA: SIFMA Municipal Swap Index Yield |
| NATL: National Public Finance Guarantee Corp. |
| Prerefunded: Bonds which are prerefunded are collateralized usually by U.S. Treasury securities which are held in escrow and used to pay principal and interest on tax-exempt issues and to retire the bonds in full at the earliest refunding date. |
| SIFMA:
Securities Industry and Financial Markets Association |
| DWS
Intermediate Tax-Free Fund |
| |
27 |
| Assets |
Level 1 |
Level 2 |
Level 3 |
Total |
| Municipal Investments (a) |
$ — |
$800,503,364
|
$—
|
$800,503,364 |
| Government & Agency Obligations |
— |
3,087,649 |
— |
3,087,649 |
| Open-End Investment Companies |
6,193,579 |
— |
— |
6,193,579 |
| Total |
$6,193,579 |
$803,591,013 |
$—
|
$809,784,592 |
| (a) |
See
Investment Portfolio for additional detailed categorizations. |
| 28 |
| |
DWS Intermediate Tax-Free Fund |
| Assets |
|
| Investment in securities, at value (cost $841,001,935) |
$ 809,784,592 |
| Receivable for investments sold |
1,841,576 |
| Receivable for Fund shares sold |
1,517,785 |
| Interest receivable |
10,186,464 |
| Other assets |
78,236 |
| Total assets |
823,408,653 |
| Liabilities |
|
| Payable for investments purchased — when-issued securities |
13,640,257 |
| Payable for Fund shares redeemed |
2,369,340 |
| Distributions payable |
376,527 |
| Accrued management fee |
142,691 |
| Accrued Trustees' fees |
9,227 |
| Other accrued expenses and payables |
379,591 |
| Total liabilities |
16,917,633 |
| Net assets, at value |
$806,491,020 |
| Net Assets Consist of |
|
| Distributable earnings (loss) |
(37,932,998) |
| Paid-in capital |
844,424,018 |
| Net assets, at value |
$806,491,020 |
| DWS
Intermediate Tax-Free Fund |
| |
29 |
| Net Asset Value |
|
| Class A |
|
| Net Asset Value and redemption price per share
($109,647,441 ÷ 10,201,427 outstanding shares of beneficial interest,
$.01 par value, unlimited number of shares authorized) |
$ 10.75 |
| Maximum offering price per share (100 ÷ 97.25 of $10.75) |
$ 11.05 |
| Class C |
|
| Net Asset Value, offering and redemption price
(subject to contingent deferred sales charge) per share
($2,656,206 ÷ 247,179 outstanding shares of beneficial interest,
$.01 par value, unlimited number of shares authorized) |
$ 10.75 |
| Class S |
|
| Net Asset Value, offering and redemption price per share
($285,081,081 ÷ 26,518,136 outstanding shares of beneficial interest,
$.01 par value, unlimited number of shares authorized) |
$ 10.75 |
| Institutional Class |
|
| Net Asset Value, offering and redemption price per share
($409,106,292 ÷ 38,064,978 outstanding shares of beneficial interest,
$.01 par value, unlimited number of shares authorized) |
$ 10.75 |
| 30 |
| |
DWS Intermediate Tax-Free Fund |
| Investment Income |
|
| Income: |
|
| Interest |
$ 13,215,183 |
| Expenses: |
|
| Management fee |
1,329,587 |
| Administration fee |
409,428 |
| Services to shareholders |
538,481 |
| Distribution and service fees |
159,908 |
| Custodian fee |
5,185 |
| Professional fees |
41,114 |
| Reports to shareholders |
24,766 |
| Registration fees |
39,345 |
| Trustees' fees and expenses |
18,483 |
| Other |
25,119 |
| Total expenses before expense reductions |
2,591,416 |
| Expense reductions |
(330,868) |
| Total expenses after expense reductions |
2,260,548 |
| Net investment income |
10,954,635 |
| Realized and Unrealized Gain (Loss) |
|
| Net realized gain (loss) from investments |
(6,078,580) |
| Change in net unrealized appreciation (depreciation) on investments |
(15,180,509) |
| Net gain (loss) |
(21,259,089) |
| Net increase (decrease) in net assets resulting from operations |
$ (10,304,454) |
| DWS
Intermediate Tax-Free Fund |
| |
31 |
| |
Six Months Ended November 30, 2022 |
Year Ended May 31, |
| Increase (Decrease) in Net Assets |
(Unaudited) |
2022 |
| Operations: |
|
|
| Net investment income |
$ 10,954,635 |
$ 20,464,050 |
| Net realized gain (loss) |
(6,078,580) |
(860,455) |
| Change in net unrealized appreciation (depreciation) |
(15,180,509) |
(80,027,679) |
| Net increase (decrease) in net assets resulting from operations |
(10,304,454) |
(60,424,084) |
| Distributions to shareholders: |
|
|
| Class A |
(1,400,383) |
(3,228,085) |
| Class C |
(24,764) |
(77,277) |
| Class S |
(3,947,636) |
(8,775,933) |
| Institutional Class |
(5,548,812) |
(11,380,469) |
| Total distributions |
(10,921,595) |
(23,461,764) |
| Fund share transactions: |
|
|
| Proceeds from shares sold |
153,244,297 |
241,513,647 |
| Reinvestment of distributions |
8,500,935 |
18,363,318 |
| Payments for shares redeemed |
(220,596,667) |
(266,344,420) |
| Net increase (decrease) in net assets from Fund share transactions |
(58,851,435) |
(6,467,455) |
| Increase (decrease) in net assets |
(80,077,484) |
(90,353,303) |
| Net assets at beginning of period |
886,568,504 |
976,921,807 |
| Net assets at end of period |
$806,491,020 |
$886,568,504 |
| 32 |
| |
DWS Intermediate Tax-Free Fund |
| DWS Intermediate Tax-Free Fund — Class A | ||||||
| |
Six Months Ended 11/30/22 |
Years Ended May 31, | ||||
| |
(Unaudited) |
2022 |
2021 |
2020 |
2019 |
2018 |
| Selected Per Share Data | ||||||
| Net asset value, beginning of period |
$11.00 |
$12.02 |
$11.80 |
$11.88 |
$11.60 |
$11.93 |
| Income (loss) from investment operations: |
|
|
|
|
|
|
| Net investment income |
.13 |
.22 |
.28 |
.30 |
.31 |
.29 |
| Net realized and unrealized gain (loss) |
(.25) |
(.98) |
.29 |
.02 |
.28 |
(.33) |
| Total from investment operations |
(.12) |
(.76) |
.57 |
.32 |
.59 |
(.04) |
| Less distributions from: |
|
|
|
|
|
|
| Net investment income |
(.13) |
(.22) |
(.28) |
(.30) |
(.31) |
(.29) |
| Net realized gains |
— |
(.04) |
(.07) |
(.10) |
(.00)* |
(.00)* |
| Total distributions |
(.13) |
(.26) |
(.35) |
(.40) |
(.31) |
(.29) |
| Net asset value, end of period |
$10.75 |
$11.00 |
$12.02 |
$11.80 |
$11.88 |
$11.60 |
| Total Return (%)a |
(1.10)b** |
(6.42)b |
4.81b |
2.73b |
5.25b |
(.30) |
| Ratios to Average Net Assets and Supplemental Data | ||||||
| Net assets, end of period ($ millions) |
110 |
123 |
155 |
144 |
154 |
174 |
| Ratio of expenses before expense reductions (%) |
.78*** |
.78 |
.78 |
.78 |
.79 |
.78 |
| Ratio of expenses after expense reductions (%) |
.75*** |
.73 |
.72 |
.77 |
.78 |
.78 |
| Ratio of net investment income (%) |
2.38*** |
1.92 |
2.33 |
2.55 |
2.70 |
2.47 |
| Portfolio turnover rate (%) |
23** |
47 |
38 |
41 |
61 |
44 |
| a |
Total return does not reflect the effect of any sales charges. |
| b |
Total return would have been lower had certain expenses not been reduced. |
| * |
Amount is less than $.005. |
| ** |
Not annualized |
| *** |
Annualized |
| DWS
Intermediate Tax-Free Fund |
| |
33 |
| DWS Intermediate Tax-Free Fund — Class C | ||||||
| |
Six Months Ended 11/30/22 |
Years Ended May 31, | ||||
| |
(Unaudited) |
2022 |
2021 |
2020 |
2019 |
2018 |
| Selected Per Share Data | ||||||
| Net asset value, beginning of period |
$11.00 |
$12.02 |
$11.80 |
$11.88 |
$11.59 |
$11.93 |
| Income (loss) from investment operations: |
|
|
|
|
|
|
| Net investment income |
.09 |
.14 |
.19 |
.21 |
.23 |
.20 |
| Net realized and unrealized gain (loss) |
(.25) |
(.98) |
.29 |
.02 |
.29 |
(.34) |
| Total from investment operations |
(.16) |
(.84) |
.48 |
.23 |
.52 |
(.14) |
| Less distributions from: |
|
|
|
|
|
|
| Net investment income |
(.09) |
(.14) |
(.19) |
(.21) |
(.23) |
(.20) |
| Net realized gains |
— |
(.04) |
(.07) |
(.10) |
(.00)* |
(.00)* |
| Total distributions |
(.09) |
(.18) |
(.26) |
(.31) |
(.23) |
(.20) |
| Net asset value, end of period |
$10.75 |
$11.00 |
$12.02 |
$11.80 |
$11.88 |
$11.59 |
| Total Return (%)a,b |
(1.47)** |
(7.12) |
4.03 |
1.97 |
4.56 |
(1.15) |
| Ratios to Average Net Assets and Supplemental Data | ||||||
| Net assets, end of period ($ millions) |
3 |
4 |
7 |
20 |
28 |
36 |
| Ratio of expenses before expense reductions (%) |
1.58*** |
1.53 |
1.53 |
1.54 |
1.56 |
1.56 |
| Ratio of expenses after expense reductions (%) |
1.50*** |
1.48 |
1.48 |
1.52 |
1.53 |
1.55 |
| Ratio of net investment income (%) |
1.62*** |
1.17 |
1.60 |
1.80 |
1.95 |
1.70 |
| Portfolio turnover rate (%) |
23** |
47 |
38 |
41 |
61 |
44 |
| a |
Total return does not reflect the effect of any sales charges. |
| b |
Total return would have been lower had certain expenses not been reduced. |
| * |
Amount is less than $.005. |
| ** |
Not annualized |
| *** |
Annualized |
| 34 |
| |
DWS Intermediate Tax-Free Fund |
| DWS Intermediate Tax-Free Fund — Class S | ||||||
| |
Six Months Ended 11/30/22 |
Years Ended May 31, | ||||
| |
(Unaudited) |
2022 |
2021 |
2020 |
2019 |
2018 |
| Selected Per Share Data | ||||||
| Net asset value, beginning of period |
$11.00 |
$12.03 |
$11.80 |
$11.88 |
$11.60 |
$11.93 |
| Income (loss) from investment operations: |
|
|
|
|
|
|
| Net investment income |
.14 |
.25 |
.31 |
.33 |
.34 |
.32 |
| Net realized and unrealized gain (loss) |
(.25) |
(.99) |
.30 |
.02 |
.28 |
(.33) |
| Total from investment operations |
(.11) |
(.74) |
.61 |
.35 |
.62 |
(.01) |
| Less distributions from: |
|
|
|
|
|
|
| Net investment income |
(.14) |
(.25) |
(.31) |
(.33) |
(.34) |
(.32) |
| Net realized gains |
— |
(.04) |
(.07) |
(.10) |
(.00)* |
(.00)* |
| Total distributions |
(.14) |
(.29) |
(.38) |
(.43) |
(.34) |
(.32) |
| Net asset value, end of period |
$10.75 |
$11.00 |
$12.03 |
$11.80 |
$11.88 |
$11.60 |
| Total Return (%)a |
(.97)** |
(6.26) |
5.16 |
2.99 |
5.51 |
(.07) |
| Ratios to Average Net Assets and Supplemental Data | ||||||
| Net assets, end of period ($ millions) |
285 |
320 |
362 |
443 |
543 |
629 |
| Ratio of expenses before expense reductions (%) |
.63*** |
.64 |
.61 |
.62 |
.63 |
.62 |
| Ratio of expenses after expense reductions (%) |
.50*** |
.48 |
.48 |
.52 |
.53 |
.55 |
| Ratio of net investment income (%) |
2.63*** |
2.17 |
2.58 |
2.80 |
2.95 |
2.71 |
| Portfolio turnover rate (%) |
23** |
47 |
38 |
41 |
61 |
44 |
| a |
Total return would have been lower had certain expenses not been reduced. |
| * |
Amount is less than $.005. |
| ** |
Not annualized |
| *** |
Annualized |
| DWS
Intermediate Tax-Free Fund |
| |
35 |
| DWS Intermediate Tax-Free Fund — Institutional Class | ||||||
| |
Six Months Ended 11/30/22 |
Years Ended May 31, | ||||
| |
(Unaudited) |
2022 |
2021 |
2020 |
2019 |
2018 |
| Selected Per Share Data | ||||||
| Net asset value, beginning of period |
$11.00 |
$12.02 |
$11.80 |
$11.88 |
$11.60 |
$11.93 |
| Income (loss) from investment operations: |
|
|
|
|
|
|
| Net investment income |
.14 |
.25 |
.31 |
.33 |
.34 |
.32 |
| Net realized and unrealized gain (loss) |
(.25) |
(.98) |
.29 |
.02 |
.28 |
(.33) |
| Total from investment operations |
(.11) |
(.73) |
.60 |
.35 |
.62 |
(.01) |
| Less distributions from: |
|
|
|
|
|
|
| Net investment income |
(.14) |
(.25) |
(.31) |
(.33) |
(.34) |
(.32) |
| Net realized gains |
— |
(.04) |
(.07) |
(.10) |
(.00)* |
(.00)* |
| Total distributions |
(.14) |
(.29) |
(.38) |
(.43) |
(.34) |
(.32) |
| Net asset value, end of period |
$10.75 |
$11.00 |
$12.02 |
$11.80 |
$11.88 |
$11.60 |
| Total Return (%) |
(.97)a** |
(6.18)a |
5.07a |
2.99a |
5.52a |
(.06) |
| Ratios to Average Net Assets and Supplemental Data | ||||||
| Net assets, end of period ($ millions) |
409 |
440 |
453 |
356 |
327 |
680 |
| Ratio of expenses before expense reductions (%) |
.55*** |
.55 |
.54 |
.55 |
.55 |
.54 |
| Ratio of expenses after expense reductions (%) |
.50*** |
.48 |
.47 |
.52 |
.53 |
.54 |
| Ratio of net investment income (%) |
2.63*** |
2.17 |
2.57 |
2.80 |
2.93 |
2.71 |
| Portfolio turnover rate (%) |
23** |
47 |
38 |
41 |
61 |
44 |
| a |
Total return would have been lower had certain expenses not been reduced. |
| * |
Amount is less than $.005. |
| ** |
Not annualized |
| *** |
Annualized |
| 36 |
| |
DWS Intermediate Tax-Free Fund |
| DWS
Intermediate Tax-Free Fund |
| |
37 |
| 38 |
| |
DWS Intermediate Tax-Free Fund |
| DWS
Intermediate Tax-Free Fund |
| |
39 |
| 40 |
| |
DWS Intermediate Tax-Free Fund |
| Class A |
|
.75% |
| Class C |
|
1.50% |
| Class S |
|
.50% |
| Institutional Class |
|
.50% |
| Class A |
.74% |
| Class C |
1.49% |
| Class S |
.49% |
| Institutional Class |
.49% |
| DWS
Intermediate Tax-Free Fund |
| |
41 |
| Class A |
$ 16,628
|
| Class C |
1,267 |
| Class S |
200,267 |
| Institutional Class |
112,706 |
| |
$ 330,868 |
| Services to Shareholders |
Total
Aggregated |
Unpaid at
November 30, 2022 |
| Class A |
$ 1,403 |
$
499 |
| Class C |
189 |
65 |
| Class S |
16,287 |
5,666 |
| Institutional Class |
747 |
245 |
| |
$ 18,626 |
$ 6,475 |
| 42 |
| |
DWS Intermediate Tax-Free Fund |
| Sub-Recordkeeping |
Total
Aggregated |
| Class A |
$
45,864 |
| Class C |
1,830 |
| Class S |
254,629 |
| Institutional Class |
211,188 |
| |
$ 513,511 |
| Distribution Fee |
Total
Aggregated |
Unpaid at
November 30, 2022 |
| Class C |
$
11,529 |
$ 1,595 |
| Service Fee |
Total
Aggregated |
Unpaid at
November 30, 2022 |
Annualized
Rate |
| Class A |
$
144,562 |
$
44,210 |
.25% |
| Class C |
3,817 |
530 |
.25% |
| |
$ 148,379 |
$ 44,740 |
|
| DWS
Intermediate Tax-Free Fund |
| |
43 |
| 44 |
| |
DWS Intermediate Tax-Free Fund |
| |
Six Months Ended
November 30, 2022 |
Year Ended
May 31, 2022 | ||
| |
Shares |
Dollars |
Shares |
Dollars |
| Shares sold | ||||
| Class A |
1,180,128 |
$ 12,617,741 |
1,010,213 |
$ 11,471,271 |
| Class C |
18,374 |
196,954 |
71,273 |
845,661 |
| Class S |
3,985,511 |
42,895,579 |
6,591,510 |
75,341,187 |
| Institutional Class |
9,090,152 |
97,534,023 |
13,326,586 |
153,855,528 |
| |
|
$ 153,244,297 |
|
$ 241,513,647 |
| Shares issued to shareholders in reinvestment of distributions | ||||
| Class A |
109,827 |
$ 1,175,222 |
233,503 |
$ 2,735,516 |
| Class C |
2,064 |
22,093 |
5,994 |
70,361 |
| Class S |
341,263 |
3,652,083 |
693,476 |
8,116,645 |
| Institutional Class |
341,422 |
3,651,537 |
636,564 |
7,440,796 |
| |
|
$ 8,500,935 |
|
$ 18,363,318 |
| Shares redeemed | ||||
| Class A |
(2,269,009) |
$ (24,140,599) |
(2,995,996) |
$ (34,318,469) |
| Class C |
(127,914) |
(1,377,325) |
(290,760) |
(3,419,132) |
| Class S |
(6,908,944) |
(73,945,012) |
(8,291,040) |
(94,735,787) |
| Institutional Class |
(11,331,373) |
(121,133,731) |
(11,641,042) |
(133,871,032) |
| |
|
$ (220,596,667) |
|
$ (266,344,420) |
| Net increase (decrease) | ||||
| Class A |
(979,054) |
$ (10,347,636) |
(1,752,280) |
$ (20,111,682) |
| Class C |
(107,476) |
(1,158,278) |
(213,493) |
(2,503,110) |
| Class S |
(2,582,170) |
(27,397,350) |
(1,006,054) |
(11,277,955) |
| Institutional Class |
(1,899,799) |
(19,948,171) |
2,322,108 |
27,425,292 |
| |
|
$ (58,851,435)
|
|
$ (6,467,455)
|
| DWS
Intermediate Tax-Free Fund |
| |
45 |
| 46 |
| |
DWS Intermediate Tax-Free Fund |
| DWS
Intermediate Tax-Free Fund |
| |
47 |
| Actual Fund Return |
Class A |
Class C |
Class S |
Institutional
Class |
| Beginning Account Value 6/1/22 |
$1,000.00
|
$1,000.00
|
$1,000.00
|
$1,000.00 |
| Ending Account Value 11/30/22 |
$989.00
|
$985.30
|
$990.30
|
$990.30 |
| Expenses Paid per $1,000* |
$3.74
|
$7.47
|
$2.49
|
$2.49 |
| Hypothetical 5% Fund Return |
Class A |
Class C |
Class S |
Institutional
Class |
| Beginning Account Value 6/1/22 |
$1,000.00
|
$1,000.00
|
$1,000.00
|
$1,000.00 |
| Ending Account Value 11/30/22 |
$1,021.31
|
$1,017.55
|
$1,022.56
|
$1,022.56 |
| Expenses Paid per $1,000* |
$3.80
|
$7.59
|
$2.54
|
$2.54 |
| * |
Expenses are equal to the Fund’s annualized expense ratio for each share class, multiplied by the average account value over the period, multiplied by 183 (the number of days in the most recent six-month period), then divided by 365. |
| Annualized Expense Ratios |
Class A |
Class C |
Class S |
Institutional
Class |
| DWS Intermediate Tax-Free Fund |
.75% |
1.50% |
.50% |
.50% |
| 48 |
| |
DWS Intermediate Tax-Free Fund |
| DWS
Intermediate Tax-Free Fund |
| |
49 |
| 50 |
| |
DWS Intermediate Tax-Free Fund |
| DWS
Intermediate Tax-Free Fund |
| |
51 |
| 52 |
| |
DWS Intermediate Tax-Free Fund |
| For More
Information |
The automated telephone system allows you to access personalized account information and obtain information on other DWS funds using either your voice or your telephone keypad. Certain account types within Classes A, C and S also have the ability to purchase, exchange or redeem shares using this system. |
| For more information, contact your financial representative. You may also access our automated telephone system or speak with a Shareholder Service representative by calling: (800) 728-3337 | |
| Web Site |
dws.com View your account transactions and balances, trade shares, monitor your asset allocation, subscribe to fund and account updates by e-mail, and change your address, 24 hours a day. |
| Obtain prospectuses and applications, news about DWS funds,
insight from DWS economists and investment specialists and access
to DWS fund account information. | |
| Written
Correspondence |
DWS
PO Box 219151 Kansas City, MO 64121-9151 |
| Proxy Voting |
The Fund’s policies and procedures for voting proxies for portfolio securities and information about how the Fund voted proxies related to its portfolio securities during the most recent 12-month period ended June 30 are available on our Web site —
dws.com/en-us/resources/proxy-voting — or on the SEC’s Web site
— sec.gov. To
obtain a written copy of the Fund’s policies and procedures without charge, upon
request, call us toll free at (800) 728-3337. |
| Portfolio Holdings |
Following the Fund’s fiscal first and third quarter-end, a complete portfolio holdings listing is posted on dws.com, and is available free of charge by contacting your financial intermediary, or if you are a direct investor, by calling (800) 728-3337. In addition, the portfolio holdings listing is filed with SEC on the Fund’s Form N-PORT and will be available on the SEC’s Web site at sec.gov. Additional portfolio holdings for the Fund are also posted on dws.com from time to time. Please see the Fund’s current prospectus for more information. |
| Principal
Underwriter |
If you have questions, comments or complaints, contact: DWS Distributors, Inc. 222 South Riverside Plaza Chicago, IL 60606-5808 (800) 621-1148 |
| DWS
Intermediate Tax-Free Fund |
| |
53 |
| Investment
Management |
DWS Investment Management Americas, Inc. (“DIMA” or the
“Advisor”
), which is part of the DWS Group GmbH & Co. KGaA (“DWS Group” ), is the investment advisor for the Fund. DIMA and its predecessors have more than 90 years of experience managing mutual funds and DIMA provides a full range of investment advisory services to both institutional and retail clients. DIMA is an indirect, wholly owned subsidiary of DWS Group. |
| |
DWS Group is a global organization that offers a wide range of investing expertise and resources, including hundreds of portfolio managers and analysts and an office network that reaches the world’s major investment centers. This well-resourced global investment platform brings together a wide variety of experience and investment insight across industries, regions, asset classes and investing styles. |
| |
Class A |
Class C |
Class S |
Institutional Class |
| Nasdaq Symbol |
SZMAX |
SZMCX |
SCMTX |
SZMIX |
| CUSIP Number |
25159H 108 |
25159H 306 |
25159H 405 |
25159H 504 |
| Fund Number |
445 |
745 |
2045 |
1445 |
| 54 |
| |
DWS Intermediate Tax-Free Fund |
(R-025435-12 1/23)
| (b) Not applicable | ||
| ITEM 2. | CODE OF ETHICS | |
| Not applicable. | ||
| ITEM 3. | AUDIT COMMITTEE FINANCIAL EXPERT | |
| Not applicable | ||
| ITEM 4. | PRINCIPAL ACCOUNTANT FEES AND SERVICES | |
| Not applicable | ||
| ITEM 5. | AUDIT COMMITTEE OF LISTED REGISTRANTS | |
| Not applicable | ||
| ITEM 6. | SCHEDULE OF INVESTMENTS | |
| Not applicable | ||
| ITEM 7. | DISCLOSURE OF PROXY VOTING POLICIES AND PROCEDURES FOR CLOSED-END MANAGEMENT INVESTMENT COMPANIES | |
| Not applicable | ||
| ITEM 8. | PORTFOLIO MANAGERS OF CLOSED-END MANAGEMENT INVESTMENT COMPANIES | |
| Not applicable | ||
| ITEM 9. | PURCHASES OF EQUITY SECURITIES BY CLOSED-END MANAGEMENT INVESTMENT COMPANY AND AFFILIATED PURCHASERS | |
| Not applicable | ||
| ITEM 10. | SUBMISSION OF MATTERS TO A VOTE OF SECURITY HOLDERS | |
| There were no material changes to the procedures by which shareholders may recommend nominees to the Fund’s Board. The primary function of the Nominating and Governance Committee is to identify and recommend individuals for membership on the Board and oversee the administration of the Board Governance Guidelines. Shareholders may recommend candidates for Board positions by forwarding their correspondence by U.S. mail or courier service to Keith R. Fox, DWS Funds Board Chair, c/o Thomas R. Hiller, Ropes & Gray LLP, Prudential Tower, 800 Boylston Street, Boston, MA 02199-3600. | ||
| ITEM 11. | CONTROLS AND PROCEDURES | |
| (a) | The Chief Executive and Financial Officers concluded that the Registrant’s Disclosure Controls and Procedures are effective based on the evaluation of the Disclosure Controls and Procedures as of a date within 90 days of the filing date of this report. | |
| (b) | There have been no changes in the registrant’s internal control over financial reporting that occurred during the period covered by this report that has materially affected, or is reasonably likely to materially affect, the registrant’s internal controls over financial reporting. | |
| ITEM 12. | Disclosure of Securities Lending Activities for Closed-End Management Investment Companies. | |
| Not applicable | ||
| ITEM 13. | EXHIBITS | |
| (a)(1) | Not applicable | |
| (a)(2) | Certification pursuant to Rule 30a-2(a) under the Investment Company Act of 1940 (17 CFR 270.30a-2(a)) is filed and attached hereto as Exhibit 99.CERT. | |
| (b) | Certification pursuant to Rule 30a-2(b) under the Investment Company Act of 1940 (17 CFR 270.30a-2(b)) is furnished and attached hereto as Exhibit 99.906CERT. | |
SIGNATURES
Pursuant to the requirements of the Securities Exchange Act of 1934 and the Investment Company Act of 1940, the registrant has duly caused this report to be signed on its behalf by the undersigned, thereunto duly authorized.
| Registrant: | DWS Intermediate Tax-Free Fund, a series of Deutsche DWS Tax Free Trust |
| By: |
/s/Hepsen Uzcan Hepsen Uzcan President |
| Date: | 1/27/2023 |
Pursuant to the requirements of the Securities Exchange Act of 1934 and the Investment Company Act of 1940, this report has been signed below by the following persons on behalf of the registrant and in the capacities and on the dates indicated.
| By: |
/s/Hepsen Uzcan Hepsen Uzcan President |
| Date: | 1/27/2023 |
| By: |
/s/Diane Kenneally Diane Kenneally Chief Financial Officer and Treasurer |
| Date: | 1/27/2023 |
ATTACHMENTS / EXHIBITS
Serious News for Serious Traders! Try StreetInsider.com Premium Free!
You May Also Be Interested In
- Crypto Exchange Millionero Partners and sleeves Sponsors with Greek Football Club PAOK
- Boucher LLP Shines Light on Justice: Advocating for Victims of Sexual Assault, Abuse, and More
- RMG Acquisition Corp. III Announces Cancellation of Dissolution
Create E-mail Alert Related Categories
SEC FilingsSign up for StreetInsider Free!
Receive full access to all new and archived articles, unlimited portfolio tracking, e-mail alerts, custom newswires and RSS feeds - and more!
