

Form N-CSRS Capital Group U.S. Equit For: Apr 30
 Tweet
Tweet Share
ShareUNITED STATES
SECURITIES AND EXCHANGE COMMISSION
Washington, D.C. 20549
FORM N-CSR
Certified Shareholder Report of
Registered Management Investment Companies
Investment Company Act File Number: 811-23469
Capital Group U.S. Equity Fund
(Exact Name of Registrant as Specified in Charter)
6455 Irvine Center Drive
Irvine, California 92618
(Address of Principal Executive Offices)
Registrant's telephone number, including area code: (949) 975-5000
Date of fiscal year end: October 31
Date of reporting period: April 30, 2022
Gregory F. Niland
Capital Group U.S. Equity Fund
5300 Robin Hood Road
Norfolk, Virginia 23513
(Name and Address of Agent for Service)
ITEM 1 – Reports to Stockholders
 |
Capital Group U.S. Equity FundSM
Semi-annual report |

A U.S.-focused approach
to seeking prudent growth
and preserving wealth
Capital Group U.S. Equity Fund seeks to provide prudent growth of capital and conservation of principal.
This fund is one of more than 40 offered by Capital Group, home of American Funds, one of the nation’s largest mutual fund families. For over 90 years, Capital Group has invested with a long-term focus based on thorough research and attention to risk.
Fund results shown in this report are at net asset value. Results are for past periods and are not predictive of results for future periods. Current and future results may be lower or higher than those shown. Prices and returns will vary, so investors may lose money. Investing for short periods makes losses more likely. For current and month-end results, visit capitalgroup.com/pcs.
Here are the total returns on a $1,000 investment with all distributions reinvested for periods ended March 31, 2022 (the most recent calendar quarter-end), and the total annual fund operating expense ratios as of the prospectus dated January 1, 2022:
| Cumulative total returns |
Average annual total returns |
Gross | Net | |||||||||
| 1 year | 5 years | 10 years | Lifetime* | expense ratio | expense ratio | |||||||
| Capital Group U.S. Equity Fund | 14.10% | 14.47% | 13.07% | 12.09% | 0.43% | 0.42% | ||||||
*Since April 1, 2011 (fund inception). The fund is newly organized for the purpose of effecting the reorganization of Capital Group U.S. Equity Fund (the “predecessor fund”) into a new Delaware statutory trust. The fund acquired the assets and assumed the liabilities of the predecessor fund on November 8, 2019, and the predecessor fund is the accounting and performance survivor of the reorganization. This means that the predecessor fund’s performance and financial history have been adopted by the fund and will be used going forward from the date of reorganization. Except where the context indicates otherwise, all references herein to the “fund” include the predecessor fund prior to November 8, 2019. In connection with the reorganization, former shareholders of the predecessor fund received shares of the fund. The performance of the fund includes the performance of the predecessor fund prior to the reorganization.
Investment results assume all distributions are reinvested and reflect applicable fees and expenses. The investment adviser is currently reimbursing a portion of other expenses so that total expenses do not exceed the fund’s unified fee. This reimbursement will be in effect through at least January 1, 2023. The adviser may elect at its discretion to extend, modify or terminate the reimbursement at that time. Visit capitalgrouppcsfunds.com for more information.
Investments are not FDIC-insured, nor are they deposits of or guaranteed by a bank or any other entity, so they may lose value.
Fellow investors:
Shown in the table below are Capital Group U.S. Equity Fund’s semi-annual results for the six months ended April 30, 2022. Also shown are the results of its primary benchmark and peer group.
For additional information about the fund, its investment results, holdings and portfolio managers, visit capitalgrouppcsfunds.com. You can also read our insights about the markets, industries and more at capitalgroup.com/pcs.
Contents
| 1 | Results at a glance |
| 2 | Investment portfolio |
| 6 | Financial statements |
| 9 | Notes to financial statements |
| 15 | Financial highlights |
Results at a glance
For periods ended April 30, 2022, with all distributions reinvested
| Cumulative total returns |
Average annual total returns | |||||||||||||||||||
| 6 months | 1 year | 5 years | 10 years | Lifetime1 | ||||||||||||||||
| Capital Group U.S. Equity Fund2 | –9.34 | % | 0.41 | % | 12.48 | % | 12.27 | % | 11.25 | % | ||||||||||
| S&P 500 Index3 | –9.65 | 0.21 | 13.66 | 13.67 | 12.98 | |||||||||||||||
| Lipper Growth & Income Funds Average4 | –9.91 | –4.76 | 8.37 | 9.54 | 8.96 | |||||||||||||||
| 1 | Since April 1, 2011 (fund inception). |
| 2 | The fund is newly organized for the purpose of effecting the reorganization of Capital Group U.S. Equity Fund (the “predecessor fund”) into a new Delaware statutory trust. The fund acquired the assets and assumed the liabilities of the predecessor fund on November 8, 2019, and the predecessor fund is the accounting and performance survivor of the reorganization. This means that the predecessor fund’s performance and financial history have been adopted by the fund and will be used going forward from the date of reorganization. Except where the context indicates otherwise, all references herein to the “fund” include the predecessor fund prior to November 8, 2019. In connection with the reorganization, former shareholders of the predecessor fund received shares of the fund. The performance of the fund includes the performance of the predecessor fund prior to the reorganization. |
| 3 | S&P source: S&P Dow Jones Indices LLC. S&P 500 Index is a market capitalization-weighted index based on the results of approximately 500 widely held common stocks. This index is unmanaged, and its results include reinvested dividends and/or distributions but do not reflect the effect of sales charges, commissions, account fees, expenses or U.S. federal income taxes. |
| 4 | Lipper source: Refinitiv Lipper. Lipper averages reflect the current composition of all eligible mutual funds (all share classes) within a given category. Lipper categories are dynamic and averages may have few funds, especially over longer periods. To see the number of funds included in the Lipper category for each fund’s lifetime, please see the Quarterly Statistical Update, available on our website. |
| Capital Group U.S. Equity Fund | 1 |
| Investment portfolio April 30, 2022 | unaudited |
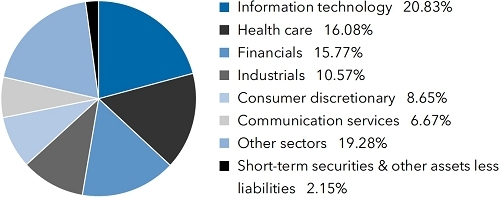
| Sector diversification | Percent of net assets |
| Country diversification by domicile | Percent of net assets | ||
| United States | 91.33 | % | |
| Eurozone* | 2.88 | ||
| United Kingdom | 1.45 | ||
| Denmark | .79 | ||
| Switzerland | .64 | ||
| Canada | .53 | ||
| Taiwan | .23 | ||
| Short-term securities & other assets less liabilities | 2.15 | ||
| * | Countries using the euro as a common currency; those represented in the fund’s portfolio are Belgium, France, Germany and the Netherlands. |
| Common stocks 97.85% | Shares | Value (000) |
||||||
| Information technology 20.83% | ||||||||
| Microsoft Corp. | 58,484 | $ | 16,230 | |||||
| Visa, Inc., Class A | 53,335 | 11,367 | ||||||
| Apple, Inc. | 45,798 | 7,220 | ||||||
| Broadcom, Inc. | 9,881 | 5,478 | ||||||
| ASML Holding NV (New York registered) (ADR) | 8,124 | 4,580 | ||||||
| KLA Corp. | 8,920 | 2,848 | ||||||
| Fidelity National Information Services, Inc. | 22,501 | 2,231 | ||||||
| Jack Henry & Associates, Inc. | 10,922 | 2,071 | ||||||
| GoDaddy, Inc., Class A1 | 19,188 | 1,551 | ||||||
| Lam Research Corp. | 3,170 | 1,476 | ||||||
| Texas Instruments, Inc. | 8,562 | 1,458 | ||||||
| Adobe, Inc.1 | 3,348 | 1,326 | ||||||
| ServiceNow, Inc.1 | 2,613 | 1,249 | ||||||
| Analog Devices, Inc. | 7,202 | 1,112 | ||||||
| Mastercard, Inc., Class A | 2,478 | 900 | ||||||
| SAP SE (ADR) | 8,100 | 817 | ||||||
| Taiwan Semiconductor Manufacturing Company, Ltd. (ADR) | 7,500 | 697 | ||||||
| Micron Technology, Inc. | 7,553 | 515 | ||||||
| Elastic NV, non-registered shares1 | 5,200 | 396 | ||||||
| 63,522 | ||||||||
| Health care 16.08% | ||||||||
| UnitedHealth Group, Inc. | 19,052 | 9,689 | ||||||
| Eli Lilly and Company | 19,699 | 5,755 | ||||||
| Seagen, Inc.1 | 33,026 | 4,327 | ||||||
| Danaher Corp. | 15,573 | 3,911 | ||||||
| Anthem, Inc. | 7,375 | 3,702 | ||||||
| Humana, Inc. | 7,763 | 3,451 | ||||||
| Abbott Laboratories | 27,515 | 3,123 | ||||||
| AstraZeneca PLC (ADR) | 43,650 | 2,898 | ||||||
| Edwards Lifesciences Corp.1 | 25,350 | 2,681 | ||||||
| Bristol-Myers Squibb Company | 34,147 | 2,570 | ||||||
| Novo Nordisk A/S, Class B (ADR) | 17,100 | 1,949 | ||||||
| Horizon Therapeutics PLC1 | 9,740 | 960 | ||||||
| Centene Corp.1 | 11,600 | 934 | ||||||
| Roche Holding AG (ADR) | 16,600 | 767 | ||||||
| Regeneron Pharmaceuticals, Inc.1 | 1,102 | 726 | ||||||
| Pfizer, Inc. | 13,547 | 665 | ||||||
| Biohaven Pharmaceutical Holding Co., Ltd.1 | 6,200 | 553 | ||||||
| Oak Street Health, Inc.1 | 20,453 | 370 | ||||||
| 49,031 | ||||||||
| 2 | Capital Group U.S. Equity Fund |
| Common stocks (continued) | Shares | Value (000) |
||||||
| Financials 15.77% | ||||||||
| Marsh & McLennan Companies, Inc. | 59,290 | $ | 9,587 | |||||
| Chubb, Ltd. | 31,780 | 6,561 | ||||||
| JPMorgan Chase & Co. | 39,430 | 4,706 | ||||||
| Aon PLC, Class A | 16,148 | 4,651 | ||||||
| CME Group, Inc., Class A | 13,875 | 3,043 | ||||||
| Moody’s Corp. | 9,375 | 2,967 | ||||||
| Intercontinental Exchange, Inc. | 19,719 | 2,284 | ||||||
| Signature Bank | 8,904 | 2,157 | ||||||
| State Street Corp. | 31,687 | 2,122 | ||||||
| MSCI, Inc. | 4,200 | 1,769 | ||||||
| Arthur J. Gallagher & Co. | 10,300 | 1,735 | ||||||
| Discover Financial Services | 15,200 | 1,709 | ||||||
| First Republic Bank | 7,000 | 1,045 | ||||||
| Truist Financial Corp. | 18,217 | 881 | ||||||
| Nasdaq, Inc. | 5,550 | 873 | ||||||
| SVB Financial Group1 | 1,398 | 682 | ||||||
| Western Alliance Bancorporation | 8,621 | 656 | ||||||
| Tradeweb Markets, Inc., Class A | 9,000 | 641 | ||||||
| 48,069 | ||||||||
| Industrials 10.57% | ||||||||
| Waste Connections, Inc. | 41,191 | 5,683 | ||||||
| Northrop Grumman Corp. | 12,170 | 5,348 | ||||||
| CSX Corp. | 74,478 | 2,558 | ||||||
| Honeywell International, Inc. | 11,655 | 2,255 | ||||||
| Norfolk Southern Corp. | 8,296 | 2,139 | ||||||
| United Airlines Holdings, Inc.1 | 41,847 | 2,113 | ||||||
| TransDigm Group, Inc.1 | 3,385 | 2,013 | ||||||
| AMETEK, Inc. | 14,500 | 1,831 | ||||||
| Carrier Global Corp. | 42,831 | 1,639 | ||||||
| ITT, Inc. | 22,129 | 1,554 | ||||||
| Airbus Group SE (ADR) | 50,200 | 1,369 | ||||||
| Deere & Company | 3,200 | 1,208 | ||||||
| Raytheon Technologies Corp. | 10,900 | 1,035 | ||||||
| Trinity Industries, Inc. | 28,566 | 792 | ||||||
| HEICO Corp., Class A | 3,000 | 350 | ||||||
| HEICO Corp. | 2,400 | 339 | ||||||
| 32,226 | ||||||||
| Consumer discretionary 8.65% | ||||||||
| Amazon.com, Inc.1 | 2,558 | 6,358 | ||||||
| Chipotle Mexican Grill, Inc.1 | 3,211 | 4,674 | ||||||
| Dollar General Corp. | 17,919 | 4,256 | ||||||
| NIKE, Inc., Class B | 25,739 | 3,210 | ||||||
| Hilton Worldwide Holdings, Inc.1 | 17,448 | 2,709 | ||||||
| YUM! Brands, Inc. | 16,476 | 1,928 | ||||||
| Aramark | 25,351 | 919 | ||||||
| Lear Corp. | 6,984 | 894 | ||||||
| Norwegian Cruise Line Holdings, Ltd.1 | 39,030 | 782 | ||||||
| Darden Restaurants, Inc. | 4,900 | 645 | ||||||
| 26,375 | ||||||||
| Communication services 6.67% | ||||||||
| Alphabet, Inc., Class C1 | 2,377 | 5,466 | ||||||
| Comcast Corp., Class A | 92,140 | 3,664 | ||||||
| Charter Communications, Inc., Class A1 | 7,108 | 3,046 | ||||||
| Meta Platforms, Inc., Class A1 | 14,487 | 2,904 | ||||||
| Netflix, Inc.1 | 10,251 | 1,951 | ||||||
| Cable One, Inc. | 1,626 | 1,896 | ||||||
| Electronic Arts, Inc. | 11,887 | 1,403 | ||||||
| 20,330 | ||||||||
| Capital Group U.S. Equity Fund | 3 |
| Common stocks (continued) | Shares | Value (000) |
||||||
| Consumer staples 5.98% | ||||||||
| Philip Morris International, Inc. | 38,401 | $ | 3,840 | |||||
| Anheuser-Busch InBev SA/NV (ADR)2 | 35,100 | 2,016 | ||||||
| Mondelez International, Inc. | 28,300 | 1,825 | ||||||
| Estée Lauder Companies, Inc., Class A | 6,687 | 1,766 | ||||||
| British American Tobacco PLC (ADR) | 36,219 | 1,513 | ||||||
| Costco Wholesale Corp. | 2,710 | 1,441 | ||||||
| General Mills, Inc. | 18,816 | 1,331 | ||||||
| Procter & Gamble Company | 7,880 | 1,265 | ||||||
| Nestlé SA (ADR) | 9,255 | 1,191 | ||||||
| PepsiCo, Inc. | 6,582 | 1,130 | ||||||
| Hormel Foods Corp. | 17,200 | 901 | ||||||
| 18,219 | ||||||||
| Energy 4.44% | ||||||||
| Chevron Corp. | 33,198 | 5,201 | ||||||
| ConocoPhillips | 41,649 | 3,978 | ||||||
| EOG Resources, Inc. | 31,098 | 3,631 | ||||||
| TC Energy Corp. | 13,700 | 725 | ||||||
| 13,535 | ||||||||
| Utilities 3.68% | ||||||||
| Sempra Energy | 13,320 | 2,149 | ||||||
| Exelon Corp. | 39,883 | 1,866 | ||||||
| Constellation Energy Corp. | 29,853 | 1,768 | ||||||
| CenterPoint Energy, Inc. | 45,667 | 1,398 | ||||||
| Edison International | 16,278 | 1,120 | ||||||
| Entergy Corp. | 8,561 | 1,017 | ||||||
| AES Corp. | 44,000 | 898 | ||||||
| NextEra Energy, Inc. | 7,600 | 540 | ||||||
| Ørsted AS (ADR) | 12,200 | 454 | ||||||
| 11,210 | ||||||||
| Materials 2.62% | ||||||||
| Linde PLC | 16,607 | 5,181 | ||||||
| Sherwin-Williams Company | 6,960 | 1,914 | ||||||
| Barrick Gold Corp. | 40,000 | 892 | ||||||
| 7,987 | ||||||||
| Real estate 2.56% | ||||||||
| Equinix, Inc. REIT | 5,567 | 4,003 | ||||||
| Crown Castle International Corp. REIT | 20,579 | 3,812 | ||||||
| 7,815 | ||||||||
| Total common stocks (cost: $159,983,000) | 298,319 | |||||||
| Short-term securities 2.49% | ||||||||
| Money market investments 2.05% | ||||||||
| Capital Group Central Cash Fund 0.32%3,4 | 62,413 | 6,242 | ||||||
| Money market investments purchased with collateral from securities on loan 0.44% | ||||||||
| Capital Group Central Cash Fund 0.32%3,4,5 | 5,793 | 579 | ||||||
| Invesco Short-Term Investments Trust – Government & Agency Portfolio, Institutional Class 0.35%3,5 | 216,617 | 217 | ||||||
| Morgan Stanley Institutional Liquidity Funds – Government Portfolio, Institutional Class 0.30%3,5 | 142,606 | 142 | ||||||
| 4 | Capital Group U.S. Equity Fund |
| Short-term securities (continued) | Shares | Value (000) |
||||||
| Money market investments purchased with collateral from securities on loan (continued) | ||||||||
| Goldman Sachs Financial Square Government Fund, Institutional Shares 0.32%3,5 | 139,211 | $ | 139 | |||||
| BlackRock Liquidity Funds – FedFund, Institutional Shares 0.31%3,5 | 133,694 | 134 | ||||||
| State Street Institutional U.S. Government Money Market Fund, Institutional Class 0.26%3,5 | 133,694 | 134 | ||||||
| 1,345 | ||||||||
| Total short-term securities (cost: $7,586,000) | 7,587 | |||||||
| Total investment securities 100.34% (cost: $167,569,000) | 305,906 | |||||||
| Other assets less liabilities (0.34)% | (1,029 | ) | ||||||
| Net assets 100.00% | $ | 304,877 | ||||||
Investments in affiliates4
| Value of affiliates at 11/1/2021 (000) |
Additions (000) |
Reductions (000) |
Net realized gain (000) |
Net unrealized depreciation (000) |
Value of affiliates at 4/30/2022 (000) |
Dividend income (000) |
||||||||||||||||||||||
| Short-term securities 2.24% | ||||||||||||||||||||||||||||
| Money market investments 2.05% | ||||||||||||||||||||||||||||
| Capital Group Central Cash Fund 0.32%3 | $ | 5,813 | $ | 29,246 | $ | 28,817 | $ | — | 6 | $ | — | 6 | $ | 6,242 | $ | 8 | ||||||||||||
| Money market investments purchased with collateral from securities on loan 0.19% | ||||||||||||||||||||||||||||
| Capital Group Central Cash Fund 0.32%3,5 | 598 | 19 | 7 | 579 | — | 8 | ||||||||||||||||||||||
| Total short-term securities | 6,821 | |||||||||||||||||||||||||||
| Total 2.24% | $ | — | 6 | $ | — | 6 | $ | 6,821 | $ | 8 | ||||||||||||||||||
| 1 | Security did not produce income during the last 12 months. |
| 2 | All or a portion of this security was on loan. The total value of all such securities was $1,464,000, which represented .48% of the net assets of the fund. Refer to Note 5 for more information on securities lending. |
| 3 | Rate represents the seven-day yield at 4/30/2022. |
| 4 | Part of the same “group of investment companies” as the fund as defined under the Investment Company Act of 1940, as amended. |
| 5 | Security purchased with cash collateral from securities on loan. Refer to Note 5 for more information on securities lending. |
| 6 | Amount less than one thousand. |
| 7 | Represents net activity. Refer to Note 5 for more information on securities lending. |
| 8 | Dividend income is included with securities lending income in the fund’s statement of operations and is not shown in this table. |
Key to abbreviation
ADR = American Depositary Receipts
See notes to financial statements.
| Capital Group U.S. Equity Fund | 5 |
Financial statements
| Statement of assets and liabilities | unaudited |
| at April 30, 2022 | (dollars in thousands) |
| Assets: | ||||||||
| Investment securities, at value (includes $1,464 of investment securities on loan): | ||||||||
| Unaffiliated issuers (cost: $160,749) | $ | 299,085 | ||||||
| Affiliated issuers (cost: $6,820) | 6,821 | $ | 305,906 | |||||
| Cash | 42 | |||||||
| Cash denominated in currencies other than U.S. dollars (cost: $8) | 8 | |||||||
| Cash collateral received for securities on loan | 150 | |||||||
| Receivables for: | ||||||||
| Sales of fund’s shares | 100 | |||||||
| Services provided by related parties | 5 | |||||||
| Dividends | 291 | |||||||
| Securities lending income | 2 | 398 | ||||||
| 306,504 | ||||||||
| Liabilities: | ||||||||
| Collateral for securities on loan | 1,495 | |||||||
| Payables for: | ||||||||
| Purchases of investments | 3 | |||||||
| Repurchases of fund’s shares | 7 | |||||||
| Investment advisory services | 114 | |||||||
| Non-U.S. taxes | 8 | 132 | ||||||
| Net assets at April 30, 2022 | $ | 304,877 | ||||||
| Net assets consist of: | ||||||||
| Capital paid in on shares of beneficial interest | $ | 155,885 | ||||||
| Total distributable earnings | 148,992 | |||||||
| Net assets at April 30, 2022 | $ | 304,877 | ||||||
(dollars and shares in thousands, except per-share amounts)
Shares of beneficial interest issued and outstanding (no stated par value)
—
unlimited shares authorized (10,481 total shares outstanding)
| Net assets | Shares outstanding |
Net asset value per share |
||||||||||
| Class M | $ | 304,877 | 10,481 | $ | 29.09 | |||||||
See notes to financial statements.
| 6 | Capital Group U.S. Equity Fund |
Financial statements (continued)
| Statement of operations | unaudited |
| for the six months ended April 30, 2022 | (dollars in thousands) |
| Investment income: | ||||||||
| Income: | ||||||||
| Dividends (net of non-U.S. taxes of $33; also includes $8 from affiliates) | $ | 2,232 | ||||||
| Securities lending income (net of fees) | 6 | |||||||
| Interest | — | * | $ | 2,238 | ||||
| Fees and expenses†: | ||||||||
| Investment advisory services | 699 | |||||||
| Trustees’ compensation | 11 | |||||||
| Legal | 6 | |||||||
| Custodian | 1 | |||||||
| Other | — | * | ||||||
| Total fees and expenses before reimbursement | 717 | |||||||
| Less reimbursement of fees and expenses: | ||||||||
| Miscellaneous fee reimbursement | 18 | |||||||
| Total fees and expenses after reimbursement | 699 | |||||||
| Net investment income | 1,539 | |||||||
| Net realized gain and unrealized depreciation: | ||||||||
| Net realized gain on: | ||||||||
| Investments: | ||||||||
| Unaffiliated issuers | 10,454 | |||||||
| Affiliated issuers | — | * | 10,454 | |||||
| Net unrealized depreciation on: | ||||||||
| Investments: | ||||||||
| Unaffiliated issuers | (43,493 | ) | ||||||
| Affiliated issuers | — | * | (43,493 | ) | ||||
| Net realized gain and unrealized depreciation | (33,039 | ) | ||||||
| Net decrease in net assets resulting from operations | $ | (31,500 | ) |
| * | Amount less than one thousand. |
| † | Additional information related to non-U.S. taxes and fees and expenses is included in the notes to financial statements. |
See notes to financial statements.
| Capital Group U.S. Equity Fund | 7 |
Financial statements (continued)
Statements of changes in net assets
(dollars in thousands)
| Six months ended April 30, 2022* |
Year ended October 31, 2021 |
|||||||
| Operations: | ||||||||
| Net investment income | $ | 1,539 | $ | 2,944 | ||||
| Net realized gain | 10,454 | 16,348 | ||||||
| Net unrealized (depreciation) appreciation | (43,493 | ) | 74,660 | |||||
| Net (decrease) increase in net assets resulting from operations | (31,500 | ) | 93,952 | |||||
| Distributions paid to shareholders | (17,060 | ) | (8,461 | ) | ||||
| Net capital share transactions | 9,208 | (4,657 | ) | |||||
| Total (decrease) increase in net assets | (39,352 | ) | 80,834 | |||||
| Net assets: | ||||||||
| Beginning of period | 344,229 | 263,395 | ||||||
| End of period | $ | 304,877 | $ | 344,229 | ||||
| * | Unaudited. |
See notes to financial statements.
| 8 | Capital Group U.S. Equity Fund |
| Notes to financial statements | unaudited |
1. Organization
Capital Group U.S. Equity Fund (the “fund”) is registered under the Investment Company Act of 1940, as amended (the “1940 Act”), as an open-end, diversified management investment company. The fund seeks to provide prudent growth of capital and conservation of principal.
2. Significant accounting policies
The fund is an investment company that applies the accounting and reporting guidance issued in Topic 946 by the U.S. Financial Accounting Standards Board. The fund’s financial statements have been prepared to comply with U.S. generally accepted accounting principles (“U.S. GAAP”). These principles require the fund’s investment adviser to make estimates and assumptions that affect reported amounts and disclosures. Actual results could differ from those estimates. Subsequent events, if any, have been evaluated through the date of issuance in the preparation of the financial statements. The fund follows the significant accounting policies described in this section, as well as the valuation policies described in the next section on valuation.
Security transactions and related investment income — Security transactions are recorded by the fund as of the date the trades are executed with brokers. Realized gains and losses from security transactions are determined based on the specific identified cost of the securities. In the event a security is purchased with a delayed payment date, the fund will segregate liquid assets sufficient to meet its payment obligations. Dividend income is recognized on the ex-dividend date and interest income is recognized on an accrual basis. Market discounts, premiums and original issue discounts on fixed-income securities are amortized daily over the expected life of the security.
Distributions paid to shareholders — Income dividends and capital gain distributions are recorded on the ex-dividend date.
Currency translation — Assets and liabilities, including investment securities, denominated in currencies other than U.S. dollars are translated into U.S. dollars at the exchange rates supplied by one or more pricing vendors on the valuation date. Purchases and sales of investment securities and income and expenses are translated into U.S. dollars at the exchange rates on the dates of such transactions. The effects of changes in exchange rates on investment securities are included with the net realized gain or loss and net unrealized appreciation or depreciation on investments in the fund’s statement of operations. The realized gain or loss and unrealized appreciation or depreciation resulting from all other transactions denominated in currencies other than U.S. dollars are disclosed separately.
3. Valuation
Capital Research and Management Company (“CRMC”), the fund’s investment adviser, values the fund’s investments at fair value as defined by U.S. GAAP. The net asset value per share is calculated once daily as of the close of regular trading on the New York Stock Exchange, normally 4 p.m. New York time, each day the New York Stock Exchange is open.
Methods and inputs — The fund’s investment adviser uses the following methods and inputs to establish the fair value of the fund’s assets and liabilities. Use of particular methods and inputs may vary over time based on availability and relevance as market and economic conditions evolve.
Equity securities are generally valued at the official closing price of, or the last reported sale price on, the exchange or market on which such securities are traded, as of the close of business on the day the securities are being valued or, lacking any sales, at the last available bid price. Prices for each security are taken from the principal exchange or market on which the security trades.
| Capital Group U.S. Equity Fund | 9 |
Fixed-income securities, including short-term securities, are generally valued at prices obtained from one or more pricing vendors. Vendors value such securities based on one or more of the inputs described in the following table. The table provides examples of inputs that are commonly relevant for valuing particular classes of fixed-income securities in which the fund is authorized to invest. However, these classifications are not exclusive, and any of the inputs may be used to value any other class of fixed-income security.
| Fixed-income class | Examples of standard inputs |
| All | Benchmark yields, transactions, bids, offers, quotations from dealers and trading systems, new issues, spreads and other relationships observed in the markets among comparable securities; and proprietary pricing models such as yield measures calculated using factors such as cash flows, financial or collateral performance and other reference data (collectively referred to as “standard inputs”) |
| Corporate bonds, notes & loans; convertible securities | Standard inputs and underlying equity of the issuer |
| Bonds & notes of governments & government agencies | Standard inputs and interest rate volatilities |
| Mortgage-backed; asset-backed obligations | Standard inputs and cash flows, prepayment information, default rates, delinquency and loss assumptions, collateral characteristics, credit enhancements and specific deal information |
When the fund’s investment adviser deems it appropriate to do so (such as when vendor prices are unavailable or deemed to be not representative), fixed-income securities will be valued in good faith at the mean quoted bid and ask prices that are reasonably and timely available (or bid prices, if ask prices are not available) or at prices for securities of comparable maturity, quality and type.
Securities with both fixed-income and equity characteristics, or equity securities traded principally among fixed-income dealers, are generally valued in the manner described for either equity or fixed-income securities, depending on which method is deemed most appropriate by the fund’s investment adviser. The Capital Group Central Cash Fund (“CCF”), a fund within the Capital Group Central Fund Series (“Central Funds”), is valued based upon a floating net asset value, which fluctuates with changes in the value of CCF’s portfolio securities. The underlying securities are valued based on the policies and procedures in CCF’s statement of additional information.
Securities and other assets for which representative market quotations are not readily available or are considered unreliable by the fund’s investment adviser are fair valued as determined in good faith under fair valuation guidelines adopted by authority of the fund’s board of trustees as further described. The investment adviser follows fair valuation guidelines, consistent with U.S. Securities and Exchange Commission rules and guidance, to consider relevant principles and factors when making fair value determinations. The investment adviser considers relevant indications of value that are reasonably and timely available to it in determining the fair value to be assigned to a particular security, such as the type and cost of the security; contractual or legal restrictions on resale of the security; relevant financial or business developments of the issuer; actively traded similar or related securities; conversion or exchange rights on the security; related corporate actions; significant events occurring after the close of trading in the security; and changes in overall market conditions. In addition, the closing prices of equity securities that trade in markets outside U.S. time zones may be adjusted to reflect significant events that occur after the close of local trading but before the net asset value of each share class of the fund is determined. Fair valuations and valuations of investments that are not actively trading involve judgment and may differ materially from valuations that would have been used had greater market activity occurred.
Processes and structure — The fund’s board of trustees has delegated authority to the fund’s investment adviser to make fair value determinations, subject to board oversight. The investment adviser has established a Joint Fair Valuation Committee (the “Fair Valuation Committee”) to administer, implement and oversee the fair valuation process, and to make fair value decisions. The Fair Valuation Committee regularly reviews its own fair value decisions, as well as decisions made under its standing instructions to the investment adviser’s valuation teams. The Fair Valuation Committee reviews changes in fair value measurements from period to period and may, as deemed appropriate, update the fair valuation guidelines to better reflect the results of back testing and address new or evolving issues. The Fair Valuation Committee reports any changes to the fair valuation guidelines to the board of trustees. The fund’s board and audit committee also regularly review reports that describe fair value determinations and methods.
The fund’s investment adviser has also established a Fixed-Income Pricing Review Group to administer and oversee the fixed-income valuation process, including the use of fixed-income pricing vendors. This group regularly reviews pricing vendor information and market data. Pricing decisions, processes and controls over security valuation are also subject to additional internal reviews facilitated by the investment adviser’s global risk management group.
Classifications — The fund’s investment adviser classifies the fund’s assets and liabilities into three levels based on the inputs used to value the assets or liabilities. Level 1 values are based on quoted prices in active markets for identical securities. Level 2 values are based on significant observable market inputs, such as quoted prices for similar securities and quoted prices in inactive markets. Certain securities
| 10 | Capital Group U.S. Equity Fund |
trading outside the U.S. may transfer between Level 1 and Level 2 due to valuation adjustments resulting from significant market movements following the close of local trading. Level 3 values are based on significant unobservable inputs that reflect the investment adviser’s determination of assumptions that market participants might reasonably use in valuing the securities. The valuation levels are not necessarily an indication of the risk or liquidity associated with the underlying investment. For example, U.S. government securities are reflected as Level 2 because the inputs used to determine fair value may not always be quoted prices in an active market. At April 30, 2022, all of the fund’s investments were classified as Level 1.
4. Risk factors
Market conditions — The prices of, and the income generated by, the securities held by the fund may decline — sometimes rapidly or unpredictably — due to various factors, including events or conditions affecting the general economy or particular industries; overall market changes; local, regional or global political, social or economic instability; governmental, governmental agency or central bank responses to economic conditions; and currency exchange rate, interest rate and commodity price fluctuations.
Economies and financial markets throughout the world are highly interconnected. Economic, financial or political events, trading and tariff arrangements, wars, terrorism, cybersecurity events, natural disasters, public health emergencies (such as the spread of infectious disease) and other circumstances in one country or region, including actions taken by governmental or quasi-governmental authorities in response to any of the foregoing, could have impacts on global economies or markets. As a result, whether or not the fund invests in securities of issuers located in or with significant exposure to the countries affected, the value and liquidity of the fund’s investments may be negatively affected by developments in other countries and regions.
Issuer risks — The prices of, and the income generated by, securities held by the fund may decline in response to various factors directly related to the issuers of such securities, including reduced demand for an issuer’s goods or services, poor management performance, major litigation, investigations or other controversies related to the issuer, changes in government regulations affecting the issuer or its competitive environment and strategic initiatives such as mergers, acquisitions or dispositions and the market response to any such initiatives.
Investing in growth-oriented stocks — Growth-oriented common stocks and other equity-type securities (such as preferred stocks, convertible preferred stocks and convertible bonds) may involve larger price swings and greater potential for loss than other types of investments.
Investing in income-oriented stocks — The value of the fund’s securities and income provided by the fund may be reduced by changes in the dividend policies of, and the capital resources available for dividend payments at, the companies in which the fund invests.
Investing outside the U.S. — Securities of issuers domiciled outside the U.S., or with significant operations or revenues outside the U.S., may lose value because of adverse political, social, economic or market developments (including social instability, regional conflicts, terrorism and war) in the countries or regions in which the issuers operate or generate revenue. These securities may also lose value due to changes in foreign currency exchange rates against the U.S. dollar and/or currencies of other countries. Issuers of these securities may be more susceptible to actions of foreign governments, such as nationalization, currency blockage or the imposition of price controls or punitive taxes, each of which could adversely impact the value of these securities. Securities markets in certain countries may be more volatile and/or less liquid than those in the U.S. Investments outside the U.S. may also be subject to different accounting and auditing practices and standards and different regulatory, legal and reporting requirements, and may be more difficult to value, than those in the U.S. In addition, the value of investments outside the U.S. may be reduced by foreign taxes, including foreign withholding taxes on interest and dividends. Further, there may be increased risks of delayed settlement of securities purchased or sold by the fund. The risks of investing outside the U.S may be heightened in connection with investments in emerging markets.
Management — The investment adviser to the fund actively manages the fund’s investments. Consequently, the fund is subject to the risk that the methods and analyses, including models, tools and data, employed by the investment adviser in this process may be flawed or incorrect and may not produce the desired results. This could cause the fund to lose value or its investment results to lag relevant benchmarks or other funds with similar objectives.
5. Certain investment techniques
Securities lending — The fund has entered into securities lending transactions in which the fund earns income by lending investment securities to brokers, dealers or other institutions. Each transaction involves three parties: the fund, acting as the lender of the securities, a borrower, and a lending agent that acts as an intermediary.
| Capital Group U.S. Equity Fund | 11 |
Securities lending transactions are entered into by the fund under a securities lending agent agreement with the lending agent. The lending agent facilitates the exchange of securities between the fund and approved borrowers, ensures that securities loans are properly coordinated and documented, marks-to-market the value of collateral daily, secures additional collateral from a borrower if it falls below preset terms, and may reinvest cash collateral on behalf of the fund according to agreed parameters. The lending agent provides indemnification to the fund against losses resulting from a borrower default. Although risk is mitigated by the collateral and indemnification, the fund could experience a delay in recovering its securities and a potential loss of income or value if a borrower fails to return securities, collateral investments decline in value or the lending agent fails to perform.
The borrower is required to post highly liquid assets, such as cash or U.S. government securities, as collateral for the loan in an amount at least equal to the value of the securities loaned. Investments made with cash collateral are recognized as assets in the fund’s investment portfolio. The same amount is recorded as a liability in the fund’s statement of assets and liabilities. While securities are on loan, the fund will continue to receive the equivalent of the interest, dividends or other distributions paid by the issuer, as well as a portion of the interest on the investment of the collateral. Additionally, although the fund does not have the right to vote on securities while they are on loan, the fund has a right to consent on corporate actions and a right to recall loaned securities to vote. A borrower is obligated to return loaned securities at the conclusion of a loan or, during the pendency of a loan, on demand from the fund.
As of April 30, 2022, the total value of securities on loan was $1,464,000, and the total value of collateral received was $1,495,000, which consisted entirely of cash. Investment securities purchased from cash collateral are disclosed in the fund’s investment portfolio as short-term securities. Securities received as collateral, if any, are not recognized as fund assets. The contractual maturity of cash collateral received under the securities lending agreement is classified as overnight and continuous.
Collateral — The fund receives highly liquid assets, such as cash or U.S. government securities, as collateral in exchange for lending investment securities. The purpose of the collateral is to cover potential losses that could occur in the event the borrower cannot meet its contractual obligation. The lending agent may reinvest cash collateral from securities lending transactions according to agreed parameters. Cash collateral reinvested by the lending agent, if any, is disclosed in the fund’s investment portfolio.
6. Taxation and distributions
Federal income taxation — The fund complies with the requirements under Subchapter M of the Internal Revenue Code applicable to regulated investment companies and intends to distribute substantially all of its net taxable income and net capital gains each year. The fund is not subject to income taxes to the extent such distributions are made. Therefore, no federal income tax provision is required.
As of and during the period ended April 30, 2022, the fund did not have a liability for any unrecognized tax benefits. The fund recognizes interest and penalties, if any, related to unrecognized tax benefits as income tax expense in the statement of operations. During the period, the fund did not incur any significant interest or penalties.
The fund’s tax returns are generally not subject to examination by federal, state and, if applicable, non-U.S. tax authorities after the expiration of each jurisdiction’s statute of limitations, which is typically three years after the date of filing but can be extended in certain jurisdictions.
Non-U.S. taxation — Dividend income is recorded net of non-U.S. taxes paid. The fund may file withholding tax reclaims in certain jurisdictions to recover a portion of amounts previously withheld. These reclaims are recorded when the amount is known and there are no significant uncertainties on collectability. Gains realized by the fund on the sale of securities in certain countries, if any, may be subject to non-U.S. taxes. If applicable, the fund records an estimated deferred tax liability based on unrealized gains to provide for potential non-U.S. taxes payable upon the sale of these securities.
Distributions — Distributions determined on a tax basis may differ from net investment income and net realized gains for financial reporting purposes. These differences are due primarily to different treatment for items such as currency gains and losses; short-term capital gains and losses and capital losses related to sales of certain securities within 30 days of purchase. The fiscal year in which amounts are distributed may differ from the year in which the net investment income and net realized gains are recorded by the fund for financial reporting purposes.
The components of distributable earnings on a tax basis are reported as of the fund’s most recent year-end. As of October 31, 2021, the components of distributable earnings on a tax basis were as follows (dollars in thousands):
| Undistributed ordinary income | $ 195 |
| Undistributed long-term capital gains | 15,579 |
| 12 | Capital Group U.S. Equity Fund |
As of April 30, 2022, the tax basis unrealized appreciation (depreciation) and cost of investments were as follows (dollars in thousands):
| Gross unrealized appreciation on investments | $145,744 | |
| Gross unrealized depreciation on investments | (7,457 | ) |
| Net unrealized appreciation on investments | 138,287 | |
| Cost of investments | 167,619 |
Distributions paid were characterized for tax purposes as follows (dollars in thousands):
| Six months ended April 30, 2022 | Year ended October 31, 2021 | |||||||||||||||||||||||
| Share class | Ordinary income |
Long-term capital gains |
Total distributions paid |
Ordinary income |
Long-term capital gains |
Total distributions paid |
||||||||||||||||||
| Class M | $ | 1,480 | $ | 15,580 | $ | 17,060 | $ | 2,962 | $ | 5,499 | $ | 8,461 | ||||||||||||
7. Fees and transactions with related parties
CRMC, the fund’s investment adviser, is the parent company of American Funds Distributors®, Inc. (“AFD”), the principal underwriter of the fund’s share, and American Funds Service Company® (“AFS”), the fund’s transfer agent. CRMC, AFD and AFS are considered related parties to the fund.
Investment advisory services — The fund has an investment advisory and service agreement with CRMC that provides for monthly fees accrued daily. For the services it provides to the fund, CRMC receives a unified management fee of 0.425% of the daily net assets of the fund. Out of the fund’s unified management fee CRMC pays all expenses of managing and operating the fund except brokerage expenses, taxes, interest, fees and expenses of the independent trustees (including legal counsel fees) and extraordinary expenses, such as litigation expenses. These expenses, which are not paid by CRMC from the unified management fee, are paid by the fund, which are currently reimbursed by CRMC.
Miscellaneous fee reimbursement — Expense limitations have been imposed through at least January 1, 2023, to limit the share class’s total annual operating expense to 0.425% as a percentage of daily net assets. For the period ended April 30, 2022, CRMC reimbursed miscellaneous fees of $18,000 for the fund. CRMC may recoup all or a portion of this reimbursement by the end of the current fiscal year. Fees and expenses in the statement of operations are presented gross of any reimbursements from CRMC.
Affiliated officers and trustees — Officers and certain trustees of the fund are or may be considered to be affiliated with CRMC. No affiliated officers or trustees received any compensation directly from the fund.
Investment in CCF — The fund holds shares of CCF, an institutional prime money market fund managed by CRMC. CCF invests in high-quality, short-term money market instruments. CCF is used as the primary investment vehicle for the fund’s short-term investments. CCF shares are only available for purchase by CRMC, its affiliates, and other funds managed by CRMC or its affiliates, and are not available to the public. CRMC does not receive an investment advisory services fee from CCF.
Security transactions with related funds — The fund purchased securities from, and sold securities to, other funds managed by CRMC (or funds managed by certain affiliates of CRMC) under procedures adopted by the fund’s board of trustees. The funds involved in such transactions are considered related by virtue of having a common investment adviser (or affiliated investment advisers), common trustees and/or common officers. Each transaction was executed at the current market price of the security and no brokerage commissions or fees were paid in accordance with Rule 17a-7 of the 1940 Act. During the six months ended April 30, 2022, the fund engaged in such purchase and sale transactions with related funds in the amounts of $3,552,000 and $688,000, respectively, which generated $214,000 of net realized gains from such sales.
| Capital Group U.S. Equity Fund | 13 |
Interfund lending — Pursuant to an exemptive order issued by the SEC, the fund, along with other CRMC-managed funds (or funds managed by certain affiliates of CRMC), may participate in an interfund lending program. The program provides an alternate credit facility that permits the funds to lend or borrow cash for temporary purposes directly to or from one another, subject to the conditions of the exemptive order. The fund did not lend or borrow cash through the interfund lending program at any time during the six months ended April 30, 2022.
8. Indemnifications
The fund’s organizational documents provide board members and officers with indemnification against certain liabilities or expenses in connection with the performance of their duties to the fund. In the normal course of business, the fund may also enter into contracts that provide general indemnifications. The fund’s maximum exposure under these arrangements is unknown since it is dependent on future claims that may be made against the fund. The risk of material loss from such claims is considered remote. Insurance policies are also available to the fund’s board members and officers.
9. Capital share transactions
Capital share transactions in the fund were as follows (dollars and shares in thousands):
| Sales | Reinvestments of distributions |
Repurchases | Net increase (decrease) |
|||||||||||||||||||||||||||||
| Share class | Amount | Shares | Amount | Shares | Amount | Shares | Amount | Shares | ||||||||||||||||||||||||
| Six months ended April 30, 2022 | ||||||||||||||||||||||||||||||||
| Class M | $ | 9,950 | 320 | $ | 16,665 | 520 | $ | (17,407 | ) | (553 | ) | $ | 9,208 | 287 | ||||||||||||||||||
| Year ended October 31, 2021 | ||||||||||||||||||||||||||||||||
| Class M | $ | 21,709 | 740 | $ | 8,259 | 292 | $ | (34,625 | ) | (1,152 | ) | $ | (4,657 | ) | (120 | ) | ||||||||||||||||
10. Investment transactions
The fund made purchases and sales of investment securities, excluding short-term securities and U.S. government obligations, if any, of $27,848,000 and $33,349,000, respectively, during the six months ended April 30, 2022.
| 14 | Capital Group U.S. Equity Fund |
Financial highlights
| (Loss) income from investment operations1 |
Dividends and distributions | |||||||||||||||||||||||||||||||||||||||||||||||||||
| Year ended | Net asset value, beginning of year |
Net investment income |
Net (losses) gains on securities (both realized and unrealized) |
Total from investment operations |
Dividends (from net investment income) |
Distributions (from capital gains) |
Total dividends and distributions |
Net asset value, end of year |
Total return2 |
Net assets,
|
Ratio of expenses to average net assets before reimbursements3 |
Ratio of
|
Ratio of net income to average net assets2 |
|||||||||||||||||||||||||||||||||||||||
| 4/30/20224,5 | $ | 33.77 | $ | .15 | $ | (3.16 | ) | $ | (3.01 | ) | $ | (.14 | ) | $ | (1.53 | ) | $ | (1.67 | ) | $ | 29.09 | (9.34 | )%6 | $ | 305 | .44 | %7 | .43 | %7 | .94 | %7 | |||||||||||||||||||||
| 10/31/2021 | 25.54 | .28 | 8.78 | 9.06 | (.29 | ) | (.54 | ) | (.83 | ) | 33.77 | 36.12 | 344 | .43 | .43 | .94 | ||||||||||||||||||||||||||||||||||||
| 10/31/2020 | 24.57 | .28 | 1.77 | 2.05 | (.29 | ) | (.79 | ) | (1.08 | ) | 25.54 | 8.51 | 263 | .45 | .42 | 1.12 | ||||||||||||||||||||||||||||||||||||
| 10/31/2019 | 22.78 | .34 | 3.27 | 3.61 | (.35 | ) | (1.47 | ) | (1.82 | ) | 24.57 | 17.65 | 244 | .45 | .42 | 1.49 | ||||||||||||||||||||||||||||||||||||
| 10/31/2018 | 22.95 | .34 | .85 | 1.19 | (.29 | ) | (1.07 | ) | (1.36 | ) | 22.78 | 5.30 | 223 | .44 | .43 | 1.45 | ||||||||||||||||||||||||||||||||||||
| 10/31/2017 | 19.78 | .32 | 4.02 | 4.34 | (.31 | ) | (.86 | ) | (1.17 | ) | 22.95 | 22.76 | 236 | .53 | .52 | 1.52 | ||||||||||||||||||||||||||||||||||||
| Six months ended April 30, |
Year ended October 31, | |||||||||||||||||||||||
| 20224,5,6 | 2021 | 2020 | 2019 | 2018 | 2017 | |||||||||||||||||||
| Portfolio turnover rate for all share classes8 | 9 | % | 15 | % | 19 | % | 16 | % | 22 | % | 19 | % | ||||||||||||
| 1 | Based on average shares outstanding. |
| 2 | This column reflects the impact, if any, of certain reimbursements from CRMC. During some of the years shown, CRMC reimbursed a portion of miscellaneous fees and expenses. |
| 3 | Ratios do not include expenses of any Central Funds. The fund indirectly bears its proportionate share of the expenses of any Central Funds. |
| 4 | Based on operations for a period that is less than a full year. |
| 5 | Unaudited. |
| 6 | Not annualized. |
| 7 | Annualized. |
| 8 | Rates do not include the fund’s portfolio activity with respect to any Central Funds. |
See notes to financial statements.
| Capital Group U.S. Equity Fund | 15 |
| Expense example | unaudited |
As a shareholder of the fund, you incur ongoing costs, including management fees and other expenses. This example is intended to help you understand your ongoing costs (in dollars) of investing in the fund so you can compare these costs with the ongoing costs of investing in other mutual funds. The example is based on an investment of $1,000 invested at the beginning of the period and held for the entire six-month period (November 1, 2021, through April 30, 2022).
Actual expenses:
The first line in the table provides information about actual account values and actual expenses. You may use the information in this line, together with the amount you invested, to estimate the expenses that you paid over the period. Simply divide your account value by $1,000 (for example, an $8,600 account value divided by $1,000 = 8.6), then multiply the result by the number in the first line under the heading titled “Expenses paid during period” to estimate the expenses you paid on your account during this period.
Hypothetical example for comparison purposes:
The second line in the table provides information about hypothetical account values and hypothetical expenses based on the actual expense ratio for the share class and an assumed rate of return of 5.00% per year before expenses, which is not the actual return of the share class. The hypothetical account values and expenses may not be used to estimate the actual ending account balance or expenses you paid for the period. You may use this information to compare the ongoing costs of investing in the fund and other funds. To do so, compare this 5.00% hypothetical example with the 5.00% hypothetical examples that appear in the shareholder reports of the other funds.
Notes:
Shareholders of the fund may be subject to an additional fee charged by CRMC’s Capital Group Private Client Services division for the ongoing services provided to the shareholder. You can estimate the impact of these fees by adding the amount of the fees to the total estimated expenses you paid on your account during the period as calculated above. In addition, your ending account value would be lower by the amount of these fees. Note that the expenses shown in the table are meant to highlight your ongoing costs only. The second line in the table is useful in comparing ongoing costs only and will not help you determine the relative total costs of owning different funds.
| Beginning account value 11/1/2021 |
Ending account value 4/30/2022 |
Expenses paid during period* |
Annualized expense ratio |
|||||||||||||
| Capital Group U.S. Equity Fund | ||||||||||||||||
| Actual return | $ | 1,000.00 | $ | 906.56 | $ | 2.03 | .43 | % | ||||||||
| Assumed 5% return | 1,000.00 | 1,022.66 | 2.16 | .43 | ||||||||||||
| * | The “expenses paid during period” are equal to the “annualized expense ratio,” multiplied by the average account value over the period, multiplied by the number of days in the period, and divided by 365 (to reflect the one-half year period). |
| 16 | Capital Group U.S. Equity Fund |
Approval of Investment Advisory and Service Agreement
The fund’s board has approved the continuation of the fund’s Investment Advisory and Service Agreement (the “agreement”) with Capital Research and Management Company (“CRMC”) for an additional one-year term through July 31, 2023. The board approved the agreement following the recommendation of the fund’s Contracts Committee (the “committee”), which is composed of all the fund’s independent board members. The board and the committee determined in the exercise of their business judgment that the fund’s advisory fee structure was fair and reasonable in relation to the services provided, and that approving the agreement was in the best interests of the fund and its shareholders.
In reaching this decision, the board and the committee took into account their interactions with CRMC as well as information furnished to them throughout the year and otherwise provided to them, as well as information prepared specifically in connection with their review of the agreement, and were advised by their independent counsel with respect to the matters considered. They considered the following factors, among others, but did not identify any single issue or particular piece of information that, in isolation, was the controlling factor, and each board and committee member did not necessarily attribute the same weight to each factor.
1. Nature, extent and quality of services
The board and the committee considered the depth and quality of CRMC’s investment management process, including its global research capabilities; the experience, capability and integrity of its senior management and other personnel; the low turnover rates of its key personnel; the overall financial strength and stability of CRMC and the Capital Group organization; the resources and systems CRMC devotes to investment management (the manner in which the fund’s assets are managed, including liquidity management), financial, investment operations, compliance, trading, proxy voting, shareholder communications, and other services; and the ongoing evolution of CRMC’s organizational structure designed to maintain and strengthen these qualities. The board and the committee also considered the nature, extent and quality of administrative and shareholder services provided by CRMC to the fund under the agreement and other agreements, as well as the benefits to fund shareholders from investing in a fund that is part of a large family of funds. The board and the committee considered the risks assumed by CRMC in providing services to the fund, including operational, business, financial, reputational, regulatory and litigation risks. The board and the committee concluded that the nature, extent and quality of the services provided by CRMC have benefited and should continue to benefit the fund and its shareholders.
2. Investment results
The board and the committee considered the investment results of the fund in light of its objective. They compared the fund’s investment results with those of other funds (including funds that currently form the basis of the Lipper index for the category in which the fund is included) and data such as relevant market and fund indexes over various periods (including the fund’s lifetime) through December 31, 2021. They generally placed greater emphasis on investment results over longer term periods. On the basis of this evaluation and the board’s and the committee’s ongoing review of investment results, and considering the relative market conditions during certain reporting periods, the board and the committee concluded that the fund’s investment results have been sufficient for renewal of the agreement, and that CRMC’s record in managing the fund indicated that its continued management should benefit the fund and its shareholders.
3. Advisory fees and total expenses
The board and the committee compared the advisory fees and total expense levels of the fund to those of other relevant funds, noting that the fund has a unitary management fee. They observed that the fund’s advisory fees and expenses generally compared favorably to those of other similar funds included in the comparable Lipper category. The board and the committee noted that, although the fees paid by CRMC clients with separately managed accounts generally were lower than those paid by the fund, the differences appropriately reflected the investment, operational, regulatory and market differences between advising the fund and separately managed accounts. They also recognized that the fees for certain separately managed accounts could be lower than those of the fund due to the sizes of the accounts and the clients’ overall relationships with CRMC. The board and the committee concluded that the fund’s cost structure was fair and reasonable in relation to the services provided, as well as in relation to the risks assumed by the adviser in sponsoring and managing the fund, and that the fund’s shareholders receive reasonable value in return for the advisory fees and other amounts paid to CRMC by the fund.
| Capital Group U.S. Equity Fund | 17 |
4. Ancillary benefits
The board and the committee considered a variety of other benefits that CRMC and its affiliates receive as a result of CRMC’s relationship with the fund, including fees paid to CRMC’s affiliated transfer agent; sales charges and distribution fees received and retained by the fund’s principal underwriter, an affiliate of CRMC; and possible ancillary benefits to CRMC and its institutional management affiliates in managing other investment vehicles. The board and the committee reviewed CRMC’s portfolio trading practices, noting that through December 31, 2018, CRMC benefited from research obtained with commissions from portfolio transactions made on behalf of each fund, and since that time has undertaken to bear the cost of obtaining such research. The board and the committee took these ancillary benefits into account in evaluating the reasonableness of the advisory fees and other amounts paid to CRMC by the fund.
5. Adviser financial information
The board and the committee reviewed information regarding CRMC’s costs of providing services to the fund, including personnel, systems and resources of investment, compliance, trading, accounting and other administrative operations. They considered CRMC’s costs and related cost allocation methodology as well as its track record of investing in technology, infrastructure and staff to maintain and expand services and capabilities, respond to industry and regulatory developments, and attract and retain qualified personnel. They noted information regarding the compensation structure for CRMC’s investment professionals. They reviewed information on the profitability of the investment adviser and its affiliates. The board and the committee also compared CRMC’s profitability and compensation data to the reported results and data of a number of large, publicly held investment management companies. The board and the committee noted the competitiveness and cyclicality of both the mutual fund industry and the capital markets, and the importance in that environment of CRMC’s long-term profitability for maintaining its independence, company culture and management continuity. They further considered CRMC’s reimbursement of fund expenses through voluntary fee caps and, as applicable, the sharing of potential economies of scale, or efficiencies, through breakpoints and other fee reductions and costs voluntarily absorbed. The board and the committee concluded that the fund’s advisory fee structure reflected a reasonable sharing of benefits between CRMC and the fund’s shareholders.
| 18 | Capital Group U.S. Equity Fund |
| Liquidity Risk Management Program | unaudited |
The fund has adopted a liquidity risk management program (the “program”). The fund’s board has designated Capital Research and Management Company (“CRMC”) as the administrator of the program. Personnel of CRMC or its affiliates conduct the day-to-day operation of the program pursuant to policies and procedures administered by the Capital Group Liquidity Risk Management Committee.
Under the program, CRMC manages the fund’s liquidity risk, which is the risk that the fund could not meet shareholder redemption requests without significant dilution of remaining shareholders’ interests in the fund. This risk is managed by monitoring the degree of liquidity of the fund’s investments, limiting the amount of the fund’s illiquid investments, and utilizing various risk management tools and facilities available to the fund for meeting shareholder redemptions, among other means. CRMC’s process of determining the degree of liquidity of the fund’s investments is supported by one or more third-party liquidity assessment vendors.
The fund’s board reviewed a report prepared by CRMC regarding the operation and effectiveness of the program for the period October 1, 2020, through September 30, 2021. No significant liquidity events impacting the fund were noted in the report. In addition, CRMC provided its assessment that the program had been effective in managing the fund’s liquidity risk.
| Capital Group U.S. Equity Fund | 19 |
This page was intentionally left blank.
| 20 | Capital Group U.S. Equity Fund |

Office of the fund
6455 Irvine Center Drive
Irvine, CA 92618-4518
Investment adviser
Capital Research and Management Company
333 South Hope Street
Los Angeles, CA 90071-1406
Transfer agent for shareholder accounts
American Funds Service Company
(Write to the address nearest you.)
P.O. Box 6007
Indianapolis, IN 46206-6007
P.O. Box 2280
Norfolk, VA 23501-2280
Custodian of assets
State Street Bank and Trust Company
One Lincoln Street
Boston, MA 02111-2900
Counsel
Morgan, Lewis & Bockius LLP
One Federal Street
Boston, MA 02110-1726
Independent registered public accounting firm
PricewaterhouseCoopers LLP
601 South Figueroa Street
Los Angeles, CA 90017-3874
Principal underwriter
American Funds Distributors, Inc.
333 South Hope Street
Los Angeles, CA 90071-1406
Investors should carefully consider investment objectives, risks, charges and expenses. This and other important information is contained in the fund prospectus, which can be obtained from Capital Research and Management Company by calling (800) 266-9532 and should be read carefully before investing.
Capital Group Private Client Services files a complete list of its portfolio holdings with the U.S. Securities and Exchange Commission (SEC) for the first and third quarters of each fiscal year on Form NPORT-P. This filing is available free of charge on the SEC website (www.sec.gov). Additionally, the list of portfolio holdings is available by calling your relationship manager at (800) 266-9532.
The proxy voting procedures and policies of Capital Group U.S. Equity Fund — which describe how we vote proxies relating to portfolio securities — are available upon request by calling your relationship manager at (800) 266-9532. The fund files its proxy voting record with the SEC for the 12 months ended June 30 by August 31. The report also is available on the SEC website or by calling your relationship manager.
S&P 500 Index is a product of S&P Dow Jones Indices LLC and/or its affiliates and has been licensed for use by Capital Group. Copyright © 2022 S&P Dow Jones Indices LLC, a division of S&P Global, and/or its affiliates. All rights reserved. Redistribution or reproduction in whole or in part is prohibited without written permission of S&P Dow Jones Indices LLC.
If used as sales material after June 30, 2022, this report must be accompanied by the Capital Group U.S. Equity Fund Quarterly Results document for the most recently completed calendar quarter.
American Funds Distributors, Inc., member FINRA.
All Capital Group trademarks mentioned are owned by The Capital Group Companies, Inc., an affiliated company or fund. All other company and product names mentioned are the property of their respective companies.

ITEM 2 – Code of Ethics
Not applicable for filing of semi-annual reports to shareholders.
ITEM 3 – Audit Committee Financial Expert
Not applicable for filing of semi-annual reports to shareholders.
ITEM 4 – Principal Accountant Fees and Services
Not applicable for filing of semi-annual reports to shareholders.
ITEM 5 – Audit Committee of Listed Registrants
Not applicable to this Registrant, insofar as the Registrant is not a listed issuer as defined in Rule 10A-3 under the Securities Exchange Act of 1934.
ITEM 6 – Schedule of Investments
Not applicable, insofar as the schedule is included as part of the report to shareholders filed under Item 1 of this Form.
ITEM 7 – Disclosure of Proxy Voting Policies and Procedures for Closed-End Management Investment Companies.
Not applicable to this Registrant, insofar as the Registrant is not a closed-end management investment company.
ITEM 8 – Portfolio Managers of Closed-End Management Investment Companies
Not applicable to this Registrant, insofar as the Registrant is not a closed-end management investment company.
ITEM 9 – Purchases of Equity Securities by Closed-End Management Investment Company and Affiliated Purchasers
Not applicable to this Registrant, insofar as the Registrant is not a closed-end management investment company.
ITEM 10 – Submission of Matters to a Vote of Security Holders
There have been no material changes to the procedures by which shareholders may recommend nominees to the Registrant’s board of trustees since the Registrant last submitted a proxy statement to its shareholders. The procedures are as follows. The Registrant has a nominating committee comprised solely of persons who are not considered ‘‘interested persons’’ of the Registrant within the meaning of the Investment Company Act of 1940, as amended. The committee periodically reviews such issues as the board’s composition, responsibilities, committees, compensation and other relevant issues, and recommends any appropriate changes to the full board of trustees. While the committee normally is able to identify from its own resources an ample number of qualified candidates, it will consider shareholder suggestions of persons to be considered as nominees to fill future vacancies on the board. Such suggestions must be sent in writing to the nominating committee of the Registrant, c/o the Registrant’s Secretary, and must be accompanied by complete biographical and occupational data on the prospective nominee, along with a written consent of the prospective nominee for consideration of his or her name by the nominating committee.
ITEM 11 – Controls and Procedures
| (a) | The Registrant’s Principal Executive Officer and Principal Financial Officer have concluded, based on their evaluation of the Registrant’s disclosure controls and procedures (as such term is defined in Rule 30a-3 under the Investment Company Act of 1940), that such controls and procedures are adequate and reasonably designed to achieve the purposes described in paragraph (c) of such rule. |
| (b) |
There were no changes in the Registrant’s internal controls over financial reporting (as defined in Rule 30a-3(d) under the Investment Company Act of 1940) that occurred during the Registrant’s semi-annual period covered by this report that has materially affected, or is reasonably likely to materially affect, the Registrant’s internal control over financial reporting.
|
ITEM 12 – Exhibits
| (a)(1) | Not applicable for filing of semi-annual reports to shareholders. |
| (a)(2) | The certifications required by Rule 30a-2 of the Investment Company Act of 1940 and Sections 302 and 906 of the Sarbanes-Oxley Act of 2002 are attached as exhibits hereto. |
SIGNATURES
Pursuant to the requirements of the Securities Exchange Act of 1934 and the Investment Company Act of 1940, the Registrant has duly caused this report to be signed on its behalf by the undersigned, thereunto duly authorized.
| CAPITAL GROUP U.S. EQUITY FUND | |
| By __/s/ John S. Armour____________________ | |
|
John S. Armour, President and Principal Executive Officer | |
| Date: June 30, 2022 |
Pursuant to the requirements of the Securities Exchange Act of 1934 and the Investment Company Act of 1940, this report has been signed below by the following persons on behalf of the Registrant and in the capacities and on the dates indicated.
| By __/s/ John S. Armour_________________ |
|
John S. Armour, President and Principal Executive Officer |
| Date: June 30, 2022 |
| By ___/s/ Gregory F. Niland __________ |
|
Gregory F. Niland, Treasurer and Principal Financial Officer |
| Date: June 30, 2022 |
|
Capital Group U.S. Equity Fund 6455 Irvine Center Drive Irvine, California 92618 (949) 975-5000 |
CERTIFICATION
I, John S. Armour, certify that:
| 1. | I have reviewed this report on Form N-CSR of Capital Group U.S. Equity Fund; |
| 2. | Based on my knowledge, this report does not contain any untrue statement of a material fact or omit to state a material fact necessary to make the statements made, in light of the circumstances under which such statements were made, not misleading with respect to the period covered by this report; |
| 3. | Based on my knowledge, the financial statements, and other financial information included in this report, fairly present in all material respects the financial condition, results of operations, changes in net assets, and cash flows (if the financial statements are required to include a statement of cash flows) of the registrant as of, and for, the periods presented in this report; |
| 4. | The registrant's other certifying officer(s) and I are responsible for establishing and maintaining disclosure controls and procedures (as defined in rule 30a-3(c) under the Investment Company Act of 1940) and internal controls over financial reporting (as defined in Rule 30a-3(d) under the Investment Company Act of 1940) for the registrant and have: |
| a) Designed such disclosure controls and procedures, or caused such disclosure controls and procedures to be designed under our supervision, to ensure that material information relating to the registrant, including its consolidated subsidiaries, is made known to us by others within those entities, particularly during the period in which this report is being prepared; | |
| b) Designed such internal control over financial reporting, or caused such internal control over financial reporting to be designed under our supervision, to provide reasonable assurance regarding the reliability of financial reporting and the preparation of financial statements for external purposes in accordance with generally accepted accounting principles; | |
| c) Evaluated the effectiveness of the registrant's disclosure controls and procedures and presented in this report our conclusions about the effectiveness of the disclosure controls and procedures, as of a date within 180 days prior to the filing date of this report based on such evaluation; and | |
| d) Disclosed in this report any change in the registrant’s internal control over financial reporting that occurred during the registrant’s semi-annual period covered by this report that has materially affected, or is reasonably likely to materially affect, the registrant’s internal control over financial reporting; and | |
| 5. | The registrant's other certifying officer(s) and I have disclosed to the registrant's auditors and the audit committee of the registrant's Board of Trustees (or persons performing the equivalent functions): |
| a) All significant deficiencies and material weaknesses in the design or operation of internal control over financial reporting which are reasonably likely to adversely affect the registrant’s ability to record, process, summarize, and report financial information; and | |
| b) Any fraud, whether or not material, that involves management or other employees who have a significant role in the registrant's internal control over financial reporting. |
Date: June 30, 2022
___/s/ John S. Armour_____________________
John S. Armour, President and
Principal Executive Officer
Capital Group U.S. Equity Fund
|
Capital Group U.S. Equity Fund 6455 Irvine Center Drive Irvine, California 92618 (949) 975-5000 |
CERTIFICATION
I, Gregory F. Niland, certify that:
| 1. | I have reviewed this report on Form N-CSR of Capital Group U.S. Equity Fund; |
| 2. | Based on my knowledge, this report does not contain any untrue statement of a material fact or omit to state a material fact necessary to make the statements made, in light of the circumstances under which such statements were made, not misleading with respect to the period covered by this report; |
| 3. | Based on my knowledge, the financial statements, and other financial information included in this report, fairly present in all material respects the financial condition, results of operations, changes in net assets, and cash flows (if the financial statements are required to include a statement of cash flows) of the registrant as of, and for, the periods presented in this report; |
| 4. | The registrant's other certifying officer(s) and I are responsible for establishing and maintaining disclosure controls and procedures (as defined in rule 30a-3(c) under the Investment Company Act of 1940) and internal controls over financial reporting (as defined in Rule 30a-3(d) under the Investment Company Act of 1940) for the registrant and have: |
| a) Designed such disclosure controls and procedures, or caused such disclosure controls and procedures to be designed under our supervision, to ensure that material information relating to the registrant, including its consolidated subsidiaries, is made known to us by others within those entities, particularly during the period in which this report is being prepared; | |
| b) Designed such internal control over financial reporting, or caused such internal control over financial reporting to be designed under our supervision, to provide reasonable assurance regarding the reliability of financial reporting and the preparation of financial statements for external purposes in accordance with generally accepted accounting principles; | |
| c) Evaluated the effectiveness of the registrant's disclosure controls and procedures and presented in this report our conclusions about the effectiveness of the disclosure controls and procedures, as of a date within 180 days prior to the filing date of this report based on such evaluation; and | |
| d) Disclosed in this report any change in the registrant’s internal control over financial reporting that occurred during the registrant’s semi-annual period covered by this report that has materially affected, or is reasonably likely to materially affect, the registrant’s internal control over financial reporting; and | |
| 5. | The registrant's other certifying officer(s) and I have disclosed to the registrant's auditors and the audit committee of the registrant's Board of Trustees (or persons performing the equivalent functions): |
| a) All significant deficiencies and material weaknesses in the design or operation of internal control over financial reporting which are reasonably likely to adversely affect the registrant’s ability to record, process, summarize, and report financial information; and | |
| b) Any fraud, whether or not material, that involves management or other employees who have a significant role in the registrant's internal control over financial reporting. |
Date: June 30, 2022
__/s/ Gregory F. Niland____________
Gregory F. Niland, Treasurer and
Principal Financial Officer
Capital Group U.S. Equity Fund
|
Capital Group U.S. Equity Fund 6455 Irvine Center Drive Irvine, California 92618 (949) 975-5000 |
CERTIFICATION PURSUANT TO 18 U.S.C. SECTION 1350,
AS ADOPTED PURSUANT TO
SECTION 906 OF THE SARBANES-OXLEY ACT OF 2002
JOHN S. ARMOUR, President and Principal Executive Officer, and GREGORY F. NILAND, Treasurer and Principal Financial Officer of Capital Group U.S. Equity Fund (the "Registrant"), each certify to the best of her or his knowledge that:
| 1) | The Registrant's periodic report on Form N-CSR for the period ended April 30, 2022 (the "Form N-CSR") fully complies with the requirements of Section 13(a) or 15(d) of the Securities Exchange Act of 1934, as amended; and |
| 2) | The information contained in the Form N-CSR fairly presents, in all material respects, the financial condition and results of operations of the Registrant. |
| Principal Executive Officer | Principal Financial Officer |
| CAPITAL GROUP U.S. EQUITY FUND | CAPITAL GROUP U.S. EQUITY FUND |
| ___/s/ John S. Armour____________ | _/s/ Gregory F. Niland____________ |
| John S. Armour, President | Gregory F. Niland, Treasurer |
| Date: June 30, 2022 | Date: June 30, 2022 |
A signed original of this written statement required by Section 906 of the Sarbanes-Oxley Act of 2002 has been provided to CAPITAL GROUP U.S. EQUITY FUND and will be retained by CAPITAL GROUP U.S. EQUITY FUND and furnished to the Securities and Exchange Commission (the "Commission") or its staff upon request.
This certification is being furnished to the Commission solely pursuant to 18 U.S.C. Section 1350 and is not being filed as part of the Form N-CSR filed with the Commission.
Serious News for Serious Traders! Try StreetInsider.com Premium Free!
You May Also Be Interested In
- Vista Energy, S.A.B. de C.V. Files Form 20-F
- Atlantic Canada’s airport security screeners take job action over GardaWorld’s non-payment of wages
- Jenzabar Inc., Reappoints Robert A. Maginn as CEO
Create E-mail Alert Related Categories
SEC FilingsSign up for StreetInsider Free!
Receive full access to all new and archived articles, unlimited portfolio tracking, e-mail alerts, custom newswires and RSS feeds - and more!
