

Form N-CSRS BRAGG CAPITAL TRUST For: Nov 30
 Tweet
Tweet Share
Share
UNITED STATES
SECURITIES AND EXCHANGE COMMISSION
Washington, D.C. 20549
FORM N-CSR
CERTIFIED SHAREHOLDER REPORT OF REGISTERED
MANAGEMENT INVESTMENT COMPANIES
Investment Company Act file number: 811-21073
BRAGG CAPITAL TRUST
(Exact name of registrant as specified in charter)
11601 WILSHIRE BLVD., STE. 1200
LOS ANGELES, CALIFORNIA 90025
(Address of principal executive offices)(Zip code)
| (Name and Address of Agent for Service) |
Copy to:
|
|
J. RICHARD ATWOOD, PRESIDENT BRAGG CAPITAL TRUST 11601 WILSHIRE BLVD., STE. 1200 LOS ANGELES, CALIFORNIA 90025 |
MARK D. PERLOW, ESQ. DECHERT LLP ONE BUSH STREET, STE. 1600 SAN FRANCISCO, CA 94104 |
Registrant’s telephone number, including area code: (310) 473-0225
Date of fiscal year end: May 31
Date of reporting period: November 30, 2022
Item 1: Report to Shareholders.
| (a) | The Report to Shareholders is attached herewith. |

Distributor:
UMB DISTRIBUTION SERVICES, LLC
235 West Galena Street
Milwaukee, Wisconsin 53212
Semi-Annual Report
November 30, 2022
FPA Queens Road Small Cap Value Fund
FPA QUEENS ROAD SMALL CAP VALUE FUND
LETTER TO SHAREHOLDERS
Dear Fellow Shareholders:
The FPA Queens Road Small Cap Value Fund ("Fund") returned 1.41% in the first half of fiscal year 2023 (May 31, 2022 to November 30, 2022), compared to a -0.25% return for the Russell 2000 Value Index in the same period. The Fund's outperformance versus the index during this most recent downturn is in line with our expectations. During times of market weakness, the fund has historically protected capital better than its benchmark and peers. We expect to outperform in down markets and trail somewhat in robust markets as a result of our diligent, disciplined, patient and conservative process.
We think of our investment process as having four pillars:
1. Balance Sheet Strength — Seek companies with strong balance sheets. We are not comfortable owning companies that have significant liabilities (debt, legal, regulatory, pension or something inherent in the business model) that could cause insolvency concerns when there's an economic, financial, or other type of crisis. We want to make sure we are invested in companies that have staying power.
2. Valuation — Normalize economic earnings over full market cycles. Primarily use free cash flow discount valuation models. Demand a margin of safety.
3. Management — Evaluate management's track record of laying out a long-term strategy and executing to achieve their stated objectives.
4. Sector and Industry Analysis — We want to own companies in growing industries with stable competitive dynamics and favorable economics. Avoid commodity industries, overly competitive industries, and invest in companies that compete in industries that have long-term growth expectations.
Market Commentary
Virtually all financial assets were down significantly through the period1. The market selloff was unsparing and hit domestic stocks, international stocks, growth stocks, value stocks, government bonds, corporate bonds and high-yield bonds. The housing market, which has been remarkably strong over the last decade, has turned significantly lower as the Federal Reserve's commitment to raising short-term rates and stamping out persistent inflation has pushed mortgage rates to highs we haven't seen since 2002.2 This spectacular rise in interest rates marks a healthy reversal to the previous cycle when persistently low interest rates and unprecedented central bank liquidity pushed the prices of virtually all financial and real assets higher.
When we buy shares in a company, we never know the real reason that a seller has decided to sell them. Bear markets tend to take on a momentum of their own and people sell because the price is down. Sometimes this is because they have leverage or liquidity issues and are forced to sell. But often it is because they are worried that the price will fall further tomorrow, regardless of their expectations of the underlying value of the investment. This is a behavioral reaction that we have profited from in the past and expect to profit from again.
1 Source: Factset
2 Federal Reserve Economic Data, 10/2022 Release.
Past performance is no guarantee, nor is it indicative, of future results.
1
FPA QUEENS ROAD SMALL CAP VALUE FUND
LETTER TO SHAREHOLDERS
(Continued)
At its most basic, our process compares a company's current price to what we expect the business to look like three to five years out. We always want to be aware of near-term headwinds. But generally, it is lower current prices and an expanding discrepancy to a company's long-term economic earnings that provides us with a margin of safety. We look for quality companies that we are confident will be worth considerably more over that time horizon and we are very comfortable buying from sellers who are afraid that the price will fall further tomorrow.
We believe current valuations are more favorable for value than for growth, and much more favorable for small caps than they are for large caps. The first chart shows that on a forward price to earnings basis, the Russell 2000 Value index trades at a significant discount to the Russell 2000 Growth index, despite the Russell 2000 Growth index significantly underperforming over the last year. The second chart shows that small-and mid-cap stocks (the S&P 600 index) are trading at the largest valuation discount to large cap stocks (the S&P 500 index) since the late 1990's tech bubble.
Weekly Forward P/E Ratios for Russell 2000 Indexes3
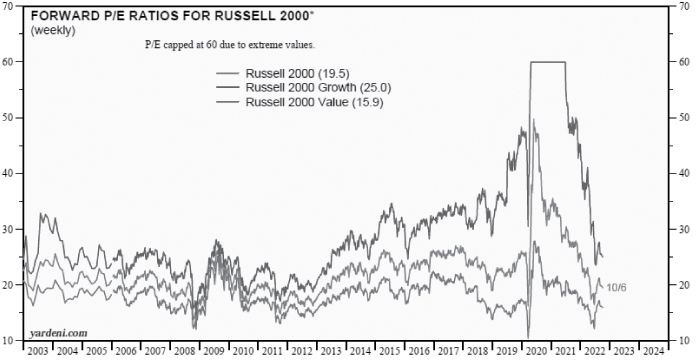
3 Chart Source: Yardeni Research. Weekly forward P/E ratios calculated by dividing price by 12-month (52-week) forward consensus expected operating earnings per share. Monthly data through December 2005, weekly thereafter. Source: I/B/E/S data by Refinitiv
2
FPA QUEENS ROAD SMALL CAP VALUE FUND
LETTER TO SHAREHOLDERS
(Continued)
Weekly Forward P/E Ratios for S&P 500 Indexes4

For more than 20 years, the FPA Queens Road Small Cap Value Fund has consistently offered investors a better risk-adjusted return experience over rolling 5-year periods — and that's because of the investment team's rigorous application of our four core tenets described previously.
With the recent increase in volatility across global equities — and especially domestic small-cap stocks — the FPA Queens Road Small Cap Value team is starting to see an uptick in the number of attractive investment opportunities being considered for inclusion into the portfolio. Naturally, we expect these more attractive valuations to help power potential future returns for patient investors seeking to benefit from the current market opportunity.
Quality and the Four Pillar Process
We have a preference for compounders — high-quality franchises with great balance sheets, management teams and industry tailwinds that we hope to own forever.5 Compounders don't usually come cheap, and while we are valuation conscious, we are generally willing to pay a little bit more for higher quality. While the vast majority of financial assets are down year to date, quality compounders have generally held up better.
4 Chart Source: Yardeni Research. Weekly forward P/E ratios calculated by dividing price 52-week forward consensus expected operating earnings per share. Note: Shaded pink areas are S&P 500 bear market declines of 20% or more. Yellow areas show bull markets. Source: I/B/E/S data by Refinitiv.
5 There can be no assurance the Fund will achieve its investment objectives. Past performance is no guarantee, nor is it indicative, of future results.
3
FPA QUEENS ROAD SMALL CAP VALUE FUND
LETTER TO SHAREHOLDERS
(Continued)
So, what do we mean by quality? At its most basic, quality means that we have confidence that a company's earnings and cash flows will be larger in three to five years than they are today. Different investors look at different heuristics or quantitative metrics that can describe quality. High returns on capital, high margins, organic growth, high cash conversion and low debt are all indicative of quality. But at the end of the day, we take a holistic look at our companies, sniff out the risks, seek to remain conservative and judicious, and compare the current price to our confidence in the future. Our four pillars — balance sheet strength, valuation, management, and industry analysis — guide our assessment of quality.
Historically, we believe the quality of the holdings has been a large contributor to the Fund's outperformance during market downturns. Low leverage allows companies to survive and reinvest during recessions. In our experience, strong management teams can be trusted to shepherd the company through headwinds and find new opportunities. We seek to invest in the companies that have strong competitive positions and that compete in industries with favorable economics and outlooks. In practice, it is never this easy. It is rare to find a company that sits cleanly atop each of the four pillars. And our view of the future is usually hazy at best. But when things get complicated and the future seems uncertain, the four pillars provide a framework for thinking through the next three to five years.
Trailing Twelve Months (TTM) and Semi-Annual Contributors and Detractors6
|
Contributors |
Performance Contribution |
Percent of Portfolio |
Detractors |
Performance Contribution |
Percent of Portfolio |
||||||||||||||||||
| 1H Fiscal Year 2023 | |||||||||||||||||||||||
|
Fabrinet |
1.84 |
% |
3.9 |
% |
Synaptics |
-1.07 |
% |
2.8 |
% |
||||||||||||||
|
Deckers Outdoor |
0.72 |
% |
1.8 |
% |
Owens & Minor |
-0.74 |
% |
1.2 |
% |
||||||||||||||
|
Atlas Air Worldwide |
0.53 |
% |
1.5 |
% |
InterDigital |
-0.69 |
% |
2.7 |
% |
||||||||||||||
|
RLI |
0.43 |
% |
3.1 |
% |
Concentrix |
-0.47 |
% |
2.4 |
% |
||||||||||||||
|
Science Applications International |
0.40 |
% |
1.7 |
% |
ServisFirst Bancshares |
-0.42 |
% |
5.0 |
% |
||||||||||||||
|
3.91 |
% |
12.0 |
% |
-3.39 |
% |
14.1 |
% |
||||||||||||||||
|
TTM |
|||||||||||||||||||||||
|
Fabrinet |
1.08 |
% |
3.5 |
% |
Synaptics |
-3.60 |
% |
3.5 |
% |
||||||||||||||
|
South Jersey Industries |
0.96 |
% |
2.5 |
% |
Owens & Minor |
-0.90 |
% |
1.4 |
% |
||||||||||||||
|
RLI |
0.89 |
% |
3.0 |
% |
PVH |
-0.83 |
% |
1.9 |
% |
||||||||||||||
|
American Equity Investment Life |
0.78 |
% |
4.5 |
% |
InterDigital |
-0.76 |
% |
2.9 |
% |
||||||||||||||
|
New Jersey Resources |
0.76 |
% |
2.4 |
% |
Axos Financial |
-0.67 |
% |
1.3 |
% |
||||||||||||||
|
4.48 |
% |
15.9 |
% |
-6.75 |
% |
11.0 |
% |
||||||||||||||||
6 Reflects the top five contributors and detractors to the Fund's performance based on contribution to return for the trailing twelve months ("TTM"). Contribution is presented gross of investment management fees, transactions costs, and Fund operating expenses, which if included, would reduce the returns presented. The information provided does not reflect all positions purchased, sold or recommended during the quarter. A copy of the methodology used and a list of every holding's contribution to the overall Fund's performance during the TTM is available by contacting FPA Client Service at [email protected]. It should not be assumed that recommendations made in the future will be profitable or will equal the performance of the securities listed.
4
FPA QUEENS ROAD SMALL CAP VALUE FUND
LETTER TO SHAREHOLDERS
(Continued)
Portfolio Positioning
The fund has historically held cash as a residual of the investment process. When we cannot find companies that meet our stringent criteria, we will allow cash to build. Over a long time horizon, we would typically want to own a diversified collection of quality companies (acquired at reasonable prices) instead of cash. But we weigh this against our reluctance to sacrifice margin of safety and risk permanent impairment of capital. The Fund's current cash allocation is 12.9%, down from 14.4% at the beginning of Fiscal Year 2023.
During the period, we were marginal net buyers as we added three new positions and eliminated two holdings, added to fourteen existing positions while trimming twelve positions7.
Despite the recent volatility, most recently to the downside, we feel better about the long-term prospects for our portfolio than we have in quite some time. We do not make short term predictions on market direction. But the current valuations of the Fund's holdings, their competitive positions and our expectation of strong execution by their management teams give us confidence that over the next 3-5 years, the companies we are invested in will be worth considerably more than they are today.
As always, and as co-investors in the fund, we appreciate your trust in us to be good stewards of your investment in the fund. If you would like to discuss performance or our portfolio holdings in greater detail, please let us know.
Respectfully,

Steve Scruggs, CFA
Portfolio Manager
November 30, 2022
7 Portfolio holdings for the FPA Queens Road Small Cap Value Fund can be found in the Related Documents section of the Fund Overview page. https://fpa.com/funds/overview/fpa-queens-road-small-cap-value-fund
5
FPA QUEENS ROAD SMALL CAP VALUE FUND
LETTER TO SHAREHOLDERS
(Continued)
Important Disclosures
This update is for informational and discussion purposes only and does not constitute, and should not be construed as, an offer or solicitation for the purchase or sale of any securities, products or services discussed, and neither does it provide investment advice. Any such offer or solicitation shall only be made pursuant to the Fund's Prospectus, which supersedes the information contained herein in its entirety. This Commentary does not constitute an investment management agreement or offering circular.
The statements contained herein reflect the opinions and views of the portfolio managers as of the date written, is subject to change without notice, and may be forward-looking and/or based on current expectations, projections, and/or information currently available. Such information may not be accurate over the long-term. These views may differ from other portfolio managers and analysts of the firm as a whole and are not intended to be a forecast of future events, a guarantee of future results or investment advice.
Portfolio composition will change due to ongoing management of the Fund. References to individual securities or sectors are for informational purposes only and should not be construed as recommendations by the Fund, the portfolio manager, the Adviser, the Sub-Adviser or the distributor. It should not be assumed that future investments will be profitable or will equal the performance of the security or sector examples discussed. The portfolio holdings as of the most recent quarter-end may be obtained at www.fpa.com.
Future events or results may vary significantly from those expressed and are subject to change at any time in response to changing circumstances and industry developments. The information and data contained herein has been prepared from sources believed reliable, but the accuracy and completeness of the information cannot be guaranteed and is not a complete summary or statement of all available data.
The information contained herein is not complete, may change, and is subject to, and is qualified in its entirety by, the more complete disclosures, risk factors, and other information contained in the Fund's Prospectus and Statement of Additional Information. The information is furnished as of the date shown. No representation is made with respect to its completeness or timeliness. The information is not intended to be, nor shall it be construed as, investment advice or a recommendation of any kind.
Certain statements contained in this presentation may be forward-looking and/or based on current expectations, projections, and information currently available. Actual events or results may differ from materially those we anticipate, or the actual performance of any investments described herein may differ from those reflected or contemplated in such forward-looking statements, due to various risks and uncertainties. We cannot assure future results and disclaim any obligation to update or alter any forward-looking statements, whether as a result of new information, future events, or otherwise. Such statements may or may not be accurate over the long-term. Statistical data or references thereto were taken from sources which we deem to be reliable, but their accuracy cannot be guaranteed.
The reader is advised that the Fund's investment strategy includes active management with corresponding changes in allocations from one period of time to the next. Therefore, any data with respect to investment allocations as of a given date is of limited use and may not be reflective of the portfolio manager's more general views with respect to proper geographic, instrument and /or sector allocations. The data is presented for indicative purposes only and, as a result, may not be relied upon for any purposes whatsoever.
In making any investment decision, you must rely on your own examination of the Fund, including the risks involved in an investment. Investments mentioned herein may not be suitable for all recipients and in each case, potential investors are advised not to make any investment decision unless they have taken independent advice from an appropriately authorized advisor. An investment in any security mentioned herein does not
6
FPA QUEENS ROAD SMALL CAP VALUE FUND
LETTER TO SHAREHOLDERS
(Continued)
guarantee a positive return as securities are subject to market risks, including the potential loss of principal. You should not construe the contents of this document as legal, tax, investment or other advice or recommendations.
Fund performance presented is calculated on a total return basis, which includes the reinvestment of all income, plus realized and unrealized gains/losses, if applicable. Unless otherwise indicated, performance results are presented on a net of fees basis and reflect the deduction of, among other things: management fees, brokerage commissions, operating and administrative expenses, and accrued performance fee/allocation, if applicable.
The information provided in this presentation is based upon data existing as of the date(s) of the report and has not been audited or reviewed. While we believe the information to be accurate, it is subject in all respects to adjustments that may be made after proper review and reconciliation.
Investments, including mutual fund investments, carry risks and investors may lose principal value. Capital markets are volatile and can decline significantly in response to adverse issuer, political, regulatory, market, or economic developments. Small and mid-cap stocks involve greater risks and they can fluctuate in price more than larger company stocks. Short-selling involves increased risks and transaction costs. You risk paying more for a security than you received from its sale. Groups of stocks, such as value and growth, go in and out of favor which may cause certain funds to underperform other equity funds. The value of an individual security can be more volatile than the market as a whole and can perform differently than the value of the market as a whole.
The Fund primarily invests in equity securities (common stocks, preferred stocks and convertible securities) of small-capitalization U.S. companies, defined as those with market capitalization, at the time of purchase, that is no greater than the largest market capitalization of any company included in the Russell 2000 Value Index. Investing in small companies involves special risks including, but not limited to, the following: smaller companies typically have more risk and their company stock prices are more volatile than that of large companies; their securities may be less liquid and may be thinly traded which makes it more difficult to dispose of them at prevailing market prices; these companies may be more adversely affected by poor economic or market conditions; they may have limited product lines, limited access to financial resources, and may be dependent on a limited management group; and small cap stocks may fluctuate independently of large cap stocks. All investment decisions are made at the discretion of the Portfolio Manager, in accordance with the then current Prospectus. Comparison to any index is for illustrative purposes only.
The prices of securities held by the Fund may decline in response to certain events taking place around the world, including those directly involving the companies whose securities are owned by the Fund. Securities in the Fund's portfolio may underperform due to inflation (or expectations for inflation), interest rates, global demand for particular products or resources, natural disasters, pandemics, epidemics, terrorism, regulatory events and governmental or quasi-governmental actions. There is a risk that you may lose money by investing in the Fund.
Value style investing presents the risk that the holdings or securities may never reach their full market value because the market fails to recognize what the portfolio management team considers the true business value or because the portfolio management team has misjudged those values. In addition, value style investing may fall out of favor and underperform growth or other styles of investing during given periods.
Please refer to the Fund's Prospectus for a complete overview of the primary risks associated with the Fund.
The FPA Funds are distributed by UMB Distribution Services, LLC, 235 W. Galena Street, Milwaukee, WI, 53212.
7
FPA QUEENS ROAD SMALL CAP VALUE FUND
LETTER TO SHAREHOLDERS
(Continued)
Index / Benchmark / Category Definitions
Comparison to any index or benchmark is for illustrative purposes only and should not be relied upon as a fully accurate measure of comparison. The Fund may be less diversified than the indices noted herein and may hold non-index securities or securities that are not comparable to those contained in an index. Indices will hold positions that are not within the Fund's investment strategy. Indices are unmanaged and do not reflect any commissions, transaction costs, or fees and expenses which would be incurred by an investor purchasing the underlying securities and which would reduce the performance in an actual account. You cannot invest directly in an index.
Russell 2000 Index is a small-cap stock market index of the smallest 2,000 stocks in the Russell 3000 Index.
The Russell 2000 Value Index is a subset of the Russell 2000 Index, and tracks the stocks of small domestic companies, based on total market capitalization. The Russell 2000 Value Index represents those stocks of the Russell 2000 with lower price-to-book ratios and lower relative forecasted growth rates. A total return index computes the index value based on capital gains plus cash payments such as dividends and interest.
Russell 2000 Growth Index is a subset of the Russell 2000 Index, measures the performance of the small cap growth segment of the US equity universe. It includes those Russell 2000 companies with relatively higher price-to-book ratios, higher I/B/E/S forecast medium term (2 year) growth and higher sales per share historical growth (5 years).
The S&P MidCap 400 Index, more commonly known as the S&P 400, is a stock market index from S&P Dow Jones Indices. The index serves as a gauge for the U.S. mid-cap equities sector and is the most widely followed mid-cap index.
The S&P 500 Index is a stock market index tracking the stock performance of 500 large companies listed on stock exchanges in the United States.
The S&P SmallCap 600 Index, more commonly known as the S&P 600, is a stock market index from S&P Dow Jones Indices. tracks a broad range of small-sized companies that meet specific liquidity and stability requirements.
The Global Industries Classification Standards, or GICS®, is a common global classification standard developed by S&P Dow Jones Indices and MSCI. The GICS structure consists of 11 Sectors, 24 Industry groups, 69 Industries and 158 sub-industries
Small Cap Value Companies: The term small cap describes companies with a relatively small market capitalization. A company's market capitalization is the market value of its outstanding shares. The definition for small cap varies, but generally means a company with $300 million to $2 billion in market capitalization.
Other Definitions
Earnings per share (EPS) is calculated as a company's profit divided by the outstanding shares of its common stock.
Expected earnings are an estimate for a company's future quarterly or annual earnings per share (EPS).
Forward price-to-earnings (forward P/E) is a version of the ratio of price-to-earnings (P/E) that uses forecasted earnings for the P/E calculation.
Margin of safety is a principle of investing in which an investor only purchases securities when their market price is significantly below their intrinsic value.
The Price-to-Earnings ratio is the ratio for valuing a company that measures its current share price relative to its earnings per share (EPS).
8
FPA QUEENS ROAD SMALL CAP VALUE FUND
LETTER TO SHAREHOLDERS
(Continued)
The discussions of Fund investments represent the views of the Fund's managers at the time of this report and are subject to change without notice. References to individual securities are for informational purposes only and should not be construed as recommendations to purchase or sell individual securities. While the Fund's managers believe that the Fund's holdings are value stocks, there can be no assurance that others will consider them as such. Further, investing in value stocks presents the risk that value stocks may fall out of favor with investors and underperform growth stocks during given periods.
FORWARD LOOKING STATEMENT DISCLOSURE
As mutual fund managers, one of our responsibilities is to communicate with shareholders in an open and direct manner. Insofar as some of our opinions and comments in our letters to shareholders are based on our current expectations, they are considered "forward-looking statements" which may or may not prove to be accurate over the long term. While we believe we have a reasonable basis for our comments and we have confidence in our opinions, actual results may differ materially from those we anticipate. You can identify forward-looking statements by words such as "believe," "expect," "may," "anticipate," and other similar expressions when discussing prospects for particular portfolio holdings and/or the markets, generally. We cannot, however, assure future results and disclaim any obligation to update or alter any forward-looking statements, whether as a result of new information, future events, or otherwise. Further, information provided in this report should not be construed as a recommendation to purchase or sell any particular security.
9
FPA QUEENS ROAD SMALL CAP VALUE FUND
PORTFOLIO SUMMARY
November 30, 2022 (Unaudited)
|
Common Stocks |
87.1 |
% |
|||||||||
|
Information Technology Services |
9.0 |
% |
|||||||||
|
Oil & Gas Services & Equipment |
7.5 |
% |
|||||||||
|
P&C Insurance |
6.4 |
% |
|||||||||
|
Technology Distributors |
6.3 |
% |
|||||||||
|
Apparel, Footwear & Accessory Design |
6.2 |
% |
|||||||||
|
Industrials |
6.2 |
% |
|||||||||
|
Life & Health Insurance |
5.6 |
% |
|||||||||
|
Banks |
5.1 |
% |
|||||||||
|
Semiconductor Devices |
4.4 |
% |
|||||||||
|
Packaged Food |
3.6 |
% |
|||||||||
|
Industrial Distribution & Rental |
3.0 |
% |
|||||||||
|
Application Software |
2.5 |
% |
|||||||||
|
Communications Equipment |
2.4 |
% |
|||||||||
|
Aircraft & Parts |
2.3 |
% |
|||||||||
|
Cement & Aggregates |
2.2 |
% |
|||||||||
|
Agricultural Machinery |
2.1 |
% |
|||||||||
|
Publishing & Broadcasting |
1.7 |
% |
|||||||||
|
Financials |
1.6 |
% |
|||||||||
|
Flow Control Equipment |
1.3 |
% |
|||||||||
|
Retailing |
1.2 |
% |
|||||||||
|
Containers & Packaging |
1.0 |
% |
|||||||||
|
Other Wholesalers |
0.9 |
% |
|||||||||
|
Basic & Diversified Chemicals |
0.9 |
% |
|||||||||
|
Health Care Supply Chain |
0.8 |
% |
|||||||||
|
Speciality Retail |
0.7 |
% |
|||||||||
|
Electrical Components |
0.7 |
% |
|||||||||
|
Internet Media |
0.6 |
% |
|||||||||
|
Real Estate Services |
0.5 |
% |
|||||||||
|
Other Commercial Services |
0.4 |
% |
|||||||||
|
Preferred Stocks |
0.0 |
% |
|||||||||
|
Short-term Investments |
12.7 |
% |
|||||||||
|
Other Assets And Liabilities, Net |
0.2 |
% |
|||||||||
|
Net Assets |
100.0 |
% |
|||||||||
10
FPA QUEENS ROAD SMALL CAP VALUE FUND
PORTFOLIO OF INVESTMENTS
November 30, 2022
(Unaudited)
|
COMMON STOCKS |
Shares |
Fair Value |
|||||||||
|
INFORMATION TECHNOLOGY SERVICES — 9.0% |
|||||||||||
|
CSG Systems International, Inc. |
156,122 |
$ |
9,654,585 |
||||||||
|
Fabrinet (Thailand)(a) |
204,357 |
27,263,267 |
|||||||||
|
Science Applications International Corp. |
82,975 |
9,136,377 |
|||||||||
|
$ |
46,054,229 |
||||||||||
|
OIL & GAS SERVICES & EQUIPMENT — 7.5% |
|||||||||||
|
New Jersey Resources Corp. |
272,460 |
$ |
13,554,885 |
||||||||
|
South Jersey Industries, Inc. |
377,898 |
13,113,060 |
|||||||||
|
UGI Corp. |
314,075 |
12,138,999 |
|||||||||
|
$ |
38,806,944 |
||||||||||
|
P&C INSURANCE — 6.4% |
|||||||||||
| Enstar Group Ltd. (Bermuda)(a) |
7,903 |
$ |
1,722,775 |
||||||||
|
Horace Mann Educators Corp. |
373,108 |
14,398,238 |
|||||||||
|
RLI Corp. |
129,811 |
16,884,517 |
|||||||||
|
$ |
33,005,530 |
||||||||||
|
TECHNOLOGY DISTRIBUTORS — 6.3% |
|||||||||||
|
Arrow Electronics, Inc.(a) |
76,065 |
$ |
8,271,308 |
||||||||
|
TD SYNNEX Corp. |
235,369 |
24,078,249 |
|||||||||
|
$ |
32,349,557 |
||||||||||
|
APPAREL, FOOTWEAR & ACCESSORY DESIGN — 6.2% |
|||||||||||
|
Carter's, Inc. |
58,772 |
$ |
4,292,707 |
||||||||
|
Deckers Outdoor Corp.(a) |
27,860 |
11,112,797 |
|||||||||
|
G-III Apparel Group Ltd.(a) |
341,416 |
7,384,828 |
|||||||||
|
PVH Corp. |
136,226 |
9,151,662 |
|||||||||
|
$ |
31,941,994 |
||||||||||
|
INDUSTRIALS — 6.2% |
|||||||||||
|
CSW Industrials, Inc. |
68,777 |
$ |
8,318,578 |
||||||||
|
Enovis Corp.(a) |
16,974 |
918,802 |
|||||||||
|
Esab Corp. |
1,941 |
91,887 |
|||||||||
|
Kimball International, Inc. Class B |
242,750 |
1,738,090 |
|||||||||
|
L B Foster Co. Class A(a) |
112,678 |
1,061,427 |
|||||||||
|
MasTec, Inc.(a) |
217,484 |
19,754,072 |
|||||||||
|
$ |
31,882,856 |
||||||||||
|
LIFE & HEALTH INSURANCE — 5.6% |
|||||||||||
|
American Equity Investment Life Holding Co. |
493,598 |
$ |
19,995,655 |
||||||||
|
CNO Financial Group, Inc. |
384,755 |
9,034,047 |
|||||||||
|
$ |
29,029,702 |
||||||||||
11
FPA QUEENS ROAD SMALL CAP VALUE FUND
PORTFOLIO OF INVESTMENTS (Continued)
November 30, 2022
(Unaudited)
|
COMMON STOCKS — Continued |
Shares |
Fair Value |
|||||||||
|
BANKS — 5.1% |
|||||||||||
|
Axos Financial, Inc.(a) |
95,615 |
$ |
3,835,118 |
||||||||
|
ServisFirst Bancshares, Inc. |
296,364 |
22,470,318 |
|||||||||
|
$ |
26,305,436 |
||||||||||
|
SEMICONDUCTOR DEVICES — 4.4% |
|||||||||||
|
Qorvo, Inc.(a) |
30,601 |
$ |
3,037,149 |
||||||||
|
Synaptics, Inc.(a) |
86,460 |
9,162,166 |
|||||||||
|
Vishay Intertechnology, Inc. |
444,634 |
10,244,368 |
|||||||||
|
$ |
22,443,683 |
||||||||||
|
PACKAGED FOOD — 3.6% |
|||||||||||
|
TreeHouse Foods, Inc.(a) |
136,116 |
$ |
6,728,214 |
||||||||
|
United Natural Foods, Inc.(a) |
250,371 |
11,937,689 |
|||||||||
|
$ |
18,665,903 |
||||||||||
|
INDUSTRIAL DISTRIBUTION & RENTAL — 3.0% |
|||||||||||
|
MSC Industrial Direct Co., Inc. Class A |
152,439 |
$ |
13,083,839 |
||||||||
|
VSE Corp. |
47,401 |
2,324,545 |
|||||||||
|
$ |
15,408,384 |
||||||||||
|
APPLICATION SOFTWARE — 2.5% |
|||||||||||
|
Concentrix Corp. |
103,872 |
$ |
12,711,855 |
||||||||
|
$ |
12,711,855 |
||||||||||
|
COMMUNICATIONS EQUIPMENT — 2.4% |
|||||||||||
|
InterDigital, Inc. |
240,918 |
$ |
12,086,856 |
||||||||
|
$ |
12,086,856 |
||||||||||
|
AIRCRAFT & PARTS — 2.3% |
|||||||||||
|
Atlas Air Worldwide Holdings, Inc.(a) |
80,949 |
$ |
8,157,231 |
||||||||
|
Ducommun, Inc.(a) |
73,372 |
3,691,345 |
|||||||||
|
$ |
11,848,576 |
||||||||||
|
CEMENT & AGGREGATES — 2.2% |
|||||||||||
|
Oshkosh Corp. |
120,597 |
$ |
11,103,366 |
||||||||
|
$ |
11,103,366 |
||||||||||
|
AGRICULTURAL MACHINERY — 2.1% |
|||||||||||
|
AGCO Corp. |
12,587 |
$ |
1,670,547 |
||||||||
|
Darling Ingredients, Inc.(a) |
124,398 |
8,935,508 |
|||||||||
|
$ |
10,606,055 |
||||||||||
|
PUBLISHING & BROADCASTING — 1.7% |
|||||||||||
|
Scholastic Corp. |
214,109 |
$ |
8,804,162 |
||||||||
|
$ |
8,804,162 |
||||||||||
12
FPA QUEENS ROAD SMALL CAP VALUE FUND
PORTFOLIO OF INVESTMENTS (Continued)
November 30, 2022
(Unaudited)
|
COMMON STOCKS — Continued |
Shares |
Fair Value |
|||||||||
|
FINANCIALS — 1.6% |
|||||||||||
|
MGIC Investment Corp. |
595,000 |
$ |
8,169,350 |
||||||||
|
$ |
8,169,350 |
||||||||||
|
FLOW CONTROL EQUIPMENT — 1.3% |
|||||||||||
|
Graco, Inc. |
94,946 |
$ |
6,643,372 |
||||||||
|
$ |
6,643,372 |
||||||||||
|
RETAILING — 1.2% |
|||||||||||
|
Sprouts Farmers Market, Inc.(a) |
186,198 |
$ |
6,392,177 |
||||||||
|
$ |
6,392,177 |
||||||||||
|
CONTAINERS & PACKAGING — 1.0% |
|||||||||||
|
Graphic Packaging Holding Co. |
231,077 |
$ |
5,310,150 |
||||||||
|
$ |
5,310,150 |
||||||||||
|
OTHER WHOLESALERS — 0.9% |
|||||||||||
|
Mativ Holdings, Inc. |
231,233 |
$ |
4,802,709 |
||||||||
|
$ |
4,802,709 |
||||||||||
|
BASIC & DIVERSIFIED CHEMICALS — 0.9% |
|||||||||||
|
Livent Corp.(a) |
169,440 |
$ |
4,742,626 |
||||||||
|
$ |
4,742,626 |
||||||||||
|
HEALTH CARE SUPPLY CHAIN — 0.8% |
|||||||||||
|
Owens & Minor, Inc. |
192,859 |
$ |
3,974,824 |
||||||||
|
$ |
3,974,824 |
||||||||||
|
SPECIALITY RETAIL — 0.7% |
|||||||||||
|
Rent-A-Center, Inc. |
150,000 |
$ |
3,613,500 |
||||||||
|
$ |
3,613,500 |
||||||||||
|
ELECTRICAL COMPONENTS — 0.7% |
|||||||||||
|
Chase Corp. |
14,303 |
$ |
1,358,785 |
||||||||
|
Littelfuse, Inc. |
8,195 |
2,020,068 |
|||||||||
|
$ |
3,378,853 |
||||||||||
|
INTERNET MEDIA — 0.6% |
|||||||||||
|
IAC, Inc.(a) |
60,654 |
$ |
3,147,336 |
||||||||
|
$ |
3,147,336 |
||||||||||
|
REAL ESTATE SERVICES — 0.5% |
|||||||||||
|
Equity Commonwealth |
88,505 |
$ |
2,397,601 |
||||||||
|
$ |
2,397,601 |
||||||||||
13
FPA QUEENS ROAD SMALL CAP VALUE FUND
PORTFOLIO OF INVESTMENTS (Continued)
November 30, 2022
(Unaudited)
|
COMMON STOCKS — Continued |
Shares or Principal Amount |
Fair Value |
|||||||||
|
OTHER COMMERCIAL SERVICES — 0.4% |
|||||||||||
|
UniFirst Corp. |
10,760 |
$ |
2,084,858 |
||||||||
|
$ |
2,084,858 |
||||||||||
| TOTAL COMMON STOCKS — 87.1% (Cost $317,418,072) |
$ |
447,712,444 |
|||||||||
|
PREFERRED STOCKS |
|||||||||||
|
INDUSTRIALS — 0.0% |
|||||||||||
|
WESCO International, Inc. — 10.625% |
6,085 |
$ |
166,729 |
||||||||
| TOTAL PREFERRED STOCKS — 0.0% (Cost $161,253) |
$ |
166,729 |
|||||||||
| TOTAL INVESTMENT SECURITIES — 87.1% (Cost $317,579,325) |
$ |
447,879,173 |
|||||||||
|
SHORT-TERM INVESTMENTS — 12.7% |
|||||||||||
|
State Street Institutional Treasury Plus Money Market Fund, 3.67%(b) |
65,498,510 |
$ |
65,498,510 |
||||||||
| TOTAL SHORT-TERM INVESTMENTS (Cost $65,498,510) |
$ |
65,498,510 |
|||||||||
| TOTAL INVESTMENTS — 99.8% (Cost $383,077,835) |
$ |
513,377,683 |
|||||||||
|
Other Assets and Liabilities, net — 0.2% |
860,892 |
||||||||||
|
NET ASSETS — 100.0% |
$ |
514,238,575 |
|||||||||
(a) Non-income producing security.
(b) Represents the 7-day effective yield as of November 30, 2022.
See accompanying Notes to Financial Statements.
14
FPA QUEENS ROAD SMALL CAP VALUE FUND
STATEMENT OF ASSETS AND LIABILITIES
November 30, 2022
(Unaudited)
|
ASSETS |
|||||||
|
Investment securities — at fair value (identified cost $317,579,325) |
$ |
447,879,173 |
|||||
|
Short-term investments — at amortized cost (maturities 60 days or less) |
65,498,510 |
||||||
|
Receivable for: |
|||||||
|
Dividends and interest |
1,563,842 |
||||||
|
Capital Stock sold |
200,957 |
||||||
|
Prepaid expenses and other assets |
270 |
||||||
|
Total assets |
515,142,752 |
||||||
|
LIABILITIES |
|||||||
|
Payable for: |
|||||||
|
Capital Stock repurchased |
391,034 |
||||||
|
Advisory fees |
268,581 |
||||||
|
Accrued expenses and other liabilities |
244,562 |
||||||
|
Total liabilities |
904,177 |
||||||
|
NET ASSETS |
$ |
514,238,575 |
|||||
|
SUMMARY OF SHAREHOLDERS' EQUITY |
|||||||
|
Capital Stock — par value $0.01 per share; unlimited authorized shares; 14,907,886 outstanding shares |
$ |
149,079 |
|||||
|
Additional Paid-in Capital |
377,947,820 |
||||||
|
Distributable earnings |
136,141,676 |
||||||
|
NET ASSETS |
$ |
514,238,575 |
|||||
|
Advisor class: |
|||||||
|
Net Assets |
$ |
46,562,152 |
|||||
|
Shares outstanding, par value $0.01 per share; unlimited authorized shares |
1,352,446 |
||||||
|
Offering and redemption price per share |
$ |
34.43 |
|||||
|
Institutional Class: |
|||||||
|
Net Assets |
$ |
387,583,389 |
|||||
|
Shares outstanding, par value $0.01 per share; unlimited authorized shares |
11,234,440 |
||||||
|
Offering and redemption price per share |
$ |
34.50 |
|||||
|
Investor Class: |
|||||||
|
Net Assets |
$ |
80,093,034 |
|||||
|
Shares outstanding, par value $0.01 per share; unlimited authorized shares |
2,321,000 |
||||||
|
Offering and redemption price per share |
$ |
34.51 |
|||||
See accompanying Notes to Financial Statements.
15
FPA QUEENS ROAD SMALL CAP VALUE FUND
STATEMENT OF OPERATIONS
For the Six Months Ended November 30, 2022
(Unaudited)
|
INVESTMENT INCOME |
|||||||
|
Dividends |
$ |
4,241,662 |
|||||
|
Interest |
666,598 |
||||||
|
Total investment income |
4,908,260 |
||||||
|
EXPENSES |
|||||||
|
Advisory fees |
1,584,412 |
||||||
|
Shareholder Servicing fees: |
|||||||
|
Advisor Class |
30,661 |
||||||
|
Institutional Class |
69,014 |
||||||
|
Investor Class |
90,303 |
||||||
|
Trustee fees and expenses |
53,738 |
||||||
|
Transfer agent fees and expenses |
51,464 |
||||||
|
Reports to shareholders |
44,231 |
||||||
|
Filing fees |
42,796 |
||||||
|
Legal fees |
42,185 |
||||||
|
Audit and tax services fees |
15,315 |
||||||
|
Administrator fees |
11,278 |
||||||
|
Other professional fees |
8,338 |
||||||
|
Custodian fees |
2,079 |
||||||
|
Other |
6,289 |
||||||
|
Total expenses |
2,052,103 |
||||||
|
Net investment income |
2,856,157 |
||||||
|
NET REALIZED AND UNREALIZED GAIN (LOSS) |
|||||||
|
Net realized loss on: |
|||||||
|
Investments |
(7,409,714 |
) |
|||||
|
Net change in unrealized appreciation (depreciation) of: |
|||||||
|
Investments |
12,194,041 |
||||||
|
Net realized and unrealized gain |
4,784,327 |
||||||
|
NET INCREASE IN NET ASSETS RESULTING FROM OPERATIONS |
$ |
7,640,484 |
|||||
See accompanying Notes to Financial Statements.
16
FPA QUEENS ROAD SMALL CAP VALUE FUND
STATEMENTS OF CHANGES IN NET ASSETS
|
Six Months Ended November 30, 2022 (Unaudited) |
Year Ended May 31, 2022 |
||||||||||
|
INCREASE (DECREASE) IN NET ASSETS |
|||||||||||
|
Operations: |
|||||||||||
|
Net investment income |
$ |
2,856,157 |
$ |
1,715,301 |
|||||||
|
Net realized gain (loss) |
(7,409,714 |
) |
11,326,130 |
||||||||
|
Net change in unrealized appreciation (depreciation) |
12,194,041 |
(25,829,932 |
) |
||||||||
|
Net increase (decrease) in net assets resulting from operations |
7,640,484 |
(12,788,501 |
) |
||||||||
|
Distributions to shareholders — Advisor Class |
— |
(887,512 |
) |
||||||||
|
Distributions to shareholders — Institutional Class |
— |
(7,484,461 |
) |
||||||||
|
Distributions to shareholders — Investor Class |
— |
(1,507,183 |
) |
||||||||
|
Total distributions to shareholders |
— |
(9,879,156 |
) |
||||||||
|
Capital Stock transactions:(a) |
|||||||||||
|
Proceeds from Capital Stock sold |
41,403,640 |
204,174,367 |
|||||||||
|
Proceeds from shares issued to shareholders upon reinvestment of dividends and distributions |
— |
8,926,912 |
|||||||||
|
Cost of Capital Stock repurchased |
(32,706,736 |
) |
(189,118,949 |
) |
|||||||
|
Net increase from Capital Stock transactions |
8,696,904 |
23,982,330 |
|||||||||
|
Total change in net assets |
16,337,388 |
1,314,673 |
|||||||||
|
NET ASSETS |
|||||||||||
|
Beginning of period |
497,901,187 |
496,586,514 |
|||||||||
|
End of period |
$ |
514,238,575 |
$ |
497,901,187 |
|||||||
(a) See Note 7, Capital Stock, in the Notes to Financial Statements.
See accompanying Notes to Financial Statements.
17
FPA QUEENS ROAD SMALL CAP VALUE FUND
FINANCIAL HIGHLIGHTS
Selected Data for Each Share of Capital Stock Outstanding Throughout Each Period
|
Six Months Ended November 30, 2022 (Unaudited) |
Year Ended May 31, 2022 |
Period Ended May 31, 2021(a) |
|||||||||||||
|
Advisor Class |
|||||||||||||||
|
Per share operating performance: |
|||||||||||||||
|
Net asset vaue at beginning of period |
$ |
33.94 |
$ |
35.52 |
$ |
28.16 |
|||||||||
|
Income from investment operations: |
|||||||||||||||
|
Net investment income(b) |
0.19 |
0.10 |
0.02 |
||||||||||||
|
Net realized and unrealized gain on investment securities |
0.30 |
(0.95 |
) |
7.44 |
|||||||||||
|
Total from investment operations |
0.49 |
(0.85 |
) |
7.46 |
|||||||||||
|
Less distributions: |
|||||||||||||||
|
Dividends from net investment income |
— |
(0.12 |
) |
(0.09 |
) |
||||||||||
|
Distributions from net realized capital gains |
— |
(0.61 |
) |
(0.01 |
) |
||||||||||
|
Total distributions |
— |
(0.73 |
) |
(0.10 |
) |
||||||||||
|
Net asset value at end of period |
$ |
34.43 |
$ |
33.94 |
$ |
35.52 |
|||||||||
|
Total investment return(c) |
1.44 |
% |
(2.46 |
)% |
26.58 |
% |
|||||||||
|
Ratios/supplemental data: |
|||||||||||||||
|
Net assets, end of period (in 000's) |
$ |
46,562 |
$ |
39,219 |
$ |
724 |
|||||||||
|
Ratio of expenses to average net assets: |
|||||||||||||||
|
Before reimbursement from Adviser |
0.94 |
%(d) |
0.93 |
% |
0.90 |
%(d) |
|||||||||
|
After reimbursement from Adviser |
0.94 |
%(d) |
0.93 |
% |
0.90 |
%(d) |
|||||||||
|
Ratio of net investment income to average net assets: |
|||||||||||||||
|
Before reimbursement from Adviser |
1.17 |
%(d) |
0.28 |
% |
0.10 |
%(d) |
|||||||||
|
After reimbursement from Adviser |
1.17 |
%(d) |
0.28 |
% |
0.10 |
%(d) |
|||||||||
|
Portfolio turnover rate |
16 |
%(d) |
10 |
% |
15 |
% |
|||||||||
(a) The Advisor Class commenced operations on December 1, 2020. The data shown reflects operations for the period December 1, 2020 to May 31, 2021.
(b) Per share amount is based on average shares outstanding.
(c) Return is based on net asset value per share, adjusted for reinvestment of distributions, and does not reflect deduction of the sales charge.
(d) Annualized.
See accompanying Notes to Financial Statements.
18
FPA QUEENS ROAD SMALL CAP VALUE FUND
FINANCIAL HIGHLIGHTS
Selected Data for Each Share of Capital Stock Outstanding Throughout Each Period
|
Six Months Ended November 30, 2022 (Unaudited) |
Year Ended May 31, 2022 |
Period Ended May 31, 2021(a) |
|||||||||||||
|
Institutional Class |
|||||||||||||||
|
Per share operating performance: |
|||||||||||||||
|
Net asset value at beginning of period |
$ |
33.99 |
$ |
35.52 |
$ |
28.16 |
|||||||||
|
Income from investment operations: |
|||||||||||||||
|
Net investment income(b) |
0.20 |
0.13 |
0.02 |
||||||||||||
|
Net realized and unrealized gain on investment securities |
0.31 |
(0.94 |
) |
7.44 |
|||||||||||
|
Total from investment operations |
0.51 |
(0.81 |
) |
7.46 |
|||||||||||
|
Less distributions: |
|||||||||||||||
|
Dividends from net investment income |
— |
(0.11 |
) |
(0.09 |
) |
||||||||||
|
Distributions from net realized capital gains |
— |
(0.61 |
) |
(0.01 |
) |
||||||||||
|
Total distributions |
— |
(0.72 |
) |
(0.10 |
) |
||||||||||
|
Redemption fees |
— |
— |
— |
||||||||||||
|
Net asset value at end of period |
$ |
34.50 |
$ |
33.99 |
$ |
35.52 |
|||||||||
|
Total investment return(c) |
1.50 |
% |
(2.34 |
)% |
26.59 |
% |
|||||||||
|
Ratios/supplemental data: |
|||||||||||||||
|
Net assets, end of period (in 000's) |
$ |
387,583 |
$ |
376,221 |
$ |
301,941 |
|||||||||
|
Ratio of expenses to average net assets: |
|||||||||||||||
|
Before reimbursement from Adviser |
0.81 |
%(d) |
0.83 |
% |
0.91 |
%(d) |
|||||||||
|
After reimbursement from Adviser |
0.81 |
%(d) |
0.83 |
% |
0.89 |
%(d) |
|||||||||
|
Ratio of net investment income to average net assets: |
|||||||||||||||
|
Before reimbursement from Adviser |
1.23 |
%(d) |
0.38 |
% |
0.08 |
%(d) |
|||||||||
|
After reimbursement from Adviser |
1.23 |
%(d) |
0.38 |
% |
0.10 |
%(d) |
|||||||||
|
Portfolio turnover rate |
16 |
%(d) |
10 |
% |
15 |
% |
|||||||||
(a) The Institutional Class commenced operations on December 1, 2020. The data shown reflects operations for the period December 1, 2020 to May 31, 2021.
(b) Per share amount is based on average shares outstanding.
(c) Return is based on net asset value per share, adjusted for reinvestment of distributions, and does not reflect deduction of the sales charge.
(d) Annualized.
See accompanying Notes to Financial Statements.
19
FPA QUEENS ROAD SMALL CAP VALUE FUND
FINANCIAL HIGHLIGHTS
Selected Data for Each Share of Capital Stock Outstanding Throughout Each Period
|
Six Months Ended November 30, 2022 |
Year Ended May 31, |
||||||||||||||||||||||||||
|
(Unaudited) |
2022 |
2021 |
2020(a) |
2019(a) |
2018(a) |
||||||||||||||||||||||
|
Investor Class |
|||||||||||||||||||||||||||
|
Per share operating performance: |
|||||||||||||||||||||||||||
|
Net asset value at beginning of year |
$ |
34.03 |
$ |
35.52 |
$ |
23.22 |
$ |
23.61 |
$ |
27.32 |
$ |
25.93 |
|||||||||||||||
|
Income from investment operations: |
|||||||||||||||||||||||||||
|
Net investment income(b) |
0.17 |
0.07 |
0.06 |
0.03 |
0.05 |
0.02 |
|||||||||||||||||||||
|
Net realized and unrealized gain (loss) on investment securities |
0.31 |
(0.95 |
) |
12.34 |
0.55 |
(1.28 |
) |
1.94 |
|||||||||||||||||||
|
Total from investment operations |
0.48 |
(0.88 |
) |
12.40 |
0.58 |
(1.23 |
) |
1.96 |
|||||||||||||||||||
|
Less distributions: |
|||||||||||||||||||||||||||
|
Dividends from net investment income |
— |
— |
(0.09 |
) |
(0.01 |
) |
(0.03 |
) |
— |
||||||||||||||||||
|
Distributions from net realized capital gains |
— |
(0.61 |
) |
(0.01 |
) |
(0.96 |
) |
(2.45 |
) |
(0.57 |
) |
||||||||||||||||
|
Total distributions |
— |
(0.61 |
) |
(0.10 |
) |
(0.97 |
) |
(2.48 |
) |
(0.57 |
) |
||||||||||||||||
|
Net asset value at end of year |
$ |
34.51 |
$ |
34.03 |
$ |
35.52 |
$ |
23.22 |
$ |
23.61 |
$ |
27.32 |
|||||||||||||||
|
Total investment return(c) |
1.41 |
% |
(2.52 |
)% |
53.51 |
% |
1.89 |
% |
(4.26 |
)% |
7.55 |
% |
|||||||||||||||
|
Ratios/supplemental data: |
|||||||||||||||||||||||||||
|
Net assets, End of Period (in 000's) |
$ |
80,093 |
$ |
82,461 |
$ |
193,922 |
$ |
127,037 |
$ |
118,454 |
$ |
133,630 |
|||||||||||||||
|
Ratio of expenses to average net assets: |
|||||||||||||||||||||||||||
|
Before reimbursement from Adviser |
1.01 |
%(d) |
1.00 |
% |
1.11 |
% |
1.18 |
% |
1.18 |
% |
1.22 |
% |
|||||||||||||||
|
After reimbursement from Adviser |
1.01 |
%(d) |
1.00 |
% |
1.09 |
%(e) |
1.18 |
% |
1.18 |
% |
1.22 |
% |
|||||||||||||||
|
Ratio of net investment income to average net assets: |
|||||||||||||||||||||||||||
|
Before reimbursement from Adviser |
1.02 |
%(d) |
0.21 |
% |
0.22 |
% |
0.10 |
% |
0.20 |
% |
0.08 |
% |
|||||||||||||||
|
After reimbursement from Adviser |
1.02 |
%(d) |
0.21 |
% |
0.20 |
% |
0.10 |
% |
0.20 |
% |
0.08 |
% |
|||||||||||||||
|
Portfolio turnover rate |
16 |
%(d) |
10 |
% |
15 |
% |
24 |
% |
27 |
% |
6 |
% |
|||||||||||||||
(a) Audits performed for the fiscal years indicated by the Fund's previous auditor, Cohen & Company, Ltd.
(b) Per share amount is based on average shares outstanding.
(c) Return is based on net asset value per share, adjusted for reinvestment of distributions, and does not reflect deduction of the sales charge.
(d) Annualized
(e) Effective November 1, 2020, the Adviser has contractually agreed to limit the annual fund operating expenses to 1.04%. Prior to November 1, 2020, the Fund had a unitized fee structure that limited annual operating expenses to 1.18%.
See accompanying Notes to Financial Statements.
20
FPA QUEENS ROAD SMALL CAP VALUE FUND
NOTES TO FINANCIAL STATEMENTS
November 30, 2022
(Unaudited)
NOTE 1 — Significant Accounting Policies
The FPA Queens Road Small Cap Value Fund (the "Fund"), is a diversified managed portfolio of Bragg Capital Trust (the "Trust"), which is registered under the Investment Company Act of 1940, as amended (the "1940 Act"), as an open-end management company. The Fund's investment objective is to seek long-term capital growth. The Fund invests primarily in common stocks which are believed by First Pacific Advisors, L.P. (the "Adviser") and Bragg Financial Advisors, Inc. (the "Sub-Adviser") to be undervalued and have good prospects for capital appreciation. Under normal circumstances, the Fund invests at least 80% of its assets in equity securities of companies with small market capitalization. The Fund currently defines a small market capitalization company as one whose market capitalization, at the time of purchase, is no greater than the largest market capitalization of any company included in the Russell 2000 Value Index. The following is a summary of significant accounting policies consistently followed by the Fund in the preparation of its financial statements.
A. Security Valuation
The Fund's investments are reported at fair value as defined by accounting principles generally accepted in the United States of America, ("U.S. GAAP"). The Fund generally determines its net asset value as of approximately 4:00 p.m. New York time each day the New York Stock Exchange is open. Further discussion of valuation methods, inputs and classifications can be found under Disclosure of Fair Value Measurements.
B. Securities Transactions and Related Investment Income
Securities transactions are accounted for on the date the securities are purchased or sold. Dividend income and distributions to shareholders are recorded on the ex-dividend date. Interest income and expenses are recorded on an accrual basis. Market discounts and premiums on fixed income securities are amortized over the expected life of the securities using effective interest rate method. Realized gains or losses are based on the specific identification method. The books and records of the Fund are maintained in U.S. dollars as follows: (1) the foreign currency fair value of investment securities, and other assets and liabilities stated in foreign currencies, are translated using the daily spot rate; and (2) purchases, sales, income and expenses are translated at the rate of exchange prevailing on the respective dates of such transactions. The resultant exchange gains and losses are included in net realized or net unrealized gain (loss) in the statement of operations.
C. Use of Estimates
The preparation of the financial statements in accordance with U.S. GAAP requires management to make estimates and assumptions that affect the amounts reported. Actual results could differ from those estimates.
NOTE 2 — Risk Considerations
Investing in the Fund may involve certain risks including, but not limited to, those described below.
Market Risk: Because the values of the Fund's investments will fluctuate with market conditions, so will the value of your investment in the Fund. You could lose money on your investment in the Fund or the Fund could underperform other investments.
Common Stocks and Other Securities: The prices of common stocks and other securities held by the Fund may decline in response to certain events taking place around the world, including; those directly involving companies whose securities are owned by the Fund; conditions affecting the general economy; overall market changes; local, regional or global political, social or economic instability; and currency, interest rate and
21
FPA QUEENS ROAD SMALL CAP VALUE FUND
NOTES TO FINANCIAL STATEMENTS (Continued)
(Unaudited)
commodity price fluctuations. In addition, the emphasis on a value-oriented investment approach by the Sub-Adviser generally results in the Fund's portfolio being invested primarily in medium or smaller sized companies. Smaller companies may be subject to a greater degree of change in earnings and business prospects than larger, more established companies, and smaller companies are often more reliant on key products or personnel than larger companies. Also, securities of smaller companies are traded in lower volumes than those issued by larger companies and may be more volatile than those of larger companies. The Fund's foreign investments are subject to additional risks such as, foreign markets could go down or prices of the Fund's foreign investments could go down because of unfavorable changes in foreign currency exchange rates, foreign government actions, social, economic or political instability or other factors that can adversely affect investments in foreign countries. These factors can also make foreign securities less liquid, more volatile and harder to value than U.S. securities. In light of these characteristics of smaller companies and their securities, the Fund may be subjected to greater risk than that assumed when investing in the equity securities of larger companies.
Many countries have experienced outbreaks of infectious illnesses in recent decades, including swine flu, avian influenza, SARS and, more recently, COVID-19. The global outbreak of COVID-19 in early 2020 has resulted in various disruptions, including travel and border restrictions, quarantines, supply chain disruptions, lower consumer demand and general market uncertainty. The full effects, duration and costs of the COVID-19 pandemic are impossible to predict, and the circumstances surrounding the COVID-19 pandemic will continue to evolve, including the risk of future increased rates of infection due to low vaccination rates and/or the lack of effectiveness of current vaccines against new variants. Similar consequences could arise as a result of the spread of other infectious diseases. Management will continue to monitor the impact COVID-19 has on the Fund and reflect the consequences as appropriate in the Fund's accounting and financial reporting.
NOTE 3 — Purchases and Sales of Investment Securities
Cost of purchases of investment securities (excluding short-term investments) aggregated $51,469,802 for the period ended November 30, 2022. The proceeds and cost of securities sold resulting in net realized loss of $7,409,714 aggregated $34,343,705 and $41,753,419, respectively, for the period ended November 30, 2022.
NOTE 4 — Federal Income Tax
No provision for federal income tax is required because the Fund has elected to be taxed as a "regulated investment company" under the Internal Revenue Code (the "Code") and intends to maintain this qualification and to distribute each year to its shareholders, in accordance with the minimum distribution requirements of the Code, its taxable net investment income and taxable net realized gains on investments.
The cost of investment securities held at November 30, 2022 was $318,662,042 for federal income tax purposes. Gross unrealized appreciation and depreciation for all investments at November 30, 2022, for federal income tax purposes was $135,127,837 and $5,910,706, respectively resulting in net unrealized appreciation of $129,217,131. As of and during the period ended November 30, 2022, the Fund did not have any liability for unrecognized tax benefits. The Fund recognizes interest and penalties, if any, related to unrecognized tax benefits as income tax expense in the Statement of Operations. During the year, the Fund did not incur any interest or penalties. The statute of limitations remains open for the last 3 years, once a return is filed. No examinations are in progress at this time.
NOTE 5 — Advisory Fees and Other Affiliated Transactions
Pursuant to an investment advisory agreement (the "Advisory Agreement") with the Fund, investment advisory services are provided to the Fund by the Adviser. Effective November 1, 2020, under terms of the Advisory Agreement, the Fund pays a fee, computed daily and payable monthly at the annual rate of 0.75% of
22
FPA QUEENS ROAD SMALL CAP VALUE FUND
NOTES TO FINANCIAL STATEMENTS (Continued)
(Unaudited)
the Fund's first $50,000,000 of average daily net assets, and 0.65% of the Fund's average daily net assets over $50,000,000. The amount due to the Adviser at November 30, 2022, in the form of Accrued Advisory Fees, was $268,581.
Pursuant to a written contract (the "Expense Limitation Agreement"), effective November 1, 2020, the Adviser has agreed to reimburse the Fund for operating expenses in excess of 0.99%, 0.89% and 1.04% of average net assets for the Advisor Class, Institutional Class and Investor Class shares, respectively, of the Fund, excluding interest, taxes, brokerage fees and commissions payable by the Fund in connection with the purchase or sale of portfolio securities, fees and expenses of other funds in which the Fund invests, and extraordinary expenses, including litigation expenses, not incurred in the Fund's ordinary course of business, through February 1, 2024.
In consideration of the Adviser's agreement to limit each Fund's expenses, the Adviser may recoup amounts waived or reimbursed for a period not to exceed three years from the time in which they were waived or reimbursed. Recoupment will be made only to the extent it does not cause the Fund's ordinary operating expenses to exceed: (1) the expense limitation in effect at the time the expense was paid or absorbed; and (2) the expense limitation in effect at the time of recapture.
For the period ended November 30, 2022, the Adviser did not waive or reimburse expenses of the Fund. As of November 30, 2022 there are no expenses subject to recapture.
Sub-Advisory Agreement — Effective November 1, 2020, the Adviser and the Trust engaged the Sub- Adviser. For its services, the Sub-Adviser receives a sub-advisory fee from the Adviser. The Sub-Adviser served as the investment adviser to the Fund until November 1, 2020.
For the period ended November 30, 2022, the Fund paid aggregate fees and expenses of $53,738, to all Trustees who are not affiliated persons of the Adviser. Certain officers of the Fund are also officers of the Adviser.
NOTE 6 — Disclosure of Fair Value Measurements
The Fund uses the following methods and inputs to establish the fair value of its assets and liabilities. Use of particular methods and inputs may vary over time based on availability and relevance as market and economic conditions evolve.
Equity securities are generally valued each day at the official closing price of, or the last reported sale price on, the exchange or market on which such securities principally are traded, as of the close of business on that day. If there have been no sales that day, equity securities are generally valued at the last available bid price. Securities that are unlisted and fixed-income and convertible securities listed on a national securities exchange for which the over-the-counter ("OTC") market more accurately reflects the securities' value in the judgment of the Fund's officers, are valued at the most recent bid price. Short-term corporate notes with maturities of 60 days or less at the time of purchase are valued at amortized cost.
Securities for which representative market quotations are not readily available or are considered unreliable by the Adviser are valued as determined in good faith under procedures adopted by the authority of the Fund's Board of Trustees. Various inputs may be reviewed in order to make a good faith determination of a security's value. These inputs include, but are not limited to, the type and cost of the security; contractual or legal restrictions on resale of the security; relevant financial or business developments of the issuer; actively traded similar or related securities; conversion or exchange rights on the security; related corporate actions; significant events occurring after the close of trading in the security; and changes in overall market conditions. Fair valuations and valuations of investments that are not actively trading involve judgment and may differ materially from valuations of investments that would have been used had greater market activity occurred.
23
FPA QUEENS ROAD SMALL CAP VALUE FUND
NOTES TO FINANCIAL STATEMENTS (Continued)
(Unaudited)
The Fund classifies its assets based on three valuation methodologies. Level 1 values are based on quoted market prices in active markets for identical assets. Level 2 values are based on significant observable market inputs, such as quoted prices for similar assets and quoted prices in inactive markets or other market observable inputs as noted above including spreads, cash flows, financial performance, prepayments, defaults, collateral, credit enhancements, and interest rate volatility. Level 3 values are based on significant unobservable inputs that reflect the Fund's determination of assumptions that market participants might reasonably use in valuing the assets. The valuation levels are not necessarily an indication of the risk associated with investing in those securities. The following table presents the valuation levels of the Fund's investments as of November 30, 2022:
|
Investments |
Level 1 |
Level 2 |
Level 3 |
Total |
|||||||||||||||
|
Common Stocks |
|||||||||||||||||||
|
Information Technology Services |
$ |
46,054,229 |
— |
— |
$ |
46,054,229 |
|||||||||||||
|
Oil & Gas Services & Equipment |
38,806,944 |
— |
— |
38,806,944 |
|||||||||||||||
|
P&C Insurance |
33,005,530 |
— |
— |
33,005,530 |
|||||||||||||||
|
Technology Distributors |
32,349,557 |
— |
— |
32,349,557 |
|||||||||||||||
|
Apparel, Footwear & Accessory Design |
31,941,994 |
— |
— |
31,941,994 |
|||||||||||||||
|
Industrials |
31,882,856 |
— |
— |
31,882,856 |
|||||||||||||||
|
Life & Health Insurance |
29,029,702 |
— |
— |
29,029,702 |
|||||||||||||||
|
Banks |
26,305,436 |
— |
— |
26,305,436 |
|||||||||||||||
|
Semiconductor Devices |
22,443,683 |
— |
— |
22,443,683 |
|||||||||||||||
|
Packaged Food |
18,665,903 |
— |
— |
18,665,903 |
|||||||||||||||
|
Industrial Distribution & Rental |
15,408,384 |
— |
— |
15,408,384 |
|||||||||||||||
|
Application Software |
12,711,855 |
— |
— |
12,711,855 |
|||||||||||||||
|
Communications Equipment |
12,086,856 |
— |
— |
12,086,856 |
|||||||||||||||
|
Aircraft & Parts |
11,848,576 |
— |
— |
11,848,576 |
|||||||||||||||
|
Cement & Aggregates |
11,103,366 |
— |
— |
11,103,366 |
|||||||||||||||
|
Agricultural Machinery |
10,606,055 |
— |
— |
10,606,055 |
|||||||||||||||
|
Publishing & Broadcasting |
8,804,162 |
— |
— |
8,804,162 |
|||||||||||||||
|
Financials |
8,169,350 |
— |
— |
8,169,350 |
|||||||||||||||
|
Flow Control Equipment |
6,643,372 |
— |
— |
6,643,372 |
|||||||||||||||
|
Retailing |
6,392,177 |
— |
— |
6,392,177 |
|||||||||||||||
|
Containers & Packaging |
5,310,150 |
— |
— |
5,310,150 |
|||||||||||||||
|
Other Wholesalers |
4,802,709 |
— |
— |
4,802,709 |
|||||||||||||||
|
Basic & Diversified Chemicals |
4,742,626 |
— |
— |
4,742,626 |
|||||||||||||||
|
Health Care Supply Chain |
3,974,824 |
— |
— |
3,974,824 |
|||||||||||||||
|
Speciality Retail |
3,613,500 |
— |
— |
3,613,500 |
|||||||||||||||
|
Electrical Components |
3,378,853 |
— |
— |
3,378,853 |
|||||||||||||||
|
Internet Media |
3,147,336 |
— |
— |
3,147,336 |
|||||||||||||||
24
FPA QUEENS ROAD SMALL CAP VALUE FUND
NOTES TO FINANCIAL STATEMENTS (Continued)
(Unaudited)
|
Investments |
Level 1 |
Level 2 |
Level 3 |
Total |
|||||||||||||||
|
Real Estate Services |
$ |
2,397,601 |
— |
— |
$ |
2,397,601 |
|||||||||||||
|
Other Commercial Services |
2,084,858 |
— |
— |
2,084,858 |
|||||||||||||||
|
Preferred Stocks |
|||||||||||||||||||
|
Industrials |
166,729 |
— |
— |
166,729 |
|||||||||||||||
|
Short-Term Investments |
— |
$ |
65,498,510 |
— |
65,498,510 |
||||||||||||||
|
$ |
447,879,173 |
$ |
65,498,510 |
— |
$ |
513,377,683 |
|||||||||||||
Transfers of investments between different levels of the fair value hierarchy are recorded at fair value as of the end of the reporting period. There were no significant transfers into or out of Level 3 during the period ended November 30, 2022.
The Fund did not hold derivatives as of November 30, 2022.
NOTE 7 — Capital Stock
|
Period Ended November 30, 2022 |
Year Ended May 31, 2022 |
||||||||||||||||||
|
Shares |
Amount |
Shares |
Amount |
||||||||||||||||
|
Capital Stock sold |
|||||||||||||||||||
|
Advisor Class |
404,791 |
$ |
13,229,606 |
1,511,191 |
$ |
53,586,768 |
|||||||||||||
|
Institutional Class |
603,541 |
19,648,327 |
3,449,230 |
123,162,592 |
|||||||||||||||
|
Investor Class |
263,372 |
8,525,707 |
778,313 |
27,425,007 |
|||||||||||||||
|
Issued to shareholders upon reinvestment of dividends and distributions |
|||||||||||||||||||
|
Advisor Class |
— |
— |
25,116 |
878,550 |
|||||||||||||||
|
Institutional Class |
— |
— |
186,968 |
6,543,877 |
|||||||||||||||
|
Investor Class |
— |
— |
42,924 |
1,504,485 |
|||||||||||||||
|
Capital Stock repurchased |
|||||||||||||||||||
|
Advisor Class |
(207,907 |
) |
(6,681,963 |
) |
(401,111 |
) |
(14,066,184 |
) |
|||||||||||
|
Institutional Class |
(437,960 |
) |
(14,235,424 |
) |
(1,067,545 |
) |
(37,705,116 |
) |
|||||||||||
|
Investor Class |
(365,508 |
) |
(11,789,349 |
) |
(3,858,286 |
) |
(137,347,649 |
) |
|||||||||||
|
Change in Capital Stock outstanding |
260,329 |
$ |
8,696,904 |
666,800 |
$ |
23,982,330 |
|||||||||||||
25
FPA QUEENS ROAD SMALL CAP VALUE FUND
SHAREHOLDER EXPENSE EXAMPLE
November 30, 2022 (Unaudited)
Fund Expenses
Mutual fund shareholders generally incur two types of costs: (1) transaction costs, and (2) ongoing costs, including advisory and administrative fees; shareholder service fees; and other Fund expenses. The Example is intended to help you understand your ongoing costs (in dollars) of investing in the Fund and to compare these costs with the ongoing costs of investing in other mutual funds. The Example is based on an investment of $1,000 invested at the beginning of the year and held for the entire year.
Actual Expenses
The information in the table under the heading "Actual Performance" provides information about actual account values and actual expenses. You may use the information in this column, together with the amount you invested, to estimate the expenses that you paid over the period. Simply divide your account value by $1,000 (for example, an $8,600 account value divided by $1,000 = 8.6), then multiply the result by the number in the first column in the row entitled "Expenses Paid During Period" to estimate the expenses you paid on your account during this period.
Hypothetical Example for Comparison Purposes
The information in the table under the heading "Hypothetical Performance (5% return before expenses)" provides information about hypothetical account values and hypothetical expenses based on the Fund's actual expense ratio and an assumed rate of return of 5% per year before expenses, which is not the Fund's actual return. The hypothetical account values and expenses may not be used to estimate the actual ending account balance or expenses you paid for the period. You may use this information to compare the ongoing costs of investing in the Fund and other funds. To do so, compare this 5% hypothetical example with the 5% hypothetical examples that appear in the shareholder reports of other funds.
Please note that the expenses shown in the table are meant to highlight your ongoing costs only and do not reflect any transactional costs. Therefore, the information under the heading "Hypothetical Performance (5% return before expenses)" is useful in comparing ongoing costs only, and will not help you determine the relative total costs of owning different funds. In addition, if these transactional costs were included, your costs would have been higher. Even though the Fund does not charge transaction fees, if you purchase shares through a broker, the broker may charge you a fee. You should evaluate other mutual funds' transaction fees and any applicable broker fees to assess the total cost of ownership for comparison purposes.
|
Actual Performance |
Hypothetical Performance (5% return before expenses) |
||||||||||
|
Advisor Class |
|||||||||||
|
Beginning Account Value May 31, 2022 |
$ |
1,000.00 |
$ |
1,000.00 |
|||||||
|
Ending Account Value November 30, 2022 |
$ |
1,014.40 |
$ |
1,020.36 |
|||||||
|
Expenses Paid During Period(a) |
$ |
4.75 |
$ |
4.76 |
|||||||
|
Institutional Class |
|||||||||||
|
Beginning Account Value May 31, 2022 |
$ |
1,000.00 |
$ |
1,000.00 |
|||||||
|
Ending Account Value November 30, 2022 |
$ |
1,015.00 |
$ |
1,021.01 |
|||||||
|
Expenses Paid During Period(b) |
$ |
4.09 |
$ |
4.10 |
|||||||
26
FPA QUEENS ROAD SMALL CAP VALUE FUND
SHAREHOLDER EXPENSE EXAMPLE (Continued)
November 30, 2022 (Unaudited)
|
Actual Performance |
Hypothetical Performance (5% return before expenses) |
||||||||||
|
Investor Class |
|||||||||||
|
Beginning Account Value May 31, 2022 |
$ |
1,000.00 |
$ |
1,000.00 |
|||||||
|
Ending Account Value November 30, 2022 |
$ |
1,014.10 |
$ |
1,020.00 |
|||||||
|
Expenses Paid During Period(c) |
$ |
5.10 |
$ |
5.11 |
|||||||
(a) Expenses are equal to the class's annualized expense ratio of 0.94%, multiplied by the average account value over the period and prorated for the six-months ended November 30, 2022 (183/365 days).
(b) Expenses are equal to the class's annualized expense ratio of 0.81%, multiplied by the average account value over the period and prorated for the six-months ended November 30, 2022 (183/365 days).
(c) Expenses are equal to the class's annualized expense ratio of 1.01%, multiplied by the average account value over the period and prorated for the six-months ended November 30, 2022 (183/365 days).
27
FPA QUEENS ROAD SMALL CAP VALUE FUND
APPROVAL OF INVESTMENT ADVISORY AGREEMENT
(Unaudited)
Approval of the Advisory Agreement. At a meeting of the Board of Trustees held on August 8, 2022, the Trustees approved the continuation of the advisory agreement between the Fund and the Adviser (the "Advisory Agreement") for an additional one-year period through September 30, 2023, on the recommendation of the Independent Trustees, who met in executive session on August 8, 2022 prior to the Board meeting to review and discuss the proposed continuation of the Advisory Agreement. The Board had also met on July 11, 2022, with the Independent Trustees meeting separately prior to the Meeting in executive session with the management of the Adviser and then separately with independent counsel to evaluate the renewal of the Advisory Agreement. Prior to their July 11 meeting, the Independent Trustees, through their independent counsel, had requested and received extensive materials prepared in connection with the review of the Advisory Agreements. The materials provided a broad range of information regarding the Fund, including a description of, among other matters, the terms of the Advisory Agreement; the services provided by the Adviser; the experience of the relevant investment personnel; the Fund's performance in absolute terms and as compared to the performance of peers and appropriate benchmark(s); the fees and expenses of the Fund in absolute terms and as compared to peers; and the profitability of the Adviser from serving as adviser to the Fund.
In addition to the executive sessions, the Boards, acting directly or through their committees, met regularly throughout the year and received information on a variety of topics that were relevant to their annual consideration of the renewal of the Advisory Agreement including, among other matters, Fund investment performance, compliance, risk management, liquidity, valuation, trade execution, service provider oversight and other matters relating to Fund operations. The Independent Trustees also had met with management of the Adviser (including key investment personnel) at their quarterly meetings as well as with management at other times between the quarterly meetings throughout the year. The materials specifically provided in connection with the annual review of the Advisory Agreements supplement the information received throughout the year.
At their regular Board meetings and executive sessions, the Independent Trustees were also advised by independent legal counsel. In addition to the materials provided by the Adviser, the Independent Trustees received a legal memorandum from independent counsel that outlined, among other matters: the duties of the Independent Trustees and relevant requirements under the 1940 Act; the general principles under state law relevant to considering the approval of advisory contracts; an adviser's fiduciary duty with respect to advisory agreements and compensation; the standards used by courts in determining whether investment advisers and investment company boards of trustees have fulfilled their duties; and factors to be considered by the Independent Trustees when voting on advisory agreements. During both executive sessions, independent legal counsel reviewed with Independent Trustees these duties, standards and factors summarized in the legal memorandum described above. The following paragraphs summarize the material information and factors considered by the Board and the Independent Trustees, as well as the Trustees' conclusions relative to such factors.
Nature, Extent and Quality of Services. The Board and the Independent Trustees considered information provided by the Adviser in response to their requests, as well as information provided throughout the year regarding: the Adviser and its staffing in connection with the Fund, including the investment professionals who monitor and oversee the Fund's sub-adviser and portfolio manager; the scope of services supervised and provided by the Adviser; and the absence of any significant service problems reported to the Board. The Board and the Independent Trustees noted the Fund is sub-advised by BFA, pursuant to an Investment Sub-Advisory Agreement among FPA, BFA, and Bragg, dated November 1, 2020. After discussion, the Board and the Independent Trustees concluded that the nature, extent and quality of services provided by the Adviser have benefited and should continue to benefit the Fund and its shareholders.
28
FPA QUEENS ROAD SMALL CAP VALUE FUND
APPROVAL OF INVESTMENT ADVISORY AGREEMENT (Continued)
(Unaudited)
Investment Performance. The Board and the Independent Trustees reviewed the overall investment performance of the Fund. The Trustees also received information from an independent consultant, Broadridge, regarding the Fund's performance relative to a peer group of small cap value equity funds selected by Broadridge (the "Peer Group"). The Board and the Independent Trustees noted the Fund's strong long-term investment performance when compared to the Peer Group and concluded that the Fund's investment performance has been strong. The Board and the Independent Trustees noted the Fund outperformed its Peer Group median for the three-, five-, and ten-year periods ended March 31, 2022, while the Fund underperformed its Peer Group median for the one-year period ended March 31, 2022. The Board and the Independent Trustees further noted the Fund outperformed the comparative Russell 2000 Value Index for the one-, three-, and five-year periods ended March 31, 2022, while the Fund underperformed the comparative Russell 2000 Value Index for the ten-year period ended March 31, 2022. The Board and the Independent Trustees concluded that the Adviser's continued oversight of the management of the Fund's investments should benefit the Fund and its shareholders.
Advisory Fees and Fund Expenses; Comparison with Peer Group and Institutional Fees. The Board and the Independent Trustees considered information provided by the Adviser regarding the Fund's advisory fees and total expense levels. The Board and the Independent Trustees reviewed comparative information regarding fees and expenses for the Peer Group. The Board and the Independent Trustees noted that the Fund's advisory fee rate is below that of the Peer Group median and that its overall net expense ratio was above the Peer Group median. The Board and the Independent Trustees concluded that the continued payment of advisory fees and expenses by the Fund to the Adviser was fair and reasonable and should continue to benefit the Fund and its shareholders.
Adviser Profitability and Costs. The Board and the Independent Trustees considered information provided by the Adviser regarding the Adviser's costs in providing services to the Fund, the profitability of the Adviser and the benefits to the Adviser from its relationship to the Fund. They reviewed and considered the Adviser's representations regarding its assumptions and methods of allocating certain costs, such as personnel costs, which constitute the Adviser's largest operating cost, overhead costs with respect to the provision of investment advisory services. The Independent Trustees discussed with the Adviser the general process through which individuals' compensation is determined and then reviewed by the management committee of the Adviser, as well as the Adviser's methods for determining that its compensation levels are set at appropriate levels to attract and retain the personnel necessary to provide high quality professional investment advice. In evaluating the Adviser's profitability, they excluded certain distribution and marketing-related expenses. The Board and the Independent Trustees recognized that the Adviser is entitled under the law to earn a reasonable level of profits for the services that it provides to the Fund. The Board and the Independent Trustees concluded that the Adviser's level of profitability from its relationship with the Fund did not indicate that the Adviser's compensation was unreasonable or excessive.
Economies of Scale and Sharing of Economies of Scale. The Board and the Independent Trustees considered whether there have been economies of scale with respect to the management of the Fund, whether the Fund has appropriately benefited from any economies of scale, and whether the fee rate is reasonable in relation to the Fund's asset levels and any economies of scale that may exist. The Board and the Independent Trustees considered the Adviser's representation that its internal costs of providing investment management services to the Fund have significantly increased as a result of a number of factors, including the Adviser's substantial investment in additional professional resources and staffing. The Board and the Independent Trustees considered
29
FPA QUEENS ROAD SMALL CAP VALUE FUND
APPROVAL OF INVESTMENT ADVISORY AGREEMENT (Continued)
(Unaudited)
both quantitative and qualitative information regarding the Adviser's representation that it has also made significant investments in: (1) new compliance, operations, and administrative personnel; (2) information technology and portfolio accounting systems; and (3) office space, each of which enhances the quality of services provided to the Fund.
The Independent Trustees noted that the fee rate contained a breakpoint as the Fund's assets increased. They considered that many registered funds have breakpoints in the advisory fee structure as a means by which to share in the benefits of potential economies of scale as a fund's assets grow. They also considered that not all funds have breakpoints in their fee structures and that breakpoints are not the exclusive means of sharing potential economies of scale. The Board and the Independent Trustees considered the Adviser's statement that it believes that additional breakpoints would not be appropriate for the Fund at this time given the ongoing investments the Adviser is making in its business for the benefit of the Fund, uncertainties regarding the direction of the economy, rising inflation, increasing costs for personnel and systems, and growth or contraction in the Fund's assets, all of which could negatively impact the profitability of the Adviser. The Board and the Independent Trustees noted that the Adviser had not proposed to increase the fee rate charged to the Fund despite the Adviser's representation that its internal costs of providing investment management services to the Fund have increased significantly in recent years as a result of a number of factors, including the Adviser's substantial investment in additional professional resources and staffing. The Board and the Independent Trustees also noted that the Adviser has contractually agreed to reimburse the Fund for Total Annual Fund Operating Expenses (excluding interest, taxes, brokerage fees and commissions payable by the Fund in connection with the purchase or sale of portfolio securities, and extraordinary expenses, including litigation expenses not incurred in the Fund's ordinary course of business) in excess of 1.04% of the average net assets of the Fund attributable to the Investor Class, 0.99% of the average net assets of the Fund attributable to the Advisor Class, and 0.89% of the average net assets of the Fund attributable to the Institutional Class until February 1, 2024. The Board and the Independent Trustees concluded that the Fund is benefitting from the ongoing investments made by the Adviser in its team of personnel serving the Fund and in the Adviser's service infrastructure, and that in light of these investments, additional breakpoints in the Fund's advisory fee structure were not warranted at current asset levels.
Ancillary Benefits. The Board and the Independent Trustees considered other actual and potential benefits to the Adviser from managing the Fund in concluding that the contractual advisory and other fees are fair and reasonable for the Fund. They noted that the Adviser does not have any affiliates that benefit from the Adviser's relationship to the Fund.
Conclusions. The Board and the Independent Trustees determined that the Fund continues to benefit from the services of the Adviser's highly experienced portfolio management team. In addition, the Board and the Independent Trustees agreed that the Fund continues to receive high quality services from the Adviser. The Board and the Independent Trustees concluded that the current advisory fee rate is reasonable and fair to the Fund and its shareholders in light of the nature and quality of the services provided by the Adviser and the Adviser's profitability and costs. The Board and the Independent Trustees also noted their intention to continue monitoring the factors relevant to the Adviser's compensation, such as changes in the Fund's asset levels, changes in portfolio management personnel and the cost and quality of the services provided by the Adviser to the Fund. On the basis of the foregoing, and without assigning particular weight to any single factor, none of which was dispositive, the Board and the Independent Trustees concluded that it would be in the best interests of the Fund to continue to be advised and managed by the Adviser and determined to approve the continuation of the current Advisory Agreement for another one-year period through September 30, 2023.
30
FPA QUEENS ROAD SMALL CAP VALUE FUND
APPROVAL OF INVESTMENT SUB-ADVISORY AGREEMENT
(Unaudited)
Approval of the Sub-Advisory Agreement. At a meeting of the Board of Trustees held on August 8, 2022, the Trustees approved the continuation of the sub-advisory agreement between the Fund, Bragg Financial Advisors ("BFA"), and the Adviser (the "Sub-Advisory Agreement") for an additional one-year period through September 30, 2023, on the recommendation of the Independent Trustees, who met in executive session on August 8, 2022 prior to the Board meeting to review and discuss the proposed continuation of the Sub-Advisory Agreement. The Board had also met on July 11, 2022, with the Independent Trustees meeting separately prior to the Meeting in executive session with the management of the Adviser and BFA, and then separately with independent counsel to evaluate the renewal of the Sub-Advisory Agreement. Prior to their July 11 meeting, the Independent Trustees, through their independent counsel, had requested and received extensive materials prepared in connection with the review of the Sub-Advisory Agreement. The materials provided a broad range of information regarding the Fund, including a description of, among other matters, the terms of the Sub-Advisory Agreement; the services provided by BFA; the experience of the relevant investment personnel; the Fund's performance in absolute terms and as compared to the performance of peers and appropriate benchmark(s); the fees and expenses of the Fund in absolute terms and as compared to peers; and the profitability of BFA from serving as sub-adviser to the Fund.
In addition to the executive sessions, the Boards, acting directly or through their committees, met regularly throughout the year and received information on a variety of topics that were relevant to their annual consideration of the renewal of the Sub-Advisory Agreement including, among other matters, Fund investment performance, compliance, risk management, liquidity, valuation, trade execution, service provider oversight, and other matters relating to the Fund's operations. The Independent Directors also had met with investment management personnel of BFA at their quarterly meetings. The materials specifically provided in connection with the annual review of the Sub-Advisory Agreement supplements the information received throughout the year.
At their regular Board meetings and executive sessions, the Independent Trustees were also advised by independent legal counsel. In addition to the materials provided by BFA, the Independent Trustees received a legal memorandum from independent counsel that outlined, among other matters: the duties of the Independent Trustees and relevant requirements under the 1940 Act; the general principles under state law relevant to considering the approval of sub-advisory contracts; a sub-adviser's fiduciary duty with respect to advisory agreements and compensation; the standards used by courts in determining whether investment sub-advisers and investment company boards of trustees have fulfilled their duties; and factors to be considered by the Independent Trustees when voting on sub-advisory agreements. During both executive sessions, independent legal counsel reviewed with Independent Trustees these duties, standards and factors summarized in the legal memorandum described above. The following paragraphs summarize the material information and factors considered by the Board and the Independent Trustees, as well as the Trustees' conclusions relative to such factors.
Nature, Extent and Quality of Services. The Board and the Independent Trustees considered information provided by BFA in response to their requests, as well as information provided throughout the year regarding: BFA and its staffing in connection with the Fund, including the Fund's sub-adviser portfolio manager and analyst; the scope of services provided by BFA; and the absence of any significant service problems reported to the Board. After discussion, the Board and the Independent Trustees concluded that the nature, extent and quality of services provided by BFA have benefited and should continue to benefit the Fund and its shareholders.
Investment Performance. The Board and the Independent Trustees reviewed the overall investment performance of the Fund. The Trustees also received information from an independent consultant, Broadridge, regarding the Fund's performance relative to a peer group of small cap value equity funds selected by Broadridge
31
FPA QUEENS ROAD SMALL CAP VALUE FUND
APPROVAL OF INVESTMENT SUB-ADVISORY AGREEMENT (Continued)
(Unaudited)
(the "Peer Group"). The Board and the Independent Trustees noted the Fund's strong long-term investment performance when compared to the Peer Group and concluded that the Fund's investment performance has been strong. The Board and the Independent Trustees noted the Fund outperformed its Peer Group median for the three-, five-, and ten-year periods ended March 31, 2022, while the Fund underperformed its Peer Group median for the one-year period ended March 31, 2022. The Board and the Independent Trustees further noted the Fund outperformed the comparative Russell 2000 Value Index for the one-, three-, and five-year periods ended March 31, 2022, while the Fund underperformed the comparative Russell 2000 Value Index for the ten-year period ended March 31, 2022. The Board and the Independent Trustees concluded that BFA's continued management of the Fund's investments should benefit the Fund and its shareholders.
Sub-Advisory Fees and Fund Expenses; Comparison with Peer Group and Institutional Fees. The Board and the Independent Trustees considered information provided by BFA regarding the Fund's sub-advisory fees and total expense levels. The Board and the Independent Trustees reviewed comparative information regarding fees and expenses for the Peer Group. The Board and the Independent Trustees noted that the Fund's overall advisory fee rate is below that of the Peer Group median and that its overall net expense ratio was above the Peer Group median. The Board and the Independent Trustees concluded that the continued payment of sub-advisory fees by the Fund to BFA was fair and reasonable and should continue to benefit the Fund and its shareholders.
Sub-Adviser Profitability and Costs. The Board and the Independent Trustees considered information provided by BFA regarding its costs in providing services to the Fund, the profitability of BFA and the benefits to BFA from its relationship to the Fund. They reviewed and considered BFA's representations regarding its assumptions and methods of allocating certain costs, such as personnel costs and overhead costs with respect to the provision of investment advisory services. In evaluating BFA's profitability, they excluded certain distribution and marketing-related expenses. The Board and the Independent Trustees recognized that BFA is entitled under the law to earn a reasonable level of profits for the services that it provides to the Fund. The Board and the Independent Trustees concluded that BFA's level of profitability from its relationship with the Fund did not indicate that BFA's compensation was unreasonable or excessive.
Economies of Scale and Sharing of Economies of Scale. The Board and the Independent Trustees considered whether there have been economies of scale with respect to the management of the Fund, whether the Fund has appropriately benefited from any economies of scale, and whether the fee rate is reasonable in relation to the Fund's asset levels and any economies of scale that may exist. The Independent Trustees noted that the advisory fee rate contained a breakpoint as the Fund's assets increased. They considered that many registered funds have breakpoints in the advisory fee structure as a means by which to share in the benefits of potential economies of scale as a fund's assets grow. They also considered that not all funds have breakpoints in their fee structures and that breakpoints are not the exclusive means of sharing potential economies of scale. The Board and the Independent Trustees considered the Adviser's and BFA's statements that it believes that additional breakpoints would not be appropriate for the Fund at this time given the ongoing investments the Adviser is making in its business for the benefit of the Fund, uncertainties regarding the direction of the economy, rising inflation, increasing costs for personnel and systems, and growth or contraction in the Fund's assets, all of which could negatively impact the profitability of the Adviser and/or BFA. The Board and the Independent Trustees noted that the Adviser had not proposed to increase the fee rate charged to the Fund. The Board and the Independent Trustees concluded that additional breakpoints in the Fund's sub-advisory fee structure were not warranted at current asset levels.
32
FPA QUEENS ROAD SMALL CAP VALUE FUND
APPROVAL OF INVESTMENT SUB-ADVISORY AGREEMENT (Continued)
(Unaudited)
Ancillary Benefits. The Board and the Independent Trustees considered other actual and potential benefits to BFA from managing the Fund in concluding that the contractual sub-advisory fees are fair and reasonable for the Fund. They noted that BFA does not have any affiliates that benefit from BFA's relationship to the Fund.
Conclusions. The Board and the Independent Trustees determined that the Fund continues to benefit from the services of BFA's experienced portfolio management team. In addition, the Board and the Independent Trustees agreed that the Fund continues to receive high quality services from BFA. The Board and the Independent Trustees concluded that the current sub-advisory fee rate is reasonable and fair to the Fund and its shareholders in light of the nature and quality of the services provided by BFA and BFA's profitability and costs. The Board and the Independent Trustees also noted their intention to continue monitoring the factors relevant to BFA's compensation, such as changes in the Fund's asset levels, changes in portfolio management personnel and the cost and quality of the services provided by BFA to the Fund. On the basis of the foregoing, and without assigning particular weight to any single factor, none of which was dispositive, the Board and the Independent Trustees concluded that it would be in the best interests of the Fund to continue to be sub-advised by BFA and determined to approve the continuation of the current Sub-Advisory Agreement for another one-year period through September 30, 2023.
33
FPA QUEENS ROAD SMALL CAP VALUE FUND
LIQUIDITY RISK MANAGEMENT PROGRAM
(Unaudited)
In compliance with SEC Rule 22e-4 under the U.S. Investment Company Act of 1940 (the "Liquidity Rule"), the Fund has adopted and implemented a written liquidity risk management program (the "Program"). The Fund's Board of Trustees have also designated the Adviser to serve as the administrator of the Program.
The Liquidity Rule requires that the Program be reasonably designed to assess and manage each Fund's liquidity risk. A Fund's "liquidity risk" is the risk that the Fund could not meet requests to redeem shares issued by the Fund without significant dilution of the remaining investors' interests in the Fund. The Program includes a number of elements that support the assessment, management and review of liquidity risk. In accordance with the Program, each Fund's liquidity risk is assessed no less frequently than annually taking into consideration a variety of factors, including, as applicable, the Fund's investment strategy and liquidity of portfolio investments, cash flow projections, and holdings of cash and cash equivalents, as well as borrowing arrangements and other funding sources. Certain factors are considered under both normal and reasonably foreseeable stressed conditions. There is no guarantee that the Program will achieve its objective under all circumstances.
Under the Program, each Fund portfolio investment is classified into one of four liquidity categories based on a determination of the number of days it is reasonably expected to take to convert the investment to cash, or sell or dispose of the investment, in current market conditions without significantly changing the investment's market value. The Program is reasonably designed to meet Liquidity Rule requirements relating to "highly liquid investment minimums" (i.e., the minimum amount of Fund net assets to be invested in highly liquid investments that are assets) and to monitor compliance with the Liquidity Rule's limitations on a Fund's investments in illiquid investments. Under the Liquidity Rule, a Fund is prohibited from acquiring any illiquid investment if, immediately after the acquisition, the Fund would have invested more than 15% of its net assets in illiquid investments that are assets.
During the period covered by this shareholder report, the Fund's Board of Trustees received reports prepared by the Adviser addressing the Program's operation and assessing the adequacy and effectiveness of its implementation for the period from October 1, 2021 to September 30, 2022. The reports concluded that the Program operated effectively, the Program had been and continued to be reasonably designed to assess and manage each Fund's liquidity risk, and the Program has been adequately and effectively implemented to monitor and respond to the Funds' liquidity developments, as applicable.
34
FPA QUEENS ROAD SMALL CAP VALUE FUND
TRUSTEE AND OFFICER INFORMATION
(Unaudited)
Sandra Brown, Mark L. Lipson, Alfred E. Osborne, Jr., and Robert F. Goldrich are all Trustees of the Fund who are not "interested persons" of the Fund, as that term is defined in the 1940 Act (collectively, the "Independent Trustees"). Trustees serve until their resignation, removal or retirement. The Statement of Additional Information includes additional information about the Trustees and is available, without charge, upon request by calling (800) 982-4372.
|
Name, Address(1) and Year of Birth |
Position(s) Held with the Fund |
Year First Elected as Trustee of the Fund |
Principal Occupation(s) During the Past Five Years |
Number of FPA Funds Overseen by Trustee |
Other Directorships Held by Trustee During the Past Five Years |
||||||||||||||||||
|
Independent Trustees |
|||||||||||||||||||||||
|
Sandra Brown, 1955 |
Trustee |
2020 |
Consultant (since 2009). Formerly, CEO and President of Transamerica Financial Advisers, Inc. (1999-2009); President, Transamerica Securities Sales Corp. (1998-2009); Vice President, Bank of America Mutual Fund Administration (1990-1998). Director/Trustee of each FPA Fund (Bragg Capital Trust since 2020). |
7 |
None |
||||||||||||||||||
|
Robert F. Goldrich, 1962 |
Trustee |
2022 |
Senior Vice President for Strategic Initiatives of CMW Strategies LLC (since 2022). Formerly, President/CFO of the Leon Levy Foundation (2015-2022). Director/Trustee of each FPA Fund (since 2022). |
7 |
Uluru, Inc. (2015-2017) |
||||||||||||||||||
|
Mark L. Lipson, 1949 |
Trustee & Chairman |
2020 |
Managing Member, ML2 Advisors, LLC (since 2014). Formerly Managing Director, Bessemer Trust (2007-2014) and US Trust (2003-2006); Chairman and CEO of the Northstar Mutual Funds (1993-2001); and President and CEO of the National Mutual Funds (1988-1993). Director/Trustee of each FPA Fund (Bragg Capital Trust since 2020). |
7 |
None |
||||||||||||||||||
|
Alfred E. Osborne, Jr., 1944 |
Trustee |
2020 |
Formerly UCLA professor, retired effective July 2022. Dr. Osborne served at UCLA's John E. Anderson School of Management in several capacities for 50 years. He was formerly Senior Associate Dean, (July 2003-June 2022), Interim Dean (July 2018-June 2019), Professor (July 1972-June 2022) and Faculty Director, Price Center for Entrepreneurship and Innovation (July 1984-June 2022). Director/Trustee of each FPA Fund (Bragg Capital Trust since 2020). |
7 |
Kaiser Aluminum, Wedbush Capital, and Waverley Capital Acquisition Corporation |
||||||||||||||||||
35
FPA QUEENS ROAD SMALL CAP VALUE FUND
TRUSTEE AND OFFICER INFORMATION (Continued)
(Unaudited)
|
Name, Address(1) and Year of Birth |
Position(s) Held with the Fund |
Year First Elected as Trustee of the Fund |
Principal Occupation(s) During the Past Five Years |
Number of FPA Funds Overseen by Trustee |
Other Directorships Held by Trustee During the Past Five Years |
||||||||||||||||||
|
"Interested" Trustee(2) |
|||||||||||||||||||||||
|
J. Richard Atwood, 1960 |
Trustee |
2020 |
Director and President of FPA GP, Inc., the General Partner of the Adviser (since October 2018). Director/Trustee of each FPA Fund (Bragg Capital Trust since 2020). President of each FPA Fund (since 2015). |
7 |
None |
||||||||||||||||||
(1) The address of each Trustee is 11601 Wilshire Boulevard, Suite 1200, Los Angeles, California 90025.
(2) "Interested person" within the meaning of the 1940 Act by virtue of their affiliation with the Fund's Adviser.
36
FPA QUEENS ROAD SMALL CAP VALUE FUND
TRUSTEE AND OFFICER INFORMATION (Continued)
(Unaudited)
Officers of the Fund. Officers of the Fund are elected annually by the Board.
|
Name, Address(1) and Year of Birth |
Position with Fund |
Year First Elected as Officer of the Fund |
Principal Occupation(s) During the Past Five Years |
||||||||||||
|
J. Richard Atwood, 1960 |
President |
2020 |
Director and President of FPA GP, Inc., the General Partner of FPA (since 2018). Director/Trustee of each FPA Fund. (Bragg Capital Trust since 2020). President of each FPA Fund (since 2015). |
||||||||||||
|
Karen E. Richards, 1969 |
Chief Compliance Officer |
2020 |
Chief Compliance Officer of FPA (since 2018); and Chief Compliance Officer of each FPA Fund (since 2019, except Bragg Capital Trust since 2020). Formerly, Deputy Chief Compliance Officer of First Republic Investment Management, LLC (from 2016 to 2018), and Vice President, Senior Compliance Officer of Pacific Investment Management Company (from 2010 to 2016). |
||||||||||||
|
E. Lake Setzler III, 1967 |
Treasurer |
2020 |
Managing Director and CFO (since 2022) of FPA. Treasurer of each FPA Fund. Treasurer of each FPA Fund (Bragg Capital Trust since 2020). Formerly, Senior Vice President and Controller of the Adviser. |
||||||||||||
|
Rebecca D. Gilding, 1979 |
Secretary |
2021 |
Vice President and Counsel, State Street Bank and Trust Company (since 2016); and Secretary of each FPA Fund (since 2019, except Bragg Capital Trust since 2020). Formerly, Assistant Vice President and Associate Counsel, Brown Brothers Harriman & Co. (2013 to 2016). |
||||||||||||
(1) The address for each Officer (except Ms. Gilding) is 11601 Wilshire Boulevard, Suite 1200, Los Angeles, California 90025. Ms. Gilding's address is State Street Bank and Trust Company, One Lincoln Street, Boston, Massachusetts 02111.
37
FPA QUEENS ROAD SMALL CAP VALUE FUND
(Unaudited)
INVESTMENT ADVISER
First Pacific Advisors, LP
11601 Wilshire Boulevard, Suite 1200
Los Angeles, CA 90025
INVESTMENT SUB-ADVISER
Bragg Financial Advisors, Inc.
1031 Caldwell Street, Suite 200
Charlotte, NC 28203
TRANSFER & SHAREHOLDER
SERVICE AGENT
UMB Fund Services, Inc.
P.O. Box 2175
Milwaukee, WI 53201-2175
or
235 West Galena Street
Milwaukee, WI 53212-3948
(800) 638-3060
Advisor Class:
TICKER SYMBOL: QRSAX
CUSIP: 104826300
Institutional Class:
TICKER SYMBOL: QRSIX
CUSIP: 104826409
CUSTODIAN AND ADMINISTRATOR
State Street Bank and Trust Company
One Lincoln Street
Boston, Massachusetts 02111
DISTRIBUTOR
UMB Distribution Services, LLC
235 West Galena Street
Milwaukee, Wisconsin 53212-3948
LEGAL COUNSEL
Dechert LLP
One Bush Street, Suite 1600
San Francisco, California 94104
INDEPENDENT REGISTERED PUBLIC
ACCOUNTING FIRM
Ernst & Young LLP
725 South Figueroa Street
Los Angeles, California 90017
Investor Class:
TICKER SYMBOL: QRSVX
CUSIP: 104826201
This report has been prepared for the information of shareholders of FPA QUEENS ROAD SMALL CAP VALUE FUND, and is not authorized for distribution to prospective investors unless preceded or accompanied by an effective prospectus. The financial information included in this report has been taken from the records of the Fund without examination by independent auditors.
A description of the policies and procedures that the Adviser uses to vote proxies related to the Fund's portfolio securities is set forth in the Fund's Statement of Additional Information which is available without charge, upon request, on the Fund's website at www.fpa.com or by calling (800) 982-4372 and on the Securities and Exchange Commission's website at www.sec.gov.
The Fund's complete proxy voting record for the 12 months ended June 30, 2022 is available without charge, upon request by calling (800) 982-4372 and on the SEC's website at www.sec.gov.
The Fund's schedule of portfolio holdings, filed the first and third quarter of the Fund's fiscal year on Form N-PORT with the SEC, is available on the SEC's website at www.sec.gov.
Additional information about the Fund is available online at www.fpa.com. This information includes, among other things, holdings, top sectors, and performance, and is updated on or about the 15th business day after the end of each quarter.

Distributor:
UMB DISTRIBUTION SERVICES, LLC
235 West Galena Street
Milwaukee, Wisconsin 53212
Semi-Annual Report
November 30, 2022
FPA Queens Road Value Fund
FPA QUEENS ROAD VALUE FUND
LETTER TO SHAREHOLDERS
Dear Fellow Shareholders:
FPA Queens Road Value Fund ("Fund") returned 5.46% in the first half of fiscal year 2023 (May 31, 2022 to November 30, 2022). This compares to the S&P 500 Value Index return of 2.17% for the same period. For the 12 months ended November 30, 2022, the Fund returned 0.40% vs 5.59% for the S&P 500 Value Index. The Fund's outperformance versus the index during this most recent downturn is in line with our expectations. During times of market weakness, the fund has historically protected capital better than its benchmark. We expect to outperform in down markets and trail somewhat in robust markets as a result of our diligent, disciplined, patient and conservative process.
We think of our investment process as having four pillars:
1. Balance Sheet Strength — Seek companies with strong balance sheets. We are not comfortable owning companies that have significant liabilities (debt, legal, regulatory, pension or something inherent in the business model) that could cause insolvency concerns when there's an economic, financial, or other type of crisis. We want to make sure we are invested in companies that have staying power.
2. Valuation — Normalize economic earnings over full market cycles. Primarily use free cash flow discount valuation models. Demand a margin of safety.
3. Management — Evaluate management's track record of laying out a long-term strategy and executing to achieve their stated objectives.
4. Sector and Industry Analysis — We want to own companies in growing industries with stable competitive dynamics and favorable economics. Avoid commodity industries, overly competitive industries, and invest in companies that compete in industries that have long-term growth expectations.
Market Commentary
Virtually all financial assets were down significantly through the period1. The market selloff was unsparing and hit domestic stocks, international stocks, growth stocks, value stocks, government bonds, corporate bonds and high-yield bonds. The housing market, which has been remarkably strong over the last decade, has turned significantly lower as the Federal Reserve's commitment to raising short-term rates and stamping out persistent inflation has pushed mortgage rates to highs we haven't seen since 20022 This spectacular rise in interest rates marks a healthy reversal to the previous cycle when persistently low interest rates and unprecedented central bank liquidity pushed the prices of virtually all financial and real assets higher.
When we buy shares in a company, we never know the real reason that a seller has decided to sell them. Bear markets tend to take on a momentum of their own and people sell because the price is down. Sometimes this is because they have leverage or liquidity issues and are forced to sell. But often it is because they are worried that the price will fall further tomorrow, regardless of their expectations of the underlying value of the investment. This is a behavioral reaction that we have profited from in the past and expect to profit from again.
At its most basic, our process compares a company's current price to what we expect the business to look like three to five years out. We always want to be aware of near-term headwinds. But generally, it is lower current prices and an expanding discrepancy to a company's long-term economic earnings that provides us with a margin of safety. We look for quality companies that we are confident will be worth considerably more over that time horizon and we are very comfortable buying from sellers who are afraid that the price will fall further tomorrow.
1 Source: Factset
2 Federal Reserve Economic Data, 10/2022 Release.
Past performance is no guarantee, nor is it indicative, of future results.
1
FPA QUEENS ROAD VALUE FUND
LETTER TO SHAREHOLDERS
(Continued)
Quality and the Four Pillar Process
We have a preference for compounders — high-quality franchises with great balance sheets, management teams and industry tailwinds that we hope to own forever.3 Compounders don't usually come cheap, and while we are valuation conscious, we are generally willing to pay a little bit more for higher quality. While the vast majority of financial assets are down year to date, quality compounders have generally held up better.
So, what do we mean by quality? At its most basic, quality means that we have confidence that a company's earnings and cash flows will be larger in three to five years than they are today. Different investors look at different heuristics or quantitative metrics that can describe quality. High returns on capital, high margins, organic growth, high cash conversion and low debt are all indicative of quality. But at the end of the day, we take a holistic look at our companies, sniff out the risks, seek to remain conservative and judicious, and compare the current price to our confidence in the future. Our four pillars — balance sheet strength, valuation, management, and industry analysis — guide our assessment of quality.
Historically, we believe the quality of the holdings has been a large contributor to the Fund's outperformance during market downturns. Low leverage allows companies to survive and reinvest during recessions. In our experience, strong management teams can be trusted to shepherd the company through headwinds and find new opportunities. We seek to invest in the companies that have strong competitive positions and that compete in industries with favorable economics and outlooks. In practice, it is never this easy. It is rare to find a company that sits cleanly atop each of the four pillars. And our view of the future is usually hazy at best. But when things get complicated and the future seems uncertain, the four pillars provide a framework for thinking through the next three to five years.
Trailing Twelve Months (TTM) and Semi-Annual Contributors and Detractors4
|
Contributors |
Performance Contribution |
Percent of Portfolio |
Detractors |
Performance Contribution |
Percent of Portfolio |
||||||||||||||||||
| 1H Fiscal Year 2023 | |||||||||||||||||||||||
|
Trane Technologies |
1.27 |
% |
4.7 |
% |
Intel |
-1.04 |
% |
2.6 |
% |
||||||||||||||
|
Ameriprise Financial |
1.22 |
% |
5.8 |
% |
V.F. |
-0.42 |
% |
1.0 |
% |
||||||||||||||
|
Eaton |
1.02 |
% |
5.7 |
% |
American Express |
-0.32 |
% |
5.0 |
% |
||||||||||||||
|
Oracle |
0.82 |
% |
5.2 |
% |
3M |
-0.22 |
% |
1.4 |
% |
||||||||||||||
|
Merck |
0.80 |
% |
3.9 |
% |
Verizon Communications |
-0.19 |
% |
0.6 |
% |
||||||||||||||
|
1.77 |
% |
5.1 |
% |
-3.65 |
% |
12.2 |
% |
||||||||||||||||
|
TTM |
|||||||||||||||||||||||
|
Elevance Health |
1.76 |
% |
6.3 |
% |
T. Rowe Price |
-1.48 |
% |
3.0 |
% |
||||||||||||||
|
General Dynamics |
1.50 |
% |
5.2 |
% |
Intel |
-1.28 |
% |
3.0 |
% |
||||||||||||||
|
Merck |
1.46 |
% |
3.5 |
% |
V.F. |
-0.86 |
% |
1.2 |
% |
||||||||||||||
|
Ameriprise Financial |
0.97 |
% |
5.7 |
% |
Danaher |
-0.78 |
% |
5.0 |
% |
||||||||||||||
|
Berkshire Hathaway |
0.51 |
% |
3.9 |
% |
Walt Disney |
-0.67 |
% |
1.8 |
% |
||||||||||||||
|
3.40 |
% |
4.5 |
% |
-5.02 |
% |
12.7 |
% |
||||||||||||||||
3 There can be no assurance the Fund will achieve its investment objectives. Past performance is no guarantee, nor is it indicative, of future results.
4 Reflects the top five contributors and detractors to the Fund's performance based on contribution to return for the trailing twelve months ("TTM"). Contribution is presented gross of investment management fees, transactions costs, and Fund operating expenses, which if included, would reduce the returns presented. The information provided does not reflect all positions purchased, sold or recommended during the quarter. A copy of the methodology used and a list of every holding's contribution to the overall Fund's performance during the TTM is available by contacting FPA Client Service at [email protected]. It should not be assumed that recommendations made in the future will be profitable or will equal the performance of the securities listed.
2
FPA QUEENS ROAD VALUE FUND
LETTER TO SHAREHOLDERS
(Continued)
For the 12 months ending November 30, 2022, the Fund's performance was negatively impacted by poor performance of portfolio holdings T. Rowe Price, Intel, V.F. Corporation, Danaher, and Walt Disney.5 This was partially offset by strong performance from healthcare holdings Merck and Elevance (formerly Anthem) as well as industrial General Dynamics, one of the Fund's largest holdings.
As we compare the stock price performance with the fundamental performance of the Fund's companies, we are very optimistic that the companies we are invested in will be worth more in 3-5 years than they are today. Taking a long-term view has served us well in the past and we are confident that our disciplined and patient approach will continue to be rewarded over the long-term.
Portfolio Positioning
During the period we were marginal net sellers as we eliminated one position.
As we look at the Fund's portfolio holdings6, we are more optimistic than we have been in quite some time. In our view, valuations appear more attractive than we have seen in quite some time. As we have said in the past, we believe when there is exuberance in the markets, it is usually overdone. Similarly, when markets get volatile and the pundits predict doom and gloom, it is usually overdone as well. If you have read our past commentaries, you will know that we are no Pollyanna. Rather our experience in the market over multiple market cycles has taught us this. We acknowledge the heightened uncertainty as well as the headwinds the economy faces but as we go through the portfolio, given the current valuations of the Fund's holdings and our long-term prospects for them, based on their fundamentals, we feel more positive about the portfolio than we have in several years.
Respectfully,

Steve Scruggs, CFA
Portfolio Manager
November 30, 2022
6 Portfolio holdings for the FPA Queens Road Value Fund can be found in the Related Documents section of the Fund Overview page. https://fpa.com/funds/overview/fpa-queens-road-value-fund
3
FPA QUEENS ROAD VALUE FUND
LETTER TO SHAREHOLDERS
(Continued)
Important Disclosures
This update is for informational and discussion purposes only and does not constitute, and should not be construed as, an offer or solicitation for the purchase or sale of any securities, products or services discussed, and neither does it provide investment advice. Any such offer or solicitation shall only be made pursuant to the Fund's Prospectus, which supersedes the information contained herein in its entirety. This Commentary does not constitute an investment management agreement or offering circular.
The statements contained herein reflect the opinions and views of the portfolio managers as of the date written, is subject to change without notice, and may be forward-looking and/or based on current expectations, projections, and/or information currently available. Such information may not be accurate over the long-term. These views may differ from other portfolio managers and analysts of the firm as a whole and are not intended to be a forecast of future events, a guarantee of future results or investment advice.
Portfolio composition will change due to ongoing management of the Fund. References to individual securities or sectors are for informational purposes only and should not be construed as recommendations by the Fund, the portfolio manager, the Adviser, the Sub-Adviser or the distributor. It should not be assumed that future investments will be profitable or will equal the performance of the security or sector examples discussed. The portfolio holdings as of the most recent quarter-end may be obtained at www.fpa.com.
Future events or results may vary significantly from those expressed and are subject to change at any time in response to changing circumstances and industry developments. The information and data contained herein has been prepared from sources believed reliable, but the accuracy and completeness of the information cannot be guaranteed and is not a complete summary or statement of all available data.
The information contained herein is not complete, may change, and is subject to, and is qualified in its entirety by, the more complete disclosures, risk factors, and other information contained in the Fund's Prospectus and Statement of Additional Information. The information is furnished as of the date shown. No representation is made with respect to its completeness or timeliness. The information is not intended to be, nor shall it be construed as, investment advice or a recommendation of any kind.
Certain statements contained in this presentation may be forward-looking and/or based on current expectations, projections, and information currently available. Actual events or results may differ from materially those we anticipate, or the actual performance of any investments described herein may differ from those reflected or contemplated in such forward-looking statements, due to various risks and uncertainties. We cannot assure future results and disclaim any obligation to update or alter any forward-looking statements, whether as a result of new information, future events, or otherwise. Such statements may or may not be accurate over the long-term. Statistical data or references thereto were taken from sources which we deem to be reliable, but their accuracy cannot be guaranteed.
The reader is advised that the Fund's investment strategy includes active management with corresponding changes in allocations from one period of time to the next. Therefore, any data with respect to investment allocations as of a given date is of limited use and may not be reflective of the portfolio manager's more general views with respect to proper geographic, instrument and /or sector allocations. The data is presented for indicative purposes only and, as a result, may not be relied upon for any purposes whatsoever.
In making any investment decision, you must rely on your own examination of the Fund, including the risks involved in an investment. Investments mentioned herein may not be suitable for all recipients and in each case, potential investors are advised not to make any investment decision unless they have taken independent advice from an appropriately authorized advisor. An investment in any security mentioned herein does not guarantee a positive return as securities are subject to market risks, including the potential loss of principal. You should not construe the contents of this document as legal, tax, investment or other advice or recommendations.
4
FPA QUEENS ROAD VALUE FUND
LETTER TO SHAREHOLDERS
(Continued)
Fund performance presented is calculated on a total return basis, which includes the reinvestment of all income, plus realized and unrealized gains/losses, if applicable. Unless otherwise indicated, performance results are presented on a net of fees basis and reflect the deduction of, among other things: management fees, brokerage commissions, operating and administrative expenses, and accrued performance fee/allocation, if applicable.
The information provided in this presentation is based upon data existing as of the date(s) of the report and has not been audited or reviewed. While we believe the information to be accurate, it is subject in all respects to adjustments that may be made after proper review and reconciliation.
Investments, including mutual fund investments, carry risks and investors may lose principal value. Capital markets are volatile and can decline significantly in response to adverse issuer, political, regulatory, market, or economic developments. Small and mid-cap stocks involve greater risks and they can fluctuate in price more than larger company stocks. Short-selling involves increased risks and transaction costs. You risk paying more for a security than you received from its sale. Groups of stocks, such as value and growth, go in and out of favor which may cause certain funds to underperform other equity funds. The value of an individual security can be more volatile than the market as a whole and can perform differently than the value of the market as a whole.
The prices of securities held by the Fund may decline in response to certain events taking place around the world, including those directly involving the companies whose securities are owned by the Fund. Securities in the Fund's portfolio may underperform due to inflation (or expectations for inflation), interest rates, global demand for particular products or resources, natural disasters, pandemics, epidemics, terrorism, regulatory events and governmental or quasi-governmental actions. There is a risk that you may lose money by investing in the Fund.
Value style investing presents the risk that the holdings or securities may never reach their full market value because the market fails to recognize what the portfolio management team considers the true business value or because the portfolio management team has misjudged those values. In addition, value style investing may fall out of favor and underperform growth or other styles of investing during given periods.
Please refer to the Fund's Prospectus for a complete overview of the primary risks associated with the Fund.
The FPA Funds are distributed by UMB Distribution Services, LLC, 235 W. Galena Street, Milwaukee, WI, 53212.
Index / Benchmark / Category Definitions
The Fund will typically be less diversified than the indices noted herein and may hold non-index securities or securities that are not comparable to those contained in an index. Indices will hold positions that are not within the Fund's investment strategy. Indices are unmanaged and do not reflect any commissions, transaction costs, or fees and expenses which would be incurred by an investor purchasing the underlying securities and which would reduce the performance in an actual account. You cannot invest directly in an index.
The S&P 500 Value Index is a market cap-weighted index. The value factors used to determine a stock's value score are book value to price ratio, cash flow to price ratio, sales to price ratio and dividend yield. S&P Style Indices divide the complete market capitalization of each parent index into growth and value segments. Constituents are drawn from the S&P 500.
The Global Industries Classification Standards, or GICS®, is a common global classification standard developed by S&P Dow Jones Indices and MSCI. The GICS structure consists of 11 Sectors, 24 Industry groups, 69 Industries and 158 sub-industries
5
FPA QUEENS ROAD VALUE FUND
LETTER TO SHAREHOLDERS
(Continued)
The discussions of Fund investments represent the views of the Fund's managers at the time of this report and are subject to change without notice. References to individual securities are for informational purposes only and should not be construed as recommendations to purchase or sell individual securities. While the Fund's managers believe that the Fund's holdings are value stocks, there can be no assurance that others will consider them as such. Further, investing in value stocks presents the risk that value stocks may fall out of favor with investors and underperform growth stocks during given periods.
FORWARD LOOKING STATEMENT DISCLOSURE
As mutual fund managers, one of our responsibilities is to communicate with shareholders in an open and direct manner. Insofar as some of our opinions and comments in our letters to shareholders are based on our current expectations, they are considered "forward-looking statements" which may or may not prove to be accurate over the long term. While we believe we have a reasonable basis for our comments and we have confidence in our opinions, actual results may differ materially from those we anticipate. You can identify forward-looking statements by words such as "believe," "expect," "may," "anticipate," and other similar expressions when discussing prospects for particular portfolio holdings and/or the markets, generally. We cannot, however, assure future results and disclaim any obligation to update or alter any forward-looking statements, whether as a result of new information, future events, or otherwise. Further, information provided in this report should not be construed as a recommendation to purchase or sell any particular security.
6
FPA QUEENS ROAD VALUE FUND
PORTFOLIO SUMMARY
November 30, 2022 (Unaudited)
|
Common Stocks |
95.8 |
% |
|||||||||
|
Wealth Management |
9.5 |
% |
|||||||||
|
Industrials |
8.5 |
% |
|||||||||
|
P&C Insurance |
7.2 |
% |
|||||||||
|
Managed Care |
6.9 |
% |
|||||||||
|
Homebuilders |
6.3 |
% |
|||||||||
|
Electrical Components |
6.1 |
% |
|||||||||
|
Infrastructure Software |
5.5 |
% |
|||||||||
|
Consumer Finance |
5.0 |
% |
|||||||||
|
Life Science Equipment |
4.9 |
% |
|||||||||
|
Large Pharmaceuticals |
4.4 |
% |
|||||||||
|
Communications Equipment |
4.4 |
% |
|||||||||
|
Specialty Pharmaceuticals |
4.3 |
% |
|||||||||
|
Application Software |
3.6 |
% |
|||||||||
|
Diversified Banks |
3.6 |
% |
|||||||||
|
Restaurants |
3.3 |
% |
|||||||||
|
Semiconductor Devices |
2.2 |
% |
|||||||||
|
Institutional Trust Fiduciary & Custody |
1.9 |
% |
|||||||||
|
Rail Freight |
1.9 |
% |
|||||||||
|
Industrial Distribution & Rental |
1.9 |
% |
|||||||||
|
Packaged Food |
1.7 |
% |
|||||||||
|
Entertainment Content |
1.4 |
% |
|||||||||
|
Apparel, Footwear & Accessory Design |
0.8 |
% |
|||||||||
|
Household Products |
0.5 |
% |
|||||||||
|
Short-term Investments |
4.5 |
% |
|||||||||
|
Other Assets And Liabilities, Net |
(0.3 |
)% |
|||||||||
|
Net Assets |
100.0 |
% |
|||||||||
7
FPA QUEENS ROAD VALUE FUND
PORTFOLIO OF INVESTMENTS
November 30, 2022
(Unaudited)
|
COMMON STOCKS |
Shares |
Fair Value |
|||||||||
|
WEALTH MANAGEMENT — 9.5% |
|||||||||||
|
Ameriprise Financial, Inc. |
7,000 |
$ |
2,323,650 |
||||||||
|
T Rowe Price Group, Inc. |
7,900 |
986,789 |
|||||||||
|
$ |
3,310,439 |
||||||||||
|
INDUSTRIALS — 8.5% |
|||||||||||
|
3M Co. |
3,600 |
$ |
453,492 |
||||||||
|
General Dynamics Corp. |
8,000 |
2,019,120 |
|||||||||
|
Ingersoll Rand, Inc. |
9,000 |
485,730 |
|||||||||
|
$ |
2,958,342 |
||||||||||
|
P&C INSURANCE — 7.2% |
|||||||||||
|
Berkshire Hathaway, Inc. Class A(a) |
3 |
$ |
1,440,840 |
||||||||
|
Prudential Financial, Inc. |
10,000 |
1,080,300 |
|||||||||
|
$ |
2,521,140 |
||||||||||
|
MANAGED CARE — 6.9% |
|||||||||||
|
Elevance Health, Inc. |
4,500 |
$ |
2,398,140 |
||||||||
|
$ |
2,398,140 |
||||||||||
|
HOMEBUILDERS — 6.3% |
|||||||||||
|
Allegion PLC (Ireland) |
3,400 |
$ |
386,410 |
||||||||
|
Trane Technologies PLC (Ireland) |
10,200 |
1,819,884 |
|||||||||
|
$ |
2,206,294 |
||||||||||
|
ELECTRICAL COMPONENTS — 6.1% |
|||||||||||
|
Eaton Corp. PLC |
13,000 |
$ |
2,124,850 |
||||||||
|
$ |
2,124,850 |
||||||||||
|
INFRASTRUCTURE SOFTWARE — 5.5% |
|||||||||||
|
Oracle Corp. |
23,395 |
$ |
1,942,487 |
||||||||
|
$ |
1,942,487 |
||||||||||
|
CONSUMER FINANCE — 5.0% |
|||||||||||
|
American Express Co. |
11,000 |
$ |
1,733,490 |
||||||||
|
$ |
1,733,490 |
||||||||||
|
LIFE SCIENCE EQUIPMENT — 4.9% |
|||||||||||
|
Danaher Corp. |
6,300 |
$ |
1,722,483 |
||||||||
|
$ |
1,722,483 |
||||||||||
|
LARGE PHARMACEUTICALS — 4.4% |
|||||||||||
|
Pfizer, Inc. |
31,000 |
$ |
1,554,030 |
||||||||
|
$ |
1,554,030 |
||||||||||
|
COMMUNICATIONS EQUIPMENT — 4.4% |
|||||||||||
|
Cisco Systems, Inc. |
30,700 |
$ |
1,526,404 |
||||||||
|
$ |
1,526,404 |
||||||||||
8
FPA QUEENS ROAD VALUE FUND
PORTFOLIO OF INVESTMENTS (Continued)
November 30, 2022
(Unaudited)
|
COMMON STOCKS — Continued |
Shares |
Fair Value |
|||||||||
|
SPECIALTY PHARMACEUTICALS — 4.3% |
|||||||||||
|
Merck & Co., Inc. |
13,820 |
$ |
1,521,858 |
||||||||
|
$ |
1,521,858 |
||||||||||
|
APPLICATION SOFTWARE — 3.6% |
|||||||||||
|
Fiserv, Inc.(a) |
12,000 |
$ |
1,252,320 |
||||||||
|
$ |
1,252,320 |
||||||||||
|
DIVERSIFIED BANKS — 3.6% |
|||||||||||
|
JPMorgan Chase & Co. |
9,000 |
$ |
1,243,620 |
||||||||
|
$ |
1,243,620 |
||||||||||
|
RESTAURANTS — 3.3% |
|||||||||||
|
McDonald's Corp. |
4,225 |
$ |
1,152,538 |
||||||||
|
$ |
1,152,538 |
||||||||||
|
SEMICONDUCTOR DEVICES — 2.2% |
|||||||||||
|
Intel Corp. |
26,000 |
$ |
781,820 |
||||||||
|
$ |
781,820 |
||||||||||
|
INSTITUTIONAL TRUST FIDUCIARY & CUSTODY — 1.9% |
|||||||||||
|
Bank of New York Mellon Corp. |
14,500 |
$ |
665,550 |
||||||||
|
$ |
665,550 |
||||||||||
|
RAIL FREIGHT — 1.9% |
|||||||||||
|
Union Pacific Corp. |
3,000 |
$ |
652,290 |
||||||||
|
$ |
652,290 |
||||||||||
|
INDUSTRIAL DISTRIBUTION & RENTAL — 1.9% |
|||||||||||
|
Raytheon Technologies Corp. |
6,600 |
$ |
651,552 |
||||||||
|
$ |
651,552 |
||||||||||
|
PACKAGED FOOD — 1.7% |
|||||||||||
|
Mondelez International, Inc. Class A |
9,000 |
$ |
608,490 |
||||||||
|
$ |
608,490 |
||||||||||
|
ENTERTAINMENT CONTENT — 1.4% |
|||||||||||
|
Walt Disney Co.(a) |
5,151 |
$ |
504,128 |
||||||||
|
$ |
504,128 |
||||||||||
|
APPAREL, FOOTWEAR & ACCESSORY DESIGN — 0.8% |
|||||||||||
|
VF Corp. |
8,500 |
$ |
278,970 |
||||||||
|
$ |
278,970 |
||||||||||
|
HOUSEHOLD PRODUCTS — 0.5% |
|||||||||||
|
Clorox Co. |
1,200 |
$ |
178,380 |
||||||||
|
$ |
178,380 |
||||||||||
| TOTAL COMMON STOCKS — 95.8% (Cost $11,200,180) |
$ |
33,489,615 |
|||||||||
9
FPA QUEENS ROAD VALUE FUND
PORTFOLIO OF INVESTMENTS (Continued)
November 30, 2022
(Unaudited)
|
SHORT-TERM INVESTMENTS |
Shares |
Fair Value |
|||||||||
|
State Street Institutional Treasury Plus Money Market Fund, 3.67%(b) |
1,567,337 |
$ |
1,567,337 |
||||||||
| TOTAL SHORT-TERM INVESTMENTS — 4.5% (Cost $1,567,337) |
$ |
1,567,337 |
|||||||||
| TOTAL INVESTMENTS — 100.3% (Cost $12,767,517) |
$ |
35,056,952 |
|||||||||
|
Other Assets and Liabilities, net — (0.3)% |
(98,622 |
) |
|||||||||
|
NET ASSETS — 100.0% |
$ |
34,958,330 |
|||||||||
(a) Non-income producing security.
(b) Represents the 7-day effective yield as of November 30, 2022.
See accompanying Notes to Financial Statements.
10
FPA QUEENS ROAD VALUE FUND
STATEMENT OF ASSETS AND LIABILITIES
November 30, 2022
(Unaudited)
|
ASSETS |
|||||||
|
Investment securities — at fair value (identified cost $11,200,180) |
$ |
33,489,615 |
|||||
|
Short-term investments — at amortized cost (maturities 60 days or less) |
1,567,337 |
||||||
|
Cash |
10,530 |
||||||
|
Receivable for: |
|||||||
|
Dividends and interest |
54,920 |
||||||
|
Due from Advisor |
14,713 |
||||||
|
Prepaid expenses and other assets |
157 |
||||||
|
Total assets |
35,137,272 |
||||||
|
LIABILITIES |
|||||||
|
Payable for: |
|||||||
|
Capital Stock repurchased |
76,900 |
||||||
|
Accrued expenses and other liabilities |
102,042 |
||||||
|
Total liabilities |
178,942 |
||||||
|
NET ASSETS |
$ |
34,958,330 |
|||||
|
SUMMARY OF SHAREHOLDERS' EQUITY |
|||||||
|
Capital Stock — par value $0.01 per share; unlimited authorized shares; 1,360,455 outstanding shares |
$ |
13,605 |
|||||
|
Additional Paid-in Capital |
11,770,724 |
||||||
|
Distributable earnings |
23,174,001 |
||||||
|
NET ASSETS |
$ |
34,958,330 |
|||||
|
NET ASSET VALUE |
|||||||
|
Offering and redemption price per share |
$ |
25.70 |
|||||
See accompanying Notes to Financial Statements.
11
FPA QUEENS ROAD VALUE FUND
STATEMENT OF OPERATIONS
For the Six Months Ended November 30, 2022
(Unaudited)
|
INVESTMENT INCOME |
|||||||
|
Dividends |
$ |
338,810 |
|||||
|
Interest |
21,730 |
||||||
|
Total investment income |
360,540 |
||||||
|
EXPENSES |
|||||||
|
Advisory fees |
155,196 |
||||||
|
Legal fees |
54,084 |
||||||
|
Trustee fees and expenses |
36,528 |
||||||
|
Reports to shareholders |
22,649 |
||||||
|
Transfer agent fees and expenses |
21,274 |
||||||
|
Filing fees |
15,846 |
||||||
|
Administrator fees |
11,154 |
||||||
|
Audit and tax services fees |
11,080 |
||||||
|
Custodian fees |
9,497 |
||||||
|
Other professional fees |
1,357 |
||||||
|
Other |
3,699 |
||||||
|
Total expenses |
342,364 |
||||||
|
Reimbursement from Adviser |
(236,178 |
) |
|||||
|
Net expenses |
106,186 |
||||||
|
Net investment income |
254,354 |
||||||
|
NET REALIZED AND UNREALIZED GAIN (LOSS) |
|||||||
|
Net realized gain on: |
|||||||
|
Investments |
110,157 |
||||||
|
Net change in unrealized appreciation (depreciation) of: |
|||||||
|
Investments |
1,420,800 |
||||||
|
Net realized and unrealized gain |
1,530,957 |
||||||
|
NET INCREASE IN NET ASSETS RESULTING FROM OPERATIONS |
$ |
1,785,311 |
|||||
See accompanying Notes to Financial Statements.
12
FPA QUEENS ROAD VALUE FUND
STATEMENTS OF CHANGES IN NET ASSETS
|
Six Months Ended November 30, 2022 (Unaudited) |
Year Ended May 31, 2022 |
||||||||||
|
INCREASE (DECREASE) IN NET ASSETS |
|||||||||||
|
Operations: |
|||||||||||
|
Net investment income |
$ |
254,354 |
$ |
442,095 |
|||||||
|
Net realized gain |
110,157 |
4,037,407 |
|||||||||
|
Net change in unrealized appreciation (depreciation) |
1,420,800 |
(5,068,156 |
) |
||||||||
|
Net increase (decrease) in net assets resulting from operations |
1,785,311 |
(588,654 |
) |
||||||||
|
Distributions to shareholders |
— |
(6,393,788 |
) |
||||||||
|
Capital Stock transactions: |
|||||||||||
|
Proceeds from Capital Stock sold |
850,431 |
4,030,264 |
|||||||||
|
Proceeds from shares issued to shareholders upon reinvestment of dividends and distributions |
— |
6,327,612 |
|||||||||
|
Cost of Capital Stock repurchased |
(2,012,771 |
) |
(10,974,978 |
) |
|||||||
|
Net decrease from Capital Stock transactions |
(1,162,340 |
) |
(617,102 |
) |
|||||||
|
Total change in net assets |
622,971 |
(7,599,544 |
) |
||||||||
|
NET ASSETS |
|||||||||||
|
Beginning of period |
34,335,359 |
41,934,903 |
|||||||||
|
End of period |
$ |
34,958,330 |
$ |
34,335,359 |
|||||||
|
CHANGE IN CAPITAL STOCK OUTSTANDING |
|||||||||||
|
Shares of Capital Stock sold |
36,538 |
133,385 |
|||||||||
|
Shares issued to shareholders upon reinvestment of dividends and distributions |
— |
240,502 |
|||||||||
|
Shares of Capital Stock repurchased |
(84,797 |
) |
(400,933 |
) |
|||||||
|
Change in Capital Stock outstanding |
(48,259 |
) |
(27,046 |
) |
|||||||
See accompanying Notes to Financial Statements.
13
FPA QUEENS ROAD VALUE FUND
FINANCIAL HIGHLIGHTS
Selected Data for Each Share of Capital Stock Outstanding Throughout Each Period
|
Six Months Ended November 30, 2022 |
Year Ended May 31, |
||||||||||||||||||||||||||
|
(Unaudited) |
2022 |
2021 |
2020(a) |
2019(a) |
2018(a) |
||||||||||||||||||||||
|
Per share operating performance: |
|||||||||||||||||||||||||||
|
Net asset value at beginning of period |
$ |
24.37 |
$ |
29.21 |
$ |
22.45 |
$ |
22.67 |
$ |
22.79 |
$ |
21.69 |
|||||||||||||||
|
Income from investment operations: |
|||||||||||||||||||||||||||
|
Net investment income(b) |
0.18 |
0.32 |
0.39 |
0.43 |
0.35 |
0.33 |
|||||||||||||||||||||
|
Net realized and unrealized gain (loss) on investment securities |
1.15 |
(0.63 |
) |
7.99 |
0.20 |
0.94 |
1.70 |
||||||||||||||||||||
|
Total from investment operations |
1.33 |
(0.31 |
) |
8.38 |
0.63 |
1.29 |
2.03 |
||||||||||||||||||||
|
Less distributions: |
|||||||||||||||||||||||||||
|
Dividends from net investment income |
— |
(0.37 |
) |
(0.48 |
) |
(0.37 |
) |
(0.34 |
) |
(0.29 |
) |
||||||||||||||||
|
Distributions from net realized capital gains |
— |
(4.16 |
) |
(1.14 |
) |
(0.48 |
) |
(1.07 |
) |
(0.64 |
) |
||||||||||||||||
|
Total distributions |
— |
(4.53 |
) |
(1.62 |
) |
(0.85 |
) |
(1.41 |
) |
(0.93 |
) |
||||||||||||||||
|
Net asset value at end of period |
$ |
25.70 |
$ |
24.37 |
$ |
29.21 |
$ |
22.45 |
$ |
22.67 |
$ |
22.79 |
|||||||||||||||
|
Total investment return(c) |
5.46 |
% |
(2.19 |
)% |
38.62 |
% |
2.41 |
% |
6.36 |
% |
9.25 |
% |
|||||||||||||||
|
Ratios/supplemental data: |
|||||||||||||||||||||||||||
|
Net assets, end of period (in 000's) |
$ |
34,958 |
$ |
34,335 |
$ |
41,935 |
$ |
34,580 |
$ |
39,423 |
$ |
42,780 |
|||||||||||||||
|
Ratio of expenses to average net assets: |
|||||||||||||||||||||||||||
|
Before reimbursement from Adviser |
2.10 |
%(d) |
1.95 |
% |
1.43 |
% |
0.95 |
% |
0.95 |
% |
0.95 |
% |
|||||||||||||||
|
After reimbursement from Adviser |
0.65 |
%(d) |
0.65 |
% |
0.77 |
%(e) |
0.95 |
% |
0.95 |
% |
0.95 |
% |
|||||||||||||||
|
Ratio of net investment income to average net assets: |
|||||||||||||||||||||||||||
|
Before reimbursement from Adviser |
0.11 |
%(d) |
(0.18 |
)% |
0.89 |
% |
1.84 |
% |
1.52 |
% |
1.43 |
% |
|||||||||||||||
|
After reimbursement from Adviser |
1.56 |
%(d) |
1.12 |
% |
1.55 |
% |
1.84 |
% |
1.52 |
% |
1.43 |
% |
|||||||||||||||
|
Portfolio turnover rate |
— |
4 |
% |
— |
1 |
% |
1 |
% |
— |
||||||||||||||||||
(a) Audits performed for the fiscal years indicated by the Fund's previous auditor, Cohen & Company, Ltd.
(b) Per share amount is based on average shares outstanding.
(c) Return is based on net asset value per share, adjusted for reinvestment of distributions, and does not reflect deduction of the sales charge.
(d) Annualized.
(e) Effective November 1, 2020, the Advisor has contractually agreed to limit the annual fund operating expenses to 0.65%. Prior to November 1, 2020, the fund had a unitary fee structure that limited annual operating expenses to 0.95%.
See accompanying Notes to Financial Statements.
14
FPA QUEENS ROAD VALUE FUND
NOTES TO FINANCIAL STATEMENTS
November 30, 2022
(Unaudited)
NOTE 1 — Significant Accounting Policies
The FPA Queens Road Value Fund (the "Fund"), is a diversified managed portfolio of Bragg Capital Trust (the "Trust"), which is registered under the Investment Company Act of 1940, as amended (the "1940 Act"), as an open-end management company. The Fund's investment objective is to seek long-term capital growth. The Fund invests primarily in common stocks which are believed by First Pacific Advisors, L.P. (the "Adviser") and Bragg Financial Advisors, Inc. (the "Sub-Adviser") to be undervalued and have good prospects for capital appreciation. The following is a summary of significant accounting policies consistently followed by the Fund in the preparation of its financial statements.
A. Security Valuation
The Fund's investments are reported at fair value as defined by accounting principles generally accepted in the United States of America, ("U.S. GAAP"). The Fund generally determines its net asset value as of approximately 4:00 p.m. New York time each day the New York Stock Exchange is open. Further discussion of valuation methods, inputs and classifications can be found under Disclosure of Fair Value Measurements.
B. Securities Transactions and Related Investment Income
Securities transactions are accounted for on the date the securities are purchased or sold. Dividend income and distributions to shareholders are recorded on the ex-dividend date. Interest income and expenses are recorded on an accrual basis. Market discounts and premiums on fixed income securities are amortized over the expected life of the securities using effective interest rate method. Realized gains or losses are based on the specific identification method. The books and records of the Fund are maintained in U.S. dollars as follows: (1) the foreign currency fair value of investment securities, and other assets and liabilities stated in foreign currencies, are translated using the daily spot rate; and (2) purchases, sales, income and expenses are translated at the rate of exchange prevailing on the respective dates of such transactions. The resultant exchange gains and losses are included in net realized or net unrealized gain (loss) in the statement of operations.
C. Use of Estimates
The preparation of the financial statements in accordance with U.S. GAAP requires management to make estimates and assumptions that affect the amounts reported. Actual results could differ from those estimates.
NOTE 2 — Risk Considerations
Investing in the Fund may involve certain risks including, but not limited to, those described below.
Market Risk: Because the values of the Fund's investments will fluctuate with market conditions, so will the value of your investment in the Fund. You could lose money on your investment in the Fund or the Fund could underperform other investments.
Common Stocks and Other Securities: The prices of common stocks and other securities held by the Fund may decline in response to certain events taking place around the world, including; those directly involving companies whose securities are owned by the Fund; conditions affecting the general economy; overall market changes; local, regional or global political, social or economic instability; and currency, interest rate and commodity price fluctuations. In addition, the emphasis on a value-oriented investment approach by the Fund's Sub-Adviser generally results in the Fund's portfolio being invested primarily in medium or smaller sized companies. Smaller companies may be subject to a greater degree of change in earnings and business prospects
15
FPA QUEENS ROAD VALUE FUND
NOTES TO FINANCIAL STATEMENTS (Continued)
(Unaudited)
than larger, more established companies, and smaller companies are often more reliant on key products or personnel than larger companies. Also, securities of smaller companies are traded in lower volumes than those issued by larger companies and may be more volatile than those of larger companies. The Fund's foreign investments are subject to additional risks such as, foreign markets could go down or prices of the Fund's foreign investments could go down because of unfavorable changes in foreign currency exchange rates, foreign government actions, social, economic or political instability or other factors that can adversely affect investments in foreign countries. These factors can also make foreign securities less liquid, more volatile and harder to value than U.S. securities. In light of these characteristics of smaller companies and their securities, the Fund may be subjected to greater risk than that assumed when investing in the equity securities of larger companies.
Many countries have experienced outbreaks of infectious illnesses in recent decades, including swine flu, avian influenza, SARS and, more recently, COVID-19. The global outbreak of COVID-19 in early 2020 has resulted in various disruptions, including travel and border restrictions, quarantines, supply chain disruptions, lower consumer demand and general market uncertainty. The full effects, duration and costs of the COVID-19 pandemic are impossible to predict, and the circumstances surrounding the COVID-19 pandemic will continue to evolve, including the risk of future increased rates of infection due to low vaccination rates and/or the lack of effectiveness of current vaccines against new variants. Similar consequences could arise as a result of the spread of other infectious diseases. Management will continue to monitor the impact COVID-19 has on the Fund and reflect the consequences as appropriate in the Fund's accounting and financial reporting.
NOTE 3 — Purchases and Sales of Investment Securities
Cost of purchases of investment securities (excluding short-term investments) aggregated $0 for the period ended November 30, 2022. The proceeds and cost of securities sold resulting in net realized gains of $110,157 aggregated $441,490 and $331,333, respectively, for the period ended November 30, 2022.
NOTE 4 — Federal Income Tax
No provision for federal income tax is required because the Fund has elected to be taxed as a "regulated investment company" under the Internal Revenue Code (the "Code") and intends to maintain this qualification and to distribute each year to its shareholders, in accordance with the minimum distribution requirements of the Code, its taxable net investment income and taxable net realized gains on investments.
The cost of investment securities held at November 30, 2022 was $11,208,414 for federal income tax purposes. Gross unrealized appreciation and depreciation for all investments at November 30, 2022, for federal income tax purposes was $22,335,800 and $54,599, respectively resulting in net unrealized appreciation of $22,281,201. As of and during the period ended November 30, 2022, the Fund did not have any liability for unrecognized tax benefits. The Fund recognizes interest and penalties, if any, related to unrecognized tax benefits as income tax expense in the Statement of Operations. During the year, the Fund did not incur any interest or penalties. The statute of limitations remains open for the last 3 years, once a return is filed. No examinations are in progress at this time.
NOTE 5 — Advisory Fees and Other Affiliated Transactions
Pursuant to an investment advisory agreement (the "Advisory Agreement") with the Fund, investment advisory services are provided to the Fund by the Adviser. Effective November 1, 2020, under terms of the Advisory Agreement, the Fund pays a fee, computed daily and payable monthly at the annual rate of 0.95% of the Fund's average daily net assets. The amount due from the Adviser at November 30, 2022, in the form of Accrued Advisory Fees, was $14,713.
16
FPA QUEENS ROAD VALUE FUND
NOTES TO FINANCIAL STATEMENTS (Continued)
(Unaudited)
Pursuant to a written contract (the "Expense Limitation Agreement"), effective November 1, 2020, the Adviser has agreed to reimburse the Fund for operating expenses in excess of 0.65% of average net assets of the Fund, excluding interest, taxes, brokerage fees and commissions payable by the Fund in connection with the purchase or sale of portfolio securities, fees and expenses of other funds in which the Fund invests, and extraordinary expenses, including litigation expenses, not incurred in the Fund's ordinary course of business, through October 31, 2023.
In consideration of the Adviser's agreement to limit the Fund's expenses, the Adviser may recoup amounts waived or reimbursed for a period not to exceed three years from the time in which they were waived or reimbursed. Recoupment will be made only to the extent it does not cause the Fund's ordinary operating expenses to exceed: (1) the expense limitation in effect at the time the expense was paid or absorbed; and (2) the expense limitation in effect at the time of recapture. For the years ended May 31, 2022 and period ended November 30, 2022, the Adviser waived fees/reimbursed expenses of $511,891 and $236,178, respectively. These amounts are subject to recapture by May 31, 2024 and May 31, 2025, respectively.
Sub-Advisory Agreement — Effective November 1, 2020, the Adviser and the Trust engaged the Sub- Adviser. For its services, the Sub-Adviser receives a sub-advisory fee from the Adviser. The Sub-Adviser served as the investment adviser to the Fund until November 1, 2020.
For the period ended November 30, 2022, the Fund paid aggregate fees and expenses of $36,528, to all Trustees who are not affiliated persons of the Adviser. Certain officers of the Fund are also officers of the Adviser.
NOTE 6 — Disclosure of Fair Value Measurements
The Fund uses the following methods and inputs to establish the fair value of its assets and liabilities. Use of particular methods and inputs may vary over time based on availability and relevance as market and economic conditions evolve.
Equity securities are generally valued each day at the official closing price of, or the last reported sale price on, the exchange or market on which such securities principally are traded, as of the close of business on that day. If there have been no sales that day, equity securities are generally valued at the last available bid price. Securities that are unlisted and fixed-income and convertible securities listed on a national securities exchange for which the over-the-counter ("OTC") market more accurately reflects the securities' value in the judgment of the Fund's officers, are valued at the most recent bid price. Short-term corporate notes with maturities of 60 days or less at the time of purchase are valued at amortized cost.
Securities for which representative market quotations are not readily available or are considered unreliable by the Adviser are valued as determined in good faith under procedures adopted by the authority of the Fund's Board of Trustees. Various inputs may be reviewed in order to make a good faith determination of a security's value. These inputs include, but are not limited to, the type and cost of the security; contractual or legal restrictions on resale of the security; relevant financial or business developments of the issuer; actively traded similar or related securities; conversion or exchange rights on the security; related corporate actions; significant events occurring after the close of trading in the security; and changes in overall market conditions. Fair valuations and valuations of investments that are not actively trading involve judgment and may differ materially from valuations of investments that would have been used had greater market activity occurred.
The Fund classifies its assets based on three valuation methodologies. Level 1 values are based on quoted market prices in active markets for identical assets. Level 2 values are based on significant observable market inputs, such as quoted prices for similar assets and quoted prices in inactive markets or other market observable
17
FPA QUEENS ROAD VALUE FUND
NOTES TO FINANCIAL STATEMENTS (Continued)
(Unaudited)
inputs as noted above including spreads, cash flows, financial performance, prepayments, defaults, collateral, credit enhancements, and interest rate volatility. Level 3 values are based on significant unobservable inputs that reflect the Fund's determination of assumptions that market participants might reasonably use in valuing the assets. The valuation levels are not necessarily an indication of the risk associated with investing in those securities. The following table presents the valuation levels of the Fund's investments as of November 30, 2022:
|
Investments |
Level 1 |
Level 2 |
Level 3 |
Total |
|||||||||||||||
|
Common Stocks |
|||||||||||||||||||
|
Wealth Management |
$ |
3,310,439 |
— |
— |
$ |
3,310,439 |
|||||||||||||
|
Industrials |
2,958,342 |
— |
— |
2,958,342 |
|||||||||||||||
|
P&C Insurance |
2,521,140 |
— |
— |
2,521,140 |
|||||||||||||||
|
Managed Care |
2,398,140 |
— |
— |
2,398,140 |
|||||||||||||||
|
Homebuilders |
2,206,294 |
— |
— |
2,206,294 |
|||||||||||||||
|
Electrical Components |
2,124,850 |
— |
— |
2,124,850 |
|||||||||||||||
|
Infrastructure Software |
1,942,487 |
— |
— |
1,942,487 |
|||||||||||||||
|
Consumer Finance |
1,733,490 |
— |
— |
1,733,490 |
|||||||||||||||
|
Life Science Equipment |
1,722,483 |
— |
— |
1,722,483 |
|||||||||||||||
|
Large Pharmaceuticals |
1,554,030 |
— |
— |
1,554,030 |
|||||||||||||||
|
Communications Equipment |
1,526,404 |
— |
— |
1,526,404 |
|||||||||||||||
|
Specialty Pharmaceuticals |
1,521,858 |
— |
— |
1,521,858 |
|||||||||||||||
|
Application Software |
1,252,320 |
— |
— |
1,252,320 |
|||||||||||||||
|
Diversified Banks |
1,243,620 |
— |
— |
1,243,620 |
|||||||||||||||
|
Restaurants |
1,152,538 |
— |
— |
1,152,538 |
|||||||||||||||
|
Semiconductor Devices |
781,820 |
— |
— |
781,820 |
|||||||||||||||
|
Institutional Trust Fiduciary & Custody |
665,550 |
— |
— |
665,550 |
|||||||||||||||
|
Rail Freight |
652,290 |
— |
— |
652,290 |
|||||||||||||||
|
Industrial Distribution & Rental |
651,552 |
— |
— |
651,552 |
|||||||||||||||
|
Packaged Food |
608,490 |
— |
— |
608,490 |
|||||||||||||||
|
Entertainment Content |
504,128 |
— |
— |
504,128 |
|||||||||||||||
|
Apparel, Footwear & Accessory Design |
278,970 |
— |
— |
278,970 |
|||||||||||||||
|
Household Products |
178,380 |
— |
— |
178,380 |
|||||||||||||||
|
Short-Term Investment |
— |
$ |
1,567,337 |
— |
1,567,337 |
||||||||||||||
|
$ |
33,489,615 |
$ |
1,567,337 |
— |
$ |
35,056,952 |
|||||||||||||
Transfers of investments between different levels of the fair value hierarchy are recorded at fair value as of the end of the reporting period. There were no significant transfers into or out of Level 3 during the period ended November 30, 2022.
The Fund did not hold derivatives as of November 30, 2022.
18
FPA QUEENS ROAD VALUE FUND
SHAREHOLDER EXPENSE EXAMPLE
November 30, 2022 (Unaudited)
Fund Expenses
Mutual fund shareholders generally incur two types of costs: (1) transaction costs, and (2) ongoing costs, including advisory and administrative fees; shareholder service fees; and other Fund expenses. The Example is intended to help you understand your ongoing costs (in dollars) of investing in the Fund and to compare these costs with the ongoing costs of investing in other mutual funds. The Example is based on an investment of $1,000 invested at the beginning of the year and held for the entire year.
Actual Expenses
The information in the table under the heading "Actual Performance" provides information about actual account values and actual expenses. You may use the information in this column, together with the amount you invested, to estimate the expenses that you paid over the period. Simply divide your account value by $1,000 (for example, an $8,600 account value divided by $1,000 = 8.6), then multiply the result by the number in the first column in the row entitled "Expenses Paid During Period" to estimate the expenses you paid on your account during this period.
Hypothetical Example for Comparison Purposes
The information in the table under the heading "Hypothetical Performance (5% return before expenses)" provides information about hypothetical account values and hypothetical expenses based on the Fund's actual expense ratio and an assumed rate of return of 5% per year before expenses, which is not the Fund's actual return. The hypothetical account values and expenses may not be used to estimate the actual ending account balance or expenses you paid for the period. You may use this information to compare the ongoing costs of investing in the Fund and other funds. To do so, compare this 5% hypothetical example with the 5% hypothetical examples that appear in the shareholder reports of other funds.
Please note that the expenses shown in the table are meant to highlight your ongoing costs only and do not reflect any transactional costs. Therefore, the information under the heading "Hypothetical Performance (5% return before expenses)" is useful in comparing ongoing costs only, and will not help you determine the relative total costs of owning different funds. In addition, if these transactional costs were included, your costs would have been higher. Even though the Fund does not charge transaction fees, if you purchase shares through a broker, the broker may charge you a fee. You should evaluate other mutual funds' transaction fees and any applicable broker fees to assess the total cost of ownership for comparison purposes.
|
Actual Performance |
Hypothetical Performance (5% return before expenses) |
||||||||||
|
Beginning Account Value May 31, 2022 |
$ |
1,000.00 |
$ |
1,000.00 |
|||||||
|
Ending Account Value November 30, 2022 |
$ |
1,054.60 |
$ |
1,021.81 |
|||||||
|
Expenses Paid During Period(a) |
$ |
3.35 |
$ |
3.29 |
|||||||
(a) Expenses are equal to the Fund's annualized expense ratio of 0.65%, multiplied by the average account value over the period and prorated for the six-months ended November 30, 2022 (183/365 days).
19
FPA QUEENS ROAD VALUE FUND
APPROVAL OF INVESTMENT ADVISORY AGREEMENT
(Unaudited)
Approval of the Advisory Agreement. At a meeting of the Board of Trustees held on August 8, 2022, the Trustees approved the continuation of the advisory agreement between the Fund and the Adviser (the "Advisory Agreement") for an additional one-year period through September 30, 2023, on the recommendation of the Independent Trustees, who met in executive session on August 8, 2022 prior to the Board meeting to review and discuss the proposed continuation of the Advisory Agreement. The Board had also met on July 11, 2022, with the Independent Trustees meeting separately prior to the Meeting in executive session with the management of the Adviser and then separately with independent counsel to evaluate the renewal of the Advisory Agreement. Prior to their July 11 meeting, the Independent Trustees, through their independent counsel, had requested and received extensive materials prepared in connection with the review of the Advisory Agreements. The materials provided a broad range of information regarding the Fund, including a description of, among other matters, the terms of the Advisory Agreement; the services provided by the Adviser; the experience of the relevant investment personnel; the Fund's performance in absolute terms and as compared to the performance of peers and appropriate benchmark(s); the fees and expenses of the Fund in absolute terms and as compared to peers; and the profitability of the Adviser from serving as adviser to the Fund.
In addition to the executive sessions, the Boards, acting directly or through their committees, met regularly throughout the year and received information on a variety of topics that were relevant to their annual consideration of the renewal of the Advisory Agreement including, among other matters, Fund investment performance, compliance, risk management, liquidity, valuation, trade execution, service provider oversight and other matters relating to Fund operations. The Independent Trustees also had met with management of the Adviser (including key investment personnel) at their quarterly meetings as well as with management at other times between the quarterly meetings throughout the year. The materials specifically provided in connection with the annual review of the Advisory Agreements supplement the information received throughout the year.
At their regular Board meetings and executive sessions, the Independent Trustees were also advised by independent legal counsel. In addition to the materials provided by the Adviser, the Independent Trustees received a legal memorandum from independent counsel that outlined, among other matters: the duties of the Independent Trustees and relevant requirements under the 1940 Act; the general principles under state law relevant to considering the approval of advisory contracts; an adviser's fiduciary duty with respect to advisory agreements and compensation; the standards used by courts in determining whether investment advisers and investment company boards of trustees have fulfilled their duties; and factors to be considered by the Independent Trustees when voting on advisory agreements. During both executive sessions, independent legal counsel reviewed with Independent Trustees these duties, standards and factors summarized in the legal memorandum described above. The following paragraphs summarize the material information and factors considered by the Board and the Independent Trustees, as well as the Trustees' conclusions relative to such factors.
Nature, Extent and Quality of Services. The Board and the Independent Trustees considered information provided by the Adviser in response to their requests, as well as information provided throughout the year regarding: the Adviser and its staffing in connection with the Fund, including the investment professionals who monitor and oversee the Fund's sub-adviser and portfolio manager; the scope of services supervised and provided by the Adviser; and the absence of any significant service problems reported to the Board. The Board and the Independent Trustees noted the Fund is sub-advised by BFA, pursuant to an Investment Sub-Advisory Agreement among FPA, BFA, and Bragg, dated November 1, 2020. After discussion, the Board and the Independent Trustees concluded that the nature, extent and quality of services provided by the Adviser have benefited and should continue to benefit the Fund and its shareholders.
20
FPA QUEENS ROAD VALUE FUND
APPROVAL OF INVESTMENT ADVISORY AGREEMENT (Continued)
(Unaudited)
Investment Performance. The Board and the Independent Trustees reviewed the overall investment performance of the Fund. The Trustees also received information from an independent consultant, Broadridge, regarding the Fund's performance relative to a peer group of large cap value equity funds selected by Broadridge (the "Peer Group"). The Board and the Independent Trustees noted the Fund's long-term investment performance when compared to the Peer Group and concluded that the Fund's investment performance has been strong. The Board and the Independent Trustees noted the Fund outperformed its Peer Group median for the one-, five-, and ten-year periods ended March 31, 2022, while the Fund underperformed its Peer Group median for the three-year period ended March 31, 2022. The Board and the Independent Trustees further noted the Fund outperformed the comparative S&P 500 Value Index for five-year period ended March 31, 2022, while the Fund underperformed the comparative S&P 500 Value Index for the one-, three-, and ten-year period ended March 31, 2022. The Board and the Independent Trustees concluded that the Adviser's continued oversight of the management of the Fund's investments should benefit the Fund and its shareholders.
Advisory Fees and Fund Expenses; Comparison with Peer Group and Institutional Fees. The Board and the Independent Trustees considered information provided by the Adviser regarding the Fund's advisory fees and total expense levels. The Board and the Independent Trustees reviewed comparative information regarding fees and expenses for the Peer Group. The Board and the Independent Trustees noted that the Fund's advisory fee rate is above that of the Peer Group median and its overall net expense ratio was below the Peer Group median. The Board and the Independent Trustees concluded that the continued payment of advisory fees and expenses by the Fund to the Adviser was fair and reasonable and should continue to benefit the Fund and its shareholders.
Adviser Profitability and Costs. The Board and the Independent Trustees considered information provided by the Adviser regarding the Adviser's costs in providing services to the Fund, the profitability of the Adviser and the benefits to the Adviser from its relationship to the Fund. They reviewed and considered the Adviser's representations regarding its assumptions and methods of allocating certain costs, such as personnel costs, which constitute the Adviser's largest operating cost, and overhead costs with respect to the provision of investment advisory services. The Independent Trustees discussed with the Adviser the general process through which individuals' compensation is determined and then reviewed by the management committee of the Adviser, as well as the Adviser's methods for determining that its compensation levels are set at appropriate levels to attract and retain the personnel necessary to provide high quality professional investment advice. In evaluating the Adviser's profitability, they excluded certain distribution and marketing-related expenses. The Board and the Independent Trustees recognized that the Adviser is entitled under the law to earn a reasonable level of profits for the services that it provides to the Fund. The Board and the Independent Trustees concluded that the Adviser's level of profitability from its relationship with the Fund did not indicate that the Adviser's compensation was unreasonable or excessive.
Economies of Scale and Sharing of Economies of Scale. The Board and the Independent Trustees considered whether there have been economies of scale with respect to the management of the Fund, whether the Fund has appropriately benefited from any economies of scale, and whether the fee rate is reasonable in relation to the Fund's asset levels and any economies of scale that may exist. The Board and the Independent Trustees considered the Adviser's representation that its internal costs of providing investment management services to the Fund have significantly increased in recent years as a result of a number of factors, including the Adviser's substantial investment in additional professional resources and staffing. The Board and the Independent Trustees considered both quantitative and qualitative information regarding the Adviser's representation that it has also made significant investments in: (1) new compliance, operations, and administrative personnel; (2) information
21
FPA QUEENS ROAD VALUE FUND
APPROVAL OF INVESTMENT ADVISORY AGREEMENT (Continued)
(Unaudited)
technology and portfolio accounting trading systems; and (3) office space, each of which enhances the quality of services provided to the Fund.
The Board and the Independent Trustees recognized that the advisory fee schedule for the Fund does not have breakpoints. They considered that many mutual funds have breakpoints in the advisory fee structure as a means by which to share in the benefits of potential economies of scale as a fund's assets grow. They also considered that not all funds have breakpoints in their fee structures and that breakpoints are not the exclusive means of sharing potential economies of scale. The Board and the Independent Trustees considered the Adviser's statement that it believes that breakpoints currently remain inappropriate for the Fund given the ongoing additional investments the Adviser is making in its business for the benefit of the Fund, uncertainties regarding the direction of the economy, and uncertainties regarding future growth or contraction in the Fund's assets, all of which could negatively impact the profitability of the Adviser. The Board and the Independent Directors also noted that the Adviser has contractually agreed to reimburse the Fund for operating expenses in excess of 0.65% of the average net assets of the Fund, excluding management fees, administrative service fees, short sale dividend expenses and interest expenses on cash deposits relating to short sales, brokerage fees and commissions, redemption liquidity service expenses, interest, taxes, fees and expenses of other funds in which the Fund invests, and extraordinary expenses, including litigation expenses not incurred in the Fund's ordinary course of business, through October 31, 2023. The Board and the Independent Trustees concluded that the Fund is benefitting from the ongoing investments made by the Adviser in its team of personnel serving the Fund and in the Adviser's service infrastructure, and that in light of these investments, the addition of breakpoints to the Fund's advisory fee structure was not warranted at current asset levels.
Ancillary Benefits. The Board and the Independent Trustees considered other actual and potential benefits to the Adviser from managing the Fund in concluding that the contractual advisory and other fees are fair and reasonable for the Fund. They noted that the Adviser does not have any affiliates that benefit from the Adviser's relationship to the Fund.
Conclusions. The Board and the Independent Trustees determined that the Fund continues to benefit from the services of the Adviser's highly experienced portfolio management team. In addition, the Board and the Independent Trustees agreed that the Fund continues to receive high quality services from the Adviser. The Board and the Independent Trustees concluded that the current advisory fee rate is reasonable and fair to the Fund and its shareholders in light of the nature and quality of the services provided by the Adviser and the Adviser's profitability and costs. The Board and the Independent Trustees also noted their intention to continue monitoring the factors relevant to the Adviser's compensation, such as changes in the Fund's asset levels, changes in portfolio management personnel and the cost and quality of the services provided by the Adviser to the Fund. On the basis of the foregoing, and without assigning particular weight to any single factor, none of which was dispositive, the Board and the Independent Trustees concluded that it would be in the best interests of the Fund to continue to be advised and managed by the Adviser and determined to approve the continuation of the current Advisory Agreement for another one-year period through September 30, 2023.
22
FPA QUEENS ROAD VALUE FUND
APPROVAL OF INVESTMENT SUB-ADVISORY AGREEMENT
(Unaudited)
Approval of the Sub-Advisory Agreement. At a meeting of the Board of Trustees held on August 8, 2022, the Trustees approved the continuation of the sub-advisory agreement between the Fund, Bragg Financial Advisors ("BFA"), and the Adviser (the "Sub-Advisory Agreement") for an additional one-year period through September 30, 2023, on the recommendation of the Independent Trustees, who met in executive session on August 8, 2022 prior to the Board meeting to review and discuss the proposed continuation of the Sub-Advisory Agreement. The Board had also met on July 11, 2022, with the Independent Trustees meeting separately prior to the Meeting in executive session with the management of the Adviser and BFA, and then separately with independent counsel to evaluate the renewal of the Sub-Advisory Agreement. Prior to their July 11 meeting, the Independent Trustees, through their independent counsel, had requested and received extensive materials prepared in connection with the review of the Sub-Advisory Agreement. The materials provided a broad range of information regarding the Fund, including a description of, among other matters, the terms of the Sub-Advisory Agreement; the services provided by BFA; the experience of the relevant investment personnel; the Fund's performance in absolute terms and as compared to the performance of peers and appropriate benchmark(s); the fees and expenses of the Fund in absolute terms and as compared to peers; and the profitability of BFA from serving as sub-adviser to the Fund.
In addition to the executive sessions, the Boards, acting directly or through their committees, met regularly throughout the year and received information on a variety of topics that were relevant to their annual consideration of the renewal of the Sub-Advisory Agreement including, among other matters, Fund investment performance, compliance, risk management, liquidity, valuation, trade execution, service provider oversight, and other matters relating to the Fund's operations. The Independent Directors also had met with investment management personnel of BFA at their quarterly meetings. The materials specifically provided in connection with the annual review of the Sub-Advisory Agreement supplements the information received throughout the year.
At their regular Board meetings and executive sessions, the Independent Trustees were also advised by independent legal counsel. In addition to the materials provided by BFA, the Independent Trustees received a legal memorandum from independent counsel that outlined, among other matters: the duties of the Independent Trustees and relevant requirements under the 1940 Act; the general principles under state law relevant to considering the approval of sub-advisory contracts; a sub-adviser's fiduciary duty with respect to advisory agreements and compensation; the standards used by courts in determining whether investment sub-advisers and investment company boards of trustees have fulfilled their duties; and factors to be considered by the Independent Trustees when voting on sub-advisory agreements. During both executive sessions, independent legal counsel reviewed with Independent Trustees these duties, standards and factors summarized in the legal memorandum described above. The following paragraphs summarize the material information and factors considered by the Board and the Independent Trustees, as well as the Trustees' conclusions relative to such factors.
Nature, Extent and Quality of Services. The Board and the Independent Trustees considered information provided by BFA in response to their requests, as well as information provided throughout the year regarding: BFA and its staffing in connection with the Fund, including the Fund's sub-adviser portfolio manager and analyst; the scope of services provided by BFA; and the absence of any significant service problems reported to the Board. After discussion, the Board and the Independent Trustees concluded that the nature, extent and quality of services provided by BFA have benefited and should continue to benefit the Fund and its shareholders.
Investment Performance. The Board and the Independent Trustees reviewed the overall investment performance of the Fund. The Trustees also received information from an independent consultant, Broadridge, regarding the Fund's performance relative to a peer group of large cap value equity funds selected by Broadridge
23
FPA QUEENS ROAD VALUE FUND
APPROVAL OF INVESTMENT SUB-ADVISORY AGREEMENT (Continued)
(Unaudited)
(the "Peer Group"). The Board and the Independent Trustees noted the Fund's long-term investment performance when compared to the Peer Group and concluded that the Fund's investment performance has been strong. The Board and the Independent Trustees noted the Fund outperformed its Peer Group median for the one-, five-, and ten-year periods ended March 31, 2022, while the Fund underperformed its Peer Group median for the three-year period ended March 31, 2022. The Board and the Independent Trustees further noted the Fund outperformed the comparative S&P 500 Value Index for five-year period ended March 31, 2022, while the Fund underperformed the comparative S&P 500 Value Index for the one-, three-, and ten-year period ended March 31, 2022. The Board and the Independent Trustees concluded that BFA's continued management of the Fund's investments should benefit the Fund and its shareholders.
Sub-Advisory Fees and Fund Expenses; Comparison with Peer Group and Institutional Fees. The Board and the Independent Trustees considered information provided by BFA regarding the Fund's sub-advisory fees and total expense levels. The Board and the Independent Trustees reviewed comparative information regarding fees and expenses for the Peer Group. The Board and the Independent Trustees noted that the Fund's overall advisory fee rate is below that of the Peer Group median and that its overall net expense ratio was above the Peer Group median. The Board and the Independent Trustees concluded that the continued payment of sub-advisory fees by the Fund to BFA was fair and reasonable and should continue to benefit the Fund and its shareholders.
Sub-Adviser Profitability and Costs. The Board and the Independent Trustees considered information provided by BFA regarding its costs in providing services to the Fund, the profitability of BFA and the benefits to BFA from its relationship to the Fund. They reviewed and considered BFA's representations regarding its assumptions and methods of allocating certain costs, such as personnel costs and overhead costs with respect to the provision of investment advisory services. In evaluating BFA's profitability, they excluded certain distribution and marketing-related expenses. The Board and the Independent Trustees recognized that BFA is entitled under the law to earn a reasonable level of profits for the services that it provides to the Fund. The Board and the Independent Trustees concluded that BFA's level of profitability from its relationship with the Fund did not indicate that BFA's compensation was unreasonable or excessive.
Economies of Scale and Sharing of Economies of Scale. The Board and the Independent Trustees considered whether there have been economies of scale with respect to the management of the Fund, whether the Fund has appropriately benefited from any economies of scale, and whether the fee rate is reasonable in relation to the Fund's asset levels and any economies of scale that may exist. The Board and the Independent Trustees recognized that the advisory fee schedule for the Fund does not have breakpoints. They considered that many registered funds have breakpoints in the advisory fee structure as a means by which to share in the benefits of potential economies of scale as a fund's assets grow. They also considered that not all funds have breakpoints in their fee structures and that breakpoints are not the exclusive means of sharing potential economies of scale. The Board and the Independent Trustees considered the Adviser's and BFA's statements that it believes that additional breakpoints would not be appropriate for the Fund at this time given the ongoing investments the Adviser is making in its business for the benefit of the Fund, uncertainties regarding the direction of the economy, rising inflation, increasing costs for personnel and systems, and growth or contraction in the Fund's assets, all of which could negatively impact the profitability of the Adviser and/or BFA. The Board and the Independent Trustees noted that the Adviser had not proposed to increase the fee rate charged to the Fund. The Board and the Independent Trustees concluded that additional breakpoints in the Fund's sub-advisory fee structure were not warranted at current asset levels.
24
FPA QUEENS ROAD VALUE FUND
APPROVAL OF INVESTMENT SUB-ADVISORY AGREEMENT (Continued)
(Unaudited)
Ancillary Benefits. The Board and the Independent Trustees considered other actual and potential benefits to BFA from managing the Fund in concluding that the contractual sub-advisory fees are fair and reasonable for the Fund. They noted that BFA does not have any affiliates that benefit from BFA's relationship to the Fund.
Conclusions. The Board and the Independent Trustees determined that the Fund continues to benefit from the services of BFA's experienced portfolio management team. In addition, the Board and the Independent Trustees agreed that the Fund continues to receive high quality services from BFA. The Board and the Independent Trustees concluded that the current sub-advisory fee rate is reasonable and fair to the Fund and its shareholders in light of the nature and quality of the services provided by BFA and BFA's profitability and costs. The Board and the Independent Trustees also noted their intention to continue monitoring the factors relevant to BFA's compensation, such as changes in the Fund's asset levels, changes in portfolio management personnel and the cost and quality of the services provided by BFA to the Fund. On the basis of the foregoing, and without assigning particular weight to any single factor, none of which was dispositive, the Board and the Independent Trustees concluded that it would be in the best interests of the Fund to continue to be sub-advised by BFA and determined to approve the continuation of the current Sub-Advisory Agreement for another one-year period through September 30, 2023.
25
FPA QUEENS ROAD VALUE FUND
LIQUIDITY RISK MANAGEMENT PROGRAM
(Unaudited)
In compliance with SEC Rule 22e-4 under the U.S. Investment Company Act of 1940 (the "Liquidity Rule"),the Fund has adopted and implemented a written liquidity risk management program (the "Program"). The Fund'sBoard of Trustees have also designated the Adviser to serve as the administrator of the Program.
The Liquidity Rule requires that the Program be reasonably designed to assess and manage each Fund's liquidity risk. A Fund's "liquidity risk" is the risk that the Fund could not meet requests to redeem shares issued by the Fund without significant dilution of the remaining investors' interests in the Fund. The Program includes a number of elements that support the assessment, management and review of liquidity risk. In accordance with the Program, each Fund's liquidity risk is assessed no less frequently than annually taking into consideration a variety of factors, including, as applicable, the Fund's investment strategy and liquidity of portfolio investments, cash flow projections, and holdings of cash and cash equivalents, as well as borrowing arrangements and other funding sources. Certain factors are considered under both normal and reasonably foreseeable stressed conditions. There is no guarantee that the Program will achieve its objective under all circumstances.
Under the Program, each Fund portfolio investment is classified into one of four liquidity categories based on a determination of the number of days it is reasonably expected to take to convert the investment to cash, or sell or dispose of the investment, in current market conditions without significantly changing the investment's market value. The Program is reasonably designed to meet Liquidity Rule requirements relating to "highly liquid investment minimums" (i.e., the minimum amount of Fund net assets to be invested in highly liquid investments that are assets) and to monitor compliance with the Liquidity Rule's limitations on a Fund's investments in illiquid investments. Under the Liquidity Rule, a Fund is prohibited from acquiring any illiquid investment if, immediately after the acquisition, the Fund would have invested more than 15% of its net assets in illiquid investments that are assets.
During the period covered by this shareholder report, the Fund's Board of Trustees received reports prepared by the Adviser addressing the Program's operation and assessing the adequacy and effectiveness of its implementation for the period from October 1, 2021 to September 30, 2022. The reports concluded that the Program operated effectively, the Program had been and continued to be reasonably designed to assess and manage each Fund's liquidity risk, and the Program has been adequately and effectively implemented to monitor and respond to the Funds' liquidity developments, as applicable.
26
FPA QUEENS ROAD VALUE FUND
TRUSTEE AND OFFICER INFORMATION
(Unaudited)
Sandra Brown, Mark L. Lipson, Alfred E. Osborne, Jr., and Robert F. Goldrich are all Trustees of the Fund who are not "interested persons" of the Fund, as that term is defined in the 1940 Act (collectively, the "Independent Trustees"). Trustees serve until their resignation, removal or retirement. The Statement of Additional Information includes additional information about the Trustees and is available, without charge, upon request by calling (800) 982-4372.
|
Name, Address(1) and Year of Birth |
Position(s) Held with the Fund |
Year First Elected as Trustee of the Fund |
Principal Occupation(s) During the Past Five Years |
Number of FPA Funds Overseen by Trustee |
Other Directorships Held by Trustee During the Past Five Years |
||||||||||||||||||
|
Independent Trustees |
|||||||||||||||||||||||
|
Sandra Brown, 1955 |
Trustee |
2020 |
Consultant (since 2009). Formerly, CEO and President of Transamerica Financial Advisers, Inc. (1999-2009); President, Transamerica Securities Sales Corp. (1998-2009); Vice President, Bank of America Mutual Fund Administration (1990-1998). Director/Trustee of each FPA Fund (Bragg Capital Trust since 2020). |
7 |
None |
||||||||||||||||||
|
Robert F. Goldrich, 1962 |
Trustee |
2022 |
Senior Vice President for Strategic Initiatives of CMW Strategies LLC (since 2022). Formerly, President/CFO of the Leon Levy Foundation (2015-2022). Director/Trustee of each FPA Fund (since 2022). |
7 |
Uluru, Inc. (2015-2017) |
||||||||||||||||||
|
Mark L. Lipson, 1949 |
Trustee & Chairman |
2020 |
Managing Member, ML2 Advisors, LLC (since 2014). Formerly Managing Director, Bessemer Trust (2007-2014) and US Trust (2003-2006); Chairman and CEO of the Northstar Mutual Funds (1993-2001); and President and CEO of the National Mutual Funds (1988-1993). Director/Trustee of each FPA Fund (Bragg Capital Trust since 2020). |
7 |
None |
||||||||||||||||||
|
Alfred E. Osborne, Jr., 1944 |
Trustee |
2020 |
Formerly UCLA professor, retired effective July 2022. Dr. Osborne served at UCLA's John E. Anderson School of Management in several capacities for 50 years. He was formerly Senior Associate Dean, (July 2003-June 2022), Interim Dean (July 2018-June 2019), Professor (July 1972-June 2022) and Faculty Director, Price Center for Entrepreneurship and Innovation (July 1984-June 2022). Director/Trustee of each FPA Fund (Bragg Capital Trust since 2020). |
7 |
Kaiser Aluminum, Wedbush Capital, and Waverley Capital Acquisition Corporation |
||||||||||||||||||
27
FPA QUEENS ROAD VALUE FUND
TRUSTEE AND OFFICER INFORMATION (Continued)
(Unaudited)
|
Name, Address(1) and Year of Birth |
Position(s) Held with the Fund |
Year First Elected as Trustee of the Fund |
Principal Occupation(s) During the Past Five Years |
Number of FPA Funds Overseen by Trustee |
Other Directorships Held by Trustee During the Past Five Years |
||||||||||||||||||
|
"Interested" Trustee(2) |
|||||||||||||||||||||||
|
J. Richard Atwood, 1960 |
Trustee |
2020 |
Director and President of FPA GP, Inc., the General Partner of the Adviser (since October 2018). Director/Trustee of each FPA Fund (Bragg Capital Trust since 2020). President of each FPA Fund (since 2015). |
7 |
None |
||||||||||||||||||
(1) The address of each Trustee is 11601 Wilshire Boulevard, Suite 1200, Los Angeles, California 90025.
(2) "Interested person" within the meaning of the 1940 Act by virtue of their affiliation with the Fund's Adviser.
28
FPA QUEENS ROAD VALUE FUND
TRUSTEE AND OFFICER INFORMATION (Continued)
(Unaudited)
Officers of the Fund. Officers of the Fund are elected annually by the Board.
|
Name, Address(1) and Year of Birth |
Position with Fund |
Year First Elected as Officer of the Fund |
Principal Occupation(s) During the Past Five Years |
||||||||||||
|
J. Richard Atwood, 1960 |
President |
2020 |
Director and President of FPA GP, Inc., the General Partner of FPA (since 2018). Director/Trustee of each FPA Fund. (Bragg Capital Trust since 2020). President of each FPA Fund (since 2015). |
||||||||||||
|
Karen E. Richards, 1969 |
Chief Compliance Officer |
2020 |
Chief Compliance Officer of FPA (since 2018); and Chief Compliance Officer of each FPA Fund (since 2019, except Bragg Capital Trust since 2020). Formerly, Deputy Chief Compliance Officer of First Republic Investment Management, LLC (from 2016 to 2018), and Vice President, Senior Compliance Officer of Pacific Investment Management Company (from 2010 to 2016). |
||||||||||||
|
E. Lake Setzler III, 1967 |
Treasurer |
2020 |
Managing Director and CFO (since 2022) of FPA. Treasurer of each FPA Fund. Treasurer of each FPA Fund (Bragg Capital Trust since 2020). Formerly, Senior Vice President and Controller of the Adviser. |
||||||||||||
|
Rebecca D. Gilding, 1979 |
Secretary |
2021 |
Vice President and Counsel, State Street Bank and Trust Company (since 2016); and Secretary of each FPA Fund (since 2019, except Bragg Capital Trust since 2020). Formerly, Assistant Vice President and Associate Counsel, Brown Brothers Harriman & Co. (2013 to 2016). |
||||||||||||
(1) The address for each Officer (except Ms. Gilding) is 11601 Wilshire Boulevard, Suite 1200, Los Angeles, California 90025. Ms. Gilding's address is State Street Bank and Trust Company, One Lincoln Street, Boston, Massachusetts 02111.
29
FPA QUEENS ROAD VALUE FUND
(Unaudited)
INVESTMENT ADVISER
First Pacific Advisors, LP
11601 Wilshire Boulevard, Suite 1200
Los Angeles, CA 90025
INVESTMENT SUB-ADVISER
Bragg Financial Advisors, Inc.
1031 Caldwell Street, Suite 200
Charlotte, NC 28203
TRANSFER & SHAREHOLDER SERVICE AGENT
UMB Fund Services, Inc.
P.O. Box 2175
Milwaukee, WI 53201-2175
or
235 West Galena Street
Milwaukee, WI 53212-3948
(800) 638-3060
TICKER SYMBOL: QRVLX
CUSIP: 104826102
CUSTODIAN AND ADMINISTRATOR
State Street Bank and Trust Company
One Lincoln Street
Boston, Massachusetts 02111
DISTRIBUTOR
UMB Distribution Services, LLC
235 West Galena Street
Milwaukee, Wisconsin 53212-3948
LEGAL COUNSEL
Dechert LLP
One Bush Street, Suite 1600
San Francisco, California 94104
INDEPENDENT REGISTERED PUBLIC ACCOUNTING FIRM
Ernst & Young LLP
725 South Figueroa Street
Los Angeles, California 90017
This report has been prepared for the information of shareholders of FPA QUEENS ROAD VALUE FUND, and is not authorized for distribution to prospective investors unless preceded or accompanied by an effective prospectus. The financial information included in this report has been taken from the records of the Fund without examination by independent auditors.
A description of the policies and procedures that the Adviser uses to vote proxies related to the Fund's portfolio securities is set forth in the Fund's Statement of Additional Information which is available without charge, upon request, on the Fund's website at www.fpa.com or by calling (800) 982-4372 and on the Securities and Exchange Commission's website at www.sec.gov.
The Fund's complete proxy voting record for the 12 months ended June 30, 2022 is available without charge, upon request by calling (800) 982-4372 and on the SEC's website at www.sec.gov.
The Fund's schedule of portfolio holdings, filed the first and third quarter of the Fund's fiscal year on Form N-PORT with the SEC, is available on the SEC's website at www.sec.gov.
Additional information about the Fund is available online at www.fpa.com. This information includes, among other things, holdings, top sectors, and performance, and is updated on or about the 15th business day after the end of each quarter.
| (b) | Not Applicable. |
Item 2. Code of Ethics.
Not applicable to this semi-annual report.
Item 3. Audit Committee Financial Expert.
Not applicable to this semi-annual report.
Item 4. Principal Accountant Fees and Services.
Not applicable to this semi-annual report.
Item 5. Audit Committee of Listed Registrants.
Not applicable.
Item 6. Investments.
| (a) | Schedule of Investments is included as a part of the report to shareholders filed under Item 1 of this Form N-CSR. |
| (b) | Not applicable. |
Item 7. Disclosure of Proxy Voting Policies and Procedures for Closed-End Management Investment Companies.
Not applicable.
Item 8. Portfolio Managers of Closed-End Management Investment Companies.
Not applicable.
Item 9. Purchases of Equity Securities by Closed-End Management Investment Company and Affiliated Purchasers.
Not applicable.
Item 10. Submission of Matters to a Vote of Security Holders.
There have been no material changes to the procedures by which the shareholders may recommend nominees to the registrant’s board of directors.
Item 11. Controls and Procedures.
| (a) | The principal executive officer and principal financial officer of the registrant have concluded that the registrant’s disclosure controls and procedures (as defined in Rule 30a-3(c) under the Investment Company Act of 1940) are effective based on their evaluation of the disclosure controls and procedures as of a date within 90 days of the filing date of this report. |
| (b) | There have been no significant changes in the registrant’s internal controls over financial reporting (as defined in Rule 30a-3(d) under the Investment Company Act of 1940) that occurred during the period covered by this report that have materially affected, or is reasonably likely to materially affect, the registrant’s internal controls over financial reporting. |
Item 12. Disclosure of Securities Lending Activities for Closed-End Management Investment Companies
Not applicable.
Item 13. Exhibits.
| (a)(1) | Not applicable. |
| (a)(2) | The certifications required by Rule 30a-2(a) under the Investment Company Act of 1940 are attached hereto. |
| (a)(3) | Not applicable. |
| (a)(4) | Not applicable. |
| (b) | The certifications required by Rule 30a-2(b) under the Investment Company Act of 1940 and Section 906 of the Sarbanes-Oxley Act of 2002 are attached hereto. |
SIGNATURES
Pursuant to the requirements of the Securities Exchange Act of 1934 and the Investment Company Act of 1940, the registrant has duly caused this report to be signed on its behalf by the undersigned, thereunto duly authorized.
BRAGG CAPITAL TRUST
| By: | /s/ J. Richard Atwood | |
| J. Richard Atwood | ||
| President (principal executive officer) | ||
| Date: | February 3, 2023 |
Pursuant to the requirements of the Securities Exchange Act of 1934 and the Investment Company Act of 1940, this report has been signed below by the following persons on behalf of the registrant and in the capacities and on the dates indicated.
| By: | /s/ J. Richard Atwood | |
| J. Richard Atwood | ||
| President (principal executive officer) | ||
| Date: | February 3, 2023 | |
| By: | /s/ E. Lake Setzler III | |
| E. Lake Setzler III | ||
| Treasurer (principal financial officer) | ||
| Date: | February 3, 2023 |
ATTACHMENTS / EXHIBITS
Serious News for Serious Traders! Try StreetInsider.com Premium Free!
You May Also Be Interested In
- Ring Energy Announces Timing of First Quarter 2024 Earnings Release and Conference Call
- Waterdrop Files Annual Report on Form 20-F for Fiscal Year 2023
- New open software code for the home gateway redefines broadband experience
Create E-mail Alert Related Categories
SEC FilingsSign up for StreetInsider Free!
Receive full access to all new and archived articles, unlimited portfolio tracking, e-mail alerts, custom newswires and RSS feeds - and more!
