

Form N-CSRS Advisors' Inner Circle For: Sep 30
 Tweet
Tweet Share
Share
UNITED STATES
SECURITIES AND EXCHANGE COMMISSION
Washington, D.C. 20549
FORM N-CSRS
CERTIFIED SHAREHOLDER REPORT OF REGISTERED
MANAGEMENT INVESTMENT COMPANIES
Investment Company Act file number 811-22920
The Advisors’ Inner Circle Fund III
(Exact name of registrant as specified in charter)
One Freedom Valley Drive
Oaks, PA 19456
(Address of principal executive offices) (Zip code)
SEI Investments
One Freedom Valley Drive
Oaks, PA 19456
(Name and address of agent for service)
Registrant’s telephone number, including area code: 1-877-446-3863
Date of fiscal year end: March 31, 2022
Date of reporting period: September 30, 2021
| Item 1. | Reports to Stockholders. |
A copy of the report transmitted to stockholders pursuant to Rule 30e-1 under the Investment Company Act or 1940, as amended (the “Act”) (17 CFR § 270.30e-1), is attached hereto.
The Advisors’ Inner Circle Fund III

GQG Partners Emerging Markets Equity Fund
GQG Partners Global Quality Equity Fund
GQG Partners US Select Quality Equity Fund
GQG Partners Global Quality Dividend Income Fund
GQG Partners International Quality Dividend Income Fund
GQG Partners US Quality Dividend Income Fund
| SEMI-ANNUAL REPORT | SEPTEMBER 30, 2021 | |
|
Investment Adviser: GQG Partners LLC
| ||
| THE ADVISORS’ INNER CIRCLE FUND III | GQG PARTNERS FUNDS | |
| SEPTEMBER 30, 2021
|
| TABLE OF CONTENTS | ||||
| 1 | ||||
| 6 | ||||
| 11 | ||||
| 14 | ||||
| 18 | ||||
| 23 | ||||
| 26 | ||||
| 30 | ||||
| 36 | ||||
| 42 | ||||
| 57 | ||||
| 80 | ||||
| 84 | ||||
The Funds file their complete schedules of investments with the US Securities and Exchange Commission (“SEC”) for the first and third quarters of each fiscal year as an exhibit to its reports on Form N-PORT (Form N-Q for filings prior to March 31, 2020). The Funds’ Form N-Q and Form N-PORT are available on the SEC’s website at http://www.sec.gov, and may be reviewed and copied at the SEC’s Public Reference Room in Washington, DC. Information on the operation of the Public Reference Room may be obtained by calling 1-800-SEC-0330.
A description of the policies and procedures that the Funds use to determine how to vote proxies relating to Fund securities, as well as information relating to how the Funds voted proxies relating to fund securities during the most recent 12-month period ended June 30, is available (i) without charge, upon request, by calling 1-866-362-8333; and (ii) on the SEC’s website at http://www.sec.gov.
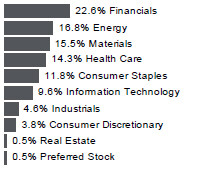
| THE ADVISORS’ INNER CIRCLE FUND III | GQG PARTNERS SEPTEMBER 30, 2021 (Unaudited) |
| SECTOR WEIGHTING †
|
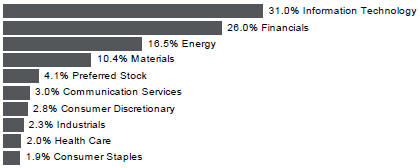
† Percentages are based on total investments.
The accompanying notes are an integral part of the financial statements.
1
| THE ADVISORS’ INNER CIRCLE FUND III | GQG PARTNERS EMERGING MARKETS EQUITY FUND SEPTEMBER 30, 2021 (Unaudited) |
| COMMON STOCK — continued | ||||||||
| Shares | Value | |||||||
| CHINA (continued) |
||||||||
| WuXi AppTec, Cl A |
4,731,894 | $ | 111,706,515 | |||||
|
|
|
| ||||||
| 1,249,371,642 | ||||||||
|
|
|
| ||||||
| HONG KONG — 3.3% |
||||||||
| AIA Group |
4,877,710 | 56,363,228 | ||||||
| Hong Kong Exchanges & Clearing |
3,739,650 | 230,043,553 | ||||||
|
|
|
| ||||||
| 286,406,781 | ||||||||
|
|
|
| ||||||
| INDIA — 22.9% |
||||||||
| Bajaj Finance |
1,750,796 | 180,081,683 | ||||||
| Hindalco Industries |
7,046,270 | 46,234,021 | ||||||
| Housing Development Finance |
11,610,148 | 428,464,804 | ||||||
| ICICI Bank |
10,247,865 | 96,064,482 | ||||||
| Infosys |
5,244,556 | 117,857,898 | ||||||
| Infosys ADR |
19,647,039 | 437,146,618 | ||||||
| JSW Steel |
4,920,554 | 44,197,571 | ||||||
| Reliance Industries |
9,659,448 | 327,062,249 | ||||||
| State Bank of India |
21,889,344 | 132,617,744 | ||||||
| Tata Consultancy Services |
2,027,280 | 102,866,155 | ||||||
| Tata Steel |
4,858,848 | 84,237,641 | ||||||
|
|
|
| ||||||
| 1,996,830,866 | ||||||||
|
|
|
| ||||||
| INDONESIA — 0.9% |
||||||||
| Bank Central Asia |
32,003,507 | 78,090,849 | ||||||
|
|
|
| ||||||
| KAZAKHSTAN — 0.3% |
||||||||
| Kaspi.KZ JSC GDR |
285,550 | 30,586,542 | ||||||
|
|
|
| ||||||
| MEXICO — 0.0% |
||||||||
| Ternium ADR |
71,842 | 3,038,917 | ||||||
|
|
|
| ||||||
| NETHERLANDS — 4.1% |
||||||||
| ASML Holding |
474,294 | 354,328,412 | ||||||
|
|
|
| ||||||
| RUSSIA — 16.4% |
||||||||
| Gazprom PJSC |
48,470,131 | 240,370,196 | ||||||
| LUKOIL PJSC |
2,287,862 | 217,762,786 | ||||||
| MMC Norilsk Nickel PJSC |
122,544 | 36,603,707 | ||||||
| MMC Norilsk Nickel PJSC ADR |
3,689,124 | 110,378,590 | ||||||
| Polyus PJSC GDR |
1,279,686 | 105,138,746 | ||||||
| Rosneft Oil PJSC |
23,488,355 | 198,570,110 | ||||||
| Sberbank of Russia PJSC |
71,510,510 | 335,631,722 | ||||||
| Severstal PAO |
2,048,622 | 42,804,888 | ||||||
The accompanying notes are an integral part of the financial statements.
2
| THE ADVISORS’ INNER CIRCLE FUND III | GQG PARTNERS EMERGING MARKETS EQUITY FUND SEPTEMBER 30, 2021 (Unaudited) |
| COMMON STOCK — continued | ||||||||
| Shares | Value | |||||||
| RUSSIA (continued) |
||||||||
| TCS Group Holding GDR |
1,580,432 | $ | 144,311,426 | |||||
|
|
|
| ||||||
| 1,431,572,171 | ||||||||
|
|
|
| ||||||
| SOUTH AFRICA — 0.4% |
||||||||
| Capitec Bank Holdings |
264,726 | 32,029,081 | ||||||
|
|
|
| ||||||
| SOUTH KOREA — 5.0% |
||||||||
| Samsung Electronics |
5,681,348 | 351,250,746 | ||||||
| SK Telecom |
319,128 | 86,854,837 | ||||||
|
|
|
| ||||||
| 438,105,583 | ||||||||
|
|
|
| ||||||
| SPAIN — 2.1% |
||||||||
| Banco Bilbao Vizcaya Argentaria |
27,809,251 | 183,008,262 | ||||||
|
|
|
| ||||||
| TAIWAN — 6.7% |
||||||||
| Taiwan Semiconductor Manufacturing |
21,225,133 | 438,071,493 | ||||||
| Taiwan Semiconductor Manufacturing ADR |
1,332,943 | 148,823,086 | ||||||
|
|
|
| ||||||
| 586,894,579 | ||||||||
|
|
|
| ||||||
| TURKEY — 1.2% |
||||||||
| Eregli Demir ve Celik Fabrikalari |
30,359,504 | 56,756,930 | ||||||
| KOC Holding |
18,385,247 | 46,737,215 | ||||||
|
|
|
| ||||||
| 103,494,145 | ||||||||
|
|
|
| ||||||
| UNITED STATES — 9.0% |
||||||||
| Communication Services — 1.9% |
||||||||
| Facebook, Cl A * |
497,085 | 168,705,678 | ||||||
|
|
|
| ||||||
| Information Technology — 7.1% |
||||||||
| Lam Research |
356,189 | 202,724,969 | ||||||
| Monolithic Power Systems |
191,321 | 92,729,463 | ||||||
| NVIDIA |
1,589,201 | 329,218,879 | ||||||
|
|
|
| ||||||
| 624,673,311 | ||||||||
|
|
|
| ||||||
| TOTAL UNITED STATES |
793,378,989 | |||||||
|
|
|
| ||||||
| Total Common Stock |
8,088,782,511 | |||||||
|
|
|
| ||||||
| PREFERRED STOCK — 3.9% | ||||||||
| BRAZIL — 3.9% |
||||||||
| Banco Bradesco*(A) |
31,192,238 | 119,069,638 | ||||||
| Itau Unibanco Holding(A) |
14,957,300 | 79,495,570 | ||||||
The accompanying notes are an integral part of the financial statements.
3
| THE ADVISORS’ INNER CIRCLE FUND III | GQG PARTNERS EMERGING MARKETS EQUITY FUND SEPTEMBER 30, 2021 (Unaudited) |
| PREFERRED STOCK — continued | ||||||||
| Shares | Value | |||||||
| BRAZIL (continued) |
||||||||
| Petroleo Brasileiro(A) |
22,413,316 | $ | 111,883,535 | |||||
| Raizen*(A) |
24,823,931 | 32,391,519 | ||||||
|
|
|
| ||||||
| 342,840,262 | ||||||||
|
|
|
| ||||||
| Total Preferred Stock |
342,840,262 | |||||||
|
|
|
| ||||||
| Total Investments — 96.5% |
$ | 8,431,622,773 | ||||||
|
|
|
| ||||||
Percentages are based on Net Assets of $8,737,143,124.
| * | Non-income producing security. |
| (A) | There is currently no rate available. |
ADR — American Depositary Receipt
Cl — Class
GDR — Global Depositary Receipt
PJSC — Public Joint Stock Company
The accompanying notes are an integral part of the financial statements.
4
| THE ADVISORS’ INNER CIRCLE FUND III | GQG PARTNERS EMERGING MARKETS EQUITY FUND SEPTEMBER 30, 2021 (Unaudited) |
The following is a summary of the level of inputs used as of September 30, 2021, in valuing the Fund’s investments carried at value:
| Investments in Securities | Level 1 | Level 2 | Level 3 | Total | ||||||||||||
| Common Stock |
||||||||||||||||
| Brazil |
$ | 521,645,692 | $ | — | $ | — | $ | 521,645,692 | ||||||||
| China |
55,790,021 | 1,193,581,621 | — | 1,249,371,642 | ||||||||||||
| Hong Kong |
— | 286,406,781 | — | 286,406,781 | ||||||||||||
| India |
437,146,618 | 1,559,684,248 | — | 1,996,830,866 | ||||||||||||
| Indonesia |
— | 78,090,849 | — | 78,090,849 | ||||||||||||
| Kazakhstan |
— | 30,586,542 | — | 30,586,542 | ||||||||||||
| Mexico |
3,038,917 | — | — | 3,038,917 | ||||||||||||
| Netherlands |
— | 354,328,412 | — | 354,328,412 | ||||||||||||
| Russia |
215,517,336 | 1,216,054,835 | — | 1,431,572,171 | ||||||||||||
| South Africa |
— | 32,029,081 | — | 32,029,081 | ||||||||||||
| South Korea |
— | 438,105,583 | — | 438,105,583 | ||||||||||||
| Spain |
— | 183,008,262 | — | 183,008,262 | ||||||||||||
| Taiwan |
148,823,086 | 438,071,493 | — | 586,894,579 | ||||||||||||
| Turkey |
— | 103,494,145 | — | 103,494,145 | ||||||||||||
| United States |
793,378,989 | — | — | 793,378,989 | ||||||||||||
|
|
|
|
|
|
|
|
|
|||||||||
| Total Common Stock |
2,175,340,659 | 5,913,441,852 | — | 8,088,782,511 | ||||||||||||
|
|
|
|
|
|
|
|
|
|||||||||
| Preferred Stock |
310,448,743 | 32,391,519 | — | 342,840,262 | ||||||||||||
|
|
|
|
|
|
|
|
|
|||||||||
| Total Investments in Securities |
$ | 2,485,789,402 | $ | 5,945,833,371 | $ | — | $ | 8,431,622,773 | ||||||||
|
|
|
|
|
|
|
|
|
|||||||||
For the period ended September 30, 2021, there were no transfers in or out of Level 3.
For more information on valuation inputs, see Note 2 — Significant Accounting Policies in the Notes to Financial Statements.
Amounts designated as “—” are $0 or have been rounded to $0.
The accompanying notes are an integral part of the financial statements.
5
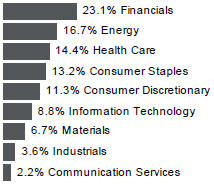
| THE ADVISORS’ INNER CIRCLE FUND III |
GLOBAL QUALITY EQUITY FUND SEPTEMBER 30, 2021 (Unaudited) |
| SECTOR WEIGHTING † |
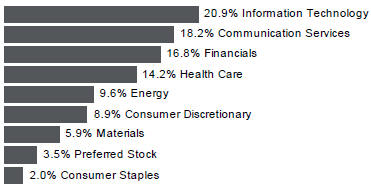
† Percentages are based on total investments.
The accompanying notes are an integral part of the financial statements.
6
| THE ADVISORS’ INNER CIRCLE FUND III | GQG PARTNERS GLOBAL QUALITY EQUITY FUND SEPTEMBER 30, 2021 (Unaudited) |
| COMMON STOCK — continued | ||||||||
| Shares | Value | |||||||
| GERMANY — 1.5% |
||||||||
| Daimler |
119,396 | $ | 10,560,711 | |||||
|
|
|
| ||||||
| LUXEMBOURG — 1.9% |
||||||||
| ArcelorMittal |
253,421 | 7,688,138 | ||||||
| ArcelorMittal ADR |
185,141 | 5,583,853 | ||||||
|
|
|
| ||||||
| 13,271,991 | ||||||||
|
|
|
| ||||||
| NETHERLANDS — 2.1% |
||||||||
| ASML Holding |
16,344 | 12,210,029 | ||||||
| ASML Holding ADR |
2,814 | 2,096,740 | ||||||
|
|
|
| ||||||
| 14,306,769 | ||||||||
|
|
|
| ||||||
| RUSSIA — 3.8% |
||||||||
| LUKOIL PJSC |
82,877 | 7,888,381 | ||||||
| Rosneft Oil PJSC |
856,303 | 7,239,169 | ||||||
| Sberbank of Russia PJSC |
2,379,292 | 11,167,112 | ||||||
|
|
|
| ||||||
| 26,294,662 | ||||||||
|
|
|
| ||||||
| SPAIN — 3.0% |
||||||||
| Banco Bilbao Vizcaya Argentaria |
1,817,804 | 11,962,680 | ||||||
| Banco Santander |
2,440,097 | 8,814,536 | ||||||
|
|
|
| ||||||
| 20,777,216 | ||||||||
|
|
|
| ||||||
| TAIWAN — 1.9% |
||||||||
| Taiwan Semiconductor Manufacturing ADR |
118,474 | 13,227,622 | ||||||
|
|
|
| ||||||
| UNITED KINGDOM — 5.2% |
||||||||
| AstraZeneca |
50,709 | 6,114,883 | ||||||
| AstraZeneca ADR |
490,128 | 29,437,088 | ||||||
|
|
|
| ||||||
| 35,551,971 | ||||||||
|
|
|
| ||||||
| UNITED STATES — 62.1% |
||||||||
| Communication Services — 17.6% |
||||||||
| Alphabet, Cl C * |
18,192 | 48,487,319 | ||||||
| Charter Communications, Cl A * |
41,169 | 29,952,918 | ||||||
| Facebook, Cl A * |
88,829 | 30,147,674 | ||||||
| Snap, Cl A * |
63,412 | 4,684,244 | ||||||
The accompanying notes are an integral part of the financial statements.
7
| THE ADVISORS’ INNER CIRCLE FUND III | GQG PARTNERS GLOBAL QUALITY EQUITY FUND SEPTEMBER 30, 2021 (Unaudited) |
| COMMON STOCK — continued | ||||||||
| Shares | Value | |||||||
| Communication Services (continued) |
||||||||
| ZoomInfo Technologies, Cl A * |
121,409 | $ | 7,429,017 | |||||
|
|
|
| ||||||
| 120,701,172 | ||||||||
|
|
|
| ||||||
| Consumer Discretionary — 7.0% |
||||||||
| Amazon.com * |
4,911 | 16,132,832 | ||||||
| Lennar, Cl A |
51,321 | 4,807,751 | ||||||
| Target |
118,383 | 27,082,479 | ||||||
|
|
|
| ||||||
| 48,023,062 | ||||||||
|
|
|
| ||||||
| Consumer Staples — 1.9% |
||||||||
| Philip Morris International |
136,209 | 12,911,251 | ||||||
|
|
|
| ||||||
| Energy — 6.0% |
||||||||
| Devon Energy |
306,963 | 10,900,256 | ||||||
| Exxon Mobil |
283,621 | 16,682,587 | ||||||
| Occidental Petroleum |
456,391 | 13,500,046 | ||||||
|
|
|
| ||||||
| 41,082,889 | ||||||||
|
|
|
| ||||||
| Financials — 7.7% |
||||||||
| Bank of America |
323,444 | 13,730,198 | ||||||
| Blackstone, Cl A |
147,517 | 17,162,128 | ||||||
| JPMorgan Chase |
21,230 | 3,475,138 | ||||||
| Morgan Stanley |
191,403 | 18,625,426 | ||||||
|
|
|
| ||||||
| 52,992,890 | ||||||||
|
|
|
| ||||||
| Health Care — 5.7% |
||||||||
| Eli Lilly |
38,792 | 8,962,892 | ||||||
| UnitedHealth Group |
76,668 | 29,957,254 | ||||||
|
|
|
| ||||||
| 38,920,146 | ||||||||
|
|
|
| ||||||
| Information Technology — 16.2% |
||||||||
| Adobe * |
23,303 | 13,416,003 | ||||||
| Microsoft |
114,777 | 32,357,932 | ||||||
| NVIDIA |
147,388 | 30,532,898 | ||||||
| salesforce.com * |
55,117 | 14,948,833 | ||||||
The accompanying notes are an integral part of the financial statements.
8
| THE ADVISORS’ INNER CIRCLE FUND III | GQG PARTNERS GLOBAL QUALITY EQUITY FUND SEPTEMBER 30, 2021 (Unaudited) |
| COMMON STOCK — continued | ||||||||
| Shares | Value | |||||||
| Information Technology (continued) |
||||||||
| Visa, Cl A |
89,496 | $ | 19,935,234 | |||||
|
|
|
| ||||||
| 111,190,900 | ||||||||
|
|
|
| ||||||
| TOTAL UNITED STATES |
425,822,310 | |||||||
|
|
|
| ||||||
| Total Common Stock |
638,324,872 | |||||||
|
|
|
| ||||||
| PREFERRED STOCK — 3.4% |
||||||||
| BRAZIL — 2.0% |
||||||||
| Itau Unibanco Holding(A) |
850,550 | 4,520,532 | ||||||
| Petroleo Brasileiro(A) |
1,810,176 | 9,036,097 | ||||||
|
|
|
| ||||||
| 13,556,629 | ||||||||
|
|
|
| ||||||
| GERMANY — 1.4% |
||||||||
| Volkswagen, 2.80% |
42,400 | 9,442,557 | ||||||
|
|
|
| ||||||
| Total Preferred Stock |
22,999,186 | |||||||
|
|
|
| ||||||
| Total Investments— 96.3% |
$ | 661,324,058 | ||||||
|
|
|
| ||||||
Percentages are based on Net Assets of $686,877,508.
| * | Non-income producing security. |
| (A) | There is currently no rate available. |
ADR — American Depositary Receipt
Cl — Class
PJSC — Public Joint Stock Company
The accompanying notes are an integral part of the financial statements.
9
| THE ADVISORS’ INNER CIRCLE FUND III | GQG PARTNERS GLOBAL QUALITY EQUITY FUND SEPTEMBER 30, 2021 (Unaudited) |
The following is a summary of the level of inputs used as of September 30, 2021, in valuing the Fund’s investments carried at value:
| Investments in Securities | Level 1 | Level 2 | Level 3 | Total | ||||||||||||
| Common Stock |
||||||||||||||||
| Australia |
$ | — | $ | 15,321,326 | $ | — | $ | 15,321,326 | ||||||||
| Brazil |
18,002,356 | — | — | 18,002,356 | ||||||||||||
| Canada |
6,440,130 | — | — | 6,440,130 | ||||||||||||
| China |
— | 6,410,514 | — | 6,410,514 | ||||||||||||
| Denmark |
2,220,615 | 16,951,396 | — | 19,172,011 | ||||||||||||
| France |
— | 13,165,283 | — | 13,165,283 | ||||||||||||
| Germany |
— | 10,560,711 | — | 10,560,711 | ||||||||||||
| Luxembourg |
5,583,853 | 7,688,138 | — | 13,271,991 | ||||||||||||
| Netherlands |
2,096,740 | 12,210,029 | — | 14,306,769 | ||||||||||||
| Russia |
— | 26,294,662 | — | 26,294,662 | ||||||||||||
| Spain |
— | 20,777,216 | — | 20,777,216 | ||||||||||||
| Taiwan |
13,227,622 | — | — | 13,227,622 | ||||||||||||
| United Kingdom |
29,437,088 | 6,114,883 | — | 35,551,971 | ||||||||||||
| United States |
425,822,310 | — | — | 425,822,310 | ||||||||||||
|
|
|
|
|
|
|
|
|
|||||||||
| Total Common Stock |
502,830,714 | 135,494,158 | — | 638,324,872 | ||||||||||||
|
|
|
|
|
|
|
|
|
|||||||||
| Preferred Stock |
||||||||||||||||
| Brazil |
13,556,629 | — | — | 13,556,629 | ||||||||||||
| Germany |
— | 9,442,557 | — | 9,442,557 | ||||||||||||
|
|
|
|
|
|
|
|
|
|||||||||
| Total Preferred Stock |
13,556,629 | 9,442,557 | — | 22,999,186 | ||||||||||||
|
|
|
|
|
|
|
|
|
|||||||||
| Total Investments in Securities |
$ | 516,387,343 | $ | 144,936,715 | $ | — | $ | 661,324,058 | ||||||||
|
|
|
|
|
|
|
|
|
|||||||||
For the period ended September 30, 2021, there have been no transfers in or out of Level 3.
For more information on valuation inputs, see Note 2 — Significant Accounting Policies in the Notes to Financial Statements.
Amounts designated as “—” are $0 or have been rounded to $0.
The accompanying notes are an integral part of the financial statements.
10
| THE ADVISORS’ INNER CIRCLE FUND III |
US SELECT QUALITY EQUITY FUND SEPTEMBER 30, 2021 (Unaudited) |
| SECTOR WEIGHTING † |
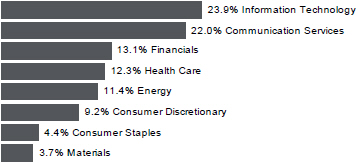
† Percentages are based on total investments.
The accompanying notes are an integral part of the financial statements.
11
| THE ADVISORS’ INNER CIRCLE FUND III | GQG PARTNERS US SELECT QUALITY EQUITY FUND SEPTEMBER 30, 2021 (Unaudited) |
| COMMON STOCK — continued |
||||||||
| Shares | Value | |||||||
| Energy — 11.1% |
||||||||
| Devon Energy |
664,942 | $ | 23,612,090 | |||||
| Exxon Mobil |
529,015 | 31,116,662 | ||||||
| Occidental Petroleum |
788,510 | 23,324,126 | ||||||
|
|
|
| ||||||
| 78,052,878 | ||||||||
|
|
|
| ||||||
| Financials — 12.6% |
||||||||
| Bank of America |
513,546 | 21,800,028 | ||||||
| Blackstone, Cl A |
263,498 | 30,655,357 | ||||||
| JPMorgan Chase |
54,623 | 8,941,239 | ||||||
| Morgan Stanley |
284,687 | 27,702,892 | ||||||
|
|
|
| ||||||
| 89,099,516 | ||||||||
|
|
|
| ||||||
| Health Care — 9.4% |
||||||||
| Eli Lilly |
59,098 | 13,654,593 | ||||||
| Johnson & Johnson |
47,734 | 7,709,041 | ||||||
| Syneos Health, Cl A * |
149,203 | 13,052,278 | ||||||
| UnitedHealth Group |
82,390 | 32,193,069 | ||||||
|
|
|
| ||||||
| 66,608,981 | ||||||||
|
|
|
| ||||||
| Information Technology — 23.1% |
||||||||
| Adobe * |
32,793 | 18,879,586 | ||||||
| Microsoft |
174,690 | 49,248,605 | ||||||
| NVIDIA |
180,369 | 37,365,242 | ||||||
| salesforce.com * |
83,449 | 22,633,038 | ||||||
| Visa, Cl A |
156,471 | 34,853,915 | ||||||
|
|
|
| ||||||
| 162,980,386 | ||||||||
|
|
|
| ||||||
| TOTAL UNITED STATES |
639,393,695 | |||||||
|
|
|
| ||||||
| Total Common Stock |
682,486,737 | |||||||
|
|
|
| ||||||
| Total Investments — 96.7% |
$ | 682,486,737 | ||||||
|
|
|
| ||||||
Percentages are based on Net Assets of $705,911,623.
| * | Non-income producing security. |
ADR — American Depositary Receipt
Cl — Class
The accompanying notes are an integral part of the financial statements.
12
| THE ADVISORS’ INNER CIRCLE FUND III | GQG PARTNERS US SELECT QUALITY EQUITY FUND SEPTEMBER 30, 2021 (Unaudited) |
As of September 30, 2021, all of the Fund’s investments were considered Level 1, in accordance with the authoritative guidance on fair value measurements and disclosure under U.S. GAAP.
For the period ended September 30, 2021, there have been no transfers in or out of Level 3.
For more information on valuation inputs, see Note 2 — Significant Accounting Policies in the Notes to Financial Statements.
The accompanying notes are an integral part of the financial statements.
13
| THE ADVISORS’ INNER CIRCLE FUND III | QUALITY DIVIDEND INCOME FUND SEPTEMBER 30, 2021 (Unaudited) |
| SECTOR WEIGHTING † |
† Percentages are based on total investments.
The accompanying notes are an integral part of the financial statements.
14
| THE ADVISORS’ INNER CIRCLE FUND III | GQG PARTNERS GLOBAL QUALITY DIVIDEND INCOME FUND SEPTEMBER 30, 2021 (Unaudited) |
| COMMON STOCK — continued |
||||||||
| Shares | Value | |||||||
| GERMANY (continued) |
||||||||
| Siemens |
1,404 | $ | 229,637 | |||||
|
|
|
| ||||||
| 720,987 | ||||||||
|
|
|
| ||||||
| INDIA — 2.8% |
||||||||
| Infosys ADR |
19,411 | 431,895 | ||||||
|
|
|
| ||||||
| JAPAN — 1.5% |
||||||||
| Tokio Marine Holdings |
4,282 | 228,835 | ||||||
|
|
|
| ||||||
| LUXEMBOURG — 2.2% |
||||||||
| ArcelorMittal ADR |
11,330 | 341,713 | ||||||
|
|
|
| ||||||
| RUSSIA — 11.6% |
||||||||
| Gazprom PJSC |
64,600 | 320,883 | ||||||
| LUKOIL PJSC ADR |
2,757 | 260,978 | ||||||
| MMC Norilsk Nickel PJSC |
885 | 265,068 | ||||||
| Polyus PJSC GDR |
1,138 | 93,498 | ||||||
| Rosneft Oil PJSC |
41,227 | 348,916 | ||||||
| Sberbank of Russia PJSC |
81,132 | 379,883 | ||||||
| Severstal PAO GDR |
6,460 | 134,889 | ||||||
|
|
|
| ||||||
| 1,804,115 | ||||||||
|
|
|
| ||||||
| SINGAPORE — 0.8% |
||||||||
| Ascendas Real Estate Investment Trust ‡ |
53,775 | 118,529 | ||||||
|
|
|
| ||||||
| SPAIN — 2.4% |
||||||||
| Banco Bilbao Vizcaya Argentaria |
56,958 | 374,832 | ||||||
|
|
|
| ||||||
| SWEDEN — 0.6% |
||||||||
| Swedbank |
4,236 | 85,485 | ||||||
|
|
|
| ||||||
| SWITZERLAND — 1.6% |
||||||||
| Roche Holding |
676 | 246,908 | ||||||
|
|
|
| ||||||
| TAIWAN — 2.7% |
||||||||
| Taiwan Semiconductor Manufacturing ADR |
3,678 | 410,649 | ||||||
|
|
|
| ||||||
| UNITED KINGDOM — 4.7% |
||||||||
| AstraZeneca ADR |
12,230 | 734,534 | ||||||
|
|
|
| ||||||
| UNITED STATES — 39.5% |
||||||||
| Consumer Staples — 3.6% |
||||||||
| Coca-Cola |
5,616 | 294,672 | ||||||
The accompanying notes are an integral part of the financial statements.
15
| THE ADVISORS’ INNER CIRCLE FUND III | GQG PARTNERS GLOBAL QUALITY DIVIDEND INCOME FUND SEPTEMBER 30, 2021 (Unaudited) |
| COMMON STOCK — continued | ||||||||
| Shares | Value | |||||||
| Consumer Staples (continued) |
||||||||
| PepsiCo |
1,796 | $ | 270,136 | |||||
|
|
|
| ||||||
| 564,808 | ||||||||
|
|
|
| ||||||
| Energy — 10.3% |
||||||||
| Chevron |
3,103 | 314,799 | ||||||
| Devon Energy |
17,663 | 627,213 | ||||||
| Exxon Mobil |
11,027 | 648,608 | ||||||
|
|
|
| ||||||
| 1,590,620 | ||||||||
|
|
|
| ||||||
| Financials — 9.7% |
||||||||
| AllianceBernstein Holding (A) |
9,446 | 468,333 | ||||||
| Bank of America |
12,478 | 529,691 | ||||||
| Morgan Stanley |
5,268 | 512,629 | ||||||
|
|
|
| ||||||
| 1,510,653 | ||||||||
|
|
|
| ||||||
| Health Care — 9.6% |
||||||||
| AbbVie |
2,863 | 308,832 | ||||||
| Bristol-Myers Squibb |
6,032 | 356,913 | ||||||
| Johnson & Johnson |
2,750 | 444,125 | ||||||
| UnitedHealth Group |
986 | 385,270 | ||||||
|
|
|
| ||||||
| 1,495,140 | ||||||||
|
|
|
| ||||||
| Industrials — 1.9% |
||||||||
| L3Harris Technologies |
1,364 | 300,407 | ||||||
|
|
|
| ||||||
| Information Technology — 4.4% |
||||||||
| Broadcom |
167 | 80,983 | ||||||
| Microsoft |
2,156 | 607,820 | ||||||
|
|
|
| ||||||
| 688,803 | ||||||||
|
|
|
| ||||||
| TOTAL UNITED STATES |
6,150,431 | |||||||
|
|
|
| ||||||
| Total Common Stock |
14,808,415 | |||||||
|
|
|
| ||||||
| Total Investments — 95.4% |
$ | 14,808,415 | ||||||
|
|
|
| ||||||
Percentages are based on Net Assets of $15,527,298.
| * | Non-income producing security. |
| ‡ | Real Estate Investment Trust. |
| (A) | Security considered Master Limited Partnership. At September 30, 2021, these securities amounted to $468,333 or 3.0% of net assets. |
The accompanying notes are an integral part of the financial statements.
16
| THE ADVISORS’ INNER CIRCLE FUND III | GQG PARTNERS GLOBAL QUALITY DIVIDEND INCOME FUND SEPTEMBER 30, 2021 (Unaudited) |
ADR — American Depositary Receipt
Cl — Class
GDR — Global Depositary Receipt
PJSC — Public Joint Stock Company
The following is a summary of the level of inputs used as of September 30, 2021, in valuing the Fund’s investments carried at value:
| Investments in Securities | Level 1 | Level 2 | Level 3 | Total | ||||||||||||
| Common Stock |
||||||||||||||||
| Australia |
$ | — | $ | 273,597 | $ | — | $ | 273,597 | ||||||||
| Brazil |
1,353,307 | — | — | 1,353,307 | ||||||||||||
| Canada |
574,776 | — | — | 574,776 | ||||||||||||
| China |
— | 118,260 | — | 118,260 | ||||||||||||
| Denmark |
701,449 | — | — | 701,449 | ||||||||||||
| France |
— | 138,113 | — | 138,113 | ||||||||||||
| Germany |
— | 720,987 | — | 720,987 | ||||||||||||
| India |
431,895 | — | — | 431,895 | ||||||||||||
| Japan |
— | 228,835 | — | 228,835 | ||||||||||||
| Luxembourg |
341,713 | — | — | 341,713 | ||||||||||||
| Russia |
489,365 | 1,314,750 | — | 1,804,115 | ||||||||||||
| Singapore |
— | 118,529 | — | 118,529 | ||||||||||||
| Spain |
— | 374,832 | — | 374,832 | ||||||||||||
| Sweden |
— | 85,485 | — | 85,485 | ||||||||||||
| Switzerland |
— | 246,908 | — | 246,908 | ||||||||||||
| Taiwan |
410,649 | — | — | 410,649 | ||||||||||||
| United Kingdom |
734,534 | — | — | 734,534 | ||||||||||||
| United States |
6,150,431 | — | — | 6,150,431 | ||||||||||||
|
|
|
|
|
|
|
|
|
|||||||||
| Total Common Stock |
11,188,119 | 3,620,296 | — | 14,808,415 | ||||||||||||
|
|
|
|
|
|
|
|
|
|||||||||
| Total Investments in Securities |
$ | 11,188,119 | $ | 3,620,296 | $ | — | $ | 14,808,415 | ||||||||
|
|
|
|
|
|
|
|
|
|||||||||
For the period ended September 30, 2021, there were no transfers in or out of Level 3.
For more information on valuation inputs, see Note 2 — Significant Accounting Policies in the Notes to Financial Statements
Amounts designated as “—” are $0 or have been rounded to $0.
The accompanying notes are an integral part of the financial statements.
17
| THE ADVISORS’ INNER CIRCLE FUND III | QUALITY DIVIDEND INCOME FUND SEPTEMBER 30, 2021 (Unaudited) |
| SECTOR WEIGHTING † | ||
† Percentages are based on total investments.
The accompanying notes are an integral part of the financial statements.
18
| THE ADVISORS’ INNER CIRCLE FUND III | GQG PARTNERS INTERNATIONAL QUALITY DIVIDEND INCOME FUND SEPTEMBER 30, 2021 (Unaudited) |
| COMMON STOCK — continued | ||||||||
| Shares | Value | |||||||
| DENMARK — 4.7% |
||||||||
| Novo Nordisk, Cl B |
7,525 | $ | 726,581 | |||||
|
|
|
| ||||||
| FRANCE — 5.5% |
||||||||
| BNP Paribas |
6,894 | 440,367 | ||||||
| Credit Agricole |
14,463 | 199,175 | ||||||
| Vinci |
2,085 | 216,723 | ||||||
|
|
|
| ||||||
| 856,265 | ||||||||
|
|
|
| ||||||
| GERMANY — 6.9% |
||||||||
| Daimler |
6,578 | 581,832 | ||||||
| Muenchener Rueckversicherungs-Gesellschaft in Muenchen |
714 | 194,850 | ||||||
| Siemens |
1,784 | 291,789 | ||||||
|
|
|
| ||||||
| 1,068,471 | ||||||||
|
|
|
| ||||||
| HONG KONG — 0.6% |
||||||||
| Hong Kong Exchanges & Clearing |
1,586 | 97,562 | ||||||
|
|
|
| ||||||
| INDIA — 3.4% |
||||||||
| Infosys ADR |
23,526 | 523,453 | ||||||
|
|
|
| ||||||
| JAPAN — 3.8% |
||||||||
| Inpex |
20,286 | 158,260 | ||||||
| Sumitomo Mitsui Financial Group |
5,086 | 178,186 | ||||||
| Tokio Marine Holdings |
4,647 | 248,341 | ||||||
|
|
|
| ||||||
| 584,787 | ||||||||
|
|
|
| ||||||
| LUXEMBOURG — 3.9% |
||||||||
| ArcelorMittal |
19,761 | 599,498 | ||||||
|
|
|
| ||||||
| NETHERLANDS — 0.5% |
||||||||
| Euronext |
658 | 74,514 | ||||||
|
|
|
| ||||||
| RUSSIA — 16.0% |
||||||||
| Gazprom PJSC |
126,002 | 625,881 | ||||||
| LUKOIL PJSC ADR |
5,393 | 510,501 | ||||||
| MMC Norilsk Nickel PJSC |
702 | 210,258 | ||||||
| Novolipetsk Steel PJSC GDR |
4,865 | 144,554 | ||||||
The accompanying notes are an integral part of the financial statements.
19
| THE ADVISORS’ INNER CIRCLE FUND III | GQG PARTNERS INTERNATIONAL QUALITY DIVIDEND INCOME FUND SEPTEMBER 30, 2021 (Unaudited) |
| COMMON STOCK — continued | ||||||||
| Shares | Value | |||||||
| RUSSIA (continued) |
||||||||
| Polyus PJSC GDR |
1,672 | $ | 137,371 | |||||
| Rosneft Oil PJSC |
40,112 | 339,479 | ||||||
| Sberbank of Russia PJSC ADR |
19,030 | 356,813 | ||||||
| Severstal PAO |
7,318 | 152,805 | ||||||
|
|
|
| ||||||
| 2,477,662 | ||||||||
|
|
|
| ||||||
| SINGAPORE — 0.5% |
||||||||
| Ascendas Real Estate Investment Trust ‡ |
36,087 | 79,542 | ||||||
|
|
|
| ||||||
| SOUTH KOREA — 1.8% |
||||||||
| Samsung Electronics GDR |
177 | 276,936 | ||||||
|
|
|
| ||||||
| SPAIN — 3.1% |
||||||||
| Banco Bilbao Vizcaya Argentaria ADR |
73,900 | 487,001 | ||||||
|
|
|
| ||||||
| SWEDEN — 3.7% |
||||||||
| Swedbank |
4,278 | 86,333 | ||||||
| Swedish Match |
55,739 | 488,475 | ||||||
|
|
|
| ||||||
| 574,808 | ||||||||
|
|
|
| ||||||
| SWITZERLAND — 4.1% |
||||||||
| Novartis |
2,373 | 194,155 | ||||||
| Roche Holding |
1,203 | 439,394 | ||||||
|
|
|
| ||||||
| 633,549 | ||||||||
|
|
|
| ||||||
| TAIWAN — 3.3% |
||||||||
| Taiwan Semiconductor Manufacturing ADR |
4,574 | 510,687 | ||||||
|
|
|
| ||||||
| UNITED KINGDOM — 8.0% |
||||||||
| AstraZeneca |
7,000 | 844,114 | ||||||
| British American Tobacco |
11,440 | 400,130 | ||||||
|
|
|
| ||||||
| 1,244,244 | ||||||||
|
|
|
| ||||||
| UNITED STATES — 7.0% |
||||||||
| Consumer Staples — 6.0% |
||||||||
| Philip Morris International |
9,804 | 929,321 | ||||||
|
|
|
| ||||||
The accompanying notes are an integral part of the financial statements.
20
| THE ADVISORS’ INNER CIRCLE FUND III | GQG PARTNERS INTERNATIONAL QUALITY DIVIDEND INCOME FUND SEPTEMBER 30, 2021 (Unaudited) |
| COMMON STOCK — continued | ||||||||
| Shares | Value | |||||||
| Information Technology — 1.0% |
||||||||
| Broadcom |
336 | $ | 162,937 | |||||
|
|
|
| ||||||
| TOTAL UNITED STATES |
1,092,258 | |||||||
|
|
|
| ||||||
| Total Common Stock |
||||||||
| (Cost $15,302,783) |
15,281,223 | |||||||
|
|
|
| ||||||
| PREFERRED STOCK — 0.5% | ||||||||
| GERMANY — 0.5% |
||||||||
| Volkswagen, 2.80% |
||||||||
| (Cost $79,428) |
317 | 70,597 | ||||||
|
|
|
| ||||||
| Total Investments — 99.0% |
||||||||
| (Cost $15,382,211) |
$ | 15,351,820 | ||||||
|
|
|
| ||||||
Percentages are based on Net Assets of $15,511,820.
| * | Non-income producing security. |
| ‡ | Real Estate Investment Trust. |
ADR — American Depositary Receipt
Cl — Class
GDR — Global Depositary Receipt
PJSC — Public Joint Stock Company
The accompanying notes are an integral part of the financial statements.
21
| THE ADVISORS’ INNER CIRCLE FUND III | GQG PARTNERS INTERNATIONAL QUALITY DIVIDEND INCOME FUND SEPTEMBER 30, 2021 (Unaudited) |
The following is a summary of the level of inputs used as of September 30, 2021, in valuing the Fund’s investments carried at value:
| Investments in Securities | Level 1 | Level 2 | Level 3 | Total | ||||||||||||
| Common Stock |
||||||||||||||||
| Australia |
$ | — | $ | 624,636 | $ | — | $ | 624,636 | ||||||||
| Belgium |
— | 356,542 | — | 356,542 | ||||||||||||
| Brazil |
1,267,177 | — | — | 1,267,177 | ||||||||||||
| Canada |
778,034 | — | — | 778,034 | ||||||||||||
| China |
— | 347,016 | — | 347,016 | ||||||||||||
| Denmark |
— | 726,581 | — | 726,581 | ||||||||||||
| France |
— | 856,265 | — | 856,265 | ||||||||||||
| Germany |
— | 1,068,471 | — | 1,068,471 | ||||||||||||
| Hong Kong |
— | 97,562 | — | 97,562 | ||||||||||||
| India |
523,453 | — | — | 523,453 | ||||||||||||
| Japan |
— | 584,787 | — | 584,787 | ||||||||||||
| Luxembourg |
— | 599,498 | — | 599,498 | ||||||||||||
| Netherlands |
— | 74,514 | — | 74,514 | ||||||||||||
| Russia |
1,149,239 | 1,328,423 | — | 2,477,662 | ||||||||||||
| Singapore |
— | 79,542 | — | 79,542 | ||||||||||||
| South Korea |
276,936 | — | — | 276,936 | ||||||||||||
| Spain |
487,001 | — | — | 487,001 | ||||||||||||
| Sweden |
— | 574,808 | — | 574,808 | ||||||||||||
| Switzerland |
— | 633,549 | — | 633,549 | ||||||||||||
| Taiwan |
510,687 | — | — | 510,687 | ||||||||||||
| United Kingdom |
— | 1,244,244 | — | 1,244,244 | ||||||||||||
| United States |
1,092,258 | — | — | 1,092,258 | ||||||||||||
|
|
|
|
|
|
|
|
|
|||||||||
| Total Common Stock |
6,084,785 | 9,196,438 | — | 15,281,223 | ||||||||||||
|
|
|
|
|
|
|
|
|
|||||||||
| Preferred Stock |
||||||||||||||||
| Germany |
— | 70,597 | — | 70,597 | ||||||||||||
|
|
|
|||||||||||||||
| Total Investments in Securities |
$ | 6,084,785 | $ | 9,267,035 | $ | — | $ | 15,351,820 | ||||||||
|
|
|
|
|
|
|
|
|
|||||||||
For the period ended September 30, 2021, there were no transfers in or out of Level 3.
For more information on valuation inputs, see Note 2 — Significant Accounting Policies in the Notes to Financial Statements
Amounts designated as “—” are $0 or have been rounded to $0.
The accompanying notes are an integral part of the financial statements.
22
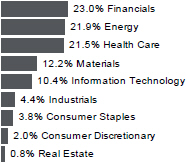
| THE ADVISORS’ INNER CIRCLE FUND III | DIVIDEND INCOME FUND SEPTEMBER 30, 2021 (Unaudited) |
| SECTOR WEIGHTING † |
† Percentages are based on total investments.
The accompanying notes are an integral part of the financial statements.
23
| THE ADVISORS’ INNER CIRCLE FUND III | GQG PARTNERS US QUALITY DIVIDEND INCOME FUND SEPTEMBER 30, 2021 (Unaudited) |
| COMMON STOCK — continued | ||||||||
| Shares | Value | |||||||
| Consumer Staples (continued) |
||||||||
| Coca-Cola |
8,351 | $ | 438,177 | |||||
| PepsiCo |
999 | 150,259 | ||||||
| Philip Morris International |
8,159 | 773,392 | ||||||
|
|
|
| ||||||
| 2,010,306 | ||||||||
|
|
|
| ||||||
| Energy — 16.2% |
||||||||
| Chevron |
6,454 | 654,758 | ||||||
| Devon Energy |
29,438 | 1,045,344 | ||||||
| Exxon Mobil |
14,394 | 846,655 | ||||||
|
|
|
| ||||||
| 2,546,757 | ||||||||
|
|
|
| ||||||
| Financials — 20.2% |
||||||||
| AllianceBernstein Holding (A) |
10,900 | 540,422 | ||||||
| Bank of America |
15,817 | 671,432 | ||||||
| Blackstone, Cl A |
6,290 | 731,779 | ||||||
| CME Group, Cl A |
1,409 | 272,472 | ||||||
| JPMorgan Chase |
1,868 | 305,773 | ||||||
| Morgan Stanley |
6,866 | 668,130 | ||||||
|
|
|
| ||||||
| 3,190,008 | ||||||||
|
|
|
| ||||||
| Health Care — 11.7% |
||||||||
| AbbVie |
2,703 | 291,573 | ||||||
| Bristol-Myers Squibb |
5,700 | 337,269 | ||||||
| Johnson & Johnson |
3,803 | 614,185 | ||||||
| Merck |
1,877 | 140,981 | ||||||
| UnitedHealth Group |
1,185 | 463,027 | ||||||
|
|
|
| ||||||
| 1,847,035 | ||||||||
|
|
|
| ||||||
| Industrials — 3.5% |
||||||||
| L3Harris Technologies |
1,421 | 312,961 | ||||||
| United Parcel Service, Cl B |
1,328 | 241,829 | ||||||
|
|
|
| ||||||
| 554,790 | ||||||||
|
|
|
| ||||||
| Information Technology — 8.5% |
||||||||
| Broadcom |
632 | 306,476 | ||||||
| Microsoft |
2,526 | 712,130 | ||||||
| Texas Instruments |
1,641 | 315,416 | ||||||
|
|
|
| ||||||
| 1,334,022 | ||||||||
|
|
|
| ||||||
| Materials — 2.3% |
||||||||
| Newmont |
6,670 | 362,181 | ||||||
|
|
|
| ||||||
| TOTAL UNITED STATES |
13,466,545 | |||||||
|
|
|
| ||||||
The accompanying notes are an integral part of the financial statements.
24
| THE ADVISORS’ INNER CIRCLE FUND III | GQG PARTNERS US QUALITY DIVIDEND INCOME FUND SEPTEMBER 30, 2021 (Unaudited) |
| COMMON STOCK — continued | ||||||||
| Shares | Value | |||||||
| Total Common Stock |
||||||||
| (Cost $15,097,358) |
$ | 15,229,755 | ||||||
|
|
|
| ||||||
| Total Investments — 96.7% |
||||||||
| (Cost $15,097,358) |
$ | 15,229,755 | ||||||
|
|
|
| ||||||
Percentages are based on Net Assets of $15,746,957.
| (A) | Security considered Master Limited Partnership. At September 30, 2021, these securities amounted to $540,422 or 3.4% of net assets. |
ADR — American Depositary Receipt
Cl — Class
As of September 30, 2021, all of the Fund’s investments were considered level 1, in accordance with the authoritative guidance on fair value measurements and disclosure under U.S. generally accepted accounting principles.
For the period ended September 30, 2021, there were no transfers in or out of Level 3.
For more information on valuation inputs, see Note 2 — Significant Accounting Policies in the Notes to Financial Statements
The accompanying notes are an integral part of the financial statements.
25
| THE ADVISORS’ INNER CIRCLE FUND III | GQG PARTNERS FUNDS SEPTEMBER 30, 2021 (Unaudited) |
| STATEMENTS OF ASSETS AND LIABILITIES |
| GQG Partners Emerging Markets Equity Fund |
GQG Partners Global Quality Equity Fund |
GQG Partners US Select Quality Equity Fund | ||||||||||
| Assets: |
||||||||||||
| Investments, at Value (Cost $7,075,696,991, $574,507,131 and $569,247,573) |
$ | 8,431,622,773 | $ | 661,324,058 | $ | 682,486,737 | ||||||
| Foreign Currency, at Value (Cost $21,520,209, $1,357,168 and $–) |
21,520,199 | 1,357,167 | – | |||||||||
| Cash |
224,634,800 | 24,807,447 | 25,728,178 | |||||||||
| Receivable for Investment Securities Sold |
106,320,557 | 8,236,684 | 11,182,547 | |||||||||
| Dividend and Interest Receivable |
16,841,630 | 223,164 | 380,224 | |||||||||
| Receivable for Capital Shares Sold |
16,614,871 | 909,762 | 2,705,754 | |||||||||
| Unrealized Gain on Foreign Spot Currency Contracts |
34,276 | – | – | |||||||||
| Reclaim Receivable |
– | 244,738 | – | |||||||||
| Other Prepaid Expenses |
83,413 | 55,882 | 20,123 | |||||||||
|
|
|
|
|
|
|
|
|
| ||||
| Total Assets |
8,817,672,519 | 697,158,902 | 722,503,563 | |||||||||
|
|
|
|
|
|
|
|
|
| ||||
| Liabilities: |
||||||||||||
| Accrued Foreign Capital Gains Tax on Appreciated Securities |
61,711,015 | – | – | |||||||||
| Payable for Capital Shares Redeemed |
7,054,969 | 303,801 | 8,204 | |||||||||
| Payable to Investment Adviser |
6,650,184 | 377,756 | 250,665 | |||||||||
| Payable for Investment Securities Purchased |
3,874,663 | 9,464,713 | 16,214,156 | |||||||||
| Payable to Administrator |
239,465 | 18,823 | 19,410 | |||||||||
| Chief Compliance Officer Fees Payable |
7,315 | 122 | 161 | |||||||||
| Payable to Trustees |
2,056 | 267 | 198 | |||||||||
| Unrealized Loss on Foreign Spot Currency Contracts |
– | 7,384 | – | |||||||||
| Shareholder Servicing Fees Payable, Investor Shares |
– | 104 | – | |||||||||
| Other Accrued Expenses and Other Payables |
989,728 | 108,424 | 99,146 | |||||||||
|
|
|
|
|
|
|
|
|
| ||||
| Total Liabilities |
80,529,395 | 10,281,394 | 16,591,940 | |||||||||
|
|
|
|
|
|
|
|
|
| ||||
| Net Assets |
$ | 8,737,143,124 | $ | 686,877,508 | $ | 705,911,623 | ||||||
|
|
|
|
|
|
|
|
|
| ||||
| Net Assets Consist of: |
||||||||||||
| Paid-in Capital |
$ | 7,333,289,497 | $ | 604,124,551 | $ | 588,897,841 | ||||||
| Total Distributable Earnings |
1,403,853,627 | 82,752,957 | 117,013,782 | |||||||||
|
|
|
|
|
|
|
|
|
| ||||
| Net Assets |
$ | 8,737,143,124 | $ | 686,877,508 | $ | 705,911,623 | ||||||
|
|
|
|
|
|
|
|
|
| ||||
The accompanying notes are an integral part of the financial statements.
26
| THE ADVISORS’ INNER CIRCLE FUND III | GQG PARTNERS FUNDS SEPTEMBER 30, 2021 (Unaudited) |
| STATEMENTS OF ASSETS AND LIABILITIES | ||||||
| GQG Partners Emerging Markets Equity Fund |
GQG Partners Global Quality Equity Fund |
GQG Partners US Select Quality Equity Fund | ||||||||||
| Investor Shares: |
||||||||||||
| Net Assets |
$ | 166,787,807 | $ | 2,162,676 | $ | 2,198,875 | ||||||
| Outstanding Shares of beneficial interest (unlimited authorization — no par value) |
9,553,059 | 150,324 | 137,539 | |||||||||
| Net Asset Value, Offering and Redemption Price Per Share |
$17.46 | $14.39 | $15.99 | |||||||||
|
|
|
|
|
|
|
|
|
| ||||
| Institutional Shares: |
||||||||||||
| Net Assets |
$ | 8,499,636,880 | $ | 636,107,488 | $ | 694,602,247 | ||||||
| Outstanding Shares of beneficial interest (unlimited authorization — no par value) |
484,412,784 | 44,106,577 | 43,349,790 | |||||||||
| Net Asset Value, Offering and Redemption Price Per Share |
$17.55 | $14.42 | $16.02 | |||||||||
|
|
|
|
|
|
|
|
|
| ||||
| R6 Shares: |
||||||||||||
| Net Assets |
$ | 70,718,437 | $ | 48,607,344 | $ | 9,110,501 | ||||||
| Outstanding Shares of beneficial interest (unlimited authorization — no par value) |
4,030,471 | 3,371,594 | 568,387 | |||||||||
| Net Asset Value, Offering and Redemption Price Per Share |
$17.55 | $14.42 | $16.03 | |||||||||
|
|
|
|
|
|
|
|
|
| ||||
Amounts designated as “ —” are $0 or have been rounded to $0.
The accompanying notes are an integral part of the financial statements.
27
| THE ADVISORS’ INNER CIRCLE FUND III | GQG PARTNERS FUNDS SEPTEMBER 30, 2021 (Unaudited) |
| STATEMENTS OF ASSETS AND LIABILITIES | ||||||
| GQG Partners Global Quality Dividend Income Fund |
GQG Partners International Quality Dividend Income Fund |
GQG Partners U.S. Quality Dividend Income Fund | ||||||||||
| Assets: |
||||||||||||
| Investments, at Value (Cost $14,804,580, $15,382,211 and $15,097,358) |
$ | 14,808,415 | $ | 15,351,820 | $ | 15,229,755 | ||||||
| Foreign Currency, at Value (Cost $–, $8,669 and $–) |
– | 8,669 | – | |||||||||
| Cash |
518,294 | 67,080 | 958,364 | |||||||||
| Receivable for Investment Securities Sold |
424,841 | 571,994 | – | |||||||||
| Dividend and Interest Receivable |
46,916 | 57,013 | 25,832 | |||||||||
| Receivable from Investment Advisor |
13,489 | 13,132 | 15,010 | |||||||||
| Deferred Offering Costs (Note 2) |
1,711 | 1,711 | 1,711 | |||||||||
| Reclaim Receivable |
953 | 2,653 | – | |||||||||
| Unrealized Gain on Foreign Spot Currency Contracts |
474 | – | – | |||||||||
| Other Prepaid Expenses |
2,412 | 2,411 | 2,412 | |||||||||
|
|
|
|
|
|
|
|
|
| ||||
| Total Assets |
15,817,505 | 16,076,483 | 16,233,084 | |||||||||
|
|
|
|
|
|
|
|
|
| ||||
| Liabilities: |
||||||||||||
| Payable for Investment Securities Purchased |
273,035 | 547,592 | 472,347 | |||||||||
| Payable to Administrator |
5,342 | 5,342 | 5,342 | |||||||||
| Payable to Trustees |
9 | 9 | 9 | |||||||||
| Chief Compliance Officer Fees Payable |
6 | 6 | 6 | |||||||||
| Unrealized Loss on Foreign Spot Currency Contracts |
– | 372 | – | |||||||||
| Other Accrued Expenses and Other Payables |
11,815 | 11,342 | 8,423 | |||||||||
|
|
|
|
|
|
|
|
|
| ||||
| Total Liabilities |
290,207 | 564,663 | 486,127 | |||||||||
|
|
|
|
|
|
|
|
|
| ||||
| Net Assets |
$ | 15,527,298 | $ | 15,511,820 | $ | 15,746,957 | ||||||
|
|
|
|
|
|
|
|
|
| ||||
| Net Assets Consist of: |
||||||||||||
| Paid-in Capital |
$ | 15,501,222 | $ | 15,550,197 | $ | 15,550,197 | ||||||
| Total Distributable Earnings/(Loss) |
26,076 | (38,377 | ) | 196,760 | ||||||||
|
|
|
|
|
|
|
|
|
| ||||
| Net Assets |
$ | 15,527,298 | $ | 15,511,820 | $ | 15,746,957 | ||||||
|
|
|
|
|
|
|
|
|
| ||||
The accompanying notes are an integral part of the financial statements.
28
| THE ADVISORS’ INNER CIRCLE FUND III | GQG PARTNERS FUNDS SEPTEMBER 30, 2021 (Unaudited) |
| STATEMENTS OF ASSETS AND LIABILITIES | ||||||
| GQG Partners Global Quality Dividend Income Fund |
GQG Partners International Quality Dividend Income Fund |
GQG Partners U.S. Quality Dividend Income Fund | ||||||||||
| Investor Shares: |
||||||||||||
| Net Assets |
$ | 990,037 | $ | 986,273 | $ | 1,011,168 | ||||||
| Outstanding Shares of beneficial interest (unlimited authorization — no par value) |
100,011 | 100,011 | 100,011 | |||||||||
| Net Asset Value, Offering and Redemption Price Per Share |
$9.90 | $9.86 | $10.11 | |||||||||
|
|
|
|
|
|
|
|
|
| ||||
| Institutional Shares: |
||||||||||||
| Net Assets |
$ | 14,537,261 | $ | 14,525,547 | $ | 14,735,789 | ||||||
| Outstanding Shares of beneficial interest (unlimited authorization — no par value) |
1,468,292 | 1,473,200 | 1,457,723 | |||||||||
| Net Asset Value, Offering and Redemption Price Per Share |
$9.90 | $9.86 | $10.11 | |||||||||
|
|
|
|
|
|
|
|
|
| ||||
Amounts designated as “ —” are $0 or have been rounded to $0.
The accompanying notes are an integral part of the financial statements.
29
| THE ADVISORS’ INNER CIRCLE FUND III | GQG PARTNERS FUNDS FOR THE PERIOD OR YEAR ENDED SEPTEMBER 30, 2021 AND JULY 31, 2021
|
| STATEMENTS OF OPERATIONS |
| GQG Partners Emerging Markets Equity Fund | ||||||||
| Period Ended (Unaudited) |
Year Ended July 31, 2021 | |||||||
|
|
|
| ||||||
| Investment Income: |
||||||||
| Dividends |
$ | 65,330,986 | $ | 145,979,972 | ||||
| Interest |
2,624 | 19,811 | ||||||
| Less: Foreign Taxes Withheld |
(2,536,936 | ) | (16,471,808 | ) | ||||
|
|
|
|
|
|
| |||
| Total Investment Income |
62,796,674 | 129,527,975 | ||||||
|
|
|
|
|
|
| |||
| Expenses: |
||||||||
| Investment Advisory Fees |
13,388,759 | 61,777,382 | ||||||
| Administration Fees |
485,241 | 2,531,756 | ||||||
| Shareholder Serving Fees, Investor Shares |
52,738 | 260,007 | ||||||
| Trustees’ Fees |
6,419 | 32,239 | ||||||
| Chief Compliance Officer Fees |
3,381 | 9,943 | ||||||
| Custodian Fees |
361,990 | 1,597,867 | ||||||
| Registration and Filing Fees |
135,415 | 477,441 | ||||||
| Transfer Agent Fees |
74,812 | 420,665 | ||||||
| Legal Fees |
17,383 | 108,487 | ||||||
| Audit Fees |
6,251 | 25,361 | ||||||
| Printing Fees |
– | 188,650 | ||||||
| Other Expenses |
64,937 | 102,317 | ||||||
|
|
|
|
|
|
| |||
| Total Expenses |
14,597,326 | 67,532,115 | ||||||
|
|
|
|
|
|
| |||
| Less: |
||||||||
| Waiver of Investment Advisory Fees |
(508,262 | ) | (556,088 | ) | ||||
| Advisory Waiver Recapture - Note 5 |
544,647 | 633,046 | ||||||
| Fees Paid Indirectly |
(2,140 | ) | (18,193 | ) | ||||
|
|
|
|
|
|
| |||
| Net Expenses |
14,631,571 | 67,590,880 | ||||||
|
|
|
|
|
|
| |||
| Net Investment Income |
48,165,103 | 61,937,095 | ||||||
|
|
|
|
|
|
| |||
| Net Realized Gain (Loss) on: |
||||||||
| Investments |
(85,628,582 | ) | 395,544,724 | |||||
| Foreign Currency Transactions |
(1,833,181 | ) | (8,681,722 | ) | ||||
|
|
|
|
|
|
| |||
| Net Realized Gain (Loss) |
(87,461,763 | ) | 386,863,002 | |||||
|
|
|
|
|
|
| |||
| Net Change in Unrealized Appreciation (Depreciation) on: |
||||||||
| Investments |
(31,334,135 | ) | 406,364,273 | |||||
| Accrued Foreign Capital Gains Tax on Appreciated Securities |
(25,383,989 | ) | (23,034,369 | ) | ||||
| Foreign Currency Translation |
(872,321 | ) | 507,983 | |||||
|
|
|
|
|
|
| |||
| Net Change in Unrealized Appreciation (Depreciation) |
(57,590,445 | ) | 383,837,887 | |||||
|
|
|
|
|
|
| |||
| Net Realized and Unrealized Gain (Loss) on Investments and Foreign Currency Transactions |
(145,052,208 | ) | 770,700,889 | |||||
|
|
|
|
|
|
| |||
| Net Increase (Decrease) in Net Assets Resulting from Operations |
$ | (96,887,105 | ) | $ | 832,637,984 | |||
|
|
|
|
|
|
| |||
The accompanying notes are an integral part of the financial statements.
30
| THE ADVISORS’ INNER CIRCLE FUND III | GQG PARTNERS FUNDS FOR THE PERIOD OR YEAR ENDED SEPTEMBER 30, 2021 AND JULY 31, 2021 |
| STATEMENTS OF OPERATIONS |
| (1) | For the period August 1, 2021 to September 30, 2021. Effective September 23, 2021, the Fund changed its fiscal year end to March 31st (see Note 1 in the Notes to Financial Statements). |
| Amounts designated as “—” are $0 or have been rounded to $0. |
The accompanying notes are an integral part of the financial statements.
31
| THE ADVISORS’ INNER CIRCLE FUND III | GQG PARTNERS FUNDS FOR THE PERIOD OR YEAR ENDED SEPTEMBER 30, 2021 AND JULY 31, 2021 |
| STATEMENTS OF OPERATIONS |
| GQG Partners Global Quality Equity Fund | ||||||||
| Period Ended September 30, 2021(1) (Unaudited) |
Year Ended | |||||||
|
|
|
| ||||||
| Investment Income: |
||||||||
| Dividends |
$ | 3,686,085 | $ | 6,841,904 | ||||
| Interest |
252 | 801 | ||||||
| Less: Foreign Taxes Withheld |
(67,395 | ) | (382,851 | ) | ||||
|
|
|
|
|
|
| |||
| Total Investment Income |
3,618,942 | 6,459,854 | ||||||
|
|
|
|
|
|
| |||
| Expenses: |
||||||||
| Investment Advisory Fees |
754,841 | 2,589,327 | ||||||
| Administration Fees |
37,878 | 145,707 | ||||||
| Shareholder Serving Fees, Investor Shares |
525 | 2,319 | ||||||
| Trustees’ Fees |
477 | 1,843 | ||||||
| Chief Compliance Officer Fees |
277 | 1,987 | ||||||
| Registration and Filing Fees |
31,990 | 119,730 | ||||||
| Transfer Agent Fees |
13,193 | 77,659 | ||||||
| Custodian Fees |
12,217 | 56,178 | ||||||
| Audit Fees |
6,175 | 25,061 | ||||||
| Legal Fees |
1,298 | 6,003 | ||||||
| Printing Fees |
– | 10,746 | ||||||
| Other Expenses |
5,095 | 9,392 | ||||||
|
|
|
|
|
|
| |||
| Total Expenses |
863,966 | 3,045,952 | ||||||
|
|
|
|
|
|
| |||
| Less: |
||||||||
| Waiver of Investment Advisory Fees |
(33,111 | ) | (57,565 | ) | ||||
| Advisory Waiver Recapture - Note 5 |
36,736 | – | ||||||
| Fees Paid Indirectly |
(41 | ) | (223 | ) | ||||
|
|
|
|
|
|
| |||
| Net Expenses |
867,550 | 2,988,164 | ||||||
|
|
|
|
|
|
| |||
| Net Investment Income |
2,751,392 | 3,471,690 | ||||||
|
|
|
|
|
|
| |||
| Net Realized Gain (Loss) on: |
||||||||
| Investments |
(5,653,826 | ) | (981,838 | ) | ||||
| Foreign Currency Transactions |
(29,761 | ) | (328,813 | ) | ||||
|
|
|
|
|
|
| |||
| Net Realized Loss |
(5,683,587 | ) | (1,310,651 | ) | ||||
|
|
|
|
|
|
| |||
| Net Change in Unrealized Appreciation (Depreciation) on: |
||||||||
| Investments |
(8,515,460 | ) | 67,418,398 | |||||
| Foreign Currency Translation |
(7,317 | ) | 1,745 | |||||
|
|
|
|
|
|
| |||
| Net Change in Unrealized Appreciation (Depreciation) |
(8,522,777 | ) | 67,420,143 | |||||
|
|
|
|
|
|
| |||
| Net Realized and Unrealized Gain (Loss) on Investments and Foreign |
||||||||
| Currency Transactions |
(14,206,364 | ) | 66,109,492 | |||||
|
|
|
|
|
|
| |||
| Net Increase (Decrease) in Net Assets Resulting from Operations |
$ | (11,454,972 | ) | $ | 69,581,182 | |||
|
|
|
|
|
|
| |||
| (1) | For the period August 1, 2021 to September 30, 2021. Effective September 23, 2021, the Fund changed its fiscal year end to March 31st (see Note 1 in the Notes to Financial Statements). |
The accompanying notes are an integral part of the financial statements.
32
| THE ADVISORS’ INNER CIRCLE FUND III | GQG PARTNERS FUNDS FOR THE PERIOD OR YEAR ENDED SEPTEMBER 30, 2021 AND JULY 31, 2021 |
| STATEMENTS OF OPERATIONS |
Amounts designated as “ —” are $0 or have been rounded to $0.
The accompanying notes are an integral part of the financial statements.
33
| THE ADVISORS’ INNER CIRCLE FUND III | GQG PARTNERS FUNDS FOR THE PERIOD OR YEAR ENDED SEPTEMBER 30, 2021 AND JULY 31, 2021 |
| STATEMENTS OF OPERATIONS |
| GQG Partners US Select Quality Equity Fund | ||||||||
| Period Ended (Unaudited) |
Year Ended July 31, 2021 | |||||||
|
|
|
| ||||||
| Investment Income: |
||||||||
| Dividends |
$ | 1,639,208 | $ | 6,115,812 | ||||
| Interest |
248 | 1,121 | ||||||
| Less: Foreign Taxes Withheld |
– | (32,469 | ) | |||||
|
|
|
|
|
|
| |||
| Total Investment Income |
1,639,456 | 6,084,464 | ||||||
|
|
|
|
|
|
| |||
| Expenses: |
||||||||
| Investment Advisory Fees |
531,492 | 2,125,763 | ||||||
| Administration Fees |
38,522 | 170,900 | ||||||
| Trustees’ Fees |
496 | 2,003 | ||||||
| Shareholder Serving Fees, Investor Shares |
375 | 1,645 | ||||||
| Chief Compliance Officer Fees |
284 | 2,088 | ||||||
| Registration and Filing Fees |
17,214 | 91,498 | ||||||
| Transfer Agent Fees |
13,509 | 79,191 | ||||||
| Audit Fees |
6,175 | 25,061 | ||||||
| Custodian Fees |
1,593 | 8,858 | ||||||
| Legal Fees |
1,344 | 6,946 | ||||||
| Printing Fees |
– | 8,135 | ||||||
| Other Expenses |
5,043 | 7,681 | ||||||
|
|
|
|
|
|
| |||
| Total Expenses |
616,047 | 2,529,769 | ||||||
|
|
|
|
|
|
| |||
| Less: |
||||||||
| Waiver of Investment Advisory Fees |
(214,438 | ) | (211,769 | ) | ||||
| Advisory Waiver Recapture - Note 5 |
176,735 | – | ||||||
| Fees Paid Indirectly |
(8 | ) | (71 | ) | ||||
|
|
|
|
|
|
| |||
| Net Expenses |
578,336 | 2,317,929 | ||||||
|
|
|
|
|
|
| |||
| Net Investment Income |
1,061,120 | 3,766,535 | ||||||
|
|
|
|
|
|
| |||
| Net Realized Gain (Loss) on: |
||||||||
| Investments |
(6,499,846 | ) | 6,466,282 | |||||
|
|
|
|
|
|
| |||
| Net Realized Gain (Loss) |
(6,499,846 | ) | 6,466,282 | |||||
|
|
|
|
|
|
| |||
| Net Change in Unrealized Appreciation (Depreciation) on: |
||||||||
| Investments |
(14,210,766 | ) | 101,748,985 | |||||
|
|
|
|
|
|
| |||
| Net Change in Unrealized Appreciation (Depreciation) |
(14,210,766 | ) | 101,748,985 | |||||
|
|
|
|
|
|
| |||
| Net Realized and Unrealized Gain (Loss) on Investments |
(20,710,612 | ) | 108,215,267 | |||||
|
|
|
|
|
|
| |||
| Net Increase (Decrease) in Net Assets Resulting from Operations |
$ | (19,649,492 | ) | $ | 111,981,802 | |||
|
|
|
|
|
|
| |||
| (1) | For the period August 1, 2021 to September 30, 2021. Effective September 23, 2021, the Fund changed its fiscal year end to March 31st (see Note 1 in the Notes to Financial Statements). |
Amounts designated as “ —” are $0 or have been rounded to $0.
The accompanying notes are an integral part of the financial statements.
34
| THE ADVISORS’ INNER CIRCLE FUND III | GQG PARTNERS FUNDS FOR THE PERIOD ENDED SEPTEMBER 30, 2021 (Unaudited) |
| STATEMENTS OF OPERATIONS | ||
| GQG Partners Global Quality Dividend Income Fund(1) |
GQG Partners International Quality Dividend Income Fund(1) |
GQG Partners U.S. Quality Dividend Income Fund(1) | ||||||||||
| Investment Income: |
||||||||||||
| Dividends |
$ | 149,949 | $ | 169,468 | $ | 90,124 | ||||||
| Interest |
10 | 7 | 8 | |||||||||
| Less: Foreign Taxes Withheld |
(11,495 | ) | (14,170 | ) | (708 | ) | ||||||
|
|
|
|
|
|
|
|
|
| ||||
| Total Investment Income |
138,464 | 155,305 | 89,424 | |||||||||
|
|
|
|
|
|
|
|
|
| ||||
| Expenses: |
||||||||||||
| Investment Advisory Fees |
17,169 | 17,114 | 12,007 | |||||||||
| Administration Fees |
16,383 | 16,383 | 16,383 | |||||||||
| Trustees’ Fees |
9 | 9 | 9 | |||||||||
| Chief Compliance Officer Fees |
6 | 6 | 6 | |||||||||
| Offering Costs |
19,659 | 19,659 | 19,659 | |||||||||
| Transfer Agent Fees |
10,717 | 10,717 | 10,717 | |||||||||
| Audit Fees |
8,368 | 8,368 | 8,268 | |||||||||
| Custodian Fees |
4,243 | 4,269 | 1,813 | |||||||||
| Registration and Filing Fees |
500 | 500 | 500 | |||||||||
| Legal Fees |
26 | 26 | 26 | |||||||||
| Other Expenses |
929 | 929 | 557 | |||||||||
|
|
|
|
|
|
|
|
|
| ||||
| Total Expenses |
78,009 | 77,980 | 69,945 | |||||||||
|
|
|
|
|
|
|
|
|
| ||||
| Less: |
||||||||||||
| Waiver of Investment Advisory Fees |
(17,169 | ) | (17,114 | ) | (12,007 | ) | ||||||
| Reimbursement from Adviser |
(41,030 | ) | (40,066 | ) | (44,865 | ) | ||||||
|
|
|
|
|
|
|
|
|
| ||||
| Net Expenses |
19,810 | 20,800 | 13,073 | |||||||||
|
|
|
|
|
|
|
|
|
| ||||
| Net Investment Income |
118,654 | 134,505 | 76,351 | |||||||||
|
|
|
|
|
|
|
|
|
| ||||
| Net Realized Gain (Loss) on: |
||||||||||||
| Investments |
(93,482 | ) | (135,818 | ) | (11,988 | ) | ||||||
| Foreign Currency Transactions |
(2,302 | ) | (6,309 | ) | – | |||||||
|
|
|
|
|
|
|
|
|
| ||||
| Net Realized Loss |
(95,784 | ) | (142,127 | ) | (11,988 | ) | ||||||
|
|
|
|
|
|
|
|
|
| ||||
| Net Change in Unrealized Appreciation (Depreciation) on: |
||||||||||||
| Investments |
3,835 | (30,391 | ) | 132,397 | ||||||||
| Foreign Currency Translation |
(629 | ) | (364 | ) | – | |||||||
|
|
|
|
|
|
|
|
|
| ||||
| Net Change in Unrealized Appreciation (Depreciation) |
3,206 | (30,755 | ) | 132,397 | ||||||||
|
|
|
|
|
|
|
|
|
| ||||
| Net Realized and Unrealized Gain (Loss) on Investments and Foreign Currency Transactions |
(92,578 | ) | (172,882 | ) | 120,409 | |||||||
|
|
|
|
|
|
|
|
|
| ||||
| Net Increase (Decrease) in Net Assets Resulting from Operations |
$ | 26,076 | $ | (38,377 | ) | $ | 196,760 | |||||
|
|
|
|
|
|
|
|
|
| ||||
(1) Commenced operations on June 30, 2021.
Amounts designated as “—” are $0 or have been rounded to $0.
The accompanying notes are an integral part of the financial statements.
35
| THE ADVISORS’ INNER CIRCLE FUND III | GQG PARTNERS EMERGING MARKETS EQUITY FUND
|
(1) For the period August 1, 2021 to September 30, 2021. Effective September 23, 2021, the Fund changed its fiscal year end to March 31st (see Note 1 in the Notes to Financial Statements).
| (2) | See Note 7 in Notes to Financial Statements. |
Amounts designated as “ —” are $0 or have been rounded to $0.
The accompanying notes are an integral part of the financial statements.
36
| THE ADVISORS’ INNER CIRCLE FUND III | GQG PARTNERS GLOBAL QUALITY EQUITY FUND
|
| STATEMENTS OF CHANGES IN NET ASSETS | ||||||||||||
| Period Ended | ||||||||||||
| September | ||||||||||||
| 30, 2021(1) | Year Ended | Year Ended | ||||||||||
| (Unaudited) | July 31, 2021 | July 31, 2020 | ||||||||||
| Operations: |
||||||||||||
| Net Investment Income |
$ | 2,751,392 | $ | 3,471,690 | $ | 399,863 | ||||||
| Net Realized Loss on Investments and Foreign Currency Transactions |
(5,683,587 | ) | (1,310,651 | ) | (3,157,298 | ) | ||||||
| Net Change in Unrealized Appreciation (Depreciation) on Investments and Foreign Currency Translation |
(8,522,777 | ) | 67,420,143 | 27,213,931 | ||||||||
|
|
|
|
|
|
|
|
|
| ||||
| Net Increase (Decrease) in Net Assets Resulting From Operations |
(11,454,972 | ) | 69,581,182 | 24,456,496 | ||||||||
|
|
|
|
|
|
|
|
|
| ||||
| Distributions |
||||||||||||
| Institutional Shares |
– | (397,457 | ) | (28,984 | ) | |||||||
| R6 Shares |
– | (358 | ) | (98 | ) | |||||||
|
|
|
|
|
|
|
|
|
| ||||
| Total Distributions |
– | (397,815 | ) | (29,082 | ) | |||||||
|
|
|
|
|
|
|
|
|
| ||||
| Capital Share Transactions (2): |
||||||||||||
| Investor Shares |
||||||||||||
| Issued |
185,350 | 946,932 | 829,887 | |||||||||
| Redeemed |
(2,794 | ) | (435,871 | ) | (82,432 | ) | ||||||
|
|
|
|
|
|
|
|
|
| ||||
| Net Investor Shares Transactions |
182,556 | 511,061 | 747,455 | |||||||||
|
|
|
|
|
|
|
|
|
| ||||
| Institutional Shares |
||||||||||||
| Issued |
40,294,633 | 432,020,577 | 170,687,747 | |||||||||
| Reinvestment of Distributions |
– | 395,333 | 28,962 | |||||||||
| Redeemed |
(4,145,369 | ) | (88,747,400 | ) | (11,336,661 | ) | ||||||
|
|
|
|
|
|
|
|
|
| ||||
| Net Institutional Shares Transactions |
36,149,264 | 343,668,510 | 159,380,048 | |||||||||
|
|
|
|
|
|
|
|
|
| ||||
| R6 Shares |
||||||||||||
| Issued |
– | 49,246,709 | – | |||||||||
| Reinvestment of Distributions |
– | 358 | 98 | |||||||||
| Redeemed |
(3,200,000 | ) | – | – | ||||||||
|
|
|
|
|
|
|
|
|
| ||||
| Net R6 Shares Transactions |
(3,200,000 | ) | 49,247,067 | 98 | ||||||||
|
|
|
|
|
|
|
|
|
| ||||
| Net Increase in Net Assets From Capital Share Transactions |
33,131,820 | 393,426,638 | 160,127,601 | |||||||||
|
|
|
|
|
|
|
|
|
| ||||
| Total Increase in Net Assets |
21,676,848 | 462,610,005 | 184,555,015 | |||||||||
|
|
|
|
|
|
|
|
|
| ||||
| Net Assets: |
||||||||||||
| Beginning of Year or Period |
665,200,660 | 202,590,655 | 18,035,640 | |||||||||
|
|
|
|
|
|
|
|
|
| ||||
| End of Year or Period |
$ | 686,877,508 | $ | 665,200,660 | $ | 202,590,655 | ||||||
|
|
|
|
|
|
|
|
|
| ||||
(1) For the period August 1, 2021 to September 30, 2021. Effective September 23, 2021, the Fund changed its fiscal year end to March 31st (see Note 1 in the Notes to Financial Statements).
(2) See Note 7 in Notes to Financial Statements.
Amounts designated as “ —” are $0 or have been rounded to $0.
The accompanying notes are an integral part of the financial statements.
37
| THE ADVISORS’ INNER CIRCLE FUND III | GQG PARTNERS US SELECT QUALITY EQUITY FUND
|
| STATEMENTS OF CHANGES IN NET ASSETS | ||||||||||||
| Period Ended | ||||||||||||
| September | ||||||||||||
| 30, 2021(1) | Year Ended | Year Ended | ||||||||||
| (Unaudited) | July 31, 2021 | July 31, 2020 | ||||||||||
| Operations: |
||||||||||||
| Net Investment Income |
$ | 1,061,120 | $ | 3,766,535 | $ | 388,135 | ||||||
| Net Realized Gain (Loss) on Investments |
(6,499,846 | ) | 6,466,282 | 2,955,429 | ||||||||
| Net Change in Unrealized Appreciation (Depreciation) on Investments |
(14,210,766 | ) | 101,748,985 | 21,793,361 | ||||||||
|
|
|
|
|
|
|
|
|
| ||||
| Net Increase (Decrease) in Net Assets Resulting From Operations |
(19,649,492 | ) | 111,981,802 | 25,136,925 | ||||||||
|
|
|
|
|
|
|
|
|
| ||||
| Distributions |
||||||||||||
| Investor Shares |
– | (9,539 | ) | (3,115 | ) | |||||||
| Institutional Shares |
– | (3,506,010 | ) | (314,395 | ) | |||||||
| R6 Shares |
– | (2,421 | ) | (1,875 | ) | |||||||
|
|
|
|
|
|
|
|
|
| ||||
| Total Distributions |
– | (3,517,970 | ) | (319,385 | ) | |||||||
|
|
|
|
|
|
|
|
|
| ||||
| Capital Share Transactions (2): |
||||||||||||
| Investor Shares |
||||||||||||
| Issued |
73,467 | 819,339 | 721,171 | |||||||||
| Reinvestment of Distributions |
– | 9,539 | 3,115 | |||||||||
| Redeemed |
(1,167 | ) | (225,864 | ) | (97,175 | ) | ||||||
|
|
|
|
|
|
|
|
|
| ||||
| Net Investor Shares Transactions |
72,300 | 603,014 | 627,111 | |||||||||
|
|
|
|
|
|
|
|
|
| ||||
| Institutional Shares |
||||||||||||
| Issued |
60,171,804 | 434,141,334 | 97,493,399 | |||||||||
| Reinvestment of Distributions |
– | 3,239,261 | 314,395 | |||||||||
| Redeemed |
(18,334,088 | ) | (38,607,432 | ) | (794,684 | ) | ||||||
|
|
|
|
|
|
|
|
|
| ||||
| Net Institutional Shares Transactions |
41,837,716 | 398,773,163 | 97,013,110 | |||||||||
|
|
|
|
|
|
|
|
|
| ||||
| R6 Shares |
||||||||||||
| Issued |
12,433 | 9,982,295 | – | |||||||||
| Reinvestment of Distributions |
– | 2,421 | 1,875 | |||||||||
| Redeemed |
(571,331 | ) | (1,159,336 | ) | – | |||||||
|
|
|
|
|
|
|
|
|
| ||||
| Net R6 Shares Transactions |
(558,898 | ) | 8,825,380 | 1,875 | ||||||||
|
|
|
|
|
|
|
|
|
| ||||
| Net Increase in Net Assets From Capital Share Transactions |
41,351,118 | 408,201,557 | 97,642,096 | |||||||||
|
|
|
|
|
|
|
|
|
| ||||
| Total Increase in Net Assets |
21,701,626 | 516,665,389 | 122,459,636 | |||||||||
|
|
|
|
|
|
|
|
|
| ||||
| Net Assets: |
||||||||||||
| Beginning of Year or Period |
684,209,997 | 167,544,608 | 45,084,972 | |||||||||
|
|
|
|
|
|
|
|
|
| ||||
| End of Year or Period |
$ | 705,911,623 | $ | 684,209,997 | $ | 167,544,608 | ||||||
|
|
|
|
|
|
|
|
|
| ||||
(1) For the period August 1, 2021 to September 30, 2021. Effective September 23, 2021, the Fund changed its fiscal year end to March 31st (see Note 1 in the Notes to Financial Statements).
(2) See Note 7 in Notes to Financial Statements.
Amounts designated as “ —” are $0 or have been rounded to $0.
The accompanying notes are an integral part of the financial statements.
38
| THE ADVISORS’ INNER CIRCLE FUND III | GQG PARTNERS GLOBAL QUALITY DIVIDEND INCOME FUND |
| STATEMENTS OF CHANGES IN NET ASSETS | ||||
| Period Ended, | ||||
| September | ||||
| 30, 2021(1) | ||||
| (Unaudited) | ||||
| Operations: |
||||
| Net Investment Income |
$ | 118,654 | ||
| Net Realized Loss on Investments and Foreign Currency Transactions |
(95,784 | ) | ||
| Net Change in Unrealized Appreciation on Investments and Foreign Currency Translation |
3,206 | |||
|
|
|
| ||
| Net Increase in Net Assets Resulting From Operations |
26,076 | |||
|
|
|
| ||
| Capital Share Transactions (2): |
||||
| Investor Shares |
||||
| Issued |
1,000,116 | |||
| Redeemed |
(5 | ) | ||
|
|
|
| ||
| Net Investor Shares Transactions |
1,000,111 | |||
|
|
|
| ||
| Institutional Shares |
||||
| Issued |
14,501,116 | |||
| Redeemed |
(5 | ) | ||
|
|
|
| ||
| Net Institutional Shares Transactions |
14,501,111 | |||
|
|
|
| ||
| Net Increase in Net Assets From Capital Share Transactions |
15,501,222 | |||
|
|
|
| ||
| Total Increase in Net Assets |
15,527,298 | |||
|
|
|
| ||
| Net Assets: |
||||
| Beginning of Period |
– | |||
|
|
|
| ||
| End of Period |
$ | 15,527,298 | ||
|
|
|
| ||
(1) Commenced operations on June 30, 2021.
(2) See Note 7 in Notes to Financial Statements.
Amounts designated as “ —” are $0 or have been rounded to $0.
The accompanying notes are an integral part of the financial statements.
39
| THE ADVISORS’ INNER CIRCLE FUND III |
GQG PARTNERS INTERNATIONAL QUALITY DIVIDEND INCOME FUND |
| STATEMENTS OF CHANGES IN NET ASSETS | ||||
| Period Ended, | ||||
| September | ||||
| 30, 2021(1) | ||||
| (Unaudited) | ||||
| Operations: |
||||
| Net Investment Income |
$ | 134,505 | ||
| Net Realized Loss on Investments and Foreign Currency Transactions |
(142,127 | ) | ||
| Net Change in Unrealized Depreciation on Investments and Foreign Currency Translation |
(30,755 | ) | ||
|
|
|
| ||
| Net Decrease in Net Assets Resulting From Operations |
(38,377 | ) | ||
|
|
|
| ||
| Capital Share Transactions (2): |
||||
| Investor Shares |
||||
| Issued |
1,000,116 | |||
| Redeemed |
(5 | ) | ||
|
|
|
| ||
| Net Investor Shares Transactions |
1,000,111 | |||
|
|
|
| ||
| Institutional Shares |
||||
| Issued |
14,550,091 | |||
| Redeemed |
(5 | ) | ||
|
|
|
| ||
| Net Institutional Shares Transactions |
14,550,086 | |||
|
|
|
| ||
| Net Increase in Net Assets From Capital Share Transactions |
15,550,197 | |||
|
|
|
| ||
| Total Increase in Net Assets |
15,511,820 | |||
|
|
|
| ||
| Net Assets: |
||||
| Beginning of Period |
– | |||
|
|
|
| ||
| End of Period |
$ | 15,511,820 | ||
|
|
|
| ||
(1) Commenced operations on June 30, 2021.
(2) See Note 7 in Notes to Financial Statements.
Amounts designated as “ —” are $0 or have been rounded to $0.
The accompanying notes are an integral part of the financial statements.
40
| THE ADVISORS’ INNER CIRCLE FUND III | GQG PARTNERS US QUALITY DIVIDEND INCOME FUND |
| STATEMENTS OF CHANGES IN NET ASSETS | ||||
| Period Ended, | ||||
| September | ||||
| 30, 2021(1) | ||||
| (Unaudited) | ||||
| Operations: |
||||
| Net Investment Income |
$ | 76,351 | ||
| Net Realized Loss on Investments |
(11,988 | ) | ||
| Net Change in Unrealized Appreciation on Investments |
132,397 | |||
|
|
|
| ||
| Net Increase in Net Assets Resulting From Operations |
196,760 | |||
|
|
|
| ||
| Capital Share Transactions (2): |
||||
| Investor Shares |
||||
| Issued |
1,000,116 | |||
| Redeemed |
(5 | ) | ||
|
|
|
| ||
| Net Investor Shares Transactions |
1,000,111 | |||
|
|
|
| ||
| Institutional Shares |
||||
| Issued |
14,550,091 | |||
| Redeemed |
(5 | ) | ||
|
|
|
| ||
| Net Institutional Shares Transactions |
14,550,086 | |||
|
|
|
| ||
| Net Increase in Net Assets From Capital Share Transactions |
15,550,197 | |||
|
|
|
| ||
| Total Increase in Net Assets |
15,746,957 | |||
|
|
|
| ||
| Net Assets: |
||||
| Beginning of Period |
– | |||
|
|
|
| ||
| End of Period |
$ | 15,746,957 | ||
|
|
|
| ||
(1) Commenced operations on June 30, 2021.
(2) See Note 7 in Notes to Financial Statements.
Amounts designated as “ —” are $0 or have been rounded to $0.
The accompanying notes are an integral part of the financial statements.
41
| THE ADVISORS’ INNER CIRCLE FUND III | GQG PARTNERS EMERGING MARKETS EQUITY FUND |
| FINANCIAL HIGHLIGHTS | ||||||||
| Selected Per Share Data & Ratios For a Share | ||||||||
| Outstanding Throughout the Year or Period | ||||||||
| Investor Shares | ||||||||||||||||||||||||
| Period Ended | Period | |||||||||||||||||||||||
| September | Ended | |||||||||||||||||||||||
| 30, 2021(1) | Year Ended | Year Ended | Year Ended | Year Ended | July 31, | |||||||||||||||||||
| (Unaudited) | July 31, 2021 | July 31, 2020 | July 31, 2019 | July 31, 2018 | 2017(2) | |||||||||||||||||||
| Net Asset Value, Beginning of Year/Period |
$ | 17.65 | $ | 14.84 | $ | 13.11 | $ | 12.43 | $ | 12.14 | $ | 10.00 | ||||||||||||
|
|
|
|
|
|
|
|
|
|
|
|
|
|
|
|
|
|
| |||||||
| Income from Investment Operations: |
||||||||||||||||||||||||
| Net Investment Income* |
0.09 | 0.13 | 0.07 | 0.14 | 0.07 | 0.12 | ||||||||||||||||||
| Net Realized and Unrealized Gain (Loss) |
(0.28 | ) | 2.71 | 1.80 | 0.61 | 0.24^ | 2.02 | |||||||||||||||||
|
|
|
|
|
|
|
|
|
|
|
|
|
|
|
|
|
|
| |||||||
| Total from Investment Operations |
(0.19 | ) | 2.84 | 1.87 | 0.75 | 0.31 | 2.14 | |||||||||||||||||
|
|
|
|
|
|
|
|
|
|
|
|
|
|
|
|
|
|
| |||||||
| Dividends and Distributions: |
||||||||||||||||||||||||
| Net Investment Income |
— | (0.03 | ) | (0.14 | ) | (0.07 | ) | (0.02 | ) | — | ||||||||||||||
|
|
|
|
|
|
|
|
|
|
|
|
|
|
|
|
|
|
| |||||||
| Total Dividends and Distributions |
— | (0.03 | ) | (0.14 | ) | (0.07 | ) | (0.02 | ) | — | ||||||||||||||
|
|
|
|
|
|
|
|
|
|
|
|
|
|
|
|
|
|
| |||||||
| Net Asset Value, End of Year/ Period |
$ | 17.46 | $ | 17.65 | $ | 14.84 | $ | 13.11 | $ | 12.43 | $ | 12.14 | ||||||||||||
|
|
|
|
|
|
|
|
|
|
|
|
|
|
|
|
|
|
| |||||||
| Total Return† |
(1.08)% | 19.12% | 14.39% | 6.10% | 2.57% | 21.40% | ||||||||||||||||||
|
|
|
|
|
|
|
|
|
|
|
|
|
|
|
|
|
|
| |||||||
| Ratios and Supplemental Data |
||||||||||||||||||||||||
| Net Assets, End of Year/Period (Thousands) |
$ | 166,788 | $ | 173,963 | $ | 88,121 | $ | 18,124 | $ | 9,932 | $ | 2,123 | ||||||||||||
| Ratio of Expenses to Average Net Assets |
1.16%††(3) | 1.16%(3) | 1.16% | 1.20% | 1.26% | 1.33%†† | ||||||||||||||||||
| Ratio of Expenses to Average Net Assets (Excluding Waivers and Recaptured Fees) |
1.16%†† | 1.16% | 1.22% | 1.26% | 1.33% | 1.95%†† | ||||||||||||||||||
| Ratio of Net Investment Income to Average Net Assets |
3.02%†† | 0.72% | 0.53% | 1.17% | 0.55% | 1.83%†† | ||||||||||||||||||
| Portfolio Turnover Rate |
10%‡ | 101% | 93% | 74% | 94% | 45%‡ | ||||||||||||||||||
| * | Per share calculations were performed using average shares for the period. |
| † | Total return is for the period indicated and has not been annualized. Returns shown do not reflect the deductions of taxes that a shareholder would pay on Fund distributions or the redemption of Fund shares. |
| †† | Annualized. |
| ‡ | Portfolio turnover is for the period indicated and has not been annualized. |
| ^ | The amount shown for a share outstanding throughout the period does not accord with the aggregate net losses on investments for the period because of the sales and repurchases of Fund shares in relation to fluctuating market value of the investments of the Fund. |
| (1) | For the period August 1, 2021 to September 30, 2021. Effective September 23, 2021, the Fund changed its fiscal year end to March 31st (see Note 1 in the Notes to Financial Statements). |
| (2) | Commenced operations on December 28, 2016. |
| (3) | Ratio includes previously waived advisory fees recaptured. The net expense ratio would have been lower absent the impact of the recaptured fees. |
| Amounts designated as “—” are either not applicable, $0 or have been rounded to $0. |
The accompanying notes are an integral part of the financial statements.
42
| THE ADVISORS’ INNER CIRCLE FUND III | GQG PARTNERS EMERGING MARKETS EQUITY FUND |
| FINANCIAL HIGHLIGHTS | ||||||||
| Selected Per Share Data & Ratios For a Share | ||||||||
| Outstanding Throughout the Year or Period | ||||||||
| Institutional Shares | ||||||||||||||||||||||||
| Period Ended | Period | |||||||||||||||||||||||
| September | Ended | |||||||||||||||||||||||
| 30, 2021(1) | Year Ended | Year Ended | Year Ended | Year Ended | July 31, | |||||||||||||||||||
| (Unaudited) | July 31, 2021 | July 31, 2020 | July 31, 2019 | July 31, 2018 | 2017(2) | |||||||||||||||||||
| Net Asset Value, Beginning of Year/Period |
$ | 17.74 | $ | 14.90 | $ | 13.15 | $ | 12.47 | $ | 12.17 | $ | 10.00 | ||||||||||||
|
|
|
|
|
|
|
|
|
|
|
|
|
|
|
|
|
|
| |||||||
| Income from Investment Operations: |
||||||||||||||||||||||||
| Net Investment Income* |
0.10 | 0.16 | 0.09 | 0.18 | 0.10 | 0.14 | ||||||||||||||||||
| Net Realized and Unrealized Gain (Loss) |
(0.29 | ) | 2.72 | 1.82 | 0.59 | 0.23 | ^ | 2.03 | ||||||||||||||||
|
|
|
|
|
|
|
|
|
|
|
|
|
|
|
|
|
|
| |||||||
| Total from Investment Operations |
(0.19 | ) | 2.88 | 1.91 | 0.77 | 0.33 | 2.17 | |||||||||||||||||
|
|
|
|
|
|
|
|
|
|
|
|
|
|
|
|
|
|
| |||||||
| Dividends and Distributions: |
||||||||||||||||||||||||
| Net Investment Income |
— | (0.04 | ) | (0.16 | ) | (0.09 | ) | (0.03 | ) | — | ||||||||||||||
|
|
|
|
|
|
|
|
|
|
|
|
|
|
|
|
|
|
| |||||||
| Total Dividends and Distributions |
— | (0.04 | ) | (0.16 | ) | (0.09 | ) | (0.03 | ) | — | ||||||||||||||
|
|
|
|
|
|
|
|
|
|
|
|
|
|
|
|
|
|
| |||||||
| Net Asset Value, End of Year/ Period |
$ | 17.55 | $ | 17.74 | $ | 14.90 | $ | 13.15 | $ | 12.47 | $ | 12.17 | ||||||||||||
|
|
|
|
|
|
|
|
|
|
|
|
|
|
|
|
|
|
| |||||||
| Total Return† |
(1.07)% | 19.35% | 14.62% | 6.31% | 2.72% | 21.70% | ||||||||||||||||||
|
|
|
|
|
|
|
|
|
|
|
|
|
|
|
|
|
|
| |||||||
| Ratios and Supplemental Data |
||||||||||||||||||||||||
| Net Assets, End of Year/Period (Thousands) |
$ | 8,499,637 | $ | 8,429,150 | $ | 4,276,901 | $ | 1,783,796 | $ | 928,267 | $ | 201,233 | ||||||||||||
| Ratio of Expenses to Average Net Assets |
0.98%††(3) | 0.98%(3) | 0.98% | 1.01% | 1.08% | 1.08%†† | ||||||||||||||||||
| Ratio of Expenses to Average Net Assets (Excluding Waivers and Recaptured Fees) |
0.98%†† | 0.98% | 1.03% | 1.07% | 1.15% | 1.69%†† | ||||||||||||||||||
| Ratio of Net Investment Income to Average Net Assets |
3.24%†† | 0.90% | 0.67% | 1.46% | 0.79% | 2.08%†† | ||||||||||||||||||
| Portfolio Turnover Rate |
10%‡ | 101% | 93% | 74% | 94% | 45%‡ | ||||||||||||||||||
| * | Per share calculations were performed using average shares for the period. |
| † | Total return is for the period indicated and has not been annualized. Returns shown do not reflect the deductions of taxes that a shareholder would pay on Fund distributions or the redemption of Fund shares. |
| †† | Annualized. |
| ‡ | Portfolio turnover is for the period indicated and has not been annualized. |
| ^ | The amount shown for a share outstanding throughout the period does not accord with the aggregate net losses on investments for the period because of the sales and repurchases of Fund shares in relation to fluctuating market value of the investments of the Fund. |
| (1) | For the period August 1, 2021 to September 30, 2021. Effective September 23, 2021, the Fund changed its fiscal year end to March 31st (see Note 1 in the Notes to Financial Statements). |
| (2) | Commenced operations on December 28, 2016. |
| (3) | Ratio includes previously waived advisory fees recaptured. The net expense ratio would have been lower absent the impact of the recaptured fees. |
| Amounts designated as “—” are either not applicable, $0 or have been rounded to $0. |
The accompanying notes are an integral part of the financial statements.
43
| THE ADVISORS’ INNER CIRCLE FUND III | GQG PARTNERS EMERGING MARKETS EQUITY FUND |
| FINANCIAL HIGHLIGHTS | ||||||||
| Selected Per Share Data & Ratios For a Share | ||||||||
| Outstanding Throughout the Year or Period | ||||||||
| R6 Shares | ||||||||||||||||||||||||
| Period Ended | Period | |||||||||||||||||||||||
| September | Ended | |||||||||||||||||||||||
| 30, 2021(1) | Year Ended | Year Ended | Year Ended | Year Ended | July 31, | |||||||||||||||||||
| (Unaudited) | July 31, 2021 | July 31, 2020 | July 31, 2019 | July 31, 2018 | 2017(2) | |||||||||||||||||||
| Net Asset Value, Beginning of Year/Period |
$ | 17.74 | $ | 14.90 | $ | 13.14 | $ | 12.47 | $ | 12.17 | $ | 10.00 | ||||||||||||
|
|
|
|
|
|
|
|
|
|
|
|
|
|
|
|
|
|
| |||||||
| Income from Investment Operations: |
||||||||||||||||||||||||
| Net Investment Income* |
0.10 | 0.21 | 0.08 | 0.19 | 0.14 | 0.10 | ||||||||||||||||||
| Net Realized and Unrealized Gain (Loss) |
(0.29 | ) | 2.67 | 1.84 | 0.57 | 0.19 | ^ | 2.07 | ||||||||||||||||
|
|
|
|
|
|
|
|
|
|
|
|
|
|
|
|
|
|
| |||||||
| Total from Investment Operations |
(0.19 | ) | 2.88 | 1.92 | 0.76 | 0.33 | 2.17 | |||||||||||||||||
|
|
|
|
|
|
|
|
|
|
|
|
|
|
|
|
|
|
| |||||||
| Dividends and Distributions: |
||||||||||||||||||||||||
| Net Investment Income |
— | (0.04 | ) | (0.16 | ) | (0.09 | ) | (0.03 | ) | — | ||||||||||||||
|
|
|
|
|
|
|
|
|
|
|
|
|
|
|
|
|
|
| |||||||
| Total Dividends and Distributions |
— | (0.04 | ) | (0.16 | ) | (0.09 | ) | (0.03 | ) | — | ||||||||||||||
|
|
|
|
|
|
|
|
|
|
|
|
|
|
|
|
|
|
| |||||||
| Net Asset Value, End of Year/ Period |
$ | 17.55 | $ | 17.74 | $ | 14.90 | $ | 13.14 | $ | 12.47 | $ | 12.17 | ||||||||||||
|
|
|
|
|
|
|
|
|
|
|
|
|
|
|
|
|
|
| |||||||
| Total Return† |
(1.07)% | 19.35% | 14.71% | 6.23% | 2.72% | 21.70% | ||||||||||||||||||
|
|
|
|
|
|
|
|
|
|
|
|
|
|
|
|
|
|
| |||||||
| Ratios and Supplemental Data |
||||||||||||||||||||||||
| Net Assets, End of Year/Period (Thousands) |
$ | 70,718 | $ | 65,354 | $ | 23,214 | $ | 13,241 | $ | 5,575 | $ | 315 | ||||||||||||
| Ratio of Expenses to Average Net Assets |
0.98%††(3) | 0.98%(3) | 0.98% | 1.01% | 1.08% | 1.08%†† | ||||||||||||||||||
| Ratio of Expenses to Average Net Assets (Excluding Waivers and Recaptured Fees) |
0.98%†† | 0.98% | 1.03% | 1.07% | 1.15% | 1.85%†† | ||||||||||||||||||
| Ratio of Net Investment Income to Average Net Assets |
3.28%†† | 1.17% | 0.65% | 1.57% | 1.06% | 1.53%†† | ||||||||||||||||||
| Portfolio Turnover Rate |
10%‡ | 101% | 93% | 74% | 94% | 45%‡ | ||||||||||||||||||
| * | Per share calculations were performed using average shares for the period. |
| † | Total return is for the period indicated and has not been annualized. Returns shown do not reflect the deductions of taxes that a shareholder would pay on Fund distributions or the redemption of Fund shares. |
| †† | Annualized. |
| ‡ | Portfolio turnover is for the period indicated and has not been annualized. |
| ^ | The amount shown for a share outstanding throughout the period does not accord with the aggregate net losses on investments for the period because of the sales and repurchases of Fund shares in relation to fluctuating market value of the investments of the Fund. |
| (1) | For the period August 1, 2021 to September 30, 2021. Effective September 23, 2021, the Fund changed its fiscal year end to March 31st (see Note 1 in the Notes to Financial Statements). |
| (2) | Commenced operations on December 28, 2016. |
| (3) | Ratio includes previously waived advisory fees recaptured. The net expense ratio would have been lower absent the impact of the recaptured fees. |
| Amounts designated as “—” are either not applicable, $0 or have been rounded to $0. |
The accompanying notes are an integral part of the financial statements.
44
| THE ADVISORS’ INNER CIRCLE FUND III | GQG PARTNERS GLOBAL QUALITY EQUITY FUND |
| FINANCIAL HIGHLIGHTS | ||||||||
| Selected Per Share Data & Ratios For a Share | ||||||||
| Outstanding Throughout the Year or Period | ||||||||
| Investor Shares | ||||||||||||||||
| Period Ended | ||||||||||||||||
| September | ||||||||||||||||
| 30, 2021(1) | Year Ended | Year Ended | Period Ended | |||||||||||||
| (Unaudited) | July 31, 2021 | July 31, 2020 | July 31, 2019(2) | |||||||||||||
| Net Asset Value, Beginning of Year/ Period |
$ | 14.62 | $ | 12.48 | $ | 10.48 | $ | 10.00 | ||||||||
|
|
|
|
|
|
|
|
|
|
|
|
| |||||
| Income from Investment Operations: |
||||||||||||||||
| Net Investment Income* |
0.06 | 0.08 | 0.04 | 0.03 | ||||||||||||
| Net Realized and Unrealized Gain (Loss) |
(0.29 | ) | 2.06 | 1.96 | 0.45 | |||||||||||
|
|
|
|
|
|
|
|
|
|
|
|
| |||||
| Total from Investment Operations |
(0.23 | ) | 2.14 | 2.00 | 0.48 | |||||||||||
|
|
|
|
|
|
|
|
|
|
|
|
| |||||
| Net Asset Value, End of Year/Period |
$ | 14.39 | $ | 14.62 | $ | 12.48 | $ | 10.48 | ||||||||
|
|
|
|
|
|
|
|
|
|
|
|
| |||||
| Total Return† |
(1.57)% | 17.15% | 19.08% | 4.80% | ||||||||||||
|
|
|
|
|
|
|
|
|
|
|
|
| |||||
| Ratios and Supplemental Data |
||||||||||||||||
| Net Assets, End of Year/Period (Thousands) |
$ | 2,163 | $ | 2,017 | $ | 1,252 | $ | 334 | ||||||||
| Ratio of Expenses to Average Net Assets |
0.90%††(3) | 0.90% | 0.90% | 0.90%†† | ||||||||||||
| Ratio of Expenses to Average Net Assets (Excluding Waivers and Recaptured Fees) |
0.90%†† | 0.91% | 1.35% | 3.91%†† | ||||||||||||
| Ratio of Net Investment Income to Average Net Assets |
2.25%†† | 0.62% | 0.33% | 0.74%†† | ||||||||||||
| Portfolio Turnover Rate |
9%‡ | 124% | 123% | 43%‡ | ||||||||||||
| * | Per share calculations were performed using average shares for the period. |
| † | Total return is for the period indicated and has not been annualized. Returns shown do not reflect the deductions of taxes that a shareholder would pay on Fund distributions or the redemption of Fund shares. |
| †† | Annualized. |
| ‡ | Portfolio turnover is for the period indicated and has not been annualized. |
| (1) | For the period August 1, 2021 to September 30, 2021. Effective September 23, 2021, the Fund changed its fiscal year end to March 31st (see Note 1 in the Notes to Financial Statements). |
| (2) | Commenced operations on March 29, 2019. |
| (3) | Ratio includes previously waived advisory fees recaptured. The net expense ratio would have been lower absent the impact of the recaptured fees. |
| Amounts designated as “—” are either not applicable, $0 or have been rounded to $0. |
The accompanying notes are an integral part of the financial statements.
45
| THE ADVISORS’ INNER CIRCLE FUND III |
GQG PARTNERS | |
| GLOBAL QUALITY | ||
| EQUITY FUND |
| FINANCIAL HIGHLIGHTS | ||||||||
| Selected Per Share Data & Ratios For a Share | ||||||||
| Outstanding Throughout the Year or Period | ||||||||
| Institutional Shares | ||||||||||||||||
| Period Ended | ||||||||||||||||
| September | ||||||||||||||||
| 30, 2021(1) | Year Ended | Year Ended | Period Ended | |||||||||||||
| (Unaudited) | July 31, 2021 | July 31, 2020 | July 31, 2019(2) | |||||||||||||
| Net Asset Value, Beginning of Year/ Period |
$ | 14.65 | $ | 12.50 | $ | 10.48 | $ | 10.00 | ||||||||
|
|
|
|
|
|
|
|
|
|
|
|
| |||||
| Income from Investment Operations: |
||||||||||||||||
| Net Investment Income* |
0.06 | 0.12 | 0.05 | 0.03 | ||||||||||||
| Net Realized and Unrealized Gain (Loss) |
(0.29 | ) | 2.04 | 1.97 | 0.45 | |||||||||||
|
|
|
|
|
|
|
|
|
|
|
|
| |||||
| Total from Investment Operations |
(0.23 | ) | 2.16 | 2.02 | 0.48 | |||||||||||
|
|
|
|
|
|
|
|
|
|
|
|
| |||||
| Dividends and Distributions: |
||||||||||||||||
| Net Investment Income |
— | (0.01) | —^ | — | ||||||||||||
|
|
|
|
|
|
|
|
|
|
|
|
| |||||
| Total Dividends and Distributions |
— | (0.01) | — | — | ||||||||||||
|
|
|
|
|
|
|
|
|
|
|
|
| |||||
| Net Asset Value, End of Year/Period |
$ | 14.42 | $ | 14.65 | $ | 12.50 | $ | 10.48 | ||||||||
|
|
|
|
|
|
|
|
|
|
|
|
| |||||
| Total Return† |
(1.57)% | 17.33% | 19.32% | 4.80% | ||||||||||||
|
|
|
|
|
|
|
|
|
|
|
|
| |||||
| Ratios and Supplemental Data |
||||||||||||||||
| Net Assets, End of Year/Period (Thousands) |
$ | 636,107 | $ | 610,670 | $ | 201,026 | $ | 17,439 | ||||||||
| Ratio of Expenses to Average Net Assets |
0.75%††(3) | 0.75% | 0.75% | 0.75%†† | ||||||||||||
| Ratio of Expenses to Average Net Assets (Excluding Waivers and Recaptured Fees) |
0.75%†† | 0.76% | 1.14% | 3.75%†† | ||||||||||||
| Ratio of Net Investment Income to Average Net Assets |
2.37%†† | 0.86% | 0.48% | 0.88%†† | ||||||||||||
| Portfolio Turnover Rate |
9%‡ | 124% | 123% | 43%‡ | ||||||||||||
| * | Per share calculations were performed using average shares for the period. |
| † | Total return is for the period indicated and has not been annualized. Returns shown do not reflect the deductions of taxes that a shareholder would pay on Fund distributions or the redemption of Fund shares. |
| †† | Annualized. |
| ‡ | Portfolio turnover is for the period indicated and has not been annualized. |
| ^ | Amount represents less than $0.005 per share. |
| (1) | For the period August 1, 2021 to September 30, 2021. Effective September 23, 2021, the Fund changed its fiscal year end to March 31st (see Note 1 in the Notes to Financial Statements). |
| (2) | Commenced operations on March 29, 2019. |
| (3) | Ratio includes previously waived advisory fees recaptured. The net expense ratio would have been lower absent the impact of the recaptured fees. |
| Amounts designated as “—” are either not applicable, $0 or have been rounded to $0. |
The accompanying notes are an integral part of the financial statements.
46
| THE ADVISORS’ INNER CIRCLE FUND III | GQG PARTNERS GLOBAL QUALITY EQUITY FUND |
| FINANCIAL HIGHLIGHTS | ||||||||||||||||
| Selected Per Share Data & Ratios For a Share | ||||||||||||||||
| Outstanding Throughout the Year or Period | ||||||||||||||||
| R6 Shares | ||||||||||||||||
| Period Ended | ||||||||||||||||
| September | ||||||||||||||||
| 30, 2021(1) | Year Ended | Year Ended | Period Ended | |||||||||||||
| (Unaudited) | July 31, 2021 | July 31, 2020 | July 31, 2019(2) | |||||||||||||
| Net Asset Value, Beginning of Year/ Period |
$ | 14.64 | $ | 12.50 | $ | 10.48 | $ | 10.00 | ||||||||
|
|
|
|
|
|
|
|
|
|
|
|
| |||||
| Income from Investment Operations: |
||||||||||||||||
| Net Investment Income* |
0.06 | 0.19 | 0.05 | 0.03 | ||||||||||||
| Net Realized and Unrealized Gain (Loss) |
(0.28 | ) | 1.96 | 1.97 | 0.45 | |||||||||||
|
|
|
|
|
|
|
|
|
|
|
|
| |||||
| Total from Investment Operations |
(0.22 | ) | 2.15 | 2.02 | 0.48 | |||||||||||
|
|
|
|
|
|
|
|
|
|
|
|
| |||||
| Dividends and Distributions: |
||||||||||||||||
| Net Investment Income |
— | (0.01 | ) | —^ | — | |||||||||||
|
|
|
|
|
|
|
|
|
|
|
|
| |||||
| Total Dividends and Distributions |
— | (0.01 | ) | — | — | |||||||||||
|
|
|
|
|
|
|
|
|
|
|
|
| |||||
| Net Asset Value, End of Year/Period |
$ | 14.42 | $ | 14.64 | $ | 12.50 | $ | 10.48 | ||||||||
|
|
|
|
|
|
|
|
|
|
|
|
| |||||
| Total Return† |
(1.50)% | 17.25% | 19.32% | 4.80% | ||||||||||||
|
|
|
|
|
|
|
|
|
|
|
|
| |||||
| Ratios and Supplemental Data |
||||||||||||||||
| Net Assets, End of Year/Period (Thousands) |
$ | 48,607 | $ | 52,514 | $ | 313 | $ | 262 | ||||||||
| Ratio of Expenses to Average Net Assets |
0.75%††(3 | ) | 0.75% | 0.75% | 0.75%†† | |||||||||||
| Ratio of Expenses to Average Net Assets (Excluding Waivers and Recaptured Fees) |
0.75%†† | 0.76% | 1.29% | 3.77%†† | ||||||||||||
| Ratio of Net Investment Income to Average Net Assets |
2.33%†† | 1.32% | 0.50% | 0.95%†† | ||||||||||||
| Portfolio Turnover Rate |
9%‡ | 124% | 123% | 43%‡ | ||||||||||||
| * | Per share calculations were performed using average shares for the period. |
| † | Total return is for the period indicated and has not been annualized. Returns shown do not reflect the deductions of taxes that a shareholder would pay on Fund distributions or the redemption of Fund shares. |
| †† | Annualized. |
| ‡ | Portfolio turnover is for the period indicated and has not been annualized. |
| ^ | Amount represents less than $0.005 per share. |
| (1) | For the period August 1, 2021 to September 30, 2021. Effective September 23, 2021, the Fund changed its fiscal year end to March 31st (see Note 1 in the Notes to Financial Statements). |
| (2) | Commenced operations on March 29, 2019. |
| (3) | Ratio includes previously waived advisory fees recaptured. The net expense ratio would have been lower absent the impact of the recaptured fees. |
| Amounts designated as “—” are either not applicable, $0 or have been rounded to $0. |
The accompanying notes are an integral part of the financial statements.
47
| THE ADVISORS’ INNER CIRCLE FUND III | GQG PARTNERS US SELECT QUALITY EQUITY FUND |
| FINANCIAL HIGHLIGHTS | ||||||||||||||||
| Selected Per Share Data & Ratios For a Share | ||||||||||||||||
| Outstanding Throughout the Year or Period | ||||||||||||||||
| Investor Shares | ||||||||||||||||
| Period Ended | ||||||||||||||||
| September | ||||||||||||||||
| 30, 2021(1) | Year Ended | Year Ended | Period Ended | |||||||||||||
| (Unaudited) | July 31, 2021 | July 31, 2020 | July 31, 2019(2) | |||||||||||||
| Net Asset Value, Beginning of Year/ Period |
$ | 16.42 | $ | 13.37 | $ | 10.71 | $ | 10.00 | ||||||||
|
|
|
|
|
|
|
|
|
|
|
|
| |||||
| Income from Investment Operations: |
||||||||||||||||
| Net Investment Income* |
0.02 | 0.09 | 0.05 | 0.07 | ||||||||||||
| Net Realized and Unrealized Gain (Loss) |
(0.45 | ) | 3.05 | 2.68 | 0.65 | |||||||||||
|
|
|
|
|
|
|
|
|
|
|
|
| |||||
| Total from Investment Operations |
(0.43 | ) | 3.14 | 2.73 | 0.72 | |||||||||||
|
|
|
|
|
|
|
|
|
|
|
|
| |||||
| Dividends and Distributions: |
||||||||||||||||
| Net Investment Income |
— | (0.01 | ) | (0.07 | ) | (0.01 | ) | |||||||||
| Capital Gains |
— | (0.08 | ) | — | — | |||||||||||
|
|
|
|
|
|
|
|
|
|
|
|
| |||||
| Total Dividends and Distributions |
— | (0.09 | ) | (0.07 | ) | (0.01 | ) | |||||||||
|
|
|
|
|
|
|
|
|
|
|
|
| |||||
| Net Asset Value, End of Year/Period |
$ | 15.99 | $ | 16.42 | $ | 13.37 | $ | 10.71 | ||||||||
|
|
|
|
|
|
|
|
|
|
|
|
| |||||
| Total Return† |
(2.62)% | 23.57% | 25.62% | 7.20% | ||||||||||||
|
|
|
|
|
|
|
|
|
|
|
|
| |||||
| Ratios and Supplemental Data |
||||||||||||||||
| Net Assets, End of Year/Period (Thousands) |
$ | 2,199 | $ | 2,186 | $ | 1,233 | $ | 377 | ||||||||
| Ratio of Expenses to Average Net Assets |
0.59%††(3 | ) | 0.59% | 0.60% | 0.71%†† | |||||||||||
| Ratio of Expenses to Average Net Assets (Excluding Waivers and Recaptured Fees) |
0.62%†† | 0.63% | 0.94% | 4.18%†† | ||||||||||||
| Ratio of Net Investment Income to Average Net Assets |
0.80%†† | 0.61% | 0.47% | 0.87%†† | ||||||||||||
| Portfolio Turnover Rate |
15%‡ | 143% | 163% | 155%‡ | ||||||||||||
| * | Per share calculations were performed using average shares for the period. |
| † | Total return is for the period indicated and has not been annualized. Returns shown do not reflect the deductions of taxes that a shareholder would pay on Fund distributions or the redemption of Fund shares. |
| †† | Annualized. |
| ‡ | Portfolio turnover is for the period indicated and has not been annualized. |
| (1) | For the period August 1, 2021 to September 30, 2021. Effective September 23, 2021, the Fund changed its fiscal year end to March 31st (see Note 1 in the Notes to Financial Statements). |
| (2) | Commenced operations on September 28, 2018. |
| (3) | Ratio includes previously waived advisory fees recaptured. The net expense ratio would have been lower absent the impact of the recaptured fees. |
| Amounts designated as “—” are either not applicable, $0 or have been rounded to $0. |
The accompanying notes are an integral part of the financial statements.
48
| THE ADVISORS’ INNER CIRCLE FUND III | GQG PARTNERS US SELECT QUALITY EQUITY FUND |
| FINANCIAL HIGHLIGHTS | ||||||||||||||||
| Selected Per Share Data & Ratios For a Share | ||||||||||||||||
| Outstanding Throughout the Year or Period | ||||||||||||||||
| Institutional Shares | ||||||||||||||||
| Period Ended | ||||||||||||||||
| September | ||||||||||||||||
| 30, 2021(1) | Year Ended | Year Ended | Period Ended | |||||||||||||
| (Unaudited) | July 31, 2021 | July 31, 2020 | July 31, 2019(2) | |||||||||||||
| Net Asset Value, Beginning of Year/ Period |
$ | 16.45 | $ | 13.39 | $ | 10.72 | $ | 10.00 | ||||||||
|
|
|
|
|
|
|
|
|
|
|
|
| |||||
| Income from Investment Operations: |
||||||||||||||||
| Net Investment Income* |
0.03 | 0.12 | 0.06 | 0.07 | ||||||||||||
| Net Realized and Unrealized Gain (Loss) |
(0.46 | ) | 3.04 | 2.68 | 0.66 | |||||||||||
|
|
|
|
|
|
|
|
|
|
|
|
| |||||
| Total from Investment Operations |
(0.43 | ) | 3.16 | 2.74 | 0.73 | |||||||||||
|
|
|
|
|
|
|
|
|
|
|
|
| |||||
| Dividends and Distributions: |
||||||||||||||||
| Net Investment Income |
— | (0.02 | ) | (0.07 | ) | (0.01 | ) | |||||||||
| Capital Gains |
— | (0.08 | ) | — | — | |||||||||||
|
|
|
|
|
|
|
|
|
|
|
|
| |||||
| Total Dividends and Distributions |
— | (0.10 | ) | (0.07 | ) | (0.01 | ) | |||||||||
|
|
|
|
|
|
|
|
|
|
|
|
| |||||
| Net Asset Value, End of Year/Period |
$ | 16.02 | $ | 16.45 | $ | 13.39 | $ | 10.72 | ||||||||
|
|
|
|
|
|
|
|
|
|
|
|
| |||||
| Total Return† |
(2.61)% | 23.69% | 25.72% | 7.33% | ||||||||||||
|
|
|
|
|
|
|
|
|
|
|
|
| |||||
| Ratios and Supplemental Data |
||||||||||||||||
| Net Assets, End of Year/Period (Thousands) |
$ | 694,602 | $ | 672,120 | $ | 165,974 | $ | 44,440 | ||||||||
| Ratio of Expenses to Average Net Assets |
0.49%††(3 | ) | 0.49% | 0.54% | 0.59%†† | |||||||||||
| Ratio of Expenses to Average Net Assets (Excluding Waivers and Recaptured Fees) |
0.52%†† | 0.53% | 0.86% | 1.82%†† | ||||||||||||
| Ratio of Net Investment Income to Average Net Assets |
0.90%†† | 0.80% | 0.54% | 0.79%†† | ||||||||||||
| Portfolio Turnover Rate |
15%‡ | 143% | 163% | 155%‡ | ||||||||||||
| * | Per share calculations were performed using average shares for the period. |
| † | Total return is for the period indicated and has not been annualized. Returns shown do not reflect the deductions of taxes that a shareholder would pay on Fund distributions or the redemption of Fund shares. |
| †† | Annualized. |
| ‡ | Portfolio turnover is for the period indicated and has not been annualized. |
| (1) | For the period August 1, 2021 to September 30, 2021. Effective September 23, 2021, the Fund changed its fiscal year end to March 31st (see Note 1 in the Notes to Financial Statements). |
| (2) | Commenced operations on September 28, 2018. |
| (3) | Ratio includes previously waived advisory fees recaptured. The net expense ratio would have been lower absent the impact of the recaptured fees. |
| Amounts designated as “—” are either not applicable, $0 or have been rounded to $0. |
The accompanying notes are an integral part of the financial statements.
49
| THE ADVISORS’ INNER CIRCLE FUND III | GQG PARTNERS US SELECT QUALITY EQUITY FUND |
| FINANCIAL HIGHLIGHTS | ||||||||||||||||
| Selected Per Share Data & Ratios For a Share | ||||||||||||||||
| Outstanding Throughout the Year or Period | ||||||||||||||||
| R6 Shares | ||||||||||||||||
| Period Ended | ||||||||||||||||
| September | ||||||||||||||||
| 30, 2021(1) | Year Ended | Year Ended | Period Ended | |||||||||||||
| (Unaudited) | July 31, 2021 | July 31, 2020 | July 31, 2019(2) | |||||||||||||
| Net Asset Value, Beginning of Year/ Period |
$ | 16.46 | $ | 13.39 | $ | 10.73 | $ | 10.00 | ||||||||
|
|
|
|
|
|
|
|
|
|
|
|
| |||||
| Income from Investment Operations: |
||||||||||||||||
| Net Investment Income* |
0.03 | 0.13 | 0.07 | 0.08 | ||||||||||||
| Net Realized and Unrealized Gain (Loss) |
(0.46 | ) | 3.04 | 2.66 | 0.66 | |||||||||||
|
|
|
|
|
|
|
|
|
|
|
|
| |||||
| Total from Investment Operations |
(0.43 | ) | 3.17 | 2.73 | 0.74 | |||||||||||
|
|
|
|
|
|
|
|
|
|
|
|
| |||||
| Dividends and Distributions: |
||||||||||||||||
| Net Investment Income |
— | (0.02 | ) | (0.07 | ) | (0.01 | ) | |||||||||
| Capital Gains |
— | (0.08 | ) | — | — | |||||||||||
|
|
|
|
|
|
|
|
|
|
|
|
| |||||
| Total Dividends and Distributions |
— | (0.10 | ) | (0.07 | ) | (0.01 | ) | |||||||||
|
|
|
|
|
|
|
|
|
|
|
|
| |||||
| Net Asset Value, End of Year/Period |
$ | 16.03 | $ | 16.46 | $ | 13.39 | $ | 10.73 | ||||||||
|
|
|
|
|
|
|
|
|
|
|
|
| |||||
| Total Return† |
(2.61)% | 23.77% | 25.60% | 7.43% | ||||||||||||
|
|
|
|
|
|
|
|
|
|
|
|
| |||||
| Ratios and Supplemental Data |
||||||||||||||||
| Net Assets, End of Year/Period (Thousands) |
$ | 9,111 | $ | 9,904 | $ | 337 | $ | 268 | ||||||||
| Ratio of Expenses to Average Net Assets |
0.49%††(3 | ) | 0.49% | 0.54% | 0.59%†† | |||||||||||
| Ratio of Expenses to Average Net Assets (Excluding Waivers and Recaptured Fees) |
0.52%†† | 0.53% | 0.93% | 3.76%†† | ||||||||||||
| Ratio of Net Investment Income to Average Net Assets |
0.90%†† | 0.84% | 0.60% | 0.99%†† | ||||||||||||
| Portfolio Turnover Rate |
15%‡ | 143% | 163% | 155%‡ | ||||||||||||
| * | Per share calculations were performed using average shares for the period. |
| † | Total return is for the period indicated and has not been annualized. Returns shown do not reflect the deductions of taxes that a shareholder would pay on Fund distributions or the redemption of Fund shares. |
| †† | Annualized. |
| ‡ | Portfolio turnover is for the period indicated and has not been annualized. |
| (1) | For the period August 1, 2021 to September 30, 2021. Effective September 23, 2021, the Fund changed its fiscal year end to March 31st (see Note 1 in the Notes to Financial Statements). |
| (2) | Commenced operations on September 28, 2018. |
| (3) | Ratio includes previously waived advisory fees recaptured. The net expense ratio would have been lower absent the impact of the recaptured fees. |
| Amounts designated as “—” are either not applicable, $0 or have been rounded to $0. |
The accompanying notes are an integral part of the financial statements.
50
| THE ADVISORS’ INNER CIRCLE FUND III | GQG PARTNERS GLOBAL QUALITY DIVIDEND INCOME FUND |
| FINANCIAL HIGHLIGHTS | ||
| Selected Per Share Data & Ratios For a Share | ||
| Outstanding Throughout the Period | ||
| Investor Shares | ||||
| Period Ended | ||||
| September 30, | ||||
| 2021(1) | ||||
| (Unaudited) | ||||
| Net Asset Value, Beginning of Period |
$ | 10.00 | ||
|
|
|
| ||
| Income from Investment Operations: |
||||
| Net Investment Income* |
0.10 | |||
| Net Realized and Unrealized Loss |
(0.20 | ) | ||
|
|
|
| ||
| Total from Investment Operations |
(0.10 | ) | ||
|
|
|
| ||
| Net Asset Value, End of Period |
$ | 9.90 | ||
|
|
|
| ||
| Total Return† |
(1.00)% | |||
|
|
|
| ||
| Ratios and Supplemental Data |
||||
| Net Assets, End of Period (Thousands) |
$ | 990 | ||
| Ratio of Expenses to Average Net Assets |
0.75%†† | |||
| Ratio of Expenses to Average Net Assets (Excluding Waivers) |
2.95%†† | |||
| Ratio of Net Investment Income to Average Net Assets |
4.14%†† | |||
| Portfolio Turnover Rate |
24%‡ | |||
| * | Per share calculations were performed using average shares for the period. |
| † | Total return is for the period indicated and has not been annualized. Returns shown do not reflect the deductions of taxes that a shareholder would pay on Fund distributions or the redemption of Fund shares. |
| †† | Annualized. |
| ‡ | Portfolio turnover is for the period indicated and has not been annualized. |
| (1) | Commenced operations on June 30, 2021. |
The accompanying notes are an integral part of the financial statements.
51
| THE ADVISORS’ INNER CIRCLE FUND III | GQG PARTNERS GLOBAL QUALITY DIVIDEND INCOME FUND |
| FINANCIAL HIGHLIGHTS |
Selected Per Share Data & Ratios For a Share
Outstanding Throughout the Period
| Institutional Shares | ||||
| Period Ended | ||||
| September 30, | ||||
| 2021(1) | ||||
| (Unaudited) | ||||
| Net Asset Value, Beginning of Period |
$ | 10.00 | ||
|
|
|
| ||
| Income from Investment Operations: |
||||
| Net Investment Income* |
0.11 | |||
| Net Realized and Unrealized Loss |
(0.21) | |||
|
|
|
| ||
| Total from Investment Operations |
(0.10) | |||
|
|
|
| ||
| Net Asset Value, End of Period |
$ | 9.90 | ||
|
|
|
| ||
| Total Return† |
(1.00)% | |||
|
|
|
| ||
| Ratios and Supplemental Data |
||||
| Net Assets, End of Period (Thousands) |
$ | 14,537 | ||
| Ratio of Expenses to Average Net Assets |
0.75%†† | |||
| Ratio of Expenses to Average Net Assets (Excluding Waivers) |
2.95%†† | |||
| Ratio of Net Investment Income to Average Net Assets |
4.53%†† | |||
| Portfolio Turnover Rate |
24%‡ | |||
| * | Per share calculations were performed using average shares for the period. |
| † | Total return is for the period indicated and has not been annualized. Returns shown do not reflect the deductions of taxes that a shareholder would pay on Fund distributions or the redemption of Fund shares. |
| †† | Annualized. |
| ‡ | Portfolio turnover is for the period indicated and has not been annualized. |
| (1) | Commenced operations on June 30, 2021. |
The accompanying notes are an integral part of the financial statements.
52
| THE ADVISORS’ INNER CIRCLE FUND III | GQG PARTNERS INTERNATIONAL QUALITY DIVIDEND INCOME FUND |
| FINANCIAL HIGHLIGHTS |
| Selected Per Share Data & Ratios For a Share | ||
| Outstanding Throughout the Period |
|
Investor Shares |
||||||
| Period Ended | ||||||
| September 30, | ||||||
| 2021(1) | ||||||
| (Unaudited) |
||||||
| Net Asset Value, Beginning of Period |
$ | 10.00 | ||||
|
|
|
| ||||
| Income from Investment Operations: |
||||||
| Net Investment Income* |
0.11 | |||||
| Net Realized and Unrealized Loss |
(0.25) | |||||
|
|
|
| ||||
| Total from Investment Operations |
(0.14) | |||||
|
|
|
| ||||
| Net Asset Value, End of Period |
$ | 9.86 | ||||
|
|
|
| ||||
| Total Return† |
(1.40)% | |||||
|
|
|
| ||||
| Ratios and Supplemental Data |
||||||
| Net Assets, End of Period (Thousands) |
$ | 986 | ||||
| Ratio of Expenses to Average Net Assets |
0.79%†† | |||||
| Ratio of Expenses to Average Net Assets (Excluding Waivers) |
2.96%†† | |||||
| Ratio of Net Investment Income to Average Net Assets |
4.51%†† | |||||
| Portfolio Turnover Rate |
16%‡ | |||||
| * | Per share calculations were performed using average shares for the period. |
| † | Total return is for the period indicated and has not been annualized. Returns shown do not reflect the deductions of taxes that a shareholder would pay on Fund distributions or the redemption of Fund shares. |
| †† | Annualized. |
| ‡ | Portfolio turnover is for the period indicated and has not been annualized. |
| (1) | Commenced operations on June 30, 2021. |
The accompanying notes are an integral part of the financial statements.
53
| THE ADVISORS’ INNER CIRCLE FUND III | GQG PARTNERS INTERNATIONAL QUALITY DIVIDEND INCOME FUND |
| FINANCIAL HIGHLIGHTS |
| Selected Per Share Data & Ratios For a Share | ||
| Outstanding Throughout the Period |
| Institutional Shares |
||||||
| Period Ended | ||||||
| September 30, | ||||||
| 2021(1) | ||||||
| (Unaudited) |
||||||
| Net Asset Value, Beginning of Period |
$ | 10.00 | ||||
|
|
|
| ||||
| Income from Investment Operations: |
||||||
| Net Investment Income* |
0.13 | |||||
| Net Realized and Unrealized Loss |
(0.27) | |||||
|
|
|
| ||||
| Total from Investment Operations |
(0.14) | |||||
|
|
|
| ||||
| Net Asset Value, End of Period |
$ | 9.86 | ||||
|
|
|
| ||||
| Total Return† |
(1.40)% | |||||
|
|
|
| ||||
| Ratios and Supplemental Data |
||||||
| Net Assets, End of Period (Thousands) |
$ | 14,526 | ||||
| Ratio of Expenses to Average Net Assets |
0.79%†† | |||||
| Ratio of Expenses to Average Net Assets (Excluding Waivers) |
2.96%†† | |||||
| Ratio of Net Investment Income to Average Net Assets |
5.17%†† | |||||
| Portfolio Turnover Rate |
16%‡ | |||||
| * | Per share calculations were performed using average shares for the period. |
| † | Total return is for the period indicated and has not been annualized. Returns shown do not reflect the deductions of taxes that a shareholder would pay on Fund distributions or the redemption of Fund shares. |
| †† | Annualized. |
| ‡ | Portfolio turnover is for the period indicated and has not been annualized. |
| (1) | Commenced operations on June 30, 2021. |
The accompanying notes are an integral part of the financial statements.
54
| THE ADVISORS’ INNER CIRCLE FUND III | GQG PARTNERS US QUALITY DIVIDEND INCOME FUND |
| FINANCIAL HIGHLIGHTS |
| Selected Per Share Data & Ratios For a Share | ||
| Outstanding Throughout the Period |
|
Investor Shares |
||||||
| Period Ended | ||||||
| September 30, | ||||||
| 2021(1) | ||||||
| (Unaudited) |
||||||
| Net Asset Value, Beginning of Period |
$ | 10.00 | ||||
|
|
|
| ||||
| Income from Investment Operations: |
||||||
| Net Investment Income* |
0.07 | |||||
| Net Realized and Unrealized Gain |
0.04 | |||||
|
|
|
| ||||
| Total from Investment Operations |
0.11 | |||||
|
|
|
| ||||
| Net Asset Value, End of Period |
$ | 10.11 | ||||
|
|
|
| ||||
| Total Return† |
1.10% | |||||
|
|
|
| ||||
| Ratios and Supplemental Data |
||||||
| Net Assets, End of Period (Thousands) |
$ | 1,011 | ||||
| Ratio of Expenses to Average Net Assets |
0.49%†† | |||||
| Ratio of Expenses to Average Net Assets (Excluding Waivers) |
2.62%†† | |||||
| Ratio of Net Investment Income to Average Net Assets |
2.82%†† | |||||
| Portfolio Turnover Rate |
7%‡ | |||||
| * | Per share calculations were performed using average shares for the period. |
| † | Total return is for the period indicated and has not been annualized. Returns shown do not reflect the deductions of taxes that a shareholder would pay on Fund distributions or the redemption of Fund shares. |
| †† | Annualized. |
| ‡ | Portfolio turnover is for the period indicated and has not been annualized. |
| (1) | Commenced operations on June 30, 2021. |
The accompanying notes are an integral part of the financial statements.
55
| THE ADVISORS’ INNER CIRCLE FUND III | GQG PARTNERS US QUALITY DIVIDEND INCOME FUND |
| FINANCIAL HIGHLIGHTS |
| Selected Per Share Data & Ratios For a Share | ||
| Outstanding Throughout the Period |
|
Institutional Shares |
||||||
| Period Ended | ||||||
| September 30, | ||||||
| 2021(1) | ||||||
| (Unaudited) |
||||||
| Net Asset Value, Beginning of Period |
$ | 10.00 | ||||
|
|
|
| ||||
| Income from Investment Operations: |
||||||
| Net Investment Income* |
0.07 | |||||
| Net Realized and Unrealized Gain |
0.04 | |||||
|
|
|
| ||||
| Total from Investment Operations |
0.11 | |||||
|
|
|
| ||||
| Net Asset Value, End of Period |
$ | 10.11 | ||||
|
|
|
| ||||
| Total Return† |
1.10% | |||||
|
|
|
| ||||
| Ratios and Supplemental Data |
||||||
| Net Assets, End of Period (Thousands) |
$ | 14,736 | ||||
| Ratio of Expenses to Average Net Assets |
0.49%†† | |||||
| Ratio of Expenses to Average Net Assets (Excluding Waivers) |
2.62%†† | |||||
| Ratio of Net Investment Income to Average Net Assets |
2.87%†† | |||||
| Portfolio Turnover Rate |
7%‡ | |||||
| * | Per share calculations were performed using average shares for the period. |
| † | Total return is for the period indicated and has not been annualized. Returns shown do not reflect the deductions of taxes that a shareholder would pay on Fund distributions or the redemption of Fund shares. |
| †† | Annualized. |
| ‡ | Portfolio turnover is for the period indicated and has not been annualized. |
| (1) | Commenced operations on June 30, 2021. |
The accompanying notes are an integral part of the financial statements.
56
| THE ADVISORS’ INNER CIRCLE FUND III |
GQG PARTNERS FUNDS | |
| SEPTEMBER 30, 2021 | ||
| (Unaudited) |
| NOTES TO FINANCIAL STATEMENTS |
1. Organization:
The Advisors’ Inner Circle Fund III (the “Trust”) is organized as a Delaware statutory trust under a Declaration of Trust dated December 4, 2013. The Trust is registered under the Investment Company Act of 1940, as amended, as an open-end management investment company with 47 funds. The financial statements herein are those of the GQG Partners Emerging Markets Equity Fund, GQG Partners Global Quality Equity Fund, GQG Partners US Select Quality Equity Fund, GQG Partners Global Quality Dividend Income Fund, GQG Partners International Quality Dividend Income Fund and GQG Partners US Quality Dividend Income Fund (each a “Fund” and collectively, the “Funds”). The investment objective of GQG Partners Emerging Markets Equity Fund, GQG Partners Global Quality Equity Fund and GQG Partners US Select Quality Equity Fund is to seek long-term capital appreciation. The investment objective of GQG Partners Global Quality Dividend Income Fund, GQG Partners International Quality Dividend Income Fund and GQG Partners US Quality Dividend Income Fund is to seek long-term capital appreciation and dividend income. Each of the Funds is classified as “non-diversified,” which means that it may invest a larger percentage of its assets in a smaller number of issuers than diversified funds. GQG Partners LLC serves as the Funds’ investment adviser (the “Adviser”). The Funds currently offer Investor Shares, Institutional Shares and R6 Shares. The GQG Partners Emerging Markets Equity Fund, GQG Partners US Select Quality Equity Fund, and GQG Partners Global Quality Equity Fund commenced operations on December 28, 2016, September 28, 2018, and March 29, 2019, respectively. The GQG Partners Global Quality Dividend Income Fund, GQG Partners International Quality Dividend Income Fund and GQG Partners US Quality Dividend Income Fund commenced operations on June 30, 2021. The financial statements of the remaining funds of the Trust are presented separately. The assets of each fund are segregated and a shareholder’s interest is limited to the fund in which shares are held. Effective September 23, 2021, the GQG Partners Emerging Markets Equity Fund, GQG Partners Global Quality Equity Fund and GQG Partners US Select Quality Equity Fund changed their fiscal year end to March 31.
2. Significant Accounting Policies:
The following are significant accounting policies, which are consistently followed in the preparation of the financial statements of the Funds. The Funds are investment companies that apply the accounting and reporting guidance issued in Topic 946 by the U.S. Financial Accounting Standards Board (“FASB”).
Use of Estimates — The preparation of financial statements, in conformity with U.S. generally accepted accounting principles (“U.S. GAAP”) requires management to make estimates and assumptions that affect the reported amount of assets and liabilities and disclosure of contingent assets and liabilities at the date of the financial statements and the reported amounts of increases and decreases in net assets from operations during the reporting period. Actual results could differ from those estimates and such differences could be material.
57
| THE ADVISORS’ INNER CIRCLE FUND III | GQG PARTNERS FUNDS SEPTEMBER 30, 2021 (Unaudited) |
Security Valuation — Securities listed on a securities exchange, market or automated quotation system for which quotations are readily available (except for securities traded on NASDAQ), including securities traded over the counter, are valued at the last quoted sale price on an exchange or market (foreign or domestic) on which they are traded or, if there is no such reported sale on the valuation date, at the most recent quoted bid price. For securities traded on NASDAQ, the NASDAQ official closing price will be used. The prices for foreign securities are reported in local currency and converted to U.S. dollars using currency exchange rates. Prices for most securities held in the Funds are provided daily by recognized independent pricing agents. If a security price cannot be obtained from an independent, third-party pricing agent, the Funds seek to obtain a bid price from at least one independent broker.
Securities for which market prices are not “readily available” are valued in accordance with “Fair Value Procedures” established by the Funds’ Board of Trustees (the “Board”). The Funds’ Fair Value Procedures are implemented through a Fair Value Committee (the “Committee”) designated by the Board. Some of the more common reasons that may necessitate that a security be valued using Fair Value Procedures include: the security’s trading has been halted or suspended; the security has been de-listed from a national exchange; the security’s primary trading market is temporarily closed at a time when under normal conditions it would be open; the security has not been traded for an extended period of time; the security’s primary pricing source is not able or willing to provide a price; or trading of the security is subject to local government imposed restrictions. When a security is valued in accordance with the Fair Value Procedures, the Committee will determine the value after taking into consideration relevant information reasonably available to the Committee.
For securities that principally trade on a foreign market or exchange, a significant gap in time can exist between the time of a particular security’s last trade and the time at which the Fund calculates its net asset value. The closing prices of such securities may no longer reflect their market value at the time each Fund calculates its net asset value if an event that could materially affect the value of those securities (a “Significant Event”) has occurred between the time of the security’s last close and the time that the Fund calculates net asset value. A Significant Event may relate to a single issuer or to an entire market sector. If the Adviser of the Funds becomes aware of a Significant Event that has occurred with respect to a security or group of securities after the closing of the exchange or market on which the security or securities principally trade, but before the time at which each Fund calculates its net asset value, it may request that a Committee meeting be called.
The GQG Partners Emerging Markets Equity Fund, GQG Partners Global Quality Equity Fund, GQG Partners Global Quality Dividend Income Fund and the GQG Partners International Quality Dividend Income Fund use Markit Fair Value (“Markit”) as a third party fair valuation vendor. Markit provides a fair value for foreign securities in the Funds’ based on certain factors and methodologies (involving, generally, tracking
58
| THE ADVISORS’ INNER CIRCLE FUND III | GQG PARTNERS FUNDS SEPTEMBER 30, 2021 (Unaudited) |
valuation correlations between the U.S. market and each non-U.S. security) applied by Markit in the event that there is a movement in the U.S. market that exceeds a specific threshold established by the Committee. The Committee establishes a “confidence interval” which is used to determine the level of correlation between the value of a foreign security and movements in the U.S. market before a particular security is fair valued when the threshold is exceeded. In the event that the threshold established by the Committee is exceeded on a specific day, the Fund values its non-U.S. securities that exceed the applicable “confidence interval” based upon the fair values provided by Markit. In such event, it is not necessary to hold a Committee meeting. In the event that the Adviser believes that the fair values provided by Markit are not reliable, the Adviser contacts SEI Investments Global Fund Services (the “Administrator”) and may request that a meeting of the Committee be held.
If a local market in which the Funds own securities is closed for one or more days, the Funds shall value all securities held in that corresponding currency based on the fair value prices provided by Markit using the predetermined confidence interval discussed above.
In accordance with the authoritative guidance on fair value measurements and disclosure under U.S. GAAP, the Funds disclose the fair value of their investments in a hierarchy that prioritizes the inputs to valuation techniques used to measure the fair value. The objective of a fair value measurement is to determine the price that would be received to sell an asset or paid to transfer a liability in an orderly transaction between market participants at the measurement date (an exit price). Accordingly, the fair value hierarchy gives the highest priority to quoted prices (unadjusted) in active markets for identical assets or liabilities (Level 1) and the lowest priority to unobservable inputs (Level 3). The three levels of the fair value hierarchy are described below:
| • | Level 1 — Unadjusted quoted prices in active markets for identical, unrestricted assets or liabilities that the Funds have the ability to access at the measurement date; |
| • | Level 2 — Other significant observable inputs (includes quoted prices for similar securities, interest rates, prepayment speeds, credit risk, referenced indices, quoted prices in inactive markets, adjusted quoted prices in active markets, adjusted quoted prices on foreign equity securities that were adjusted in accordance with pricing procedures approved by the Board, etc.); and |
| • | Level 3 — Prices, inputs or exotic modeling techniques which are both significant to the fair value measurement and unobservable (supported by little or no market activity). |
Investments are classified within the level of the lowest significant input considered in determining fair value. Investments classified within Level 3 whose fair value measurement considers several inputs may include Level 1 or Level 2 inputs as components of the overall fair value measurement.
59
| THE ADVISORS’ INNER CIRCLE FUND III | GQG PARTNERS FUNDS SEPTEMBER 30, 2021 (Unaudited) |
For the period ended September 30, 2021, there have been no significant changes to the Funds’ fair valuation methodology.
Federal Income Taxes — It is each Fund’s intention to qualify as regulated investment companies for Federal income tax purposes by complying with the appropriate provisions of Subchapter M of the Internal Revenue Code of 1986, as amended. Accordingly, no provisions for Federal income taxes have been made in the financial statements.
The Funds evaluate tax positions taken or expected to be taken in the course of preparing the Funds’ tax returns to determine whether it is “more-likely than-not” (i.e., greater than 50-percent) that each tax position will be sustained upon examination by a taxing authority based on the technical merits of the position. Tax positions not deemed to meet the more-likely-than-not threshold are recorded as a tax benefit or expense in the current period. The Funds did not record any tax provision in the current period. However, management’s conclusions regarding tax positions taken may be subject to review and adjustment at a later date based on factors including, but not limited to, examination by tax authorities (i.e., from commencement of operations, as applicable), on-going analysis of and changes to tax laws, regulations and interpretations thereof.
As of and during the period ended September 30, 2021, the Funds did not have a liability for any unrecognized tax benefits. The Funds recognize interest and penalties, if any, related to unrecognized tax benefits as income tax expense in the Statement of Operations. During the year, the Funds did not incur any significant interest or penalties.
Foreign Taxes — The Funds may be subject to taxes imposed by countries in which they invest. Such taxes are generally based on either income or gains earned or repatriated. The Funds accrue and apply such taxes to net investment income, net realized gains and net unrealized gains as income and/or capital gains are earned. The GQG Partners Emerging Markets Equity Fund has accrued foreign tax in the amount of $61,711,015 presented on the Statement of Assets and Liabilities.
Security Transactions and Investment Income — Security transactions are accounted for on trade date. Costs used in determining realized gains and losses on the sale of investment securities are based on the specific identification method. Dividend income and expense are recorded on the ex-dividend date. Interest income is recognized on the accrual basis from settlement date. Certain dividends from foreign securities will be recorded as soon as the Funds are informed of the dividend if such information is obtained subsequent to the ex-dividend date.
Participation Notes (P-Notes) – To the extent consistent with its Investment Objective and Strategies, each Fund may acquire P-Notes issued by participating banks or broker dealers. P-Notes are participation interest notes that are designed to offer a return linked to a particular underlying equity, debt, currency or market. When purchasing a P-Note, the posting of margin is not required because the full cost of the P-Note (plus commission) is paid at the time of purchase. When the P-Note matures, the issuer will
60
| THE ADVISORS’ INNER CIRCLE FUND III | GQG PARTNERS FUNDS SEPTEMBER 30, 2021 (Unaudited) |
pay to, or receive from, the purchaser the difference between the nominal value of the underlying instrument at the time of purchase and that instrument’s value at maturity. Investments in P-Notes involve the same risks associated with a direct investment in the underlying foreign companies of foreign securities markets that they seek to replicate.
In addition, there can be no assurance that the trading price of P-Notes will equal the underlying value of the foreign companies or foreign securities markets that they seek to replicate. The holder of a participation note that is linked to a particular underlying security is entitled to receive any dividends paid in connection with an underlying security or instrument. However, the holder of a participation note does not receive voting rights as it would if it directly owned the underlying security or instrument. P-Notes are generally traded over-the-counter. P-Notes constitute general unsecured contractual obligations of the banks or broker-dealers that issue them and the counterparty. There is also counterparty risk associated with these investments because the Funds are relying on the creditworthiness of such counterparty and has no rights under a participation note against the issuer of the underlying security. In addition, the Funds will incur transaction costs as a result of investments in P-Notes.
Foreign Currency Translation — The books and records of the Funds are maintained in U.S. dollars. Investment securities and other assets and liabilities denominated in a foreign currency are translated into U.S. dollars on the date of valuation. The Funds do not isolate that portion of realized or unrealized gains and losses resulting from changes in the foreign exchange rate from fluctuations arising from changes in the market prices of the securities. These gains and losses are included in net realized and unrealized gains and losses on investments on the Statements of Operations. Net realized and unrealized gains and losses on foreign currency transactions represent net foreign exchange gains or losses from foreign currency exchange contracts, disposition of foreign currencies, currency gains or losses realized between trade and settlement dates on securities transactions and the difference between the amount of the investment income and foreign withholding taxes recorded on the Funds’ books and the U.S. dollar equivalent of the amounts actually received or paid.
Cash—Idle cash may be swept into various time deposit accounts and is classified as cash on the Statements of Assets and Liabilities. The Funds maintain cash in bank deposit accounts which, at times, may exceed United States federally insured limits. Amounts invested are available on the same business day.
Expenses — Most expenses of the Trust can be directly attributed to a particular Fund. Expenses which cannot be directly attributed to a particular Fund are apportioned among the Funds of the Trust based on the number of Funds and/or relative net assets.
Classes—Class specific expenses are borne by that class of shares. Income, realized and unrealized gains (losses), and non-class specific expenses are allocated to the respective class on the basis of relative daily net assets.
61
| THE ADVISORS’ INNER CIRCLE FUND III | GQG PARTNERS FUNDS SEPTEMBER 30, 2021 (Unaudited) |
Dividends and Distributions to Shareholders — The Funds distribute substantially all of their net investment income annually. Any net realized capital gains are distributed annually. All distributions are recorded on ex-dividend date.
Deferred Offering Costs — Offering costs, including costs of printing initial prospectus, legal and registration fees, are amortized over twelve-months from inception of the Funds. As of September 30, 2021, the GQG Partners Global Quality Dividend Income Fund, GQG Partners International Quality Dividend Income Fund and GQG Partners US Quality Dividend Income Fund have $1,711, $1,711 and $1,711 remaining to be amortized as presented on the Statements of Assets and Liabilities.
3. Transactions with Affiliates:
Certain officers of the Trust are also employees of SEI Investments Global Funds Services (the “Administrator”), a wholly owned subsidiary of SEI Investments Company, and/or SEI Investments Distribution Co. (the “Distributor”). Such officers are paid no fees by the Trust, other than the Chief Compliance Officer (“CCO”) as described below, for serving as officers of the Trust.
The services provided by the CCO and his staff are paid for by the Trust as incurred. The services include regulatory oversight of the Trust’s Advisors and service providers as required by SEC regulations. The CCO’s services and fees have been approved by and are reviewed by the Board.
4. Administration, Shareholder Servicing, Custodian and Transfer Agent Agreements:
The Funds and the Administrator are parties to an Administration Agreement under which the Administrator provides administration services to the Funds. For these services, the Administrator is paid an asset based fee, which will vary depending on the number of share classes and the average daily net assets of the Funds. For the period ended September 30, 2021, GQG Partners Emerging Markets Equity Fund, GQG Partners Global Quality Equity Fund, GQG Partners US Select Quality Equity Fund, GQG Partners Global Quality Dividend Income Fund, GQG Partners International Quality Dividend Income Fund and GQG Partners US Quality Dividend Income Fund were charged $485,241, $37,878, $38,522, $16,383, $16,383, $16,383, respectively.
The Funds have adopted a Shareholder Servicing Plan (the “Plan”) that provides that a Fund may pay financial intermediaries for shareholder services in an annual amount not to exceed 0.25% based on the average daily net assets of the Funds’ Investor Shares. The services for which financial intermediaries are compensated may include record-keeping, transaction processing for shareholders’ accounts and other shareholder services.
Brown Brothers Harriman & Co. acts as custodian (the “Custodian”) for the Funds. The Custodian plays no role in determining the investment policies of the Funds or which securities are to be purchased or sold by the Funds.
62
| THE ADVISORS’ INNER CIRCLE FUND III | GQG PARTNERS FUNDS SEPTEMBER 30, 2021 (Unaudited) |
DST Systems, Inc. serves as the transfer agent and dividend disbursing agent for the Funds under a transfer agency agreement with the Trust. The Funds may earn cash management credits which can be used to offset transfer agent expenses. During the period ended September 30, 2021, the GQG Partners Emerging Markets Equity Fund, GQG Partners Global Quality Equity Fund and GQG Partners US Select Quality Equity Fund earned credits of $2,140, $41 and $8. These amounts are listed as “Fees Paid Indirectly” on the Statements of Operations.
5. Investment Advisory Agreement:
Under the terms of an investment advisory agreement, GQG Partners LLC provides investment advisory services to the GQG Partners Emerging Markets Equity Fund, GQG Partners Global Quality Equity Fund, GQG Partners US Select Quality Equity Fund, GQG Partners Global Quality Dividend Income Fund, GQG Partners International Quality Dividend Income Fund and GQG Partners US Quality Dividend Income Fund at a fee calculated at an annual rate of 0.90%, 0.65%, 0.45%, 0.65%, 0.65% and 0.45%, respectively, of the Funds’ respective average daily net assets.
The Adviser has contractually agreed to reduce fees and reimburse expenses to the extent necessary to keep total annual fund operating expenses for the GQG Partners Emerging Markets Equity Fund, GQG Partners Global Quality Equity Fund and GQG Partners US Select Quality Equity Fund after fee reductions and/or expense reimbursements (excluding any class specific expenses, interest, taxes, brokerage commissions, acquired fund fees and expenses and non-routine expenses (collectively, “excluded expenses”)) for Investor Shares, Institutional Shares and R6 Shares from exceeding 98 basis points, 75 basis points and 49 basis points of the Funds’ respective average daily net assets until November 30, 2022 (the “Contractual Expense Limit”). The Adviser may recover all or a portion of its fee reductions or expense reimbursements with respect to a Fund, within a three-year period from the year in which it reduced its fee or reimbursed expenses if the Funds’ total annual fund operating expenses are below the Contractual Expense Limit. This agreement may be terminated with respect to the Fund by the Board for any reason at any time, or by the Adviser, upon ninety (90) days’ prior written notice to the Trust, effective as of the close of business on November 30, 2022.
The Adviser has contractually agreed to reduce fees and reimburse expenses to the extent necessary to keep total annual fund operating expenses for the GQG Partners Global Quality Dividend Income Fund, GQG Partners International Quality Dividend Income Fund and GQG Partners US Quality Dividend Income Fund after fee reductions and/or expense reimbursements (excluding any class specific expenses, interest, taxes, brokerage commissions, acquired fund fees and expenses and non-routine expenses (collectively, “excluded expenses”)) for Investor Shares and Institutional Shares from exceeding 75 basis points, 79 basis points and 49 basis points as set forth below until July 31, 2022 (the “Contractual Expense Limit”). The Adviser may recover all or a portion of its fee reductions or expense reimbursements with respect to a Fund, within a three-year period from the year in which it reduced its fee or reimbursed expenses if the Funds’ total annual fund
63
| THE ADVISORS’ INNER CIRCLE FUND III | GQG PARTNERS FUNDS SEPTEMBER 30, 2021 (Unaudited) |
operating expenses are below the Contractual Expense Limit. This agreement may be terminated with respect to the Fund by the Board for any reason at any time, or by the Adviser, upon ninety (90) days’ prior written notice to the Trust, effective as of the close of business on July 31, 2022.
For the period ended September 30, 2021, the Adviser recaptured previously waived fees of $544,647, $36,736 and $176,735 for the GQG Partners Emerging Markets Equity Fund, GQG Partners Global Quality Equity Fund and GQG Partners US Select Quality Equity Fund, respectively.
As of September 30, 2021, the fees which were previously waived by the Adviser which may be subject to possible future reimbursement are as follows:
| Period | Subject to Repayment until September 30: |
GQG Partners Markets Equity Fund |
GQG Partners Global Quality Equity Fund |
GQG Partners U.S. Select Quality Equity Fund |
GQG Partners Global Quality Income Fund |
GQG Partners Dividend Income Fund |
GQG Partners U.S. Quality Income Fund |
|||||||||||||||||||||
| 2019 |
2022 | $ | 578,724 | $ | 170,955 | $ | 293,277 | $ | N/A | $ | N/A | $ | N/A | |||||||||||||||
| 2020 |
2023 | 1,092,760 | 302,632 | 223,198 | N/A | N/A | N/A | |||||||||||||||||||||
| 2021 |
2024 | 508,262 | 33,111 | 214,438 | 58,199 | 57,180 | 56,871 | |||||||||||||||||||||
| $ | 2,179,746 | $ | 506,698 | $ | 730,913 | $ | 58,199 | $ | 57,180 | $ | 56,871 | |||||||||||||||||
|
|
|
| ||||||||||||||||||||||||||
6. Investment Transactions:
The cost of security purchases and the proceeds from security sales, other than short-term investments, for the period ended September 30, 2021, were as follows:
| GQG Partners Emerging | GQG Partners Global Quality | GQG Partners US Select | ||||||||||
| Markets Equity Fund | Equity Fund | Quality Equity Fund | ||||||||||
|
|
|
|||||||||||
| Purchases |
||||||||||||
| U.S. Government |
$ | — | $ | — | $ | — | ||||||
| Other |
1,189,626,837 | 87,791,823 | 136,475,972 | |||||||||
| Sales |
||||||||||||
| U.S. Government |
$ | — | $ | — | $ | — | ||||||
| Other |
890,819,451 | 58,886,226 | 104,038,298 | |||||||||
| GQG Partners Global Quality | GQG Partners International | GQG Partners U.S. Quality | ||||||||||
| Dividend Income Fund | Quality Dividend Income Fund | Dividend Income Fund | ||||||||||
|
|
|
|||||||||||
| Purchases |
||||||||||||
| U.S. Government |
$ | — | $ | — | $ | — | ||||||
| Other |
17,499,686 | 17,301,220 | 15,912,125 | |||||||||
| Sales |
||||||||||||
| U.S. Government |
$ | — | $ | — | $ | — | ||||||
| Other |
2,601,577 | 1,783,161 | 802,778 | |||||||||
64
| THE ADVISORS’ INNER CIRCLE FUND III | GQG PARTNERS FUNDS SEPTEMBER 30, 2021 (Unaudited) |
7. Share Transactions:
| Period Ended | ||||||||||||
| September | ||||||||||||
| 30, 2021 | Year Ended | Year Ended | ||||||||||
| (Unaudited)(1) | July 31, 2021 | July 31, 2020 | ||||||||||
| GQG Partners Emerging Markets Equity Fund |
||||||||||||
| Investor Shares |
||||||||||||
| Issued |
797,802 | 7,679,415 | 6,365,038 | |||||||||
| Reinvestment of Distributions |
– | 11,302 | 19,373 | |||||||||
| Redeemed |
(1,098,828 | ) | (3,774,112 | ) | (1,829,669 | ) | ||||||
|
|
|
|
|
|
|
|
|
| ||||
| Total Investor Shares Transactions |
(301,026 | ) | 3,916,605 | 4,554,742 | ||||||||
|
|
|
|
|
|
|
|
|
| ||||
| Institutional Shares |
||||||||||||
| Issued |
26,627,598 | 240,505,450 | 196,586,362 | |||||||||
| Reinvestment of Distributions |
– | 633,858 | 1,385,720 | |||||||||
| Redeemed |
(17,458,873 | ) | (52,977,911 | ) | (46,573,982 | ) | ||||||
|
|
|
|
|
|
|
|
|
| ||||
| Total Institutional Shares Transactions |
9,168,725 | 188,161,397 | 151,398,100 | |||||||||
|
|
|
|
|
|
|
|
|
| ||||
| R6 Shares |
||||||||||||
| Issued |
949,917 | 2,871,685 | 698,352 | |||||||||
| Reinvestment of Distributions |
– | 4,027 | 12,604 | |||||||||
| Redeemed |
(603,861 | ) | (749,537 | ) | (160,083 | ) | ||||||
|
|
|
|
|
|
|
|
|
| ||||
| Total R6 Shares Transactions |
346,056 | 2,126,175 | 550,873 | |||||||||
|
|
|
|
|
|
|
|
|
| ||||
| Net Increase in Shares Outstanding From Share Transactions |
9,213,755 | 194,204,177 | 156,503,715 | |||||||||
|
|
|
|
|
|
|
|
|
| ||||
65
| THE ADVISORS’ INNER CIRCLE FUND III | GQG PARTNERS FUNDS SEPTEMBER 30, 2021 (Unaudited) |
| Period Ended | ||||||||||||
| September | ||||||||||||
| 30, 2021 | Year Ended | Year Ended | ||||||||||
| (Unaudited)(1) | July 31, 2021 | July 31, 2020 | ||||||||||
| GQG Partners Global Quality Equity Fund |
||||||||||||
| Investor Shares |
||||||||||||
| Issued |
12,523 | 71,297 | 76,013 | |||||||||
| Redeemed |
(185 | ) | (33,671 | ) | (7,534 | ) | ||||||
|
|
|
|
|
|
|
|
|
| ||||
| Total Investor Shares Transactions |
12,338 | 37,626 | 68,479 | |||||||||
|
|
|
|
|
|
|
|
|
| ||||
| Institutional Shares |
||||||||||||
| Issued |
2,698,038 | 32,321,315 | 15,430,178 | |||||||||
| Reinvestment of Distributions |
– | 30,670 | 2,570 | |||||||||
| Redeemed |
(278,610 | ) | (6,747,619 | ) | (1,013,698 | ) | ||||||
|
|
|
|
|
|
|
|
|
| ||||
| Total Institutional Shares Transactions |
2,419,428 | 25,604,366 | 14,419,050 | |||||||||
|
|
|
|
|
|
|
|
|
| ||||
| R6 Shares |
||||||||||||
| Issued |
– | 3,561,132 | – | |||||||||
| Reinvestment of Distributions |
– | 28 | 8 | |||||||||
| Redeemed |
(214,586 | ) | – | – | ||||||||
|
|
|
|
|
|
|
|
|
| ||||
| Total R6 Shares Transactions |
(214,586 | ) | 3,561,160 | 8 | ||||||||
|
|
|
|
|
|
|
|
|
| ||||
| Net Increase in Shares Outstanding From Share Transactions |
2,217,180 | 29,203,152 | 14,487,537 | |||||||||
|
|
|
|
|
|
|
|
|
| ||||
66
| THE ADVISORS’ INNER CIRCLE FUND III | GQG PARTNERS FUNDS SEPTEMBER 30, 2021 (Unaudited) |
| Period Ended | ||||||||||||
| September | ||||||||||||
| 30, 2021 | Year Ended | Year Ended | ||||||||||
| (Unaudited)(1) | July 31, 2021 | July 31, 2020 | ||||||||||
| GQG Partners US Select Quality Equity Fund) |
||||||||||||
| Investor Shares |
||||||||||||
| Issued |
4,427 | 56,159 | 65,157 | |||||||||
| Reinvestment of Distributions |
– | 680 | 270 | |||||||||
| Redeemed |
(69 | ) | (15,896 | ) | (8,366 | ) | ||||||
|
|
|
|
|
|
|
|
|
| ||||
| Total Investor Shares Transactions |
4,358 | 40,943 | 57,061 | |||||||||
|
|
|
|
|
|
|
|
|
| ||||
| Institutional Shares |
||||||||||||
| Issued |
3,602,096 | 30,888,592 | 8,289,414 | |||||||||
| Reinvestment of Distributions |
– | 230,283 | 27,173 | |||||||||
| Redeemed |
(1,108,845 | ) | (2,658,168 | ) | (65,222 | ) | ||||||
|
|
|
|
|
|
|
|
|
| ||||
| Total Institutional Shares Transactions |
2,493,251 | 28,460,707 | 8,251,365 | |||||||||
|
|
|
|
|
|
|
|
|
| ||||
| R6 Shares |
||||||||||||
| Issued |
746 | 649,754 | – | |||||||||
| Reinvestment of Distributions |
– | 172 | 162 | |||||||||
| Redeemed |
(34,192 | ) | (73,284 | ) | – | |||||||
|
|
|
|
|
|
|
|
|
| ||||
| Total R6 Shares Transactions |
(33,446 | ) | 576,642 | 162 | ||||||||
|
|
|
|
|
|
|
|
|
| ||||
| Net Increase in Shares Outstanding From Share Transactions |
2,464,163 | 29,078,292 | 8,308,588 | |||||||||
|
|
|
|
|
|
|
|
|
| ||||
| Period Ended | ||||||||||||
| September | ||||||||||||
| 30, 2021 | ||||||||||||
| (Unaudited)(2) | ||||||||||||
| GQG Partners Global Quality Dividend Income Fund |
||||||||||||
| Investor Shares |
||||||||||||
| Issued |
100,012 | |||||||||||
| Redeemed |
(1 | ) | ||||||||||
|
|
|
|
||||||||||
| Total Investor Shares Transactions |
100,011 | |||||||||||
|
|
|
|
||||||||||
| Institutional Shares |
||||||||||||
| Issued |
1,468,293 | |||||||||||
| Redeemed |
(1 | ) | ||||||||||
|
|
|
|
||||||||||
| Total Institutional Shares Transactions |
1,468,292 | |||||||||||
|
|
|
|
||||||||||
| Net Increase in Shares Outstanding From Share Transactions |
1,568,303 | |||||||||||
|
|
|
|
||||||||||
67
| THE ADVISORS’ INNER CIRCLE FUND III | GQG PARTNERS FUNDS SEPTEMBER 30, 2021 (Unaudited) |
| Period Ended | ||||
| September | ||||
| 30, 2021 | ||||
| (Unaudited)(2) | ||||
| GQG Partners International Quality Dividend Income Fund |
||||
| Investor Shares |
||||
| Issued |
100,012 | |||
| Redeemed |
(1 | ) | ||
|
|
|
| ||
| Total Investor Shares Transactions |
100,011 | |||
|
|
|
| ||
| Institutional Shares |
||||
| Issued |
1,473,201 | |||
| Redeemed |
(1 | ) | ||
|
|
|
| ||
| Total Institutional Shares Transactions |
1,473,200 | |||
|
|
|
| ||
| Net Increase in Shares Outstanding From Share Transactions |
1,573,211 | |||
|
|
|
| ||
| Period Ended | ||||
| September | ||||
| 30, 2021 | ||||
| (Unaudited)(2) | ||||
| GQG Partners U.S. Quality Dividend Income Fund |
||||
| Investor Shares |
||||
| Issued |
100,012 | |||
| Redeemed |
(1 | ) | ||
|
|
|
| ||
| Total Investor Shares Transactions |
100,011 | |||
|
|
|
| ||
| Institutional Shares |
||||
| Issued |
1,457,724 | |||
| Redeemed |
(1 | ) | ||
|
|
|
| ||
| Total Institutional Shares Transactions |
1,457,723 | |||
|
|
|
| ||
| Net Increase in Shares Outstanding From Share Transactions |
1,557,734 | |||
|
|
|
| ||
(1) For the period August 1, 2021 to September 30, 2021. Effective September 23, 2021, the Fund changed its fiscal year end to March 31st (see Note 1 in the Notes to Financial Statements).
(2) Commenced operations on June 30, 2021.
68
| THE ADVISORS’ INNER CIRCLE FUND III | GQG PARTNERS FUNDS SEPTEMBER 30, 2021 (Unaudited) |
8. Federal Tax Information:
The amount and character of income and capital gain distributions to be paid, if any, are determined in accordance with Federal income tax regulations, which may differ from U.S. GAAP. As a result, net investment income (loss) and net realized gain (loss) on investment transactions for a reporting period may differ significantly from distributions during such period. These book/tax differences may be temporary or permanent. To the extent these differences are permanent in nature, they are charged or credited to distributable earnings or paid-in capital, as appropriate, in the period that the differences arise.
The tax character of dividends and distributions paid during the fiscal year ended July 31, 2021 and July 31, 2020 were as follows:
| Ordinary Income |
Long-Term Capital Gain |
Return of Capital |
Total | |||||||||||||
| GQG Partners Emerging Markets Equity Fund |
|
|||||||||||||||
| 2021 |
$ | 15,044,817 | $ | — | $ | — | $ | 15,044,817 | ||||||||
| 2020 |
25,168,190 | — | — | 25,168,190 | ||||||||||||
| GQG Partners US Select Quality Equity Fund |
|
|||||||||||||||
| 2021 |
$ | 3,108,808 | $ | 409,162 | $ | — | $ | 3,517,970 | ||||||||
| 2020 |
319,385 | — | — | 319,385 | ||||||||||||
| GQG Partners Global Quality Equity Fund |
|
|||||||||||||||
| 2021 |
$ | 397,815 | $ | — | $ | — | $ | 397,815 | ||||||||
| 2020 |
29,082 | — | — | 29,082 | ||||||||||||
As of July 31, 2021, the components of Distributable Earnings on a tax basis were as follows:
GQG Partners Emerging Markets Equity Fund
| Undistributed Ordinary Income |
$ | 47,556,730 | ||
| Undistributed Long-Term Capital Gains |
129,548,986 | |||
| Unrealized Appreciation |
1,323,635,017 | |||
| Other Temporary Differences |
(1 | ) | ||
|
|
|
| ||
| Total Distributable Earnings |
$ | 1,500,740,732 | ||
|
|
|
|
GQG Partners US Select Quality Equity Fund
| Undistributed Ordinary Income |
$ | 4,045,488 | ||
| Undistributed Long-Term Capital Gains |
5,947,365 | |||
| Unrealized Appreciation |
126,670,424 | |||
| Other Temporary Differences |
(3 | ) | ||
|
|
|
| ||
| Total Distributable Earnings |
$ | 136,663,274 | ||
|
|
|
|
69
| THE ADVISORS’ INNER CIRCLE FUND III | GQG PARTNERS FUNDS SEPTEMBER 30, 2021 (Unaudited) |
GQG Partners Global Quality Equity Fund
| Undistributed Ordinary Income |
$ | 3,144,020 | ||
| Capital Loss Carryforwards |
(1,875,578 | ) | ||
| Unrealized Appreciation |
92,939,491 | |||
| Other Temporary Differences |
(4 | ) | ||
|
|
|
| ||
| Total Distributable Earnings |
$ | 94,207,929 | ||
|
|
|
|
During the year ended July 31, 2021 the funds listed below utilized capital loss carryforwards to offset capital gains:
| GQG Partners Emerging Markets Equity Fund |
$ | 141,713,067 | ||
| GQG Partners Global Quality Equity Fund |
2,628,310 |
Losses carried forward are as follows:
| Short-Term Loss | Long-Term Loss | Total | ||||||||||
| GQG Partners Emerging Markets Equity Fund |
$ | — | $ | — | $ | — | ||||||
| GQG Partners US Select Quality Equity Fund |
— | — | — | |||||||||
| GQG Partners Global Quality Equity Fund |
1,875,578 | — | 1,875,578 | |||||||||
For Federal income tax purposes the difference between Federal tax cost and book cost primarily relates to wash sales which cannot be used for Federal income tax purposes in the current year and have been deferred for use in future years and passive foreign investment companies. The Federal tax cost and aggregate gross unrealized appreciation and depreciation for the investments (including foreign currency and derivatives, if applicable) held by the Funds at September 30, 2021, were as follows:
70
| THE ADVISORS’ INNER CIRCLE FUND III | GQG PARTNERS FUNDS SEPTEMBER 30, 2021 (Unaudited) |
| Federal Tax Cost | Aggregate Gross Unrealized Appreciation |
Aggregate Gross Unrealized Depreciation |
Net Unrealized Appreciation (Depreciation) |
|||||||||||||
| GQG Partners Emerging Markets Equity Fund | $ | 7,075,696,991 | $ | 1,562,845,595 | $ | (206,919,813) | $ | 1,355,925,782 | ||||||||
| GQG Partners Global Quality Equity Fund | 574,507,131 | 94,970,767 | (8,153,840) | 86,816,927 | ||||||||||||
| GQG Partners US Select Quality Equity Fund | 569,247,573 | 116,374,146 | (3,134,982) | 113,239,164 | ||||||||||||
| GQG Partners Global Quality Dividend Income Fund | 14,804,580 | 454,892 | (451,057) | 3,835 | ||||||||||||
| GQG Partners International Quality Dividend Income Fund | 15,382,211 | 387,549 | (417,940) | (30,391) | ||||||||||||
| GQG Partners U.S. Quality Dividend Income Fund | 15,097,358 | 428,134 | (295,737) | 132,397 | ||||||||||||
9. Concentration of Risks:
As with all mutual funds, there is no guarantee that a Fund will achieve its investment objective. You could lose money by investing in a Fund. A Fund share is not a bank deposit and it is not insured or guaranteed by the FDIC or any government agency. The principal risk factors affecting shareholders’ investments in the Fund are set forth below.
Active Management Risk (All Funds) – The Funds are subject to the risk that the Adviser’s judgments about the attractiveness, value, or potential appreciation of the Funds’ investments may prove to be incorrect. If the investments selected and strategies employed by a Fund fail to produce the intended results, the Fund could underperform in comparison to other funds with similar objectives and investment strategies.
Depositary Receipts Risk (All Funds) – ADRs are typically trust receipts issued by a U.S. bank or trust company that evidence an indirect interest in underlying securities issued by a foreign entity. GDRs, EDRs, and other types of depositary receipts are typically issued by non-U.S. banks or financial institutions to evidence an interest in underlying securities issued by either a U.S. or a non-U.S. entity. Investments in non-U.S. issuers through ADRs, GDRs, EDRs, and other types of depositary receipts generally involve risks applicable to other types of investments in non-U.S. issuers. Investments in depositary receipts may be less liquid and more volatile than the underlying securities in their primary trading market. If a depositary receipt is denominated in a different currency than its underlying securities, a Fund will be subject to the currency risk of both the investment in the depositary receipt and the underlying security. The values of depositary receipts may decline for a number of reasons relating to the issuers or sponsors of the depositary receipts, including, but not limited to, insolvency of the issuer or sponsor. Holders of depositary receipts may have limited or no rights to take action with respect to the underlying securities or to compel the issuer of the receipts to take action. The prices of depositary receipts may differ from the prices of securities upon which they are based.
71
| THE ADVISORS’ INNER CIRCLE FUND III | GQG PARTNERS FUNDS SEPTEMBER 30, 2021 (Unaudited) |
The Funds may invest in unsponsored depositary receipts, which are issued by one or more depositaries without a formal agreement with the company that issues the underlying securities. Holders of unsponsored depositary receipts generally bear all the costs thereof, and the depositaries of unsponsored depositary receipts frequently are under no obligation to distribute shareholder communications received from the issuers of the underlying securities or to pass through voting rights with respect to the underlying securities. In addition, the issuers of the securities underlying unsponsored depositary receipts are not obligated to disclose material information to the market and, therefore, there may be less information available regarding such issuers and there may not be a correlation between such information and the market value of the depositary receipts.
Equity Risk (All Funds) – Equity securities include common and preferred stocks, depositary receipts, and P-Notes. Common stock represents an equity or ownership interest in an issuer. Preferred stock provides a fixed dividend that is paid before any dividends are paid to common stockholders, and which takes precedence over common stock in the event of a liquidation. Like common stock, preferred stocks represent partial ownership in a company, although preferred stock shareholders do not enjoy the voting rights of common stockholders. Also, unlike common stock, a preferred stock pays a fixed dividend that does not fluctuate, although the company does not have to pay this dividend if it lacks the financial ability to do so. Depositary receipts are described above and P-Notes are described below. Investments in equity securities in general are subject to market risks that may cause their prices to fluctuate over time. Fluctuations in the value of equity securities in which a mutual fund invests will cause the fund’s net asset value (“NAV”) to fluctuate. An investment in a portfolio of equity securities may be more suitable for long-term investors who can bear the risk of these share price fluctuations.
ETF Risk (GQG Partners Global Quality Equity Fund, GQG Partners Global Quality Dividend Income Fund, GQG Partners International Quality Dividend Income Fund and GQG Partners US Quality Dividend Income Fund) – ETFs are pooled investment vehicles, such as registered investment companies and grantor trusts, whose shares are listed and traded on U.S. and non-U.S. stock exchanges or otherwise traded in the over-the-counter market. To the extent that the Fund invests in ETFs, the Fund will be subject to substantially the same risks as those associated with the direct ownership of the securities comprising the index on which an index ETF is based or the other holdings of an ETF, and the value of the Fund’s investment will fluctuate in response to the performance of the underlying index or holdings. ETFs typically incur fees that are separate from those of the Fund. Accordingly, the Fund’s investments in ETFs will result in the layering of expenses such that shareholders will indirectly bear a proportionate share of the ETFs’ operating expenses, in addition to paying Fund expenses. Because the value of ETF shares depends on the demand in the market, shares may trade at a discount or premium to their NAV and the Adviser may not be able to liquidate the Fund’s holdings at the most optimal time, which could adversely affect the Fund’s performance.
72
| THE ADVISORS’ INNER CIRCLE FUND III | GQG PARTNERS FUNDS SEPTEMBER 30, 2021 (Unaudited) |
Dividend-Paying Investments Risk (GQG Partners Global Quality Dividend Income Fund, GQG Partners International Quality Dividend Income Fund and GQG Partners US Quality Dividend Income Fund) - The Fund’s investments in dividend-paying securities could cause the Fund to underperform other funds. Securities that pay dividends, as a group, can fall out of favor with the market, causing such securities to underperform securities that do not pay dividends. Depending upon market conditions and political and legislative responses to such conditions, dividend-paying securities that meet the Fund’s investment criteria may not be widely available and/or may be highly concentrated in only a few market sectors. In addition, issuers that have paid regular dividends or distributions to shareholders may not continue to do so at the same level or at all in the future.
Foreign Company Risk (All Funds) – Investing in foreign companies, including direct investments and investments through depositary receipts and P-Notes, poses additional risks since political and economic events unique to a country or region will affect those markets and their issuers. These risks will not necessarily affect the U.S. economy or similar issuers located in the U.S. Securities of foreign companies may not be registered with the U.S. Securities and Exchange Commission (the “SEC”) and foreign companies are generally not subject to the regulatory controls imposed on U.S. issuers and, as a consequence, there is generally less publicly available information about foreign securities than is available about domestic securities. Income from foreign securities owned by the Fund may be reduced by a withholding tax at the source, which tax would reduce income received from the securities comprising the Fund’s portfolio. Foreign securities may also be more difficult to value than securities of U.S. issuers. While depositary receipts provide an alternative to directly purchasing the underlying foreign securities in their respective national markets and currencies, investments in depositary receipts continue to be subject to many of the risks associated with investing directly in foreign securities.
Foreign Currency Risk (All Funds) – Because non-U.S. securities are usually denominated in currencies other than the dollar, the value of a Fund’s portfolio may be influenced by currency exchange rates and exchange control regulations. The currencies of emerging market countries may experience significant declines against the U.S. dollar, and devaluation may occur subsequent to investments in these currencies by a Fund. Inflation and rapid fluctuations in inflation rates have had, and may continue to have, negative effects on the economies and securities markets of certain emerging market countries.
Foreign Securities/Emerging Markets Risk (All Funds) – Investments in securities of foreign companies (including direct investments as well as investments through depositary receipts or P-Notes) can be more volatile than investments in U.S. companies. Diplomatic, political, or economic developments, including nationalization or appropriation, could affect investments in foreign companies. Foreign securities markets generally have less trading volume and less liquidity than U.S. markets. In addition, the value of securities denominated in foreign currencies, and of dividends from such securities, can change significantly when foreign currencies strengthen or weaken relative to the U.S. dollar. Financial statements of foreign issuers are governed by different accounting, auditing, and financial reporting
73
| THE ADVISORS’ INNER CIRCLE FUND III | GQG PARTNERS FUNDS SEPTEMBER 30, 2021 (Unaudited) |
standards than the financial statements of U.S. issuers and may be less transparent and uniform than in the United States. Thus, there may be less information publicly available about foreign issuers than about most U.S. issuers. Transaction costs are generally higher than those in the United States and expenses for custodial arrangements of foreign securities may be somewhat greater than typical expenses for custodial arrangements of similar U.S. securities. Some foreign governments levy withholding taxes against dividend and interest income. Although in some countries a portion of these taxes are recoverable, the non-recovered portion will reduce the income received from the securities comprising a Fund’s portfolio. These risks may be heightened with respect to emerging market countries since political turmoil and rapid changes in economic conditions are more likely to occur in these countries.
Geographic Focus Risk (All Funds) – To the extent that it focuses its investments in a particular country or geographic region, a Fund may be more susceptible to economic, political, regulatory or other events or conditions affecting issuers and countries within that country or geographic region. As a result, the Fund may be subject to greater price volatility and risk of loss than a fund holding more geographically diverse investments.
Investing in the United States Risk (All Funds) – A decrease in imports or exports, changes in trade regulations and/or an economic recession in the U.S. may have a material adverse effect on the U.S. economy and the securities listed on U.S. exchanges. Proposed and adopted policy and legislative changes in the U.S. are changing many aspects of financial and other regulation and may have a significant effect on the U.S. markets generally, as well as on the value of certain securities. In addition, a continued rise in the U.S. public debt level or U.S. austerity measures may adversely affect U.S. economic growth and the securities in which the Fund invests.
Investment Style Risk (All Funds) – Each Fund pursues a “growth style” of investing, meaning that the Fund invests in equity securities of companies that the Adviser believes will have above-average rates of relative earnings growth and which, therefore, may experience above-average increases in stock prices. Over time, a relative growth investing style may go in and out of favor, causing a Fund to sometimes underperform other equity funds that use differing investing styles.
IPO Risk (All Funds) – The Funds may invest in IPOs. An IPO is a company’s first offering of stock to the public. IPO risk is the risk that the market value of IPO shares will fluctuate considerably due to factors such as the absence of a prior public market, unseasoned trading, the small number of shares available for trading and limited information about a company’s business model, quality of management, earnings growth potential and other criteria used to evaluate its investment prospects. Accordingly, investments in IPO shares involve greater risks than investments in shares of companies that have traded publicly on an exchange for extended periods of time. Investments in IPO shares may also involve high transaction costs, and are subject to market risk and liquidity risk, which are described below.
74
| THE ADVISORS’ INNER CIRCLE FUND III | GQG PARTNERS FUNDS SEPTEMBER 30, 2021 (Unaudited) |
When a Fund’s asset base is small, a significant portion of the Fund’s performance could be attributable to investments in IPOs, because such investments would have a magnified impact on the Fund. As the Fund’s assets grow, the effect of the Fund’s investments in IPOs on the Fund’s performance probably will decline, which could reduce the Fund’s performance. Because of the price volatility of IPO shares, a Fund may choose to hold IPO shares for a very short period of time. This may increase the turnover of the Fund’s portfolio and may lead to increased expenses to the Fund, such as commissions and transaction costs. By selling IPO shares, a Fund may realize taxable gains it will subsequently distribute to shareholders. In addition, the market for IPO shares can be speculative and/or inactive for extended periods of time. There is no assurance that a Fund will be able to obtain allocable portions of IPO shares. The limited number of shares available for trading in some IPOs may make it more difficult for a Fund to buy or sell significant amounts of shares without an unfavorable impact on prevailing prices. Investors in IPO shares can be affected by substantial dilution in the value of their shares, by sales of additional shares and by concentration of control in existing management and principal shareholders.
Large Capitalization Company Risk (All Funds) – The large capitalization companies in which a Fund may invest may lag the performance of smaller capitalization companies because large capitalization companies may experience slower rates of growth than smaller capitalization companies and may not respond as quickly to market changes and opportunities.
Large Purchase and Redemption Risk (All Funds) – Large purchases or redemptions of a Fund’s shares may affect the Fund, since the Fund may be required to sell portfolio securities if it experiences redemptions, and the Fund will need to invest additional cash that it receives. While it is impossible to predict the overall impact of these transactions over time, there could be adverse effects on portfolio management to the extent that a Fund may be required to sell securities or invest cash at times when it would not otherwise do so. These transactions could also have tax consequences if sales of securities result in gains, and could also increase transaction costs or portfolio turnover. In addition, a large redemption could result in a Fund’s expenses being allocated over a smaller asset base, leading to an increase in the Fund’s expense ratio.
Liquidity Risk (All Funds) – Certain securities may be difficult or impossible to sell at the time and the price that a Fund would like. A Fund may have to accept a lower price to sell a security, sell other securities to raise cash, or give up an investment opportunity, any of which could have a negative effect on Fund management or performance.
Market Risk (All Funds) – The value of the securities in which the Funds invest may go up or down in response to the prospects of individual companies, particular sectors or governments and/or general economic conditions throughout the world. Price changes may be temporary or last for extended periods. Global economies and financial markets are becoming increasingly interconnected, and conditions and events in one country, region or financial market may adversely impact issuers in a different country, region or financial market. In addition, governmental and quasi-governmental organizations have taken a number of unprecedented actions designed to support the markets. Such
75
| THE ADVISORS’ INNER CIRCLE FUND III | GQG PARTNERS FUNDS SEPTEMBER 30, 2021 (Unaudited) |
conditions, events and actions may result in greater market risk. In addition, the impact of any epidemic, pandemic or natural disaster, or widespread fear that such events may occur, could negatively affect the global economy, as well as the economies of individual countries, the financial performance of individual companies and sectors, and the markets in general in significant and unforeseen ways. Any such impact could adversely affect the prices and liquidity of the securities and other instruments in which the Fund invests, which in turn could negatively impact the Fund’s performance and cause losses on your investment in the Fund.
New Fund Risk (GQG Partners Global Quality Dividend Income Fund, GQG Partners International Quality Dividend Income Fund and GQG Partners US Quality Dividend Income Fund) – Because the Fund is new, investors in the Fund bear the risk that the Fund may not be successful in implementing its investment strategy, may not employ a successful investment strategy, or may fail to attract sufficient assets under management to realize economies of scale, any of which could result in the Fund being liquidated at any time without shareholder approval and at a time that may not be favorable for all shareholders. Such liquidation could have negative tax consequences for shareholders and will cause shareholders to incur expenses of liquidation.
Non-Diversification Risk (All Funds) – Each Fund is classified as “non-diversified,” which means it may invest a larger percentage of its assets in a smaller number of issuers than a diversified fund. To the extent that a Fund invests its assets in a smaller number of issuers, the Fund will be more susceptible to negative events affecting those issuers than a diversified fund.
Participation Notes Risk (GQG Partners Emerging Markets Equity Fund, GQG Partners Global Quality Equity Fund, GQG Partners Global Quality Dividend Income Fund and GQG Partners International Quality Dividend Income Fund) – P-Notes are generally traded over-the-counter and constitute general unsecured contractual obligations of the banks and broker-dealers that issue them. Generally, these banks and broker-dealers buy securities listed on certain foreign exchanges and then issue P-Notes which are designed to replicate the performance of certain issuers and markets. The performance results of P-Notes will not correlate exactly to the performance of the issuers or markets that they seek to replicate due to transaction costs and other expenses. The holder of a P-Note typically does not receive voting or other rights as it would if it directly owned the underlying security, but is subject to the same risks of investing directly in the underlying security.
Proprietary Model Risk (GQG Partners Global Quality Dividend Income Fund, GQG Partners international Quality Dividend Income Fund and GQG Partners US Quality Dividend Income Fund) - Proprietary models that may be used to evaluate securities or securities markets are based on certain assumptions concerning the interplay of market factors and may not adequately take into account certain factors and may result in the Fund having a lower return than if the Fund were managed using another model or investment strategy. The markets or prices of individual securities may be affected by factors not foreseen in developing the models.
76
| THE ADVISORS’ INNER CIRCLE FUND III | GQG PARTNERS FUNDS SEPTEMBER 30, 2021 (Unaudited) |
Small- and Mid-Capitalization Company Risk (All Funds) – The small- and mid-capitalization companies in which a Fund may invest may be more vulnerable to adverse business or economic events than larger, more established companies. In particular, investments in these small- and mid-sized companies may pose additional risks, including liquidity risk, because these companies tend to have limited product lines, markets and financial resources, and may depend upon a relatively small management group. Therefore, small-and mid-cap stocks may be more volatile than those of larger companies. These securities may be traded over-the-counter or listed on an exchange.
Stock Connect Investing Risk (GQG Partners Emerging Markets Equity Fund, GQG Partners Global Quality Equity Fund, GQG Partners Global Quality Dividend Income Fund and GQG Partners International Quality Dividend Income Fund) – Trading through Stock Connect is subject to a number of restrictions that may affect a Fund’s investments and returns, including a daily quota that limits the maximum net purchases under Stock Connect each day. In addition, investments made through Stock Connect are subject to relatively untested trading, clearance and settlement procedures. Moreover, A Shares purchased through Stock Connect generally may only be sold or otherwise transferred through Stock Connect. A Fund’s investments in A Shares purchased through Stock Connect are generally subject to Chinese securities regulations and listing rules. While overseas investors currently are exempt from paying capital gains or value added taxes on income and gains from investments in A Shares purchased through Stock Connect, these tax rules could be changed, which could result in unexpected tax liabilities for the Fund.
Stock Connect operates only on days when both the China and Hong Kong markets are open for trading and when banks in both markets are open on the corresponding settlement days. Therefore, a Fund may be subject to the risk of price fluctuations of A Shares during the time when Stock Connect is not trading. Because of the way in which A shares are held in Stock Connect, a Fund may not be able to exercise the rights of a shareholder and may be limited in its ability to pursue claims against the issuer of a security, and may suffer losses in the event the depository of the Shanghai Stock Exchange or Shenzhen Stock Exchange becomes insolvent. Stock Connect is a relatively new program. Further developments are likely and there can be no assurance as to the program’s continued existence or whether future developments regarding the program may restrict or adversely affect a Fund’s investments or returns. In addition, the application and interpretation of the laws and regulations of Hong Kong and China, and the rules, policies or guidelines published or applied by relevant regulators and exchanges in respect of Stock Connect are uncertain, and they may have a detrimental effect on the Fund’s investments and returns.
U.S. Treasury Securities Risk (GQG Partners US Select Quality Equity Fund, GQG Partners Global Quality Equity Fund, GQG Partners Global Quality Dividend Income Fund, GQG Partners International Quality Dividend Income Fund and GQG Partners US Quality Dividend Income Fund) – A security backed by the U.S. Treasury or the full faith and credit of the United States is guaranteed only as to the timely payment of interest and principal when
77
| THE ADVISORS’ INNER CIRCLE FUND III | GQG PARTNERS FUNDS SEPTEMBER 30, 2021 (Unaudited) |
held to maturity, but the market prices for such securities are not guaranteed and will fluctuate.
10. Other:
At September 30, 2021, the percentage of total shares outstanding held by shareholders for the Fund, which are comprised of individual shareholders and omnibus accounts that are held on behalf of various individual shareholders, each owning 10% or greater of the aggregate shares outstanding, were as follows:
| GQG Partners Emerging Markets Equity Fund | No. of Shareholders |
% Ownership | ||
| Investor Shares |
3 | 77% | ||
| Institutional Shares |
2 | 38% | ||
| R6 Shares |
3 | 65% | ||
| GQG Partners Global Quality Equity Fund |
No. of Shareholders |
% Ownership | ||
| Investor Shares |
2 | 71% | ||
| Institutional Shares |
3 | 72% | ||
| R6 Shares |
1 | 99% | ||
| GQG Partners US Select Quality Equity Fund |
No. of Shareholders |
% Ownership | ||
| Investor Shares |
3 | 97% | ||
| Institutional Shares |
3 | 75% | ||
| R6 Shares |
1 | 96% | ||
| GQG Partners Global Quality Dividend Income Fund | No. of Shareholders |
% Ownership | ||
| Investor Shares |
1 | 100% | ||
| Institutional Shares |
2 | 100% | ||
| GQG Partners International Quality Dividend Income Fund | No. of Shareholders |
% Ownership | ||
| Investor Shares |
1 | 100% | ||
| Institutional Shares |
2 | 100% | ||
| GQG Partners U.S. Quality Dividend Income Fund | No. of Shareholders |
% Ownership | ||
| Investor Shares |
1 | 100% | ||
| Institutional Shares |
2 | 100% | ||
In the normal course of business, the Funds enter into contracts that provide general indemnifications. The Funds’ maximum exposure under these arrangements is dependent on future claims that may be made against the Funds and, therefore, cannot be established; however, based on experience, the risk of loss from such claim is considered remote.
78
| THE ADVISORS’ INNER CIRCLE FUND III | GQG PARTNERS FUNDS SEPTEMBER 30, 2021 (Unaudited) |
11. Subsequent Events:
On September 7, 2021, Brown Brothers Harriman & Co. (“BBH”), the Funds’ custodian, announced that it had entered into an agreement with State Street Bank and Trust Company (“State Street”) to sell BBH’s Investor Services business to State Street (the “Transaction”). The Transaction is subject to certain closing conditions, including regulatory and customary approvals, and it is expected to be consummated by the end of calendar year 2021 (the “Closing Date”). Consequently, as a result of the Transaction, it is expected that State Street will replace BBH as the Funds’ custodian effective as of the Closing Date.
The Funds have evaluated the need for additional disclosures (other than what is disclosed in the preceding paragraph) and/or adjustments resulting from subsequent events through the date the financial statements were issued. Based on this evaluation, no additional disclosures and/or adjustments were required to the financial statements as of September 30, 2021.
79
| THE ADVISORS’ INNER CIRCLE FUND III | GQG PARTNERS FUNDS SEPTEMBER 30, 2021 (Unaudited) |
| DISCLOSURE OF FUND EXPENSES |
All mutual funds have operating expenses. As a shareholder of a mutual fund, your investment is affected by these ongoing costs, which include (among others) costs for Fund management, administrative services, and shareholder reports like this one. It is important for you to understand the impact of these costs on your investment returns.
Operating expenses such as these are deducted from the mutual fund’s gross income and directly reduce your final investment return. These expenses are expressed as a percentage of the mutual fund’s average net assets; this percentage is known as the mutual fund’s expense ratio.
The following examples use the expense ratio and are intended to help you understand the ongoing costs (in dollars) of investing in your Fund and to compare these costs with those of other mutual funds. The examples are based on an investment of $1,000 made at the beginning of the period shown and held for the entire period (April 1, 2021 to September 30, 2021).
The table on the next page illustrates your Fund’s costs in two ways:
• Actual Fund Return. This section helps you to estimate the actual expenses after fee waivers that your Fund incurred over the period. The “Expenses Paid During Period” column shows the actual dollar expense cost incurred by a $1,000 investment in the Fund, and the “Ending Account Value” number is derived from deducting that expense cost from the Fund’s gross investment return.
You can use this information, together with the actual amount you invested in the Fund, to estimate the expenses you paid over that period. Simply divide your ending starting account value by $1,000 to arrive at a ratio (for example, an $8,600 account value divided by $1,000 = 8.6), then multiply that ratio by the number shown for your Fund under “Expenses Paid During Period.”
• Hypothetical 5% Return. This section helps you compare your Fund’s costs with those of other mutual funds. It assumes that the Fund had an annual 5% return before expenses during the year, but that the expense ratio (Column 3) for the period is unchanged. This example is useful in making comparisons because the Securities and Exchange Commission requires all mutual funds to make this 5% calculation. You can assess your Fund’s comparative cost by comparing the hypothetical result for your Fund in the “Expense Paid During Period” column with those that appear in the same charts in the shareholder reports for other mutual funds.
Note: Because the return is set at 5% for comparison purposes — NOT your Fund’s actual return — the account values shown may not apply to your specific investment.
80
| THE ADVISORS’ INNER CIRCLE FUND III | GQG PARTNERS FUNDS SEPTEMBER 30, 2021 (Unaudited) |
GQG Partners Emerging Markets Equity Fund
|
Beginning Account Value 4/1/21 |
Ending Account Value 9/30/21 |
Annualized Expense Ratios |
Expenses Paid During Period* |
|||||||||||||
| Investor Shares |
||||||||||||||||
| Actual Portfolio Return |
$1,000.00 | $989.80 | 1.16% | $5.79 | ||||||||||||
| Hypothetical 5% Return |
1,000.00 | 1,019.25 | 1.16 | 5.87 | ||||||||||||
| Institutional Shares |
||||||||||||||||
| Actual Portfolio Return |
$1,000.00 | $990.40 | 0.98 | $4.89 | ||||||||||||
| Hypothetical 5% Return |
1,000.00 | 1,020.16 | 0.98 | 4.96 | ||||||||||||
| R6 Shares |
||||||||||||||||
| Actual Portfolio Return |
$1,000.00 | $990.40 | 0.98 | $4.89 | ||||||||||||
| Hypothetical 5% Return |
1,000.00 | 1,020.16 | 0.98 | 4.96 | ||||||||||||
| * | Expenses are equal to the Fund’s annualized expense ratio multiplied by the average account value over the period, multiplied by 183/365 (to reflect the one-half year period). |
GQG Partners Global Quality Equity Fund
|
Beginning Account Value 4/1/21 |
Ending Account Value 9/30/21 |
Annualized Expense Ratios |
Expenses Paid During Period* |
|||||||||||||
| Investor Shares |
||||||||||||||||
| Actual Portfolio Return |
$1,000.00 | $1,099.30 | 0.90% | $4.74 | ||||||||||||
| Hypothetical 5% Return |
1,000.00 | 1,020.56 | 0.90 | 4.56 | ||||||||||||
| Institutional Shares |
||||||||||||||||
| Actual Portfolio Return |
$1,000.00 | $1,099.90 | 0.75 | $3.95 | ||||||||||||
| Hypothetical 5% Return |
1,000.00 | 1,021.31 | 0.75 | 3.80 | ||||||||||||
| R6 Shares |
||||||||||||||||
| Actual Portfolio Return |
$1,000.00 | $1,099.90 | 0.75 | $3.95 | ||||||||||||
| Hypothetical 5% Return |
1,000.00 | 1,021.31 | 0.75 | 3.80 | ||||||||||||
| * | Expenses are equal to the Fund’s annualized expense ratio multiplied by the average account value over the period, multiplied by 183/365 (to reflect the one-half year period). |
81
| THE ADVISORS’ INNER CIRCLE FUND III | GQG PARTNERS FUNDS SEPTEMBER 30, 2021 (Unaudited) |
GQG Partners US Select Quality Equity Fund
|
Beginning Account Value 4/1/21 |
Ending Account Value 9/30/21 |
Annualized Expense Ratios |
Expenses Paid During Period* |
|||||||||||||
| Investor Shares |
||||||||||||||||
| Actual Portfolio Return |
$1,000.00 | $1,099.00 | 0.59% | $3.10 | ||||||||||||
| Hypothetical 5% Return |
1,000.00 | 1,022.11 | 0.59 | 2.99 | ||||||||||||
| Institutional Shares |
||||||||||||||||
| Actual Portfolio Return |
$1,000.00 | $1,098.80 | 0.49 | $2.58 | ||||||||||||
| Hypothetical 5% Return |
1,000.00 | 1,022.61 | 0.49 | 2.48 | ||||||||||||
| R6 Shares |
||||||||||||||||
| Actual Portfolio Return |
$1,000.00 | $1,099.50 | 0.59 | $3.11 | ||||||||||||
| Hypothetical 5% Return |
1,000.00 | 1,022.11 | 0.59 | 2.99 | ||||||||||||
| * | Expenses are equal to the Fund’s annualized expense ratio multiplied by the average account value over the period, multiplied by 183/365 (to reflect the one-half year period). |
GQG Partners Global Quality Dividend Income Fund(1)
|
Beginning Account Value 4/1/21 |
Ending Account Value 9/30/21 |
Annualized Expense Ratios |
Expenses Paid During Period |
|||||||||||||
| Investor Shares |
||||||||||||||||
| Actual Portfolio Return |
$1,000.00 | $990.00 | 0.75% | $1.88* | ||||||||||||
| Hypothetical 5% Return |
1,000.00 | 1,021.31 | 0.75 | 3.80** | ||||||||||||
| Institutional Shares |
||||||||||||||||
| Actual Portfolio Return |
$1,000.00 | $990.00 | 0.75 | $1.88* | ||||||||||||
| Hypothetical 5% Return |
1,000.00 | 1,021.31 | 0.75 | 3.80** | ||||||||||||
| * | Expenses are equal to the Fund’s annualized expense ratio multiplied by the average account value over the period, multiplied by 92/365 (to reflect the period since inception to period end). |
| ** | Expenses are equal to the Fund’s annualized expense ratio multiplied by the average account value over the period, multiplied by 183/365 (to reflect the one-half year period shown). |
| (1) | Commenced operations on June 30, 2021. |
82
| THE ADVISORS’ INNER CIRCLE FUND III | GQG PARTNERS FUNDS SEPTEMBER 30, 2021 (Unaudited) |
GQG Partners International Quality Dividend Income Fund(1)
| Beginning | Ending | |||||||||||||||
| Account | Account | |||||||||||||||
| Value | Value | Annualized | Expenses | |||||||||||||
| 4/1/21 | 9/30/21 | Expense Ratios | Paid During Period | |||||||||||||
| Investor Shares |
||||||||||||||||
| Actual Portfolio Return |
$1,000.00 | $986.00 | 0.79% | $1.98* | ||||||||||||
| Hypothetical 5% Return |
1,000.00 | 1,021.11 | 0.79 | 4.00** | ||||||||||||
| Institutional Shares |
||||||||||||||||
| Actual Portfolio Return |
$1,000.00 | $986.00 | 0.79 | $1.98* | ||||||||||||
| Hypothetical 5% Return |
1,000.00 | 1,021.11 | 0.79 | 4.00** | ||||||||||||
| * | Expenses are equal to the Fund’s annualized expense ratio multiplied by the average account value over the period, multiplied by 92/365 (to reflect the period since inception to period end). |
| ** | Expenses are equal to the Fund’s annualized expense ratio multiplied by the average account value over the period, multiplied by 183/365 (to reflect the one-half year period shown). |
| (1) | Commenced operations on June 30, 2021. |
GQG Partners Us Quality Dividend Income Fund(1)
| Beginning | Ending | |||||||||||||||
| Account | Account | |||||||||||||||
| Value | Value | Annualized | Expenses | |||||||||||||
| 4/1/21 | 9/30/21 | Expense Ratios | Paid During Period | |||||||||||||
| Investor Shares |
||||||||||||||||
| Actual Portfolio Return |
$1,000.00 | $1,011.00 | 0.49% | $1.24* | ||||||||||||
| Hypothetical 5% Return |
1,000.00 | 1,022.61 | 0.49 | 2.48** | ||||||||||||
| Institutional Shares |
||||||||||||||||
| Actual Portfolio Return |
$1,000.00 | $1,011.00 | 0.49 | $1.24* | ||||||||||||
| Hypothetical 5% Return |
1,000.00 | 1,022.61 | 0.49 | 2.48** | ||||||||||||
| * | Expenses are equal to the Fund’s annualized expense ratio multiplied by the average account value over the period, multiplied by 92/365 (to reflect the period since inception to period end). |
| ** | Expenses are equal to the Fund’s annualized expense ratio multiplied by the average account value over the period, multiplied by 183/365 (to reflect the one-half year period shown). |
| (1) | Commenced operations on June 30, 2021. |
83
| THE ADVISORS’ INNER CIRCLE FUND III | GQG PARTNERS FUNDS SEPTEMBER 30, 2021 (Unaudited) |
|
|
GQG Partners Global Quality Dividend Income Fund
GQG Partners International Quality Dividend Income Fund
GQG Partners US Quality Dividend Income Fund
Pursuant to Section 15 of the Investment Company Act of 1940 (the “1940 Act”), the Funds’ advisory agreement (the “Agreement”) must be approved: (i) by a vote of a majority of the shareholders of the Fund; and (ii) by the vote of a majority of the members of the Board of Trustees (the “Board” or the “Trustees”) of The Advisors’ Inner Circle Fund III (the “Trust”) who are not parties to the Agreement or “interested persons” of any party thereto, as defined in the 1940 Act (the “Independent Trustees”), cast in person at a meeting called for the purpose of voting on such approval.
A Board meeting was held on June 24, 2021 to decide whether to approve the Agreement for an initial two-year term (the “June Meeting”). The June Meeting was held via videoconference in reliance on relief provided in orders issued by the Securities and Exchange Commission on March 13, 2020, March 25, 2020 and June 19, 2020 from 1940 Act sections and rules requiring that certain votes of a company’s board of trustees be cast in person due to circumstances related to the current or potential effects of the COVID-19 pandemic. In preparation for the June Meeting, the Trustees requested that the Adviser furnish information necessary to evaluate the terms of the Agreement. The Trustees used this information, as well as other information that the Adviser and other service providers of the Funds presented or submitted to the Board at the June Meeting, to help them decide whether to approve the Agreement for an initial two-year term.
Specifically, the Board requested and received written materials from the Adviser and other service providers of the Funds regarding: (i) the nature, extent and quality of the services to be provided by the Adviser; (ii) the Adviser’s investment management personnel; (iii) the Adviser’s operations; (iv) the Funds’ proposed advisory fees to be paid to the Adviser and the Funds’ overall fees and operating expenses compared with peer groups of mutual funds; (v) the Adviser’s compliance program, including a description of any material compliance matters and any material compliance violations; (vi) the Adviser’s policies on and compliance procedures for personal securities transactions; (vii) the Adviser’s investment experience; and (viii) the Adviser’s rationale for introducing the Funds as well as the Funds’ proposed objectives and strategies.
Representatives from the Adviser, along with other Fund service providers, presented additional information and participated in question and answer sessions at the June Meeting to help the Trustees evaluate the Adviser’s services, fees and other aspects of the Agreement. The Independent Trustees received advice from independent counsel and met in executive session outside the presence of Fund management and the Adviser.
84
| THE ADVISORS’ INNER CIRCLE FUND III | GQG PARTNERS FUNDS SEPTEMBER 30, 2021 (Unaudited) |
At the June Meeting, the Trustees, including all of the Independent Trustees, based on their evaluation of the information provided by the Adviser and other service providers of the Funds, approved the Agreement. In considering the approval of the Agreement, the Board considered various factors that they determined were relevant, including: (i) the nature, extent and quality of the services to be provided by the Adviser; and (ii) the fees to be paid to the Adviser, as discussed in further detail below.
Nature, Extent and Quality of Services to be Provided by the Adviser
In considering the nature, extent and quality of the services to be provided by the Adviser, the Board reviewed the portfolio management services to be provided by the Adviser to the Funds, including the quality and continuity of the Adviser’s portfolio management personnel, the resources of the Adviser, and the Adviser’s compliance history and compliance program. The Trustees reviewed the terms of the proposed Agreement. The Trustees also reviewed the Adviser’s proposed investment and risk management approaches for the Funds. The response of the Adviser to a detailed series of questions which included, among other things, information about the investment advisory services to be provided by the Adviser to the Funds, was available to the Board.
The Trustees also considered other services to be provided to the Funds by the Adviser such as monitoring adherence to the Funds’ investment restrictions, and monitoring compliance with various Fund policies and procedures and with applicable securities laws and regulations. Based on the factors above, as well as those discussed below, the Board concluded, within the context of its full deliberations, that the nature, extent and quality of the services to be provided to the Funds by the Adviser would be satisfactory.
Costs of Advisory Services
In considering the advisory fees payable by the Funds to the Adviser, the Trustees reviewed, among other things, a report of the proposed advisory fees to be paid to the Adviser. The Trustees also reviewed reports prepared by the Funds’ administrator comparing the Funds’ net and gross expense ratios and advisory fees to those paid by peer groups of mutual funds as classified by Lipper, an independent provider of investment company data. The Trustees reviewed pro forma fee and expense information. The Trustees considered any differences in management fees and took into account the respective demands, resources and complexity associated with the Funds as well as the extensive regulatory, compliance and tax regimes to which the Funds are subject. The Board concluded, within the context of its full deliberations, that the advisory fees were reasonable in light of the nature and quality of the services expected to be rendered by the Adviser. The Board also considered the Adviser’s commitment to managing the Funds and its willingness to enter into an expense limitation and fee waiver arrangement with the Funds.
Investment Performance, Profitability and Economies of Scale
85
| THE ADVISORS’ INNER CIRCLE FUND III | GQG PARTNERS FUNDS SEPTEMBER 30, 2021 (Unaudited) |
Because the Funds were new and had not commenced operations, they did not yet have an investment performance record and it was not possible to determine the profitability that the Adviser might achieve with respect to the Funds or the extent to which economies of scale would be realized by the Adviser as the assets of the Funds grow. Accordingly, the Trustees did not make any conclusions regarding the Funds’ investment performance, the Adviser’s profitability, or the extent to which economies of scale would be realized by the Adviser as the assets of the Funds grow, but will do so during future considerations of the Agreement.
Approval of the Agreement
Based on the Board’s deliberations and its evaluation of the information described above and other factors and information it believed relevant in the exercise of its reasonable business judgment, the Board, including all of the Independent Trustees, with the assistance of Fund counsel and Independent Trustees’ counsel, unanimously concluded that the terms of the Agreement, including the fees to be paid thereunder, were fair and reasonable and agreed to approve the Agreement for an initial term of two years. In its deliberations, the Board did not identify any absence of information as material to its decision, or any particular factor (or conclusion with respect thereto) or single piece of information that was all-important, controlling or determinative of its decision, but considered all of the factors together, and each Trustee may have attributed different weights to the various factors (and conclusions with respect thereto) and information.
86
GQG Partners Funds
P.O. Box 219009
Kansas City, MO 64121-9009
1-866-362-8333
Investment Adviser:
GQG Partners LLC
450 East Las Olas Boulevard, Suite 750
Fort Lauderdale, FL 33301
Administrator:
SEI Investments Global Funds Services
One Freedom Valley Drive
Oaks, PA 19456
Distributor:
SEI Investments Distribution Co.
One Freedom Valley Drive
Oaks, PA 19456
Legal Counsel:
Morgan, Lewis & Bockius LLP
1701 Market Street
Philadelphia, PA 19103
This information must be preceded or accompanied by a current prospectus for
the Funds described. Investors should read it carefully before investing or sending
money.
GQG-SA-001-0600
| Item 2. | Code of Ethics. |
Not applicable for semi-annual report.
| Item 3. | Audit Committee Financial Expert. |
Not applicable for semi-annual report.
| Item 4. | Principal Accountant Fees and Services. |
Not applicable for semi-annual report.
| Item 5. | Audit Committee of Listed Registrants. |
Not applicable to open-end management investment companies.
| Item 6. | Schedule of Investments. |
Schedule of Investments is included as part of the Report to Shareholders filed under Item 1 of this form.
| Item 7. | Disclosure of Proxy Voting Policies and Procedures for Closed-End Management Investment Companies. |
Not applicable to open-end management investment companies.
| Item 8. | Portfolio Managers of Closed-End Management Investment Companies. |
Not applicable to open-end management investment companies. Effective for closed-end management investment companies for fiscal-years-ending on or after December 31, 2005.
| Item 9. | Purchases of Equity Securities by Closed-End Management Company and Affiliated Purchasers. |
Not applicable to open-end management investment companies.
| Item 10. | Submission of Matters to a Vote of Security Holders. |
There have been no changes to the procedures by which shareholders may recommend nominees to the Registrant’s Board of Trustees during the period covered by this report.
| Item 11. | Controls and Procedures. |
(a) The Registrant’s principal executive and principal financial officers, or persons performing similar functions, have concluded that the Registrant’s disclosure controls and procedures, as defined in Rule 30a-3(c) under the Act (17 CFR § 270.30a-3(c)), as of a date within 90 days of the filing date of the report, are effective based on the evaluation of these controls and procedures required by Rule 30a-3(b) under the Act (17 CFR § 270.30a-3(b)) and Rules 13a-15(b) or 15d-15(b) under the Exchange Act, as amended (17 CFR § 270.30a-15(b) or § 240.15d-15(b)).
(b) There has been no change in the Registrant’s internal control over financial reporting (as defined in Rule 30a-3(d) under the Act (17 CFR § 270.3a-3(d)) that occurred during the period covered by this report that has materially affected, or is reasonably likely to materially affect, the Registrant’s internal control over financial reporting.
| Items 12. | Disclosure of Securities Lending Activities for Closed-End Management Investment Companies. |
Not applicable to open-end management investment companies.
| Items 13. | Exhibits. |
(a)(1) Not applicable for semi-annual reports.
SIGNATURES
Pursuant to the requirements of the Securities Exchange Act of 1934 and the Investment Company Act of 1940, the Registrant has duly caused this report to be signed on its behalf by the undersigned, thereunto duly authorized.
| (Registrant) | The Advisors’ Inner Circle Fund III | |||||
| By (Signature and Title)* | /s/ Michael Beattie | |||||
| Michael Beattie, President | ||||||
Date: December 8, 2021
Pursuant to the requirements of the Securities Exchange Act of 1934 and the Investment Company Act of 1940, this report has been signed below by the following persons on behalf of the Registrant and in the capacities and on the dates indicated.
| By (Signature and Title)* | /s/ Michael Beattie | |||||
| Michael Beattie, President |
Date: December 8, 2021
| By (Signature and Title)* | /s/ Andrew Metzger | |||||
| Andrew Metzger, | ||||||
| Treasurer, Controller, and CFO |
Date: December 8, 2021
| * | Print the name and title of each signing officer under his or her signature. |
CERTIFICATION
Pursuant to Rule 30a-2(a) under the Investment Company Act of 1940
and Section 302 of the Sarbanes-Oxley Act of 2002
I, Michael Beattie, certify that:
1. I have reviewed this report on Form N-CSRS of The Advisors’ Inner Circle Fund III (the “Registrant”);
2. Based on my knowledge, this report does not contain any untrue statement of a material fact or omit to state a material fact necessary to make the statements made, in light of the circumstances under which such statements were made, not misleading with respect to the period covered by this report;
3. Based on my knowledge, the financial statements, and other financial information, included in this report fairly present in all material respects the financial condition, results of operations, changes in net assets, and cash flows (if the financial statements are required to include a statement of cash flows) of the Registrant as of, and for, the periods presented in this report;
4. The Registrant’s other certifying officer(s), if any, and I are responsible for establishing and maintaining disclosure controls and procedures (as defined in Rule 30a-3(c) under the Investment Company Act of 1940) and internal control over financial reporting (as defined in Rule 30a-3(d) under the Investment Company Act of 1940) for the Registrant and have:
(a) Designed such disclosure controls and procedures, or caused such disclosure controls and procedures to be designed under our supervision, to ensure that material information relating to the Registrant, including its consolidated subsidiaries, is made known to us by others within those entities, particularly during the period in which this report is being prepared;
(b) Designed such internal control over financial reporting, or caused such internal control over financial reporting to be designed under our supervision, to provide reasonable assurance regarding the reliability of financial reporting and the preparation of financial statements for external purposes in accordance with generally accepted accounting principles;
(c) Evaluated the effectiveness of the Registrant’s disclosure controls and procedures and presented in this report our conclusions about the effectiveness of the disclosure controls and procedures, as of a date within 90 days prior to the filing date of this report, based on such evaluation; and
(d) Disclosed in this report any change in the Registrant’s internal control over financial reporting that occurred during the period covered by this report that has materially affected, or is reasonably likely to materially affect, the Registrant’s internal control over financial reporting; and
5. The Registrant’s other certifying officer(s) and I have disclosed to the Registrant’s auditors and the audit committee of the Registrant’s board of directors (or persons performing the equivalent functions):
(a) All significant deficiencies and material weaknesses in the design or operation of internal control over financial reporting which are reasonably likely to adversely affect the Registrant’s ability to record, process, summarize, and report financial information; and
(b) Any fraud, whether or not material, that involves management or other employees who have a significant role in the Registrant’s internal control over financial reporting.
Date: December 8, 2021
| /s/ Michael Beattie |
| Michael Beattie |
| President |
CERTIFICATION
Pursuant to Rule 30a-2(a) under the Investment Company Act of 1940
and Section 302 of the Sarbanes-Oxley Act of 2002
I, Andrew Metzger, certify that:
1. I have reviewed this report on Form N-CSRS of The Advisors’ Inner Circle Fund III (the “Registrant”);
2. Based on my knowledge, this report does not contain any untrue statement of a material fact or omit to state a material fact necessary to make the statements made, in light of the circumstances under which such statements were made, not misleading with respect to the period covered by this report;
3. Based on my knowledge, the financial statements, and other financial information, included in this report fairly present in all material respects the financial condition, results of operations, changes in net assets, and cash flows (if the financial statements are required to include a statement of cash flows) of the Registrant as of, and for, the periods presented in this report;
4. The Registrant’s other certifying officer(s), if any, and I are responsible for establishing and maintaining disclosure controls and procedures (as defined in Rule 30a-3(c) under the Investment Company Act of 1940) and internal control over financial reporting (as defined in Rule 30a-3(d) under the Investment Company Act of 1940) for the Registrant and have:
(a) Designed such disclosure controls and procedures, or caused such disclosure controls and procedures to be designed under our supervision, to ensure that material information relating to the Registrant, including its consolidated subsidiaries, is made known to us by others within those entities, particularly during the period in which this report is being prepared;
(b) Designed such internal control over financial reporting, or caused such internal control over financial reporting to be designed under our supervision, to provide reasonable assurance regarding the reliability of financial reporting and the preparation of financial statements for external purposes in accordance with generally accepted accounting principles;
(c) Evaluated the effectiveness of the Registrant’s disclosure controls and procedures and presented in this report our conclusions about the effectiveness of the disclosure controls and procedures, as of a date within 90 days prior to the filing date of this report, based on such evaluation; and
(d) Disclosed in this report any change in the Registrant’s internal control over financial reporting that occurred during the period covered by this report that has materially affected, or is reasonably likely to materially affect, the Registrant’s internal control over financial reporting; and
5. The Registrant’s other certifying officer(s) and I have disclosed to the Registrant’s auditors and the audit committee of the Registrant’s board of directors (or persons performing the equivalent functions):
(a) All significant deficiencies and material weaknesses in the design or operation of internal control over financial reporting which are reasonably likely to adversely affect the Registrant’s ability to record, process, summarize, and report financial information; and
(b) Any fraud, whether or not material, that involves management or other employees who have a significant role in the Registrant’s internal control over financial reporting.
Date: December 8, 2021
| /s/ Andrew Metzger |
| Andrew Metzger |
| Treasurer, Controller, and CFO |
CERTIFICATION
Pursuant to 18 U.S.C. Section 1350,
As Adopted Pursuant to Section 906
of the Sarbanes-Oxley Act of 2002
The undersigned, the President of The Advisors’ Inner Circle Fund III (the “Fund”), with respect to the Fund’s Form N-CSRS for the period ended September 30, 2021, as filed with the Securities and Exchange Commission, hereby certifies, pursuant to 18 U.S.C. Section 1350, as adopted pursuant to Section 906 of the Sarbanes-Oxley Act of 2002, that, to the best of my knowledge:
1. such Form N-CSRS fully complies with the requirements of Section 13(a) or 15(d) of the Securities Exchange Act of 1934; and
2. the information contained in such Form N-CSRS fairly presents, in all material respects, the financial condition and results of operations of the Fund.
Dated: December 8, 2021
| /s/ Michael Beattie |
| Michael Beattie |
| President |
CERTIFICATION
Pursuant to 18 U.S.C. Section 1350,
As Adopted Pursuant to Section 906
of the Sarbanes-Oxley Act of 2002
The undersigned, the Treasurer, Controller, and CFO of The Advisors’ Inner Circle Fund III (the “Fund”), with respect to the Fund’s Form N-CSRS for the period ended September 30, 2021, as filed with the Securities and Exchange Commission, hereby certifies, pursuant to 18 U.S.C. Section 1350, as adopted pursuant to Section 906 of the Sarbanes-Oxley Act of 2002, that, to the best of my knowledge:
1. such Form N-CSRS fully complies with the requirements of Section 13(a) or 15(d) of the Securities Exchange Act of 1934; and
2. the information contained in such Form N-CSRS fairly presents, in all material respects, the financial condition and results of operations of the Fund.
Dated: December 8, 2021
| /s/ Andrew Metzger |
| Andrew Metzger |
| Treasurer, Controller, and CFO |
Serious News for Serious Traders! Try StreetInsider.com Premium Free!
You May Also Be Interested In
- deepull unveils 1 hour, direct-from-blood multiplex PCR test for 95% of sepsis-causing pathogens at ESCMID 2024
- Salesforce Unveils Zero Copy Partner Network, an Ecosystem Committed to Secure, Bidirectional Zero Copy Integration with Salesforce Data Cloud
- The International Camel Racing Federation (ICRF) concludes its participation in the SportAccord Global Sports and Business Summit
Create E-mail Alert Related Categories
SEC FilingsSign up for StreetInsider Free!
Receive full access to all new and archived articles, unlimited portfolio tracking, e-mail alerts, custom newswires and RSS feeds - and more!
