

Form N-CSRS ARBITRAGE FUNDS For: Nov 30
 Tweet
Tweet Share
Share
UNITED STATES
SECURITIES AND EXCHANGE COMMISSION
Washington, D.C. 20549
FORM N-CSR
CERTIFIED SHAREHOLDER REPORT OF REGISTERED
MANAGEMENT INVESTMENT COMPANIES
Investment Company Act file number: 811-09815
the arbitrage funds
(exact name of registrant as specified in charter)
41 Madison Avenue, 42nd Floor, New York, NY 10010
(Address of principal executive offices) (Zip code)
John S. Orrico
Water Island Capital, LLC
41 Madison Avenue
42nd Floor
New York, NY 10010
(Name and address of agent for service)
Registrant’s telephone number, including area code: 800-295-4485
Date of fiscal year end: May 31
Date of reporting period: November 30, 2022
Item 1. Reports to Stockholders.

Semi-Annual Report
November 30, 2022
Arbitrage Fund
Water Island Event-Driven Fund
Water Island Credit Opportunities Fund

TABLE OF CONTENTS
|
Arbitrage Fund |
|||||||
|
Portfolio Information |
1 |
||||||
|
Portfolio of Investments |
3 |
||||||
|
Water Island Event-Driven Fund |
|||||||
|
Portfolio Information |
14 |
||||||
|
Portfolio of Investments |
16 |
||||||
|
Water Island Credit Opportunities Fund |
|||||||
|
Portfolio Information |
27 |
||||||
|
Portfolio of Investments |
29 |
||||||
|
Statements of Assets and Liabilities |
36 |
||||||
|
Statements of Operations |
40 |
||||||
|
Statements of Changes in Net Assets |
44 |
||||||
|
Financial Highlights |
|||||||
|
Arbitrage Fund - Class R |
48 |
||||||
|
Arbitrage Fund - Class I |
50 |
||||||
|
Arbitrage Fund - Class C |
52 |
||||||
|
Arbitrage Fund - Class A |
54 |
||||||
|
Water Island Event-Driven Fund - Class R |
56 |
||||||
|
Water Island Event-Driven Fund - Class I |
58 |
||||||
|
Water Island Event-Driven Fund - Class A |
60 |
||||||
|
Water Island Credit Opportunities Fund - Class R |
62 |
||||||
|
Water Island Credit Opportunities Fund - Class I |
64 |
||||||
|
Water Island Credit Opportunities Fund - Class A |
66 |
||||||
|
Notes to Financial Statements |
68 |
||||||
|
Disclosure of Fund Expenses |
93 |
||||||
|
Additional Information |
96 |
||||||
Arbitrage Fund Portfolio Information
November 30, 2022 (Unaudited)
Performance^ (annualized returns as of November 30, 2022)
|
One Year |
Five Year |
Ten Year |
Since Inception* |
||||||||||||||||
|
Arbitrage Fund, Class R |
-0.57 |
% |
2.21 |
% |
2.11 |
% |
3.65 |
% |
|||||||||||
|
Arbitrage Fund, Class I |
-0.39 |
% |
2.45 |
% |
2.36 |
% |
2.86 |
% |
|||||||||||
|
Arbitrage Fund, Class C** |
-2.35 |
%# |
1.43 |
% |
1.34 |
% |
1.14 |
% |
|||||||||||
|
Arbitrage Fund, Class A*** |
-3.31 |
% |
1.68 |
% |
N/A |
1.79 |
% |
||||||||||||
|
ICE BofA U.S. 3-Month Treasury Bill Index |
1.10 |
% |
1.21 |
% |
0.73 |
% |
1.49 |
% |
|||||||||||
Current performance may be higher or lower than performance quoted above. Any performance data quoted represents past performance and the investment return and principal value of an investment in the Fund will fluctuate so that an investor's shares, when redeemed, may be worth more or less than their original cost. Past performance is no guarantee of future results. Returns shown above include the reinvestment of all dividends and capital gains. Performance results do not include adjustments made for financial reporting purposes in accordance with U.S. generally accepted accounting principles and may differ from the amount reported in the Financial Highlights. You can obtain performance data current to the most recent month end by calling 1-800-295-4485 or going to www.arbitragefunds.com. This table does not reflect the deduction of taxes that a shareholder would pay on Fund distributions or the redemption of Fund shares.
^ After sales charge.
* Class R inception: 9/18/00; Class I inception: 10/17/03; Class C inception: 6/1/12; Class A inception: 6/1/13. The "Since Inception" returns for securities indices are for the inception date of Class R shares.
# Class C One Year return includes load.
** Class C shares are subject to a 1.00% contingent deferred sales charge on all purchases redeemed within 12 months of purchase.
*** Class A shares are subject to a maximum front-end sales load of 2.75% on purchases up to $250,000. The shares are also subject to a deferred sales charge of up to 1.00% on purchases of $250,000 or more purchased without a front-end sales charge and redeemed within 18 months of purchase.
The Total Annual Fund Operating Expenses for Class R, Class I, Class C and Class A are 1.62%, 1.37%, 2.37% and 1.62%, respectively. These expense ratios are as stated in the current prospectus and may differ from the expense ratios disclosed in the financial highlights in this report.
The ICE BofA U.S. 3-Month Treasury Bill Index tracks the performance of the U.S. dollar denominated U.S. Treasury Bills publicly issued in the U.S. domestic market with a remaining term to final maturity of less than 3 months.
An investor may not invest directly in an index.
Semi-Annual Report | November 30, 2022
1
Arbitrage Fund Portfolio Information (continued)
November 30, 2022 (Unaudited)
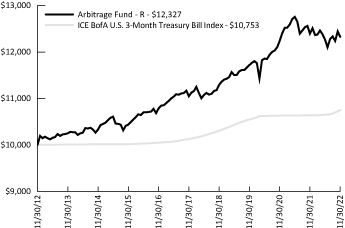
Growth of $10,000 Investment
The chart represents historical performance of a hypothetical investment of $10,000 in the Class R shares of the Fund over ten years. Past performance does not guarantee future results. This chart does not reflect the deduction of taxes that a shareholder would pay on Fund distributions or the redemption of Fund shares.
Sector Weighting
The following chart shows the sector weightings of Arbitrage Fund's investments (including short sales and excluding derivatives) as of the report date.

www.arbitragefunds.com | 1-800-295-4485
2
Arbitrage Fund Portfolio of Investments
November 30, 2022 (Unaudited)
|
Shares |
Value |
||||||||||
|
COMMON STOCKS - 69.94% |
|||||||||||
|
Aerospace & Defense - 1.03% |
|||||||||||
|
Aerojet Rocketdyne Holdings, Inc.(a) |
286,113 |
$ |
14,877,876 |
||||||||
|
Banks - 3.52% |
|||||||||||
|
First Horizon Corp. |
1,751,813 |
43,532,553 |
|||||||||
|
Home Capital Group, Inc. |
230,520 |
7,317,551 |
|||||||||
|
50,850,104 |
|||||||||||
|
Biotechnology - 1.24% |
|||||||||||
|
AVEO Pharmaceuticals, Inc.(a) |
456,464 |
6,824,137 |
|||||||||
|
Imago Biosciences, Inc.(a) |
101,598 |
3,626,032 |
|||||||||
|
Swedish Orphan Biovitrum AB(a) |
346,239 |
7,487,336 |
|||||||||
|
17,937,505 |
|||||||||||
|
Chemicals - 1.08% |
|||||||||||
|
Rogers Corp.(a) |
143,490 |
15,646,150 |
|||||||||
|
Commercial Services - 2.87% |
|||||||||||
|
Caverion Oyj |
684,302 |
4,956,109 |
|||||||||
|
Evo Payments, Inc., Class A(a)(b) |
810,122 |
27,309,213 |
|||||||||
|
Moneylion, Inc.(a)(c) |
2,489,318 |
1,858,525 |
|||||||||
| RPS Group Plc |
2,750,000 |
7,258,621 |
|||||||||
|
41,382,468 |
|||||||||||
|
Computers & Computer Services - 1.06% |
|||||||||||
|
KnowBe4, Inc., Class A(a)(b) |
620,187 |
15,312,417 |
|||||||||
|
Construction Materials - 1.09% |
|||||||||||
|
Forterra, Inc.(a)(d) |
653,007 |
15,672,168 |
|||||||||
|
Diversified Financial Services - 1.06% |
|||||||||||
|
Cowen, Inc., Class A(b) |
397,161 |
15,354,244 |
|||||||||
|
Electric - 4.53% |
|||||||||||
|
ContourGlobal Plc(e) |
2,242,798 |
6,757,834 |
|||||||||
|
Electricite de France SA |
1,614,148 |
20,156,190 |
|||||||||
|
PNM Resources, Inc.(b) |
785,402 |
38,484,698 |
|||||||||
|
65,398,722 |
|||||||||||
|
Electrical Components & Equipment - 0.35% |
|||||||||||
|
Somfy SA |
33,959 |
5,074,499 |
|||||||||
|
Energy - Alternate Sources - 3.23% |
|||||||||||
|
Archaea Energy, Inc.(a) |
1,224,192 |
31,755,541 |
|||||||||
|
Siemens Gamesa Renewable Energy SA(a) |
792,536 |
14,869,575 |
|||||||||
|
46,625,116 |
|||||||||||
See Notes to Financial Statements.
Semi-Annual Report | November 30, 2022
3
Arbitrage Fund Portfolio of Investments (continued)
November 30, 2022 (Unaudited)
|
Shares |
Value |
||||||||||
|
COMMON STOCKS - 69.94% (Continued) |
|||||||||||
|
Engineering & Construction - 0.55% |
|||||||||||
|
HomeServe Plc(a) |
549,278 |
$ |
7,884,630 |
||||||||
|
Environmental Control - 0.72% |
|||||||||||
|
Biffa Plc(e) |
2,118,542 |
10,417,766 |
|||||||||
|
Food - 0.35% |
|||||||||||
|
Devro Plc |
1,378,000 |
5,082,156 |
|||||||||
|
Forest Products & Paper - 1.17% |
|||||||||||
|
Resolute Forest Products, Inc.(a)(b) |
803,806 |
16,960,307 |
|||||||||
|
Gas - 2.49% |
|||||||||||
|
South Jersey Industries, Inc. |
1,034,649 |
35,902,320 |
|||||||||
|
Healthcare - Products - 1.79% |
|||||||||||
|
ABIOMED, Inc.(a) |
58,849 |
22,232,564 |
|||||||||
|
Apollo Endosurgery, Inc.(a)(f) |
359,000 |
3,636,670 |
|||||||||
|
25,869,234 |
|||||||||||
|
Healthcare - Services - 4.03% |
|||||||||||
|
LHC Group, Inc.(a)(b) |
163,295 |
26,684,036 |
|||||||||
|
Mediclinic International Plc |
2,008,366 |
11,986,733 |
|||||||||
|
Signify Health, Inc., Class A(a)(b) |
683,132 |
19,551,238 |
|||||||||
|
UpHealth, Inc.(a)(c) |
48,973 |
16,920 |
|||||||||
|
58,238,927 |
|||||||||||
|
Home Furnishings - 1.42% |
|||||||||||
|
iRobot Corp.(a)(b) |
393,725 |
20,509,135 |
|||||||||
|
Insurance - 0.22% |
|||||||||||
|
TOWER Ltd. |
7,208,016 |
3,202,202 |
|||||||||
|
Internet - 1.05% |
|||||||||||
|
Poshmark, Inc., Class A(a) |
846,716 |
15,096,946 |
|||||||||
|
Machinery - Diversified - 1.02% |
|||||||||||
|
Altra Industrial Motion Corp.(b) |
252,378 |
14,794,398 |
|||||||||
|
Media - 6.28% |
|||||||||||
|
Houghton Mifflin Harcourt Co.(a)(d) |
1,739,400 |
36,527,400 |
|||||||||
|
Shaw Communications, Inc., Class B |
289,718 |
7,906,589 |
|||||||||
|
TEGNA, Inc.(b) |
2,344,230 |
46,275,100 |
|||||||||
|
90,709,089 |
|||||||||||
|
Pharmaceuticals - 1.05% |
|||||||||||
|
Myovant Sciences Ltd.(a) |
563,645 |
15,139,505 |
|||||||||
See Notes to Financial Statements.
www.arbitragefunds.com | 1-800-295-4485
4
Arbitrage Fund Portfolio of Investments (continued)
November 30, 2022 (Unaudited)
|
Shares |
Value |
||||||||||
|
COMMON STOCKS - 69.94% (Continued) |
|||||||||||
|
Real Estate Investment Trusts - 2.92% |
|||||||||||
|
Bluerock Homes Trust, Inc.(a) |
38,628 |
$ |
947,159 |
||||||||
|
STORE Capital Corp.(b) |
1,173,120 |
37,422,528 |
|||||||||
|
Summit Industrial Income REIT |
222,102 |
3,723,302 |
|||||||||
|
42,092,989 |
|||||||||||
|
Semiconductors - 1.39% |
|||||||||||
|
Magnachip Semiconductor Corp.(a) |
411,831 |
4,167,730 |
|||||||||
|
Silicon Motion Technology Corp., ADR(b) |
251,202 |
15,850,846 |
|||||||||
|
20,018,576 |
|||||||||||
|
Software - 14.89% |
|||||||||||
|
1Life Healthcare, Inc.(a)(b) |
1,520,267 |
25,829,336 |
|||||||||
|
Activision Blizzard, Inc. |
624,728 |
46,198,636 |
|||||||||
|
AVEVA Group Plc |
377,856 |
14,486,629 |
|||||||||
|
Benefitfocus, Inc.(a) |
699,932 |
7,258,295 |
|||||||||
|
Black Knight, Inc.(a)(b) |
79,969 |
4,957,278 |
|||||||||
|
BTRS Holdings, Inc., Class 1(a) |
2,473,118 |
23,420,427 |
|||||||||
|
ForgeRock, Inc., Class A(a)(b) |
836,738 |
18,199,052 |
|||||||||
|
Micro Focus International Plc |
1,375,000 |
8,654,000 |
|||||||||
|
Momentive Global, Inc.(a)(f) |
1,604,381 |
12,722,741 |
|||||||||
|
Onemarket Ltd.(a)(d) |
111,800 |
— |
|||||||||
|
UserTesting, Inc.(a) |
1,978,004 |
14,676,790 |
|||||||||
|
VMware, Inc., Class A(a)(b) |
317,925 |
38,624,708 |
|||||||||
|
215,027,892 |
|||||||||||
|
Telecommunications - 4.53% |
|||||||||||
|
Sierra Wireless, Inc.(a)(b) |
1,287,743 |
37,769,502 |
|||||||||
|
Switch, Inc., Class A(b) |
806,083 |
27,608,343 |
|||||||||
|
65,377,845 |
|||||||||||
|
Transportation - 3.01% |
|||||||||||
|
Atlas Air Worldwide Holdings, Inc.(a)(b) |
280,211 |
28,236,862 |
|||||||||
|
Atlas Corp.(b) |
986,796 |
15,167,055 |
|||||||||
|
43,403,917 |
|||||||||||
|
TOTAL COMMON STOCKS (Cost $1,079,504,882) |
1,009,859,103 |
||||||||||
|
RIGHTS(a) - 0.15% |
|||||||||||
|
Bristol-Myers Squibb Co. CVR |
857,631 |
857,631 |
|||||||||
|
Contra Adamas Pharmaceuticals, Inc. CVR, Expires 12/31/2024(d) |
1,150,652 |
76,173 |
|||||||||
|
Contra Adamas Pharmaceuticals, Inc. CVR, Expires 12/31/2025(d) |
1,150,652 |
76,058 |
|||||||||
|
Contra Flexion Therapeutics, Inc. CVR, Expires 12/31/2030(d) |
1,411,000 |
965,406 |
|||||||||
|
Contra Zogenix, Inc. CVR(d) |
304,716 |
222,230 |
|||||||||
|
TOTAL RIGHTS (Cost $2,405,892) |
2,197,498 |
||||||||||
See Notes to Financial Statements.
Semi-Annual Report | November 30, 2022
5
Arbitrage Fund Portfolio of Investments (continued)
November 30, 2022 (Unaudited)
|
Maturity Date |
Rate |
Principal Amount |
Value |
||||||||||||||||
|
CONVERTIBLE CORPORATE BONDS - 0.46% |
|||||||||||||||||||
|
Auto Manufacturers - 0.05% |
|||||||||||||||||||
|
Lightning eMotors, Inc.(e) |
05/15/2024 |
7.500 |
% |
$ |
1,084,000 |
$ |
643,679 |
||||||||||||
|
Healthcare - Services - 0.25% |
|||||||||||||||||||
|
UpHealth, Inc.(e) |
06/15/2026 |
6.250 |
% |
1,275,000 |
379,312 |
||||||||||||||
|
UpHealth, Inc., Variable Rate, (SOFR plus 9.00%)(e) |
12/15/2025 |
12.810 |
% |
3,506,000 |
3,264,086 |
||||||||||||||
|
3,643,398 |
|||||||||||||||||||
|
Software - 0.16% |
|||||||||||||||||||
|
Kaleyra, Inc.(e) |
06/01/2026 |
6.125 |
% |
2,947,000 |
2,332,975 |
||||||||||||||
|
TOTAL CONVERTIBLE CORPORATE BONDS (Cost $8,812,501) |
6,620,052 |
||||||||||||||||||
|
Shares |
Value |
||||||||||
|
MUTUAL FUNDS(g) - 5.05% |
|||||||||||
|
Water Island Event-Driven Fund, Class I |
6,605,365 |
$ |
72,923,232 |
||||||||
|
TOTAL MUTUAL FUNDS (Cost $60,632,644) |
72,923,232 |
||||||||||
|
PRIVATE INVESTMENTS(a)(c)(d)(h) - 0.04% |
|||||||||||
|
Fast Capital LLC |
290,700 |
581,400 |
|||||||||
|
TOTAL PRIVATE INVESTMENTS (Cost $300,786) |
581,400 |
||||||||||
|
WARRANTS(a) - 0.00%(i) |
|||||||||||
|
Commercial Services - 0.00%(i) |
|||||||||||
|
Moneylion, Inc., Exercise Price $11.50, Expires 09/22/2026 |
290,320 |
29,032 |
|||||||||
|
Healthcare - Services - 0.00%(i) |
|||||||||||
|
UpHealth, Inc., Exercise Price $11.50, Expires 07/01/2024(c) |
4,897 |
128 |
|||||||||
|
TOTAL WARRANTS (Cost $0) |
29,160 |
||||||||||
|
Expiration Date |
Exercise Price |
Notional Amount |
Contracts |
Value |
|||||||||||||||||||
|
PURCHASED OPTIONS(a) - 0.08% |
|||||||||||||||||||||||
|
Call Options Purchased - 0.07% |
|||||||||||||||||||||||
|
Apollo Endosurgery, Inc. |
01/2023 |
$ |
10.00 |
$ |
2,880,972 |
2,844 |
$ |
106,650 |
|||||||||||||||
|
Broadcom, Inc. |
|||||||||||||||||||||||
|
12/2022 |
500.00 |
1,818,399 |
33 |
181,665 |
|||||||||||||||||||
|
12/2022 |
520.00 |
3,967,416 |
72 |
278,280 |
|||||||||||||||||||
|
12/2022 |
550.00 |
14,051,265 |
255 |
476,850 |
|||||||||||||||||||
See Notes to Financial Statements.
www.arbitragefunds.com | 1-800-295-4485
6
Arbitrage Fund Portfolio of Investments (continued)
November 30, 2022 (Unaudited)
|
Expiration Date |
Exercise Price |
Notional Amount |
Contracts |
Value |
|||||||||||||||||||
|
PURCHASED OPTIONS(a) - 0.08% (Continued) |
|||||||||||||||||||||||
|
Call Options Purchased - 0.07% (Continued) |
|||||||||||||||||||||||
|
Ironsource Ltd. |
12/2022 |
$ |
5.00 |
$ |
956,534 |
3,491 |
$ |
0 |
|||||||||||||||
|
TOTAL CALL OPTIONS PURCHASED (Cost $1,650,189) |
1,043,445 |
||||||||||||||||||||||
|
Put Options Purchased - 0.01% |
|||||||||||||||||||||||
|
Momentive Global, Inc. |
12/2022 |
6.00 |
9,408,152 |
11,864 |
88,980 |
||||||||||||||||||
|
Tenneco, Inc. |
01/2023 |
10.00 |
6,540,728 |
3,272 |
0 |
||||||||||||||||||
|
TOTAL PUT OPTIONS PURCHASED (Cost $1,022,598) |
88,980 |
||||||||||||||||||||||
|
TOTAL PURCHASED OPTIONS (Cost $2,672,787) |
1,132,425 |
||||||||||||||||||||||
|
Yield |
Shares |
Value |
|||||||||||||
|
SHORT-TERM INVESTMENTS - 18.20% |
|||||||||||||||
|
Money Market Funds |
|||||||||||||||
|
Morgan Stanley Institutional Liquidity Fund - Government Portfolio |
3.629 |
%(j) |
131,434,069 |
$ |
131,434,069 |
||||||||||
|
State Street Institutional U.S. Government Money Market Fund, Premier Class |
3.776 |
%(j) |
131,434,069 |
131,434,069 |
|||||||||||
|
262,868,138 |
|||||||||||||||
|
TOTAL SHORT-TERM INVESTMENTS (Cost $262,868,138) |
262,868,138 |
||||||||||||||
|
Total Investments - 93.92% (Cost $1,417,197,630) |
1,356,211,008 |
||||||||||||||
|
Other Assets in Excess of Liabilities - 6.08%(k) |
87,746,744 |
||||||||||||||
|
NET ASSETS - 100.00% |
$ |
1,443,957,752 |
|||||||||||||
Portfolio Footnotes
(a) Non-income-producing security.
(b) Security, or a portion of security, is being held as collateral for short sales, written option contracts or forward foreign currency exchange contracts. At November 30, 2022, the aggregate fair market value of those securities was $252,213,910, representing 17.47% of net assets.
(c) Restricted securities (including private placements) - The Fund may own investment securities that have other legal or contractual limitations. At the end of the period, the value of restricted securities (excluding 144A issues) amounted to $2,456,973 or 0.17% of net assets.
See Notes to Financial Statements.
Semi-Annual Report | November 30, 2022
7
Arbitrage Fund Portfolio of Investments (continued)
November 30, 2022 (Unaudited)
|
Restricted Security |
Acquisition Date |
Acquisition Cost |
|||||||||
|
Fast Capital LLC |
08/18/2020 |
$ |
300,786 |
||||||||
|
Moneylion, Inc. |
06/19/2020 |
17,080,470 |
|||||||||
|
UpHealth, Inc. |
06/08/2021 |
489,730 |
|||||||||
|
UpHealth, Inc., Exercise Price $11.50, Expires 07/01/2024 |
06/08/2021 |
— |
|||||||||
|
Total |
$ |
17,870,986 |
|||||||||
(d) Security fair valued using significant unobservable inputs and classified as a Level 3 security. As of November 30, 2022, the total fair market value of these securities was $54,120,835, representing 3.75% of net assets.
(e) Security exempt from registration under Rule 144A of the Securities Act of 1933. These securities may be resold in transactions exempt from registration, normally to qualified institutional buyers. As of November 30, 2022, these securities had a total value of $23,795,652 or 1.65% of net assets.
(f) Underlying security for a written/purchased call/put option.
(g) Affiliated investment.
(h) Represents a holding that is a direct investment into a private company and is not a listed or publicly traded entity.
(i) Less than 0.005% of net assets.
(j) Rate shown is the 7-day effective yield as of November 30, 2022.
(k) Includes cash held as collateral for short sales.
|
SCHEDULE OF SECURITIES SOLD SHORT |
Shares |
Value |
|||||||||
|
SECURITIES SOLD SHORT - (0.41%) |
|||||||||||
|
COMMON STOCKS SOLD SHORT - (0.41%) |
|||||||||||
|
Semiconductors - (0.41%) |
|||||||||||
|
Broadcom, Inc. |
(4,389 |
) |
$ |
(2,418,471 |
) |
||||||
|
MaxLinear, Inc. |
(97,467 |
) |
(3,567,292 |
) |
|||||||
|
(5,985,763 |
) |
||||||||||
|
TOTAL COMMON STOCKS SOLD SHORT (Proceeds $5,735,213) |
(5,985,763 |
) |
|||||||||
|
TOTAL SECURITIES SOLD SHORT (Proceeds $5,735,213) |
$ |
(5,985,763 |
) |
||||||||
|
WRITTEN OPTIONS |
Expiration Date |
Exercise Price |
Notional Amount |
Contracts |
Value |
||||||||||||||||||
|
Written Put Options |
|||||||||||||||||||||||
|
Tenneco, Inc. |
01/2023 |
$ |
5.00 |
$ |
(111,944 |
) |
(56 |
) |
$ |
(0 |
) |
||||||||||||
|
TOTAL WRITTEN OPTIONS (Premiums received $171) |
$ |
(0 |
) |
||||||||||||||||||||
See Notes to Financial Statements.
www.arbitragefunds.com | 1-800-295-4485
8
Arbitrage Fund Portfolio of Investments (continued)
November 30, 2022 (Unaudited)
EQUITY SWAP CONTRACTS
|
Swap Counterparty/ Payment Frequency |
Reference Obligation |
Rate Paid/ Received by the Fund |
Termination Date |
Upfront Payments Made |
Upfront Payments Received |
Market Value |
Notional Amount |
Unrealized Appreciation |
|||||||||||||||||||||||||||
|
Morgan Stanley & Co./ Monthly |
Distell Group Holdings Ltd. |
Paid 1 Month SABOR Plus 125 bps (7.320%) |
11/17/2023 |
$ |
— |
$ |
— |
$ |
0 |
ZAR |
18,766,626 |
$ |
0 |
||||||||||||||||||||||
|
Goldman Sachs & Co./ Monthly |
Distell Group Holdings Ltd. |
Paid 1 Month JIBAR Plus 95 bps (7.342%) |
11/20/2023 |
— |
— |
21,851 |
ZAR |
64,262,373 |
21,851 |
||||||||||||||||||||||||||
|
$ |
21,851 |
$ |
21,851 |
||||||||||||||||||||||||||||||||
|
Swap Counterparty/ Payment Frequency |
Reference Obligation |
Rate Paid/ Received by the Fund |
Termination Date |
Upfront Payments Made |
Upfront Payments Received |
Market Value |
Notional Amount |
Unrealized Depreciation |
|||||||||||||||||||||||||||
|
Morgan Stanley & Co./ Monthly |
Broadcom, Inc. |
Received 1 Month- Federal Rate Minus 40 bps (-3.430%) |
10/29/2024 |
$ |
— |
$ |
— |
$ |
(2,884,765 |
) |
USD |
16,761,658 |
$ |
(2,884,765 |
) |
||||||||||||||||||||
|
Morgan Stanley & Co./ Monthly |
Intercontinental Exchange, Inc. |
Received 1 Month- Federal Rate Minus 40 bps (-3.430%) |
10/29/2024 |
— |
— |
(144,561 |
) |
USD |
1,084,433 |
(144,561 |
) |
||||||||||||||||||||||||
|
$ |
(3,029,326 |
) |
$ |
(3,029,326 |
) |
||||||||||||||||||||||||||||||
See Notes to Financial Statements.
Semi-Annual Report | November 30, 2022
9
Arbitrage Fund Portfolio of Investments (continued)
November 30, 2022 (Unaudited)
OUTSTANDING FORWARD FOREIGN CURRENCY EXCHANGE CONTRACTS
|
Currency Purchased |
Currency Sold |
Counterparty |
Settlement Date |
Unrealized Appreciation |
|||||||||||||||
|
USD |
17,298,761 |
CAD |
22,985,500 |
Morgan Stanley & Co. |
12/15/2022 |
$ |
207,936 |
||||||||||||
|
CHF |
7,549,900 |
USD |
7,607,355 |
Morgan Stanley & Co. |
12/15/2022 |
384,429 |
|||||||||||||
|
EUR |
47,818,600 |
USD |
48,481,028 |
Morgan Stanley & Co. |
12/15/2022 |
1,330,513 |
|||||||||||||
|
GBP |
12,094,500 |
USD |
13,553,934 |
Morgan Stanley & Co. |
12/15/2022 |
1,029,317 |
|||||||||||||
|
USD |
1,840,513 |
GBP |
1,520,700 |
Morgan Stanley & Co. |
12/15/2022 |
6,891 |
|||||||||||||
|
NZD |
1,261,200 |
USD |
732,811 |
Morgan Stanley & Co. |
12/15/2022 |
62,017 |
|||||||||||||
|
SEK |
71,352,600 |
USD |
6,497,761 |
Morgan Stanley & Co. |
12/15/2022 |
302,173 |
|||||||||||||
|
USD |
444,682 |
SEK |
4,639,600 |
Morgan Stanley & Co. |
12/15/2022 |
2,527 |
|||||||||||||
|
$ |
3,325,803 |
||||||||||||||||||
|
Currency Purchased |
Currency Sold |
Counterparty |
Settlement Date |
Unrealized Depreciation |
|||||||||||||||
|
USD |
2,567,792 |
CAD |
3,501,600 |
Morgan Stanley & Co. |
12/15/2022 |
$ |
(35,816 |
) |
|||||||||||
|
USD |
7,867,579 |
CHF |
7,549,900 |
Morgan Stanley & Co. |
12/15/2022 |
(124,204 |
) |
||||||||||||
|
USD |
101,737,395 |
EUR |
101,336,600 |
Morgan Stanley & Co. |
12/15/2022 |
(3,822,624 |
) |
||||||||||||
|
USD |
90,088,463 |
GBP |
78,452,600 |
Morgan Stanley & Co. |
12/15/2022 |
(4,507,757 |
) |
||||||||||||
|
USD |
3,804,390 |
NZD |
6,342,900 |
Morgan Stanley & Co. |
12/15/2022 |
(192,990 |
) |
||||||||||||
|
SEK |
196,906,900 |
USD |
19,100,527 |
Morgan Stanley & Co. |
12/15/2022 |
(335,214 |
) |
||||||||||||
|
USD |
32,164,925 |
SEK |
342,735,500 |
Morgan Stanley & Co. |
12/15/2022 |
(497,918 |
) |
||||||||||||
|
$ |
(9,516,523 |
) |
|||||||||||||||||
The following is a summary of investments classified by country exposure:
|
Country |
% of Net Assets(a) |
||||||
|
United States |
77.62 |
% |
|||||
|
United Kingdom |
6.07 |
% |
|||||
|
Canada |
4.98 |
% |
|||||
|
France |
1.75 |
% |
|||||
|
Taiwan |
1.10 |
% |
|||||
|
Spain |
1.03 |
% |
|||||
|
Sweden |
0.52 |
% |
|||||
|
Finland |
0.34 |
% |
|||||
|
Republic of Korea |
0.29 |
% |
|||||
|
New Zealand |
0.22 |
% |
|||||
|
Australia |
0.00 |
%(b) |
|||||
|
Other Assets in Excess of Liabilities |
6.08 |
% |
|||||
|
100.00 |
% |
||||||
(a) These percentages represent long positions only and are not net of short positions.
(b) Less than 0.005% of net assets.
See Notes to Financial Statements.
www.arbitragefunds.com | 1-800-295-4485
10
Arbitrage Fund Portfolio of Investments (continued)
November 30, 2022 (Unaudited)
Abbreviations:
AB - Aktiebolag is the Swedish term for a limited company.
ADR - American Depositary Receipt
bps - Basis Points. 100 Basis Points is equal to 1 percentage point.
CAD - Canadian dollar
CHF - Swiss franc
CVR - Contingent Value Rights
EUR - Euro
GBP - British pound
JIBAR - Johannesburg Interbank Agreed Rate
LLC - Limited Liability Company
Ltd. - Limited
NZD - New Zealand dollar
Oyj - Osakeyhtio is the Finnish equivalent of a public limited company.
Plc - Public Limited Company
REIT - Real Estate Investment Trust
SA - Generally designates corporations in various countries, mostly those employing civil law. This translates literally in all languages mentioned as anonymous company.
SABOR - South African Benchmark Overnight Rate
SEK - Swedish krona
SOFR - Secured Overnight Financing Rate
USD - United States Dollar
ZAR - South African rand
The following table summarizes the Arbitrage Fund's investments and derivative financial instruments categorized in the fair value hierarchy as of November 30, 2022:
|
Investments in Securities at Fair Value* |
Level 1 |
Level 2 |
Level 3 |
Total |
|||||||||||||||
|
Assets |
|||||||||||||||||||
|
Common Stocks |
|||||||||||||||||||
|
Aerospace & Defense |
$ |
14,877,876 |
$ |
— |
$ |
— |
$ |
14,877,876 |
|||||||||||
|
Banks |
50,850,104 |
— |
— |
50,850,104 |
|||||||||||||||
|
Biotechnology |
17,937,505 |
— |
— |
17,937,505 |
|||||||||||||||
|
Chemicals |
15,646,150 |
— |
— |
15,646,150 |
|||||||||||||||
|
Commercial Services |
41,382,468 |
— |
— |
41,382,468 |
|||||||||||||||
|
Computers & Computer Services |
15,312,417 |
— |
— |
15,312,417 |
|||||||||||||||
|
Construction Materials |
— |
— |
15,672,168 |
15,672,168 |
|||||||||||||||
|
Diversified Financial Services |
15,354,244 |
— |
— |
15,354,244 |
|||||||||||||||
|
Electric |
65,398,722 |
— |
— |
65,398,722 |
|||||||||||||||
|
Electrical Components & Equipment |
5,074,499 |
— |
— |
5,074,499 |
|||||||||||||||
|
Energy - Alternate Sources |
46,625,116 |
— |
— |
46,625,116 |
|||||||||||||||
|
Engineering & Construction |
7,884,630 |
— |
— |
7,884,630 |
|||||||||||||||
|
Environmental Control |
10,417,766 |
— |
— |
10,417,766 |
|||||||||||||||
|
Food |
5,082,156 |
— |
— |
5,082,156 |
|||||||||||||||
|
Forest Products & Paper |
16,960,307 |
— |
— |
16,960,307 |
|||||||||||||||
|
Gas |
35,902,320 |
— |
— |
35,902,320 |
|||||||||||||||
|
Healthcare - Products |
25,869,234 |
— |
— |
25,869,234 |
|||||||||||||||
See Notes to Financial Statements.
Semi-Annual Report | November 30, 2022
11
Arbitrage Fund Portfolio of Investments (continued)
November 30, 2022 (Unaudited)
|
Investments in Securities at Fair Value* |
Level 1 |
Level 2 |
Level 3 |
Total |
|||||||||||||||
|
Healthcare - Services |
$ |
58,238,927 |
$ |
— |
$ |
— |
$ |
58,238,927 |
|||||||||||
|
Home Furnishings |
20,509,135 |
— |
— |
20,509,135 |
|||||||||||||||
|
Insurance |
3,202,202 |
— |
— |
3,202,202 |
|||||||||||||||
|
Internet |
15,096,946 |
— |
— |
15,096,946 |
|||||||||||||||
|
Machinery - Diversified |
14,794,398 |
— |
— |
14,794,398 |
|||||||||||||||
|
Media |
54,181,689 |
— |
36,527,400 |
90,709,089 |
|||||||||||||||
|
Pharmaceuticals |
15,139,505 |
— |
— |
15,139,505 |
|||||||||||||||
|
Real Estate Investment Trusts |
42,092,989 |
— |
— |
42,092,989 |
|||||||||||||||
|
Semiconductors |
20,018,576 |
— |
— |
20,018,576 |
|||||||||||||||
|
Software |
215,027,892 |
— |
0 |
215,027,892 |
|||||||||||||||
|
Telecommunications |
65,377,845 |
— |
— |
65,377,845 |
|||||||||||||||
|
Transportation |
43,403,917 |
— |
— |
43,403,917 |
|||||||||||||||
|
Rights |
— |
857,631 |
1,339,867 |
2,197,498 |
|||||||||||||||
|
Convertible Corporate Bonds** |
— |
6,620,052 |
— |
6,620,052 |
|||||||||||||||
|
Mutual Funds |
72,923,232 |
— |
— |
72,923,232 |
|||||||||||||||
|
Private Investments |
— |
— |
581,400 |
581,400 |
|||||||||||||||
|
Warrants** |
29,160 |
— |
— |
29,160 |
|||||||||||||||
|
Purchased Options |
1,132,425 |
— |
— |
1,132,425 |
|||||||||||||||
|
Short-Term Investments |
262,868,138 |
— |
— |
262,868,138 |
|||||||||||||||
|
TOTAL |
$ |
1,294,612,490 |
$ |
7,477,683 |
$ |
54,120,835 |
$ |
1,356,211,008 |
|||||||||||
|
Other Financial Instruments*** |
|||||||||||||||||||
|
Assets |
|||||||||||||||||||
|
Forward Foreign Currency Exchange Contracts |
$ |
— |
$ |
3,325,803 |
$ |
— |
$ |
3,325,803 |
|||||||||||
|
Equity Swaps |
21,851 |
— |
— |
21,851 |
|||||||||||||||
|
Liabilities |
|||||||||||||||||||
|
Common Stocks** |
(5,985,763 |
) |
— |
— |
(5,985,763 |
) |
|||||||||||||
|
Written Options |
(0 |
) |
— |
— |
(0 |
) |
|||||||||||||
|
Forward Foreign Currency Exchange Contracts |
— |
(9,516,523 |
) |
— |
(9,516,523 |
) |
|||||||||||||
|
Equity Swaps |
(3,029,326 |
) |
— |
— |
(3,029,326 |
) |
|||||||||||||
|
TOTAL |
$ |
(8,993,238 |
) |
$ |
(6,190,720 |
) |
$ |
— |
$ |
(15,183,958 |
) |
||||||||
* Refer to Note 2 where leveling hierarchy is defined.
** Refer to Portfolio of Investments for sector information.
*** Other financial instruments are instruments such as written options, securities sold short, equity swaps and forward foreign currency exchange contracts.
See Notes to Financial Statements.
www.arbitragefunds.com | 1-800-295-4485
12
Arbitrage Fund Portfolio of Investments (continued)
November 30, 2022 (Unaudited)
The following is a reconciliation of the fair valuations using significant unobservable inputs (Level 3) for the Fund's assets and liabilities during the period ended November 30, 2022:
|
Investments in Securities |
Balance as of May 31, 2022 |
Realized Gain (Loss) |
Change in Unrealized Appreciation (Depreciation) |
Purchases |
Sales Proceeds |
Transfers into Level 3 |
Transfers out of Level 3 |
Balance as of November 30, 2022 |
Net change in Unrealized Appreciation (Depreciation) from investments still held as of November 30, 2022 |
||||||||||||||||||||||||||||||
|
Common Stocks |
$ |
68,815,638 |
$ |
245,437 |
$ |
(245,437 |
) |
$ |
— |
$ |
(16,616,070 |
) |
$ |
— |
$ |
— |
$ |
52,199,568 |
$ |
— |
|||||||||||||||||||
|
Rights |
1,277,503 |
— |
62,364 |
— |
— |
— |
— |
1,339,867 |
62,364 |
||||||||||||||||||||||||||||||
|
Private Investments |
290,700 |
— |
290,700 |
— |
— |
— |
— |
581,400 |
290,700 |
||||||||||||||||||||||||||||||
|
Total |
$ |
70,383,841 |
$ |
245,437 |
$ |
107,627 |
$ |
— |
$ |
(16,616,070 |
) |
$ |
— |
$ |
— |
$ |
54,120,835 |
$ |
353,064 |
||||||||||||||||||||
The following table summarizes the quantitative inputs used for investments categorized as Level 3 of the fair value hierarchy as of November 30, 2022:
|
Investments in Securities |
Fair Value at November 30, 2022 |
Valuation Technique |
Unobservable Input |
Range of Values |
Weighted Average |
||||||||||||||||||
|
Common Stocks |
$ |
52,199,568 |
Deal Value |
Final determination on Dissent |
$21-$24 |
$21.90 |
|||||||||||||||||
|
Rights |
1,339,867 |
Discounted, probability adjusted value |
Discount Rate, Probability |
10%, 16.14%-40.43% |
10%, 21.95% |
||||||||||||||||||
|
Private Investments |
581,400 |
Recovery Value |
Proceeds from winding down |
$2 |
$2.0000 |
||||||||||||||||||
See Notes to Financial Statements.
Semi-Annual Report | November 30, 2022
13
Water Island Event-Driven Fund Portfolio Information
November 30, 2022 (Unaudited)
Performance^ (annualized returns as of November 30, 2022)
|
One Year |
Five Year |
Ten Year |
Since Inception* |
||||||||||||||||
|
Water Island Event-Driven Fund Class R |
-0.09 |
% |
3.54 |
% |
2.17 |
% |
2.17 |
% |
|||||||||||
|
Water Island Event-Driven Fund Class I |
0.18 |
% |
3.80 |
% |
2.42 |
% |
2.42 |
% |
|||||||||||
|
Water Island Event-Driven Fund, Class A** |
-3.46 |
% |
2.84 |
% |
N/A |
1.57 |
% |
||||||||||||
|
ICE BofA U.S. 3-Month Treasury Bill Index |
1.10 |
% |
1.21 |
% |
0.73 |
% |
0.62 |
% |
|||||||||||
Current performance may be higher or lower than performance quoted above. Any performance data quoted represents past performance, and the investment return and principal value of an investment in the Fund will fluctuate so that an investor's shares, when redeemed, may be worth more or less than their original cost. Past performance is no guarantee of future results. Returns shown above include the reinvestment of all dividends and capital gains. Performance results do not include adjustments made for financial reporting purposes in accordance with U.S. generally accepted accounting principles and may differ from the amount reported in the Financial Highlights. Performance numbers reflect fee waivers and/or expense reimbursements by the Adviser and any recoupment by the Adviser of waived fees. Absent any applicable waivers and/or expense reimbursements, performance numbers would be reduced. You can obtain performance data current to the most recent month end by calling 1-800-295-4485 or going to www.arbitragefunds.com. This table does not reflect the deduction of taxes that a shareholder would pay on Fund distributions or the redemption of Fund shares.
^ After sales charge.
* Class R and Class I inception: 10/1/10; Class A inception: 6/1/13. The "Since Inception" returns for securities indices are for the inception date of Class R and Class I shares.
** Class A shares are subject to a maximum front-end sales load of 3.25% of the offering price and are also subject to a 1.00% contingent deferred sales load on purchases at or above $250,000 purchased without a front-end sales charge and redeemed within 18 months of purchase.
The Total Annual Fund Operating Expenses for Class R, Class I and Class A are 1.80%, 1.55% and 1.80%, respectively. The Adviser has contractually agreed to limit the total annual operating expenses of the Fund, not including taxes, interest, dividends on short positions, brokerage commissions, acquired fund fees and expenses, and other costs incurred in connection with the purchase or sale of portfolio securities, so they do not exceed 1.69%, 1.44% and 1.69% for Class R, Class I and Class A, respectively. The agreement remains in effect until September 30, 2023, unless terminated earlier by the Board of Trustees. These expense ratios are as stated in the current prospectus and may differ from the expense ratios disclosed in the financial highlights in this report.
The ICE BofA U.S. 3-Month Treasury Bill Index tracks the performance of the U.S. dollar denominated U.S. Treasury Bills publicly issued in the U.S. domestic market with a remaining term to final maturity of less than 3 months.
An investor may not invest directly in an index.
www.arbitragefunds.com | 1-800-295-4485
14
Water Island Event-Driven Fund Portfolio Information (continued)
November 30, 2022 (Unaudited)
Growth of $10,000 Investment
The chart represents historical performance of a hypothetical investment of $10,000 in the Class R shares of the Fund over ten years. Past performance does not guarantee future results. This chart does not reflect the deduction of taxes that a shareholder would pay on Fund distributions or the redemption of Fund shares.

Sector Weighting
The following chart shows the sector weightings of Water Island Event-Driven Fund's investments (including short sales and excluding derivatives) as of the report date.

* Concentration Risk: If a large percentage of mergers or event-driven investment opportunities taking place within the U.S. are within one industry over a given period of time, the Fund may invest a large portion of its assets in securities of issuers in a single industry for that period of time. During such a period of concentration, the Fund may be subject to greater volatility with respect to its portfolio securities than a fund that is more broadly diversified.
Semi-Annual Report | November 30, 2022
15
Water Island Event-Driven Fund Portfolio of Investments
November 30, 2022 (Unaudited)
|
Shares |
Value |
||||||||||
|
COMMON STOCKS - 72.45% |
|||||||||||
|
Aerospace & Defense - 1.54% |
|||||||||||
|
Aerojet Rocketdyne Holdings, Inc.(a) |
33,241 |
$ |
1,728,532 |
||||||||
|
Banks - 3.42% |
|||||||||||
|
First Horizon Corp. |
128,284 |
3,187,857 |
|||||||||
|
Home Capital Group, Inc. |
20,532 |
651,761 |
|||||||||
|
3,839,618 |
|||||||||||
|
Biotechnology - 1.35% |
|||||||||||
|
AVEO Pharmaceuticals, Inc.(a) |
34,422 |
514,609 |
|||||||||
|
Imago Biosciences, Inc.(a) |
9,049 |
322,959 |
|||||||||
|
Swedish Orphan Biovitrum AB(a) |
31,212 |
674,952 |
|||||||||
|
1,512,520 |
|||||||||||
|
Chemicals - 1.02% |
|||||||||||
|
Rogers Corp.(a) |
10,508 |
1,145,792 |
|||||||||
|
Commercial Services - 2.63% |
|||||||||||
|
Caverion Oyj |
53,072 |
384,378 |
|||||||||
|
Evo Payments, Inc., Class A(a) |
70,574 |
2,379,049 |
|||||||||
|
Moneylion, Inc.(a)(b) |
263,426 |
196,674 |
|||||||||
|
2,960,101 |
|||||||||||
|
Computers & Computer Services - 1.17% |
|||||||||||
|
KnowBe4, Inc., Class A(a) |
53,318 |
1,316,421 |
|||||||||
|
Construction Materials - 1.13% |
|||||||||||
|
Forterra, Inc.(a)(c) |
53,067 |
1,273,608 |
|||||||||
|
Diversified Financial Services - 1.17% |
|||||||||||
|
Cowen, Inc., Class A |
34,116 |
1,318,925 |
|||||||||
|
Electric - 4.29% |
|||||||||||
|
Electricite de France SA |
122,660 |
1,531,680 |
|||||||||
|
PNM Resources, Inc.(d) |
67,249 |
3,295,201 |
|||||||||
|
4,826,881 |
|||||||||||
|
Electrical Components & Equipment - 0.35% |
|||||||||||
|
Somfy SA |
2,633 |
393,450 |
|||||||||
|
Energy - Alternate Sources - 3.45% |
|||||||||||
|
Archaea Energy, Inc.(a)(d) |
106,475 |
2,761,962 |
|||||||||
|
Siemens Gamesa Renewable Energy SA(a) |
59,269 |
1,112,006 |
|||||||||
|
3,873,968 |
|||||||||||
|
Engineering & Construction - 0.51% |
|||||||||||
|
HomeServe Plc(a) |
40,134 |
576,105 |
|||||||||
See Notes to Financial Statements.
www.arbitragefunds.com | 1-800-295-4485
16
Water Island Event-Driven Fund Portfolio of Investments (continued)
November 30, 2022 (Unaudited)
|
Shares |
Value |
||||||||||
|
COMMON STOCKS - 72.45% (Continued) |
|||||||||||
|
Entertainment - 0.16% |
|||||||||||
|
Cineplex, Inc.(a) |
23,133 |
$ |
177,133 |
||||||||
|
Environmental Control - 0.72% |
|||||||||||
|
Biffa Plc(e) |
164,172 |
807,303 |
|||||||||
|
Forest Products & Paper - 1.10% |
|||||||||||
|
Resolute Forest Products, Inc.(a)(d) |
58,862 |
1,241,988 |
|||||||||
|
Gas - 2.43% |
|||||||||||
|
South Jersey Industries, Inc. |
78,614 |
2,727,906 |
|||||||||
|
Healthcare - Products - 1.73% |
|||||||||||
|
ABIOMED, Inc.(a) |
5,159 |
1,949,019 |
|||||||||
|
Healthcare - Services - 4.39% |
|||||||||||
|
Cano Health, Inc.(a) |
15,669 |
29,771 |
|||||||||
|
LHC Group, Inc.(a) |
14,545 |
2,376,798 |
|||||||||
|
Mediclinic International Plc |
147,780 |
882,010 |
|||||||||
|
Signify Health, Inc., Class A(a)(d) |
57,601 |
1,648,541 |
|||||||||
|
UpHealth, Inc.(a)(b) |
8,340 |
2,882 |
|||||||||
|
4,940,002 |
|||||||||||
|
Home Furnishings - 1.52% |
|||||||||||
|
iRobot Corp.(a) |
32,771 |
1,707,041 |
|||||||||
|
Insurance - 0.36% |
|||||||||||
|
Hartford Financial Services Group, Inc. (The) |
5,355 |
408,961 |
|||||||||
|
Internet - 1.17% |
|||||||||||
|
Just Eat Takeaway.com N.V.(a)(e) |
7,623 |
171,262 |
|||||||||
|
Poshmark, Inc., Class A(a) |
64,031 |
1,141,673 |
|||||||||
|
1,312,935 |
|||||||||||
|
Machinery - Diversified - 1.14% |
|||||||||||
|
Altra Industrial Motion Corp. |
21,882 |
1,282,723 |
|||||||||
|
Media - 6.53% |
|||||||||||
|
Shaw Communications, Inc., Class B |
21,912 |
597,993 |
|||||||||
|
Houghton Mifflin Harcourt Co.(a)(c) |
156,912 |
3,295,152 |
|||||||||
|
TEGNA, Inc.(d) |
174,541 |
3,445,439 |
|||||||||
|
7,338,584 |
|||||||||||
|
Pharmaceuticals - 1.17% |
|||||||||||
|
Myovant Sciences Ltd.(a) |
48,869 |
1,312,621 |
|||||||||
See Notes to Financial Statements.
Semi-Annual Report | November 30, 2022
17
Water Island Event-Driven Fund Portfolio of Investments (continued)
November 30, 2022 (Unaudited)
|
Shares |
Value |
||||||||||
|
COMMON STOCKS - 72.45% (Continued) |
|||||||||||
|
Real Estate Investment Trusts - 3.18% |
|||||||||||
|
STORE Capital Corp. |
101,741 |
$ |
3,245,538 |
||||||||
|
Summit Industrial Income REIT |
19,349 |
324,365 |
|||||||||
|
3,569,903 |
|||||||||||
|
Semiconductors - 1.39% |
|||||||||||
|
Magnachip Semiconductor Corp.(a) |
37,044 |
374,885 |
|||||||||
|
Silicon Motion Technology Corp., ADR(d) |
18,764 |
1,184,009 |
|||||||||
|
1,558,894 |
|||||||||||
|
Software - 15.36% |
|||||||||||
|
1Life Healthcare, Inc.(a) |
135,311 |
2,298,934 |
|||||||||
|
Activision Blizzard, Inc.(d) |
52,611 |
3,890,583 |
|||||||||
|
AVEVA Group Plc |
29,261 |
1,121,838 |
|||||||||
|
Black Knight, Inc.(a)(d) |
5,765 |
357,372 |
|||||||||
|
BTRS Holdings, Inc., Class 1(a) |
211,865 |
2,006,362 |
|||||||||
|
ForgeRock, Inc., Class A(a) |
72,568 |
1,578,354 |
|||||||||
|
Micro Focus International Plc |
122,402 |
770,376 |
|||||||||
|
Momentive Global, Inc.(a)(f) |
135,658 |
1,075,768 |
|||||||||
|
UserTesting, Inc.(a) |
173,588 |
1,288,023 |
|||||||||
|
VMware, Inc., Class A(a)(d) |
23,708 |
2,880,285 |
|||||||||
|
17,267,895 |
|||||||||||
|
Telecommunications - 4.78% |
|||||||||||
|
Sierra Wireless, Inc.(a) |
99,244 |
2,910,827 |
|||||||||
|
Switch, Inc., Class A |
71,836 |
2,460,383 |
|||||||||
|
5,371,210 |
|||||||||||
|
Transportation - 3.29% |
|||||||||||
|
Atlas Air Worldwide Holdings, Inc.(a) |
23,597 |
2,377,870 |
|||||||||
|
Atlas Corp. |
85,839 |
1,319,345 |
|||||||||
|
3,697,215 |
|||||||||||
|
TOTAL COMMON STOCKS (Cost $87,931,697) |
81,437,254 |
||||||||||
|
RIGHTS(a) - 0.08% |
|||||||||||
|
Bristol-Myers Squibb Co. CVR |
67,803 |
67,803 |
|||||||||
|
Contra Zogenix, Inc. CVR(c) |
26,158 |
19,077 |
|||||||||
|
TOTAL RIGHTS (Cost $128,568) |
86,880 |
||||||||||
See Notes to Financial Statements.
www.arbitragefunds.com | 1-800-295-4485
18
Water Island Event-Driven Fund Portfolio of Investments (continued)
November 30, 2022 (Unaudited)
|
Maturity Date |
Rate |
Principal Amount |
Value |
||||||||||||||||
|
CONVERTIBLE CORPORATE BONDS - 1.06% |
|||||||||||||||||||
|
Auto Manufacturers - 0.04% |
|||||||||||||||||||
|
Lightning eMotors, Inc.(e) |
05/15/2024 |
7.500 |
% |
$ |
79,000 |
$ |
46,910 |
||||||||||||
|
Entertainment - 0.28% |
|||||||||||||||||||
|
Cineplex, Inc.(e) |
09/30/2025 |
5.750 |
% |
392,000 |
313,839 |
||||||||||||||
|
Healthcare - Services - 0.40% |
|||||||||||||||||||
|
UpHealth, Inc.(e) |
06/15/2026 |
6.250 |
% |
217,000 |
64,558 |
||||||||||||||
|
UpHealth, Inc., Variable Rate, (SOFR plus 9.00%)(e) |
12/15/2025 |
12.810 |
% |
409,000 |
380,779 |
||||||||||||||
|
445,337 |
|||||||||||||||||||
|
Software - 0.34% |
|||||||||||||||||||
|
Kaleyra, Inc.(e) |
06/01/2026 |
6.125 |
% |
488,000 |
386,322 |
||||||||||||||
|
TOTAL CONVERTIBLE CORPORATE BONDS (Cost $1,481,431) |
1,192,408 |
||||||||||||||||||
|
Shares |
Value |
||||||||||
|
WARRANTS(a) - 0.00%(g) |
|||||||||||
|
Commercial Services - 0.00%(g) |
|||||||||||
|
Moneylion, Inc., Exercise Price $11.50, Expires 09/22/2026 |
22,640 |
$ |
2,264 |
||||||||
|
Healthcare - Services - 0.00%(g) |
|||||||||||
|
UpHealth, Inc., Exercise Price $11.50, Expires 07/01/2024(b) |
834 |
22 |
|||||||||
|
TOTAL WARRANTS (Cost $0) |
2,286 |
||||||||||
|
PRIVATE INVESTMENTS(a)(b)(c)(h) - 0.04% |
|||||||||||
|
Fast Capital LLC |
22,800 |
45,600 |
|||||||||
|
TOTAL PRIVATE INVESTMENTS (Cost $23,591) |
45,600 |
||||||||||
|
Expiration Date |
Exercise Price |
Notional Amount |
Contracts |
Value |
|||||||||||||||||||
|
PURCHASED OPTIONS(a) - 0.07% |
|||||||||||||||||||||||
|
Call Options Purchased - 0.06% |
|||||||||||||||||||||||
|
Broadcom, Inc. |
|||||||||||||||||||||||
|
12/2022 |
$ |
500.00 |
$ |
110,206 |
2 |
$ |
11,010 |
||||||||||||||||
|
12/2022 |
520.00 |
275,515 |
5 |
19,325 |
|||||||||||||||||||
|
12/2022 |
550.00 |
1,046,957 |
19 |
35,530 |
|||||||||||||||||||
|
Ironsource Ltd. |
12/2022 |
5.00 |
68,774 |
251 |
0 |
||||||||||||||||||
|
TOTAL CALL OPTIONS PURCHASED (Cost $112,328) |
65,865 |
||||||||||||||||||||||
See Notes to Financial Statements.
Semi-Annual Report | November 30, 2022
19
Water Island Event-Driven Fund Portfolio of Investments (continued)
November 30, 2022 (Unaudited)
|
Expiration Date |
Exercise Price |
Notional Amount |
Contracts |
Value |
|||||||||||||||||||
|
PURCHASED OPTIONS(a) - 0.07% (Continued) |
|||||||||||||||||||||||
|
Put Options Purchased - 0.01% |
|||||||||||||||||||||||
|
Momentive Global, Inc. |
12/2022 |
$ |
6.00 |
$ |
794,586 |
1,002 |
$ |
7,515 |
|||||||||||||||
|
Tenneco, Inc. |
01/2023 |
10.00 |
479,760 |
240 |
0 |
||||||||||||||||||
|
TOTAL PUT OPTIONS PURCHASED (Cost $85,251) |
7,515 |
||||||||||||||||||||||
|
TOTAL PURCHASED OPTIONS (Cost $197,579) |
73,380 |
||||||||||||||||||||||
|
Yield |
Shares |
Value |
|||||||||||||
|
SHORT-TERM INVESTMENTS - 19.21% |
|||||||||||||||
|
Money Market Funds |
|||||||||||||||
|
Morgan Stanley Institutional Liquidity Fund - Government Portfolio |
3.629 |
%(i) |
10,797,420 |
$ |
10,797,420 |
||||||||||
|
State Street Institutional U.S. Government Money Market Fund, Premier Class |
3.776 |
%(i) |
10,797,420 |
10,797,420 |
|||||||||||
|
21,594,840 |
|||||||||||||||
|
TOTAL SHORT-TERM INVESTMENTS (Cost $21,594,840) |
21,594,840 |
||||||||||||||
|
Total Investments - 92.91% (Cost $111,357,706) |
104,432,648 |
||||||||||||||
|
Other Assets in Excess of Liabilities - 7.09%(j) |
7,968,293 |
||||||||||||||
|
NET ASSETS - 100.00% |
$ |
112,400,941 |
|||||||||||||
Portfolio Footnotes
(a) Non-income-producing security.
(b) Restricted securities (including private placements) - The Fund may own investment securities that have other legal or contractual limitations. At the end of the period, the value of restricted securities (excluding 144A issues) amounted to $245,178 or 0.22% of net assets.
|
Restricted Security |
Acquisition Date |
Acquisition Cost |
|||||||||
|
Fast Capital LLC |
08/18/2020 |
$ |
23,591 |
||||||||
|
Moneylion, Inc. |
06/19/2020 |
1,926,135 |
|||||||||
|
UpHealth, Inc. |
06/08/2021 |
83,400 |
|||||||||
|
UpHealth, Inc., Exercise Price $11.50, Expires 07/01/2024 |
06/08/2021 |
— |
|||||||||
|
Total |
$ |
2,033,126 |
|||||||||
(c) Security fair valued using significant unobservable inputs and classified as a Level 3 security. As of November 30, 2022, the total fair market value of these securities was $4,633,437, representing 4.12% of net assets.
See Notes to Financial Statements.
www.arbitragefunds.com | 1-800-295-4485
20
Water Island Event-Driven Fund Portfolio of Investments (continued)
November 30, 2022 (Unaudited)
(d) Security, or a portion of security, is being held as collateral for short sales, written option contracts or forward foreign currency exchange contracts. At November 30, 2022, the aggregate fair market value of those securities was $9,554,560, representing 8.50% of net assets.
(e) Security exempt from registration under Rule 144A of the Securities Act of 1933. These securities may be resold in transactions exempt from registration, normally to qualified institutional buyers. As of November 30, 2022, these securities had a total value of $2,170,973 or 1.93% of net assets.
(f) Underlying security for a written/purchased call/put option.
(g) Less than 0.005% of net assets.
(h) Represents a holding that is a direct investment into a private company and is not a listed or publicly traded entity.
(i) Rate shown is the 7-day effective yield as of November 30, 2022.
(j) Includes cash held as collateral for short sales and written option contracts.
|
SCHEDULE OF SECURITIES SOLD SHORT |
Shares |
Value |
|||||||||
|
SECURITIES SOLD SHORT - (0.44%) |
|||||||||||
|
COMMON STOCKS SOLD SHORT - (0.44%) |
|||||||||||
|
Entertainment - (0.02%) |
|||||||||||
|
Cineplex, Inc. |
(3,228 |
) |
$ |
(24,717 |
) |
||||||
|
Semiconductors - (0.42%) |
|||||||||||
|
Broadcom, Inc. |
(371 |
) |
(204,432 |
) |
|||||||
|
MaxLinear, Inc. |
(7,281 |
) |
(266,485 |
) |
|||||||
|
(470,917 |
) |
||||||||||
|
TOTAL COMMON STOCKS SOLD SHORT (Proceeds $484,408) |
(495,634 |
) |
|||||||||
|
TOTAL SECURITIES SOLD SHORT (Proceeds $484,408) |
$ |
(495,634 |
) |
||||||||
|
WRITTEN OPTIONS |
Expiration Date |
Exercise Price |
Notional Amount |
Contracts |
Value |
||||||||||||||||||
|
Written Put Options |
|||||||||||||||||||||||
|
Tenneco, Inc. |
01/2023 |
$ |
5.00 |
$ |
(7,996 |
) |
(4 |
) |
$ |
(0 |
) |
||||||||||||
|
TOTAL WRITTEN OPTIONS (Premiums received $13) |
$ |
(0 |
) |
||||||||||||||||||||
See Notes to Financial Statements.
Semi-Annual Report | November 30, 2022
21
Water Island Event-Driven Fund Portfolio of Investments (continued)
November 30, 2022 (Unaudited)
EQUITY SWAP CONTRACTS
|
Swap Counterparty/ Payment Frequency |
Reference Obligation |
Rate Paid/ Received by the Fund |
Termination Date |
Upfront Payments Made |
Upfront Payments Received |
Market Value |
Notional Amount |
Unrealized Appreciation |
|||||||||||||||||||||||||||
|
Morgan Stanley & Co./ Monthly |
Distell Group Holdings Ltd. |
Paid 1 Month SABOR Plus 125 bps (7.320%) |
11/17/2022 |
$ |
— |
$ |
— |
$ |
0 |
ZAR |
1,140,749 |
$ |
0 |
||||||||||||||||||||||
|
Goldman Sachs & Co./ Monthly |
Distell Group Holdings Ltd. |
Paid 1 Month JIBAR Plus 95 bps (7.342%) |
11/20/2023 |
— |
— |
4,546 |
ZAR |
5,097,392 |
4,546 |
||||||||||||||||||||||||||
|
$ |
4,546 |
$ |
4,546 |
||||||||||||||||||||||||||||||||
|
Swap Counterparty/ Payment Frequency |
Reference Obligation |
Rate Paid/ Received by the Fund |
Termination Date |
Upfront Payments Made |
Upfront Payments Received |
Market Value |
Notional Amount |
Unrealized Depreciation |
|||||||||||||||||||||||||||
|
Morgan Stanley & Co./ Monthly |
Broadcom, Inc. |
Received 1 Month- Federal Rate Minus 40 bps (-3.430%) |
10/29/2024 |
$ |
— |
$ |
— |
$ |
(211,580 |
) |
USD |
1,229,364 |
$ |
(211,580 |
) |
||||||||||||||||||||
|
Morgan Stanley & Co./ Monthly |
Intercontinental Exchange, Inc. |
Received 1 Month- Federal Rate Minus 40 bps (-3.430%) |
10/29/2024 |
— |
— |
(10,421 |
) |
USD |
78,176 |
(10,421 |
) |
||||||||||||||||||||||||
|
$ |
(222,001 |
) |
$ |
(222,001 |
) |
||||||||||||||||||||||||||||||
See Notes to Financial Statements.
www.arbitragefunds.com | 1-800-295-4485
22
Water Island Event-Driven Fund Portfolio of Investments (continued)
November 30, 2022 (Unaudited)
OUTSTANDING FORWARD FOREIGN CURRENCY EXCHANGE CONTRACTS
|
Currency Purchased |
Currency Sold |
Counterparty |
Settlement Date |
Unrealized Appreciation |
|||||||||||||||
|
CAD |
34,500 |
USD |
25,051 |
Morgan Stanley & Co. |
12/15/2022 |
$ |
601 |
||||||||||||
|
USD |
1,896,399 |
CAD |
2,513,300 |
Morgan Stanley & Co. |
12/15/2022 |
27,640 |
|||||||||||||
|
EUR |
3,632,400 |
USD |
3,683,927 |
Morgan Stanley & Co. |
12/15/2022 |
99,860 |
|||||||||||||
|
GBP |
586,200 |
USD |
650,337 |
Morgan Stanley & Co. |
12/15/2022 |
56,489 |
|||||||||||||
|
SEK |
1,613,800 |
USD |
146,487 |
Morgan Stanley & Co. |
12/15/2022 |
7,310 |
|||||||||||||
|
USD |
40,083 |
SEK |
418,200 |
Morgan Stanley & Co. |
12/15/2022 |
228 |
|||||||||||||
|
$ |
192,128 |
||||||||||||||||||
|
Currency Purchased |
Currency Sold |
Counterparty |
Settlement Date |
Unrealized Depreciation |
|||||||||||||||
|
USD |
237,678 |
CAD |
324,100 |
Morgan Stanley & Co. |
12/15/2022 |
$ |
(3,306 |
) |
|||||||||||
|
USD |
7,913,026 |
EUR |
7,877,500 |
Morgan Stanley & Co. |
12/15/2022 |
(292,784 |
) |
||||||||||||
|
USD |
4,655,840 |
GBP |
4,050,200 |
Morgan Stanley & Co. |
12/15/2022 |
(227,792 |
) |
||||||||||||
|
SEK |
14,900,800 |
USD |
1,445,420 |
Morgan Stanley & Co. |
12/15/2022 |
(25,367 |
) |
||||||||||||
|
USD |
2,175,079 |
SEK |
23,228,300 |
Morgan Stanley & Co. |
12/15/2022 |
(38,589 |
) |
||||||||||||
|
$ |
(587,838 |
) |
|||||||||||||||||
The following is a summary of investments classified by country exposure:
|
Country |
% of Net Assets(a) |
||||||
|
United States |
77.26 |
% |
|||||
|
Canada |
5.60 |
% |
|||||
|
United Kingdom |
4.87 |
% |
|||||
|
France |
1.71 |
% |
|||||
|
Taiwan |
1.05 |
% |
|||||
|
Spain |
0.99 |
% |
|||||
|
Sweden |
0.60 |
% |
|||||
|
Finland |
0.34 |
% |
|||||
|
Republic of Korea |
0.34 |
% |
|||||
|
Netherlands |
0.15 |
% |
|||||
|
Other Assets in Excess of Liabilities |
7.09 |
% |
|||||
|
100.00 |
% |
||||||
(a) These percentages represent long positions only and are not net of short positions.
Abbreviations:
AB - Aktiebolag is the Swedish term for a limited company.
ADR - American Depositary Receipt
bps - Basis Points. 100 Basis Points is equal to 1 percentage point.
CAD - Canadian dollar
CVR - Contingent Value Rights
EUR - Euro
See Notes to Financial Statements.
Semi-Annual Report | November 30, 2022
23
Water Island Event-Driven Fund Portfolio of Investments (continued)
November 30, 2022 (Unaudited)
GBP - British pound
JIBAR - Johannesburg Interbank Agreed Rate
LLC - Limited Liability Company
Ltd. - Limited
N.V. - Naamloze Vennootschap is the Dutch term for a public limited liability corporation.
Oyj - Osakeyhtio is the Finnish equivalent of a public limited company.
Plc - Public Limited Company
REIT - Real Estate Investment Trust
SA - Generally designates corporations in various countries, mostly those employing civil law. This translates literally in all languages mentioned as anonymous company.
SABOR - South African Benchmark Overnight Rate
SEK - Swedish krona
SOFR - Secured Overnight Financing Rate
USD - United States Dollar
ZAR - South African rand
The following table summarizes the Water Island Event-Driven Fund's investments and derivative financial instruments categorized in the fair value hierarchy as of November 30, 2022:
|
Investments in Securities at Fair Value* |
Level 1 |
Level 2 |
Level 3 |
Total |
|||||||||||||||
|
Assets |
|||||||||||||||||||
|
Common Stocks |
|||||||||||||||||||
|
Aerospace & Defense |
$ |
1,728,532 |
$ |
— |
$ |
— |
$ |
1,728,532 |
|||||||||||
|
Banks |
3,839,618 |
— |
— |
3,839,618 |
|||||||||||||||
|
Biotechnology |
1,512,520 |
— |
— |
1,512,520 |
|||||||||||||||
|
Chemicals |
1,145,792 |
— |
— |
1,145,792 |
|||||||||||||||
|
Commercial Services |
2,960,101 |
— |
— |
2,960,101 |
|||||||||||||||
|
Computers & Computer Services |
1,316,421 |
— |
— |
1,316,421 |
|||||||||||||||
|
Construction Materials |
— |
— |
1,273,608 |
1,273,608 |
|||||||||||||||
|
Diversified Financial Services |
1,318,925 |
— |
— |
1,318,925 |
|||||||||||||||
|
Electric |
4,826,881 |
— |
— |
4,826,881 |
|||||||||||||||
|
Electrical Components & Equipment |
393,450 |
— |
— |
393,450 |
|||||||||||||||
|
Energy - Alternate Sources |
3,873,968 |
— |
— |
3,873,968 |
|||||||||||||||
|
Engineering & Construction |
576,105 |
— |
— |
576,105 |
|||||||||||||||
|
Entertainment |
177,133 |
— |
— |
177,133 |
|||||||||||||||
|
Environmental Control |
807,303 |
— |
— |
807,303 |
|||||||||||||||
|
Forest Products & Paper |
1,241,988 |
— |
— |
1,241,988 |
|||||||||||||||
|
Gas |
2,727,906 |
— |
— |
2,727,906 |
|||||||||||||||
|
Healthcare - Products |
1,949,019 |
— |
— |
1,949,019 |
|||||||||||||||
|
Healthcare - Services |
4,940,002 |
— |
— |
4,940,002 |
|||||||||||||||
|
Home Furnishings |
1,707,041 |
— |
— |
1,707,041 |
|||||||||||||||
|
Insurance |
408,961 |
— |
— |
408,961 |
|||||||||||||||
|
Internet |
1,312,935 |
— |
— |
1,312,935 |
|||||||||||||||
|
Machinery - Diversified |
1,282,723 |
— |
— |
1,282,723 |
|||||||||||||||
|
Media |
4,043,432 |
— |
3,295,152 |
7,338,584 |
|||||||||||||||
|
Pharmaceuticals |
1,312,621 |
— |
— |
1,312,621 |
|||||||||||||||
|
Real Estate Investment Trusts |
3,569,903 |
— |
— |
3,569,903 |
|||||||||||||||
|
Semiconductors |
1,558,894 |
— |
— |
1,558,894 |
|||||||||||||||
See Notes to Financial Statements.
www.arbitragefunds.com | 1-800-295-4485
24
Water Island Event-Driven Fund Portfolio of Investments (continued)
November 30, 2022 (Unaudited)
|
Investments in Securities at Fair Value* |
Level 1 |
Level 2 |
Level 3 |
Total |
|||||||||||||||
|
Software |
$ |
17,267,895 |
$ |
— |
$ |
— |
$ |
17,267,895 |
|||||||||||
|
Telecommunications |
5,371,210 |
— |
— |
5,371,210 |
|||||||||||||||
|
Transportation |
3,697,215 |
— |
— |
3,697,215 |
|||||||||||||||
|
Rights |
— |
67,803 |
19,077 |
86,880 |
|||||||||||||||
|
Convertible Corporate Bonds** |
— |
1,192,408 |
— |
1,192,408 |
|||||||||||||||
|
Warrants** |
2,286 |
— |
— |
2,286 |
|||||||||||||||
|
Private Investments |
— |
— |
45,600 |
45,600 |
|||||||||||||||
|
Purchased Options |
73,380 |
— |
— |
73,380 |
|||||||||||||||
|
Short-Term Investments |
21,594,840 |
— |
— |
21,594,840 |
|||||||||||||||
|
TOTAL |
$ |
98,539,000 |
$ |
1,260,211 |
$ |
4,633,437 |
$ |
104,432,648 |
|||||||||||
|
Other Financial Instruments*** |
|||||||||||||||||||
|
Assets |
|||||||||||||||||||
|
Forward Foreign Currency Exchange Contracts |
$ |
— |
$ |
192,128 |
$ |
— |
$ |
192,128 |
|||||||||||
|
Equity Swaps |
4,546 |
— |
— |
4,546 |
|||||||||||||||
|
Liabilities |
|||||||||||||||||||
|
Common Stocks** |
(495,634 |
) |
— |
— |
(495,634 |
) |
|||||||||||||
|
Written Options |
(0 |
) |
— |
— |
(0 |
) |
|||||||||||||
|
Forward Foreign Currency Exchange Contracts |
— |
(587,838 |
) |
— |
(587,838 |
) |
|||||||||||||
|
Equity Swaps |
(222,001 |
) |
— |
— |
(222,001 |
) |
|||||||||||||
|
TOTAL |
$ |
(713,089 |
) |
$ |
(395,710 |
) |
$ |
— |
$ |
(1,108,799 |
) |
||||||||
* Refer to Note 2 where leveling hierarchy is defined.
** Refer to Portfolio of Investments for sector information.
*** Other financial instruments are instruments such as written options, securities sold short, equity swaps and forward foreign currency exchange contracts.
The following is a reconciliation of the fair valuations using significant unobservable inputs (Level 3) for the Fund's assets and liabilities during the period ended November 30, 2022:
|
Investments in Securities |
Balance as of May 31, 2022 |
Realized Gain (Loss) |
Change in Unrealized Appreciation (Depreciation) |
Purchases |
Sales Proceeds |
Transfers into Level 3 |
Transfers out of Level 3 |
Balance as of November 30, 2022 |
Net change in Unrealized Appreciation (Depreciation) from investments still held as of November 30, 2022 |
||||||||||||||||||||||||||||||
|
Common Stocks |
$ |
6,103,595 |
$ |
22,683 |
$ |
(22,683 |
) |
$ |
— |
$ |
(1,534,835 |
) |
$ |
— |
$ |
— |
$ |
4,568,760 |
$ |
— |
|||||||||||||||||||
|
Rights |
18,187 |
890 |
— |
— |
— |
— |
19,077 |
890 |
|||||||||||||||||||||||||||||||
|
Private Investments |
22,800 |
— |
22,800 |
— |
— |
— |
— |
45,600 |
22,800 |
||||||||||||||||||||||||||||||
|
Total |
$ |
6,144,582 |
$ |
22,683 |
$ |
1,007 |
$ |
— |
$ |
(1,534,835 |
) |
$ |
— |
$ |
— |
$ |
4,633,437 |
$ |
23,690 |
||||||||||||||||||||
See Notes to Financial Statements.
Semi-Annual Report | November 30, 2022
25
Water Island Event-Driven Fund Portfolio of Investments (continued)
November 30, 2022 (Unaudited)
The following table summarizes the quantitative inputs used for investments categorized as Level 3 of the fair value hierarchy as of November 30, 2022:
|
Investments in Securities |
Fair Value at November 30, 2022 |
Valuation Technique |
Unobservable Input |
Range of Values |
Weighted Average |
||||||||||||||||||
|
Common Stocks |
$ |
4,568,760 |
Deal Value |
Final determination on Dissent |
$21-$24 |
$21.83 |
|||||||||||||||||
|
Rights |
19,077 |
Discounted, probability adjusted value |
Discount Rate, Probability |
10%, 40.43% |
10%, 40.43% |
||||||||||||||||||
|
Private Investments |
45,600 |
Recovery Value |
Proceeds from winding down |
$2 |
$2.0000 |
||||||||||||||||||
See Notes to Financial Statements.
www.arbitragefunds.com | 1-800-295-4485
26
Water Island Credit Opportunities Fund Portfolio Information
November 30, 2022 (Unaudited)
Performance^ (annualized returns as of November 30, 2022)
|
One Year |
Five Year |
Ten Year |
Since Inception* |
||||||||||||||||
|
Water Island Credit Opportunities Fund, Class R |
-1.72 |
% |
2.92 |
% |
2.48 |
% |
2.45 |
% |
|||||||||||
|
Water Island Credit Opportunities Fund, Class I |
-1.49 |
% |
3.17 |
% |
2.72 |
% |
2.69 |
% |
|||||||||||
|
Water Island Credit Opportunities Fund, Class A** |
-4.95 |
% |
2.25 |
% |
N/A |
2.01 |
% |
||||||||||||
|
ICE BofA U.S. 3-Month Treasury Bill Index |
1.10 |
% |
1.21 |
% |
0.73 |
% |
0.72 |
% |
|||||||||||
|
Bloomberg U.S. Aggregate Bond Index |
-12.84 |
% |
0.21 |
% |
1.09 |
% |
1.10 |
% |
|||||||||||
Current performance may be higher or lower than performance quoted above. Any performance data quoted represents past performance and the investment return and principal value of an investment in the Fund will fluctuate so that an investor's shares, when redeemed, may be worth more or less than their original cost. Past performance is no guarantee of future results. Returns shown above include the reinvestment of all dividends and capital gains. Performance results do not include adjustments made for financial reporting purposes in accordance with U.S. generally accepted accounting principles and may differ from the amount reported in the Financial Highlights. Contractual fee waivers are currently in effect. Without such fee waivers, performance numbers would be reduced. You can obtain performance data current to the most recent month end by calling 1-800-295-4485 or going to www.arbitragefunds.com. This table does not reflect the deduction of taxes that a shareholder would pay on Fund distributions or the redemption of Fund shares.
^ After sales charge.
* Class R and Class I inception: 10/1/12; Class A inception: 6/1/13. The "Since Inception" returns for securities indices are for the inception date of Class R and Class I shares.
** Class A shares are subject to a maximum front-end sales load of 3.25% of the offering price and are also subject to a 1.00% contingent deferred sales load on purchases at or above $250,000 purchased without a front-end sales charge and redeemed within 18 months of purchase.
The Total Annual Fund Operating Expenses for Class R, Class I and Class A are 1.62%, 1.37% and 1.62%, respectively. The Adviser has contractually agreed to limit the total annual operating expenses of the Fund, not including taxes, interest, dividends on short positions, brokerage commissions, acquired fund fees and expenses and other costs incurred in connection with the purchase or sale of portfolio securities, so they do not exceed 1.23%, 0.98% and 1.23% for Class R, Class I and Class A, respectively. The agreement remains in effect until September 30, 2023, unless terminated earlier by the Board of Trustees. These expense ratios are as stated in the current prospectus and may differ from the expense ratios disclosed in the financial highlights in this report.
The ICE BofA U.S. 3-Month Treasury Bill Index tracks the performance of the U.S. dollar denominated U.S. Treasury Bills publicly issued in the U.S. domestic market with a remaining term to final maturity of less than 3 months.
The Bloomberg U.S. Aggregate Bond Index is a market value-weighted index of investment grade fixed-rated debt issues, including government, corporate, asset-backed and mortgage-backed securities with a maturity of one year or more.
An investor may not invest directly in an index.
Semi-Annual Report | November 30, 2022
27
Water Island Credit Opportunities Fund Portfolio Information (continued)
November 30, 2022 (Unaudited)
Growth of $10,000 Investment
The chart represents historical performance of a hypothetical investment of $10,000 in the Class R shares of the Fund since inception. Past performance does not guarantee future results. This chart does not reflect the deduction of taxes that a shareholder would pay on Fund distributions or the redemption of Fund shares.

Sector Weighting
The following chart shows the sector weightings of Water Island Credit Opportunities Fund's investments (including short sales and excluding derivatives) as of the report date.

www.arbitragefunds.com | 1-800-295-4485
28
Water Island Credit Opportunities Fund Portfolio of Investments
November 30, 2022 (Unaudited)
|
Maturity Date |
Rate |
Principal Amount |
Value |
||||||||||||||||
|
BANK LOAN - 4.11% |
|||||||||||||||||||
|
Commercial Services - 4.11% |
|||||||||||||||||||
|
Moneygram International, Inc., 2021 Term Loan B, Variable Rate, (1 mo. USD LIBOR plus 4.50%) |
07/21/2026 |
8.571 |
% |
$ |
4,960,938 |
$ |
4,933,057 |
||||||||||||
|
TOTAL BANK LOANS (Cost $4,971,219) |
4,933,057 |
||||||||||||||||||
|
CORPORATE BONDS - 49.23% |
|||||||||||||||||||
|
Aerospace & Defense - 1.03% |
|||||||||||||||||||
|
Howmet Aerospace, Inc. |
10/01/2024 |
5.125 |
% |
1,250,000 |
1,238,594 |
||||||||||||||
|
Banks - 0.75% |
|||||||||||||||||||
|
Truist Financial Corp., Variable Rate, (3 mo. USD LIBOR plus 0.65%)(a) |
03/15/2028 |
3.943 |
% |
1,000,000 |
900,000 |
||||||||||||||
|
Chemicals - 2.56% |
|||||||||||||||||||
|
Valvoline, Inc.(a)(b) |
02/15/2030 |
4.250 |
% |
3,160,000 |
3,071,232 |
||||||||||||||
|
Distribution/Wholesale - 2.86% |
|||||||||||||||||||
|
IAA, Inc.(b) |
06/15/2027 |
5.500 |
% |
3,500,000 |
3,438,750 |
||||||||||||||
|
Diversified Financial Services - 3.15% |
|||||||||||||||||||
|
Cowen, Inc.(a)(b) |
05/06/2024 |
7.250 |
% |
3,750,000 |
3,785,998 |
||||||||||||||
|
Electrical Components & Equipment - 0.08% |
|||||||||||||||||||
|
WESCO Distribution, Inc.(b) |
06/15/2025 |
7.125 |
% |
100,000 |
101,250 |
||||||||||||||
|
Entertainment - 0.90% |
|||||||||||||||||||
|
Caesars Entertainment, Inc.(b) |
07/01/2025 |
6.250 |
% |
1,090,000 |
1,077,250 |
||||||||||||||
|
Food - 3.68% |
|||||||||||||||||||
|
Chobani LLC / Chobani Finance Corp., Inc.(a)(b) |
04/15/2025 |
7.500 |
% |
3,749,000 |
3,664,498 |
||||||||||||||
|
US Foods, Inc.(b) |
04/15/2025 |
6.250 |
% |
750,000 |
757,005 |
||||||||||||||
|
4,421,503 |
|||||||||||||||||||
|
Hand/Machine Tools - 2.00% |
|||||||||||||||||||
|
Werner FinCo LP / Werner FinCo, Inc.(b) |
07/15/2025 |
8.750 |
% |
3,000,000 |
2,400,000 |
||||||||||||||
|
Internet - 6.07% |
|||||||||||||||||||
|
Gen Digital, Inc.(a)(b) |
04/15/2025 |
5.000 |
% |
1,407,000 |
1,364,790 |
||||||||||||||
|
Getty Images, Inc.(b) |
03/01/2027 |
9.750 |
% |
6,000,000 |
5,925,000 |
||||||||||||||
|
7,289,790 |
|||||||||||||||||||
See Notes to Financial Statements.
Semi-Annual Report | November 30, 2022
29
Water Island Credit Opportunities Fund Portfolio of Investments (continued)
November 30, 2022 (Unaudited)
|
Maturity Date |
Rate |
Principal Amount |
Value |
||||||||||||||||
|
CORPORATE BONDS - 49.23% (Continued) |
|||||||||||||||||||
|
Machinery - Diversified - 3.10% |
|||||||||||||||||||
|
JPW Industries Holding Corp.(a)(b) |
10/01/2024 |
9.000 |
% |
$ |
2,000,000 |
$ |
1,707,500 |
||||||||||||
|
Stevens Holding Co., Inc.(b) |
10/01/2026 |
6.125 |
% |
2,000,000 |
2,016,820 |
||||||||||||||
|
3,724,320 |
|||||||||||||||||||
|
Office/Business Equip - 2.56% |
|||||||||||||||||||
|
Xerox Holdings Corp.(a)(b) |
08/15/2025 |
5.000 |
% |
3,307,000 |
3,075,146 |
||||||||||||||
|
Oil & Gas - 2.59% |
|||||||||||||||||||
|
Par Petroleum LLC / Par Petroleum Finance Corp.(b) |
12/15/2025 |
7.750 |
% |
3,190,000 |
3,110,250 |
||||||||||||||
|
Packaging & Containers - 0.94% |
|||||||||||||||||||
|
LABL, Inc.(b) |
07/15/2026 |
6.750 |
% |
1,175,000 |
1,122,125 |
||||||||||||||
|
Real Estate Investment Trusts - 8.30% |
|||||||||||||||||||
|
iStar, Inc.(a) |
10/01/2024 |
4.750 |
% |
2,295,000 |
2,257,950 |
||||||||||||||
|
02/15/2026 |
5.500 |
% |
2,900,000 |
2,895,528 |
|||||||||||||||
|
Uniti Group LP / Uniti Fiber Holdings, Inc. / CSL Capital LLC(b) |
02/15/2025 |
7.875 |
% |
4,796,000 |
4,816,158 |
||||||||||||||
|
9,969,636 |
|||||||||||||||||||
|
Software - 0.60% |
|||||||||||||||||||
|
PTC, Inc.(a)(b) |
02/15/2025 |
3.625 |
% |
750,000 |
714,947 |
||||||||||||||
|
Telecommunications - 8.06% |
|||||||||||||||||||
|
Altice France Holding SA(b) |
05/15/2027 |
10.500 |
% |
6,500,000 |
5,135,000 |
||||||||||||||
|
Switch Ltd.(b) |
09/15/2028 |
3.750 |
% |
4,500,000 |
4,536,462 |
||||||||||||||
|
9,671,462 |
|||||||||||||||||||
|
TOTAL CORPORATE BONDS (Cost $62,717,707) |
59,112,253 |
||||||||||||||||||
|
CONVERTIBLE CORPORATE BONDS - 20.45% |
|||||||||||||||||||
|
Aerospace & Defense - 2.31% |
|||||||||||||||||||
|
Kaman Corp.(a) |
05/01/2024 |
3.250 |
% |
3,000,000 |
2,776,500 |
||||||||||||||
|
Auto Manufacturers - 0.48% |
|||||||||||||||||||
|
Lightning eMotors, Inc.(b) |
05/15/2024 |
7.500 |
% |
973,000 |
577,767 |
||||||||||||||
|
Commercial Services - 1.63% |
|||||||||||||||||||
|
Block, Inc.(a) |
03/01/2025 |
0.125 |
% |
2,000,000 |
1,952,500 |
||||||||||||||
|
Diversified Financial Services - 1.12% |
|||||||||||||||||||
|
WisdomTree, Inc. |
06/15/2026 |
3.250 |
% |
1,500,000 |
1,349,250 |
||||||||||||||
|
Entertainment - 0.38% |
|||||||||||||||||||
|
Cineplex, Inc.(b) |
09/30/2025 |
5.750 |
% |
567,000 |
453,946 |
||||||||||||||
See Notes to Financial Statements.
www.arbitragefunds.com | 1-800-295-4485
30
Water Island Credit Opportunities Fund Portfolio of Investments (continued)
November 30, 2022 (Unaudited)
|
Maturity Date |
Rate |
Principal Amount |
Value |
||||||||||||||||
|
CONVERTIBLE CORPORATE BONDS - 20.45% (Continued) |
|||||||||||||||||||
|
Healthcare - Services - 0.90% |
|||||||||||||||||||
|
UpHealth, Inc.(b) |
06/15/2026 |
6.250 |
% |
$ |
689,000 |
$ |
204,978 |
||||||||||||
|
UpHealth, Inc., Variable Rate, (SOFR plus 9.00%)(b) |
12/15/2025 |
12.810 |
% |
938,000 |
873,278 |
||||||||||||||
|
1,078,256 |
|||||||||||||||||||
|
Internet - 5.23% |
|||||||||||||||||||
|
Spotify USA, Inc.(c) |
03/15/2026 |
0.000 |
% |
3,500,000 |
2,798,250 |
||||||||||||||
|
Zendesk, Inc. |
06/15/2025 |
0.625 |
% |
3,500,000 |
3,480,400 |
||||||||||||||
|
6,278,650 |
|||||||||||||||||||
|
Pharmaceuticals - 1.64% |
|||||||||||||||||||
|
Paratek Pharmaceuticals, Inc.(a) |
05/01/2024 |
4.750 |
% |
2,250,000 |
1,973,025 |
||||||||||||||
|
Software - 6.76% |
|||||||||||||||||||
|
1Life Healthcare, Inc.(a) |
06/15/2025 |
3.000 |
% |
1,000,000 |
965,500 |
||||||||||||||
|
Avalara, Inc. |
08/01/2026 |
0.250 |
% |
3,000,000 |
2,992,500 |
||||||||||||||
|
Kaleyra, Inc.(a)(b) |
06/01/2026 |
6.125 |
% |
1,900,000 |
1,504,123 |
||||||||||||||
|
RingCentral, Inc.(a)(c) |
03/01/2025 |
0.000 |
% |
3,105,000 |
2,654,775 |
||||||||||||||
|
8,116,898 |
|||||||||||||||||||
|
TOTAL CONVERTIBLE CORPORATE BONDS (Cost $28,128,352) |
24,556,792 |
||||||||||||||||||
|
Shares |
Value |
||||||||||
|
WARRANTS(d) - 0.00%(e) |
|||||||||||
|
Auto Manufacturers - 0.00%(e) |
|||||||||||
|
Lightning eMotors, Inc., Exercise Price $11.50, Expires 05/18/2025 |
53,913 |
$ |
3,774 |
||||||||
|
TOTAL WARRANTS (Cost $0) |
3,774 |
||||||||||
|
Expiration Date |
Exercise Price |
Notional Amount |
Contracts |
Value |
|||||||||||||||||||
|
PURCHASED OPTIONS(d) - 0.32% |
|||||||||||||||||||||||
|
Call Options Purchased - 0.32% |
|||||||||||||||||||||||
|
Caesars Entertainment, Inc. |
01/2023 |
$ |
50.00 |
$ |
508,100 |
100 |
$ |
47,750 |
|||||||||||||||
|
Gen Digital, Inc. |
12/2022 |
23.00 |
803,600 |
350 |
18,375 |
||||||||||||||||||
|
Howmet Aerospace, Inc. |
01/2023 |
35.00 |
791,070 |
210 |
82,950 |
||||||||||||||||||
|
Par Pacific Holdings, Inc. |
12/2022 |
25.00 |
2,343,000 |
1,000 |
50,000 |
||||||||||||||||||
|
SPDR S&P 500 ETF Trust |
01/2023 |
425.00 |
10,192,000 |
250 |
117,625 |
||||||||||||||||||
|
Uniti Group, Inc. |
02/2023 |
9.00 |
762,000 |
1,000 |
17,500 |
||||||||||||||||||
See Notes to Financial Statements.
Semi-Annual Report | November 30, 2022
31
Water Island Credit Opportunities Fund Portfolio of Investments (continued)
November 30, 2022 (Unaudited)
|
Expiration Date |
Exercise Price |
Notional Amount |
Contracts |
Value |
|||||||||||||||||||
|
PURCHASED OPTIONS(d) - 0.32% (Continued) |
|||||||||||||||||||||||
|
Call Options Purchased - 0.32% (Continued) |
|||||||||||||||||||||||
|
WESCO International, Inc. |
12/2022 |
$ |
150.00 |
$ |
644,600 |
50 |
$ |
1,000 |
|||||||||||||||
|
Xerox Holdings Corp. |
01/2023 |
17.00 |
1,141,700 |
700 |
42,000 |
||||||||||||||||||
|
TOTAL CALL OPTIONS PURCHASED (Cost $394,675) |
377,200 |
||||||||||||||||||||||
|
TOTAL PURCHASED OPTIONS (Cost $394,675) |
377,200 |
||||||||||||||||||||||
|
Yield |
Shares |
Value |
|||||||||||||
|
SHORT-TERM INVESTMENTS - 14.09% |
|||||||||||||||
|
Money Market Funds |
|||||||||||||||
|
Morgan Stanley Institutional Liquidity Fund - Government Portfolio |
3.629 |
%(f) |
8,458,173 |
$ |
8,458,173 |
||||||||||
|
State Street Institutional U.S. Government Money Market Fund, Premier Class |
3.776 |
%(f) |
8,458,172 |
8,458,172 |
|||||||||||
|
16,916,345 |
|||||||
|
TOTAL SHORT-TERM INVESTMENTS (Cost $16,916,345) |
16,916,345 |
||||||
|
Total Investments - 88.20% (Cost $113,128,298) |
105,899,421 |
||||||
|
Other Assets in Excess of Liabilities - 11.80%(g) |
14,169,439 |
||||||
|
NET ASSETS - 100.00% |
$ |
120,068,860 |
|||||
Portfolio Footnotes
(a) Security, or a portion of security, is being held as collateral for short sales or forward foreign currency exchange contracts. At November 30, 2022, the aggregate fair market value of those securities was $32,048,314, representing 26.69% of net assets.
(b) Security exempt from registration under Rule 144A of the Securities Act of 1933. These securities may be resold in transactions exempt from registration, normally to qualified institutional buyers. As of November 30, 2022, these securities had a total value of $55,434,273 or 46.17% of net assets.
(c) Represents a zero coupon bond.
(d) Non-income-producing security.
(e) Less than 0.005% of net assets.
(f) Rate shown is the 7-day effective yield as of November 30, 2022.
(g) Includes cash held as collateral for short sales.
See Notes to Financial Statements.
www.arbitragefunds.com | 1-800-295-4485
32
Water Island Credit Opportunities Fund Portfolio of Investments (continued)
November 30, 2022 (Unaudited)
|
SCHEDULE OF SECURITIES SOLD SHORT |
Shares |
Value |
|||||||||
|
SECURITIES SOLD SHORT - (2.73%) |
|||||||||||
|
COMMON STOCKS SOLD SHORT - (2.73%) |
|||||||||||
|
Aerospace & Defense - (0.45%) |
|||||||||||
|
Howmet Aerospace, Inc. |
(13,300 |
) |
$ |
(501,011 |
) |
||||||
|
Kaman Corp. |
(1,800 |
) |
(36,666 |
) |
|||||||
|
(537,677 |
) |
||||||||||
|
Commercial Services - (0.38%) |
|||||||||||
|
Block, Inc. |
(6,800 |
) |
(460,836 |
) |
|||||||
|
Diversified Financial Services - (0.10%) |
|||||||||||
|
WisdomTree Investments, Inc. |
(20,400 |
) |
(113,628 |
) |
|||||||
|
Entertainment - (0.44%) |
|||||||||||
|
Caesars Entertainment, Inc. |
(5,300 |
) |
(269,293 |
) |
|||||||
|
Cineplex, Inc. |
(33,300 |
) |
(254,983 |
) |
|||||||
|
(524,276 |
) |
||||||||||
|
Internet - (0.33%) |
|||||||||||
|
Gen Digital, Inc. |
(14,200 |
) |
(326,032 |
) |
|||||||
|
Spotify Technology SA |
(800 |
) |
(63,536 |
) |
|||||||
|
(389,568 |
) |
||||||||||
|
Machinery - Diversified - (0.08%) |
|||||||||||
|
Altra Industrial Motion Corp. |
(1,700 |
) |
(99,654 |
) |
|||||||
|
Office/Business Equip - (0.20%) |
|||||||||||
|
Xerox Holdings Corp. |
(15,000 |
) |
(244,650 |
) |
|||||||
|
Oil & Gas - (0.67%) |
|||||||||||
|
Par Pacific Holdings, Inc. |
(34,489 |
) |
(808,077 |
) |
|||||||
|
Pharmaceuticals - (0.02%) |
|||||||||||
|
Paratek Pharmaceuticals, Inc. |
(11,450 |
) |
(25,419 |
) |
|||||||
|
Real Estate Investment Trusts - (0.03%) |
|||||||||||
|
Uniti Group, Inc. |
(4,900 |
) |
(37,338 |
) |
|||||||
|
Software - (0.03%) |
|||||||||||
|
RingCentral, Inc., Class A |
(900 |
) |
(33,354 |
) |
|||||||
|
TOTAL COMMON STOCKS SOLD SHORT (Proceeds $4,245,049) |
(3,274,477 |
) |
|||||||||
|
TOTAL SECURITIES SOLD SHORT (Proceeds $4,245,049) |
$ |
(3,274,477 |
) |
||||||||
See Notes to Financial Statements.
Semi-Annual Report | November 30, 2022
33
Water Island Credit Opportunities Fund Portfolio of Investments (continued)
November 30, 2022 (Unaudited)
EQUITY SWAP CONTRACTS
|
Swap Counterparty/ Payment Frequency |
Reference Obligation |
Rate Paid/ Received by the Fund |
Termination Date |
Upfront Payments Made |
Upfront Payments Received |
Market Value |
Notional Amount |
Unrealized Depreciation |
|||||||||||||||||||||||||||
|
Morgan Stanley & Co./ Monthly |
SPDR Bloomberg High Yield Bond ETF |
Received 1 Month- Federal Rate Minus 153 bps (-2.300%) |
10/29/2024 |
$ |
— |
$ |
— |
$ |
(108,142 |
) |
USD |
3,502,945 |
$ |
(108,142 |
) |
||||||||||||||||||||
OUTSTANDING FORWARD FOREIGN CURRENCY EXCHANGE CONTRACTS
|
Currency Purchased |
Currency Sold |
Counterparty |
Settlement Date |
Unrealized Appreciation |
|||||||||||||||
|
CAD |
102,700 |
USD |
75,048 |
Morgan Stanley & Co. |
12/15/2022 |
$ |
1,313 |
||||||||||||
|
USD |
261,826 |
CAD |
344,100 |
Morgan Stanley & Co. |
12/15/2022 |
5,971 |
|||||||||||||
|
$ |
7,284 |
||||||||||||||||||
|
Currency Purchased |
Currency Sold |
Counterparty |
Settlement Date |
Unrealized Depreciation |
|||||||||||||||
|
CAD |
88,600 |
USD |
66,323 |
Morgan Stanley & Co. |
12/15/2022 |
$ |
(444 |
) |
|||||||||||
|
USD |
83,091 |
CAD |
113,300 |
Morgan Stanley & Co. |
12/15/2022 |
(1,153 |
) |
||||||||||||
|
$ |
(1,597 |
) |
|||||||||||||||||
The following is a summary of investments classified by country exposure:
|
Country |
% of Net Assets(a) |
||||||
|
United States |
83.54 |
% |
|||||
|
Luxembourg |
4.28 |
% |
|||||
|
Canada |
0.38 |
% |
|||||
|
Other Assets in Excess of Liabilities |
11.80 |
% |
|||||
|
100.00 |
% |
||||||
(a) These percentages represent long positions only and are not net of short positions.
Abbreviations:
bps - Basis Points. 100 Basis Points is equal to 1 percentage point.
CAD - Canadian dollar
ETF - Exchange-Traded Fund
LIBOR - London Interbank Offered Rate
LLC - Limited Liability Company
LP - Limited Partnership
See Notes to Financial Statements.
www.arbitragefunds.com | 1-800-295-4485
34
Water Island Credit Opportunities Fund Portfolio of Investments (continued)
November 30, 2022 (Unaudited)
Ltd. - Limited
SA - Generally designates corporations in various countries, mostly those employing civil law. This translates literally in all languages mentioned as anonymous company.
SOFR - Secured Overnight Financing Rate
S&P - Standard & Poor's
SPDR - Standard & Poor's Depositary Receipt
USD - United States Dollar
The following table summarizes the Water Island Credit Opportunities Fund's investments and derivative financial instruments categorized in the fair value hierarchy as of November 30, 2022:
|
Investments in Securities at Fair Value* |
Level 1 |
Level 2 |
Level 3 |
Total |
|||||||||||||||
|
Assets |
|||||||||||||||||||
|
Bank Loans |
$ |
— |
$ |
4,933,057 |
$ |
— |
$ |
4,933,057 |
|||||||||||
|
Corporate Bonds** |
— |
59,112,253 |
— |
59,112,253 |
|||||||||||||||
|
Convertible Corporate Bonds** |
— |
24,556,792 |
— |
24,556,792 |
|||||||||||||||
|
Warrants** |
3,774 |
— |
— |
3,774 |
|||||||||||||||
|
Purchased Options |
377,200 |
— |
— |
377,200 |
|||||||||||||||
|
Short-Term Investments |
16,916,345 |
— |
— |
16,916,345 |
|||||||||||||||
|
TOTAL |
$ |
17,297,319 |
$ |
88,602,102 |
$ |
— |
$ |
105,899,421 |
|||||||||||
|
Other Financial Instruments*** |
|||||||||||||||||||
|
Assets |
|||||||||||||||||||
|
Forward Foreign Currency Exchange Contracts |
$ |
— |
$ |
7,284 |
$ |
— |
$ |
7,284 |
|||||||||||
|
Liabilities |
|||||||||||||||||||
|
Common Stocks** |
(3,274,477 |
) |
— |
— |
(3,274,477 |
) |
|||||||||||||
|
Forward Foreign Currency Exchange Contracts |
— |
(1,597 |
) |
— |
(1,597 |
) |
|||||||||||||
|
Equity Swaps |
(108,142 |
) |
— |
— |
(108,142 |
) |
|||||||||||||
|
TOTAL |
$ |
(3,382,619 |
) |
$ |
5,687 |
$ |
— |
$ |
(3,376,932 |
) |
|||||||||
* Refer to Note 2 where leveling hierarchy is defined.
** Refer to Portfolio of Investments for sector information.
*** Other financial instruments are instruments such as securities sold short, equity swaps and forward foreign currency exchange contracts.
See Notes to Financial Statements.
Semi-Annual Report | November 30, 2022
35
The Arbitrage Funds
|
Arbitrage Fund |
Water Island Event-Driven Fund |
||||||||||
|
ASSETS |
|||||||||||
|
Investments: |
|||||||||||
|
At cost of unaffiliated investments |
$ |
1,356,564,986 |
$ |
111,357,706 |
|||||||
|
At cost of affiliated investments |
60,632,644 |
— |
|||||||||
|
At fair value of unaffiliated investments (Note 2) |
1,283,287,776 |
104,432,648 |
|||||||||
|
At fair value of affiliated investments (Note 2) |
72,923,232 |
— |
|||||||||
|
Cash |
13,878,917 |
1,220,877 |
|||||||||
|
Cash denominated in foreign currency (Cost $87,720, $3,819 and $0) |
89,530 |
3,876 |
|||||||||
|
Deposits with brokers for securities sold short (Note 2) |
5,622,001 |
466,705 |
|||||||||
|
Segregated cash for collateral (Note 2) |
530,000 |
630,000 |
|||||||||
|
Receivable for investment securities sold |
92,043,736 |
6,979,203 |
|||||||||
|
Receivable for capital shares sold |
1,954,246 |
12,562 |
|||||||||
|
Unrealized appreciation on forward foreign currency exchange contracts (Note 8) |
3,325,803 |
192,128 |
|||||||||
|
Unrealized appreciation on swap contracts |
21,851 |
4,546 |
|||||||||
|
Dividends and interest receivable |
1,465,324 |
121,778 |
|||||||||
|
Miscellaneous receivable |
379,257 |
— |
|||||||||
|
Prepaid expenses |
46,568 |
30,045 |
|||||||||
|
Total Assets |
1,475,568,241 |
114,094,368 |
|||||||||
|
LIABILITIES |
|||||||||||
|
Securities sold short, at value (Note 2) (proceeds $5,735,213, $484,408 and $4,245,049) |
5,985,763 |
495,634 |
|||||||||
|
Written Options, at value (Note 2) (premiums received $171, $13 and $0) |
— |
— |
|||||||||
|
Due to bank |
— |
— |
|||||||||
|
Payable for investment securities purchased |
8,851,304 |
148,291 |
|||||||||
|
Unrealized depreciation on forward foreign currency exchange contracts (Note 8) |
9,516,523 |
587,838 |
|||||||||
|
Unrealized depreciation on swap contracts |
3,029,326 |
222,001 |
|||||||||
|
Payable for capital shares redeemed |
2,384,065 |
40,464 |
|||||||||
|
Payable to Adviser (Note 5) |
1,202,044 |
105,585 |
|||||||||
|
Dividends payable on securities sold short |
— |
— |
|||||||||
|
Payable to Distributor (Note 5) |
29,709 |
1,362 |
|||||||||
|
Payable to Administrator (Note 5) |
115,342 |
21,185 |
|||||||||
|
Payable to Transfer Agent (Note 5) |
154,460 |
10,681 |
|||||||||
|
Payable to Custodian |
42,869 |
21,068 |
|||||||||
|
Income distribution payable |
— |
— |
|||||||||
|
Interest expense payable |
626 |
— |
|||||||||
|
Payable for swap reset |
65,345 |
105 |
|||||||||
|
Audit and legal fees payable |
63,168 |
17,357 |
|||||||||
|
Payable to Trustees |
76,396 |
7,642 |
|||||||||
|
Chief Compliance Officer Fees payable (Note 5) |
58,869 |
3,946 |
|||||||||
|
Chief Financial Officer Fees payable (Note 5) |
4,981 |
904 |
|||||||||
|
Other accrued expenses and liabilities |
29,699 |
9,364 |
|||||||||
|
Total Liabilities |
31,610,489 |
1,693,427 |
|||||||||
|
NET ASSETS |
$ |
1,443,957,752 |
$ |
112,400,941 |
|||||||
|
NET ASSETS CONSIST OF: |
|||||||||||
|
Paid-in capital |
1,433,289,216 |
152,540,705 |
|||||||||
|
Distributable earnings (Accumulated loss) |
10,668,536 |
(40,139,764 |
) |
||||||||
|
NET ASSETS |
$ |
1,443,957,752 |
$ |
112,400,941 |
|||||||
See Notes to Financial Statements.
www.arbitragefunds.com | 1-800-295-4485
36
Statements of Assets and Liabilities
November 30, 2022 (Unaudited)
|
Water Island Credit Opportunities Fund |
|||||||
|
ASSETS |
|||||||
|
Investments: |
|||||||
|
At cost of unaffiliated investments |
$ |
113,128,298 |
|||||
|
At cost of affiliated investments |
— |
||||||
|
At fair value of unaffiliated investments (Note 2) |
105,899,421 |
||||||
|
At fair value of affiliated investments (Note 2) |
— |
||||||
|
Cash |
— |
||||||
|
Cash denominated in foreign currency (Cost $87,720, $3,819 and $0) |
— |
||||||
|
Deposits with brokers for securities sold short (Note 2) |
3,506,292 |
||||||
|
Segregated cash for collateral (Note 2) |
1,290,000 |
||||||
|
Receivable for investment securities sold |
15,843,035 |
||||||
|
Receivable for capital shares sold |
99,423 |
||||||
|
Unrealized appreciation on forward foreign currency exchange contracts (Note 8) |
7,284 |
||||||
|
Unrealized appreciation on swap contracts |
— |
||||||
|
Dividends and interest receivable |
1,569,694 |
||||||
|
Miscellaneous receivable |
— |
||||||
|
Prepaid expenses |
29,717 |
||||||
|
Total Assets |
128,244,866 |
||||||
|
LIABILITIES |
|||||||
|
Securities sold short, at value (Note 2) (proceeds $5,735,213, $484,408 and $4,245,049) |
3,274,477 |
||||||
|
Written Options, at value (Note 2) (premiums received $171, $13 and $0) |
— |
||||||
|
Due to bank |
3,405,477 |
||||||
|
Payable for investment securities purchased |
743,590 |
||||||
|
Unrealized depreciation on forward foreign currency exchange contracts (Note 8) |
1,597 |
||||||
|
Unrealized depreciation on swap contracts |
108,142 |
||||||
|
Payable for capital shares redeemed |
300,653 |
||||||
|
Payable to Adviser (Note 5) |
47,243 |
||||||
|
Dividends payable on securities sold short |
1,775 |
||||||
|
Payable to Distributor (Note 5) |
1,795 |
||||||
|
Payable to Administrator (Note 5) |
30,684 |
||||||
|
Payable to Transfer Agent (Note 5) |
19,058 |
||||||
|
Payable to Custodian |
5,518 |
||||||
|
Income distribution payable |
188,857 |
||||||
|
Interest expense payable |
7,223 |
||||||
|
Payable for swap reset |
— |
||||||
|
Audit and legal fees payable |
17,866 |
||||||
|
Payable to Trustees |
7,426 |
||||||
|
Chief Compliance Officer Fees payable (Note 5) |
5,244 |
||||||
|
Chief Financial Officer Fees payable (Note 5) |
977 |
||||||
|
Other accrued expenses and liabilities |
8,404 |
||||||
|
Total Liabilities |
8,176,006 |
||||||
|
NET ASSETS |
$ |
120,068,860 |
|||||
|
NET ASSETS CONSIST OF: |
|||||||
|
Paid-in capital |
127,369,795 |
||||||
|
Distributable earnings (Accumulated loss) |
(7,300,935 |
) |
|||||
|
NET ASSETS |
$ |
120,068,860 |
|||||
Semi-Annual Report | November 30, 2022
37
The Arbitrage Funds
|
Arbitrage Fund |
Water Island Event-Driven Fund |
||||||||||
|
PRICING OF SHARES: |
|||||||||||
|
CLASS R SHARES: |
|||||||||||
|
Net assets applicable to Class R shares |
$ |
59,828,522 |
$ |
4,441,661 |
|||||||
|
Shares of beneficial interest outstanding (unlimited number of shares authorized, no par value) |
4,750,001 |
407,222 |
|||||||||
|
Net asset value and offering price per share |
$ |
12.60 |
$ |
10.91 |
|||||||
|
CLASS I SHARES: |
|||||||||||
|
Net assets applicable to Class I shares |
$ |
1,333,883,588 |
$ |
105,802,676 |
|||||||
|
Shares of beneficial interest outstanding (unlimited number of shares authorized, no par value) |
101,642,868 |
9,587,511 |
|||||||||
|
Net asset value and offering price per share |
$ |
13.12 |
$ |
11.04 |
|||||||
|
CLASS C SHARES: |
|||||||||||
|
Net assets applicable to Class C shares |
$ |
10,739,449 |
$ |
— |
|||||||
|
Shares of beneficial interest outstanding (unlimited number of shares authorized, no par value) |
922,272 |
— |
|||||||||
|
Net asset value and offering price per share(a) |
$ |
11.64 |
$ |
— |
|||||||
|
CLASS A SHARES: |
|||||||||||
|
Net assets applicable to Class A shares |
$ |
39,506,193 |
$ |
2,156,604 |
|||||||
|
Shares of beneficial interest outstanding (unlimited number of shares authorized, no par value) |
3,143,656 |
198,137 |
|||||||||
|
Net asset value and offering price per share(a) |
$ |
12.57 |
$ |
10.88 |
|||||||
|
Maximum offering price per share (NAV/(100% — maximum sales charge)) |
$ |
12.93 |
$ |
11.25 |
|||||||
|
Maximum sales charge |
2.75 |
% |
3.25 |
% |
|||||||
(a) Redemption price varies based on length of time held (Note 1).
See Notes to Financial Statements.
www.arbitragefunds.com | 1-800-295-4485
38
Statements of Assets and Liabilities
November 30, 2022 (Unaudited)
|
Water Island Credit Opportunities Fund |
|||||||
|
PRICING OF SHARES: |
|||||||
|
CLASS R SHARES: |
|||||||
|
Net assets applicable to Class R shares |
$ |
8,608,114 |
|||||
|
Shares of beneficial interest outstanding (unlimited number of shares authorized, no par value) |
893,351 |
||||||
|
Net asset value and offering price per share |
$ |
9.64 |
|||||
|
CLASS I SHARES: |
|||||||
|
Net assets applicable to Class I shares |
$ |
111,394,997 |
|||||
|
Shares of beneficial interest outstanding (unlimited number of shares authorized, no par value) |
11,613,931 |
||||||
|
Net asset value and offering price per share |
$ |
9.59 |
|||||
|
CLASS C SHARES: |
|||||||
|
Net assets applicable to Class C shares |
$ |
— |
|||||
|
Shares of beneficial interest outstanding (unlimited number of shares authorized, no par value) |
— |
||||||
|
Net asset value and offering price per share(a) |
$ |
— |
|||||
|
CLASS A SHARES: |
|||||||
|
Net assets applicable to Class A shares |
$ |
65,749 |
|||||
|
Shares of beneficial interest outstanding (unlimited number of shares authorized, no par value) |
6,852 |
||||||
|
Net asset value and offering price per share(a) |
$ |
9.60 |
|||||
|
Maximum offering price per share (NAV/(100% — maximum sales charge)) |
$ |
9.92 |
|||||
|
Maximum sales charge |
3.25 |
% |
|||||
Semi-Annual Report | November 30, 2022
39
The Arbitrage Funds
|
Arbitrage Fund |
Water Island Event-Driven Fund |
||||||||||
|
INVESTMENT INCOME |
|||||||||||
|
Dividend income |
$ |
11,170,504 |
$ |
784,118 |
|||||||
|
Foreign taxes withheld on dividends |
(57,259 |
) |
(2,595 |
) |
|||||||
|
Interest income |
622,257 |
138,269 |
|||||||||
|
Non-cash dividends |
654,336 |
— |
|||||||||
|
Total Investment Income |
12,389,838 |
919,792 |
|||||||||
|
EXPENSES |
|||||||||||
|
Investment advisory fees (Note 5) |
8,151,982 |
622,390 |
|||||||||
|
Distribution and service fees (Note 5) |
|||||||||||
|
Class R |
84,266 |
5,560 |
|||||||||
|
Class C |
61,059 |
— |
|||||||||
|
Class A |
52,851 |
2,766 |
|||||||||
|
Administrative fees |
142,713 |
24,462 |
|||||||||
|
Chief Compliance Officer fees |
98,497 |
7,342 |
|||||||||
|
Trustees' fees |
156,149 |
14,541 |
|||||||||
|
Dividend expense |
152,945 |
6,078 |
|||||||||
|
Transfer agent fees |
691,899 |
50,826 |
|||||||||
|
Custodian and bank service fees |
95,901 |
27,659 |
|||||||||
|
Registration and filing fees |
44,540 |
26,217 |
|||||||||
|
Printing of shareholder reports |
59,756 |
4,730 |
|||||||||
|
Professional fees |
95,460 |
14,311 |
|||||||||
|
Line of credit interest expense |
— |
5,319 |
|||||||||
|
Insurance expense |
31,191 |
2,447 |
|||||||||
|
Chief Financial Officer fees |
29,516 |
5,396 |
|||||||||
|
Other expenses |
38,124 |
10,387 |
|||||||||
|
Total Expenses |
9,986,849 |
830,431 |
|||||||||
|
Fees waived, reimbursed or recouped by the Adviser, Class R (Note 5) |
(19,826 |
) |
152 |
||||||||
|
Fees waived, reimbursed or recouped by the Adviser, Class I (Note 5) |
(417,482 |
) |
3,824 |
||||||||
|
Fees waived, reimbursed or recouped by the Adviser, Class C (Note 5) |
(3,590 |
) |
— |
||||||||
|
Fees waived, reimbursed or recouped by the Adviser, Class A (Note 5) |
(12,461 |
) |
81 |
||||||||
|
Net Expenses |
9,533,490 |
834,488 |
|||||||||
|
NET INVESTMENT INCOME (LOSS) |
2,856,348 |
85,304 |
|||||||||
|
REALIZED AND UNREALIZED GAINS (LOSSES) ON INVESTMENTS AND FOREIGN CURRENCIES |
|||||||||||
|
Net realized gains (losses) from: |
|||||||||||
|
Unaffiliated investments |
22,402,360 |
2,926,412 |
|||||||||
|
Purchased option contracts |
(694,059 |
) |
(81,346 |
) |
|||||||
|
Swap contracts |
5,146,920 |
403,680 |
|||||||||
|
Securities sold short |
5,967,837 |
443,621 |
|||||||||
|
Written option contracts |
(515,012 |
) |
(40,997 |
) |
|||||||
|
Forward currency contracts |
15,510,335 |
783,590 |
|||||||||
|
Foreign currency transactions (Note 8) |
565,927 |
48,590 |
|||||||||
See Notes to Financial Statements.
www.arbitragefunds.com | 1-800-295-4485
40
Statements of Operations
For the Six Months Ended November 30, 2022 (Unaudited)
|
Water Island Credit Opportunities Fund |
|||||||
|
INVESTMENT INCOME |
|||||||
|
Dividend income |
$ |
46,251 |
|||||
|
Foreign taxes withheld on dividends |
— |
||||||
|
Interest income |
2,859,740 |
||||||
|
Non-cash dividends |
— |
||||||
|
Total Investment Income |
2,905,991 |
||||||
|
EXPENSES |
|||||||
|
Investment advisory fees (Note 5) |
608,779 |
||||||
|
Distribution and service fees (Note 5) |
|||||||
|
Class R |
11,062 |
||||||
|
Class C |
— |
||||||
|
Class A |
109 |
||||||
|
Administrative fees |
42,406 |
||||||
|
Chief Compliance Officer fees |
8,137 |
||||||
|
Trustees' fees |
16,095 |
||||||
|
Dividend expense |
15,887 |
||||||
|
Transfer agent fees |
67,865 |
||||||
|
Custodian and bank service fees |
11,554 |
||||||
|
Registration and filing fees |
24,700 |
||||||
|
Printing of shareholder reports |
10,238 |
||||||
|
Professional fees |
15,270 |
||||||
|
Line of credit interest expense |
22,254 |
||||||
|
Insurance expense |
2,498 |
||||||
|
Chief Financial Officer fees |
5,699 |
||||||
|
Other expenses |
10,739 |
||||||
|
Total Expenses |
873,292 |
||||||
|
Fees waived, reimbursed or recouped by the Adviser, Class R (Note 5) |
(13,537 |
) |
|||||
|
Fees waived, reimbursed or recouped by the Adviser, Class I (Note 5) |
(182,308 |
) |
|||||
|
Fees waived, reimbursed or recouped by the Adviser, Class C (Note 5) |
— |
||||||
|
Fees waived, reimbursed or recouped by the Adviser, Class A (Note 5) |
(133 |
) |
|||||
|
Net Expenses |
677,314 |
||||||
|
NET INVESTMENT INCOME (LOSS) |
2,228,677 |
||||||
|
REALIZED AND UNREALIZED GAINS (LOSSES) ON INVESTMENTS AND FOREIGN CURRENCIES |
|||||||
|
Net realized gains (losses) from: |
|||||||
|
Unaffiliated investments |
(956,428 |
) |
|||||
|
Purchased option contracts |
360,243 |
||||||
|
Swap contracts |
230,140 |
||||||
|
Securities sold short |
1,229,832 |
||||||
|
Written option contracts |
30,483 |
||||||
|
Forward currency contracts |
(10,848 |
) |
|||||
|
Foreign currency transactions (Note 8) |
887 |
||||||
Semi-Annual Report | November 30, 2022
41
The Arbitrage Funds
|
Arbitrage Fund |
Water Island Event-Driven Fund |
||||||||||
|
Net change in unrealized appreciation (depreciation) on: |
|||||||||||
|
Unaffiliated investments |
$ |
(26,483,139 |
) |
$ |
(2,626,499 |
) |
|||||
|
Affiliated investments |
528,429 |
— |
|||||||||
|
Securities sold short |
(3,487,432 |
) |
(239,530 |
) |
|||||||
|
Foreign currency transactions (Note 8) |
(36,865 |
) |
133 |
||||||||
|
Purchased option contracts |
(1,577,694 |
) |
(126,350 |
) |
|||||||
|
Written option contracts |
(10,015 |
) |
(848 |
) |
|||||||
|
Swap contracts |
(3,007,623 |
) |
(217,455 |
) |
|||||||
|
Forward currency contracts |
(9,568,248 |
) |
(543,358 |
) |
|||||||
|
NET REALIZED AND UNREALIZED GAINS (LOSSES) ON INVESTMENTS AND FOREIGN CURRENCIES |
4,741,721 |
729,643 |
|||||||||
|
NET INCREASE IN NET ASSETS RESULTING FROM OPERATIONS |
$ |
7,598,069 |
$ |
814,947 |
|||||||
See Notes to Financial Statements.
www.arbitragefunds.com | 1-800-295-4485
42
Statements of Operations
For the Six Months Ended November 30, 2022 (Unaudited)
|
Water Island Credit Opportunities Fund |
|||||||
|
Net change in unrealized appreciation (depreciation) on: |
|||||||
|
Unaffiliated investments |
$ |
(212,443 |
) |
||||
|
Affiliated investments |
— |
||||||
|
Securities sold short |
(1,796,650 |
) |
|||||
|
Foreign currency transactions (Note 8) |
9 |
||||||
|
Purchased option contracts |
8,408 |
||||||
|
Written option contracts |
240 |
||||||
|
Swap contracts |
(108,142 |
) |
|||||
|
Forward currency contracts |
7,760 |
||||||
|
NET REALIZED AND UNREALIZED GAINS (LOSSES) ON INVESTMENTS AND FOREIGN CURRENCIES |
(1,216,509 |
) |
|||||
|
NET INCREASE IN NET ASSETS RESULTING FROM OPERATIONS |
$ |
1,012,168 |
|||||
Semi-Annual Report | November 30, 2022
43
The Arbitrage Funds
|
Arbitrage Fund |
|||||||||||
|
Six Months Ended November 30, 2022 (Unaudited) |
Year Ended May 31, 2022 |
||||||||||
|
FROM OPERATIONS: |
|||||||||||
|
Net investment income (loss) |
$ |
2,856,348 |
$ |
(7,137,527 |
) |
||||||
|
Net realized gains (losses) from: |
|||||||||||
|
Unaffiliated investments |
22,402,360 |
75,174,977 |
|||||||||
|
Purchased option contracts |
(694,059 |
) |
(1,844,236 |
) |
|||||||
|
Swap contracts |
5,146,920 |
(6,444,884 |
) |
||||||||
|
Securities sold short |
5,967,837 |
(19,584,880 |
) |
||||||||
|
Written option contracts |
(515,012 |
) |
2,115,078 |
||||||||
|
Forward currency contracts |
15,510,335 |
9,860,568 |
|||||||||
|
Foreign currency transactions |
565,927 |
(659,632 |
) |
||||||||
|
Net change in unrealized appreciation (depreciation) on: |
|||||||||||
|
Unaffiliated investments |
(26,483,139 |
) |
(114,517,314 |
) |
|||||||
|
Affiliated investments |
528,429 |
(3,434,790 |
) |
||||||||
|
Securities sold short |
(3,487,432 |
) |
235,533 |
||||||||
|
Foreign currency transactions |
(36,865 |
) |
(8,941 |
) |
|||||||
|
Purchased option contracts |
(1,577,694 |
) |
1,391,682 |
||||||||
|
Written option contracts |
(10,015 |
) |
10,186 |
||||||||
|
Swap contracts |
(3,007,623 |
) |
148 |
||||||||
|
Forward currency contracts |
(9,568,248 |
) |
5,524,437 |
||||||||
|
Net increase (decrease) in net assets resulting from operations |
7,598,069 |
(59,319,595 |
) |
||||||||
|
FROM DIVIDENDS AND DISTRIBUTIONS TO SHAREHOLDERS: |
|||||||||||
|
Distributions from distributable earnings, Class R |
— |
(516,092 |
) |
||||||||
|
Distributions from distributable earnings, Class I |
— |
(7,605,189 |
) |
||||||||
|
Distributions from distributable earnings, Class C |
— |
(99,436 |
) |
||||||||
|
Distributions from distributable earnings, Class A |
— |
(213,958 |
) |
||||||||
|
Decrease in net assets from distributions to shareholders |
— |
(8,434,675 |
) |
||||||||
|
FROM CAPITAL SHARE TRANSACTIONS (NOTE 7): |
|||||||||||
|
Proceeds from shares sold |
151,373,248 |
493,961,134 |
|||||||||
|
Shares issued in reinvestment of distributions |
— |
6,813,804 |
|||||||||
|
Payments for shares redeemed |
(307,562,356 |
) |
(438,357,571 |
) |
|||||||
|
Net increase (decrease) in net assets from capital share transactions |
(156,189,108 |
) |
62,417,367 |
||||||||
|
TOTAL INCREASE (DECREASE) IN NET ASSETS |
(148,591,039 |
) |
(5,336,903 |
) |
|||||||
|
NET ASSETS: |
|||||||||||
|
Beginning of period |
1,592,548,791 |
1,597,885,694 |
|||||||||
|
End of period |
$ |
1,443,957,752 |
$ |
1,592,548,791 |
|||||||
See Notes to Financial Statements.
www.arbitragefunds.com | 1-800-295-4485
44
Statements of Changes in Net Assets
|
Water Island Event-Driven Fund |
|||||||||||
|
Six Months Ended November 30, 2022 (Unaudited) |
Year Ended May 31, 2022 |
||||||||||
|
FROM OPERATIONS: |
|||||||||||
|
Net investment income (loss) |
$ |
85,304 |
$ |
(1,121,511 |
) |
||||||
|
Net realized gains (losses) from: |
|||||||||||
|
Unaffiliated investments |
2,926,412 |
7,344,199 |
|||||||||
|
Purchased option contracts |
(81,346 |
) |
(141,575 |
) |
|||||||
|
Swap contracts |
403,680 |
(643,295 |
) |
||||||||
|
Securities sold short |
443,621 |
(2,833,577 |
) |
||||||||
|
Written option contracts |
(40,997 |
) |
227,040 |
||||||||
|
Forward currency contracts |
783,590 |
677,044 |
|||||||||
|
Foreign currency transactions |
48,590 |
34,075 |
|||||||||
|
Net change in unrealized appreciation (depreciation) on: |
|||||||||||
|
Unaffiliated investments |
(2,626,499 |
) |
(9,533,762 |
) |
|||||||
|
Affiliated investments |
— |
— |
|||||||||
|
Securities sold short |
(239,530 |
) |
(663,914 |
) |
|||||||
|
Foreign currency transactions |
133 |
(1,610 |
) |
||||||||
|
Purchased option contracts |
(126,350 |
) |
152,193 |
||||||||
|
Written option contracts |
(848 |
) |
861 |
||||||||
|
Swap contracts |
(217,455 |
) |
— |
||||||||
|
Forward currency contracts |
(543,358 |
) |
363,598 |
||||||||
|
Net increase (decrease) in net assets resulting from operations |
814,947 |
(6,140,234 |
) |
||||||||
|
FROM DIVIDENDS AND DISTRIBUTIONS TO SHAREHOLDERS: |
|||||||||||
|
Distributions from distributable earnings, Class R |
— |
— |
|||||||||
|
Distributions from distributable earnings, Class I |
— |
— |
|||||||||
|
Distributions from distributable earnings, Class C |
— |
— |
|||||||||
|
Distributions from distributable earnings, Class A |
— |
— |
|||||||||
|
Decrease in net assets from distributions to shareholders |
— |
— |
|||||||||
|
FROM CAPITAL SHARE TRANSACTIONS (NOTE 7): |
|||||||||||
|
Proceeds from shares sold |
3,041,824 |
16,716,837 |
|||||||||
|
Shares issued in reinvestment of distributions |
— |
— |
|||||||||
|
Payments for shares redeemed |
(5,297,572 |
) |
(33,328,537 |
) |
|||||||
|
Net increase (decrease) in net assets from capital share transactions |
(2,255,748 |
) |
(16,611,700 |
) |
|||||||
|
TOTAL INCREASE (DECREASE) IN NET ASSETS |
(1,440,801 |
) |
(22,751,934 |
) |
|||||||
|
NET ASSETS: |
|||||||||||
|
Beginning of period |
113,841,742 |
136,593,676 |
|||||||||
|
End of period |
$ |
112,400,941 |
$ |
113,841,742 |
|||||||
Semi-Annual Report | November 30, 2022
45
The Arbitrage Funds Statements of Changes in Net Assets
|
Water Island Credit Opportunities Fund |
|||||||||||
|
Six Months Ended November 30, 2022 (Unaudited) |
Year Ended May 31, 2022 |
||||||||||
|
FROM OPERATIONS: |
|||||||||||
|
Net investment income (loss) |
$ |
2,228,677 |
$ |
2,354,939 |
|||||||
|
Net realized gains (losses) from: |
|||||||||||
|
Investments |
(956,428 |
) |
1,164,010 |
||||||||
|
Purchased option contracts |
360,243 |
(262,482 |
) |
||||||||
|
Swap contracts |
230,140 |
200,376 |
|||||||||
|
Securities sold short |
1,229,832 |
(285,977 |
) |
||||||||
|
Written option contracts |
30,483 |
97,867 |
|||||||||
|
Forward currency contracts |
(10,848 |
) |
2,653 |
||||||||
|
Foreign currency transactions |
887 |
883 |
|||||||||
|
Net change in unrealized appreciation (depreciation) on: |
|||||||||||
|
Investments |
(212,443 |
) |
(9,859,431 |
) |
|||||||
|
Securities sold short |
(1,796,650 |
) |
4,035,356 |
||||||||
|
Foreign currency transactions |
9 |
(57 |
) |
||||||||
|
Purchased option contracts |
8,408 |
53,356 |
|||||||||
|
Written option contracts |
240 |
83 |
|||||||||
|
Swap contracts |
(108,142 |
) |
— |
||||||||
|
Forward currency contracts |
7,760 |
9,606 |
|||||||||
|
Net increase (decrease) in net assets resulting from operations |
1,012,168 |
(2,488,818 |
) |
||||||||
|
FROM DIVIDENDS AND DISTRIBUTIONS TO SHAREHOLDERS: |
|||||||||||
|
Distributions from distributable earnings, Class R |
(160,180 |
) |
(232,802 |
) |
|||||||
|
Distributions from distributable earnings, Class I |
(2,295,899 |
) |
(3,360,754 |
) |
|||||||
|
Distributions from distributable earnings, Class A |
(1,541 |
) |
(2,624 |
) |
|||||||
|
Decrease in net assets from distributions to shareholders |
(2,457,620 |
) |
(3,596,180 |
) |
|||||||
|
FROM CAPITAL SHARE TRANSACTIONS (NOTE 7): |
|||||||||||
|
Proceeds from shares sold |
7,737,507 |
54,762,362 |
|||||||||
|
Shares issued in reinvestment of distributions |
1,635,192 |
3,120,787 |
|||||||||
|
Payments for shares redeemed |
(22,740,312 |
) |
(23,344,218 |
) |
|||||||
|
Net increase (decrease) in net assets from capital share transactions |
(13,367,613 |
) |
34,538,931 |
||||||||
|
TOTAL INCREASE (DECREASE) IN NET ASSETS |
(14,813,065 |
) |
28,453,933 |
||||||||
|
NET ASSETS: |
|||||||||||
|
Beginning of period |
134,881,925 |
106,427,992 |
|||||||||
|
End of period |
$ |
120,068,860 |
$ |
134,881,925 |
|||||||
See Notes to Financial Statements.
www.arbitragefunds.com | 1-800-295-4485
46
This Page Intentionally Left Blank
Arbitrage Fund – Class R
Selected Per Share Data and Ratios for a Share Outstanding Throughout the Periods Presented:
|
Six Months Ended November 30, 2022 |
Year Ended May 31, |
||||||||||||||||||||||||||
|
(Unaudited) |
2022 |
2021 |
2020 |
2019 |
2018 |
||||||||||||||||||||||
|
Net asset value, beginning of period |
$ |
12.54 |
$ |
13.11 |
$ |
13.04 |
$ |
12.92 |
$ |
12.65 |
$ |
13.06 |
|||||||||||||||
|
Income (loss) from investment operations |
|||||||||||||||||||||||||||
|
Net investment income (loss)(a) |
0.01 |
(0.08 |
) |
(0.01 |
)(b) |
(0.05 |
) |
(0.03 |
)(b) |
0.05 |
|||||||||||||||||
|
Net realized and unrealized gains (losses) on investments and foreign currencies |
0.05 |
(0.42 |
) |
0.97 |
0.44 |
0.52 |
(0.01 |
)(b) |
|||||||||||||||||||
|
Total from investment operations |
0.06 |
(0.50 |
) |
0.96 |
0.39 |
0.49 |
0.04 |
||||||||||||||||||||
|
Less distributions |
|||||||||||||||||||||||||||
|
From net investment income |
— |
— |
— |
— |
(0.06 |
) |
(0.09 |
) |
|||||||||||||||||||
|
From net realized gains |
— |
(0.07 |
) |
(0.89 |
) |
(0.27 |
) |
(0.16 |
) |
(0.36 |
) |
||||||||||||||||
|
Total distributions |
— |
(0.07 |
) |
(0.89 |
) |
(0.27 |
) |
(0.22 |
) |
(0.45 |
) |
||||||||||||||||
|
Proceeds from redemption fees collected |
— |
— |
— |
— |
— |
0.00 |
(c) |
||||||||||||||||||||
|
Net asset value, end of period |
$ |
12.60 |
$ |
12.54 |
$ |
13.11 |
$ |
13.04 |
$ |
12.92 |
$ |
12.65 |
|||||||||||||||
|
Total return(d) |
0.48 |
%(e) |
(3.83 |
%) |
7.58 |
% |
3.07 |
% |
3.89 |
% |
0.31 |
% |
|||||||||||||||
|
Net assets, end of period (in 000s) |
$ |
59,829 |
$ |
77,866 |
$ |
97,909 |
$ |
98,715 |
$ |
163,349 |
$ |
222,309 |
|||||||||||||||
|
RATIOS TO AVERAGE NET ASSETS: |
|||||||||||||||||||||||||||
|
Gross expenses(f) |
1.52 |
%(g) |
1.55 |
% |
1.64 |
% |
1.66 |
% |
1.94 |
% |
1.91 |
% |
|||||||||||||||
|
Net expenses after advisory fees waived and expenses reimbursed(f)(h) |
1.46 |
%(g) |
1.49 |
% |
1.58 |
% |
1.63 |
% |
1.93 |
% |
1.90 |
% |
|||||||||||||||
|
Net investment income (loss) |
0.11 |
%(g) |
(0.61 |
%) |
(0.08 |
%)(b) |
(0.36 |
%) |
(0.20 |
%)(b) |
0.41 |
% |
|||||||||||||||
|
Portfolio turnover rate |
91 |
%(e) |
206 |
% |
300 |
% |
273 |
% |
419 |
% |
362 |
% |
|||||||||||||||
See Notes to Financial Statements.
www.arbitragefunds.com | 1-800-295-4485
48
Financial Highlights
(a) Per share amounts were calculated using average shares outstanding for the period.
(b) The amount shown for a share outstanding throughout the period may not correlate with the Statement of Operations for the period due to timing of sales and redemptions of Fund shares in relation to income earned and/or fluctuating market value of the investments of the Fund.
(c) Amount rounds to less than $0.01 per share.
(d) Total return is a measure of the change in the value of an investment in the Fund over the periods covered, which assumes any dividends or capital gains distributions are reinvested in shares of the Fund. Returns shown do not reflect the deduction of taxes a shareholder would pay on Fund distributions or the redemption of Fund shares.
(e) Not annualized.
(f) Dividend expense totaled 0.02% (annualized), 0.01%, 0.00%, 0.15%, 0.46% and 0.42% of average net assets for the six months ended November 30, 2022 and the years ended May 31, 2022, 2021, 2020, 2019 and 2018, respectively. Interest rebate expense and line of credit interest expense totaled 0.00% (annualized), 0.05%, 0.11%, 0.01%, 0.00% and 0.01% of average net assets for the six months ended November 30, 2022 and the years ended May 31, 2022, 2021, 2020, 2019 and 2018, respectively.
(g) Annualized.
(h) Excluding dividend and interest expenses, the Fund's net expenses after advisory fees waived and expenses reimbursed would have been 1.44% (annualized), 1.43%, 1.47%, 1.47%, 1.47% and 1.47% of average net assets for the six months ended November 30, 2022 and the years ended May 31, 2022, 2021, 2020, 2019 and 2018, respectively.
See Notes to Financial Statements.
Semi-Annual Report | November 30, 2022
49
Arbitrage Fund – Class I
Selected Per Share Data and Ratios for a Share Outstanding Throughout the Periods Presented:
|
Six Months Ended November 30, 2022 |
Year Ended May 31, |
||||||||||||||||||||||||||
|
(Unaudited) |
2022 |
2021 |
2020 |
2019 |
2018 |
||||||||||||||||||||||
|
Net asset value, beginning of period |
$ |
13.05 |
$ |
13.60 |
$ |
13.47 |
$ |
13.32 |
$ |
13.03 |
$ |
13.46 |
|||||||||||||||
|
Income (loss) from investment operations |
|||||||||||||||||||||||||||
|
Net investment income (loss)(a) |
0.03 |
(0.05 |
) |
0.02 |
(0.02 |
) |
0.01 |
0.05 |
|||||||||||||||||||
|
Net realized and unrealized gains (losses) on investments and foreign currencies |
0.04 |
(0.43 |
) |
1.00 |
0.45 |
0.54 |
0.01 |
||||||||||||||||||||
|
Total from investment operations |
0.07 |
(0.48 |
) |
1.02 |
0.43 |
0.55 |
0.06 |
||||||||||||||||||||
|
Less distributions |
|||||||||||||||||||||||||||
|
From net investment income |
— |
— |
— |
(0.01 |
) |
(0.10 |
) |
(0.13 |
) |
||||||||||||||||||
|
From net realized gains |
— |
(0.07 |
) |
(0.89 |
) |
(0.27 |
) |
(0.16 |
) |
(0.36 |
) |
||||||||||||||||
|
Total distributions |
— |
(0.07 |
) |
(0.89 |
) |
(0.28 |
) |
(0.26 |
) |
(0.49 |
) |
||||||||||||||||
|
Proceeds from redemption fees collected |
— |
— |
— |
— |
— |
0.00 |
(b) |
||||||||||||||||||||
|
Net asset value, end of period |
$ |
13.12 |
$ |
13.05 |
$ |
13.60 |
$ |
13.47 |
$ |
13.32 |
$ |
13.03 |
|||||||||||||||
|
Total return(c) |
0.54 |
%(d) |
(3.55 |
%) |
7.87 |
% |
3.27 |
% |
4.21 |
% |
0.50 |
% |
|||||||||||||||
|
Net assets, end of period (in 000s) |
$ |
1,333,884 |
$ |
1,459,176 |
$ |
1,449,309 |
$ |
1,243,838 |
$ |
1,546,542 |
$ |
1,510,598 |
|||||||||||||||
|
RATIOS TO AVERAGE NET ASSETS: |
|||||||||||||||||||||||||||
|
Gross expenses(e) |
1.27 |
%(f) |
1.30 |
% |
1.39 |
% |
1.41 |
% |
1.69 |
% |
1.66 |
% |
|||||||||||||||
|
Net expenses after advisory fees waived and expenses reimbursed(e)(g) |
1.21 |
%(f) |
1.24 |
% |
1.33 |
% |
1.38 |
% |
1.68 |
% |
1.65 |
% |
|||||||||||||||
|
Net investment income (loss) |
0.40 |
%(f) |
(0.41 |
%) |
0.16 |
% |
(0.13 |
%) |
0.06 |
% |
0.35 |
% |
|||||||||||||||
|
Portfolio turnover rate |
91 |
%(d) |
206 |
% |
300 |
% |
273 |
% |
419 |
% |
362 |
% |
|||||||||||||||
See Notes to Financial Statements.
www.arbitragefunds.com | 1-800-295-4485
50
Financial Highlights
(a) Per share amounts were calculated using average shares outstanding for the period.
(b) Amount rounds to less than $0.01 per share.
(c) Total return is a measure of the change in the value of an investment in the Fund over the periods covered, which assumes any dividends or capital gains distributions are reinvested in shares of the Fund. Returns shown do not reflect the deduction of taxes a shareholder would pay on Fund distributions or the redemption of Fund shares.
(d) Not annualized.
(e) Dividend expense totaled 0.02% (annualized), 0.01%, 0.00%, 0.15%, 0.46% and 0.42% of average net assets for the six months ended November 30, 2022 and the years ended May 31, 2022, 2021, 2020, 2019 and 2018, respectively. Interest rebate expense and line of credit interest expense totaled 0.00% (annualized), 0.05%, 0.11%, 0.01%, 0.00% and 0.01% of average net assets for the six months ended November 30, 2022 and the years ended May 31, 2022, 2021, 2020, 2019 and 2018, respectively.
(f) Annualized.
(g) Excluding dividend and interest expenses, the Fund's net expenses after advisory fees waived and expenses reimbursed would have been 1.19% (annualized), 1.18%, 1.22%, 1.22%, 1.22% and 1.22% of average net assets for the six months ended November 30, 2022 and the years ended May 31, 2022, 2021, 2020, 2019 and 2018, respectively.
See Notes to Financial Statements.
Semi-Annual Report | November 30, 2022
51
Arbitrage Fund – Class C
Selected Per Share Data and Ratios for a Share Outstanding Throughout the Periods Presented:
|
Six Months Ended November 30, 2022 |
Year Ended May 31, |
||||||||||||||||||||||||||
|
(Unaudited) |
2022 |
2021 |
2020 |
2019 |
2018 |
||||||||||||||||||||||
|
Net asset value, beginning of period |
$ |
11.64 |
$ |
12.26 |
$ |
12.34 |
$ |
12.34 |
$ |
12.12 |
$ |
12.54 |
|||||||||||||||
|
Income (loss) from investment operations |
|||||||||||||||||||||||||||
|
Net investment loss(a) |
(0.04 |
)(b) |
(0.16 |
) |
(0.10 |
)(b) |
(0.14 |
) |
(0.12 |
)(b) |
(0.07 |
)(b) |
|||||||||||||||
|
Net realized and unrealized gains (losses) on investments and foreign currencies |
0.04 |
(0.39 |
) |
0.91 |
0.41 |
0.50 |
0.01 |
||||||||||||||||||||
|
Total from investment operations |
— |
(0.55 |
) |
0.81 |
0.27 |
0.38 |
(0.06 |
) |
|||||||||||||||||||
|
Less distributions |
|||||||||||||||||||||||||||
|
From net investment income |
— |
— |
— |
— |
— |
(0.00 |
)(c) |
||||||||||||||||||||
|
From net realized gains |
— |
(0.07 |
) |
(0.89 |
) |
(0.27 |
) |
(0.16 |
) |
(0.36 |
) |
||||||||||||||||
|
Total distributions |
— |
(0.07 |
) |
(0.89 |
) |
(0.27 |
) |
(0.16 |
) |
(0.36 |
) |
||||||||||||||||
|
Net asset value, end of period |
$ |
11.64 |
$ |
11.64 |
$ |
12.26 |
$ |
12.34 |
$ |
12.34 |
$ |
12.12 |
|||||||||||||||
|
Total return(d)(e) |
0 |
%(f) |
(4.51 |
%) |
6.77 |
% |
2.24 |
% |
3.11 |
% |
(0.45 |
%) |
|||||||||||||||
|
Net assets, end of period (in 000s) |
$ |
10,739 |
$ |
13,467 |
$ |
18,043 |
$ |
19,860 |
$ |
19,050 |
$ |
22,917 |
|||||||||||||||
|
RATIOS TO AVERAGE NET ASSETS: |
|||||||||||||||||||||||||||
|
Gross expenses(g) |
2.27 |
%(h) |
2.30 |
% |
2.39 |
% |
2.41 |
% |
2.69 |
% |
2.66 |
% |
|||||||||||||||
|
Net expenses after advisory fees waived and expenses reimbursed(g)(i) |
2.21 |
%(h) |
2.24 |
% |
2.33 |
% |
2.38 |
% |
2.68 |
% |
2.65 |
% |
|||||||||||||||
|
Net investment loss |
(0.63 |
%)(h) |
(1.35 |
%) |
(0.85 |
%)(b) |
(1.16 |
%) |
(0.94 |
%)(b) |
(0.56 |
%) |
|||||||||||||||
|
Portfolio turnover rate |
91 |
%(f) |
206 |
% |
300 |
% |
273 |
% |
419 |
% |
362 |
% |
|||||||||||||||
See Notes to Financial Statements.
www.arbitragefunds.com | 1-800-295-4485
52
Financial Highlights
(a) Per share amounts were calculated using average shares outstanding for the period.
(b) The amount shown for a share outstanding throughout the period may not correlate with the Statement of Operations for the period due to timing of sales and redemptions of Fund shares in relation to income earned and/or fluctuating market value of the investments of the Fund.
(c) Amount rounds to less than $0.01 per share.
(d) Total return is a measure of the change in the value of an investment in the Fund over the periods covered, which assumes any dividends or capital gains distributions are reinvested in shares of the Fund. Returns shown do not reflect the deduction of taxes a shareholder would pay on Fund distributions or the redemption of Fund shares.
(e) Total return excludes sales charges, if any, and would be lower for the period presented if it reflected these charges.
(f) Not annualized.
(g) Dividend expense totaled 0.02% (annualized), 0.01%, 0.00%, 0.15%, 0.46% and 0.42% of average net assets for the six months ended November 30, 2022 and the years ended May 31, 2022, 2021, 2020, 2019 and 2018, respectively. Interest rebate expense and line of credit interest expense totaled 0.00% (annualized), 0.05%, 0.11%, 0.01%, 0.00% and 0.01% of average net assets for the six months ended November 30, 2022 and the years ended May 31, 2022, 2021, 2020, 2019 and 2018, respectively.
(h) Annualized.
(i) Excluding dividend and interest expenses, the Fund's net expenses after advisory fees waived and expenses reimbursed would have been 2.19% (annualized), 2.18%, 2.22%, 2.22%, 2.22% and 2.22% of average net assets for the six months ended November 30, 2022 and the years ended May 31, 2022, 2021, 2020, 2019 and 2018, respectively.
See Notes to Financial Statements.
Semi-Annual Report | November 30, 2022
53
Arbitrage Fund – Class A
Selected Per Share Data and Ratios for a Share Outstanding Throughout the Periods Presented:
|
Six Months Ended November 30, 2022 |
Year Ended May 31, |
||||||||||||||||||||||||||
|
(Unaudited) |
2022 |
2021 |
2020 |
2019 |
2018 |
||||||||||||||||||||||
|
Net asset value, beginning of period |
$ |
12.52 |
$ |
13.08 |
$ |
13.01 |
$ |
12.90 |
$ |
12.63 |
$ |
13.07 |
|||||||||||||||
|
Income (loss) from investment operations |
|||||||||||||||||||||||||||
|
Net investment income (loss)(a) |
0.01 |
(0.09 |
) |
— |
(b) |
(0.05 |
) |
(0.02 |
)(c) |
— |
(b) |
||||||||||||||||
|
Net realized and unrealized gains (losses) on investments and foreign currencies |
0.04 |
(0.40 |
) |
0.96 |
0.43 |
0.52 |
0.02 |
||||||||||||||||||||
|
Total from investment operations |
0.05 |
(0.49 |
) |
0.96 |
0.38 |
0.50 |
0.02 |
||||||||||||||||||||
|
Less distributions |
|||||||||||||||||||||||||||
|
From net investment income |
— |
— |
— |
— |
(0.07 |
) |
(0.10 |
) |
|||||||||||||||||||
|
From net realized gains |
— |
(0.07 |
) |
(0.89 |
) |
(0.27 |
) |
(0.16 |
) |
(0.36 |
) |
||||||||||||||||
|
Total distributions |
— |
(0.07 |
) |
(0.89 |
) |
(0.27 |
) |
(0.23 |
) |
(0.46 |
) |
||||||||||||||||
|
Net asset value, end of period |
$ |
12.57 |
$ |
12.52 |
$ |
13.08 |
$ |
13.01 |
$ |
12.90 |
$ |
12.63 |
|||||||||||||||
|
Total return(d)(e) |
0.40 |
%(f) |
(3.77 |
%) |
7.60 |
% |
3.00 |
% |
3.94 |
% |
0.21 |
% |
|||||||||||||||
|
Net assets, end of period (in 000s) |
$ |
39,506 |
$ |
42,040 |
$ |
32,624 |
$ |
17,762 |
$ |
18,341 |
$ |
16,740 |
|||||||||||||||
|
RATIOS TO AVERAGE NET ASSETS: |
|||||||||||||||||||||||||||
|
Gross expenses(g) |
1.52 |
%(h) |
1.55 |
% |
1.64 |
% |
1.66 |
% |
1.94 |
% |
1.91 |
% |
|||||||||||||||
|
Net expenses after advisory fees waived and expenses reimbursed(g)(i) |
1.46 |
%(h) |
1.49 |
% |
1.58 |
% |
1.63 |
% |
1.93 |
% |
1.90 |
% |
|||||||||||||||
|
Net investment income (loss) |
0.16 |
%(h) |
(0.74 |
%) |
(0.03 |
%)(c) |
(0.40 |
%) |
(0.19 |
%)(c) |
(0.01 |
%) |
|||||||||||||||
|
Portfolio turnover rate |
91 |
%(f) |
206 |
% |
300 |
% |
273 |
% |
419 |
% |
362 |
% |
|||||||||||||||
See Notes to Financial Statements.
www.arbitragefunds.com | 1-800-295-4485
54
Financial Highlights
(a) Per share amounts were calculated using average shares outstanding for the period.
(b) Amount rounds to less than $0.01 per share.
(c) The amount shown for a share outstanding throughout the period may not correlate with the Statement of Operations for the period due to timing of sales and redemptions of Fund shares in relation to income earned and/or fluctuating market value of the investments of the Fund.
(d) Total return is a measure of the change in the value of an investment in the Fund over the periods covered, which assumes any dividends or capital gains distributions are reinvested in shares of the Fund. Returns shown do not reflect the deduction of taxes a shareholder would pay on Fund distributions or the redemption of Fund shares.
(e) Total return excludes sales charges, if any, and would be lower for the period presented if it reflected these charges.
(f) Not annualized.
(g) Dividend expense totaled 0.02% (annualized), 0.01%, 0.00%, 0.15%, 0.46% and 0.42% of average net assets for the six months ended November 30, 2022 and the years ended May 31, 2022, 2021, 2020, 2019 and 2018, respectively. Interest rebate expense and line of credit interest expense totaled 0.00% (annualized), 0.05%, 0.11%, 0.01%, 0.00% and 0.01% of average net assets for the six months ended November 30, 2022 and the years ended May 31, 2022, 2021, 2020, 2019 and 2018, respectively.
(h) Annualized.
(i) Excluding dividend and interest expenses, the Fund's net expenses after advisory fees waived and expenses reimbursed would have been 1.44% (annualized), 1.43%, 1.47%, 1.47%, 1.47% and 1.47% of average net assets for the six months ended November 30, 2022 and the years ended May 31, 2022, 2021, 2020, 2019 and 2018, respectively.
See Notes to Financial Statements.
Semi-Annual Report | November 30, 2022
55
Water Island Event-Driven Fund – Class R
Selected Per Share Data and Ratios for a Share Outstanding Throughout the Periods Presented:
|
Six Months Ended November 30, 2022 |
Year Ended May 31, |
||||||||||||||||||||||||||
|
(Unaudited) |
2022 |
2021 |
2020 |
2019 |
2018 |
||||||||||||||||||||||
|
Net asset value, beginning of period |
$ |
10.84 |
$ |
11.38 |
$ |
9.97 |
$ |
9.47 |
$ |
9.46 |
$ |
9.34 |
|||||||||||||||
|
Income (loss) from investment operations |
|||||||||||||||||||||||||||
|
Net investment income (loss)(a) |
(0.00 |
)(b)(c) |
(0.12 |
) |
(0.05 |
) |
0.01 |
0.07 |
0.06 |
||||||||||||||||||
|
Net realized and unrealized gains (losses) on investments and foreign currencies |
0.07 |
(0.42 |
) |
1.46 |
0.51 |
0.08 |
0.09 |
||||||||||||||||||||
|
Total from investment operations |
0.07 |
(0.54 |
) |
1.41 |
0.52 |
0.15 |
0.15 |
||||||||||||||||||||
|
Less distributions |
|||||||||||||||||||||||||||
|
From net investment income |
— |
— |
— |
(0.02 |
) |
(0.14 |
) |
(0.03 |
) |
||||||||||||||||||
|
Total distributions |
— |
— |
— |
(0.02 |
) |
(0.14 |
) |
(0.03 |
) |
||||||||||||||||||
|
Proceeds from redemption fees collected |
— |
— |
— |
— |
— |
0.00 |
(b) |
||||||||||||||||||||
|
Net asset value, end of period |
$ |
10.91 |
$ |
10.84 |
$ |
11.38 |
$ |
9.97 |
$ |
9.47 |
$ |
9.46 |
|||||||||||||||
|
Total return(d) |
0.65 |
%(e) |
(4.75 |
%) |
14.14 |
% |
5.49 |
% |
1.60 |
% |
1.56 |
% |
|||||||||||||||
|
Net assets, end of period (in 000s) |
$ |
4,442 |
$ |
4,502 |
$ |
10,116 |
$ |
7,694 |
$ |
30,423 |
$ |
45,383 |
|||||||||||||||
|
RATIOS TO AVERAGE NET ASSETS: |
|||||||||||||||||||||||||||
|
Gross expenses(f) |
1.70 |
%(g) |
1.78 |
% |
1.98 |
% |
2.11 |
% |
2.58 |
% |
2.59 |
% |
|||||||||||||||
|
Net expenses after advisory fees waived and expenses reimbursed(f)(h) |
1.71 |
%(g) |
1.80 |
% |
1.89 |
% |
1.83 |
% |
2.18 |
% |
2.16 |
% |
|||||||||||||||
|
Net investment income (loss) |
(0.08 |
%)(g) |
(1.08 |
%) |
(0.51 |
%) |
0.09 |
% |
0.70 |
% |
0.58 |
% |
|||||||||||||||
|
Portfolio turnover rate |
94 |
%(e) |
217 |
% |
320 |
% |
397 |
% |
504 |
% |
421 |
% |
|||||||||||||||
See Notes to Financial Statements.
www.arbitragefunds.com | 1-800-295-4485
56
Financial Highlights
(a) Per share amounts were calculated using average shares outstanding for the period.
(b) Amount rounds to less than $0.01 per share.
(c) The amount shown for a share outstanding throughout the period may not correlate with the Statement of Operations for the period due to timing of sales and redemptions of Fund shares in relation to income earned and/or fluctuating market value of the investments of the Fund.
(d) Total return is a measure of the change in the value of an investment in the Fund over the periods covered, which assumes any dividends or capital gains distributions are reinvested in shares of the Fund. Returns shown do not reflect the deduction of taxes a shareholder would pay on Fund distributions or the redemption of Fund shares.
(e) Not annualized.
(f) Dividend expense totaled 0.01% (annualized), 0.01%, 0.01%, 0.13%, 0.46% and 0.44% of average net assets for the six months ended November 30, 2022 and the years ended May 31, 2022, 2021, 2020, 2019 and 2018, respectively. Interest rebate expense and line of credit interest expense totaled 0.01% (annualized), 0.10%, 0.19%, 0.01%, 0.03% and 0.03% of average net assets for the six months ended November 30, 2022 and the years ended May 31, 2022, 2021, 2020, 2019 and 2018, respectively.
(g) Annualized.
(h) Excluding dividend and interest expenses, the Fund's net expenses after advisory fees waived and expenses reimbursed would have been 1.69% (annualized), 1.69%, 1.69%, 1.69%, 1.69% and 1.69% of average net assets for the six months ended November 30, 2022 and the years ended May 31, 2022, 2021, 2020, 2019 and 2018, respectively.
See Notes to Financial Statements.
Semi-Annual Report | November 30, 2022
57
Water Island Event-Driven Fund – Class I
Selected Per Share Data and Ratios for a Share Outstanding Throughout the Periods Presented:
|
Six Months Ended November 30, 2022 |
Year Ended May 31, |
||||||||||||||||||||||||||
|
(Unaudited) |
2022 |
2021 |
2020 |
2019 |
2018 |
||||||||||||||||||||||
|
Net asset value, beginning of period |
$ |
10.95 |
$ |
11.47 |
$ |
10.05 |
$ |
9.54 |
$ |
9.53 |
$ |
9.43 |
|||||||||||||||
|
Income (loss) from investment operations |
|||||||||||||||||||||||||||
|
Net investment income (loss)(a) |
0.01 |
(0.10 |
) |
(0.03 |
) |
0.02 |
0.09 |
0.04 |
|||||||||||||||||||
|
Net realized and unrealized gains (losses) on investments and foreign currencies |
0.08 |
(0.42 |
) |
1.48 |
0.53 |
0.09 |
0.12 |
||||||||||||||||||||
|
Total from investment operations |
0.09 |
(0.52 |
) |
1.45 |
0.55 |
0.18 |
0.16 |
||||||||||||||||||||
|
Less distributions |
|||||||||||||||||||||||||||
|
From net investment income |
— |
— |
(0.03 |
) |
(0.04 |
) |
(0.17 |
) |
(0.06 |
) |
|||||||||||||||||
|
Total distributions |
— |
— |
(0.03 |
) |
(0.04 |
) |
(0.17 |
) |
(0.06 |
) |
|||||||||||||||||
|
Proceeds from redemption fees collected |
— |
— |
— |
— |
— |
0.00 |
(b) |
||||||||||||||||||||
|
Net asset value, end of period |
$ |
11.04 |
$ |
10.95 |
$ |
11.47 |
$ |
10.05 |
$ |
9.54 |
$ |
9.53 |
|||||||||||||||
|
Total return(c) |
0.73 |
%(d) |
(4.53 |
%) |
14.51 |
% |
5.83 |
% |
1.88 |
% |
1.69 |
% |
|||||||||||||||
|
Net assets, end of period (in 000s) |
$ |
105,803 |
$ |
107,038 |
$ |
125,093 |
$ |
99,069 |
$ |
92,710 |
$ |
103,001 |
|||||||||||||||
|
RATIOS TO AVERAGE NET ASSETS: |
|||||||||||||||||||||||||||
|
Gross expenses(e) |
1.45 |
%(f) |
1.53 |
% |
1.73 |
% |
1.86 |
% |
2.33 |
% |
2.34 |
% |
|||||||||||||||
|
Net expenses after advisory fees waived and expenses reimbursed(e)(g) |
1.46 |
%(f) |
1.55 |
% |
1.64 |
% |
1.58 |
% |
1.93 |
% |
1.91 |
% |
|||||||||||||||
|
Net investment income (loss) |
0.17 |
%(f) |
(0.86 |
%) |
(0.24 |
%) |
0.20 |
% |
0.92 |
% |
0.46 |
% |
|||||||||||||||
|
Portfolio turnover rate |
94 |
%(d) |
217 |
% |
320 |
% |
397 |
% |
504 |
% |
421 |
% |
|||||||||||||||
See Notes to Financial Statements.
www.arbitragefunds.com | 1-800-295-4485
58
Financial Highlights
(a) Per share amounts were calculated using average shares outstanding for the period.
(b) Amount rounds to less than $0.01 per share.
(c) Total return is a measure of the change in the value of an investment in the Fund over the periods covered, which assumes any dividends or capital gains distributions are reinvested in shares of the Fund. Returns shown do not reflect the deduction of taxes a shareholder would pay on Fund distributions or the redemption of Fund shares.
(d) Not annualized.
(e) Dividend expense totaled 0.01% (annualized), 0.01%, 0.01%, 0.13%, 0.46% and 0.44% of average net assets for the six months ended November 30, 2022 and the years ended May 31, 2022, 2021, 2020, 2019 and 2018, respectively. Interest rebate expense and line of credit interest expense totaled 0.01% (annualized), 0.10%, 0.19%, 0.01%, 0.03% and 0.03% of average net assets for the six months ended November 30, 2022 and the years ended May 31, 2022, 2021, 2020, 2019 and 2018, respectively.
(f) Annualized.
(g) Excluding dividend and interest expenses, the Fund's net expenses after advisory fees waived and expenses reimbursed would have been 1.44% (annualized), 1.44%, 1.44%, 1.44%, 1.44% and 1.44% of average net assets for the six months ended November 30, 2022 and the years ended May 31, 2022, 2021, 2020, 2019 and 2018, respectively.
See Notes to Financial Statements.
Semi-Annual Report | November 30, 2022
59
Water Island Event-Driven Fund – Class A
Selected Per Share Data and Ratios for a Share Outstanding Throughout the Periods Presented:
|
Six Months Ended November 30, 2022 |
Year Ended May 31, |
||||||||||||||||||||||||||
|
(Unaudited) |
2022 |
2021 |
2020 |
2019 |
2018 |
||||||||||||||||||||||
|
Net asset value, beginning of period |
$ |
10.82 |
$ |
11.36 |
$ |
9.97 |
$ |
9.46 |
$ |
9.46 |
$ |
9.35 |
|||||||||||||||
|
Income (loss) from investment operations |
|||||||||||||||||||||||||||
|
Net investment income (loss)(a) |
(0.01 |
)(c) |
(0.15 |
) |
(0.06 |
) |
(0.00 |
)(b) |
0.06 |
0.04 |
|||||||||||||||||
|
Net realized and unrealized gains (losses) on investments and foreign currencies |
0.07 |
(0.39 |
) |
1.46 |
0.53 |
0.08 |
0.10 |
||||||||||||||||||||
|
Total from investment operations |
0.06 |
(0.54 |
) |
1.40 |
0.53 |
0.14 |
0.14 |
||||||||||||||||||||
|
Less distributions |
|||||||||||||||||||||||||||
|
From net investment income |
— |
— |
(0.01 |
) |
(0.02 |
) |
(0.14 |
) |
(0.03 |
) |
|||||||||||||||||
|
Total distributions |
— |
— |
(0.01 |
) |
(0.02 |
) |
(0.14 |
) |
(0.03 |
) |
|||||||||||||||||
|
Net asset value, end of period |
$ |
10.88 |
$ |
10.82 |
$ |
11.36 |
$ |
9.97 |
$ |
9.46 |
$ |
9.46 |
|||||||||||||||
|
Total return(d)(f) |
0.46 |
%(e) |
(4.75 |
%) |
14.20 |
% |
5.62 |
% |
1.56 |
% |
1.49 |
% |
|||||||||||||||
|
Net assets, end of period (in 000s) |
$ |
2,157 |
$ |
2,301 |
$ |
1,384 |
$ |
347 |
$ |
799 |
$ |
701 |
|||||||||||||||
|
RATIOS TO AVERAGE NET ASSETS: |
|||||||||||||||||||||||||||
|
Gross expenses(g) |
1.70 |
%(h) |
1.77 |
% |
2.00 |
% |
2.11 |
% |
2.58 |
% |
2.59 |
% |
|||||||||||||||
|
Net expenses after advisory fees waived and expenses reimbursed(g)(i) |
1.71 |
%(h) |
1.79 |
% |
1.91 |
% |
1.83 |
% |
2.18 |
% |
2.16 |
% |
|||||||||||||||
|
Net investment income (loss) |
(0.10 |
%)(h) |
(1.35 |
%) |
(0.59 |
%) |
0.02 |
% |
0.65 |
% |
0.41 |
% |
|||||||||||||||
|
Portfolio turnover rate |
94 |
%(e) |
217 |
% |
320 |
% |
397 |
% |
504 |
% |
421 |
% |
|||||||||||||||
See Notes to Financial Statements.
www.arbitragefunds.com | 1-800-295-4485
60
Financial Highlights
(a) Per share amounts were calculated using average shares outstanding for the period.
(b) Amount rounds to less than $0.01 per share.
(c) The amount shown for a share outstanding throughout the period may not correlate with the Statement of Operations for the period due to timing of sales and redemptions of Fund shares in relation to income earned and/or fluctuating market value of the investments of the Fund.
(d) Total return excludes sales charges, if any, and would be lower for the period presented if it reflected these charges.
(e) Not annualized.
(f) Total return is a measure of the change in the value of an investment in the Fund over the periods covered, which assumes any dividends or capital gains distributions are reinvested in shares of the Fund. Returns shown do not reflect the deduction of taxes a shareholder would pay on Fund distributions or the redemption of Fund shares or the imposition of any sales load.
(g) Dividend expense totaled 0.01% (annualized), 0.00%, 0.01%, 0.13%, 0.46% and 0.44% of average net assets for the six months ended November 30, 2022 and the years ended May 31, 2022, 2021, 2020, 2019 and 2018, respectively. Interest rebate expense and line of credit interest expense totaled 0.01% (annualized), 0.10%, 0.21%, 0.01%, 0.03% and 0.03% of average net assets for the six months ended November 30, 2022 and the years ended May 31, 2022, 2021, 2020, 2019 and 2018, respectively.
(h) Annualized.
(i) Excluding dividend and interest expenses, the Fund's net expenses after advisory fees waived and expenses reimbursed would have been 1.69% (annualized), 1.69%, 1.69%, 1.69%, 1.69% and 1.69% of average net assets for the six months ended November 30, 2022 and the years ended May 31, 2022, 2021, 2020, 2019 and 2018, respectively.
See Notes to Financial Statements.
Semi-Annual Report | November 30, 2022
61
Water Island Credit Opportunities Fund – Class R
Selected Per Share Data and Ratios for a Share Outstanding Throughout the Periods Presented:
|
Six Months Ended November 30, 2022 |
Year Ended May 31, |
||||||||||||||||||||||||||
|
(Unaudited) |
2022 |
2021 |
2020 |
2019 |
2018 |
||||||||||||||||||||||
|
Net asset value, beginning of period |
$ |
9.73 |
$ |
10.16 |
$ |
9.64 |
$ |
9.70 |
$ |
9.77 |
$ |
9.67 |
|||||||||||||||
|
Income (loss) from investment operations |
|||||||||||||||||||||||||||
|
Net investment income(a) |
0.16 |
0.16 |
0.22 |
0.24 |
0.31 |
0.20 |
|||||||||||||||||||||
|
Net realized and unrealized gains (losses) on investments and foreign currencies |
(0.08 |
) |
(0.33 |
) |
0.54 |
(0.01 |
) |
(0.07 |
) |
0.12 |
|||||||||||||||||
|
Total from investment operations |
0.08 |
(0.17 |
) |
0.76 |
0.23 |
0.24 |
0.32 |
||||||||||||||||||||
|
Less distributions |
|||||||||||||||||||||||||||
|
From net investment income |
(0.17 |
) |
(0.26 |
) |
(0.24 |
) |
(0.29 |
) |
(0.31 |
) |
(0.22 |
) |
|||||||||||||||
|
Total distributions |
(0.17 |
) |
(0.26 |
) |
(0.24 |
) |
(0.29 |
) |
(0.31 |
) |
(0.22 |
) |
|||||||||||||||
|
Net asset value, end of period |
$ |
9.64 |
$ |
9.73 |
$ |
10.16 |
$ |
9.64 |
$ |
9.70 |
$ |
9.77 |
|||||||||||||||
|
Total return(b) |
0.89 |
%(c) |
(1.74 |
%) |
8.09 |
% |
2.46 |
% |
2.55 |
% |
3.21 |
% |
|||||||||||||||
|
Net assets, end of period (in 000s) |
$ |
8,608 |
$ |
9,072 |
$ |
7,553 |
$ |
3,673 |
$ |
7,845 |
$ |
9,533 |
|||||||||||||||
|
RATIOS TO AVERAGE NET ASSETS: |
|||||||||||||||||||||||||||
|
Gross expenses(d) |
1.59 |
%(e) |
1.62 |
% |
1.77 |
% |
1.96 |
% |
2.10 |
%(f) |
2.27 |
% |
|||||||||||||||
|
Net expenses after advisory fees waived and expenses reimbursed(d)(g) |
1.28 |
%(e) |
1.32 |
% |
1.32 |
% |
1.35 |
% |
1.59 |
%(f) |
1.95 |
% |
|||||||||||||||
|
Net investment income |
3.25 |
%(e) |
1.58 |
% |
2.20 |
% |
2.48 |
% |
3.18 |
%(f) |
2.09 |
% |
|||||||||||||||
|
Portfolio turnover rate |
46 |
%(c) |
148 |
% |
147 |
% |
175 |
% |
221 |
% |
314 |
% |
|||||||||||||||
See Notes to Financial Statements.
www.arbitragefunds.com | 1-800-295-4485
62
Financial Highlights
(a) Per share amounts were calculated using average shares outstanding for the period.
(b) Total return is a measure of the change in the value of an investment in the Fund over the periods covered, which assumes any dividends or capital gains distributions are reinvested in shares of the Fund. Returns shown do not reflect the deduction of taxes a shareholder would pay on Fund distributions or the redemption of Fund shares.
(c) Not annualized.
(d) Dividend expense totaled 0.02% (annualized), 0.01%, 0.01%, 0.07%, 0.29% and 0.42% of average net assets for the six months ended November 30, 2022 and the years ended May 31, 2022, 2021, 2020, 2019 and 2018, respectively. Interest rebate expense and line of credit interest expense totaled 0.03% (annualized), 0.08%, 0.08%, 0.05%, 0.01% and 0.03% of average net assets for the six months ended November 30, 2022 and the years ended May 31, 2022, 2021, 2020, 2019 and 2018, respectively.
(e) Annualized.
(f) Effective August 6, 2018, the investment adviser reduced the advisory fee paid by the Fund and agreed to increase the expense reimbursements it provides to the Fund by contractually limiting the Fund's total expenses (other than certain expenses noted in the Notes to Financial Statements) to 1.23% for Class R shares. Prior to August 6, 2018, the expense limitation had been 1.50%.
(g) Excluding dividend and interest expenses, the Fund's net expenses after advisory fees waived and expenses reimbursed would have been 1.23% (annualized), 1.23%, 1.23%, 1.23%, 1.29% and 1.50% of average net assets for the six months ended November 30, 2022 and the years ended May 31, 2022, 2021, 2020, 2019 and 2018, respectively.
See Notes to Financial Statements.
Semi-Annual Report | November 30, 2022
63
Water Island Credit Opportunities Fund – Class I
Selected Per Share Data and Ratios for a Share Outstanding Throughout the Periods Presented:
|
Six Months Ended November 30, 2022 |
Year Ended May 31, |
||||||||||||||||||||||||||
|
(Unaudited) |
2022 |
2021 |
2020 |
2019 |
2018 |
||||||||||||||||||||||
|
Net asset value, beginning of period |
$ |
9.69 |
$ |
10.12 |
$ |
9.60 |
$ |
9.65 |
$ |
9.73 |
$ |
9.65 |
|||||||||||||||
|
Income (loss) from investment operations |
|||||||||||||||||||||||||||
|
Net investment income(a) |
0.17 |
0.18 |
0.24 |
0.26 |
0.34 |
0.23 |
|||||||||||||||||||||
|
Net realized and unrealized gains (losses) on investments and foreign currencies |
(0.08 |
) |
(0.33 |
) |
0.55 |
0.01 |
(b) |
(0.08 |
) |
0.11 |
|||||||||||||||||
|
Total from investment operations |
0.09 |
(0.15 |
) |
0.79 |
0.27 |
0.26 |
0.34 |
||||||||||||||||||||
|
Less distributions |
|||||||||||||||||||||||||||
|
From net investment income |
(0.19 |
) |
(0.28 |
) |
(0.27 |
) |
(0.32 |
) |
(0.34 |
) |
(0.26 |
) |
|||||||||||||||
|
Total distributions |
(0.19 |
) |
(0.28 |
) |
(0.27 |
) |
(0.32 |
) |
(0.34 |
) |
(0.26 |
) |
|||||||||||||||
|
Net asset value, end of period |
$ |
9.59 |
$ |
9.69 |
$ |
10.12 |
$ |
9.60 |
$ |
9.65 |
$ |
9.73 |
|||||||||||||||
|
Total return(c) |
0.91 |
%(d) |
(1.51 |
%) |
8.29 |
% |
2.82 |
% |
2.70 |
% |
3.61 |
% |
|||||||||||||||
|
Net assets, end of period (in 000s) |
$ |
111,395 |
$ |
125,705 |
$ |
98,777 |
$ |
56,869 |
$ |
49,795 |
$ |
36,207 |
|||||||||||||||
|
RATIOS TO AVERAGE NET ASSETS: |
|||||||||||||||||||||||||||
|
Gross expenses(e) |
1.34 |
%(g) |
1.37 |
% |
1.52 |
% |
1.71 |
% |
1.85 |
%(f) |
2.02 |
% |
|||||||||||||||
|
Net expenses after advisory fees waived and expenses reimbursed(e)(h) |
1.03 |
%(g) |
1.07 |
% |
1.07 |
% |
1.10 |
% |
1.32 |
%(f) |
1.70 |
% |
|||||||||||||||
|
Net investment income |
3.49 |
%(g) |
1.84 |
% |
2.44 |
% |
2.73 |
% |
3.51 |
%(f) |
2.34 |
% |
|||||||||||||||
|
Portfolio turnover rate |
46 |
%(d) |
148 |
% |
147 |
% |
175 |
% |
221 |
% |
314 |
% |
|||||||||||||||
See Notes to Financial Statements.
www.arbitragefunds.com | 1-800-295-4485
64
Financial Highlights
(a) Per share amounts were calculated using average shares outstanding for the period.
(b) The amount shown for a share outstanding throughout the period may not correlate with the Statement of Operations for the period due to timing of sales and redemptions of Fund shares in relation to income earned and/or fluctuating market value of the investments of the Fund.
(c) Total return is a measure of the change in the value of an investment in the Fund over the periods covered, which assumes any dividends or capital gains distributions are reinvested in shares of the Fund. Returns shown do not reflect the deduction of taxes a shareholder would pay on Fund distributions or the redemption of Fund shares.
(d) Not annualized.
(e) Dividend expense totaled 0.02% (annualized), 0.01%, 0.01%, 0.07%, 0.29% and 0.42% of average net assets for the six months ended November 30, 2022 and the years ended May 31, 2022, 2021, 2020, 2019 and 2018, respectively. Interest rebate expense and line of credit interest expense totaled 0.03% (annualized), 0.08%, 0.08%, 0.05%, 0.01% and 0.03% of average net assets for the six months ended November 30, 2022 and the years ended May 31, 2022, 2021, 2020, 2019 and 2018, respectively.
(f) Effective August 6, 2018, the investment adviser reduced the advisory fee paid by the Fund and agreed to increase the expense reimbursements it provides to the Fund by contractually limiting the Fund's total expenses (other than certain expenses noted in the Notes to Financial Statements) to 0.98% for Class I shares. Prior to August 6, 2018, the expense limitation had been 1.25%.
(g) Annualized.
(h) Excluding dividend and interest expenses, the Fund's net expenses after advisory fees waived and expenses reimbursed would have been 0.98% (annualized), 0.98%, 0.98%, 0.98%, 1.02% and 1.25% of average net assets for the six months ended November 30, 2022 and the years ended May 31, 2022, 2021, 2020, 2019 and 2018, respectively.
See Notes to Financial Statements.
Semi-Annual Report | November 30, 2022
65
Water Island Credit Opportunities Fund – Class A
Selected Per Share Data and Ratios for a Share Outstanding Throughout the Periods Presented:
|
Six Months Ended November 30, 2022 |
Year Ended May 31, |
||||||||||||||||||||||||||
|
(Unaudited) |
2022 |
2021 |
2020 |
2019 |
2018 |
||||||||||||||||||||||
|
Net asset value, beginning of period |
$ |
9.69 |
$ |
10.12 |
$ |
9.60 |
$ |
9.65 |
$ |
9.73 |
$ |
9.66 |
|||||||||||||||
|
Income (loss) from investment operations |
|||||||||||||||||||||||||||
|
Net investment income(a) |
0.15 |
0.16 |
0.22 |
0.23 |
0.31 |
0.17 |
|||||||||||||||||||||
|
Net realized and unrealized gains (losses) on investments and foreign currencies |
(0.07 |
) |
(0.33 |
) |
0.54 |
0.01 |
(b) |
(0.08 |
) |
0.14 |
|||||||||||||||||
|
Total from investment operations |
0.08 |
(0.17 |
) |
0.76 |
0.24 |
0.23 |
0.31 |
||||||||||||||||||||
|
Less distributions |
|||||||||||||||||||||||||||
|
From net investment income |
(0.17 |
) |
(0.26 |
) |
(0.24 |
) |
(0.29 |
) |
(0.31 |
) |
(0.24 |
) |
|||||||||||||||
|
Total distributions |
(0.17 |
) |
(0.26 |
) |
(0.24 |
) |
(0.29 |
) |
(0.31 |
) |
(0.24 |
) |
|||||||||||||||
|
Net asset value, end of period |
$ |
9.60 |
$ |
9.69 |
$ |
10.12 |
$ |
9.60 |
$ |
9.65 |
$ |
9.73 |
|||||||||||||||
|
Total return(c)(e) |
0.89 |
%(d) |
(1.76 |
%) |
8.02 |
% |
2.56 |
% |
2.45 |
% |
3.10 |
% |
|||||||||||||||
|
Net assets, end of period (in 000s) |
$ |
66 |
$ |
105 |
$ |
97 |
$ |
88 |
$ |
121 |
$ |
153 |
|||||||||||||||
|
RATIOS TO AVERAGE NET ASSETS: |
|||||||||||||||||||||||||||
|
Gross expenses(f) |
1.60 |
%(g) |
1.62 |
% |
1.77 |
% |
1.96 |
% |
2.10 |
%(h) |
2.27 |
% |
|||||||||||||||
|
Net expenses after advisory fees waived and expenses reimbursed(f)(i) |
1.29 |
%(g) |
1.32 |
% |
1.32 |
% |
1.35 |
% |
1.58 |
%(h) |
1.95 |
% |
|||||||||||||||
|
Net investment income |
3.21 |
%(g) |
1.59 |
% |
2.21 |
% |
2.37 |
% |
3.24 |
%(h) |
1.81 |
% |
|||||||||||||||
|
Portfolio turnover rate |
46 |
%(d) |
148 |
% |
147 |
% |
175 |
% |
221 |
% |
314 |
% |
|||||||||||||||
See Notes to Financial Statements.
www.arbitragefunds.com | 1-800-295-4485
66
Financial Highlights
(a) Per share amounts were calculated using average shares outstanding for the period.
(b) The amount shown for a share outstanding throughout the period may not correlate with the Statement of Operations for the period due to timing of sales and redemptions of Fund shares in relation to income earned and/or fluctuating market value of the investments of the Fund.
(c) Total return excludes sales charges, if any, and would be lower for the period presented if it reflected these charges.
(d) Not annualized.
(e) Total return is a measure of the change in the value of an investment in the Fund over the periods covered, which assumes any dividends or capital gains distributions are reinvested in shares of the Fund. Returns shown do not reflect the deduction of taxes a shareholder would pay on Fund distributions or the redemption of Fund shares or the imposition of any sales load.
(f) Dividend expense totaled 0.02% (annualized), 0.01%, 0.01%, 0.07%, 0.29% and 0.42% of average net assets for the six months ended November 30, 2022 and the years ended May 31, 2022, 2021, 2020, 2019 and 2018, respectively. Interest rebate expense and line of credit interest expense totaled 0.03% (annualized), 0.08%, 0.08%, 0.05%, 0.01% and 0.03% of average net assets for the six months ended November 30, 2022 and the years ended May 31, 2022, 2021, 2020, 2019 and 2018, respectively.
(g) Annualized.
(h) Effective August 6, 2018, the investment adviser reduced the advisory fee paid by the Fund and agreed to increase the expense reimbursements it provides to the Fund by contractually limiting the Fund's total expenses (other than certain expenses noted in the Notes to Financial Statements) to 1.23% for Class A shares. Prior to August 6, 2018, the expense limitation had been 1.50%.
(i) Excluding dividend and interest expenses, the Fund's net expenses after advisory fees waived and expenses reimbursed would have been 1.23% (annualized), 1.23%, 1.23%, 1.23%, 1.28% and 1.50% of average net assets for the six months ended November 30, 2022 and the years ended May 31, 2022, 2021, 2020, 2019 and 2018, respectively.
See Notes to Financial Statements.
Semi-Annual Report | November 30, 2022
67
The Arbitrage Funds Notes to Financial Statements
November 30, 2022 (Unaudited)
1. ORGANIZATION
The Arbitrage Funds (the "Trust") is a Delaware statutory trust, which was organized on December 22, 1999 and is registered under the Investment Company Act of 1940, as amended (the "1940 Act"), as an open-end management investment company issuing its shares in series. Each series represents a distinct portfolio with its own investment objective and policies. The three series presently authorized are the Arbitrage Fund (the "Arbitrage Fund"), the Water Island Event-Driven Fund (the "Event-Driven Fund") and the Water Island Credit Opportunities Fund (the "Credit Opportunities Fund"), each a "Fund" and collectively the "Funds." The Arbitrage Fund and the Credit Opportunities Fund are each a diversified series of the Trust. The Event-Driven Fund is a non-diversified series of the Trust. Water Island Capital, LLC acts as the Funds' investment adviser (the "Adviser"). The Adviser is responsible for overseeing the management and business affairs of the Funds, and has discretion to purchase and sell securities in accordance with the Funds' objectives, policies, and restrictions, subject to the authority of and supervision by the Trust's Board of Trustees (the "Board"). The Adviser continuously reviews, supervises, and administers the Funds' investment programs. The Funds, together with the series of AltShares Trust, an open-end management investment company also advised by the Adviser, are part of a family of investment companies referred to as the Water Island Capital-Advised Funds.
|
Commencement of Operations |
|||||||||||||||||||
|
Fund |
Class R shares |
Class I shares |
Class C shares |
Class A shares |
|||||||||||||||
|
Arbitrage Fund |
September 18, 2000 |
October 17, 2003 |
June 1, 2012 |
June 1, 2013 |
|||||||||||||||
|
Event-Driven Fund |
October 1, 2010 |
October 1, 2010 |
N/A |
June 1, 2013 |
|||||||||||||||
|
Credit Opportunities Fund |
October 1, 2012 |
October 1, 2012 |
N/A |
June 1, 2013 |
|||||||||||||||
The investment objective of the Arbitrage Fund is to seek to achieve capital growth by engaging in merger arbitrage. The investment objective of the Event-Driven Fund is to seek to achieve capital growth by investing in companies that are impacted by corporate events such as mergers, acquisitions, asset sales, restructurings, refinancings, recapitalizations, reorganizations, or other special situations. The investment objective of the Credit Opportunities Fund is to seek to provide current income and capital growth by investing primarily in debt securities impacted by catalysts and events such as mergers, acquisitions, debt maturities, refinancings, regulatory changes, recapitalizations, reorganizations, restructurings, and other special situations.
The Arbitrage Fund's four classes of shares, Class R, Class I, Class C and Class A, and the Event-Driven Fund's and Credit Opportunities Fund's three classes of shares, Class R, Class I and Class A, represent interests in the same portfolio of investments and have the same rights, but differ primarily in the expenses to which they are subject and the investment eligibility requirements. Class R shares, Class C shares and Class A shares are subject to an annual distribution and servicing fee of up to 0.25%, 1.00% and 0.25%, respectively, of each Fund's average daily net assets attributable to Class R shares, Class C shares and Class A shares, respectively, whereas Class I shares are not subject to any distribution and servicing fees. Class C shares are also subject to a 1.00% contingent deferred sales charge on all purchases redeemed within 12 months of purchase. Class A shares of the Arbitrage Fund are sold subject to a maximum front-end sales load equal to 2.75% of the offering price and are also subject to a 1.00% contingent deferred sales load on purchases at or above $250,000, purchased without a front-end sales charge and redeemed within 18 months of purchase. Class A shares of the Event-Driven Fund and the Credit Opportunities Fund are sold subject to a maximum front-end sales load equal to 3.25% of the offering price and are also subject to a 1.00% contingent deferred sales load on purchases
www.arbitragefunds.com | 1-800-295-4485
68
The Arbitrage Funds Notes to Financial Statements (continued)
November 30, 2022 (Unaudited)
at or above $250,000 purchased without a front-end sales charge and redeemed within 18 months of purchase.
2. SIGNIFICANT ACCOUNTING POLICIES
The following is a summary of significant accounting policies followed by the Funds. These policies are in conformity with U.S. generally accepted accounting principles ("GAAP"). The Funds are considered investment companies for financial reporting purposes under GAAP and Accounting Standards Codification Topic 946 — Financial Services — Investment Companies.
In March 2020, the FASB issued ASU 2020-04, Reference Rate Reform, which provides optional expedients and exceptions for applying GAAP to contracts, hedging relationships, and other transactions which are affected by reference rate reform if certain criteria are met. Such provisions are elective and apply to all entities as of March 12, 2020 through December 31, 2022, subject to meeting certain criteria, that have transactions that reference the London Interbank Offered Rate ("LIBOR") or another reference rate that are discontinued because of reference rate reform. In March 2021, the administrator for LIBOR announced the extension of the publication of a majority of the USD LIBOR settings to June 30, 2023. Management expects that the adoption of the guidance will not have a material impact on the Funds' financial statements.
In July 2017, the Financial Conduct Authority, the United Kingdom's financial regulatory body, announced that after 2021 it will cease its active encouragement of banks to provide quotations needed to sustain the LIBOR rate, which means that the LIBOR rate may no longer be published after 2021. The elimination of LIBOR, among other "inter-bank offered" reference rates, may adversely affect the interest rates on, and value of, certain Fund investments for which the value is tied to LIBOR. The U.K. Financial Conduct Authority and the ICE Benchmark Administration have announced that most LIBOR settings will no longer be published after December 31, 2021 and a majority of U.S. dollar LIBOR settings will cease publication after June 30, 2023. It's possible that a subset of LIBOR settings will be published after these dates on a "synthetic" basis, but any such publications would be considered non-representative of the underlying market. Markets are slowly developing in response to these new reference rates. Uncertainty related to the liquidity impact of the change in rates, and how to appropriately adjust these rates at the time of transition, poses risks for the Funds. These risks are likely to persist until new reference rates and fallbacks for both legacy and new instruments and contracts are commercially accepted, and market practices become settled. Alternatives to LIBOR have been established or are in development in most major currencies, including the Secured Overnight Financing Rate ("SOFR") that is intended to replace U.S. dollar LIBOR. Management expects that the LIBOR transition will not have a material impact on the Funds' financial statements.
Effective August 19, 2022, the Funds are required to comply with new Securities and Exchange Commission ("SEC") regulations governing the use of derivatives by registered investment companies. Rule 18f-4 under the 1940 Act requires funds that invest in derivatives above a specified amount to adopt and implement a derivatives risk management program ("DRMP") administered by a derivatives risk manager that is appointed by and overseen by the fund's board of trustees, and to comply with an outer limit on fund leverage risk based on value at risk, or "VaR." The Funds have established a DRMP and appointed a derivatives risk manager to administer the DRMP, consistent with Rule 18f-4. The requirements of Rule 18f-4 may limit a Fund's ability to engage in derivatives transactions as part of its investment strategies. The rule also may not be effective to limit a Fund's risk of loss. In particular, measurements of VaR rely on historical data and may not accurately measure the degree of risk reflected in a Fund's derivatives
Semi-Annual Report | November 30, 2022
69
The Arbitrage Funds Notes to Financial Statements (continued)
November 30, 2022 (Unaudited)
or other investments. Management expects that the implementation of this rule will not have a material impact on the Funds' financial statements.
Effective September 8, 2022, the Funds are required to comply with new SEC regulations that govern valuation practices and the role of a fund's board with respect to the fair value of the investments of a registered investment company. Rule 2a-5 under the 1940 Act, among other things, establishes an updated regulatory framework for registered investment company fair valuation practices. The Funds' Board has designated the Adviser as each Fund's valuation designee to perform fair value functions in accordance with valuation policies and procedures adopted by the Adviser, subject to the Board's oversight. Management expects that the implementation of this rule will not have a material impact on the Funds' financial statements.
Use of Estimates — The preparation of financial statements in conformity with GAAP requires management to make estimates and assumptions that affect the reported amounts of assets and liabilities at the date of the financial statements and the reported amounts of increases and decreases in net assets from operations during the reporting period. Actual results could differ from those estimates.
Valuation of Investments — The Funds' portfolio securities are valued as of the close of trading of the New York Stock Exchange ("NYSE") (normally 4:00 p.m., Eastern standard time). Common stocks, mutual funds and other securities, including open short positions that are traded on a securities exchange, are valued at the last quoted sales price at the close of regular trading on the day the valuation is made. Securities which are quoted by NASDAQ are valued at the NASDAQ Official Closing Price. Price information on listed stocks is taken from the exchange where the security is primarily traded. Redeemable securities issued by open-end investment companies are valued at the investment company's respective net asset value, with the exception of exchange-traded open-end investment companies, which are priced as common stocks. Market quotations of foreign securities from the principal markets in which they trade may not be reliable if events or circumstances that may affect the value of portfolio securities occur between the time of the market quotation and the close of trading on the NYSE. If a significant event that affects the valuation of a foreign security occurs between the close of a foreign security's primary exchange and the time the Funds calculate their net asset value ("NAV"), the Funds will fair value the foreign security to account for this discrepancy. Securities which are listed on an exchange but which are not traded on the valuation date will be valued at last bid if held long, and last ask if held short. Put and call options and securities traded in the over-the-counter market are valued at the mean of the most recent bid and ask prices. Foreign currency forward contracts are valued at the current day's interpolated foreign exchange rate, as calculated using the current day's spot rate, and the thirty, sixty, ninety and one-hundred eighty day forward rates provided by an independent source.
Debt securities are priced based upon an evaluated bid provided by independent, third-party pricing agents, if available. The third-party pricing agents may also value debt securities at an evaluated bid price by employing methodologies that utilize actual market transactions, broker-supplied valuations, or other methodologies designed to identify the market value for such securities. Unlisted securities for which market quotations are readily available are valued at the latest quoted bid price. Single name swap agreements are valued based on the underlying terms of the agreement. Other swap agreements (such as baskets of securities) are valued daily based on the terms of the swap agreement as provided by an independent third party or the counterparty. If a third-party valuation is not available, these other swap agreements are valued based on the valuation provided by the counterparty.
www.arbitragefunds.com | 1-800-295-4485
70
The Arbitrage Funds Notes to Financial Statements (continued)
November 30, 2022 (Unaudited)
Other assets and securities for which no quotations are readily available are valued at fair value using methods determined in good faith by the Adviser's Pricing Committee, which is under the supervision of the Board. Some of the more common reasons that may necessitate that a security be valued at fair value include: the security's trading has been halted or suspended; the security has been delisted from a national exchange; the security's primary trading market is temporarily closed at a time when under normal conditions it would be open; the security has been acquired through completion of a merger/tender or the security's primary pricing source is not able or willing to provide a price. Such methods of fair valuation may include, but are not limited to: multiple of earnings, multiple of book value, discount from market of a similar freely traded security, purchase price of a security, subsequent private transactions in the security or related securities, or a combination of these and other factors. Foreign securities are translated from the local currency into U.S. dollars using currency exchange rates supplied by a quotation service.
Fair Value Measurements — In accordance with the authoritative guidance on fair value measurements under GAAP, the Funds disclose fair value of their investments in a hierarchy that prioritizes the inputs to valuation techniques used to measure the fair value. The objective of a fair value measurement is to determine the price that would be received to sell an asset or paid to transfer a liability in an orderly transaction between market participants at the measurement date (an exit price). Accordingly, the fair value hierarchy gives the highest priority to quoted prices (unadjusted) in active markets for identical assets or liabilities (Level 1) and the lowest priority to unobservable inputs (Level 3). The guidance establishes three levels of the fair value hierarchy as follows:
Level 1 — Unadjusted quoted prices in active markets for identical, unrestricted assets or liabilities that the Funds have the ability to access at the measurement date;
Level 2 — Observable inputs other than quoted prices included in Level 1 that are observable (either directly or indirectly) for substantially the full term of the asset or liability; and
Level 3 — Unobservable inputs for the asset or liability, to the extent relevant observable inputs are not available, representing each Fund's own assumption about the assumptions a market participant would use in valuing the asset or liability, and would be based on the best information available.
Investments are classified within the level of the lowest significant input considered in determining fair value. Investments classified within Level 3, whose fair value measurement considers several inputs, may include Level 1 or Level 2 inputs as components of the overall fair value measurement. The inputs or methodology used for valuing securities are not necessarily an indication of the risk associated with investing in those securities.
For the six months ended November 30, 2022, there were no significant changes to the Funds' fair value methodologies. Transfers for Level 3 securities, if any, are shown as part of the leveling table in each Fund's Portfolio of Investments.
The availability of observable inputs can vary from security to security and is affected by a wide variety of factors, including, but not limited to, the type of security, whether the security is new and not yet established in the marketplace, the liquidity of markets, and other characteristics particular to the security. To the extent that valuation is based on models or inputs that are less observable or unobservable in the market, the determination of fair value requires more judgment. Accordingly, the degree of judgment exercised in determining fair value is generally greatest for instruments categorized in Level 3. Due to the inherent uncertainty of valuation, the
Semi-Annual Report | November 30, 2022
71
The Arbitrage Funds Notes to Financial Statements (continued)
November 30, 2022 (Unaudited)
determination of values may differ significantly from values that would have been realized had a ready market for investments existed, and the differences could be material.
Share Valuation — The net asset value per share of each class of shares of the Funds is calculated daily by dividing the total value of a Fund's assets attributable to that class, less liabilities attributable to that class, by the number of shares of that class outstanding.
Security Transactions — Security transactions are accounted for on trade date. Gains and losses on securities sold are determined on a specific identification basis.
Short Positions — The Funds may sell securities short for economic hedging purposes. Subsequent fluctuations in the market prices of securities sold short may require purchasing the securities at prices which may differ from the market value reflected on the Portfolio of Investments. The Funds are liable for any dividends and interest payable on securities while those securities are in a short position. As collateral for their short positions, the Funds maintain assets consisting of cash, cash equivalents or liquid securities. The amount of the collateral is required to be adjusted daily to reflect changes in the value of the securities sold short. The Funds are charged an interest rebate expense by the prime broker on securities sold short. The interest rebate expense is charged for the duration of time that a security is sold short and is shown on the Statements of Operations.
Collateral — The Funds maintain a margin account with a broker that is used to hold proceeds received from short sales as well as daily mark-to-market adjustments. The balance is shown in the Statement of Assets and Liabilities as 'Deposits with brokers for securities sold short'. Further, both short sales and swap contracts require the Funds to maintain additional collateral with the broker/counterparty and to pledge assets or cash which is held in a segregated tri-party account. Securities pledged as collateral are designated in the Schedule of Investments and cash collateral as 'Segregated cash for collateral' in the Statement of Assets and Liabilities.
Derivative Instruments and Hedging Activities — The following discloses the Funds' use of derivative instruments and hedging activities.
The Funds' investment objectives not only permit the Funds to purchase investment securities, but they also allow the Funds to enter into various types of derivative contracts, including, but not limited to, swap contracts, forward foreign currency exchange contracts, and purchased and written option contracts. In doing so, the Funds will employ strategies in differing combinations to permit them to increase, decrease, or change the level or types of exposure to market factors. Central to those strategies are features inherent to derivatives that make them more attractive for this purpose than equity or debt securities: they require little or no initial cash investment; they can focus exposure on only certain selected risk factors; and they may not require the ultimate receipt or delivery of the underlying security (or securities) to satisfy the contract. This may allow the Funds to pursue their objectives more quickly and efficiently than if they were to make direct purchases or sales of securities capable of effecting a similar response to market factors. The Funds may, but are not required to, seek to reduce their currency risk by hedging part or all of their exposure to various foreign currencies.
Market Risk Factors: In pursuit of their investment objectives, the Funds may seek to use derivatives to increase or decrease their exposure to the following market risk factors:
Equity Risk: Equity risk relates to the change in value of equity securities as they relate to increases or decreases in the general market. Investments in securities issued by small and medium capitalization companies tend to be less liquid and more volatile than stocks of
www.arbitragefunds.com | 1-800-295-4485
72
The Arbitrage Funds Notes to Financial Statements (continued)
November 30, 2022 (Unaudited)
companies with relatively large market capitalizations. To the extent a Fund invests in securities of small and medium capitalization companies, it may be more vulnerable to adverse business events than larger, more established companies.
Interest Rate Risk: Interest rate risk refers to the fluctuations in value of fixed-income securities resulting from the inverse relationship between price and yield. For example, an increase in general interest rates will tend to reduce the market value of fixed-income investments, and a decline in general interest rates will tend to increase the value of such investments. In addition, debt securities with longer maturities, which tend to have higher yields, are subject to potentially greater fluctuations in value from changes in interest rates than obligations with shorter maturities.
Foreign Exchange Rate Risk: Foreign exchange rate risk relates to the change in the U.S. dollar value of a security held that is denominated in a foreign currency. The value of a foreign currency denominated security will decrease as the dollar appreciates against the currency, while the value of the foreign currency denominated security will increase as the dollar depreciates against the currency. Adverse changes in exchange rates may erode or reverse any gains produced by foreign currency denominated investments and may widen any losses.
Credit Risk: Credit risk relates to the ability of the issuer to meet interest and principal payments, or both, as they come due. In general, lower-grade, higher-yield bonds are subject to credit risk to a greater extent than lower-yield, higher-quality bonds.
Market Disruption Risks Related to COVID-19: The extent of the impact of the novel coronavirus ("COVID-19") outbreak on the financial performance of the Funds continues to depend on developments, including duration and spread of the outbreak, related public health advisories and restrictions, and the impact of COVID-19 on the financial markets and the overall economy, all of which are highly uncertain and cannot be predicted. Adverse market conditions may be prolonged and may not have the same impact on all types of securities. These disruptions could prevent a Fund from executing advantageous investment decisions in a timely manner and could negatively impact the Fund's ability to achieve its investment objective. If the financial markets and/or the overall economy continue to be impacted for an extended period of time, the Funds' results of operations may be materially adversely affected.
Market Disruption Risks Related to Russia-Ukraine Conflict: Russia's invasion of Ukraine in late February 2022, the resulting responses of various countries, the European Union and NATO to Russia's actions (including potential further sanctions), the potential for military escalation and other corresponding events, including potential retaliatory actions (including cyberattacks) by Russia, have had, and could continue to have, severe negative effects on regional and global economic and financial markets, including increased volatility, reduced liquidity and overall uncertainty. The negative impact may be particularly acute in certain sectors including, but not limited to, energy, financials, commodities, engineering and defense. This could negatively affect Fund performance and the value of an investment in the Funds, even beyond any direct investment exposure the Funds may have to Russian issuers or the adjoining geographic regions.
Risk of Investing in Derivatives: The Funds' use of derivatives can result in losses due to unanticipated changes in the market risk factors and the overall market. In instances where the Funds are using derivatives to decrease or hedge exposures to market risk factors for securities held by the Funds, there are also risks that those derivatives may not perform as expected, resulting in losses for the combined or hedged positions.
Semi-Annual Report | November 30, 2022
73
The Arbitrage Funds Notes to Financial Statements (continued)
November 30, 2022 (Unaudited)
Derivatives may have little or no initial cash investment relative to their market value exposure and therefore can produce significant gains or losses in excess of their cost. This use of embedded leverage allows the Funds to increase their market value exposure relative to their net assets and can substantially increase the volatility of the Funds' performance.
Additional associated risks from investing in derivatives also exist and potentially could have significant effects on the valuation of the derivative instruments and the Funds. Typically, the associated risks are not the risks that the Funds are attempting to increase or decrease exposure to, per their investment objectives, but are the additional risks from investing in derivatives.
Examples of these associated risks are liquidity risk, which is the risk that the Funds will not be able to sell the derivative in the open market in a timely manner, and counterparty credit risk, which is the risk that the counterparty to a transaction will not fulfill its obligation to the Funds. Associated risks can be different for each type of derivative and are discussed by derivative type in the notes that follow.
Option Writing/Purchasing: The Funds may write or purchase option contracts to adjust risk and return of their overall investment positions. When a Fund writes or purchases an option, an amount equal to the premium received or paid by the Fund is recorded as a liability or an asset and is subsequently adjusted to the current market value of the option written or purchased. Premiums received or paid from writing or purchasing options that expire unexercised are treated by the Fund on the expiration date as realized gains or losses. The difference between the premium and the amount paid or received on effecting a closing purchase or sale transaction, including brokerage commissions, is also treated as a realized gain or loss. If an option is exercised, the premium paid or received is added to the cost of the purchase or proceeds from the sale in determining whether the Fund has realized a gain or loss on investment transactions. Risks from entering into option transactions arise from the potential inability of counterparties to meet the terms of the contracts, the potential inability to enter into closing transactions because of an illiquid secondary market and from unexpected movements in security values.
Options held by the Funds at November 30, 2022 are disclosed in the Portfolio of Investments.
During the period ended November 30, 2022, the Funds engaged in option writing/purchasing to limit volatility and correlation and to create income and optionality. The maximum potential amount of future payments (undiscounted) that a fund as a writer of put options could be required to make is equal to the notional amount multiplied by the exercise price as shown in the Schedule of Investments.
Foreign Currency Exchange Contracts: The Funds may enter into forward foreign currency exchange contracts as a way of managing foreign exchange rate risk. The Funds may enter into these contracts for the purchase or sale of a specific foreign currency at a fixed price on a future date as a hedge or cross-hedge against either specific transactions or portfolio positions. The objective of the Funds' foreign currency hedging transactions is to reduce risk that the U.S. dollar value of the Funds' securities denominated in foreign currency will decline in value due to changes in foreign currency exchange rates.
Foreign currency exchange contracts held by the Funds at November 30, 2022 are disclosed in the Portfolio of Investments.
During the period ended November 30, 2022, the Funds entered into foreign currency exchange contracts to hedge currency risk.
www.arbitragefunds.com | 1-800-295-4485
74
The Arbitrage Funds Notes to Financial Statements (continued)
November 30, 2022 (Unaudited)
Warrants/Rights: Each Fund may purchase or otherwise receive warrants or rights. Warrants and rights generally give the holder the right to receive, upon exercise, a security of the issuer at a set price. The Funds typically use warrants and rights in a manner similar to their use of purchased options on securities, as described in the Options Writing/Purchasing section above. Risks associated with the use of warrants and rights are generally similar to risks associated with the use of purchased options. However, warrants and rights often do not have standardized terms, and may have longer maturities and may be less liquid than exchange-traded options. In addition, the terms of warrants or rights may limit each Fund's ability to exercise the warrants or rights at such times and in such quantities as each Fund would otherwise wish. Warrants and rights generally pay no dividends and confer no voting or other rights other than to purchase the underlying security.
Warrants/rights held by the Funds at November 30, 2022 are disclosed in the Portfolio of Investments.
During the period ended November 30, 2022, the Funds held warrants/rights as a result of receiving them from completed deals, and to participate in investment opportunities.
Swaps: The Funds may enter into swap transactions, such as interest rate, index, equity, total return and credit default swap agreements, for hedging and non-hedging purposes. These transactions would be entered into in an attempt to obtain a particular return when it is considered desirable to do so, possibly at a lower cost to a Fund than if the Fund had invested directly in the asset that yielded the desired return. Swap agreements may be executed in a multilateral or other trade facility program, such as a registered exchange ("centrally cleared swaps") or may be privately negotiated in the over-the-counter market. The duration of a swap agreement typically ranges from a few weeks to more than one year. In a standard swap transaction, two parties agree to exchange the returns (or differentials in rates of return) earned or realized on particular predetermined investments or instruments, which may be adjusted for an interest factor. The gross returns to be exchanged or "swapped" between the parties are generally calculated with respect to a "notional amount" (i.e., the return on or increase in value of a particular dollar amount invested at a particular interest rate, a particular security, in a particular foreign currency, or in a "basket" of securities representing a particular index). In a centrally cleared swap, immediately following execution of the swap agreement, the swap agreement is novated to a central counterparty (the "CCP") and the Fund's counterparty on the swap agreement becomes the CCP.
Total return swap agreements are contracts in which one party agrees to make periodic payments based on the change in market value of underlying assets, which may include a specified security, basket of securities, defined portfolios of bonds, loans and mortgages, or securities indexes during the specified period in return for periodic payments based on a fixed or variable interest rate or the total return from other underlying assets or indices. Total return swap agreements may be used to obtain exposure to a security or market index without owning or taking physical custody of such security or component securities of a market index. Total return swap agreements may effectively add leverage to a Fund's portfolio because, in addition to its total net assets, the Fund would be subject to investment exposure on the notional amount of the swap. Total return swaps are a mechanism for the user to accept the economic benefits of asset ownership without utilizing the balance sheet. The other leg of the swap, usually an identified reference rate such as the SOFR or the federal funds rate, is spread to reflect the non-balance sheet nature of the product. Total return swaps can be designed with any underlying asset agreed upon between two parties. Typically no notional amounts are exchanged with total return swaps. Total return swap
Semi-Annual Report | November 30, 2022
75
The Arbitrage Funds Notes to Financial Statements (continued)
November 30, 2022 (Unaudited)
agreements entail the risk that a party will default on its payment obligations to a Fund thereunder. Swap agreements also entail the risk that a Fund will not be able to meet its obligation to the counterparty. Generally, a Fund will enter into total return swaps on a net basis (i.e., the two payment streams are netted out with the Fund receiving or paying, as the case may be, only the net amount of the two payments). The Funds will typically enter into agreements based on either long or short exposure to underlying equities. To help mitigate against default risk by the counterparties these agreements are reset monthly, with cashflows exchanged based on the change in the value of the underlying equity from either the opening price or the last reset price, netted against the interest leg of the swap.
Most swap agreements entered into by a Fund calculate the obligations of the parties to the agreement on a "net basis." Consequently, a Fund's current obligations (or rights) under a swap agreement will generally be equal only to the net present value of amounts to be paid or received under the agreement based on the relative values of the positions held by each party to the agreement (the "net amount"). A Fund's current obligations under a swap agreement will be accrued daily (offset against amounts owed to the Fund). Any net amount accrued but not yet paid to a Fund by the counterparty under a swap agreement (i.e., the Fund's current rights under the swap agreement) is recorded as unrealized appreciation until the amount is paid to the Fund. The Fund's maximum risk of loss from counterparty credit risk is generally limited to the net payment to be received by the Fund and/or the termination value at the end of the contract.
Whether a Fund's use of swap agreements will be successful in furthering its investment objective will depend on management's ability to correctly predict whether certain types of investments are likely to produce greater returns than other investments. Swap agreements that cannot be terminated or sold within seven days may be considered to be illiquid investments. Moreover, a Fund bears the risk of loss of the amount expected to be received under a swap agreement in the event of the default or bankruptcy of a swap agreement counterparty. Although centrally cleared swaps typically present less counterparty risk than non-centrally cleared swaps, a Fund that has entered into centrally cleared swaps is subject to the risk of the failure of the CCP. A Fund will enter into swap agreements only with counterparties that meet certain standards for creditworthiness (generally, such counterparties would have to be eligible counterparties under the terms of the Fund's repurchase agreement guidelines) or that are centrally cleared. Certain restrictions imposed on the Funds by the Internal Revenue Code of 1986, as amended (the "Code"), may limit a Fund's ability to use swap agreements. It is possible that developments in the swap market, including additional government regulation, could adversely affect a Fund's ability to terminate existing swap agreements or to realize amounts to be received under such agreements.
International Swaps and Derivatives Association, Inc. Master Agreements ("ISDA Master Agreements") govern over-the-counter financial derivative transactions entered into by a Fund and counterparty. The ISDA Master Agreements maintain provisions for general obligations, representations, agreements, collateral and events of default or termination. Events of termination include conditions that may entitle counterparties to elect to terminate early and cause settlement of all outstanding transactions under the applicable ISDA Master Agreement. Any election to terminate early could be material to the financial statements.
Swap agreements held by the Funds at November 30, 2022 are disclosed in the Portfolio of Investments.
www.arbitragefunds.com | 1-800-295-4485
76
The Arbitrage Funds Notes to Financial Statements (continued)
November 30, 2022 (Unaudited)
During the period ended November 30, 2022, the Arbitrage Fund, Event-Driven Fund and Credit Opportunities Fund entered into swap agreements to gain efficient exposure to underlying equities.
Fair Value of Derivative Instruments — Fair values of derivatives presented in the financial statements are not netted with the fair value of other derivatives or with any collateral amounts posted by the Funds or any counterparty on the Statement of Assets and Liabilities. The fair value of derivative instruments for the Funds as of November 30, 2022, was as follows:
|
Derivatives Not Accounted For As Hedging Instruments |
Asset Derivatives Statement of Assets and Liabilities Location |
Fair Value |
Liability Derivatives Statement of Assets and Liabilities Location |
Fair Value |
|||||||||||||||
|
Arbitrage Fund |
|||||||||||||||||||
|
Forward Foreign Currency Exchange Contracts |
Unrealized appreciation on forward foreign currency exchange contracts |
$ |
3,325,803 |
Unrealized depreciation on forward foreign currency exchange contracts |
$ |
9,516,523 |
|||||||||||||
|
Equity Contracts (swap contracts) |
Unrealized appreciation on swap contracts |
21,851 |
Unrealized depreciation on swap contracts |
3,029,326 |
|||||||||||||||
|
Equity Contracts (purchased option contracts) |
Investments: at fair value of unaffiliated investments |
1,132,425 |
— |
||||||||||||||||
|
Equity Contracts (written option contracts) |
— |
Written options, at value |
0 | ||||||||||||||||
|
$ |
4,480,079 |
$ |
12,545,849 |
||||||||||||||||
Semi-Annual Report | November 30, 2022
77
The Arbitrage Funds Notes to Financial Statements (continued)
November 30, 2022 (Unaudited)
|
Derivatives Not Accounted For As Hedging Instruments |
Asset Derivatives Statement of Assets and Liabilities Location |
Fair Value |
Liability Derivatives Statement of Assets and Liabilities Location |
Fair Value |
|||||||||||||||
|
Event-Driven Fund |
|||||||||||||||||||
|
Forward Foreign Currency Exchange Contracts |
Unrealized appreciation on forward foreign currency exchange contracts |
$ |
192,128 |
Unrealized depreciation on forward foreign currency exchange contracts |
$ |
587,838 |
|||||||||||||
|
Equity Contracts (swap contracts) |
Unrealized appreciation on swap contracts |
4,546 |
Unrealized depreciation on swap contracts |
222,001 |
|||||||||||||||
|
Equity Contracts (purchased option contracts) |
Investments: at fair value of unaffiliated investments |
73,380 |
— |
||||||||||||||||
|
Equity Contracts (written option contracts) |
— |
Written options, at value |
0 | ||||||||||||||||
|
$ |
270,054 |
$ |
809,839 |
||||||||||||||||
|
Derivatives Not Accounted For As Hedging Instruments |
Asset Derivatives Statement of Assets and Liabilities Location |
Fair Value |
Liability Derivatives Statement of Assets and Liabilities Location |
Fair Value |
|||||||||||||||
|
Credit Opportunities Fund |
|||||||||||||||||||
|
Forward Foreign Currency Exchange Contracts |
Unrealized appreciation on forward foreign currency exchange contracts |
$ |
7,284 |
Unrealized depreciation on forward foreign currency exchange contracts |
$ |
1,597 |
|||||||||||||
|
Equity Contracts (swap contracts) |
Unrealized appreciation on swap contracts |
— |
Unrealized depreciation on swap contracts |
108,142 |
|||||||||||||||
|
Equity Contracts (purchased option contracts) |
Investments: at fair value of unaffiliated investments |
377,200 |
— |
||||||||||||||||
|
$ |
384,484 |
$ |
109,739 |
||||||||||||||||
www.arbitragefunds.com | 1-800-295-4485
78
The Arbitrage Funds Notes to Financial Statements (continued)
November 30, 2022 (Unaudited)
The effect of derivative instruments on the Funds' Statement of Operations for the period ended November 30, 2022, was as follows:
|
Derivatives Not Accounted For As Hedging Instruments |
Location Of Gains/(Loss) On Derivatives Recognized In Income |
Realized Gain/(Loss) On Derivatives Recognized In Income |
Change in Unrealized Gain/(Loss) On Derivatives Recognized In Income |
||||||||||||
|
Arbitrage Fund |
|||||||||||||||
|
Forward Foreign Currency Exchange Contracts |
Net realized gains (losses) from: Forward currency contracts / Net change in unrealized appreciation (depreciation) on: Forward currency contracts |
$ |
15,510,335 |
$ |
(9,568,248 |
) |
|||||||||
|
Swap Contracts |
Net realized gains (losses) from: Swap contracts / Net change in unrealized appreciation (depreciation) on: Swap contracts |
5,146,920 |
(3,007,623 |
) |
|||||||||||
|
Equity Contracts (purchased option contracts) |
Net realized gains (losses) from: Purchased option contracts / Net change in unrealized appreciation (depreciation) on: Purchased option contracts |
(694,059 |
) |
(1,577,694 |
) |
||||||||||
|
Equity Contracts (written option contracts) |
Net realized gains (losses) from: Written option contracts / Net change in unrealized appreciation (depreciation) on: Written option contracts |
(515,012 |
) |
(10,015 |
) |
||||||||||
|
$ |
19,448,184 |
$ |
(14,163,580 |
) |
|||||||||||
Semi-Annual Report | November 30, 2022
79
The Arbitrage Funds Notes to Financial Statements (continued)
November 30, 2022 (Unaudited)
|
Derivatives Not Accounted For As Hedging Instruments |
Location Of Gains/(Loss) On Derivatives Recognized In Income |
Realized Gain/(Loss) On Derivatives Recognized In Income |
Change in Unrealized Gain/(Loss) On Derivatives Recognized In Income |
||||||||||||
|
Event-Driven Fund |
|||||||||||||||
|
Forward Foreign Currency Exchange Contracts |
Net realized gains (losses) from: Forward currency contracts / Net change in unrealized appreciation (depreciation) on: Forward currency contracts |
$ |
783,590 |
$ |
(543,358 |
) |
|||||||||
|
Swap Contracts |
Net realized gains (losses) from: Swap contracts / Net change in unrealized appreciation (depreciation) on: Swap contracts |
403,680 |
(217,455 |
) |
|||||||||||
|
Equity Contracts (purchased option contracts) |
Net realized gains (losses) from: Purchased option contracts / Net change in unrealized appreciation (depreciation) on: Purchased option contracts |
(81,346 |
) |
(126,350 |
) |
||||||||||
|
Equity Contracts (written option contracts) |
Net realized gains (losses) from: Written option contracts / Net change in unrealized appreciation (depreciation) on: Written option contracts |
(40,997 |
) |
(848 |
) |
||||||||||
|
$ |
1,064,927 |
$ |
(888,011 |
) |
|||||||||||
www.arbitragefunds.com | 1-800-295-4485
80
The Arbitrage Funds Notes to Financial Statements (continued)
November 30, 2022 (Unaudited)
|
Derivatives Not Accounted For As Hedging Instruments |
Location Of Gains/(Loss) On Derivatives Recognized In Income |
Realized Gain/(Loss) On Derivatives Recognized In Income |
Change in Unrealized Gain/(Loss) On Derivatives Recognized In Income |
||||||||||||
|
Credit Opportunities Fund |
|||||||||||||||
|
Forward Foreign Currency Exchange Contracts |
Net realized gains (losses) from: Forward currency contracts / Net change in unrealized appreciation (depreciation) on: Forward currency contracts |
$ |
(10,848 |
) |
$ |
7,760 |
|||||||||
|
Swap Contracts |
Net realized gains (losses) from: Swap contracts / Net change in unrealized appreciation (depreciation) on: Swap contracts |
230,140 |
(108,142 |
) |
|||||||||||
|
Equity Contracts (purchased option contracts) |
Net realized gains (losses) from: Purchased option contracts / Net change in unrealized appreciation (depreciation) on: Purchased option contracts |
360,243 |
8,408 |
||||||||||||
|
Equity Contracts (written option contracts) |
Net realized gains (losses) from: Written option contracts / Net change in unrealized appreciation (depreciation) on: Written option contracts |
30,483 |
240 |
||||||||||||
|
$ |
610,018 |
$ |
(91,734 |
) |
|||||||||||
Volume of derivative instruments held by the Funds during the period ended November 30, 2022, was as follows:
|
Derivative Type |
Unit of Measurement |
Monthly Average |
|||||||||
|
Arbitrage Fund |
|||||||||||
|
Swap Contracts |
Notional Quantity |
$ |
29,605,494 |
||||||||
|
Forward Foreign Currency Exchange Contracts |
Net Contracts to Deliver/(Receive) |
(161,376,436 |
) |
||||||||
|
Purchased Option Contracts |
Contracts |
15,037 |
|||||||||
|
Written Option Contracts |
Contracts |
(1,487 |
) |
||||||||
|
Derivative Type |
Unit of Measurement |
Monthly Average |
|||||||||
|
Event-Driven Fund |
|||||||||||
|
Swap Contracts |
Notional Quantity |
$ |
1,783,385 |
||||||||
|
Forward Foreign Currency Exchange Contracts |
Net Contracts to Deliver/(Receive) |
(9,876,508 |
) |
||||||||
|
Purchased Option Contracts |
Contracts |
1,007 |
|||||||||
|
Written Option Contracts |
Contracts |
(216 |
) |
||||||||
Semi-Annual Report | November 30, 2022
81
The Arbitrage Funds Notes to Financial Statements (continued)
November 30, 2022 (Unaudited)
|
Derivative Type |
Unit of Measurement |
Monthly Average |
|||||||||
|
Credit Opportunities Fund |
|||||||||||
|
Swap Contracts |
Notional Quantity |
$ |
7,173,290 |
||||||||
|
Forward Foreign Currency Exchange Contracts |
Net Contracts to Deliver/(Receive) |
(134,709 |
) |
||||||||
|
Purchased Option Contracts |
Contracts |
2,609 |
|||||||||
|
Written Option Contracts |
Contracts |
(24 |
) |
||||||||
Certain derivative contracts are executed under either standardized netting agreements or, for exchange-traded derivatives, the relevant contracts for a particular exchange which contain enforceable netting provisions. A derivative netting arrangement creates an enforceable right of set-off that becomes effective, and affects the realization of settlement on individual assets, liabilities and collateral amounts, only following a specified event of default or early termination. Default events may include the failure to make payments or deliver securities timely, material adverse changes in financial condition or insolvency, the breach of minimum regulatory capital requirements, or loss of license, charter or other legal authorization necessary to perform under the contract.
The Funds held financial instruments such as equity swaps that are subject to enforceable netting arrangements or other similar agreements as of November 30, 2022. All other derivative contracts held by the Funds were not subject to netting agreements.
The following tables present financial instruments held by the Funds that are subject to enforceable netting arrangements or other similar agreements as of November 30, 2022:
Arbitrage Fund
|
Gross |
Gross Amounts Offset in |
Net Amounts Presented in |
Gross Amounts Not Offset in the Statement of Assets and Liabilities |
||||||||||||||||||||||||
|
Description |
Amounts of Recognized Assets |
the Statements of Assets and Liabilities |
the Statement of Assets and Liabilities |
Financial Instruments |
Cash Collateral Received |
Net Amount |
|||||||||||||||||||||
|
Equity Swaps |
$ |
21,851 |
$ |
(21,851 |
) |
$ |
— |
$ |
— |
$ |
— |
$ |
— |
||||||||||||||
|
Total |
$ |
21,851 |
$ |
(21,851 |
) |
$ |
— |
$ |
— |
$ |
— |
$ |
— |
||||||||||||||
|
Gross |
Gross Amounts Offset in |
Net Amounts Presented in |
Gross Amounts Not Offset in the Statement of Assets and Liabilities |
||||||||||||||||||||||||
|
Description |
Amounts of Recognized Liabilities |
the Statements of Assets and Liabilities |
the Statement of Assets and Liabilities |
Financial Instruments |
Cash Collateral Pledged |
Net Amount |
|||||||||||||||||||||
|
Equity Swaps |
$ |
3,029,326 |
$ |
(21,851 |
) |
$ |
3,007,475 |
$ |
— |
$ |
— |
$ |
3,007,475 |
||||||||||||||
|
Total |
$ |
3,029,326 |
$ |
(21,851 |
) |
$ |
3,007,475 |
$ |
— |
$ |
— |
$ |
3,007,475 |
||||||||||||||
Event-Driven Fund
|
Gross |
Gross Amounts Offset in |
Net Amounts Presented in |
Gross Amounts Not Offset in the Statement of Assets and Liabilities |
||||||||||||||||||||||||
|
Description |
Amounts of Recognized Assets |
the Statements of Assets and Liabilities |
the Statement of Assets and Liabilities |
Financial Instruments |
Cash Collateral Received |
Net Amount |
|||||||||||||||||||||
|
Equity Swaps |
$ |
4,546 |
$ |
(4,546 |
) |
$ |
— |
$ |
— |
$ |
— |
$ |
— |
||||||||||||||
|
Total |
$ |
4,546 |
$ |
(4,546 |
) |
$ |
— |
$ |
— |
$ |
— |
$ |
— |
||||||||||||||
www.arbitragefunds.com | 1-800-295-4485
82
The Arbitrage Funds Notes to Financial Statements (continued)
November 30, 2022 (Unaudited)
|
Gross |
Gross Amounts Offset in |
Net Amounts Presented in |
Gross Amounts Not Offset in the Statement of Assets and Liabilities |
||||||||||||||||||||||||
|
Description |
Amounts of Recognized Liabilities |
the Statements of Assets and Liabilities |
the Statement of Assets and Liabilities |
Financial Instruments |
Cash Collateral Pledged |
Net Amount |
|||||||||||||||||||||
|
Equity Swaps |
$ |
222,001 |
$ |
(4,546 |
) |
$ |
217,455 |
$ |
— |
$ |
— |
$ |
217,455 |
||||||||||||||
|
Total |
$ |
222,001 |
$ |
(4,546 |
) |
$ |
217,455 |
$ |
— |
$ |
— |
$ |
217,455 |
||||||||||||||
Credit Opportunities Fund
|
Gross |
Gross Amounts Offset in |
Net Amounts Presented in |
Gross Amounts Not Offset in the Statement of Assets and Liabilities |
||||||||||||||||||||||||
|
Description |
Amounts of Recognized Liabilities |
the Statements of Assets and Liabilities |
the Statement of Assets and Liabilities |
Financial Instruments |
Cash Collateral Pledged |
Net Amount |
|||||||||||||||||||||
|
Equity Swaps |
$ |
108,142 |
$ |
— |
$ |
108,142 |
$ |
— |
$ |
— |
$ |
108,142 |
|||||||||||||||
|
Total |
$ |
108,142 |
$ |
— |
$ |
108,142 |
$ |
— |
$ |
— |
$ |
108,142 |
|||||||||||||||
Investment Income — Interest income, adjusted for amortization of premium and accretion of discount, is recorded on the accrual basis. Dividend income is recorded on the ex-dividend date, net of any non-reclaimable tax withholdings. Payment-in-kind securities have the option at each interest payment date of making interest payments in cash or additional debt securities. Any interest accrued on payment-in-kind securities is recorded as interest income on an accrual basis. Distributions from real estate investment trusts ("REITs") may be characterized as ordinary income, net capital gain, or a return of capital to the Funds. The proper characterization of REIT distributions is generally not known until after the end of each calendar year. As such, estimates are used in reporting the character of income and distributions for financial statement purposes when information is not available.
Dividends and Distributions to Shareholders — Dividends arising from net investment income and net capital gain distributions, if any, are declared and paid at least annually to shareholders of the Arbitrage Fund and Event-Driven Fund. Dividends arising from net investment income, if any, are declared daily and paid monthly, and net capital gain distributions, if any, are declared and paid at least annually to shareholders of the Credit Opportunities Fund.
Cash — The Funds may invest a portion of their assets in cash or cash items. These cash items and other high-quality debt securities may include money market instruments, such as securities issued by the U.S. Government and its agencies, bankers' acceptances, commercial paper, bank certificates of deposit and investment companies that invest primarily in such instruments. As of November 30, 2022, cash held by the Funds represented cash held at a third-party custodian.
Allocation Between Classes — Investment income earned, realized capital gains and losses, and unrealized appreciation and depreciation are allocated daily to each class of shares based upon the proportionate shares of total net assets of each Fund. Class-specific expenses are charged directly to the class incurring the expense. Common expenses which are not attributable to a specific class are allocated daily to each class of shares based upon the proportionate share of total net assets of each Fund.
Federal Income Tax — It is the Funds' policy to continue to comply with the special provisions of Subchapter M of the Code, as amended, applicable to regulated investment companies. As
Semi-Annual Report | November 30, 2022
83
The Arbitrage Funds Notes to Financial Statements (continued)
November 30, 2022 (Unaudited)
provided therein, in any fiscal year in which a fund so qualifies and distributes at least 90% of its taxable net income, a fund (but not the shareholders) will be relieved of Federal income tax on the income distributed. Accordingly, no provision for income taxes has been made.
As of and during the six months ended November 30, 2022, the Funds did not have a liability for any unrecognized tax benefits. The Funds recognize interest and, if applicable, penalties for any uncertain tax positions. Interest and penalty expense will be recorded as a component of interest or other tax expense. No interest or penalties were recorded during the six months ended November 30, 2022. The Funds file U.S. federal, state, and local tax returns as required. The Funds' tax returns are subject to examination by the relevant tax authorities until expiration of the applicable statute of limitations which is generally three years after the filing of the tax return. Tax returns for open years have incorporated no uncertain tax positions that require a provision for income taxes.
3. INVESTMENT TRANSACTIONS
During the six months ended November 30, 2022, cost of purchases and proceeds from sales and maturities of investment securities, excluding short-term investments, U.S. government securities, equity swap contracts, purchased and written option contracts and securities sold short, were as follows:
|
Arbitrage Fund |
Event-Driven Fund |
Credit Opportunities Fund |
|||||||||||||
|
Purchases |
$ |
1,203,600,468 |
$ |
94,109,990 |
$ |
53,511,319 |
|||||||||
|
Sales and Maturities |
1,516,211,499 |
118,374,681 |
90,602,214 |
||||||||||||
4. LINE OF CREDIT
The Trust, on behalf of the Funds, entered into an agreement which enables the Funds to participate in a $100,000,000 unsecured uncommitted revolving line of credit (the "Uncommitted Line") with State Street Bank and Trust Company (the "Custodian"). Borrowings under the Uncommitted Line are made solely to temporarily finance the purchase or sale of securities or to finance the redemption of the shares of an investor of the Funds. The Uncommitted Line has an upfront fee of $30,000, is held available on a discretionary demand basis and may be terminated by the Custodian or the Trust at any time for any or no reason. Such fees are included in the custodian bank and service fees on the Statements of Operations. Interest on the Uncommitted Line is charged to the Funds based on their borrowing at a rate equal to the higher of (a) the federal funds rate plus 1.35% and (b) the overnight bank funding rate plus 1.35%. For purposes of calculating the effective interest rate, if the federal funds rate or the overnight bank funding rate shall be less than zero, then such rate shall be deemed to be zero.
For the six months ended November 30, 2022, the Event-Driven Fund and the Credit Opportunities Fund had average borrowings of $1,982,143 and $4,455,556, respectively, over a period of 28 days and 45 days, respectively, at a weighted average interest rate of 3.49% and 3.88%, respectively. Interest expense on the line of credit for the Event-Driven Fund and the Credit Opportunities Fund during the six months ended November 30, 2022 is shown as line of credit interest expense on the Statements of Operations. The Funds had no outstanding borrowings at November 30, 2022.
www.arbitragefunds.com | 1-800-295-4485
84
The Arbitrage Funds Notes to Financial Statements (continued)
November 30, 2022 (Unaudited)
5. ADVISORY FEES, ADMINISTRATION FEES AND OTHER AGREEMENTS
Investment Advisory Agreement
The Funds' investments are managed by the Adviser according to the terms of Investment Advisory Agreements. Under each of the Investment Advisory Agreements, fees are computed and accrued daily and paid monthly. Under the Investment Advisory Agreement between the Adviser and the Arbitrage Fund, as amended and restated on October 1, 2007, the Arbitrage Fund pays the Adviser an annual fee, of 1.25% on the first $250 million, 1.20% on the next $50 million, 1.15% on the next $50 million, 1.10% on the next $75 million, 1.05% on the next $75 million, and 1.00% on its average daily net assets in excess of $500 million. Effective November 1, 2019, the Event-Driven Fund pays the Adviser an annual fee of 1.10% based on the Event-Driven Fund's average daily net assets. Effective August 6, 2018, the Credit Opportunities Fund pays the Adviser an annual fee of 0.95% on the first $250 million, 0.90% on the next $500 million, and 0.85% on its average daily net assets in excess of $750 million.
Under an Amended and Restated Expense Waiver and Reimbursement Agreement for each of Arbitrage Fund, Event-Driven Fund and Credit Opportunities Fund, the Adviser has contractually agreed to waive its advisory fee and/or reimburse the Funds' other expenses to the extent that total operating expenses (exclusive of taxes, interest, dividends on short positions, brokerage commissions, acquired fund fees and expenses and other costs incurred in connection with the purchase or sale of portfolio securities) exceed the annual rate of the Funds' average daily net assets attributable to each share class as shown in the table below. The agreement remains in effect until September 30, 2023, unless terminated earlier by the Board.
|
Arbitrage Fund |
Event-Driven Fund |
Credit Opportunities Fund |
|||||||||||||
|
Class R |
1.69 |
% |
1.69 |
% |
1.23 |
% |
|||||||||
|
Class I |
1.44 |
% |
1.44 |
% |
0.98 |
% |
|||||||||
|
Class C |
2.44 |
% |
N/A |
N/A |
|||||||||||
|
Class A |
1.69 |
% |
1.69 |
% |
1.23 |
% |
|||||||||
The Adviser agreed not to charge the Arbitrage Fund an advisory fee on the portion of its assets invested in the Event-Driven Fund. This resulted in $453,359 of advisory fees being waived during the six months ended November 30, 2022.
For the six months ended November 30, 2022, the aggregate net fee paid to the Adviser as a percentage of average net assets for the Arbitrage Fund, Event-Driven Fund and Credit Opportunities Fund was 1.00%, 1.11% and 0.64%, respectively.
The Adviser can recapture, with the exception of the advisory fees waived related to Arbitrage Fund's investment in the Event-Driven Fund, any waived amount from a Fund pursuant to the Amended and Restated Expense Waiver and Reimbursement Agreements if such recapture does not cause the Fund to exceed the expense limitations in effect at the time the amounts were waived, the recapture does not cause the Fund to exceed the current expense limitation, and the recapture is done within three years after the date on which the expense was waived. During the six months ended November 30, 2022, the Adviser recaptured the following fees or expenses from the Event-Driven Fund. There were no amounts recaptured during the period ended November 30, 2022 for Credit Opportunities Fund.
|
Event-Driven Fund |
Recaptured Amount |
||||||
|
Class R |
$ |
152 |
|||||
|
Class I |
3,824 |
||||||
|
Class A |
81 |
||||||
Semi-Annual Report | November 30, 2022
85
The Arbitrage Funds Notes to Financial Statements (continued)
November 30, 2022 (Unaudited)
As of November 30, 2022, the balances of waived expenses that are eligible for potential recapture for each Fund are as follows:
|
Expiring May 31, 2023 |
Expiring May 31, 2024 |
Expiring May 31, 2025 |
Total |
||||||||||||||||
|
Event-Driven Fund |
|||||||||||||||||||
|
Class R |
$ |
72,562 |
$ |
7,526 |
$ |
— |
$ |
80,088 |
|||||||||||
|
Class I |
275,400 |
94,924 |
— |
370,324 |
|||||||||||||||
|
Class A |
2,031 |
706 |
— |
2,737 |
|||||||||||||||
|
Credit Opportunities Fund |
|||||||||||||||||||
|
Class R |
$ |
46,492 |
$ |
14,935 |
$ |
27,491 |
$ |
88,918 |
|||||||||||
|
Class I |
305,422 |
327,225 |
360,709 |
993,356 |
|||||||||||||||
|
Class A |
1,504 |
386 |
309 |
2,199 |
|||||||||||||||
Administration Agreement
State Street Bank & Trust Company serves as the Trust's administrator pursuant to an Administration Agreement with the Trust.
Distribution Agreement
ALPS Distributors, Inc. (the "Distributor") serves as the Funds' distributor. The Distributor acts as an agent for the Funds and the distributor of their shares. The Funds have adopted, with respect to their Class R, Class C shares and Class A shares, as applicable, a plan of distribution pursuant to Rule 12b-1 under the 1940 Act which permits each Fund to pay for expenses incurred in the distribution and promotion of the Funds' Class R shares, Class C shares and Class A shares and for services provided to shareholders. The Plan is a "reimbursement" plan. This means that a Fund's Class R shares, Class C shares and Class A shares only pay the 12b-1 fee to the extent that the Adviser, the Distributor or others have incurred expenses in the promotion and distribution of the shares, including but not limited to, the printing of prospectuses and reports used for sales purposes, expenses of preparation of sales literature and related expenses, advertisements, and other distribution-related expenses, as well as any distribution fees paid to securities dealers or others. Under the distribution plan, a Fund may pay compensation to any broker-dealer with whom the Distributor or the Funds has entered into a contract to distribute Class R shares, Class C shares or Class A shares, or to any other qualified financial services firm, for distribution and/or shareholder-related services with respect to shares held or purchased by their respective customers or in connection with the purchase of shares attributable to their efforts. The amount of payments under the Plan in any year shall not exceed 0.25% for Class R shares, 0.75% for Class C shares and 0.25% for Class A shares, respectively, of the average daily net assets allocable to a Fund's Class R shares, Class C shares and Class A shares, respectively. In addition, the Plan permits each Fund to make payments at an annual rate of up to 0.25% of the Fund's Class C shares for expenses incurred in connection with the provision of shareholder support or administrative services for the Fund's Class C shares.
During the six months ended November 30, 2022, the Arbitrage Fund's Class R shares and Class A shares incurred $84,266 and $52,851 in distribution expenses, respectively, and Class C shares incurred $61,059 in distribution and shareholder support expenses, all of which were used to compensate broker-dealers. During the six months ended November 30, 2022, the Event-Driven Fund's Class R shares and Class A shares incurred $5,560 and $2,766 in distribution expenses, respectively, all of which were used to compensate broker-dealers. During the six months ended November 30, 2022, the Credit Opportunities Fund's Class R shares and Class A shares incurred $11,062 and $109 in distribution expenses, respectively, all of which were used to compensate broker-dealers.
www.arbitragefunds.com | 1-800-295-4485
86
The Arbitrage Funds Notes to Financial Statements (continued)
November 30, 2022 (Unaudited)
Chief Compliance Officer
The Chief Compliance Officer ("CCO") of the Trust also serves as the CCO of the Adviser. The Trust pays a portion of the CCO's compensation as approved by the Board of Trustees. Information related to the CCO Fees can be found in the Funds' Statements of Operations.
Chief Financial Officer
Foreside Management Services, LLC provides Chief Financial Officer ("CFO") services to the Trust. Foreside Management Services, LLC is compensated by the Trust under a Fund CFO/Treasurer Agreement.
Transfer Agent and Shareholder Services Agreement
DST Systems, Inc. ("DST") is the Funds' transfer agent, and per an agency agreement, maintains the records of each shareholder's account, answers shareholders' inquiries concerning their accounts, processes purchases and redemptions of the Funds shares, acts as dividend and distribution disbursing agent and performs other shareholder service functions.
6. RELATED PARTIES
The Adviser is a related party of the Funds and certain officers of the Trust are also officers of the Adviser. Fees payable to related parties are disclosed in Note 5 and accrued amounts are disclosed in the Statements of Operations.
7. AFFILIATED ISSUER TRANSACTIONS
A summary of affiliated transactions for the Arbitrage Fund for the six months ended November 30, 2022 follows:
|
Affiliated Issuer |
Beginning Value as of May 31, 2022 |
Purchases at Cost |
Proceeds from Sales |
Net Realized Gain/ (Loss) on Sales |
Change in Unrealized Appreciation/ Depreciation |
Ending Value as of November 30, 2022 |
Shares as of November 30, 2022 |
Dividend Income |
Capital Gain Distributions |
||||||||||||||||||||||||||||||
|
Water Island Event- Driven Fund |
$ |
72,394,803 |
$ |
— |
$ |
— |
$ |
— |
$ |
528,429 |
$ |
72,923,232 |
6,605,365 |
$ |
— |
$ |
— |
||||||||||||||||||||||
At November 30, 2022, Arbitrage Fund, an affiliated fund, owned 64.80% of Event-Driven Fund's shares.
8. CAPITAL SHARE TRANSACTIONS
Proceeds and payments on capital shares as shown in the Statement of Changes in Net Assets are the result of the following capital share transactions for the periods shown:
|
Six Months Ended November 30, 2022 (Unaudited) |
Year Ended May 31, 2022 |
||||||||||||||||||
|
Arbitrage Fund - Class R |
Shares |
Value |
Shares |
Value |
|||||||||||||||
|
Proceeds from shares sold |
527,381 |
$ |
6,627,935 |
1,682,625 |
$ |
21,585,919 |
|||||||||||||
|
Shares issued in reinvestment of distributions |
— |
— |
39,313 |
499,276 |
|||||||||||||||
|
Payments for shares redeemed |
(1,984,432 |
) |
(24,876,205 |
) |
(2,985,174 |
) |
(37,993,767 |
) |
|||||||||||
|
Net decrease |
(1,457,051 |
) |
$ |
(18,248,270 |
) |
(1,263,236 |
) |
$ |
(15,908,572 |
) |
|||||||||
Semi-Annual Report | November 30, 2022
87
The Arbitrage Funds Notes to Financial Statements (continued)
November 30, 2022 (Unaudited)
|
Six Months Ended November 30, 2022 (Unaudited) |
Year Ended May 31, 2022 |
||||||||||||||||||
|
Arbitrage Fund - Class I |
Shares |
Value |
Shares |
Value |
|||||||||||||||
|
Proceeds from shares sold |
10,723,959 |
$ |
140,052,925 |
33,994,762 |
$ |
451,556,693 |
|||||||||||||
|
Shares issued in reinvestment of distributions |
— |
— |
462,945 |
6,110,874 |
|||||||||||||||
|
Payments for shares redeemed |
(20,860,561 |
) |
(272,555,683 |
) |
(29,221,299 |
) |
(386,744,281 |
) |
|||||||||||
|
Net increase/(decrease) |
(10,136,602 |
) |
$ |
(132,502,758 |
) |
5,236,408 |
$ |
70,923,286 |
|||||||||||
|
Arbitrage Fund - Class C |
|||||||||||||||||||
|
Proceeds from shares sold |
8,260 |
$ |
95,816 |
224,527 |
$ |
2,685,087 |
|||||||||||||
|
Shares issued in reinvestment of distributions |
— |
— |
6,547 |
77,389 |
|||||||||||||||
|
Payments for shares redeemed |
(242,768 |
) |
(2,822,688 |
) |
(546,088 |
) |
(6,468,684 |
) |
|||||||||||
|
Net decrease |
(234,508 |
) |
$ |
(2,726,872 |
) |
(315,014 |
) |
$ |
(3,706,208 |
) |
|||||||||
|
Arbitrage Fund - Class A |
|||||||||||||||||||
|
Proceeds from shares sold |
370,107 |
$ |
4,596,572 |
1,416,227 |
$ |
18,133,435 |
|||||||||||||
|
Shares issued in reinvestment of distributions |
— |
— |
9,966 |
126,265 |
|||||||||||||||
|
Payments for shares redeemed |
(585,202 |
) |
(7,307,780 |
) |
(561,906 |
) |
(7,150,839 |
) |
|||||||||||
|
Net increase/(decrease) |
(215,095 |
) |
$ |
(2,711,208 |
) |
864,287 |
$ |
11,108,861 |
|||||||||||
|
Event-Driven Fund - Class R |
|||||||||||||||||||
|
Proceeds from shares sold |
12,884 |
$ |
139,507 |
72,562 |
$ |
802,465 |
|||||||||||||
|
Payments for shares redeemed |
(20,979 |
) |
(225,910 |
) |
(546,503 |
) |
(5,986,060 |
) |
|||||||||||
|
Net decrease |
(8,095 |
) |
$ |
(86,403 |
) |
(473,941 |
) |
$ |
(5,183,595 |
) |
|||||||||
|
Event-Driven Fund - Class I |
|||||||||||||||||||
|
Proceeds from shares sold |
255,925 |
$ |
2,796,660 |
1,162,749 |
$ |
13,034,737 |
|||||||||||||
|
Payments for shares redeemed |
(439,222 |
) |
(4,809,425 |
) |
(2,297,771 |
) |
(25,475,126 |
) |
|||||||||||
|
Net decrease |
(183,297 |
) |
$ |
(2,012,765 |
) |
(1,135,022 |
) |
$ |
(12,440,389 |
) |
|||||||||
|
Event-Driven Fund - Class A |
|||||||||||||||||||
|
Proceeds from shares sold |
9,719 |
$ |
105,657 |
264,682 |
$ |
2,879,635 |
|||||||||||||
|
Payments for shares redeemed |
(24,308 |
) |
(262,237 |
) |
(173,800 |
) |
(1,867,351 |
) |
|||||||||||
|
Net increase/(decrease) |
(14,589 |
) |
$ |
(156,580 |
) |
90,882 |
$ |
1,012,284 |
|||||||||||
|
Credit Opportunities Fund - Class R |
|||||||||||||||||||
|
Proceeds from shares sold |
71,731 |
$ |
688,324 |
389,395 |
$ |
3,924,678 |
|||||||||||||
|
Shares issued in reinvestment of distributions |
16,713 |
160,180 |
23,145 |
232,547 |
|||||||||||||||
|
Payments for shares redeemed |
(127,362 |
) |
(1,222,379 |
) |
(223,471 |
) |
(2,237,808 |
) |
|||||||||||
|
Net increase/(decrease) |
(38,918 |
) |
$ |
(373,875 |
) |
189,069 |
$ |
1,919,417 |
|||||||||||
www.arbitragefunds.com | 1-800-295-4485
88
The Arbitrage Funds Notes to Financial Statements (continued)
November 30, 2022 (Unaudited)
|
Six Months Ended November 30, 2022 (Unaudited) |
Year Ended May 31, 2022 |
||||||||||||||||||
|
Credit Opportunities Fund - Class I |
Shares |
Value |
Shares |
Value |
|||||||||||||||
|
Proceeds from shares sold |
738,735 |
$ |
7,049,183 |
5,052,483 |
$ |
50,828,009 |
|||||||||||||
|
Shares issued in reinvestment of distributions |
154,480 |
1,473,471 |
288,204 |
2,885,616 |
|||||||||||||||
|
Payments for shares redeemed |
(2,257,222 |
) |
(21,478,044 |
) |
(2,127,208 |
) |
(21,106,410 |
) |
|||||||||||
|
Net increase/(decrease) |
(1,364,007 |
) |
$ |
(12,955,390 |
) |
3,213,479 |
$ |
32,607,215 |
|||||||||||
|
Credit Opportunities Fund - Class A |
|||||||||||||||||||
|
Proceeds from shares sold |
— |
$ |
— |
957 |
$ |
9,675 |
|||||||||||||
|
Shares issued in reinvestment of distributions |
162 |
1,541 |
262 |
2,624 |
|||||||||||||||
|
Payments for shares redeemed |
(4,162 |
) |
(39,889 |
) |
— |
— |
|||||||||||||
|
Net increase/(decrease) |
(4,000 |
) |
$ |
(38,348 |
) |
1,219 |
$ |
12,299 |
|||||||||||
9. FOREIGN CURRENCY TRANSLATION
Amounts denominated in or expected to settle in foreign currencies are translated to U.S. dollars based on exchange rates on the basis outlined below:
A. The market values of investment securities and other assets and liabilities are translated at the closing rate of exchange each day.
B. Purchases and sales of investment securities and income and expenses are translated at the rate of exchange prevailing on the respective dates of such transactions.
C. The Funds do not isolate that portion of the results of operations caused by changes in foreign exchange rates on investments from those caused by changes in market prices of securities held. Such fluctuations are included with the net realized and unrealized gains or losses on investments. Reported net realized foreign exchange gains or losses arise from 1) purchases and sales of foreign currencies; 2) currency gains or losses realized between the trade and settlement dates on security transactions; and 3) the difference between the amounts of dividends, interest and foreign withholding taxes recorded on the Funds' books, and the U.S. dollar equivalent of the amounts actually received or paid. Reported net unrealized foreign exchange gains and losses arise from changes in the value of assets and liabilities, other than investment securities, resulting from changes in exchange rates.
10. CONTINGENCIES AND COMMITMENTS
The Funds indemnify the Trust's officers and trustees for certain liabilities that might arise from their performance of their duties to the Funds. Additionally, in the normal course of business, the Funds enter into contracts that contain a variety of representations and warranties and which provide general indemnifications. The Funds' maximum exposure under these arrangements is unknown, as this would involve future claims that may be made against the Funds that have not yet occurred. However, based on experience, the Funds expect the risk of loss to be remote.
Semi-Annual Report | November 30, 2022
89
The Arbitrage Funds Notes to Financial Statements (continued)
November 30, 2022 (Unaudited)
11. SECURITIES LENDING
To generate additional income, the Funds may, from time to time, lend portfolio securities to broker-dealers, banks or institutional borrowers of securities. At the time of the loan, the Funds must receive from the borrower 102% collateral in the form of cash or U.S. government securities. This collateral must be valued daily and, should the market value of the loaned securities increase, the borrower must furnish additional collateral to the Funds. During the time portfolio securities are on loan, the borrower pays the Funds any dividends or interest paid on such securities.
Loans are subject to termination by the Funds or the borrower at any time. While the Funds do not have the right to vote securities on loan, they have the right to terminate the loan and regain the right to vote if that is considered important with respect to the investment. In the event the borrower defaults in its obligation to the Fund, the Funds bear the risk of delay in the recovery of portfolio securities and the risk of loss of rights in the collateral.
The Funds may participate in a securities lending program under which the Funds' custodian, State Street Bank and Trust Company (the "Custodian") acting as securities lending agent, is authorized to lend Fund portfolio securities to qualified brokers/dealers and financial institutions that post appropriate collateral. The value of securities loaned will not exceed one-third of the value of the total assets of the Fund making the loan. The Custodian has agreed to indemnify the Fund in case of default of any security borrower.
Securities on loan are fully collateralized and the collateral was equal to or exceeded the securities on loan. Cash collateral is invested in the State Street Institutional U.S. Government Money Market Fund, Premier Class. The Custodian receives a portion of the interest earned on any reinvested collateral. Income received by the Funds in securities lending transactions during the six months ended November 30, 2022, if any, is net of fees retained by the securities lending agent and is reflected as securities lending income in the Statement of Operations. There were no securities on loan at November 30, 2022.
12. FEDERAL TAX INFORMATION
In order to avoid imposition of the excise tax applicable to regulated investment companies, it is each Fund's intention to declare as dividends in each calendar year at least 98.0% of its net investment income (earned during the calendar year) and 98.2% of its net realized capital gains (earned during the twelve months ended October 31), plus undistributed amounts from prior years.
The amount of distributions from net investment income and net realized gains, if any, are determined in accordance with Federal income tax regulations which may differ from accounting principles generally accepted in the United States of America. These "book/tax" differences are either temporary or permanent in nature and permanent differences are charged or credited to undistributed net investment income (loss), accumulated net realized gain (loss) or paid-in capital as appropriate in the period that the differences arise.
Permanent differences between the Funds' financial statement and income tax reporting requirements are primarily attributable to gains and losses on certain foreign currency related transactions, short sale related dividend expense, investments in passive foreign investment companies, investments in swaps, premium amortization, net operating losses, ordinary loss netting to reduce short-term capital gains, convertible bonds, non-deductible excise tax activity
www.arbitragefunds.com | 1-800-295-4485
90
The Arbitrage Funds Notes to Financial Statements (continued)
November 30, 2022 (Unaudited)
and partnership basis adjustments. These have no effect on the Funds' net assets or net asset value per share.
|
Fund |
Distributable Earnings (Accumulated Loss) |
Paid-in Capital |
|||||||||
|
Arbitrage Fund |
$ |
1,019 |
$ |
(1,019 |
) |
||||||
|
Event-Driven Fund |
3,402,433 |
(3,402,433 |
) |
||||||||
|
Credit Opportunities Fund |
— |
— |
|||||||||
The tax character of dividends and distributions declared and paid during the years ended May 31, 2022 and May 31, 2021 was as follows:
|
Fund |
Year Ended |
Ordinary Income |
Long-Term Capital Gains* |
Total Distributions |
|||||||||||||||
|
Arbitrage Fund |
5/31/2022 |
$ |
— |
$ |
8,434,675 |
$ |
8,434,675 |
||||||||||||
|
5/31/2021 |
85,958,483 |
239 |
85,958,722 |
||||||||||||||||
|
Event-Driven Fund |
5/31/2022 |
$ |
— |
$ |
— |
$ |
— |
||||||||||||
|
5/31/2021 |
252,179 |
— |
252,179 |
||||||||||||||||
|
Credit Opportunities Fund |
5/31/2022 |
$ |
3,596,180 |
$ |
— |
$ |
3,596,180 |
||||||||||||
|
5/31/2021 |
1,949,287 |
— |
1,949,287 |
||||||||||||||||
* The Funds designate these distributions as long-term capital gains dividends per IRC code section 852(b)(3)(C).
As of May 31, 2022, the components of distributable earnings on a tax basis were as follows:
|
Arbitrage Fund |
Event-Driven Fund |
Credit Opportunities Fund |
|||||||||||||
|
Undistributed ordinary income |
$ |
700,765 |
$ |
— |
$ |
442,320 |
|||||||||
|
Accumulated capital gains/losses |
35,442,941 |
— |
— |
||||||||||||
|
Unrealized appreciation/(depreciation) |
(33,073,239 |
) |
(3,019,349 |
) |
(5,214,185 |
) |
|||||||||
|
Capital loss carryover and late year ordinary loss deferrals |
— |
(37,935,362 |
) |
(976,715 |
) |
||||||||||
|
Total distributable earnings (accumulated loss) |
$ |
3,070,467 |
$ |
(40,954,711 |
) |
$ |
(5,748,580 |
) |
|||||||
As of November 30, 2022, the cost and aggregate gross unrealized appreciation/(depreciation) of long security positions, short security positions and derivative instruments for federal income tax purposes were as follows:
|
Fund |
Gross Appreciation (excess of value over tax cost) |
Gross Depreciation (excess of tax cost over value) |
Net Unrealized Appreciation |
Aggregate Cost of Investments for Income Tax Purposes |
|||||||||||||||
|
Arbitrage Fund |
$ |
34,134,055 |
$ |
(104,528,045 |
) |
$ |
(70,393,990 |
) |
$ |
1,411,462,246 |
|||||||||
|
Event-Driven Fund |
1,795,123 |
(9,343,250 |
) |
(7,548,127 |
) |
110,873,285 |
|||||||||||||
|
Credit Opportunities Fund |
1,661,245 |
(8,022,005 |
) |
(6,360,760 |
) |
108,883,249 |
|||||||||||||
Semi-Annual Report | November 30, 2022
91
The Arbitrage Funds Notes to Financial Statements (continued)
November 30, 2022 (Unaudited)
The differences between book-basis and tax-basis net unrealized appreciation/(depreciation) for the Funds are attributable to dividends related to short securities, swap mark to market, wash sales, convertible bonds, straddle loss deferrals, premium amortization, constructive gains and constructive sales adjustments, partnership basis adjustments and forward contracts mark to market.
Capital Losses
As of May 31, 2022, the Event-Driven Fund had $31,626,473 of short term and $5,295,181 of long term capital loss carryforwards and the Credit Opportunities Fund had $976,715 of short term capital loss carryforwards which may reduce the Funds' taxable income arising from future net realized gains on investments, if any, to the extent permitted by the Code and thus may reduce the amount of the distributions to shareholders which would otherwise be necessary to relieve the Funds of any liability for federal tax.
The Event-Driven Fund utilized $2,713,682 of capital loss carryforwards during the year ended May 31, 2022.
Late Year Losses
The Event-Driven Fund elected to defer to the period ending May 31, 2022 losses in the amount of $1,013,708.
13. SUBSEQUENT EVENTS
Management has evaluated subsequent events for the Funds through the date the financial statements were issued, and has concluded that there are no recognized or non-recognized subsequent events relevant for financial statement disclosure.
www.arbitragefunds.com | 1-800-295-4485
92
The Arbitrage Funds Disclosure of Fund Expenses
November 30, 2022 (Unaudited)
As a shareholder of a mutual fund you incur two types of costs: transaction costs, including sales charges (loads) on some share classes, and operating expenses. Your investment is affected by these ongoing costs, which include (among others) costs for portfolio management, administrative services, distribution (12b-1) expenses, redemption fees and shareholder reports like this one. It is important for you to understand the impact of these costs on your investment returns.
Operating expenses such as these are deducted from a mutual fund's gross income and directly reduce its final investment return. These expenses are expressed as a percentage of a mutual fund's average net assets; this percentage is known as a mutual fund's expense ratio.
The following examples use the expense ratio and are intended to help you understand the ongoing costs (in dollars) of investing in your Fund and to compare these costs with those of other mutual funds. The examples are based on an investment of $1,000 made at the beginning of the period shown and held for the entire period.
The table on the following page illustrates your Fund's cost in two ways:
Actual Fund Return. The section helps you to estimate the actual expenses after fee waivers that your Fund incurred over the period. The "Expenses Paid During Period" column shows the actual dollar expense cost incurred by a $1,000 investment in the Fund, and the "Ending Account Value" number is derived from deducting that expense cost from the Fund's gross investment return.
You can use this information, together with the actual amount you invested in the Fund, to estimate the expenses you paid over that period. Simply divide your actual account value by $1,000 to arrive at a ratio (for example, an $8,600 account value divided by $1,000 = 8.6), then multiply that ratio by the number shown for your Fund under "Expenses Paid During Period."
Hypothetical 5% Return. This section helps you compare your Fund's costs with those of other mutual funds. It assumes that the Fund had an annual 5% return before expenses during the period, but that expense ratio (Column 3) for the period is unchanged. This example is useful in making comparisons because the Securities and Exchange Commission requires all mutual funds to make this 5% calculation. You can assess your Fund's comparative cost by comparing the hypothetical result for your Fund in the "Expenses Paid During Period" column with those that appear in the same charts in the shareholder reports for other mutual funds.
Note: Because the return is set at 5% for comparison purposes — NOT your Fund's actual return — the account values shown may not apply to your specific investment.
Semi-Annual Report | November 30, 2022
93
The Arbitrage Funds Disclosure of Fund Expenses (continued)
November 30, 2022 (Unaudited)
|
Beginning Account Value 06/01/2022 |
Ending Account Value 11/30/2022 |
Expense Ratio(a) |
Expenses Paid During Period(b) |
||||||||||||||||
|
Arbitrage Fund |
|||||||||||||||||||
|
Class R |
|||||||||||||||||||
|
Actual |
$ |
1,000.00 |
$ |
1,004.80 |
1.46 |
% |
$ |
7.34 |
|||||||||||
|
Hypothetical (5% return before expenses) |
$ |
1,000.00 |
$ |
1,017.75 |
1.46 |
% |
$ |
7.38 |
|||||||||||
|
Class I |
|||||||||||||||||||
|
Actual |
$ |
1,000.00 |
$ |
1,005.40 |
1.21 |
% |
$ |
6.08 |
|||||||||||
|
Hypothetical (5% return before expenses) |
$ |
1,000.00 |
$ |
1,019.00 |
1.21 |
% |
$ |
6.12 |
|||||||||||
|
Class C |
|||||||||||||||||||
|
Actual |
$ |
1,000.00 |
$ |
1,000.00 |
2.21 |
% |
$ |
11.08 |
|||||||||||
|
Hypothetical (5% return before expenses) |
$ |
1,000.00 |
$ |
1,013.99 |
2.21 |
% |
$ |
11.16 |
|||||||||||
|
Class A |
|||||||||||||||||||
|
Actual |
$ |
1,000.00 |
$ |
1,004.00 |
1.46 |
% |
$ |
7.33 |
|||||||||||
|
Hypothetical (5% return before expenses) |
$ |
1,000.00 |
$ |
1,017.75 |
1.46 |
% |
$ |
7.38 |
|||||||||||
(a) Annualized, based on the Fund's most recent fiscal half-year expenses.
(b) Expenses, are equal to the Fund's annualized ratio multiplied by the average account value over the period, multiplied by the number of days in the most recent fiscal half year (183), divided by 365.
|
Beginning Account Value 06/01/2022 |
Ending Account Value 11/30/2022 |
Expense Ratio(a) |
Expenses Paid During Period(b) |
||||||||||||||||
|
Water Island Event-Driven Fund |
|||||||||||||||||||
|
Class R |
|||||||||||||||||||
|
Actual |
$ |
1,000.00 |
$ |
1,006.50 |
1.71 |
% |
$ |
8.60 |
|||||||||||
|
Hypothetical (5% return before expenses) |
$ |
1,000.00 |
$ |
1,016.50 |
1.71 |
% |
$ |
8.64 |
|||||||||||
|
Class I |
|||||||||||||||||||
|
Actual |
$ |
1,000.00 |
$ |
1,007.30 |
1.46 |
% |
$ |
7.35 |
|||||||||||
|
Hypothetical (5% return before expenses) |
$ |
1,000.00 |
$ |
1,017.75 |
1.46 |
% |
$ |
7.38 |
|||||||||||
|
Class A |
|||||||||||||||||||
|
Actual |
$ |
1,000.00 |
$ |
1,004.60 |
1.71 |
% |
$ |
8.59 |
|||||||||||
|
Hypothetical (5% return before expenses) |
$ |
1,000.00 |
$ |
1,016.50 |
1.71 |
% |
$ |
8.64 |
|||||||||||
(a) Annualized, based on the Fund's most recent fiscal half-year expenses.
(b) Expenses, are equal to the Fund's annualized ratio multiplied by the average account value over the period, multiplied by the number of days in the most recent fiscal half year (183), divided by 365.
www.arbitragefunds.com | 1-800-295-4485
94
The Arbitrage Funds Disclosure of Fund Expenses (continued)
November 30, 2022 (Unaudited)
|
Beginning Account Value 06/01/2022 |
Ending Account Value 11/30/2022 |
Expense Ratio(a) |
Expenses Paid During Period(b) |
||||||||||||||||
|
Water Island Credit Opportunities Fund |
|||||||||||||||||||
|
Class R |
|||||||||||||||||||
|
Actual |
$ |
1,000.00 |
$ |
1,008.90 |
1.29 |
% |
$ |
6.50 |
|||||||||||
|
Hypothetical (5% return before expenses) |
$ |
1,000.00 |
$ |
1,018.60 |
1.29 |
% |
$ |
6.53 |
|||||||||||
|
Class I |
|||||||||||||||||||
|
Actual |
$ |
1,000.00 |
$ |
1,009.10 |
1.04 |
% |
$ |
5.24 |
|||||||||||
|
Hypothetical (5% return before expenses) |
$ |
1,000.00 |
$ |
1,019.85 |
1.04 |
% |
$ |
5.27 |
|||||||||||
|
Class A |
|||||||||||||||||||
|
Actual |
$ |
1,000.00 |
$ |
1,008.90 |
1.29 |
% |
$ |
6.50 |
|||||||||||
|
Hypothetical (5% return before expenses) |
$ |
1,000.00 |
$ |
1,018.60 |
1.29 |
% |
$ |
6.53 |
|||||||||||
(a) Annualized, based on the Fund's most recent fiscal half-year expenses.
(b) Expenses, are equal to the Fund's annualized ratio multiplied by the average account value over the period, multiplied by the number of days in the most recent fiscal half year (183), divided by 365.
Semi-Annual Report | November 30, 2022
95
The Arbitrage Funds Additional Information
November 30, 2022 (Unaudited)
1. PROXY VOTING POLICIES AND VOTING RECORD
A description of the policies and procedures that the Funds use to determine how to vote proxies relating to portfolio securities is available without charge, upon request, by calling 1-800-295-4485 or on the Securities and Exchange Commission's ("SEC") website at http://www.sec.gov.
Information regarding how the Funds voted proxies relating to portfolio securities during the most recent 12-month period ended June 30 is available without charge upon request by calling 1-800-295-4485 or on the SEC 's website at http://www.sec.gov.
2. QUARTERLY PORTFOLIO HOLDINGS
The Funds file a complete listing of their portfolio holdings with the SEC as of the first and third quarters of each fiscal year on Form N-PORT. The filings are available on the Funds' website at www.arbitragefunds.com/resources or upon request by calling 1-800-295-4485. Furthermore, you may obtain a copy of the filing on the SEC's website at http://www.sec.gov.
www.arbitragefunds.com | 1-800-295-4485
96

Arbitrage Fund
Water Island Event-Driven Fund
Water Island Credit Opportunities Fund
800-295-4485
www.arbitragefunds.com
Adviser
Water Island Capital, LLC
41 Madison Avenue, 42nd Floor
New York, NY 10010
Distributor
ALPS Distributors, Inc.
1290 Broadway, Suite 1100
Denver, CO 80203
Transfer Agent
DST Systems, Inc.
P.O. Box 219842
Kansas City, MO 64121-9842
Custodian
State Street Bank & Trust
225 Liberty Street
New York, NY 10281
This material must be preceded or accompanied by a prospectus. Please read it carefully before investing.
| (b) | Not applicable. |
Item 2. Code of Ethics.
Not applicable to semi-annual report.
Item 3. Audit Committee Financial Expert.
Not applicable to semi-annual report.
Item 4. Principal Accountant Fees and Services.
Not applicable to semi-annual report.
Item 5. Audit Committee of Listed Registrants.
Not applicable.
Item 6. Schedule of Investments.
The Schedule of Investments is included as part of the Report to Stockholders filed under Item 1 of this form.
Item 7. Disclosure of Proxy Voting Policies and Procedures for Closed-End Management Investment Companies.
Not applicable.
Item 8. Portfolio Managers of Closed-End Management Investment Companies.
Not applicable.
Item 9. Purchases of Equity Securities by Closed-End Management Investment Company and Affiliated Purchasers.
Not applicable.
Item 10. Submission of Matters to Vote of Security Holders.
There have been no material changes to the procedures by which shareholders may recommend nominees to the registrant’s Board of Trustees.
Item 11. Controls and Procedures.
| (a) | The registrant’s principal executive officer and principal financial officer have evaluated the registrant’s disclosure controls and procedures (as defined in Rule 30a-3(c) under the Investment Company Act of 1940, as amended) within the most recent fiscal half-year of the filing date and have concluded that the registrant’s disclosure controls and procedures were effective, as of that date. |
| (b) | There was no change in the registrant’s internal control over financial reporting (as defined in Rule 30a-3(d) under the Investment Company Act of 1940, as amended) during the period covered by this report that has materially affected, or is reasonably likely to materially affect, the registrant’s internal control over financial reporting. |
Item 12. Disclosure of Securities Lending Activities for Closed-End Management Investment Companies
Not applicable.
Item 13. Exhibits.
| (a)(1) | Not applicable to semi-annual report. |
| (a)(3) | Not applicable. |
| (a)(4) | Not applicable. |
SIGNATURES
Pursuant to the requirements of the Securities Exchange Act of 1934 and the Investment Company Act of 1940, the registrant has duly caused this report to be signed on its behalf by the undersigned, thereunto duly authorized.
THE ARBITRAGE FUNDS
| By: | /s/ John S. Orrico | |
| John S. Orrico | ||
| President (Principal Executive Officer) | ||
| Date: | February 1, 2023 |
Pursuant to the requirements of the Securities Exchange Act of 1934 and the Investment Company Act of 1940, this report has been signed below by the following persons on behalf of the registrant and in the capacities and on the dates indicated.
| By: | /s/ John S. Orrico | |
| John S. Orrico | ||
| President (Principal Executive Officer) | ||
| Date: | February 1, 2023 |
| By: | /s/ Monique Labbe | |
| Monique Labbe | ||
| Chief Financial Officer (Principal Financial Officer) | ||
| Date: | February 1, 2023 |
ATTACHMENTS / EXHIBITS
Serious News for Serious Traders! Try StreetInsider.com Premium Free!
You May Also Be Interested In
- Snoqualmie Casino Brings "Burning Trotman" – Top 7 Artists
- AM Best Maintains Under Review With Negative Implications Status for Credit Ratings of M&C General Insurance Company Limited
- Medicus Pharma Ltd. Announces Proposed Private Placement of Convertible Notes
Create E-mail Alert Related Categories
SEC FilingsSign up for StreetInsider Free!
Receive full access to all new and archived articles, unlimited portfolio tracking, e-mail alerts, custom newswires and RSS feeds - and more!
