

Form N-CSRS AB CAP FUND, INC. For: Sep 30
 Tweet
Tweet Share
Share
UNITED STATES
SECURITIES AND EXCHANGE COMMISSION
WASHINGTON, D.C. 20549
FORM N-CSR
CERTIFIED SHAREHOLDER REPORT OF REGISTERED
MANAGEMENT INVESTMENT COMPANIES
Investment Company Act file number: 811-01716
AB CAP FUND, INC.
(Exact name of registrant as specified in charter)
1345 Avenue of the Americas, New York, New York 10105
(Address of principal executive offices) (Zip code)
Joseph J. Mantineo
AllianceBernstein L.P.
1345 Avenue of the Americas
New York, New York 10105
(Name and address of agent for service)
Registrant’s telephone number, including area code: (800) 221-5672
Date of fiscal year end: March 31, 2022
Date of reporting period: September 30, 2021
ITEM 1. REPORTS TO STOCKHOLDERS.
SEP 09.30.21

SEMI-ANNUAL REPORT
AB EMERGING MARKETS
MULTI-ASSET PORTFOLIO

As of January 1, 2021, as permitted by new regulations adopted by the Securities and Exchange Commission, the Fund’s annual and semi-annual shareholder reports are no longer sent by mail, unless you specifically requested paper copies of the reports. Instead, the reports are made available on a website, and you will be notified by mail each time a report is posted and provided with a website address to access the report.
You may elect to receive all future reports in paper form free of charge. If you invest through a financial intermediary, you can contact your financial intermediary to request that you continue to receive paper copies of your shareholder reports; if you invest directly with the Fund, you can call the Fund at (800) 221 5672. Your election to receive reports in paper form will apply to all funds held in your account with your financial intermediary or, if you invest directly, to all AB Mutual Funds you hold.
| Investment Products Offered | • Are Not FDIC Insured • May Lose Value • Are Not Bank Guaranteed | |
Investors should consider the investment objectives, risks, charges and expenses of the Fund carefully before investing. For copies of our prospectus or summary prospectus, which contain this and other information, visit us online at www.abfunds.com or contact your AB representative. Please read the prospectus and/or summary prospectus carefully before investing.
This shareholder report must be preceded or accompanied by the Fund’s prospectus for individuals who are not current shareholders of the Fund.
You may obtain a description of the Fund’s proxy voting policies and procedures, and information regarding how the Fund voted proxies relating to portfolio securities during the most recent 12-month period ended June 30, without charge. Simply visit AB’s website at www.abfunds.com, or go to the Securities and Exchange Commission’s (the “Commission”) website at www.sec.gov, or call AB at (800) 227 4618.
The Fund files its complete schedule of portfolio holdings with the Commission for the first and third quarters of each fiscal year as an exhibit to its reports on Form N-PORT. The Fund’s Form N-PORT reports are available on the Commission’s website at www.sec.gov. The Fund’s Forms N-PORT may also be reviewed and copied at the Commission’s Public Reference Room in Washington, DC; information on the operation of the Public Reference Room may be obtained by calling (800) SEC 0330. AB publishes full portfolio holdings for the Fund monthly at www.abfunds.com.
AllianceBernstein Investments, Inc. (ABI) is the distributor of the AB family of mutual funds. ABI is a member of FINRA and is an affiliate of AllianceBernstein L.P., the Adviser of the funds.
The [A/B] logo is a registered service mark of AllianceBernstein and AllianceBernstein® is a registered service mark used by permission of the owner, AllianceBernstein L.P.
| FROM THE PRESIDENT |

|
Dear Shareholder,
We’re pleased to provide this report for the AB Emerging Markets Multi-Asset Portfolio (the “Fund”). Please review the discussion of Fund performance, the market conditions during the reporting period and the Fund’s investment strategy.
At AB, we’re striving to help our clients achieve better outcomes by:
| + | Fostering diverse perspectives that give us a distinctive approach to navigating global capital markets |
| + | Applying differentiated investment insights through a connected global research network |
| + | Embracing innovation to design better ways to invest and leading-edge mutual-fund solutions |
Whether you’re an individual investor or a multibillion-dollar institution, we’re putting our knowledge and experience to work for you every day.
For more information about AB’s comprehensive range of products and shareholder resources, please log on to www.abfunds.com.
Thank you for your investment in AB mutual funds—and for placing your trust in our firm.
Sincerely,

Onur Erzan
President and Chief Executive Officer, AB Mutual Funds
| abfunds.com | AB EMERGING MARKETS MULTI-ASSET PORTFOLIO | 1 | |
SEMI-ANNUAL REPORT
November 8, 2021
This report provides management’s discussion of fund performance for the AB Emerging Markets Multi-Asset Portfolio for the semi-annual reporting period ended September 30, 2021.
The Fund’s investment objective is to maximize total return. Total return is the sum of capital appreciation and income.
NAV RETURNS AS OF SEPTEMBER 30, 2021 (unaudited)
| 6 Months | 12 Months | |||||||
| AB EMERGING MARKETS MULTI-ASSET PORTFOLIO | ||||||||
| Class A Shares | -1.84% | 16.31% | ||||||
| Class C Shares | -2.23% | 15.38% | ||||||
| Advisor Class Shares1 | -1.62% | 16.67% | ||||||
| Class R Shares1 | -1.88% | 16.08% | ||||||
| Class K Shares1 | -1.82% | 16.37% | ||||||
| Class I Shares1 | -1.72% | 16.61% | ||||||
| Class Z Shares1 | -1.62% | 16.69% | ||||||
| MSCI EM Index (net) | -3.45% | 18.20% | ||||||
| 1 | Please note that these share classes are for investors purchasing shares through accounts established under certain fee-based programs sponsored and maintained by certain broker-dealers and financial intermediaries, institutional pension plans and/or investment advisory clients of, and certain other persons associated with, the Adviser and its affiliates or the Fund. |
Please keep in mind that high, double-digit returns are highly unusual and cannot be sustained. Investors should also be aware that these returns were primarily achieved during favorable market conditions.
INVESTMENT RESULTS
The table above shows the Fund’s performance compared to its benchmark, the Morgan Stanley Capital International Emerging Markets (“MSCI EM”) Index (net), for the six- and 12-month periods ended September 30, 2021. The Fund’s benchmark is fully composed of equities, while the Fund invests in both equities and fixed income.
All share classes of the Fund outperformed the benchmark for the six-month period, before sales charges. Emerging-market debt index returns outperformed emerging-market equity returns, so the structural underweight to equities of the Fund’s multi-asset strategy contributed when measured against a pure equity benchmark. Equity and fixed-income holdings outperformed their respective equity and fixed-income benchmarks, and overall security selection within equities and fixed income contributed to absolute returns. Active currency management contributed during the period.
| 2 | AB EMERGING MARKETS MULTI-ASSET PORTFOLIO |
abfunds.com | |
During the 12-month period, all share classes of the Fund underperformed the benchmark, before sales charges. Emerging-market debt index returns contributed on an absolute basis but lagged emerging-market equity returns, so the structural underweight to equities detracted when measured against a pure equity benchmark. Overall security selection within equities and fixed income contributed, and both categories outperformed their respective benchmarks. Active currency management also contributed during the 12-month period.
During both periods, the Fund utilized derivatives for hedging and investment purposes in the form of currency forwards and written swaptions, which added to absolute performance, while variance swaps, credit default swaps and purchased swaptions detracted; futures and total return swaps detracted for the six-month period, but added for the 12-month period; interest rate swaps added for the six-month period, but detracted for the 12-month period.
MARKET REVIEW AND INVESTMENT STRATEGY
Global equities recorded positive returns and emerging-market equities declined for the six-month period ended September 30, 2021. Accommodative monetary policy and strong company earnings growth continued to support equity markets, but bouts of volatility increased as the accelerating economic recovery triggered inflationary fears. Worsening supply-chain constraints and the negative economic impact of the coronavirus delta variant were compounded by the convergence of politically divisive budget and spending plan negotiations in the US. The likelihood of contagion from the collapse of the heavily indebted Chinese real estate developer Evergrande and a slowdown in China’s economy pushed emerging-market equities into negative territory and weighed on global risk sentiment. Equity markets remained under pressure after the US Federal Reserve turned more hawkish regarding the timing of tapering and interest-rate liftoff, and as concern grew over the US debt-ceiling crisis. Surging oil and commodity prices stoked inflationary fears, driving bond yields higher and equities sharply lower. Large-cap stocks significantly outperformed small-cap stocks on a relative basis, and despite intervals of market rotation, growth-style stocks outperformed their value-style peers.
Developed-market fixed-income market returns were mostly positive as longer-term government bond yields fell during most of the period in all regions except Europe on growth concerns from the delta variant, until August when inflation reports and central bank tapering comments started to send yields higher. Low interest rates set the stage for the continued outperformance of risk assets, led by emerging-market high-yield sovereign bonds. Developed- and emerging-market high-yield and investment-grade corporate bonds also posted strong returns. Corporate bond returns were higher in the US than in Europe, mostly because of the divergence in government yields. Emerging-market local-currency bonds had positive performance but trailed developed-market treasuries as the
| abfunds.com | AB EMERGING MARKETS MULTI-ASSET PORTFOLIO | 3 | |
US dollar rose against the majority of emerging-market currencies and all major developed-market currencies except the Swiss franc. Securitized assets advanced but trailed US Treasuries. Commodity prices continued their ascent, led by the continued recovery in Brent crude oil prices.
The Fund’s Senior Investment Management Team (the “Team”) seeks to maximize total return by dynamically adjusting exposure to emerging markets by investing across asset classes. The Team’s emerging-market strategy searches for long-term growth with lower volatility. In seeking to reduce risk and provide downside protection, the Team pursues active stocks and flexible bond allocations. The Team utilizes a disciplined investment process, which draws on a rigorous quantitative research toolset with fundamental expertise across all regions and markets.
INVESTMENT POLICIES
The Fund invests at least 80% of its net assets under normal circumstances in securities of emerging-market issuers and/or the currencies of emerging-market countries. Examples of emerging-market countries include Argentina, Brazil, Chile, Croatia, Egypt, India, Indonesia, Israel, Kazakhstan, Malaysia, Mexico, the People’s Republic of China, Peru, the Philippines, Poland, Russia, South Africa, South Korea, Taiwan, Thailand, Turkey and Venezuela. The Fund may invest up to 20% of its net assets in the securities of developed-market issuers.
The Fund invests in equity securities, debt securities and currencies, and does not attempt to maintain a constant or relatively constant allocation among these asset classes. Rather, allocations among asset classes are adjusted based on the Adviser’s view of the relative attractiveness of the asset classes. These allocations are informed by the Adviser’s proprietary asset allocation tools, which are comprised of a series of volatility, correlation and expected return forecasts. The Adviser reviews potential Fund investments in each asset class holistically from a country, currency, sector and security standpoint to optimize overall portfolio construction. Under normal circumstances, the Fund will invest between 30% and 95% of its net assets in equity securities, and between 0% and 65% of its net assets in debt securities, with any remainder held in cash (including foreign currency). The Fund is not constrained based on the country, region, market capitalization, credit quality or duration of its investments and its assets may at times be concentrated in a particular country or region.
The process for selecting equity securities for the Fund is primarily bottom-up. The Adviser seeks to identify stocks that are attractive based on valuation, profitability, earnings quality, business trends, price momentum and other measures. The process for selecting debt securities
(continued on next page)
| 4 | AB EMERGING MARKETS MULTI-ASSET PORTFOLIO |
abfunds.com | |
for the Fund is more top-down. The Adviser believes that inefficiencies in the global debt markets arise from investor emotion, market complexity and conflicting investment agendas. The Adviser combines quantitative forecasts with fundamental credit and economic research in seeking to exploit these inefficiencies. The Adviser seeks to generate returns from the Fund’s fixed-income investments through a combination of country selection, currency allocation, sector analysis and security selection. Debt securities may include those of both corporate and governmental issuers, and may include below investment-grade debt securities (“junk bonds”). The Fund may invest in debt securities with a range of maturities from short- to long-term.
The Adviser considers both quantitative and fundamental factors in adjusting the Fund’s currency exposures. In addition to the Fund’s currency exposure that results from its investments in equity and debt securities denominated in foreign currencies (and any related hedging), the Fund may hold foreign currency (or related derivatives) independently of any such investments, and may hold a currency even if the Fund does not hold any securities denominated in that currency.
The Fund may utilize derivatives, such as futures contracts, forwards and swaps, and invest in exchange-traded funds (“ETFs”) to a significant extent. Derivatives and ETFs may provide more efficient and economical exposure to market segments than direct investments, and may also be a quicker and more efficient way to alter the Fund’s exposure than buying and selling direct investments. In determining when and to what extent to enter into derivatives transactions or to invest in ETFs, the Adviser will consider factors such as the relative risks and returns expected of potential investments and the cost of such transactions. Derivatives may also be used for hedging purposes, including to hedge against interest-rate, credit and currency fluctuations. The Adviser also expects to use derivatives frequently to effectively leverage the Fund by creating aggregate exposure somewhat in excess of the Fund’s net assets. The notional value of derivatives and ETFs linked to emerging-market securities or currencies are counted towards meeting the percentage minimums and ranges set forth above, including the requirement that the Fund invest at least 80% of its net assets in the securities of emerging-market issuers and/or the currencies of emerging-market countries.
| abfunds.com | AB EMERGING MARKETS MULTI-ASSET PORTFOLIO | 5 | |
DISCLOSURES AND RISKS
Benchmark Disclosure
The MSCI EM Index is unmanaged and does not reflect fees and expenses associated with the active management of a mutual fund portfolio. The MSCI EM Index (net, free float-adjusted, market capitalization weighted) represents the equity market performance of emerging markets. MSCI makes no express or implied warranties or representations, and shall have no liability whatsoever with respect to any MSCI data contained herein. The MSCI data may not be further redistributed or used as a basis for other indices, any securities or financial products. This report is not approved, reviewed or produced by MSCI. Net returns include the reinvestment of dividends after deduction of non-US withholding tax. An investor cannot invest directly in an index or average, and their results are not indicative of the performance for any specific investment, including the Fund.
A Word About Risk
Emerging-Market Risk: Investments in emerging-market countries may involve more risk than investments in other foreign countries because the markets in emerging-market countries are less developed and less liquid, and because these investments may be subject to increased economic, political, regulatory or other uncertainties.
Market Risk: The value of the Fund’s assets will fluctuate as the stock, bond or currency markets fluctuate. The value of the Fund’s investments may decline, sometimes rapidly and unpredictably, simply because of economic changes or other events, including public health crises (including the occurrence of a contagious disease or illness), that affect large portions of the market.
Foreign (Non-US) Risk: Investments in securities of non-US issuers may involve more risk than those of US issuers. These securities may fluctuate more widely in price and may be more difficult to trade due to adverse market, economic, political, regulatory or other factors.
Currency Risk: Fluctuations in currency exchange rates may negatively affect the value of the Fund’s investments or reduce its returns. Emerging-market currencies may be more volatile and less liquid, and subject to significantly greater risk of currency controls and convertibility restrictions, than currencies of developed countries.
Country Concentration Risk: The Fund may not always be diversified among countries or geographic regions and the effect on the Fund’s net asset value (“NAV”) of the specific risks identified above, such as political, regulatory and currency risks, may be magnified due to concentration of the Fund’s investments in a particular country or region.
| 6 | AB EMERGING MARKETS MULTI-ASSET PORTFOLIO |
abfunds.com | |
DISCLOSURES AND RISKS (continued)
Allocation Risk: The allocation of Fund assets among different asset classes, such as equity securities, debt securities and currencies, may have a significant effect on the Fund’s NAV when one of these asset classes is performing better or worse than others. The diversification benefits typically associated with investing in both equity and debt securities may be limited in the emerging-markets context, as movements in emerging-market equity and emerging-market debt markets may be more correlated than movements in the equity and debt markets of developed countries.
Capitalization Risk: Investments in small- and mid-capitalization companies may be more volatile than investments in large-capitalization companies. Investments in small-capitalization companies may have additional risks because these companies have limited product lines, markets or financial resources.
Interest-Rate Risk: Changes in interest rates will affect the value of investments in fixed-income securities. When interest rates rise, the value of existing investments in fixed-income securities tends to fall and this decrease in value may not be offset by higher income from new investments. Interest-rate risk is generally greater for fixed-income securities with longer maturities or durations. The current historically low interest rate environment heightens the risks associated with rising interest rates.
Credit Risk: An issuer or guarantor of a fixed-income security, or the counterparty to a derivatives or other contract, may be unable or unwilling to make timely payments of interest or principal, or to otherwise honor its obligations. The issuer or guarantor may default, causing a loss of the full principal amount of a security and accrued interest. The degree of risk for a particular security may be reflected in its credit rating. There is the possibility that the credit rating of a fixed-income security may be downgraded after purchase, which may adversely affect the value of the security.
Sovereign Debt Risk: Investments in sovereign debt obligations expose the Fund to the direct or indirect consequences of political, social and economic changes in countries that issue the obligations. Such changes may affect a foreign government’s willingness or ability to make timely payments of its obligations. In addition, no established market may exist for many sovereign debt obligations. Reduced secondary market liquidity may have an adverse effect on the market price of an instrument and the Fund’s ability to dispose of particular instruments.
Below Investment-Grade Securities Risk: Investments in fixed-income securities with lower ratings (commonly known as “junk bonds”) tend to have a higher probability that an issuer will default or fail to meet its payment obligations. These securities may be subject to greater price volatility
| abfunds.com | AB EMERGING MARKETS MULTI-ASSET PORTFOLIO | 7 | |
DISCLOSURES AND RISKS (continued)
due to factors such as specific corporate developments, interest-rate sensitivity and negative perceptions of the junk bond market generally, and may be more difficult to trade than other types of securities.
Derivatives Risk: Derivatives may be difficult to price or unwind and leveraged so that small changes may produce disproportionate losses for the Fund. Derivatives, especially over-the-counter derivatives, are also subject to counterparty risk.
Leverage Risk: To the extent the Fund uses leveraging techniques, its NAV may be more volatile because leverage tends to exaggerate the effect of changes in interest rates and any increase or decrease in the value of the Fund’s investments.
Illiquid Investments Risk: Illiquid investments risk exists when certain investments are or become difficult to purchase or sell. Difficulty in selling such investments may result in sales at disadvantageous prices affecting the value of your investment in the Fund. Causes of illiquid investments risk may include low trading volumes, large positions and heavy redemptions of Fund shares. Illiquid investments risk may be higher in a rising interest-rate environment, when the value and liquidity of fixed-income securities generally decline.
Management Risk: The Fund is subject to management risk because it is an actively managed investment fund. The Adviser will apply its investment techniques and risk analyses in making investment decisions, but there is no guarantee that its techniques will produce the intended results. Some of these techniques may incorporate, or rely upon, quantitative models, but there is no guarantee that these models will generate accurate forecasts, reduce risk or otherwise perform as expected.
These risks are fully discussed in the Fund’s prospectus. As with all investments, you may lose money by investing in the Fund.
An Important Note About Historical Performance
The investment return and principal value of an investment in the Fund will fluctuate, so that shares, when redeemed, may be worth more or less than their original cost. Performance shown in this report represents past performance and does not guarantee future results. Current performance may be lower or higher than the performance information shown. You may obtain performance information current to the most recent month-end by visiting www.abfunds.com.
All fees and expenses related to the operation of the Fund have been deducted. NAV returns do not reflect sales charges; if sales
| 8 | AB EMERGING MARKETS MULTI-ASSET PORTFOLIO |
abfunds.com | |
DISCLOSURES AND RISKS (continued)
charges were reflected, the Fund’s quoted performance would be lower. SEC returns reflect the applicable sales charges for each share class: a 4.25% maximum front-end sales charge for Class A shares and a 1% 1-year contingent deferred sales charge for Class C shares. Returns for the different share classes will vary due to different expenses associated with each class. Performance assumes reinvestment of distributions and does not account for taxes.
| abfunds.com | AB EMERGING MARKETS MULTI-ASSET PORTFOLIO | 9 | |
HISTORICAL PERFORMANCE
AVERAGE ANNUAL RETURNS AS OF SEPTEMBER 30, 2021 (unaudited)
| NAV Returns | SEC Returns (reflects applicable |
|||||||
| CLASS A SHARES | ||||||||
| 1 Year | 16.31% | 11.38% | ||||||
| 5 Years | 6.16% | 5.25% | ||||||
| 10 Years | 4.85% | 4.39% | ||||||
| CLASS C SHARES | ||||||||
| 1 Year | 15.38% | 14.38% | ||||||
| 5 Years | 5.37% | 5.37% | ||||||
| 10 Years1 | 4.08% | 4.08% | ||||||
| ADVISOR CLASS SHARES2 | ||||||||
| 1 Year | 16.67% | 16.67% | ||||||
| 5 Years | 6.44% | 6.44% | ||||||
| 10 Years | 5.14% | 5.14% | ||||||
| CLASS R SHARES2 | ||||||||
| 1 Year | 16.08% | 16.08% | ||||||
| 5 Years | 5.92% | 5.92% | ||||||
| 10 Years | 4.61% | 4.61% | ||||||
| CLASS K SHARES2 | ||||||||
| 1 Year | 16.37% | 16.37% | ||||||
| 5 Years | 6.16% | 6.16% | ||||||
| 10 Years | 4.87% | 4.87% | ||||||
| CLASS I SHARES2 | ||||||||
| 1 Year | 16.61% | 16.61% | ||||||
| 5 Years | 6.43% | 6.43% | ||||||
| 10 Years | 5.13% | 5.13% | ||||||
| CLASS Z SHARES2 | ||||||||
| 1 Year | 16.69% | 16.69% | ||||||
| Since Inception3 | 4.91% | 4.91% | ||||||
The Fund’s prospectus fee table shows the Fund’s total annual operating expense ratios as 1.65%, 2.41%, 1.40%, 2.11%, 1.81%, 1.25% and 1.32% for Class A, Class C, Advisor Class, Class R, Class K, Class I and Class Z shares, respectively, gross of any fee waivers or expense reimbursements. Contractual fee waivers and/or expense reimbursements limit the Fund’s annual operating expense ratios exclusive of expenses associated with acquired fund fees and expenses other than the advisory fees of any AB mutual funds in which the Fund may invest, interest expense and extraordinary expenses to 1.24%, 1.99%, 0.99%, 1.49%, 1.24%, 0.99% and 0.99% for Class A, Class C, Advisor Class, Class R, Class K, Class I and Class Z shares, respectively. These waivers/reimbursements may not be terminated before July 31, 2022. Absent reimbursements or waivers, performance would have been lower. The Financial Highlights section of this report sets forth expense ratio data for the current reporting period; the expense ratios shown above may differ from the expense ratios in the Financial Highlights section since they are based on different time periods.
(footnotes continued on next page)
|
10 | AB EMERGING MARKETS MULTI-ASSET PORTFOLIO |
abfunds.com | |
HISTORICAL PERFORMANCE (continued)
| 1 | Assumes conversion of Class C shares into Class A shares after eight years. |
| 2 | These share classes are offered at NAV to eligible investors and their SEC returns are the same as their NAV returns. Please note that these share classes are for investors purchasing shares through accounts established under certain fee-based programs sponsored and maintained by certain broker-dealers and financial intermediaries, institutional pension plans and/or investment advisory clients of, and certain other persons associated with, the Adviser and its affiliates or the Fund. |
| 3 | Inception date: 7/31/2017. |
| abfunds.com | AB EMERGING MARKETS MULTI-ASSET PORTFOLIO | 11 | |
HISTORICAL PERFORMANCE (continued)
SEC AVERAGE ANNUAL RETURNS
AS OF THE MOST RECENT CALENDAR QUARTER-END
SEPTEMBER 30, 2021 (unaudited)
| SEC Returns (reflects applicable |
||||
| CLASS A SHARES | ||||
| 1 Year | 11.38% | |||
| 5 Years | 5.25% | |||
| 10 Years | 4.39% | |||
| CLASS C SHARES | ||||
| 1 Year | 14.38% | |||
| 5 Years | 5.37% | |||
| 10 Years1 | 4.08% | |||
| ADVISOR CLASS SHARES2 | ||||
| 1 Year | 16.67% | |||
| 5 Years | 6.44% | |||
| 10 Years | 5.14% | |||
| CLASS R SHARES2 | ||||
| 1 Year | 16.08% | |||
| 5 Years | 5.92% | |||
| 10 Years | 4.61% | |||
| CLASS K SHARES2 | ||||
| 1 Year | 16.37% | |||
| 5 Years | 6.16% | |||
| 10 Years | 4.87% | |||
| CLASS I SHARES2 | ||||
| 1 Year | 16.61% | |||
| 5 Years | 6.43% | |||
| 10 Years | 5.13% | |||
| CLASS Z SHARES2 | ||||
| 1 Year | 16.69% | |||
| Since Inception3 | 4.91% | |||
| 1 | Assumes conversion of Class C shares into Class A shares after eight years. |
| 2 | Please note that these share classes are for investors purchasing shares through accounts established under certain fee-based programs sponsored and maintained by certain broker-dealers and financial intermediaries, institutional pension plans and/or investment advisory clients of, and certain other persons associated with, the Adviser and its affiliates or the Fund. |
| 3 | Inception date: 7/31/2017. |
| 12 | AB EMERGING MARKETS MULTI-ASSET PORTFOLIO |
abfunds.com | |
EXPENSE EXAMPLE
(unaudited)
As a shareholder of the Fund, you incur two types of costs: (1) transaction costs, including sales charges (loads) on purchase payments, contingent deferred sales charges on redemptions and (2) ongoing costs, including management fees; distribution (12b-1) fees; and other Fund expenses. This example is intended to help you understand your ongoing costs (in dollars) of investing in the Fund and to compare these costs with the ongoing costs of investing in other mutual funds.
The Example is based on an investment of $1,000 invested at the beginning of the period and held for the entire period as indicated below.
Actual Expenses
The table below provides information about actual account values and actual expenses. You may use the information, together with the amount you invested, to estimate the expenses that you paid over the period. Simply divide your account value by $1,000 (for example, an $8,600 account value divided by $1,000 = 8.6), then multiply the result by the number under the heading entitled “Expenses Paid During Period” to estimate the expenses you paid on your account during this period.
Hypothetical Example for Comparison Purposes
The table below also provides information about hypothetical account values and hypothetical expenses based on the Fund’s actual expense ratio and an assumed annual rate of return of 5% before expenses, which is not the Fund’s actual return. The hypothetical account values and expenses may not be used to estimate the actual ending account balance or expenses you paid for the period. You may use this information to compare the ongoing costs of investing in the Fund and other funds by comparing this 5% hypothetical example with the 5% hypothetical examples that appear in the shareholder reports of other funds.
Please note that the expenses shown in the table are meant to highlight your ongoing costs only and do not reflect any transactional costs, such as sales charges (loads), or contingent deferred sales charges on redemptions. Therefore, the hypothetical example is useful in comparing ongoing costs only, and will not help you determine the relative total costs of owning different funds. In addition, if these transactional costs were included, your costs would have been higher.
| abfunds.com | AB EMERGING MARKETS MULTI-ASSET PORTFOLIO | 13 | |
EXPENSE EXAMPLE (continued)
| Beginning Account Value 4/1/2021 |
Ending Account Value 9/30/2021 |
Expenses Paid During Period* |
Annualized Expense Ratio* |
|||||||||||||
| Class A | ||||||||||||||||
| Actual |
$ | 1,000 | $ | 981.60 | $ | 6.16 | 1.24 | % | ||||||||
| Hypothetical** |
$ | 1,000 | $ | 1,018.85 | $ | 6.28 | 1.24 | % | ||||||||
| Class C | ||||||||||||||||
| Actual |
$ | 1,000 | $ | 977.70 | $ | 9.87 | 1.99 | % | ||||||||
| Hypothetical** |
$ | 1,000 | $ | 1,015.09 | $ | 10.05 | 1.99 | % | ||||||||
| Advisor Class | ||||||||||||||||
| Actual |
$ | 1,000 | $ | 983.80 | $ | 4.92 | 0.99 | % | ||||||||
| Hypothetical** |
$ | 1,000 | $ | 1,020.10 | $ | 5.01 | 0.99 | % | ||||||||
| Class R | ||||||||||||||||
| Actual |
$ | 1,000 | $ | 981.20 | $ | 7.40 | 1.49 | % | ||||||||
| Hypothetical** |
$ | 1,000 | $ | 1,017.60 | $ | 7.54 | 1.49 | % | ||||||||
| Class K | ||||||||||||||||
| Actual |
$ | 1,000 | $ | 981.80 | $ | 6.16 | 1.24 | % | ||||||||
| Hypothetical** |
$ | 1,000 | $ | 1,018.85 | $ | 6.28 | 1.24 | % | ||||||||
| Class I | ||||||||||||||||
| Actual |
$ | 1,000 | $ | 982.80 | $ | 4.92 | 0.99 | % | ||||||||
| Hypothetical** |
$ | 1,000 | $ | 1,020.10 | $ | 5.01 | 0.99 | % | ||||||||
| Class Z | ||||||||||||||||
| Actual |
$ | 1,000 | $ | 983.80 | $ | 4.92 | 0.99 | % | ||||||||
| Hypothetical** |
$ | 1,000 | $ | 1,020.10 | $ | 5.01 | 0.99 | % | ||||||||
| * | Expenses are equal to the classes’ annualized expense ratios multiplied by the average account value over the period, multiplied by 183/365 (to reflect the one-half year period). |
| ** | Assumes 5% annual return before expenses. |
|
14 | AB EMERGING MARKETS MULTI-ASSET PORTFOLIO |
abfunds.com | |
PORTFOLIO SUMMARY
September 30, 2021 (unaudited)
PORTFOLIO STATISTICS
Net Assets ($mil): $184.6
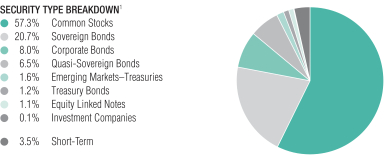
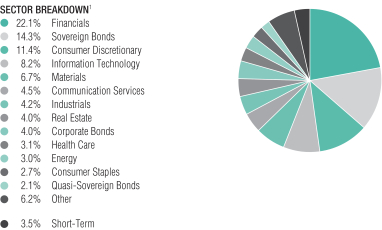
| 1 | All data are as of September 30, 2021. The Fund’s security type and sector breakdowns are expressed as a percentage of total investments (excluding security lending collateral) and may vary over time. The Fund also enters into derivative transactions, which may be used for hedging or investment purposes (see “Portfolio of Investments” section of the report for additional details). “Other” sector weightings represent 2.1% or less in the following sectors: Emerging Markets–Treasuries, Equity Linked Notes, Funds and Investment Trusts, Treasury Bonds and Utilities. |
| abfunds.com | AB EMERGING MARKETS MULTI-ASSET PORTFOLIO | 15 | |
PORTFOLIO SUMMARY (continued)
September 30, 2021 (unaudited)
TEN LARGEST HOLDINGS2
| Company | U.S. $ Value | Percent of Net Assets |
||||||
| Taiwan Semiconductor Manufacturing Co., Ltd. | $ | 4,570,741 | 2.5 | % | ||||
| Samsung Electronics Co., Ltd. | 4,066,164 | 2.2 | ||||||
| Agricultural Bank of China Ltd. – Class H | 3,426,373 | 1.9 | ||||||
| PetroChina Co., Ltd. | 3,279,491 | 1.8 | ||||||
| Hana Financial Group, Inc. | 2,992,198 | 1.6 | ||||||
| LUKOIL PJSC (Sponsored ADR) | 2,892,431 | 1.6 | ||||||
| Hon Hai Precision Industry Co., Ltd. | 2,788,262 | 1.5 | ||||||
| Egypt Government International Bond | 2,705,538 | 1.5 | ||||||
| Ukraine Government International Bond | 2,453,397 | 1.3 | ||||||
| Tencent Holdings Ltd. | 2,417,800 | 1.3 | ||||||
| $ | 31,592,395 | 17.2 | % | |||||
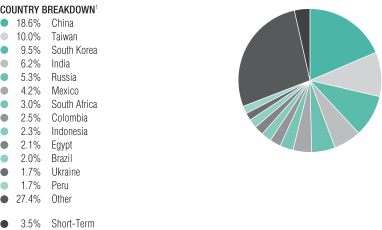
| 1 | All data are as of September 30, 2021. The Fund’s country breakdown is expressed as a percentage of total investments (excluding security lending collateral) and may vary over time. The Fund also enters into derivative transactions, which may be used for hedging or investment purposes (see “Portfolio of Investments” section of the report for additional details). “Other” country weightings represent 1.6% or less in the following: Angola, Argentina, Australia, Azerbaijan, Bahamas, Bahrain, Chile, Czech Republic, Dominican Republic, Ecuador, El Salvador, France, Gabon, Ghana, Greece, Guatemala, Honduras, Hong Kong, Hungary, Israel, Ivory Coast, Jamaica, Japan, Kazakhstan, Kenya, Kuwait, Lebanon, Malaysia, Mongolia, Nigeria, Oman, Pakistan, Panama, Paraguay, Philippines, Poland, Qatar, Romania, Saudi Arabia, Senegal, Sri Lanka, Thailand, Trinidad & Tobago, Turkey, United Arab Emirates, United States, Uruguay, Venezuela, Vietnam and Zambia. |
| 2 | Long-term investments. |
| 16 | AB EMERGING MARKETS MULTI-ASSET PORTFOLIO |
abfunds.com | |
PORTFOLIO OF INVESTMENTS
September 30, 2021 (unaudited)
| Company | Shares |
U.S. $ Value | ||||||||||
|
|
||||||||||||
| COMMON STOCKS – 56.4% |
| |||||||||||
| Financials – 13.8% |
| |||||||||||
| Banks – 9.1% |
||||||||||||
| Abu Dhabi Islamic Bank PJSC |
49,233 | $ | 77,395 | |||||||||
| Agricultural Bank of China Ltd. – Class H |
9,974,000 | 3,426,373 | ||||||||||
| Banco Santander Chile |
2,208,696 | 110,680 | ||||||||||
| Bank of China Ltd. – Class H |
323,000 | 114,127 | ||||||||||
| Bank of Communications Co., Ltd. – Class H |
1,044,000 | 617,940 | ||||||||||
| Capitec Bank Holdings Ltd. |
85 | 10,268 | ||||||||||
| China CITIC Bank Corp., Ltd. – Class H |
2,078,000 | 936,613 | ||||||||||
| China Construction Bank Corp. – Class H |
600,000 | 428,210 | ||||||||||
| China Everbright Bank Co., Ltd. – Class H |
326,000 | 114,750 | ||||||||||
| China Merchants Bank Co., Ltd. – Class H |
15,000 | 119,372 | ||||||||||
| Chongqing Rural Commercial Bank Co., Ltd. – Class H |
148,000 | 53,798 | ||||||||||
| Commercial Bank PSQC (The) |
68,100 | 115,009 | ||||||||||
| Grupo Financiero Banorte SAB de CV – Class O |
17,319 | 110,996 | ||||||||||
| Habib Bank Ltd. |
81,241 | 52,228 | ||||||||||
| Halyk Savings Bank of Kazakhstan JSC (GDR)(a) |
23,000 | 391,000 | ||||||||||
| Hana Financial Group, Inc. |
76,976 | 2,992,198 | ||||||||||
| HDFC Bank Ltd. |
44,723 | 954,841 | ||||||||||
| Industrial Bank Co., Ltd. – Class A |
465,960 | 1,313,939 | ||||||||||
| KB Financial Group, Inc. |
17,225 | 801,092 | ||||||||||
| Kuwait Finance House KSCP |
40,960 | 111,654 | ||||||||||
| Malayan Banking Bhd |
56,600 | 108,833 | ||||||||||
| MCB Bank Ltd. |
44,776 | 40,213 | ||||||||||
| Metropolitan Bank & Trust Co. |
678,620 | 580,285 | ||||||||||
| Postal Savings Bank of China Co., Ltd.(a) |
166,000 | 114,118 | ||||||||||
| Sberbank of Russia PJSC (Sponsored ADR) |
113,887 | 2,133,982 | ||||||||||
| Taishin Financial Holding Co., Ltd. |
90,000 | 58,263 | ||||||||||
| TCS Group Holding PLC (GDR)(a) |
10,019 | 911,043 | ||||||||||
|
|
|
|||||||||||
| 16,799,220 | ||||||||||||
|
|
|
|||||||||||
| Capital Markets – 0.4% |
||||||||||||
| China Everbright Ltd. |
78,000 | 91,645 | ||||||||||
| East Money Information Co., Ltd. – Class A |
15,900 | 84,254 | ||||||||||
| GF Securities Co., Ltd. – Class H |
60,800 | 106,026 | ||||||||||
| Korea Investment Holdings Co., Ltd. |
1,444 | 103,769 | ||||||||||
| Meritz Securities Co., Ltd. |
25,142 | 104,196 | ||||||||||
| NH Investment & Securities Co., Ltd. |
9,831 | 105,861 | ||||||||||
| Samsung Securities Co., Ltd. |
2,666 | 106,496 | ||||||||||
| Up Fintech Holding Ltd. (ADR)(b)(c) |
2,572 | 27,237 | ||||||||||
|
|
|
|||||||||||
| 729,484 | ||||||||||||
|
|
|
|||||||||||
| Consumer Finance – 0.3% |
||||||||||||
| 360 DigiTech, Inc. (ADR)(c) |
5,739 | 116,616 | ||||||||||
| Manappuram Finance Ltd. |
196,945 | 446,740 | ||||||||||
|
|
|
|||||||||||
| 563,356 | ||||||||||||
|
|
|
|||||||||||
| abfunds.com | AB EMERGING MARKETS MULTI-ASSET PORTFOLIO | 17 | |
PORTFOLIO OF INVESTMENTS (continued)
| Company | Shares |
U.S. $ Value | ||||||||||
|
|
||||||||||||
| Diversified Financial Services – 1.7% |
||||||||||||
| Chailease Holding Co., Ltd. |
28,000 | $ | 245,899 | |||||||||
| Far East Horizon Ltd. |
111,000 | 112,645 | ||||||||||
| FirstRand Ltd. |
27,992 | 119,914 | ||||||||||
| Fubon Financial Holding Co., Ltd. |
545,600 | 1,491,034 | ||||||||||
| Haci Omer Sabanci Holding AS |
747,535 | 814,731 | ||||||||||
| Piramal Enterprises Ltd. |
3,303 | 114,937 | ||||||||||
| REC Ltd. |
54,651 | 115,443 | ||||||||||
| Yuanta Financial Holding Co., Ltd. |
126,000 | 111,169 | ||||||||||
|
|
|
|||||||||||
| 3,125,772 | ||||||||||||
|
|
|
|||||||||||
| Insurance – 1.8% |
||||||||||||
| AIA Group Ltd. |
118,000 | 1,357,520 | ||||||||||
| Bupa Arabia for Cooperative Insurance Co. |
2,796 | 111,223 | ||||||||||
| Co. for Cooperative Insurance (The) |
4,509 | 103,988 | ||||||||||
| PICC Property & Casualty Co., Ltd. – Class H |
1,322,000 | 1,282,431 | ||||||||||
| Ping An Insurance Group Co. of China Ltd. – Class H |
38,000 | 259,896 | ||||||||||
| Ping An Insurance Group Co. of China, Ltd. – Class A |
28,200 | 210,750 | ||||||||||
| Powszechny Zaklad Ubezpieczen SA |
11,707 | 107,096 | ||||||||||
|
|
|
|||||||||||
| 3,432,904 | ||||||||||||
|
|
|
|||||||||||
| Thrifts & Mortgage Finance – 0.5% |
||||||||||||
| Housing Development Finance Corp., Ltd. |
24,109 | 888,009 | ||||||||||
|
|
|
|||||||||||
| 25,538,745 | ||||||||||||
|
|
|
|||||||||||
| Information Technology – 13.3% |
||||||||||||
| Electronic Equipment, Instruments & Components – 2.6% |
||||||||||||
| Hon Hai Precision Industry Co., Ltd. |
747,000 | 2,788,262 | ||||||||||
| Kingboard Holdings Ltd. |
24,500 | 110,877 | ||||||||||
| Samsung SDI Co., Ltd. |
1,820 | 1,086,031 | ||||||||||
| Sinbon Electronics Co., Ltd. |
59,000 | 496,128 | ||||||||||
| Synnex Technology International Corp. |
59,000 | 109,873 | ||||||||||
| WPG Holdings Ltd. |
62,000 | 107,403 | ||||||||||
| Zhen Ding Technology Holding Ltd. |
22,000 | 77,351 | ||||||||||
|
|
|
|||||||||||
| 4,775,925 | ||||||||||||
|
|
|
|||||||||||
| IT Services – 1.3% |
||||||||||||
| GDS Holdings Ltd. (ADR)(b)(c) |
23,072 | 1,306,106 | ||||||||||
| Infosys Ltd. (Sponsored ADR) |
26,770 | 595,632 | ||||||||||
| Network International Holdings PLC(a)(c) |
72,705 | 355,899 | ||||||||||
| Tech Mahindra Ltd. |
5,778 | 107,083 | ||||||||||
| Wipro Ltd. |
12,482 | 106,278 | ||||||||||
|
|
|
|||||||||||
| 2,470,998 | ||||||||||||
|
|
|
|||||||||||
| 18 | AB EMERGING MARKETS MULTI-ASSET PORTFOLIO |
abfunds.com | |
PORTFOLIO OF INVESTMENTS (continued)
| Company | Shares |
U.S. $ Value | ||||||||||
|
|
||||||||||||
| Semiconductors & Semiconductor Equipment – 6.4% |
||||||||||||
| ASE Technology Holding Co., Ltd. |
26,000 | $ | 100,589 | |||||||||
| Daqo New Energy Corp. (ADR)(c) |
1,976 | 112,632 | ||||||||||
| Hangzhou Silan Microelectronics Co., Ltd. |
5,900 | 51,866 | ||||||||||
| MediaTek, Inc. |
69,000 | 2,220,936 | ||||||||||
| Novatek Microelectronics Corp. |
103,000 | 1,496,470 | ||||||||||
| Parade Technologies Ltd. |
2,000 | 117,071 | ||||||||||
| Realtek Semiconductor Corp. |
1,000 | 17,618 | ||||||||||
| Silergy Corp. |
1,000 | 145,454 | ||||||||||
| SK Hynix, Inc. |
10,552 | 903,318 | ||||||||||
| Taiwan Semiconductor Manufacturing Co., Ltd. |
221,000 | 4,570,741 | ||||||||||
| United Microelectronics Corp. |
898,000 | 2,035,541 | ||||||||||
|
|
|
|||||||||||
| 11,772,236 | ||||||||||||
|
|
|
|||||||||||
| Technology Hardware, Storage & Peripherals – 3.0% |
||||||||||||
| Asustek Computer, Inc. |
11,000 | 127,756 | ||||||||||
| Lenovo Group Ltd. |
108,000 | 140,964 | ||||||||||
| Samsung Electronics Co., Ltd. |
65,589 | 4,066,164 | ||||||||||
| Samsung Electronics Co., Ltd. (Preference Shares) |
20,050 | 1,169,691 | ||||||||||
|
|
|
|||||||||||
| 5,504,575 | ||||||||||||
|
|
|
|||||||||||
| 24,523,734 | ||||||||||||
|
|
|
|||||||||||
| Consumer Discretionary – 6.5% |
||||||||||||
| Auto Components – 0.1% |
||||||||||||
| Fuyao Glass Industry Group Co., Ltd. – Class H(a) |
16,800 | 89,359 | ||||||||||
| Hankook Tire & Technology Co., Ltd. |
527 | 19,098 | ||||||||||
|
|
|
|||||||||||
| 108,457 | ||||||||||||
|
|
|
|||||||||||
| Automobiles – 1.9% |
||||||||||||
| Dongfeng Motor Group Co., Ltd. – Class H |
248,000 | 220,844 | ||||||||||
| Ford Otomotiv Sanayi AS |
12,226 | 229,727 | ||||||||||
| Great Wall Motor Co., Ltd. – Class H |
28,000 | 103,027 | ||||||||||
| Kia Corp. |
32,061 | 2,165,289 | ||||||||||
| SAIC Motor Corp., Ltd. – Class A |
252,000 | 743,294 | ||||||||||
|
|
|
|||||||||||
| 3,462,181 | ||||||||||||
|
|
|
|||||||||||
| Hotels, Restaurants & Leisure – 1.6% |
||||||||||||
| Despegar.com Corp.(b)(c) |
39,050 | 469,771 | ||||||||||
| MakeMyTrip Ltd.(b)(c) |
18,147 | 493,417 | ||||||||||
| OPAP SA |
127,838 | 1,977,763 | ||||||||||
| Yum China Holdings, Inc. |
497 | 28,881 | ||||||||||
|
|
|
|||||||||||
| 2,969,832 | ||||||||||||
|
|
|
|||||||||||
| Internet & Direct Marketing Retail – 2.0% |
||||||||||||
| Alibaba Group Holding Ltd.(c) |
87,520 | 1,620,340 | ||||||||||
| JD.com, Inc. – Class A(c) |
44,970 | 1,621,274 | ||||||||||
| abfunds.com | AB EMERGING MARKETS MULTI-ASSET PORTFOLIO | 19 | |
PORTFOLIO OF INVESTMENTS (continued)
| Company | Shares |
U.S. $ Value | ||||||||||
|
|
||||||||||||
| momo.com, Inc. |
9,000 | $ | 521,608 | |||||||||
| Naspers Ltd. – Class N |
21 | 3,471 | ||||||||||
|
|
|
|||||||||||
| 3,766,693 | ||||||||||||
|
|
|
|||||||||||
| Specialty Retail – 0.4% |
||||||||||||
| Abu Dhabi National Oil Co. for Distribution PJSC |
90,252 | 102,214 | ||||||||||
| China Meidong Auto Holdings Ltd. |
3,866 | 19,453 | ||||||||||
| Jarir Marketing Co. |
1,937 | 108,094 | ||||||||||
| Topsports International Holdings Ltd.(a) |
299,000 | 339,575 | ||||||||||
| Zhongsheng Group Holdings Ltd. |
29,000 | 232,470 | ||||||||||
|
|
|
|||||||||||
| 801,806 | ||||||||||||
|
|
|
|||||||||||
| Textiles, Apparel & Luxury Goods – 0.5% |
||||||||||||
| ANTA Sports Products Ltd. |
14,000 | 264,369 | ||||||||||
| Li Ning Co., Ltd. |
29,500 | 340,009 | ||||||||||
| LVMH Moet Hennessy Louis Vuitton SE |
297 | 212,730 | ||||||||||
| Shenzhou International Group Holdings Ltd. |
6,000 | 127,341 | ||||||||||
|
|
|
|||||||||||
| 944,449 | ||||||||||||
|
|
|
|||||||||||
| 12,053,418 | ||||||||||||
|
|
|
|||||||||||
| Materials – 6.4% |
||||||||||||
| Chemicals – 0.9% |
||||||||||||
| Formosa Chemicals & Fibre Corp. |
3,000 | 8,975 | ||||||||||
| Nan Ya Plastics Corp. |
22,000 | 71,915 | ||||||||||
| Orbia Advance Corp. SAB de CV |
71,716 | 184,106 | ||||||||||
| Petronas Chemicals Group Bhd |
59,100 | 122,816 | ||||||||||
| PhosAgro PJSC (GDR)(a) |
5,685 | 126,662 | ||||||||||
| Saudi Basic Industries Corp. |
1,095 | 37,003 | ||||||||||
| Tosoh Corp. |
50,500 | 915,148 | ||||||||||
| Wanhua Chemical Group Co., Ltd. – Class A |
6,500 | 106,500 | ||||||||||
| Zhejiang Satellite Petrochemical Co., Ltd. |
16,289 | 97,818 | ||||||||||
|
|
|
|||||||||||
| 1,670,943 | ||||||||||||
|
|
|
|||||||||||
| Construction Materials – 0.3% |
||||||||||||
| ACC Ltd. |
3,714 | 112,213 | ||||||||||
| Ambuja Cements Ltd. |
20,177 | 108,516 | ||||||||||
| Taiwan Cement Corp. |
176,610 | 321,652 | ||||||||||
| UltraTech Cement Ltd. |
181 | 17,953 | ||||||||||
|
|
|
|||||||||||
| 560,334 | ||||||||||||
|
|
|
|||||||||||
| Metals & Mining – 5.2% |
||||||||||||
| African Rainbow Minerals Ltd. |
7,876 | 100,528 | ||||||||||
| Baoshan Iron & Steel Co., Ltd. – Class A |
46,800 | 62,668 | ||||||||||
| China Hongqiao Group Ltd. |
996,596 | 1,264,762 | ||||||||||
| Cia Siderurgica Nacional SA |
20,600 | 108,679 | ||||||||||
| CSN Mineracao SA |
403,300 | 471,748 | ||||||||||
| Eregli Demir ve Celik Fabrikalari TAS |
58,961 | 108,576 | ||||||||||
| Fortescue Metals Group Ltd. |
48,250 | 513,960 | ||||||||||
| Grupo Mexico SAB de CV |
27,543 | 109,524 | ||||||||||
| Hindalco Industries Ltd. |
260,550 | 1,705,628 | ||||||||||
| 20 | AB EMERGING MARKETS MULTI-ASSET PORTFOLIO |
abfunds.com | |
PORTFOLIO OF INVESTMENTS (continued)
| Company | Shares |
U.S. $ Value | ||||||||||
|
|
||||||||||||
| Impala Platinum Holdings Ltd. |
59,268 | $ | 667,942 | |||||||||
| Inner Mongolia BaoTou Steel Union Co., Ltd.(c) |
103,400 | 50,349 | ||||||||||
| JSW Steel Ltd. |
12,725 | 113,638 | ||||||||||
| Kumba Iron Ore Ltd. |
3,157 | 103,723 | ||||||||||
| MMC Norilsk Nickel PJSC (ADR) |
7,237 | 216,531 | ||||||||||
| Polyus PJSC (GDR)(a) |
829 | 68,106 | ||||||||||
| POSCO |
6,057 | 1,667,847 | ||||||||||
| Rio Tinto Ltd. |
3,223 | 229,449 | ||||||||||
| Southern Copper Corp. |
1,972 | 110,708 | ||||||||||
| Tata Steel Ltd. |
98,984 | 1,699,597 | ||||||||||
| Vale SA |
7,200 | 100,799 | ||||||||||
| Vedanta Ltd. |
27,987 | 107,968 | ||||||||||
|
|
|
|||||||||||
| 9,582,730 | ||||||||||||
|
|
|
|||||||||||
| 11,814,007 | ||||||||||||
|
|
|
|||||||||||
| Energy – 4.8% |
||||||||||||
| Oil, Gas & Consumable Fuels – 4.8% |
||||||||||||
| Bharat Petroleum Corp., Ltd. |
16,874 | 97,666 | ||||||||||
| China Petroleum & Chemical Corp. |
161,100 | 110,670 | ||||||||||
| China Petroleum & Chemical Corp. – Class H |
230,000 | 113,342 | ||||||||||
| China Shenhua Energy Co., Ltd. – Class A |
33,500 | 117,277 | ||||||||||
| China Shenhua Energy Co., Ltd. – Class H |
51,000 | 118,802 | ||||||||||
| Exxaro Resources Ltd. |
9,527 | 101,877 | ||||||||||
| GS Holdings Corp. |
2,862 | 106,840 | ||||||||||
| Guanghui Energy Co., Ltd.(c) |
53,793 | 71,984 | ||||||||||
| Hindustan Petroleum Corp., Ltd. |
30,343 | 122,318 | ||||||||||
| Indian Oil Corp. Ltd. |
72,153 | 120,986 | ||||||||||
| LUKOIL PJSC (Sponsored ADR) |
30,556 | 2,892,431 | ||||||||||
| MOL Hungarian Oil & Gas PLC |
14,392 | 119,566 | ||||||||||
| PetroChina Co., Ltd. – Class H |
7,002,000 | 3,279,491 | ||||||||||
| Petroleo Brasileiro SA |
23,700 | 122,509 | ||||||||||
| Polski Koncern Naftowy ORLEN SA |
36,407 | 750,082 | ||||||||||
| Polskie Gornictwo Naftowe i Gazownictwo SA |
73,880 | 120,073 | ||||||||||
| Saudi Arabian Oil Co.(a) |
12,743 | 122,206 | ||||||||||
| Shaanxi Coal Industry Co., Ltd. |
48,500 | 110,776 | ||||||||||
| Yanzhou Coal Mining Co., Ltd. |
23,200 | 103,578 | ||||||||||
| Yanzhou Coal Mining Co., Ltd. – Class H |
60,000 | 113,144 | ||||||||||
|
|
|
|||||||||||
| 8,815,618 | ||||||||||||
|
|
|
|||||||||||
| Communication Services – 2.7% |
||||||||||||
| Diversified Telecommunication Services – 0.3% |
||||||||||||
| Chunghwa Telecom Co., Ltd. |
17,000 | 67,346 | ||||||||||
| Emirates Telecommunications Group Co. PJSC |
17,537 | 114,638 | ||||||||||
| LG Uplus Corp. |
9,024 | 113,438 | ||||||||||
| MultiChoice Group |
11,428 | 86,643 | ||||||||||
| Sarana Menara Nusantara Tbk PT |
310,000 | 28,571 | ||||||||||
| abfunds.com | AB EMERGING MARKETS MULTI-ASSET PORTFOLIO | 21 | |
PORTFOLIO OF INVESTMENTS (continued)
| Company | Shares |
U.S. $ Value | ||||||||||
|
|
||||||||||||
| Telekom Malaysia Bhd |
81,700 | $ | 111,165 | |||||||||
| Tower Bersama Infrastructure Tbk PT |
161,000 | 33,175 | ||||||||||
|
|
|
|||||||||||
| 554,976 | ||||||||||||
|
|
|
|||||||||||
| Interactive Media & Services – 2.0% |
||||||||||||
| NAVER Corp. |
3,993 | 1,295,597 | ||||||||||
| Tencent Holdings Ltd. |
40,500 | 2,417,800 | ||||||||||
| Weibo Corp. (Sponsored ADR)(c) |
1,233 | 58,555 | ||||||||||
|
|
|
|||||||||||
| 3,771,952 | ||||||||||||
|
|
|
|||||||||||
| Media – 0.1% |
||||||||||||
| Cheil Worldwide, Inc. |
5,860 | 111,924 | ||||||||||
|
|
|
|||||||||||
| Wireless Telecommunication Services – 0.3% |
||||||||||||
| America Movil SAB de CV |
37,116 | 32,852 | ||||||||||
| Globe Telecom, Inc. |
1,720 | 100,617 | ||||||||||
| PLDT, Inc. |
2,770 | 91,229 | ||||||||||
| SK Telecom Co., Ltd.(c) |
438 | 118,968 | ||||||||||
| Taiwan Mobile Co., Ltd. |
5,000 | 17,733 | ||||||||||
| Turkcell Iletisim Hizmetleri AS |
12,145 | 20,839 | ||||||||||
| Vodacom Group Ltd. |
12,162 | 116,332 | ||||||||||
|
|
|
|||||||||||
| 498,570 | ||||||||||||
|
|
|
|||||||||||
| 4,937,422 | ||||||||||||
|
|
|
|||||||||||
| Industrials – 2.2% |
||||||||||||
| Aerospace & Defense – 0.1% |
||||||||||||
| Bharat Electronics Ltd. |
41,015 | 111,142 | ||||||||||
|
|
|
|||||||||||
| Commercial Services & Supplies – 0.3% |
||||||||||||
| China Everbright Environment Group Ltd. |
149,000 | 111,968 | ||||||||||
| Sunny Friend Environmental Technology Co., Ltd. |
52,000 | 367,567 | ||||||||||
|
|
|
|||||||||||
| 479,535 | ||||||||||||
|
|
|
|||||||||||
| Electrical Equipment – 0.1% |
||||||||||||
| Havells India Ltd. |
5,877 | 108,318 | ||||||||||
| TBEA Co., Ltd. – Class A |
29,600 | 110,360 | ||||||||||
|
|
|
|||||||||||
| 218,678 | ||||||||||||
|
|
|
|||||||||||
| Industrial Conglomerates – 0.4% |
||||||||||||
| CITIC Ltd. |
95,000 | 100,580 | ||||||||||
| Industries Qatar QSC |
33,121 | 140,544 | ||||||||||
| KOC Holding AS |
42,089 | 107,056 | ||||||||||
| Refrigeration Electrical Engineering Corp.(c) |
107,680 | 306,998 | ||||||||||
| Siemens Ltd. |
1,952 | 55,878 | ||||||||||
| Sime Darby Bhd |
128,500 | 69,675 | ||||||||||
|
|
|
|||||||||||
| 780,731 | ||||||||||||
|
|
|
|||||||||||
| 22 | AB EMERGING MARKETS MULTI-ASSET PORTFOLIO |
abfunds.com | |
PORTFOLIO OF INVESTMENTS (continued)
| Company | Shares |
U.S. $ Value | ||||||||||
|
|
||||||||||||
| Machinery – 0.2% |
||||||||||||
| China Yuchai International Ltd. |
23,050 | $ | 313,250 | |||||||||
| Haitian International Holdings Ltd. |
31,000 | 96,182 | ||||||||||
|
|
|
|||||||||||
| 409,432 | ||||||||||||
|
|
|
|||||||||||
| Marine – 0.2% |
||||||||||||
| COSCO SHIPPING Holdings Co., Ltd.(c) |
33,930 | 89,873 | ||||||||||
| COSCO Holdings Co., Ltd. – Class H(b)(c) |
61,100 | 92,715 | ||||||||||
| Evergreen Marine Corp. Taiwan Ltd. |
19,000 | 84,408 | ||||||||||
| Pan Ocean Co., Ltd. |
17,613 | 110,568 | ||||||||||
|
|
|
|||||||||||
| 377,564 | ||||||||||||
|
|
|
|||||||||||
| Professional Services – 0.7% |
||||||||||||
| HeadHunter Group PLC (ADR) |
25,320 | 1,235,616 | ||||||||||
|
|
|
|||||||||||
| Trading Companies & Distributors – 0.0% |
||||||||||||
| Adani Enterprises Ltd. |
889 | 17,477 | ||||||||||
|
|
|
|||||||||||
| Transportation Infrastructure – 0.2% |
||||||||||||
| China Merchants Port Holdings Co., Ltd. |
68,000 | 116,281 | ||||||||||
| International Container Terminal Services, Inc. |
29,500 | 112,772 | ||||||||||
| Shanghai International Port Group Co., Ltd. |
116,100 | 109,407 | ||||||||||
| Zhejiang Expressway Co., Ltd. – Class H |
136,000 | 112,159 | ||||||||||
|
|
|
|||||||||||
| 450,619 | ||||||||||||
|
|
|
|||||||||||
| 4,080,794 | ||||||||||||
|
|
|
|||||||||||
| Real Estate – 2.1% |
||||||||||||
| Equity Real Estate Investment Trusts (REITs) – 0.7% |
||||||||||||
| Fibra Uno Administracion SA de CV |
1,203,550 | 1,369,638 | ||||||||||
|
|
|
|||||||||||
| Real Estate Management & Development – 1.4% |
||||||||||||
| A-Living Smart City Services Co., Ltd. – Class H(a) |
262,750 | 933,086 | ||||||||||
| Agile Group Holdings Ltd. |
144,000 | 134,296 | ||||||||||
| Aldar Properties PJSC |
100,214 | 110,769 | ||||||||||
| China Aoyuan Group Ltd. |
107,000 | 56,402 | ||||||||||
| Country Garden Services Holdings Co., Ltd. |
23,000 | 181,745 | ||||||||||
| Hopson Development Holdings Ltd. |
33,400 | 118,923 | ||||||||||
| Logan Group Co. Ltd. |
10,000 | 10,436 | ||||||||||
| Longfor Properties Co., Ltd.(a) |
106,500 | 486,608 | ||||||||||
| Powerlong Real Estate Holdings Ltd. |
148,000 | 111,558 | ||||||||||
| Vincom Retail JSC(c) |
308,840 | 394,094 | ||||||||||
|
|
|
|||||||||||
| 2,537,917 | ||||||||||||
|
|
|
|||||||||||
| 3,907,555 | ||||||||||||
|
|
|
|||||||||||
| abfunds.com | AB EMERGING MARKETS MULTI-ASSET PORTFOLIO | 23 | |
PORTFOLIO OF INVESTMENTS (continued)
| Company | Shares |
U.S. $ Value | ||||||||||
|
|
||||||||||||
| Utilities – 2.0% |
||||||||||||
| Electric Utilities – 0.8% |
||||||||||||
| Centrais Eletricas Brasileiras SA |
16,100 | $ | 113,852 | |||||||||
| CEZ AS |
3,513 | 114,416 | ||||||||||
| Cia Energetica de Minas Gerais (Preference Shares) |
11,900 | 30,658 | ||||||||||
| CPFL Energia SA |
21,600 | 106,815 | ||||||||||
| Equatorial Energia SA |
161,200 | 750,387 | ||||||||||
| Manila Electric Co. |
11,230 | 65,420 | ||||||||||
| Power Grid Corp. of India Ltd. |
102,327 | 260,155 | ||||||||||
|
|
|
|||||||||||
| 1,441,703 | ||||||||||||
|
|
|
|||||||||||
| Gas Utilities – 1.2% |
||||||||||||
| Beijing Enterprises Holdings Ltd. |
14,500 | 57,877 | ||||||||||
| GAIL India Ltd. |
947,977 | 2,018,138 | ||||||||||
| Petronas Gas Bhd |
7,700 | 30,936 | ||||||||||
|
|
|
|||||||||||
| 2,106,951 | ||||||||||||
|
|
|
|||||||||||
| Independent Power and Renewable Electricity Producers – 0.0% |
||||||||||||
| NTPC Ltd. |
17,371 | 33,073 | ||||||||||
|
|
|
|||||||||||
| 3,581,727 | ||||||||||||
|
|
|
|||||||||||
| Consumer Staples – 1.3% |
||||||||||||
| Beverages – 0.4% |
||||||||||||
| Coca-Cola Femsa SAB de CV |
16,361 | 92,357 | ||||||||||
| Tsingtao Brewery Co., Ltd. – Class A |
62,100 | 771,661 | ||||||||||
|
|
|
|||||||||||
| 864,018 | ||||||||||||
|
|
|
|||||||||||
| Food & Staples Retailing – 0.3% |
||||||||||||
| Atacadao SA |
24,300 | 79,249 | ||||||||||
| Magnit PJSC (Sponsored GDR)(a) |
7,323 | 123,392 | ||||||||||
| SPAR Group Ltd. (The) |
8,230 | 107,349 | ||||||||||
| X5 Retail Group NV (GDR)(a) |
8,020 | 260,409 | ||||||||||
|
|
|
|||||||||||
| 570,399 | ||||||||||||
|
|
|
|||||||||||
| Food Products – 0.1% |
||||||||||||
| JBS SA |
18,400 | 125,251 | ||||||||||
|
|
|
|||||||||||
| Household Products – 0.4% |
||||||||||||
| C&S Paper Co., Ltd. |
268,400 | 717,163 | ||||||||||
|
|
|
|||||||||||
| Personal Products – 0.1% |
||||||||||||
| Colgate-Palmolive India Ltd. |
4,788 | 107,779 | ||||||||||
|
|
|
|||||||||||
| Tobacco – 0.0% |
||||||||||||
| Eastern Co. SAE |
75,006 | 58,402 | ||||||||||
|
|
|
|||||||||||
| 2,443,012 | ||||||||||||
|
|
|
|||||||||||
| 24 | AB EMERGING MARKETS MULTI-ASSET PORTFOLIO |
abfunds.com | |
PORTFOLIO OF INVESTMENTS (continued)
| Company | Shares |
U.S. $ Value | ||||||||||
|
|
||||||||||||
| Health Care – 1.3% |
||||||||||||
| Biotechnology – 0.1% |
||||||||||||
| I-Mab (Sponsored ADR)(c) |
577 | $ | 41,827 | |||||||||
| SK Bioscience Co., Ltd.(c) |
466 | 106,463 | ||||||||||
|
|
|
|||||||||||
| 148,290 | ||||||||||||
|
|
|
|||||||||||
| Health Care Providers & Services – 0.3% |
||||||||||||
| Apollo Hospitals Enterprise Ltd. |
1,696 | 101,985 | ||||||||||
| Universal Vision Biotechnology Co., Ltd. |
45,000 | 494,538 | ||||||||||
|
|
|
|||||||||||
| 596,523 | ||||||||||||
|
|
|
|||||||||||
| Life Sciences Tools & Services – 0.1% |
||||||||||||
| Divi’s Laboratories Ltd. |
1,618 | 104,495 | ||||||||||
| Wuxi Biologics Cayman, Inc.(a)(c) |
7,000 | 113,542 | ||||||||||
|
|
|
|||||||||||
| 218,037 | ||||||||||||
|
|
|
|||||||||||
| Pharmaceuticals – 0.8% |
||||||||||||
| China Medical System Holdings Ltd. |
343,000 | 625,114 | ||||||||||
| Genomma Lab Internacional SAB de CV – Class B(c) |
434,970 | 413,023 | ||||||||||
| Richter Gedeon Nyrt |
10,720 | 293,162 | ||||||||||
| Shanghai Fosun Pharmaceutical Group Co., Ltd. – Class H |
14,500 | 74,230 | ||||||||||
|
|
|
|||||||||||
| 1,405,529 | ||||||||||||
|
|
|
|||||||||||
| 2,368,379 | ||||||||||||
|
|
|
|||||||||||
| Total Common Stocks |
104,064,411 | |||||||||||
|
|
|
|||||||||||
| Principal Amount (000) |
||||||||||||
| FIXED INCOME – 37.3% |
||||||||||||
| Sovereign Bonds – 20.3% |
||||||||||||
| Angolan Government International Bond |
U.S.$ | 979 | 991,205 | |||||||||
| 9.375%, 05/08/2048(a) |
448 | 460,824 | ||||||||||
| Argentine Republic Government International Bond |
1,789 | 653,121 | ||||||||||
| 1.00%, 07/09/2029 |
236 | 90,496 | ||||||||||
| 1.125%, 07/09/2035 |
2,792 | 910,298 | ||||||||||
| 2.00%, 01/09/2038 |
1,249 | 481,452 | ||||||||||
| 2.50%, 07/09/2041 |
210 | 76,538 | ||||||||||
| Bahamas Government International Bond |
319 | 296,670 | ||||||||||
| Bahrain Government International Bond |
200 | 198,163 | ||||||||||
| 6.00%, 09/19/2044(a) |
480 | 441,090 | ||||||||||
| abfunds.com | AB EMERGING MARKETS MULTI-ASSET PORTFOLIO | 25 | |
PORTFOLIO OF INVESTMENTS (continued)
| Principal Amount (000) |
U.S. $ Value | |||||||||
|
|
||||||||||
| 6.75%, 09/20/2029(a) |
U.S.$ | 244 | $ | 261,355 | ||||||
| 7.00%, 10/12/2028(a) |
334 | 364,895 | ||||||||
| Colombia Government International Bond |
950 | 888,131 | ||||||||
| 3.25%, 04/22/2032 |
535 | 498,352 | ||||||||
| 5.00%, 06/15/2045 |
302 | 294,035 | ||||||||
| 6.125%, 01/18/2041 |
260 | 285,967 | ||||||||
| Dominican Republic International Bond |
100 | 109,206 | ||||||||
| 5.875%, 01/30/2060(a) |
377 | 368,117 | ||||||||
| 6.40%, 06/05/2049(a) |
364 | 385,453 | ||||||||
| 6.50%, 02/15/2048(a) |
298 | 318,357 | ||||||||
| Ecuador Government International Bond |
106 | 55,250 | ||||||||
| 0.50%, 07/31/2040(a) |
446 | 258,509 | ||||||||
| 1.00%, 07/31/2035(a) |
900 | 596,889 | ||||||||
| 5.00%, 07/31/2030(a) |
860 | 719,952 | ||||||||
| Egypt Government International Bond |
359 | 335,665 | ||||||||
| 5.875%, 06/11/2025(a) |
313 | 322,359 | ||||||||
| 7.30%, 09/30/2033(a) |
217 | 209,676 | ||||||||
| 7.50%, 02/16/2061(a) |
253 | 220,110 | ||||||||
| 7.60%, 03/01/2029(a) |
302 | 311,060 | ||||||||
| 7.903%, 02/21/2048(a) |
300 | 271,500 | ||||||||
| 8.15%, 11/20/2059(a) |
585 | 535,275 | ||||||||
| 8.50%, 01/31/2047(a) |
305 | 292,037 | ||||||||
| 8.875%, 05/29/2050(a) |
211 | 207,856 | ||||||||
| El Salvador Government International Bond |
87 | 67,208 | ||||||||
| 6.375%, 01/18/2027(a) |
294 | 219,765 | ||||||||
| 7.125%, 01/20/2050(a) |
938 | 647,220 | ||||||||
| 7.65%, 06/15/2035(a) |
57 | 41,610 | ||||||||
| 7.75%, 01/24/2023(a) |
63 | 53,235 | ||||||||
| 8.625%, 02/28/2029(a) |
226 | 174,585 | ||||||||
| Gabon Government International Bond |
200 | 196,475 | ||||||||
| Ghana Government International Bond |
243 | 230,850 | ||||||||
| 7.875%, 03/26/2027-02/11/2035(a) |
936 | 860,733 | ||||||||
| 8.125%, 03/26/2032(a) |
200 | 189,038 | ||||||||
| 8.627%, 06/16/2049(a) |
432 | 386,181 | ||||||||
| 8.95%, 03/26/2051(a) |
200 | 182,038 | ||||||||
| Honduras Government International Bond |
290 | 305,461 | ||||||||
| Indonesia Government International Bond |
200 | 206,225 | ||||||||
| 4.125%, 01/15/2025(a) |
380 | 415,619 | ||||||||
| 4.20%, 10/15/2050 |
340 | 376,295 | ||||||||
| 26 | AB EMERGING MARKETS MULTI-ASSET PORTFOLIO |
abfunds.com | |
PORTFOLIO OF INVESTMENTS (continued)
| Principal Amount (000) |
U.S. $ Value | |||||||||||
|
|
||||||||||||
| Ivory Coast Government International Bond |
U.S.$ | 1,058 | $ | 1,114,405 | ||||||||
| 6.375%, 03/03/2028(a) |
295 | 324,002 | ||||||||||
| Jamaica Government International Bond |
200 | 232,788 | ||||||||||
| 8.00%, 03/15/2039 |
108 | 151,200 | ||||||||||
| Lebanon Government International Bond |
36 | 5,940 | ||||||||||
| 6.65%, 04/22/2024(a)(c)(d) |
57 | 9,405 | ||||||||||
| 6.85%, 03/23/2027(a)(c)(d) |
481 | 79,365 | ||||||||||
| Series E |
216 | 35,640 | ||||||||||
| Series G |
206 | 33,990 | ||||||||||
| 6.60%, 11/27/2026(a)(c)(d) |
170 | 28,050 | ||||||||||
| Mexico Government International Bond |
140 | 148,864 | ||||||||||
| 5.00%, 04/27/2051 |
249 | 273,091 | ||||||||||
| Mongolia Government International Bond |
200 | 209,725 | ||||||||||
| Nigeria Government International Bond |
401 | 401,501 | ||||||||||
| 6.50%, 11/28/2027(a) |
272 | 280,891 | ||||||||||
| 7.375%, 09/28/2033(a) |
363 | 365,722 | ||||||||||
| 7.625%, 11/28/2047(a) |
633 | 607,403 | ||||||||||
| 7.696%, 02/23/2038(a) |
240 | 236,295 | ||||||||||
| 8.25%, 09/28/2051(a) |
200 | 201,250 | ||||||||||
| Oman Government International Bond |
205 | 212,598 | ||||||||||
| 5.625%, 01/17/2028(a) |
211 | 219,176 | ||||||||||
| 6.50%, 03/08/2047(a) |
294 | 282,754 | ||||||||||
| 6.75%, 01/17/2048(a) |
616 | 607,261 | ||||||||||
| Pakistan Government International Bond |
325 | 325,670 | ||||||||||
| 7.375%, 04/08/2031(a) |
422 | 420,464 | ||||||||||
| Panama Bonos del Tesoro |
350 | 354,266 | ||||||||||
| Panama Government International Bond |
447 | 460,773 | ||||||||||
| 3.87%, 07/23/2060 |
290 | 283,076 | ||||||||||
| 4.00%, 09/22/2024 |
200 | 215,225 | ||||||||||
| Panama Notas del Tesoro |
400 | 426,575 | ||||||||||
| Paraguay Government International Bond |
208 | 234,039 | ||||||||||
| Perusahaan Penerbit SBSN Indonesia III |
200 | 223,413 | ||||||||||
| abfunds.com | AB EMERGING MARKETS MULTI-ASSET PORTFOLIO | 27 | |
PORTFOLIO OF INVESTMENTS (continued)
| Principal Amount (000) |
U.S. $ Value | |||||||||||
|
|
||||||||||||
| Peruvian Government International Bond |
U.S.$ | 148 | $ | 122,822 | ||||||||
| Philippine Government International Bond |
281 | 276,465 | ||||||||||
| Qatar Government International Bond |
864 | 1,050,840 | ||||||||||
| 4.50%, 04/23/2028(a) |
300 | 349,837 | ||||||||||
| 5.103%, 04/23/2048(a) |
239 | 316,720 | ||||||||||
| Republic of Guatemala |
215 | 209,535 | ||||||||||
| Republic of Kenya Government International Bond |
346 | 381,205 | ||||||||||
| Republic of South Africa Government International Bond |
550 | 576,154 | ||||||||||
| 5.00%, 10/12/2046 |
460 | 405,950 | ||||||||||
| Romanian Government International Bond |
210 | 208,661 | ||||||||||
| Russian Foreign Bond – Eurobond |
800 | 1,014,150 | ||||||||||
| 5.625%, 04/04/2042(a) |
200 | 258,914 | ||||||||||
| Saudi Government International Bond |
260 | 277,940 | ||||||||||
| 4.625%, 10/04/2047(a) |
310 | 363,862 | ||||||||||
| 5.25%, 01/16/2050(a) |
201 | 259,793 | ||||||||||
| Senegal Government International Bond |
EUR | 400 | 482,250 | |||||||||
| 6.75%, 03/13/2048(a) |
U.S.$ | 200 | 201,725 | |||||||||
| Sri Lanka Government International Bond |
200 | 121,475 | ||||||||||
| 7.85%, 03/14/2029(a) |
240 | 146,070 | ||||||||||
| Turkey Government International Bond |
893 | 692,134 | ||||||||||
| Ukraine Government International Bond |
EUR | 173 | 217,278 | |||||||||
| 6.876%, 05/21/2029(a) |
U.S.$ | 284 | 287,692 | |||||||||
| 7.75%, 09/01/2023-09/01/2026(a) |
1,167 | 1,255,878 | ||||||||||
| Series GDP |
638 | 692,549 | ||||||||||
| Uruguay Government International Bond |
149 | 171,704 | ||||||||||
| 4.975%, 04/20/2055 |
17 | 21,809 | ||||||||||
| 5.10%, 06/18/2050 |
49 | 62,315 | ||||||||||
| Venezuela Government International Bond |
265 | 26,781 | ||||||||||
| 12.75%, 08/23/2022(a)(c)(d) |
564 | 56,410 | ||||||||||
| 28 | AB EMERGING MARKETS MULTI-ASSET PORTFOLIO |
abfunds.com | |
PORTFOLIO OF INVESTMENTS (continued)
| Principal Amount (000) |
U.S. $ Value | |||||||||||
|
|
||||||||||||
| Zambia Government International Bond |
U.S.$ | 825 | $ | 635,250 | ||||||||
|
|
|
|||||||||||
| Total Sovereign Bonds |
37,411,386 | |||||||||||
|
|
|
|||||||||||
| Corporate Bonds – 7.9% |
||||||||||||
| AES Gener SA |
200 | 210,804 | ||||||||||
| AES Panama Generation Holdings SRL |
315 | 324,765 | ||||||||||
| Alfa Desarrollo SpA |
365 | 355,419 | ||||||||||
| Bangkok Bank PCL/Hong Kong |
200 | 203,345 | ||||||||||
| Bidvest Group UK PLC (The) |
365 | 365,512 | ||||||||||
| Braskem Idesa SAPI |
219 | 231,702 | ||||||||||
| Cemex SAB de CV |
251 | 254,137 | ||||||||||
| 7.375%, 06/05/2027(a) |
200 | 221,548 | ||||||||||
| Cemig Geracao e Transmissao SA |
200 | 225,750 | ||||||||||
| Central American Bottling Corp. |
135 | 138,527 | ||||||||||
| Central China Real Estate Ltd. |
260 | 158,275 | ||||||||||
| Chile Electricity Pec SpA |
446 | 363,574 | ||||||||||
| China Aoyuan Group Ltd. |
260 | 196,300 | ||||||||||
| Cia de Minas Buenaventura SAA |
216 | 212,582 | ||||||||||
| Colbun SA |
263 | 285,897 | ||||||||||
| CSN Resources SA |
287 | 283,594 | ||||||||||
| Digicel Group Holdings Ltd. |
16 | 13,343 | ||||||||||
| 8.00% (5.00% Cash and 3.00% PIK), 04/01/2025(a)(f) |
99 | 87,552 | ||||||||||
| 10.00% (8.00% Cash and 2.00% PIK), 04/01/2024(f) |
267 | 267,129 | ||||||||||
| Ecopetrol SA |
401 | 468,368 | ||||||||||
| 7.375%, 09/18/2043 |
185 | 215,294 | ||||||||||
| Embraer Netherlands Finance BV |
155 | 165,172 | ||||||||||
| abfunds.com | AB EMERGING MARKETS MULTI-ASSET PORTFOLIO | 29 | |
PORTFOLIO OF INVESTMENTS (continued)
| Principal Amount (000) |
U.S. $ Value | |||||||||
|
|
||||||||||
| Empresa Electrica Cochrane SpA |
U.S.$ | 170 | $ | 174,566 | ||||||
| Empresas Publicas de Medellin ESP |
200 | 198,775 | ||||||||
| 8.375%, 11/08/2027 |
COP | 418,000 | 103,120 | |||||||
| Gran Tierra Energy International Holdings Ltd. |
U.S.$ | 400 | 347,908 | |||||||
| Gran Tierra Energy, Inc. |
200 | 173,282 | ||||||||
| Grupo Energia Bogota SA ESP |
268 | 301,215 | ||||||||
| Huarong Finance II Co., Ltd. |
861 | 839,475 | ||||||||
| 5.50%, 01/16/2025(a) |
427 | 421,662 | ||||||||
| Indika Energy Capital IV Pte Ltd. |
250 | 260,000 | ||||||||
| Industrias Penoles SAB de CV |
200 | 218,727 | ||||||||
| Infraestructura Energetica Nova SAB de CV |
334 | 357,338 | ||||||||
| Intercorp Financial Services, Inc. |
200 | 202,350 | ||||||||
| Intercorp Peru Ltd. |
200 | 194,750 | ||||||||
| Klabin Austria GmbH |
359 | 343,833 | ||||||||
| Kosmos Energy Ltd. |
200 | 193,663 | ||||||||
| Leviathan Bond Ltd. |
87 | 96,820 | ||||||||
| Lima Metro Line 2 Finance Ltd. |
342 | 363,762 | ||||||||
| Minejesa Capital BV |
215 | 228,499 | ||||||||
| Nexa Resources SA |
329 | 362,765 | ||||||||
| Odebrecht Holdco Finance Ltd. |
132 | 2,183 | ||||||||
| OEC Finance Ltd. |
113 | 9,797 | ||||||||
| Oleoducto Central SA |
285 | 291,733 | ||||||||
| Peru LNG SRL |
294 | 235,935 | ||||||||
| Petrobras Global Finance BV |
158 | 199,515 | ||||||||
| Prosus NV |
318 | 328,991 | ||||||||
| Scenery Journey Ltd. |
205 | 37,925 | ||||||||
| 30 | AB EMERGING MARKETS MULTI-ASSET PORTFOLIO |
abfunds.com | |
PORTFOLIO OF INVESTMENTS (continued)
| Principal Amount (000) |
U.S. $ Value | |||||||||||
|
|
||||||||||||
| SEPLAT Petroleum Development Co. PLC |
U.S.$ | 200 | $ | 208,500 | ||||||||
| SierraCol Energy Andina LLC |
200 | 196,027 | ||||||||||
| Suzano Austria GmbH |
112 | 115,169 | ||||||||||
| Tengizchevroil Finance Co. International Ltd. |
305 | 309,126 | ||||||||||
| Tonon Luxembourg SA |
105 | 1,060 | ||||||||||
| TransJamaican Highway Ltd. |
158 | 158,726 | ||||||||||
| Transportadora de Gas Internacional SA ESP 5.55%, 11/01/2028(a) |
200 | 226,360 | ||||||||||
| Tullow Oil PLC |
238 | 248,758 | ||||||||||
| Vedanta Resources Finance II PLC |
355 | 382,844 | ||||||||||
| Virgolino de Oliveira Finance SA |
202 | 1,010 | ||||||||||
| Volcan Cia Minera SAA |
282 | 274,209 | ||||||||||
| Xiaomi Best Time International Ltd. |
215 | 212,958 | ||||||||||
| Yuzhou Group Holdings Co., Ltd. |
260 | 168,371 | ||||||||||
| Zorlu Yenilenebilir Enerji AS |
285 | 279,300 | ||||||||||
|
|
|
|||||||||||
| Total Corporate Bonds |
14,519,596 | |||||||||||
|
|
|
|||||||||||
| Quasi-Sovereign Bonds – 6.4% |
||||||||||||
| Aeropuerto Internacional de Tocumen SA |
306 | 311,221 | ||||||||||
| Comision Federal de Electricidad |
200 | 196,225 | ||||||||||
| 4.677%, 02/09/2051(a) |
200 | 191,912 | ||||||||||
| 5.00%, 09/29/2036(a) |
237 | 248,850 | ||||||||||
| Corp. Nacional del Cobre de Chile |
200 | 213,700 | ||||||||||
| DP World Ltd./United Arab Emirates |
200 | 217,710 | ||||||||||
| Empresa de Transporte de Pasajeros Metro SA |
200 | 216,050 | ||||||||||
| 5.00%, 01/25/2047(a) |
200 | 239,662 | ||||||||||
| Eskom Holdings SOC Ltd. |
304 | 323,570 | ||||||||||
| 7.125%, 02/11/2025(a) |
485 | 503,733 | ||||||||||
| abfunds.com | AB EMERGING MARKETS MULTI-ASSET PORTFOLIO | 31 | |
PORTFOLIO OF INVESTMENTS (continued)
| Principal Amount (000) |
U.S. $ Value | |||||||||
|
|
||||||||||
| Indonesia Asahan Aluminium Persero PT |
U.S.$ | 200 | $ | 233,350 | ||||||
| KazMunayGas National Co. JSC |
200 | 239,500 | ||||||||
| 6.375%, 10/24/2048(a) |
200 | 256,000 | ||||||||
| Lamar Funding Ltd. |
364 | 364,723 | ||||||||
| NAK Naftogaz Ukraine via Kondor Finance PLC |
200 | 198,475 | ||||||||
| Oil and Gas Holding Co. BSCC (The) |
200 | 218,423 | ||||||||
| 7.625%, 11/07/2024(a) |
200 | 218,690 | ||||||||
| Pertamina Persero PT |
200 | 236,500 | ||||||||
| Perusahaan Perseroan Persero PT Perusahaan Listrik Negara |
1,399 | 1,431,352 | ||||||||
| 3.875%, 07/17/2029(a) |
200 | 211,740 | ||||||||
| 5.45%, 05/21/2028(a) |
220 | 255,379 | ||||||||
| Petroleos de Venezuela SA |
226 | 12,414 | ||||||||
| 6.00%, 11/15/2026(a)(c)(d) |
220 | 12,100 | ||||||||
| 9.00%, 11/17/2021(a)(c)(d) |
128 | 7,064 | ||||||||
| Petroleos Mexicanos |
321 | 310,375 | ||||||||
| 6.50%, 03/13/2027 |
154 | 161,700 | ||||||||
| 6.75%, 09/21/2047 |
408 | 353,471 | ||||||||
| 6.84%, 01/23/2030 |
655 | 673,274 | ||||||||
| 6.875%, 08/04/2026 |
60 | 64,956 | ||||||||
| 6.95%, 01/28/2060 |
979 | 848,206 | ||||||||
| Petronas Capital Ltd. |
395 | 482,863 | ||||||||
| 4.80%, 04/21/2060(a) |
395 | 512,366 | ||||||||
| Qatar Petroleum |
386 | 388,577 | ||||||||
| Sinopec Group Overseas Development 2018 Ltd. |
347 | 354,582 | ||||||||
| State Agency of Roads of Ukraine |
360 | 355,500 | ||||||||
| State Oil Co. of the Azerbaijan Republic |
321 | 394,348 | ||||||||
| State Savings Bank of Ukraine Via SSB #1 PLC |
84 | 91,140 | ||||||||
| Trinidad Generation UnLtd. |
200 | 205,162 | ||||||||
|
|
|
|||||||||
| Total Quasi-Sovereign Bonds |
11,754,863 | |||||||||
|
|
|
|||||||||
|
32 | AB EMERGING MARKETS MULTI-ASSET PORTFOLIO |
abfunds.com | |
PORTFOLIO OF INVESTMENTS (continued)
| Principal Amount (000) |
U.S. $ Value | |||||||||||
|
|
||||||||||||
| Emerging Markets - Treasuries – 1.5% |
||||||||||||
| Egypt Government Bond |
EGP | 11,243 | $ | 690,321 | ||||||||
| Series 7Y |
5,777 | 353,020 | ||||||||||
| Republic of South Africa Government Bond |
ZAR | 15,823 | 976,223 | |||||||||
| Series 2048 |
5,703 | 311,716 | ||||||||||
| Series R213 |
9,326 | 521,019 | ||||||||||
|
|
|
|||||||||||
| Total Emerging Markets - Treasuries |
2,852,299 | |||||||||||
|
|
|
|||||||||||
| Treasury Bonds – 1.2% |
||||||||||||
| Bonos de Tesoreria |
U.S.$ | 3,414 | 798,049 | |||||||||
| Mexican Bonos |
MXN | 12,154 | 593,781 | |||||||||
| Peru Government Bond |
PEN | 2,030 | 491,708 | |||||||||
| Russian Federal Bond – OFZ |
RUB | 24,167 | 341,642 | |||||||||
|
|
|
|||||||||||
| Total Treasury Bonds |
2,225,180 | |||||||||||
|
|
|
|||||||||||
| Regional Bonds – 0.0% |
||||||||||||
| Provincia de Neuquen Argentina |
U.S.$ | 70 | 43,270 | |||||||||
|
|
|
|||||||||||
| Total Fixed Income |
68,806,594 | |||||||||||
|
|
|
|||||||||||
| Shares | ||||||||||||
| EQUITY LINKED NOTES – 1.0% |
||||||||||||
| Information Technology – 1.0% |
||||||||||||
| Electronic Equipment, Instruments & Components – 1.0% |
||||||||||||
| FPT Corp., Macquarie Bank Ltd., expiring 04/05/2023(c) |
466,131 | 1,904,666 | ||||||||||
|
|
|
|||||||||||
| abfunds.com | AB EMERGING MARKETS MULTI-ASSET PORTFOLIO | 33 | |
PORTFOLIO OF INVESTMENTS (continued)
| Company |
Shares |
U.S. $ Value | ||||||||||
|
|
||||||||||||
| INVESTMENT COMPANIES – 0.1% |
||||||||||||
| Funds and Investment Trusts – 0.1% |
||||||||||||
| VFMVN30 ETF Fund(c)(j) |
239,030 | $ | 257,426 | |||||||||
|
|
|
|||||||||||
| SHORT-TERM INVESTMENTS – 3.5% |
||||||||||||
| Investment Companies – 3.1% |
||||||||||||
| AB Fixed Income Shares, Inc. – Government Money Market Portfolio – Class AB, 0.01%(j)(k)(l) |
5,704,068 | 5,704,068 | ||||||||||
|
|
|
|||||||||||
| Principal Amount (000) |
||||||||||||
| Time Deposits – 0.4% |
||||||||||||
| BBH, Grand Cayman |
AUD | 113 | 82,012 | |||||||||
| 0.00%, 10/01/2021 |
CAD | 1 | 622 | |||||||||
| 3.50%, 10/01/2021 |
ZAR | 116 | 7,712 | |||||||||
| Citibank, London |
EUR | 8 | 9,239 | |||||||||
| 0.00%, 10/01/2021 |
GBP | 3 | 4,396 | |||||||||
| Hong Kong & Shanghai Bank, Hong Kong |
HKD | 321 | 41,298 | |||||||||
| Hong Kong & Shanghai Bank, Singapore |
SGD | 1 | 664 | |||||||||
| Nordea Bank Norge, Oslo |
NOK | 2 | 198 | |||||||||
| SEB, Stockholm |
SEK | 9 | 1,061 | |||||||||
| Sumitomo Trust Bank, London |
U.S.$ | 535 | 534,955 | |||||||||
| Sumitomo, Tokyo |
JPY | 5,002 | 44,944 | |||||||||
|
|
|
|||||||||||
| Total Time Deposits |
727,101 | |||||||||||
|
|
|
|||||||||||
| Total Short-Term Investments |
6,431,169 | |||||||||||
|
|
|
|||||||||||
| Total Investments Before Security Lending Collateral for Securities Loaned – 98.3% |
181,464,266 | |||||||||||
|
|
|
|||||||||||
|
34 | AB EMERGING MARKETS MULTI-ASSET PORTFOLIO |
abfunds.com | |
PORTFOLIO OF INVESTMENTS (continued)
| Company |
Shares |
U.S. $ Value | ||||||||||
|
|
||||||||||||
| INVESTMENTS OF CASH COLLATERAL FOR SECURITIES LOANED – 0.8% |
||||||||||||
| Investment Companies – 0.8% |
||||||||||||
| AB Fixed Income Shares, Inc. – Government Money Market Portfolio Class AB, 0.01%(j)(k)(l) |
1,512,481 | $ | 1,512,481 | |||||||||
|
|
|
|||||||||||
| Total Investments – 99.1% |
182,976,747 | |||||||||||
| Other assets less liabilities – 0.9% |
1,619,674 | |||||||||||
|
|
|
|||||||||||
| Net Assets – 100.0% |
$ | 184,596,421 | ||||||||||
|
|
|
|||||||||||
FUTURES (see Note D)
| Description | Number of Contracts |
Expiration Month |
Current Notional |
Value and Unrealized Appreciation/ (Depreciation) |
||||||||||||
| Purchased Contracts |
| |||||||||||||||
| FTSE China A50 Index Futures |
137 | October 2021 | $ | 2,116,615 | $ | 60,794 | ||||||||||
| Hang Seng China Enterprises Index Futures |
68 | October 2021 | 3,811,739 | 55,085 | ||||||||||||
| MSCI Emerging Markets Futures |
176 | December 2021 | 10,961,280 | (476,356 | ) | |||||||||||
| U.S. T-Note 10 Yr (CBT) Futures |
41 | December 2021 | 5,395,984 | (71,109 | ) | |||||||||||
| U.S. Ultra Bond (CBT) Futures |
4 | December 2021 | 764,251 | (10,656 | ) | |||||||||||
| Sold Contracts |
| |||||||||||||||
| U.S. 10 Yr Ultra Futures |
8 | December 2021 | 1,162,000 | 16,234 | ||||||||||||
|
|
|
|||||||||||||||
| $ | (426,008 | ) | ||||||||||||||
|
|
|
|||||||||||||||
FORWARD CURRENCY EXCHANGE CONTRACTS (see Note D)
| Counterparty | Contracts to Deliver (000) |
In Exchange For (000) |
Settlement Date |
Unrealized Appreciation/ (Depreciation) |
||||||||||||||||
| Bank of America, NA |
INR | 61,993 | USD | 828 | 10/08/2021 | $ | (6,762 | ) | ||||||||||||
| Bank of America, NA |
EUR | 3,211 | USD | 3,768 | 11/08/2021 | 46,148 | ||||||||||||||
| Bank of America, NA |
PEN | 16,113 | USD | 3,926 | 11/12/2021 | 33,092 | ||||||||||||||
| Bank of America, NA |
USD | 537 | PEN | 2,212 | 11/12/2021 | (2,841 | ) | |||||||||||||
| Bank of America, NA |
CNH | 114,752 | USD | 17,710 | 12/09/2021 | 12,837 | ||||||||||||||
| Barclays Bank PLC |
BRL | 1,859 | USD | 342 | 10/04/2021 | 399 | ||||||||||||||
| Barclays Bank PLC |
USD | 351 | BRL | 1,859 | 10/04/2021 | (9,487 | ) | |||||||||||||
| Barclays Bank PLC |
INR | 115,427 | USD | 1,537 | 10/08/2021 | (17,002 | ) | |||||||||||||
| Barclays Bank PLC |
USD | 1,647 | IDR | 24,210,339 | 10/15/2021 | 41,368 | ||||||||||||||
| Barclays Bank PLC |
USD | 631 | TWD | 17,598 | 10/21/2021 | 1,802 | ||||||||||||||
| Barclays Bank PLC |
COP | 12,577,642 | USD | 3,267 | 11/12/2021 | (26,522 | ) | |||||||||||||
| abfunds.com | AB EMERGING MARKETS MULTI-ASSET PORTFOLIO | 35 | |
PORTFOLIO OF INVESTMENTS (continued)
| Counterparty | Contracts to Deliver (000) |
In Exchange For (000) |
Settlement Date |
Unrealized Appreciation/ (Depreciation) |
||||||||||||||||
| Barclays Bank PLC |
USD | 498 | CLP | 391,408 | 11/12/2021 | $ | (16,847 | ) | ||||||||||||
| Barclays Bank PLC |
MYR | 14,106 | USD | 3,375 | 12/22/2021 | 20,615 | ||||||||||||||
| Barclays Bank PLC |
USD | 823 | MYR | 3,463 | 12/22/2021 | 786 | ||||||||||||||
| BNP Paribas SA |
HUF | 866,756 | USD | 2,927 | 12/07/2021 | 139,764 | ||||||||||||||
| Brown Brothers Harriman & Co. |
THB | 330,379 | USD | 10,063 | 10/07/2021 | 299,323 | ||||||||||||||
| Brown Brothers Harriman & Co. |
USD | 4,107 | THB | 134,763 | 10/07/2021 | (124,577 | ) | |||||||||||||
| Brown Brothers Harriman & Co. |
USD | 239 | MXN | 4,905 | 10/28/2021 | (2,421 | ) | |||||||||||||
| Brown Brothers Harriman & Co. |
USD | 3,824 | EUR | 3,211 | 11/08/2021 | (101,915 | ) | |||||||||||||
| Brown Brothers Harriman & Co. |
ZAR | 4,983 | USD | 333 | 11/24/2021 | 4,717 | ||||||||||||||
| Brown Brothers Harriman & Co. |
CZK | 12,039 | USD | 561 | 12/07/2021 | 11,734 | ||||||||||||||
| Brown Brothers Harriman & Co. |
PLN | 1,697 | USD | 430 | 12/07/2021 | 3,770 | ||||||||||||||
| Brown Brothers Harriman & Co. |
USD | 496 | CZK | 10,777 | 12/07/2021 | (4,571 | ) | |||||||||||||
| Citibank, NA |
BRL | 5,193 | USD | 955 | 10/04/2021 | 1,113 | ||||||||||||||
| Citibank, NA |
USD | 985 | BRL | 5,193 | 10/04/2021 | (30,870 | ) | |||||||||||||
| Citibank, NA |
USD | 8,199 | INR | 617,598 | 10/08/2021 | 115,533 | ||||||||||||||
| Citibank, NA |
COP | 4,635,988 | USD | 1,210 | 11/12/2021 | (4,256 | ) | |||||||||||||
| Deutsche Bank AG |
BRL | 34,780 | USD | 6,489 | 10/04/2021 | 102,175 | ||||||||||||||
| Deutsche Bank AG |
USD | 6,394 | BRL | 34,780 | 10/04/2021 | (7,456 | ) | |||||||||||||
| Deutsche Bank AG |
USD | 6,459 | BRL | 34,780 | 11/03/2021 | (102,406 | ) | |||||||||||||
| Deutsche Bank AG |
USD | 1,577 | RUB | 116,204 | 12/15/2021 | (1,015 | ) | |||||||||||||
| Goldman Sachs Bank USA |
USD | 1,179 | IDR | 17,262,129 | 10/15/2021 | 24,617 | ||||||||||||||
| Goldman Sachs Bank USA |
PHP | 60,494 | USD | 1,206 | 10/21/2021 | 24,041 | ||||||||||||||
| Goldman Sachs Bank USA |
USD | 3,633 | PHP | 184,565 | 10/21/2021 | (28,093 | ) | |||||||||||||
| Goldman Sachs Bank USA |
KRW | 1,166,384 | USD | 1,013 | 10/28/2021 | 28,700 | ||||||||||||||
| Goldman Sachs Bank USA |
MXN | 26,730 | USD | 1,321 | 10/28/2021 | 31,110 | ||||||||||||||
| Goldman Sachs Bank USA |
USD | 1,901 | KRW | 2,250,809 | 10/28/2021 | (1,111 | ) | |||||||||||||
| Goldman Sachs Bank USA |
USD | 555 | CZK | 12,039 | 12/07/2021 | (5,526 | ) | |||||||||||||
| Goldman Sachs Bank USA |
USD | 2,197 | CNH | 14,330 | 12/09/2021 | 13,013 | ||||||||||||||
| Goldman Sachs Bank USA |
USD | 7,288 | MYR | 30,302 | 12/22/2021 | (81,777 | ) | |||||||||||||
| HSBC Bank USA |
CLP | 831,789 | USD | 1,046 | 11/12/2021 | 24,333 | ||||||||||||||
| HSBC Bank USA |
PLN | 7,388 | USD | 1,916 | 12/07/2021 | 58,434 | ||||||||||||||
| HSBC Bank USA |
USD | 1,091 | HUF | 328,710 | 12/07/2021 | (34,071 | ) | |||||||||||||
| JPMorgan Chase Bank, NA |
USD | 374 | INR | 28,081 | 10/08/2021 | 4,062 | ||||||||||||||
| JPMorgan Chase Bank, NA |
IDR | 5,284,398 | USD | 370 | 10/15/2021 | 1,490 | ||||||||||||||
| JPMorgan Chase Bank, NA |
USD | 567 | TWD | 15,698 | 10/21/2021 | (2,278 | ) | |||||||||||||
| Morgan Stanley Capital Services LLC |
BRL | 27,728 | USD | 5,098 | 10/04/2021 | 5,944 | ||||||||||||||
| Morgan Stanley Capital Services LLC |
USD | 5,269 | BRL | 27,728 | 10/04/2021 | (177,301 | ) | |||||||||||||
| Morgan Stanley Capital Services LLC |
KRW | 1,264,740 | USD | 1,081 | 10/28/2021 | 13,310 | ||||||||||||||
| Royal Bank of Scotland PLC |
USD | 1,288 | INR | 95,310 | 10/08/2021 | (5,133 | ) | |||||||||||||
| Standard Chartered Bank |
INR | 269,735 | USD | 3,645 | 10/08/2021 | 13,405 | ||||||||||||||
| Standard Chartered Bank |
USD | 1,459 | INR | 107,667 | 10/08/2021 | (9,688 | ) | |||||||||||||
|
36 | AB EMERGING MARKETS MULTI-ASSET PORTFOLIO |
abfunds.com | |
PORTFOLIO OF INVESTMENTS (continued)
| Counterparty | Contracts to Deliver (000) |
In Exchange For (000) |
Settlement Date |
Unrealized Appreciation/ (Depreciation) |
||||||||||||||||
| Standard Chartered Bank |
IDR | 23,243,142 | USD | 1,621 | 10/15/2021 | $ | 308 | |||||||||||||
| Standard Chartered Bank |
IDR | 22,516,268 | USD | 1,553 | 10/15/2021 | (17,717 | ) | |||||||||||||
| Standard Chartered Bank |
PHP | 391,817 | USD | 7,798 | 10/21/2021 | 144,395 | ||||||||||||||
| Standard Chartered Bank |
TWD | 514,361 | USD | 18,454 | 10/21/2021 | (51,455 | ) | |||||||||||||
| Standard Chartered Bank |
USD | 10,250 | PHP | 517,744 | 10/21/2021 | (136,547 | ) | |||||||||||||
| Standard Chartered Bank |
USD | 2,945 | TWD | 82,056 | 10/21/2021 | 7,347 | ||||||||||||||
| Standard Chartered Bank |
USD | 725 | TWD | 20,118 | 10/21/2021 | (721 | ) | |||||||||||||
| Standard Chartered Bank |
KRW | 14,267,283 | USD | 12,451 | 10/28/2021 | 409,438 | ||||||||||||||
| Standard Chartered Bank |
USD | 1,111 | KRW | 1,282,127 | 10/28/2021 | (28,875 | ) | |||||||||||||
| Standard Chartered Bank |
ZAR | 18,020 | USD | 1,249 | 11/24/2021 | 61,203 | ||||||||||||||
| UBS AG |
USD | 1,056 | KRW | 1,221,900 | 10/28/2021 | (24,544 | ) | |||||||||||||
| UBS AG |
USD | 1,631 | MXN | 33,433 | 10/28/2021 | (17,450 | ) | |||||||||||||
|
|
|
|||||||||||||||||||
| $ | 619,091 | |||||||||||||||||||
|
|
|
|||||||||||||||||||
CENTRALLY CLEARED CREDIT DEFAULT SWAPS (see Note D)
| Description | Fixed Rate (Pay) Receive |
Payment Frequency |
Implied Credit Spread at September 30, 2021 |
Notional |
Market Value |
Upfront Premiums Paid/ (Received) |
Unrealized Appreciation/ (Depreciation) |
|||||||||||||||||||||||||
| Buy Contracts |
| |||||||||||||||||||||||||||||||
| CDX-EM Series 35, 5 Year Index, 12/20/2026* |
(1.00 | )% | Quarterly | 1.82 | % | USD | 21,400 | $ | 844,539 | $ | 709,273 | $ | 135,266 | |||||||||||||||||||
| * | Termination date |
CENTRALLY CLEARED INFLATION (CPI) SWAPS (see Note D)
| Rate Type | ||||||||||||||||||||||||||
| Notional |
Termination Date |
Payments made by the Fund |
Payments received by the Fund |
Payment Frequency Paid/ Received |
Market Value |
Upfront Premiums Paid/ (Received) |
Unrealized Appreciation/ (Depreciation) |
|||||||||||||||||||
| USD |
490 | 02/22/2051 | CPI# | 2.348% | Maturity | $ | (34,960 | ) | $ | – 0 | – | $ | (34,960 | ) | ||||||||||||
| # | Variable interest rate based on the rate of inflation as determined by the Consumer Price Index (CPI). |
CENTRALLY CLEARED INTEREST RATE SWAPS (see Note D)
| Rate Type |
||||||||||||||||||||||
| Notional |
Termination Date |
Payments made by the Fund |
Payments received by the Fund |
Payment Frequency Paid/ Received |
Market Value |
Upfront Premiums Paid/ (Received) |
Unrealized Appreciation/ (Depreciation) |
|||||||||||||||
| USD |
4,290 | 10/02/2029 | 3 Month LIBOR | 1.589% | Quarterly/ Semi-Annual |
$ | 82,076 | $ | – 0 | – | $ | 82,076 | ||||||||||
| USD |
770 | 02/22/2051 | 1.854% | 3 Month LIBOR | Semi-Annual/Quarterly | (4,436 | ) | – 0 | – | (4,436 | ) | |||||||||||
|
|
|
|
|
|
|
|||||||||||||||||
| $ | 77,640 | $ | – 0 | – | $ | 77,640 | ||||||||||||||||
|
|
|
|
|
|
|
|||||||||||||||||
| abfunds.com | AB EMERGING MARKETS MULTI-ASSET PORTFOLIO | 37 | |
PORTFOLIO OF INVESTMENTS (continued)
TOTAL RETURN SWAPS (see Note D)
| Counterparty & Referenced Obligation |
Rate Paid/ Received |
Payment Frequency |
Current Notional (000) |
Maturity Date |
Unrealized Appreciation/ (Depreciation) |
|||||||||||||||||
| Receive Total Return on Reference Obligation |
| |||||||||||||||||||||
| Goldman Sachs International | ||||||||||||||||||||||
| MSCI Emerging Markets Growth |
3 Month LIBOR plus 0.48% | Quarterly | USD | 14,372 | 11/15/2021 | $ | (212,483 | ) | ||||||||||||||
| MSCI Emerging Markets Growth |
3 Month LIBOR plus 0.46% | Quarterly | USD | 2,569 | 05/16/2022 | (37,864 | ) | |||||||||||||||
|
|
|
|||||||||||||||||||||
| $ | (250,347 | ) | ||||||||||||||||||||
|
|
|
|||||||||||||||||||||
VARIANCE SWAPS (see Note D)
| Swap Counterparty & Referenced Obligation |
Volatility Strike Rate |
Payment Frequency |
Notional Amount (000) |
Market Value |
Upfront Premiums (Paid)/ Received |
Unrealized Appreciation/ (Depreciation) |
||||||||||||||||||||||
| Buy Contracts |
| |||||||||||||||||||||||||||
| Bank of America, NA |
| |||||||||||||||||||||||||||
| FTSE 100 Index 12/17/2021* |
21.95 | % | Maturity | GBP | 4 | $ | (792 | ) | $ | – 0 | – | $ | (792 | ) | ||||||||||||||
| Russell 2000 Index 12/17/2021* |
30.20 | Maturity | USD | 2 | 31 | – 0 | – | 31 | ||||||||||||||||||||
| Goldman Sachs International |
| |||||||||||||||||||||||||||
| Nikkei 225 Index 12/17/2021* |
24.20 | Maturity | JPY | 762 | (949 | ) | – 0 | – | (949 | ) | ||||||||||||||||||
| JPMorgan Chase Bank, NA |
| |||||||||||||||||||||||||||
| Hang Seng China Enterprises Index 12/30/2021* |
22.54 | Maturity | HKD | 155 | 137,824 | – 0 | – | 137,824 | ||||||||||||||||||||
| UBS AG |
| |||||||||||||||||||||||||||
| FTSE 100 Index 11/19/2021* |
21.60 | Maturity | GBP | 7 | (20,889 | ) | – 0 | – | (20,889 | ) | ||||||||||||||||||
| S&P/ASX 200 Index 12/16/2021* |
18.85 | Maturity | AUD | 8 | 8,207 | – 0 | – | 8,207 | ||||||||||||||||||||
| Sale Contracts |
| |||||||||||||||||||||||||||
| Bank of America, NA |
| |||||||||||||||||||||||||||
| FTSE 100 Index 11/19/2021* |
19.20 | Maturity | GBP | 6 | 7 | – 0 | – | 7 | ||||||||||||||||||||
| JPMorgan Chase Bank, NA |
| |||||||||||||||||||||||||||
| Hang Seng China Enterprises Index 10/28/2021* |
32.90 | Maturity | HKD | 83 | 21,899 | – 0 | – | 21,899 | ||||||||||||||||||||
|
|
|
|
|
|
|
|||||||||||||||||||||||
| $ | 145,338 | $ | – 0 | – | $ | 145,338 | ||||||||||||||||||||||
|
|
|
|
|
|
|
|||||||||||||||||||||||
| * | Termination date |
| 38 | AB EMERGING MARKETS MULTI-ASSET PORTFOLIO |
abfunds.com | |
PORTFOLIO OF INVESTMENTS (continued)
| (a) | Security is exempt from registration under Rule 144A or Regulation S of the Securities Act of 1933. These securities are considered restricted, but liquid and may be resold in transactions exempt from registration. At September 30, 2021, the aggregate market value of these securities amounted to $54,355,119 or 29.4% of net assets. |
| (b) | Represents entire or partial securities out on loan. See Note E for securities lending information. |
| (c) | Non-income producing security. |
| (d) | Defaulted. |
| (e) | Securities are perpetual and, thus, do not have a predetermined maturity date. The date shown, if applicable, reflects the next call date. |
| (f) | Pay-In-Kind Payments (PIK). The issuer may pay cash interest and/or interest in additional debt securities. Rates shown are the rates in effect at September 30, 2021. |
| (g) | Security is exempt from registration under Rule 144A or Regulation S of the Securities Act of 1933. These securities, which represent 0.01% of net assets as of September 30, 2021, are considered illiquid and restricted. Additional information regarding such securities follows: |
| 144A/Restricted & Illiquid Securities |
Acquisition Date |
Cost | Market Value |
Percentage of Net Assets |
||||||||||||
| Digicel Group Holdings Ltd. |
|
01/14/2019- 04/01/2021 |
|
$ | 12,445 | $ | 13,343 | 0.01 | % | |||||||
| Odebrecht Holdco Finance Ltd. |
01/22/2021 | 20,463 | 2,183 | 0.00 | % | |||||||||||
| Tonon Luxembourg SA |
|
05/03/2019- 10/31/2020 |
|
198,834 | 1,060 | 0.00 | % | |||||||||
| Virgolino de Oliveira Finance SA |
07/12/2013 | 172,628 | 1,010 | 0.00 | % | |||||||||||
| (h) | Security in which significant unobservable inputs (Level 3) were used in determining fair value. |
| (i) | Fair valued by the Adviser. |
| (j) | To obtain a copy of the fund’s shareholder report, please go to the Securities and Exchange Commission’s website at www.sec.gov. Additionally, shareholder reports for AB funds can be obtained by calling AB at (800) 227-4618. |
| (k) | Affiliated investments. |
| (l) | The rate shown represents the 7-day yield as of period end. |
Currency Abbreviations:
AUD – Australian Dollar
BRL – Brazilian Real
CAD – Canadian Dollar
CLP – Chilean Peso
CNH – Chinese Yuan Renminbi (Offshore)
COP – Colombian Peso
CZK – Czech Koruna
EGP – Egyptian Pound
EUR – Euro
GBP – Great British Pound
HKD – Hong Kong Dollar
HUF – Hungarian Forint
IDR – Indonesian Rupiah
INR – Indian Rupee
JPY – Japanese Yen
KRW – South Korean Won
MXN – Mexican Peso
MYR – Malaysian Ringgit
NOK – Norwegian Krone
PEN – Peruvian Sol
PHP – Philippine Peso
PLN – Polish Zloty
RUB – Russian Ruble
SEK – Swedish Krona
SGD – Singapore Dollar
THB – Thailand Baht
TWD – New Taiwan Dollar
USD – United States Dollar
ZAR – South African Rand
| abfunds.com | AB EMERGING MARKETS MULTI-ASSET PORTFOLIO | 39 | |
PORTFOLIO OF INVESTMENTS (continued)
Glossary:
ADR – American Depositary Receipt
ASX – Australian Stock Exchange
CBT – Chicago Board of Trade
CDX-EM – Emerging Market Credit Default Swap Index
CPI – Consumer Price Index
ETF – Exchange Traded Fund
FTSE – Financial Times Stock Exchange
GDR – Global Depositary Receipt
JSC – Joint Stock Company
LIBOR – London Interbank Offered Rate
MSCI – Morgan Stanley Capital International
PJSC – Public Joint Stock Company
See notes to financial statements.
| 40 | AB EMERGING MARKETS MULTI-ASSET PORTFOLIO |
abfunds.com | |
STATEMENT OF ASSETS & LIABILITIES
September 30, 2021 (unaudited)
| Assets | ||||
| Investments in securities, at value |
$ | 175,760,198 | (a) | |
| Affiliated issuers (cost $7,216,549—including investment of cash collateral for securities loaned of $1,512,481) |
7,216,549 | |||
| Cash |
128,880 | |||
| Cash collateral due from broker |
2,666,004 | |||
| Foreign currencies, at value (cost $492,093) |
486,632 | |||
| Unrealized appreciation on forward currency exchange contracts |
1,700,326 | |||
| Unaffiliated dividends and interest receivable |
1,251,763 | |||
| Receivable for investment securities sold |
307,269 | |||
| Receivable for capital stock sold |
217,996 | |||
| Unrealized appreciation on variance swaps |
167,968 | |||
| Receivable for variation margin on futures |
88,715 | |||
| Receivable for terminated variance swaps |
33,524 | |||
| Receivable for variation margin on centrally cleared swaps |
12,091 | |||
| Affiliated dividends receivable |
62 | |||
|
|
|
|||
| Total assets |
190,037,977 | |||
|
|
|
|||
| Liabilities | ||||
| Payable for collateral received on securities loaned |
1,512,481 | |||
| Unrealized depreciation on forward currency exchange contracts |
1,081,235 | |||
| Payable for capital stock redeemed |
829,140 | |||
| Payable for investment securities purchased and foreign currency transactions |
641,550 | |||
| Payable for capital gains taxes |
452,991 | |||
| Cash collateral due to broker |
260,000 | |||
| Unrealized depreciation on total return swaps |
250,347 | |||
| Advisory fee payable |
91,410 | |||
| Payable for terminated total return swaps |
44,590 | |||
| Unrealized depreciation on variance swaps |
22,630 | |||
| Administrative fee payable |
11,479 | |||
| Transfer Agent fee payable |
4,601 | |||
| Distribution fee payable |
1,806 | |||
| Directors’ fee payable |
304 | |||
| Accrued expenses and other liabilities |
236,992 | |||
|
|
|
|||
| Total liabilities |
5,441,556 | |||
|
|
|
|||
| Net Assets |
$ | 184,596,421 | ||
|
|
|
|||
| Composition of Net Assets | ||||
| Capital stock, at par |
$ | 1,843 | ||
| Additional paid-in capital |
173,764,179 | |||
| Distributable earnings |
10,830,399 | |||
|
|
|
|||
| $ | 184,596,421 | |||
|
|
|
See notes to financial statements.
| abfunds.com | AB EMERGING MARKETS MULTI-ASSET PORTFOLIO | 41 | |
STATEMENT OF ASSETS & LIABILITIES (continued)
Net Asset Value Per Share—33 billion shares of capital stock authorized, $.0001 par value
| Class | Net Assets | Shares Outstanding |
Net Asset Value |
|||||||||
|
|
||||||||||||
| A | $ | 3,557,956 | 356,016 | $ | 9.99 | * | ||||||
|
|
||||||||||||
| C | $ | 974,510 | 98,012 | $ | 9.94 | |||||||
|
|
||||||||||||
| Advisor | $ | 176,176,504 | 17,587,071 | $ | 10.02 | |||||||
|
|
||||||||||||
| R | $ | 297,141 | 29,605 | $ | 10.04 | |||||||
|
|
||||||||||||
| K | $ | 275,315 | 27,510 | $ | 10.01 | |||||||
|
|
||||||||||||
| I | $ | 301,895 | 30,430 | $ | 9.92 | |||||||
|
|
||||||||||||
| Z | $ | 3,013,100 | 302,918 | $ | 9.95 | |||||||
|
|
||||||||||||
| (a) | Includes securities on loan with a value of $1,560,630 (see Note E). |
| * | The maximum offering price per share for Class A shares was $10.43, which reflects a sales charge of 4.25%. |
See notes to financial statements.
| 42 | AB EMERGING MARKETS MULTI-ASSET PORTFOLIO |
abfunds.com | |
STATEMENT OF OPERATIONS
Six Months Ended September 30, 2021 (unaudited)
| Investment Income | ||||||||
| Dividends |
||||||||
| Unaffiliated issuers (net of foreign taxes withheld of $351,521) |
$ | 2,752,840 | ||||||
| Affiliated issuers |
608 | |||||||
| Interest (net of foreign taxes withheld of $19,861) |
2,087,315 | |||||||
| Securities lending income |
2,532 | $ | 4,843,295 | |||||
|
|
|
|||||||
| Expenses | ||||||||
| Advisory fee (see Note B) |
830,453 | |||||||
| Transfer agency—Class A |
755 | |||||||
| Transfer agency—Class C |
235 | |||||||
| Transfer agency—Advisor Class |
37,365 | |||||||
| Transfer agency—Class R |
438 | |||||||
| Transfer agency—Class K |
294 | |||||||
| Transfer agency—Class I |
33 | |||||||
| Transfer agency—Class Z |
342 | |||||||
| Distribution fee—Class A |
4,695 | |||||||
| Distribution fee—Class C |
5,384 | |||||||
| Distribution fee—Class R |
842 | |||||||
| Distribution fee—Class K |
368 | |||||||
| Custody and accounting |
156,965 | |||||||
| Registration fees |
52,377 | |||||||
| Audit and tax |
39,650 | |||||||
| Administrative |
38,067 | |||||||
| Printing |
22,567 | |||||||
| Legal |
16,424 | |||||||
| Directors’ fees |
10,505 | |||||||
| Miscellaneous |
33,345 | |||||||
|
|
|
|||||||
| Total expenses |
1,251,104 | |||||||
| Less: expenses waived and reimbursed by the Adviser (see Note B and Note E) |
(275,463 | ) | ||||||
|
|
|
|||||||
| Net expenses |
975,641 | |||||||
|
|
|
|||||||
| Net investment income |
3,867,654 | |||||||
|
|
|
See notes to financial statements.
| abfunds.com | AB EMERGING MARKETS MULTI-ASSET PORTFOLIO | 43 | |
STATEMENT OF OPERATIONS (continued)
| Realized and Unrealized Gain (Loss) on Investment and Foreign Currency Transactions | ||||||||
| Net realized gain (loss) on: |
||||||||
| Investment transactions(a) |
$ | 3,408,272 | ||||||
| Forward currency exchange contracts |
912,037 | |||||||
| Futures |
(984,868 | ) | ||||||
| Swaps |
(4,112,970 | ) | ||||||
| Swaptions written |
145,486 | |||||||
| Foreign currency transactions |
(133,530 | ) | ||||||
| Net change in unrealized appreciation/depreciation on: |
||||||||
| Investments(b) |
(7,456,456 | ) | ||||||
| Forward currency exchange contracts |
(351,826 | ) | ||||||
| Futures |
(447,773 | ) | ||||||
| Swaps |
2,216,817 | |||||||
| Swaptions written |
(77,821 | ) | ||||||
| Foreign currency denominated assets and liabilities |
11,891 | |||||||
|
|
|
|||||||
| Net loss on investment and foreign currency transactions |
(6,870,741 | ) | ||||||
|
|
|
|||||||
| Net Decrease in Net Assets from Operations |
$ | (3,003,087 | ) | |||||
|
|
|
| (a) | Net of foreign realized capital gains taxes of $242,591. |
| (b) | Net of decrease in accrued foreign capital gains taxes on unrealized gains of $25,293. |
See notes to financial statements.
| 44 | AB EMERGING MARKETS MULTI-ASSET PORTFOLIO |
abfunds.com | |
STATEMENT OF CHANGES IN NET ASSETS
| Six Months Ended September 30, 2021 (unaudited) |
Year Ended March 31, 2021 |
|||||||
| Increase (Decrease) in Net Assets from Operations | ||||||||
| Net investment income |
$ | 3,867,654 | $ | 3,907,333 | ||||
| Net realized gain (loss) on investment and foreign currency transactions |
(765,573 | ) | 14,555,103 | |||||
| Net change in unrealized appreciation/depreciation on investments and foreign currency denominated assets and liabilities |
(6,105,168 | ) | 44,932,603 | |||||
|
|
|
|
|
|||||
| Net increase (decrease) in net assets from operations |
(3,003,087 | ) | 63,395,039 | |||||
| Distributions to Shareholders | ||||||||
| Class A |
(60,063 | ) | (72,649 | ) | ||||
| Class C |
(12,577 | ) | (16,421 | ) | ||||
| Advisor Class |
(3,168,365 | ) | (4,047,068 | ) | ||||
| Class R |
(4,401 | ) | (5,023 | ) | ||||
| Class K |
(4,430 | ) | (5,736 | ) | ||||
| Class I |
(5,627 | ) | (1,449 | ) | ||||
| Class Z |
(60,077 | ) | (6,691 | ) | ||||
| Capital Stock Transactions | ||||||||
| Net increase (decrease) |
(1,027,477 | ) | 5,693,668 | |||||
|
|
|
|
|
|||||
| Total increase (decrease) |
(7,346,104 | ) | 64,933,670 | |||||
| Net Assets | ||||||||
| Beginning of period |
191,942,525 | 127,008,855 | ||||||
|
|
|
|
|
|||||
| End of period |
$ | 184,596,421 | $ | 191,942,525 | ||||
|
|
|
|
|
|||||
See notes to financial statements.
| abfunds.com | AB EMERGING MARKETS MULTI-ASSET PORTFOLIO | 45 | |
NOTES TO FINANCIAL STATEMENTS
September 30, 2021 (unaudited)
NOTE A
Significant Accounting Policies
AB Cap Fund, Inc. (the “Company”) is registered under the Investment Company Act of 1940 as an open-end management investment company. The Company, which is a Maryland corporation, operates as a series company comprised of 13 portfolios currently in operation. Each portfolio is considered to be a separate entity for financial reporting and tax purposes. This report relates only to the AB Emerging Markets Multi-Asset Portfolio (the “Fund”), a diversified portfolio. The Fund has authorized the issuance of Class A, Class B, Class C, Advisor Class, Class R, Class K, Class I, Class Z, Class T, Class 1, and Class 2 shares. Class B, Class T, Class 1, and Class 2 shares are not currently being offered. Class A shares are sold with a front-end sales charge of up to 4.25% for purchases not exceeding $1,000,000. With respect to purchases of $1,000,000 or more, Class A shares redeemed within one year of purchase may be subject to a contingent deferred sales charge of 1%. Class C shares are subject to a contingent deferred sales charge of 1% on redemptions made within the first year after purchase, and 0% after the first year of purchase. Effective May 31, 2021, Class C shares automatically converted to Class A shares eight years after the end of the calendar month of purchase. Prior to May 31, 2021, Class C shares automatically converted to Class A shares ten years after the end of the calendar month of purchase. Class R and Class K shares are sold without an initial or contingent deferred sales charge. Advisor Class and Class I shares are sold without an initial or contingent deferred sales charge and are not subject to ongoing distribution expenses. All eleven classes of shares have identical voting, dividend, liquidation and other rights, except that the classes bear different distribution and transfer agency expenses. Each class has exclusive voting rights with respect to its distribution plan. The financial statements have been prepared in conformity with U.S. generally accepted accounting principles (“U.S. GAAP”), which require management to make certain estimates and assumptions that affect the reported amounts of assets and liabilities in the financial statements and amounts of income and expenses during the reporting period. Actual results could differ from those estimates. The Fund is an investment company under U.S. GAAP and follows the accounting and reporting guidance applicable to investment companies. The following is a summary of significant accounting policies followed by the Fund.
1. Security Valuation
Portfolio securities are valued at their current market value determined on the basis of market quotations or, if market quotations are not readily available or are deemed unreliable, at “fair value” as determined in accordance with procedures established by and under the general supervision of the Company’s Board of Directors (the “Board”).
| 46 | AB EMERGING MARKETS MULTI-ASSET PORTFOLIO |
abfunds.com | |
NOTES TO FINANCIAL STATEMENTS (continued)
In general, the market values of securities which are readily available and deemed reliable are determined as follows: securities listed on a national securities exchange (other than securities listed on the NASDAQ Stock Market, Inc. (“NASDAQ”)) or on a foreign securities exchange are valued at the last sale price at the close of the exchange or foreign securities exchange. If there has been no sale on such day, the securities are valued at the last traded price from the previous day. Securities listed on more than one exchange are valued by reference to the principal exchange on which the securities are traded; securities listed only on NASDAQ are valued in accordance with the NASDAQ Official Closing Price; listed or over the counter (“OTC”) market put or call options are valued at the mid level between the current bid and ask prices. If either a current bid or current ask price is unavailable, AllianceBernstein L.P. (the “Adviser”) will have discretion to determine the best valuation (e.g., last trade price in the case of listed options); open futures are valued using the closing settlement price or, in the absence of such a price, the most recent quoted bid price. If there are no quotations available for the day of valuation, the last available closing settlement price is used; U.S. Government securities and any other debt instruments having 60 days or less remaining until maturity are generally valued at market by an independent pricing vendor, if a market price is available. If a market price is not available, the securities are valued at amortized cost. This methodology is commonly used for short term securities that have an original maturity of 60 days or less, as well as short term securities that had an original term to maturity that exceeded 60 days. In instances when amortized cost is utilized, the Valuation Committee (the “Committee”) must reasonably conclude that the utilization of amortized cost is approximately the same as the fair value of the security. Factors the Committee will consider include, but are not limited to, an impairment of the creditworthiness of the issuer or material changes in interest rates. Fixed-income securities, including mortgage-backed and asset-backed securities, may be valued on the basis of prices provided by a pricing service or at a price obtained from one or more of the major broker-dealers. In cases where broker-dealer quotes are obtained, the Adviser may establish procedures whereby changes in market yields or spreads are used to adjust, on a daily basis, a recently obtained quoted price on a security. Swaps and other derivatives are valued daily, primarily using independent pricing services, independent pricing models using market inputs, as well as third party broker-dealers or counterparties. Open-end mutual funds are valued at the closing net asset value per share, while exchange traded funds are valued at the closing market price per share.
Securities for which market quotations are not readily available (including restricted securities) or are deemed unreliable are valued at fair value as deemed appropriate by the Adviser. Factors considered in making this
| abfunds.com | AB EMERGING MARKETS MULTI-ASSET PORTFOLIO | 47 | |
NOTES TO FINANCIAL STATEMENTS (continued)
determination may include, but are not limited to, information obtained by contacting the issuer, analysts, analysis of the issuer’s financial statements or other available documents. In addition, the Fund may use fair value pricing for securities primarily traded in non-U.S. markets because most foreign markets close well before the Fund values its securities at 4:00 p.m., Eastern Time. The earlier close of these foreign markets gives rise to the possibility that significant events, including broad market moves, may have occurred in the interim and may materially affect the value of those securities. To account for this, the Fund generally values many of its foreign equity securities using fair value prices based on third party vendor modeling tools to the extent available.
2. Fair Value Measurements
In accordance with U.S. GAAP regarding fair value measurements, fair value is defined as the price that the Fund would receive to sell an asset or pay to transfer a liability in an orderly transaction between market participants at the measurement date. U.S. GAAP establishes a framework for measuring fair value, and a three-level hierarchy for fair value measurements based upon the transparency of inputs to the valuation of an asset or liability (including those valued based on their market values as described in Note A.1 above). Inputs may be observable or unobservable and refer broadly to the assumptions that market participants would use in pricing the asset or liability. Observable inputs reflect the assumptions market participants would use in pricing the asset or liability based on market data obtained from sources independent of the Fund. Unobservable inputs reflect the Fund’s own assumptions about the assumptions that market participants would use in pricing the asset or liability based on the best information available in the circumstances. Each investment is assigned a level based upon the observability of the inputs which are significant to the overall valuation. The three-tier hierarchy of inputs is summarized below.
| • | Level 1—quoted prices in active markets for identical investments |
| • | Level 2—other significant observable inputs (including quoted prices for similar investments, interest rates, prepayment speeds, credit risk, etc.) |
| • | Level 3—significant unobservable inputs (including the Fund’s own assumptions in determining the fair value of investments) |
The fair value of debt instruments, such as bonds, and over-the-counter derivatives is generally based on market price quotations, recently executed market transactions (where observable) or industry recognized modeling techniques and are generally classified as Level 2. Pricing vendor inputs to Level 2 valuations may include quoted prices for similar investments in active markets, interest rate curves, coupon rates, currency rates, yield curves, option adjusted spreads, default rates, credit spreads and
| 48 | AB EMERGING MARKETS MULTI-ASSET PORTFOLIO |
abfunds.com | |
NOTES TO FINANCIAL STATEMENTS (continued)
other unique security features in order to estimate the relevant cash flows which are then discounted to calculate fair values. If these inputs are unobservable and significant to the fair value, these investments will be classified as Level 3.
Where readily available market prices or relevant bid prices are not available for certain equity investments, such investments may be valued based on similar publicly traded investments, movements in relevant indices since last available prices or based upon underlying company fundamentals and comparable company data (such as multiples to earnings or other multiples to equity). Where an investment is valued using an observable input, such as another publicly traded security, the investment will be classified as Level 2. If management determines that an adjustment is appropriate based on restrictions on resale, illiquidity or uncertainty, and such adjustment is a significant component of the valuation, the investment will be classified as Level 3. An investment will also be classified as Level 3 where management uses company fundamentals and other significant inputs to determine the valuation.
Options are valued using market-based inputs to models, broker or dealer quotations, or alternative pricing sources with reasonable levels of price transparency, where such inputs and models are available. Alternatively, the values may be obtained through unobservable management determined inputs and/or management’s proprietary models. Where models are used, the selection of a particular model to value an option depends upon the contractual terms of, and specific risks inherent in, the option as well as the availability of pricing information in the market. Valuation models require a variety of inputs, including contractual terms, market prices, measures of volatility and correlations of such inputs. Exchange traded options generally will be classified as Level 2. For options that do not trade on an exchange but trade in liquid markets, inputs can generally be verified and model selection does not involve significant management judgment. Options are classified within Level 2 on the fair value hierarchy when all of the significant inputs can be corroborated to market evidence. Otherwise such instruments are classified as Level 3.
Other fixed income investments, including non-U.S. government and corporate debt, are generally valued using quoted market prices, if available, which are typically impacted by current interest rates, maturity dates and any perceived credit risk of the issuer. Additionally, in the absence of quoted market prices, these inputs are used by pricing vendors to derive a valuation based upon industry or proprietary models which incorporate issuer specific data with relevant yield/spread comparisons with more widely quoted bonds with similar key characteristics. Those investments for which there are observable inputs are classified as Level 2. Where the inputs are not observable, the investments are classified as Level 3.
| abfunds.com | AB EMERGING MARKETS MULTI-ASSET PORTFOLIO | 49 | |
NOTES TO FINANCIAL STATEMENTS (continued)
The following table summarizes the valuation of the Fund’s investments by the above fair value hierarchy levels as of September 30, 2021:
| Investments in Securities |
Level 1 | Level 2 | Level 3 | Total | ||||||||||||
| Assets: |
||||||||||||||||
| Common Stocks: |
||||||||||||||||
| Financials |
$ | 3,517,092 | $ | 22,021,653 | $ | – 0 | – | $ | 25,538,745 | |||||||
| Information Technology |
2,370,269 | 22,153,465 | – 0 | – | 24,523,734 | |||||||||||
| Consumer Discretionary |
1,324,010 | 10,729,408 | – 0 | – | 12,053,418 | |||||||||||
| Materials |
1,551,573 | 10,262,434 | – 0 | – | 11,814,007 | |||||||||||
| Energy |
3,236,890 | 5,578,728 | – 0 | – | 8,815,618 | |||||||||||
| Communication Services |
486,228 | 4,451,194 | – 0 | – | 4,937,422 | |||||||||||
| Industrials |
2,091,072 | 1,989,722 | – 0 | – | 4,080,794 | |||||||||||
| Real Estate |
1,369,638 | 2,537,917 | – 0 | – | 3,907,555 | |||||||||||
| Utilities |
1,147,064 | 2,434,663 | – 0 | – | 3,581,727 | |||||||||||
| Consumer Staples |
846,409 | 1,596,603 | – 0 | – | 2,443,012 | |||||||||||
| Health Care |
854,475 | 1,513,904 | – 0 | – | 2,368,379 | |||||||||||
| Fixed Income Securities: |
||||||||||||||||
| Sovereign Bonds |
– 0 | – | 37,411,386 | – 0 | – | 37,411,386 | ||||||||||
| Corporate Bonds |
– 0 | – | 14,518,536 | 1,060 | 14,519,596 | |||||||||||
| Quasi-Sovereign Bonds |
– 0 | – | 11,754,863 | – 0 | – | 11,754,863 | ||||||||||
| Emerging Markets—Treasuries |
– 0 | – | 2,852,299 | – 0 | – | 2,852,299 | ||||||||||
| Treasury Bonds |
– 0 | – | 2,225,180 | – 0 | – | 2,225,180 | ||||||||||
| Regional Bonds |
– 0 | – | 43,270 | – 0 | – | 43,270 | ||||||||||
| Equity Linked Notes |
– 0 | – | 1,904,666 | – 0 | – | 1,904,666 | ||||||||||
| Investment Companies |
– 0 | – | 257,426 | – 0 | – | 257,426 | ||||||||||
| Short-Term Investments: |
||||||||||||||||
| Investment Companies |
5,704,068 | – 0 | – | – 0 | – | 5,704,068 | ||||||||||
| Time Deposits |
– 0 | – | 727,101 | – 0 | – | 727,101 | ||||||||||
| Investments of Cash Collateral for Securities Loaned in |
1,512,481 | – 0 | – | – 0 | – | 1,512,481 | ||||||||||
|
|
|
|
|
|
|
|
|
|||||||||
| Total Investments in Securities |
26,011,269 | 156,964,418 | + | 1,060 | 182,976,747 | |||||||||||
| Other Financial Instruments*: |
||||||||||||||||
| Assets |
||||||||||||||||
| Futures |
16,234 | 115,879 | – 0 | – | 132,113 | † | ||||||||||
| Forward Currency Exchange Contracts |
– 0 | – | 1,700,326 | – 0 | – | 1,700,326 | ||||||||||
| Centrally Cleared Credit Default Swaps |
– 0 | – | 844,539 | – 0 | – | 844,539 | † | |||||||||
| Centrally Cleared Interest Rate Swaps |
– 0 | – | 82,076 | – 0 | – | 82,076 | † | |||||||||
| Variance Swaps |
– 0 | – | 167,968 | – 0 | – | 167,968 | ||||||||||
| Liabilities |
||||||||||||||||
| Futures |
(558,121 | ) | – 0 | – | – 0 | – | (558,121 | )† | ||||||||
| Forward Currency Exchange Contracts |
– 0 | – | (1,081,235 | ) | – 0 | – | (1,081,235 | ) | ||||||||
| Centrally Cleared Inflation Swaps |
– 0 | – | (34,960 | ) | – 0 | – | (34,960 | )† | ||||||||
| Centrally Cleared Interest Rate Swaps |
– 0 | – | (4,436 | ) | – 0 | – | (4,436 | )† | ||||||||
| Total Return Swaps |
– 0 | – | (250,347 | ) | – 0 | – | (250,347 | ) | ||||||||
| Variance Swaps |
– 0 | – | (22,630 | ) | – 0 | – | (22,630 | ) | ||||||||
|
|
|
|
|
|
|
|
|
|||||||||
| Total |
$ | 25,469,382 | $ | 158,481,598 | $ | 1,060 | $ | 183,952,040 | ||||||||
|
|
|
|
|
|
|
|
|
|||||||||
| 50 | AB EMERGING MARKETS MULTI-ASSET PORTFOLIO |
abfunds.com | |
NOTES TO FINANCIAL STATEMENTS (continued)
| * | Other financial instruments are derivative instruments, such as futures, forwards and swaps, which are valued at the unrealized appreciation/(depreciation) on the instrument. Other financial instruments may also include swaps with upfront premiums, options written and swaptions written which are valued at market value. |
| + | A significant portion of the Fund’s foreign equity investments are categorized as Level 2 investments since they are valued using fair value prices based on third party vendor modeling tools to the extent available, see Note A.1. |
| † | Only variation margin receivable/payable at period end is reported within the statement of assets and liabilities. This amount reflects cumulative unrealized appreciation/(depreciation) on futures and centrally cleared swaps as reported in the portfolio of investments. Where applicable, centrally cleared swaps with upfront premiums are presented here at market value. |
3. Currency Translation
Assets and liabilities denominated in foreign currencies and commitments under forward currency exchange contracts are translated into U.S. dollars at the mean of the quoted bid and ask prices of such currencies against the U.S. dollar. Purchases and sales of portfolio securities are translated into U.S. dollars at the rates of exchange prevailing when such securities were acquired or sold. Income and expenses are translated into U.S. dollars at the rates of exchange prevailing when accrued.
Net realized gain or loss on foreign currency transactions represents foreign exchange gains and losses from sales and maturities of foreign fixed income investments, holding of foreign currencies, currency gains or losses realized between the trade and settlement dates on foreign investment transactions, and the difference between the amounts of dividends, interest and foreign withholding taxes recorded on the Fund’s books and the U.S. dollar equivalent amounts actually received or paid. Net unrealized currency gains and losses from valuing foreign currency denominated assets and liabilities at period end exchange rates are reflected as a component of net unrealized appreciation or depreciation of foreign currency denominated assets and liabilities.
4. Taxes
It is the Fund’s policy to meet the requirements of the Internal Revenue Code applicable to regulated investment companies and to distribute all of its investment company taxable income and net realized gains, if any, to shareholders. Therefore, no provisions for federal income or excise taxes are required. The Fund may be subject to taxes imposed by countries in which it invests. Such taxes are generally based on income and/or capital gains earned or repatriated. Taxes are accrued and applied to net investment income, net realized gains and net unrealized appreciation/depreciation as such income and/or gains are earned.
In accordance with U.S. GAAP requirements regarding accounting for uncertainties in income taxes, management has analyzed the Fund’s tax positions taken or expected to be taken on federal and state income tax
| abfunds.com | AB EMERGING MARKETS MULTI-ASSET PORTFOLIO | 51 | |
NOTES TO FINANCIAL STATEMENTS (continued)
returns for all open tax years (the current and the prior three tax years) and has concluded that no provision for income tax is required in the Fund’s financial statements.
5. Investment Income and Investment Transactions
Dividend income is recorded on the ex-dividend date or as soon as the Fund is informed of the dividend. Interest income is accrued daily. Investment transactions are accounted for on the date the securities are purchased or sold. Investment gains or losses are determined on the identified cost basis. The Fund amortizes premiums and accretes discounts as adjustments to interest income. The Fund accounts for distributions received from REIT investments or from regulated investment companies as dividend income, realized gain, or return of capital based on information provided by the REIT or the investment company.
6. Class Allocations
All income earned and expenses incurred by the Fund are borne on a pro-rata basis by each outstanding class of shares, based on the proportionate interest in the Fund represented by the net assets of such class, except for class specific expenses which are allocated to the respective class. Expenses of the Company are charged proportionately to each portfolio or based on other appropriate methods. Realized and unrealized gains and losses are allocated among the various share classes based on respective net assets.
7. Dividends and Distributions
Dividends and distributions to shareholders, if any, are recorded on the ex-dividend date. Income dividends and capital gains distributions are determined in accordance with federal tax regulations and may differ from those determined in accordance with U.S. GAAP. To the extent these differences are permanent, such amounts are reclassified within the capital accounts based on their federal tax basis treatment; temporary differences do not require such reclassification.
NOTE B
Advisory Fee and Other Transactions with Affiliates
Under the terms of the investment advisory agreement, the Fund pays the Adviser an advisory fee at an annual rate of .85% of the first $1 billion, .80% of the next $1 billion, .75% of the next $1 billion and .70% in excess of $3 billion of the Fund’s average daily net assets. The fee is accrued daily and paid monthly. The Adviser has agreed to waive its fees and bear certain expenses to the extent necessary to limit total operating expenses on an annual basis (“the Expense Caps”) to 1.24%, 1.99%, .99%, 1.49%, 1.24%, .99% and .99% of the daily average net assets for the Class A, Class C, Advisor Class, Class R, Class K, Class I and Class Z shares,
| 52 | AB EMERGING MARKETS MULTI-ASSET PORTFOLIO |
abfunds.com | |
NOTES TO FINANCIAL STATEMENTS (continued)
respectively. For the six months ended September 30, 2021, such waivers/reimbursements amounted to $272,372. The Expense Caps may not be terminated before July 31, 2022.
Pursuant to the investment advisory agreement, the Fund may reimburse the Adviser for certain legal and accounting services provided to the Fund by the Adviser. For the six months ended September 30, 2021, the reimbursement for such services amounted to $38,067.
The Fund compensates AllianceBernstein Investor Services, Inc. (“ABIS”), a wholly-owned subsidiary of the Adviser, under a Transfer Agency Agreement for providing personnel and facilities to perform transfer agency services for the Fund. ABIS may make payments to intermediaries that provide omnibus account services, sub-accounting services and/or networking services. Such compensation retained by ABIS amounted to $15,193 for the six months ended September 30, 2021.
AllianceBernstein Investments, Inc. (the “Distributor”), a wholly-owned subsidiary of the Adviser, serves as the distributor of the Fund’s shares. The Distributor has advised the Fund that it has retained front-end sales charges of $202 from the sale of Class A shares and received $48 and $0 in contingent deferred sales charges imposed upon redemptions by shareholders of Class A and Class C shares, respectively, for the six months ended September 30, 2021.
The Fund may invest in AB Government Money Market Portfolio (the “Government Money Market Portfolio”) which has a contractual annual advisory fee rate of .20% of the portfolio’s average daily net assets and bears its own expenses. The Adviser has contractually agreed to waive .10% of the advisory fee of Government Money Market Portfolio (resulting in a net advisory fee of .10%) until August 31, 2022. In connection with the investment by the Fund in Government Money Market Portfolio, the Adviser has contractually agreed to waive its advisory fee from the Fund in an amount equal to the Fund’s pro rata share of the effective advisory fee of Government Money Market Portfolio, as borne indirectly by the Fund as an acquired fund fee and expense. For the six months ended September 30, 2021, such waiver amounted to $3,091.
| abfunds.com | AB EMERGING MARKETS MULTI-ASSET PORTFOLIO | 53 | |
NOTES TO FINANCIAL STATEMENTS (continued)
A summary of the Fund’s transactions in AB mutual funds for the six months ended September 30, 2021 is as follows:
| Distributions | ||||||||||||||||||||
| Fund |
Market Value 3/31/21 (000) |
Purchases at Cost (000) |
Sales Proceeds (000) |
Market Value 9/30/21 (000) |
Dividend Income (000) |
|||||||||||||||
| Government Money Market Portfolio |
$ | 12,729 | $ | 43,458 | $ | 50,483 | $ | 5,704 | $ | 1 | ||||||||||
| Government Money Market Portfolio* |
634 | 9,074 | 8,195 | 1,513 | 0 | ** | ||||||||||||||
|
|
|
|
|
|||||||||||||||||
| Total |
$ | 7,217 | $ | 1 | ||||||||||||||||
|
|
|
|
|
|||||||||||||||||
| * | Investment of cash collateral for securities lending transactions (see Note E). |
| ** | Amount is less than $500. |
NOTE C
Distribution Services Agreement
The Fund has adopted a Distribution Services Agreement (the “Agreement”) pursuant to Rule 12b-1 under the Investment Company Act of 1940. Under the Agreement the Fund pays distribution and servicing fees to the Distributor at an annual rate of up to .30% of the Fund’s average daily net assets attributable to Class A shares, 1% of the Fund’s average daily net assets attributable to Class C shares, .50% of the Fund’s average daily net assets attributable to Class R shares and .25% of the Fund’s average daily net assets attributable to Class K shares. Payments under the Agreement in respect of Class A shares are currently limited to an annual rate of .25% of Class A share’s average daily net assets. There are no distribution and servicing fees on Advisor Class and Class I shares. The fees are accrued daily and paid monthly. The Agreement provides that the Distributor will use such payments in their entirety for distribution assistance and promotional activities. Since the commencement of the Fund’s operation, the Distributor has incurred expenses in excess of the distribution costs reimbursed by the Fund in the amounts of $9,041, $897 and $2,386 for Class C, Class K and Class R shares, respectively. While such costs may be recovered from the Fund in future periods so long as the Agreement is in effect, the rate of the distribution and servicing fees payable under the Agreement may not be increased without a shareholder vote. In accordance with the Agreement, there is no provision for recovery of unreimbursed distribution costs, incurred by the Distributor, beyond the current fiscal period for Class A shares. The Agreement also provides that the Adviser may use its own resources to finance the distribution of the Fund’s shares.
| 54 | AB EMERGING MARKETS MULTI-ASSET PORTFOLIO |
abfunds.com | |
NOTES TO FINANCIAL STATEMENTS (continued)
NOTE D
Investment Transactions
Purchases and sales of investment securities (excluding short-term investments) for the six months ended September 30, 2021, were as follows:
| Purchases | Sales | |||||||
| Investment securities (excluding U.S. government securities) |
$ | 79,981,233 | $ | 76,173,960 | ||||
| U.S. government securities |
– 0 | – | – 0 | – | ||||
The cost of investments for federal income tax purposes was substantially the same as the cost for financial reporting purposes. Accordingly, gross unrealized appreciation and unrealized depreciation are as follows:
| Gross unrealized appreciation |
$ | 29,702,944 | ||
| Gross unrealized depreciation |
(10,748,449 | ) | ||
|
|
|
|||
| Net unrealized appreciation |
$ | 18,954,495 | ||
|
|
|
1. Derivative Financial Instruments
The Fund may use derivatives in an effort to earn income and enhance returns, to replace more traditional direct investments, to obtain exposure to otherwise inaccessible markets (collectively, “investment purposes”), or to hedge or adjust the risk profile of its portfolio.
The principal types of derivatives utilized by the Fund, as well as the methods in which they may be used are:
| • | Forward Currency Exchange Contracts |
The Fund may enter into forward currency exchange contracts in order to hedge its exposure to changes in foreign currency exchange rates on its foreign portfolio holdings, to hedge certain firm purchase and sale commitments denominated in foreign currencies and for non-hedging purposes as a means of making direct investments in foreign currencies, as described below under “Currency Transactions”.
A forward currency exchange contract is a commitment to purchase or sell a foreign currency at a future date at a negotiated forward rate. The gain or loss arising from the difference between the original contract and the closing of such contract would be included in net realized gain or loss on forward currency exchange contracts. Fluctuations in the value of open forward currency exchange contracts are recorded for financial reporting purposes as unrealized appreciation and/or depreciation by the Fund. Risks may arise from the potential inability of a counterparty to meet the terms of a contract and from unanticipated movements in the value of a foreign currency relative to the U.S. dollar.
| abfunds.com | AB EMERGING MARKETS MULTI-ASSET PORTFOLIO | 55 | |
NOTES TO FINANCIAL STATEMENTS (continued)
During the six months ended September 30, 2021, the Fund held forward currency exchange contracts for hedging and non-hedging purposes.
| • | Futures |
The Fund may buy or sell futures for investment purposes or for the purpose of hedging its portfolio against adverse effects of potential movements in the market. The Fund bears the market risk that arises from changes in the value of these instruments and the imperfect correlation between movements in the price of the futures and movements in the price of the assets, reference rates or indices which they are designed to track. Among other things, the Fund may purchase or sell futures for foreign currencies or options thereon for non-hedging purposes as a means of making direct investment in foreign currencies, as described below under “Currency Transactions”.
At the time the Fund enters into futures, the Fund deposits and maintains as collateral an initial margin with the broker, as required by the exchange on which the transaction is effected. Such amount is shown as cash collateral due from broker on the statement of assets and liabilities. Pursuant to the contract, the Fund agrees to receive from or pay to the broker an amount of cash equal to the daily fluctuation in the value of the contract. Such receipts or payments are known as variation margin and are recorded by the Fund as unrealized gains or losses. Risks may arise from the potential inability of a counterparty to meet the terms of the contract. The credit/ counterparty risk for exchange-traded futures is generally less than privately negotiated futures, since the clearinghouse, which is the issuer or counterparty to each exchange-traded future, has robust risk mitigation standards, including the requirement to provide initial and variation margin. When the contract is closed, the Fund records a realized gain or loss equal to the difference between the value of the contract at the time it was opened and the time it was closed.
Use of long futures subjects the Fund to risk of loss in excess of the amounts shown on the statement of assets and liabilities, up to the notional value of the futures. Use of short futures subjects the Fund to unlimited risk of loss. Under some circumstances, futures exchanges may establish daily limits on the amount that the price of futures can vary from the previous day’s settlement price, which could effectively prevent liquidation of unfavorable positions.
During the six months ended September 30, 2021, the Fund held futures for hedging and non-hedging purposes.
| 56 | AB EMERGING MARKETS MULTI-ASSET PORTFOLIO |
abfunds.com | |
NOTES TO FINANCIAL STATEMENTS (continued)
| • | Option Transactions |
For hedging and investment purposes, the Fund may purchase and write (sell) put and call options on U.S. and foreign securities, including government securities, and foreign currencies that are traded on U.S. and foreign securities exchanges and over-the-counter markets. Among other things, the Fund may use options transactions for non-hedging purposes as a means of making direct investments in foreign currencies, as described below under “Currency Transactions” and may use options strategies involving the purchase and/or writing of various combinations of call and/or put options, for hedging and investment purposes.
The risk associated with purchasing an option is that the Fund pays a premium whether or not the option is exercised. Additionally, the Fund bears the risk of loss of the premium and change in market value should the counterparty not perform under the contract. If a put or call option purchased by the Fund were permitted to expire without being sold or exercised, its premium would represent a loss to the Fund. Put and call options purchased are accounted for in the same manner as portfolio securities. The cost of securities acquired through the exercise of call options is increased by premiums paid. The proceeds from securities sold through the exercise of put options are decreased by the premiums paid.
When the Fund writes an option, the premium received by the Fund is recorded as a liability and is subsequently adjusted to the current market value of the option written. The Fund’s maximum payment for written put options equates to the number of shares multiplied by the strike price. In certain circumstances maximum payout amounts may be partially offset by recovery values of the respective referenced assets and upfront premium received upon entering into the contract. Premiums received from written options which expire unexercised are recorded by the Fund on the expiration date as realized gains from options written. The difference between the premium received and the amount paid on effecting a closing purchase transaction, including brokerage commissions, is also treated as a realized gain, or if the premium received is less than the amount paid for the closing purchase transaction, as a realized loss. If a call option is exercised, the premium received is added to the proceeds from the sale of the underlying security or currency in determining whether the Fund has realized a gain or loss. If a put option is exercised, the premium received reduces the cost basis of the security or currency purchased by the Fund. In writing an option, the Fund bears the market risk of an unfavorable change in the price of the security or currency underlying the written option. Exercise of an option written by the Fund could result in the Fund selling or buying a security or currency at a price different from the current market value.
| abfunds.com | AB EMERGING MARKETS MULTI-ASSET PORTFOLIO | 57 | |
NOTES TO FINANCIAL STATEMENTS (continued)
The Fund may also invest in options on swap agreements, also called “swaptions”. A swaption is an option that gives the buyer the right, but not the obligation, to enter into a swap on a future date in exchange for paying a market-based “premium”. A receiver swaption gives the owner the right to receive the total return of a specified asset, reference rate, or index. A payer swaption gives the owner the right to pay the total return of a specified asset, reference rate, or index. Swaptions also include options that allow an existing swap to be terminated or extended by one of the counterparties. The Fund’s maximum payment for written put swaptions equates to the notional amount of the underlying swap. In certain circumstances maximum payout amounts may be partially offset by recovery values of the respective referenced assets and upfront premium received upon entering into the contract.
During the six months ended September 30, 2021, the Fund held purchased swaptions for hedging and non-hedging purposes.
During the six months ended September 30, 2021, the Fund held written swaptions for hedging and non-hedging purposes.
| • | Swaps |
The Fund may enter into swaps to hedge its exposure to interest rates, credit risk or currencies. The Fund may also enter into swaps for non-hedging purposes as a means of gaining market exposures including by making direct investments in foreign currencies, as described below under “Currency Transactions” or in order to take a “long” or “short” position with respect to an underlying referenced asset described below under “Total Return Swaps”. A swap is an agreement that obligates two parties to exchange a series of cash flows at specified intervals based upon or calculated by reference to changes in specified prices or rates for a specified amount of an underlying asset. The payment flows are usually netted against each other, with the difference being paid by one party to the other. In addition, collateral may be pledged or received by the Fund in accordance with the terms of the respective swaps to provide value and recourse to the Fund or its counterparties in the event of default, bankruptcy or insolvency by one of the parties to the swap.
Risks may arise as a result of the failure of the counterparty to the swap to comply with the terms of the swap. The loss incurred by the failure of a counterparty is generally limited to the net interim payment to be received by the Fund, and/or the termination value at the end of the contract. Therefore, the Fund considers the creditworthiness of each counterparty to a swap in evaluating potential counterparty risk. This risk is mitigated by having a netting arrangement between the Fund and the counterparty and by the posting of collateral by the counterparty to the
| 58 | AB EMERGING MARKETS MULTI-ASSET PORTFOLIO |
abfunds.com | |
NOTES TO FINANCIAL STATEMENTS (continued)
Fund to cover the Fund’s exposure to the counterparty. Additionally, risks may arise from unanticipated movements in interest rates or in the value of the underlying securities. The Fund accrues for the interim payments on swaps on a daily basis, with the net amount recorded within unrealized appreciation/ depreciation of swaps on the statement of assets and liabilities, where applicable. Once the interim payments are settled in cash, the net amount is recorded as realized gain/(loss) on swaps on the statement of operations, in addition to any realized gain/(loss) recorded upon the termination of swaps. Upfront premiums paid or received for swaps are recognized as cost or proceeds on the statement of assets and liabilities and are amortized on a straight line basis over the life of the contract. Amortized upfront premiums are included in net realized gain/(loss) from swaps on the statement of operations. Fluctuations in the value of swaps are recorded as a component of net change in unrealized appreciation/depreciation of swaps on the statement of operations.
Certain standardized swaps, including certain interest rate swaps and credit default swaps, are (or soon will be) subject to mandatory central clearing. Cleared swaps are transacted through futures commission merchants (“FCMs”) that are members of central clearinghouses, with the clearinghouse serving as central counterparty, similar to transactions in futures contracts. Centralized clearing will be required for additional categories of swaps on a phased-in basis based on requirements published by the Securities and Exchange Commission and Commodity Futures Trading Commission.
At the time the Fund enters into a centrally cleared swap, the Fund deposits and maintains as collateral an initial margin with the broker, as required by the clearinghouse on which the transaction is effected. Such amount is shown as cash collateral due from broker on the statement of assets and liabilities. Pursuant to the contract, the Fund agrees to receive from or pay to the broker an amount of cash equal to the daily fluctuation in the value of the contract. Such receipts or payments are known as variation margin and are recorded by the Fund as unrealized gains or losses. Risks may arise from the potential inability of a counterparty to meet the terms of the contract. The credit/counterparty risk for centrally cleared swaps is generally less than non-centrally cleared swaps, since the clearinghouse, which is the issuer or counterparty to each centrally cleared swap, has robust risk mitigation standards, including the requirement to provide initial and variation margin. When the contract is closed, the Fund records a realized gain or loss equal to the difference between the value of the contract at the time it was opened and the time it was closed.
| abfunds.com | AB EMERGING MARKETS MULTI-ASSET PORTFOLIO | 59 | |
NOTES TO FINANCIAL STATEMENTS (continued)
Interest Rate Swaps:
The Fund is subject to interest rate risk exposure in the normal course of pursuing its investment objectives. Because the Fund holds fixed rate bonds, the value of these bonds may decrease if interest rates rise. To help hedge against this risk and to maintain its ability to generate income at prevailing market rates, the Fund may enter into interest rate swaps. Interest rate swaps are agreements between two parties to exchange cash flows based on a notional amount. The Fund may elect to pay a fixed rate and receive a floating rate, or, receive a fixed rate and pay a floating rate on a notional amount.
In addition, the Fund may also enter into interest rate swap transactions to preserve a return or spread on a particular investment or portion of its portfolio, or protecting against an increase in the price of securities the Fund anticipates purchasing at a later date. Interest rate swaps involve the exchange by a Fund with another party of their respective commitments to pay or receive interest (e.g., an exchange of floating rate payments for fixed rate payments) computed based on a contractually-based principal (or “notional”) amount. Interest rate swaps are entered into on a net basis (i.e., the two payment streams are netted out, with the Fund receiving or paying, as the case may be, only the net amount of the two payments).
During the six months ended September 30, 2021, the Fund held interest rate swaps for hedging and non-hedging purposes.
Credit Default Swaps:
The Fund may enter into credit default swaps, including to manage its exposure to the market or certain sectors of the market, to reduce its risk exposure to defaults by corporate and sovereign issuers held by the Fund, or to create exposure to corporate or sovereign issuers to which it is not otherwise exposed. The Fund may purchase credit protection (“Buy Contract”) or provide credit protection (“Sale Contract”) on the referenced obligation of the credit default swap. During the term of the swap, the Fund receives/(pays) fixed payments from/(to) the respective counterparty, calculated at the agreed upon rate applied to the notional amount. If the Fund is a buyer/(seller) of protection and a credit event occurs, as defined under the terms of the swap, the Fund will either (i) receive from the seller/(pay to the buyer) of protection an amount equal to the notional amount of the swap (the “Maximum Payout Amount”) and deliver/(take delivery of) the referenced obligation or (ii) receive/(pay) a net settlement amount in the form of cash or securities equal to the notional amount of the swap less the recovery value of the referenced obligation. In certain circumstances Maximum Payout Amounts may be partially offset by recovery values of the respective referenced obligations, upfront premium received upon entering into the
| 60 | AB EMERGING MARKETS MULTI-ASSET PORTFOLIO |
abfunds.com | |
NOTES TO FINANCIAL STATEMENTS (continued)
agreement, or net amounts received from settlement of buy protection credit default swaps entered into by the Fund for the same referenced obligation with the same counterparty.
Credit default swaps may involve greater risks than if the Fund had invested in the referenced obligation directly. Credit default swaps are subject to general market risk, liquidity risk, counterparty risk and credit risk. If the Fund is a buyer of protection and no credit event occurs, it will lose the payments it made to its counterparty. If the Fund is a seller of protection and a credit event occurs, the value of the referenced obligation received by the Fund coupled with the periodic payments previously received may be less than the Maximum Payout Amount it pays to the buyer, resulting in a net loss to the Fund.
Implied credit spreads over U.S. Treasuries of comparable maturity utilized in determining the market value of credit default swaps on issuers as of period end are disclosed in the portfolio of investments. The implied spreads serve as an indicator of the current status of the payment/ performance risk and typically reflect the likelihood of default by the issuer of the referenced obligation. The implied credit spread of a particular reference obligation also reflects the cost of buying/selling protection and may reflect upfront payments required to be made to enter into the agreement. Widening credit spreads typically represent a deterioration of the referenced obligation’s credit soundness and greater likelihood of default or other credit event occurring as defined under the terms of the agreement. A credit spread identified as “Defaulted” indicates a credit event has occurred for the referenced obligation.
During the six months ended September 30, 2021, the Fund held credit default swaps for hedging and non-hedging purposes.
Total Return Swaps:
The Fund may enter into total return swaps in order to take a “long” or “short” position with respect to an underlying referenced asset. The Fund is subject to market price volatility of the underlying referenced asset. A total return swap involves commitments to pay interest in exchange for a market linked return based on a notional amount. To the extent that the total return of the security, group of securities or index underlying the transaction exceeds or falls short of the offsetting interest obligation, the Fund will receive a payment from or make a payment to the counterparty.
During the six months ended September 30, 2021, the Fund held total return swaps for hedging and non-hedging purposes.
Variance Swaps:
The Fund may enter into variance swaps to hedge equity market risk or adjust exposure to the equity markets. Variance swaps are contracts in
| abfunds.com | AB EMERGING MARKETS MULTI-ASSET PORTFOLIO | 61 | |
NOTES TO FINANCIAL STATEMENTS (continued)
which two parties agree to exchange cash payments based on the difference between the stated level of variance and the actual variance realized on underlying asset(s) or index(es). Actual “variance” as used here is defined as the sum of the square of the returns on the reference asset(s) or index(es) (which in effect is a measure of its “volatility”) over the length of the contract term. So the parties to a variance swap can be said to exchange actual volatility for a contractually stated rate of volatility.
During the six months ended September 30, 2021, the Fund held variance swaps for hedging and non-hedging purposes.
The Fund typically enters into International Swaps and Derivatives Association, Inc. Master Agreements (“ISDA Master Agreement”) with its OTC derivative contract counterparties in order to, among other things, reduce its credit risk to OTC counterparties. ISDA Master Agreements include provisions for general obligations, representations, collateral and events of default or termination. Under an ISDA Master Agreement, the Fund typically may offset with the OTC counterparty certain derivative financial instruments’ payables and/or receivables with collateral held and/or posted and create one single net payment (close-out netting) in the event of default or termination. In the event of a default by an OTC counterparty, the return of collateral with market value in excess of the Fund’s net liability, held by the defaulting party, may be delayed or denied.
The Fund’s ISDA Master Agreements may contain provisions for early termination of OTC derivative transactions in the event the net assets of the Fund decline below specific levels (“net asset contingent features”). If these levels are triggered, the Fund’s OTC counterparty has the right to terminate such transaction and require the Fund to pay or receive a settlement amount in connection with the terminated transaction. If OTC derivatives were held at period end, please refer to netting arrangements by the OTC counterparty tables below for additional details.
During the six months ended September 30, 2021, the Fund had entered into the following derivatives:
| Asset Derivatives |
Liability Derivatives |
|||||||||||
| Derivative Type |
Statement of |
Fair Value | Statement of |
Fair Value | ||||||||
| Interest rate |
Receivable for variation margin on centrally cleared swaps |
$ |
82,076 |
* |
Payable for variation margin on centrally cleared swaps |
$ |
39,396 |
* | ||||
| 62 | AB EMERGING MARKETS MULTI-ASSET PORTFOLIO |
abfunds.com | |
NOTES TO FINANCIAL STATEMENTS (continued)
| Asset Derivatives |
Liability Derivatives |
|||||||||||
| Derivative Type |
Statement of |
Fair Value | Statement of |
Fair Value | ||||||||
| Interest rate contracts |
Receivable for variation margin on futures |
$ |
16,234 |
* |
Payable for variation margin on futures |
$ |
81,765 |
* | ||||
| Foreign currency contracts |
Unrealized appreciation on forward currency exchange contracts |
|
1,700,326 |
Unrealized depreciation on forward currency exchange contracts |
|
1,081,235 |
||||||
| Credit contracts |
Receivable for variation margin on centrally cleared swaps | 135,266 | * | |||||||||
| Equity contracts |
Unrealized appreciation on variance swaps | 167,968 | Unrealized depreciation on variance swaps | 22,630 | ||||||||
| Equity contracts |
Unrealized depreciation on total return swap | 250,347 | ||||||||||
| Equity contracts |
Receivable for variation margin on futures | 115,879 | * | Payable for variation margin on futures | 476,356 | * | ||||||
|
|
|
|
|
|||||||||
| Total |
$ | 2,217,749 | $ | 1,951,729 | ||||||||
|
|
|
|
|
|||||||||
| * | Only variation margin receivable/payable at period end is reported within the statement of assets and liabilities. This amount reflects cumulative unrealized appreciation/depreciation on futures and centrally cleared swaps as reported in the portfolio of investments. |
| Derivative Type |
Location of Gain or |
Realized Gain or (Loss) on Derivatives |
Change in Unrealized Appreciation or (Depreciation) |
|||||||
| Interest rate contracts |
Net realized gain/(loss) on swaps; Net change in unrealized appreciation/ depreciation on swaps | $ | (18,990 | ) | $ | 21,389 | ||||
| Interest rate contracts |
Net realized gain/(loss) on futures; Net change in unrealized appreciation/ depreciation on futures | (28,872 | ) | (94,156 | ) | |||||
| Foreign currency |
Net realized gain/(loss) on forward currency exchange contracts; Net change in unrealized appreciation/depreciation on forward currency exchange contracts |
|
912,037 |
|
(351,826 |
) | ||||
| abfunds.com | AB EMERGING MARKETS MULTI-ASSET PORTFOLIO | 63 | |
NOTES TO FINANCIAL STATEMENTS (continued)
| Derivative Type |
Location of Gain or |
Realized Gain or (Loss) on Derivatives |
Change in Unrealized Appreciation or (Depreciation) |
|||||||
| Credit contracts |
Net realized gain/(loss) on investment transactions; Net change in unrealized appreciation/depreciation on investments | $ | (185,756 | ) | $ | 75,479 | ||||
| Credit contracts |
Net realized gain/(loss) on swaps; Net change in unrealized appreciation/depreciation on swaps | (203,445 | ) | 7,728 | ||||||
| Credit contracts |
Net realized gain/(loss) on swaptions written; Net change in unrealized appreciation/depreciation on swaptions written | 145,486 | (77,821 | ) | ||||||
| Equity contracts |
Net realized gain/(loss) on swaps; Net change in unrealized appreciation/depreciation on swaps | (3,890,535 | ) | 2,187,700 | ||||||
| Equity contracts |
Net realized gain/(loss) on futures; Net change in unrealized appreciation/depreciation on futures | (955,996 | ) | (353,617 | ) | |||||
|
|
|
|
|
|||||||
| Total |
$ | (4,226,071 | ) | $ | 1,414,876 | |||||
|
|
|
|
|
|||||||
The following table represents the average monthly volume of the Fund’s derivative transactions during the six months ended September 30, 2021:
| Centrally Cleared Credit Default Swaps: |
||||
| Average notional amount of buy contracts |
$ | 17,867,857 | ||
| Centrally Cleared Interest Rate Swaps |
||||
| Average notional amount |
$ | 6,918,880 | ||
| Credit Default Swaps: |
||||
| Average notional amount of sale contracts |
$ | 56,000 | (a) | |
| Forward Currency Exchange Contracts: |
||||
| Average principal amount of buy contracts |
$ | 76,373,796 | ||
| Average principal amount of sale contracts |
$ | 113,147,626 | ||
| Futures: |
||||
| Average notional amount of buy contracts |
$ | 18,433,136 | ||
| Average notional amount of sale contracts |
$ | 1,169,103 | ||
| Total Return Swaps: |
||||
| Average notional amount |
$ | 18,913,231 | ||
| Variance Swaps: |
||||
| Average notional amount |
$ | 803,720 | ||
| Purchased Swaptions: |
||||
| Average notional amount |
$ | 14,503,333 | (a) | |
| Swaptions Written: |
||||
| Average notional amount |
$ | 29,006,667 | (a) |
| (a) | Positions were open for two months during the reporting period. |
| 64 | AB EMERGING MARKETS MULTI-ASSET PORTFOLIO |
abfunds.com | |
NOTES TO FINANCIAL STATEMENTS (continued)
For financial reporting purposes, the Fund does not offset derivative assets and derivative liabilities that are subject to netting arrangements in the statement of assets and liabilities.
All OTC derivatives held at period end were subject to netting arrangements. The following table presents the Fund’s derivative assets and liabilities by OTC counterparty net of amounts available for offset under ISDA Master Agreements (“MA”) and net of the related collateral received/pledged by the Fund as of September 30, 2021. Exchange-traded derivatives and centrally cleared swaps are not subject to netting arrangements and as such are excluded from the tables.
| Counterparty |
Derivative Assets Subject to a MA |
Derivatives Available for Offset |
Cash Collateral Received* |
Security Collateral Received* |
Net Amount of Derivative Assets |
|||||||||||||||
| Bank of America, NA. |
$ | 92,115 | $ | (10,395 | ) | $ | – 0 | – | $ | – 0 | – | $ | 81,720 | |||||||
| Barclays Bank PLC |
64,970 | (64,970 | ) | – 0 | – | – 0 | – | – 0 | – | |||||||||||
| BNP Paribas |
139,764 | – 0 | – | – 0 | – | – 0 | – | 139,764 | ||||||||||||
| Brown Brothers Harriman & Co. |
319,544 | (233,484 | ) | – 0 | – | – 0 | – | 86,060 | ||||||||||||
| Citibank, NA. |
116,646 | (35,126 | ) | – 0 | – | – 0 | – | 81,520 | ||||||||||||
| Deutsche Bank AG |
102,175 | (102,175 | ) | – 0 | – | – 0 | – | – 0 | – | |||||||||||
| Goldman Sachs Bank USA/Goldman Sachs International |
121,481 | (121,481 | ) | – 0 | – | – 0 | – | – 0 | – | |||||||||||
| HSBC Bank USA. |
82,767 | (34,071 | ) | – 0 | – | – 0 | – | 48,696 | ||||||||||||
| JPMorgan Chase Bank, NA. |
165,275 | (2,278 | ) | – 0 | – | – 0 | – | 162,997 | ||||||||||||
| Morgan Stanley Capital Services LLC/Morgan Stanley & Co. International PLC |
19,254 | (19,254 | ) | – 0 | – | – 0 | – | – 0 | – | |||||||||||
| Standard Chartered Bank. |
636,096 | (245,003 | ) | (260,000 | ) | – 0 | – | 131,093 | ||||||||||||
| UBS AG |
8,207 | (8,207 | ) | – 0 | – | – 0 | – | – 0 | – | |||||||||||
|
|
|
|
|
|
|
|
|
|
|
|||||||||||
| Total |
$ | 1,868,294 | $ | (876,444 | ) | $ | (260,000 | ) | $ | – 0 | – | $ | 731,850 | ^ | ||||||
|
|
|
|
|
|
|
|
|
|
|
|||||||||||
| Counterparty |
Derivative Liabilities Subject to a MA |
Derivatives Available for Offset |
Cash Collateral Pledged* |
Security Collateral Pledged* |
Net Amount of Derivative Liabilities |
|||||||||||||||
| Bank of America, NA. |
$ | 10,395 | $ | (10,395 | ) | $ | – 0 | – | $ | – 0 | – | $ | – 0 | – | ||||||
| Barclays Bank PLC |
69,858 | (64,970 | ) | – 0 | – | – 0 | – | 4,888 | ||||||||||||
| Brown Brothers Harriman & Co. |
233,484 | (233,484 | ) | – 0 | – | – 0 | – | – 0 | – | |||||||||||
| Citibank, NA. |
35,126 | (35,126 | ) | – 0 | – | – 0 | – | – 0 | – | |||||||||||
| Deutsche Bank AG |
110,877 | (102,175 | ) | – 0 | – | – 0 | – | 8,702 | ||||||||||||
| Goldman Sachs Bank USA/Goldman Sachs International |
367,803 | (121,481 | ) | (246,322 | ) | – 0 | – | – 0 | – | |||||||||||
| HSBC Bank USA. |
34,071 | (34,071 | ) | – 0 | – | – 0 | – | – 0 | – | |||||||||||
| abfunds.com | AB EMERGING MARKETS MULTI-ASSET PORTFOLIO | 65 | |
NOTES TO FINANCIAL STATEMENTS (continued)
| Counterparty |
Derivative Liabilities Subject to a MA |
Derivatives Available for Offset |
Cash Collateral Pledged* |
Security Collateral Pledged* |
Net Amount of Derivative Liabilities |
|||||||||||||||
| JPMorgan Chase Bank, NA. |
$ | 2,278 | $ | (2,278 | ) | $ | – 0 | – | $ | – 0 | – | $ | – 0 | – | ||||||
| Morgan Stanley Capital Services LLC/Morgan Stanley & Co. International PLC |
177,301 | (19,254 | ) | – 0 | – | – 0 | – | 158,047 | ||||||||||||
| Royal Bank of Scotland PLC |
5,133 | – 0 | – | – 0 | – | – 0 | – | 5,133 | ||||||||||||
| Standard Chartered Bank. |
245,003 | (245,003 | ) | – 0 | – | – 0 | – | – 0 | – | |||||||||||
| UBS AG |
62,883 | (8,207 | ) | – 0 | – | – 0 | – | 54,676 | ||||||||||||
|
|
|
|
|
|
|
|
|
|
|
|||||||||||
| Total |
$ | 1,354,212 | $ | (876,444 | ) | $ | (246,322 | ) | $ | – 0 | – | $ | 231,446 | ^ | ||||||
|
|
|
|
|
|
|
|
|
|
|
|||||||||||
| * | The actual collateral received/pledged may be more than the amount reported due to overcollateralization. |
| ^ | Net amount represents the net receivable/payable that would be due from/to the counterparty in the event of default or termination. The net amount from OTC financial derivative instruments can only be netted across transactions governed under the same master agreement with the same counterparty. |
2. Currency Transactions
The Fund may invest in non-U.S. Dollar-denominated securities on a currency hedged or unhedged basis. The Fund may seek investment opportunities by taking long or short positions in currencies through the use of currency-related derivatives, including forward currency exchange contracts, futures and options on futures, swaps, and other options. The Fund may enter into transactions for investment opportunities when it anticipates that a foreign currency will appreciate or depreciate in value but securities denominated in that currency are not held by the Fund and do not present attractive investment opportunities. Such transactions may also be used when the Adviser believes that it may be more efficient than a direct investment in a foreign currency-denominated security. The Fund may also conduct currency exchange contracts on a spot basis (i.e., for cash at the spot rate prevailing in the currency exchange market for buying or selling currencies).
NOTE E
Securities Lending
The Fund may enter into securities lending transactions. Under the Fund’s securities lending program, all loans of securities will be collateralized continually by cash collateral and/or non-cash collateral. Non-cash collateral will include only securities issued or guaranteed by the U.S. government or its agencies or instrumentalities. The Fund cannot sell or repledge any non-cash collateral, such collateral will not be reflected in the portfolio of investments. If a loan is collateralized by cash, the Fund will be compensated for the loan from a portion of the net return from the income earned on cash collateral after a rebate is paid to the borrower (in some cases, this rebate may be a “negative rebate” or fee paid by the borrower to the Fund in connection with the loan), and payments are made for fees of the
| 66 | AB EMERGING MARKETS MULTI-ASSET PORTFOLIO |
abfunds.com | |
NOTES TO FINANCIAL STATEMENTS (continued)
securities lending agent and for certain other administrative expenses. If the Fund receives non-cash collateral, the Fund will receive a fee from the borrower generally equal to a negotiated percentage of the market value of the loaned securities. The Fund will have the right to call a loan and obtain the securities loaned at any time on notice to the borrower within the normal and customary settlement time for the securities. While the securities are on loan, the borrower is obligated to pay the Fund amounts equal to any dividend income or other distributions from the securities; however, these distributions will not be afforded the same preferential tax treatment as qualified dividends. The Fund will not be able to exercise voting rights with respect to any securities during the existence of a loan, but will have the right to regain ownership of loaned securities in order to exercise voting or other ownership rights. Collateral received and securities loaned are marked to market daily to ensure that the securities loaned are secured by collateral. The lending agent currently invests the cash collateral received in Government Money Market Portfolio, an eligible money market vehicle, in accordance with the investment restrictions of the Fund, and as approved by the Board. The collateral received on securities loaned is recorded as an asset as well as a corresponding liability in the statement of assets and liabilities. The collateral will be adjusted the next business day to maintain the required collateral amount. The amounts of securities lending income from the borrowers and Government Money Market Portfolio are reflected in the statement of operations. When the Fund earns net securities lending income from Government Money Market Portfolio, the income is inclusive of a rebate expense paid to the borrower. In connection with the cash collateral investment by the Fund in the Government Money Market Portfolio, the Adviser has agreed to waive a portion of the Fund’s share of the advisory fees of Government Money Market Portfolio, as borne indirectly by the Fund as an acquired fund fee and expense. When the Fund lends securities, its investment performance will continue to reflect changes in the value of the securities loaned. A principal risk of lending portfolio securities is that the borrower may fail to return the loaned securities upon termination of the loan and that the collateral will not be sufficient to replace the loaned securities. The lending agent has agreed to indemnify the Fund in the case of default of any securities borrower.
A summary of the Fund’s transactions surrounding securities lending for the six months ended September 30, 2021 is as follows:
| Government Money Market Portfolio | ||||||||||||||||||||
|
Market Value |
Cash Collateral* |
Market Value of Non-Cash Collateral* |
Income from Borrowers |
Income Earned | Advisory Fee Waived |
|||||||||||||||
| $ 1,560,630 |
$ | 1,512,481 | $ | 144,678 | $ | 2,502 | $ | 30 | $ | – 0 – | ||||||||||
| * | As of September 30, 2021. |
| abfunds.com | AB EMERGING MARKETS MULTI-ASSET PORTFOLIO | 67 | |
NOTES TO FINANCIAL STATEMENTS (continued)
NOTE F
Capital Stock
Each class consists of 3,000,000,000 authorized shares. Transactions in capital shares for each class were as follows:
| Shares | Amount | |||||||||||||||||||||||
| Six Months Ended September 30, 2021 (unaudited) |
Year Ended March 31, 2021 |
Six Months Ended September 30, 2021 (unaudited) |
Year Ended March 31, 2021 |
|||||||||||||||||||||
|
|
|
|||||||||||||||||||||||
| Class A | ||||||||||||||||||||||||
| Shares sold |
26,320 | 222,548 | $ | 275,097 | $ | 2,170,281 | ||||||||||||||||||
|
|
||||||||||||||||||||||||
| Shares issued in reinvestment of dividends |
4,184 | 5,919 | 43,884 | 54,875 | ||||||||||||||||||||
|
|
||||||||||||||||||||||||
| Shares converted from Class C |
6,048 | 1,957 | 65,127 | 17,182 | ||||||||||||||||||||
|
|
||||||||||||||||||||||||
| Shares redeemed |
(32,963 | ) | (309,557 | ) | (344,482 | ) | (2,860,594 | ) | ||||||||||||||||
|
|
||||||||||||||||||||||||
| Net increase (decrease) |
3,589 | (79,133 | ) | $ | 39,626 | $ | (618,256 | ) | ||||||||||||||||
|
|
||||||||||||||||||||||||
| Class C | ||||||||||||||||||||||||
| Shares sold |
5,165 | 8,263 | $ | 53,141 | $ | 83,219 | ||||||||||||||||||
|
|
||||||||||||||||||||||||
| Shares issued in reinvestment of dividends |
885 | 1,313 | 9,216 | 12,108 | ||||||||||||||||||||
|
|
||||||||||||||||||||||||
| Shares converted to Class A |
(6,088 | ) | (1,967 | ) | (65,127 | ) | (17,182 | ) | ||||||||||||||||
|
|
||||||||||||||||||||||||
| Shares redeemed |
(10,504 | ) | (43,154 | ) | (107,298 | ) | (372,886 | ) | ||||||||||||||||
|
|
||||||||||||||||||||||||
| Net decrease |
(10,542 | ) | (35,545 | ) | $ | (110,068 | ) | $ | (294,741 | ) | ||||||||||||||
|
|
||||||||||||||||||||||||
| Advisor Class | ||||||||||||||||||||||||
| Shares sold |
1,585,784 | 5,541,078 | $ | 16,619,517 | $ | 50,185,208 | ||||||||||||||||||
|
|
||||||||||||||||||||||||
| Shares issued in reinvestment of dividends |
240,010 | 356,037 | 2,523,778 | 3,327,303 | ||||||||||||||||||||
|
|
||||||||||||||||||||||||
| Shares redeemed |
(2,141,258 | ) | (5,319,714 | ) | (22,516,953 | ) | (47,683,195 | ) | ||||||||||||||||
|
|
||||||||||||||||||||||||
| Net increase (decrease) |
(315,464 | ) | 577,401 | $ | (3,373,658 | ) | $ | 5,829,316 | ||||||||||||||||
|
|
||||||||||||||||||||||||
| Class R | ||||||||||||||||||||||||
| Shares sold |
2,021 | 6,833 | $ | 21,249 | $ | 63,408 | ||||||||||||||||||
|
|
||||||||||||||||||||||||
| Shares issued in reinvestment of dividends |
405 | 518 | 4,260 | 4,859 | ||||||||||||||||||||
|
|
||||||||||||||||||||||||
| Shares redeemed |
(6,042 | ) | (12,515 | ) | (63,156 | ) | (96,959 | ) | ||||||||||||||||
|
|
||||||||||||||||||||||||
| Net decrease |
(3,616 | ) | (5,164 | ) | $ | (37,647 | ) | $ | (28,692 | ) | ||||||||||||||
|
|
||||||||||||||||||||||||
| 68 | AB EMERGING MARKETS MULTI-ASSET PORTFOLIO |
abfunds.com | |
NOTES TO FINANCIAL STATEMENTS (continued)
| Shares | Amount | |||||||||||||||||||||||
| Six Months Ended September 30, 2021 (unaudited) |
Year Ended March 31, 2021 |
Six Months Ended September 30, 2021 (unaudited) |
Year Ended March 31, 2021 |
|||||||||||||||||||||
|
|
|
|||||||||||||||||||||||
| Class K | ||||||||||||||||||||||||
| Shares sold |
1,028 | 3,085 | $ | 10,707 | $ | 26,783 | ||||||||||||||||||
|
|
||||||||||||||||||||||||
| Shares issued in reinvestment of dividends |
407 | 596 | 4,271 | 5,542 | ||||||||||||||||||||
|
|
||||||||||||||||||||||||
| Shares redeemed |
(2,138 | ) | (5,557 | ) | (21,929 | ) | (49,680 | ) | ||||||||||||||||
|
|
||||||||||||||||||||||||
| Net decrease |
(703 | ) | (1,876 | ) | $ | (6,951 | ) | $ | (17,355 | ) | ||||||||||||||
|
|
||||||||||||||||||||||||
| Class I | ||||||||||||||||||||||||
| Shares sold |
863 | 32,024 | $ | 9,005 | $ | 338,111 | ||||||||||||||||||
|
|
||||||||||||||||||||||||
| Shares issued in reinvestment of dividends |
522 | 120 | 5,441 | 1,212 | ||||||||||||||||||||
|
|
||||||||||||||||||||||||
| Shares redeemed |
(1,765 | ) | (2,831 | ) | (17,924 | ) | (26,710 | ) | ||||||||||||||||
|
|
||||||||||||||||||||||||
| Net increase (decrease) |
(380 | ) | 29,313 | $ | (3,478 | ) | $ | 312,613 | ||||||||||||||||
|
|
||||||||||||||||||||||||
| Class Z | ||||||||||||||||||||||||
| Shares sold |
279,206 | 46,618 | $ | 2,906,567 | $ | 507,670 | ||||||||||||||||||
|
|
||||||||||||||||||||||||
| Shares issued in reinvestment of dividends |
5,736 | 679 | 59,893 | 6,455 | ||||||||||||||||||||
|
|
||||||||||||||||||||||||
| Shares redeemed |
(49,542 | ) | (323 | ) | (501,761 | ) | (3,342 | ) | ||||||||||||||||
|
|
||||||||||||||||||||||||
| Net increase |
235,400 | 46,974 | $ | 2,464,699 | $ | 510,783 | ||||||||||||||||||
|
|
||||||||||||||||||||||||
NOTE G
Risks Involved in Investing in the Fund
Market Risk—The value of the Fund’s assets will fluctuate as the stock, bond or currency markets fluctuate. The value of the Fund’s investments may decline, sometimes rapidly and unpredictably, simply because of economic changes or other events, including public health crises (including the occurrence of a contagious disease or illness), that affect large portions of the market.
Emerging Market Risk—Investments in emerging market countries may involve more risk than investments in other foreign countries because the markets in emerging market countries are less developed and less liquid, and because these investments may be subject to increased economic, political, regulatory, or other uncertainties.
Foreign (Non-U.S.) Risk—Investments in securities of non-U.S. issuers may involve more risk than those of U.S. issuers. These securities may fluctuate more widely in price and may be more difficult to trade due to adverse market, economic, political, regulatory or other factors.
| abfunds.com | AB EMERGING MARKETS MULTI-ASSET PORTFOLIO | 69 | |
NOTES TO FINANCIAL STATEMENTS (continued)
Currency Risk—Fluctuations in currency exchange rates may negatively affect the value of the Fund’s investments or reduce its returns. Emerging market currencies may be more volatile and less liquid, and subject to significantly greater risk of currency controls and convertibility restrictions, than currencies of developed countries.
Country Concentration Risk—The Fund may not always be diversified among countries or geographic regions and the effect on the Fund’s net asset value, or NAV, of the specific risks identified above, such as political, regulatory and currency risks, may be magnified due to concentration of the Fund’s investments in a particular country or region.
Allocation Risk—The allocation of Fund assets among different asset classes, such as equity securities, debt securities and currencies, may have a significant effect on the Fund’s NAV when one of these asset classes is performing better or worse than others. The diversification benefits typically associated with investing in both equity and debt securities may be limited in the emerging markets context, as movements in emerging market equity and emerging market debt markets may be more correlated than movements in the equity and debt markets of developed countries.
Capitalization Risk—Investments in small- and mid-capitalization companies may be more volatile than investments in large-capitalization companies. Investments in small-capitalization companies may have additional risks because these companies have limited product lines, markets or financial resources.
Interest Rate Risk—Changes in interest rates will affect the value of investments in fixed-income securities. When interest rates rise, the value of existing investments in fixed-income securities tends to fall and this decrease in value may not be offset by higher income from new investments. Interest rate risk is generally greater for fixed-income securities with longer maturities or durations. The current historically low interest rate environment heightens the risks associated with rising interest rates.
Credit Risk—An issuer or guarantor of a fixed-income security, or the counterparty to a derivatives or other contract, may be unable or unwilling to make timely payments of interest or principal, or to otherwise honor its obligations. The issuer or guarantor may default, causing a loss of the full principal amount of a security and accrued interest. The degree of risk for a particular security may be reflected in its credit rating. There is the possibility that the credit rating of a fixed-income security may be downgraded after purchase, which may adversely affect the value of the security.
| 70 | AB EMERGING MARKETS MULTI-ASSET PORTFOLIO |
abfunds.com | |
NOTES TO FINANCIAL STATEMENTS (continued)
Sovereign Debt Risk—Investments in sovereign debt obligations expose the Fund to the direct or indirect consequences of political, social and economic changes in countries that issue the obligations. Such changes may affect a foreign government’s willingness or ability to make timely payments of its obligations. In addition, no established market may exist for many sovereign debt obligations. Reduced secondary market liquidity may have an adverse effect on the market price of an instrument and the Fund’s ability to dispose of particular instruments.
Below Investment Grade Securities Risk—Investments in fixed-income securities with lower ratings (commonly known as “junk bonds”) tend to have a higher probability that an issuer will default or fail to meet its payment obligations. These securities may be subject to greater price volatility due to factors such as specific corporate developments, interest rate sensitivity and negative perceptions of the junk bond market generally, and may be more difficult to trade than other types of securities.
Derivatives Risk—The Fund may enter into derivative transactions such as forwards, options, futures and swaps. Derivatives may be illiquid, difficult to price, and leveraged so that small changes may produce disproportionate losses for the Fund, and subject to counterparty risk to a greater degree than more traditional investments. Derivatives may result in significant losses, including losses that are far greater than the value of the derivatives reflected on the statement of assets and liabilities.
Leverage Risk—When the Fund borrows money or otherwise leverages its investments, its performance may be volatile because leverage tends to exaggerate the effect of any increase or decrease in the value of the Fund’s investments. The Fund may create leverage through the use of reverse repurchase arrangements, forward currency exchange contracts, forward commitments, dollar rolls or futures contracts or by borrowing money. The use of other types of derivative instruments by the Fund, such as options and swaps, may also result in a form of leverage. Leverage may result in higher returns to the Fund than if the Fund were not leveraged, but may also adversely affect returns, particularly if the market is declining.
Illiquid Investments Risk—Illiquid investments risk exists when certain investments are or become difficult to purchase or sell. Difficulty in selling such investments may result in sales at disadvantageous prices affecting the value of your investment in the Fund. Causes of illiquid investments risk may include low trading volumes, large positions and heavy redemptions of Fund shares. Illiquid investments risk may be higher in a rising interest rate environment, when the value and liquidity of fixed-income securities generally decline.
| abfunds.com | AB EMERGING MARKETS MULTI-ASSET PORTFOLIO | 71 | |
NOTES TO FINANCIAL STATEMENTS (continued)
LIBOR Transition and Associated Risk—A Fund may invest in debt securities, derivatives or other financial instruments that utilize the London Interbank Offered Rate, or “LIBOR,” as a “benchmark” or “reference rate” for various interest rate calculations. The United Kingdom Financial Conduct Authority, which regulates LIBOR, will cease publishing certain LIBOR benchmarks at the end of 2021. Although certain LIBOR rates are intended to be published until June 2023, banks are strongly encouraged to cease entering into agreements with counterparties referencing LIBOR by the end of 2021. Although financial regulators and industry working groups have suggested alternative reference rates, such as the European Interbank Offer Rate, the Sterling Overnight Interbank Average Rate and the Secured Overnight Financing Rate, global consensus on alternative rates is lacking and the process for amending existing contracts or instruments to transition away from LIBOR is underway but remains incomplete. The elimination of LIBOR or changes to other reference rates or any other changes or reforms to the determination or supervision of reference rates could have an adverse impact on the market for, or value of, any securities or payments linked to those reference rates, which may adversely affect a Fund’s performance and/or net asset value. Uncertainty and risk also remain regarding the willingness and ability of issuers and lenders to include revised provisions in new and existing contracts or instruments. Consequently, the transition away from LIBOR to other reference rates may lead to increased volatility and illiquidity in markets that are tied to LIBOR, fluctuations in values of LIBOR-related investments or investments in issuers that utilize LIBOR, increased difficulty in borrowing or refinancing and diminished effectiveness of hedging strategies, potentially adversely affecting a Fund’s performance. Furthermore, the risks associated with the expected discontinuation of LIBOR and transition may be exacerbated if the work necessary to effect an orderly transition to an alternative reference rate is not completed in a timely manner. Because the usefulness of LIBOR as a benchmark could deteriorate during the transition period, these effects could occur prior to the end of 2021.
Indemnification Risk—In the ordinary course of business, the Fund enters into contracts that contain a variety of indemnifications. The Fund’s maximum exposure under these arrangements is unknown. However, the Fund has not had prior claims or losses pursuant to these indemnification provisions and expects the risk of loss thereunder to be remote. Therefore, the Fund has not accrued any liability in connection with these indemnification provisions.
Management Risk—The Fund is subject to management risk because it is an actively-managed investment fund. The Adviser will apply its investment techniques and risk analyses in making investment decisions, but there is no guarantee that its techniques will produce the intended results.
| 72 | AB EMERGING MARKETS MULTI-ASSET PORTFOLIO |
abfunds.com | |
NOTES TO FINANCIAL STATEMENTS (continued)
Some of these techniques may incorporate, or rely upon, quantitative models, but there is no guarantee that these models will generate accurate forecasts, reduce risk or otherwise perform as expected.
NOTE H
Joint Credit Facility
A number of open-end mutual funds managed by the Adviser, including the Fund, participate in a $325 million revolving credit facility (the “Facility”) intended to provide short-term financing related to redemptions and other short term liquidity requirements, subject to certain restrictions. Commitment fees related to the Facility are paid by the participating funds and are included in miscellaneous expenses in the statement of operations. The Fund did not utilize the Facility during the six months ended September 30, 2021.
NOTE I
Distributions to Shareholders
The tax character of distributions paid for the year ending March 31, 2022 will be determined at the end of the current fiscal year.
The tax character of distributions paid during the fiscal years ended March 31, 2021 and March 31, 2020 were as follows:
| 2021 | 2020 | |||||||
| Distributions paid from: |
||||||||
| Ordinary income |
$ | 4,155,037 | $ | 7,851,100 | ||||
|
|
|
|
|
|||||
| Total taxable distributions paid |
$ | 4,155,037 | $ | 7,851,100 | ||||
|
|
|
|
|
|||||
As of March 31, 2021, the components of accumulated earnings/(deficit) on a tax basis were as follows:
| Accumulated capital and other losses |
$ | (6,459,083 | )(a) | |
| Unrealized appreciation/(depreciation) |
24,317,317 | (b) | ||
|
|
|
|||
| Total accumulated earnings/(deficit) |
$ | 17,858,234 | (c) | |
|
|
|
| (a) | As of March 31, 2021, the Fund had a net capital loss carryforward of $6,459,083. During the fiscal year, the Fund utilized $12,022,346 of capital loss carry forwards to offset current year net realized gains. |
| (b) | The differences between book-basis and tax-basis unrealized appreciation/(depreciation) are attributable primarily to the recognition for tax purposes of unrealized gains/losses on certain derivative instruments, the tax treatment of passive foreign investment companies (PFICs), the tax treatment of swaps, the tax deferral of losses on wash sales, the tax treatment of hyper-inflationary currency contracts, and the tax treatment of callable bonds. |
| (c) | The differences between book-basis and tax-basis components of accumulated earnings/(deficit) are attributable primarily to the accrual of foreign capital gains tax and the tax treatment of defaulted securities. |
| abfunds.com | AB EMERGING MARKETS MULTI-ASSET PORTFOLIO | 73 | |
NOTES TO FINANCIAL STATEMENTS (continued)
For tax purposes, net realized capital losses may be carried over to offset future capital gains, if any. Funds are permitted to carry forward capital losses for an indefinite period, and such losses will retain their character as either short-term or long-term capital losses. As of March 31, 2021, the Fund had a net short-term capital loss carryforward of $1,701,223 and a net long-term capital loss carryforward of $4,757,860, which may be carried forward for an indefinite period.
NOTE J
Recent Accounting Pronouncements
In March 2020, the Financial Accounting Standards Board issued an Accounting Standards Update, ASU 2020-04, “Reference Rate Reform (Topic 848)—Facilitation of the Effects of Reference Rate Reform on Financial Reporting.” ASU 2020-04 provides optional guidance to ease the potential accounting burden due to the discontinuation of the LIBOR and other interbank-offered based reference rates. ASU 2020-04 is effective as of March 12, 2020 through December 31, 2022. Management is currently evaluating the impact, if any, of applying ASU 2020-04.
NOTE K
Subsequent Events
Management has evaluated subsequent events for possible recognition or disclosure in the financial statements through the date the financial statements are issued. Management has determined that there are no material events that would require disclosure in the Fund’s financial statements through this date.
| 74 | AB EMERGING MARKETS MULTI-ASSET PORTFOLIO |
abfunds.com | |
FINANCIAL HIGHLIGHTS
Selected Data For A Share of Capital Stock Outstanding Throughout Each Period
| Class A | ||||||||||||||||||||||||
| Six Months Ended September 30, 2021 (unaudited) |
Year Ended March 31, | |||||||||||||||||||||||
| 2021 | 2020 | 2019 | 2018 | 2017 | ||||||||||||||||||||
|
|
|
|||||||||||||||||||||||
| Net asset value, beginning of period |
$ 10.34 | $ 7.04 | $ 8.89 | $ 10.00 | $ 9.20 | $ 8.59 | ||||||||||||||||||
|
|
|
|||||||||||||||||||||||
| Income From Investment Operations |
||||||||||||||||||||||||
| Net investment income(a)(b) |
.20 | .19 | .29 | .30 | .25 | .24 | ||||||||||||||||||
| Net realized and unrealized gain (loss) on investment and foreign currency transactions |
(.38 | ) | 3.32 | (1.68 | ) | (.95 | ) | .89 | .74 | |||||||||||||||
|
|
|
|||||||||||||||||||||||
| Net increase (decrease) in net asset value from operations |
(.18 | ) | 3.51 | (1.39 | ) | (.65 | ) | 1.14 | .98 | |||||||||||||||
|
|
|
|||||||||||||||||||||||
| Less: Dividends and Distributions |
||||||||||||||||||||||||
| Dividends from net investment income |
(.17 | ) | (.21 | ) | (.46 | ) | (.46 | ) | (.33 | ) | (.30 | ) | ||||||||||||
| Return of capital |
– 0 | – | – 0 | – | – 0 | – | – 0 | – | (.01 | ) | (.07 | ) | ||||||||||||
|
|
|
|||||||||||||||||||||||
| Total dividends and distributions |
(.17 | ) | (.21 | ) | (.46 | ) | (.46 | ) | (.34 | ) | (.37 | ) | ||||||||||||
|
|
|
|||||||||||||||||||||||
| Net asset value, end of period |
$ 9.99 | $ 10.34 | $ 7.04 | $ 8.89 | $ 10.00 | $ 9.20 | ||||||||||||||||||
|
|
|
|||||||||||||||||||||||
| Total Return |
||||||||||||||||||||||||
| Total investment return based on net asset value(c) |
(1.84 | )% | 50.17 | % | (16.50 | )% | (6.20 | )% | 12.56 | % | 11.82 | % | ||||||||||||
| Ratios/Supplemental Data |
||||||||||||||||||||||||
| Net assets, end of period (000’s omitted) |
$3,558 | $3,644 | $3,040 | $5,510 | $10,849 | $4,764 | ||||||||||||||||||
| Ratio to average net assets of: |
||||||||||||||||||||||||
| Expenses, net of waivers/reimbursements(d)(e)† |
1.24 | %(f) | 1.23 | % | 1.23 | % | 1.24 | % | 1.23 | % | 1.51 | % | ||||||||||||
| Expenses, before waivers/reimbursements(d)(e)† |
1.52 | %(f) | 1.64 | % | 1.76 | % | 1.80 | % | 1.92 | % | 2.92 | % | ||||||||||||
| Net investment |
3.73 | %(f) | 2.14 | % | 3.26 | % | 3.36 | % | 2.51 | % | 2.68 | % | ||||||||||||
| Portfolio turnover rate |
43 | % | 88 | % | 117 | % | 110 | % | 74 | % | 118 | % | ||||||||||||
|
† Expense ratios exclude the estimated acquired fund fees of affiliated/unaffiliated underlying |
| |||||||||||||||||||||||
| portfolios |
.00 | %(f) | .01 | % | .01 | % | .01 | % | .02 | % | .02 | % | ||||||||||||
See footnote summary on page 82.
| abfunds.com | AB EMERGING MARKETS MULTI-ASSET PORTFOLIO | 75 | |
FINANCIAL HIGHLIGHTS (continued)
Selected Data For A Share of Capital Stock Outstanding Throughout Each Period
| Class C | ||||||||||||||||||||||||
| Six Months Ended September 30, 2021 (unaudited) |
Year Ended March 31, | |||||||||||||||||||||||
| 2021 | 2020 | 2019 | 2018 | 2017 | ||||||||||||||||||||
|
|
|
|||||||||||||||||||||||
| Net asset value, beginning of period |
$ 10.29 | $ 7.01 | $ 8.85 | $ 9.95 | $ 9.19 | $ 8.59 | ||||||||||||||||||
|
|
|
|||||||||||||||||||||||
| Income From Investment Operations |
||||||||||||||||||||||||
| Net investment income(a)(b) |
.15 | .13 | .22 | .23 | .16 | .17 | ||||||||||||||||||
| Net realized and unrealized gain (loss) on investment and foreign currency transactions |
(.37 | ) | 3.29 | (1.66 | ) | (.93 | ) | .89 | .75 | |||||||||||||||
|
|
|
|||||||||||||||||||||||
| Net increase (decrease) in net asset value from operations |
(.22 | ) | 3.42 | (1.44 | ) | (.70 | ) | 1.05 | .92 | |||||||||||||||
|
|
|
|||||||||||||||||||||||
| Less: Dividends and Distributions |
||||||||||||||||||||||||
| Dividends from net investment income |
(.13 | ) | (.14 | ) | (.40 | ) | (.40 | ) | (.28 | ) | (.26 | ) | ||||||||||||
| Return of capital |
– 0 | – | – 0 | – | – 0 | – | – 0 | – | (.01 | ) | (.06 | ) | ||||||||||||
|
|
|
|||||||||||||||||||||||
| Total dividends and distributions |
(.13 | ) | (.14 | ) | (.40 | ) | (.40 | ) | (.29 | ) | (.32 | ) | ||||||||||||
|
|
|
|||||||||||||||||||||||
| Net asset value, end of period |
$ 9.94 | $ 10.29 | $ 7.01 | $ 8.85 | $ 9.95 | $ 9.19 | ||||||||||||||||||
|
|
|
|||||||||||||||||||||||
| Total Return |
||||||||||||||||||||||||
| Total investment return based on net asset value(c) |
(2.23 | )% | 49.01 | % | (17.11 | )% | (6.79 | )%^ | 11.63 | %^ | 11.00 | %^ | ||||||||||||
| Ratios/Supplemental Data |
||||||||||||||||||||||||
| Net assets, end of period (000’s omitted) |
$975 | $1,117 | $1,010 | $2,234 | $2,792 | $497 | ||||||||||||||||||
| Ratio to average net assets of: |
||||||||||||||||||||||||
| Expenses, net of waivers/reimbursements(d)(e)† |
1.99 | %(f) | 1.98 | % | 1.98 | % | 1.99 | % | 1.98 | % | 2.26 | % | ||||||||||||
| Expenses, before waivers/reimbursements(d)(e)† |
2.27 | %(f) | 2.40 | % | 2.51 | % | 2.58 | % | 2.69 | % | 3.69 | % | ||||||||||||
| Net investment income(b) |
2.93 | %(f) | 1.40 | % | 2.54 | % | 2.54 | % | 1.57 | % | 1.97 | % | ||||||||||||
| Portfolio turnover rate |
43 | % | 88 | % | 117 | % | 110 | % | 74 | % | 118 | % | ||||||||||||
|
† Expense ratios exclude the estimated acquired fund fees of affiliated/unaffiliated underlying |
| |||||||||||||||||||||||
| portfolios |
.00 | %(f) | .01 | % | .01 | % | .01 | % | .02 | % | .02 | % | ||||||||||||
See footnote summary on page 82.
| 76 | AB EMERGING MARKETS MULTI-ASSET PORTFOLIO |
abfunds.com | |
FINANCIAL HIGHLIGHTS (continued)
Selected Data For A Share of Capital Stock Outstanding Throughout Each Period
| Advisor Class | ||||||||||||||||||||||||
| Six Months Ended September 30, 2021 (unaudited) |
Year Ended March 31, | |||||||||||||||||||||||
| 2021 | 2020 | 2019 | 2018 | 2017 | ||||||||||||||||||||
|
|
|
|||||||||||||||||||||||
| Net asset value, beginning of period |
$ 10.36 | $ 7.06 | $ 8.91 | $ 10.02 | $ 9.22 | $ 8.61 | ||||||||||||||||||
|
|
|
|||||||||||||||||||||||
| Income From Investment Operations |
||||||||||||||||||||||||
| Net investment income(a)(b) |
.21 | .22 | .30 | .32 | .27 | .27 | ||||||||||||||||||
| Net realized and unrealized gain (loss) on investment and foreign currency transactions |
(.37 | ) | 3.31 | (1.66 | ) | (.95 | ) | .89 | .74 | |||||||||||||||
|
|
|
|||||||||||||||||||||||
| Net increase (decrease) in net asset value from operations |
(.16 | ) | 3.53 | (1.36 | ) | (.63 | ) | 1.16 | 1.01 | |||||||||||||||
|
|
|
|||||||||||||||||||||||
| Less: Dividends and Distributions |
||||||||||||||||||||||||
| Dividends from net investment income |
(.18 | ) | (.23 | ) | (.49 | ) | (.48 | ) | (.35 | ) | (.33 | ) | ||||||||||||
| Return of capital |
– 0 | – | – 0 | – | – 0 | – | – 0 | – | (.01 | ) | (.07 | ) | ||||||||||||
|
|
|
|||||||||||||||||||||||
| Total dividends and distributions |
(.18 | ) | (.23 | ) | (.49 | ) | (.48 | ) | (.36 | ) | (.40 | ) | ||||||||||||
|
|
|
|||||||||||||||||||||||
| Net asset value, end of period |
$ 10.02 | $ 10.36 | $ 7.06 | $ 8.91 | $ 10.02 | $ 9.22 | ||||||||||||||||||
|
|
|
|||||||||||||||||||||||
| Total Return |
||||||||||||||||||||||||
| Total investment return based on net asset value(c) |
(1.62 | )% | 50.40 | % | (16.24 | )% | (5.93 | )% | 12.78 | % | 12.07 | % | ||||||||||||
| Ratios/Supplemental Data |
||||||||||||||||||||||||
| Net assets, end of period (000’s omitted) |
$176,176 | $185,534 | $122,322 | $118,492 | $126,029 | $42,000 | ||||||||||||||||||
| Ratio to average net assets of: |
||||||||||||||||||||||||
| Expenses, net of waivers/reimbursements(d)(e)† |
.99 | %(f) | .98 | % | .98 | % | .99 | % | .98 | % | 1.24 | % | ||||||||||||
| Expenses, before waivers/reimbursements(d)(e)† |
1.27 | %(f) | 1.39 | % | 1.51 | % | 1.58 | % | 1.67 | % | 2.64 | % | ||||||||||||
| Net investment income(b) |
3.97 | %(f) | 2.36 | % | 3.42 | % | 3.53 | % | 2.76 | % | 3.07 | % | ||||||||||||
| Portfolio turnover rate |
43 | % | 88 | % | 117 | % | 110 | % | 74 | % | 118 | % | ||||||||||||
|
† Expense ratios exclude the estimated acquired fund fees of affiliated/unaffiliated underlying |
| |||||||||||||||||||||||
| portfolios |
.00 | %(f) | .01 | % | .01 | % | .01 | % | .02 | % | .02 | % | ||||||||||||
See footnote summary on page 82.
| abfunds.com | AB EMERGING MARKETS MULTI-ASSET PORTFOLIO | 77 | |
FINANCIAL HIGHLIGHTS (continued)
Selected Data For A Share of Capital Stock Outstanding Throughout Each Period
| Class R | ||||||||||||||||||||||||
| Six Months Ended September 30, 2021 (unaudited) |
Year Ended March 31, | |||||||||||||||||||||||
| 2021 | 2020 | 2019 | 2018 | 2017 | ||||||||||||||||||||
|
|
|
|||||||||||||||||||||||
| Net asset value, beginning of period |
$ 10.37 | $ 7.05 | $ 8.88 | $ 9.97 | $ 9.17 | $ 8.57 | ||||||||||||||||||
|
|
|
|||||||||||||||||||||||
| Income From Investment Operations |
||||||||||||||||||||||||
| Net investment income(a)(b) |
.18 | .17 | .25 | .27 | .22 | .18 | ||||||||||||||||||
| Net realized and unrealized gain (loss) on investment and foreign currency transactions |
(.37 | ) | 3.31 | (1.65 | ) | (.94 | ) | .89 | .78 | |||||||||||||||
|
|
|
|||||||||||||||||||||||
| Net increase (decrease) in net asset value from operations |
(.19 | ) | 3.48 | (1.40 | ) | (.67 | ) | 1.11 | .96 | |||||||||||||||
|
|
|
|||||||||||||||||||||||
| Less: Dividends and Distributions |
||||||||||||||||||||||||
| Dividends from net investment income |
(.14 | ) | (.16 | ) | (.43 | ) | (.42 | ) | (.30 | ) | (.30 | ) | ||||||||||||
| Return of capital |
– 0 | – | – 0 | – | – 0 | – | – 0 | – | (.01 | ) | (.06 | ) | ||||||||||||
|
|
|
|||||||||||||||||||||||
| Total dividends and distributions |
(.14 | ) | (.16 | ) | (.43 | ) | (.42 | ) | (.31 | ) | (.36 | ) | ||||||||||||
|
|
|
|||||||||||||||||||||||
| Net asset value, end of period |
$ 10.04 | $ 10.37 | $ 7.05 | $ 8.88 | $ 9.97 | $ 9.17 | ||||||||||||||||||
|
|
|
|||||||||||||||||||||||
| Total Return |
||||||||||||||||||||||||
| Total investment return based on net asset value(c) |
(1.88 | )% | 49.68 | % | (16.64 | )% | (6.39 | )% | 12.20 | % | 11.51 | % | ||||||||||||
| Ratios/Supplemental Data |
||||||||||||||||||||||||
| Net assets, end of period (000’s omitted) |
$297 | $345 | $271 | $305 | $327 | $184 | ||||||||||||||||||
| Ratio to average net assets of: |
||||||||||||||||||||||||
| Expenses, net of waivers/reimbursements(d)(e)† |
1.49 | %(f) | 1.48 | % | 1.48 | % | 1.49 | % | 1.48 | % | 1.72 | % | ||||||||||||
| Expenses, before waivers/reimbursements(d)(e)† |
1.99 | %(f) | 2.10 | % | 2.23 | % | 2.23 | % | 2.29 | % | 3.24 | % | ||||||||||||
| Net investment income(b) |
3.43 | %(f) | 1.84 | % | 2.92 | % | 3.06 | % | 2.26 | % | 2.08 | % | ||||||||||||
| Portfolio turnover rate |
43 | % | 88 | % | 117 | % | 110 | % | 74 | % | 118 | % | ||||||||||||
|
† Expense ratios exclude the estimated acquired fund fees of affiliated/unaffiliated underlying |
| |||||||||||||||||||||||
| portfolios |
.00 | %(f) | .01 | % | .01 | % | .01 | % | .02 | % | .02 | % | ||||||||||||
See footnote summary on page 82.
| 78 | AB EMERGING MARKETS MULTI-ASSET PORTFOLIO |
abfunds.com | |
FINANCIAL HIGHLIGHTS (continued)
Selected Data For A Share of Capital Stock Outstanding Throughout Each Period
| Class K | ||||||||||||||||||||||||
| Six Months Ended September 30, 2021 (unaudited) |
Year Ended March 31, | |||||||||||||||||||||||
| 2021 | 2020 | 2019 | 2018 | 2017 | ||||||||||||||||||||
|
|
|
|||||||||||||||||||||||
| Net asset value, beginning of period |
$ 10.35 | $ 7.04 | $ 8.87 | $ 9.97 | $ 9.16 | $ 8.56 | ||||||||||||||||||
|
|
|
|||||||||||||||||||||||
| Income From Investment Operations |
||||||||||||||||||||||||
| Net investment income(a)(b) |
.20 | .19 | .29 | .29 | .26 | .26 | ||||||||||||||||||
| Net realized and unrealized gain (loss) on investment and foreign currency transactions |
(.38 | ) | 3.31 | (1.67 | ) | (.94 | ) | .88 | .71 | |||||||||||||||
|
|
|
|||||||||||||||||||||||
| Net increase (decrease) in net asset value from operations |
(.18 | ) | 3.50 | (1.38 | ) | (.65 | ) | 1.14 | .97 | |||||||||||||||
|
|
|
|||||||||||||||||||||||
| Less: Dividends and Distributions |
||||||||||||||||||||||||
| Dividends from net investment income |
(.16 | ) | (.19 | ) | (.45 | ) | (.45 | ) | (.32 | ) | (.30 | ) | ||||||||||||
| Return of capital |
– 0 | – | – 0 | – | – 0 | – | – 0 | – | (.01 | ) | (.07 | ) | ||||||||||||
|
|
|
|||||||||||||||||||||||
| Total dividends and distributions |
(.16 | ) | (.19 | ) | (.45 | ) | (.45 | ) | (.33 | ) | (.37 | ) | ||||||||||||
|
|
|
|||||||||||||||||||||||
| Net asset value, end of period |
$ 10.01 | $ 10.35 | $ 7.04 | $ 8.87 | $ 9.97 | $ 9.16 | ||||||||||||||||||
|
|
|
|||||||||||||||||||||||
| Total Return |
||||||||||||||||||||||||
| Total investment return based on net asset value(c) |
(1.82 | )% | 50.10 | %^ | (16.55 | )% | (6.19 | )% | 12.56 | % | 11.75 | % | ||||||||||||
| Ratios/Supplemental Data |
||||||||||||||||||||||||
| Net assets, end of period (000’s omitted) |
$275 | $292 | $212 | $313 | $333 | $298 | ||||||||||||||||||
| Ratio to average net assets of: |
||||||||||||||||||||||||
| Expenses, net of waivers/reimbursements(d)(e)† |
1.24 | %(f) | 1.23 | % | 1.23 | % | 1.24 | % | 1.23 | % | 1.53 | % | ||||||||||||
| Expenses, before waivers/reimbursements(d)(e)† |
1.68 | %(f) | 1.80 | % | 1.92 | % | 1.96 | % | 2.01 | % | 2.89 | % | ||||||||||||
| Net investment income(b) |
3.72 | %(f) | 2.13 | % | 3.34 | % | 3.26 | % | 2.67 | % | 2.94 | % | ||||||||||||
| Portfolio turnover rate |
43 | % | 88 | % | 117 | % | 110 | % | 74 | % | 118 | % | ||||||||||||
|
† Expense ratios exclude the estimated acquired fund fees of affiliated/unaffiliated underlying |
| |||||||||||||||||||||||
| portfolios |
.00 | %(f) | .01 | % | .01 | % | .01 | % | .02 | % | .02 | % | ||||||||||||
See footnote summary on page 82.
| abfunds.com | AB EMERGING MARKETS MULTI-ASSET PORTFOLIO | 79 | |
FINANCIAL HIGHLIGHTS (continued)
Selected Data For A Share of Capital Stock Outstanding Throughout Each Period
| Class I | ||||||||||||||||||||||||
| Six Months Ended September 30, 2021 (unaudited) |
Year Ended March 31, | |||||||||||||||||||||||
| 2021 | 2020 | 2019 | 2018 | 2017 | ||||||||||||||||||||
|
|
|
|||||||||||||||||||||||
| Net asset value, beginning of period |
$ 10.27 | $ 6.99 | $ 8.83 | $ 9.94 | $ 9.16 | $ 8.56 | ||||||||||||||||||
|
|
|
|||||||||||||||||||||||
| Income From Investment Operations |
||||||||||||||||||||||||
| Net investment income(a)(b) |
.21 | .20 | .36 | .28 | .30 | .28 | ||||||||||||||||||
| Net realized and unrealized gain (loss) on investment and foreign currency transactions |
(.38 | ) | 3.31 | (1.72 | ) | (.90 | ) | .85 | .72 | |||||||||||||||
|
|
|
|||||||||||||||||||||||
| Net increase (decrease) in net asset value from operations |
(.17 | ) | 3.51 | (1.36 | ) | (.62 | ) | 1.15 | 1.00 | |||||||||||||||
|
|
|
|||||||||||||||||||||||
| Less: Dividends and Distributions |
||||||||||||||||||||||||
| Dividends from net investment income |
(.18 | ) | (.23 | ) | (.48 | ) | (.49 | ) | (.36 | ) | (.33 | ) | ||||||||||||
| Return of capital |
– 0 | – | – 0 | – | – 0 | – | – 0 | – | (.01 | ) | (.07 | ) | ||||||||||||
|
|
|
|||||||||||||||||||||||
| Total dividends and distributions |
(.18 | ) | (.23 | ) | (.48 | ) | (.49 | ) | (.37 | ) | (.40 | ) | ||||||||||||
|
|
|
|||||||||||||||||||||||
| Net asset value, end of period |
$ 9.92 | $ 10.27 | $ 6.99 | $ 8.83 | $ 9.94 | $ 9.16 | ||||||||||||||||||
|
|
|
|||||||||||||||||||||||
| Total Return |
||||||||||||||||||||||||
| Total investment return based on net asset value(c) |
(1.72 | )% | 50.61 | % | (16.30 | )% | (5.93 | )% | 12.68 | %^ | 12.15 | %^ | ||||||||||||
| Ratios/Supplemental Data |
||||||||||||||||||||||||
| Net assets, end of period (000’s omitted) |
$302 | $316 | $10 | $151 | $2,012 | $16,952 | ||||||||||||||||||
| Ratio to average net assets of: |
||||||||||||||||||||||||
| Expenses, net of waivers/reimbursements(d)(e)† |
.99 | %(f) | .99 | % | .98 | % | .99 | % | .98 | % | 1.28 | % | ||||||||||||
| Expenses, before |
1.25 | %(f) | 1.25 | % | 1.46 | % | 1.46 | % | 1.58 | % | 2.51 | % | ||||||||||||
| Net investment |
3.98 | %(f) | 1.99 | % | 4.19 | % | 3.03 | % | 3.12 | % | 3.19 | % | ||||||||||||
| Portfolio turnover rate |
43 | % | 88 | % | 117 | % | 110 | % | 74 | % | 118 | % | ||||||||||||
| † Expense ratios exclude the estimated acquired fund fees of affiliated/unaffiliated underlying |
| |||||||||||||||||||||||
| portfolios |
.00 | %(f) | .01 | % | .01 | % | .01 | % | .02 | % | .02 | % | ||||||||||||
See footnote summary on page 82.
|
80 | AB EMERGING MARKETS MULTI-ASSET PORTFOLIO |
abfunds.com | |
FINANCIAL HIGHLIGHTS (continued)
Selected Data For A Share of Capital Stock Outstanding Throughout Each Period
| Class Z | ||||||||||||||||||||
| Six Months Ended September 30, 2021 (unaudited) |
Year Ended March 31, | July 31, 2017(g) to March 31, 2018 |
||||||||||||||||||
| 2021 | 2020 | 2019 | ||||||||||||||||||
|
|
|
|||||||||||||||||||
| Net asset value, beginning of period |
$ 10.29 | $ 7.01 | $ 8.85 | $ 9.95 | $ 9.81 | |||||||||||||||
|
|
|
|||||||||||||||||||
| Income From Investment Operations |
||||||||||||||||||||
| Net investment income(a)(b) |
.21 | .22 | .24 | .31 | .15 | |||||||||||||||
| Net realized and unrealized gain (loss) on investment and foreign currency transactions |
(.37 | ) | 3.29 | (1.59 | ) | (.93 | ) | .30 | ||||||||||||
|
|
|
|||||||||||||||||||
| Net increase (decrease) in net asset value from operations |
(.16 | ) | 3.51 | (1.35 | ) | (.62 | ) | .45 | ||||||||||||
|
|
|
|||||||||||||||||||
| Less: Dividends and Distributions |
||||||||||||||||||||
| Dividends from net investment income |
(.18 | ) | (.23 | ) | (.49 | ) | (.48 | ) | (.30 | ) | ||||||||||
| Return of capital |
– 0 | – | – 0 | – | – 0 | – | – 0 | – | (.01 | ) | ||||||||||
|
|
|
|||||||||||||||||||
| Total dividends and distributions |
(.18 | ) | (.23 | ) | (.49 | ) | (.48 | ) | (.31 | ) | ||||||||||
|
|
|
|||||||||||||||||||
| Net asset value, end of period |
$ 9.95 | $ 10.29 | $ 7.01 | $ 8.85 | $ 9.95 | |||||||||||||||
|
|
|
|||||||||||||||||||
| Total Return |
||||||||||||||||||||
| Total investment return based on net asset value(c) |
(1.62 | )% | 50.47 | % | (16.25 | )% | (5.90 | )%^ | 4.66 | %^ | ||||||||||
| Ratios/Supplemental Data |
||||||||||||||||||||
| Net assets, end of period (000’s omitted) |
$3,013 | $695 | $144 | $9 | $10 | |||||||||||||||
| Ratio to average net assets of: |
||||||||||||||||||||
| Expenses, net of waivers/reimbursements(d)(e)† |
.99 | %(f) | .99 | % | .99 | % | .99 | % | .98 | %(f) | ||||||||||
| Expenses, before |
1.25 | %(f) | 1.32 | % | 1.54 | % | 1.60 | % | 1.71 | %(f) | ||||||||||
| Net investment income(b) |
4.03 | %(f) | 2.29 | % | 2.78 | % | 3.49 | % | 2.26 | %(f) | ||||||||||
| Portfolio turnover rate |
43 | % | 88 | % | 117 | % | 110 | % | 74 | % | ||||||||||
| † Expense ratios exclude the estimated acquired fund fees of affiliated/unaffiliated underlying |
| |||||||||||||||||||
| portfolios |
.00 | %(f) | .01 | % | .01 | % | .01 | % | .01 | % | ||||||||||
See footnote summary on page 82.
| abfunds.com | AB EMERGING MARKETS MULTI-ASSET PORTFOLIO | 81 | |
FINANCIAL HIGHLIGHTS (continued)
Selected Data For A Share of Capital Stock Outstanding Throughout Each Period
| (a) | Based on average shares outstanding. |
| (b) | Net of expenses waived/reimbursed by the Adviser. |
| (c) | Total investment return is calculated assuming an initial investment made at the net asset value at the beginning of the period, reinvestment of all dividends and distributions at net asset value during the period, and redemption on the last day of the period. Initial sales charge or contingent deferred sales charge is not reflected in the calculation of total investment return. Total investment return does not reflect the deduction of taxes that a shareholder would pay on fund distributions or the redemption of fund shares. Total investment return for a period of less than one year is not annualized. |
| (d) | In connection with the Fund’s investments in affiliated underlying portfolios, the Fund incurs no direct expenses but bears proportionate shares of the acquired fund fees and expenses (i.e. operating, administrative and investment advisory fees) of the affiliated underlying portfolios. The Adviser has contractually agreed to waive its fees from the Fund in an amount equal to the Fund’s pro rata share of certain acquired fund fees and expenses, and for years ended March 31, 2021, March 31, 2020, March 31, 2019, March 31, 2018 and March 31, 2017, such waiver amounted to 0.01%, 0.01%, 0.01%, 0.01% and 0.02%, respectively. |
| (e) | The expense ratios presented below exclude interest expense: |
| Six Months Ended September 30, 2021 (unaudited)(f) |
Year Ended March 31, | |||||||||||||||||||
| 2021 | 2020 | 2019 | 2018 | 2017 | ||||||||||||||||
|
|
|
|
| |||||||||||||||||
| Class A |
||||||||||||||||||||
| Net of waivers/reimbursements |
1.24 | % | 1.23 | % | 1.23 | % | 1.24% | 1.23% | 1.51% | |||||||||||
| Before waivers/reimbursements |
1.52 | % | 1.64 | % | 1.76 | % | 1.80% | 1.92% | 2.92% | |||||||||||
| Class C |
||||||||||||||||||||
| Net of waivers/reimbursements |
1.99 | % | 1.98 | % | 1.98 | % | 1.98% | 1.98% | 2.26% | |||||||||||
| Before waivers/reimbursements |
2.27 | % | 2.40 | % | 2.51 | % | 2.57% | 2.69% | 3.69% | |||||||||||
| Advisor Class |
||||||||||||||||||||
| Net of waivers/reimbursements |
.99 | % | .98 | % | .98 | % | .98% | .98% | 1.24% | |||||||||||
| Before waivers/reimbursements |
1.27 | % | 1.39 | % | 1.51 | % | 1.57% | 1.67% | 2.64% | |||||||||||
| Class R |
||||||||||||||||||||
| Net of waivers/reimbursements |
1.49 | % | 1.48 | % | 1.48 | % | 1.48% | 1.48% | 1.72% | |||||||||||
| Before waivers/reimbursements |
1.99 | % | 2.10 | % | 2.23 | % | 2.22% | 2.29% | 3.24% | |||||||||||
| Class K |
||||||||||||||||||||
| Net of waivers/reimbursements |
1.24 | % | 1.23 | % | 1.23 | % | 1.24% | 1.23% | 1.53% | |||||||||||
| Before waivers/reimbursements |
1.68 | % | 1.80 | % | 1.92 | % | 1.96% | 2.01% | 2.89% | |||||||||||
| Class I |
||||||||||||||||||||
| Net of waivers/reimbursements |
.99 | % | .99 | % | .98 | % | .98% | .98% | 1.28% | |||||||||||
| Before waivers/reimbursements |
1.25 | % | 1.25 | % | 1.46 | % | 1.45% | 1.58% | 2.51% | |||||||||||
| Six Months Ended (unaudited)(f) |
Year Ended March 31, | July 31, 2017(g) to |
||||||||||||||||||
| 2021 | 2020 | 2019 | ||||||||||||||||||
|
|
|
|
|
|
|
|||||||||||||||
| Class Z |
||||||||||||||||||||
| Net of waivers/reimbursements |
.99 | % | .99 | % | .99 | % | .99 | % | .98 | % | ||||||||||
| Before waivers/reimbursements |
1.25 | % | 1.32 | % | 1.54 | % | 1.60 | % | 1.71 | % | ||||||||||
| (f) | Annualized. |
| (g) | Commencement of distribution. |
| ^ | The net asset value and total return include adjustments in accordance with accounting principles generally accepted in the United States of America for financial reporting purposes. As such, the net asset value and total return for shareholder transactions may differ from financial statements. |
See notes to financial statements.
|
82 | AB EMERGING MARKETS MULTI-ASSET PORTFOLIO |
abfunds.com | |
BOARD OF DIRECTORS
| Marshall C. Turner, Jr.(1), Jorge A. Bermudez(1) Michael J. Downey(1) Onur Erzan, President and Chief Executive Officer |
Nancy P. Jacklin(1) Jeanette W. Loeb(1) Carol C. McMullen(1) Garry L. Moody(1) Earl D. Weiner(1) | |
| OFFICERS | ||
| Christian DiClementi(2), Henry S. Mallari-D’Auria(2), Morgan C. Harting(2), Emilie D. Wrapp, Secretary |
Michael B. Reyes, Senior Analyst Joseph J. Mantineo, Treasurer and Chief Financial Officer Phyllis J. Clarke, Controller Vincent S. Noto, Chief Compliance Officer | |
| Custodian and Accounting Agent Brown Brothers Harriman & Co.
Principal Underwriter AllianceBernstein
Investments, Inc.
Legal Counsel Seward & Kissel LLP |
Independent Registered Public Accounting Firm Ernst & Young LLP
Transfer Agent AllianceBernstein
Investor |
| 1 | Member of the Audit Committee, the Governance and Nominating Committee and the Independent Directors Committee. |
| 2 | The day-to-day management of, and investment decisions for, the Fund’s portfolio are made by the Adviser’s Emerging Markets Multi-Asset Team. Messrs. DiClementi, Harting & Mallari-D’Auria are the investment professionals with the most significant responsibility for the day-to-day management of the Fund’s portfolio. |
| abfunds.com | AB EMERGING MARKETS MULTI-ASSET PORTFOLIO | 83 | |
Operation and Effectiveness of the Fund’s Liquidity Risk Management Program:
In October 2016, the Securities and Exchange Commission (“SEC”) adopted the open-end fund liquidity rule (the “Liquidity Rule”). In June 2018 the SEC adopted a requirement that funds disclose information about the operation and effectiveness of their Liquidity Risk Management Program (“LRMP”) in their reports to shareholders.
One of the requirements of the Liquidity Rule is for the Fund to designate an Administrator of the Fund’s Liquidity Risk Management Program. The Administrator of the Fund’s LRMP is AllianceBernstein L.P., the Fund’s investment adviser (the “Adviser”). The Adviser has delegated the responsibility to its Liquidity Risk Management Committee (the “Committee”).
Another requirement of the Liquidity Rule is for the Fund’s Board of Directors (the “Fund Board”) to receive an annual written report from the Administrator of the LRMP, which addresses the operation of the fund’s LRMP and assesses its adequacy and effectiveness. The Adviser provided the Fund Board with such annual report during the first quarter of 2021, which covered the period January 1, 2020 through December 31, 2020 (the “Program Reporting Period”).
The LRMP’s principal objectives include supporting the Fund’s compliance with limits on investments in illiquid assets and mitigating the risk that the Fund will be unable to meet its redemption obligations in a timely manner.
Pursuant to the LRMP, the Fund classifies the liquidity of its portfolio investments into one of the four categories defined by the SEC: Highly Liquid, Moderately Liquid, Less Liquid, and Illiquid. These classifications are reported to the SEC on Form N-PORT.
During the Program Reporting Period, the Committee reviewed whether the Fund’s strategy is appropriate for an open-end structure, incorporating any holdings of less liquid and illiquid assets. If the Fund participated in derivative transactions, the exposure from such transactions were considered in the LRMP.
The Committee also performed an analysis to determine whether the Fund is required to maintain a Highly Liquid Investment Minimum (“HLIM”). The Committee also incorporated the following information when determining the Fund’s reasonably anticipated trading size for purposes of liquidity monitoring: historical net redemption activity, a Fund’s concentration in an issuer, shareholder concentration, investment performance, total net assets, and distribution channels.
The Adviser informed the Fund Board that the Committee believes the Fund’s LRMP is adequately designed, has been implemented as intended,
| 84 | AB EMERGING MARKETS MULTI-ASSET PORTFOLIO |
abfunds.com | |
and has operated effectively since its inception. No material exceptions have been noted since the implementation of the LRMP. During the Program Reporting Period, beginning in March 2020, all financial markets experienced extreme levels of price volatility and relative illiquidity resulting from the COVID-19 impacts on the global economy. This extreme relative illiquidity resulted in significantly wider bid-ask spreads to transact in securities, including many of those securities held by the Fund, and in a diminished depth of liquidity in most markets, to varying degrees. Nonetheless, there were no liquidity events that impacted the Fund or its ability to timely meet redemptions during the Program Reporting Period.
| abfunds.com | AB EMERGING MARKETS MULTI-ASSET PORTFOLIO | 85 | |
Information Regarding the Review and Approval of the Fund’s Advisory Agreement
The disinterested directors (the “directors”) of AB Cap Fund, Inc. (the “Company”) unanimously approved the continuance of the Company’s Advisory Agreement with the Adviser in respect of AB Emerging Markets Multi-Asset Portfolio (the “Fund”) at a meeting held by video conference on May 3-5, 2021 (the “Meeting”).
Prior to approval of the continuance of the Advisory Agreement, the directors had requested from the Adviser, and received and evaluated, extensive materials. They reviewed the proposed continuance of the Advisory Agreement with the Adviser and with experienced counsel who are independent of the Adviser, who advised on the relevant legal standards. The directors also reviewed additional materials, including comparative analytical data prepared by the Senior Analyst for the Fund. The directors also discussed the proposed continuance in private sessions with counsel.
The directors considered their knowledge of the nature and quality of the services provided by the Adviser to the Fund gained from their experience as directors or trustees of most of the registered investment companies advised by the Adviser, their overall confidence in the Adviser’s integrity and competence they have gained from that experience, the Adviser’s initiative in identifying and raising potential issues with the directors and its responsiveness, frankness and attention to concerns raised by the directors in the past, including the Adviser’s willingness to consider and implement organizational and operational changes designed to improve investment results and the services provided to the AB Funds. The directors noted that they have four regular meetings each year, at each of which they review extensive materials and information from the Adviser, including information on the investment performance of the Fund and the money market fund advised by the Adviser in which the Fund invests a portion of its assets.
The directors also considered all factors they believed relevant, including the specific matters discussed below. During the course of their deliberations, the directors evaluated, among other things, the reasonableness of the advisory fee. The directors did not identify any particular information that was all-important or controlling, and different directors may have attributed different weights to the various factors. The directors determined that the selection of the Adviser to manage the Fund and the overall arrangements between the Fund and the Adviser, as provided in the Advisory Agreement, including the advisory fee, were fair and reasonable in light of the services performed, expenses incurred and such other matters as the directors considered relevant in the exercise of their business
| 86 | AB EMERGING MARKETS MULTI-ASSET PORTFOLIO |
abfunds.com | |
judgment. The material factors and conclusions that formed the basis for the directors’ determinations included the following:
Nature, Extent and Quality of Services Provided
The directors considered the scope and quality of services provided by the Adviser under the Advisory Agreement, including the quality of the investment research capabilities of the Adviser and the other resources it has dedicated to performing services for the Fund. The directors noted that the Adviser from time to time reviews the Fund’s investment strategies and from time to time proposes changes intended to improve the Fund’s relative or absolute performance for the directors’ consideration. They also noted the professional experience and qualifications of the Fund’s portfolio management team and other senior personnel of the Adviser. The directors also considered that the Advisory Agreement provides that the Fund will reimburse the Adviser for the cost to it of providing certain clerical, accounting, administrative and other services to the Fund by employees of the Adviser or its affiliates. Requests for these reimbursements are made on a quarterly basis and subject to approval by the directors. Reimbursements, to the extent requested and paid, result in a higher rate of total compensation from the Fund to the Adviser than the fee rate stated in the Advisory agreement. The directors noted that the methodology used to determine the reimbursement amounts had been reviewed by an independent consultant retained at the request of the directors. The quality of administrative and other services, including the Adviser’s role in coordinating the activities of the Fund’s other service providers, also was considered. The directors concluded that, overall, they were satisfied with the nature, extent and quality of services provided to the Fund under the Advisory Agreement.
Costs of Services Provided and Profitability
The directors reviewed a schedule of the revenues and expenses and related notes indicating the profitability of the Fund to the Adviser for calendar years 2019 and 2020 that had been prepared with an expense allocation methodology arrived at in consultation with an independent consultant at the request of the directors. The directors noted the assumptions and methods of allocation used by the Adviser in preparing fund-specific profitability data and understood that there are a number of potentially acceptable allocation methodologies for information of this type. The directors noted that the profitability information reflected all revenues and expenses of the Adviser’s relationship with the Fund, including those relating to its subsidiaries that provide transfer agency, distribution and brokerage services to the Fund. The directors recognized that it is difficult to make comparisons of the profitability of the Advisory Agreement with the profitability of fund advisory contracts for unaffiliated funds because comparative information is not generally publicly available and is affected by numerous factors. The directors focused on the profitability of the
| abfunds.com | AB EMERGING MARKETS MULTI-ASSET PORTFOLIO | 87 | |
Adviser’s relationship with the Fund before taxes and distribution expenses. The directors noted that the Fund was not profitable to the Adviser in the periods reviewed.
Fall-Out Benefits
The directors considered the other benefits to the Adviser and its affiliates from their relationships with the Fund and the money market fund advised by the Adviser in which the Fund invests, including, but not limited to, benefits relating to soft dollar arrangements (whereby investment advisers receive brokerage and research services from brokers that execute agency transactions for their clients); 12b-1 fees and sales charges received by the Fund’s principal underwriter (which is a wholly owned subsidiary of the Adviser) in respect of certain classes of the Fund’s shares; brokerage commissions paid by the Fund to brokers affiliated with the Adviser; and transfer agency fees paid by the Fund to a wholly owned subsidiary of the Adviser. The directors recognized that the Fund’s unprofitability to the Adviser would be exacerbated without these benefits. The directors understood that the Adviser also might derive reputational and other benefits from its association with the Fund.
Investment Results
In addition to the information reviewed by the directors in connection with the Meeting, the directors receive detailed performance information for the Fund at each regular Board meeting during the year.
At the Meeting, the directors reviewed performance information prepared by an independent service provider (the “15(c) service provider”), showing the performance of the Class A Shares of the Fund against a group of similar funds (“peer group”) and a larger group of similar funds (“peer universe”), each selected by the 15(c) service provider, and information prepared by the Adviser showing performance of the Class A Shares against a broad-based securities market index, in each case for the 1-, 3- and 5-year periods ended February 28, 2021 and (in the case of comparisons with the broad-based securities market index) for the period from inception. Based on their review, the directors concluded that the Fund’s investment performance was acceptable.
Advisory Fees and Other Expenses
The directors considered the advisory fee rate payable by the Fund to the Adviser and information prepared by the 15(c) service provider concerning advisory fee rates payable by other funds in the same category as the Fund. The directors recognized that it is difficult to make comparisons of advisory fees because there are variations in the services that are included in the fees paid by other funds. The directors compared the Fund’s contractual effective advisory fee rate with a peer group median and took into account the impact on the advisory fee rate of the administrative expense reimbursement paid to the Adviser in the latest fiscal year.
| 88 | AB EMERGING MARKETS MULTI-ASSET PORTFOLIO |
abfunds.com | |
The directors also considered the Adviser’s fee schedule for other clients utilizing investment strategies similar to those of the Fund. For this purpose, they reviewed the relevant advisory fee information from the Adviser’s Form ADV and in a report from the Fund’s Senior Analyst and noted the differences between the Fund’s fee schedule, on the one hand, and the Adviser’s institutional fee schedule and the schedule of fees charged by the Adviser to any offshore funds and for services to any sub-advised funds utilizing investment strategies similar to those of the Fund, on the other. The directors noted that the Adviser may, in some cases, agree to fee rates with large institutional clients that are lower than those reviewed by the directors and that they had previously discussed with the Adviser its policies in respect of such arrangements.
The Adviser reviewed with the directors the significantly greater scope of the services it provides to the Fund relative to institutional, offshore fund and sub-advised fund clients. In this regard, the Adviser noted, among other things, that, compared to institutional and offshore or sub-advisory accounts, the Fund (i) demands considerably more portfolio management, research and trading resources due to significantly higher daily cash flows; (ii) has more tax and regulatory restrictions and compliance obligations; (iii) must prepare and file or distribute regulatory and other communications about fund operations; and (iv) must provide shareholder servicing to retail investors. The Adviser also reviewed the greater legal risks presented by the large and changing population of Fund shareholders who may assert claims against the Adviser in individual or class actions, and the greater entrepreneurial risk in offering new fund products, which require substantial investment to launch, may not succeed, and generally must be priced to compete with larger, more established funds resulting in lack of profitability to the Adviser until a new fund achieves scale. In light of the substantial differences in services rendered by the Adviser to institutional, offshore fund and sub-advised fund clients as compared to the Fund, and the different risk profile, the directors considered these fee comparisons inapt and did not place significant weight on them in their deliberations.
The directors noted that the Fund invests in shares of exchange-traded funds (“ETFs”), subject to the restrictions and limitations of the Investment Company Act of 1940 as these may be varied as a result of exemptive orders issued, and rules adopted, by the SEC. The directors also noted that ETFs pay advisory fees pursuant to their advisory contracts, and that the Adviser had provided, and they had reviewed, information about the expense ratios of the relevant ETFs. The directors concluded, based on the Adviser’s explanation of how it uses ETFs when they are the most cost-effective way to obtain desired exposures, in some cases pending purchases of underlying securities, that the advisory fee for the Fund is for services that are in addition to, rather than duplicative of, the services provided under the advisory contracts of the ETFs.
| abfunds.com | AB EMERGING MARKETS MULTI-ASSET PORTFOLIO | 89 | |
In connection with their review of the Fund’s advisory fee, the directors also considered the total expense ratio of the Class A shares of the Fund in comparison to a peer group and a peer universe selected by the 15(c) service provider. The Class A expense ratio of the Fund was based on the Fund’s latest fiscal year and the directors considered the Adviser’s expense cap for the Fund. The directors noted that it was likely that the expense ratios of some of the other funds in the Fund’s category were lowered by waivers or reimbursements by those funds’ investment advisers, which in some cases might be voluntary or temporary. The directors view expense ratio information as relevant to their evaluation of the Adviser’s services because the Adviser is responsible for coordinating services provided to the Fund by others. Based on their review, the directors concluded that the Fund’s expense ratio was acceptable.
Economies of Scale
The directors noted that the advisory fee schedule for the Fund contains breakpoints that reduce the fee rates on assets above specified levels. The directors took into consideration prior presentations by an independent consultant on economies of scale in the mutual fund industry and for the AB Funds, and presentations from time to time by the Adviser concerning certain of its views on economies of scale. The directors also had requested and received from the Adviser certain updates on economies of scale in advance of the Meeting. The directors believe that economies of scale may be realized (if at all) by the Adviser across a variety of products and services, and not only in respect of a single fund. The directors noted that there is no established methodology for setting breakpoints that give effect to the fund-specific services provided by a fund’s adviser and to the economies of scale that an adviser may realize in its overall mutual fund business or those components of it which directly or indirectly affect a fund’s operations. The directors observed that in the mutual fund industry as a whole, as well as among funds similar to the Fund, there is no uniformity or pattern in the fees and asset levels at which breakpoints (if any) apply. The directors also noted that the advisory agreements for many funds do not have breakpoints at all. Having taken these factors into account, the directors concluded that the Fund’s shareholders would benefit from a sharing of economies of scale in the event the Fund’s net assets exceed a breakpoint in the future.
| 90 | AB EMERGING MARKETS MULTI-ASSET PORTFOLIO |
abfunds.com | |
This page is not part of the Shareholder Report or the Financial Statements.
AB FAMILY OF FUNDS
US EQUITY
CORE
Core Opportunities Fund
Select US Equity Portfolio
Sustainable US Thematic Portfolio1
GROWTH
Concentrated Growth Fund
Discovery Growth Fund
Growth Fund
Large Cap Growth Fund
Small Cap Growth Portfolio
VALUE
Discovery Value Fund
Equity Income Fund
Relative Value Fund
Small Cap Value Portfolio
Value Fund
INTERNATIONAL/ GLOBAL EQUITY
CORE
Global Core Equity Portfolio
International Strategic Core Portfolio
Sustainable Global Thematic Fund
Tax-Managed Wealth Appreciation Strategy
Wealth Appreciation Strategy
GROWTH
Concentrated International Growth Portfolio
Sustainable International Thematic Fund
VALUE
All China Equity Portfolio
International Value Fund
FIXED INCOME
MUNICIPAL
High Income Municipal Portfolio
Intermediate California Municipal Portfolio
Intermediate Diversified Municipal Portfolio
Intermediate New York Municipal Portfolio
Municipal Bond Inflation Strategy
Tax-Aware Fixed Income Opportunities Portfolio
National Portfolio
Arizona Portfolio
California Portfolio
Massachusetts Portfolio
Minnesota Portfolio
New Jersey Portfolio
New York Portfolio
Ohio Portfolio
Pennsylvania Portfolio
Virginia Portfolio
TAXABLE
Bond Inflation Strategy
Global Bond Fund
High Income Fund
High Yield Portfolio1
Income Fund
Intermediate Duration Portfolio
Limited Duration High Income Portfolio
Short Duration Income Portfolio
Short Duration Portfolio
Sustainable Thematic Credit Portfolio
Total Return Bond Portfolio
ALTERNATIVES
All Market Real Return Portfolio
Global Real Estate Investment Fund
Select US Long/Short Portfolio
MULTI-ASSET
All Market Income Portfolio
All Market Total Return Portfolio
Conservative Wealth Strategy
Emerging Markets Multi-Asset Portfolio
Global Risk Allocation Fund
Tax-Managed All Market Income Portfolio
CLOSED-END FUNDS
AllianceBernstein Global High Income Fund
AllianceBernstein National Municipal Income Fund
We also offer Government Money Market Portfolio, which serves as the money market fund exchange vehicle for the AB mutual funds. You could lose money by investing in the Fund. Although the Fund seeks to preserve the value of your investment at $1.00 per share, it cannot guarantee it will do so. The Fund may impose a fee upon sale of your shares or may temporarily suspend your ability to sell shares if the Fund’s liquidity falls below required minimums because of market conditions or other factors. An investment in the Fund is not insured or guaranteed by the Federal Deposit Insurance Corporation or any other government agency. The Fund’s sponsor has no legal obligation to provide financial support to the Fund, and you should not expect that the sponsor will provide financial support to the Fund at any time.
Investors should consider the investment objectives, risks, charges and expenses of the Fund carefully before investing. For copies of our prospectus or summary prospectus, which contain this and other information, visit us online at www.abfunds.com or contact your AB representative. Please read the prospectus and/or summary prospectus carefully before investing.
| 1 | Prior to August 23, 2021, Sustainable US Thematic Portfolio was named FlexFee™ US Thematic Portfolio. Prior to April 30, 2021, High Yield Portfolio was named FlexFee™ High Yield Portfolio. |
| abfunds.com | AB EMERGING MARKETS MULTI-ASSET PORTFOLIO | 91 | |
NOTES
| 92 | AB EMERGING MARKETS MULTI-ASSET PORTFOLIO |
abfunds.com | |
AB EMERGING MARKETS MULTI-ASSET PORTFOLIO
1345 Avenue of the Americas
New York, NY 10105
800 221 5672
EMMA-0152-0921

ITEM 2. CODE OF ETHICS.
Not applicable when filing a semi-annual report to shareholders.
ITEM 3. AUDIT COMMITTEE FINANCIAL EXPERT.
Not applicable when filing a semi-annual report to shareholders.
ITEM 4. PRINCIPAL ACCOUNTANT FEES AND SERVICES.
Not applicable when filing a semi-annual report to shareholders.
ITEM 5. AUDIT COMMITTEE OF LISTED REGISTRANTS.
Not applicable to the registrant.
ITEM 6. INVESTMENTS.
Please see Schedule of Investments contained in the Report to Shareholders included under Item 1 of this Form N-CSR.
ITEM 7. DISCLOSURE OF PROXY VOTING POLICIES AND PROCEDURES FOR CLOSED-END MANAGEMENT INVESTMENT COMPANIES.
Not applicable to the registrant.
ITEM 8. PORTFOLIO MANAGERS OF CLOSED-END MANAGEMENT INVESTMENT COMPANIES.
Not applicable to the registrant.
ITEM 9. PURCHASES OF EQUITY SECURITIES BY CLOSED-END MANAGEMENT INVESTMENT COMPANY AND AFFILIATED PURCHASERS.
Not applicable to the registrant.
ITEM 10. SUBMISSION OF MATTERS TO A VOTE OF SECURITY HOLDERS.
There have been no material changes to the procedures by which shareholders may recommend nominees to the Fund’s Board of Directors since the Fund last provided disclosure in response to this item.
ITEM 11. CONTROLS AND PROCEDURES.
(a) The registrant’s principal executive officer and principal financial officer have concluded that the registrant’s disclosure controls and procedures (as defined in Rule 30a-2(c) under the Investment Company Act of 1940, as amended) are effective at the reasonable assurance level based on their evaluation of these controls and procedures as of a date within 90 days of the filing date of this document.
(b) There were no changes in the registrant’s internal controls over financial reporting that occurred during the second fiscal quarter of the period that has materially affected, or is reasonably likely to materially affect, the registrant’s internal control over financial reporting.
ITEM 12. DISCLOSURE OF SECURITIES LENDING ACTIVITIES FOR CLOSED-END MANAGEMENT INVESTMENT COMPANIES.
Not applicable to the registrant.
ITEM 13. EXHIBITS.
The following exhibits are attached to this Form N-CSR:
SIGNATURES
Pursuant to the requirements of the Securities Exchange Act of 1934 and the Investment Company Act of 1940, the registrant has duly caused this report to be signed on its behalf by the undersigned, thereunto duly authorized.
| (Registrant): AB Cap Fund, Inc. | ||
| By: | /s/ Onur Erzan | |
| Onur Erzan | ||
| President | ||
| Date: | November 26, 2021 | |
Pursuant to the requirements of the Securities Exchange Act of 1934 and the Investment Company Act of 1940, this report has been signed below by the following persons on behalf of the registrant and in the capacities and on the dates indicated.
| By: | /s/ Onur Erzan | |
| Onur Erzan | ||
| President | ||
| Date: | November 26, 2021 | |
| By: | /s/ Joseph J. Mantineo | |
| Joseph J. Mantineo | ||
| Treasurer and Chief Financial Officer | ||
| Date: | November 26, 2021 | |
Exhibit 12(b)(1)
CERTIFICATION OF PRINCIPAL EXECUTIVE OFFICER
I, Onur Erzan, President of AB Cap Fund, Inc., certify that:
1. I have reviewed this report on Form N-CSR of AB Cap Fund, Inc.;
2. Based on my knowledge, this report does not contain any untrue statement of a material fact or omit to state a material fact necessary to make the statements made, in light of the circumstances under which such statements were made, not misleading with respect to the period covered by this report;
3. Based on my knowledge, the financial statements, and other financial information included in this report, fairly present in all material respects the financial condition, results of operations, changes in net assets, and cash flows (if the financial statements are required to include a statement of cash flows) of the registrant as of, and for, the periods presented in this report;
4. The registrant’s other certifying officers and I are responsible for establishing and maintaining disclosure controls and procedures (as defined in Rule 30a-3(c) under the Investment Company Act of 1940) and internal control over financial reporting (as defined in Rule 30a-3(d) under the Investment Company Act of 1940) for the registrant and have:
| a) | designed such disclosure controls and procedures to ensure that material information relating to the registrant, including its consolidated subsidiaries, is made known to us by others within those entities, particularly during the period in which this report is being prepared; |
| b) | designed such internal control over financial reporting to provide reasonable assurance regarding the reliability of financial reporting and the preparation of financial statements for external purposes in accordance with generally accepted accounting principles; |
| c) | evaluated the effectiveness of the registrant’s disclosure controls and procedures and presented in this report our conclusions about the effectiveness of the disclosure controls and procedures, as of a date within 90 days prior to the filing date of this report based on such evaluation; and |
| d) | disclosed in this report any change in the registrant’s internal control over financial reporting that occurred during the second fiscal quarter of the period covered by this report that has materially affected, or is reasonably likely to materially affect, the registrant’s internal control over financial reporting; and |
5. The registrant’s other certifying officers and I have disclosed to the registrant’s auditors and the audit committee of the registrant’s board of directors (or persons performing the equivalent functions):
a) all significant deficiencies and material weaknesses in the design or operation of internal control over financial reporting which are reasonably likely to adversely affect the registrant’s ability to record, process, summarize, and report financial information; and
b) any fraud, whether or not material, that involves management or other employees who have a significant role in the registrant’s internal control over financial reporting.
Date: November 26, 2021
| By: | /s/ Onur Erzan | |
| Onur Erzan | ||
| President |
CERTIFICATION OF PRINCIPAL FINANCIAL OFFICER
I, Joseph J. Mantineo, Treasurer and Chief Financial Officer of AB Cap Fund, Inc., certify that:
1. I have reviewed this report on Form N-CSR of AB Cap Fund, Inc.;
2. Based on my knowledge, this report does not contain any untrue statement of a material fact or omit to state a material fact necessary to make the statements made, in light of the circumstances under which such statements were made, not misleading with respect to the period covered by this report;
3. Based on my knowledge, the financial statements, and other financial information included in this report, fairly present in all material respects the financial condition, results of operations, changes in net assets, and cash flows (if the financial statements are required to include a statement of cash flows) of the registrant as of, and for, the periods presented in this report;
4. The registrant’s other certifying officers and I are responsible for establishing and maintaining disclosure controls and procedures (as defined in Rule 30a-3(c) under the Investment Company Act of 1940) and internal control over financial reporting (as defined in Rule 30a-3(d) under the Investment Company Act of 1940) for the registrant and have:
| a) | designed such disclosure controls and procedures to ensure that material information relating to the registrant, including its consolidated subsidiaries, is made known to us by others within those entities, particularly during the period in which this report is being prepared; |
| b) | designed such internal control over financial reporting to provide reasonable assurance regarding the reliability of financial reporting and the preparation of financial statements for external purposes in accordance with generally accepted accounting principles; |
| c) | evaluated the effectiveness of the registrant’s disclosure controls and procedures presented in this report our conclusions about the effectiveness of the disclosure controls and procedures, as of a date within 90 days prior to the filing date of this report based on such evaluation; and |
| d) | disclosed in this report any change in the registrant’s internal control over financial reporting that occurred during the second fiscal quarter of the period covered by this report that has materially affected, or is reasonably likely to materially affect, the registrant’s internal control over financial reporting; and |
5. The registrant’s other certifying officers and I have disclosed to the registrant’s auditors and the audit committee of the registrant’s board of directors (or persons performing the equivalent functions):
a) all significant deficiencies and material weaknesses in the design or operation of internal control over financial reporting which are reasonably likely to adversely affect the registrant’s ability to record, process, summarize, and report financial information; and
b) any fraud, whether or not material, that involves management or other employees who have a significant role in the registrant’s internal control over financial reporting.
Date: November 26, 2021
| By: | /s/ Joseph J. Mantineo | |
| Joseph J. Mantineo | ||
| Treasurer and Chief Financial Officer |
EXHIBIT 12(c)
CERTIFICATION PURSUANT TO SECTION 906 OF THE
SARBANES-OXLEY ACT
Pursuant to 18 U.S.C. 1350, each of the undersigned, being the Principal Executive Officer and Principal Financial Officer of AB Cap Fund Inc., (the “Registrant”), hereby certifies that the Registrant’s report on Form N-CSR for the period ended September 30, 2021 (the “Report”) fully complies with the requirements of Section 13(a) or 15(d) of the Securities Exchange Act of 1934 and that the information contained in the Report fairly presents, in all material respects, the financial condition and results of operations of the Registrant.
Date: November 26, 2021
| By: | /s/ Onur Erzan | |
| Onur Erzan | ||
| President | ||
| By: | /s/ Joseph J. Mantineo | |
| Joseph J. Mantineo | ||
| Treasurer and Chief Financial Officer | ||
This certification is being furnished solely pursuant to Section 906 of the Sarbanes-Oxley Act of 2002 and is not being filed as part of the Report or as a separate disclosure document.
A signed original of this written statement required by Section 906 has been provided to the Registrant and will be retained by the Registrant and furnished to the Securities and Exchange Commission or its staff upon request.
Serious News for Serious Traders! Try StreetInsider.com Premium Free!
You May Also Be Interested In
- Orosur Mining Inc Announces Results for Third Quarter Ended February 29, 2024
- Together Selects nCino to Revolutionise its Lending Business
- SOLE Treadmills With Training Programs & Daily Fitness Classes Announced
Create E-mail Alert Related Categories
SEC FilingsSign up for StreetInsider Free!
Receive full access to all new and archived articles, unlimited portfolio tracking, e-mail alerts, custom newswires and RSS feeds - and more!
