

Form N-CSR/A Miller Investment Trust For: Oct 31
 Tweet
Tweet Share
Share
united
states
securities and exchange commission
washington, d.c. 20549
form n-csr
certified shareholder report of registered management
investment companies
Investment Company Act file number 811-22131
Miller Investment Trust
(Exact name of registrant as specified in charter)
20 William Street Wellesley, MA 02481
(Address of principal executive offices) (Zip code)
The Corporation Trust Company
1209 Orange Street Wilmington, DE 19801
(Name and address of agent for service)
Registrant's telephone number, including area code: 781-416-4000
Date of fiscal year end: 10/31
Date of reporting period:10/31/21
Refile to update Items 4 and 11 (b).
Item 1. Reports to Stockholders.
 |
| Miller Convertible Bond Fund |
| Miller Convertible Plus Fund |
| Miller Intermediate Bond Fund |
| Annual Report |
| October 31, 2021 |
| 877- 441- 4434 |
| www.MillerFamilyofFunds.com |
| Investment Advisor |
| Wellesley Asset Management, Inc. |
| The Wellesley Office Park |
| 20 William Street, Suite 310 |
| Wellesley, MA 02481 |
| 781-416-4000 |
| This report and the financial statements contained herein are submitted for the general information of shareholders and are not authorized for distribution to prospective investors unless preceded or accompanied by an effective prospectus. Nothing herein contained is to be considered an offer of sale or solicitation of an offer to buy shares of Miller Funds. Such offering is made only by prospectus, which includes details as to offering price and other material information. |
| Distributed by Northern Lights Distributors, LLC. Member FINRA |
Dear Fellow Shareholder,
This annual report of the Miller family of funds provides an overview of mutual fund performance for the 12-month period ending October 31, 2021 (“the Reporting Period”) and provides insights into the convertible market, factors that influenced performance over the last year and what investors may expect going forward.
During the reporting period, all share classes of the mutual funds in the Miller family of funds outperformed bonds but underperformed stocks. Similarly, since inception all share classes have outperformed the Bloomberg Barclays US Aggregate Index, while all share classes have underperformed the S&P 500 Total Return Index. Investors must keep in mind that unlike many convertible managers who run equity-like convertible bond strategies, the Miller convertible funds strive to be a more conservative fixed income strategy. As such, historically in equity bull markets we may lag peers, but outperform in equity bear markets. The funds’ performance for the one year ending October 31, 2021 and since inception is as follows:
| One Year Ended | Annualized Since | |
| Miller Convertible Bond Fund | October 31, 2021 | Inception |
| I shares (MCIFX) | 11.04% | 6.91% (12/27/07) |
| A shares (MCFAX.LW) | 10.54% | 6.35% (12/27/07) |
| C shares (MCFCX) | 9.99% | 6.59% (12/01/09) |
| Annualized Since | ||
| Miller Convertible Plus Fund | Inception | |
| I shares (MCPIX) | 8.05% | 8.15% (12/31/14) |
| Annualized Since | ||
| Miller Intermediate Bond Fund | Inception | |
| I shares (MIFIX) | 10.83% | 5.72% (12/31/14) |
The funds’ total net assets under management for the period ended 10/31/2021 were as follows:
| Miller Convertible Bond Fund | $973,805,773 |
| Miller Convertible Plus Fund | $119,886,449 |
| Miller Intermediate Bond Fund | $127,660,494 |
1
Convertible Market Review
For the year ending October 31, 2021, the Bloomberg Barclays US Aggregate Bond Index was down 0.48% while the S&P 500 Total Return Index was up 42.91%. Convertible performance was buoyed by the strength of underlying equities and tighter credit spreads. Higher interest rates and lower volatility offset gains attributable to the previously mentioned factors. Note the following definitions:
| ● | The Bloomberg/Barclays US Aggregate Bond Index represents most investment grade bonds traded in the United States |
| ● | The S&P 500 Total Return Index is a cap-weighted index of 500 common stocks and is regarded as a leading proxy for the US stock market |
| ● | A credit spread is the difference in yield between a U.S. Treasury bond and a debt security with the same maturity but of lesser quality |
Please note that Investors cannot directly invest in an index and unmanaged index returns do not reflect any fees, expenses, or sales charges.
The fiscal year started with a bang, as equities responded positively to early November election results. From there it was off to the races with strong equity markets, characterized by low volatility and very small drawdowns. Interest rates experienced a bumpy ride in the beginning of this year as strong economic data and concerns over inflation caused the 10-year Treasury bond yield to more than double to 1.60%. Equity markets continued to march higher until the month of September. Concerns about the sizes of fiscal stimulus packages and worries about inflation caused equity markets to fall almost 5% during the month. It was also during this time the stock market had its first drawdown greater than 5% during our fiscal year. In October it became clear there would be some paring back of the fiscal stimulus packages. Equity markets responded by recuperating September’s losses and ending the fiscal year at all-time highs.
Despite some treasury yield turbulence, the investing environment remained supportive for U.S. equity markets. As the number of COVID-19 cases dropped, the economy began to reopen. With economic numbers improving, corporate earnings continued to beat analyst’s estimates. The CBOE Volatility Index, or VIX, a measure of short-term equity volatility, started the year above 35 and ended at 16, reflecting the calm investing environment. Corporate credit spreads continued to tighten throughout the year despite the rise in government interest rates. Investment grade credit spreads improved by 30 basis points while high yield spreads saw a staggering improvement of 200 basis points. This led to significant outperformance by high yield convertibles (up 72%) when compared to investment grade convertibles (up 17%). The combination of higher equity prices and higher rates provided the ideal backdrop for convertible issuance. Over the fiscal year, more money was raised in the convertible market than in any year going back to 2008.
2
Miller Convertible Bond Fund
Over the last year, the Miller Convertible Bond Fund outperformed the Bloomberg Barclays US Aggregate Bond Index. The combination of higher rates and higher stock prices led to the fund’s outperformance compared to the Bloomberg Barclays US Aggregate Bond Index.
The fund’s position in Innovated Industrial Properties, Inc. (1.65% weight) produced a gain of 122%. On the negative side, the fund’s position in Newmont Mining (1.37% weight) resulted in 16.1% loss.
The fund is well diversified with 79 positions. Ford Motor Company is the largest holding representing 3.17% of the fund’s assets. During the reporting period, the market moved higher in an orderly fashion. As a result, the Fund’s largest monthly drawdown, or peak to trough decline, was only 1.66%.
Miller Convertible Plus Fund
The Miller Convertible Plus Fund also outperformed the Bloomberg Barclays US Aggregate Bond Index and underperformed the S&P 500 Total Return Index. Similar to the Miller Convertible Fund, higher interest rates and higher stock prices led to outperformance versus the Bloomberg Barclays US Aggregate Bond Index.
The Miller Convertible Plus Fund’s top performing position was Smart Global Holdings Inc. (3.74% weight) which returned 66%. The Fund’s worst position was in a NASDAQ put option which was used as a portfolio hedge. The NASDAQ 100 Stock Index NDX US 12/17/21 P13000 (0.10% weight) resulted in a 96% loss.
The fund remains well diversified with 49 positions, the largest which accounts for 4.96% of assets. The Miller Convertible Plus Fund is often the most volatile in the Miller family of funds because of leverage. As a result, the largest monthly drawdown over the fiscal year in the fund was 5.87%.
Miller Intermediate Bond Fund
The Miller Intermediate Bond Fund outperformed the Bloomberg Barclays US Aggregate Bond. In a period of rising interest rates, the fund’s shorter duration led to outperformance relative to the Bloomberg Barclays US Aggregate Bond Index.
The Intermediate Bond Fund’s best performing position was Smart Global Holdings Inc. (1.17% weight) which gained 66%. The Fund’s worst performing position was Trip Advisor Inc. (2.39% weight) which lost 9.83%.
The Intermediate Bond Fund has 54 positions. Ford Motor Company is the largest position representing 2.98% of the fund’s assets. The fund’s largest drawdown for the reporting period was 1.15%.
3
Convertible Bond Strategy Review
We remain committed to the same strategy we have utilized since Wellesley Asset Management was founded in 1991. It is important to note that we do not change our investment strategy regardless of the current investment climate. Our investment focus is to buy convertible bonds and notes (no convertible preferreds, mandatory preferreds, or other convertible structures) which typically offer the return of the majority of principal within seven years of issuance when purchased at or near par value. Before making an investment, we perform a thorough analysis of a company’s balance sheet and income statement. We seek to invest in profitable companies and avoid companies with large debt loads. While we usually invest with the idea of holding bonds until the next liquidity date (maturity, put or call), we consider selling or reducing our exposure if one of the following scenarios occur:
| ● | An issuer’s credit quality deteriorates |
| ● | The bond loses its favorable risk/reward characteristics due to price appreciation |
| ● | We perceive an opportunity to increase portfolio diversification |
| ● | We believe more attractive investments are available. |
One of our key risk management practices involves careful limits on prices we pay to avoid purchasing convertibles trading at prices substantially above par, or which have material negative yields to the next liquidity date. Such investment discipline seeks to reduce exposure to many equity-sensitive convertibles. In the first half of 2021 we reduced equity risk in our portfolios by selling appreciated securities and redeploying those assets into bonds trading closer to their par value. As a result, distributions from our funds were larger than normal in the first half of the year. Profit taking is a normal part of our investment process as we seek to reduce equity risk in our portfolios. While our performance tends to lag broader equity indices in rising markets, we seek to preserve capital in falling stock markets. Our holdings span the convertible market, from investment-grade to small-cap, with a broad distribution among varied industries. Many of our rated convertible bonds are investment grade and a large percentage of the bonds are not rated.
New Issuance
Primary issuance continued on a record setting pace over the last year. Higher equity prices and interest rates created an ideal environment for companies to issue convertibles. About $91 billion of new paper came to market over the last year which was more than any full year since 2008. Below is a sampling of some of the new issues that met the strategy’s investing criteria and found their way into various portfolios (weightings as of October 31, 2021):
| ● | Greenbrier Companies Inc. (2.99% weight), a manufacturer of railroad freight car equipment |
| ● | Halozyme Therapeutics, Inc. (2.88% weight), a developer of drug delivery systems for biologics |
| ● | Ford Motor Company (3.33% weight), a manufacturer of automobiles |
4
Summary
Over the last year, equity investors have been beneficiaries of strong returns with little volatility. Even more unusual is that investors have not had to endure any steep drawdowns in the process. The bulls have plenty to cheer about. Coming out of the Covid-19 crisis, the earnings growth rates of many corporations have been impressive. Combined with a dovish Federal Reserve and “Goldilocks” economic numbers have given the bulls plenty to be excited about going into 2022.
The bears are focused on valuations as P/E’s continue to move higher. In addition, with the passage of the infrastructure package and an upcoming vote on the Build Back Better Act, the bears are concerned that substantial fiscal stimulus together with endless easy money from Central Banks could ignite persistent inflation.
Fortunately, we invest in convertible bonds with asymmetric return profiles and issued by companies with healthy balance sheets which allow investors to stay invested during periods of high valuations or market downturns.
For more detailed and timely information on our funds and Wellesley Asset Management, please visit our website at www.wellesleyassetmanagement.com where you can access quarterly commentaries and fund fact sheets. As always, we thank you for your continued trust and confidence in our management. We look forward to helping you achieve your future goals.
Sincerely,
Greg
Miller, Portfolio Manager
Michael Miller, Portfolio Manager
2444-NLD-11192021
5
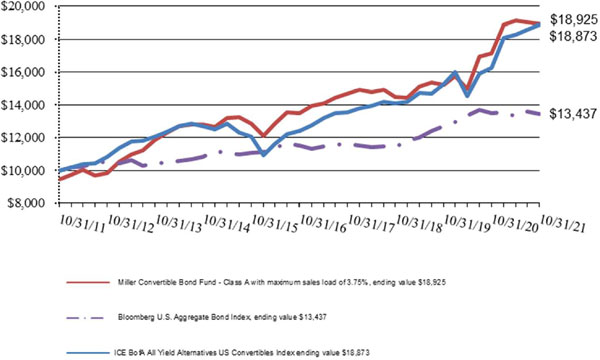
| Miller Convertible Bond Fund Class A |
| GROWTH OF A $10,000 INVESTMENT (Unaudited) |
| Since Inception through October 31, 2021 |
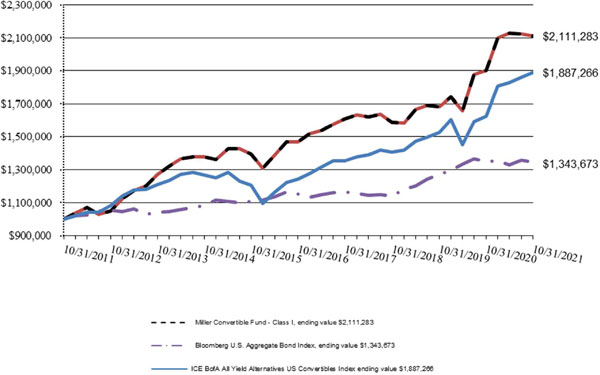
| Miller Convertible Bond Fund Class I |
| GROWTH OF A $1,000,000 INVESTMENT (Unaudited) |
| Since Inception through October 31, 2021 |
6
Total Returns as of October 31, 2021
| Annualized | |||||
| Since Inception * | Since Inception ** | ||||
| One Year | Five Years | Ten Years | (Class A & I) | (Class C) | |
| Miller Convertible Bond Fund: | |||||
| Class A, without sales charge | 10.54% | 6.98% | 7.23% | 6.35% | — |
| Class A, with sales charge of 3.75% | 4.19% | 5.73% | 6.59% | 5.89% | — |
| Class I | 11.04% | 7.50% | 7.76% | 6.91% | — |
| Class C | 9.99% | 6.42% | 6.68% | — | 6.59% |
| Bloomberg U.S. Aggregate Bond Index | (0.48)% | 3.10% | 3.00% | 3.99% | 3.51% |
| ICE BofA All Yield Alternatives US Convertibles Index | 15.97% | 8.74% | 6.56% | 6.01% | 6.74% |
| * | Class A and Class I shares commenced operations on December 27, 2007. |
| ** | Class C shares commenced operations on December 1, 2009. |
The Bloomberg U.S. Aggregate Bond Index is an unmanaged index of prices of U.S. dollar-denominated, fixed-rate, taxable, investment grade fixed-income securities with remaining maturities of one year and longer. The Index includes Treasury, government, corporate, mortgage-backed, commercial mortgage-backed and asset-backed securities.
The ICE BofA All Yield Alternatives US Convertibles Index tracks the performance of U.S. dollar denominated convertible debt.
Past performance is not predictive of future results. The investment return and principal value of an investment will fluctuate. An investor’s shares, when redeemed, may be worth more or less than the original cost. Total return is calculated assuming reinvestment of all dividends and distributions and the payment of the maximum 3.75% sales charge. Average annual total return reflects the change in the value of an investment, assuming reinvestment of the class’ distributions from dividend income and capital gains (the profits earned upon the sale of securities that have grown in value, if any) and assuming a constant rate of performance each year. Total returns would have been lower had the adviser not waived a portion of its fees and reimbursed a portion of the Fund’s expenses. The Fund’s total gross annual operating expenses, per its prospectus dated March 1, 2021, as supplemented on July 8, 2021, including the indirect expenses of underlying funds, are 1.50%, 1.00%, and 2.00% for Class A shares, Class I shares, and Class C shares, respectively. For performance information current to the most recent month-end, please call 877-441-4434.
7
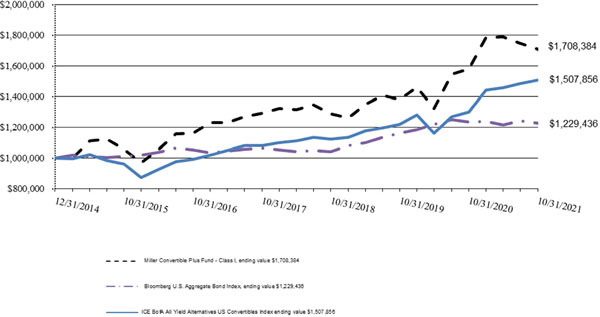
| Miller Convertible Plus Fund Class I |
| GROWTH OF A $1,000,000 INVESTMENT (Unaudited) |
| Since Inception through October 31, 2021 |
Total Returns as of October 31, 2021
| Annualized | |||
| One Year | Five Years | Since Inception* | |
| Miller Convertible Plus Fund: | |||
| Class I | 8.05% | 7.99% | 8.15% |
| Bloomberg U.S. Aggregate Bond Index | (0.48)% | 3.10% | 3.07% |
| ICE BofA All Yield Alternatives US Convertibles Index | 15.97% | 8.74% | 6.19% |
| * | Class I shares commenced operations on December 31, 2014. |
The Bloomberg U.S. Aggregate Bond Index is an unmanaged index of prices of U.S. dollar-denominated, fixed-rate, taxable, investment grade fixed-income securities with remaining maturities of one year and longer. The Index includes Treasury, government, corporate, mortgage-backed, commercial mortgage-backed and asset-backed securities.
The ICE BofA All Yield Alternatives US Convertibles Index tracks the performance of U.S. dollar denominated convertible debt.
Past performance is not predictive of future results. The investment return and principal value of an investment will fluctuate. An investor’s shares, when redeemed, may be worth more or less than the original cost. Total return is calculated assuming reinvestment of all dividends and distributions. Average annual total return reflects the change in the value of an investment, assuming reinvestment of the class’ distributions from dividend income and capital gains (the profits earned upon the sale of securities that have grown in value, if any) and assuming a constant rate of performance each year. Total returns would have been lower had the adviser not waived a portion of its fees and reimbursed a portion of the Fund’s expenses. The Fund’s total gross annual operating expenses, per its prospectus dated March 1, 2021, including the indirect expenses of underlying funds, is 2.97% for Class I shares. For performance information current to the most recent month-end, please call 877-441-4434.
8
| Miller Intermediate Bond Fund Class I |
| GROWTH OF A $1,000,000 INVESTMENT (Unaudited) |
| Since Inception through October 31, 2021 |

Total Returns as of October 31, 2021
| Annualized | |||
| One Year | Five Years | Since Inception* | |
| Miller Intermediate Bond Fund: | |||
| Class I | 10.83% | 5.68% | 5.72% |
| Bloomberg U.S. Aggregate Bond Index | (0.48)% | 3.10% | 3.07% |
| * | Class I shares commenced operations on December 31, 2014. |
The Bloomberg U.S. Aggregate Bond Index is an unmanaged index of prices of U.S. dollar-denominated, fixed-rate, taxable, investment grade fixed-income securities with remaining maturities of one year and longer. The Index includes Treasury, government, corporate, mortgage-backed, commercial mortgage-backed and asset-backed securities.
Past performance is not predictive of future results. The investment return and principal value of an investment will fluctuate. An investor’s shares, when redeemed, may be worth more or less than the original cost. Total return is calculated assuming reinvestment of all dividends and distributions and . Average annual total return reflects the change in the value of an investment, assuming reinvestment of the class’ distributions from dividend income and capital gains (the profits earned upon the sale of securities that have grown in value, if any) and assuming a constant rate of performance each year. Total returns would have been lower had the adviser not waived a portion of its fees and reimbursed a portion of the Fund’s expenses. The Fund’s total gross annual operating expenses, per its prospectus dated March 1, 2021, including indirect expenses of underlying funds, is 1.06% for Class I shares. For performance information current to the most recent month-end, please call 877-441-4434.
9
| MILLER CONVERTIBLE BOND FUND |
| SCHEDULE OF INVESTMENTS |
| October 31, 2021 |
| Shares | Fair Value | |||||||||||
| COMMON STOCKS — 0.1% | ||||||||||||
| ASSET MANAGEMENT - 0.1% | ||||||||||||
| 88,200 | Acropolis Infrastructure Acquisition Corporation(a) | $ | 879,354 | |||||||||
| 44,000 | TortoiseEcofin Acquisition Corporation III(a) | 437,800 | ||||||||||
| 1,317,154 | ||||||||||||
| TOTAL COMMON STOCKS (Cost $1,322,000) | 1,317,154 | |||||||||||
| Principal | Coupon Rate | |||||||||||
| Amount ($) | (%) | Maturity | ||||||||||
| CONVERTIBLE BONDS — 96.6% | ||||||||||||
| AEROSPACE & DEFENSE — 0.2% | ||||||||||||
| 2,000,000 | Kaman Corporation | 3.2500 | 05/01/24 | 2,032,600 | ||||||||
| ASSET MANAGEMENT — 0.0%(b) | ||||||||||||
| 100,000 | Ares Capital Corporation | 4.6250 | 03/01/24 | 114,130 | ||||||||
| 100,000 | New Mountain Finance Corporation | 5.7500 | 08/15/23 | 107,505 | ||||||||
| 221,635 | ||||||||||||
| AUTOMOTIVE — 3.2% | ||||||||||||
| 26,000,000 | Ford Motor Company(c),(d) | — | 03/15/26 | 30,885,059 | ||||||||
| BANKING — 0.8% | ||||||||||||
| 8,000,000 | Hope Bancorp, Inc. | 2.0000 | 05/15/38 | 7,835,044 | ||||||||
| BASIC INDUSTRY — 0.2% | ||||||||||||
| 2,000,000 | Dow, Inc. - Bank of America Finance LLC Synthetic(f) | 2.6410 | 06/18/24 | 2,128,600 | ||||||||
| BEVERAGES — 0.0%(b) | ||||||||||||
| 100,000 | PepsiCo, Inc. - Citigroup Global Markets Holdings, Inc. Synthetic(f) | 1.4930 | 12/30/27 | 95,660 | ||||||||
| BIOTECH & PHARMA — 18.2% | ||||||||||||
| 17,400,000 | AbbVie, Inc. - Goldman Sachs Finance Corp. Synthetic(f) | 1.4700 | 02/03/28 | 16,352,520 | ||||||||
| 10,000,000 | AbbVie, Inc. - Goldman Sachs Finance Corp. Synthetic(f) | 1.9900 | 05/01/28 | 9,703,000 | ||||||||
| 16,000,000 | BioMarin Pharmaceutical, Inc. | 1.2500 | 05/15/27 | 16,179,625 | ||||||||
| 17,000,000 | Bristol-Myers Squibb Co. - Wells Fargo Finance, LLC. Synthetic(f) | 2.3100 | 11/01/24 | 17,588,200 | ||||||||
| 30,000,000 | Halozyme Therapeutics, Inc.(c) | 0.2500 | 03/01/27 | 26,688,799 | ||||||||
| 25,000,000 | Jazz Investments I Ltd. | 1.5000 | 08/15/24 | 25,468,750 | ||||||||
The accompanying notes are an integral part of these financial statements.
10
| MILLER CONVERTIBLE BOND FUND |
| SCHEDULE OF INVESTMENTS (Continued) |
| October 31, 2021 |
| Principal | Coupon Rate | |||||||||||
| Amount ($) | (%) | Maturity | Fair Value | |||||||||
| CONVERTIBLE BONDS — 96.6% (Continued) | ||||||||||||
| BIOTECH & PHARMA — 18.2% (Continued) | ||||||||||||
| 18,000,000 | Johnson & Johnson - Citigroup Global Markets Holdings, Inc. Synthetic(f) | 1.7920 | 06/30/27 | $ | 18,414,000 | |||||||
| 100,000 | Johnson & Johnson - Citigroup Global Markets Holdings, Inc. Synthetic(f) | 1.5470 | 10/25/27 | 96,690 | ||||||||
| 100,000 | Ligand Pharmaceuticals, Inc. | 0.7500 | 05/15/23 | 101,187 | ||||||||
| 7,300,000 | Merck & Co., Inc. - Goldman Sachs Financial Corp. Synthetic(f) | 1.5700 | 02/24/28 | 7,393,440 | ||||||||
| 13,886,000 | Merck & Co., Inc. UBS Group AG Synthetic(f) | 1.7721 | 05/25/28 | 14,469,212 | ||||||||
| 100,000 | Pacira BioSciences, Inc. | 2.3750 | 04/01/22 | 103,012 | ||||||||
| 22,000,000 | Pacira BioSciences, Inc. | 0.7500 | 08/01/25 | 23,147,983 | ||||||||
| 1,000,000 | Supernus Pharmaceuticals, Inc. | 0.6250 | 04/01/23 | 994,375 | ||||||||
| 176,700,793 | ||||||||||||
| CABLE & SATELLITE — 2.7% | ||||||||||||
| 100,000 | Charter Communications, Inc. - Bank of America Finance LLC Synthetic(f) | 1.7700 | 09/01/22 | 117,900 | ||||||||
| 26,000,000 | Liberty Broadband Corp. Synthetic(c),(f) | 1.2500 | 09/30/50 | 26,005,382 | ||||||||
| 26,123,282 | ||||||||||||
| CONSUMER SERVICES — 2.3% | ||||||||||||
| 22,000,000 | Stride, Inc. | 1.1250 | 09/01/27 | 22,088,000 | ||||||||
| DIVERSIFIED INDUSTRIALS — 1.0% | ||||||||||||
| 100,000 | 3M Co. - Citigroup Global Markets Holdings, Inc. Synthetic(f) | 1.4930 | 12/30/27 | 93,510 | ||||||||
| 10,000,000 | 3M Co. - Citigroup Global Markets Holdings, Inc. Synthetic(f) | 2.1030 | 04/20/28 | 9,348,000 | ||||||||
| 9,441,510 | ||||||||||||
| ELECTRICAL EQUIPMENT — 3.7% | ||||||||||||
| 9,000,000 | OSI Systems, Inc. | 1.2500 | 09/01/22 | 9,331,927 | ||||||||
| 18,000,000 | SMART Global Holdings, Inc. | 2.2500 | 02/15/26 | 26,865,000 | ||||||||
| 36,196,927 | ||||||||||||
| ENTERTAINMENT CONTENT — 0.2% | ||||||||||||
| 2,000,000 | IMAX Corporation(c) | 0.5000 | 04/01/26 | 1,984,481 | ||||||||
| FOOD — 1.2% | ||||||||||||
| 12,000,000 | The Kraft Heinz Co. - Citigroup Global Markets Holdings, Inc. Synthetic(f) | 1.7920 | 06/30/27 | 11,834,400 | ||||||||
| HEALTH CARE FACILITIES & SERVICES — 2.4% | ||||||||||||
| 19,000,000 | PetIQ, Inc. | 4.0000 | 06/01/26 | 22,974,800 | ||||||||
The accompanying notes are an integral part of these financial statements.
11
| MILLER CONVERTIBLE BOND FUND |
| SCHEDULE OF INVESTMENTS (Continued) |
| October 31, 2021 |
| Principal | Coupon Rate | |||||||||||
| Amount ($) | (%) | Maturity | Fair Value | |||||||||
| CONVERTIBLE BONDS — 96.6% (Continued) | ||||||||||||
| INSTITUTIONAL FINANCIAL SERVICES — 0.0%(b) | ||||||||||||
| 100,000 | Voya Financial, Inc. - Bank of America Finance LLC Synthetic(f) | 3.1425 | 05/01/23 | $ | 112,800 | |||||||
| INSURANCE — 2.3% | ||||||||||||
| 22,500,000 | Berkshire Hathaway, Inc. - Barclays Bank PLC Synthetic(f) | 1.8652 | 04/14/28 | 22,000,500 | ||||||||
| INTERNET MEDIA & SERVICES— 6.0% | ||||||||||||
| 14,050,000 | Amazon.com, Inc.- JPMorgan Chase Financial Co., LLC Synthetic(f) | 3.5900 | 04/21/23 | 21,615,925 | ||||||||
| 7,000,000 | Google, Inc. - Bank of America Finance LLC Synthetic(f) | 3.6429 | 09/28/23 | 13,649,300 | ||||||||
| 21,000,000 | TripAdvisor, Inc.(c) | 0.2500 | 04/01/26 | 18,874,906 | ||||||||
| 5,000,000 | Twitter, Inc.(c),(d) | — | 03/15/26 | 4,607,287 | ||||||||
| 58,747,418 | ||||||||||||
| LEISURE FACILITIES & SERVICES — 7.9% | ||||||||||||
| 22,000,000 | Cheesecake Factory, Inc. | 0.3750 | 06/15/26 | 20,050,523 | ||||||||
| 15,000,000 | Cracker Barrel Old Country Store, Inc.(c) | 0.6250 | 06/15/26 | 14,725,609 | ||||||||
| 22,000,000 | DraftKings, Inc.(c),(d) | — | 03/15/28 | 19,292,703 | ||||||||
| 14,500,000 | McDonald’s Corp. - Credit Suisse AG Synthetic(f) | 1.9200 | 05/28/27 | 15,354,050 | ||||||||
| 7,000,000 | Vail Resorts, Inc.(c),(d) | — | 01/01/26 | 7,740,229 | ||||||||
| 77,163,114 | ||||||||||||
| LEISURE PRODUCTS — 5.4% | ||||||||||||
| 13,000,000 | D.R. Horton, Inc. - Barclays Bank PLC Synthetic(f) | 3.8900 | 09/26/23 | 22,072,700 | ||||||||
| 16,360,000 | LCI Industries(c) | 1.1250 | 05/15/26 | 17,281,275 | ||||||||
| 10,000,000 | Winnebago Industries Inc | 1.5000 | 04/01/25 | 12,857,848 | ||||||||
| 52,211,823 | ||||||||||||
| MEDICAL EQUIPMENT & DEVICES — 3.6% | ||||||||||||
| 29,000,000 | Haemonetics Corporation(c),(d) | — | 03/01/26 | 25,464,164 | ||||||||
| 10,000,000 | NuVasive, Inc. | 0.3750 | 03/15/25 | 9,475,000 | ||||||||
| 34,939,164 | ||||||||||||
| METALS & MINING — 1.7% | ||||||||||||
| 17,000,000 | Century Aluminum Company(c) | 2.7500 | 05/01/28 | 16,920,262 | ||||||||
| 100,000 | Newmont Mining Corp. - Barclays Bank PLC Synthetic(f) | 3.9200 | 10/30/23 | 145,850 | ||||||||
| 17,066,112 | ||||||||||||
| OIL & GAS — 3.3% | ||||||||||||
| 27,000,000 | Chevron Corporation - Bank of America Finance LLC Synthetic(f) | 1.9500 | 10/27/28 | 27,099,900 | ||||||||
The accompanying notes are an integral part of these financial statements.
12
| MILLER CONVERTIBLE BOND FUND |
| SCHEDULE OF INVESTMENTS (Continued) |
| October 31, 2021 |
| Principal | Coupon Rate | |||||||||||
| Amount ($) | (%) | Maturity | Fair Value | |||||||||
| CONVERTIBLE BONDS — 96.6% (Continued) | ||||||||||||
| OIL & GAS — 3.3% (Continued) | ||||||||||||
| 4,462,000 | Exxon Mobil Corp. - Citigroup Global Markets Holdings, Inc. Synthetic(f) | 1.5490 | 11/24/27 | $ | 4,920,247 | |||||||
| 32,020,147 | ||||||||||||
| REAL ESTATE INVESTMENT TRUSTS — 1.6% | ||||||||||||
| 4,000,000 | IIP Operating Partnership, L.P.(c) | 3.7500 | 02/21/24 | 16,030,000 | ||||||||
| RENEWABLE ENERGY — 1.4% | ||||||||||||
| 12,500,000 | Enphase Energy, Inc.(c),(d) | — | 03/01/26 | 13,589,158 | ||||||||
| 100,000 | Green Plains, Inc. | 2.2500 | 03/15/27 | 142,000 | ||||||||
| 13,731,158 | ||||||||||||
| RETAIL - DISCRETIONARY — 0.1% | ||||||||||||
| 1,000,000 | Guess?, Inc. | 2.0000 | 04/15/24 | 1,110,000 | ||||||||
| SEMICONDUCTORS — 2.5% | ||||||||||||
| 24,000,000 | Vishay Intertechnology, Inc. | 2.2500 | 06/15/25 | 24,434,400 | ||||||||
| SOFTWARE — 3.2% | ||||||||||||
| 10,000,000 | Akamai Technologies, Inc. | 0.3750 | 09/01/27 | 11,018,750 | ||||||||
| 7,000,000 | Microsoft Corp. - Morgan Stanley Finance, LLC. Synthetic(f) | 2.3773 | 10/25/24 | 12,572,350 | ||||||||
| 7,000,000 | Mitek Systems, Inc.(c) | 0.7500 | 02/01/26 | 7,921,719 | ||||||||
| 31,512,819 | ||||||||||||
| SPECIALTY FINANCE — 0.1% | ||||||||||||
| 100,000 | MFA Financial, Inc. | 6.2500 | 06/15/24 | 103,750 | ||||||||
| 100,000 | PennyMac Corporation(c) | 5.5000 | 03/15/26 | 103,500 | ||||||||
| 1,000,000 | Redwood Trust, Inc. | 5.6250 | 07/15/24 | 1,048,800 | ||||||||
| 1,256,050 | ||||||||||||
| TECHNOLOGY HARDWARE — 2.6% | ||||||||||||
| 7,000,000 | Apple, Inc. - JPMorgan Chase Financial Co., LLC Synthetic(f) | 3.8700 | 10/16/23 | 16,326,800 | ||||||||
| 8,000,000 | InterDigital, Inc. | 2.0000 | 06/01/24 | 8,665,000 | ||||||||
| 100,000 | Lumentum Holdings, Inc. | 0.5000 | 12/15/26 | 109,250 | ||||||||
| 25,101,050 | ||||||||||||
| TECHNOLOGY SERVICES — 6.9% | ||||||||||||
| 15,000,000 | Euronet Worldwide, Inc. | 0.7500 | 03/15/49 | 16,254,133 | ||||||||
The accompanying notes are an integral part of these financial statements.
13
| MILLER CONVERTIBLE BOND FUND |
| SCHEDULE OF INVESTMENTS (Continued) |
| October 31, 2021 |
| Principal | Coupon Rate | |||||||||||
| Amount ($) | (%) | Maturity | Fair Value | |||||||||
| CONVERTIBLE BONDS — 96.6% (Continued) | ||||||||||||
| TECHNOLOGY SERVICES — 6.9% (Continued) | ||||||||||||
| 1,000,000 | Insight Enterprises, Inc. | 0.7500 | 02/15/25 | $ | 1,457,250 | |||||||
| 19,000,000 | International Business Machines Corporation - Credit Suisse AG Synthetic(f) | 1.8775 | 07/03/28 | 17,605,400 | ||||||||
| 8,000,000 | International Business Machines Corporation - JPMorgan Chase Financial Company, LLC Synthetic(f) | 1.0200 | 06/29/28 | 7,631,200 | ||||||||
| 23,000,000 | Parsons Corporation | 0.2500 | 08/15/25 | 23,441,032 | ||||||||
| 100,000 | Visa, Inc. - Barclays Bank PLC Synthetic(f) | 1.2800 | 02/18/25 | 109,880 | ||||||||
| 66,498,895 | ||||||||||||
| TRANSPORTATION & LOGISTICS — 6.2% | ||||||||||||
| 12,309,000 | Air Transport Services Group, Inc. | 1.1250 | 10/15/24 | 13,078,312 | ||||||||
| 26,000,000 | JetBlue Airways Corporation(c) | 0.5000 | 04/01/26 | 25,095,625 | ||||||||
| 24,000,000 | Spirit Airlines, Inc. | 1.0000 | 05/15/26 | 21,705,600 | ||||||||
| 59,879,537 | ||||||||||||
| TRANSPORTATION EQUIPMENT — 5.7% | ||||||||||||
| 391,000 | Greenbrier Companies, Inc. | 2.8750 | 02/01/24 | 394,660 | ||||||||
| 27,000,000 | Greenbrier Companies, Inc.(c) | 2.8750 | 04/15/28 | 28,164,927 | ||||||||
| 25,000,000 | Meritor, Inc. | 3.2500 | 10/15/37 | 27,258,087 | ||||||||
| 55,817,674 | ||||||||||||
| WHOLESALE - CONSUMER STAPLES — 0.0%(b) | ||||||||||||
| 100,000 | Chefs’ Warehouse, Inc. | 1.8750 | 12/01/24 | 110,380 | ||||||||
| TOTAL CONVERTIBLE BONDS (Cost $883,035,675) | 940,285,832 | |||||||||||
| U.S. GOVERNMENT & AGENCIES — 0.0%(b) | ||||||||||||
| U.S. TREASURY OBLIGATIONS — 0.0%(b) | ||||||||||||
| 100,000 | United States Treasury Note | 0.6250 | 03/31/27 | 96,725 | ||||||||
| TOTAL U.S. GOVERNMENT & AGENCIES (Cost $99,282) | ||||||||||||
The accompanying notes are an integral part of these financial statements.
14
| MILLER CONVERTIBLE BOND FUND |
| SCHEDULE OF INVESTMENTS (Continued) |
| October 31, 2021 |
| Shares | Fair Value | |||||||
| SHORT-TERM INVESTMENTS — 3.1% | ||||||||
| MONEY MARKET FUND - 3.1% | ||||||||
| 30,409,467 | BlackRock Liquidity Funds T-Fund, Institutional Class, 0.01%(e) | $ | 30,409,467 | |||||
| TOTAL SHORT-TERM INVESTMENTS (Cost $30,409,467) | ||||||||
| TOTAL INVESTMENTS - 99.8% (Cost $914,866,424) | $ | 972,109,178 | ||||||
| OTHER ASSETS IN EXCESS OF LIABILITIES- 0.2% | 1,696,595 | |||||||
| NET ASSETS - 100.0% | $ | 973,805,773 | ||||||
| LLC | - Limited Liability Company |
| LP | - Limited Partnership |
| LTD | - Limited Company |
| PLC | - Public Limited Company |
| REIT | - Real Estate Investment Trust |
| (a) | Non-income producing security. |
| (b) | Percentage rounds to less than 0.1%. |
| (c) | Security exempt from registration under Rule 144A of the Securities Act of 1933. These securities may be sold in transactions exempt from registration, normally to qualified institutional buyers. |
| (d) | Zero coupon bond. |
| (e) | Rate disclosed is the seven-day effective yield as of October 31, 2021. |
| (f) | Interest rate represents the comparable yield on the contingent payment debt instruments. |
| PORTFOLIO ANALYSIS | ||||
| As of October 31, 2021 | ||||
| % of Net | ||||
| Sector | Assets | |||
| Health Care | 24.1 | % | ||
| Consumer Discretionary | 18.9 | % | ||
| Technology | 18.8 | % | ||
| Industrial | 16.8 | % | ||
| Communications | 5.3 | % | ||
| Energy | 4.7 | % | ||
| Financial | 3.3 | % | ||
| Materials | 2.0 | % | ||
| Real Estate | 1.6 | % | ||
| Consumer Staples | 1.2 | % | ||
| U.S. Treasury Obligations | 0.0 | % | ||
| Short-Term Investments | 3.1 | % | ||
| Other Assets in Excess of Liabilities | 0.2 | % | ||
| 100.0 | % | |||
The accompanying notes are an integral part of these financial statements.
15
| MILLER CONVERTIBLE PLUS FUND |
| SCHEDULE OF INVESTMENTS |
| October 31, 2021 |
| Shares | Fair Value | |||||||||||
| COMMON STOCKS — 1.6% | ||||||||||||
| AUTOMOTIVE - 1.6% | ||||||||||||
| 34,000 | General Motors Company(a) | $ | 1,850,620 | |||||||||
| TOTAL COMMON STOCKS (Cost $1,800,300) | ||||||||||||
| Principal | Coupon Rate | |||||||||||
| Amount ($) | (%) | Maturity | ||||||||||
| CONVERTIBLE BONDS — 142.2% | ||||||||||||
| AEROSPACE & DEFENSE — 1.7% | ||||||||||||
| 2,000,000 | Kaman Corporation | 3.2500 | 05/01/24 | 2,032,600 | ||||||||
| AUTOMOTIVE — 5.0% | ||||||||||||
| 5,000,000 | Ford Motor Company(b),(c) | — | 03/15/26 | 5,939,434 | ||||||||
| BASIC INDUSTRY — 0.9% | ||||||||||||
| 1,000,000 | Dow, Inc. - Bank of America Finance LLC Synthetic(e) | 2.6410 | 06/18/24 | 1,064,300 | ||||||||
| BIOTECH & PHARMA — 29.2% | ||||||||||||
| 5,000,000 | AbbVie, Inc. - Goldman Sachs Finance Corp. Synthetic(e) | 1.9900 | 05/01/28 | 4,851,500 | ||||||||
| 4,300,000 | BioMarin Pharmaceutical, Inc. | 1.2500 | 05/15/27 | 4,348,274 | ||||||||
| 4,500,000 | Bristol-Myers Squibb Co. - Wells Fargo Finance, LLC. Synthetic(e) | 2.3100 | 11/01/24 | 4,655,700 | ||||||||
| 5,600,000 | Halozyme Therapeutics, Inc.(b) | 0.2500 | 03/01/27 | 4,981,909 | ||||||||
| 4,100,000 | Jazz Investments I Ltd. | 1.5000 | 08/15/24 | 4,176,875 | ||||||||
| 3,000,000 | Johnson & Johnson - Citigroup Global Markets Holdings, Inc. Synthetic(e) | 1.5470 | 10/25/27 | 2,900,700 | ||||||||
| 4,700,000 | Merck & Co., Inc. UBS Group AG Synthetic(e) | 1.7721 | 05/25/28 | 4,897,400 | ||||||||
| 4,000,000 | Pacira BioSciences, Inc. | 0.7500 | 08/01/25 | 4,208,724 | ||||||||
| 35,021,082 | ||||||||||||
| CABLE & SATELLITE — 3.9% | ||||||||||||
| 4,700,000 | Liberty Broadband Corp. Synthetic(b),(e) | 1.2500 | 09/30/50 | 4,700,973 | ||||||||
| CONSUMER SERVICES — 3.8% | ||||||||||||
| 4,500,000 | Stride, Inc. | 1.1250 | 09/01/27 | 4,518,000 | ||||||||
| ELECTRICAL EQUIPMENT — 4.6% | ||||||||||||
| 1,000,000 | OSI Systems, Inc. | 1.2500 | 09/01/22 | 1,036,881 | ||||||||
| 3,000,000 | SMART Global Holdings, Inc. | 2.2500 | 02/15/26 | 4,477,500 | ||||||||
| 5,514,381 | ||||||||||||
The accompanying notes are an integral part of these financial statements.
16
| MILLER CONVERTIBLE PLUS FUND |
| SCHEDULE OF INVESTMENTS (Continued) |
| October 31, 2021 |
| Principal | Coupon Rate | |||||||||||
| Amount ($) | (%) | Maturity | Fair Value | |||||||||
| CONVERTIBLE BONDS — 142.2% (Continued) | ||||||||||||
| ENTERTAINMENT CONTENT — 1.1% | ||||||||||||
| 1,325,000 | IMAX Corporation(b) | 0.5000 | 04/01/26 | $ | 1,314,719 | |||||||
| HEALTH CARE FACILITIES & SERVICES — 3.5% | ||||||||||||
| 3,500,000 | PetIQ, Inc. | 4.0000 | 06/01/26 | 4,232,200 | ||||||||
| INTERNET MEDIA & SERVICES — 10.0% | ||||||||||||
| 2,050,000 | Amazon.com, Inc.- JPMorgan Chase Financial Co., LLC Synthetic(e) | 3.5900 | 04/21/23 | 3,153,925 | ||||||||
| 1,500,000 | Google, Inc. - Bank of America Finance LLC Synthetic(e) | 3.6429 | 09/28/23 | 2,924,850 | ||||||||
| 3,500,000 | TripAdvisor, Inc.(b) | 0.2500 | 04/01/26 | 3,145,818 | ||||||||
| 3,000,000 | Twitter, Inc.(b),(c) | — | 03/15/26 | 2,764,372 | ||||||||
| 11,988,965 | ||||||||||||
| LEISURE FACILITIES & SERVICES 13.4% | ||||||||||||
| 4,500,000 | Cheesecake Factory, Inc. (The) | 0.3750 | 06/15/26 | 4,101,243 | ||||||||
| 4,350,000 | Cracker Barrel Old Country Store, Inc.(b) | 0.6250 | 06/15/26 | 4,270,427 | ||||||||
| 4,500,000 | DraftKings, Inc.(b),(c) | — | 03/15/28 | 3,946,235 | ||||||||
| 2,500,000 | McDonald’s Corp. - Credit Suisse AG Synthetic(e) | 1.9200 | 05/28/27 | 2,647,250 | ||||||||
| 1,000,000 | Vail Resorts, Inc.(b),(c) | — | 01/01/26 | 1,105,747 | ||||||||
| 16,070,902 | ||||||||||||
| LEISURE PRODUCTS — 7.6% | ||||||||||||
| 2,200,000 | D.R. Horton, Inc. - Barclays Bank PLC Synthetic(e) | 3.8900 | 09/26/23 | 3,735,380 | ||||||||
| 3,500,000 | LCI Industries(b) | 1.1250 | 05/15/26 | 3,697,094 | ||||||||
| 1,300,000 | Winnebago Industries Inc | 1.5000 | 04/01/25 | 1,671,520 | ||||||||
| 9,103,994 | ||||||||||||
| MEDICAL EQUIPMENT & DEVICES — 4.0% | ||||||||||||
| 5,500,000 | Haemonetics Corporation(b),(c) | — | 03/01/26 | 4,829,410 | ||||||||
| METALS & MINING — 3.7% | ||||||||||||
| 4,500,000 | Century Aluminum Company(b) | 2.7500 | 05/01/28 | 4,478,893 | ||||||||
The accompanying notes are an integral part of these financial statements.
17
| MILLER CONVERTIBLE PLUS FUND |
| SCHEDULE OF INVESTMENTS (Continued) |
| October 31, 2021 |
| Principal | Coupon Rate | |||||||||||
| Amount ($) | (%) | Maturity | Fair Value | |||||||||
| CONVERTIBLE BONDS 142.2% (Continued) | ||||||||||||
| OIL & GAS 6.7% | ||||||||||||
| 4,600,000 | Chevron Corporation - Bank of America Finance LLC Synthetic(e) | 1.9500 | 10/27/28 | $ | 4,617,020 | |||||||
| 3,100,000 | Exxon Mobil Corp. - Citigroup Global Markets Holdings, Inc. Synthetic(e) | 1.5490 | 11/24/27 | 3,418,370 | ||||||||
| 8,035,390 | ||||||||||||
| RENEWABLE ENERGY — 1.8% | ||||||||||||
| 2,000,000 | Enphase Energy, Inc.(b),(c) | — | 03/01/26 | 2,174,265 | ||||||||
| SEMICONDUCTORS — 3.8% | ||||||||||||
| 4,500,000 | Vishay Intertechnology, Inc. | 2.2500 | 06/15/25 | 4,581,450 | ||||||||
| SOFTWARE — 4.2% | ||||||||||||
| 1,600,000 | Akamai Technologies, Inc. | 0.3750 | 09/01/27 | 1,763,000 | ||||||||
| 1,200,000 | Microsoft Corp. - Morgan Stanley Finance, LLC. Synthetic(e) | 2.3773 | 10/25/24 | 2,155,260 | ||||||||
| 1,000,000 | Mitek Systems, Inc.(b) | 0.7500 | 02/01/26 | 1,131,674 | ||||||||
| 5,049,934 | ||||||||||||
| TECHNOLOGY HARDWARE — 4.0% | ||||||||||||
| 1,450,000 | Apple, Inc. - JPMorgan Chase Financial Co., LLC Synthetic(e) | 3.8700 | 10/16/23 | 3,381,980 | ||||||||
| 1,289,000 | InterDigital, Inc. | 2.0000 | 06/01/24 | 1,396,148 | ||||||||
| 4,778,128 | ||||||||||||
| TECHNOLOGY SERVICES — 9.4% | ||||||||||||
| 1,900,000 | Euronet Worldwide, Inc. | 0.7500 | 03/15/49 | 2,058,857 | ||||||||
| 5,000,000 | International Business Machines Corporation - Credit Suisse AG Synthetic(e) | 1.8775 | 07/03/28 | 4,633,000 | ||||||||
| 4,500,000 | Parsons Corporation | 0.2500 | 08/15/25 | 4,586,289 | ||||||||
| 11,278,146 | ||||||||||||
| TRANSPORTATION & LOGISTICS — 11.7% | ||||||||||||
| 4,385,000 | Air Transport Services Group, Inc. | 1.1250 | 10/15/24 | 4,659,062 | ||||||||
| 5,000,000 | JetBlue Airways Corporation(b) | 0.5000 | 04/01/26 | 4,826,082 | ||||||||
| 5,000,000 | Spirit Airlines, Inc. | 1.0000 | 05/15/26 | 4,522,000 | ||||||||
| 14,007,144 | ||||||||||||
The accompanying notes are an integral part of these financial statements.
18
| MILLER CONVERTIBLE PLUS FUND |
| SCHEDULE OF INVESTMENTS (Continued) |
| October 31, 2021 |
| Principal | Coupon Rate | |||||||||||||||||||
| Amount ($) | (%) | Maturity | Fair Value | |||||||||||||||||
| TRANSPORTATION EQUIPMENT — 8.2% | ||||||||||||||||||||
| 4,700,000 | Greenbrier Companies, Inc.(b) | 2.8750 | 04/15/28 | $ | 4,902,784 | |||||||||||||||
| 4,500,000 | Meritor, Inc. | 3.2500 | 10/15/37 | 4,906,456 | ||||||||||||||||
| 9,809,240 | ||||||||||||||||||||
| TOTAL CONVERTIBLE BONDS (Cost $163,250,342) | 170,523,550 | |||||||||||||||||||
| Expiration | ||||||||||||||||||||
| Contracts(d) | Date | Exercise Price | Notional Value | |||||||||||||||||
| EQUITY OPTIONS PURCHASED (a) - 0.2% | ||||||||||||||||||||
| PUT OPTIONS PURCHASED - 0.2% | ||||||||||||||||||||
| 360 | General Motors Company | 01/20/2023 | $ | 50 | $ | 1,959,480 | 207,720 | |||||||||||||
| TOTAL PUT OPTIONS PURCHASED (Cost - $458,980) | ||||||||||||||||||||
| TOTAL EQUITY OPTIONS PURCHASED (Cost - $458,980) | 207,720 | |||||||||||||||||||
| Contracts(d) | ||||||||||||||||||||
| INDEX OPTIONS PURCHASED (a) - 0.1% | ||||||||||||||||||||
| PUT OPTIONS PURCHASED - 0.1% | ||||||||||||||||||||
| 37 | NASDAQ 100 Index | 12/17/2021 | 13,000 | 58,646,739 | 116,550 | |||||||||||||||
| 32 | S&P 500 Index | 01/21/2022 | 3,850 | 14,737,216 | 75,360 | |||||||||||||||
| TOTAL PUT OPTIONS PURCHASED (Cost - $3,996,138) | 191,910 | |||||||||||||||||||
| TOTAL INDEX OPTIONS PURCHASED (Cost - $3,996,138) | 191,910 | |||||||||||||||||||
| TOTAL INVESTMENTS - 144.1% (Cost $169,505,760) | $ | 172,773,800 | ||||||||||||||||||
| LIABILITIES IN EXCESS OF OTHER ASSETS - (44.1)% | (52,887,351 | ) | ||||||||||||||||||
| NET ASSETS - 100.0% | $ | 119,886,449 | ||||||||||||||||||
| LLC | - Limited Liability Company |
| LTD | - Limited Company |
| PLC | - Public Limited Company |
| (a) | Non-income producing security. |
| (b) | Security exempt from registration under Rule 144A of the Securities Act of 1933. These securities may be sold in transactions exempt from registration, normally to qualified institutional buyers. |
| (c) | Zero coupon bond. |
| (d) | Each contract is equivalent to one futures contract. |
| (e) | Interest rate represents the comparable yield on the contingent payment debt instruments. |
The accompanying notes are an integral part of these financial statements.
19
| MILLER CONVERTIBLE PLUS FUND |
| SCHEDULE OF INVESTMENTS (Continued) |
| October 31, 2021 |
| PORTFOLIO ANALYSIS | ||||
| As of October 31, 2021 | ||||
| % of Net | ||||
| Sector | Assets | |||
| Health Care | 36.8 | % | ||
| Consumer Discretionary | 31.3 | % | ||
| Technology | 26.5 | % | ||
| Industrial | 26.2 | % | ||
| Communications | 9.9 | % | ||
| Energy | 8.5 | % | ||
| Materials | 4.6 | % | ||
| Options | 0.3 | % | ||
| Liabilities in Excess of Other Assets | (44.1 | )% | ||
| 100.0 | % | |||
The accompanying notes are an integral part of these financial statements.
20
| MILLER INTERMEDIATE BOND FUND |
| SCHEDULE OF INVESTMENTS |
| October 31, 2021 |
| Shares | Fair Value | |||||||||||
| COMMON STOCKS — 1.1% | ||||||||||||
| ASSET MANAGEMENT - 1.1% | ||||||||||||
| 100,000 | Acropolis Infrastructure Acquisition Corporation(a) | $ | 997,000 | |||||||||
| 44,000 | TortoiseEcofin Acquisition Corporation III(a) | 437,800 | ||||||||||
| 1,434,800 | ||||||||||||
| TOTAL COMMON STOCKS (Cost $1,440,000) | 1,434,800 | |||||||||||
| Principal | Coupon Rate | |||||||||||
| Amount ($) | (%) | Maturity | Fair Value | |||||||||
| CONVERTIBLE BONDS — 92.6% | ||||||||||||
| AEROSPACE & DEFENSE — 0.8% | ||||||||||||
| 1,000,000 | Kaman Corporation | 3.2500 | 05/01/24 | 1,016,300 | ||||||||
| ASSET MANAGEMENT — 1.3% | ||||||||||||
| 1,500,000 | New Mountain Finance Corporation | 5.7500 | 08/15/23 | 1,612,575 | ||||||||
| AUTOMOTIVE — 3.0% | ||||||||||||
| 3,200,000 | Ford Motor Company(b),(c) | — | 03/15/26 | 3,801,238 | ||||||||
| BANKING — 2.3% | ||||||||||||
| 3,000,000 | Hope Bancorp, Inc. | 2.0000 | 05/15/38 | 2,938,141 | ||||||||
| BASIC INDUSTRY — 0.8% | ||||||||||||
| 1,000,000 | Dow, Inc. - Bank of America Finance LLC Synthetic(e) | 2.6410 | 06/18/24 | 1,064,300 | ||||||||
| BIOTECH & PHARMA — 18.4% | ||||||||||||
| 3,800,000 | AbbVie, Inc. - Goldman Sachs Finance Corp. Synthetic(e) | 1.4700 | 02/03/28 | 3,571,240 | ||||||||
| 2,900,000 | BioMarin Pharmaceutical, Inc. | 1.2500 | 05/15/27 | 2,932,557 | ||||||||
| 2,014,000 | Bristol-Myers Squibb Co. - Wells Fargo Finance, LLC. Synthetic(e) | 2.3100 | 11/01/24 | 2,083,684 | ||||||||
| 3,900,000 | Halozyme Therapeutics, Inc.(b) | 0.2500 | 03/01/27 | 3,469,544 | ||||||||
| 3,100,000 | Jazz Investments I Ltd. | 1.5000 | 08/15/24 | 3,158,125 | ||||||||
| 1,400,000 | Johnson & Johnson - Citigroup Global Markets Holdings, Inc. Synthetic(e) | 1.7920 | 06/30/27 | 1,432,200 | ||||||||
| 1,000,000 | Johnson & Johnson - Citigroup Global Markets Holdings, Inc. Synthetic(e) | 1.5470 | 10/25/27 | 966,900 | ||||||||
| 2,800,000 | Merck & Co., Inc. - Goldman Sachs Financial Corp. Synthetic(e) | 1.5700 | 02/24/28 | 2,835,840 | ||||||||
| 2,000,000 | Pacira BioSciences, Inc. | 0.7500 | 08/01/25 | 2,104,362 | ||||||||
The accompanying notes are an integral part of these financial statements.
21
| MILLER INTERMEDIATE BOND FUND |
| SCHEDULE OF INVESTMENTS (Continued) |
| October 31, 2021 |
| Principal | Coupon Rate | |||||||||||
| Amount ($) | (%) | Maturity | Fair Value | |||||||||
| CONVERTIBLE BONDS — 92.6% (Continued) | ||||||||||||
| BIOTECH & PHARMA — 18.4% (Continued) | ||||||||||||
| 1,000,000 | Supernus Pharmaceuticals, Inc. | 0.6250 | 04/01/23 | $ | 994,375 | |||||||
| 23,548,827 | ||||||||||||
| CABLE & SATELLITE — 2.4% | ||||||||||||
| 3,000,000 | Liberty Broadband Corp. Synthetic(b),(e) | 1.2500 | 09/30/50 | 3,000,621 | ||||||||
| CONSUMER SERVICES — 2.6% | ||||||||||||
| 3,300,000 | Stride, Inc. | 1.1250 | 09/01/27 | 3,313,200 | ||||||||
| DIVERSIFIED INDUSTRIALS — 1.9% | ||||||||||||
| 2,600,000 | 3M Co. - Citigroup Global Markets Holdings, Inc. Synthetic(e) | 2.1030 | 04/20/28 | 2,430,480 | ||||||||
| ELECTRICAL EQUIPMENT — 2.0% | ||||||||||||
| 1,000,000 | OSI Systems, Inc. | 1.2500 | 09/01/22 | 1,036,881 | ||||||||
| 1,000,000 | SMART Global Holdings, Inc. | 2.2500 | 02/15/26 | 1,492,500 | ||||||||
| 2,529,381 | ||||||||||||
| ENTERTAINMENT CONTENT — 0.8% | ||||||||||||
| 1,000,000 | IMAX Corporation(b) | 0.5000 | 04/01/26 | 992,240 | ||||||||
| HEALTH CARE FACILITIES & SERVICES — 1.9% | ||||||||||||
| 2,000,000 | PetIQ, Inc. | 4.0000 | 06/01/26 | 2,418,400 | ||||||||
| INSURANCE — 2.5% | ||||||||||||
| 3,200,000 | Berkshire Hathaway, Inc. - Barclays Bank PLC Synthetic(e) | 1.8652 | 04/14/28 | 3,128,960 | ||||||||
| INTERNET MEDIA & SERVICES — 4.5% | ||||||||||||
| 500,000 | Amazon.com, Inc.- JPMorgan Chase Financial Co., LLC Synthetic(e) | 3.5900 | 04/21/23 | 769,250 | ||||||||
| 500,000 | Google, Inc. - Bank of America Finance LLC Synthetic(e) | 3.6429 | 09/28/23 | 974,950 | ||||||||
| 3,400,000 | TripAdvisor, Inc.(b) | 0.2500 | 04/01/26 | 3,055,937 | ||||||||
| 1,000,000 | Twitter, Inc.(b),(c) | — | 03/15/26 | 921,458 | ||||||||
| 5,721,595 | ||||||||||||
The accompanying notes are an integral part of these financial statements.
22
| MILLER INTERMEDIATE BOND FUND |
| SCHEDULE OF INVESTMENTS (Continued) |
| October 31, 2021 |
| Principal | Coupon Rate | |||||||||||
| Amount ($) | (%) | Maturity | Fair Value | |||||||||
| CONVERTIBLE BONDS — 92.6% (Continued) | ||||||||||||
| LEISURE FACILITIES & SERVICES — 7.3% | ||||||||||||
| 3,300,000 | Cheesecake Factory, Inc. | 0.3750 | 06/15/26 | $ | 3,007,578 | |||||||
| 2,900,000 | Cracker Barrel Old Country Store, Inc.(b) | 0.6250 | 06/15/26 | 2,846,951 | ||||||||
| 2,500,000 | DraftKings, Inc.(b),(c) | — | 03/15/28 | 2,192,353 | ||||||||
| 1,245,000 | McDonald’s Corp. - Credit Suisse AG Synthetic(e) | 1.9200 | 05/28/27 | 1,318,331 | ||||||||
| 9,365,213 | ||||||||||||
| LEISURE PRODUCTS — 3.2% | ||||||||||||
| 700,000 | D.R. Horton, Inc. - Barclays Bank PLC Synthetic(e) | 3.8900 | 09/26/23 | 1,188,530 | ||||||||
| 2,700,000 | LCI Industries(b) | 1.1250 | 05/15/26 | 2,852,044 | ||||||||
| 4,040,574 | ||||||||||||
| MEDICAL EQUIPMENT & DEVICES — 4.2% | ||||||||||||
| 3,900,000 | Haemonetics Corporation(b),(c) | — | 03/01/26 | 3,424,491 | ||||||||
| 2,000,000 | NuVasive, Inc. | 0.3750 | 03/15/25 | 1,895,000 | ||||||||
| 5,319,491 | ||||||||||||
| METALS & MINING — 2.1% | ||||||||||||
| 2,700,000 | Century Aluminum Company(b) | 2.7500 | 05/01/28 | 2,687,336 | ||||||||
| OIL & GAS — 3.6% | ||||||||||||
| 3,500,000 | Chevron Corporation - Bank of America Finance LLC Synthetic(e) | 1.9500 | 10/27/28 | 3,512,950 | ||||||||
| 1,000,000 | Exxon Mobil Corp. - Citigroup Global Markets Holdings, Inc. Synthetic(e) | 1.5490 | 11/24/27 | 1,102,700 | ||||||||
| 4,615,650 | ||||||||||||
| RENEWABLE ENERGY — 1.7% | ||||||||||||
| 2,000,000 | Enphase Energy, Inc.(b),(c) | — | 03/01/26 | 2,174,265 | ||||||||
| SEMICONDUCTORS — 2.3% | ||||||||||||
| 2,900,000 | Vishay Intertechnology, Inc. | 2.2500 | 06/15/25 | 2,952,490 | ||||||||
| SOFTWARE — 0.4% | ||||||||||||
| 500,000 | Akamai Technologies, Inc. | 0.3750 | 09/01/27 | 550,938 | ||||||||
| SPECIALTY FINANCE — 1.9% | ||||||||||||
| 2,400,000 | PennyMac Corporation(b) | 5.5000 | 03/15/26 | 2,484,000 | ||||||||
The accompanying notes are an integral part of these financial statements.
23
| MILLER INTERMEDIATE BOND FUND |
| SCHEDULE OF INVESTMENTS (Continued) |
| October 31, 2021 |
| Principal | Coupon Rate | |||||||||||
| Amount ($) | (%) | Maturity | Fair Value | |||||||||
| CONVERTIBLE BONDS — 92.6% (Continued) | ||||||||||||
| TECHNOLOGY HARDWARE — 2.2% | ||||||||||||
| 300,000 | Apple, Inc. - JPMorgan Chase Financial Co., LLC Synthetic(e) | 3.8700 | 10/16/23 | $ | 699,720 | |||||||
| 2,000,000 | InterDigital, Inc. | 2.0000 | 06/01/24 | 2,166,250 | ||||||||
| 2,865,970 | ||||||||||||
| TECHNOLOGY SERVICES — 5.8% | ||||||||||||
| 1,000,000 | Euronet Worldwide, Inc. | 0.7500 | 03/15/49 | 1,083,609 | ||||||||
| 3,000,000 | International Business Machines Corporation - JPMorgan Chase Financial Company, LLC Synthetic(e) | 1.0200 | 06/29/28 | 2,861,700 | ||||||||
| 3,300,000 | Parsons Corporation | 0.2500 | 08/15/25 | 3,363,279 | ||||||||
| 100,000 | Visa, Inc. - Barclays Bank PLC Synthetic(e) | 1.2800 | 02/18/25 | 109,880 | ||||||||
| 7,418,468 | ||||||||||||
| TRANSPORTATION & LOGISTICS — 7.2% | ||||||||||||
| 2,800,000 | Air Transport Services Group, Inc. | 1.1250 | 10/15/24 | 2,975,000 | ||||||||
| 3,200,000 | JetBlue Airways Corporation(b) | 0.5000 | 04/01/26 | 3,088,692 | ||||||||
| 3,400,000 | Spirit Airlines, Inc. | 1.0000 | 05/15/26 | 3,074,960 | ||||||||
| 9,138,652 | ||||||||||||
| TRANSPORTATION EQUIPMENT — 5.5% | ||||||||||||
| 3,300,000 | Greenbrier Companies, Inc.(b) | 2.8750 | 04/15/28 | 3,442,380 | ||||||||
| 3,300,000 | Meritor, Inc. | 3.2500 | 10/15/37 | 3,598,067 | ||||||||
| 7,040,447 | ||||||||||||
| TOTAL CONVERTIBLE BONDS (Cost $116,454,489) | 118,169,752 | |||||||||||
| U.S. GOVERNMENT & AGENCIES — 1.5% | ||||||||||||
| U.S. TREASURY OBLIGATIONS — 1.5% | ||||||||||||
| 2,000,000 | United States Treasury Note | 0.6250 | 03/31/27 | 1,934,492 | ||||||||
| TOTAL U.S. GOVERNMENT & AGENCIES (Cost $1,985,641) | ||||||||||||
| Shares | ||||||||||||
| SHORT-TERM INVESTMENTS — 4.6% | ||||||||||||
| MONEY MARKET FUNDS - 4.6% | ||||||||||||
| 5,876,972 | BlackRock Liquidity Funds T-Fund, Institutional Class, 0.01%(d) | 5,876,972 | ||||||||||
| TOTAL SHORT-TERM INVESTMENTS (Cost $5,876,972) | ||||||||||||
The accompanying notes are an integral part of these financial statements.
24
| MILLER INTERMEDIATE BOND FUND |
| SCHEDULE OF INVESTMENTS (Continued) |
| October 31, 2021 |
| TOTAL INVESTMENTS - 99.8% (Cost $125,757,102) | $ | 127,416,016 | |||
| OTHER ASSETS IN EXCESS OF LIABILITIES - 0.2% | 244,478 | ||||
| NET ASSETS - 100.0% | $ | 127,660,494 |
| LLC | - Limited Liability Company |
| LTD | - Limited Company |
| PLC | - Public Limited Company |
| (a) | Non-income producing security. |
| (b) | Security exempt from registration under Rule 144A of the Securities Act of 1933. These securities may be sold in transactions exempt from registration, normally to qualified institutional buyers. |
| (c) | Zero coupon bond. |
| (d) | Rate disclosed is the seven-day effective yield as of October 31, 2021. |
| (e) | Interest rate represents the comparable yield on the contingent payment debt instruments. |
| PORTFOLIO ANALYSIS | ||||
| As of October 31, 2021 | ||||
| % of Net | ||||
| Sector | Assets | |||
| Health Care | 24.5 | % | ||
| Industrial | 17.4 | % | ||
| Consumer Discretionary | 16.1 | % | ||
| Technology | 12.2 | % | ||
| Financial | 9.1 | % | ||
| Communications | 6.2 | % | ||
| Energy | 5.3 | % | ||
| Materials | 2.9 | % | ||
| U.S. Treasury Obligations | 1.5 | % | ||
| Short-Term Investments | 4.6 | % | ||
| Other Assets in Excess of Liabilities | 0.2 | % | ||
| 100.0 | % | |||
The accompanying notes are an integral part of these financial statements.
25
| Miller Funds |
| STATEMENTS OF ASSETS AND LIABILITIES |
| October 31, 2021 |
| Miller | Miller | Miller | ||||||||||
| Convertible | Convertible | Intermediate | ||||||||||
| Bond Fund | Plus Fund | Bond Fund | ||||||||||
| Assets: | ||||||||||||
| Investments in Securities at Cost | $ | 914,866,424 | $ | 169,505,760 | $ | 125,757,102 | ||||||
| Investments in Securities at Fair Value | $ | 972,109,178 | $ | 172,773,800 | $ | 127,416,016 | ||||||
| Segregated Cash - Deposit with Broker for Options | — | 1,701,110 | — | |||||||||
| Segregated Cash - Collateral for Loan | — | 13,385 | — | |||||||||
| Receivable for Securities Sold | — | 392,831 | — | |||||||||
| Receivable for Fund Shares Sold | 1,078,297 | 94,855 | 7,867 | |||||||||
| Interest and Dividend Receivable | 1,863,989 | 380,004 | 308,789 | |||||||||
| Prepaid Expenses and Other Assets | 64,220 | 16,406 | 24,473 | |||||||||
| Total Assets | 975,115,684 | 175,372,391 | 127,757,145 | |||||||||
| Liabilities: | ||||||||||||
| Line of Credit Payable | — | 55,000,000 | — | |||||||||
| Accrued Advisory Fees | 614,083 | 155,608 | 65,333 | |||||||||
| Due to Custodian | — | 148,630 | ||||||||||
| Interest Payable | — | 98,011 | — | |||||||||
| Accrued Distribution Fees | 68,182 | — | — | |||||||||
| Payable for Fund Shares Redeemed | 388,862 | 17,907 | — | |||||||||
| Accrued Expenses and Other Liabilities | 238,784 | 65,786 | 31,318 | |||||||||
| Total Liabilities | 1,309,911 | 55,485,942 | 96,651 | |||||||||
| Net Assets | $ | 973,805,773 | $ | 119,886,449 | $ | 127,660,494 | ||||||
| Composition of Net Assets: | ||||||||||||
| At October 31, 2021, Net Assets consisted of: | ||||||||||||
| Paid-in-Capital | $ | 883,996,224 | $ | 106,565,416 | $ | 122,789,454 | ||||||
| Accumulated Earnings | 89,809,549 | 13,321,033 | 4,871,040 | |||||||||
| Net Assets | $ | 973,805,773 | $ | 119,886,449 | $ | 127,660,494 | ||||||
| Net Asset Value Per Share | ||||||||||||
| Class A Shares | ||||||||||||
| Net Assets | $ | 40,582,353 | ||||||||||
| Shares of Beneficial Interest Outstanding (no par value; unlimited shares authorized) | 2,792,132 | |||||||||||
| Net Asset Value and Redemption Price per Share | $ | 14.53 | ||||||||||
| Maximum Offering Price Per Share (Includes a Maximum Sales Charge of 3.75%) | $ | 15.10 | ||||||||||
| Class I Shares | ||||||||||||
| Net Assets | $ | 873,183,820 | $ | 119,886,449 | $ | 127,660,494 | ||||||
| Shares of Beneficial Interest Outstanding (no par value; unlimited shares authorized) | 60,277,128 | 4,617,372 | 7,285,743 | |||||||||
| Net Asset Value, Offering and Redemption Price per Share | $ | 14.49 | $ | 25.96 | $ | 17.52 | ||||||
| Class C Shares | ||||||||||||
| Net Assets | $ | 60,039,600 | ||||||||||
| Shares of Beneficial Interest Outstanding (no par value; unlimited shares authorized) | 4,175,441 | |||||||||||
| Net Asset Value, Offering and Redemption Price per Share | $ | 14.38 | ||||||||||
The accompanying notes are an integral part of these financial statements.
26
| Miller Funds |
| STATEMENTS OF OPERATIONS |
| For the Year Ended October 31, 2021 |
| Miller | Miller | Miller | ||||||||||
| Convertible | Convertible | Intermediate | ||||||||||
| Bond Fund | Plus Fund | Bond Fund | ||||||||||
| Investment Income: | ||||||||||||
| Interest Income | $ | 8,828,487 | $ | 1,844,626 | $ | 1,312,433 | ||||||
| Dividend Income | 1,065,339 | 166,801 | 108,481 | |||||||||
| Total Investment Income | 9,893,826 | 2,011,427 | 1,420,914 | |||||||||
| Expenses: | ||||||||||||
| Investment Advisory Fees | 6,812,275 | 1,767,826 | 799,867 | |||||||||
| Distribution Fees (Class A) | 280,264 | — | — | |||||||||
| Distribution Fees (Class C) | 618,554 | — | — | |||||||||
| Third Party Administrative Services Fees | 598,824 | 79,900 | 51,719 | |||||||||
| Administration Fees | 327,898 | 68,375 | 58,355 | |||||||||
| Trustees’ Fees | 188,582 | 33,311 | 21,724 | |||||||||
| Transfer Agent Fees | 209,685 | 27,269 | 24,999 | |||||||||
| Audit Fees | 114,390 | 18,570 | 8,241 | |||||||||
| Custodian Fees | 101,777 | 38,314 | 20,668 | |||||||||
| Registration and Filing Fees | 86,301 | 28,310 | 28,976 | |||||||||
| Printing Expense | 60,686 | 8,673 | 7,428 | |||||||||
| Legal Fees | 65,626 | 8,789 | 6,603 | |||||||||
| Insurance Expense | 65,329 | 13,930 | 7,887 | |||||||||
| Chief Compliance Officer Fees | 41,811 | 6,818 | 4,373 | |||||||||
| Interest Expense | — | 826,585 | — | |||||||||
| Miscellaneous Expenses | 29,708 | 4,073 | 3,979 | |||||||||
| Total Expenses | 9,601,710 | 2,930,743 | 1,044,819 | |||||||||
| Plus (Less): Expenses Recaptured (Fees Waived) by Adviser | — | 406,183 | (30,326 | ) | ||||||||
| Net Expenses | 9,601,710 | 3,336,926 | 1,014,493 | |||||||||
| Net Investment Income (Loss) | 292,116 | (1,325,499 | ) | 406,421 | ||||||||
| Net Realized and Unrealized Gain (Loss) on Investments: | ||||||||||||
| Net Realized Gain (Loss) on: | ||||||||||||
| Investments | 71,907,455 | 26,252,762 | 9,365,156 | |||||||||
| Purchased Options | — | (7,043,144 | ) | — | ||||||||
| Written Options | — | (1,308 | ) | — | ||||||||
| Total Net Realized Gain | 71,907,455 | 19,208,310 | 9,365,156 | |||||||||
| Net Change in Unrealized Appreciation (Depreciation) on: | ||||||||||||
| Investments | 10,759,156 | (3,411,237 | ) | (1,657,728 | ) | |||||||
| Purchased Options | — | (4,317,333 | ) | — | ||||||||
| Total Net Change in Unrealized Appreciation (Depreciation) | 10,759,156 | (7,728,570 | ) | (1,657,728 | ) | |||||||
| Net Realized and Unrealized Gain on Investments | 82,666,611 | 11,479,740 | 7,707,428 | |||||||||
| Net Increase in Net Assets Resulting From Operations | $ | 82,958,727 | $ | 10,154,241 | $ | 8,113,849 | ||||||
The accompanying notes are an integral part of these financial statements.
27
| Miller Convertible Bond Fund |
| STATEMENTS OF CHANGES IN NET ASSETS |
| Year | Year | |||||||
| Ended | Ended | |||||||
| October 31, 2021 | October 31, 2020 | |||||||
| Operations: | ||||||||
| Net Investment Income | $ | 292,116 | $ | 5,373,540 | ||||
| Net Realized Gain on Investments | 71,907,455 | 43,864,824 | ||||||
| Net Change in Unrealized Appreciation on Investments | 10,759,156 | 25,608,037 | ||||||
| Net Increase in Net Assets Resulting From Operations | 82,958,727 | 74,846,401 | ||||||
| Distributions to Shareholders From: | ||||||||
| Total Distributions Paid | ||||||||
| Class A ($0.69 and $0.31 per share, respectively) | (2,752,370 | ) | (1,415,858 | ) | ||||
| Class I ($0.77 and $0.39 per share, respectively) | (40,527,256 | ) | (17,950,880 | ) | ||||
| Class C ($0.62 and $0.25 per share, respectively) | (2,634,187 | ) | (1,163,625 | ) | ||||
| Total Distributions to Shareholders | (45,913,813 | ) | (20,530,363 | ) | ||||
| Beneficial Interest Transactions: | ||||||||
| Class A | ||||||||
| Proceeds from Shares Issued | 12,744,154 | 10,866,686 | ||||||
| Distributions Reinvested | 2,506,175 | 1,299,096 | ||||||
| Cost of Shares Redeemed | (30,807,101 | ) | (31,912,638 | ) | ||||
| Total Class A Shares | (15,556,772 | ) | (19,746,856 | ) | ||||
| Class I | ||||||||
| Proceeds from Shares Issued | 324,079,338 | 225,951,524 | ||||||
| Distributions Reinvested | 30,588,176 | 13,064,107 | ||||||
| Cost of Shares Redeemed | (131,553,593 | ) | (304,816,582 | ) | ||||
| Total Class I Shares | 223,113,921 | (65,800,951 | ) | |||||
| Class C | ||||||||
| Proceeds from Shares Issued | 3,573,063 | 5,184,777 | ||||||
| Distributions Reinvested | 2,306,927 | 1,036,425 | ||||||
| Cost of Shares Redeemed | (8,253,160 | ) | (14,327,153 | ) | ||||
| Total Class C Shares | (2,373,170 | ) | (8,105,951 | ) | ||||
| Total Beneficial Interest Transactions | 205,183,979 | (93,653,758 | ) | |||||
| Increase (Decrease) in Net Assets | 242,228,893 | (39,337,720 | ) | |||||
| Net Assets: | ||||||||
| Beginning of Year | 731,576,880 | 770,914,600 | ||||||
| End of Year | $ | 973,805,773 | $ | 731,576,880 | ||||
| SHARE ACTIVITY | ||||||||
| Class A: | ||||||||
| Shares Issued | 857,178 | 866,118 | ||||||
| Shares Reinvested | 170,245 | 100,185 | ||||||
| Shares Redeemed | (2,109,778 | ) | (2,539,236 | ) | ||||
| Net decrease in shares of beneficial interest outstanding | (1,082,355 | ) | (1,572,933 | ) | ||||
| Class I: | ||||||||
| Shares Issued | 22,118,138 | 17,402,997 | ||||||
| Shares Reinvested | 2,085,030 | 1,008,737 | ||||||
| Shares Redeemed | (8,960,786 | ) | (24,392,483 | ) | ||||
| Net increase (decrease) in shares of beneficial interest outstanding | 15,242,382 | (5,980,749 | ) | |||||
| Class C: | ||||||||
| Shares Issued | 244,462 | 413,651 | ||||||
| Shares Reinvested | 158,228 | 79,800 | ||||||
| Shares Redeemed | (564,544 | ) | (1,137,729 | ) | ||||
| Net decrease in shares of beneficial interest outstanding | (161,854 | ) | (644,278 | ) | ||||
The accompanying notes are an integral part of these financial statements.
28
| Miller Convertible Plus Fund |
| STATEMENTS OF CHANGES IN NET ASSETS |
| Year | Year | |||||||
| Ended | Ended | |||||||
| October 31, 2021 | October 31, 2020 | |||||||
| Operations: | ||||||||
| Net Investment Income (Loss) | $ | (1,325,499 | ) | $ | 16,503 | |||
| Net Realized Gain on Investments, Options | 19,208,310 | 9,559,881 | ||||||
| Net Change in Unrealized Appreciation (Depreciation) on Investments and Options | (7,728,570 | ) | 5,378,925 | |||||
| Net Increase in Net Assets Resulting From Operations | 10,154,241 | 14,955,309 | ||||||
| Total Distributions Paid | ||||||||
| Class I ($2.13 and $0.42 per share, respectively) | (9,953,438 | ) | (2,047,227 | ) | ||||
| Total Distributions to Shareholders | (9,953,438 | ) | (2,047,227 | ) | ||||
| Beneficial Interest Transactions: | ||||||||
| Class I | ||||||||
| Proceeds from Shares Issued | 20,024,819 | 10,921,430 | ||||||
| Distributions Reinvested | 9,597,199 | 1,981,817 | ||||||
| Cost of Shares Redeemed | (28,879,054 | ) | (24,278,153 | ) | ||||
| Total Class I Shares | 742,964 | (11,374,906 | ) | |||||
| Increase in Net Assets | 943,767 | 1,533,176 | ||||||
| Net Assets: | ||||||||
| Beginning of Year | 118,942,682 | 117,409,506 | ||||||
| End of Year | $ | 119,886,449 | $ | 118,942,682 | ||||
| SHARE ACTIVITY | ||||||||
| Class I: | ||||||||
| Shares Issued | 721,399 | 437,170 | ||||||
| Shares Reinvested | 351,256 | 83,256 | ||||||
| Shares Redeemed | (1,040,071 | ) | (1,028,830 | ) | ||||
| Net increase (decrease) in shares of beneficial interest outstanding | 32,584 | (508,404 | ) | |||||
The accompanying notes are an integral part of these financial statements.
29
| Miller Intermediate Bond Fund |
| STATEMENTS OF CHANGES IN NET ASSETS |
| Year | Year | |||||||
| Ended | Ended | |||||||
| October 31, 2021 | October 31, 2020 | |||||||
| Operations: | ||||||||
| Net Investment Income | $ | 406,421 | $ | 1,323,676 | ||||
| Net Realized Gain on Investments | 9,365,156 | 3,390,299 | ||||||
| Net Change in Unrealized Appreciation (Depreciation) on Investments | (1,657,728 | ) | 500,018 | |||||
| Net Increase in Net Assets Resulting From Operations | 8,113,849 | 5,213,993 | ||||||
| Total Distributions Paid Class I ($0.91 and $0.62 per share, respectively) | (5,066,335 | ) | (3,441,879 | ) | ||||
| Total Distributions to Shareholders | (5,066,335 | ) | (3,441,879 | ) | ||||
| Beneficial Interest Transactions: | ||||||||
| Class I | ||||||||
| Proceeds from Shares Issued | 68,613,283 | 11,400,206 | ||||||
| Distributions Reinvested | 4,736,801 | 3,311,173 | ||||||
| Cost of Shares Redeemed | (25,295,493 | ) | (55,817,609 | ) | ||||
| Total Class I Shares | 48,054,591 | (41,106,230 | ) | |||||
| Total Beneficial Interest Transactions | 48,054,591 | (41,106,230 | ) | |||||
| Increase (Decrease) in Net Assets | 51,102,105 | (39,334,116 | ) | |||||
| Net Assets: | ||||||||
| Beginning of Year | 76,558,389 | 115,892,505 | ||||||
| End of Year | $ | 127,660,494 | $ | 76,558,389 | ||||
| SHARE ACTIVITY | ||||||||
| Class I: | ||||||||
| Shares Issued | 3,838,503 | 699,252 | ||||||
| Shares Reinvested | 268,987 | 206,290 | ||||||
| Shares Redeemed | (1,421,515 | ) | (3,508,141 | ) | ||||
| Net increase (decrease) in shares of beneficial interest outstanding | 2,685,975 | (2,602,599 | ) | |||||
The accompanying notes are an integral part of these financial statements.
30
| Miller Convertible Plus Fund |
| STATEMENT OF CASH FLOWS |
| For the Year Ended October 31, 2021 |
| Cash flows from operating activities: | ||||
| Net increase in net assets resulting from operations | $ | 10,154,241 | ||
| Adjustments to reconcile net increase in net assets resulting from operations to net cash provided by operating activities: | ||||
| Purchases of investments and options | (267,642,594 | ) | ||
| Proceeds from sales of investments and options | 278,617,232 | |||
| Purchases of short term investments, net | (779,191 | ) | ||
| Net realized gain from investments | (19,208,310 | ) | ||
| Net change in unrealized appreciation (depreciation) from investments | 7,728,570 | |||
| Net accretion of discounts | (377,747 | ) | ||
| Changes in assets and liabilities (Increase)/decrease in assets: | ||||
| Dividend and interest receivable | 226,594 | |||
| Receivable for securities sold | (392,831 | ) | ||
| Prepaid expenses and other assets | 1,300 | |||
| Increase/(decrease) in liabilities: | ||||
| Interest payable | 37,276 | |||
| Accrued advisory fees | (32,033 | ) | ||
| Accrued expenses and other liabilities | 21,672 | |||
| Net cash provided by operating activities | 8,354,179 | |||
| Cash flows from financing activities: | ||||
| Proceeds from revolving credit line payable to bank | 31,000,000 | |||
| Repayment of borrowings under revolving credit line payable | (29,000,000 | ) | ||
| Proceeds from shares sold | 20,084,964 | |||
| Payment on shares redeemed | (28,861,147 | ) | ||
| Cash distributions paid | (356,239 | ) | ||
| Net cash used in financing activities | (7,132,422 | ) | ||
| Net increase in cash | 1,221,757 | |||
| Cash & Restricted Cash at beginning of year | 492,738 | |||
| Cash & Restricted Cash at end of year | $ | 1,714,495 | ||
| Cash | — | |||
| Restricted Cash | ||||
| Segregated Cash - Deposit with Broker for Options | 1,701,110 | |||
| Segregated Cash - Collateral for Loan | 13,385 | |||
| Total Cash and Restricted Cash | $ | 1,714,495 | ||
| Noncash or supplementary financing activities consist of: | ||||
| Noncash financing activities not including herein consists of: | ||||
| Reinvestment of dividends | $ | 9,597,199 | ||
| Interest paid | $ | 789,309 | ||
The accompanying notes are an integral part of the financial statements.
31
| Miller Convertible Bond Fund | |||||||
| FINANCIAL HIGHLIGHTS | |||||||
The table below sets forth financial data for one share of beneficial interest outstanding throughout each year presented.
| Class A | ||||||||||||||||||||
| Year Ended October 31, | ||||||||||||||||||||
| 2021 | 2020 | 2019 | 2018 | 2017 | ||||||||||||||||
| Net Asset Value, Beginning of Year | $ | 13.78 | $ | 12.56 | $ | 12.42 | $ | 13.19 | $ | 12.53 | ||||||||||
| Increase (decrease) from operations: | ||||||||||||||||||||
| Net investment income (loss) (a) | (0.05 | ) | 0.05 | 0.10 | 0.20 | 0.72 | ||||||||||||||
| Net gain (loss) from securities (both realized and unrealized) | 1.49 | 1.48 | 0.54 | (0.38 | ) | 0.36 | ||||||||||||||
| Total from operations | 1.44 | 1.53 | 0.64 | (0.18 | ) | 1.08 | ||||||||||||||
| Distributions to shareholders from: | ||||||||||||||||||||
| Net investment income | (0.64 | ) | (0.31 | ) | (0.29 | ) | (0.38 | ) | (0.42 | ) | ||||||||||
| Net realized gain | (0.05 | ) | — | (0.21 | ) | (0.21 | ) | — | ||||||||||||
| Total distributions | (0.69 | ) | (0.31 | ) | (0.50 | ) | (0.59 | ) | (0.42 | ) | ||||||||||
| Net Asset Value, End of Year | $ | 14.53 | $ | 13.78 | $ | 12.56 | $ | 12.42 | $ | 13.19 | ||||||||||
| Total Return (b) | 10.54 | % | 12.33 | % | 5.37 | % | (1.50 | )% | 8.72 | % | ||||||||||
| Ratios/Supplemental Data | ||||||||||||||||||||
| Net assets, end of year (in 000’s) | $ | 40,582 | $ | 53,385 | $ | 68,437 | $ | 91,985 | $ | 109,900 | ||||||||||
| Ratio of expenses to average net assets | 1.46 | % | 1.49 | % | 1.47 | % | 1.44 | % | 1.45 | % | ||||||||||
| Ratio of net investment income (loss) to average net assets | (0.36 | )% | 0.40 | % | 0.80 | % | 1.53 | % | 5.55 | % | ||||||||||
| Portfolio turnover rate | 98 | % | 94 | % | 81 | % | 107 | % | 79 | % | ||||||||||
| (a) | Per share amounts are calculated using the daily average shares method, which more appropriately presents the per share data for the year. |
| (b) | Total returns are historical in nature and assume changes in share price, reinvestment of dividends and capital gains distributions, if any, excluding the effect of sales loads. Total returns for periods less than one year are not annualized. |
The accompanying notes are an integral part of the financial statements.
32
| Miller Convertible Bond Fund |
| FINANCIAL HIGHLIGHTS |
The table below sets forth financial data for one share of beneficial interest outstanding throughout each year presented.
| Class I | ||||||||||||||||||||
| Year Ended October 31, | ||||||||||||||||||||
| 2021 | 2020 | 2019 | 2018 | 2017 | ||||||||||||||||
| Net Asset Value, Beginning of Year | $ | 13.75 | $ | 12.55 | $ | 12.41 | $ | 13.19 | $ | 12.53 | ||||||||||
| Increase (decrease) from operations: | ||||||||||||||||||||
| Net investment income (a) | 0.02 | 0.12 | 0.16 | 0.27 | 0.78 | |||||||||||||||
| Net gain (loss) from securities (both realized and unrealized) | 1.49 | 1.47 | 0.54 | (0.40 | ) | 0.36 | ||||||||||||||
| Total from operations | 1.51 | 1.59 | 0.70 | (0.13 | ) | 1.14 | ||||||||||||||
| Distributions to shareholders from: | ||||||||||||||||||||
| Net investment income | (0.72 | ) | (0.39 | ) | (0.35 | ) | (0.44 | ) | (0.48 | ) | ||||||||||
| Net realized gain | (0.05 | ) | — | (0.21 | ) | (0.21 | ) | — | ||||||||||||
| Total distributions | (0.77 | ) | (0.39 | ) | (0.56 | ) | (0.65 | ) | (0.48 | ) | ||||||||||
| Net Asset Value, End of Year | $ | 14.49 | $ | 13.75 | $ | 12.55 | $ | 12.41 | $ | 13.19 | ||||||||||
| Total Return (b) | 11.04 | % | 12.93 | % | 5.90 | % | (1.08 | )% | 9.27 | % | ||||||||||
| Ratios/Supplemental Data | ||||||||||||||||||||
| Net assets, end of year (in 000’s) | $ | 873,184 | $ | 619,010 | $ | 640,466 | $ | 821,772 | $ | 781,823 | ||||||||||
| Ratio of expenses to average net assets | 0.96 | % | 0.99 | % | 0.97 | % | 0.94 | % | 0.95 | % | ||||||||||
| Ratio of net investment income to average net assets | 0.13 | % | 0.89 | % | 1.30 | % | 2.09 | % | 6.06 | % | ||||||||||
| Portfolio turnover rate | 98 | % | 94 | % | 81 | % | 107 | % | 79 | % | ||||||||||
| (a) | Per share amounts are calculated using the daily average shares method, which more appropriately presents the per share data for the year. |
| (b) | Total returns are historical in nature and assume changes in share price, reinvestment of dividends and capital gains distributions, if any, excluding the effect o sales loads. Total returns for periods less than one year are not annualized. |
The accompanying notes are an integral part of the financial statements.
33
| Miller Convertible Bond Fund |
| FINANCIAL HIGHLIGHTS |
The table below sets forth financial data for one share of beneficial interest outstanding throughout each year presented.
| Class C | ||||||||||||||||||||
| Year Ended October 31, | ||||||||||||||||||||
| 2021 | 2020 | 2019 | 2018 | 2017 | ||||||||||||||||
| Net Asset Value, Beginning of Year | $ | 13.64 | $ | 12.45 | $ | 12.31 | $ | 13.10 | $ | 12.45 | ||||||||||
| Increase (decrease) from operations: | ||||||||||||||||||||
| Net investment income (loss) (a) | (0.13 | ) | (0.01 | ) | 0.04 | 0.14 | 0.65 | |||||||||||||
| Net gain (loss) from securities (both realized and unrealized) | 1.49 | 1.45 | 0.54 | (0.39 | ) | 0.35 | ||||||||||||||
| Total from operations | 1.36 | 1.44 | 0.58 | (0.25 | ) | 1.00 | ||||||||||||||
| Distributions to shareholders from: | ||||||||||||||||||||
| Net investment income | (0.57 | ) | (0.25 | ) | (0.23 | ) | (0.33 | ) | (0.35 | ) | ||||||||||
| Net realized gain | (0.05 | ) | — | (0.21 | ) | (0.21 | ) | — | ||||||||||||
| Total distributions | (0.62 | ) | (0.25 | ) | (0.44 | ) | (0.54 | ) | (0.35 | ) | ||||||||||
| Net Asset Value, End of Year | $ | 14.38 | $ | 13.64 | $ | 12.45 | $ | 12.31 | $ | 13.10 | ||||||||||
| Total Return (b) | 9.99 | % | 11.68 | % | 4.92 | % | (2.04 | )% | 8.14 | % | ||||||||||
| Ratios/Supplemental Data | ||||||||||||||||||||
| Net assets, end of year (in 000’s) | $ | 60,040 | $ | 59,182 | $ | 62,012 | $ | 64,832 | $ | 71,406 | ||||||||||
| Ratio of expenses to average net assets | 1.96 | % | 1.99 | % | 1.97 | % | 1.94 | % | 1.95 | % | ||||||||||
| Ratio of net investment income (loss) to average net assets | (0.86 | )% | (0.10 | )% | 0.30 | % | 1.06 | % | 5.06 | % | ||||||||||
| Portfolio turnover rate | 98 | % | 94 | % | 81 | % | 107 | % | 79 | % | ||||||||||
| (a) | Per share amounts are calculated using the daily average shares method, which more appropriately presents the per share data for the year. |
| (b) | Total returns are historical in nature and assume changes in share price, reinvestment of dividends and capital gains distributions, if any, excluding the effect of sales loads. Total returns for periods less than one year are not annualized. |
The accompanying notes are an integral part of the financial statements.
34
| Miller Convertible Plus Fund |
| FINANCIAL HIGHLIGHTS |
The table below sets forth financial data for one share of beneficial interest outstanding throughout each year presented.
| Class I | ||||||||||||||||||||
| Year Ended October 31, | ||||||||||||||||||||
| 2021 | 2020 | 2019 | 2018 | 2017 | ||||||||||||||||
| Net Asset Value, Beginning of Year | $ | 25.94 | $ | 23.05 | $ | 22.82 | $ | 24.30 | $ | 22.45 | ||||||||||
| Increase from operations: | ||||||||||||||||||||
| Net investment income (loss) (a) | (0.28 | ) | 0.00 | (c) | (0.06 | ) | 0.14 | 1.21 | ||||||||||||
| Net gain (loss) from securities (both realized and unrealized) | 2.43 | 3.31 | 1.53 | (0.19 | ) | 1.27 | ||||||||||||||
| Total from operations | 2.15 | 3.31 | 1.47 | (0.05 | ) | 2.48 | ||||||||||||||
| Distributions to shareholders from: | ||||||||||||||||||||
| Net investment income | (1.99 | ) | (0.42 | ) | (0.19 | ) | (0.72 | ) | (0.63 | ) | ||||||||||
| Net realized gain | (0.14 | ) | — | (1.05 | ) | (0.71 | ) | — | ||||||||||||
| Total distributions | (2.13 | ) | (0.42 | ) | (1.24 | ) | (1.43 | ) | (0.63 | ) | ||||||||||
| Net Asset Value, End of Year | $ | 25.96 | $ | 25.94 | $ | 23.05 | $ | 22.82 | $ | 24.30 | ||||||||||
| Total Return (b) | 8.05 | % | 14.54 | % | 7.16 | % | (0.32 | )% | 11.16 | % | ||||||||||
| Ratios/Supplemental Data | ||||||||||||||||||||
| Net assets, end of year (in 000’s) | $ | 119,886 | $ | 118,943 | $ | 117,410 | $ | 140,726 | $ | 136,449 | ||||||||||
| Ratio of expenses to average net assets, before reimbursement | 2.59 | % (d) | 2.96 | % (d) | 4.75 | % | 4.60 | % | 4.15 | % | ||||||||||
| net of reimbursement | 2.59 | % (d)(e) | 2.96 | % (d),(e) | 3.61 | % | 3.46 | % | 4.00 | % | ||||||||||
| Ratio of net investment income (loss) to average net assets | (1.03 | )% | 0.01 | % | (0.26 | )% | 0.60 | % | 5.11 | % | ||||||||||
| Portfolio turnover rate | 145 | % | 127 | % | 110 | % | 141 | % | 122 | % | ||||||||||
| (a) | Per share amounts are calculated using the daily average shares method, which more appropriately presents the per share data for the year. |
| (b) | Total returns are historical in nature and assume changes in share price, reinvestment of dividends and capital gains distributions, if any, excluding the effect of sales loads. Total returns for periods less than one year are not annualized. Had the adviser not absorbed a portion of the expenses or recaptured expenses during certain periods, total returns would have been lower or higher, respectively. |
| (c) | Amount is less than $0.005 per share. |
| (d) | Ratio of expenses to average net assets includes borrowing costs not subject to the Expense Limitation Agreement as described in Note 3. Borrowing costs represented 0.64% and 1.01% of average net assets for the year ended October 31, 2021 and year ended October 31, 2020, respectively. |
| (e) | Ratio includes expense recapture of prior years’ expense waivers/reimbursements in accordance with the Expense Limitation Agreement as described in Note 3. Recapture of prior years’ expense waivers/reimbursements represented 0.32% and 0.37% of average net assets for the year ended October 31, 2021 and year ended October 31, 2020, respectively. |
The accompanying notes are an integral part of the financial statements.
35
| Miller Intermediate Bond Fund |
| FINANCIAL HIGHLIGHTS |
The table below sets forth financial data for one share of beneficial interest outstanding throughout each year presented.
| Class I | ||||||||||||||||||||
| Year Ended October 31, | ||||||||||||||||||||
| 2021 | 2020 | 2019 | 2018 | 2017 | ||||||||||||||||
| Net Asset Value, Beginning of Year | $ | 16.64 | $ | 16.09 | $ | 16.08 | $ | 16.55 | $ | 16.21 | ||||||||||
| Increase from operations: | ||||||||||||||||||||
| Net investment income (a) | 0.07 | 0.24 | 0.24 | 0.30 | 0.62 | |||||||||||||||
| Net gain (loss) from securities (both realized and unrealized) | 1.72 | 0.93 | 0.52 | (0.14 | ) | 0.08 | ||||||||||||||
| Total from operations | 1.79 | 1.17 | 0.76 | 0.16 | 0.70 | |||||||||||||||
| Distributions to shareholders from: | ||||||||||||||||||||
| Net investment income | (0.91 | ) | (0.62 | ) | (0.29 | ) | (0.38 | ) | (0.36 | ) | ||||||||||
| Net realized gain | — | — | (0.46 | ) | (0.25 | ) | — | |||||||||||||
| Total distributions | (0.91 | ) | (0.62 | ) | (0.75 | ) | (0.63 | ) | (0.36 | ) | ||||||||||
| Net Asset Value, End of Year | $ | 17.52 | $ | 16.64 | $ | 16.09 | $ | 16.08 | $ | 16.55 | ||||||||||
| Total Return (b) | 10.83 | % | 7.45 | % | 5.08 | % | 0.96 | % | 4.34 | % | ||||||||||
| Ratios/Supplemental Data | ||||||||||||||||||||
| Net assets, end of year (in 000’s) | $ | 127,660 | $ | 76,558 | $ | 115,893 | $ | 108,554 | $ | 147,539 | ||||||||||
| Ratio of expenses to average net assets, before reimbursement/recapture | 0.98 | % | 1.06 | % | 1.20 | % | 1.17 | % | 1.18 | % | ||||||||||
| net of reimbursement/recapture | 0.95 | % | 0.95 | % | 1.02 | % | 1.05 | % | 1.25 | % | ||||||||||
| Ratio of net investment income to average net assets | 0.38 | % | 1.46 | % | 1.54 | % | 1.85 | % | 3.78 | % | ||||||||||
| Portfolio turnover rate | 113 | % | 106 | % | 77 | % | 98 | % | 83 | % | ||||||||||
| (a) | Per share amounts are calculated using the daily average shares method, which more appropriately presents the per share data for the year. |
| (b) | Total returns are historical in nature and assume changes in share price, reinvestment of dividends and capital gains distributions, if any, excluding the effect of sales loads. Total returns for periods less than one year are not annualized. Had the adviser not absorbed a portion of the expenses or recaptured expenses during certain periods, total returns would have been lower or higher, respectively. |
The accompanying notes are an integral part of the financial statements.
36
| Miller Funds |
| NOTES TO FINANCIAL STATEMENTS |
| October 31, 2021 |
| 1. | ORGANIZATION |
The Miller Convertible Bond Fund (the “Convertible Bond Fund”), the Miller Convertible Plus Fund (the “Convertible Plus Fund”), and Miller Intermediate Bond Fund (the “Intermediate Bond Fund”) referred to collectively, as the “Funds”, are separate series of the Miller Investment Trust (the “Trust”), a Delaware statutory trust organized on September 28, 2007. The Trust is registered as an open-end management investment company. The Funds are registered under the Investment Company Act of 1940, as amended (the “1940 Act”), as diversified, open-end management investment companies. Convertible Bond Fund’s primary investment objective is to maximize total return comprising current income and capital appreciation, consistent with preservation of capital. Convertible Plus Fund’s primary investment objective is to use leverage to maximize total return comprising current income and capital appreciation. Intermediate Bond Fund’s primary investment objective is to maximize total return comprising current income and capital appreciation, consistent with preservation of capital.
The Convertible Bond Fund currently offers Class A, Class I and Class C shares of which Class A and Class I shares commenced operations on December 27, 2007 and Class C shares commenced operations on December 1, 2009. Convertible Plus Fund and Intermediate Bond Fund currently offer only Class I shares which commenced operations on December 31, 2014. On July 13, 2019, $987,053 and 42,539 shares of Class A and $250,886 and 10,970 shares of Class C shares of the Convertible Plus Fund were converted into 53,421 Class I shares of Convertible Plus Fund, and $937,238 and 58,646 shares of Class A and $323,384 and 20,140 shares of Class C of the Intermediate Bond Fund were converted into 78,883 Class I shares of Intermediate Bond Fund. Prior to July 13, 2019, the Convertible Plus Fund and Intermediate Bond Fund offered three classes of shares designated as Class A, Class C and Class I. Class A and Class C shares of the Convertible Plus Fund and Intermediate Bond Fund are no longer available for purchase. Class I and Class C shares are offered at net asset value. Class A shares are offered at net asset value plus a maximum sales charge of 3.75% (5.75% through April 13, 2021). Each class represents an interest in the same assets of the respective Fund and classes are identical except for differences in their sales charge structures and ongoing service and distribution charges. All classes of shares have equal voting privileges except that each class has exclusive voting rights with respect to its service and/or distribution plans. Each Fund’s income, expenses (other than class specific distribution fees) and realized and unrealized gains and losses are allocated proportionately each day based upon the relative net assets of each class.
Wellesley Asset Management, Inc. serves as the Funds’ investment adviser (the “Adviser”).
| 2. | SUMMARY OF SIGNIFICANT ACCOUNTING POLICIES |
The preparation of financial statements in accordance with accounting principles generally accepted in the United States of America (“GAAP”) requires management to make estimates and assumptions that affect the reported amounts of assets and liabilities and disclosure of contingent assets and liabilities at the date of the financial statements and the reported amounts of revenue and expenses during the period. Actual results could differ from those estimates. Each Fund is an investment company and accordingly follows the investment company accounting and reporting guidance of the Financial Accounting Standards Board (FASB) Accounting Standards Codification Topic 946 “Financial Services - Investment Companies.”
The following is a summary of significant accounting policies followed by the Funds in preparation of their financial statements.
Security Valuation – The Funds’ securities are valued at the last sale price on the exchange in which such securities are primarily traded, as of the close of business on the day the securities are being valued. NASDAQ traded securities are valued using the NASDAQ Official Closing Price (“NOCP”). If the NOCP is not available, such securities shall be valued at the last sale price on the day of valuation, or if there has been no sale on such day, at the mean between the bid and asked prices. Exchange traded options, futures and options on futures are valued at the final settle price or, in the absence of a sale price, at the mean between the current bid and ask prices on the day of valuation. Index options shall be valued at the mean between the current bid and ask prices on the day of valuation. Debt securities and long-term U.S. Treasury obligations (other than short-term obligations) are valued each day by an independent pricing service approved by the Trust’s Board of Trustees (the “Board”) using methods which include current market quotations from a major market maker or counterparty in/to the securities and based on
37
| Miller Funds |
| NOTES TO FINANCIAL STATEMENTS (Continued) |
| October 31, 2021 |
methods which include the consideration of yields or prices of securities of comparable quality, coupon, maturity and type. The independent pricing service does not distinguish between smaller-sized bond positions known as “odd lots” and larger institutional-sized bond positions known as “round lots”. The Funds may fair value a particular bond if the Adviser does not believe that the round lot value provided by the independent pricing service reflects fair value of the Funds’ holding. Short-term debt obligations that mature in 60 days or less, at the time of purchase, may be valued at amortized cost, provided such valuations represent fair value. Investments in open-end investment companies are valued at net asset value. Due to custodian as recorded on the Statement of Assets and Liabilities is recorded at cost and approximates fair value; it is classified as level 2 under the fair value hierarchy.
Securities for which current market quotations are not readily available or for which quotations are not deemed to be representative of market values are valued at fair value as determined in good faith by a Fair Valuation Committee in accordance with the Trust’s Portfolio Securities Valuation Procedures (the “Procedures”) adopted by the Board. The Procedures consider, among others, the following factors to determine a security’s fair value: the nature and pricing history (if any) of the security; whether any dealer quotations for the security are available; and possible valuation methodologies that could be used to determine the fair value of the security.
The Funds utilize various methods to measure the fair value of their investments on a recurring basis. GAAP establishes a hierarchy that prioritizes inputs to valuation methods. The three levels of input are:
Level 1 – Unadjusted quoted prices in active markets for identical assets and liabilities that the Funds have the ability to access.
Level 2 – Observable inputs other than quoted prices included in Level 1 that are observable for the asset or liability, either directly or indirectly. These inputs may include quoted prices for the identical instrument in an inactive market, prices for similar instruments, interest rates, prepayment speeds, credit risk, yield curves, default rates and similar data.
Level 3 – Unobservable inputs for the asset or liability, to the extent relevant observable inputs are not available, representing the Funds’ own assumptions about the assumptions a market participate would use in valuing the asset or liability, and would be based on the best information available.
The availability of observable inputs can vary from security to security and is affected by a wide variety of factors, including, for example, the type of security, whether the security is new and not yet established in the marketplace, the liquidity of markets, and other characteristics particular to the security. To the extent that valuation is based on models or inputs that are less observable or unobservable in the market, the determination of fair value requires more judgment. Accordingly, the degree of judgment exercised in determining fair value is greatest for instruments categorized in Level 3.
The inputs used to measure fair value may fall into different levels of the fair value hierarchy. In such cases, for disclosure purposes, the level in the fair value hierarchy within which the fair value measurement falls in its entirety, is determined based on the lowest level input that is significant to the fair value measurement in its entirety.
The inputs or methodology used for valuing securities are not necessarily an indication of the risk associated with investing in those securities. The following tables summarize the inputs used as of October 31, 2021 for the Funds’ assets and liabilities measured at fair value:
| Convertible Bond Fund | ||||||||||||||||
| Assets | Level 1 | Level 2 | Level 3 | Total | ||||||||||||
| Investments in Securities: | ||||||||||||||||
| Common Stocks* | $ | 1,317,154 | $ | — | $ | — | $ | 1,317,154 | ||||||||
| Convertible Bonds* | — | 940,285,832 | — | 940,285,832 | ||||||||||||
| U.S. Treasury Obligations | — | 96,725 | — | 96,725 | ||||||||||||
| Short-Term Investments | 30,409,467 | — | — | 30,409,467 | ||||||||||||
| Total Investments in Securities | $ | 31,726,621 | $ | 940,382,557 | $ | — | $ | 972,109,178 | ||||||||
38
| Miller Funds |
| NOTES TO FINANCIAL STATEMENTS (Continued) |
| October 31, 2021 |
| Convertible Plus Fund | ||||||||||||||||
| Assets | Level 1 | Level 2 | Level 3 | Total | ||||||||||||
| Investments in Securities: | ||||||||||||||||
| Common Stocks* | $ | 1,850,620 | $ | — | $ | — | $ | 1,850,620 | ||||||||
| Convertible Bonds* | — | 170,523,550 | — | 170,523,550 | ||||||||||||
| Option Contracts Purchased | 207,720 | 191,910 | — | 399,630 | ||||||||||||
| Total Investments in Securities | $ | 2,058,340 | $ | 170,715,460 | $ | — | $ | 172,773,800 | ||||||||
| Intermediate Bond Fund | ||||||||||||||||
| Assets | Level 1 | Level 2 | Level 3 | Total | ||||||||||||
| Investments in Securities: | ||||||||||||||||
| Common Stocks* | $ | 1,434,800 | $ | — | $ | — | $ | 1,434,800 | ||||||||
| Convertible Bonds* | — | 118,169,752 | — | 118,169,752 | ||||||||||||
| U.S. Treasury Obligations | — | 1,934,492 | — | 1,934,492 | ||||||||||||
| Short-Term Investments | 5,876,972 | — | — | 5,876,972 | ||||||||||||
| Total Investments in Securities | $ | 7,311,772 | $ | 120,104,244 | $ | — | $ | 127,416,016 | ||||||||
| * | Please refer to the Schedule of Investments for industry classifications. |
Synthetic Convertible Bond Risk – Synthetic convertible bonds are financial instruments created by combining two or more separate securities that, in total, have returns that are similar to a convertible bond. Synthetic convertible bonds are derivative debt securities and are subject to the creditworthiness of the counterparty of the synthetic security. The value of a synthetic convertible bond may decline substantially if the counterparty’s creditworthiness deteriorates. The value of a synthetic convertible bond may also respond differently to market fluctuations than a convertible bond because a synthetic convertible is composed of two or more separate securities, each with its own market value.
The Funds invest in synthetic convertible bonds which may be packaged by investment banks and brokerage firms. Synthetic convertible bonds include structured equity linked products that combine unrelated securities which together have the characteristics of convertible securities: a fixed-income component and a convertible component. The fixed-income component is achieved by investing in non-convertible, fixed-income securities such as zero coupon, corporate or government bonds. The convertible component is achieved by investing in warrants or options to buy or sell common stock or various indices at a certain exercise price, or options on a stock index.
Synthetic convertible bonds also include index-linked and equity-linked convertible structured notes. Index-linked and equity-linked notes are securities, the value of which fluctuates based on the value of a basket of stocks or other securities (in the case of index-linked notes) or a single security (in the case of equity-linked notes). Many index-linked and equity-linked notes have a guarantee feature (usually supplied by a brokerage house or bank) that guarantees return of the original issue price, providing substantial protection against a decline in price, while preserving the ability for capital appreciation if the underlying basket of securities increases in value. Synthetic convertible bonds held by the Funds are contingent payment debt instruments that accrue interest income at the stated coupon rate for book purposes but at the comparable yield for tax purposes.
Leverage Risk – The use of leverage through activities such as borrowing or purchasing derivatives can magnify the effects of changes in the value of the Convertible Plus Fund and make the Convertible Plus Fund’s share price more volatile and sensitive to market movements. The leveraged investment techniques that the Convertible Plus Fund employs could cause investors in the Convertible Plus Fund to lose more money in adverse environments. Leverage may result in the creation of a liability that requires the Convertible Plus Fund to pay interest or fees, which may be greater than the income or gain received by the Convertible Plus Fund from the securities purchased with leverage proceeds.
Short Sales – A “short sale” is a transaction in which a Fund sells a security it does not own but have borrowed in anticipation that the market price of that security will decline. A Fund is obligated to replace the security borrowed
39
| Miller Funds |
| NOTES TO FINANCIAL STATEMENTS (Continued) |
| October 31, 2021 |
by purchasing it on the open market at a later date. If the price of the security sold short increases between the time of the short sale and the time the Fund replaces the borrowed security, the Fund will incur a loss, potentially unlimited in size. Conversely, if the price declines, the Fund will realize a gain, limited to the price at which the Fund sold the security short. As of October 31, 2021, the Funds had no open short positions.
Options Transactions – Each Fund is subject to equity price risk in the normal course of pursuing its investment objective and may purchase or sell options to help hedge against risk. When a Fund writes put and call options, an amount equal to the premium received is included in the Statements of Assets and Liabilities as a liability. The amount of the liability is subsequently marked-to-market to reflect the current market value of the option. If an option expires on its stipulated expiration date or if a Fund enters into a closing purchase transaction, a gain or loss is realized. If a written call option is exercised, a gain or loss is realized for the sale of the underlying security and the proceeds from the sale are increased by the premium originally received. As writer of an option, a Fund has no control over whether the option will be exercised and, as a result, retains the market risk of an unfavorable change in the price of the security underlying the written option.
The Funds may purchase put and call options. Put options are purchased to hedge against a decline in the value of securities held in a Fund’s portfolio. If such a decline occurs, a put option will permit a Fund to sell the securities underlying such options at the exercise price, or to close out the options at a profit. The premium paid for a put or call option plus any transaction costs will reduce the benefit, if any, realized by a Fund upon exercise of the option, and, unless the price of the underlying security or index rises or declines sufficiently, the option may expire worthless to a Fund. In addition, in the event that the price of the security or index in connection with which an option was purchased moves in a direction favorable to a Fund, the benefits realized by a Fund as a result of such favorable movement will be reduced by the amount of the premium paid for the option and related transaction costs. Written and purchased options are non-income producing securities. With purchased options, there is minimal counterparty risk to a Fund since these options are exchange traded and the exchange’s clearinghouse, as counterparty to all exchange traded options, guarantees against a possible default.
During the year ended October 31, 2021, the Miller Convertible Plus Fund held option contracts subject to equity price risk. The fair value of these option contracts as of October 31, 2021 was $399,630 and is included in Investments in Securities at Fair Value on the Statements of Assets and Liabilities. For the year ended October 31, 2021, the amount of unrealized depreciation and realized loss on purchased options contracts and written options contracts subject to equity price risk as included in the Statements of Operations amounted to $4,317,333, $7,043,144 and $1,308, respectively. During the year ended October 31, 2021, the Miller Convertible Bond Fund and Miller Intermediate Bond Fund did not hold options.
The notional value of the derivative instruments outstanding as of October 31, 2021 as disclosed in the Schedule of Investments for Miller Convertible Plus Fund serves as an indicator of the volume of derivative activity during the period.
Security Transactions and Investment Income – Investment security transactions are accounted for on a trade date basis. Cost is determined and gains and losses are based upon the specific identification method for both financial statement and federal income tax purposes.
Dividend income is recorded on the ex-dividend date and interest income is recorded on the accrual basis. Purchase discounts and premiums on securities are accreted or amortized over the life of the respective securities.
Expenses – Common expenses, income and gains and losses are allocated daily among share classes of the Funds based on the relative proportion of net assets represented by each class. Class specific expenses are charged directly to the responsible class of shares of the Funds.
Federal Income Taxes – The Funds intend to continue to comply with the requirements of Subchapter M of the Internal Revenue Code applicable to regulated investment companies and will distribute all of its taxable income, if any, to shareholders. Accordingly, no provision for Federal income taxes is required in the financial statements. The Funds recognize the tax benefits of uncertain tax positions only when the position is “more likely than not” to be sustained assuming examination by tax authorities. Management has reviewed the tax positions on returns filed for
40
| Miller Funds |
| NOTES TO FINANCIAL STATEMENTS (Continued) |
| October 31, 2021 |
open fiscal year ends October 31, 2018 through October 31, 2020, or expected to be taken in the Funds’ current fiscal year end returns, and concluded that no liability for unrecognized tax benefits should be recorded related to uncertain tax positions. The Funds identify their major tax jurisdictions as U.S. federal and the state of Massachusetts. The Funds recognize interest and penalties, if any, related to unrecognized tax benefits as income tax expense in the Statements of Operations. During the year ended October 31, 2021, the Funds did not incur any interest or penalties.
Distributions to Shareholders – Distributions from investment income, if any, are declared and paid quarterly and are recorded on the ex-dividend date. The Funds will declare and pay net realized capital gains, if any, annually. The character of income and gains to be distributed is determined in accordance with income tax regulations which may differ from GAAP.
Indemnification – The Trust indemnifies its officers and trustees for certain liabilities that may arise from the performance of their duties to the Trust. Additionally, in the normal course of business, the Funds enter into contracts that contain a variety of representations and warranties and which provide general indemnities. The Funds’ maximum exposure under these arrangements is unknown, as this would involve future claims that may be made against the Funds that have not yet occurred. However, based on experience, the Trust expects the risk of loss due to these warranties and indemnities to be remote.
| 3. | INVESTMENT ADVISORY AGREEMENT AND TRANSACTIONS WITH RELATED PARTIES |
The activities of the Funds are overseen by the Board. Pursuant to an Investment Advisory Agreement with the Funds, the Adviser, under the oversight of the Board, directs the daily operations of the Funds and supervises the performance of administrative and professional services provided by others. As compensation for its services and the related expenses borne by the Adviser, the Funds pays the Adviser a management fee, computed and accrued daily and paid monthly, at an annual rate of 0.75% for the Convertible Bond Fund and the Intermediate Bond Fund of the average daily net assets of each respective Fund. The Convertible Plus Fund pays the Adviser an annual rate of 0.95% of the average daily managed assets, which is equal to its total assets including assets attributable to borrowings, minus accrued liabilities other than borrowings. For the year ended October 31, 2021, the Adviser earned management fees of $6,812,275, $1,767,826 and $799,867 for the Convertible Bond Fund, Convertible Plus Fund and the Intermediate Bond Fund, respectively.
The Adviser, pursuant to an Expense Limitation Agreement (the “Agreement”), has contractually agreed to reduce its fees and/or absorb expenses of the Convertible Plus Fund and the Intermediate Bond Fund, at least until February 28, 2022, to ensure that net annual operating expenses (excluding any front-end or contingent deferred loads, brokerage fees and commissions, acquired fund fees and expenses, borrowing costs such as interest and dividend expense on securities sold short, taxes and extraordinary expenses such as litigation) will not exceed 1.95% of the Convertible Plus Fund’s average daily net assets for Class I shares and 0.95% of the Intermediate Bond Fund’s average daily net assets for Class I shares. The Agreement allows the Adviser, subject to certain conditions, to recover amounts previously reimbursed for operating expenses to the Funds to the extent that the Funds’ expense ratios fall below the above indicated expense limitations. The amounts that can be recovered are limited to the difference between the actual expense ratio and the amount of the expense limitation during the 36 month period following such waiver or reimbursement. The potential recoupment amounts are the lesser of: (i) the expense cap in effect at the time of the fee waiver/recoupment; or (ii) the expense cap in effect at the time of recapture. For the year ended October 31, 2021 the Adviser waived fees of $30,326 for the Intermediate Bond Fund and recouped expenses of $406,183 from the Convertible Plus Fund.
As of October 31, 2021, the following amounts are subject to recapture by the Adviser by October 31 of the following years:
| 2022 | 2023 | 2024 | ||||||||||
| Convertible Plus Fund | $ | 1,377,852 | $ | — | $ | — | ||||||
| Intermediate Bond Fund | 209,060 | 101,168 | 30,326 | |||||||||
41
| Miller Funds |
| NOTES TO FINANCIAL STATEMENTS (Continued) |
| October 31, 2021 |
Distributor – The distributor of the Funds is Northern Lights Distributors, LLC (the “Distributor” or “NLD”). The Board has adopted, on behalf of each Fund, a Distribution Plan and Agreement pursuant to Rule 12b-1 under the Investment Company Act of 1940 (the “Plan”), as amended, to pay for certain distribution activities and shareholder services. Convertible Bond Fund’s Class A shares and Class C shares pay 0.50% and 1.00%, respectively, per year of its average daily net assets for such distribution and shareholder service activities under the Plan. For the year ended October 31, 2021, the 12b-1 fees accrued amounted to $280,264 and $618,554 for the Convertible Bond Fund’s Class A shares and Class C shares, respectively.
The Distributor acts as each Fund’s principal underwriter in a continuous public offering of the Funds’ shares. For the year ended October 31, 2021, the Distributor received $106,137 in underwriting commissions for sales of Class A shares, of which $15,123 was retained by the principal underwriter or other affiliated broker-dealers for the Convertible Bond Fund.
In addition, certain affiliates of the Distributor provide services to the Funds as follows:
Ultimus Fund Solutions, LLC (“UFS”) – UFS, an affiliate of the Distributor, provides administration, fund accounting, and transfer agent services to the Trust. Pursuant to separate servicing agreements with UFS, the Funds pay UFS customary fees for providing administration, fund accounting and transfer agency services to the Funds.
Northern Lights Compliance Services, LLC (“NLCS”) – NLCS, an affiliate of UFS and the Distributor, provides a Chief Compliance Officer to the Trust, as well as related compliance services, pursuant to a consulting agreement between NLCS and the Trust. Under the terms of such agreement, NLCS receives customary fees from the Funds. An officer of the Trust is also an officer of NLCS.
Blu Giant, LLC (“Blu Giant”) – Blu Giant, an affiliate of UFS and the Distributor, provides EDGAR conversion and filing services as well as print management services for the Funds on an ad-hoc basis. For the provision of these services, Blu Giant receives customary fees from the Funds.
Trustee Fees - Each Trustee who is not affiliated with the Trust or the Adviser receives an annual retainer fee of $55,000, as well as $15,000 for one annual in-person meeting and $8,000 for all meetings conducted by telephone. Any additional as needed meetings, either in person or by telephone are covered by the retainer fee. The trustee who is chair of the Audit Committee receives an additional payment of $1,000 as an annual retainer fee for serving in that capacity. None of the Trustees who are affiliated with the Trust receive compensation from the Trust.
| 4. | INVESTMENT TRANSACTIONS |
The cost of security purchases and the proceeds from the sale of securities, other than short-term securities and U.S. Government securities, for the year ended October 31, 2021, amounted to $1,007,805,584 and $848,959,491, respectively, for the Convertible Bond Fund, $258,972,885 and $276,268,427, respectively, for the Convertible Plus Fund and $152,009,828 and $115,194,164, respectively, for the Intermediate Bond Fund. The cost of purchases and the proceeds from the sale of U.S. Government securities for the year ended October 31, 2021, amounted to $61,334,500 and $66,522,496, respectively, for the Convertible Bond Fund, $0 and $0 respectively, for the Convertible Plus Fund and $18,898,184 and $18,313,926, respectively, for the Intermediate Bond Fund.
| 5. | LINE OF CREDIT |
The Convertible Plus Fund may borrow for investment purposes, to meet repurchase requests and for temporary, extraordinary or emergency purposes. The Convertible Plus Fund is required to maintain asset coverage (that is, total assets including borrowings, less liabilities exclusive of borrowings) of at least 300% of the amount borrowed, with an exception it expects to limit its borrowings for investment purposes to 33 1/3% of the value of the Fund’s total assets (including the amount borrowed). The Convertible Plus Fund has entered into a line of credit agreement with Barclays Bank PLC, which permits the Convertible Plus Fund to borrow at a rate, per annum, equal to 1.15% plus the 3 month LIBOR rate to be paid quarterly. There is also an annual commitment fee. During the year ended October 31, 2021, the Convertible Plus Fund recorded $826,585 in interest expense on the line of credit. Average borrowings and the average interest rate during the year ended October 31, 2021, were $57,402,740 and 1.35%,
42
| Miller Funds |
| NOTES TO FINANCIAL STATEMENTS (Continued) |
| October 31, 2021 |
respectively. The largest outstanding amount borrowed during the period was $64,000,000. The balance on the line of credit as of October 31, 2021 was $55,000,000 and the amount of the commitment was $75,000,000. The interest rate as of October 31, 2021 was 1.29%. The line of credit is recorded at cost on the statement of assets and liabilities. As of October 31, 2021, fair value of the line of credit approximates cost; fair value of the line of credit is estimated using level 2 inputs in the fair value hierarchy.
| 6. | AGGREGATE UNREALIZED APPRECIATION AND DEPRECIATION – TAX BASIS |
The identified cost of investments in securities owned by each Fund for federal income tax purposes and its respective gross unrealized appreciation and depreciation at October 31, 2021 were as follows:
| Gross Unrealized | Gross Unrealized | Net Unrealized | ||||||||||||||
| Tax Cost | Appreciation | (Depreciation) | Appreciation | |||||||||||||
| Convertible Bond Fund | $ | 924,170,395 | $ | 78,343,461 | $ | (30,404,678 | ) | $ | 47,938,783 | |||||||
| Convertible Plus Fund | 167,179,879 | 11,329,481 | (5,735,560 | ) | 5,593,921 | |||||||||||
| Intermediate Bond Fund | 126,422,740 | 4,444,580 | (3,451,304 | ) | 993,276 | |||||||||||
| 7. | DISTRIBUTIONS TO SHAREHOLDERS AND TAX COMPONENTS OF CAPITAL |
The tax character of fund distributions for the following periods was as follows:
| For the year ended October 31, 2021: | ||||||||||||||||
| Ordinary | Long-Term | Return of | ||||||||||||||
| Income | Capital Gains | Capital | Total | |||||||||||||
| Convertible Bond Fund | $ | 45,885,245 | $ | 28,568 | $ | — | $ | 45,913,813 | ||||||||
| Convertible Plus Fund | 9,953,438 | — | — | 9,953,438 | ||||||||||||
| Intermediate Bond Fund | 5,066,335 | — | — | 5,066,335 | ||||||||||||
| For the year ended October 31, 2020: | ||||||||||||||||
| Ordinary | Long-Term | Return of | ||||||||||||||
| Income | Capital Gains | Capital | Total | |||||||||||||
| Convertible Bond Fund | $ | 20,530,363 | $ | — | $ | — | $ | 20,530,363 | ||||||||
| Convertible Plus Fund | 2,047,227 | — | — | 2,047,227 | ||||||||||||
| Intermediate Bond Fund | 3,441,879 | — | — | 3,441,879 | ||||||||||||
As of October 31, 2021, the components of accumulated earnings/(deficit) on a tax basis were as follows:
| Undistributed | Undistributed | Capital Loss | Other | Unrealized | Total | |||||||||||||||||||
| Ordinary | Long-Term | Carry | Book/Tax | Appreciation/ | Accumulated | |||||||||||||||||||
| Income | Capital Gains | Forwards | Differences | (Depreciation) | Earnings/ (Deficits) | |||||||||||||||||||
| Convertible Bond Fund | $ | 29,119,566 | $ | 12,751,200 | $ | — | $ | — | $ | 47,938,783 | $ | 89,809,549 | ||||||||||||
| Convertible Plus Fund | 7,727,112 | — | — | — | 5,593,921 | $ | 13,321,033 | |||||||||||||||||
| Intermediate Bond Fund | 3,877,764 | — | — | — | 993,276 | $ | 4,871,040 | |||||||||||||||||
The difference between book basis and tax basis distributable earnings and unrealized appreciation is primarily attributable to income on contingent convertible debt securities, 1256 option contracts, Section 305(c) deemed dividend distributions, and the tax deferral of losses on wash sales.
43
| Miller Funds |
| NOTES TO FINANCIAL STATEMENTS (Continued) |
| October 31, 2021 |
At October 31, 2021, the Funds utilized capital loss carry forwards for federal income tax purposes as follows:
| Short-Term | Long-Term | Total | Utilized | |||||||||||||
| Intermediate Bond Fund | $ | — | $ | — | $ | — | $ | 2,479,455 | ||||||||
Permanent book and tax differences, primarily attributable to tax adjustments for equalization debits resulted in reclassification for the year ended October 31, 2021 as follows:
| Paid | Total | |||||||
| In | Distributable | |||||||
| Capital | Earnings (Losses) | |||||||
| Convertible Bond Fund | $ | 3,503,547 | $ | (3,503,547 | ) | |||
| Convertible Plus Fund | 343,256 | (343,256 | ) | |||||
| Intermediate Bond Fund | 248,939 | (248,939 | ) | |||||
TAX INFORMATION
We are required to advise you of the federal tax status of certain distributions received by shareholders during the fiscal year. The Convertible Bond Fund hereby designates the following amounts for the Fund’s fiscal year ended October 31, 2021:
| Long-Term | ||||
| Capital Gains | ||||
| Convertible Bond Fund | $ | 3,532,115 | ||
Individual shareholders should refer to their Form 1099 or other tax information, which will be mailed in January 2022, to determine the calendar year amounts to be included on their 2021 tax returns. Shareholders should consult their tax advisors.
| 8. | CROSS TRADES |
Each Fund is permitted to purchase and sell securities (“cross-trade”) from and to other Funds within the Trust as well as certain other clients of the Adviser pursuant to “Cross-Trading” Procedures adopted by the Board. These procedures have been designed to ensure that any cross-trade of securities by the respective Funds from or to another Fund that is or could be considered an affiliate of the Funds under certain limited circumstances by virtue of having a common investment adviser, common Officer, or common Trustee complies with Rule 17a-7 under the 1940 Act. For the year ended October 31, 2021, the Convertible Bond Fund engaged in cross-trades. The cost of security purchases and the proceeds from the sale of securities for the year ended October 31, 2021, amounted to $1,095,819 and $1,769,332, respectively. The realized gain from cross-trades for the year ended October 31, 2021 was $38,642 for the Convertible Bond Fund. The Convertible Plus Fund and Intermediate Bond Fund did not engage in cross trades during the same period.
| 9. | NEW ACCOUNTING PRONOUNCEMENT |
In October 2020, the Securities and Exchange Commission (“SEC”) adopted new regulations governing the use of derivative by registered investment companies (“Rule 18f-4”). Rule 18f-4 will impose limits on the amount of derivatives a Fund can enter into, eliminate the asset segregation framework currently used by funds to comply with Section 18 of the 1940 Act, and require funds whose use of derivatives is greater than a limited specified amount to establish and maintain a comprehensive derivatives risk management program and appoint a derivatives risk manager. Funds will be required to comply with Rule 18f-4 by August 19, 2022. It is not currently clear what impact, if any, Rule 18f-4 will have on the availability, liquidity or performance of derivatives. Management is currently evaluating the potential impact of Rule 18f-4 on the Funds. When fully implemented, Rule 18f-4 may
44
| Miller Funds |
| NOTES TO FINANCIAL STATEMENTS (Continued) |
| October 31, 2021 |
require changes in how a Fund uses derivatives, adversely affect the Fund’s performance and increase costs related to the Fund’s use of derivatives.
| 10. | SUBSEQUENT EVENTS |
Subsequent events after the date of the Statements of Assets and Liabilities have been evaluated through the date the financial statements were issued. Management has determined that no events or transactions occurred requiring adjustment or disclosure in the financial statements.
45
 |
Deloitte
& Touche LLP
|
| REPORT OF INDEPENDENT REGISTERED PUBLIC ACCOUNTING FIRM | Tel:
714-436-7100 Fax: 714-436-7200 www.deloitte.com |
To the Board of Trustees of the Miller Investment Trust and Shareholders of the
Miller Convertible Bond Fund, Miller Convertible Plus Fund, and Miller Intermediate Bond Fund
Opinion on the Financial Statements and Financial Highlights
We have audited the accompanying statements of assets and liabilities of Miller Convertible Bond Fund, Miller Convertible Plus Fund, and Miller Intermediate Bond Fund (the “Funds”), including the schedules of investments, as of October 31, 2021, the related statements of operations for the year then ended, the related statement of cash flows for the year then ended for Miller Convertible Plus Fund, the statements of changes in net assets for each of the two years in the period then ended, the financial highlights for each of the four years in the period then ended, and the related notes.
In our opinion, the financial statements and financial highlights of each of the Funds present fairly, in all material respects, the financial position of the Funds as of October 31, 2021, and the results of their operations for the year then ended, the results of its cash flows for the year then ended for Miller Convertible Plus Fund, the changes in their net assets for each of the two years in the period then ended, and the financial highlights for each of the four years in the period then ended in conformity with accounting principles generally accepted in the United States of America. The financial highlights of the Funds for the year ended October 31, 2017 were audited by other auditors whose report, dated January 12, 2018, expressed an unqualified opinion on those statements.
Basis for Opinion
These financial statements and financial highlights are the responsibility of the Funds’ management. Our responsibility is to express an opinion on the Funds’ financial statements and financial highlights based on our audits. We are a public accounting firm registered with the Public Company Accounting Oversight Board (United States) (PCAOB) and are required to be independent with respect to the Funds in accordance with the U.S. federal securities laws and the applicable rules and regulations of the Securities and Exchange Commission and the PCAOB.
We conducted our audits in accordance with the standards of the PCAOB. Those standards require that we plan and perform the audit to obtain reasonable assurance about whether the financial statements and financial highlights are free of material misstatement, whether due to error or fraud. The Funds are not required to have, nor were we engaged to perform, an audit of their internal control over financial reporting. As part of our audits we are required to obtain an understanding of internal control over financial reporting but not for the purpose of expressing an opinion on the effectiveness of the Funds’ internal control over financial reporting. Accordingly, we express no such opinion.
Our audits included performing procedures to assess the risks of material misstatement of the financial statements and financial highlights, whether due to error or fraud, and performing procedures that respond to those risks. Such procedures included examining, on a test basis, evidence regarding the amounts and disclosures in the financial statements and financial highlights. Our audits also included evaluating the accounting principles used and significant estimates made by management, as well as evaluating the overall presentation of the financial statements and financial highlights. Our procedures included confirmation of securities owned as of October 31, 2021, by correspondence with the custodian and brokers; when replies were not received from brokers, we performed other auditing procedures. We believe that our audits provide a reasonable basis for our opinion.

Costa Mesa, California
December 21, 2021
We have served as the auditor of one or more Miller Funds investment companies since 2018.
46
| Miller Funds |
| DISCLOSURE OF FUND EXPENSES (Unaudited) |
| October 31, 2021 |
As a shareholder of the Funds you incur two types of costs: (1) transaction costs (such as front-end loads) and (2) ongoing costs, including advisory fees, distribution and/or service (12b-1 fees) fees and other Fund expenses. This example is intended to help you understand your ongoing costs (in dollars) of investing in the Funds and to compare these costs with the ongoing costs of investing in other mutual funds. Please note, the expenses shown in the tables are meant to highlight ongoing costs only and do not reflect any transactional costs.
This example is based on an investment of $1,000 invested for the period of time as indicated in the table below.
Actual Expenses : The first line of the table provides information about actual account values and actual expenses. You may use the information in this line, together with the amount you invested, to estimate the expenses that you paid over the period. Simply divide your account value by $1,000 (for example, an $8,600 account value divided by $1,000 = 8.6), then multiply the result by the number in the first line under the heading entitled “Expenses Paid During the Period” to estimate the expenses you paid on your account during the period.
Hypothetical Examples for Comparison Purposes: The second line of the table below provides information about hypothetical account values and hypothetical expenses based on the Funds’ actual expense ratios and an assumed rate of return of 5% per year before expenses, which is not the Funds’ actual return. The hypothetical account values and expenses may not be used to estimate the actual ending account balance or expenses you paid for the period. You may use this information to compare the ongoing costs of investing in the Funds and other funds. To do so, compare this 5% hypothetical example with the 5% hypothetical examples that appear in the shareholder reports of the other funds.
Please note that the expenses shown in the table are meant to highlight your ongoing costs only and do not reflect any transactional costs which may be applicable to your account. Therefore, the second line of the table is useful in comparing ongoing costs only, and will not help you determine the relative total costs of owning different funds. In addition, if these transactional costs were included, your costs would have been higher.
| Beginning | Annualized | Expenses Paid During the | ||||||
| Account | Ending Account | Expense | Period | |||||
| Value (5/1/21) | Value (10/31/21) | Ratio | (5/1/21 to 10/31/21) | |||||
| Actual * | ||||||||
| Miller Convertible Bond Fund | ||||||||
| Class A | $1,000.00 | $990.60 | 1.44% | $7.23 | ||||
| Class I | $1,000.00 | $993.00 | 0.94% | $4.72 | ||||
| Class C | $1,000.00 | $987.80 | 1.94% | $9.72 | ||||
| Miller Convertible Plus Fund | ||||||||
| Class I | $1,000.00 | $955.70 | 2.63% | $12.96 | ||||
| Miller Intermediate Bond Fund | ||||||||
| Class I | $1,000.00 | $991.50 | 0.95% | $4.77 | ||||
| Hypothetical (5% return before expenses) * | ||||||||
| Miller Convertible Bond Fund | ||||||||
| Class A | $1,000.00 | $1,017.95 | 1.44% | $7.32 | ||||
| Class I | $1,000.00 | $1,020.47 | 0.94% | $4.79 | ||||
| Class C | $1,000.00 | $1,015.43 | 1.94% | $9.86 | ||||
| Miller Convertible Plus Fund | ||||||||
| Class I | $1,000.00 | $1,011.95 | 2.63% | $13.34 | ||||
| Miller Intermediate Bond Fund | ||||||||
| Class I | $1,000.00 | $1,020.42 | 0.95% | $4.84 |
| * | Expenses are equal to the average account value over the period, multiplied by the Fund’s annualized expense ratio, multiplied by the number of days in the six month period ended October 31, 2021 (184) divided by the number of days in the fiscal year (365). |
47
Approval and Renewal of the Management Agreements and Review of 15(c) Materials
At an in person meeting held October 20, 2021, the Board of Trustees (the “Board”) including the Trustees who are not “interested persons”, as such term is defined under Section 2(a)(19) of the Investment Company Act of 1940, as amended (the “Independent Trustees”), considered the approval of the Management Agreement between the Miller Investment Trust and Wellesley Asset Management, Inc. (the “Adviser”) with respect to the Miller Market Neutral Income Fund (“Market Neutral Income Fund”) and renewal of the Management Agreements between the Miller Investment Trust and Adviser with respect to the Miller Convertible Bond Fund (“Convertible Bond Fund”), Miller Convertible Plus Fund (“Convertible Plus Fund”) and Miller Intermediate Bond Fund (“Intermediate Bond Fund”) (each a “Management Agreement” and collectively the “Management Agreements”). In its consideration of the approval or renewal of each Management Agreement, the Board including the Independent Trustees, did not identify any single factor as all-important or controlling, and the following summary does not detail all the matters considered.
The Board relied upon each Trustee’s own business judgment in determining the material factors to be considered when evaluating the Management Agreements and the weight to be given to each factor. The Board based its conclusions on a comprehensive evaluation of all the information provided and not on any one factor exclusively. Moreover, each Trustee may have afforded different weight to the various factors in reaching his conclusions with respect to the Management Agreements. Matters considered by the Board, including the Independent Trustees, in connection with its approval of each Management Agreement included the following:
Market Neutral Income Fund
Nature, Extent and Quality of Services and Personnel. The Board examined the nature, extent and quality of the services to be provided by the Adviser to the Market Neutral Income Fund. The Trustees noted a new portfolio manager and trading personnel will be added to Adviser’s management team and they will contribute to the overall advisory services to be provided to the Market Neutral Income Fund. The Board acknowledged that the Adviser currently provides a high level of service as Adviser to the existing Funds in the Trust. The Trustees discussed the Adviser’s personnel, and the continued high level of service provided by them. The Board discussed the financial strength of the Adviser and concluded the Adviser has the ability to provide a level of service consistent with the Board’s expectations.
Performance. The Board noted that the Market Neutral Income Fund was new and therefore did not have any prior performance to provide.
Fees & Expenses. The Trustees reviewed the proposed advisory fee to be paid by the Market Neutral Income Fund, including information about advisory fees paid by certain mutual funds in the Fund’s peer group. The Trustees further considered the fact that the Adviser manages separately managed accounts and with different costs associated with providing advisory services to such clients. The Trustees noted that the Market Neutral Income Fund’s proposed advisory fee rate of 0.75% was lower than the peer group average of 1.04%. The Trustees further noted that the Market Neutral Income Fund’s proposed net expense ratio rate of 1.06% was lower than the peer group average of 1.40%. The Trustees concluded that the proposed advisory fee and net expense ratio were within an acceptable range of fees for the Market Neutral Income Fund when compared to peer funds.
Profitability. The Board reviewed a profitability analysis provided by the Adviser and noted that the Adviser expects to realize a modest gain in connection with its relationship with the Market Neutral Income Fund during the first 12 months of operation. The Board concluded, after further discussion of the
48
profitability analysis provided, that excessive profitability from the Adviser’s relationship with the Market Neutral Income Fund is not an issue at this time.
Economies of Scale. The Board considered whether the Adviser would realize economies of scale during the initial period of the Market Neutral Income Fund Management Agreement. They noted that the proposed fee schedule does not currently provide breakpoints, but that the Adviser indicated it is amenable to the discussion of adding breakpoints as the Market Neutral Income Fund’s assets experience significant growth. The Board concluded that absence of breakpoints was acceptable at this time.
Conclusion. Having requested and received such information from the Adviser as the Board believed to be reasonably necessary to evaluate the terms of the Market Neutral Income Fund Management Agreement, the Board determined that approval of the Market Neutral Income Fund Management Agreement was in the best interests of the Market Neutral Income Fund and its future shareholders.
Convertible Bond Fund, Convertible Plus Fund and Intermediate Bond Fund (each a “Fund” and collectively, the “Funds”)
Nature, Extent and Quality of Services and Personnel. The Board examined the nature, extent and quality of the services provided by the Adviser to the Funds. The Trustees also engaged in discussions with the Adviser’s senior management responsible for the overall functioning of the advisory services provided to each Fund. The Board considered information regarding the Adviser’s efforts in the area of compliance and investment processes. The Trustees discussed the Adviser’s personnel, and the quality of service provided by them including managing the growth of Fund assets, which among other things requires specialized skill in sourcing sufficient suitable convertible bonds. The Board discussed the financial strength of the Adviser after reviewing financial information about it and concluded that it is satisfied that the Adviser continues to be in the position to deliver quality services to the Funds and their shareholders. The Board further concluded that the Adviser’s management team and the Adviser’s overall resources were adequate, and that the Adviser has personnel with investment management skills who are more than capable to perform its duties under each Agreement.
Performance. The Trustees reviewed the performance of the Funds. It was noted that certain strategies were also used when and with different costs associated with providing advisory services to separately managed account and private fund clients but that such accounts were managed in part with key differences in strategies because of the regulatory constraints of the 1940 Act and IRS tax rules imposed on registered investment companies.
Convertible Bond Fund. The Board noted that for the one, three, five, and ten-year periods ended August 31, 2021, the Convertible Bond Fund had returns of 8.29%, 8.33%, 7.50% and 7.94%, respectively, underperforming the peer group averages of 24.05%, 20.94%, 17.83% and 12.97% over the same periods. Similarly, the Fund underperformed the “Convertibles” Morningstar Category averages of 21.64%, 20.00%, 16.78% and 12.33% during the same periods. The Adviser attributed the Fund’s underperformance in this category in part to its focus on high quality attributes, and only buying convertible bonds in companies that are profitable and have high low levels of debt. In addition, the Fund has a high percentage of assets invested in convertible bonds as compared to other assets, generally causing it to underperform other convertible bonds funds that take greater risk by investing a greater percentage of their assets in common stocks during bull markets. The Board also considered that the Adviser’s goal is for the Fund’s total return to outperform its peer group over full market cycles. It was further noted that the Adviser
49
expects that the Fund will have strong performance relative to its peer group during bear markets. The Adviser noted that convertible bonds from companies with lower quality earnings have generally outperformed other in the current low interest rate environment over recent years.
Convertible Plus Fund. The Board noted that for the one, three, five and seven-year periods ended August 31, 2021, the Convertible Plus Fund had returns of 5.80%, 7.88%, 8.30% and 8.66%, respectively, underperforming the peer group average which returned 21.25%, 18.30%, 15.89% and 11.99% during the same periods. Similarly, the Fund underperformed the “Convertibles” Morningstar Category average of 21.64%, 20.00%, 16.78% and 11.36% during the same periods. The Board considered that the Adviser’s goal is for the Fund’s total return to out-perform its peer group over full market cycles. In addition, the Fund has a high percentage of assets invested in convertible bonds as compared to other assets, generally causing it to underperform other convertible bonds funds that take greater risk by investing a greater percentage of their assets in common stocks during bull markets. It was further noted that the Adviser expects that the Fund will have strong performance relative to its peer group during bear markets. The Board also noted that the Fund’s use of leverage is unique in the convertible bond mutual fund space, greatly limiting the number of pure peer funds.
Intermediate Bond Fund. The Board noted that for the one, three and five-year periods ended August 31, 2021, the Intermediate Bond Fund had returns of 9.68%, 7.06% and 5.91%, respectively, outperforming its peer group averages of 3.52%, 7.02% and 4.70% during the same periods. It was noted that the Intermediate Bond Fund outperformed the Morningstar Category average of 3.18% and 4.88% for the one and five-year periods; however, underperformed the Morningstar Category averages of 7.58% for the three-year period ended August 31, 2021. The Adviser attributed the outperformance to the intermediate bond funds that have a greater concentration of investment grade bonds than and convertible bonds that comprise over 70% of the Fund’s portfolio. It was noted that it is the goal of the Adviser for the Fund to outperform its benchmark and peer group over full market cycles.
With respect to each of the Funds, the Board found that the Adviser continues to not deviate from its strategy to achieve favorable risk-adjusted returns throughout the stages of market cycles. The Board concluded that each Fund’s performance was reasonable, especially in light of the longest bull market in modern American history.
Fees & Expenses. The Trustees reviewed the fees charged by the Funds, including reviewing the fees compared to the Funds’ respective peer groups and Morningstar Categories. The Trustees further considered the fact that the Adviser manages separately managed accounts and a private fund with similar investment strategies and with different costs associated with providing advisory services to such clients.
Convertible Bond Fund. The Trustees noted that the Convertible Bond Fund’s advisory fee rate of 0.75% was higher than the peer group average of 0.61% and slightly lower than the Morningstar Category average of 0.76%. The Trustees further noted that the Convertible Bond Fund’s net expense ratio rate of 1.00% was higher than the peer group average of 0.70% and lower than the Morningstar Category average of 1.16%. The Trustees concluded that the advisory fee and net expense ratio were within an acceptable range of fees for the Fund when compared to peer funds, especially in light of the fact that certain peer funds were considerably larger in terms of assets.
Convertible Plus Fund. The Trustees noted that the Convertible Plus Fund’s advisory fee rate of 1.33% was significantly higher than both the peer group average of 0.69% and Morningstar Category average of 0.76%.
50
The Trustees further noted that the Convertible Plus Fund’s net expense ratio rate of 2.97% was significantly higher than both the peer group average of 0.84% and Morningstar Category average of 1.16%. The Adviser asserted that managing the Convertible Plus Fund is likely significantly more complex and requires more resources than managing the funds in the peer group because of the Convertible Plus Fund’s leveraged strategy. The Trustees noted that the Convertible Plus Fund, unlike its peer funds, is the only fund in its peer group that is a leveraged convertible mutual fund and that the cost of leverage is a significant part of the net expense ratio. The Trustees further noted that the Fund’s net investment advisory fee was 0.95%. The Trustees concluded that the advisory fee and net expense ratio were acceptable because of the complexities associated with managing a leveraged mutual fund and noted the lack of true peer funds.
Intermediate Bond Fund. The Trustees noted that the Intermediate Bond Fund’s fee rate of 0.75% was higher than the peer group average of 0.42%. The Trustees further noted that the Intermediate Bond Fund’s net expense ratio rate of 1.00% was higher than both the peer group average of 0.57% and Morningstar Category average of 0.78%. The Trustees concluded that the advisory fee and net expense ratio were within an acceptable range of fees for the Fund when compared to peer funds, especially in light of the level and quality of services provided by the Adviser to the Fund and the fact that certain peer funds were considerably larger in terms of assets.
Economies of Scale. The Trustees considered whether the Adviser has realized or will realize economies of scale with respect to the management of the Funds. The Trustees stated that they will continue to review the Adviser’s projections for asset growth of each Fund over the next 12 months and discussed the expense limitation agreements currently in place. Furthermore, the Board concluded that the size of each Fund had not reached sufficient size to result in material economies of scale and thus fee breakpoints were not appropriate at this time.
Profitability. The Trustees considered the expenses of the Adviser associated with managing each Fund, and reviewed the profits realized by the Adviser with respect to each Fund and took into consideration other benefits to the Adviser. The Board found the profit earned by the Adviser with respect to each Fund to be acceptable and not unreasonable or excessive. Based on financial information provided by the Adviser, the Board also found that the Adviser was in a strong position to continue to provide the high level and quality of services that it currently provides to the Funds.
Conclusion. Having requested and received such information from the Adviser as the Board believed to be reasonably necessary to evaluate the terms of the Management Agreements, the Board, including all of the Independent Trustees, concluded that the advisory fee for each Fund is fair and reasonable and approved the continuance of the respective Management Agreements and the advisory fees thereunder as in the best interest of each Fund and its shareholders.
51
LIQUIDITY RISK MANAGEMENT PROGRAM (Unaudited)
The Board of Trustees (the “Board”) of the Trust, on behalf of the Funds, met on March 18, 2021 (the “Meeting”) to review the liquidity risk management program (the “Program”) established for the Funds. The Funds have adopted and implemented the Program as required by Rule 22e-4 (the “Liquidity Rule”) under the Investment Company Act of 1940. The Board appointed Wellesley Asset Management, Inc., the investment adviser to the Funds, the program administrator for the Funds’ Program. The Adviser has delegated oversight of the Program to the Liquidity Risk Management Program Committee (the “Committee”).
At the Meeting, the Board was provided with a report that addressed the operation of the Program and assessed its adequacy and effectiveness of implementation (the “Report”). The Report covered the period from December 1, 2019 through November 30, 2020 (the “Program Reporting Period”).
The Report stated that the Committee concluded that based on how it functions, the Program is operating as intended and is effective in implementing the requirements of the Liquidity Rule. The Report noted that during the Program Reporting Period, the Committee reviewed historical net redemption activity, and used this information and other factors as a component to establish each Fund’s reasonably anticipated trading size (“RATS”). The Report further provided that the Program is reasonably designed to assess and manage the Funds’ liquidity risk, taking into consideration, among other factors, each Fund’s investment strategy and the liquidity of its portfolio investments during normal and reasonably foreseeable stressed conditions; its short and long-term cash flow projections; and its cash holdings and access to other funding sources.
During the fiscal year ended October 31, 2021, the Committee reviewed the Funds’ investments and determined that the Funds held adequate levels of cash and highly liquid investments to meet shareholder redemption activities in accordance with applicable requirements. Accordingly, the Committee concluded that (i) the Funds’ liquidity risk management program is reasonably designed to prevent violations of the Liquidity Rule and (ii) the Funds’ liquidity risk management program has been effectively implemented. There were no material changes to the Program during the Program Reporting Period.
Tax information (Unaudited)
We are required to advise you of the federal tax status of certain distributions received by shareholders during the fiscal year. The Convertible Bond Fund hereby designates the following amounts for the Fund’s fiscal year ended October 31, 2021:
| Long-Term | ||||
| Capital Gains | ||||
| Convertible Bond Fund | $ | 3,532,115 | ||
Individual shareholders should refer to their Form 1099 or other tax information, which will be mailed in January 2022, to determine the calendar year amounts to be included on their 2021 tax returns. Shareholders should consult their tax advisors.
52
| Miller Funds | |
| TRUSTEES AND OFFICERS (Unaudited) | October 31, 2021 |
Following is a list of the Trustees and executive officers of the Trust (each, an “Officer”) and their principal occupation over the last five years. Each Trustee and Officer of the Trust serves in that capacity with respect to the Fund. Unless otherwise noted, the address of each Trustee and Officer is 20 William Street, Wellesley, MA 02481.
Independent Trustees
| Name,
Address and Year of Birth |
Position/
Term of Office* |
Principal
Occupation During the Past Five Years |
Number
of Portfolios in Fund Complex** Overseen by Trustee |
Other Directorships held by Trustee During the Past Five Years |
| Neal
Chorney 1948 |
Trustee Since 2007 | Retired. Vice President – Real Estate Investing & Property Management, Sunrise Financial LLC (2006 – December 31, 2018) (commercial and investment real estate lending). | 3 | None |
| Daniel
Mainzer 1963 |
Trustee Since 2007 | Partner, Flanigan, Cotillo & Mainzer, LLP, (2011 – Present). | 3 | None |
| Michael
Blank 1950 |
Trustee Since 2009 | Principal, Braintree Street Realty, LLC (1986-Present) President, Evanteal Properties, LLC (2012-Present); JNF-USA National Board (2012 – Present) | 3 | None |
53
| Miller Funds |
| TRUSTEES AND OFFICERS (Unaudited) (Continued) |
| October 31, 2021 |
Interested Trustee and Officers
| Name,
Address and Year of Birth |
Position/
Term of Office* |
Principal
Occupation During the Past Five Years |
Number
of Portfolios in Fund Complex ** Overseen by Trustee |
Other
Directorships held by Trustee During Past Five Years |
| Greg
Miller*** 1949 |
Trustee, President, Since 2007 | Chief Executive Officer Co-Portfolio Manager, Wellesley Asset Management, Inc. (1991 – Present) (registered investment advisory firm) Director, New England Investment Properties (September 2012 – December 2016) | 3 | None |
| Michael
Miller 1983 |
Secretary, Treasurer Since 2019 | President, Chief Investment Officer and Co-Portfolio Manager (October 2019 -Present) and Co-Portfolio Manager & Vice President, (March 2010 – October 2019), Wellesley Asset Management, Inc. (registered investment advisory firm). | 3 | N/A |
| Brian
Privor 1973 4221 North 203rd Street, Suite 100 Elkhorn, Nebraska 68022-3474 |
Chief Compliance Officer Since 2019 | President (October 2019 – Present), Chief Regulatory Officer (May 2018 – September 2019), Northern Lights Compliance Services, LLC, (provides CCO services to mutual funds), Senior Counsel, U.S. Senate, Judiciary Committee (2017 - 2018), Senior Counsel, Division of Enforcement, U.S. Securities and Exchange Commission (2010-2017). | N/A | N/A |
| * | The term of office for each Trustee and Officer listed above will continue indefinitely. |
| ** | The term “Fund Complex” refers to the Miller Investment Trust, which as of the date of this SAI, consisted of the Funds: the Miller Convertible Bond Fund, the Miller Convertible Plus Fund and the Miller Intermediate Bond Fund. |
| *** | Greg Miller is an “interested person” of the Trust as that term is defined under the 1940 Act, because of his affiliation with Wellesley Asset Management, Inc. (the Fund’s Advisor). |
The Trust’s Statement of Additional Information includes additional information about the Trustees and is available free of charge, upon request, by calling toll-free at 1-877-441-4434.
54
PRIVACY notice
| FACTS | WHAT DOES MILLER INVESTMENT TRUST DO WITH YOUR PERSONAL INFORMATION? | |||
| Why? | Financial companies choose how they share your personal information. Federal law gives consumers the right to limit some but not all sharing. Federal law also requires us to tell you how we collect, share, and protect your personal information. Please read this notice carefully to understand what we do. | |||
| What? | The types of personal information we collect and share depend on the product or service you have with us. This information can include: | |||
| ■ | Social Security number | ■ | Purchase History | |
| ■ | Assets | ■ | Account Balances | |
| ■ | Retirement Assets | ■ | Account Transactions | |
| ■ | Transaction History | ■ | Wire Transfer Instructions | |
| ■ | Checking Account Information | |||
| When you are no longer our customer, we continue to share your information as described in this notice. | ||||
| How? | All financial companies need to share customers’ personal information to run their everyday business. In the section below, we list the reasons financial companies can share their customers’ personal information; the reasons Miller Investment Trust chooses to share; and whether you can limit this sharing. | |||
| Reasons we can share your personal information | Does Miller Investment Trust share? |
Can you limit this sharing? |
For our everyday business purposes – such as to process your transactions, maintain your account(s), respond to court orders and legal investigations, or report to credit bureaus |
Yes | No |
For our marketing purposes – to offer our products and services to you |
No | We don’t share |
| For joint marketing with other financial companies | No | We don’t share |
For our affiliates’ everyday business purposes – information about your transactions and experiences |
No | We don’t share |
For our affiliates’ everyday business purposes – information about your creditworthiness |
No | We don’t share |
| For non-affiliates to market to you | No | We don’t share |
| Questions? | Call 1-877-441-4434 |
55
| Who we are | |||||
| Who is providing this notice? | Miller Investment Trust | ||||
| What we do | |||||
| How does Miller Investment Trust protect my personal information? | To protect your personal information from unauthorized access and use, we use security measures that comply with federal law. These measures include computer safeguards and secured files and buildings.
Our service providers are held accountable for adhering to strict policies and procedures to prevent any misuse of your nonpublic personal information. | ||||
| How does Miller Investment Trust collect my personal information? | We collect your personal information, for example, when you
■ Open an account
■ Provide account information
■ Give us your contact information
■ Make deposits or withdrawals from your account
■ Make a wire transfer
■ Tell us where to send the money
■ Tells us who receives the money
■ Show your government-issued ID
■ Show your driver’s license
We also collect your personal information from other companies. | ||||
| Why can’t I limit all sharing? | Federal law gives you the right to limit only
■ Sharing for affiliates’ everyday business purposes – information about your creditworthiness
■ Affiliates from using your information to market to you
■ Sharing for non-affiliates to market to you
State laws and individual companies may give you additional rights to limit sharing. | ||||
| Definitions | |||||
| Affiliates | Companies related by common ownership or control. They can be financial and nonfinancial companies.
■ Miller Investment Trust does not share with our affiliates. | ||||
| Non-affiliates | Companies not related by common ownership or control. They can be financial and nonfinancial companies
■ Miller Investment Trust does not share with non-affiliates so they can market you. | ||||
| Joint marketing | A formal agreement between nonaffiliated financial companies that together market financial products or services to you.
■ Miller Investment Trust does not jointly market. | ||||
56
MILLER FUNDS
| Advisor | Wellesley Asset Management, Inc. | |
| The Wellesley Office Park | ||
| 20 William Street, Suite 310 | ||
| Wellesley, MA 02481 | ||
| Distributor | Northern Lights Distributors, LLC | |
| 4221 North 203rd Street, Suite 100 | ||
| Elkhorn, NE 68022 | ||
| Legal Counsel | Thompson Hine LLP | |
| 1919 M Street, N.W. – Suite 700 | ||
| Washington, DC 20036 | ||
| Transfer Agent | Ultimus Fund Solutions, LLC | |
| 225 Pictoria Drive, Suite 450 | ||
| Cincinnati, OH 45246 | ||
| Custodian | Bank of New York Mellon Corp. | |
| 101 Barclay Street | ||
| New York, NY 10286 |
How to Obtain Proxy Voting Information
Information regarding how the Funds voted proxies relating to portfolio securities during the most recent 12-month period ending June 30th, as well as a description of the policies and procedures that the Funds use to determine how to vote proxies is available without charge, upon request, by calling toll-free 877-441-4434 or by referring to the Security and Exchange Commission’s (“SEC”) website at http://www.sec.gov.
How to Obtain 1st and 3rd Fiscal Quarter Portfolio Holdings
The Funds file their complete schedule of portfolio holdings with the SEC for the first and third quarters of each fiscal year as an exhibit to its reports on Form N-PORT, within sixty days after the end of the period. Form N-PORT reports are available on the SEC’s website at http://www.sec.gov. The information on Form N-PORT is available without charge, upon request, by calling 877-441-4434.
Miller Funds ● 225 Pictoria Drive ● Suite 450 ● Cincinnati,
OH 45246
877-441-4434
MILLER-AR21
(b) Not applicable.
Item 2. Code of Ethics.
As of the end of the period covered by this report, the registrant has adopted a code of ethics that applies to the registrant's principal executive officer, principal financial officer, principal accounting officer or controller, or persons performing similar functions, regardless of whether these individuals are employed by the registrant or a third party.
Item 3. Audit Committee Financial Expert.
The Board has determined, based on questionnaires completed by the Audit Committee members, that no one on the committee satisfies the definition of "financial expert;" however the Board also determined that collectively the Audit Committee members have the requisite knowledge and experience to perform the Audit Committee duties.
Item 4. Principal Accountant Fees and Services.
| (a) | Audit Fees |
FY 2021 $114,750
FY 2020 $111,390
| (b) | Audit-Related Fees |
FY 2021 $ None
FY 2020 $ None
Tax Fees
| (c) |
FY 2021 $ 16,970
FY 2020 $ 16,475
(d) All Other Fees
FY 2021 $ 0
FY 2020 $ 0
The above "Audit-Related Fees" represent fees billed for assurance and related services that are reasonably related to the performance of the registrant audit or the review of the registrant's financial statements and that are not reported under Audit Fees.
The above “Tax Fees” were billed for professional services rendered for tax compliance and tax return preparation.
| (e) | (1) Audit Committee’s Pre-Approval Policies |
The registrant’s Audit Committee is required to pre-approve all audit services and, when appropriate, any non-audit services (including audit-related, tax and all other services) to the registrant. The registrant’s Audit Committee is also required to pre-approve, when appropriate, any non-audit services (including audit-related, tax and all other services) to its adviser, or any entity controlling, controlled by or under common control with the adviser that provides ongoing services to the registrant to the extent that the services are determined to have a direct impact on the operations or financial reporting of the registrant. Services are reviewed on an engagement by engagement basis by the audit committee.
| (2) | Percentages of 2021 Services Approved by the Audit Committee |
| Registrant | Adviser | |||||||
| Audit-Related Fees: | 0 | % | 0 | % | ||||
| Tax Fees: | 0 | % | 0 | % | ||||
| All Other Fees: | 0 | % | 0 | % | ||||
(f) During audit of registrant's financial statements for the most recent fiscal year, less than 50 percent of the hours expended on the principal accountant's engagement were attributed to work performed by persons other than the principal accountant's full-time, permanent employees.
(g) The aggregate non-audit fees billed by the registrant's accountant for services rendered to the registrant, and rendered to the registrant's investment adviser (not including any sub-adviser whose role is primarily portfolio management and is subcontracted with or overseen by another investment adviser), and any entity controlling, controlled by, or under common control with the adviser that provides ongoing services to the registrant:
| Registrant | Adviser | |||||||||
| FY 2021 | $ None | $ None | ||||||||
| FY 2020 | $ None | $ None |
(h) Not applicable. All non-audit services to the registrant were pre-approved by the Audit Committee for FY 2019.
(i) Not applicable.
(j) Not applicable.
Item 5. Audit Committee of Listed Companies. Not applicable.
Item 6. (a) Schedule of Investments. Schedule of investments in securities of unaffiliated issuers is included under Item 1.
(b) Not Applicable
Item 7. Disclosure of Proxy Voting Policies and Procedures for Closed-End Management Investment Companies. Not applicable.
Item 8. Portfolio Managers of Closed-End Management Investment Companies. Not applicable.
Item 9. Purchases of Equity Securities by Closed-End Management Investment Companies. Not applicable.
Item 10. Submission of Matters to a Vote of Security Holders. There were no material changes to the procedures by which shareholders may recommend nominees to the registrant's Board of Trustees.
Item 11. Controls and Procedures.
(a) The President and Treasurer has concluded that the registrant's disclosure controls and procedures (as defined in Rule 30a-3(c) under the Investment Company Act of 1940) provide reasonable assurances that material information relating to the registrant is made known to them by the appropriate persons, based on their evaluation of these controls and procedures as of a date within 90 days of the filing date of this report.
(b) There were no significant changes in the Registrant’s internal control over financial reporting that occurred during the period covered by this report that have materially affected, or are reasonably likely to materially affect, the Registrant’s internal control over financial reporting.
Item 12. Disclosure of Securities Lending Activities for Closed-End Management Investment Companies. Not applicable.
Item 13. Exhibits.
(a)(1) Sarbanes Oxley Code of Ethics filed herewith.
(a)(3) Not applicable for open-end investment companies.
SIGNATURES
Pursuant to the requirements of the Securities Exchange Act of 1934 and the Investment Company Act of 1940, the registrant has duly caused this report to be signed on its behalf by the undersigned, thereunto duly authorized.
(Registrant) Miller Investment Trust
By (Signature and Title)
/s/ Greg Miller
Greg Miller, President
Date 10/6/22
Pursuant to the requirements of the Securities Exchange Act of 1934 and the Investment Company Act of 1940, this report has been signed below by the following person on behalf of the registrant and in the capacities and on the dates indicated.
By (Signature and Title)
/s/Greg Miller
Greg Miller, President
Date 10/6/22
By (Signature and Title)
/s/Michael Miller
Michael Miller, Treasurer
Date 10/6/22
ATTACHMENTS / EXHIBITS
Serious News for Serious Traders! Try StreetInsider.com Premium Free!
You May Also Be Interested In
- NovaBay Pharmaceuticals Receives a NYSE American Notice Regarding Stockholder Equity
- Port Houston Regular Commission Meeting
- Three From Lyons & Simmons Selected Among Best Lawyers in Dallas
Create E-mail Alert Related Categories
SEC FilingsSign up for StreetInsider Free!
Receive full access to all new and archived articles, unlimited portfolio tracking, e-mail alerts, custom newswires and RSS feeds - and more!
