

Form N-CSR/A ETF Series Solutions For: Feb 28
 Tweet
Tweet Share
ShareAs filed with the U.S. Securities and Exchange Commission on May 26, 2022
UNITED STATES
SECURITIES AND EXCHANGE COMMISSION
Washington, D.C. 20549
FORM N-CSR
CERTIFIED SHAREHOLDER REPORT OF REGISTERED
MANAGEMENT INVESTMENT COMPANIES
Investment Company Act file number 811-22668
ETF Series Solutions
(Exact name of registrant as specified in charter)
615 East Michigan Street
Milwaukee, WI 53202
(Address of principal executive offices) (Zip code)
Kristina R. Nelson
ETF Series Solutions
615 East Michigan Street
Milwaukee, WI 53202
(Name and address of agent for service)
(414) 765-6076
Registrant's telephone number, including area code
Date of fiscal year end: February 28
Date of reporting period: February 28, 2022
Item 1. Reports to Stockholders.
(a)

Hoya Capital Housing ETF
Ticker: HOMZ
Hoya Capital High Dividend Yield ETF
Ticker: RIET
Annual Report
February 28, 2022
Hoya Capital ETFs
TABLE OF CONTENTS
Page |
|
Letter to Shareholders |
1 |
Performance Summary |
8 |
Portfolio Allocations |
10 |
Schedules of Investments |
16 |
Statements of Assets and Liabilities |
20 |
Statements of Operations |
21 |
Statements of Changes in Net Assets |
22 |
Financial Highlights |
24 |
Notes to Financial Statements |
26 |
Report of Independent Registered Public Accounting Firm |
36 |
Trustees and Officers |
38 |
Expense Examples |
41 |
Review of Liquidity Risk Management Program |
43 |
Approval of Advisory Agreement & Board Consideration |
44 |
Federal Tax Information |
50 |
Information About Portfolio Holdings |
50 |
Information About Proxy Voting |
51 |
Frequency Distribution of Premiums and Discounts |
51 |
Hoya Capital ETFs
Letter to Shareholders
(Unaudited)
Dear Shareholders,
On behalf of the entire Hoya Capital Real Estate team, we want to express our gratitude for the confidence you have placed in the Hoya Capital Housing ETF (“HOMZ” or the “Fund”). The following information pertains to the period from March 1, 2021 through February 28, 2022 (the “current fiscal period”).
HOMZ offers diversified exposure across the U.S. housing sector, one of the largest and most critical asset classes in the world. The Fund seeks to track the total return performance, before fees and expenses, of the Hoya Capital Housing 100TM Index (the “Index”). The Index is a rules-based index designed to track the 100 companies that collectively represent the performance of the U.S. Housing Industry including homebuilders, residential real estate investment trusts (“REITs”), home improvement companies, and real estate services and technology firms.
During this current fiscal period, the market value and net asset value (“NAV”) for HOMZ generated a cumulative total return of 14.16% and 14.60%, respectively, compared to a return of 7.98% on the S&P MidCap 400® Index and 16.39% on the S&P 500® Index. The Hoya Capital Housing 100TM Index increased 15.24% during the current fiscal period. Meanwhile, outstanding shares ended the current fiscal period at 1,600,000.
The U.S. Housing Industry emerged as a leader of the early post-pandemic economic recovery during the current fiscal period as key housing market indicators exhibited a sharp rebound in the back-half of 2020 and throughout 2021 following a slowdown at the outset of the coronavirus pandemic. During this period of significant uncertainty, consumers exhibited a propensity to prioritize housing-related investments and has reinforced the belief among many Americans that “there’s no place like home.”
During the current fiscal period, the Residential Real Estate Investment Trusts (“REITs”) and the Home Improvement Retailers sectors were the leading contributor to the Fund’s performance. For Residential REITs, demand for both apartments1 and single-family rental homes2 hit the highest level on record in 2021, resulting in the strongest pace of national rent growth and the lowest-level of vacancy rates on record. Rents rose in all 50 of the nation’s largest markets with the fastest annual rent growth observed across the Sunbelt.3
Meanwhile, the Home Improvement Retailers sector benefited from pandemic driven home-centric behavioral changes in which consumers – particularly those with work-from-home and remote-study arrangements - invested heavily in home improvement. Strong growth in personal incomes also drove accelerated spending on previously-deferred home repair and remodeling activity, a trend that we expect to continue given the aging of the American housing stock, a byproduct of low levels of new home construction activity in the 2010s.
1
Hoya Capital ETFs
Letter to Shareholders
(Unaudited) (Continued)
Leading detractors during the current fiscal period were the Real Estate Technology, Brokerage & Services and Home Furnishings & Home Goods sectors. For the Real Estate Technology, Brokerage & Services sector - which was among the leading contributors to performance in the prior annual period - performance was negatively impacted by multiple compression across many technology-related equities during the period and by company-specific operational challenges. Notably, Zillow closed its Zillow Offer home-buying business - citing operational challenges and high capital intensity of the iBuying strategy – and noted that it intends to focus on its core property technology business.
For the Home Furnishings & Home Goods sector, performance was negatively impacted by global supply chain disruptions resulting from the lingering effects of the coronavirus pandemic. Furniture, major appliances, mattresses, and cabinetry were among the products facing the most severe shortages, higher prices, and delivery delays, which prompted some consumers to defer these purchases. Despite these shortages and operational challenges, retail spending at Furniture and Home Furnishings Stores still rose 26.9% in 20214 – the highest on record.
More broadly, the current fiscal period saw a notable intensification of the housing shortage in the United States. Existing Home Sales data in February 2022 – the final month of the current fiscal period – showed that supply levels of homes for sale remained near historic lows with inventory down 15.5% from the prior year. Properties were on the market for just 18 days in February, on average, and 84% percent of homes sold were on the market for less than a month.5
Amid this intensifying housing shortage, demographic trends over the next decade are highly supportive of significant growth in housing demand, which we believe will necessitate significantly higher levels of new home construction activity. Additionally, we believe that home-centric behavioral changes resulting from the pandemic – and the increased value and attention that consumers dedicate towards their homes – will exhibit a high degree of persistence, resulting in higher sustained levels of investments on home improvement and physical space upgrades.
We continue to see a compelling long-term investment case for HOMZ over the next decade and beyond as the combination of historically low housing supply, the continued aging of the U.S. housing stock, and strong secular demand provide a favorable long-term macroeconomic backdrop for companies across the U.S. housing industry – tailwinds that will be enhanced by advancements in property technology which will significantly improve the efficiency, productivity, and margins of the housing industry at large.
2
Hoya Capital ETFs
Letter to Shareholders
(Unaudited) (Continued)
Further, HOMZ is the lowest-cost ETF out of five funds in its ETF Database (“ETFdb”) segment as of the end of the period,6 and given the ever-present uncertainty, we believe that capturing balanced and diversified exposure across the entire housing sector – homebuilders, rental operators, home improvement, and housing technology firms - is optimized to efficiently capture these thematic growth trends.
Thank you once again and we look forward to keeping you well informed.
Sincerely,
Alex Pettee, CFA
President & Director of Research and ETFs
Hoya Capital Real Estate, Adviser to the Fund
Must be preceded or accompanied by a prospectus.
Investing involves risks. Principal loss is possible. The Fund is not actively managed. The Fund’s investments will be concentrated in housing and real estate-related industries. Investments in real estate companies and the construction and housing industry involve unique risks. Real estate companies, including REITs, may have limited financial resources, may trade less frequently and in limited volume, and may be more volatile than other securities. Many factors may affect real estate values, including the availability of mortgages and changes in interest rates. Real estate companies are also subject to heavy cash flow dependency, defaults by borrowers, and self-liquidation. The construction and housing industry can be significantly affected by the real estate markets. Compared to large cap companies, small and mid- capitalizations companies may be less stable, and their securities may be more volatile and less liquid. As with all ETFs, Shares may be bought and sold in the secondary market at market prices and are not individually redeemed from the Fund. Brokerage commissions will reduce returns. Although it is expected that the market price of Shares will approximate the Fund’s NAV, there may be times when the market price of Shares is more than the NAV intra-day (premium) or less than the NAV intra-day (discount) due to supply and demand of Shares or during periods of market volatility.
Short term performance, in particular, is not a good indication of the Fund’s future performance, and an investment should not be made based solely on returns.
The S&P 500® Index is a broad-based unmanaged index of 500 stocks, which is widely recognized as representative of the equity market in general. You cannot invest directly in an index.
The S&P Mid-Cap 400® Index, also known as the S&P 400 Index, is a broad-based unmanaged index of approximately 400 mid-capitalization stocks which is widely recognized as representative of the mid-cap segment of the U.S. equity market.
1 RealPage Analytics. “Apartment Demand Hit A Record in 2021.” January 10, 2022. https://www.realpage.comThen/analytics/apartment-demand-hits-a-record-in-2021/
2 CoreLogic Intelligence. “Single-Family Annual Rent Growth Finishes 2021 at New Record.” February 15, 2022. https://www.realpage.com/analytics/apartment-demand-hits-a-record-in-2021/
3 Zillow Research. “December 2021 Market Report.” January 20, 2022. https://www.zillow.com/research/december-2021-market-report-30530/
4 US Census Bureau, Advanced Retail Sales: Furniture & Home Furnishing Stores. March 16, 2022. https://fred.stlouisfed.org/series/RSFHFS
3
Hoya Capital ETFs
Letter to Shareholders
(Unaudited) (Continued)
5 Existing Home Inventory: National Association of Realtors, Existing Home Sales, February 2022 (Release Date: March 19, 2022). Inventory indicates the number of properties marked as active on the market. When a seller lists a property, it becomes counted as inventory. Inventory is calculated monthly by taking a count of the number of active listings on the last day of the month.
6 Lowest expense ratio out of 5 US-registered ETFs in the ETFdb Homebuilders ETF Segment as of 2/28/2022. Expense ratio data for other ETFs were obtained from the funds’ prospectuses, data pulled as of 2/28/2022. ETFs in the same ETFdb segment may track different indexes, have differences in holdings, and show different performance.
Past performance does not guarantee future results.
The Hoya Capital Housing 100TM Index is a rules-based index composed of the 100 companies that collectively represent the performance of the US Housing Industry. The index is designed to track total annual spending on housing and housing-related services across the United States. The Index is divided into four US Housing Industry Business Segments, weighted based on their relative contribution to GDP: 1) Home Ownership and Rental Operators; 2) Home Building and Construction; 3) Home Improvement and Furnishings; 4) Home Financing, Technology & Services.
Diversification does not assure a profit or protect against loss in a declining market.
Hoya Capital Real Estate, LLC is the advisor to HOMZ, which is distributed by Quasar Distributors, LLC.
Opinions expressed are subject to change at any time, are not guaranteed and should not be considered investment advice.
Fund holdings and sector allocations are subject to change and are not recommendations to buy or sell any security. Please refer to the Schedule of Investments in the report for a complete list of fund holdings.
4
Hoya Capital ETFs
Letter to Shareholders
(Unaudited) (Continued)
Dear Shareholders,
On behalf of the entire Hoya Capital Real Estate team, we want to express our gratitude for the confidence you have placed in the Hoya Capital High Dividend Yield ETF (“RIET” or the “Fund”). The following information pertains to the period from September 21, 2021 through February 28, 2022 (the “current fiscal period”).
RIET offers diversified exposure to select high-dividend yielding securities across the U.S. real estate sector. The Fund seeks to track the performance, before fees and expenses, of the Hoya Capital High Dividend Yield Index (“the Index”), a rules-based index that is designed to provide diversified exposure to 100 U.S. exchange-listed common and preferred securities that collectively provide income through high dividend yields.
The multi-factor selection process incorporates a quality screen to identify companies with lower leverage profiles and begins with the selection of “Dividend Champions.” Securities are then selected based principally on dividend yield across 14 property sectors and 3 market capitalization tiers. Real estate securities include exchange-listed common stocks, exchange-listed preferred stocks and other exchange-listed equity securities issued by U.S. real estate companies, including real estate investment trusts (“REITs”) and similar REIT-like entities.
During this current fiscal period, the market value and net asset value (“NAV”) for RIET generated a cumulative total return of -1.24% and -1.35%, respectively, compared to a return of -2.89% on the Dow Jones U.S. Real Estate Index (the “Benchmark”). The Hoya Capital High Dividend Yield Index (the “Index”) returned -2.28% during the current fiscal period. Meanwhile, outstanding shares ended the current fiscal period at 1,530,000.
During the current fiscal period, the Small-Cap REIT and Dividend Champion categories were the leading upside contributors to the fund’s performance. The Small-Cap REIT category benefited from merger and acquisitions (“M&A”) activity - which was a major theme across the U.S. real estate sector during the period - with Blackstone announcing acquisitions of two fund holdings during the period - Preferred Apartment Communities and Bluerock Residential Growth. Based on our research, there were 20 major M&A deals involving U.S. publicly-traded REITs during the fiscal period, one of the most active periods of REIT M&A in history.
The Dividend Champions category benefited from strong earnings growth and a historic wave of dividend increases across the U.S. real estate sector with more than half of all U.S. REITs raising their dividend rates in 2021, including six of the ten Dividend Champions in RIET. REIT earnings, measured by funds from operations (“FFO”) for all equity REITs, rose 24.6% from 2020 to 2021, according to NAREIT, which exceeded its pre-pandemic level. Total dividend distributions lagged FFO growth during the period, resulting in dividend payout ratios that are significantly below their historic average.1
5
Hoya Capital ETFs
Letter to Shareholders
(Unaudited) (Continued)
The leading detractors during the current fiscal period were Mid-Cap REITs and Large-Cap REITs. For Mid-Cap REITs, the rise in long-term interest rates and inflation expectations during the period resulted in underperformance among companies in the more “rate-sensitive” property sectors including Net Lease, Specialty, and Healthcare. These property sectors tend to utilize longer lease terms compared with other property sectors and thus, typically have a more limited ability to raise rents on individual leases to keep pace with inflation on a year-by-year basis. The underperformance from these property sectors was partially offset by stronger performance from companies in more “pro-cyclical” property sectors including office, retail, and commercial financing which tend to demonstrate a higher degree of inflation protection.
The Large-Cap REIT category, meanwhile, was negatively impacted by similar themes related to rising interest rates as the Mid-Cap REIT category, as well as underperformance from the companies in the Home Financing property sector resulting from elevated levels of interest rate volatility amid uncertainty over Federal Reserve monetary policy, geopolitical concerns, and the coronavirus global pandemic.
More broadly, a rotation from “growth-to-value” across the U.S. real estate sector in the period led to outperformance from more value-oriented property sectors and underperformance from several of the more growth-focused property sectors including technology and infrastructure, which also explained some of the Fund’s outperformance relative to the Benchmark during the period.
We continue to see a compelling long-term investment case for RIET, particularly for investors seeking diversified exposure to real, income-producing assets in the United States which provide the potential for reliable monthly income and inflation-hedging in an otherwise uncertain macroeconomic and geopolitical environment.
Further, the diligently researched rules-driven selection process of the Index reflects an “income-first” objective and is grounded in the core principals of balanced diversification and limited single-stock risk, which we believe provides both innovative and optimized exposure to high income-producing securities in a simple, accessible, and cost-effective package.
Thank you once again and we look forward to keeping you well informed.
Sincerely,
Alex Pettee, CFA
President & Director of Research and ETFs
Hoya Capital Real Estate, Adviser to the Fund
6
Hoya Capital ETFs
Letter to Shareholders
(Unaudited) (Continued)
Must be preceded or accompanied by a prospectus.
Investing involves risks. Principal loss is possible. The fund is passively managed and attempts to mirror the composition and performance of the Hoya Capital High Dividend Yield Index. The Fund’s returns may not match due to expenses incurred by the Fund or lack of precise correlation with the index and may at times not hold or be fully invested in the same securities as the index. The Fund’s investments will be concentrated in real estate-related industries. Investments in real estate companies involve unique risks. Real estate companies, including REITs, may have limited financial resources, may trade less frequently and in limited volume, and may be more volatile than other securities. Many factors may affect real estate values, including the availability of mortgages and changes in interest rates. Real estate companies are also subject to heavy cash flow dependency, defaults by borrowers, and self-liquidation. Preferred stocks may decline in price, fail to pay dividends, or be illiquid. Compared to large cap companies, small and mid-capitalizations companies may be less stable and their securities may be more volatile and less liquid. The Fund is new with no track record to evaluate. The fund seeks to maintain relatively consistent monthly distributions; however, because the amount of income earned by the Fund varies from month-to-month, the Fund’s distributions may be more or less than the actual amount of income earned in that period and may include income, return of capital, and capital gains. Distributions for funds investing in real estate investment trusts (REITs) may later be characterized as capital gains and/or a return of capital, depending on the character of the dividends reported to each fund after year-end by REITs held by a fund. The final tax treatment of these distributions will be reported to shareholders after the close of each fiscal year on form 1099-DIV.
Short term performance, in particular, is not a good indication of the Fund’s future performance, and an investment should not be made based solely on returns.
The Dow Jones U.S. Real Estate Index is designed to track the performance of real estate investment trusts (REIT) and other companies that invest directly or indirectly in real estate through development, management, or ownership, including property agencies.
1 NAREIT’s REIT Industry Update, March 4, 2022. Funds from operations (FFO) refers to the figure used by real estate investment trusts (REITs) to define the cash flow from their operations. Real estate companies use FFO as a measurement of operating performance.
Past performance does not guarantee future results.
The Hoya Capital High Dividend Yield Index seeks to provide diversified exposure to 100 of the highest dividend yielding real estate securities in the United States, utilizing a rules-based methodology to select U.S. exchange-listed real estate securities that collectively provide income through high dividend yields. Securities are selected to the Index through a multi-factor, tier-weighted process that selects components based principally on dividend yield, subject to diversification requirements across property sectors and market capitalizations, and subject to minimum liquidity requirements. Real estate securities include exchange-listed common stocks, exchange-listed preferred stocks and other exchange-listed equity securities issued by U.S. real estate companies, including real estate investment trusts (REITs) and similar REIT-like entities.
Diversification does not assure a profit or protect against loss in a declining market.
Hoya Capital Real Estate, LLC is the advisor to RIET which is distributed by Quasar Distributors, LLC.
Opinions expressed are subject to change at any time, are not guaranteed and should not be considered investment advice.
Fund holdings and sector allocations are subject to change and are not recommendations to buy or sell any security. Please refer to the Schedule of Investments in the report for a complete list of fund holdings.
7
Hoya Capital Housing ETF
Performance Summary
(Unaudited)
Growth of $10,000

Average Annual Returns |
1 Year |
Since |
Hoya Capital Housing ETF - NAV |
14.60% |
19.51% |
Hoya Capital Housing ETF - Market |
14.16% |
19.48% |
Hoya Capital Housing 100TM Index |
15.24% |
20.09% |
S&P 500® Index |
16.39% |
17.87% |
This chart illustrates the performance of a hypothetical $10,000 investment made on March 19, 2019 and is not intended to imply any future performance. The returns shown do not reflect the deduction of taxes that a shareholder would pay on Fund distributions or the redemption of Fund shares. The chart assumes reinvestment of capital gains and dividends.
The performance data quoted represents past performance. Past performance does not guarantee future results. Returns for periods of less than one year are not annualized. The investment return and principal value of an investment will fluctuate so that an investor’s shares, when sold or redeemed, may be worth more or less than their original cost and current performance may be lower or higher than the performance quoted. For performance current to most recent month end, please visit www.thehousingetf.com. Gross expense ratio as of the summary prospectus 06/30/21 was 0.30%.
8
Hoya Capital High Dividend Yield ETF
Performance Summary
(Unaudited)
Growth of $10,000
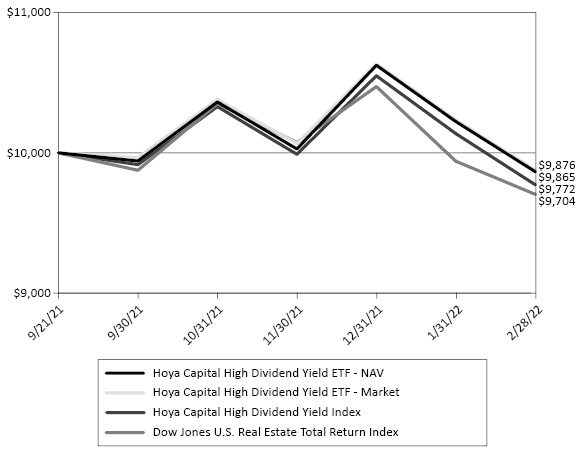
Cumulative Returns |
Since |
Hoya Capital High Dividend Yield ETF - NAV |
-1.35% |
Hoya Capital High Dividend Yield ETF - Market |
-1.24% |
Hoya Capital High Dividend Yield Index |
-2.28% |
Dow Jones U.S. Real Estate Total Return Index |
-2.89% |
This chart illustrates the performance of a hypothetical $10,000 investment made on September 21, 2021 and is not intended to imply any future performance. The returns shown do not reflect the deduction of taxes that a shareholder would pay on Fund distributions or the redemption of Fund shares. The chart assumes reinvestment of capital gains and dividends.
The performance data quoted represents past performance. Past performance does not guarantee future results. Returns for periods of less than one year are not annualized. The investment return and principal value of an investment will fluctuate so that an investor’s shares, when sold or redeemed, may be worth more or less than their original cost and current performance may be lower or higher than the performance quoted. For performance current to most recent month end, please visit www.TheIncomeETF.com/RIET. Gross expense ratio as of the summary prospectus 09/21/21 was 0.50%.
9
Hoya Capital ETFs
Portfolio Allocations
As of February 28, 2022 (Unaudited)
Hoya Capital Housing ETF |
|
Sector |
Percent of |
Residential REITs & Real Estate Operators (a) |
32.4% |
Home Building Products & Materials |
14.6 |
Homebuilders |
14.3 |
Home Furnishings & Home Goods |
12.4 |
Mortgage Lenders & Servicers |
10.6 |
Property, Title & Mortgage Insurance |
6.0 |
Home Improvement Retailers |
5.5 |
Real Estate Technology, Brokerage & Services |
3.5 |
Short-Term Investments |
0.6 |
Other Assets in Excess of Liabilities |
0.1 |
Total |
100.0% |
Hoya Capital High Dividend Yield ETF |
|
Sector |
Percent of |
Small-Cap REITs (b) |
30.0% |
Mid-Cap REITs (b) |
29.4 |
Large-Cap REITs |
15.0 |
Dividend Champions |
14.5 |
Preferred Stocks |
10.0 |
Short-Term Investments |
1.0 |
Other Assets in Excess of Liabilities |
0.1 |
Total |
100.0% |
(a) |
The Index, and consequently the Fund, is expected to concentrate its investments in the U.S. residential housing industry. The value of the Fund’s shares may rise and fall more than the value of shares of a fund that invests in securities of companies in a broader range of industries. See Note 7 in Notes to Financial Statements. |
(b) |
The Index, and consequently the Fund, is expected to concentrate its investments in real estate-related industries. The value of the Fund’s shares may rise and fall more than the value of shares of a fund that invests in securities of companies in a broader range of industries. See Note 7 in Notes to Financial Statements. |
10
Hoya Capital Housing ETF
Schedule of Investments
February 28, 2022
Shares |
Security Description |
Value |
||||||
COMMON STOCKS — 99.3% |
||||||||
Home Building Products & Materials — 14.6% |
||||||||
| 6,364 | A.O. Smith Corporation |
$ | 436,443 | |||||
| 4,615 | Armstrong World Industries, Inc. |
407,966 | ||||||
| 9,495 | Beacon Roofing Supply, Inc. (a) |
566,757 | ||||||
| 7,157 | Builders FirstSource, Inc. (a) |
532,624 | ||||||
| 9,561 | Carrier Global Corporation |
429,098 | ||||||
| 1,704 | Cavco Industries, Inc. (a) |
464,561 | ||||||
| 3,198 | Eagle Materials, Inc. |
437,582 | ||||||
| 12,190 | Leggett & Platt, Inc. |
452,005 | ||||||
| 1,634 | Lennox International, Inc. |
436,164 | ||||||
| 7,424 | Louisiana-Pacific Corporation |
534,157 | ||||||
| 7,690 | Masco Corporation |
430,948 | ||||||
| 2,895 | Mohawk Industries, Inc. (a) |
407,558 | ||||||
| 5,725 | Owens Corning |
533,513 | ||||||
| 9,266 | PotlatchDeltic Corporation |
508,703 | ||||||
| 3,269 | PPG Industries, Inc. |
436,248 | ||||||
| 4,354 | Simpson Manufacturing Company, Inc. |
515,992 | ||||||
| 1,875 | TopBuild Corporation (a) |
402,525 | ||||||
| 3,999 | Trex Company, Inc. (a) |
367,268 | ||||||
| 1,715 | Watsco, Inc. |
468,298 | ||||||
| 13,612 | Weyerhaeuser Company |
529,235 | ||||||
| 9,297,645 | ||||||||
Home Furnishings & Home Goods — 12.4% |
||||||||
| 155 | Amazon.com, Inc. (a) |
476,045 | ||||||
| 8,026 | American Woodmark Corporation (a) |
430,033 | ||||||
| 1,003 | Costco Wholesale Corporation |
520,808 | ||||||
| 4,166 | Floor & Decor Holdings, Inc. - Class A (a) |
398,353 | ||||||
| 5,135 | Fortune Brands Home & Security, Inc. |
446,231 | ||||||
| 6,625 | iRobot Corporation (a) |
411,810 | ||||||
| 15,165 | La-Z-Boy, Inc. |
442,515 | ||||||
| 2,950 | Middleby Corporation (a) |
523,979 | ||||||
| 12,967 | MillerKnoll, Inc. |
504,157 | ||||||
| 900 | RH (a) |
361,683 | ||||||
| 1,669 | Sherwin-Williams Company |
439,164 | ||||||
| 6,662 | Sleep Number Corporation (a) |
437,693 | ||||||
| 2,183 | Target Corporation |
436,098 | ||||||
| 12,393 | Tempur Sealy International, Inc. |
409,093 | ||||||
| 3,732 | Walmart, Inc. |
504,417 | ||||||
The accompanying notes are an integral part of these financial statements.
11
Hoya Capital Housing ETF
Schedule OF INVESTMENTS
February 28, 2022 (Continued)
Shares |
Security Description |
Value |
||||||
COMMON STOCKS — 99.3% (Continued) |
||||||||
Home Furnishings & Home Goods — 12.4% (Continued) |
||||||||
| 2,099 | Wayfair, Inc. - Class A (a) |
$ | 295,686 | |||||
| 2,358 | Whirlpool Corporation |
474,595 | ||||||
| 2,573 | Williams-Sonoma, Inc. |
372,725 | ||||||
| 7,885,085 | ||||||||
Home Improvement Retailers — 5.5% |
||||||||
| 5,139 | Home Depot, Inc. |
1,623,050 | ||||||
| 8,328 | Lowe’s Companies, Inc. |
1,840,988 | ||||||
| 3,464,038 | ||||||||
Homebuilders — 14.3% |
||||||||
| 10,310 | DR Horton, Inc. |
880,474 | ||||||
| 23,861 | KB Home |
921,273 | ||||||
| 9,476 | Lennar Corporation - Class A |
851,703 | ||||||
| 20,306 | MDC Holdings, Inc. |
900,368 | ||||||
| 8,841 | Meritage Homes Corporation (a) |
871,546 | ||||||
| 197 | NVR, Inc. (a) |
976,813 | ||||||
| 19,836 | PulteGroup, Inc. |
985,056 | ||||||
| 31,323 | Taylor Morrison Home Corporation (a) |
924,028 | ||||||
| 15,873 | Toll Brothers, Inc. |
861,269 | ||||||
| 40,065 | Tri Pointe Homes, Inc. (a) |
896,254 | ||||||
| 9,068,784 | ||||||||
Mortgage Lenders & Servicers — 10.6% |
||||||||
| 29,098 | AGNC Investment Corporation |
375,655 | ||||||
| 55,298 | Annaly Capital Management, Inc. |
384,874 | ||||||
| 9,816 | Bank of America Corporation |
433,867 | ||||||
| 6,387 | Black Knight, Inc. (a) |
358,885 | ||||||
| 28,018 | Chimera Investment Corporation |
340,979 | ||||||
| 9,170 | Citizens Financial Group, Inc. |
480,692 | ||||||
| 2,131 | First Republic Bank |
369,217 | ||||||
| 28,421 | Huntington Bancshares, Inc. |
441,094 | ||||||
| 2,772 | JPMorgan Chase & Company |
393,070 | ||||||
| 2,888 | M&T Bank Corporation |
526,280 | ||||||
| 41,665 | New Residential Investment Corporation |
432,483 | ||||||
| 2,236 | PNC Financial Services Group, Inc. |
445,523 | ||||||
| 30,235 | Rocket Companies, Inc. - Class A |
390,334 | ||||||
| 7,416 | Truist Financial Corporation |
461,424 | ||||||
| 76,671 | Two Harbors Investment Corporation |
387,955 | ||||||
The accompanying notes are an integral part of these financial statements.
12
Hoya Capital Housing ETF
Schedule OF INVESTMENTS
February 28, 2022 (Continued)
Shares |
Security Description |
Value |
||||||
COMMON STOCKS — 99.3% (Continued) |
||||||||
Mortgage Lenders & Servicers — 10.6% (Continued) |
||||||||
| 9,074 | Wells Fargo & Company |
$ | 484,279 | |||||
| 6,706,611 | ||||||||
Property, Title & Mortgage Insurance — 6.0% |
||||||||
| 4,060 | Allstate Corporation |
496,781 | ||||||
| 8,893 | Fidelity National Financial, Inc. |
423,662 | ||||||
| 6,042 | First American Financial Corporation |
405,056 | ||||||
| 30,900 | MGIC Investment Corporation |
469,062 | ||||||
| 17,926 | Old Republic International Corporation |
472,350 | ||||||
| 4,933 | Progressive Corporation |
522,553 | ||||||
| 21,734 | Radian Group, Inc. |
519,443 | ||||||
| 2,912 | Travelers Companies, Inc. |
500,369 | ||||||
| 3,809,276 | ||||||||
Real Estate Technology, Brokerage & Services — 3.5% |
||||||||
| 5,816 | CoStar Group, Inc. (a) |
354,834 | ||||||
| 17,969 | Matterport, Inc. (a) |
133,150 | ||||||
| 16,215 | RE/MAX Holdings, Inc. - Class A |
480,613 | ||||||
| 29,048 | Realogy Holdings Corporation (a) |
528,093 | ||||||
| 11,264 | Redfin Corporation (a) |
243,640 | ||||||
| 8,578 | Zillow Group, Inc. - Class C (a) |
493,407 | ||||||
| 2,233,737 | ||||||||
Residential REITs & Real Estate Operators — 32.4% (b) |
||||||||
| 19,740 | American Campus Communities, Inc. |
1,062,209 | ||||||
| 25,854 | American Homes 4 Rent - Class A |
982,710 | ||||||
| 19,956 | Apartment Income REIT Corporation |
1,029,929 | ||||||
| 4,325 | AvalonBay Communities, Inc. |
1,031,902 | ||||||
| 6,266 | Camden Property Trust |
1,034,579 | ||||||
| 19,471 | CubeSmart |
938,697 | ||||||
| 12,479 | Equity LifeStyle Properties, Inc. |
931,183 | ||||||
| 12,103 | Equity Residential |
1,032,386 | ||||||
| 2,990 | Essex Property Trust, Inc. |
948,338 | ||||||
| 5,241 | Extra Space Storage, Inc. |
986,094 | ||||||
| 41,416 | Independence Realty Trust, Inc. |
1,046,582 | ||||||
| 25,491 | Invitation Homes, Inc. |
963,560 | ||||||
| 5,065 | Mid-America Apartment Communities, Inc. |
1,036,350 | ||||||
| 13,474 | NexPoint Residential Trust, Inc. |
1,144,886 | ||||||
| 3,180 | Public Storage |
1,128,964 | ||||||
The accompanying notes are an integral part of these financial statements.
13
Hoya Capital Housing ETF
Schedule OF INVESTMENTS
February 28, 2022 (Continued)
Shares |
Security Description |
Value |
||||||
COMMON STOCKS — 99.3% (Continued) |
||||||||
Residential REITs & Real Estate Operators — 32.4% (b) (Continued) |
||||||||
| 5,346 | Sun Communities, Inc. |
$ | 967,626 | |||||
| 74,707 | Tricon Residential, Inc. |
1,111,640 | ||||||
| 18,503 | UDR, Inc. |
1,015,260 | ||||||
| 20,548 | Ventas, Inc. |
1,109,592 | ||||||
| 12,227 | Welltower, Inc. |
1,018,387 | ||||||
| 20,520,874 | ||||||||
TOTAL COMMON STOCKS (Cost $58,788,761) |
62,986,050 | |||||||
SHORT-TERM INVESTMENTS — 0.6% |
||||||||
| 402,764 | First American Government Obligations Fund - Class X, 0.03% (c) |
402,764 | ||||||
TOTAL SHORT-TERM INVESTMENTS (Cost $402,764) |
402,764 | |||||||
TOTAL INVESTMENTS — 99.9% (Cost $59,191,525) |
63,388,814 | |||||||
Other Assets in Excess of Liabilities — 0.1% |
33,941 | |||||||
NET ASSETS — 100.0% |
$ | 63,422,755 | ||||||
Percentages are stated as a percent of net assets.
The Fund’s security classifications are defined by the Fund’s Adviser.
(a) |
Non-income producing security. |
(b) |
The Index, and consequently the Fund, is expected to concentrate its investments in the U.S. residential housing industry. The value of the Fund’s shares may rise and fall more than the value of shares of a fund that invests in securities of companies in a broader range of industries. See Note 7 in Notes to the Financial Statements. |
(c) |
Rate shown is the annualized seven-day yield as of February 28, 2022. |
REIT - Real Estate Investment Trust
The accompanying notes are an integral part of these financial statements.
14
Hoya Capital High Dividend Yield ETF
Schedule of Investments
February 28, 2022
Shares |
Security Description |
Value |
||||||
COMMON STOCKS — 88.9% |
||||||||
Dividend Champions — 14.5% |
||||||||
| 1,884 | Crown Castle International Corporation |
$ | 313,856 | |||||
| 2,081 | Digital Realty Trust, Inc. |
280,769 | ||||||
| 4,018 | Equity Residential |
342,735 | ||||||
| 1,728 | Extra Space Storage, Inc. |
325,123 | ||||||
| 1,305 | Innovative Industrial Properties, Inc. |
245,940 | ||||||
| 7,427 | Iron Mountain, Inc. |
365,260 | ||||||
| 2,053 | Simon Property Group, Inc. |
282,411 | ||||||
| 7,896 | Vornado Realty Trust |
341,739 | ||||||
| 4,047 | Welltower, Inc. |
337,075 | ||||||
| 4,486 | WP Carey, Inc. |
347,216 | ||||||
| 3,182,124 | ||||||||
Large-Cap REITs — 15.0% |
||||||||
| 21,781 | AGNC Investment Corporation |
281,193 | ||||||
| 41,400 | Annaly Capital Management, Inc. |
288,144 | ||||||
| 11,022 | Blackstone Mortgage Trust, Inc. - Class A |
350,279 | ||||||
| 7,536 | Gaming and Leisure Properties, Inc. |
342,210 | ||||||
| 16,290 | Medical Properties Trust, Inc. |
331,339 | ||||||
| 31,214 | New Residential Investment Corporation |
324,001 | ||||||
| 11,944 | Omega Healthcare Investors, Inc. |
336,462 | ||||||
| 7,519 | Spirit Realty Capital, Inc. |
348,656 | ||||||
| 13,325 | Starwood Property Trust, Inc. |
317,668 | ||||||
| 12,334 | VICI Properties, Inc. |
344,859 | ||||||
| 3,264,811 | ||||||||
Mid-Cap REITs — 29.4% |
||||||||
| 19,665 | Apollo Commercial Real Estate Finance, Inc. |
256,628 | ||||||
| 15,185 | Arbor Realty Trust, Inc. |
273,330 | ||||||
| 19,509 | Brandywine Realty Trust |
260,055 | ||||||
| 13,532 | CareTrust REIT, Inc. |
236,810 | ||||||
| 16,766 | Chimera Investment Corporation |
204,042 | ||||||
| 13,010 | Easterly Government Properties, Inc. |
270,868 | ||||||
| 5,548 | EPR Properties |
276,290 | ||||||
| 9,892 | Four Corners Property Trust, Inc. |
260,951 | ||||||
| 8,669 | Getty Realty Corporation |
238,831 | ||||||
| 18,667 | Global Net Lease, Inc. |
265,258 | ||||||
| 6,049 | Highwoods Properties, Inc. |
263,736 | ||||||
| 12,332 | Industrial Logistics Properties Trust |
275,867 | ||||||
The accompanying notes are an integral part of these financial statements.
15
Hoya Capital High Dividend Yield ETF
Schedule OF INVESTMENTS
February 28, 2022 (Continued)
Shares |
Security Description |
Value |
||||||
COMMON STOCKS — 88.9% (Continued) |
||||||||
Mid-Cap REITs — 29.4% (Continued) |
||||||||
| 13,088 | KKR Real Estate Finance Trust, Inc. |
$ | 280,999 | |||||
| 23,182 | Ladder Capital Corporation |
265,666 | ||||||
| 61,965 | MFA Financial, Inc. |
251,578 | ||||||
| 5,062 | National Health Investors, Inc. |
269,855 | ||||||
| 70,904 | New York Mortgage Trust, Inc. |
248,873 | ||||||
| 15,091 | PennyMac Mortgage Investment Trust |
235,420 | ||||||
| 15,385 | Physicians Realty Trust |
250,160 | ||||||
| 14,783 | Piedmont Office Realty Trust, Inc. |
251,902 | ||||||
| 20,119 | Redwood Trust, Inc. |
209,036 | ||||||
| 19,958 | Sabra Health Care REIT, Inc. |
268,036 | ||||||
| 3,836 | SL Green Realty Corporation |
305,039 | ||||||
| 45,935 | Two Harbors Investment Corporation |
232,431 | ||||||
| 20,260 | Uniti Group, Inc. |
262,772 | ||||||
| 6,414,433 | ||||||||
Small-Cap REITs — 30.0% |
||||||||
| 11,890 | AFC Gamma, Inc. |
234,827 | ||||||
| 1,002 | Alexander’s, Inc. |
253,927 | ||||||
| 15,508 | Alpine Income Property Trust, Inc. |
297,288 | ||||||
| 33,445 | American Finance Trust, Inc. |
235,453 | ||||||
| 18,011 | Ares Commercial Real Estate Corporation |
263,861 | ||||||
| 27,704 | ARMOUR Residential REIT, Inc. |
225,234 | ||||||
| 28,795 | BrightSpire Capital, Inc. |
255,124 | ||||||
| 28,474 | Broadmark Realty Capital, Inc. |
246,585 | ||||||
| 31,411 | Cherry Hill Mortgage Investment Corporation |
236,211 | ||||||
| 24,409 | Ellington Residential Mortgage REIT |
235,303 | ||||||
| 48,670 | Franklin Street Properties Corporation |
281,313 | ||||||
| 12,437 | Gladstone Commercial Corporation |
263,540 | ||||||
| 16,545 | Global Medical REIT, Inc. |
259,756 | ||||||
| 22,363 | Granite Point Mortgage Trust, Inc. |
250,913 | ||||||
| 90,165 | Invesco Mortgage Capital, Inc. |
196,560 | ||||||
| 8,319 | LTC Properties, Inc. |
281,432 | ||||||
| 13,075 | Nexpoint Real Estate Finance, Inc. |
274,706 | ||||||
| 10,935 | Office Properties Income Trust |
273,922 | ||||||
| 8,165 | One Liberty Properties, Inc. |
237,275 | ||||||
| 58,191 | Orchid Island Capital, Inc. |
191,448 | ||||||
| 15,949 | Postal Realty Trust, Inc. - Class A |
278,310 | ||||||
| 19,750 | Preferred Apartment Communities, Inc. |
498,885 | ||||||
The accompanying notes are an integral part of these financial statements.
16
Hoya Capital High Dividend Yield ETF
Schedule OF INVESTMENTS
February 28, 2022 (Continued)
Shares |
Security Description |
Value |
||||||
COMMON STOCKS — 88.9% (Continued) |
||||||||
Small-Cap REITs — 30.0% (Continued) |
||||||||
| 17,645 | Ready Capital Corporation |
$ | 262,028 | |||||
| 47,920 | Sachem Capital Corporation |
234,808 | ||||||
| 4,767 | Universal Health Realty Income Trust |
272,243 | ||||||
| 6,540,952 | ||||||||
TOTAL COMMON STOCKS (Cost $20,379,308) |
19,402,320 | |||||||
PREFERRED STOCKS — 10.0% |
||||||||
AG Mortgage Investment Trust, Inc. |
||||||||
| 3,011 | Series C, 8.000%, Perpetual (b) |
69,253 | ||||||
AGNC Investment Corporation |
||||||||
| 3,005 | Series C, 7.000%, Perpetual (b) |
73,112 | ||||||
| 3,011 | Series E, 6.500%, Perpetual (b) |
72,415 | ||||||
Annaly Capital Management, Inc. |
||||||||
| 3,002 | Series F, 6.950%, Perpetual (b) |
71,598 | ||||||
| 3,006 | Series G, 6.500%, Perpetual (b) |
68,356 | ||||||
| 2,942 | Series I, 6.7500%, Perpetual (b) |
71,373 | ||||||
ARMOUR Residential REIT, Inc. |
||||||||
| 2,994 | Series C, 7.000%, Perpetual |
72,904 | ||||||
Chimera Investment Corporation |
||||||||
| 2,992 | Series B, 8.000%, Perpetual (b) |
74,232 | ||||||
| 2,985 | Series C, 7.750%, Perpetual (b) |
73,431 | ||||||
| 2,970 | Series D, 8.000%, Perpetual (b) |
73,478 | ||||||
DigitalBridge Group, Inc. |
||||||||
| 3,086 | Series H, 7.125%, Perpetual |
76,132 | ||||||
| 3,089 | Series I, 7.150%, Perpetual |
76,298 | ||||||
| 3,003 | Series J, 7.125%, Perpetual |
74,444 | ||||||
Global Net Lease, Inc. |
||||||||
| 2,971 | Series A, 7.250%, Perpetual |
73,621 | ||||||
| 2,973 | Series B, 6.875%, Perpetual |
73,637 | ||||||
Hersha Hospitality Trust |
||||||||
| 3,264 | Series D, 6.500%, Perpetual |
71,090 | ||||||
| 3,229 | Series E, 6.500%, Perpetual |
70,222 | ||||||
Invesco Mortgage Capital, Inc. |
||||||||
| 3,083 | Series B, 7.750%, Perpetual (b) |
71,248 | ||||||
| 3,076 | Series C, 7.500%, Perpetual (b) |
74,531 | ||||||
The accompanying notes are an integral part of these financial statements.
17
Hoya Capital High Dividend Yield ETF
Schedule OF INVESTMENTS
February 28, 2022 (Continued)
Shares |
Security Description |
Value |
||||||
PREFERRED STOCKS — 10.0% (Continued) |
||||||||
KKR Real Estate Finance Trust, Inc. |
||||||||
| 2,984 | Series A, 6.500%, Perpetual |
$ | 72,988 | |||||
MFA Financial, Inc. |
||||||||
| 3,232 | Series C, 6.500%, Perpetual (b) |
73,851 | ||||||
Necessity Retail REIT, Inc. |
||||||||
| 2,934 | Series A, 7.500%, Perpetual |
74,817 | ||||||
New Residential Investment Corporation |
||||||||
| 3,086 | Series B, 7.125%, Perpetual (b) |
72,830 | ||||||
| 3,318 | Series C, 6.375%, Perpetual (b) |
72,200 | ||||||
New York Mortgage Trust, Inc. |
||||||||
| 3,006 | Series D, 8.000%, Perpetual (b) |
73,346 | ||||||
| 2,960 | Series E, 7.875%, Perpetual (b) |
69,826 | ||||||
RLJ Lodging Trust |
||||||||
| 2,684 | Series A, 1.950%, Perpetual (c) |
70,858 | ||||||
SITE Centers Corporation |
||||||||
| 3,067 | Series A, 6.375%, Perpetual |
75,908 | ||||||
Two Harbors Investment Corporation |
||||||||
| 3,065 | Series B, 7.625%, Perpetual (b) |
72,579 | ||||||
| 3,083 | Series C, 7.250%, Perpetual (b) |
71,711 | ||||||
TOTAL PREFERRED STOCKS (Cost $2,298,059) |
2,182,289 | |||||||
The accompanying notes are an integral part of these financial statements.
18
Hoya Capital High Dividend Yield ETF
Schedule OF INVESTMENTS
February 28, 2022 (Continued)
Shares |
Security Description |
Value |
||||||
SHORT-TERM INVESTMENTS — 1.0% |
||||||||
| 210,767 | First American Government Obligations Fund - Class X, 0.03% (d) |
$ | 210,767 | |||||
TOTAL SHORT-TERM INVESTMENTS (Cost $210,767) |
210,767 | |||||||
TOTAL INVESTMENTS — 99.9% (Cost $22,888,134) |
21,795,376 | |||||||
Other Assets in Excess of Liabilities — 0.1% |
25,124 | |||||||
NET ASSETS — 100.0% |
$ | 21,820,500 | ||||||
Percentages are stated as a percent of net assets.
The Fund’s security classifications are defined by the Fund’s Adviser.
(a) |
The Index, and consequently the Fund, is expected to concentrate its investments in real estate-related industries. The value of the Fund’s shares may rise and fall more than the value of shares of a fund that invests in securities of companies in a broader range of industries. See Note 7 in Notes to Financial Statements. |
(b) |
Variable rate security based on a reference index and spread. Rate is fixed to variable and currently in the fixed phase. Rate disclosed is the rate in effect as of February 28, 2022. |
(c) |
Convertible security. |
(d) |
Rate shown is the annualized seven-day yield as of February 28, 2022. |
REIT - Real Estate Investment Trust
The accompanying notes are an integral part of these financial statements.
19
Hoya Capital ETFs
Statements of Assets and Liabilities
February 28, 2022
Hoya Capital |
Hoya Capital High |
|||||||
ASSETS |
||||||||
Investments in securities, at value* |
$ | 63,388,814 | $ | 21,795,376 | ||||
Dividends and interest receivable |
51,149 | 29,227 | ||||||
Total assets |
63,439,963 | 21,824,603 | ||||||
LIABILITIES |
||||||||
Management fees payable, net of waiver |
17,208 | 4,103 | ||||||
Total liabilities |
17,208 | 4,103 | ||||||
NET ASSETS |
$ | 63,422,755 | $ | 21,820,500 | ||||
Net Assets Consist of: |
||||||||
Paid-in capital |
$ | 59,771,603 | $ | 22,949,596 | ||||
Total distributable earnings (accumulated deficit) |
3,651,152 | (1,129,096 | ) | |||||
Net assets |
$ | 63,422,755 | $ | 21,820,500 | ||||
Net Asset Value: |
||||||||
Net Assets |
$ | 63,422,755 | $ | 21,820,500 | ||||
Shares outstanding^ |
1,600,000 | 1,530,000 | ||||||
Net asset value, offering and redemption price per share |
$ | 39.64 | $ | 14.26 | ||||
*Identified Cost: |
||||||||
Investments in Securities |
$ | 59,191,525 | $ | 22,888,134 | ||||
^ |
No par value, unlimited number of shares authorized. |
The accompanying notes are an integral part of these financial statements.
20
Hoya Capital ETFs
Statements of Operations
For the Year/Period Ended February 28, 2022
Hoya Capital |
Hoya Capital High |
|||||||
INCOME |
||||||||
Dividends+ |
$ | 986,396 | $ | 260,571 | ||||
Interest |
100 | 14 | ||||||
Total investment income |
986,496 | 260,585 | ||||||
EXPENSES |
||||||||
Management fees |
222,345 | 35,517 | ||||||
Total expenses before waiver |
222,345 | 35,517 | ||||||
Less management fees waived (see Note 3) |
— | (17,758 | ) | |||||
Net expenses |
222,345 | 17,759 | ||||||
Net investment income (loss) |
764,151 | 242,826 | ||||||
REALIZED & UNREALIZED GAIN (LOSS) ON INVESTMENTS |
||||||||
Net realized gain (loss) on investments |
10,822,631 | 70,441 | ||||||
Change in unrealized appreciation (depreciation) on investments |
(3,477,882 | ) | (1,092,758 | ) | ||||
Net realized and unrealized gain (loss) on investments |
7,344,749 | (1,022,317 | ) | |||||
Net increase (decrease) in net assets resulting from operations |
$ | 8,108,900 | $ | (779,491 | ) | |||
* |
The Fund commenced operations on September 21, 2021. The information presented is for the period from September 21, 2021 to February 28, 2022. |
+ |
Net of foreign taxes withheld of $751 and $0, respectively. |
The accompanying notes are an integral part of these financial statements.
21
Hoya Capital Housing ETF
Statements of Changes in Net Assets
Year Ended February 28, |
||||||||
2022 |
2021 |
|||||||
OPERATIONS |
||||||||
Net investment income (loss) |
$ | 764,151 | $ | 484,299 | ||||
Net realized gain (loss) on investments |
10,822,631 | 2,318,429 | ||||||
Change in unrealized appreciation (depreciation) of investments |
(3,477,882 | ) | 7,821,554 | |||||
Net increase (decrease) in net assets resulting from operations |
8,108,900 | 10,624,282 | ||||||
DISTRIBUTIONS TO SHAREHOLDERS |
||||||||
Net distributions to shareholders |
(783,934 | ) | (987,629 | ) | ||||
Tax return of capital to shareholders |
(233,770 | ) | (165,491 | ) | ||||
Total distributions to shareholders |
(1,017,704 | ) | (1,153,120 | ) | ||||
CAPITAL SHARE TRANSACTIONS |
||||||||
Proceeds from shares sold |
31,613,303 | 44,763,753 | ||||||
Payments for shares redeemed |
(34,906,983 | ) | (5,991,085 | ) | ||||
Net increase (decrease) in net assets derived from capital share transactions (a) |
(3,293,680 | ) | 38,772,668 | |||||
Net increase (decrease) in net assets |
$ | 3,797,516 | $ | 48,243,830 | ||||
NET ASSETS |
||||||||
Beginning of year |
$ | 59,625,239 | $ | 11,381,409 | ||||
End of year |
$ | 63,422,755 | $ | 59,625,239 | ||||
(a) |
A summary of capital shares transactions is as follows: |
Shares |
Shares |
|||||||
Shares sold |
775,000 | 1,475,000 | ||||||
Shares redeemed |
(875,000 | ) | (200,000 | ) | ||||
Net increase (decrease) |
(100,000 | ) | 1,275,000 | |||||
The accompanying notes are an integral part of these financial statements.
22
Hoya Capital High Dividend Yield ETF
Statement of Changes in Net Assets
Period Ended |
||||
OPERATIONS |
||||
Net investment income (loss) |
$ | 242,826 | ||
Net realized gain (loss) on investments |
70,441 | |||
Change in unrealized appreciation (depreciation) of investments |
(1,092,758 | ) | ||
Net increase (decrease) in net assets resulting from operations |
(779,491 | ) | ||
DISTRIBUTIONS TO SHAREHOLDERS |
||||
Net distributions to shareholders |
(349,605 | ) | ||
Tax return of capital to shareholders |
(200,959 | ) | ||
Total distributions to shareholders |
(550,564 | ) | ||
CAPITAL SHARE TRANSACTIONS |
||||
Proceeds from shares sold |
23,150,555 | |||
Payments for shares redeemed |
— | |||
Net increase (decrease) in net assets derived from capital share transactions (b) |
23,150,555 | |||
Net increase (decrease) in net assets |
$ | 21,820,500 | ||
NET ASSETS |
||||
Beginning of period |
$ | — | ||
End of period |
$ | 21,820,500 | ||
(a) |
The Fund commenced operations on September 21, 2021. The information presented is for the period from September 21, 2021 to February 28, 2022. |
(b) |
A summary of capital shares transactions is as follows: |
Shares |
||||
Shares sold |
1,530,000 | |||
Shares redeemed |
— | |||
Net increase (decrease) |
1,530,000 | |||
The accompanying notes are an integral part of these financial statements.
23
Hoya Capital Housing ETF
Financial Highlights
For a capital share outstanding throughout the year/period
Year Ended February 28, |
Period Ended |
|||||||||||
2022 |
2021 |
|||||||||||
Net asset value, beginning of year/period |
$ | 35.07 | $ | 26.78 | $ | 25.00 | ||||||
INCOME (LOSS) FROM INVESTMENT OPERATIONS: |
||||||||||||
Net investment income (loss) (2) |
0.42 | 0.49 | 0.43 | |||||||||
Net realized and unrealized gain (loss) on investments (3) |
4.71 | 8.82 | 1.80 | |||||||||
Total from investment operations |
5.13 | 9.31 | 2.23 | |||||||||
DISTRIBUTIONS TO SHAREHOLDERS: |
||||||||||||
Distributions from: |
||||||||||||
Net investment income |
(0.42 | ) | (0.87 | ) | (0.45 | ) | ||||||
Net realized gains |
(0.01 | ) | — | — | ||||||||
Tax return of capital to shareholders |
(0.13 | ) | (0.15 | ) | — | |||||||
Total distributions to shareholders |
(0.56 | ) | (1.02 | ) | (0.45 | ) | ||||||
CAPITAL SHARE TRANSACTIONS: |
||||||||||||
Transaction fees (see Note 6) |
— | — | 0.00 | (4) | ||||||||
Net asset value, end of year/period |
$ | 39.64 | $ | 35.07 | $ | 26.78 | ||||||
Total return |
14.60 | % | 35.54 | % | 8.88 | %(5) | ||||||
SUPPLEMENTAL DATA: |
||||||||||||
Net assets at end of year/period (000’s) |
$ | 63,423 | $ | 59,625 | $ | 11,381 | ||||||
RATIOS TO AVERAGE NET ASSETS: |
||||||||||||
Expenses to average net assets |
0.30 | % | 0.33 | %(8) | 0.45 | %(6) | ||||||
Net investment income (loss) to average net assets |
1.03 | % | 1.67 | % | 1.60 | %(6) | ||||||
Portfolio turnover rate (7) |
13 | % | 19 | % | 11 | %(5) | ||||||
(1) |
Commencement of operations on March 19, 2019. |
(2) |
Calculated based on average shares outstanding during the period. |
(3) |
Realized and unrealized gains (losses) per share are balancing amounts necessary to reconcile the change in net asset value per share for the period and may not reconcile with the aggregate gains and losses in the Statement of Operations due to share transactions for the period. |
(4) |
Represents less than $0.005 per share. |
(5) |
Not annualized. |
(6) |
Annualized. |
(7) |
Excludes the impact of in-kind transactions. |
(8) |
Effective August 1, 2020, the management fee for the Fund was reduced from 0.45% to 0.30%. |
The accompanying notes are an integral part of these financial statements.
24
Hoya Capital High Dividend Yield ETF
Financial Highlights
For a capital share outstanding throughout the period
Period Ended |
||||
Net asset value, beginning of period |
$ | 14.92 | ||
INCOME (LOSS) FROM INVESTMENT OPERATIONS: |
||||
Net investment income (loss) (2) |
0.23 | |||
Net realized and unrealized gain (loss) on investments (3) |
(0.41 | ) | ||
Total from investment operations |
(0.18 | ) | ||
DISTRIBUTIONS TO SHAREHOLDERS: |
||||
Distributions from: |
||||
Net investment income |
(0.30 | ) | ||
Net realized gains |
(0.01 | ) | ||
Tax return of capital to shareholders |
(0.17 | ) | ||
Total distributions to shareholders |
(0.48 | ) | ||
Net asset value, end of period |
$ | 14.26 | ||
Total return |
-1.35 | %(4) | ||
SUPPLEMENTAL DATA: |
||||
Net assets at end of period (000’s) |
$ | 21,821 | ||
RATIOS TO AVERAGE NET ASSETS: |
||||
Expenses to average net assets (before management fees waived) |
0.50 | %(5) | ||
Expenses to average net assets (after management fees waived) |
0.25 | %(5) | ||
Net investment income (loss) to average net assets (before management fees waived) |
3.17 | %(5) | ||
Net investment income (loss) to average net assets (after management fees waived) |
3.42 | %(5) | ||
Portfolio turnover rate (6) |
7 | %(4) | ||
(1) |
Commencement of operations on September 21, 2021. |
(2) |
Calculated based on average shares outstanding during the period. |
(3) |
Realized and unrealized gains (losses) per share are balancing amounts necessary to reconcile the change in net asset value per share for the period and may not reconcile with the aggregate gains and losses in the Statement of Operations due to share transactions for the period. |
(4) |
Not annualized. |
(5) |
Annualized. |
(6) |
Excludes the impact of in-kind transactions. |
The accompanying notes are an integral part of these financial statements.
25
Hoya Capital ETFs
Notes to Financial Statements
February 28, 2022
NOTE 1 – ORGANIZATION
Hoya Capital Housing ETF and Hoya Capital High Dividend Yield ETF (individually each a “Fund” or collectively the “Funds”) are each a diversified series of ETF Series Solutions (“ESS” or the “Trust”), an open-end management investment company consisting of multiple investment series, organized as a Delaware statutory trust on February 9, 2012. The Trust is registered with the U.S. Securities and Exchange Commission (“SEC”) under the Investment Company Act of 1940, as amended (the “1940 Act”), as an open-end management investment company and the offering of the Funds’ shares is registered under the Securities Act of 1933, as amended (the “Securities Act”). The investment objective of the Hoya Capital Housing ETF is to track the performance, before fees and expenses, of the Hoya Capital Housing 100™ Index (the “Index”). The investment objective of the Hoya Capital High Dividend Yield ETF is to track the performance, before fees and expenses, of the Hoya Capital High Dividend Yield Index (the “Index”). Hoya Capital Housing ETF commenced operations on March 19, 2019 and Hoya Capital High Dividend Yield ETF commenced operations on September 21, 2021.
The end of the reporting period for the Funds is February 28, 2022. The period covered by these Notes to Financial Statements for the Hoya Capital Housing ETF is the fiscal year ended February 28, 2022 (the “current fiscal period”). The period covered by these Notes to Financial Statements for the Hoya Capital High Dividend Yield ETF is the period from September 21, 2021 to February 28, 2022 (the “current fiscal period”).
NOTE 2 – SIGNIFICANT ACCOUNTING POLICIES
The Funds are investment companies and accordingly follow the investment company accounting and reporting guidance of the Financial Accounting Standards Board (“FASB”) Accounting Standards Codification (“ASC”) Topic 946 Financial Services-Investment Companies.
The following is a summary of significant accounting policies consistently followed by the Funds. These policies are in conformity with accounting principles generally accepted in the United States of America (“U.S. GAAP”).
|
A. |
Security Valuation. All equity securities, including domestic and foreign common stocks, preferred stocks and exchange traded funds that are traded on a national securities exchange, except those listed on the Nasdaq Global Market®, Nasdaq Global Select Market® and the Nasdaq Capital Market® exchanges (collectively, “Nasdaq”) are valued at the last reported sale price on the exchange on which the security is principally traded. Securities traded on Nasdaq will be valued at the Nasdaq Official Closing Price (“NOCP”). If, on a particular day, an exchange-traded or Nasdaq security does not trade, then the mean between the most recent quoted bid and asked prices will be used. |
26
Hoya Capital ETFs
NOTES TO FINANCIAL STATEMENTS
February 28, 2022 (Continued)
All equity securities that are not traded on a listed exchange are valued at the last sale price in the over-the-counter market. If a non-exchange traded security does not trade on a particular day, then the mean between the last quoted closing bid and asked price will be used. Prices denominated in foreign currencies are converted to U.S. dollar equivalents at the current exchange rate, which approximates fair value.
Investments in mutual funds, including money market funds, are valued at their net asset value (“NAV”) per share.
Securities for which quotations are not readily available are valued at their respective fair values in accordance with pricing procedures adopted by the Fund’s Board of Trustees (the “Board”). When a security is “fair valued,” consideration is given to the facts and circumstances relevant to the particular situation, including a review of various factors set forth in the pricing procedures adopted by the Board. The use of fair value pricing by the Funds may cause the NAV of their shares to differ significantly from the NAV that would be calculated without regard to such considerations.
As described above, the Funds utilize various methods to measure the fair value of their investments on a recurring basis. U.S. GAAP establishes a hierarchy that prioritizes inputs to valuation methods. The three levels of inputs are:
|
Level 1 — |
Unadjusted quoted prices in active markets for identical assets or liabilities that the Fund has the ability to access. |
|
Level 2 — |
Observable inputs other than quoted prices included in Level 1 that are observable for the asset or liability, either directly or indirectly. These inputs may include quoted prices for the identical instrument on an inactive market, prices for similar instruments, interest rates, prepayment speeds, credit risk, yield curves, default rates and similar data. |
|
Level 3 — |
Unobservable inputs for the asset or liability, to the extent relevant observable inputs are not available; representing the Funds’ own assumptions about the assumptions a market participant would use in valuing the asset or liability, and would be based on the best information available. |
The availability of observable inputs can vary from security to security and is affected by a wide variety of factors, including, for example, the type of security, whether the security is new and not yet established in the marketplace, the liquidity of markets, and other characteristics particular to the security. To the extent that valuation is based on models or inputs that
27
Hoya Capital ETFs
NOTES TO FINANCIAL STATEMENTS
February 28, 2022 (Continued)
are less observable or unobservable in the market, the determination of fair value requires more judgment. Accordingly, the degree of judgment exercised in determining fair value is greatest for instruments categorized in Level 3.
The inputs used to measure fair value may fall into different levels of the fair value hierarchy. In such cases, for disclosure purposes, the level in the fair value hierarchy within which the fair value measurement falls in its entirety is determined based on the lowest level input that is significant to the fair value measurement in its entirety.
The following is a summary of the inputs used to value the Funds’ investments as of the end of the current fiscal period:
Hoya Capital Housing ETF |
||||||||||||||||
Assets^ |
Level 1 |
Level 2 |
Level 3 |
Total |
||||||||||||
Common Stocks |
$ | 62,986,050 | $ | — | $ | — | $ | 62,986,050 | ||||||||
Short-Term Investments |
402,764 | — | — | 402,764 | ||||||||||||
Total Investments in Securities |
$ | 63,388,814 | $ | — | $ | — | $ | 63,388,814 | ||||||||
Hoya Capital High Dividend Yield ETF |
||||||||||||||||
Assets^ |
Level 1 |
Level 2 |
Level 3 |
Total |
||||||||||||
Common Stocks |
$ | 19,402,320 | $ | — | $ | — | $ | 19,402,320 | ||||||||
Preferred Stocks |
2,182,289 | — | — | 2,182,289 | ||||||||||||
Short-Term Investments |
210,767 | — | — | 210,767 | ||||||||||||
Total Investments in Securities |
$ | 21,795,376 | $ | — | $ | — | $ | 21,795,376 | ||||||||
^ |
See Schedule of Investments for breakout of investments by sector classifications. |
During the current fiscal period, the Funds did not recognize any transfers to or from Level 3.
|
B. |
Federal Income Taxes. The Funds’ policy is to comply with the requirements of Subchapter M of the Internal Revenue Code of 1986, as amended, applicable to regulated investment companies and to distribute substantially all of their net investment income and net capital gains to shareholders. Therefore, no federal income tax provision is required. Each Fund plans to file U.S. Federal and applicable state and local tax returns. |
28
Hoya Capital ETFs
NOTES TO FINANCIAL STATEMENTS
February 28, 2022 (Continued)
Each Fund recognize the tax benefits of uncertain tax positions only when the position is more likely than not to be sustained. Management has analyzed each Fund’s uncertain tax positions and concluded that no liability for unrecognized tax benefits should be recorded related to uncertain tax positions. Management is not aware of any tax positions for which it is reasonably possible that the total amounts of unrecognized tax benefits will change materially in the next 12 months. Income and capital gain distributions are determined in accordance with federal income tax regulations, which may differ from U.S. GAAP. The Funds recognize interest and penalties, if any, related to unrecognized tax benefits on uncertain tax positions as income tax expense in the Statement of Operations. During the current fiscal period, the Funds did not incur any interest or penalties.
|
C. |
Security Transactions and Investment Income. Investment securities transactions are accounted for on the trade date. Gains and losses realized on sales of securities are determined on a specific identification basis. Dividend income is recorded on the ex-dividend date. Non-cash dividends included in dividend income or separately disclosed, if any, are recorded at the fair value of the security received. Interest income is recorded on an accrual basis. Withholding taxes on foreign dividends, if any, have been provided for in accordance with the Funds’ understanding of the applicable tax rules and regulations. |
Distributions received from investments in Real Estate Investment Trusts (“REITs”) may be characterized as ordinary income, net capital gain, or a return of capital. The proper characterization of REIT distributions is generally not known until after the end of each calendar year. As such, the Funds must use estimates in reporting the character of income and distributions received during the current calendar year for financial statement purposes. The actual character of distributions to the Funds’ shareholders will be reflected on the Form 1099 received by shareholders after the end of the calendar year. Due to the nature of REIT investments, a portion of the distributions received by the Funds’ shareholders may represent a return of capital.
|
D. |
Distributions to Shareholders. Distributions to shareholders from net investment income, if any, are declared and paid monthly by the Funds. Distributions to shareholders from net realized gains on securities are declared and paid by the Funds on, at least, an annual basis. Distributions are recorded on the ex-dividend date. |
|
E. |
Use of Estimates. The preparation of financial statements in conformity with U.S. GAAP requires management to make estimates and assumptions that affect the reported amounts of assets and liabilities and disclosure of |
29
Hoya Capital ETFs
NOTES TO FINANCIAL STATEMENTS
February 28, 2022 (Continued)
contingent assets and liabilities at the date of the financial statements, as well as the reported amounts of revenues and expenses during the current fiscal period. Actual results could differ from those estimates.
|
F. |
Share Valuation. The NAV per share of each Fund are calculated by dividing the sum of the value of the securities held by each Fund, plus cash and other assets, minus all liabilities (including estimated accrued expenses) by the total number of outstanding shares of each Fund, rounded to the nearest cent. The Funds’ shares will not be priced on the days on which the New York Stock Exchange (“NYSE”) is closed for trading. The offering and redemption price per share of each Fund is equal to each Fund’s NAV per share. |
|
G. |
Reclassifications of Capital Accounts. U.S. GAAP requires that certain components of net assets relating to permanent differences be reclassified between financial and tax reporting. These reclassifications have no effect on net assets or NAV per share. |
These timing differences are primarily due to differing book and tax treatments for in-kind transactions.
For the current fiscal period, the following table shows the reclassifications made:
Distributable |
Paid-In Capital |
|||||||
Hoya Capital Housing ETF |
$ | (10,933,756 | ) | $ | 10,933,756 | |||
Hoya Capital High Dividend Yield ETF |
— | — | ||||||
During the current fiscal period the Hoya Capital Housing ETF realized $10,933,756 in net capital gains resulting from in-kind redemptions, in which shareholders exchanged Fund shares for securities held by the Fund rather than for cash. Because such gains are not taxable to the Fund, and are not distributed to shareholders, they have been reclassified from distributable earnings (accumulated deficit) to paid-in capital.
|
H. |
Guarantees and Indemnifications. In the normal course of business, the Funds enter into contracts with service providers that contain general indemnification clauses. The Funds’ maximum exposure under these arrangements is unknown as this would involve future claims that may be against the Funds that have not yet occurred. However, based on experience, the Funds expect the risk of loss to be remote. |
30
Hoya Capital ETFs
NOTES TO FINANCIAL STATEMENTS
February 28, 2022 (Continued)
|
I. |
Subsequent Events. In preparing these financial statements, management has evaluated events and transactions for potential recognition or disclosure through the date the financial statements were issued. There were no events or transactions that occurred during the period subsequent to the end of the current fiscal period that materially impacted the amounts or disclosures in the Funds’ financial statements. |
NOTE 3 – COMMITMENTS AND OTHER RELATED PARTY TRANSACTIONS
Hoya Capital Real Estate, LLC (the “Adviser”), serves as the investment adviser to the Funds. An affiliate of the Adviser, Hoya Capital Index Innovations (the “Index Provider”), serves as index provider to the Funds. Pursuant to an Investment Advisory Agreement (“Advisory Agreement”) between the Trust, on behalf of the Funds, and the Adviser, the Adviser provides investment advice to the Funds and oversees the day-to-day operations of the Funds, subject to the direction and control of the Board and the officers of the Trust. Under the Advisory Agreement, the Adviser is also responsible for arranging, in consultation with Penserra Capital Management, LLC, (the “Sub-Adviser”), transfer agency, custody, fund administration and accounting, and other non-distribution related services necessary for the Funds to operate. Under the Advisory Agreement, the Adviser has agreed to pay all expenses of the Funds, except for: the fee paid to the Adviser pursuant to the Advisory Agreement, interest charges on any borrowings, dividends and other expenses on securities sold short, taxes, brokerage commissions and other expenses incurred in placing orders for the purchase and sale of securities and other investment instruments, acquired fund fees and expenses, accrued deferred tax liability, extraordinary expenses and distribution (12b-1) fees and expenses. For the services it provides to the Funds, the Funds pay the Adviser a unified management fee, which is calculated daily and paid monthly, at the annual rates of each Fund’s average daily net assets listed below.
Hoya Capital Housing ETF |
0.30 | % | ||
Hoya Capital High Dividend Yield ETF |
0.50 | % |
The Adviser has agreed to waive 0.25% of its Advisor fees for the Hoya Capital High Dividend Yield ETF until at least September 30, 2022. This agreement may be terminated only by, or with the consent of, the Board. Fees waived under this waiver agreement are not subject to recoupment by the Adviser.
U.S. Bancorp Fund Services, LLC, doing business as U.S. Bank Global Fund Services (“Fund Services” or “Administrator”), acts as the Funds’ Administrator and, in that capacity, performs various administrative and accounting services for the Funds. The Administrator prepares various federal and state regulatory filings, reports and returns for the Funds, including regulatory compliance monitoring and financial reporting; prepares reports and materials to be supplied to the Board; monitors the activities of
31
Hoya Capital ETFs
NOTES TO FINANCIAL STATEMENTS
February 28, 2022 (Continued)
the Funds’ Custodian, transfer agent, and fund accountant. Fund Services also serves as the transfer agent and fund accountant to the Funds. U.S. Bank N.A. (the “Custodian”), an affiliate of Fund Services, serves as the Funds’ Custodian.
A Trustee and all officers of the Trust are affiliated with the Administrator and Custodian.
NOTE 4 – PURCHASES AND SALES OF SECURITIES
During the current fiscal period, purchases and sales of securities by the Funds, excluding short-term securities and in-kind transactions were as follow:
Purchases |
Sales |
|||||||
Hoya Capital Housing ETF |
$ | 12,713,749 | $ | 9,568,679 | ||||
Hoya Capital High Dividend Yield ETF |
$ | 1,092,175 | $ | 1,116,527 | ||||
During the current fiscal period, there were no purchases or sales of U.S. Government securities.
During the current fiscal period, in-kind transactions associated with creations and redemptions were as follow:
In-Kind |
In-Kind |
|||||||
Hoya Capital Housing ETF |
$ | 28,181,047 | $ | 34,538,138 | ||||
Hoya Capital High Dividend Yield ETF |
$ | 22,856,979 | — | |||||
NOTE 5 – INCOME TAX INFORMATION
The components of distributable earnings (accumulated deficit) and cost basis of investments for federal income tax purposes at February 28, 2022 were as follows:
Hoya Capital |
Hoya Capital |
|||||||
Tax cost of investments |
$ | 59,578,676 | $ | 22,924,472 | ||||
Gross tax unrealized appreciation |
$ | 8,347,536 | $ | 603,401 | ||||
Gross tax unrealized depreciation |
(4,537,398 | ) | (1,732,497 | ) | ||||
Net tax unrealized appreciation (depreciation) |
3,810,138 | (1,129,096 | ) | |||||
Undistributed ordinary income |
— | — | ||||||
Undistributed long-term capital gains |
— | — | ||||||
Other accumulated gain (loss) |
(158,986 | ) | — | |||||
Distributable earnings (accumulated deficit) |
$ | 3,651,152 | $ | (1,129,096 | ) | |||
32
Hoya Capital ETFs
NOTES TO FINANCIAL STATEMENTS
February 28, 2022 (Continued)
The difference between the cost basis for financial statement and federal income tax purposes is primarily due to timing differences in recognizing wash sales.
A regulated investment company may elect for any taxable year to treat any portion of any qualified late year loss as arising on the first day of the next taxable year. Qualified late year losses are certain capital and ordinary losses which occur during the portion of the Funds’ taxable year subsequent to October 31 and December 31, respectively. Hoya Capital Housing ETF deferred $158,986 of post-October capital losses and no late-year ordinary losses. The Hoya Capital High Dividend Yield ETF did not elect to defer any post-October capital losses or late-year losses.
As of February 28, 2022, the Funds had no capital loss carryforward.
The tax character of distributions declared by the Funds during the current fiscal period were as follows:
Year/Period Ended February 28, 2022 |
||||||||||||
Fund |
Ordinary |
Long-Term |
Return of |
|||||||||
Hoya Capital Housing ETF |
$ | 764,151 | $ | 19,783 | $ | 233,770 | ||||||
Hoya Capital High Dividend Yield ETF |
287,207 | 62,398 | 200,959 | |||||||||
The tax character of distributions paid by the Hoya Capital Housing ETF during the period ended February 28, 2021 was $559,784 of ordinary income, $427,845 of long-term capital gain and $165,491 of return of capital.
NOTE 6 – SHARE TRANSACTIONS
Shares of the Funds are listed and trade on the New York Stock Exchange Arca, Inc. (“NYSE Arca”). Market prices for the shares may be different from their NAV. The Funds issue and redeem shares on a continuous basis at NAV generally in blocks of 25,000 shares for Hoya Capital Housing ETF, and 10,000 shares for the Hoya Capital High Dividend Yield ETF, called “Creation Units.” Creation Units are issued and redeemed principally in-kind for securities included in a specified universe. Once created, shares generally trade in the secondary market at market prices that change throughout the day. Except when aggregated in Creation Units, shares are not redeemable securities of the Funds. Creation Units may only be purchased or redeemed by certain financial institutions (“Authorized Participants”). An Authorized Participant is either (i) a broker-dealer or other participant in the clearing process through the Continuous Net Settlement System of the National Securities Clearing Corporation or (ii) a Depository Trust Company participant and, in each case, must have executed a Participation Agreement with the Distributor. Most retail investors do not qualify as Authorized Participants nor have the resources to buy and sell whole Creation Units. Therefore,
33
Hoya Capital ETFs
NOTES TO FINANCIAL STATEMENTS
February 28, 2022 (Continued)
they are unable to purchase or redeem shares directly from the Funds. Rather, most retail investors may purchase shares in the secondary market with the assistance of a broker and are subject to customary brokerage commissions or fees.
The Funds currently offer one class of shares, which has no front-end sales load, no deferred sales charge, and no redemption fee. A fixed transaction fee is imposed for the transfer and other transaction costs associated with the purchase or sale of Creation Units. The standard fixed transaction fee for the Funds is $250, payable to the Custodian. The fixed transaction fee may be waived on certain orders if the Funds’ Custodian has determined to waive some or all of the costs associated with the order or another party, such as the Adviser, has agreed to pay such fee. In addition, a variable fee, payable to the Funds, may be charged on all cash transactions or substitutes for Creation Units of up to a maximum of 2% as a percentage of the value of the Creation Units subject to the transaction. Variable fees received by the Funds, if any, are displayed in the Capital Shares Transactions section of the Statements of Changes in Net Assets. The Funds may issue an unlimited number of shares of beneficial interest, with no par value. All shares of the Funds have equal rights and privileges.
NOTE 7 – RISKS
Concentration Risk. The Funds’ investments will be concentrated in an industry or group of industries to the extent the Indexes are so concentrated, and the Indexes are expected to be concentrated in housing and real estate-related industries. When the Funds focus their investments in a particular industry or sector, they thereby present a more concentrated risk and their performance will be especially sensitive to developments that significantly affect that industry or group of industries. In addition, the value of shares may change at different rates compared to the value of shares of a fund with investments in a more diversified mix of industries. An industry may have above-average performance during particular periods, but may also move up and down more than the broader market. The several industries that constitute a sector may all react in the same way to economic, political or regulatory events. The Funds’ performance could also be affected if the sectors, industries, or sub-sectors do not perform as expected. Alternatively, the lack of exposure to one or more sectors or industries may adversely affect performance.
Construction and Housing Risk. The construction and housing industry can be significantly affected by the national, regional and local real estate markets. This industry is also sensitive to interest rate fluctuations which can cause changes in the availability of mortgage capital and directly affect the purchasing power of potential homebuyers. The building industry can be significantly affected by changes in government spending, consumer confidence, demographic patterns and the level of new and existing home sales.
34
Hoya Capital ETFs
NOTES TO FINANCIAL STATEMENTS
February 28, 2022 (Continued)
COVID-19 Risk. The recent global outbreak of COVID-19 has disrupted economic markets and the prolonged economic impact is uncertain. The operational and financial performance of the issuers of securities in which the Funds invest depends on future developments, including the duration and spread of the outbreak, and such uncertainty may in turn impact the value of the Funds’ investments.
35
Hoya Capital ETFs
Report of Independent Registered Public Accounting Firm
To the Shareholders of Hoya Capital ETFs and
Board of Trustees of ETF Series Solutions
Opinion on the Financial Statements
We have audited the accompanying statements of assets and liabilities, including the schedules of investments, of Hoya Capital ETFs comprising the funds listed below (the “Funds”), each a series of ETF Series Solutions, as of February 28, 2022, the related statements of operations, the statements of changes in net assets, the related notes, and the financial highlights for each of the periods indicated below (collectively referred to as the “financial statements”). In our opinion, the financial statements present fairly, in all material respects, the financial position of each of the Funds as of February 28, 2022, the results of their operations, the changes in net assets, and the financial highlights for each of the periods indicated below in conformity with accounting principles generally accepted in the United States of America.
Fund Name |
Statements of |
Statements of |
Financial Highlights |
Hoya Capital Housing ETF |
For the year ended February 28, 2022 |
For the years ended February 28, 2022 and 2021 |
For the years ended February 28, 2022 and 2021 and for the period from March 19, 2019 (commencement of operations) through February 29, 2020 |
Hoya Capital High Dividend Yield ETF |
For the period from September 21, 2021 (commencement of operations) through February 28, 2022 |
||
Basis for Opinion
These financial statements are the responsibility of the Funds’ management. Our responsibility is to express an opinion on the Funds’ financial statements based on our audits. We are a public accounting firm registered with the Public Company Accounting Oversight Board (United States) (“PCAOB”) and are required to be independent with respect to the Funds in accordance with the U.S. federal securities laws and the applicable rules and regulations of the Securities and Exchange Commission and the PCAOB.
We conducted our audits in accordance with the standards of the PCAOB. Those standards require that we plan and perform the audit to obtain reasonable assurance about whether the financial statements are free of material misstatement whether due to error or fraud.
Our audits included performing procedures to assess the risks of material misstatement of the financial statements, whether due to error or fraud, and performing procedures that respond to those risks. Such procedures included examining, on a test basis, evidence regarding the amounts and disclosures in the financial statements. Our
36
Hoya Capital ETFs
Report of Independent Registered Public Accounting Firm
(Continued)
procedures included confirmation of securities owned as of February 28, 2022, by correspondence with the custodian. Our audits also included evaluating the accounting principles used and significant estimates made by management, as well as evaluating the overall presentation of the financial statements. We believe that our audits provide a reasonable basis for our opinion.
We have served as the Funds’ auditor since 2019.

COHEN & COMPANY, LTD.
Milwaukee, Wisconsin
April 28, 2022
37
Hoya Capital ETFs
Trustees and Officers
(Unaudited)
Additional information about each Trustee of the Trust is set forth below. The address of each Trustee of the Trust is c/o U.S. Bank Global Fund Services, 615 E. Michigan Street, Milwaukee, WI 53202.
Name and |
Position |
Term of |
Principal Occupation(s) |
Number of |
Other |
Independent Trustees |
|||||
Leonard M. Rush, CPA Born: 1946 |
Lead Independent Trustee and Audit Committee Chairman |
Indefinite term; |
Retired; formerly Chief Financial Officer, Robert W. Baird & Co. Incorporated (wealth management firm) (2000–2011). |
60 |
Independent Trustee, Managed Portfolio Series (34 portfolios) (since 2011). |
David A. Massart |
Trustee |
Indefinite term; |
Partner and Manager Director, Beacon Pointe Advisors, LLC (since 2022); Co-Founder, President, and Chief Investment Strategist, Next Generation Wealth Management, Inc. (2005-2021). |
60 |
Independent Trustee, Managed Portfolio Series (34 portfolios) (since 2011). |
Janet D. Olsen |
Trustee |
Indefinite term; |
Retired; formerly Managing Director and General Counsel, Artisan Partners Limited Partnership (investment adviser) (2000–2013); Executive Vice President and General Counsel, Artisan Partners Asset Management Inc. (2012–2013); Vice President and General Counsel, Artisan Funds, Inc. (investment company) (2001–2012). |
60 |
Independent Trustee, PPM Funds (3 portfolios) (since 2018). |
Interested Trustee |
|||||
Michael A. Castino Born: 1967 |
Trustee and Chairman |
Indefinite term; Trustee since 2014; Chairman since 2013 |
Senior Vice President, U.S. Bancorp Fund Services, LLC (since 2013); Managing Director of Index Services, Zacks Investment Management (2011–2013). |
60 |
None |
38
Hoya Capital ETFs
Trustees and Officers
(Unaudited) (Continued)
The officers of the Trust conduct and supervise its daily business. The address of each officer of the Trust is c/o U.S. Bank Global Fund Services, 615 E. Michigan Street, Milwaukee, WI 53202. Additional information about the Trust’s officers is as follows:
Name and |
Position(s) |
Term of |
Principal Occupation(s) During Past 5 Years |
Kristina R. Nelson Born: 1982 |
President |
Indefinite term; since 2019 |
Senior Vice President, U.S. Bancorp Fund Services, LLC (since 2020); Vice President, U.S. Bancorp Fund Services, LLC (2014–2020). |
Alyssa M. Bernard Born: 1988 |
Vice President |
Indefinite term; since 2021 |
Vice President, U.S. Bancorp Fund Services, LLC (since 2021); Assistant Vice President, U.S. Bancorp Fund Services, LLC (2018–2021); Attorney, Waddell & Reed Financial, Inc. (2017–2018). |
Elizabeth B. Scalf Born: 1985 |
Chief Compliance Officer and Anti-Money Laundering Officer |
Indefinite term; since 2021 |
Senior Vice President, U.S. Bancorp Fund Services, LLC (since 2017); Vice President and Assistant CCO, Heartland Advisors, Inc. (2016–2017); Vice President and CCO, Heartland Group, Inc. (2016). |
Kristen M. Weitzel Born: 1977 |
Treasurer |
Indefinite term; since 2014 (other roles since 2013) |
Vice President, U.S. Bancorp Fund Services, LLC (since 2015); Assistant Vice President, U.S. Bancorp Fund Services, LLC (2011–2015); Manager, PricewaterhouseCoopers LLP (accounting firm) (2005–2011). |
Isabella K. Zoller Born: 1994 |
Secretary |
Indefinite term; since 2021 (other roles since 2020) |
Assistant Vice President, U.S. Bancorp Fund Services, LLC (since 2021); Regulatory Administration Attorney, U.S. Bancorp Fund Services, LLC (since 2019); Regulatory Administration Intern, U.S. Bancorp Fund Services, LLC (2018–2019); Law Student (2016–2019). |
Elizabeth A. Winske Born: 1983 |
Assistant Treasurer |
Indefinite term; since 2017 |
Vice President, U.S. Bancorp Fund Services, LLC (since 2020); Assistant Vice President, U.S. Bancorp Fund Services, LLC (2016–2020). |
Jason E. Shlensky Born: 1987 |
Assistant Treasurer |
Indefinite term; since 2019 |
Assistant Vice President, U.S. Bancorp Fund Services, LLC (since 2019); Officer, U.S. Bancorp Fund Services, LLC (2014–2019). |
Jessica L. Vorbeck Born: 1984 |
Assistant Treasurer |
Indefinite term; since 2020 |
Officer, U.S. Bancorp Fund Services, LLC (since 2018; 2014-2017). |
39
Hoya Capital ETFs
Trustees and Officers
(Unaudited) (Continued)
Name and |
Position(s) |
Term of |
Principal Occupation(s) During Past 5 Years |
Cynthia L. Andrae Born: 1971 |
Deputy Chief Compliance Officer |
Indefinite term; since 2021 |
Vice President, U.S. Bancorp Fund Services, LLC (since 2019); Compliance Officer, U.S. Bancorp Fund Services, LLC (2015-2019). |
The Statement of Additional Information (“SAI”) includes additional information about the Trustees and is available without charge, upon request, by calling toll free (800) 617-0004, by accessing the SEC’s website at www.sec.gov, or by accessing the Funds’ website at hoyaetfs.com.
40
Hoya Capital ETFs
Expense Examples
For the Six-Months Ended February 28, 2022 (Unaudited)
As a shareholder of the Funds, you incur two types of costs: (1) transaction costs, including brokerage commissions on purchases and sales of the Funds shares, and (2) ongoing costs, including management fees and other Fund expenses. This example is intended to help you understand your ongoing costs (in dollars) of investing in the Funds and to compare these costs with the ongoing costs of investing in other funds. The example is based on an investment of $1,000 invested at the beginning of the period and held for the entire period as indicated in the following Expense Example Tables.
Actual Expenses
The first line of the table provides information about actual account values based on actual returns and actual expenses. You may use the information in this line, together with the amount you invested, to estimate the expenses that you paid over the period. Simply divide your account value by $1,000 (for example, an $8,600 account value divided by $1,000 = 8.6), then, multiply the result by the number in the first line under the heading entitled “Expenses Paid During the Period’’ to estimate the expenses you paid on your account during this period.
Hypothetical Example for Comparison Purposes
The second line of the table provides information about hypothetical account values based on a hypothetical return and hypothetical expenses based on the Funds’ actual expense ratio and an assumed rate of return of 5% per year before expenses, which is not the Funds’ actual return. The hypothetical account values and expenses may not be used to estimate the actual ending account balance or expenses you paid for the period. You may use this information to compare the ongoing costs of investing in the Funds and other funds. To do so, compare this 5% hypothetical example with the 5% hypothetical examples that appear in the shareholder reports of the other funds. Please note that the expenses shown in the table are meant to highlight your ongoing costs only and do not reflect any transactional costs, such as brokerage commissions paid on purchases and sales of Fund shares. Therefore, the second line of the table is useful in comparing ongoing costs only and will not help you determine the relative total costs of owning different funds. If these transactional costs were included, your costs would have been higher.
41
Hoya Capital ETFs
Expense Examples
For the Six-Months Ended February 28, 2022 (Unaudited) (Continued)
Hoya Capital Housing ETF |
|||
Beginning |
Ending |
Expenses |
|
Actual |
$1,000.00 |
$ 949.90 |
$1.45 |
Hypothetical (5% annual return before expenses) |
$1,000.00 |
$ 1,023.31 |
$1.51 |
(1) |
The dollar amounts shown as expenses paid during the period are equal to the annualized six-month net expense ratio, 0.30%, multiplied by the average account value during the period, multiplied by 181/365, to reflect the one-half year period. |
Hoya Capital High Dividend Yield ETF |
|||
Beginning |
Ending |
Expenses |
|
Actual |
$1,000.00 |
$ 986.50 |
$1.09(3) |
Hypothetical (5% annual return before expenses) |
$1,000.00 |
$ 1,023.55 |
$1.25(4) |
(2) |
Fund commencement. |
(3) |
The dollar amount shown as expenses paid during the period are equal to the annualized net expense ratio, 0.25% (fee waivers in effect during the period), multiplied by the average account value during the period, multiplied by 160/365, to reflect the current fiscal period. |
(4) |
The dollar amount shown as expenses paid during the period are equal to the annualized net expense ratio, 0.25% (fee waivers in effect during the period), multiplied by the average account value during the period, multiplied by 181/365, to reflect the one-half year period. |
42
Hoya Capital ETFs
Review of Liquidity Risk Management Program
(Unaudited)
Pursuant to Rule 22e-4 under the Investment Company Act of 1940, the Trust, on behalf of the series of the Trust covered by this shareholder report (the “Series”), has adopted a liquidity risk management program to govern the Trust’s approach to managing liquidity risk. Rule 22e-4 seeks to promote effective liquidity risk management, thereby reducing the risk that a fund will be unable to meet its redemption obligations and mitigating dilution of the interests of fund shareholders. The Trust’s liquidity risk management program is tailored to reflect the Series’ particular risks, but not to eliminate all adverse impacts of liquidity risk, which would be incompatible with the nature of such Series.
The investment adviser to the Series has adopted and implemented its own written liquidity risk management program (the “Program”) tailored specifically to assess and manage the liquidity risk of the Series.
At a recent meeting of the Board of Trustees of the Trust, the Trustees received a report pertaining to the operation, adequacy, and effectiveness of implementation of the Program for the period ended December 31, 2021. The report concluded that the Program is reasonably designed to assess and manage the Series’ liquidity risk and has operated adequately and effectively to manage such risk. The report reflected that there were no liquidity events that impacted the Series’ ability to timely meet redemptions without dilution to existing shareholders. The report further noted that no material changes have been made to the Program since its implementation.
There can be no assurance that the Program will achieve its objectives in the future. Please refer to the prospectus for more information regarding the Series’ exposure to liquidity risk and other principal risks to which an investment in the Series may be subject.
43
Hoya Capital Housing ETF
Approval of Advisory Agreement & Board Consideration
(Unaudited)
Pursuant to Section 15(c) of the Investment Company Act of 1940 (the “1940 Act”), at a meeting held January 19-20, 2022 (the “Meeting”), the Board of Trustees (the “Board”) of ETF Series Solutions (the “Trust”) considered the approval of the continuation of the Investment Advisory Agreement (the “Advisory Agreement”) between Hoya Capital Real Estate, LLC (the “Adviser”) and the Trust, on behalf of Hoya Capital Housing ETF (the “Fund”).
Prior to the Meeting, the Board, including the Trustees who are not parties to the Advisory Agreement or “interested persons” of any party thereto, as defined in the 1940 Act (the “Independent Trustees”), reviewed written materials from the Adviser (the “Materials”) regarding, among other things: (i) the nature, extent, and quality of the services provided by the Adviser; (ii) the historical performance of the Fund; (iii) the cost of the services provided and the profits realized by the Adviser from services rendered to the Fund; (iv) comparative fee and expense data for the Fund and other investment companies with similar investment objectives; (v) the extent to which any economies of scale realized by the Adviser in connection with its services to the Fund are shared with Fund shareholders; and (vi) other factors the Board deemed to be relevant.
The Board also considered that the Adviser, along with other service providers of the Fund, presented written information to help the Board evaluate the Adviser’s fees and other aspects of the Advisory Agreement. Additionally, a representative from the Adviser provided an oral overview of the Fund’s strategy, the services provided to the Fund by the Adviser, and additional information about the Adviser’s personnel and business. The Board then discussed the written materials and oral presentation that it had received and any other information that the Board received at the Meeting and deliberated on the approval of the Advisory Agreement in light of this information.
Approval of the Continuation of the Advisory Agreement with the Adviser
Nature, Extent, and Quality of Services Provided. The Trustees considered the scope of services provided under the Advisory Agreement, noting that the Adviser would continue to provide investment management services to the Fund. In considering the nature, extent, and quality of the services provided by the Adviser, the Board considered the quality of the Adviser’s compliance program and past reports from the Trust’s Chief Compliance Officer. The Board also considered its previous experience with the Adviser providing investment management services to the Fund. The Board noted that it had received a copy of the Adviser’s registration form, as well as the response of the Adviser to a detailed series of questions which included, among other things, information about the background and experience of the firm’s key personnel, the firm’s cybersecurity policy, and the services provided by the Adviser.
44
Hoya Capital Housing ETF
APPROVAL OF ADVISORY AGREEMENT & BOARD CONSIDERATION
(Unaudited) (Continued)
The Board also considered other services currently provided by the Adviser to the Fund, such as monitoring adherence to the Fund’s investment restrictions, oversight of the sub-adviser, monitoring compliance with various policies and procedures and with applicable securities regulations, and monitoring the extent to which the Fund achieved its investment objective as a passively-managed fund. The Board further considered the oral information provided by the Adviser with respect to the impact of the COVID-19 pandemic on the Adviser’s operations.
Additionally, the Board considered that Hoya Capital Index Innovations, LLC (“HCII”), an affiliate of the Adviser, acts as index provider to the Fund, which tracks an index created by HCII based on HCII’s intellectual property. The Board noted the Adviser’s belief that shareholders will invest in the Fund based on the exposure to the U.S. residential housing industry that HCII’s index seeks to provide, and the expectation that the Adviser will provide advisory services to the Fund based on the index.
Historical Performance. The Board noted that information regarding the Fund’s performance for various time periods had been included in the Materials. The Board considered the Fund’s past investment performance, including for periods ended September 30, 2021. Because the Fund is designed to track the performance of an index, the Board considered, among other things, the extent to which the Fund tracked its index before fees and expenses. The Fund’s underlying index is the Hoya Capital Housing 100 Index, which tracks 100 companies collectively representing the performance of the U.S. residential housing industry and spending on housing and housing-related services in the U.S. The Board noted that, for the one-year and since inception periods, the Fund underperformed its underlying index, before fees and expenses.
The Board also considered that for the one-year and since inception periods, the Fund outperformed the S&P 500 Index, which provides an indication of the performance of the overall U.S. stock market. The Board also considered that for the one-year period, the Fund underperformed the S&P MidCap 400 Total Return Index, which provides an indication of the performance of approximately 400 U.S. mid-capitalization companies, and for the since inception period, the Fund outperformed the S&P MidCap 400 Total Return Index. The Board further noted that, for the one-year period, the Fund outperformed the median for the other funds in the universe of U.S. Mid-Cap Value ETFs as reported by Morningstar (collectively, the “Category Peer Group”).
The Board also considered the Fund’s performance relative to its competitors identified by the Adviser at the Board’s request of other funds that are focused on homebuilding or residential real estate (the “Selected Peer Group”). The Board noted that, for the one-year period ended September 30, 2021, the Fund’s performance was within the range of performance of the Selected Peer Group.
45
Hoya Capital Housing ETF
APPROVAL OF ADVISORY AGREEMENT & BOARD CONSIDERATION
(Unaudited) (Continued)
Cost of Services Provided and Economies of Scale. The Board compared the Fund’s expense ratio to its Category Peer Group and the Selected Peer Group. The Board noted that the net expense ratio for the Fund was lower than the median for funds in the Category Peer Group, and was within the range of net expense ratios of the funds in the Selected Peer Group.
The Board took into consideration that the Adviser would continue to charge a “unified fee,” meaning the Fund pays no expenses other than the advisory fee and, if incurred, certain other costs such as interest, brokerage, acquired fund fees and expenses, extraordinary expenses, and, to the extent it is implemented, fees pursuant to a Distribution and/or Shareholder Servicing (12b-1) Plan. The Board noted that the Adviser continued to be responsible for compensating the Trust’s other service providers and paying the Fund’s other expenses out of its own fee and resources. The Board also evaluated the compensation and benefits received by the Adviser from its relationship with the Fund, taking into account analyses of the Adviser’s profitability with respect to the Fund.
The Board expressed the view that it currently appeared that the Adviser might realize economies of scale in managing the Fund as assets grow in size. The Board noted that, should the Adviser realize economies of scale in the future, the amount and structure of the Fund’s unitary fee might result in a sharing of those economies with Fund shareholders. The Board noted its intention to monitor fees as the Fund grows in size and assess whether fee breakpoints may be warranted.
Conclusion. No single factor was determinative of the Board’s decision to approve the continuation of the Advisory Agreement; rather, the Board based its determination on the total mix of information available to it. Based on a consideration of all the factors in their totality, the Board, including a majority of the Independent Trustees, determined that the Advisory Agreement, including the compensation payable under the agreement, was fair and reasonable to the Fund. The Board, including a majority of the Independent Trustees, therefore determined that the approval of the continuation of the Advisory Agreement was in the best interests of the Fund and its shareholders.
46
Hoya Capital High Dividend Yield ETF
APPROVAL OF ADVISORY AGREEMENTS & BOARD CONSIDERATIONS
(Unaudited)
Pursuant to Section 15(c) of the Investment Company Act of 1940 (the “1940 Act”), at a meeting held on July 21-22, 2021 (the “Meeting”), the Board of Trustees (the “Board”) of ETF Series Solutions (the “Trust”) considered the approval of the Investment Advisory Agreement (the “Advisory Agreement”) between Hoya Capital Real Estate, LLC (the “Adviser”) and the Trust, on behalf of Hoya Capital High Dividend Yield ETF (the “Fund”), and the Investment Sub-Advisory Agreement (the “Sub-Advisory Agreement”) (together, the “Agreements”) among the Adviser, the Trust, on behalf of the Fund, and Penserra Capital Management, LLC (“Penserra” or the “Sub-Adviser”), each for an initial two-year term.
Prior to the Meeting, the Board, including the Trustees who are not parties to the Agreements or “interested persons” of any party thereto, as defined in the 1940 Act (the “Independent Trustees”), reviewed written materials from the Adviser and Sub-Adviser (the “Materials”) regarding, among other things: (i) the nature, extent, and quality of the services to be provided by the Adviser and Sub-Adviser; (ii) the cost of the services to be provided and the profits expected to be realized by the Adviser, Sub-Adviser, or their affiliates from services rendered to the Fund; (iii) comparative fee and expense data for the Fund and other investment companies with similar investment objectives; (iv) the extent to which any economies of scale might be realized as the Fund grows and whether the advisory fee for the Fund reflects these economies of scale for the benefit of the Fund; and (v) any other financial benefits to the Adviser, Sub-Adviser, and their affiliates resulting from services rendered to the Fund.
The Board also considered that the Adviser and Sub-Adviser, along with other service providers of the Fund, had provided written updates on the firm over the course of the year with respect to their roles as investment adviser and sub-adviser to other series in the Trust, and the Board considered that information alongside the Materials in its evaluation of the Adviser’s and Sub-Adviser’s fees and other aspects of the Agreements. Additionally, representatives from the Adviser provided an oral overview of the Fund’s strategy, the services to be provided to the Fund by the Adviser, and additional information about the Adviser’s personnel and operations. The Board then discussed the Materials, the Adviser’s oral presentation, and any other information that the Board received at the Meeting, and deliberated on the approval of the Agreements in light of this information.
Approval of the Advisory Agreement with the Adviser
Nature, Extent, and Quality of Services to be Provided. The Trustees considered the scope of services to be provided under the Advisory Agreement, noting that the Adviser will be providing investment management services to the Fund. In considering the nature, extent, and quality of the services to be provided by the Adviser, the Board considered the quality of the Adviser’s compliance infrastructure and past reports from the Trust’s Chief Compliance Officer (“CCO”) regarding his review of the Adviser’s compliance program, as well as the Board’s experience with the Adviser as the investment adviser to another series of the Trust. The Board noted that it had previously received a copy of the Adviser’s registration form, as well as the response of the Adviser to a detailed series of questions that included, among other things, information about the Adviser’s decision-making process, details about the Fund, and the services to be provided by the Adviser.
The Board also considered other services to be provided to the Fund, such as monitoring adherence to the Fund’s investment restrictions, sub-adviser oversight, monitoring compliance with various of the Fund’s policies and procedures and with applicable securities regulations, and monitoring the extent to which the Fund achieves its investment objective as a passively-managed fund. The Board noted that an affiliate of the Adviser was the index provider for the Fund, while the sub-adviser would be responsible for implementing a replication or sampling strategy to track the performance of the index. The Board considered that, because an affiliate of the Adviser is the index provider, the Adviser may have certain conflicts of interest with respect to the management of the index, but noted that the Adviser had adopted policies and procedures to mitigate such conflicts. The Board further considered the oral information provided by the Adviser with respect to the impact of the COVID-19 pandemic on the Adviser’s operations.
Historical Performance. The Board noted that the Fund had not yet commenced operations and concluded that the performance of the Fund, thus, was not a relevant factor in the context of the Board’s deliberations on the Advisory Agreement. The Board also considered that the Fund is designed to track the performance of an index. Consequently, with respect to the Fund’s performance, the Board in the future would focus on the Adviser’s services, including its oversight of the Sub-Adviser’s day-to-day management of the Fund in seeking to track the index as closely as possible.
47
Hoya Capital High Dividend Yield ETF
APPROVAL OF ADVISORY AGREEMENTS & BOARD CONSIDERATIONS
(Unaudited) (Continued)
Cost of Services to be Provided and Economies of Scale. The Board then reviewed the Fund’s proposed expense ratio, the full amount of which was anticipated to be the “unified fee” described below, and compared the Fund’s expense ratio to its Category Peer Group and Selected Peer Group (each defined below). The Board noted that the expense ratio for the Fund was higher than the median of other funds in the universe of Real Estate ETFs as reported by Morningstar (the “Category Peer Group”). The Board also noted that the Fund’s proposed expense ratio was in line with the expense ratios for the Fund’s competitors identified by the Adviser that are focused on higher-yielding real estate securities (the “Selected Peer Group”). The Board further noted that the Adviser has contractually agreed to a reduction in the Fund’s unitary management fee for at least one year following the commencement of operations, which would make the Fund’s expense ratio lower than the median for the Category Peer Group and among the lowest of funds in the Selected Peer Group.
The Board took into consideration that the Adviser would charge a “unified fee,” meaning the Fund would pay no expenses other than the advisory fee and certain other costs such as interest, brokerage, acquired fund fees and expenses, extraordinary expenses and, to the extent it is implemented, fees pursuant to a Distribution and/or Shareholder Servicing (12b-1) Plan. The Board noted that the Adviser would be responsible for compensating the Trust’s other service providers and paying the Fund’s other expenses out of its own fee and resources. The Board also evaluated the compensation and benefits expected to be received by the Adviser from its relationship with the Fund, taking into account an analysis of the Adviser’s anticipated profitability with respect to the Fund and the financial resources the Adviser had committed and proposed to commit to its business. The Board determined such analyses were not a significant factor given that the Fund had not yet commenced operations and consequently, the future size of the Fund and the Adviser’s future profitability were generally unpredictable.
The Board expressed the view that the Adviser might realize economies of scale in managing the Fund as assets grow in size. The Board noted that, should the Adviser realize economies of scale in the future, the amount and structure of the Fund’s unitary fee might result in a sharing of those economies with Fund shareholders in the initial period of such Fund’s operations. The Board noted its intention to monitor fees as the Fund grows in size and assess whether fee breakpoints may be warranted.
Conclusion. No single factor was determinative of the Board’s decision to approve the Advisory Agreement; rather, the Board based its determination on the total mix of information available to it. Based on a consideration of all the factors in their totality, the Board, including a majority of the Independent Trustees, determined that the Advisory Agreement, including the compensation payable under the agreement, was fair and reasonable to the Fund. The Board, including a majority of the Independent Trustees, therefore determined that the approval of the Advisory Agreement was in the best interests of the Fund and its shareholders.
Approval of the Sub-Advisory Agreement with the Sub-Adviser
Nature, Extent, and Quality of Services to be Provided. The Board considered the scope of services to be provided to the Fund under the Sub-Advisory Agreement, noting that Penserra will be providing investment management services to the Fund and currently serves as sub-adviser to other series in the Trust. The Board noted the responsibilities that the Sub-Adviser would have as Fund’s investment sub-adviser, including: responsibility for the general management of the day-to-day investment and reinvestment of the assets of the Fund; determining the daily baskets of deposit securities and cash components; executing portfolio security trades for purchases and redemptions of the Fund’s shares conducted on a cash-in-lieu basis; oversight of general portfolio compliance with applicable securities laws, regulations, and investment restrictions; responsibility for daily monitoring of tracking error and quarterly reporting to the Board; and implementation of Board directives as they relate to the Fund.
In considering the nature, extent, and quality of the services to be provided by the Sub-Adviser, the Board considered reports of the Trust’s CCO with respect to the Sub-Adviser’s compliance program and the Sub-Adviser’s experience providing investment management services to other ETFs, including other series of the Trust. The Trustees further noted that they had received and reviewed the Materials with regard to the Sub-Adviser and they had reviewed additional detailed information about the Sub-Adviser at previous Board meetings. The Board also considered the Sub-Adviser’s resources and capacity with respect to portfolio management, compliance, and operations given the number of funds for which it would serve as sub-adviser. The Board further considered information provided by the Sub-Adviser with respect to the impact of the COVID-19 pandemic on the Sub-Adviser’s operations.
48
Hoya Capital High Dividend Yield ETF
APPROVAL OF ADVISORY AGREEMENTS & BOARD CONSIDERATIONS
(Unaudited) (Continued)
Historical Performance. The Board noted that the Fund had not yet commenced operations. Consequently, the Board determined that performance was not a relevant consideration in the context of the Board’s deliberations on the Sub-Advisory Agreement. The Board also considered that the Fund is designed to track the performance of an index. Consequently, with respect to the Fund’s performance, the Board in the future would focus on the Sub-Adviser’s services, including whether the Fund’s performance exhibited significant tracking error.
Costs of Services to be Provided and Economies of Scale. The Board reviewed the advisory fee to be paid by the Adviser to the Sub-Adviser for its services to the Fund. The Board considered the fees to be paid to the Sub-Adviser would be paid by the Adviser from the fee the Adviser receives from the Fund and noted that the fee reflected an arm’s-length negotiation between the Adviser and the Sub-Adviser. The Board further determined the fee reflected an appropriate allocation of the advisory fee paid to each adviser given the work performed by each firm and noted that the fees were generally in line with those charged by the Sub-Adviser in connection with other funds managed by the Sub-Adviser. The Board noted that the Sub-Adviser has an affiliated broker-dealer that was expected to execute some or all of the brokerage transactions for the Fund, and consequently, the Sub-Adviser would indirectly benefit from commissions paid to such affiliated broker-dealer. The Board also evaluated the compensation and benefits expected to be received by the Sub-Adviser from its relationship with the Fund, taking into account an analysis of the Sub-Adviser’s estimated profitability with respect to the Fund.
The Board expressed the view that it currently appeared that the Sub-Adviser might realize economies of scale in managing the Fund as assets grow in size. The Board determined that it would monitor fees as the Fund’s assets grow to determine whether economies of scale were being effectively shared with the Fund and its shareholders.
Conclusion. No single factor was determinative of the Board’s decision to approve the Sub-Advisory Agreement; rather, the Board based its determination on the total mix of information available to it. Based on a consideration of all the factors in their totality, the Board, including a majority of the Independent Trustees, determined that the Sub-Advisory Agreement, including the compensation payable under the agreement, was fair and reasonable to the Fund. The Board, including a majority of the Independent Trustees, therefore determined that the approval of the Sub-Advisory Agreement was in the best interests of the Fund and its shareholders.
49
Hoya Capital ETFs
Federal Tax Information
(Unaudited)
For the fiscal year ended February 28, 2022, certain dividends paid by the Funds may be subject to the maximum tax rate of 23.8%, as provided for by the Jobs and Growth Tax Relief Reconciliation Act of 2003.
The percentage of dividends declared from ordinary income designated as qualified dividend income was as follows:
Hoya Capital Housing ETF |
83.72 | % | |||||
Hoya Capital High Dividend Yield ETF |
2.55 | % | |||||
For corporate shareholders, the percentage of ordinary income distributions qualifying for the corporate dividends received deduction for the fiscal year ended February 28, 2022 was as follows:
Hoya Capital Housing ETF |
82.68 | % | |||||
Hoya Capital High Dividend Yield ETF |
0.00 | % | |||||
The percentage of taxable ordinary income distributions that are designated as short-term capital gain distributions under Internal Revenue Section 871(k)(2)(C) for each Fund was as follows:
Hoya Capital Housing ETF |
0.00 | % | |||||
Hoya Capital High Dividend Yield ETF |
15.45 | % | |||||
Information About Portfolio Holdings
(Unaudited)
The Funds file their complete schedules of portfolio holdings for their first and third fiscal quarters with the SEC on Part F of Form N-PORT. The Funds’ Part F of Form N-PORT are available without charge, upon request, by calling toll-free at (800) 617-0004 or by accessing the Funds’ website at hoyaetfs.com. Furthermore, you may obtain the Part F of Form N-PORT on the SEC’s website at www.sec.gov. The Funds’ portfolio holdings are posted on their website at hoyaetfs.com daily.
50
Hoya Capital ETFs
Information About Proxy Voting
(Unaudited)
A description of the policies and procedures the Funds use to determine how to vote proxies relating to portfolio securities is provided in the SAI. The SAI is available without charge, upon request, by calling tollfree at (800) 617-0004, by accessing the SEC’s website at www.sec.gov, or by accessing the Funds’ website at hoyaetfs.com.
When available, information regarding how the Funds voted proxies relating to portfolio securities during the twelve-months ending June 30 is available by calling tollfree at (800) 617-0004 or by accessing the SEC’s website at www.sec.gov.
Frequency Distribution of Premiums and Discounts
(Unaudited)
Information regarding how often shares of the Funds trade on the exchange at a price above (i.e., at a premium) or below (i.e., at a discount) the NAV of the Funds is available, without charge, on the Funds’ website at hoyaetfs.com.
51
(This Page Intentionally Left Blank.)
Adviser
Hoya Capital Real Estate, LLC
137 Rowayton Avenue, Suite 430
Rowayton, Connecticut 06853
Index Provider
Hoya Capital Index Innovations, LLC
133 Rowayton Avenue, Suite C
Rowayton, Connecticut 06853
Sub-Adviser
Penserra Capital Management, LLC
4 Orinda Way, Suite 100-A
Orinda, California 94563
Distributor
Quasar Distributors, LLC
111 East Kilbourn Avenue, Suite 2200
Milwaukee, Wisconsin 53202
Custodian
U.S. Bank National Association
1555 North Rivercenter Drive, Suite 302
Milwaukee, Wisconsin 53212
Transfer Agent
U.S. Bancorp Fund Services, LLC
615 East Michigan Street
Milwaukee, Wisconsin 53202
Independent Registered Public Accounting Firm
Cohen & Company, Ltd.
342 North Water Street, Suite 830
Milwaukee, Wisconsin 53202
Legal Counsel
Morgan, Lewis & Bockius LLP
1111 Pennsylvania Avenue, NW
Washington, DC 20004
Hoya Capital Housing ETF
Symbol – HOMZ
CUSIP – 26922A230
Hoya Capital High Dividend Yield ETF
Symbol – RIET
CUSIP – 26922B840
| (b) | Not applicable. |
Item 2. Code of Ethics.
The registrant has adopted a code of ethics that applies to the registrant's principal executive officer and principal financial officer. The registrant has not made any amendments to its code of ethics during the period covered by this report. The registrant has not granted any waivers from any provisions of the code of ethics during the period covered by this report.
A copy of the registrant's Code of Ethics is filed herewith.
Item 3. Audit Committee Financial Expert.
The registrant's board of trustees has determined that there is at least one audit committee financial expert serving on its audit committee. Mr. Leonard Rush is the "audit committee financial expert" and is considered to be "independent" as each term is defined in Item 3 of Form N-CSR.
Item 4. Principal Accountant Fees and Services.
The registrant has engaged its principal accountant to perform audit services, audit-related services, tax services and other services during the past two fiscal years. "Audit services" refer to performing an audit of the registrant's annual financial statements or services that are normally provided by the accountant in connection with statutory and regulatory filings or engagements for those fiscal years. "Audit-related services" refer to the assurance and related services by the principal accountant that are reasonably related to the performance of the audit. "Tax services" refer to professional services rendered by the principal accountant for tax compliance, tax advice, and tax planning. There were no "Other services" provided by the principal accountant. The following table details the aggregate fees billed or expected to be billed for each of the last two fiscal years for audit fees, audit-related fees, tax fees and other fees by the principal accountant.
Hoya Capital Housing ETF
| FYE 2/28/2022 | FYE 2/28/2021 | |
| Audit Fees | $14,500 | $14,500 |
| Audit-Related Fees | N/A | N/A |
| Tax Fees | $4,500 | $4,500 |
| All Other Fees | N/A | N/A |
Hoya Capital High Dividend Yield ETF
| FYE 2/28/2022 | FYE 2/28/2021 | |
| Audit Fees | $14,500 | N/A |
| Audit-Related Fees | N/A | N/A |
| Tax Fees | $3,500 | N/A |
| All Other Fees | N/A | N/A |
The audit committee has adopted pre-approval policies and procedures that require the audit committee to pre-approve all audit and non-audit services of the registrant, including services provided to any entity affiliated with the registrant.
The percentage of fees billed by Cohen & Company, Ltd. applicable to non-audit services pursuant to waiver of pre-approval requirement were as follows:
Hoya Capital Housing ETF
| FYE 2/28/2022 | FYE 2/28/2021 | |
| Audit-Related Fees | 0% | 0% |
| Tax Fees | 0% | 0% |
| All Other Fees | 0% | 0% |
Hoya Capital High Dividend Yield ETF
| FYE 2/28/2022 | FYE 2/28/2021 | |
| Audit-Related Fees | 0% | N/A |
| Tax Fees | 0% | N/A |
| All Other Fees | 0% | N/A |
All of the principal accountant's hours spent on auditing the registrant's financial statements were attributed to work performed by full-time permanent employees of the principal accountant.
The following table indicates the non-audit fees billed or expected to be billed by the registrant's accountant for services to the registrant and to the registrant's investment adviser (and any other controlling entity, etc.—not sub-adviser) for the last two years.
Hoya Capital Housing ETF
| Non-Audit Related Fees | FYE 2/28/2022 | FYE 2/28/2021 |
| Registrant | N/A | N/A |
| Registrant's Investment Adviser | N/A | N/A |
Hoya Capital High Dividend Yield ETF
| Non-Audit Related Fees | FYE 2/28/2022 | FYE 2/28/2021 |
| Registrant | N/A | N/A |
| Registrant's Investment Adviser | N/A | N/A |
The registrant has not been identified by the U.S. Securities and Exchange Commission as having filed an annual report issued by a registered public accounting firm branch or office that is located in a foreign jurisdiction where the Public Company Accounting Oversight Board is unable to inspect or completely investigate because of a position taken by an authority in that jurisdiction.
The registrant is not a foreign issuer.
Item 5. Audit Committee of Listed Registrants.
| (a) | The registrant is an issuer as defined in Rule 10A-3 under the Securities Exchange Act of 1934, (the "Act") and has a separately-designated standing audit committee established in accordance with Section 3(a)(58)(A) of the Act. The independent members of the committee are as follows: David A. Massart, Leonard M. Rush and Janet D. Olsen. |
| (b) | Not applicable. |
Item 6. Investments.
Schedule of Investments is included as part of the report to shareholders filed under Item 1 of this Form.
Item 7. Disclosure of Proxy Voting Policies and Procedures for Closed-End Management Investment Companies.
Not applicable to open-end investment companies.
Item 8. Portfolio Managers of Closed-End Management Investment Companies.
Not applicable to open-end investment companies.
Item 9. Purchases of Equity Securities by Closed-End Management Investment Company and Affiliated Purchasers.
Not applicable to open-end investment companies.
Item 10. Submission of Matters to a Vote of Security Holders.
There have been no material changes to the procedures by which shareholders may recommend nominees to the registrant's board of trustees.
Item 11. Controls and Procedures.
| (a) | The Registrant's President (principal executive officer) and Treasurer (principal financial officer) have reviewed the Registrant's disclosure controls and procedures (as defined in Rule 30a-3(c) under the Investment Company Act of 1940 (the "Act")) as of a date within 90 days of the filing of this report, as required by Rule 30a-3(b) under the Act and Rules 13a-15(b) or 15d-15(b) under the Securities Exchange Act of 1934. Based on their review, such officers have concluded that the disclosure controls and procedures are effective in ensuring that information required to be disclosed in this report is appropriately recorded, processed, summarized and reported and made known to them by others within the Registrant and by the Registrant's service provider. |
| (b) | There were no changes in the Registrant's internal control over financial reporting (as defined in Rule 30a-3(d) under the Act) that occurred during the period covered by this report that have materially affected, or are reasonably likely to materially affect, the Registrant's internal control over financial reporting. |
Item 12. Disclosure of Securities Lending Activities for Closed-End Management Investment Companies.
Not applicable to open-end investment companies.
Item 13. Exhibits.
| (a) | (1) Any code of ethics or amendment thereto, that is the subject of the disclosure required by Item 2, to the extent that the registrant intends to satisfy Item 2 requirements through filing an exhibit. Filed herewith. |
(2) A separate certification for each principal executive officer and principal financial officer pursuant to Section 302 of the Sarbanes-Oxley Act of 2002. Filed herewith.
(3) Any written solicitation to purchase securities under Rule 23c-1 under the Act sent or given during the period covered by the report by or on behalf of the registrant to 10 or more persons. Not applicable to open-end investment companies.
(4) Change in the registrant's independent public accountant. There was no change in the registrant's independent public accountant for the period covered by this report.
| (b) | Certifications pursuant to Section 906 of the Sarbanes-Oxley Act of 2002. Furnished herewith. |
SIGNATURES
Pursuant to the requirements of the Securities Exchange Act of 1934 and the Investment Company Act of 1940, the registrant has duly caused this report to be signed on its behalf by the undersigned, thereunto duly authorized.
| (Registrant) | ETF Series Solutions | |
| By (Signature and Title)* | /s/ Kristina R. Nelson | |
| Kristina R. Nelson, President (principal executive officer) | ||
| Date | 05/24/2022 |
Pursuant to the requirements of the Securities Exchange Act of 1934 and the Investment Company Act of 1940, this report has been signed below by the following persons on behalf of the registrant and in the capacities and on the dates indicated.
| By (Signature and Title)* | /s/ Kristina R. Nelson | |
| Kristina R. Nelson, President (principal executive officer) | ||
| Date | 05/24/2022 |
|
| By (Signature and Title)* | /s/ Kristen M. Weitzel | |
| Kristen M. Weitzel, Treasurer (principal financial officer) | ||
| Date | 05/24/2022 |
ETF Series Solutions
Code of Ethics
For Principal Executive Officer & Principal Financial Officer
This Code of Ethics is designed to comply with Section 406 of the Sarbanes-Oxley Act of 2002 and the rules promulgated by the Securities and Exchange Commission (the "SEC") thereunder. This Code of Ethics is in addition to, not in replacement of, the ETF Series Solutions (the "Trust") Code of Ethics for access persons (the "Investment Company Code of Ethics"), adopted pursuant to Rule 17j-1 under the Investment Company Act of 1940, as amended (the "Investment Company Act"). The persons covered by this Code of Ethics may also be subject to the Investment Company Code of Ethics.
The Trust requires its Principal Executive Officer, Principal Financial Officer, or other Trust officers performing similar functions (the "Principal Officers"), to maintain the highest ethical and legal standards while performing their duties and responsibilities to the Trust and each of its series (each a "Fund," collectively the "Funds"), with particular emphasis on those duties that relate to the preparation and reporting of the financial information of the Funds. The following principles and responsibilities shall govern the professional conduct of the Principal Officers:
1. HONEST AND ETHICAL CONDUCT.
The Principal Officers shall act with honesty and integrity, avoiding actual or apparent conflicts of interest in personal and professional relationships, and shall report any material transaction or relationship that reasonably could be expected to give rise to such conflict between their interests and those of a Fund to the Audit Committee, the full Board of Trustees of the Trust, and, in addition, to any other appropriate person or entity that may reasonably be expected to deal with any conflict of interest in timely and expeditious manner.
The Principal Officers shall act in good faith, responsibly, with due care, competence and diligence, without misrepresenting material facts or allowing their independent judgment to be subordinated or compromised.
2. FINANCIAL RECORDS AND REPORTING
The Principal Officers shall provide full, fair, accurate, timely and understandable disclosure in the reports and/or other documents to be filed with or submitted to the Securities and Exchange Commission or other applicable body by a Fund, or that is otherwise publicly disclosed or communicated. The Principal Officers shall comply with applicable rules and regulations of federal, state, and local governments, and other appropriate private and public regulatory agencies.
The Principal Officers shall respect the confidentiality of information acquired in the course of their work and shall not disclose such information except when authorized or legally obligated to disclose. The Principal Officers will not use confidential information acquired in the course of their duties as Principal Officers.
The Principal Officers shall share knowledge and maintain skills important and relevant to the Trust's needs; shall proactively promote ethical behavior of the Trust's employees and with industry peers and associates; and shall maintain control over and responsibly manage assets and resources employed or entrusted to them by the Trust.
3. COMPLIANCE WITH LAWS, RULES AND REGULATIONS
The Principal Officers shall establish and maintain mechanisms to oversee the compliance of the Funds with applicable federal, state or local law, regulation or administrative rule, and to identify, report and correct in a swift and certain manner, any detected deviations from applicable federal, state or local law regulation or rule.
4. COMPLIANCE WITH THIS CODE OF ETHICS
The Principal Officers shall promptly report any violations of this Code of Ethics to the Audit Committee as well as the full Board of Trustees of the Trust and shall be held accountable for strict adherence to this Code of Ethics. A proven failure to uphold the standards stated herein shall be grounds for such sanctions as shall be reasonably imposed by the Board of Trustees of the Trust.
5. AMENDMENT AND WAIVER
This Code of Ethics may only be amended or modified by approval of the Board of Trustees. Any substantive amendment that is not technical or administrative in nature or any material waiver, implicit or otherwise, of any provision of this Code of Ethics, shall be communicated publicly in accordance with Item 2 of Form N-CSR under the Investment Company Act of 1940.
Adopted: March 27, 2012
CERTIFICATIONS
I, Kristina R. Nelson, certify that:
| 1. | I have reviewed this report on Form N-CSR of ETF Series Solutions; |
| 2. | Based on my knowledge, this report does not contain any untrue statement of a material fact or omit to state a material fact necessary to make the statements made, in light of the circumstances under which such statements were made, not misleading with respect to the period covered by this report; |
| 3. | Based on my knowledge, the financial statements, and other financial information included in this report, fairly present in all material respects the financial condition, results of operations, changes in net assets, and cash flows (if the financial statements are required to include a statement of cash flows) of the registrant as of, and for, the periods presented in this report; |
| 4. | The registrant's other certifying officer(s) and I are responsible for establishing and maintaining disclosure controls and procedures (as defined in Rule 30a-3(c) under the Investment Company Act of 1940) and internal control over financial reporting (as defined in Rule 30a-3(d) under the Investment Company Act of 1940) for the registrant and have: |
| (a) | Designed such disclosure controls and procedures, or caused such disclosure controls and procedures to be designed under our supervision, to ensure that material information relating to the registrant, including its consolidated subsidiaries, is made known to us by others within those entities, particularly during the period in which this report is being prepared; |
| (b) | Designed such internal control over financial reporting, or caused such internal control over financial reporting to be designed under our supervision, to provide reasonable assurance regarding the reliability of financial reporting and the preparation of financial statements for external purposes in accordance with generally accepted accounting principles; |
| (c) | Evaluated the effectiveness of the registrant's disclosure controls and procedures and presented in this report our conclusions about the effectiveness of the disclosure controls and procedures, as of a date within 90 days prior to the filing date of this report based on such evaluation; and |
| (d) | Disclosed in this report any change in the registrant's internal control over financial reporting that occurred during the period covered by this report that has materially affected, or is reasonably likely to materially affect, the registrant's internal control over financial reporting; and |
| 5. | The registrant's other certifying officer(s) and I have disclosed to the registrant's auditors and the audit committee of the registrant's board of directors (or persons performing the equivalent functions): |
| (a) | All significant deficiencies and material weaknesses in the design or operation of internal control over financial reporting which are reasonably likely to adversely affect the registrant's ability to record, process, summarize, and report financial information; and |
| (b) | Any fraud, whether or not material, that involves management or other employees who have a significant role in the registrant's internal control over financial reporting. |
| Date: | 05/24/2022 |
/s/ Kristina R. Nelson | ||
| Kristina R. Nelson | ||||
| President (principal executive officer) | ||||
| ETF Series Solutions |
CERTIFICATIONS
I, Kristen M. Weitzel, certify that:
| 1. | I have reviewed this report on Form N-CSR of ETF Series Solutions; |
| 2. | Based on my knowledge, this report does not contain any untrue statement of a material fact or omit to state a material fact necessary to make the statements made, in light of the circumstances under which such statements were made, not misleading with respect to the period covered by this report; |
| 3. | Based on my knowledge, the financial statements, and other financial information included in this report, fairly present in all material respects the financial condition, results of operations, changes in net assets, and cash flows (if the financial statements are required to include a statement of cash flows) of the registrant as of, and for, the periods presented in this report; |
| 4. | The registrant's other certifying officer(s) and I are responsible for establishing and maintaining disclosure controls and procedures (as defined in Rule 30a-3(c) under the Investment Company Act of 1940) and internal control over financial reporting (as defined in Rule 30a-3(d) under the Investment Company Act of 1940) for the registrant and have: |
| (a) | Designed such disclosure controls and procedures, or caused such disclosure controls and procedures to be designed under our supervision, to ensure that material information relating to the registrant, including its consolidated subsidiaries, is made known to us by others within those entities, particularly during the period in which this report is being prepared; |
| (b) | Designed such internal control over financial reporting, or caused such internal control over financial reporting to be designed under our supervision, to provide reasonable assurance regarding the reliability of financial reporting and the preparation of financial statements for external purposes in accordance with generally accepted accounting principles; |
| (c) | Evaluated the effectiveness of the registrant's disclosure controls and procedures and presented in this report our conclusions about the effectiveness of the disclosure controls and procedures, as of a date within 90 days prior to the filing date of this report based on such evaluation; and |
| (d) | Disclosed in this report any change in the registrant's internal control over financial reporting that occurred during the period covered by this report that has materially affected, or is reasonably likely to materially affect, the registrant's internal control over financial reporting; and |
| 5. | The registrant's other certifying officer(s) and I have disclosed to the registrant's auditors and the audit committee of the registrant's board of directors (or persons performing the equivalent functions): |
| (a) | All significant deficiencies and material weaknesses in the design or operation of internal control over financial reporting which are reasonably likely to adversely affect the registrant's ability to record, process, summarize, and report financial information; and |
| (b) | Any fraud, whether or not material, that involves management or other employees who have a significant role in the registrant's internal control over financial reporting. |
| Date: | 05/24/2022 |
/s/ Kristen M. Weitzel | ||
| Kristen M. Weitzel | ||||
| Treasurer (principal financial officer) | ||||
| ETF Series Solutions |
Certification Pursuant to Section 906 of the Sarbanes-Oxley Act
Pursuant to Section 906 of the Sarbanes-Oxley Act of 2002, each of the undersigned officers of ETF Series Solutions, does hereby certify, to such officer's knowledge, that the report on Form N-CSR of ETF Series Solutions for the year ended February 28, 2022 fully complies with the requirements of Section 13(a) or 15(d) of the Securities Exchange Act of 1934, as applicable, and that the information contained in the Form N-CSR fairly presents, in all material respects, the financial condition and results of operations of ETF Series Solutions for the stated period.
| /s/ Kristina R. Nelson | /s/ Kristen M. Weitzel | ||
| Kristina R. Nelson | Kristen M. Weitzel | ||
| President (principal executive officer) | Treasurer (principal financial officer) | ||
| ETF Series Solutions | ETF Series Solutions |
| Dated: | 05/24/2022 |
Dated: | 05/24/2022 |
This statement accompanies this report on Form N-CSR pursuant to Section 906 of the Sarbanes-Oxley Act of 2002 and shall not be deemed as filed by ETF Series Solutions for purposes of Section 18 of the Securities Exchange Act of 1934.
Serious News for Serious Traders! Try StreetInsider.com Premium Free!
You May Also Be Interested In
- Airline Passengers Score Two Major Victories Following Two DOT Final Rules, Reports FlyersRights
- Chicken Soup for the Soul Entertainment Receives Delinquency Letter from Nasdaq
- CPKC announces results of director elections
Create E-mail Alert Related Categories
SEC FilingsSign up for StreetInsider Free!
Receive full access to all new and archived articles, unlimited portfolio tracking, e-mail alerts, custom newswires and RSS feeds - and more!
