

Form N-CSR Ultimus Managers Trust For: May 31
 Tweet
Tweet Share
Share| OMB APPROVAL |
|
OMB Number: 3235-0570
Expires: July 31, 2022
Estimated average burden hours per response: 20.6 |
UNITED STATES
SECURITIES AND EXCHANGE COMMISSION
Washington, D.C. 20549
FORM N-CSR
CERTIFIED SHAREHOLDER REPORT OF REGISTERED
MANAGEMENT INVESTMENT COMPANIES
| Investment Company Act file number | 811-22680 |
| Ultimus Managers Trust |
| (Exact name of registrant as specified in charter) |
| 225 Pictoria Drive, Suite 450 Cincinnati, Ohio | 45246 |
| (Address of principal executive offices) | (Zip code) |
David K. James, esq.
| Ultimus Fund Solutions, LLC 225 Pictoria Drive, Suite 450 Cincinnati, Ohio 45246_ |
| (Name and address of agent for service) |
| Registrant's telephone number, including area code: | (513) 587-3400 |
| Date of fiscal year end: | May 31 | |
| Date of reporting period: | May 31, 2021 |
Form N-CSR is to be used by management investment companies to file reports with the Commission not later than 10 days after the transmission to stockholders of any report that is required to be transmitted to stockholders under Rule 30e-1 under the Investment Company Act of 1940 (17 CFR 270.30e-1). The Commission may use the information provided on Form N-CSR in its regulatory, disclosure review, inspection, and policymaking roles.
A registrant is required to disclose the information specified by Form N-CSR, and the Commission will make this information public. A registrant is not required to respond to the collection of information contained in Form N-CSR unless the Form displays a currently valid Office of Management and Budget ("OMB") control number. Please direct comments concerning the accuracy of the information collection burden estimate and any suggestions for reducing the burden to Secretary, Securities and Exchange Commission, 450 Fifth Street, NW, Washington, DC 20549-0609. The OMB has reviewed this collection of information under the clearance requirements of 44 U.S.C. § 3507.
| Item 1. | Reports to Stockholders. |
| (a) |
Institutional Class (ADLVX)
ANNUAL REPORT
May 31, 2021
Managed
by
Adler Asset Management, LLC
For
information or assistance in opening an account,
please call toll-free 1-800-408-4682.
| ADLER VALUE FUND | |
| LETTER TO SHAREHOLDERS (Unaudited) | June 15, 2021 |
Dear Shareholder,
In mid-August 2018, the Adler Value Fund (the “Fund”) commenced operations. Adler Asset Management, LLC (the “Adviser”) is the Fund’s investment adviser. For the annual period ended May 31, 2021, the Fund’s total return was 55.78%. During the same period, the total return of the S&P 500 Value Index was 39.84%.
Equity markets are anticipating a strong economic recovery as post-pandemic re-opening progresses throughout the United States. Wall Street’s focus remains on the economic recovery bolstered by a robust earnings outlook validated by an approximately 50% year-over-year increase in 2021 first quarter earnings. The market’s focus on value stocks evolved into a rotation as investors sought our cyclical sectors with earnings momentum. While Federal Reserve officials stress that inflation pressures should prove temporary, inflation continues to be a market worry. Persistently positive economic data has helped keep inflationary concerns in check despite increases in commodity, consumer, and producer prices.
Investment Approach
In selecting investments for the Fund, the Adviser uses a focused-value strategy to invest in companies that, in its opinion, appear to be undervalued by the equity market but where catalysts exist, in the opinion of the Adviser, to close these valuation gaps. The Adviser seeks to exploit perceived market misjudgments in pricing by buying equity securities that appear to be undervalued because of a temporary aversion to these out-of-favor issuers.
The Adviser maintains a watch list of companies and reviews each company’s financial condition and prospects, including: expected future earnings; cash flow; the ability and willingness to return capital to shareholders; competitive position; quality of the business franchise; and the reputation, experience, and competence of a company’s management and board of directors. The Adviser considers these factors both while the company is on the watch list and also at the time of purchase. Not all companies, at the time of purchase, are on the Adviser’s watch list, and a company may be added to the Fund’s portfolio following a precipitating event.
When added to the Fund’s portfolio, a company will generally be trading at a significant discount to its 52-week or all-time high. The Adviser’s contrarian approach, buying what it believes are fundamentally sound companies that are out-of-favor with the market, is industry, sector and market capitalization agnostic, and typically involves the securities of fewer than thirty issuers.
Performance for the Annual Period
The Adviser believes the reasons for Fund’s outperformance for the annual period include:
| ● | Disciplined stock selection. The Adviser’s decision to sell is driven by a Company’s realization of catalysts rather than movement in its stock price. As a result, the Adviser focuses on the Fund holdings’ fundamental developments to assess investment decisions. This approach has allowed the Fund to continue to capture the upside potential of the Fund’s holdings. |
1
| ● | Effective use of call option purchases. Call options purchased near the market’s nadir in the Spring of 2020 were largely exercised, rather than sold. This approach has allowed the Fund to continue to capture the upside potential of the Fund’s holdings. |
Portfolio Developments
Meredith and Bayer are two Fund holdings:
| ● | Meredith (MDP) recently announced the sale of its television stations. Post-transaction, MDP will focus on its digital and print media businesses and will carry a much-reduced debt. Subsequently, MDP announced an unsolicited proposal from a second party to acquire its television stations. MDP re-affirmed the original transaction with the original buyer after the price was increased. MDP’s stock has been a strong performer for the Fund. |
| ● | Bayer (BAYRY) is a life sciences company focused on health care and nutrition. Bayer’s legal challenges with its Monsanto acquisition have been well-documented. The Adviser purchased Bayer American Depositary Receipts (“ADRs”) for the Fund after the Monsanto acquisition and the related legal exposure became known. Bayer continues to face setbacks with this glyphosate litigation. Its ADR continues to trade around the Fund’s average cost of the holding. The Adviser believes the resolution of this litigation is a key catalyst for Bayer’s re-valuation. |
In closing, I want to thank shareholders for their confidence in the Fund’s Adviser. The Adviser continues to assess companies that fit the Fund’s investment approach.
David Adler
Adler Asset Management, LLC
June 15, 2021
2
Past performance is not predictive of future performance. Investment results and principal value will fluctuate so that shares, when redeemed, may be worth more or less than their original cost. Current performance may be higher or lower than the performance data quoted. Performance data current to the most recent month-end are available by calling 1-800-408-4682.
An investor should consider the investment objectives, risks, charges and expenses of the Fund carefully before investing. The Fund’s prospectus contains this and other important information. To obtain a copy of the Fund’s prospectus please visit the Fund’s website at www.adlervaluefund.com or call 1-800-408-4682 and a copy will be sent to you free of charge. Please read the prospectus carefully before you invest. The Fund is distributed by Ultimus Fund Distributors, LLC.
The Letter to Shareholders seeks to describe some of the Adviser’s current opinions and views of the financial markets. Although the Adviser believes it has a reasonable basis for any opinions or views expressed, actual results may differ, sometimes significantly so, from those expected or expressed. The securities held by the Fund that are discussed in the Letter to Shareholders were held during the period covered by this Report. They do not comprise the entire investment portfolio of the Fund, may be sold at any time, and may no longer be held by the Fund. For a complete list of securities held by the Fund as of May 31, 2021, please see the Schedule of Investments section of the semi-annual report. The opinions of the Fund’s adviser with respect to those securities may change at any time.
Statements in the Letter to Shareholders that reflect projections or expectations for future financial or economic performance of the Fund and the market in general and statements of the Fund’s plans and objectives for future operations are forward-looking statements. No assurance can be given that actual results or events will not differ materially from those projected, estimated, assumed, or anticipated in any such forward-looking statements. Important factors that could result in such differences, in addition to factors noted with such forward-looking statements, include, without limitation, general economic conditions, such as inflation, recession, and interest rates. Past performance is not a guarantee of future results.
3
| ADLER VALUE FUND |
| PERFORMANCE INFORMATION |
| May 31, 2021 (Unaudited) |
Comparison
of the Change in Value of a $1,000,000 Investment in
Adler Value Fund - Institutional Class vs. the S&P 500® Value Index*
and the S&P 500® Index*
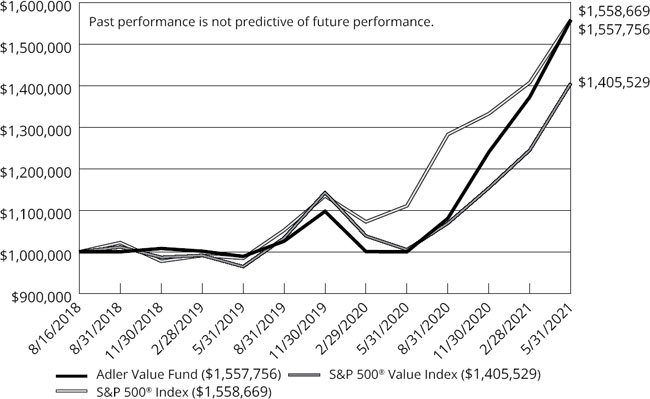
| Average
Annual Total Returns (for the periods ended May 31, 2021) | |||||
| Since | |||||
| 1 Year | Inception(b) | ||||
| Adler Value Fund - Institutional Class (a) | 55.78% | 17.22% | |||
| S&P 500® Value Index (c) | 39.84% | 12.98% | |||
| S&P 500® Index (c) | 40.32% | 17.25% | |||
| (a) | The total returns shown do not reflect the deduction of taxes a shareholder would pay on Fund distributions, if any, or the redemption of Fund shares. |
| (b) | The Fund commenced operations on August 16, 2018. |
| (c) | The S&P 500® Index is a market capitalization weighted index of 500 large companies that is widely used as a barometer of U.S. stock market performance. The S&P 500® Value Index measures value stocks drawn from the S&P 500® Index. Value is measured using three factors: the ratios of book value, earnings, and sales to price. Both indices are unmanaged and shown for illustration purposes only. An investor cannot invest in an index and their returns are not indicative of the performance of any specific investment. |
| * | Effective July 20, 2020, the S&P 500® Value Index became the Fund’s primary benchmark instead of the S&P® 500 Index. The S&P 500® Value Index is a better comparison for the Fund’s portfolio holdings. |
4
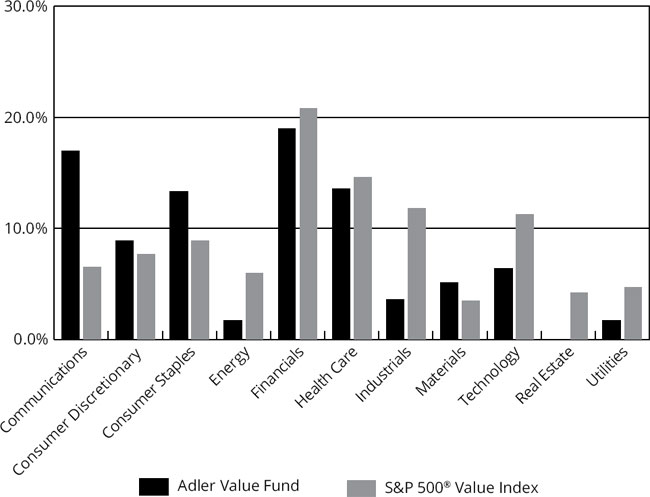
| ADLER VALUE FUND |
| PORTFOLIO INFORMATION |
| May 31, 2021 (Unaudited) |
Sector
Diversification
(% of Net Assets)
| Top 10 Equity Holdings | ||
| % of Net | ||
| Security Description | Assets | |
| Meredith Corporation | 6.2% | |
| Big Lots, Inc. | 5.9% | |
| iHeartMedia, Inc. - Class A | 5.4% | |
| Valvoline, Inc. | 5.0% | |
| Charles Schwab Corporation (The) | 4.9% | |
| Veoneer, Inc. | 4.7% | |
| Aflac, Inc. | 4.0% | |
| Citigroup, Inc. | 3.9% | |
| Spectrum Brands Holdings, Inc. | 3.8% | |
| Equitable Holdings, Inc. | 3.6% | |
5
| ADLER VALUE FUND |
| SCHEDULE OF INVESTMENTS |
| May 31, 2021 |
| COMMON STOCKS — 88.5% | Shares | Value | ||||||
| Communications — 17.0% | ||||||||
| Cable & Satellite — 2.2% | ||||||||
| Altice USA, Inc. - Class A (a) | 1,300 | $ | 46,878 | |||||
| Comcast Corporation - Class A | 600 | 34,404 | ||||||
| 81,282 | ||||||||
| Entertainment Content — 3.2% | ||||||||
| ViacomCBS, Inc. - Class B | 2,900 | 123,018 | ||||||
| Publishing & Broadcasting — 11.6% | ||||||||
| iHeartMedia, Inc. - Class A (a) | 8,800 | 204,248 | ||||||
| Meredith Corporation (a) | 7,000 | 235,760 | ||||||
| 440,008 | ||||||||
| Consumer Discretionary — 8.9% | ||||||||
| Automotive — 4.7% | ||||||||
| Veoneer, Inc. (a) | 7,600 | 179,892 | ||||||
| Leisure Facilities & Services — 4.2% | ||||||||
| Jack in the Box, Inc. | 900 | 102,240 | ||||||
| Starbucks Corporation | 500 | 56,940 | ||||||
| 159,180 | ||||||||
| Consumer Staples — 13.3% | ||||||||
| Beverages — 3.6% | ||||||||
| Diageo plc - ADR | 700 | 135,275 | ||||||
| Household Products — 3.8% | ||||||||
| Spectrum Brands Holdings, Inc. | 1,600 | 142,224 | ||||||
| Retail - Consumer Staples — 5.9% | ||||||||
| Big Lots, Inc. | 3,700 | 225,478 | ||||||
| Energy — 1.7% | ||||||||
| Oil & Gas Producers — 1.7% | ||||||||
| ConocoPhillips | 1,168 | 65,104 | ||||||
| Financials — 17.2% | ||||||||
| Asset Management — 4.9% | ||||||||
| Charles Schwab Corporation (The) | 2,500 | 184,625 | ||||||
| Banking — 4.7% | ||||||||
| Citigroup, Inc. | 1,900 | 149,549 | ||||||
| U.S. Bancorp | 500 | 30,390 | ||||||
| 179,939 | ||||||||
6
| ADLER VALUE FUND |
| SCHEDULE OF INVESTMENTS (Continued) |
| COMMON STOCKS — 88.5% (Continued) | Shares | Value | ||||||
| Financials — 17.2% (Continued) | ||||||||
| Insurance — 7.6% | ||||||||
| Aflac, Inc. | 2,700 | $ | 153,036 | |||||
| Equitable Holdings, Inc. | 4,300 | 136,525 | ||||||
| 289,561 | ||||||||
| Health Care — 13.6% | ||||||||
| Biotech & Pharma — 10.5% | ||||||||
| Bayer AG - ADR | 6,700 | 107,401 | ||||||
| Bristol-Myers Squibb Company | 1,500 | 98,580 | ||||||
| Pfizer, Inc. | 2,300 | 89,079 | ||||||
| Viatris, Inc. | 6,935 | 105,689 | ||||||
| 400,749 | ||||||||
| Health Care Facilities & Services — 3.1% | ||||||||
| Cigna Corporation | 450 | 116,483 | ||||||
| Industrials — 3.6% | ||||||||
| Aerospace & Defense — 1.2% | ||||||||
| Raytheon Technologies Corporation | 500 | 44,355 | ||||||
| Industrial Support Services — 2.4% | ||||||||
| Grainger (W.W.), Inc. | 200 | 92,432 | ||||||
| Materials — 5.1% | ||||||||
| Chemicals — 5.1% | ||||||||
| Valvoline, Inc. | 5,800 | 191,400 | ||||||
| Technology — 6.4% | ||||||||
| Technology Hardware — 3.2% | ||||||||
| Diebold Nixdorf, Inc. (a) | 9,100 | 123,214 | ||||||
| Technology Services — 3.2% | ||||||||
| MultiPlan Corporation (a) | 14,300 | 120,692 | ||||||
| Utilities — 1.7% | ||||||||
| Electric Utilities — 1.7% | ||||||||
| PG&E Corporation (a) | 6,200 | 62,868 | ||||||
| Total Common Stocks (Cost $2,224,596) | $ | 3,357,779 | ||||||
7
| ADLER VALUE FUND |
| SCHEDULE OF INVESTMENTS (Continued) |
| PREFERRED STOCKS — 1.8% | Shares | Value | ||||||
| Financials — 1.8% | ||||||||
| Banking — 1.8% | ||||||||
| Itau Unibanco Holding S.A. - ADR (Cost $61,928) | 12,400 | $ | 70,680 | |||||
| Strike | Notional | |||||||||||||||
| PURCHASED OPTION CONTRACTS — 2.5% | Price | Contracts | Value | Value | ||||||||||||
| Call Option Contracts — 2.5% | ||||||||||||||||
| Big Lots, Inc., 06/18/21 | $ | 62.50 | 30 | $ | 182,820 | $ | 4,800 | |||||||||
| Bristol-Myers Squibb Company, 01/21/22 | 62.50 | 25 | 164,300 | 13,975 | ||||||||||||
| Bristol-Myers Squibb Company, 06/17/22 | 65.00 | 15 | 98,580 | 8,175 | ||||||||||||
| Diebold Nixdorf, Inc., 08/20/21 | 12.50 | 5 | 6,770 | 1,063 | ||||||||||||
| Diebold Nixdorf, Inc., 01/21/22 | 12.50 | 20 | 27,080 | 6,600 | ||||||||||||
| iHeartMedia, Inc. - Class A, 10/15/21 | 20.00 | 10 | 23,210 | 4,500 | ||||||||||||
| Itau Unibanco Holding S.A. - ADR, 01/20/23 | 4.50 | 10 | 5,700 | 1,600 | ||||||||||||
| Itau Unibanco Holding S.A. - ADR, 01/20/23 | 5.00 | 20 | 11,400 | 2,600 | ||||||||||||
| MultiPlan Corporation, 01/21/22 | 7.50 | 20 | 16,880 | 4,000 | ||||||||||||
| Pfizer, Inc., 07/16/21 | 37.00 | 10 | 38,730 | 4,000 | ||||||||||||
| Pfizer, Inc., 01/21/22 | 37.00 | 20 | 77,460 | 6,400 | ||||||||||||
| PG&E Corporation, 01/21/22 | 10.00 | 10 | 10,140 | 1,480 | ||||||||||||
| PG&E Corporation, 01/21/22 | 12.00 | 10 | 10,140 | 740 | ||||||||||||
| Veoneer, Inc., 11/19/21 | 25.00 | 20 | 47,340 | 6,250 | ||||||||||||
| ViacomCBS, Inc. - Class B, 01/22/22 | 40.00 | 30 | 127,260 | 21,450 | ||||||||||||
| Viatris, Inc., 01/21/22 | 15.00 | 15 | 22,860 | 2,550 | ||||||||||||
| Viatris, Inc., 01/21/22 | 12.50 | 10 | 15,240 | 3,420 | ||||||||||||
| Viatris, Inc., 01/21/22 | 20.00 | 20 | 30,480 | 800 | ||||||||||||
| Total Purchased Option Contracts (Cost $88,142) | $ | 916,390 | $ | 94,403 | ||||||||||||
8
| ADLER VALUE FUND |
| SCHEDULE OF INVESTMENTS (Continued) |
| MONEY MARKET FUNDS — 7.2% | Shares | Value | ||||||
| JPMorgan 100% U.S. Treasury Securities Money Market Fund - Institutional Class, 0.01% (b) (Cost $273,518) | 273,518 | $ | 273,518 | |||||
| Investments at Value — 100.0% (Cost $2,648,184) | $ | 3,796,380 | ||||||
| Liabilities in Excess of Other Assets — 0.0% (c) | (1,690 | ) | ||||||
| Net Assets — 100.0% | $ | 3,794,690 | ||||||
ADR - American Depositary Receipt
| (a) | Non-income producing security. |
| (b) | The rate shown is the 7-day effective yield as of May 31, 2021. |
| (c) | Percentage rounds to less than 0.1%. |
See accompanying notes to financial statements.
9
| ADLER VALUE FUND |
| STATEMENT OF ASSETS AND LIABILITIES |
| May 31, 2021 |
| ASSETS | ||||
| Investments in securities: | ||||
| At cost | $ | 2,648,184 | ||
| At value (Note 2) | $ | 3,796,380 | ||
| Receivable for capital shares sold | 5,250 | |||
| Receivable from Adviser (Note 4) | 8,636 | |||
| Dividends receivable | 6,429 | |||
| Tax reclaims receivable | 341 | |||
| Other assets | 2,372 | |||
| Total assets | 3,819,408 | |||
| LIABILITIES | ||||
| Payable to administrator (Note 4) | 14,058 | |||
| Other accrued expenses | 10,660 | |||
| Total liabilities | 24,718 | |||
| NET ASSETS | $ | 3,794,690 | ||
| NET ASSETS CONSIST OF: | ||||
| Paid-in capital | $ | 2,647,558 | ||
| Accumulated earnings | 1,147,132 | |||
| NET ASSETS | $ | 3,794,690 | ||
| PRICING OF INSTITUTIONAL SHARES (Note 2) | ||||
| Net assets applicable to Institutional Shares | $ | 3,794,690 | ||
| Shares of Institutional Shares outstanding (no par value, unlimited number of shares authorized) | 124,414 | |||
| Net asset value, offering and redemption price per share (Note 2) | $ | 30.50 |
See accompanying notes to financial statements.
10
| ADLER VALUE FUND |
| STATEMENT OF OPERATIONS |
| For the Year Ended May 31, 2021 |
| INVESTMENT INCOME | ||||
| Dividends | $ | 39,143 | ||
| Foreign withholding tax on dividends | (1,261 | ) | ||
| Total investment income | 37,882 | |||
| EXPENSES | ||||
| Fund accounting fees (Note 4) | 28,500 | |||
| Administration fees (Note 4) | 28,250 | |||
| Legal fees | 26,420 | |||
| Investment advisory fees (Note 4) | 24,969 | |||
| Audit and tax services fees | 16,900 | |||
| Trustees’ fees and expenses (Note 4) | 16,750 | |||
| Registration and filing fees | 14,920 | |||
| Transfer agent fees (Note 4) | 12,000 | |||
| Compliance fees (Note 4) | 12,000 | |||
| Custodian and bank service fees | 10,549 | |||
| Postage and supplies | 4,567 | |||
| Printing of shareholder reports | 3,387 | |||
| Insurance expense | 3,145 | |||
| Other expenses | 8,597 | |||
| Total expenses | 210,954 | |||
| Less fee reductions and expense reimbursements by the Adviser (Note 4) | (179,743 | ) | ||
| Net expenses | 31,211 | |||
| NET INVESTMENT INCOME | 6,671 | |||
| REALIZED AND UNREALIZED GAINS (LOSSES) ON INVESTMENTS | ||||
| Net realized losses on investments transactions | (3,828 | ) | ||
| Net change in unrealized appreciation (depreciation) on investments | 1,190,419 | |||
| NET REALIZED AND UNREALIZED GAINS ON INVESTMENTS | 1,186,591 | |||
| NET INCREASE IN NET ASSETS RESULTING FROM OPERATIONS | $ | 1,193,262 |
See accompanying notes to financial statements.
11
| ADLER VALUE FUND |
| STATEMENTS OF CHANGES IN NET ASSETS |
| Year Ended | Period Ended | Period Ended | ||||||||||
| May 31, | May 31, | July 31, | ||||||||||
| 2021 | 2020 (a) | 2019 (b) | ||||||||||
| FROM OPERATIONS | ||||||||||||
| Net investment income | $ | 6,671 | $ | 35,659 | $ | 10,351 | ||||||
| Net realized losses from investment transactions | (3,828 | ) | (1,793 | ) | — | |||||||
| Net change in unrealized appreciation (depreciation) on investments | 1,190,419 | (61,173 | ) | 18,950 | ||||||||
| Net increase (decrease) in net assets resulting from operations | 1,193,262 | (27,307 | ) | 29,301 | ||||||||
| DISTRIBUTIONS TO SHAREHOLDERS (NOTE 2) | ||||||||||||
| Institutional Shares | (33,750 | ) | (14,521 | ) | — | |||||||
| FROM CAPITAL SHARE TRANSACTIONS | ||||||||||||
| Institutional Shares | ||||||||||||
| Proceeds from shares sold | 1,143,090 | 39,000 | 1,417,374 | |||||||||
| Net asset value of shares issued in reinvestment of distributions to shareholders | 33,750 | 14,521 | — | |||||||||
| Payments for shares redeemed | (30 | ) | — | — | ||||||||
| Net increase in Institutional Shares net assets from capital share transactions | 1,176,810 | 53,521 | 1,417,374 | |||||||||
| TOTAL INCREASE IN NET ASSETS | 2,336,322 | 11,693 | 1,446,675 | |||||||||
| NET ASSETS | ||||||||||||
| Beginning of period | 1,458,368 | 1,446,675 | — | |||||||||
| End of period | $ | 3,794,690 | $ | 1,458,368 | $ | 1,446,675 | ||||||
| CAPITAL SHARES ACTIVITY | ||||||||||||
| Institutional Shares | ||||||||||||
| Shares sold | 49,491 | 2,051 | 70,866 | |||||||||
| Shares reinvested | 1,359 | 648 | — | |||||||||
| Shares redeemed | (1 | ) | — | — | ||||||||
| Net increase in shares outstanding | 50,849 | 2,699 | 70,866 | |||||||||
| Shares outstanding, beginning of period | 73,565 | 70,866 | — | |||||||||
| Shares outstanding, end of period | 124,414 | 73,565 | 70,866 | |||||||||
| (a) | Fund changed fiscal year to May 31. |
| (b) | Represents the period from the commencement of operations (August 16, 2018) through July 31, 2019. |
See accompanying notes to financial statements.
12
| ADLER VALUE FUND |
| INSTITUTIONAL SHARES |
| FINANCIAL HIGHLIGHTS |
Per Share Data for a Share Outstanding Throughout Each Period
| Year Ended | Period Ended | Period Ended | ||||||||||
| May 31, | May 31, | July 31, | ||||||||||
| 2021 | 2020 (a) | 2019 (b) | ||||||||||
| Net asset value at beginning of period | $ | 19.82 | $ | 20.41 | $ | 20.00 | ||||||
| Income (loss) from investment operations: | ||||||||||||
| Net investment income | 0.07 | (c) | 0.49 | (d) | 0.15 | |||||||
| Net realized and unrealized gains (losses) on investments | 10.92 | (0.88 | ) | 0.26 | ||||||||
| Total from investment operations | 10.99 | (0.39 | ) | 0.41 | ||||||||
| Less distributions from: | ||||||||||||
| Net investment income | (0.31 | ) | (0.20 | ) | — | |||||||
| Net asset value at end of period | $ | 30.50 | $ | 19.82 | $ | 20.41 | ||||||
| Total return (e) | 55.78 | % | (2.01 | %) (f) | 2.05 | % (f) | ||||||
| Net assets at end of period (000’s) | $ | 3,795 | $ | 1,458 | $ | 1,447 | ||||||
| Ratios/supplementary data: | ||||||||||||
| Ratio of total expenses to average net assets | 8.42 | % | 13.01 | % (g) | 11.82 | % (g) | ||||||
| Ratio of net expenses to average net assets (h) | 1.25 | % | 1.25 | % (g) | 1.26 | % (g)(i) | ||||||
| Ratio of net investment income to average net assets (h) | 0.27 | % | 2.93 | % (d)(g) | 0.81 | % (g) | ||||||
| Portfolio turnover rate | 0 | % (j) | 4 | % (f) | 0 | % | ||||||
| (a) | Fund changed fiscal year to May 31. |
| (b) | Represents the period from the commencement of operations (August 16, 2018) through July 31, 2019. |
| (c) | Per share net investment income has been determined on the basis of average number of shares outstanding during the period. |
| (d) | During the period ended May 31, 2020, the Fund received a large special dividend distribution from NortonLifeLock, Inc. Had the Fund not received this special dividend distribution, the net investment income per share and ratio of net investment income to average net assets would have been $0.33 and 1.97%(g) lower, respectively. |
| (e) | Total return is a measure of the change in value of an investment in the Fund over the periods covered. The returns shown do not reflect the deduction of taxes a shareholder would pay on Fund distributions, if any, or the redemption of Fund shares. The total returns would be lower if the Adviser had not reduced fees and reimbursed expenses (Note 4). |
| (f) | Not annualized. |
| (g) | Annualized. |
| (h) | Ratio was determined after advisory fee reductions and expense reimbursements (Note 4). |
| (i) | Includes federal excise taxes of 0.01% of average net assets with respect to the period ended July 31, 2019. |
| (j) | Percentage rounds to less than 1%. |
See accompanying notes to financial statements.
13
| ADLER VALUE FUND |
| NOTES TO FINANCIAL STATEMENTS |
| May 31, 2021 |
| 1. | Organization |
Adler Value Fund (the “Fund”) is a non-diversified series of Ultimus Managers Trust (the “Trust”), an open-end investment company established as an Ohio business trust under a Declaration of Trust dated February 28, 2012. Other series of the Trust are not incorporated in this report.
The investment objective of the Fund is to seek to achieve long-term growth of capital.
The Fund currently offers one class of shares: Institutional Class shares (sold without any sales loads or distribution fees and subject to a $1,000,000 initial investment requirement). As of May 31, 2021, the Investor Class shares (to be sold without any sales loads, but subject to a distribution fee of up to 0.25% of Investor Class’ average daily net assets and subject to a $2,500 initial investment requirement) are not currently offered. When both classes are offered, each share class will represent an ownership interest in the same investment portfolio.
| 2. | Significant Accounting Policies |
The Fund follows accounting and reporting guidance under Financial Accounting Standards Board Accounting Standards Codification Topic 946, “Financial Services – Investment Companies.” The following is a summary of the Fund’s significant accounting policies used in preparation of its financial statements. These policies are in conformity with accounting principles generally accepted in the United States of America (“GAAP”).
Securities valuation – The Fund values its portfolio securities at market value as of the close of regular trading on the New York Stock Exchange (the “NYSE”) (normally 4:00 p.m. Eastern Time) on each day the NYSE is open for business. The Fund generally values its listed securities on the basis of the security’s last sale price on the security’s primary exchange, if available, otherwise at the exchange’s most recently quoted mean price. NASDAQ-listed securities are valued at the NASDAQ Official Closing Price. Option contracts are valued at the closing price on the exchanges on which they are primarily traded; if no closing price is available at the time of valuation, the option will be valued at the mean of the closing bid and ask prices for that day. Investments representing shares of money market funds and other open-end investment companies not traded on an exchange are valued at their net asset value (“NAV”) as reported by such companies. When using a quoted price and when the market is considered active, the security will be classified as Level 1 within the fair value hierarchy (see next page). In the event that market quotations are not readily available or are considered unreliable due to market or other events, the Fund values its securities and other assets at fair value in accordance with procedures established by and under the general supervision of the Board of Trustees of the Trust (the “Board”). Under these procedures, the securities will be classified as Level 2 or 3 within the fair value hierarchy, depending on the inputs used. Unavailable or unreliable market quotes may be due to the following factors: a substantial bid-ask spread; infrequent sales resulting in stale prices; insufficient trading volume; small trade sizes; a temporary lapse in any
14
| ADLER VALUE FUND |
| NOTES TO FINANCIAL STATEMENTS (Continued) |
reliable pricing source; and actions of the securities or futures markets, such as the suspension or limitation of trading. As a result, the prices of securities used to calculate the Fund’s NAV may differ from quoted or published prices for the same securities.
GAAP establishes a single authoritative definition of fair value, sets out a framework for measuring fair value, and requires additional disclosures about fair value measurements.
Various inputs are used in determining the value of the Fund’s investments. These inputs are summarized in the three broad levels listed below:
| ● | Level 1 – quoted prices in active markets for identical securities |
| ● | Level 2 – other significant observable inputs |
| ● | Level 3 – significant unobservable inputs |
The inputs or methods used for valuing securities are not necessarily an indication of the risks associated with investing in those securities. The inputs used to measure fair value may fall into different levels of the fair value hierarchy. In such cases, for disclosure purposes, the level in the fair value hierarchy within which the fair value measurement falls in its entirety is determined based on the lowest level input that is significant to the fair value measurement.
The following is a summary of the Fund’s investments based on the inputs used to value the investments as of May 31, 2021:
| Level 1 | Level 2 | Level 3 | Total | |||||||||||||
| Common Stocks | $ | 3,357,779 | $ | — | $ | — | $ | 3,357,779 | ||||||||
| Preferred Stocks | 70,680 | — | — | 70,680 | ||||||||||||
| Purchased Option Contracts | 72,490 | 21,913 | — | 94,403 | ||||||||||||
| Money Market Funds | 273,518 | — | — | 273,518 | ||||||||||||
| Total | $ | 3,774,467 | $ | 21,913 | $ | — | $ | 3,796,380 | ||||||||
Refer to the Fund’s Schedule of Investments for a listing of the common stocks by sector and industry type. The Fund did not have any assets or liabilities that were measured at fair value on a recurring basis using significant unobservable inputs (Level 3) as of or during the year ended May 31, 2021.
Share valuation – The NAV per share of each class of the Fund is calculated daily by dividing the total value of the assets attributable to that class, less liabilities attributable to that class, by the number of shares outstanding of that class. The offering price and redemption price per share of each class of the Fund is equal to the NAV per share of such class.
Investment income – Dividend income is recorded on the ex-dividend date. Non-cash dividends included in dividend income, if any, are recorded at the fair value of the security received. Interest income is accrued as earned. Withholding taxes on foreign dividends, if any, have been recorded in accordance with the Fund’s understanding of the applicable country’s tax rules and rates.
15
| ADLER VALUE FUND |
| NOTES TO FINANCIAL STATEMENTS (Continued) |
Investment transactions – Investment transactions are accounted for on the trade date. Realized gains and losses on investments sold are determined on a specific identification basis.
Common expenses – Common expenses of the Trust are allocated among the Fund and the other series of the Trust based on the relative net assets of each series, the number of series in the Trust, or the nature of the services performed and the relative applicability to each series.
Distributions to shareholders – Distributions to shareholders arising from net investment income and realized capital gains, if any, are declared and paid annually to shareholders. The amount of distributions from net investment income and net realized capital gains are determined in accordance with federal income tax regulations, which may differ from GAAP. Dividends and distributions to shareholders are recorded on the ex-dividend date. For the periods ended May 31, 2021 and 2020, the tax character of distributions paid to shareholders was ordinary income. There were no distributions paid to shareholders during the period ended July 31, 2019.
Purchased option contracts – The Fund may use option contracts in any manner consistent with its investment objectives and as long as its use is consistent with relevant provisions of the Investment Company Act of 1940, as amended (the “1940 Act”). The Fund may use options for speculative purposes as well as for the purpose of seeking to reduce the overall investment risk that would otherwise be associated with the securities in which the Fund invests. When the Fund purchases a call or put option, an amount equal to the total premium (the premium plus the commission) paid by the Fund is recorded as an asset on the Fund’s Statement of Assets and Liabilities and is subsequently marked-to-market daily. Premiums paid in the purchase of options which expire are treated as realized losses. Premiums paid in the purchase of call options which are exercised increase the cost of the security purchased. Premiums paid in the purchase of put options which are exercised decrease the proceeds used to calculate the realized capital gain or loss on the sale of the security.
Estimates – The preparation of financial statements in conformity with GAAP requires management to make estimates and assumptions that affect the reported amounts of assets and liabilities and disclosure of contingent assets and liabilities as of the date of the financial statements and the reported amounts of increase (decrease) in net assets from operations during the reporting period. Actual results could differ from those estimates.
Federal income tax – The Fund has qualified and intends to continue to qualify as a regulated investment company under the Internal Revenue Code of 1986, as amended (the “Code”). Qualification generally will relieve the Fund of liability for federal income taxes to the extent 100% of its net investment income and net realized capital gains are distributed in accordance with the Code.
16
| ADLER VALUE FUND |
| NOTES TO FINANCIAL STATEMENTS (Continued) |
In order to avoid imposition of the excise tax applicable to regulated investment companies, it is also the Fund’s intention to declare as dividends in each calendar year amounts equal to at least 98% of its net investment income (earned during the calendar year) and 98.2% of its net realized capital gains (earned during the 12 months ended October 31) plus undistributed amounts from prior years.
The following information is computed on a tax basis for each item as of May 31, 2021:
| Tax cost of portfolio investments | $ | 2,648,184 | ||
| Gross unrealized appreciation | $ | 1,174,161 | ||
| Gross unrealized depreciation | (25,965 | ) | ||
| Net unrealized appreciation | 1,148,196 | |||
| Undistributed ordinary income | 4,557 | |||
| Capital loss carryforward | (5,621 | ) | ||
| Accumulated earnings | $ | 1,147,132 |
As of May 31, 2021, the Fund had a long-term capital loss carryforward of $5,621 for federal income tax purposes, which may be carried forward indefinitely. This capital loss carryforward is available to offset net realized gains in future years, thereby reducing future taxable gains.
The Fund recognizes the tax benefits or expenses of uncertain tax positions only when the position is “more likely than not” to be sustained assuming examination by tax authorities. Management has reviewed the Fund’s tax positions for all open tax periods (generally, three years) and has concluded that no provision for unrecognized tax benefits or expenses is required in these financial statements. The Fund identifies its major tax jurisdiction as U.S. federal.
| 3. | Investment Transactions |
During the year ended May 31, 2021, cost of purchases and proceeds from sales of investment securities, other than short-term investments, were $1,034,423 and $12, respectively.
| 4. | Transactions with Related Parties |
INVESTMENT ADVISORY AGREEMENT
The Fund’s investments are managed by Adler Asset Management, LLC (the “Adviser”) pursuant to the terms of an Investment Advisory Agreement. Under the Investment Advisory Agreement, the Fund pays the Adviser an investment advisory fee, computed and accrued daily and paid monthly, at the annual rate of 1.00% of its average daily net assets.
Pursuant to an Expense Limitation Agreement (“ELA”) between the Fund and the Adviser, the Adviser has agreed, until December 1, 2021, to reduce its investment advisory fees and reimburse other expenses to limit total annual operating expenses (exclusive of brokerage costs; taxes; interest; borrowing costs such as interest and dividends expenses on securities sold short; costs to organize the Fund; acquired fund fees and expenses; and extraordinary
17
| ADLER VALUE FUND |
| NOTES TO FINANCIAL STATEMENTS (Continued) |
expenses such as litigation and merger or reorganization costs and other expenses not incurred in the ordinary course of the Fund’s business) to an amount not exceeding 1.25% of the Fund’s average daily net assets of the Institutional Class shares. Accordingly, during the year ended May 31, 2021, the Adviser did not collect any of its investment advisory fees and reimbursed other operating expenses totaling $154,774.
Under the terms of the ELA, investment advisory fee reductions and expense reimbursements by the Adviser are subject to repayment by the Fund for a period of three years after such fees and expenses were incurred, provided that the repayments do not cause the Fund’s total annual operating expenses to exceed the lesser of (i) the expense limitation then in effect, if any, and (ii) the expense limitation in effect at the time the expenses to be repaid were incurred. As of May 31, 2021, the Adviser may seek recoupment of investment advisory fee reductions and expense reimbursements no later than the dates as stated below:
| July 31, 2022 | $ | 134,855 | ||
| May 31, 2023 | 142,930 | |||
| May 31, 2024 | 179,743 | |||
| Total | $ | 457,528 |
OTHER SERVICE PROVIDERS
Ultimus Fund Solutions, LLC (“Ultimus”) provides administration, fund accounting, compliance and transfer agency services to the Fund. The Fund pays Ultimus fees in accordance with the agreements for such services. In addition, the Fund pays out-of-pocket expenses including, but not limited to, postage, supplies, and certain costs related to the pricing of the Fund’s portfolio securities.
Under the terms of a Distribution Agreement with the Trust, Ultimus Fund Distributors, LLC (the “Distributor”) serves as principal underwriter to the Fund. The Distributor is a wholly-owned subsidiary of Ultimus. The Distributor is compensated by the Adviser (not the Fund) for acting as principal underwriter.
Certain officers and a Trustee of the Trust are also officers of Ultimus and are not paid by the Fund for serving in such capacities.
TRUSTEE COMPENSATION
Each member of the Board (a “Trustee”) who is not an “interested person” of the Trust (“Independent Trustee”) receives a $1,300 annual retainer from the Fund, paid quarterly, except for the Board Chairperson who receives a $1,500 annual retainer from the Fund, paid quarterly. Each Independent Trustee also receives from the Fund a fee of $500 for each Board meeting attended plus reimbursement for travel and other meeting-related expenses.
18
| ADLER VALUE FUND |
| NOTES TO FINANCIAL STATEMENTS (Continued) |
PRINCIPAL HOLDER OF FUND SHARES
As of May 31, 2021, the following shareholder owned of record 25% or more of the outstanding shares of the Fund:
| NAME OF RECORD OWNER | % Ownership | |
| David R. Adler | 53% |
A beneficial owner of 25% or more of the Fund’s outstanding shares may be considered a controlling person. That shareholder’s vote could have a more significant effect on matters presented at a shareholders’ meeting.
| 5. | Derivative Transactions |
The location on the Statement of Assets and Liabilities of the derivative positions of the Fund are as follows:
| Average | ||||||||||||||||
| Fair Value | Monthly | |||||||||||||||
| Notional Value | ||||||||||||||||
| During the | ||||||||||||||||
| Type of | Asset | Liability | Year Ended | |||||||||||||
| Derivative | Risk | Location | Derivatives | Derivatives | May 31, 2021* | |||||||||||
| Equity call options purchased | Equity | Investments in securities at value | $ | 94,403 | $ | — | $ | 335,424 | ||||||||
| * | The average monthly notional value generally represents the Fund’s derivative activity throughout the year. |
Realized and unrealized gains and losses associated with transactions in derivative instruments for the Fund during the year ended May 31, 2021 are recorded in the following locations on the Statement of Operations:
| Change in | ||||||||||||||
| Unrealized | ||||||||||||||
| Type of | Realized | Appreciation | ||||||||||||
| Derivative | Risk | Location | Losses | Location | (Depreciation) | |||||||||
| Equity call options purchased | Equity | Net realized losses on investment transactions | $ | (3,824 | ) | Net change in unrealized appreciation (depreciation) on investments | $ | (26,445 | ) | |||||
19
| ADLER VALUE FUND |
| NOTES TO FINANCIAL STATEMENTS (Continued) |
| 6. | Contingencies and Commitments |
The Fund indemnifies the Trust’s officers and Trustees for certain liabilities that might arise from their performance of their duties to the Fund. Additionally, in the normal course of business, the Fund enters into contracts that contain a variety of representations, warranties, and general indemnifications. The Fund’s maximum exposure under these arrangements is unknown, as this would involve future claims that may be made against the Fund that have not yet occurred. However, based on experience, the Fund expects the risk of loss to be remote.
| 7. | Subsequent Events |
The Fund is required to recognize in the financial statements the effects of all subsequent events that provide additional evidence about conditions that existed as of the date of the Statement of Assets and Liabilities. For non-recognized subsequent events that must be disclosed to keep the financial statements from being misleading, the Fund is required to disclose the nature of the event as well as an estimate of its financial effect, or a statement that such an estimate cannot be made. Management has evaluated subsequent events through the issuance of these financial statements and has noted no such events.
20
| ADLER VALUE FUND |
| REPORT OF INDEPENDENT REGISTERED |
| PUBLIC ACCOUNTING FIRM |
To the Board of Trustees of Ultimus Managers
Trust and the Shareholders of Adler Value Fund
Opinion on the Financial Statements
We have audited the accompanying statement of assets and liabilities of Adler Value Fund, a series of shares of beneficial interest in Ultimus Managers Trust (the “Fund”), including the schedule of investments, as of May 31, 2021, and the related statement of operations for the year then ended, and the statements of changes in net assets and the financial highlights as presented in the table below, and the related notes (collectively referred to as the “financial statements”). In our opinion, the financial statements present fairly, in all material respects, the financial position of the Fund as of May 31, 2021, and the results of its operations for the year then ended, and the changes in its net assets and its financial highlights as presented in the table below, in conformity with accounting principles generally accepted in the United States of America.
| Statements of Changes in Net Assets and | |
| Fund | Financial Highlights Presented |
| Adler Value Fund | For the year ended May 31, 2021, the period from August 1, 2019 through May 31, 2020, and the period from August 16, 2018 (commencement of operations) to July 31, 2019 |
Basis for Opinion
These financial statements are the responsibility of the Fund’s management. Our responsibility is to express an opinion on the Fund’s financial statements based on our audits. We are a public accounting firm registered with the Public Company Accounting Oversight Board (United States) (“PCAOB”) and are required to be independent with respect to the Fund in accordance with the U.S. federal securities law and the applicable rules and regulations of the Securities and Exchange Commission and the PCAOB.
We conducted our audits in accordance with the standards of the PCAOB. Those standards require that we plan and perform the audits to obtain reasonable assurance about whether the financial statements are free of material misstatement, whether due to error or fraud. The Fund is not required to have, nor were we engaged to perform, an audit of its internal control over financial reporting. As part of our audits we are required to obtain an understanding of internal control over financial reporting but not for the purpose of expressing an opinion on the effectiveness of the Fund’s internal control over financial reporting. Accordingly, we express no such opinion.
21
| ADLER VALUE FUND |
| REPORT OF INDEPENDENT REGISTERED |
| PUBLIC ACCOUNTING FIRM (Continued) |
Our audits included performing procedures to assess the risk of material misstatement of the financial statements, whether due to error or fraud, and performing procedures that respond to those risks. Such procedures included examining, on a test basis, evidence regarding the amounts and disclosures in the financial statements. Our procedures included confirmation of securities owned as of May 31, 2021 by correspondence with the custodian and broker. Our audits also included evaluating the accounting principles used and significant estimates made by management, as well as evaluating the overall presentation of the financial statements. We believe that our audits provide a reasonable basis for our opinion.

BBD, LLP
We have served as the auditor of one or more of the Funds in the Ultimus Managers Trust since 2013.
Philadelphia, Pennsylvania
July 23, 2021
22
| ADLER VALUE FUND |
| ABOUT YOUR FUND’S EXPENSES (Unaudited) |
We believe it is important for you to understand the impact of costs on your investment. As a shareholder of the Fund, you incur ongoing costs, including management fees and other operating expenses. The following examples are intended to help you understand your ongoing costs (in dollars) of investing in the Fund and to compare these costs with the ongoing costs of investing in other mutual funds.
A mutual fund’s ongoing costs are expressed as a percentage of its average net assets. This figure is known as the expense ratio. The expenses in the table below are based on an investment of $1,000 made at the beginning of the most recent period (December 1, 2020) and held until the end of the period (May 31, 2021).
The table below illustrates the Fund’s ongoing costs in two ways:
Actual fund return – This section helps you to estimate the actual expenses that you paid over the period. The “Ending Account Value” shown is derived from the Fund’s actual return, and the fourth column shows the dollar amount of operating expenses that would have been paid by an investor who started with $1,000 in the Fund. You may use the information here, together with the amount you invested, to estimate the expenses that you paid over the period.
To do so, simply divide your account value by $1,000 (for example, an $8,600 account value divided by $1,000 = 8.6), then multiply the result by the number given for the Fund under the heading “Expenses Paid During Period.”
Hypothetical 5% return – This section is intended to help you compare the Fund’s ongoing costs with those of other mutual funds. It assumes that the Fund had an annual return of 5% before expenses during the period shown, but that the expense ratio is unchanged. In this case, because the return used is not the Fund’s actual return, the results do not apply to your investment. The example is useful in making comparisons because the U.S. Securities and Exchange Commission (the “SEC”) requires all mutual funds to calculate expenses based on a 5% return. You can assess the Fund’s ongoing costs by comparing this hypothetical example with the hypothetical examples that appear in shareholder reports of other funds.
Note that expenses shown in the table are meant to highlight and help you compare ongoing costs only. The Fund does not charge sales loads.
The calculations assume no shares were bought or sold during the period. Your actual costs may have been higher or lower, depending on the amount of your investment and the timing of any purchases or redemptions.
More information about the Fund’s expenses can be found in this report. For additional information on operating expenses and other shareholder costs, please refer to the Fund’s prospectus.
23
| ADLER VALUE FUND |
| ABOUT YOUR FUND’S EXPENSES (Unaudited) (Continued) |
| Beginning | Ending | |||||||
| Account Value | Account Value | Expenses | ||||||
| December 1, | May 31, | Net Expense | Paid During | |||||
| Institutional Class | 2020 | 2021 | Ratio(a) | Period(b) | ||||
| Based on Actual Fund Return | $1,000.00 | $1,256.10 | 1.25% | $7.03 | ||||
| Based on Hypothetical 5%Return (before expenses) | $1,000.00 | $1,018.70 | 1.25% | $6.29 |
| (a) | Annualized, based on the Fund’s most recent one-half year expenses. |
| (b) | Expenses are equal to the Fund’s annualized net expense ratio multiplied by the average account value over the period, multiplied by 182/365 (to reflect the one-half year period). |
24
| ADLER VALUE FUND |
| OTHER INFORMATION (Unaudited) |
A description of the policies and procedures that the Fund uses to vote proxies relating to portfolio securities is available without charge upon request by calling 1-800-408-4682, or on the SEC’s website at www.sec.gov. Information regarding how the Fund voted proxies relating to portfolio securities during the most recent 12-month period ended June 30 is also available without charge upon request by calling 1-800-408-4682, or on the SEC’s website at www.sec.gov.
The Trust files a complete listing of portfolio holdings for the Fund with the SEC as of the end of the first and third quarters of each fiscal year as an exhibit to its reports on Form N-PORT. These filings are available upon request by calling 1-800-408-4682. Furthermore, you may obtain a copy of the filings on the SEC’s website at www.sec.gov.
| FEDERAL TAX INFORMATION (Unaudited) |
Qualified Dividend Income – The Fund designates 100%, or up to the maximum amount of such dividends allowable pursuant to the Internal Revenue code, as qualified dividend income eligible for the reduced tax rate of 15%.
Dividends Received Deduction – Corporate shareholders are generally entitled to take the dividends received deduction on the portion of a Fund’s dividend distribution that qualifies under tax law. For the Fund’s fiscal year ended May 31, 2021, 100% of ordinary income dividends qualifies for the corporate dividends received deduction.
25
| ADLER VALUE FUND |
| BOARD OF TRUSTEES AND EXECUTIVE OFFICERS (Unaudited) |
The Board has overall responsibility for management of the Trust’s affairs. The Trustees serve during the lifetime of the Trust and until its termination, or until death, resignation, retirement, or removal. The Trustees, in turn, elect the officers of the Fund to actively supervise their day-to-day operations. The officers have been elected for an annual term. Each Trustee’s and officer’s address is 225 Pictoria Drive, Suite 450, Cincinnati, Ohio 45246. The following are the Trustees and executive officers of the Fund:
| Name
and Year of Birth |
Length of Time Served |
Position(s) Held with Trust |
Principal Occupation(s) During Past 5 Years |
Number of Funds in Trust Overseen by Trustee |
Directorships of Public Companies Held by Trustee During Past 5 Years |
| Interested Trustees: | |||||
| Dave
R. Carson* Year of Birth: 1958 |
Since 2013 | Trustee and Vice President (January 2021 to present)
Principal Executive Officer (April 2017 to January 2021)
President (October 2013 to present)
Vice President (April 2013 to October 2013) |
SVP, Client Strategies of Ultimus Fund Solutions, LLC (2013 to present); President, Unified Series Trust (2016 to present) and Trustee (2020 to present); President, Centaur Mutual Funds Trust (2018 to present); Chief Compliance Officer, FSI Low Beta Absolute Return Fund (2013 to 2016) | 15 | Interested Trustee of Unified Series Trust (25 Funds) |
| Independent Trustees: | |||||
| Janine
L. Cohen Year of Birth: 1952 |
Since January 2016 | Chairperson (October 2019 to present)
Trustee (January 2016 to present) |
Retired (2013) financial services executive | 15 | None |
26
| ADLER VALUE FUND |
| BOARD OF TRUSTEES AND EXECUTIVE OFFICERS (Unaudited) (Continued) |
| Name
and Year of Birth |
Length of Time Served |
Position(s) Held with Trust |
Principal Occupation(s) During Past 5 Years |
Number of Funds in Trust Overseen by Trustee |
Directorships of Public Companies Held by Trustee During Past 5 Years |
| Independent Trustees (Continued): | |||||
| David
M. Deptula Year of Birth: 1958 |
Since June 2012 | Trustee | Vice President of Legal and Special Projects at Dayton Freight Lines, Inc. since 2016; Vice President of Tax Treasury at The Standard Register Inc. (formerly The Standard Register Company) from 2011 to 2016 | 15 | None |
| Robert
E. Morrison Year of Birth: 1957 |
Since June 2019 | Trustee | Senior Vice President and National Practice Lead for Investment, Huntington National Bank/Huntington Private Bank (2014 to present) | 15 | None |
| Clifford
N. Schireson Year of Birth: 1953 |
Since June 2019 | Trustee | Founder of Schireson Consulting, LLC (2017 to present); Director of Institutional Services for Brandes Investment Partners, LP (2004-2017) | 15 | Trustee of the San Diego City Employees’ Retirement System (2019 to present) |
| Jacqueline
A. Williams Year of Birth: 1954 |
Since June 2019 | Trustee | Managing Member of Custom Strategy Consulting, LLC (2017 to present); Managing Director of Global Investment Research (2005 to 2017), Cambridge Associates, LLC | 15 | None |
| * | Mr. Carson is considered an “interested person” of the Trust within the meaning of Section 2(a)(19) of the 1940 Act, as amended, because of his relationship with the Trust’s administrator and transfer agent. |
27
| ADLER VALUE FUND |
| BOARD OF TRUSTEES AND EXECUTIVE OFFICERS (Unaudited) (Continued) |
| Name
and Year of Birth |
Length of Time Served |
Position(s) Held with Trust |
Principal Occupation(s) During Past 5 Years |
| Executive Officers: | |||
| Todd
E. Heim Year of Birth: 1967 |
Since 2014 | Principal Executive Officer and President (January 2021 to present)
Vice President (2014 to January 2021) |
VP, Relationship Management of Ultimus Fund Solutions, LLC (2018 to present); Client Implementation Manager and AVP of Ultimus Fund Solutions, LLC (2014 to 2018); Naval Flight Officer in the United States Navy (May 1989 to June 2017) |
| Jennifer
L. Leamer Year of Birth: 1976 |
Since 2014 | Treasurer (October 2014 to present)
Assistant Treasurer (April 2014 to October 2014) |
SVP, Fund Accounting of Ultimus Fund Solutions, LLC (2014 to present) |
| Daniel
D. Bauer Year of Birth: 1977 |
Since 2016 | Assistant Treasurer (April 2016 to present) | AVP, Fund Accounting (September 2015 to present) of Ultimus Fund Solutions, LLC |
| David
K. James Year of Birth: 1970 |
Since 2021 | Secretary (July 2021 to present) | EVP, Chief Legal and Risk Officer of Ultimus Fund Solutions, LLC (2018 to present); Managing Director and Managing Counsel at State Street Bank and Trust Company (2009 to 2018) |
| Natalie
S. Anderson Year of Birth: 1975 |
Since 2016 | Assistant Secretary (April 2016 to present) | Manager, Legal Administration (July 2016 to present) and Paralegal (January 2015 to June 2016) of Ultimus Fund Solutions, LLC |
| Gweneth
K. Gosselink Year of Birth: 1955 |
Since 2020 | Chief Compliance Officer (January 2020 to present) | AVP, Compliance Officer of Ultimus Fund Solutions, LLC (December 2019 to present); CCO Consultant at GKG Consulting, LLC (December 2019 to present); Chief Operating Office and CCO at Miles Capital, Inc. (June 2013 to December 2019) |
28
| ADLER VALUE FUND |
| BOARD OF TRUSTEES AND EXECUTIVE OFFICERS (Unaudited) (Continued) |
| Name
and Year of Birth |
Length of Time Served |
Position(s) Held with Trust |
Principal Occupation(s) During Past 5 Years |
| Executive Officers (Continued): | |||
Martin R. Dean Year of Birth: 1963 |
Since 2016 | Assistant Chief Compliance Officer (January 2020 to present)
Interim Chief Compliance Officer (October 2019 to January 2020)
Assistant Chief Compliance Officer (January 2016 to 2017) |
SVP, Head of Fund Compliance of Ultimus Fund Solutions, LLC (2016 to present) |
Additional information about members of the Board and executive officers is available in the Fund’s Statement of Additional Information (“SAI”). To obtain a free copy of the SAI, please call 1-800-408-4682.
29
| ADLER VALUE FUND |
| DISCLOSURE REGARDING APPROVAL OF INVESTMENT ADVISORY AGREEMENT (Unaudited) |
The Board of Trustees (the “Board”), including the Independent Trustees voting separately, has reviewed and approved the continuance of the Fund’s Investment Advisory Agreement (the “Agreement”) with Adler Asset Management, LLC (the “Adviser”) for an additional one-year term. The Board approved the Agreement at meeting held on January 19-21, 2021, at which all of the Trustee were present.
In deciding whether to approve the continuation of the Adler Advisory Agreement, the Board recalled its review of the materials related to the Adler Fund and Adler throughout the preceding twelve months and its numerous discussions with Trust Management and Adler about the operations and performance of the Adler Fund during that period. The Board further considered those materials and discussions and other numerous factors, including the following:
The nature, extent, and quality of the services provided by the Adviser. In this regard, the Board reviewed the services being provided by Adler to the Adler Fund including, without limitation, its investment advisory services since the Adler Fund’s inception, Adler’s compliance policies and procedures, and its compliance program. After reviewing the foregoing information and further information in the Adler Memorandum (e.g., descriptions of its business and Form ADV), the Board concluded that the quality, extent, and nature of the services provided by Adler were satisfactory and adequate for the Adler Fund.
The investment performance of the Adler Fund. In this regard, the Board compared the performance of the Adler Fund with the performance of its benchmark index, the custom peer group and Morningstar category. The Board also considered the consistency of Adler’s management with the Adler Fund’s investment objective and policies. The Board noted that the Adler Fund had outperformed its benchmark, the S&P 500 Value Total Return Stock Index, for the since inception and one-year periods. The Board also noted that the Adler Fund had outperformed its custom peer group and Morningstar category (Large Cap Value Funds Under $50 Million, True No-Load) for the since inception and one-year periods. Following additional discussion of the investment performance of the Adler Fund, Adler’s experience in managing mutual funds and separate accounts, Adler’s historical investment performance, and other factors, the Board concluded that the investment performance of the Adler Fund has been satisfactory.
The costs of the services provided and profits realized by Adler and its affiliates from its relationship with the Adler Fund. In this regard, the Board considered Adler’s staffing, personnel, and methods of operations; the education and experience of its personnel; compliance program, policies, and procedures; financial condition and the level of commitment to the Adler Fund, and, generally, Adler’s advisory business; the asset level of the Adler Fund; and the overall expenses of the Adler Fund, including the advisory fee. The Board considered the Adler ELA and considered Adler’s current and past fee reductions and expense reimbursements for the Adler Fund. The Board further took into account Adler’s commitment to continue the Adler ELA until at least December 1, 2021.
30
| ADLER VALUE FUND |
| DISCLOSURE REGARDING APPROVAL OF INVESTMENT ADVISORY AGREEMENT (Unaudited) (Continued) |
The Board also considered potential benefits for Adler in managing the Adler Fund, including promotion of Adler’s name. The Board compared the Adler Fund’s advisory fee and overall expense ratio to the average and median advisory fees and expense ratios for its custom peer group and Morningstar category (Large Cap Value Funds Under $50 Million, True No-Load). In considering the comparison in fees and expense ratios between the Adler Fund and other comparable funds, the Board looked at the differences in types of funds being compared, the style of investment management, the size of the Adler Fund, and the nature of the investment strategy. The Board noted that the Adler Fund’s advisory fee of 1.00% was higher than the average and median advisory fee for the Adler Fund’s custom peer group and Morningstar category, but less than the highest advisory fee in the Adler Fund’s custom peer group and Morningstar category. The Board also considered Adler’s commitment to limit the Adler Fund’s expenses under the Adler ELA. The Board further noted that the overall expense ratio for the Adler Fund of 1.25% was higher than the average and median expense ratio for the other funds in the Adler Fund’s custom peer group and Morningstar category, but lower than the highest expense ratio in the Adler Fund’s custom peer group and Morningstar category. The Board also considered the differences in the investment style of certain of the peer funds as compared to the investment strategy and style used by Adler in managing the portfolio of the Adler Fund. Following these comparisons and considerations and upon further consideration and discussion of the foregoing, the Board concluded that for the Adler Fund, the advisory fees to be paid to Adler by the Fund are fair and reasonable.
The extent to which economies of scale would be realized as the Adler Fund grows and whether advisory fee levels reflect these economies of scale for the benefit of the Adler Fund’s investors. In this regard, the Board considered that the Adler Fund’s fee arrangements with Adler involve both the advisory fee and the Adler ELA. The Board determined that while the advisory fee rate remained the same as asset levels increased, the shareholders of the Adler Fund have experienced benefits from the Adler ELA and will continue to experience benefits from the Adler ELA until the Adler Fund assets grow to a level where its expenses otherwise fall below the expense limit. Following further discussion of the Adler Fund’s asset level, expectations for growth, and level of fees, the Board determined that the Adler Fund’s fee arrangements with Adler would continue to provide benefits. The Board also determined that the fee arrangements were fair and reasonable in relation to the nature and quality of services being provided by Adler, given the Adler Fund’s projected asset levels for the next year.
Brokerage and portfolio transactions. In this regard, the Board considered Adler’s trading policies, procedures, and performance in seeking best execution for its clients, including the Adler Fund. The Board also considered the historical portfolio turnover rate for the Adler Fund; the process by which evaluations are made of the overall reasonableness of commissions paid; the process by which Adler evaluates best execution; the method and basis for selecting and evaluating the broker-dealers used; and any anticipated allocation of portfolio business to persons affiliated with Adler. After further review and discussion, the Board determined that Adler’s practices regarding brokerage and portfolio transactions were satisfactory.
31
| ADLER VALUE FUND |
| DISCLOSURE REGARDING APPROVAL OF INVESTMENT ADVISORY AGREEMENT (Unaudited) (Continued) |
Possible conflicts of interest. In evaluating the possibility for conflicts of interest, the Board considered such matters as the experience and abilities of the advisory personnel assigned to the Adler Fund, Adler’s process for allocating trades among the Adler Fund and potential future clients with similar types of investment objectives and strategies, and the substance and administration of Adler’s Code of Ethics. Following further consideration and discussion, the Board found for the Adler Fund that Adler’s standards and practices relating to the identification and mitigation of potential conflicts of interests were satisfactory.
After further discussion of the factors noted above and in reliance on the information provided by Adler and Trust Management, and taking into account the totality of all the factors discussed and information presented at this Meeting and previous Meetings, the Board indicated its agreement to approve the continuance of the Adler Advisory Agreement and to approve the continuance of the Adler ELA. It was noted that in the Trustees’ deliberations regarding the approval of renewal the Adler Advisory Agreement, the Trustees did not identify any particular information or factor that was all-important or controlling, and that each individual Trustee may have attributed different weights to the various factors listed above.
32
This page intentionally left blank.
ADLER-AR-21

EVOLUTIONARY TREE INNOVATORS FUND
(INVNX)
Annual Report
May 31, 2021
| EVOLUTIONARY TREE INNOVATORS FUND | |
| LETTER TO SHAREHOLDERS (Unaudited) | May 31, 2021 |
Dear Fellow Shareholders,
Given this is our first fiscal year-end letter, we welcome you as a new shareholder to the Evolutionary Tree Innovators Fund (the “Fund”). We will touch briefly on our investment approach, why we focus on innovation and not short-term market moves, and conclude by providing a brief performance update for the fiscal year ended May 31.
How Our Approach Enables Investors to Benefit from the Power of Innovation
Everyone senses the power of innovation in their lives but struggles to find appropriate ways to invest in innovative businesses driving change. The Evolutionary Tree Innovators Fund was launched to provide an attractive pathway for investing in profound innovation and secular trends, or evolutionary shifts as we call them. The Fund and its adviser apply an innovation and evolution-focused framework to investing. We believe the development of innovation and its resultant pattern of evolutionary change is the primary engine of growth for companies, industries, and the economy—and, in turn, is the underlying driver of long-term wealth creation.
The Fund seeks to identify important innovations that are driving secular growth and evolutionary shifts for companies, industries, and the economy, and own the leading innovators at the forefront. The Fund defines evolutionary shift as when an industry shifts from an old generation (of a product, service, or business model) over to a “next generation” or new offering that provides advantages versus the “old way” of doing things. The Fund invests in a focused portfolio of 25-35 quality innovative businesses.
Examples of innovations that we believe contribute to sustainable growth include technological innovation, product innovation, service or experience innovation, process or cost innovation, and/or business model innovation. In addition to contributing to sustaining growth for leading innovative businesses, new innovations may also enable innovators to take market share, create competitive advantage, and/or enhance profitability over time. Innovation is the root cause of value creation.
Why We Focus on Innovation, Not on Short-term Movements in the Markets or the Economy
The Evolutionary Tree Innovators Fund is meant for investors that are seeking capital appreciation over the long term. We define long term as sticking with your investments for many years. In the context of this long-term investing mindset, we believe that trying to predict short-term movements in the economy or the markets is largely futile and often counter-productive. As such, we believe shifting the focus toward identifying specific innovations creating positive impact for users and sustaining growth is a more repeatable process for adding value. Focus on innovation and ignore the short-term market chatter.
Looking at investing from an innovation-focused vantage-point, we strongly believe the current economic environment is highly conducive to a steady stream of important and profound innovations across the economy, particularly with industry after industry becoming tech-enabled through digital transformation. We describe the current era we
1
live in as the Age of Innovation. It is the Fund’s mission to own a high-quality collection of leading and emerging innovators that may benefit from these dynamics. Our increasingly intellectual capital-based economy is generating a growing number of innovative businesses in a variety of industries, most notably in technology, life sciences, fintech, and digital consumer spaces.
Investment Results and Contributors and Detractors to Performance
Evolutionary Tree Innovators Fund (INVNX) launched in early September 2020, so the investment results are very short term. The Fund is a long-term focused strategy with a time horizon that is measured in years (typically 3-7 years). As such, short-term performance is less meaningful than long-term results.
Despite a pullback in growth and innovation-oriented stocks in recent months, the Fund has delivered strong absolute investment returns since launch (September 9, 2020) and through May 31, 2021 of 27.30% and relative results that compare favorably with large-cap growth style indices which are generally up about 21% over this same period. Given that the Fund’s stated benchmark, the S&P 500 Index, includes both growth and value-oriented stocks, it has delivered similar strong results (+25.08%) from the time of the Fund’s launch and through the end of its fiscal year, as cyclicals and “re-opening trades” have recently served as tailwinds to that index and headwinds to the growth style. So-called re-opening trades are those stocks that investors believe may potentially benefit from the re-opening of the economy as the population gets vaccinated. We believe the benefits of the re-opening trade will be short lived, while secular growers and innovators—which we focus on—can sustain growth for longer, as we describe in more detail below.
The top three contributors to performance in the period were HubSpot, Roku, and Sea Limited. Contributors were generally companies providing cloud-based enterprise applications or digital consumer and e-commerce services, which have benefited from the shifts to the cloud and e-commerce. The top three detractors were Sarepta, nCino, and Farfetch. The primary detractors were life science companies. We do not believe a change in administration will alter their long-term prospects. Both political parties support healthcare innovation, especially for diseases with few alternatives, where we tend to focus. We continue to have confidence in Sarepta and other healthcare holdings, as well as nCino (a leading cloud software provider) and Farfetch (the leader in e-marketplaces for luxury brands).
Secular Growth in a Rising Rate Environment
Recently, market participants have expressed concern over rising inflation expectations leading to higher interest rates, thus raising input costs, crimping margins, and potentially impacting valuations for some companies. Interest rates have been too low for too long, and we believe it’s a healthy dynamic for rates to move to more normalized levels. Additionally, innovative companies, if truly differentiated, have pricing power enabling them to pass along any increase in input costs from inflation to their customers, ultimately protecting their margin structure. We believe this dynamic holds true for the companies in the Fund.
2
Stick with Secular Growers Versus Chasing the “Re-Opening Trade”
While investors are focused on the topic du jour of the “re-opening trade,” we remain focused on longer-term opportunities represented in the Fund, which are multi-year in nature and driven by the adoption of innovations and secular trends. These are the types of opportunities that will not only benefit from a strengthening economy but can also grow for years beyond that.
We believe the “re-opening trade” is short-term by nature and will play out in less than a year. In fact, many of the cyclical stocks have already rebounded nearly to levels seen in 2019, despite the fact that many of these industries will take longer to get back to even. And then, once cyclical industries get back to pre-COVID levels, many of these industries will slow dramatically. As they are not secular growers, they lack the fuel to sustain above-average growth beyond the initial rebound. Eventually, in our opinion, investors will look beyond cyclicals and return to the secular growers.
Rather than relying on the typical short-term trading approach of shifting from one group of stocks to another group—say from “COVID stocks” to “re-opening stocks” for example–we remain consistent in staying focused on our long-term approach of owning companies that meet our eight criteria and are positioned to grow over a multi-year period. The eight criteria we use to identify and evaluate quality innovators include the following characteristics: 1) Benefits from evolutionary shift driven by secular trends and innovation, 2) Large market opportunity with room for growth, 3) Attractive industry structure and dynamics, 4) Industry leader with strong innovation pipeline, 5) Multiple layers of competitive advantage, 6) Strong business model and financial position, 7) Exceptional talent with a unique culture, and 8) Logical valuation based on long-term drivers and economics. We believe quality innovative businesses—both leading and emerging innovators—are best able to drive value creation when you stick with them over many years, as their innovations gain adoption over time.
Thanks for joining the growing community of investors embracing innovation investing and the Evolutionary Tree Innovators Fund. We wish you all the best,
Thomas Ricketts, CFA
Portfolio Manager
3
Past performance is not predictive of future performance. Investment results and principal value will fluctuate so that shares, when redeemed, may be worth more or less than their original cost. Current performance may be higher or lower than performance data quoted. An investor should consider the investment objectives, risks, charges and expenses of the Fund carefully before investing. The Fund’s prospectus contains this and other important information. To obtain a copy of the Fund’s prospectus please call 1-833-517-1010 and a copy can be sent to you free of charge. Please read the prospectus carefully before you invest. The Fund is distributed by Ultimus Fund Distributors, LLC.
The Letter to Shareholders seeks to describe some of the Adviser’s current opinions and views of the financial markets and specific holdings. Although the Adviser believes it has a reasonable basis for any opinions or views expressed, actual results may differ, sometimes significantly so, from those expected or expressed. The securities held by the Fund that are discussed in the Letter to Shareholders were held during the period covered by this Report. They do not comprise the entire investment portfolio of the Fund, may be sold at any time, and may no longer be held by the Fund. For a complete list of securities held by the Fund as of May 31, 2021, please see the Schedule of Investments section of this Report. The opinions of the Fund’s Adviser with respect to those securities may change at any time.
Statements in the Letter to Shareholders that reflect projections or expectations for future financial or economic performance of the Fund and the market in general and statements of the Fund’s plans and objectives for future operations are forward-looking statements. No assurance can be given that actual results or events will not differ materially from those projected, estimated, assumed, or anticipated in any such forward- looking statements. Important factors that could result in such differences, in addition to factors noted with such forward-looking statements include, without limitation, general economic conditions, such as inflation, recession, and interest rates. Past performance is not a guarantee of future results.
4
EVOLUTIONARY TREE INNOVATORS FUND PERFORMANCE INFORMATION May 31, 2021 (Unaudited) |
Comparison of the Change in Value of a $50,000 Investment in
Evolutionary Tree Innovators Fund versus the S&P 500 Index

Total Returns (a) (for the period ended May 31, 2021) |
||
| Since | ||
| Inception | ||
| (9/9/2020) | ||
| Evolutionary Tree Innovators Fund | 27.30% | |
| S&P 500 Index (b) | 25.08% | |
| (a) | The Fund’s total return does not reflect the deduction of taxes a shareholder would pay on Fund distributions or the redemption of Fund shares. |
| (b) | The S&P 500 Index is an index of 500 of the largest companies listed on stock exchanges in the United States. |
5
EVOLUTIONARY TREE INNOVATORS FUND PORTFOLIO INFORMATION May 31, 2021 (Unaudited) |
Sector Diversification (% of Net Assets)

| Top 10 Equity Holdings | |
| % of | |
| Security Description | Net Assets |
| Sea Ltd. - ADR | 6.2% |
| Peloton Interactive, Inc. - Class A | 5.9% |
| Zscaler, Inc. | 5.9% |
| HubSpot, Inc. | 5.5% |
| Pinterest, Inc. - Class A | 5.2% |
| ServiceNow, Inc. | 4.1% |
| Netflix, Inc. | 3.7% |
| Roku, Inc. | 3.7% |
| DraftKings, Inc. - Class A | 3.6% |
| Elastic N.V. | 3.4% |
6
| EVOLUTIONARY TREE INNOVATORS FUND |
| SCHEDULE OF INVESTMENTS |
| May 31, 2021 |
| COMMON STOCKS — 97.8% | Shares | Value | ||||||
| Communications — 21.4% | ||||||||
| Communication Services — 5.5% | ||||||||
| Twilio, Inc. - Class A (a) | 2,777 | $ | 933,072 | |||||
| Zoom Video Communications, Inc. - Class A (a) | 1,850 | 613,330 | ||||||
| 1,546,402 | ||||||||
| Digital Media — 8.5% | ||||||||
| Pinterest, Inc. - Class A (a) | 22,040 | 1,439,212 | ||||||
| Trade Desk, Inc. (The) - Class A (a) | 1,008 | 592,845 | ||||||
| Unity Software, Inc. (a) | 3,735 | 352,808 | ||||||
| 2,384,865 | ||||||||
| Streaming Video — 7.4% | ||||||||
| Netflix, Inc. (a) | 2,053 | 1,032,269 | ||||||
| Roku, Inc. (a) | 2,935 | 1,017,594 | ||||||
| 2,049,863 | ||||||||
| Consumer Discretionary – 24.9% | ||||||||
| Consumer Leisure — 5.9% | ||||||||
| Peloton Interactive, Inc. - Class A (a) | 14,885 | 1,641,965 | ||||||
| Digital Gaming — 3.6% | ||||||||
| DraftKings, Inc. - Class A (a) | 20,197 | 1,008,840 | ||||||
| E-Commerce — 15.4% | ||||||||
| Amazon.com, Inc. (a) | 250 | 805,767 | ||||||
| Bumble, Inc. - Class A (a) | 10,900 | 520,148 | ||||||
| Etsy, Inc. (a) | 3,683 | 606,701 | ||||||
| Farfetch Ltd. - Class A (a) | 13,250 | 613,872 | ||||||
| Sea Ltd. - ADR (a) | 6,886 | 1,743,811 | ||||||
| 4,290,299 | ||||||||
| Financials — 2.4% | ||||||||
| Financial Services — 2.4% | ||||||||
| PayPal Holdings, Inc. (a) | 2,638 | 685,933 | ||||||
| Health Care — 20.1% | ||||||||
| Biotechnology — 13.1% | ||||||||
| Alnylam Pharmaceuticals, Inc. (a) | 4,387 | 622,910 | ||||||
| argenx SE - ADR (a) | 1,503 | 419,322 | ||||||
| Arrowhead Pharmaceuticals, Inc. (a) | 10,189 | 739,721 | ||||||
| Beam Therapeutics, Inc. (a) | 6,750 | 528,053 | ||||||
| Dicerna Pharmaceuticals, Inc. (a) | 18,034 | 587,908 | ||||||
| Sarepta Therapeutics, Inc. (a) | 10,147 | 767,621 | ||||||
| 3,665,535 | ||||||||
7
| EVOLUTIONARY TREE INNOVATORS FUND |
| SCHEDULE OF INVESTMENTS |
| May 31, 2021 |
| COMMON STOCKS — 97.8% (Continued) | Shares | Value | ||||||
| Health Care — 20.1% (Continued) | ||||||||
| Medical Technology — 3.3% | ||||||||
| DermTech, Inc. (a) | 10,385 | $ | 424,954 | |||||
| DexCom, Inc. (a) | 1,363 | 503,479 | ||||||
| 928,433 | ||||||||
| Pharmaceuticals — 3.7% | ||||||||
| Ascendis Pharma A/S - ADR (a) | 3,663 | 492,234 | ||||||
| Revance Therapeutics, Inc. (a) | 17,779 | 526,436 | ||||||
| 1,018,670 | ||||||||
| Technology — 29.0% | ||||||||
| Application Software — 16.8% | ||||||||
| Coupa Software, Inc. (a) | 2,660 | 633,612 | ||||||
| DocuSign, Inc. (a) | 2,675 | 539,333 | ||||||
| HubSpot, Inc. (a) | 3,065 | 1,545,925 | ||||||
| nCino, Inc. (a) | 13,565 | 829,093 | ||||||
| ServiceNow, Inc. (a) | 2,427 | 1,150,107 | ||||||
| 4,698,070 | ||||||||
| Business Services — 1.6% | ||||||||
| Avalara, Inc. (a) | 3,428 | 453,079 | ||||||
| Data & Analytics — 4.7% | ||||||||
| Elastic N.V. (a) | 8,038 | 950,172 | ||||||
| MongoDB, Inc. (a) | 1,262 | 368,428 | ||||||
| 1,318,600 | ||||||||
| IT Security — 5.9% | ||||||||
| Zscaler, Inc. (a) | 8,392 | 1,629,726 | ||||||
| Total Common Stocks (Cost $25,421,838) | $ | 27,320,280 | ||||||
8
| EVOLUTIONARY TREE INNOVATORS FUND |
| SCHEDULE OF INVESTMENTS |
| May 31, 2021 |
| MONEY MARKET FUNDS — 2.2% | Shares | Value | ||||||
| First American Treasury Obligations Fund - Class X, 0.01% (b) (Cost $601,184) | 601,184 | $ | 601,184 | |||||
| Investments at Value — 100.0% (Cost $26,023,022) | $ | 27,921,464 | ||||||
| Other Assets in Excess of Liabilities — 0.0% (c) | 1,299 | |||||||
| Net Assets — 100.0% | $ | 27,922,763 | ||||||
ADR - American Depositary Receipt.
| (a) | Non-income producing security. |
| (b) | The rate shown is the 7-day effective yield as of May 31, 2021. |
| (c) | Percentage rounds to less than 0.1%. |
See accompanying notes to financial statements.
9
| EVOLUTIONARY TREE INNOVATORS FUND |
| STATEMENT OF ASSETS AND LIABILITIES |
| May 31, 2021 |
| ASSETS | ||||
| Investments in securities: | ||||
| At cost | $ | 26,023,022 | ||
| At value (Note 2) | $ | 27,921,464 | ||
| Receivable for capital shares sold | 8,832 | |||
| Dividends receivable | 11 | |||
| Other assets | 17,823 | |||
| Total assets | 27,948,130 | |||
| LIABILITIES | ||||
| Payable for capital shares redeemed | 1,000 | |||
| Payable to Adviser (Note 4) | 10,222 | |||
| Payable to administrator (Note 4) | 6,225 | |||
| Other accrued expenses | 7,920 | |||
| Total liabilities | 25,367 | |||
| NET ASSETS | $ | 27,922,763 | ||
| NET ASSETS CONSIST OF: | ||||
| Paid-in capital | $ | 24,940,883 | ||
| Accumulated earnings | 2,981,880 | |||
| NET ASSETS | $ | 27,922,763 | ||
| Shares of beneficial interest outstanding (unlimited number of shares authorized, no par value) | 1,096,615 | |||
| Net asset value, offering and redemption price per share (Note 2) | $ | 25.46 | ||
See accompanying notes to financial statements.
10
| EVOLUTIONARY TREE INNOVATORS FUND |
| STATEMENT OF OPERATIONS |
| For the Period Ended May 31, 2021 (a) |
| INVESTMENT INCOME | ||||
| Dividends | $ | 521 | ||
| Foreign withholding tax on dividends | (37 | ) | ||
| Total investment income | 484 | |||
| EXPENSES | ||||
| Management fees (Note 4) | 127,437 | |||
| Registration and filing fees | 26,383 | |||
| Legal fees | 19,273 | |||
| Fund accounting fees (Note 4) | 19,069 | |||
| Administration fees (Note 4) | 17,467 | |||
| Trustees’ fees (Note 4) | 15,025 | |||
| Compliance fees (Note 4) | 8,733 | |||
| Transfer agent fees (Note 4) | 8,733 | |||
| Custodian and bank service fees | 5,067 | |||
| Postage and supplies | 3,892 | |||
| Printing of shareholder reports | 3,452 | |||
| Other expenses | 8,757 | |||
| Total expenses | 263,288 | |||
| Less fee reductions by the Adviser (Note 4) | (108,771 | ) | ||
| Net expenses | 154,517 | |||
| NET INVESTMENT LOSS | (154,033 | ) | ||
| REALIZED AND UNREALIZED GAINS ON INVESTMENTS | ||||
| Net realized gains on investments transactions | 1,237,471 | |||
| Net change in unrealized appreciation (depreciation) on investments | 1,898,442 | |||
| NET REALIZED AND UNREALIZED GAINS ON INVESTMENTS | 3,135,913 | |||
| NET INCREASE IN NET ASSETS RESULTING FROM OPERATIONS | $ | 2,981,880 | ||
| (a) | Represents the period from the commencement of operations (September 9, 2020) through May 31, 2021. |
See accompanying notes to financial statements.
11
| EVOLUTIONARY TREE INNOVATORS FUND |
| STATEMENT OF CHANGES IN NET ASSETS |
| Period Ended | ||||
| May 31, | ||||
| 2021 (a) | ||||
| FROM OPERATIONS | ||||
| Net investment loss | $ | (154,033 | ) | |
| Net realized gains from investment transactions | 1,237,471 | |||
| Net change in unrealized appreciation (depreciation) on investments | 1,898,442 | |||
| Net increase in net assets resulting from operations | 2,981,880 | |||
| FROM CAPITAL SHARE TRANSACTIONS | ||||
| Proceeds from shares sold | 27,224,801 | |||
| Payments for shares redeemed | (2,283,918 | ) | ||
| Net increase in net assets from capital share transactions | 24,940,883 | |||
| TOTAL INCREASE IN NET ASSETS | 27,922,763 | |||
| NET ASSETS | ||||
| Beginning of period | — | |||
| End of period | $ | 27,922,763 | ||
| CAPITAL SHARES ACTIVITY | ||||
| Shares sold | 1,181,048 | |||
| Shares redeemed | (84,433 | ) | ||
| Net increase in shares outstanding | 1,096,615 | |||
| Shares outstanding, beginning of period | — | |||
| Shares outstanding, end of period | 1,096,615 | |||
| (a) | Represents the period from the commencement of operations (September 9, 2020) through May 31, 2021. |
See accompanying notes to financial statements.
12
| EVOLUTIONARY TREE INNOVATORS FUND |
| FINANCIAL HIGHLIGHTS |
| Per Share Data for a Share Outstanding Throughout the Period |
| Period Ended | ||||
| May 31, | ||||
| 2021 (a) | ||||
| Net asset value at beginning of period | $ | 20.00 | ||
| Income (loss) from investment operations: | ||||
| Net investment loss (b) | (0.18 | ) | ||
| Net realized and unrealized gains on investments | 5.64 | |||
| Total from investment operations | 5.46 | |||
| Net asset value at end of period | $ | 25.46 | ||
| Total return (c) | 27.30 | % (d) | ||
| Net assets at end of period (000’s) | $ | 27,923 | ||
| Ratios/supplementary data: | ||||
| Ratio of total expenses to average net assets | 1.65 | % (e) | ||
| Ratio of net expenses to average net assets (f) | 0.97 | % (e) | ||
| Ratio of net investment loss to average net assets (f) | (0.97 | %) (e) | ||
| Portfolio turnover rate | 33 | % (d) | ||
| (a) | Represents the period from the commencement of operations (September 9, 2020) through May 31, 2021. |
| (b) | Per share net investment loss has been determined on the basis of average number of shares outstanding during the period. |
| (c) | Total return is a measure of the change in value of an investment in the Fund over the period covered. The return shown does not reflect the deduction of taxes a shareholder would pay on Fund distributions, if any, or the redemption of Fund shares. The total return would have been lower if the Adviser had not reduced fees (Note 4). |
| (d) | Not annualized. |
| (e) | Annualized. |
| (f) | Ratio was determined after advisory fee reductions (Note 4). |
See accompanying notes to financial statements.
13
| EVOLUTIONARY TREE INNOVATORS FUND |
| NOTES TO FINANCIAL STATEMENTS |
| May 31, 2021 |
| 1. | Organization |
Evolutionary Tree Innovators Fund (the “Fund”) is a non-diversified series of Ultimus Managers Trust (the “Trust”). The Trust is an open-end management investment company established as an Ohio business trust under a Declaration of Trust dated February 28, 2012. Other series of the Trust are not incorporated in this report. The Fund commenced operations on September 9, 2020.
The investment objective of the Fund is to seek to achieve long-term growth of capital.
| 2. | Significant Accounting Policies |
The Fund follows accounting and reporting guidance under Financial Accounting Standards Board Accounting Standards Codification Topic 946, “Financial Services – Investment Companies.” The following is a summary of the Fund’s significant accounting policies used in the preparation of its financial statements. These policies are in conformity with accounting principles generally accepted in the United States of America (“GAAP”).
Securities valuation – The Fund values its portfolio securities at market value as of the close of regular trading on the New York Stock Exchange (the “NYSE”) (normally 4:00 p.m. Eastern time) on each business day the NYSE is open for business. The Fund values its listed securities on the basis of the security’s last sale price on the security’s primary exchange, if available, otherwise at the exchange’s most recently quoted mean price. NASDAQ-listed securities are valued at the NASDAQ Official Closing Price. When using a quoted price and when the market for the security is considered active, the security will be classified as Level 1 within the fair value hierarchy (see below). In the event that market quotations are not readily available or are considered unreliable due to market or other events, the Fund values its securities and other assets at fair value in accordance with procedures established by and under the general supervision of the Board of Trustees (the “Board”). Under these procedures, the securities will be classified as Level 2 or 3 within the fair value hierarchy, depending on the inputs used. Unavailable or unreliable market quotes may be due to the following factors: a substantial bid-ask spread; infrequent sales resulting in stale prices; insufficient trading volume; small trade sizes; a temporary lapse in any reliable pricing source; and actions of the securities or futures markets, such as the suspension or limitation of trading. As a result, the prices of securities used to calculate the Fund’s net asset value (“NAV”) may differ from quoted or published prices for the same securities.
GAAP establishes a single authoritative definition of fair value, sets out a framework for measuring fair value, and requires additional disclosures about fair value measurements.
Various inputs are used in determining the value of the Fund’s investments. These inputs are summarized in the three broad levels listed below:
| ● | Level 1 – quoted prices in active markets for identical securities |
14
| EVOLUTIONARY TREE INNOVATORS FUND |
| NOTES TO FINANCIAL STATEMENTS (Continued) |
| ● | Level 2 – other significant observable inputs |
| ● | Level 3 – significant unobservable inputs |
The inputs or methods used for valuing securities are not necessarily an indication of the risks associated with investing in those securities. The inputs used to measure fair value may fall into different levels of the fair value hierarchy. In such cases, for disclosure purposes, the level in the fair value hierarchy within which the fair value measurement falls in its entirety is determined based on the lowest level input that is significant to the fair value measurement.
The following is a summary of the Fund’s investments based on the inputs used to value the investments as of May 31, 2021, by security type:
| Level 1 | Level 2 | Level 3 | Total | |||||||||||||
| Common Stocks | $ | 27,320,280 | $ | — | $ | — | $ | 27,320,280 | ||||||||
| Money Market Funds | 601,184 | — | — | 601,184 | ||||||||||||
| Total | $ | 27,921,464 | $ | — | $ | — | $ | 27,921,464 | ||||||||
Refer to the Fund’s Schedule of Investments for a listing of the common stocks by sector and industry type. The Fund did not hold any derivative instruments or any assets or liabilities that were measured at fair value on a recurring basis using significant unobservable inputs (Level 3) as of or during the period ended May 31, 2021.
Share valuation – The NAV per share of the Fund is calculated daily by dividing the total value of the Fund’s assets, less liabilities, by the number of shares outstanding. The offering price and redemption price per share of the Fund is equal to the NAV per share.
Investment income – Dividend income is recorded on the ex-dividend date. Non-cash dividends included in dividend income, if any, are recorded at the fair market value of the security received. Interest income is accrued as earned. Withholding taxes on foreign dividends have been recorded in accordance with the Fund’s understanding of the applicable country’s tax rules and rates.
Investment transactions – Investment transactions are accounted for on the trade date. Realized gains and losses on investments sold are determined on a specific identification basis.
Common expenses – Common expenses of the Trust are allocated among the Fund and the other series of the Trust based on the relative net assets of each series, the number of series in the Trust, or the nature of the services performed and the relative applicability to each series.
Distributions to shareholders – The Fund distributes to shareholders any net investment income dividends and net realized capital gains on an annual basis. The amount of such dividends and distributions are determined in accordance with federal income tax
15
| EVOLUTIONARY TREE INNOVATORS FUND |
| NOTES TO FINANCIAL STATEMENTS (Continued) |
regulations, which may differ from GAAP. Dividends and distributions to shareholders are recorded on the ex-dividend date. There were no distributions paid to shareholders by the Fund during the period ended May 31, 2021.
Estimates – The preparation of financial statements in conformity with GAAP requires management to make estimates and assumptions that affect the reported amounts of assets and liabilities and disclosure of contingent assets and liabilities as of the date of the financial statements and the reported amounts of increase (decrease) in net assets from operations during the reporting period. Actual results could differ from those estimates.
Federal income tax – The Fund intends to qualify as a regulated investment company under the Internal Revenue Code of 1986, as amended (the “Code”). Qualification generally will relieve the Fund of liability for federal income taxes to the extent 100% of its net investment income and net realized capital gains are distributed in accordance with the Code.
In order to avoid imposition of the excise tax applicable to regulated investment companies, it is also the Fund’s intention to declare as dividends in each calendar year amounts equal to at least 98% of its net investment income (earned during the calendar year) and 98.2% of its net realized capital gains (earned during the twelve months ended October 31) plus undistributed amounts from prior years, if any.
The following information is computed on a tax basis for each item as of May 31, 2021:
| Tax cost of portfolio investments | $ | 26,044,629 | ||
| Gross unrealized appreciation | $ | 3,695,244 | ||
| Gross unrealized depreciation | (1,818,409 | ) | ||
| Net unrealized appreciation | 1,876,835 | |||
| Undistributed ordinary income | 1,105,045 | |||
| Accumulated earnings | $ | 2,981,880 |
The difference between the federal income tax cost of portfolio investments and the financial statement cost of portfolio investments is due to certain timing differences in the recognition of capital gains or losses under income tax regulations and GAAP. These “book/tax” differences are temporary in nature and are primarily due to the tax deferral of losses on wash sales.
The Fund recognizes the tax benefits or expenses of uncertain tax positions only when the position is “more likely than not” of being sustained assuming examination by tax authorities. Management has reviewed the Fund’s tax positions for the current tax year and has concluded that no provision for unrecognized tax benefits or expenses is required in these financial statements. The Fund identifies its major tax jurisdiction as U.S. Federal.
16
| EVOLUTIONARY TREE INNOVATORS FUND |
| NOTES TO FINANCIAL STATEMENTS (Continued) |
| 3. | Investment Transactions |
During the period ended May 31, 2021, cost of purchases and proceeds from sales of investment securities, other than short-term investments, amounted to $31,821,069 and $7,636,702, respectively.
| 4. | Transactions with Related Parties |
INVESTMENT ADVISORY AGREEMENT
The Fund’s investments are managed by Evolutionary Tree Capital Management, LLC (the “Adviser”) pursuant to the terms of an Investment Advisory Agreement. The Fund pays the Adviser a management fee, computed and accrued daily and paid monthly, at the annual rate of 0.80% of average daily net assets.
Pursuant to an Expense Limitation Agreement (“ELA”) between the Fund and the Adviser, the Adviser has agreed contractually, until October 31, 2023, to reduce its management fees and reimburse other expenses to the extent necessary to limit total annual fund operating expenses (exclusive of brokerage costs, taxes, interest, borrowing costs such as interest and dividend expenses on securities sold short, costs to organize the Fund, acquired fund fees and expenses, extraordinary expenses such as litigation and merger or reorganization costs and other expenses not incurred in the ordinary course of the Fund’s business) to an amount not exceeding 0.97% of the Fund’s average daily net assets. Accordingly, during the period ended May 31, 2021, the Adviser reduced its management fees in the amount of $108,771.
Under the terms of the ELA, management fee reductions and/or expense reimbursements by the Adviser are subject to repayment by the Fund for a period of three years after such date that fees and expenses were incurred, provided that the repayments do not cause total annual fund operating expenses to exceed (i) the expense limitation then in effect, if any, and (ii) the expense limitation in effect at the time the expenses to be repaid were incurred. Prior to October 31, 2023, this agreement may not be modified or terminated without the approval of the Fund’s Board of Trustees. This agreement will terminate automatically if the Fund’s investment advisory agreement with the Adviser is terminated. As of May 31, 2021, the Adviser may seek repayment of management fee reductions in the amount of $108,771 no later than May 31, 2024.
OTHER SERVICE PROVIDERS
Ultimus Fund Solutions, LLC (“Ultimus”) provides administration, fund accounting, compliance and transfer agency services to the Fund. The Fund pays Ultimus fees in accordance with the agreements for such services. In addition, the Fund pays out-of-pocket expenses including, but not limited to, postage, supplies and certain costs related to the pricing of the Fund’s portfolio securities.
17
| EVOLUTIONARY TREE INNOVATORS FUND |
| NOTES TO FINANCIAL STATEMENTS (Continued) |
Under the terms of a Distribution Agreement with the Trust, Ultimus Fund Distributors, LLC (the “Distributor”) serves as principal underwriter to the Fund. The Distributor is a wholly-owned subsidiary of Ultimus. The Distributor is compensated by the Adviser (not the Fund) for acting as principal underwriter.
Certain officers and a Trustee of the Trust are also officers of Ultimus.
TRUSTEE COMPENSATION
Each Trustee who is not an “interested person” of the Trust (“Independent Trustee”) receives a $1,300 annual retainer from the Fund, paid quarterly, except for the Board Chairperson who receives a $1,500 annual retainer from the Fund, paid quarterly. Each Independent Trustee also receives from the Fund a fee of $500 for each Board meeting attended plus reimbursement for travel and other meeting-related expenses.
PRINCIPAL HOLDER OF FUND SHARES
As of May 31, 2021, the following shareholder owned of record more than 25% of the outstanding shares of the Fund:
| NAME OF RECORD OWNER | % Ownership | |
| Charles Schwab & Co. (for the benefit of its customers) | 76% |
A beneficial owner of 25% or more of the Fund’s outstanding shares may be considered a controlling person. That shareholder’s vote could have a more significant effect on matters presented at a shareholders’ meeting.
| 5. | Contingencies and Commitments |
The Fund indemnifies the Trust’s officers and Trustees for certain liabilities that might arise from their performance of their duties to the Fund. Additionally, in the normal course of business the Fund enters into contracts that contain a variety of representations and warranties and which provide general indemnifications. The Fund’s maximum exposure under these arrangements is unknown, as this would involve future claims that may be made against the Fund that have not yet occurred. However, based on experience, the Fund expects the risk of loss to be remote.
| 6. | Non-Diversification Risk |
The Fund is a non-diversified Fund. As a result, the Fund’s holdings may be more concentrated in a limited number of securities and the value of its shares may be more sensitive than a diversified fund to any single economic, business, political, or regulatory occurrence.
18
| EVOLUTIONARY TREE INNOVATORS FUND |
| NOTES TO FINANCIAL STATEMENTS (Continued) |
| 7. | Sector Risk |
If a Fund has significant investments in the securities of issuers within a particular sector, any development affecting that sector will have a greater impact on the value of the net assets of the Fund than would be the case if the Fund did not have significant investments in that sector. In addition, this may increase the risk of loss in the Fund and increase the volatility of the Fund’s NAV per share. Occasionally, market conditions, regulatory changes or other developments may negatively impact a particular sector. As of May 31, 2021, the Fund had 29.0% of the value of its net assets invested in stocks within the Technology sector.
| 8. | Subsequent Events |
The Fund is required to recognize in the financial statements the effects of all subsequent events that provide additional evidence about conditions that existed as of the date of the Statement of Assets and Liabilities. For non-recognized subsequent events that must be disclosed to keep the financial statements from being misleading, the Fund is required to disclose the nature of the event as well as an estimate of its financial effect, or a statement that such an estimate cannot be made. Management has evaluated subsequent events through the issuance of these financial statements and has noted no such events.
19
| EVOLUTIONARY TREE INNOVATORS FUND |
REPORT OF INDEPENDENT REGISTERED PUBLIC ACCOUNTING FIRM |
To the Board of Trustees of Ultimus Managers Trust
and the Shareholders of Evolutionary Tree Innovators Fund
Opinion on the Financial Statements
We have audited the accompanying statement of assets and liabilities of Evolutionary Tree Innovators Fund, a series of shares of beneficial interest in Ultimus Managers Trust (the “Fund”), including the schedule of investments, as of May 31, 2021, and the related statements of operations, changes in net assets and the financial highlights for the period September 9, 2020 (commencement of operations) through May 31, 2021, and the related notes (collectively referred to as the “financial statements”). In our opinion, the financial statements present fairly, in all material respects, the financial position of the Fund as of May 31, 2021, and the results of its operations, the changes in its net assets and its financial highlights for the period September 9, 2020 through May 31, 2021, in conformity with accounting principles generally accepted in the United States of America.
Basis for Opinion
These financial statements are the responsibility of the Fund’s management. Our responsibility is to express an opinion on the Fund’s financial statements based on our audit. We are a public accounting firm registered with the Public Company Accounting Oversight Board (United States) (“PCAOB”) and are required to be independent with respect to the Fund in accordance with the U.S. federal securities law and the applicable rules and regulations of the Securities and Exchange Commission and the PCAOB.
We conducted our audit in accordance with the standards of the PCAOB. Those standards require that we plan and perform the audit to obtain reasonable assurance about whether the financial statements are free of material misstatement, whether due to error or fraud. The Fund is not required to have, nor were we engaged to perform, an audit of its internal control over financial reporting. As part of our audit we are required to obtain an understanding of internal control over financial reporting but not for the purpose of expressing an opinion on the effectiveness of the Fund’s internal control over financial reporting. Accordingly, we express no such opinion.
Our audit included performing procedures to assess the risk of material misstatement of the financial statements, whether due to error or fraud, and performing procedures that respond to those risks. Such procedures included examining, on a test basis, evidence regarding the amounts and disclosures in the financial statements. Our procedures included confirmation of securities owned as of May 31, 2021 by correspondence with the custodian. Our audit also included evaluating the accounting principles used and
20
| EVOLUTIONARY TREE INNOVATORS FUND |
REPORT OF INDEPENDENT REGISTERED PUBLIC ACCOUNTING FIRM (Continued) |
significant estimates made by management, as well as evaluating the overall presentation of the financial statements. We believe that our audit provides a reasonable basis for our opinion.
BBD, LLP
We have served as the auditor of one or more of the Funds in the Ultimus Managers Trust since 2013.
Philadelphia, Pennsylvania
July 23, 2021
21
| EVOLUTIONARY TREE INNOVATORS FUND |
| ABOUT YOUR FUND’S EXPENSES (Unaudited) |
We believe it is important for you to understand the impact of costs on your investment. As a shareholder of the Fund, you incur ongoing costs, including management fees, and other operating expenses. The following examples are intended to help you understand your ongoing costs (in dollars) of investing in the Fund and to compare these costs with the ongoing costs of investing in other mutual funds.
A mutual fund’s ongoing costs are expressed as a percentage of its average net assets. This figure is known as the expense ratio. The expenses in the table below are based on an investment of $1,000 made at the beginning of the most recent period (December 1, 2020) and held until the end of the period (May 31, 2021).
The table below illustrates the Fund’s ongoing costs in two ways:
Actual fund return – This section helps you to estimate the actual expenses that you paid over the period. The “Ending Account Value” shown is derived from the Fund’s actual return, and the fourth column shows the dollar amount of operating expenses that would have been paid by an investor who started with $1,000 in the Fund. You may use the information here, together with the amount you invested, to estimate the expenses that you paid over the period.
To do so, simply divide your account value by $1,000 (for example, an $8,600 account value divided by $1,000 = 8.6), then multiply the result by the number given for the Fund under the heading “Expenses Paid During Period.”
Hypothetical 5% return – This section is intended to help you compare the Fund’s ongoing costs with those of other mutual funds. It assumes that the Fund had an annual return of 5% before expenses during the period shown, but that the expense ratio is unchanged. In this case, because the return used is not the Fund’s actual return, the results do not apply to your investment. The example is useful in making comparisons because the U.S. Securities and Exchange Commission (the “SEC”) requires all mutual funds to calculate expenses based on a 5% return. You can assess the Fund’s ongoing costs by comparing this hypothetical example with the hypothetical examples that appear in shareholder reports of other funds.
Note that expenses shown in the table are meant to highlight and help you compare ongoing costs only. The Fund does not charge transaction fees, such as purchase or redemption fees, nor does it carry a “sales load.”
The calculations assume no shares were bought or sold during the period. Your actual costs may have been higher or lower, depending on the amount of your investment and the timing of any purchases or redemptions.
22
| EVOLUTIONARY TREE INNOVATORS FUND |
| ABOUT YOUR FUND’S EXPENSES (Unaudited) (Continued) |
More information about the Fund’s expenses can be found in this report. For additional information on operating expenses and other shareholder costs, please refer to the Fund’s prospectus.
| Beginning | Ending | |||||||
| Account Value | Account Value | Expenses | ||||||
| December 1, | May 31, | Net Expense | Paid During | |||||
| 2020 | 2021 | Ratio (a) | Period (b) | |||||
| Based on Actual Fund Return | $1,000.00 | $1,023.30 | 0.97% | $4.89 | ||||
| Based on Hypothetical 5% Return (before expenses) | $1,000.00 | $1,020.09 | 0.97% | $4.89 |
| (a) | Annualized, based on the Fund’s expenses during the period since the commencement of operations. |
| (b) | Expenses are equal to the Fund’s annualized net expense ratio multiplied by the average account value over the period, multiplied by 182/365 (to reflect the one-half year period). |
23
| EVOLUTIONARY TREE INNOVATORS FUND |
| OTHER INFORMATION (Unaudited) |
A description of the policies and procedures that the Fund uses to vote proxies relating to portfolio securities is available without charge upon request by calling toll-free 1-833-517-1010, or on the SEC’s website at www.sec.gov. Information regarding how the Fund voted proxies relating to portfolio securities during the period ended June 30, 2021 will be available on or about August 31, 2021 without charge upon request by calling toll-free 1-833-517-1010, or on the SEC’s website at www.sec.gov.
The Trust files a complete listing of portfolio holdings for the Fund with the SEC as of the end of the first and third quarters of each fiscal year as an exhibit to Form N-PORT. These filings are available upon request by calling 1-833-517-1010. Furthermore, you may obtain a copy of the filings on the SEC’s website at www.sec.gov.
24
| EVOLUTIONARY TREE INNOVATORS FUND |
BOARD OF TRUSTEES AND EXECUTIVE OFFICERS (Unaudited) |
The Board has overall responsibility for management of the Trust’s affairs. The Trustees serve during the lifetime of the Trust and until its termination, or until death, resignation, retirement, or removal. The Trustees, in turn, elect the officers of the Fund to actively supervise their day-to-day operations. The officers have been elected for an annual term. Each Trustee’s and officer’s address is 225 Pictoria Drive, Suite 450, Cincinnati, Ohio 45246. The following are the Trustees and executive officers of the Fund:
| Directorships | |||||
| Number | of Public | ||||
| of Funds | Companies | ||||
| Length | Principal | in Trust | Held by | ||
| Name and | of Time | Position(s) | Occupation(s) | Overseen by | Trustee During |
| Year of Birth | Served | Held with Trust | During Past 5 Years | Trustee | Past 5 Years |
| Interested Trustees: | |||||
| David
R. Carson* Year of Birth: 1958 |
Since 2013 |
Trustee and Vice President (January 2021 to present)
Principal Executive Officer (April 2017 to January 2021)
President (October 2013 to present)
Vice President (April 2013 to October 2013) |
SVP, Client Strategies of Ultimus Fund Solutions, LLC (2013 to present); President, Unified Series Trust (2016 to present) and Trustee (2020 to present); President, Centaur Mutual Funds Trust (2018 to present); Chief Compliance Officer, FSI Low Beta Absolute Return Fund (2013 to 2016) | 15 | Interested Trustee of Unified Series Trust (25 funds) |
| Independent Trustees: | |||||
| Janine
L. Cohen Year of Birth: 1952 |
Since January 2016 | Chairperson (October 2019 to present)
Trustee (January 2016 to present) |
Retired (2013) financial services executive | 15 | None |
25
| EVOLUTIONARY TREE INNOVATORS FUND |
BOARD OF TRUSTEES AND EXECUTIVE OFFICERS (Unaudited) (Continued) |
| Directorships | |||||
| Number | of Public | ||||
| of Funds | Companies | ||||
| Length | Principal | in Trust | Held by | ||
| Name and | of Time | Position(s) | Occupation(s) | Overseen by | Trustee During |
| Year of Birth | Served | Held with Trust | During Past 5 Years | Trustee | Past 5 Years |
| Independent Trustees (Continued): | |||||
| David
M. Deptula Year of Birth: 1958 |
Since June 2012 | Trustee | Vice President of Legal and Special Projects at Dayton Freight Lines, Inc. since 2016; Vice President of Tax Treasury at The Standard Register Inc. (formerly The Standard Register Company) from 2011 to 2016 | 15 | None |
| Robert
E. Morrison Year of Birth: 1957 |
Since June 2019 | Trustee | Senior Vice President and National Practice Lead for Investment, Huntington National Bank/Huntington Private Bank (2014 to present) | 15 | None |
| Clifford
N. Schireson Year of Birth: 1953 |
Since June 2019 | Trustee | Founder of Schireson Consulting, LLC (2017 to present); Director of Institutional Services for Brandes Investment Partners, LP (2004-2017) | 15 | Trustee of the San Diego City Employees’ Retirement System (2009 to present) |
| Jacqueline
A. Williams Year of Birth: 1954 |
Since June 2019 | Trustee | Managing Member of Custom Strategy Consulting, LLC (2017 to present); Managing Director of Global Investment Research (2005 to 2017), Cambridge Associates, LLC | 15 | None |
| * | Mr. Carson is considered an “interested person” of the Trust within the meaning of Section 2(a)(19) of the Investment Company Act of 1940, as amended, because of his relationship with the Trust’s administrator and transfer agent. |
26
| EVOLUTIONARY TREE INNOVATORS FUND |
BOARD OF TRUSTEES AND EXECUTIVE OFFICERS (Unaudited) (Continued) |
| Name
and Year of Birth |
Length of Time Served |
Position(s) Held with Trust |
Principal Occupation(s) During Past 5 Years |
| Executive Officers: | |||
| Todd
E. Heim Year of Birth: 1967 |
Since 2014 | Principal Executive Officer and President (January 2021 to present)
Vice President (2014 to 2021) |
VP, Relationship Management of Ultimus Fund Solutions, LLC (2018 to present); Client Implementation Manager and AVP of Ultimus Fund Solutions, LLC (2014 to 2018); Naval Flight Officer in the United States Navy (May 1989 to June 2017) |
| Jennifer
L. Leamer Year of Birth: 1976 |
Since 2014 | Treasurer (October 2014 to present)
Assistant Treasurer (April 2014 to October 2014) |
SVP, Fund Accounting of Ultimus Fund Solutions, LLC (2014 to present) |
| Daniel
D. Bauer Year of Birth: 1977 |
Since 2016 | Assistant Treasurer (April 2016 to present) | AVP, Fund Accounting (September 2015 to present) of Ultimus Fund Solutions, LLC |
| David
K. James Year of Birth: 1970 |
Since 2021 | Secretary (July 2021 to present) | EVP, Chief Legal and Risk Officer of Ultimus Fund Solutions, LLC (2018 to present); Managing Director and Managing Counsel at State Street Bank and Trust Company (2009 to 2018) |
| Natalie
S. Anderson Year of Birth: 1975 |
Since 2016 | Assistant Secretary (April 2016 to present) | Manager, Legal Administration (July 2016 to present) and Paralegal (January 2015 to June 2016) of Ultimus Fund Solutions, LLC |
| Gweneth
K. Gosselink Year of Birth: 1955 |
Since 2016 | Chief Compliance Officer (January 2021 to present) | AVP, Compliance Officer of Ultimus Fund Solutions, LLC (December 2019 to present); CCO Consultant at GKG Consulting, LLC (December 2019 to present); Chief Operating Officer and CCO at Miles Capital, Inc. (June 2013 to December 2019) |
27
| EVOLUTIONARY TREE INNOVATORS FUND |
BOARD OF TRUSTEES AND EXECUTIVE OFFICERS (Unaudited) (Continued) |
| Name
and Year of Birth |
Length of Time Served |
Position(s) Held with Trust |
Principal Occupation(s) During Past 5 Years |
| Executive Officers (Continued): | |||
| Martin
R. Dean Year of Birth: 1963 |
Since 2019 | Assistant Chief Compliance Officer (January 2021 to present)
Interim Chief Compliance Officer (October 2019 to present)
Assistant Chief Compliance Officer (January 2016 to 2017) |
SVP of Fund Compliance of Ultimus Fund Solutions, LLC (2016 to present) |
Additional information about members of the Board and executive officers is available in the Fund’s Statement of Additional Information (“SAI”). To obtain a free copy of the SAI, please call 1-833-517-1010.
28
This page intentionally left blank.
EVOLUTIONARY-AR-21
 |
| KARNER BLUE BIODIVERSITY IMPACT FUND |
| ButterflyTM Class (KAIBX) |
| Annual Report |
| May 31, 2021 |
| KARNER BLUE BIODIVERSITY IMPACT FUND | |
| LETTER TO SHAREHOLDERS (Unaudited) | July 9, 2021 |
Dear Shareholder,
As the world struggles to address climate change and social inequity, the popularity of responsible investing has surged. In the first half of 2020 alone, there was a $20.9 billion flow of assets into U.S. sustainable mutual funds, almost as much as in all of 2019 combined.1 This surge evinces a recognition that traditional economic thinking must be revamped to account for the impacts of corporate behaviors on non-shareholders.
The growth of today’s sustainable investment strategies began in the early 1990s when data sets were first compiled primarily using publicly available information from company financial filings. These data sets were a response to the growing demand for standardized environmental, social and governance (ESG) benchmarking data to hold companies accountable for their actions. The demand for these metrics was a direct result of the evolution and maturation of socially responsible investing from primarily discrete issue-based divestment to comprehensive assessments of responsible corporate conduct. And, thankfully, these efforts are finally starting to pay off.
In recent years, ESG data has been instrumental in helping investors to understand and advocate for a range of improved corporate behavior from board diversity to the climate change impacts of a company’s business operations and supply chains. However, the datasets fall woefully short with respect to an oftentimes hidden crisis closely related to the climate change crisis—the ongoing mass extinction of species sometimes referred to as the Anthropocene.
In December 2020, the Intergovernmental Panel on Climate Change (IPCC) and the Intergovernmental Platform on Biodiversity and Ecosystem Services (IPBES) held the first ever joint collaboration between the two bodies to explore the complex and multiple connections between climate change and biodiversity loss. In their June 2021 report, the IPCC and IPBES set forth 41 distinct conclusions and explained:
Climate change impacts and biodiversity loss are two of the most important challenges and risks for human societies…Climate change exacerbates risks to biodiversity and natural and managed habitats; at the same time, natural and managed ecosystems and their biodiversity play a key role in the fluxes of greenhouse gases, as well as in supporting climate adaptation…However, nature’s contributions to attenuating climate change, partly provided by the underpinning biodiversity, are at risk from ecosystem degradation resulting from progressive climate change and human activities. In fact, ecosystem degradation through land-use changes and other impacts on natural carbon stocks and sequestration is a major contributor to cumulative CO2 emissions, and, therefore, an additional driver of climate change…
| 1 | Deborah Nason (November 5, 2020). Sustainable Investing is Surging. How to Decide if it’s Right for You. Retrieved from https://www.cnbc.com/2020/11/05/sustainable-investing-is-surging-how-to-decide-if-its-right-for-you.html. |
1
Limiting global warming to ensure a habitable climate and protecting biodiversity are mutually supporting goals, and their achievement is essential for sustainably and equitably providing benefits to people.2
The acceleration of biodiversity loss as a result of nature-harmful business practices and supply chain management has recently come into sharper focus thanks to some cutting-edge initiatives that use innovative measurement metrics. For example, Iceberg Data Labs’ Corporate Biodiversity Footprint models peer-relative biodiversity impacts using a metric – mean species abundance – that provides a consolidated estimate of the biodiversity harm and ecosystem damage caused by a company’s business practices.3 Mean species abundance is a metric that assesses the naturalness or biodiversity intactness of an area relative to the abundance of species that would exist in that area in a pristine, undisturbed ecosystem. Notwithstanding this progress, society has not yet developed an agreed-upon method of quantifying the value of nature and therefore has not been able to measure the costs of its depletion and assign stakeholder accountability. This failure has resulted in society absorbing the costs associated with the overuse and degradation of nature, rather than those stakeholders that, through their actions, deplete or harm our planet’s natural resources.
The lack of nature-based metrics has resulted in a dearth of hard data for company benchmarking in financial or impact analyses. The biodiversity crisis, however, cannot wait for the development of nature-based cost accounting standards and the amendment of financial disclosure requirements. With 25 percent of all species endangered and one million species at risk of extinction in the next few years, we need to benchmark and hold companies accountable now. As the IPCC and IPBES noted:
A sustainable society requires both a stabilized climate and healthy ecosystems. However, 77% of land (excluding Antarctica) and 87% of the area of the ocean have been modified by the direct effects of human activities. These changes are associated with the loss of 83% of wild mammal biomass, and half that of plants. Livestock and humans now account for nearly 96% of all mammal biomass on Earth, and more species are threatened with extinction than ever before in human history. Climate change increasingly interacts with these processes. Anthropogenic release of greenhouse gases from fossil fuel combustion, industry, Agriculture, Forestry and Other Land Use (AFOLU), now overall exceeding 55 GtCO2e [per year], continues to
| 2 | Pörtner, H.O., Scholes, R.J., Agard, J., Archer, E., Arneth, A., Bai, X., Barnes, D., Burrows, M., Chan, L., Cheung, W.L., Diamond, S., Donatti, C., Duarte, C., Eisenhauer, N., Foden, W., Gasalla, M. A., Handa, C., Hickler, T., Hoegh-Guldberg, O., Ichii, K., Jacob, U., Insarov, G., Kiessling, W., Leadley, P., Leemans, R., Levin, L., Lim, M., Maharaj, S., Managi, S., Marquet, P. A., McElwee, P., Midgley, G., Oberdorff, T., Obura, D., Osman, E., Pandit, R., Pascual, U., Pires, A. P. F., Popp, A., ReyesGarcía, V., Sankaran, M., Settele, J., Shin, Y. J., Sintayehu, D. W., Smith, P., Steiner, N., Strassburg, B., Sukumar, R., Trisos, C., Val, A.L., Wu, J., Aldrian, E., Parmesan, C., Pichs-Madruga, R., Roberts, D.C., Rogers, A.D., Díaz, S., Fischer, M., Hashimoto, S., Lavorel, S., Wu, N., Ngo, H.T. 2021. IPBES-IPCC co-sponsored workshop report on biodiversity and climate change; IPBES and IPCC. DOI:10.5281/zenodo.4782538. Retrieved from https://www.ipbes.net/sites/default/ files/2021-06/20210609_workshop_report_embargo_3pm_CEST_10_june_0.pdf. |
| 3 | Finance and Biodiversity Community (F@B Community) and workstream Methods, both part of the European Union Business@Biodiversity Platform (July 2021). Finance for Biodiversity: Guide on Biodiversity Measurement Approaches. Retrieved from https://www.financeforbiodiversity.org/wp-content/uploads/ Finance-for-Biodiversity_Guide-on-biodiversity-measurement-approaches.pdf. |
2
rise and has already led to global warming above 1°C relative to pre-industrial times. Climate change and biodiversity loss pose significant threats for human livelihoods, food security and public health, and such negative impacts are disproportionately felt by communities that are socially, politically, geographically and/or economically marginalized.4
In order to address these issues, Karner Blue Capital benchmarks companies operating in specific industries considered to have material dependencies and/or impacts on biodiversity utilizing proprietary industry-specific frameworks. Each framework, or “model,” is comprised of key performance indicators that represent significant environmental, social, and governmental risks specific to each industry. These risks are wide ranging and those attributed to “E” include resource dependency, pollution, and invasive species mitigation. Risks specific to “S” include threats to human health, including pandemics, social license to operate, changing societal and consumer preferences, and changing demographics. Risks specific to “G” include legislative and tax regime changes, political lobbying, and anti-corruption measures. An emphasis is also placed on identifying company-specific innovations and opportunities, focusing on those companies developing technologies to mitigate their impacts and inventing alternative products and services that disrupt traditional status quo operating protocols, all in the name of biodiversity, animal welfare and environmental protection.
Advocacy and corporate engagement initiatives also play an important role in holding companies accountable and shaping corporate decisions that impact biodiversity and environmental stewardship. The Convention on Biological Diversity is meeting later this year to establish the post-2020 global biodiversity framework within which companies will need to operate. At the same time, private sector initiatives, such as the Finance for Biodiversity Pledge and Iceberg Data Labs’ Corporate Biodiversity Footprint, are leveraging the collective power of stakeholders and investors who have acknowledged the existential threat that biodiversity loss poses to our planet and economic systems. Karner Blue Capital is proud to have partnered with each of these organizations and believes that their efforts can help fill the biodiversity data gap and enable all responsible investors to be a Force for Nature.
PERFORMANCE
The Fund seeks to achieve long-term total returns by investing in companies that lead their industries in animal welfare performance. KBC’s strategy to achieve the Fund’s investment objective involves peer-relative evaluations of companies that operate in 16 industries with significant exposure to the five key drivers of biodiversity loss, which are (i) irresponsible land and ocean use, (ii) exploitation and over-use of species, (iii) climate change, (iv) pollution and (v) invasive and introduced species. The Fund’s holdings of companies operating in these industries together comprise at least 65 percent of the Fund’s assets. KBC also assesses companies that operate in other industries and that, in KBC’s opinion, have made significant contributions to the advancement of biodiversity
| 4 | IPBES-IPCC co-sponsored workshop report on biodiversity and climate change. See footnote 2. |
3
and animal welfare outside of their normal business operations. The companies in this group are referred to as Opportunity Companies and may comprise up to 35 percent of the Fund’s holdings at the time of purchase.
On a net basis, the ButterflyTM Class underperformed its benchmark, the Morningstar Developed Markets (NR) Index (the “Morningstar Index”), by 101 basis points during the one-year period ended May 31, 2021 (the “Reporting Period”) and outperformed the Morningstar Index by 195 basis points on an annualized basis since inception.
Performance Total Return % as of 5.31.21
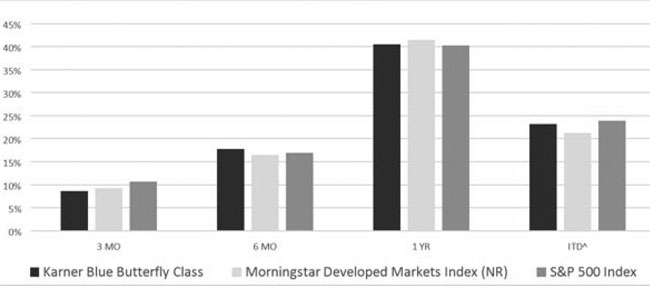
| ITD | ||||
| Total Return Percentage as of 5.31.2021 | 3 MO | 6 MO | 1 YR | 9.17.19^ |
| Karner Blue Biodiversity Impact Fund ButterflyTM Class | 8.64 | 17.73 | 40.49 | 23.15 |
| Morningstar Developed Markets Index (NR) | 9.27 | 16.48 | 41.50 | 21.20 |
| S&P 500 Index | 10.72 | 16.95 | 40.32 | 23.91 |
Returns for periods over one year are annualized.
| ^ | ITD is the inception-to-date return from 9.17.2019 through 5.31.2021. |
Source: Ultimus Fund Solutions, LLC
The Fund’s performance during the Reporting Period was characterized by strong stock selection and weak sector allocation. Stock selection was particularly strong in the Consumer Cyclical, Financial Services, and Industrials sectors, but that was partially offset by notably weak stock selection in the Technology sector. In an environment during which equity markets rebounded sharply as national economies across the globe emerged from pandemic-related lockdowns, the Fund’s overweight allocation to the Consumer Defensive sector, underweight allocation to the Financial Services sector and cash holdings weighed on the Fund’s returns relative to the Morningstar Index. The Fund’s overweight allocation to the Basic Materials sector, however, helped to offset some of the underperformance. From a global perspective, strong stock selection in the United States and Australia and the Fund’s underweight allocation to Japan benefitted the Fund’s relative performance, but that was offset by weak stock selection in Brazil, Canada, Denmark, France, Spain, Switzerland and the United Kingdom.
4
The five holdings that most positively impacted Fund performance during the Reporting Period were as follows:
| Contribution | |
| to the Fund’s | |
| Return During | |
| the Reporting | |
| Holding | Period |
| Tesla Inc. | 3.34% |
| Freeport-McMoRan Inc. | 2.77% |
| Fortescue Metals Group Ltd. - ADR | 1.78% |
| Levi Strauss & Co. | 1.61% |
| Deutsche Post AG - ADR | 1.28% |
The five holdings that most negatively impacted Fund performance during the Reporting Period were as follows:
| Contribution | |
| to the Fund’s | |
| Return During | |
| the Reporting | |
| Holding | Period |
| Canadian Solar Inc. | -0.64% |
| Intel Corp. | -0.59% |
| Vital Farms Inc. | -0.35% |
| Enphase Energy Inc. | -0.27% |
| Discovery Inc. | -0.20% |
Tesla, Inc. was the Fund’s top performer during the Reporting Period, but the position was liquidated in May 2021 due to the company’s increasingly stretched valuation and the crowded competitive landscape in the electric vehicle manufacturing industry. Freeport-McMoRan Inc. and Levi Strauss & Co. also ranked among the Fund’s best performers during the Reporting Period. Our views with respect to those companies have not materially changed from the comments we shared in the Fund’s Semi-Annual Report for the period ended November 30, 2020 and we maintain a constructive outlook on each company.
In February 2021, Fortescue Metals Group Ltd. reported its best ever half year operating and financial results since the company was founded, including record shipments, earnings and operating cashflow. For the six months ended December 31, 2020 (H1 FY21), Fortescue’s revenues grew 44 percent YOY to $9.3 billion reflecting both a three per cent increase in ore sold to 90.2 million tonnes and a 42 per cent increase in the average realized iron ore price to $114 per dry metric tonne (dmt). The favorable global supply and demand environment for iron ore and Fortescue’s efforts to manage costs through productivity and innovation initiatives pushed the underlying EBITDA margin 71 per cent higher to US$80/dmt and generated earnings per share of $1.33 and a return on equity of 47 percent. Fortescue intends to allocate 10 per cent of its net profit after
5
taxes to fund renewable energy projects through Fortescue Future Industries (FFI), a wholly-owned subsidiary of Fortescue, which has promised to explore a range of projects totaling more than 500 gigawatts (GW) of hydro, geothermal, wind and solar power and has set a goal to be involved in the creation of 1,000 GW of installed pure green energy capacity. FFI has already committed $1 billion in investments through 2023 and will seek to leverage Fortescue’s demonstrated track record of identifying, assessing, and developing large-scale resource and infrastructure opportunities to finance, develop and operate renewable energy projects, including the production of green hydrogen and green ammonia that could be used in shipping, steelmaking and fertilizers. As explained by Fortescue CEO, Elizabeth Gaines, Fortescue is “leading the heavy industry battle against global warming, transitioning from being a major fossil fuel importer to a significant green and renewable energy and product exporter. We are leading by example to decrease emissions across our operations, using our large industrial platform of operating mine sites in the Pilbara to trial and demonstrate technologies in completely renewable green hydrogen, green ammonia and green electricity. All of us at Fortescue are committed to its decarbonisation…[and] are aiming to meet or beat our internal global industry-leading target to achieve carbon neutrality by 2030.” Fortescue’s commitment to sustainability has been widely acknowledged and has resulted in its inclusion in the 2020 Dow Jones Sustainability Indices, an upgraded status in the latest MSCI ESG ratings, and a Gold Class distinction in the S&P Global Sustainability Awards.
Deutsche Post AG similarly reported its best ever first quarter performance during Q1/2021, which contributed to a 130.5% rally in the company’s American Depositary Receipts during the Reporting Period. Strong momentum in e-commerce and a resurgence in global trade enabled Deutsche Post to exceed revenue estimates by more than 6 percent and guide full-year 2021 EBIT higher from approximately €5.6 billion to €6.7 billion. Deutsche Post has a very extensive corporate sustainability program that is grounded in its mission to achieve net-zero emissions by 2050 (“Mission 50”), including planned investments of €7 billion over the next decade to reduce the company’s annual GHG emissions to below 29 million tonnes by 2030 in alignment with its Science-Based Targets initiative (SBTi) commitment. Key aspects of Deutsche Post’s Mission 50 Plan include (i) the increased use of sustainable aviation fuel, (ii) electrifying the company’s last-mile network through the use of various green delivery modes such as bicycles, e-bikes, cargo bikes, and parcel lockers (by 2030 the company expects to have more than 80,000 e-vehicles on the road), and (iii) achieving carbon neutral buildings through architectural design, sourcing renewable energy and integrating digitalization and intelligent building management systems. Deutsche Post’s comprehensive portfolio of green products and solutions also helps its customers to reduce their emissions in every part of the logistics value chain through the use of sustainable fuels and low carbon technologies, Gold Standard certified carbon offset programs, supply chain optimization to reduce waste and promote circular economies, and transparent reporting of GHG emissions related to transportation and logistics operations. Deutsche Post has acknowledged the significant impact that its GHG emissions have on ecosystems through air pollution, resource consumption and other environmental factors and seeks to directly address some of the company’s biodiversity impacts through its Policy on the Usage of Liquid Biofuels. The company also actively supports the United Nations’ Convention on Biological Diversity and is a member of the United for Wildlife Transport Taskforce (also
6
known as the Buckingham Palace Declaration), which is a coalition of companies in the transportation industry committed to battling illegal wildlife trafficking. Furthermore, Deutsche Post supports the protection of endangered species and the advancement of conservation initiatives through the application of its unique expertise in large animal transport, including rehoming Ussuri brown bears from Japan’s Hokkaido Island to the United Kingdom’s Yorkshire Wildlife Park and black rhinoceroses from the Port Lympne Wild Animal Park in the United Kingdom to the Mkomazi Rhino Sanctuary in Tanzania.
The Fund’s exposure to the renewable energy sector was a key detractor during the Reporting Period with Canadian Solar, Inc. and Enphase, Inc. being two of the top four worst performing holdings. Canadian Solar, Inc. and Enphase, Inc. are new positions for the Fund that were established during the Reporting Period on January 19, 2021 and December 10, 2020, respectively.
On March 17, 2021, Canadian Solar, Inc. reported blow-out earnings with Q4/2020 EPS of $0.11, trouncing the consensus estimate of a $0.55 loss, on better-than-expected Q4 revenues that grew 13.2% YOY to $1.04 billion. Performance during Q1/2021 was also strong with revenues and gross margins at the high-end of prior guidance, but EPS missed by $0.03 on better-than-expected revenues that grew 31.94% YOY to $1.09 billion. Notwithstanding the strong financial performance, the company’s stock fell sharply during February and drifted lower into the end of the Reporting Period. As a renewable energy provider, Canadian Solar’s products and services directly combat climate change, which is one of the five key drivers of biodiversity loss. The company has also been diligently working over the past several years to improve its per megawatt efficiency with respect to water used, wastewater discharged, and pollutants emitted, such as CO2, NOX, and SOX. In recognition of the fact that many communities around the world lack reliable power grids and depend on kerosene, a dangerous fuel with myriad safety and health hazards, the company has made it a strategic priority to develop specialized, portable, off-grid solutions that provide clean, safe and green energy at lower cost.
Enphase, Inc. rallied in December 2020 after it was added to the Fund, but it more than gave back those gains in 2021. The retrenchment lacked a clear catalyst given Enphase’s May report that it beat Q1/2021 revenue and EPS expectations by 3.1% and $0.12, respectively. Enphase is a global energy technology company that provides solutions spanning solar generation, home energy storage and web-based monitoring and control. The company primarily engages in the design, development, manufacture, and sale of microinverter systems for the solar photovoltaic industry. These microinverters convert direct current (DC) power into alternating current (AC) at the individual solar panel level and provide advanced energy monitoring and control when combined with Enphase’s proprietary networking and software technologies. By comparison, a central inverter system uses string modules (with or without an optimizer) to convert energy of the entire solar panel array using a single high voltage electrical unit that lacks intelligence about the energy producing capacity of the solar array, which makes microinverters a much more effective and efficient solution. As recently reported by the International Energy Agency (IEA), the realization of a carbon-neutral world by 2050 will require an unprecedented installation of clean energy technology for the remainder of this decade, including annual additions of solar photovoltaics that ramp up to 630 gigawatts by 2030 – quadruple the single-year solar power installation record achieved in 2020. For context, that amount of
7
new solar energy generation capacity in a single year would require the installation of the world’s largest existing solar park roughly every day. We therefore maintain a positive outlook on the solar industry in general and Canadian Solar and Enphase in particular.5
OUTLOOK
At the start of the Reporting Period, the gradual reopening of national economies across the globe drove financial market indices higher as market participants optimistically looked through the pandemic to 2021 corporate earnings estimates. Pent-up consumer demand fueled a spurt of economic activity in Q3/2020, but GDP growth in Q4/2020 waned in the absence of a clear catalyst for additional consumer spending amid an uncertain policy outlook related, in part, to the U.S. presidential election and transition of administrations. The equity markets pulled back somewhat, but mostly traded sideways, during the historically weak months of September and October, and then rallied sharply into the end of the year supported by certain key expectations. These expectations included (i) an extended, years-long period of easy monetary policy both in the U.S. and Europe supported by the continued use of quantitative easing tools and the introduction of the Federal Reserve’s new average inflation targeting policy, (ii) further fiscal stimulus under the Biden Administration to spur consumer spending, which accounted for approximately 70 percent of U.S. GDP prior to COVID-19; (iii) the widespread availability of effective COVID-19 vaccines by mid-2021; (iv) the continuation of subdued consumer price inflation; and (v) a relatively stable U.S. Dollar exchange rate.
During December, January and February, the timing, amount and potential economic impact of fiscal stimulus packages in the U.S. dominated the market outlook. After a series of delays, President Trump signed into law a $900 billion second round of COVID-19 economic relief on December 27, 2020. Shortly thereafter, on January 5, 2021, the election of two Democratic senators in Georgia’s run-off elections signaled that Democrats would eventually take control of the Senate following President-Elect Biden’s inauguration. That outcome triggered a laser focus on the amount of relief that Congress would support and whether legislation could be passed before the expiration of expanded pandemic-related unemployment benefits on March 14, 2021. Ultimately, a $1.9 trillion relief package was pushed through on a party-line vote on March 11, 2021, and sentiment in the equity markets quickly shifted to concerns that the massive amount of fiscal spending could cause the U.S. economy to overheat and require the Federal Reserve to raise interest rates earlier than expected. The 10-year U.S. Treasury Note, which traded mostly flat during December, started a steady climb promptly following Georgia’s run-off elections and reached a post-pandemic high yield of 1.749% on March 19, 2021 as the brighter economic outlook led to a great deal of handwringing over the potential for non-transitory inflation.
During March, April and May, the vaccine rollout across the globe, supply chain bottlenecks amid a resurgent global economy, and concerns that the Federal Reserve might rein in its accommodative monetary policy earlier than anticipated were the dominant focal
| 5 | International Energy Agency (2021). Net Zero by 2050: A Roadmap for the Global Energy Sector. Retrieved from: https://iea.blob.core.windows.net/assets/20959e2e-7ab8-4f2a-b1c6-4e63387f03a1/NetZeroby2050-ARoadmapfortheGlobalEnergySector_CORR.pdf |
8
points for the markets. With a post-pandemic return to normalcy being dependent upon getting shots in arms, governments across the globe found themselves in a race against the ability of the SARS-CoV-2 virus to mutate into more deadly and transmissible forms. Initially the U.S. rollout of the vaccine was much more effective than in other countries, raising doubts over Europe’s ability to avoid rolling partial lockdowns. However, toward the end of the Reporting Period, the European Union’s vaccine distribution efforts kicked into high gear and were more successful than those of the U.S. Accordingly, in most developed nation’s approximately 50 percent of the population has now been administered at least one vaccine dose. This faster than anticipated distribution of effective COVID-19 vaccines and the massive U.S. fiscal stimulus prompted the OECD to revise its growth estimates for global GDP for 2021 from 4.2% at the end of last year to 5.8% at the end of May 2021, which would be the strongest annual rate of global economic growth since 1973. In 2021, the OECD now expects real GDP in the U.S. and the Euro area to grow 6.9% and 4.3%, respectively, while emerging market economies are likely to lag far behind mostly due to the lack of access to COVID-19 vaccines.6
Europe’s economic growth prospects improved considerably during the Reporting Period. After Europe secured additional vaccine supplies, the vaccination rate in April doubled compared to March enabling most European countries to substantially ease restrictions on economic activity. In June 2021, the EU began issuing bonds to raise funds for the launch of its Recovery and Resilience Facility (“RRF”), which may add 0.5% to Eurozone GDP in 2021 and 2022 according to some economists. The RRF is comprised of €312.50 billion in grants, approximately 44% of which will be divided between Spain and Italy, and €360 billion in low-cost loans. To receive RRF funding, Member States were required to submit spending plans to the European Commission that significantly favored spending on climate-change mitigation and digital transformation. Accordingly, electric vehicles, hydrogen research, and digitalization of public and private services feature prominently in many country plans along with required reforms of governmental processes and procedures that impede higher growth. The potential of the RRF to support and restructure the European economy is also being reflected in rebounding sentiment surveys. In May, France’s index of business confidence climbed to its highest level in three years while Germany’s Ifo survey of business expectations showed its strongest reading since January 2011. Consumer confidence is also at levels far above the long-term average as relatively few Eurozone workers lost their jobs during the pandemic due, in part, to worker furlough programs. Buoyed by mostly stable household incomes and a savings rate that spiked during the pandemic, European consumers appear ready to unleash a wave of consumer spending which is the primary driver of European economic growth. All of which suggests that Eurozone economic growth rates may not peak for quite some time and that the outperformance of Eurozone stock indices relative to the U.S. seen during the first half of 2021 may continue during the second half of the year.
| 6 | Organization for Economic Cooperation and Development (2021). OECD Economic Outlook (Issue 1). Retrieved from https://www.oecd-ilibrary.org/sites/edfbca02-en/1/3/1/index.html?itemId=/content/publication/edfbca02-en&_ga=2.114506373.329315082.1624768564-1903548931.1623990909&_csp_=db 1589373f9d2ad2f9935628d9528c9b&itemIGO=oecd&itemContentType=book#section-d1e109. |
9
It appears increasingly likely that the global post-pandemic economic recovery will have a fast lane and a slow lane, with China, the U.S. and many European countries occupying the former and most of the rest of the world occupying the latter. Developed nations have reaped the benefits of their greater wealth as developing nations continue to struggle without effective health care, monetary policy and fiscal policy interventions. According to the OECD, countries still experiencing deadly waves of COVID-19 such as India and Brazil “may continue to have large shortfalls in GDP relative to pre-pandemic expectations” and will recover only after the virus has been contained. The emergence of new, more virulent SARS-CoV-2 variants, such as the now dominant Delta strain, could abruptly disrupt the growth trajectory of the countries in the fast lane. In an interconnected world, the failure of developed nations to make available adequate vaccine supplies to poorer countries creates an opportunity for further virus mutations and poses an ongoing risk to the growth trajectories of emerging economies and developed nations alike. As the OECD noted in its report, “the global economic and social cost of maintaining closed borders dwarfs the costs of making vaccines, tests and health supplies more widely available to these countries…Confidence could be seriously eroded by further lockdowns, and a stop-and-go of economic activities. Firms, so far well protected but often with higher debt than before the pandemic, could go bankrupt. The most vulnerable members of society would risk further suffering from prolonged spells of inactivity or reduced income, exacerbating inequalities, across and within countries, and potentially destabilising economies.”7
Evidence is also mounting in support of the view that it will be very challenging to wean global markets from the liquidity spigot that has driven many indices to all-time highs even as labor markets remain challenged. On June 16, 2021, the Fed raised its estimate for 2021 headline inflation in the U.S. from 2.4% to 3.4% and surprised the markets with a somewhat more hawkish tone in its commentary. The mere whiff of a suggestion that short-term interest rates might rise slightly faster than previously anticipated caused stocks and commodities to sell-off hard even in the absence of any statements as to when the Fed might actually begin tapering its aggressive bond-buying program. In so doing, the market demonstrated just how reliant it is on the historically accommodative stance of the Fed and other central banks – and how fearful investors are that the existing extreme liquidity conditions might become just a little less extreme. It therefore appears increasingly likely that policymakers have painted themselves into a corner whereby the continuation of easy monetary policies will push long-term bond yields higher and undercut stock prices through the application of higher discount rates, and the discontinuation of easy monetary policies will undercut stock prices by removing the market’s rocket fuel. Either of these alternatives will likely involve heightened stock market volatility as equity investors struggle to interpret policymakers’ highly nuanced statements. On the positive side, after peaking earlier this year, 10-year bond yields across most developed countries have traded flat to slightly lower. The much more sanguine outlook of global bond investors regarding growth, inflation and monetary policy suggests that there exists a narrow policy path that could avoid significant stock market indigestion. That path would require inflation to run cooler than expected, perhaps due to
| 7 | Organization for Economic Cooperation and Development (2021). OECD Economic Outlook (Issue 1). See footnote 6. |
10
a relatively quick elimination of supply chain bottlenecks, and economic growth to remain firm enough to give policymakers the confidence to believe that the removal of monetary policy supports will not jeopardize the nascent recovery, which explains why there is so much debate over the transitory nature of existing inflation pressures. If inflation becomes entrenched or runs hotter than expected, policymakers could be forced into making a lose-lose decision, at least insofar as the equity markets are concerned. Accordingly, investors are keenly alert for stronger-than-expected economic data that could accelerate the timing of a shift in monetary policy, push bond yields higher and upend the Goldilocks environment that has fueled the equity markets over the past year. With markets on a knife’s edge, statements by Federal Reserve officials, especially Chairman Powell, will also take on even greater significance especially during the summer months when liquidity is lower and fears ratchet up with the rapid approach of the historically weak months of September and October.
Finally, given the biodiversity focus of the Fund, we are very excited by the efforts of regulators on both sides of the Atlantic to make more sustainability information available to investors. Last year, the European Union (EU) rolled out the new EU Taxonomy – an economic activity classification system designed to grow green investments – with the goal of advancing six environmental objectives: (i) climate change mitigation, (ii) climate change adaptation, (iii) sustainable use and protection of water and marine resources, (iv) transition to a circular economy, (v) pollution prevention and control, and (vi) protection and restoration of biodiversity and ecosystems. Entities subject to the EU Non-Financial Reporting Directive (NFRD) and the Sustainable Finance Disclosure Regulation (SFDR) are required to provide additional transparency regarding the alignment of their business activities with the Taxonomy. The early days of the Biden Administration have also seen a flurry of regulators embracing the notion of enhancing climate-related risk disclosures. While there have been few details regarding specific regulations, there appears to be a coordinated regulatory effort underway to acknowledge the financial impacts caused by climate change. The Securities and Exchange Commission recently issued a request for comment on how it should require companies to disclose “consistent, comparable, and reliable information on climate change” risks to investors. Similarly, the Treasury Department and the Federal Reserve have recently highlighted the staggering costs of extreme weather events and the financial tumult businesses, banks and investors might experience as the economy is weaned from its dependence on fossil fuels. The efforts by these regulators could result in significantly improved information flows and encourage the deployment of private capital to support the development of solutions for climate change and biodiversity loss, which has the potential to benefit some of the Fund’s holdings.
11
CONCLUSION
On behalf of the entire Karner Blue Capital team we thank you for your investment in the Karner Blue Biodiversity Impact Fund and look forward to working together to realize a more sustainable and ethical future.
Sincerely,
| Vicki L. Benjamin | Andrew K. Niebler |
| President & Co-Founder | Executive Vice President & Co-Founder |
| Karner Blue Capital, LLC | Karner Blue Capital, LLC |
Past performance is not predictive of future performance. Investment results and principal value will fluctuate so that shares, when redeemed, may be worth more or less than their original cost. Current performance may be higher or lower than the performance data quoted. Performance data current to the most recent month end are available by calling 1-855-KBANIML (855-522-6465).
An investor should consider the investment objectives, risks, charges, and expenses of the Fund carefully before investing. The Fund’s prospectus contains this and other important information. To obtain a copy of the Fund’s prospectus please visit our website at www.biodiversityimpactfund.com or call 1-855-KBANIML (855-522-6465) and a copy will be sent to you free of charge. Please read the prospectus carefully before you invest. The Karner Blue Biodiversity Impact Fund is distributed by Ultimus Fund Distributors, LLC.
The Letter to Shareholders seeks to describe some of the Adviser’s current opinions and views of the financial markets. Although the Adviser believes it has a reasonable basis for any opinions or views expressed, actual results may differ, sometimes significantly so, from those expected or expressed. The securities held by the Fund that are discussed in the Letter to Shareholders were held during the period covered by this Report. They do not comprise the entire investment portfolio of the Fund, may be sold at any time and may no longer be held by the Fund. For a complete list of securities held by the Fund as of May 31, 2021, please see the Schedule of Investments section of the Annual Report. The opinions of the Adviser with respect to those securities may change at any time.
Statements in the Letter to Shareholders that reflect projections or expectations for future financial or economic performance of the Fund and the market in general and statements of the Fund’s plans and objectives for future operations are forward-looking statements. No assurance can be given that actual results or events will not differ materially from those projected, estimated, assumed, or anticipated in any such forward- looking statements. Important factors that could result in such differences, in addition to factors noted with such forward-looking statements include, without limitation, general economic conditions, such as inflation, recession, and interest rates. Past performance is not a guarantee of future results.
12
| KARNER
BLUE BIODIVERSITY IMPACT FUND PERFORMANCE INFORMATION May 31, 2021 (Unaudited) |
Comparison
of the Change in Value of a $10,000 Investment in
Karner Blue Biodiversity Impact Fund - Butterfly™ Class (since inception on
09/17/2019) versus the Morningstar Developed Markets NR Index
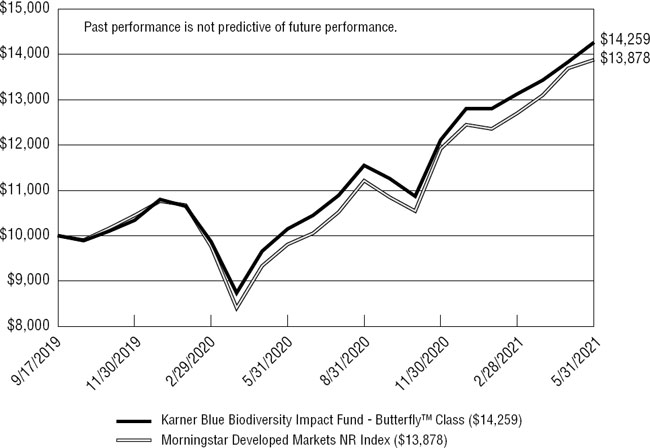
| Average Annual Total Returns | ||||
| (for the periods ended May 31, 2021) | ||||
| Since Inception | ||||
| 1 Year | (09/17/2019) | |||
| Karner Blue Biodiversity Impact Fund - Butterfly™ Class(a) | 40.49% | 23.15% | ||
| Morningstar Developed Markets NR Index (b) | 41.50% | 21.20% | ||
| (a) | The Fund’s total returns do not reflect the deduction of taxes a shareholder would pay on Fund distributions or the redemption of Fund shares. |
| (b) | The Morningstar Developed Markets NR Index measures the performance of developed regional markets targeting the top 97% of stocks by market capitalization. This index does not incorporate Environmental, Social, or Governance (ESG) criteria. The Index is unmanaged and shown for illustration purposes only. An investor cannot invest in an index and its return is not indicative of the performance of any specific investment. |
13
| KARNER BLUE BIODIVERSITY IMPACT FUND |
| PORTFOLIO INFORMATION |
| May 31, 2021 (Unaudited) |
Portfolio Allocation (% of Net Assets)
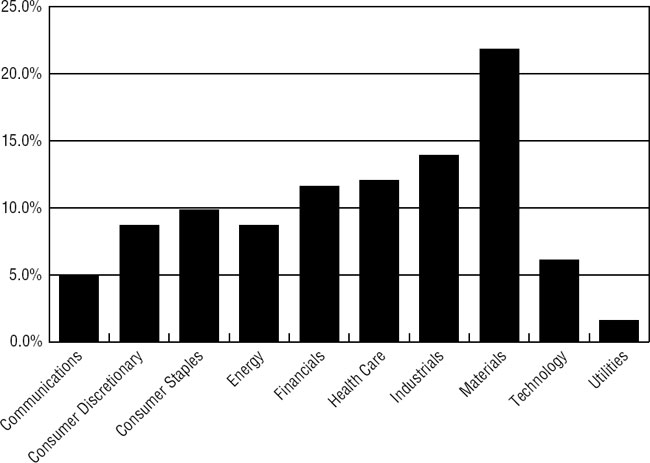
| Top 10 Equity Holdings | |
| % of | |
| Security Description | Net Assets |
| Walt Disney Company (The) | 2.2% |
| Newmont Corporation | 2.2% |
| Alphabet, Inc. - Class A | 2.1% |
| NVIDIA Corporation | 2.0% |
| Goldman Sachs Group, Inc. (The) | 2.0% |
| Microsoft Corporation | 2.0% |
| Deere & Company | 1.9% |
| Enphase Energy, Inc. | 1.9% |
| BNP Paribas S.A. - ADR | 1.8% |
| Owens Corning | 1.8% |
14
| KARNER BLUE BIODIVERSITY IMPACT FUND |
| SCHEDULE OF INVESTMENTS |
| May 31, 2021 |
| COMMON STOCKS — 99.2% | Shares | Value | ||||||
| Communications — 5.0% | ||||||||
| Entertainment Content — 2.9% | ||||||||
| Discovery, Inc. - Series A (a) | 2,250 | $ | 72,247 | |||||
| Walt Disney Company (The) (a) | 1,360 | 242,964 | ||||||
| 315,211 | ||||||||
| Internet Media & Services — 2.1% | ||||||||
| Alphabet, Inc. - Class A (a) | 96 | 226,258 | ||||||
| Consumer Discretionary — 8.7% | ||||||||
| Apparel & Textile Products — 5.0% | ||||||||
| adidas AG - ADR | 626 | 114,790 | ||||||
| Levi Strauss & Company - Class A | 6,375 | 170,595 | ||||||
| NIKE, Inc. - Class B | 1,135 | 154,882 | ||||||
| VF Corporation | 1,235 | 98,454 | ||||||
| 538,721 | ||||||||
| Automotive — 1.0% | ||||||||
| Cie Generale des Etablissements Michelin - ADR | 3,525 | 107,759 | ||||||
| Home & Office Products — 1.8% | ||||||||
| Panasonic Corporation - ADR | 16,630 | 189,998 | ||||||
| Leisure Facilities & Services — 0.9% | ||||||||
| Accor S.A. - ADR (a) | 12,805 | 102,363 | ||||||
| Consumer Staples — 9.8% | ||||||||
| Food — 4.5% | ||||||||
| Conagra Brands, Inc. | 2,570 | 97,917 | ||||||
| Hershey Company (The) | 620 | 107,291 | ||||||
| Ingredion, Inc. | 1,070 | 101,575 | ||||||
| McCormick & Company, Inc. | 1,200 | 106,872 | ||||||
| Vital Farms, Inc. (a) | 3,215 | 68,448 | ||||||
| 482,103 | ||||||||
| Household Products — 2.4% | ||||||||
| L’Oreal S.A. - ADR | 1,290 | 116,874 | ||||||
| Procter & Gamble Company (The) | 1,085 | 146,312 | ||||||
| 263,186 | ||||||||
15
| KARNER BLUE BIODIVERSITY IMPACT FUND |
| SCHEDULE OF INVESTMENTS (Continued) |
| COMMON STOCKS — 99.2% (Continued) | Shares | Value | ||||||
| Consumer Staples — 9.8% (Continued) | ||||||||
| Retail - Consumer Staples — 2.9% | ||||||||
| Sprouts Farmers Market, Inc. (a) | 5,885 | $ | 156,541 | |||||
| Target Corporation | 710 | 161,113 | ||||||
| 317,654 | ||||||||
| Energy — 8.7% | ||||||||
| Oil & Gas Producers — 4.5% | ||||||||
| Equinor ASA - ADR | 8,799 | 192,786 | ||||||
| Repsol S.A. - ADR | 8,649 | 116,069 | ||||||
| Total SE - ADR | 3,700 | 172,753 | ||||||
| 481,608 | ||||||||
| Renewable Energy — 4.2% | ||||||||
| Canadian Solar, Inc. (a) | 3,680 | 145,654 | ||||||
| Enphase Energy, Inc. (a) | 1,415 | 202,416 | ||||||
| First Solar, Inc. (a) | 1,425 | 108,457 | ||||||
| 456,527 | ||||||||
| Financials — 11.6% | ||||||||
| Banking — 8.4% | ||||||||
| Bank of Montreal | 1,630 | 171,183 | ||||||
| BNP Paribas S.A. - ADR | 5,717 | 197,179 | ||||||
| Citigroup, Inc. | 1,465 | 115,310 | ||||||
| Credit Agricole S.A. - ADR | 14,400 | 107,280 | ||||||
| HSBC Holdings plc - ADR | 4,805 | 155,586 | ||||||
| ING Groep N.V. - ADR | 11,528 | 161,046 | ||||||
| 907,584 | ||||||||
| Institutional Financial Services — 3.2% | ||||||||
| Credit Suisse Group AG - ADR | 11,500 | 126,730 | ||||||
| Goldman Sachs Group, Inc. (The) | 580 | 215,772 | ||||||
| 342,502 | ||||||||
| Health Care — 12.0% | ||||||||
| Biotech & Pharma — 9.7% | ||||||||
| AbbVie, Inc. | 1,390 | 157,348 | ||||||
| AstraZeneca plc - ADR | 1,970 | 111,837 | ||||||
| Bristol-Myers Squibb Company | 2,340 | 153,785 | ||||||
| Merck & Company, Inc. | 1,855 | 140,776 | ||||||
| Novo Nordisk A/S - ADR | 2,150 | 169,635 | ||||||
| Roche Holding AG - ADR | 3,559 | 155,742 | ||||||
| Sanofi - ADR | 2,940 | 157,084 | ||||||
| 1,046,207 | ||||||||
16
| KARNER BLUE BIODIVERSITY IMPACT FUND |
| SCHEDULE OF INVESTMENTS (Continued) |
| COMMON STOCKS — 99.2% (Continued) | Shares | Value | ||||||
| Health Care — 12.0% (Continued) | ||||||||
| Medical Equipment & Devices — 2.3% | ||||||||
| Abbott Laboratories | 1,015 | $ | 118,400 | |||||
| Medtronic plc | 1,035 | 131,020 | ||||||
| 249,420 | ||||||||
| Industrials — 13.9% | ||||||||
| Commercial Support Services — 1.4% | ||||||||
| Waste Management, Inc. | 1,047 | 147,292 | ||||||
| Diversified Industrials — 3.8% | ||||||||
| 3M Company | 665 | 135,021 | ||||||
| General Electric Company | 8,360 | 117,542 | ||||||
| Pentair plc | 2,330 | 160,700 | ||||||
| 413,263 | ||||||||
| Electrical Equipment — 1.4% | ||||||||
| Trimble, Inc. (a) | 1,920 | 149,357 | ||||||
| Engineering & Construction — 1.2% | ||||||||
| Stantec, Inc. | 2,875 | 128,743 | ||||||
| Machinery — 2.9% | ||||||||
| Deere & Company | 580 | 209,438 | ||||||
| Xylem, Inc. | 895 | 105,717 | ||||||
| 315,155 | ||||||||
| Transportation & Logistics — 3.2% | ||||||||
| A.P. Moller-Maersk A/S - B Shares - ADR | 12,695 | 175,445 | ||||||
| Deutsche Post AG - ADR | 2,561 | 173,994 | ||||||
| 349,439 | ||||||||
| Materials — 21.8% | ||||||||
| Chemicals — 4.5% | ||||||||
| Air Products & Chemicals, Inc. | 360 | 107,878 | ||||||
| Akzo Nobel N.V. - ADR | 3,920 | 167,462 | ||||||
| Avery Dennison Corporation | 485 | 106,957 | ||||||
| Koninklijke DSM N.V. - ADR | 2,245 | 103,517 | ||||||
| 485,814 | ||||||||
| Construction Materials — 5.7% | ||||||||
| CRH plc - ADR | 2,065 | 107,524 | ||||||
| Holcim Ltd. - ADR (a) | 10,502 | 126,129 | ||||||
| Owens Corning | 1,840 | 196,236 | ||||||
| Vulcan Materials Company | 990 | 181,487 | ||||||
| 611,376 | ||||||||
17
| KARNER BLUE BIODIVERSITY IMPACT FUND |
| SCHEDULE OF INVESTMENTS (Continued) |
| COMMON STOCKS — 99.2% (Continued) | Shares | Value | ||||||
| Materials — 21.8% (Continued) | ||||||||
| Forestry, Paper & Wood Products — 3.4% | ||||||||
| Stora Enso Oyj - ADR | 7,281 | $ | 129,238 | |||||
| Trex Company, Inc. (a) | 1,489 | 145,043 | ||||||
| UPM-Kymmene Oyj - ADR | 2,475 | 94,793 | ||||||
| 369,074 | ||||||||
| Metals & Mining — 8.2% | ||||||||
| Barrick Gold Corporation | 6,646 | 160,036 | ||||||
| Fortescue Metals Group Ltd. - ADR | 4,850 | 165,433 | ||||||
| Freeport-McMoRan, Inc. | 3,646 | 155,757 | ||||||
| Kinross Gold Corporation | 20,796 | 168,448 | ||||||
| Newmont Corporation | 3,177 | 233,446 | ||||||
| 883,120 | ||||||||
| Technology — 6.1% | ||||||||
| Semiconductors — 2.0% | ||||||||
| NVIDIA Corporation | 335 | 217,676 | ||||||
| Software — 3.2% | ||||||||
| Microsoft Corporation | 855 | 213,476 | ||||||
| SAP SE - ADR | 990 | 138,531 | ||||||
| 352,007 | ||||||||
| Technology Hardware — 0.9% | ||||||||
| Sony Corporation - ADR | 940 | 93,634 | ||||||
| Utilities — 1.6% | ||||||||
| Electric & Gas Marketing & Trading — 1.6% | ||||||||
| Orsted A/S - ADR | 3,310 | 168,512 | ||||||
| Investments at Value — 99.2% (Cost $8,706,226) | $ | 10,711,563 | ||||||
| Other Assets in Excess of Liabilities — 0.8% | 91,087 | |||||||
| Net Assets — 100.0% | $ | 10,802,650 | ||||||
ADR - American Depositary Receipt.
| (a) | Non-income producing security. |
See accompanying notes to financial statements.
18
| KARNER BLUE BIODIVERSITY IMPACT FUND |
| STATEMENT OF ASSETS AND LIABILITIES |
| May 31, 2021 |
| ASSETS | ||||
| Investments in securities: | ||||
| At cost | $ | 8,706,226 | ||
| At value (Note 2) | $ | 10,711,563 | ||
| Cash (Note 2) | 121,070 | |||
| Receivable for capital shares sold | 350 | |||
| Receivable from Adviser (Note 4) | 1,944 | |||
| Dividend and income receivable | 12,067 | |||
| Tax reclaims receivable | 125 | |||
| Other assets | 8,644 | |||
| Total assets | 10,855,763 | |||
| LIABILITIES | ||||
| Payable for investment securities purchased | 38,867 | |||
| Payable to administrator (Note 4) | 7,090 | |||
| Accrued administrative services fee (Note 4) | 2,087 | |||
| Other accrued expenses | 5,069 | |||
| Total liabilities | 53,113 | |||
| NET ASSETS | $ | 10,802,650 | ||
| NET ASSETS CONSIST OF: | ||||
| Paid-in capital | $ | 8,216,554 | ||
| Accumulated earnings | 2,586,096 | |||
| NET ASSETS | $ | 10,802,650 | ||
| NET ASSET VALUE PER SHARE: | ||||
| BUTTERFLY™ CLASS | ||||
| Net assets applicable to Butterfly™ Class | $ | 10,802,650 | ||
| Butterfly™ Class shares of beneficial interest outstanding (unlimited number of shares authorized, no par value) | 766,849 | |||
| Net asset value, offering price and redemption price per share (Note 2) | $ | 14.09 | ||
See accompanying notes to financial statements.
19
| KARNER BLUE BIODIVERSITY IMPACT FUND |
| STATEMENT OF OPERATIONS |
| Year Ended May 31, 2021 |
| INVESTMENT INCOME | ||||
| Dividend income | $ | 187,755 | ||
| Foreign witholding taxes on dividends | (23,357 | ) | ||
| Total investment income | 164,398 | |||
| EXPENSES | ||||
| Investment advisory fees (Note 4) | 64,824 | |||
| Fund accounting fees (Note 4) | 36,388 | |||
| Transfer agent fees (Note 4) | 32,661 | |||
| Administration fees (Note 4) | 26,000 | |||
| Legal fees | 25,975 | |||
| Registration fees - Investor Class | 10,589 | |||
| Registration fees - Butterfly™ Class | 6,191 | |||
| Registration fees - Institutional Class | 5,840 | |||
| Trustees’ fees and expenses (Note 4) | 16,750 | |||
| Audit and tax services fees | 16,500 | |||
| Compliance fees (Note 4) | 12,000 | |||
| Filing fees | 8,858 | |||
| Postage and supplies | 6,749 | |||
| Custody and bank service fees | 6,705 | |||
| Printing of shareholder reports | 5,545 | |||
| Insurance expense | 3,161 | |||
| Administrative service fees (Note 4) | 1,990 | |||
| Distribution fees - Investor Class (Note 4) | 1,034 | |||
| Other expenses | 24,911 | |||
| Total expenses | 312,671 | |||
| Less fee reductions and expense reimbursements by Adviser (Note 4) | (217,946 | ) | ||
| Less fee waivers by the administrator (Note 4) | (23,800 | ) | ||
| Net expenses | 70,925 | |||
| NET INVESTMENT INCOME | 93,473 | |||
| REALIZED AND UNREALIZED GAINS ON INVESTMENTS AND FOREIGN CURRENCIES | ||||
| Net realized gains from: | ||||
| Investments | 695,017 | |||
| Foreign currency transactions (Note 2) | 546 | |||
| Net change in unrealized appreciation (depreciation) on investments | 1,908,545 | |||
| NET REALIZED AND UNREALIZED GAINS ON INVESTMENTS AND FOREIGN CURRENCIES | 2,604,108 | |||
| NET INCREASE IN NET ASSETS RESULTING FROM OPERATIONS | $ | 2,697,581 |
See accompanying notes to financial statements.
20
| KARNER BLUE BIODIVERSITY IMPACT FUND |
| STATEMENTS OF CHANGES IN NET ASSETS |
| Year Ended | Period Ended | |||||||
| May 31, | May 31, | |||||||
| 2021 | 2020 (a) | |||||||
| FROM OPERATIONS | ||||||||
| Net investment income | $ | 93,473 | $ | 46,675 | ||||
| Net realized gains (losses) from investments and foreign currency translations | 695,563 | (162,337 | ) | |||||
| Net change in unrealized appreciation (depreciation) on investments | 1,908,545 | 96,792 | ||||||
| Net increase (decrease) in net assets resulting from operations | 2,697,581 | (18,870 | ) | |||||
| FROM DISTRIBUTIONS TO SHAREHOLDERS (Note 2) | ||||||||
| Investor Class | (4,791 | ) | (173 | ) | ||||
| Institutional Class | (3,457 | ) | (31 | ) | ||||
| Butterfly™ Class | (79,509 | ) | (4,685 | ) | ||||
| Decrease in net assets from distributions to shareholders | (87,757 | ) | (4,889 | ) | ||||
| CAPITAL SHARE TRANSACTIONS | ||||||||
| Investor Class | ||||||||
| Proceeds from shares sold | 233,552 | 478,670 | ||||||
| Net asset value of shares issued in reinvestment of distributions to shareholders | 4,791 | 173 | ||||||
| Payments for shares redeemed | (50,325 | ) | (50,030 | ) | ||||
| Shares exchanged for Butterfly™ Class (Note 1) | (746,207 | ) | — | |||||
| Net increase (decrease) in Investor Class net assets from capital share transactions | (558,189 | ) | 428,813 | |||||
| Institutional Class | ||||||||
| Proceeds from shares sold | — | 303,524 | ||||||
| Net asset value of shares issued in reinvestment of distributions to shareholders | 3,457 | 31 | ||||||
| Payments for shares redeemed | (685 | ) | (189 | ) | ||||
| Shares exchanged for Butterfly™ Class (Note 1) | (374,058 | ) | — | |||||
| Net increase (decrease) in Institutional Class net assets from capital share transactions | (371,286 | ) | 303,366 | |||||
| Butterfly™ Class | ||||||||
| Proceeds from shares sold | 1,750,844 | 5,513,500 | ||||||
| Shares exchanged from Investor Class (Note 1) | 746,207 | — | ||||||
| Shares exchanged from Institutional Class (Note 1) | 374,058 | — | ||||||
| Net asset value of shares issued in reinvestment of distributions to shareholders | 28,650 | 4,685 | ||||||
| Payments for shares redeemed | (217 | ) | (3,846 | ) | ||||
| Net increase in Butterfly Class™ net assets from capital share transactions | 2,899,542 | 5,514,339 | ||||||
| TOTAL INCREASE IN NET ASSETS | 4,579,891 | 6,222,759 | ||||||
| (a) | Represents the period from the commencement of operations (September 17, 2019) through May 31, 2020. |
See accompanying notes to financial statements.
21
| KARNER BLUE BIODIVERSITY IMPACT FUND |
| STATEMENTS OF CHANGES IN NET ASSETS (Continued) |
| Year Ended | Period Ended | |||||||
| May 31, | May 31, | |||||||
| 2021 | 2020 (a) | |||||||
| NET ASSETS | ||||||||
| Beginning of period | $ | 6,222,759 | $ | — | ||||
| End of period | $ | 10,802,650 | $ | 6,222,759 | ||||
| CAPITAL SHARE ACTIVITY | ||||||||
| Investor Class | ||||||||
| Shares sold | 18,449 | 46,943 | ||||||
| Shares reinvested | 384 | 16 | ||||||
| Shares redeemed | (4,416 | ) | (4,988 | ) | ||||
| Shares exchanged for Butterfly™ Class (Note 1) | (56,388 | ) | — | |||||
| Net increase (decrease) in shares outstanding | (41,971 | ) | 41,971 | |||||
| Shares outstanding at beginning of period | 41,971 | — | ||||||
| Shares outstanding at end of period | — | 41,971 | ||||||
| Institutional Class | ||||||||
| Shares sold | — | 28,006 | ||||||
| Shares reinvested | 277 | 3 | ||||||
| Shares redeemed | (59 | ) | (20 | ) | ||||
| Shares exchanged for Butterfly™ Class (Note 1) | (28,207 | ) | — | |||||
| Net increase (decrease) in shares outstanding | (27,989 | ) | 27,989 | |||||
| Shares outstanding at beginning of period | 27,989 | — | ||||||
| Shares outstanding at end of period | — | 27,989 | ||||||
| Butterfly™ Class | ||||||||
| Shares sold | 136,601 | 543,487 | ||||||
| Shares issued in connection with exchange of Investor Class shares (Note 1) | 56,224 | — | ||||||
| Shares issued in connection with exchange of Institutional Class shares (Note 1) | 28,184 | — | ||||||
| Shares reinvested | 2,290 | 438 | ||||||
| Shares redeemed | (16 | ) | (359 | ) | ||||
| Net increase in shares outstanding | 223,283 | 543,566 | ||||||
| Shares outstanding at beginning of period | 543,566 | — | ||||||
| Shares outstanding at end of period | 766,849 | 543,566 | ||||||
| (a) | Represents the period from the commencement of operations (September 17, 2019) through May 31, 2020. |
See accompanying notes to financial statements.
22
| KARNER BLUE BIODIVERSITY IMPACT FUND |
| BUTTERFLY™ CLASS |
| FINANCIAL HIGHLIGHTS |
| Per Share Data for a Share Outstanding Throughout Each Period |
| Year Ended | Period Ended | |||||||
| May 31, | May 31, | |||||||
| 2021 | 2020 (a) | |||||||
| Net asset value at beginning of period | $ | 10.14 | $ | 10.00 | ||||
| Income from investment operations: | ||||||||
| Net investment income (b) | 0.15 | 0.10 | ||||||
| Net realized and unrealized gains on investments and foreign currencies | 3.94 | 0.05 | (c) | |||||
| Total from investment operations | 4.09 | 0.15 | ||||||
| Less distributions from: | ||||||||
| Net investment income | (0.14 | ) | (0.01 | ) | ||||
| Net asset value at end of period | $ | 14.09 | $ | 10.14 | ||||
| Total return (d) | 40.49 | % | 1.50 | % (e) | ||||
| Net assets at end of period (000’s) | $ | 10,803 | $ | 5,514 | ||||
| Ratios/supplementary data: | ||||||||
| Ratio of total expenses to average net assets | 3.62 | % | 5.32 | % (f) | ||||
| Ratio of net expenses to average net assets (g) | 0.85 | % | 0.85 | % (f) | ||||
| Ratio of net investment income to average net assets (g) | 1.20 | % | 1.47 | % (f) | ||||
| Portfolio turnover rate | 55 | % | 61 | % (e) | ||||
| (a) | Represents the period from the commencement of operations (September 17, 2019) through May 31, 2020. |
| (b) | Net investment income per share has been determined on the basis of average number of shares outstanding during the period. |
| (c) | Represents a balancing figure derived from other amounts in the financial highlights table that captures all other changes affecting net asset value per share. This per share amount does not correlate to the aggregate of the net realized and unrealized losses on the Statement of Operations for the same period. |
| (d) | Total return is a measure of the change in value of an investment in the Fund over the periods covered. The returns shown do not reflect the deduction of taxes a shareholder would pay on Fund distributions, if any, or the redemption of Fund shares. The total returns would be lower if the Adviser had not reduced advisory fees and reimbursed expenses (Note 4). |
| (e) | Not annualized. |
| (f) | Annualized. |
| (g) | Ratio was determined after fee reductions and expense reimbursements (Note 4). |
See accompanying notes to financial statements.
23
| KARNER BLUE BIODIVERSITY IMPACT FUND |
| NOTES TO FINANCIAL STATEMENTS |
| May 31, 2021 |
| 1. | Organization |
Karner Blue Biodiversity Impact Fund (formerly Karner Blue Animal Impact Fund) (the “Fund”) is a diversified series of Ultimus Managers Trust (the “Trust”), an open-end investment company established as an Ohio business trust under a Declaration of Trust dated February 28, 2012. Other series of the Trust are not incorporated in this report.
The investment objective of the Fund is to seek to achieve long-term total returns by investing in companies that lead their industries in animal welfare performance.
The Fund currently offers one class of shares: Butterfly™ Class shares (sold without any sales loads and distribution and/or shareholder service fees but subject to an administrative service fee of up to 0.10% of the average net assets, and requiring a $2,000 initial investment). Prior to March 19, 2021, the Fund offered three classes of shares, including Investor Class shares (sold without any sales loads, but subject to a distribution and/or shareholder service fee of up to 0.25% of the average daily net assets attributable to Investor Class shares, and requiring a $2,000 initial investment), Institutional Class shares (sold without any sales loads and distribution and/or shareholder service fees but subject to an administrative service fee of up to 0.10% of the average daily net assets attributable to Institutional Class shares, and requiring a $200,000 initial investment) and ButterflyTM Class shares (sold without any sales loads and distribution and/or shareholder service fees and requiring a $2,000,000 initial investment). On March 19, 2021, all existing Investor Class and Institutional Class shares were converted into Butterfly™ Class shares at the Butterfly™ Class net asset value per share as of March 18, 2021, which was $13.27. After March 19, 2021, Investor Class shares and Institutional Class shares were no longer offered by the Fund.
| 2. | Significant Accounting Policies |
The following is a summary of the Fund’s significant accounting policies. The policies are in conformity with accounting principles generally accepted in the United States of America (“GAAP”). The Fund follows accounting and reporting guidance under Financial Accounting Standards Board Accounting Standards Codification Topic 946, “Financial Services – Investment Companies.”
Securities valuation – The Fund values its portfolio securities at market value as of the close of regular trading on the New York Stock Exchange (the “NYSE”) (normally 4:00 p.m. Eastern time) on each business day the NYSE is open for business. The Fund values its listed securities on the basis of the security’s last sale price on the security’s primary exchange, if available, otherwise at the exchange’s most recently quoted mean price. NASDAQ-listed securities are valued at the NASDAQ Official Closing Price. When using a quoted price and when the market is considered active, the security will be classified as Level 1 within the fair value hierarchy (see below). In the event that market quotations
24
| KARNER BLUE BIODIVERSITY IMPACT FUND |
| NOTES TO FINANCIAL STATEMENTS (Continued) |
are not readily available or are considered unreliable due to market or other events, the Fund values its securities and other assets at fair value in accordance with procedures established by and under the general supervision of the Board of Trustees (the “Board”). Under these procedures, the securities will be classified as Level 2 or 3 within the fair value hierarchy, depending on the inputs used. Unavailable or unreliable market quotes may be due to the following factors: a substantial bid-ask spread; infrequent sales resulting in stale prices; insufficient trading volume; small trade sizes; a temporary lapse in any reliable pricing source; and actions of the securities or futures markets, such as the suspension or limitation of trading. As a result, the prices of securities used to calculate the Fund’s net asset value (“NAV”) may differ from quoted or published prices for the same securities.
GAAP establishes a single authoritative definition of fair value, sets out a framework for measuring fair value, and requires additional disclosures about fair value measurements.
Various inputs are used in determining the value of the Fund’s investments. These inputs are summarized in the three broad levels listed below:
| ● | Level 1 – quoted prices in active markets for identical securities |
| ● | Level 2 – other significant observable inputs |
| ● | Level 3 – significant unobservable inputs |
The inputs or methods used for valuing securities are not necessarily an indication of the risks associated with investing in those securities. The inputs used to measure fair value may fall into different levels of the fair value hierarchy. In such cases, for disclosure purposes, the level in the fair value hierarchy within which the fair value measurement falls in its entirety is determined based on the lowest level input that is significant to the fair value measurement.
The following is a summary of the Fund’s investments and the inputs used to value the investments as of May 31, 2021:
| Level 1 | Level 2 | Level 3 | Total | |||||||||||||
| Common Stocks | $ | 10,711,563 | $ | — | $ | — | $ | 10,711,563 | ||||||||
| Total | $ | 10,711,563 | $ | — | $ | — | $ | 10,711,563 | ||||||||
Refer to the Fund’s Schedule of Investments for a listing of securities by sector and industry type. The Fund did not hold any derivative instruments or any assets or liabilities that were measured at fair value on a recurring basis using significant unobservable inputs (Level 3) as of or during the year ended May 31, 2021.
25
| KARNER BLUE BIODIVERSITY IMPACT FUND |
| NOTES TO FINANCIAL STATEMENTS (Continued) |
Cash account – The Fund’s cash is held in a bank account with balances which may exceed the amount covered by federal deposit insurance. As of May 31, 2021, the cash balance reflected on the Statement of Assets and Liabilities represents the amount held in a deposit sweep account.
Share valuation – The NAV per share of the Fund is calculated daily by dividing the total value of the assets, less liabilities, by the number of shares outstanding. The offering price and redemption price per share of the Fund is equal to the NAV per share of the Fund.
Investment income – Dividend income is recorded on the ex-dividend date. Non-cash dividends included in dividend income, if any, are recorded at the fair market value of the security received. Interest income is accrued as earned. Withholding taxes on foreign dividends have been recorded in accordance with the Fund’s understanding of the applicable country’s rules and tax rates.
Investment transactions – Investment transactions are accounted for on the trade date. Realized gains and losses on investments sold are determined on a specific identification basis.
Foreign currency translation – Securities and other assets and liabilities denominated in or expected to settle in foreign currencies, if any, are translated into U.S. dollars based on exchange rates on the following basis:
| A. | The fair values of investment securities and other assets and liabilities are translated as of the close of the NYSE each day. |
| B. | Purchases and sales of investment securities and income and expenses are translated at the rate of exchange prevailing as of 4:00 p.m. Eastern time on the respective date of such transactions. |
| C. | The Fund does not isolate that portion of the results of operations caused by changes in foreign exchange rates on investments from those caused by changes in market prices of securities held. Such fluctuations are included with the net realized and unrealized gains or losses on investments. |
Reported net realized foreign exchange gains or losses arise from 1) purchases and sales of foreign currencies, 2) currency gains or losses realized between trade and settlement dates on securities transactions, and 3) the difference between the amounts of dividends and foreign withholding taxes recorded on the Fund’s books and the U.S. dollar equivalent of the amounts actually received or paid. Reported net unrealized foreign exchange gains and losses arise from changes in the value of assets and liabilities, other than investments in securities, that result from changes in exchange rates.
Allocation between Classes – Investment income earned, realized capital gains and losses, and unrealized appreciation and depreciation were allocated daily to each Class of the Fund based upon its proportionate share of total net assets of the Fund. Class-specific expenses were charged directly to the Class incurring the expense. Common expenses
26
| KARNER BLUE BIODIVERSITY IMPACT FUND |
| NOTES TO FINANCIAL STATEMENTS (Continued) |
which were not attributable to a specific Class were allocated daily to each Class of shares of the Fund based upon its proportionate share of total net assets of the Fund. Effective March 19, 2021, the allocation between classes no longer applies to the Fund.
Common expenses – Common expenses of the Trust are allocated among the Fund and the other series of the Trust based on the relative net assets of each series, the number of series in the Trust, or the nature of the services performed and the relative applicability to each series.
Distributions to shareholders – The Fund distributes to shareholders any net investment income dividends and net realized capital gains distributions at least once each year. The amount of such dividends and distributions are determined in accordance with federal income tax regulations, which may differ from GAAP. Dividends and distributions to shareholders are recorded on the ex-dividend date. The distributions paid to shareholders during the periods ended May 31, 2021 and 2020 were from ordinary income.
Estimates – The preparation of financial statements in conformity with GAAP requires management to make estimates and assumptions that affect the reported amounts of assets and liabilities and disclosure of contingent assets and liabilities as of the date of the financial statements and the reported amounts of increase (decrease) in net assets from operations during the reporting period. Actual results could differ from those estimates.
Federal income tax – The Fund has qualified and intends to continue to qualify as a regulated investment company under the Internal Revenue Code of 1986, as amended (the “Code”). Qualification generally will relieve the Fund of liability for federal income taxes to the extent 100% of its net investment income and net realized capital gains are distributed in accordance with the Code.
In order to avoid imposition of the excise tax applicable to regulated investment companies, it is also the Fund’s intention to declare as dividends amounts in each calendar year at least 98% of its net investment income (earned during the calendar year) and 98.2% of its net realized capital gains (earned during the twelve months ended October 31) plus undistributed amounts from prior years.
The following information is computed on a tax basis for each item as of May 31, 2021:
| Tax cost of portfolio investments | $ | 8,711,490 | ||
| Gross unrealized appreciation | $ | 2,219,709 | ||
| Gross unrealized depreciation | (219,636 | ) | ||
| Net unrealized appreciation | 2,000,073 | |||
| Undistributed ordinary income | 108,845 | |||
| Undistributed long-term capital gains | 477,178 | |||
| Accumulated earnings | $ | 2,586,096 | ||
27
| KARNER BLUE BIODIVERSITY IMPACT FUND |
| NOTES TO FINANCIAL STATEMENTS (Continued) |
The difference between the federal income tax cost of portfolio investments and the financial statement cost of portfolio investments is due to certain timing differences in the recognition of capital gains or losses under income tax regulations and GAAP. These “book/tax” differences are temporary in nature and are primarily due to the tax deferral of losses on wash sales.
For the year ended May 31, 2021, the Fund utilized $153,539 of short-term capital loss carryforwards for federal income tax purposes to offset current year net realized capital gains.
For the year ended May 31, 2021, the Fund reclassified $14 of accumulated earnings against paid-in capital on the Statement of Assets and Liabilities due to adjustments for non-deductible federal excise tax paid. Such reclassification, the result of permanent differences between financial statement and income tax reporting requirements, has no effect on the Fund’s net assets or NAV per share.
The Fund recognizes the tax benefits or expenses of uncertain tax positions only when the position is “more likely than not” of being sustained assuming examination by tax authorities. Management has reviewed the Fund’s tax positions for all open tax periods and has concluded that no provision for unrecognized tax benefits or expenses is required in these financial statements. The Fund identifies its major tax jurisdiction as U.S. Federal.
| 3. | Investment Transactions |
During the year ended May 31, 2021, cost of purchases and proceeds from sales of investment securities, other than short-term investments, amounted to $6,524,211 and $4,377,410, respectively.
| 4. | Transactions with Related Parties |
INVESTMENT ADVISORY AGREEMENT
The Fund’s investments are managed by Karner Blue Capital, LLC (the “Adviser”) pursuant to the terms of an Investment Advisory Agreement. The Fund pays the Adviser an investment advisory fee, computed and accrued daily and paid monthly, at the annual rate of 0.80% of average daily net assets.
Pursuant to an Expense Limitation Agreement (“ELA”) between the Fund and the Adviser, the Adviser has contractually agreed, until September 30, 2021, to reduce investment advisory fees and reimburse other operating expenses to limit total annual operating expenses of the Fund (exclusive of brokerage costs; taxes; interest; borrowing costs such as interest and dividend expenses on securities sold short; costs to organize the Fund; acquired fund fees and expenses; extraordinary expenses such as litigation and merger or reorganization costs; and other expenses not incurred in the ordinary course of the Fund’s business) to an amount not exceeding 0.85% of its average daily net assets.
28
| KARNER BLUE BIODIVERSITY IMPACT FUND |
| NOTES TO FINANCIAL STATEMENTS (Continued) |
Accordingly, during the year ended May 31, 2021, the Adviser did not collect any of its investment advisory fees and reimbursed other operating expenses of $153,122.
Under the terms of the ELA, investment advisory fee reductions and expense reimbursements by the Adviser are subject to repayment by the Fund for a period of three years after such fees and expenses were incurred, provided that the repayments do not cause total annual fund operating expenses to exceed the lesser of (i) the expense limitation then in effect, if any, and (ii) the expense limitation in effect at the time the expenses to be repaid were incurred. As of May 31, 2021, the Adviser may in the future seek repayment of investment advisory fee reductions and expense reimbursements in the amount of $362,728 no later than the dates listed below:
| May 31, 2023 | $ | 144,782 | ||
| May 31, 2024 | 217,946 | |||
| Total | $ | 362,728 | ||
OTHER SERVICE PROVIDERS
Ultimus Fund Solutions, LLC (“Ultimus”) provides administration, fund accounting, compliance and transfer agency services to the Fund. The Fund pays Ultimus fees in accordance with the agreements for such services. In addition, the Fund pays out-of-pocket expenses including, but not limited to, postage, supplies and certain costs related to the pricing of its portfolio securities. During the year ended May 31, 2021, Ultimus voluntarily waived fees in the amount of $23,800. These voluntary waivers are not subject to recoupment by Ultimus.
Under the terms of a Distribution Agreement with the Trust, Ultimus Fund Distributors, LLC (the “Distributor”) serves as the principal underwriter to the Fund. The Distributor is a wholly-owned subsidiary of Ultimus. The Distributor is compensated partially by the Adviser and was partially compensated by the Investor Class shares of the Fund for acting as principal underwriter. The portion paid by the Investor Class shares is reflected in the Distribution fees - Investor Class on the Statement of Operations.
Certain officers and a Trustee of the Trust are also officers of Ultimus and are not paid by the Fund for serving in such capacities.
DISTRIBUTION PLAN
The Fund had adopted a plan of distribution (the “Plan”), pursuant to Rule 12b-1 under the Investment Company Act of 1940, as amended (the “1940 Act”), which permitted Investor Class shares of the Fund to directly incur or reimburse the Fund’s principal underwriter for certain expenses related to the distribution of its shares. The annual limitation for payment of expenses pursuant to the Plan was 0.25% of the Fund’s average daily net assets allocable to Investor Class shares. The Fund had not adopted a plan of distribution
29
| KARNER BLUE BIODIVERSITY IMPACT FUND |
| NOTES TO FINANCIAL STATEMENTS (Continued) |
with respect to the Institutional Class shares or the Butterfly™ Class shares. During the year ended May 31, 2021, the Investor Class shares incurred $1,034 of distribution fees under the Plan. The Plan was terminated on March 19, 2021.
ADMINISTRATIVE SERVICES PLAN
Effective March 19, 2021, the Fund has adopted an Administrative Services Plan (the “Administrative Services Plan”), for the Butterfly™ Class shares of the Fund. The Administrative Services Plan allows the Fund to use the net assets of the Butterfly™ Class shares to pay financial intermediaries that provide services relating to Butterfly™ Class shares. The Administrative Services Plan permits payments for the provision of certain administrative, recordkeeping and other non-distribution related services to Butterfly™ Class shareholders. The Administrative Services Plan permits the Fund to make service fee payments at an annual rate of up to 0.10% of the Fund’s average daily net assets attributable to its Butterfly™ Class shares. Prior to March 19, 2021, the Administrative Services Plan was attributable to the Institutional Class Shares. During the year ended May 31, 2021, the Fund incurred $1,990 of fees under the Administrative Services Plan.
TRUSTEE COMPENSATION
Each member of the Board (a “Trustee”) who is not an “interested person” of the Trust (“Independent Trustee”) receives a $1,300 annual retainer from the Fund, paid quarterly, except for the Board Chairperson who receives a $1,500 annual retainer from the Fund, paid in quarterly installments. Each Independent Trustee also receives from the Fund a fee of $500 for each Board meeting attended plus reimbursement for travel and other meeting-related expenses.
PRINCIPAL HOLDERS OF FUND SHARES
As of May 31, 2021, the following shareholders owned of record 25% or more of the outstanding shares of the Fund:
| Name of Record Owners | % Ownership |
| Butterfly™ Class | |
| SEI Private Trust Company (for the benefit of its customers) | 59% |
A beneficial owner of 25% or more of the Fund’s outstanding shares may be considered a controlling person of the Fund. That shareholder’s vote could have a more significant effect on matters presented at a shareholders’ meeting.
| 5. | Foreign Securities Risk |
The Fund may invest in American Depositary Receipts (“ADRs”). Investments in ADRs provide exposure to foreign securities that may involve different risks than those of U.S. securities. Foreign securities are subject to individual country risk, less favorable
30
| KARNER BLUE BIODIVERSITY IMPACT FUND |
| NOTES TO FINANCIAL STATEMENTS (Continued) |
reporting and disclosure risk, currency exchange risk and greater price volatility, and may have higher liquidity risk than U.S. registered securities. As of May 31, 2021, the Fund had 38.0% of its net assets invested in ADRs.
| 6. | Contingencies and Commitments |
The Fund indemnifies the Trust’s officers and Trustees for certain liabilities that might arise from their performance of their duties to the Fund. Additionally, in the normal course of business the Fund enters into contracts that contain a variety of representations and warranties and which provide general indemnifications. The Fund’s maximum exposure under these arrangements is unknown, as this would involve future claims that may be made against the Fund that have not yet occurred. However, based on experience, the Fund expects the risk of loss to be remote.
| 7. | Subsequent Events |
The Fund is required to recognize in the financial statements the effects of all subsequent events that provide additional evidence about conditions that existed as of the date of the Statement of Assets and Liabilities. For non-recognized subsequent events that must be disclosed to keep the financial statements from being misleading, the Fund is required to disclose the nature of the event as well as an estimate of its financial effect, or a statement that such an estimate cannot be made. Management has evaluated subsequent events through the issuance of these financial statements and has noted no such events.
31
| KARNER BLUE BIODIVERSITY IMPACT FUND |
| REPORT
OF INDEPENDENT REGISTERED PUBLIC ACCOUNTING FIRM |
To
the Board of Trustees of Ultimus Managers Trust
and the Shareholders of Karner Blue Biodiversity Impact Fund
Opinion on the Financial Statements
We have audited the accompanying statement of assets and liabilities of Karner Blue Biodiversity Impact Fund (formerly, Karner Blue Animal Impact Fund), a series of shares of beneficial interest in Ultimus Managers Trust (the “Fund”), including the schedule of investments, as of May 31, 2021, and the related statement of operations for the year then ended, and the statements of changes in net assets and the financial highlights for the year then ended and for the period from September 17, 2019 (commencement of operations) through May 31, 2020, and the related notes (collectively referred to as the “financial statements”). In our opinion, the financial statements present fairly, in all material respects, the financial position of the Fund as of May 31, 2021, and the results of its operations for the year then ended, and the changes in its net assets and its financial highlights for the year then ended and for the period from September 17, 2019 to May 31, 2020, in conformity with accounting principles generally accepted in the United States of America.
Basis for Opinion
These financial statements are the responsibility of the Fund’s management. Our responsibility is to express an opinion on the Fund’s financial statements based on our audits. We are a public accounting firm registered with the Public Company Accounting Oversight Board (United States) (“PCAOB”) and are required to be independent with respect to the Fund in accordance with the U.S. federal securities law and the applicable rules and regulations of the Securities and Exchange Commission and the PCAOB.
We conducted our audits in accordance with the standards of the PCAOB. Those standards require that we plan and perform the audits to obtain reasonable assurance about whether the financial statements are free of material misstatement, whether due to error or fraud. The Fund is not required to have, nor were we engaged to perform, an audit of its internal control over financial reporting. As part of our audits, we are required to obtain an understanding of internal control over financial reporting but not for the purpose of expressing an opinion on the effectiveness of the Fund’s internal control over financial reporting. Accordingly, we express no such opinion.
Our audits included performing procedures to assess the risk of material misstatement of the financial statements, whether due to error or fraud, and performing procedures that respond to those risks. Such procedures included examining, on a test basis, evidence regarding the amounts and disclosures in the financial statements. Our procedures included confirmation of securities owned as of May 31, 2021 by correspondence with the custodian and brokers. Our audits also included evaluating the accounting principles
32
| KARNER BLUE BIODIVERSITY IMPACT FUND |
| REPORT
OF INDEPENDENT REGISTERED PUBLIC ACCOUNTING FIRM (Continued) |
used and significant estimates made by management, as well as evaluating the overall presentation of the financial statements. We believe that our audits provide a reasonable basis for our opinion.
BBD, LLP
We have served as the auditor of one or more of the Funds in the Ultimus Managers Trust since 2013.
Philadelphia,
Pennsylvania
July 23, 2021
33
| KARNER BLUE BIODIVERSITY IMPACT FUND |
| ABOUT YOUR FUND’S EXPENSES (Unaudited) |
We believe it is important for you to understand the impact of costs on your investment. As a shareholder of the Fund, you incur ongoing costs, including management fees, class-specific expenses (such as distribution fees and administrative services fees) and other operating expenses. The following examples are intended to help you understand your ongoing costs (in dollars) of investing in the Fund and to compare these costs with the ongoing costs of investing in other mutual funds.
A mutual fund’s ongoing costs are expressed as a percentage of its average net assets. This figure is known as the expense ratio. The expenses in the table below are based on an investment of $1,000 made at the beginning of the most recent semi-annual period (December 1, 2020) and held until the end of the period (May 31, 2021).
The table below illustrates the Fund’s ongoing costs in two ways:
Actual fund return – This section helps you to estimate the actual expenses that you paid over the period. The “Ending Account Value” shown is derived from the Fund’s actual return, and the fourth column shows the dollar amount of operating expenses that would have been paid by an investor who started with $1,000 in the Fund. You may use the information here, together with the amount you invested, to estimate the expenses that you paid over the period.
To do so, simply divide your account value by $1,000 (for example, an $8,600 account value divided by $1,000 = 8.6), then multiply the result by the number given for the Fund under the heading “Expenses Paid During Period.”
Hypothetical 5% return – This section is intended to help you compare the Fund’s ongoing costs with those of other mutual funds. It assumes that the Fund had an annual return of 5% before expenses during the period shown, but that the expense ratio is unchanged. In this case, because the return used is not the Fund’s actual return, the results do not apply to your investment. The example is useful in making comparisons because the U.S. Securities and Exchange Commission (the “SEC”) requires all mutual funds to calculate expenses based on a 5% return. You can assess the Fund’s ongoing costs by comparing this hypothetical example with the hypothetical examples that appear in shareholder reports of other funds.
Note that expenses shown in the table are meant to highlight and help you compare ongoing costs only. The Fund does not charge transaction fees, such as purchase or redemption fees, nor does it carry a “sales load.”
The calculations assume no shares were bought or sold during the period. Your actual costs may have been higher or lower, depending on the amount of your investment and the timing of any purchases or redemptions.
34
| KARNER BLUE BIODIVERSITY IMPACT FUND |
| ABOUT YOUR FUND’S EXPENSES (Unaudited) (Continued) |
More information about the Fund’s expenses can be found in this report. For additional information on operating expenses and other shareholder costs, please refer to the Fund’s prospectus.
| Beginning | Ending | |||
| Account Value | Account Value | Net | Expenses | |
| December 1, | May 31, | Expense | Paid During | |
| 2020 | 2021 | Ratio (a) | Period (b) | |
| Butterfly™ Class | ||||
| Based on Actual Fund Return | $1,000.00 | $1,177.30 | 0.85% | $4.61 |
| Based on Hypothetical 5% Return (before expenses) | $1,000.00 | $1,020.69 | 0.85% | $4.28 |
| (a) | Annualized, based on the most recent one-half year expenses. |
| (b) | Expenses are equal to the annualized expense ratio of the Fund, multiplied by the average account value over the period, multiplied by 182/365 (to reflect the one-half year period). |
| OTHER INFORMATION (Unaudited) |
A description of the policies and procedures that the Fund uses to vote proxies relating to portfolio securities is available without charge upon request by calling toll-free 1-855-KBANIML (855-522-6465), or on the SEC’s website at www.sec.gov. Information regarding how the Fund voted proxies relating to portfolio securities during the most recent 12-month period ended June 30 is also available without charge upon request by calling toll-free 1-855-KBANIML (855-522-6465), or on the SEC’s website at www.sec.gov.
The Trust files a complete listing of portfolio holdings for the Fund with the SEC as of the end of the first and third quarters of each fiscal year as an exhibit to its reports on Form N-PORT. These filings are available upon request by calling 1-855-KBANIML (855-522-6465). Furthermore, you may obtain a copy of the filings on the SEC’s website at www.sec.gov.
| FEDERAL TAX INFORMATION (Unaudited) |
Qualified Dividend Income – The Fund designates 100%, or up to the maximum amount of such dividends allowable pursuant to the Internal Revenue code, as qualified dividend income eligible for the reduced tax rate of 15%.
Dividends Received Deduction – Corporate shareholders are generally entitled to take the dividends received deduction on the portion of a Fund’s dividend distribution that qualifies under tax law. For the Fund’s fiscal year ended May 31, 2021, 50.25% of ordinary income dividends qualifies for the corporate dividends received deduction.
35
| KARNER BLUE BIODIVERSITY IMPACT FUND |
| BOARD OF TRUSTEES AND EXECUTIVE OFFICERS (Unaudited) |
The Board has overall responsibility for management of the Trust’s affairs. The Trustees serve during the lifetime of the Trust and until its termination, or until death, resignation, retirement, or removal. The Trustees, in turn, elect the officers of the Fund to actively supervise their day-to-day operations. The officers have been elected for an annual term. Each Trustee’s and officer’s address is 225 Pictoria Drive, Suite 450, Cincinnati, Ohio 45246. The following are the Trustees and executive officers of the Fund:
| Name
and Year of Birth |
Length
of Time Served |
Position(s)
Held with Trust |
Principal
Occupation(s) During Past 5 Years |
Number
of Funds in Trust Overseen by Trustee |
Directorships
of Public Companies Held by Trustee During Past 5 Years |
| Interested Trustees: | |||||
| David
R. Carson* Year of Birth: 1958 |
Since 2013 | Trustee and Vice President (January 2021 to present)
Principal Executive Officer (April 2017 to January 2021)
President (October 2013 to present)
Vice President (April 2013 to October 2013) |
SVP, Client Strategies of Ultimus Fund Solutions, LLC (2013 to present); President, Unified Series Trust (2016 to present) and Trustee (2020 to present); President, Centaur Mutual Funds Trust (2018 to present); Chief Compliance Officer, FSI Low Beta Absolute Return Fund (2013 to 2016) | 15 | Interested Trustee of Unified Series Trust (25 funds) |
| Independent Trustees: | |||||
| Janine
L. Cohen Year of Birth: 1952 |
Since January 2016 | Chairperson (October 2019 to present)
Trustee (January 2016 to present) |
Retired (2013) financial services executive | 15 | None |
36
| KARNER BLUE BIODIVERSITY IMPACT FUND |
| BOARD OF TRUSTEES AND EXECUTIVE OFFICERS (Unaudited) (Continued) |
| Name
and Year of Birth |
Length
of Time Served |
Position(s)
Held with Trust |
Principal
Occupation(s) During Past 5 Years |
Number
of Funds in Trust Overseen by Trustee |
Directorships
of Public Companies Held by Trustee During Past 5 Years |
| Independent Trustees (Continued): | |||||
| David
M. Deptula Year of Birth: 1958 |
Since June 2012 | Trustee | Vice President of Legal and Special Projects at Dayton Freight Lines, Inc. since 2016; Vice President of Tax Treasury at The Standard Register Inc. (formerly The Standard Register Company) from 2011 to 2016 | 15 | None |
| Robert
E. Morrison Year of Birth: 1957 |
Since June 2019 | Trustee | Senior Vice President and National Practice Lead for Investment, Huntington National Bank/Huntington Private Bank (2014 to present) | 15 | None |
| Clifford
N. Schireson Year of Birth: 1953 |
Since June 2019 | Trustee | Founder of Schireson Consulting, LLC (2017 to present); Director of Institutional Services for Brandes Investment Partners, LP (2004-2017) | 15 | Trustee of the San Diego City Employees’ Retirement System (2019 to present) |
| Jacqueline
A. Williams Year of Birth: 1954 |
Since June 2019 | Trustee | Managing Member of Custom Strategy Consulting, LLC (2017 to present); Managing Director of Global Investment Research (2005 to 2017), Cambridge Associates, LLC | 15 | None |
| * | Mr. Carson is considered an “interested person” of the Trust within the meaning of Section 2(a)(19) of the Investment Company Act of 1940, as amended, because of his relationship with the Trust’s administrator and transfer agent. |
37
| KARNER BLUE BIODIVERSITY IMPACT FUND |
| BOARD OF TRUSTEES AND EXECUTIVE OFFICERS (Unaudited) (Continued) |
| Name
and Year of Birth |
Length of Time Served |
Position(s) Held with Trust |
Principal Occupation(s) During Past 5 Years |
| Executive Officers: | |||
| Todd
E. Heim Year of Birth: 1967 |
Since 2014 | Principal Executive Officer and President (January 2021 to present)
Vice President (2014-2021) |
VP, Relationship Management of Ultimus Fund Solutions, LLC (2018 to present); Client Implementation Manager and AVP of Ultimus Fund Solutions, LLC (2014 to 2018); Naval Flight Officer in the United States Navy (May 1989 to June 2017) |
| Jennifer
L. Leamer Year of Birth: 1976 |
Since 2014 | Treasurer (October 2014 to present)
Assistant Treasurer (April 2014 to October 2014) |
SVP, Fund Accounting of Ultimus Fund Solutions, LLC (2014 to present) |
| Daniel
D. Bauer Year of Birth: 1977 |
Since 2016 | Assistant Treasurer (April 2016 to present) | AVP, Fund Accounting (September 2015 to present) of Ultimus Fund Solutions, LLC |
| David
K. James Year of Birth: 1970 |
Since 2021 | Secretary (July 2021 to present) | EVP, Chief Legal and Risk Officer of Ultimus Fund Solutions, LLC (2018 to present); Managing Director and Managing Counsel at State Street Bank and Trust Company (2009 to 2018) |
| Natalie
S. Anderson Year of Birth: 1975 |
Since 2016 | Assistant Secretary (April 2016 to present) | Manager, Legal Administration (July 2016 to present) and Paralegal (January 2015 to June 2016) of Ultimus Fund Solutions, LLC |
| Gweneth
K. Gosselink Year of Birth: 1955 |
Since 2020 | Chief Compliance Officer (January 2020 to present) | AVP, Compliance Officer of Ultimus Fund Solutions, LLC (December 2019 to present); CCO Consultant at GKG Consulting, LLC (December 2019 to present); Chief Operating Office and CCO at Miles Capital, Inc. (June 2013 to December 2019) |
38
| KARNER BLUE BIODIVERSITY IMPACT FUND |
| BOARD OF TRUSTEES AND EXECUTIVE OFFICERS (Unaudited) (Continued) |
| Name
and Year of Birth |
Length of Time Served |
Position(s) Held with Trust |
Principal Occupation(s) During Past 5 Years |
| Executive Officers (Continued): | |||
| Martin
R. Dean Year of Birth: 1963 |
Since 2016 | Assistant Chief Compliance Officer (January 2021 to present)
Interim Chief Compliance Officer (October 2019 to January 2021)
Assistant Chief Compliance Officer (January 2016 to 2017) |
SVP of Fund Compliance of Ultimus Fund Solutions, LLC (2016 to present) |
Additional information about members of the Board and executive officers is available in the Fund’s Statement of Additional Information (“SAI”). To obtain a free copy of the SAI, please call toll free 1-855-KBANIML (855-522-6465).
39
This page intentionally left blank.
This page intentionally left blank.
KARNER-AR-21
KEMPNER MULTI-CAP DEEP VALUE FUND
Institutional Class (FIKDX)
Investor Class (FAKDX)
Annual Report
May 31, 2021
| KEMPNER MULTI-CAP DEEP VALUE FUND | |
| LETTER TO SHAREHOLDERS (Unaudited) | June 23, 2021 |
Fund Objective
The Kempner Multi-Cap Deep Value Fund seeks to generate a total pre-tax return, including capital growth and dividends, greater than the rate of inflation over a minimum three- to five-year period. For the twelve months ended May 31, 2021, the Fund produced a total return of 55.52% (Institutional Class Shares) and 55.09% (Investor Class Shares), both net of fees. For the trailing three years ended May 31, 2021, the Fund produced a total return of 11.33% annualized (Institutional Class Shares) and 11.07% annualized (Investor Class Shares), both net of fees. The Headline CPI inflation rates over the periods were 4.93% for one year and 2.31% for three years annualized. Comparatively, over the same time periods the Lipper Multi-Cap Value Funds Classification Index returned 53.12% for one year and 11.71% for three years annualized; and the S&P 500 Value Index returned 39.84% for one year and 13.82% for three years annualized.
U.S. Economic Commentary
Unless there is a substantial resurgence of Covid-19 due to a variant, we believe 2021 will be one of the strongest growth years for the U.S. economy that we have seen in 70 years. We are presently projecting that real GDP will grow in 2021 by 8%, and that’s inflation adjusted. If you add inflation to it, it will probably be more like a 10% to 11% headline number. To put it in further context, this would project to be the largest growth year of any since 1951, during the Korean War, and will probably just ace out 1983, which was a recovery year following a very deep recession as, indeed, is this year.
So, why so strong? The reason is the confluence since November of the following factors:
| 1. | The general recovery we have been undergoing since the worst of the pandemic in Spring 2020. This is now clearly a “V” shaped recovery in almost all areas. |
| 2. | So far, vaccinations and therapeutics (treatments) have been steaming ahead, and we believe that on balance, we will be opening up more and more for the rest of the year – another increment of growth. |
| 3. | Despite recent headlines, the monetary policy of the Fed is still very loose, and we are projecting no tightening or slow-down of bond purchasing whatsoever during the remainder of this fiscal year. No fears this year at least, of higher rates limiting growth. |
| 4. | There have been two large fiscal bills – one at the end of 2020 and the most recent one passed in March for about $1.9 trillion total. These are dollars in the consumers’ pockets and also direct support for the business economy. |
| 5. | Due to many of these factors, consumer savings are very high, which is a bulwark for the present and future of the economy. Always remember that the consumer is 70% of the total U.S. economy. |
In all these cases, trends are clear. The unemployment rate as measured by the U.S. Bureau of Labor Statistics is 5.8% as of May, which is down from 6.3% in January 2021. Consumer savings as well as consumer spending, as measured by the 3-month average of U.S. nominal retail sales is at $624 billion and its highest ever level, show no signs of slowing down. Many manufacturing indices are also rapidly improving.
1
We see no serious impediments to these trends, except a possible resurgence of Covid-19. Barring that, an exceptionally strong year is ahead for the U.S.
Portfolio Strategy
Our investment approach continues to be one of investing in deeply undervalued companies and selling when the underlying value becomes realized by other market participants and reflected in the current price. The past year has therefore resulted in a greater number of buy opportunities than sell opportunities. Cash is always considered a buying reserve.
For the fiscal year of June 1, 2020 thru May 31, 2021, we established positions in Bristol-Myers Squibb Co. (BMY), Continental AG (CTTAY), Credit Suisse Group (CS), Deutsche Telekom AG ADR (DTEGY), Everest RE Group Ltd. (RE), Ingredion Incorporated (INGR), Leidos Holdings, Inc. (LDOS), Lockheed Martin Corp. (LMT), and ViacomCBS Inc 5.75% Conv. Pfd. (VIACP). During the same time frame, we added to the Fund’s positions in Citigroup Inc. (C), DuPont de NeMours Inc. (DD), Hewlett Packard Enterprises (HPE) and Viatris Inc. (VTRS). We reduced the Fund’s positions in Acuity Brands Inc. (AYI), Corteva Incorporated (CTVA), FedEx Corporation (FDX), Hartford Financial Services (HIG), Honda Motor Co. Ltd (HMC), Mosaic Company (MOS), Pfizer Incorporated (PFE) and ViacomCBS Inc. Class B (VIAC). We sold entirely out of Accenture PLC (ACN), Applied Materials Inc. (AMAT), Axis Capital Holdings (AXS), Capital One Financial (COF), Hewlett Packard Enterprises (HPE), Nordstrom, Inc. (JWN), Occidental Petroleum Corp. (OXY), Skyworks Solutions Inc. (SWKS) and United Parcel Services Inc. (UPS).
The three securities with the most significant price increases during the last twelve-month period were represented by the industrial and consumer discretionary sectors. They are as follows:
| The Mosaic Company | MOS | +191.6 |
| Fedex Corporation | FDX | +145.8 |
| General Motors Company | GM | +120.2 |
The three securities with the worst performance in the portfolio during the 12-month period were an eclectic group with individual stock circumstances. They are as follows:
| Occidental Petroleum Corp. | OXY | -30.0 |
| Nordstrom Inc. | JWN | -26.6 |
| Merck & Company | MRK | -1.52 |
We continue to scour the equity universe to locate stocks which meet our investment criteria of: 1) a relatively low forecast P/E multiple, usually 15x or less, 2) a dividend being paid, or expected to be, 3) public debt, if any, is investment grade, 4) a minimum of $500 million market capitalization, and 5) current stock price is within 20% of the 52-week low price. In addition to meeting these criteria, stocks are quantitatively and qualitatively analyzed to determine company prospects and reasonableness of valuation.
We maintain our long-term focus in the Kempner Multi-Cap Deep Value Fund on areas which are overlooked by the market. Harris L. Kempner, Jr. and M. Shawn Gault are the portfolio managers for the Kempner Multi-Cap Deep Value Fund.
2
Past performance is not predictive of future performance. Investment results and principal value will fluctuate so that shares, when redeemed, may be worth more or less than their original cost. Current performance may be higher or lower than the performance data quoted. Performance data current to the most recent month end are available by calling 1-800-665-9778.
An investor should consider the investment objectives, risks, charges, and expenses of the Fund carefully before investing. The Fund’s prospectus contains this and other important information. To obtain a copy of the Fund’s prospectus please call 1-800-665-9778 and a copy will be sent to you free of charge. Please read the prospectus carefully before you invest. Kempner Multi-Cap Deep Value Fund is distributed by Ultimus Fund Distributors, LLC.
This Letter to Shareholders seeks to describe some of the Adviser’s current opinions and views of the financial markets. Although the Adviser believes it has a reasonable basis for any opinions or views expressed, actual results may differ, sometimes significantly so, from those expected or expressed. The securities held by the Fund that are discussed in the Letter to Shareholders were held during the period covered by this Report. They do not comprise the entire investment portfolio of the Fund, may be sold at any time and may no longer be held by the Fund. For a complete list of securities held by the Fund as of May 31, 2021, please see the Schedule of Investments section of the annual report. The opinions of the Adviser with respect to those securities may change at any time.
Statements in the Letter to Shareholders that reflect projections or expectations for future financial or economic performance of the Fund and the market in general and statements of the Fund’s plans and objectives for future operations are forward-looking statements. No assurance can be given that actual results or events will not differ materially from those projected, estimated, assumed, or anticipated in any such forward-looking statements. Important factors that could result in such differences, in addition to factors noted with such forward-looking statements include, without limitation, general economic conditions, such as inflation, recession, and interest rates. Past performance is not a guarantee of future results.
3
KEMPNER MULTI-CAP DEEP VALUE FUND PERFORMANCE INFORMATION May 31, 2021 (Unaudited) |
Comparison of the Change in Value of a $500,000 Investment
in Kempner Multi-Cap Deep Value Fund - Institutional Class versus the
S&P 500® Value Index*

| Average Annual Total Returns | |||||||
| (for the years ended May 31, 2021) | |||||||
| 1 Year | 5 Years | 10 Years | |||||
| Kempner Multi-Cap Deep Value Fund - Institutional Class (a) | 55.52% | 12.60% | 8.51% | ||||
| Kempner Multi-Cap Deep Value Fund - Investor Class (a)(b) | 55.09% | 12.33% | 8.25% | ||||
| S&P 500® Value Index (c) | 39.84% | 13.00% | 11.75% | ||||
| * | The graph is based on the performance of Institutional Class only; performance for Investor Class varies due to differences in fees paid by shareholders in the different classes. |
| (a) | The total returns shown do not reflect the deduction of taxes that a shareholder would pay on Fund distributions or the redemption of Fund shares. |
| (b) | Effective March 31, 2015, Class A Shares were re-designated as Investor Class. Prior to March 31, 2015, shareholders were charged a sales charge on purchases and redemptions of Class A Shares. The performance information provided for the period prior to March 31, 2015 represents the performance of Investor Class when they were called Class A Shares. The share class change had no impact on the Fund’s operations or investment policy. |
| (c) | The S&P 500® Value Index measure value stocks using three factors: the ratios of book value, earnings, and sales to price. Constituents are drawn from the S&P 500® Index. The Index is unmanaged and shown for illustration purposes only. An investor cannot invest in an index and its returns are not indicative of the performance of any specific investment. |
4
KEMPNER MULTI-CAP DEEP VALUE FUND PORTFOLIO INFORMATION May 31, 2021 (Unaudited) |
Sector Diversification (% of Net Assets)
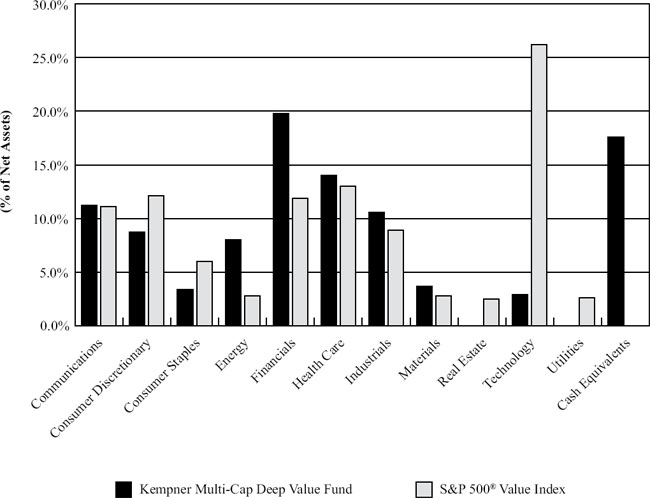
Top 10 Equity Investments
| Security Description | % of Net Assets | |
| General Motors Company | 6.2% | |
| Lincoln National Corporation | 5.9% | |
| Citigroup, Inc. | 4.8% | |
| Johnson Controls International plc | 4.0% | |
| Bank of America Corporation | 3.9% | |
| Walt Disney Company (The) | 3.7% | |
| Cardinal Health, Inc. | 3.5% | |
| Acuity Brands, Inc. | 3.3% | |
| Viatris, Inc. | 3.0% | |
| AT&T, Inc. | 2.9% |
5
| KEMPNER MULTI-CAP DEEP VALUE FUND |
| SCHEDULE OF INVESTMENTS |
| May 31, 2021 |
| COMMON STOCKS — 81.1% | Shares | Value | ||||||
| Communications — 10.1% | ||||||||
| Entertainment Content — 4.7% | ||||||||
| ViacomCBS, Inc. - Class B | 20,810 | $ | 882,760 | |||||
| Walt Disney Company (The) (a) | 18,200 | 3,251,430 | ||||||
| 4,134,190 | ||||||||
| Telecommunications — 5.4% | ||||||||
| AT&T, Inc. | 86,692 | 2,551,346 | ||||||
| Deutsche Telekom AG - ADR | 55,289 | 1,154,434 | ||||||
| Verizon Communications, Inc. | 19,300 | 1,090,257 | ||||||
| 4,796,037 | ||||||||
| Consumer Discretionary — 8.7% | ||||||||
| Automotive — 8.7% | ||||||||
| Continental AG - ADR | 62,900 | 939,097 | ||||||
| General Motors Company (a) | 92,720 | 5,499,223 | ||||||
| Honda Motor Company Ltd. - ADR | 41,400 | 1,294,164 | ||||||
| 7,732,484 | ||||||||
| Consumer Staples — 3.4% | ||||||||
| Food — 1.1% | ||||||||
| Ingredion, Inc. | 9,800 | 930,314 | ||||||
| Retail - Consumer Staples — 2.3% | ||||||||
| Walgreen Boots Alliance, Inc. | 38,950 | 2,051,107 | ||||||
| Energy — 7.9% | ||||||||
| Oil & Gas Producers — 6.2% | ||||||||
| BP plc - ADR | 89,120 | 2,337,618 | ||||||
| Royal Dutch Shell plc - Class A - ADR | 39,454 | 1,523,319 | ||||||
| Valero Energy Corporation | 20,400 | 1,640,160 | ||||||
| 5,501,097 | ||||||||
| Oil & Gas Services & Equipment — 1.7% | ||||||||
| Schlumberger Ltd. | 47,555 | 1,489,898 | ||||||
| Financials — 19.8% | ||||||||
| Banking — 9.8% | ||||||||
| Bank of America Corporation | 81,720 | 3,464,111 | ||||||
| Citigroup, Inc. | 54,100 | 4,258,211 | ||||||
| Truist Financial Corporation | 15,300 | 945,234 | ||||||
| 8,667,556 | ||||||||
| Institutional Financial Services — 1.4% | ||||||||
| Credit Suisse Group AG - ADR | 112,000 | 1,234,240 | ||||||
6
| KEMPNER MULTI-CAP DEEP VALUE FUND |
| SCHEDULE OF INVESTMENTS (Continued) |
| COMMON STOCKS — 81.1% (Continued) | Shares | Value | ||||||
| Financials — 19.8% (Continued) | ||||||||
| Insurance — 8.6% | ||||||||
| Everest Re Group Ltd. | 6,200 | $ | 1,611,752 | |||||
| Hartford Financial Services Group, Inc. (The) | 11,650 | 761,328 | ||||||
| Lincoln National Corporation | 74,850 | 5,223,781 | ||||||
| 7,596,861 | ||||||||
| Health Care — 14.0% | ||||||||
| Biotech & Pharma — 9.0% | ||||||||
| Bristol-Myers Squibb Company | 22,850 | 1,501,702 | ||||||
| Merck & Company, Inc. | 17,430 | 1,322,763 | ||||||
| Pfizer, Inc. | 15,400 | 596,442 | ||||||
| Roche Holding AG - ADR | 43,000 | 1,881,680 | ||||||
| Viatris, Inc. | 173,485 | 2,643,911 | ||||||
| 7,946,498 | ||||||||
| Health Care Facilities & Services — 5.0% | ||||||||
| Cardinal Health, Inc. | 54,965 | 3,081,888 | ||||||
| McKesson Corporation | 6,880 | 1,323,643 | ||||||
| 4,405,531 | ||||||||
| Industrials — 10.6% | ||||||||
| Aerospace & Defense — 1.3% | ||||||||
| Lockheed Martin Corporation | 2,900 | 1,108,380 | ||||||
| Electrical Equipment — 7.3% | ||||||||
| Acuity Brands, Inc. | 15,785 | 2,932,064 | ||||||
| Johnson Controls International plc | 52,599 | 3,499,937 | ||||||
| 6,432,001 | ||||||||
| Transportation & Logistics — 2.0% | ||||||||
| FedEx Corporation | 5,700 | 1,794,417 | ||||||
| Materials — 3.7% | ||||||||
| Chemicals — 3.7% | ||||||||
| Corteva, Inc. | 25,499 | 1,160,204 | ||||||
| Dow, Inc. | 14,449 | 988,601 | ||||||
| DuPont de Nemours, Inc. | 12,900 | 1,091,211 | ||||||
| 3,240,016 | ||||||||
| Technology — 2.9% | ||||||||
| Technology Hardware — 2.1% | ||||||||
| Cisco Systems, Inc. | 35,600 | 1,883,240 | ||||||
| Technology Services — 0.8% | ||||||||
| Leidos Holdings, Inc. | 6,600 | 678,150 | ||||||
| Total Common Stocks (Cost $56,818,310) | $ | 71,622,017 | ||||||
7
| KEMPNER MULTI-CAP DEEP VALUE FUND |
| SCHEDULE OF INVESTMENTS (Continued) |
| PREFERRED STOCKS — 1.1% | Shares | Value | ||||||
| Communications — 1.1% | ||||||||
| Entertainment Content — 1.1% | ||||||||
| ViacomCBS, Inc., Series A, 5.75% (Cost $860,830) | 13,500 | $ | 982,665 | |||||
| WARRANTS — 0.1% | Shares | Value | ||||||
| Energy — 0.1% | ||||||||
| Oil & Gas Producers — 0.1% | ||||||||
| Occidental Petroleum Corporation, expires 08/03/2027 (a) (Cost $0) | 4,600 | $ | 50,370 | |||||
| MONEY MARKET FUNDS — 17.6% | Shares | Value | ||||||
| BlackRock Liquidity Funds Treasury Trust Fund - Institutional Shares, 0.01% (b) (Cost $15,510,857) | 15,510,857 | $ | 15,510,857 | |||||
| Investments at Value — 99.9% (Cost $73,189,997) | $ | 88,165,909 | ||||||
| Other Assets in Excess of Liabilities — 0.1% | 102,377 | |||||||
| Net Assets — 100.0% | $ | 88,268,286 | ||||||
ADR – American Depositary Receipt
| (a) | Non-income producing security. |
| (b) | The rate shown is the 7-day effective yield as of May 31, 2021. |
See accompanying notes to financial statements.
8
| KEMPNER MULTI-CAP DEEP VALUE FUND |
| STATEMENT OF ASSETS AND LIABILITIES |
| May 31, 2021 |
| ASSETS | ||||
| Investments: | ||||
| At cost | $ | 73,189,997 | ||
| At value (Note 2) | $ | 88,165,909 | ||
| Dividends receivable | 163,304 | |||
| Tax reclaims receivable | 24,428 | |||
| Other assets | 8,020 | |||
| Total assets | 88,361,661 | |||
| LIABILITIES | ||||
| Payable for capital shares redeemed | 6,385 | |||
| Payable to Adviser (Note 4) | 43,903 | |||
| Payable to administrator (Note 4) | 14,595 | |||
| Accrued distribution fees (Note 4) | 6,823 | |||
| Other accrued expenses | 21,669 | |||
| Total liabilities | 93,375 | |||
| NET ASSETS | $ | 88,268,286 | ||
| NET ASSETS CONSIST OF: | ||||
| Paid-in capital | $ | 67,529,113 | ||
| Accumulated earnings | 20,739,173 | |||
| NET ASSETS | $ | 88,268,286 | ||
| NET ASSET VALUE PER SHARE: | ||||
| INSTITUTIONAL CLASS | ||||
| Net assets applicable to Institutional Class | $ | 69,142,800 | ||
| Institutional Class shares of beneficial interest outstanding (unlimited number of shares authorized, no par value) | 5,407,407 | |||
| Net asset value, offering price and redemption price per share (Note 2) | $ | 12.79 | ||
| INVESTOR CLASS | ||||
| Net assets applicable to Investor Class | $ | 19,125,486 | ||
| Investor Class shares of beneficial interest outstanding (unlimited number of shares authorized, no par value) | 1,497,144 | |||
| Net asset value, offering price and redemption price per share (Note 2) | $ | 12.77 |
See accompanying notes to financial statements.
9
| KEMPNER MULTI-CAP DEEP VALUE FUND |
| STATEMENT OF OPERATIONS |
| For the Year Ended May 31, 2021 |
| INVESTMENT INCOME | ||||
| Dividend income | $ | 1,746,014 | ||
| Foreign withholding taxes on dividends | (16,533 | ) | ||
| Total investment income | 1,729,481 | |||
| EXPENSES | ||||
| Investment advisory fees (Note 4) | 418,176 | |||
| Administration fees (Note 4) | 71,083 | |||
| Fund accounting fees (Note 4) | 43,196 | |||
| Distribution fees - Investor Class (Note 4) | 37,519 | |||
| Transfer agent fees (Note 4) | 27,823 | |||
| Legal fees | 26,419 | |||
| Registration and filing fees | 17,079 | |||
| Audit and tax services fees | 17,000 | |||
| Trustees’ fees and expenses (Note 4) | 16,750 | |||
| Compliance service fees (Note 4) | 12,000 | |||
| Custodian and bank service fees | 9,933 | |||
| Insurance expense | 3,858 | |||
| Printing of shareholder reports | 3,683 | |||
| Postage and supplies | 2,810 | |||
| Other expenses | 21,996 | |||
| Total expenses | 729,325 | |||
| NET INVESTMENT INCOME | 1,000,156 | |||
| REALIZED AND UNREALIZED GAINS ON INVESTMENTS | ||||
| Net realized gains from investment transactions | 5,555,621 | |||
| Net change in unrealized appreciation (depreciation) on investments | 25,309,541 | |||
| NET REALIZED AND UNREALIZED GAINS ON INVESTMENTS | 30,865,162 | |||
| NET INCREASE IN NET ASSETS RESULTING FROM OPERATIONS | $ | 31,865,318 | ||
See accompanying notes to financial statements.
10
| KEMPNER MULTI-CAP DEEP VALUE FUND |
| STATEMENTS OF CHANGES IN NET ASSETS |
| Year | Ten Months | Year | ||||||||||
| Ended | Ended | Ended | ||||||||||
| May 31, | May 31, | July 31, | ||||||||||
| 2021 | 2020(a) | 2019 | ||||||||||
| FROM OPERATIONS | ||||||||||||
| Net investment income | $ | 1,000,156 | $ | 1,324,666 | $ | 1,566,551 | ||||||
| Net realized gains from investment transactions | 5,555,621 | 4,544,600 | 1,078,394 | |||||||||
| Net change in unrealized appreciation (depreciation) on investments | 25,309,541 | (15,824,047 | ) | (2,710,254 | ) | |||||||
| Net increase (decrease) in net assets resulting from operations | 31,865,318 | (9,954,781 | ) | (65,309 | ) | |||||||
| FROM DISTRIBUTIONS TO SHAREHOLDERS (Note 2) | ||||||||||||
| Institutional Class | (3,496,009 | ) | (2,778,216 | ) | (1,891,230 | ) | ||||||
| Investor Class | (887,811 | ) | (659,602 | ) | (405,918 | ) | ||||||
| Decrease in net assets from distributions to shareholders | (4,383,820 | ) | (3,437,818 | ) | (2,297,148 | ) | ||||||
| CAPITAL SHARE TRANSACTIONS | ||||||||||||
| Institutional Class | ||||||||||||
| Proceeds from shares sold | 1,250,001 | 1,361,548 | 502,000 | |||||||||
| Net asset value of shares issued in reinvestment of distributions to shareholders | 186,356 | 184,521 | 488,647 | |||||||||
| Payments for shares redeemed | (2,484,949 | ) | (2,467,395 | ) | (6,515,014 | ) | ||||||
| Net decrease in Institutional Class net assets from capital share transactions | (1,048,592 | ) | (921,326 | ) | (5,524,367 | ) | ||||||
| Investor Class | ||||||||||||
| Proceeds from shares sold | 983,556 | 58,348 | 207,333 | |||||||||
| Net asset value of shares issued in reinvestment of distributions to shareholders | 877,593 | 648,309 | 394,858 | |||||||||
| Payments for shares redeemed | (783,555 | ) | (358,267 | ) | (520,339 | ) | ||||||
| Net increase in Investor Class net assets from capital share transactions | 1,077,594 | 348,390 | 81,852 | |||||||||
| TOTAL INCREASE (DECREASE) IN NET ASSETS | 27,510,500 | (13,965,535 | ) | (7,804,972 | ) | |||||||
| NET ASSETS | ||||||||||||
| Beginning of period | 60,757,786 | 74,723,321 | 82,528,293 | |||||||||
| End of period | $ | 88,268,286 | $ | 60,757,786 | $ | 74,723,321 | ||||||
| (a) | Fund changed fiscal year to May 31. |
See accompanying notes to financial statements.
11
| KEMPNER MULTI-CAP DEEP VALUE FUND |
| STATEMENTS OF CHANGES IN NET ASSETS (Continued) |
| Year | Ten Months | Year | ||||||||||
| Ended | Ended | Ended | ||||||||||
| May 31, | May 31, | July 31, | ||||||||||
| 2021 | 2020(a) | 2019 | ||||||||||
| CAPITAL SHARES ACTIVITY | ||||||||||||
| Institutional Class | ||||||||||||
| Shares sold | 123,603 | 124,841 | 47,878 | |||||||||
| Shares issued in reinvestment of distributions to shareholders | 18,589 | 17,685 | 51,883 | |||||||||
| Shares redeemed | (268,667 | ) | (236,471 | ) | (621,448 | ) | ||||||
| Net decrease in shares outstanding | (126,475 | ) | (93,945 | ) | (521,687 | ) | ||||||
| Shares outstanding at beginning of period | 5,533,882 | 5,627,827 | 6,149,514 | |||||||||
| Shares outstanding at end of period | 5,407,407 | 5,533,882 | 5,627,827 | |||||||||
| Investor Class | ||||||||||||
| Shares sold | 94,988 | 7,576 | 19,363 | |||||||||
| Shares issued in reinvestment of distributions to shareholders | 87,550 | 62,053 | 40,136 | |||||||||
| Shares redeemed | (78,176 | ) | (32,739 | ) | (49,190 | ) | ||||||
| Net increase in shares outstanding | 104,362 | 36,890 | 10,309 | |||||||||
| Shares outstanding at beginning of period | 1,392,782 | 1,355,892 | 1,345,583 | |||||||||
| Shares outstanding at end of period | 1,497,144 | 1,392,782 | 1,355,892 | |||||||||
| (a) | Fund changed fiscal year to May 31. |
See accompanying notes to financial statements.
12
| KEMPNER MULTI-CAP DEEP VALUE FUND |
| INSTITUTIONAL CLASS |
| FINANCIAL HIGHLIGHTS |
| Per Share Data for a Share Outstanding Throughout Each Period | ||||||||||||||||||||||||
| Ten | ||||||||||||||||||||||||
| Year | Months | Year | Year | Year | Year | |||||||||||||||||||
| Ended | Ended | Ended | Ended | Ended | Ended | |||||||||||||||||||
| May 31, | May 31, | July 31, | July 31, | July 31, | July 31, | |||||||||||||||||||
| 2021 | 2020(a) | 2019 | 2018 | 2017 | 2016 | |||||||||||||||||||
| Net asset value at beginning of period | $ | 8.77 | $ | 10.70 | $ | 11.01 | $ | 10.47 | $ | 9.18 | $ | 10.42 | ||||||||||||
| Income (loss) from investment operations: | ||||||||||||||||||||||||
| Net investment income | 0.15 | 0.20 | 0.21 | 0.19 | 0.19 | 0.21 | ||||||||||||||||||
| Net realized and unrealized gains (losses) on investments | 4.53 | (1.62 | ) | (0.19 | ) | 1.00 | 1.29 | (0.54 | ) | |||||||||||||||
| Total from investment operations | 4.68 | (1.42 | ) | 0.02 | 1.19 | 1.48 | (0.33 | ) | ||||||||||||||||
| Less distributions from: | ||||||||||||||||||||||||
| Net investment income | (0.16 | ) | (0.17 | ) | (0.23 | ) | (0.17 | ) | (0.19 | ) | (0.21 | ) (b) | ||||||||||||
| Net realized gains | (0.50 | ) | (0.34 | ) | (0.10 | ) | (0.48 | ) | — | (0.70 | ) | |||||||||||||
| Total distributions | (0.66 | ) | (0.51 | ) | (0.33 | ) | (0.65 | ) | (0.19 | ) | (0.91 | ) | ||||||||||||
| Net asset value at end of period | $ | 12.79 | $ | 8.77 | $ | 10.70 | $ | 11.01 | $ | 10.47 | $ | 9.18 | ||||||||||||
| Total return (c) | 55.52 | % | (13.99 | %) (d) | 0.43 | % | 11.79 | % | 16.30 | % | (2.56 | %) | ||||||||||||
| Net assets at end of period (000’s) | $ | 69,143 | $ | 48,552 | $ | 60,228 | $ | 67,725 | $ | 67,863 | $ | 95,846 | ||||||||||||
| Ratios/supplementary data: | ||||||||||||||||||||||||
| Ratio of total expenses to average net assets | 0.97 | % | 0.99 | % (e) | 0.95 | % | 0.94 | % | 0.84 | % | 0.78 | % | ||||||||||||
| Ratio of net investment income to average net assets | 1.46 | % | 2.37 | % (e) | 2.13 | % | 1.74 | % | 1.98 | % | 2.30 | % | ||||||||||||
| Portfolio turnover rate | 21 | % | 27 | % (d) | 17 | % | 25 | % | 18 | % | 10 | % | ||||||||||||
| (a) | Fund changed fiscal year to May 31. |
| (b) | Includes a return of capital of less than $0.01 per share. |
| (c) | Total return is a measure of the change in value of an investment in the Fund over the periods covered. The returns shown do not reflect the deduction of taxes a shareholder would pay on Fund distributions, if any, or the redemption of Fund shares. |
| (d) | Not annualized. |
| (e) | Annualized. |
See accompanying notes to financial statements.
13
| KEMPNER MULTI-CAP DEEP VALUE FUND |
| INVESTOR CLASS |
| FINANCIAL HIGHLIGHTS |
| Per Share Data for a Share Outstanding Throughout Each Period | ||||||||||||||||||||||||
| Ten | ||||||||||||||||||||||||
| Year | Months | Year | Year | Year | Year | |||||||||||||||||||
| Ended | Ended | Ended | Ended | Ended | Ended | |||||||||||||||||||
| May 31, | May 31, | July 31, | July 31, | July 31, | July 31, | |||||||||||||||||||
| 2021 | 2020(a) | 2019 | 2018 | 2017 | 2016 | |||||||||||||||||||
| Net asset value at beginning of period | $ | 8.76 | $ | 10.69 | $ | 11.00 | $ | 10.46 | $ | 9.17 | $ | 10.40 | ||||||||||||
| Income (loss) from investment operations: | ||||||||||||||||||||||||
| Net investment income | 0.13 | 0.18 | 0.18 | 0.17 | 0.17 | 0.19 | ||||||||||||||||||
| Net realized and unrealized gains (losses) on investments | 4.51 | (1.62 | ) | (0.19 | ) | 1.00 | 1.29 | (0.53 | ) | |||||||||||||||
| Total from investment operations | 4.64 | (1.44 | ) | (0.01 | ) | 1.17 | 1.46 | (0.34 | ) | |||||||||||||||
| Less distributions from: | ||||||||||||||||||||||||
| Net investment income | (0.13 | ) | (0.15 | ) | (0.20 | ) | (0.15 | ) | (0.17 | ) | (0.19 | ) (b) | ||||||||||||
| Net realized gains | (0.50 | ) | (0.34 | ) | (0.10 | ) | (0.48 | ) | — | (0.70 | ) | |||||||||||||
| Total distributions | (0.63 | ) | (0.49 | ) | (0.30 | ) | (0.63 | ) | (0.17 | ) | (0.89 | ) | ||||||||||||
| Net asset value at end of period | $ | 12.77 | $ | 8.76 | $ | 10.69 | $ | 11.00 | $ | 10.46 | $ | 9.17 | ||||||||||||
| Total return (c) | 55.09 | % | (14.18 | %) (d) | 0.18 | % | 11.55 | % | 16.06 | % | (2.70 | %) | ||||||||||||
| Net assets at end of period (000’s) | $ | 19,125 | $ | 12,206 | $ | 14,495 | $ | 14,803 | $ | 15,321 | $ | 14,880 | ||||||||||||
| Ratios/supplementary data: | ||||||||||||||||||||||||
| Ratio of total expenses to average net assets | 1.22 | % | 1.24 | % (e) | 1.20 | % | 1.19 | % | 1.09 | % | 1.03 | % | ||||||||||||
| Ratio of net investment income to average net assets | 1.21 | % | 2.12 | % (e) | 1.88 | % | 1.49 | % | 1.70 | % | 2.05 | % | ||||||||||||
| Portfolio turnover rate | 21 | % | 27 | % (d) | 17 | % | 25 | % | 18 | % | 10 | % | ||||||||||||
| (a) | Fund changed fiscal year to May 31. |
| (b) | Includes a return of capital of less than $0.01 per share. |
| (c) | Total return is a measure of the change in value of an investment in the Fund over the periods covered. The returns shown do not reflect the deduction of taxes a shareholder would pay on Fund distributions, if any, or the redemption of Fund shares. |
| (d) | Not annualized. |
| (e) | Annualized. |
See accompanying notes to financial statements.
14
| KEMPNER MULTI-CAP DEEP VALUE FUND |
| NOTES TO FINANCIAL STATEMENTS |
| May 31, 2021 |
| 1. | Organization |
Kempner Multi-Cap Deep Value Fund (the “Fund”) is a diversified series of Ultimus Managers Trust (the “Trust”). The Trust is an open-end management investment company registered under the Investment Company Act of 1940, as amended (the “1940 Act”). The Fund was reorganized into the Trust on April 28, 2017.
The investment objective of the Fund is to seek to generate a total pre-tax return, including capital growth and dividends, that is greater than the rate of inflation over a three-to-five-year period.
The Fund currently offers two classes of shares: Institutional Class shares (sold without any sales loads and distribution and/or shareholder servicing fees and requiring a $500,000 initial investment) and Investor Class shares (sold without any sales loads, but subject to a distribution and/or shareholder servicing fee of up to 0.25% of the average daily net assets attributable to Investor Class shares, and requiring a $500 initial investment). Each share class represents an ownership interest in the same investment portfolio.
| 2. | Significant Accounting Policies |
The Fund follows accounting and reporting guidance under Financial Accounting Standards Board Accounting Standards Codification Topic 946, “Financial Services – Investment Companies.” The following is a summary of the Fund’s significant accounting policies used in the preparation of its financial statements. These policies are in conformity with accounting principles generally accepted in the United States of America (“GAAP”).
Securities valuation – The Fund values its portfolio securities at market value as of the close of regular trading on the New York Stock Exchange (the “NYSE”) (normally 4:00 p.m. Eastern time) on each business day the NYSE is open for business. The Fund values its listed securities on the basis of the security’s last sale price on the security’s primary exchange, if available, otherwise at the exchange’s most recently quoted mean price. NASDAQ-listed securities are valued at the NASDAQ Official Closing Price. Investments representing shares of money market funds and other open-end investment companies are valued at their net asset value (“NAV”) as reported by such companies. When using a quoted price and when the market for the security is considered active, the security will be classified as Level 1 within the fair value hierarchy (see below). In the event that market quotations are not readily available or are considered unreliable due to market or other events, the Fund values its securities and other assets at fair value in accordance with procedures established by and under the general supervision of the Board of Trustees (the “Board”). Under these procedures, the securities will be classified as Level 2 or 3 within the fair value hierarchy, depending on the inputs used. Unavailable or unreliable market quotes may be due to the following factors: a substantial bid-ask spread; infrequent sales resulting in stale prices; insufficient trading volume; small trade sizes; a temporary lapse in any reliable pricing source; and actions of the securities or futures markets, such as the suspension or limitation of trading. As a result, the prices of securities used to calculate the Fund’s NAV may differ from quoted or published prices for the same securities.
15
| KEMPNER MULTI-CAP DEEP VALUE FUND |
| NOTES TO FINANCIAL STATEMENTS (Continued) |
GAAP establishes a single authoritative definition of fair value, sets out a framework for measuring fair value, and requires additional disclosures about fair value measurements.
Various inputs are used in determining the value of the Fund’s investments. These inputs are summarized in the three broad levels listed below:
| ● | Level 1 – quoted prices in active markets for identical securities |
| ● | Level 2 – other significant observable inputs |
| ● | Level 3 – significant unobservable inputs |
The inputs or methods used for valuing securities are not necessarily an indication of the risks associated with investing in those securities. The inputs used to measure fair value may fall into different levels of the fair value hierarchy. In such cases, for disclosure purposes, the level in the fair value hierarchy within which the fair value measurement falls in its entirety is determined based on the lowest level input that is significant to the fair value measurement.
The following is a summary of the Fund’s investments based on the inputs used to value the investments as of May 31, 2021 by security type:
| Level 1 | Level 2 | Level 3 | Total | |||||||||||||
| Common Stocks | $ | 71,622,017 | $ | — | $ | — | $ | 71,622,017 | ||||||||
| Preferred Stocks | 982,665 | — | — | 982,665 | ||||||||||||
| Warrants | 50,370 | — | — | 50,370 | ||||||||||||
| Money Market Funds | 15,510,857 | — | — | 15,510,857 | ||||||||||||
| Total | $ | 88,165,909 | $ | — | $ | — | $ | 88,165,909 | ||||||||
Refer to the Fund’s Schedule of Investments for a listing of securities by sector and industry type. The Fund did not hold any derivative instruments or any assets or liabilities that were measured at fair value on a recurring basis using significant unobservable inputs (Level 3) as of or during year ended May 31, 2021.
Share valuation – The NAV per share of each class of the Fund is calculated daily by dividing the total value of the assets attributable to that class, less liabilities attributable to that class, by the number of shares outstanding of that class. The offering price and redemption price per share of each class of the Fund is equal to the NAV per share of such class.
Investment income – Dividend income is recorded on the ex-dividend date. Non-cash dividends included in dividend income, if any, are recorded at the fair market value of the security received. Interest income is accrued as earned. Withholding taxes on foreign dividends have been recorded in accordance with the Fund’s understanding of the applicable country’s rules and tax rates.
Investment transactions – Investment transactions are accounted for on the trade date. Realized gains and losses on investments sold are determined on a specific identification basis.
16
| KEMPNER MULTI-CAP DEEP VALUE FUND |
| NOTES TO FINANCIAL STATEMENTS (Continued) |
Allocation between Classes – Investment income earned, realized capital gains and losses, and unrealized appreciation and depreciation are allocated daily to each Class of the Fund based upon its proportionate share of total net assets of the Fund. Class-specific expenses are charged directly to the Class incurring the expense. Common expenses which are not attributable to a specific Class are allocated daily to each Class of shares of the Fund based upon its proportionate share of total net assets of the Fund.
Common expenses – Common expenses of the Trust are allocated among the Fund and the other series of the Trust based on the relative net assets of each series, the number of series in the Trust, or the nature of the services performed and the relative applicability to each series.
Distributions to shareholders – The Fund intends to declare and distribute net investment income dividends on a quarterly basis. In addition, the Fund will declare and distribute net realized capital gains, if any, on an annual basis. The amount of such dividends and distributions are determined in accordance with federal income tax regulations, which may differ from GAAP. Dividends and distributions to shareholders are recorded on the ex-dividend date. The tax character of distributions paid to shareholders by the Fund during the periods ended May 31, 2021, May 31, 2020 and July 31, 2019 were as follows:
| Period | Ordinary | Long-Term | Total | |||||||||
| Ended | Income | Capital Gains | Distributions | |||||||||
| 5/31/2021 | $ | 2,014,446 | $ | 2,369,374 | $ | 4,383,820 | ||||||
| 5/31/2020 | $ | 2,234,371 | $ | 1,203,447 | $ | 3,437,818 | ||||||
| 7/31/2019 | $ | 2,075,676 | $ | 221,472 | $ | 2,297,148 | ||||||
Estimates – The preparation of financial statements in conformity with GAAP requires management to make estimates and assumptions that affect the reported amounts of assets and liabilities and disclosure of contingent assets and liabilities as of the date of the financial statements and the reported amounts of increase (decrease) in net assets from operations during the reporting period. Actual results could differ from those estimates.
Federal income tax – The Fund has qualified and intends to continue to qualify as a regulated investment company under the Internal Revenue Code of 1986 (the “Code”). Qualification generally will relieve the Fund of liability for federal income taxes to the extent 100% of its net investment income and net realized capital gains are distributed in accordance with the Code.
In order to avoid imposition of the excise tax applicable to regulated investment companies, it is also the Fund’s intention to declare as dividends in each calendar year amounts equal to at least 98% of its net investment income (earned during the calendar year) and 98.2% of its net realized capital gains (earned during the twelve months ended October 31) plus undistributed amounts from prior years.
17
| KEMPNER MULTI-CAP DEEP VALUE FUND |
| NOTES TO FINANCIAL STATEMENTS (Continued) |
The following information is computed on a tax basis for each item as of May 31, 2021:
| Tax cost of portfolio investments | $ | 73,190,006 | ||
| Gross unrealized appreciation | $ | 20,303,972 | ||
| Gross unrealized depreciation | (5,328,069 | ) | ||
| Net unrealized appreciation | 14,975,903 | |||
| Undistributed ordinary income | 1,964,682 | |||
| Undistributed long-term gains | 3,798,588 | |||
| Accumulated earnings | $ | 20,739,173 |
The value of the federal income tax cost of portfolio investments may temporarily differ from the financial statement cost. This book/tax difference is due to the recognition of capital gains or losses under income tax regulations and GAAP, primarily due to the tax deferral of losses on wash sales.
The Fund recognizes the tax benefits or expenses of uncertain tax positions only when the position is “more likely than not” of being sustained assuming examination by tax authorities. Management has reviewed the Fund’s tax positions for all open tax years (generally, three years) and has concluded that no provision for unrecognized tax benefits or expenses is required in these financial statements. The Fund identifies its major tax jurisdiction as U.S. Federal.
| 3. | Investment Transactions |
During year ended May 31, 2021, cost of purchases and proceeds from sales of investment securities, other than short-term investments, amounted to $13,239,187 and $26,830,183, respectively.
| 4. | Transactions with Related Parties |
INVESTMENT ADVISORY AGREEMENT
The Fund’s investments are managed by Kempner Capital Management, Inc. (the “Adviser”) pursuant to the terms of an Investment Advisory Agreement. The Fund pays the Adviser an investment advisory fee, computed and accrued daily and paid monthly, at the annual rate of 0.59% of average daily net assets.
The Adviser has agreed contractually, until at least December 1, 2021, to reduce its advisory fees and reimburse other expenses to the extent necessary to limit total annual fund operating expenses (exclusive of brokerage costs; taxes; interest; borrowing costs such as interest and dividend expenses on securities sold short; costs to organize the Fund; acquired fund fees and expenses; extraordinary expenses such as litigation and merger or reorganization costs and other expenses not incurred in the ordinary course of the Fund’s business) to an amount not exceeding 1.05% and 1.30% of average daily net assets for Institutional Class and Investor Class shares, respectively.
18
| KEMPNER MULTI-CAP DEEP VALUE FUND |
| NOTES TO FINANCIAL STATEMENTS (Continued) |
Advisory fee reductions and expense reimbursements by the Adviser are subject to repayment by the Fund for a period of three years after such fees and expenses were incurred, provided that the repayments do not cause the Fund’s total annual fund operating expenses to exceed the lesser of (i) the expense limitation then in effect, if any, and (ii) the expense limitation in effect at the time the expenses to be repaid were incurred. This agreement will terminate automatically if the Investment Advisory Agreement is terminated. During the year ended May 31, 2021, the Adviser did not reduce its advisory fees or reimburse other expenses of the Fund.
OTHER SERVICE PROVIDERS
Ultimus Fund Solutions, LLC (“Ultimus”) provides administration, fund accounting, compliance and transfer agency services to the Fund. The Fund pays Ultimus fees in accordance with the agreements for such services. In addition, the Fund pays out-of-pocket expenses including, but not limited to, postage, supplies and certain costs related to the pricing of the Fund’s portfolio securities.
Under the terms of a Distribution Agreement with the Trust, Ultimus Fund Distributors, LLC (the “Distributor”) serves as principal underwriter to the Fund. The Distributor is a wholly-owned subsidiary of Ultimus. The Distributor is compensated partially by the Adviser and partially by the Investor Class shares of the Fund for acting as principal underwriter.
A Trustee and certain officers of the Trust are also officers of Ultimus.
DISTRIBUTION PLAN
The Fund has adopted a plan of distribution (the “Plan”), pursuant to Rule 12b-1 under the 1940 Act, which permits Investor Class shares of the Fund to directly incur or reimburse the Fund’s principal underwriter for certain expenses related to the distribution of Investor Class shares. The annual limitation for payment of expenses pursuant to the Plan is 0.25% of the Fund’s average daily net assets allocable to Investor Class shares. The Fund has not adopted a plan of distribution with respect to Institutional Class shares. During the year ended May 31, 2021, Investor Class shares of the Fund incurred $37,519 of distribution fees under the Plan.
TRUSTEE COMPENSATION
Each member of the Board (a “Trustee”) who is not an “interested person” of the Trust (“Independent Trustee”) receives a $1,300 annual retainer from the Fund, paid quarterly, except for the Board Chairperson who receives a $1,500 annual retainer from the Fund, paid quarterly. Each Independent Trustee also receives from the Fund a fee of $500 for each Board meeting attended plus reimbursement for travel and other meeting-related expenses.
19
| KEMPNER MULTI-CAP DEEP VALUE FUND |
| NOTES TO FINANCIAL STATEMENTS (Continued) |
PRINCIPAL HOLDERS OF FUND SHARES
As of May 31, 2021, the following shareholders owned of record 25% or more of the outstanding shares of each class of the Fund:
| NAME OF RECORD OWNERS | % Ownership | |
| Institutional Class | ||
| Muir & Company (for the benefit of its customers) | 98% | |
| Investor Class | ||
| Muir & Company (for the benefit of its customers) | 31% | |
| Morgan Stanley Smith Barney LLC (for the benefit of its customers) | 41% |
A beneficial owner of 25% or more of the Fund’s outstanding shares may be considered a controlling person. That shareholder’s vote could have a more significant effect on matters presented at a shareholders’ meeting.
| 5. | Contingencies and Commitments |
The Fund indemnifies the Trust’s officers and Trustees for certain liabilities that might arise from their performance of their duties to the Fund. Additionally, in the normal course of business the Fund enters into contracts that contain a variety of representations and warranties and which provide general indemnifications. The Fund’s maximum exposure under these arrangements is unknown, as this would involve future claims that may be made against the Fund that have not yet occurred. However, based on experience, the Fund expects the risk of loss to be remote.
| 6. | Subsequent Events |
The Fund is required to recognize in the financial statements the effects of all subsequent events that provide additional evidence about conditions that existed as of the date of the Statement of Assets and Liabilities. For non-recognized subsequent events that must be disclosed to keep the financial statements from being misleading, the Fund is required to disclose the nature of the event as well as an estimate of its financial effect, or a statement that such an estimate cannot be made. Management has evaluated subsequent events through the issuance of these financial statements and has noted no such events except for the following:
The Fund paid the following distributions to shareholders subsequent to May 31, 2021:
| Per Share | ||||||||
| Record | Ordinary | |||||||
| Date | Ex-Date | Income | ||||||
| Institutional Class | 6/28/2021 | 6/29/2021 | $ | 0.0360 | ||||
| Investor Class | 6/28/2021 | 6/29/2021 | $ | 0.0280 | ||||
20
| KEMPNER MULTI-CAP DEEP VALUE FUND |
REPORT OF INDEPENDENT REGISTERED PUBLIC ACCOUNTING FIRM |
To the Board of Trustees of Ultimus Managers Trust
and the Shareholders of Kempner Multi-Cap Deep Value Fund
Opinion on the Financial Statements
We have audited the accompanying statement of assets and liabilities of Kempner Multi-Cap Deep Value Fund, a series of shares of beneficial interest in Ultimus Managers Trust (the “Fund”), including the schedule of investments, as of May 31, 2021, and the related statement of operations for the year then ended, and the statements of changes in net assets and financial highlights as presented in the table below, and the related notes (collectively referred to as the “financial statements”). In our opinion, the financial statements present fairly, in all material respects, the financial position of the Fund as of May 31, 2021, and the results of its operations for the year then ended, and the changes in its net assets and financial highlights as presented in the table below, in conformity with accounting principles generally accepted in the United States of America. The financial highlights for the year ended July 31, 2016 were audited by other auditors whose report dated September 29, 2016 expressed an unqualified opinion on those financial highlights.
| Statements of Changes in Net Assets and Financial | |
| Fund | Highlights Presented |
| Kempner Multi-Cap Deep Value Fund | The statements of changes in net assets for the year ended May 31, 2021, the period from August 1, 2019 through May 31, 2020 and for the year ended July 31, 2019.
The financial highlights for the year ended May 31, 2021, the period from August 1, 2019 through May 31, 2020, and for each of the years in the three-year period ended July 31, 2019 |
Basis for Opinion
These financial statements are the responsibility of the Fund’s management. Our responsibility is to express an opinion on the Fund’s financial statements based on our audits. We are a public accounting firm registered with the Public Company Accounting Oversight Board (United States) (“PCAOB”) and are required to be independent with respect to the Fund in accordance with the U.S. federal securities law and the applicable rules and regulations of the Securities and Exchange Commission and the PCAOB.
We conducted our audits in accordance with the standards of the PCAOB. Those standards require that we plan and perform the audits to obtain reasonable assurance about whether the financial statements are free of material misstatement, whether due to error or fraud. The Fund is not required to have, nor were we engaged to perform, an audit of its internal control over financial reporting. As part of our audits, we are required to obtain an understanding of internal control over financial reporting but not for the purpose of expressing an opinion on the effectiveness of the Fund’s internal control over financial reporting. Accordingly, we express no such opinion.
21
| KEMPNER MULTI-CAP DEEP VALUE FUND |
REPORT OF INDEPENDENT REGISTERED PUBLIC ACCOUNTING FIRM (Continued) |
Our audits included performing procedures to assess the risk of material misstatement of the financial statements, whether due to error or fraud, and performing procedures that respond to those risks. Such procedures included examining, on a test basis, evidence regarding the amounts and disclosures in the financial statements. Our procedures included confirmation of securities owned as of May 31, 2021 by correspondence with the custodian. Our audits also included evaluating the accounting principles used and significant estimates made by management, as well as evaluating the overall presentation of the financial statements. We believe that our audits provide a reasonable basis for our opinion.
BBD, LLP
We have served as the auditor of one or more of the Funds in the Ultimus Managers Trust since 2013.
Philadelphia, Pennsylvania
July 23, 2021
22
| KEMPNER MULTI-CAP DEEP VALUE FUND |
| ABOUT YOUR FUND’S EXPENSES (Unaudited) |
We believe it is important for you to understand the impact of costs on your investment. As a shareholder of the Fund, you incur ongoing costs, including management fees, class-specific expenses (such as distribution fees) and other operating expenses. The following examples are intended to help you understand your ongoing costs (in dollars) of investing in the Fund and to compare these costs with the ongoing costs of investing in other mutual funds.
A mutual fund’s ongoing costs are expressed as a percentage of its average net assets. This figure is known as the expense ratio. The expenses in the table below are based on an investment of $1,000 made at the beginning of the most recent period (November 1, 2020) and held until the end of the period (May 31, 2021).
The table below illustrates the Fund’s ongoing costs in two ways:
Actual fund return – This section helps you to estimate the actual expenses that you paid over the period. The “Ending Account Value” shown is derived from the Fund’s actual return, and the fourth column shows the dollar amount of operating expenses that would have been paid by an investor who started with $1,000 in the Fund. You may use the information here, together with the amount you invested, to estimate the expenses that you paid over the period.
To do so, simply divide your account value by $1,000 (for example, an $8,600 account value divided by $1,000 = 8.6), then multiply the result by the number given for the Fund under the heading “Expenses Paid During Period.”
Hypothetical 5% return – This section is intended to help you compare the Fund’s ongoing costs with those of other mutual funds. It assumes that the Fund had an annual return of 5% before expenses during the period shown, but that the expense ratio is unchanged. In this case, because the return used is not the Fund’s actual return, the results do not apply to your investment. The example is useful in making comparisons because the SEC requires all mutual funds to calculate expenses based on a 5% return. You can assess the Fund’s ongoing costs by comparing this hypothetical example with the hypothetical examples that appear in shareholder reports of other funds.
Note that expenses shown in the table are meant to highlight and help you compare ongoing costs only. The Fund does not charge transaction fees, such as purchase or redemption fees, nor does it carry a “sales load.”
The calculations assume no shares were bought or sold during the period. Your actual costs may have been higher or lower, depending on the amount of your investment and the timing of any purchases or redemptions.
23
| KEMPNER MULTI-CAP DEEP VALUE FUND |
| ABOUT YOUR FUND’S EXPENSES (Unaudited) (Continued) |
More information about the Fund’s expenses can be found in this report. For additional information on operating expenses and other shareholder costs, please refer to the Fund’s prospectus.
| Beginning | Ending | Net | Expenses | |||||
| Account Value | Account Value | Expense | Paid During | |||||
| December 1, 2020 | May 31, 2021 | Ratio(a) | Period(b) | |||||
| Institutional Class | ||||||||
| Based on Actual Fund Return | $1,000.00 | $1,306.70 | 0.94% | $5.41 | ||||
| Based on Hypothetical 5%Return (before expenses) | $1,000.00 | $1,020.24 | 0.94% | $4.73 | ||||
| Investor Class | ||||||||
| Based on Actual Fund Return | $1,000.00 | $1,304.50 | 1.19% | $6.84 | ||||
| Based on Hypothetical 5%Return (before expenses) | $1,000.00 | $1,019.00 | 1.19% | $5.99 |
| (a) | Annualized, based on the Fund’s most recent one-half year expenses. |
| (b) | Expenses are equal to the Fund’s annualized net expense ratio multiplied by the average account value over the period, multiplied by 182/365 (to reflect the one-half year period). |
24
| KEMPNER MULTI-CAP DEEP VALUE FUND |
| OTHER INFORMATION (Unaudited) |
A description of the policies and procedures that the Fund uses to vote proxies relating to portfolio securities is available without charge upon request by calling toll- free 1-800-665-9778, or on the SEC’s website at www.sec.gov. Information regarding how the Fund voted proxies relating to portfolio securities during the most recent 12-month period ended June 30 is available without charge upon request by calling toll-free 1-800-665-9778, or on the SEC’s website at www.sec.gov.
The Trust files a complete listing of portfolio holdings for the Fund with the SEC as of the end of the first and third quarters of each fiscal year as an exhibit to its reports on Form N-PORT. These filings are available upon request by calling 1-800-665-9778. Furthermore, you may obtain a copy of the filings on the SEC’s website at www.sec.gov.
| FEDERAL TAX INFORMATION (Unaudited) |
For the year ended May 31, 2021, the Fund designated $2,369,374 as long-term capital gain distribution.
Qualified Dividend Income – The Fund designates 70.31% of its ordinary income dividends, or up to the maximum amount of such dividends allowable pursuant to the Internal Revenue Code, as qualified dividend income eligible for the reduced tax rate of 15%.
Dividends Received Deduction – Corporate shareholders are generally entitled to take the dividends received deduction on the portion of a Fund’s dividend distribution that qualifies under tax law. For the year ended May 31, 2021, 51.27% of ordinary income dividends qualifies for the corporate dividends received deduction.
25
| KEMPNER MULTI-CAP DEEP VALUE FUND |
| BOARD OF TRUSTEES AND EXECUTIVE OFFICERS (Unaudited) |
The Board has overall responsibility for management of the Trust’s affairs. The Trustees serve during the lifetime of the Trust and until its termination, or until death, resignation, retirement, or removal. The Trustees, in turn, elect the officers of the Fund to actively supervise their day-to-day operations. The officers have been elected for an annual term. Each Trustee’s and officer’s address is 225 Pictoria Drive, Suite 450, Cincinnati, Ohio 45246. The following are the Trustees and executive officers of the Fund:
| Directorships | |||||
| Number | of Public | ||||
| of Funds | Companies | ||||
| Length | Principal | in Trust | Held by | ||
| Name and | of Time | Position(s) | Occupation(s) | Overseen by | Trustee During |
| Year of Birth | Served | Held with Trust | During Past 5 Years | Trustee | Past 5 Years |
| Interested Trustees: | |||||
| David
R. Carson* Year of Birth: 1958 |
Since 2013 |
Trustee and Vice President (January 2021 to present)
Principal Executive Officer (April 2017 to January 2021)
President (October 2013 to present)
Vice President (April 2013 to October 2013) |
SVP, Client Strategies of Ultimus Fund Solutions, LLC (2013 to present); President, Unified Series Trust (2016 to present) and Trustee (2020 to present); President, Centaur Mutual Funds Trust (2018 to present); Chief Compliance Officer, FSI Low Beta Absolute Return Fund (2013 to 2016) | 15 | Interested Trustee of Unified Series Trust (25 funds) |
| Independent Trustees: | |||||
| Janine
L. Cohen Year of Birth: 1952 |
Since January 2016 | Chairperson (October 2019 to present)
Trustee (January 2016 to present) |
Retired (2013) financial services executive | 15 | None |
26
| KEMPNER MULTI-CAP DEEP VALUE FUND |
| BOARD OF TRUSTEES AND EXECUTIVE OFFICERS (Unaudited) (Continued) |
| Directorships | |||||
| Number | of Public | ||||
| of Funds | Companies | ||||
| Length | Principal | in Trust | Held by | ||
| Name and | of Time | Position(s) | Occupation(s) | Overseen by | Trustee During |
| Year of Birth | Served | Held with Trust | During Past 5 Years | Trustee | Past 5 Years |
| Independent Trustees (Continued): | |||||
| David
M. Deptula Year of Birth: 1958 |
Since June 2012 | Trustee | Vice President of Legal and Special Projects at Dayton Freight Lines, Inc. since 2016; Vice President of Tax Treasury at The Standard Register Inc. (formerly The Standard Register Company) from 2011 to 2016 | 15 | None |
| Robert
E. Morrison Year of Birth: 1957 |
Since June 2019 | Trustee | Senior Vice President and National Practice Lead for Investment, Huntington National Bank/Huntington Private Bank (2014 to present) | 15 | None |
| Clifford
N. Schireson Year of Birth: 1953 |
Since June 2019 | Trustee | Founder of Schireson Consulting, LLC (2017 to present); Director of Institutional Services for Brandes Investment Partners, LP (2004-2017) | 15 | Trustee of the San Diego City Employees’ Retirement System (2019 to present) |
| Jacqueline
A. Williams Year of Birth: 1954 |
Since June 2019 | Trustee | Managing Member of Custom Strategy Consulting, LLC (2017 to present); Managing Director of Global Investment Research (2005 to 2017), Cambridge Associates, LLC | 15 | None |
| * | Mr. Carson is considered an “interested person” of the Trust within the meaning of Section 2(a)(19) of the 1940 Act, as amended, because of his relationship with the Trust’s administrator and transfer agent. |
27
| KEMPNER MULTI-CAP DEEP VALUE FUND |
| BOARD OF TRUSTEES AND EXECUTIVE OFFICERS (Unaudited) (Continued) |
| Name
and Year of Birth |
Length of Time Served |
Position(s) Held with Trust |
Principal Occupation(s) During Past 5 Years |
| Executive Officers: | |||
| Todd
E. Heim Year of Birth: 1967 |
Since 2014 | Principal Executive Officer and President (January 2021 to present)
Vice President (2014-2021) |
VP, Relationship Management of Ultimus Fund Solutions, LLC (2018 to present); Client Implementation Manager and AVP of Ultimus Fund Solutions, LLC (2014 to 2018); Naval Flight Officer in the United States Navy (May 1989 to June 2017) |
| Jennifer
L. Leamer Year of Birth: 1976 |
Since 2014 | Treasurer (October 2014 to present)
Assistant Treasurer (April 2014 to October 2014) |
SVP, Fund Accounting of Ultimus Fund Solutions, LLC (2014 to present) |
| Daniel
D. Bauer Year of Birth: 1977 |
Since 2016 | Assistant Treasurer (April 2016 to present) | AVP, Fund Accounting (September 2015 to present) of Ultimus Fund Solutions, LLC |
| David
K. James Year of Birth: 1970 |
Since 2021 | Secretary (July 2021 to present) | EVP, Chief Legal and Risk Officer of Ultimus Fund Solutions, LLC (2018 to present); Managing Director and Managing Counsel at State Street Bank and Trust Company (2009 to 2018) |
| Natalie
S. Anderson Year of Birth: 1975 |
Since 2016 | Assistant Secretary (April 2016 to present) | Manager, Legal Administration (July 2016 to present) and Paralegal (January 2015 to June 2016) of Ultimus Fund Solutions, LLC |
| Gweneth
K. Gosselink Year of Birth: 1955 |
Since 2016 | Chief Compliance Officer (January 2020 to present) | AVP, Compliance Officer of Ultimus Fund Solutions, LLC (December 2019 to present); CCO Consultant at GKG Consulting, LLC (December 2019 to present); Chief Operating Office and CCO at Miles Capital, Inc. (June 2013 to December 2019) |
28
| KEMPNER MULTI-CAP DEEP VALUE FUND |
| BOARD OF TRUSTEES AND EXECUTIVE OFFICERS (Unaudited) (Continued) |
| Name
and Year of Birth |
Length of Time Served |
Position(s) Held with Trust |
Principal Occupation(s) During Past 5 Years |
| Executive Officers (Continued): | |||
| Martin
R. Dean Year of Birth: 1963 |
Since 2016 | Assistant Chief Compliance Officer (January 2020 to present)
Interim Chief Compliance Officer (October 2019 to January 2020 )
Assistant Chief Compliance Officer (January 2016 to 2017) |
SVP of Fund Compliance of Ultimus Fund Solutions, LLC (2016 to present) |
Additional information about members of the Board and executive officers is available in the Fund’s Statement of Additional Information (“SAI”). To obtain a free copy of the SAI, please call 1-800-665-9778.
29
KEMPNER-AR-21
| WAVELENGTH INTEREST RATE NEUTRAL FUND | |
| LETTER TO SHAREHOLDERS (Unaudited) | July 2021 |
Dear Fellow Shareholders:
Since our last annual letter, the global economy continued on an uneven path to recovery amidst an ongoing pandemic and crisis for public health. Through a patchwork of lockdowns and reopenings, extraordinary policy measures drove economic activity, and while some of the resulting dynamics will be transitory, others may have a lasting impact. In this environment, we actively managed downside risks to the portfolio, and understanding the fundamental linkages between markets and the economy was essential to delivering returns.
What follows is designed to provide a context for our returns that fosters a deeper understanding of the investment process that supports them. By doing so we hope to build on the partnership your investment creates.
PERFORMANCE SUMMARY
For the twelve months ended May 31, 2021, the Wavelength Interest Rate Neutral Fund (the “Fund”) delivered a return of +8.39% versus a benchmark return of +0.09% for the S&P / BGCantor 0-3 Month US Treasury Bill Index (which seeks to represent the return from not taking risk in financial markets). These results were within targeted risk parameters and the Fund performed in line with investment objectives.
WAVELENGTH PHILOSOPHY
We believe that macroeconomic conditions drive asset prices and central banks use interest rates to manage macroeconomic conditions. Based on this fundamental logic, we seek to build a portfolio that is hedged to changes in interest rates by balancing investment exposure between instruments we expect to outperform in rising and falling macroeconomic conditions.
INVESTMENT ENVIRONMENT
As an extension of our investment philosophy we believe that changing expectations for growth and inflation drive investment decisions, which in turn drive market prices. Since our last letter, central bank and fiscal policies actively supported economic output and created new inflationary pressures as supply chains were inundated by rapidly rising demand.
The period began with an intermittent reopening of businesses caught between waves of COVID-19 and rising levels of uncertainty over future virus spread. Markets rebounded from stressed levels, benefitting from substantial policy stimulus, and looked past risks toward an economic recovery.
Following the largest quarterly contraction for US gross domestic product on record, markets accelerated into the summer and benefited from earnings that exceeded consensus expectations. In conjunction with this, inflation expectations also rose among investors as the Fed’s new policy framework tolerating periods of price increases above the 2% annual target began to manifest itself in market prices.
1
Heading into the fourth quarter, anxiety over political gridlock and an oncoming US presidential election impacted investor sentiment. At the same time, a resurgence of COVID-19 cases put pressure on growth expectations. As clarity was established around the election and economic outlook, however, a widespread redeployment of capital sought to take advantage of opportunities heading into year-end.
The new year began with a post-holiday wave of COVID-19 cases and a rise in instability from escalating frictions between hedge funds and retail investors. This highlighted new existential risks in markets and produced a number of dislocations. Increasing bond yields also accelerated into the second quarter as markets adjusted to a new set of expectations for inflation.
With spring came the strengthening growth conditions predicted by many economists, and US output nearly reached its pre-pandemic levels. In line with this, a widely expected uptick for inflation arrived in May, still managing to exceed consensus forecasts, as supply was unable to recalibrate to rapidly expanding demand. While Fed officials continued to describe these conditions as transitory, the shock nonetheless highlighted new risks to the forward path of interest rates and demonstrated the advantage of balance in a less predictable economy.
PERFORMANCE DISCUSSION
Over the period, the Fund outperformed its benchmark by successfully managing new risks while monetizing opportunities across rapidly changing conditions. The portfolio’s core balance to potential outcomes for growth and inflation was effective at limiting downside, while its use of factors provided meaningful upside as fixed income markets recalibrated to a new economic trajectory.
The series of dislocations from market moves driven by the onset of the pandemic created an excellent opportunity set for actively investing in fixed income. In this context, we monetized mispricings across the portfolio as markets adapted to new conditions to start the period. Through June and July, profits were driven by convertible bonds, inflation-linked bonds, and emerging market debt, as well as municipal bonds which offered substantial opportunities as an asset class. Then in August, inflation-linked bonds and emerging market debt continued to drive performance as the dollar weakened and the growing risk of an inflationary outcome was recognized by investors.
Heading into the autumn months, our investment process adjusted to increasing levels of risk in markets amidst COVID-19’s resurgence and election anxiety in the US. In this context, we limited downside while positioning to capture upside as the US election and vaccine developments brought a clearer outlook for markets in November. To close out the year, the portfolio again benefited meaningfully as reflationary expectations took hold and investors adjusted to the new economic paradigm.
Concerns over rising case counts and vaccine distribution issues increased uncertainty as the year began, and these dynamics led to relatively muted performance amidst widespread deleveraging. Pressure from rising bond yields created tactical opportunities as dislocations offered an attractive opportunity set for systematic investing. The portfolio took advantage of these conditions heading into the second quarter, delivering balanced positive results in both April and May in a strong close to the period.
2
OUTLOOK
The pandemic disrupted markets and economic relationships across the globe, and though some changes will be transient, others will have a lasting impact. Under these conditions, we expect the ability to manage new risks while actively seeking out the opportunities they create will be critical to delivering returns. We believe a data-driven approach offers a logical solution for investors in this environment and are positioned to monetize the opportunity set in a balance to potential risks and outcomes for the economy over the long-term.
Thank you for your trust and commitment through investment.
Sincerely,

Andrew Dassori
Founding
Partner & Chief Investment Officer
Wavelength Capital Management
Past performance is not predictive of future performance. Investment results and principal value will fluctuate so that shares, when redeemed, may be worth more or less than their original cost. Current performance may be higher or lower than the performance data quoted. Performance data current to the most recent month end are available by calling 1-866-896-9292.
An investor should consider the investment objectives, risks, charges and expenses of the Fund carefully before investing. The Fund’s prospectus contains this and other important information. To obtain a copy of the Fund’s prospectus please visit our website at www.wavelengthfunds.com or call 1-866-896-9292 and a copy will be sent to you free of charge. Please read the prospectus carefully before you invest. The Wavelength Interest Rate Neutral Fund is distributed by Ultimus Fund Distributors, LLC.
The Letter to Shareholders seeks to describe some of the Adviser’s current opinions and views of the financial markets. Although the Adviser believes it has a reasonable basis for any opinions or views expressed, actual results may differ, sometimes significantly so, from those expected or expressed. The securities held by the Fund that are discussed in the Letter to Shareholders were held during the period covered by this Report. They do not comprise the entire investment portfolio of the Fund, may be sold at any time and may no longer be held by the Fund. For a complete list of securities held by the Fund as of May 31, 2021, please see the Schedule of Investments section of the Annual Report. The opinions of the Adviser with respect to those securities may change at any time.
Statements in the Letter to Shareholders that reflect projections or expectations for future financial or economic performance of the Fund and the market in general and statements of the Fund’s plans and objectives for future operations are forward-looking statements. No assurance can be given that actual results or events will not differ materially from those projected, estimated, assumed, or anticipated in any such forward-looking statements. Important factors that could result in such differences, in addition to factors noted with such forward-looking statements include, without limitation, general economic conditions, such as inflation, recession, and interest rates. Past performance is not a guarantee of future results.
3
| WAVELENGTH INTEREST RATE NEUTRAL FUND |
| PERFORMANCE INFORMATION |
| May 31, 2021 (Unaudited) |
Comparison
of the Change in Value of a $10,000 Investment in
Wavelength Interest Rate Neutral Fund versus the
S&P/BGCantor 0-3 Month U.S. Treasury Bill Index
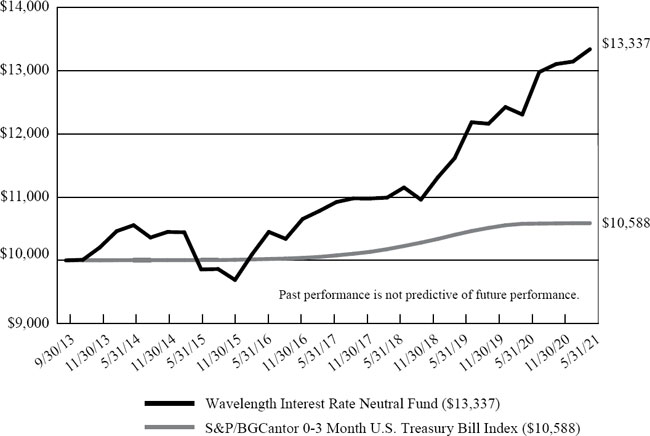
| Average
Annual Total Returns For Periods Ended May 31, 2021 | ||||||||
| Since | ||||||||
| 1 Year | 3 Years | 5 Years | Inception(b) | |||||
| Wavelength Interest Rate Neutral Fund(a) | 8.39% | 6.66% | 5.73% | 3.83% | ||||
| S&P/BGCantor 0-3 Month U.S. Treasury Bill Index | 0.09% | 1.33% | 1.12% | 0.75% | ||||
| (a) | The Fund’s total returns do not reflect the deduction of taxes a shareholder would pay on Fund distributions or the redemption of Fund shares. |
| (b) | The Fund commenced operations on September 30, 2013. |
4
| WAVELENGTH INTEREST RATE NEUTRAL FUND |
| PORTFOLIO INFORMATION |
| May 31, 2021 (Unaudited) |
Portfolio Allocation (% of Net Assets)
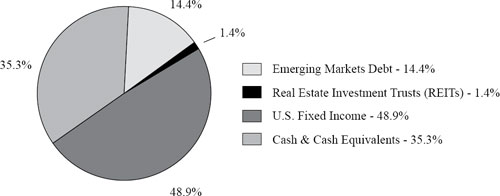
| Top 10 Equity Holdings |
| % of Net | ||
| Security Description | Assets | |
| iShares TIPS Bond ETF | 12.7% | |
| Invesco Senior Loan ETF | 8.2% | |
| iShares National Muni Bond ETF | 7.7% | |
| Vanguard Emerging Markets Government Bond ETF | 7.4% | |
| SPDR Bloomberg Barclays Convertible Securities ETF | 5.0% | |
| Vanguard Mortgage-Backed Securities ETF | 4.8% | |
| SPDR Bloomberg Barclays Short Term High Yield Bond ETF | 3.5% | |
| Vanguard Short-Term Inflation-Protected Securities ETF | 3.3% | |
| VanEck Vectors Emerging Markets High Yield Bond ETF | 3.2% | |
| Invesco Emerging Markets Sovereign Debt ETF | 2.3% | |
5
| WAVELENGTH INTEREST RATE NEUTRAL FUND |
| SCHEDULE OF INVESTMENTS |
| May 31, 2021 |
| EXCHANGE-TRADED FUNDS — 64.7% | Shares | Value | ||||||
| Emerging Markets Debt — 14.4% | ||||||||
| Invesco Emerging Markets Sovereign Debt ETF | 130,292 | $ | 3,588,242 | |||||
| iShares J.P. Morgan USD Emerging Markets Bond ETF . | 21,253 | 2,377,360 | ||||||
| VanEck Vectors Emerging Markets High Yield Bond ETF | 205,943 | 4,917,919 | ||||||
| Vanguard Emerging Markets Government Bond ETF | 145,794 | 11,586,249 | ||||||
| 22,469,770 | ||||||||
| Real Estate Investment Trusts (REITs) — 1.4% | ||||||||
| Vanguard Real Estate ETF (a) | 21,400 | 2,137,432 | ||||||
| U.S. Fixed Income — 48.9% | ||||||||
| Invesco Senior Loan ETF (a) | 576,112 | 12,789,686 | ||||||
| iShares iBoxx $ High Yield Corporate Bond ETF (a) | 40,620 | 3,541,252 | ||||||
| iShares National Muni Bond ETF (a) | 102,795 | 12,023,931 | ||||||
| iShares TIPS Bond ETF | 154,661 | 19,761,036 | ||||||
| SPDR Bloomberg Barclays Convertible Securities ETF | 93,181 | 7,852,363 | ||||||
| SPDR Bloomberg Barclays High Yield Bond ETF (a) | 19,377 | 2,110,349 | ||||||
| SPDR Bloomberg Barclays Short Term High Yield Bond ETF | 201,309 | 5,515,867 | ||||||
| Vanguard Mortgage-Backed Securities ETF | 139,768 | 7,471,299 | ||||||
| Vanguard Short-Term Inflation-Protected Securities ETF .. | 98,660 | 5,168,797 | ||||||
| 76,234,580 | ||||||||
| Total Exchange-Traded Funds (Cost $95,394,340) | $ | 100,841,782 | ||||||
6
| WAVELENGTH INTEREST RATE NEUTRAL FUND |
| SCHEDULE OF INVESTMENTS (Continued) |
| MONEY MARKET FUNDS — 16.0% | Shares | Value | ||||||
| Fidelity Institutional Money Market Government Portfolio - Class I, 0.01% (b) | 12,450,318 | $ | 12,450,318 | |||||
| Invesco Short-Term Investments Trust - Institutional Class, 0.01% (b) | 12,450,318 | 12,450,318 | ||||||
| Total Money Market Funds (Cost $24,900,636) | $ | 24,900,636 | ||||||
| COLLATERAL FOR SECURITIES LOANED — 11.5% | Value | Value | ||||||
| Mount Vernon Liquid Assets Portfolio, LLC, 0.09% (Cost $17,992,868) (b)(c) | 17,992,868 | $ | 17,992,868 | |||||
| Investments at Value — 92.2% (Cost $138,287,844) | $ | 143,735,286 | ||||||
| Other Assets in Excess of Liabilities — 7.8% | 12,126,517 | |||||||
| Net Assets — 100.0% | $ | 155,861,803 | ||||||
| (a) | All or a portion of the security is on loan. The total value of the securities on loan as of May 31, 2021 was $17,616,649 (Note 6). |
| (b) | The rate shown is the 7-day effective yield as of May 31, 2021. |
| (c) | This security was purchased with cash collateral held from securities on loan (Note 6). |
See accompanying notes to financial statements.
7
| WAVELENGTH INTEREST RATE NEUTRAL FUND |
| SCHEDULE OF FUTURES CONTRACTS |
| May 31, 2021 |
| Value/Unrealized | ||||||||||||||||
| Expiration | Notional | Appreciation | ||||||||||||||
| FUTURES CONTRACTS | Contracts | Date | Value | (Depreciation) | ||||||||||||
| Commodity Futures | ||||||||||||||||
| E-Mini Gold Future | 22 | 7/28/2021 | $ | 2,097,700 | $ | 14,590 | ||||||||||
| Index Futures | ||||||||||||||||
| E-Mini Dow CBOT DJIA Future | 17 | 6/18/2021 | 2,936,580 | 122,619 | ||||||||||||
| E-Mini Nasdaq 100 Future | 11 | 6/18/2021 | 3,013,120 | 75,412 | ||||||||||||
| E-Mini S&P 500 Future | 15 | 6/18/2021 | 3,153,000 | 87,631 | ||||||||||||
| Total Index Futures | 9,102,700 | 285,662 | ||||||||||||||
| Treasury Futures | ||||||||||||||||
| 10-Year U.S. Treasury Note Future | 58 | 9/21/2021 | 7,648,750 | (8,719 | ) | |||||||||||
| 2-Year U.S. Treasury Note Future | 41 | 9/30/2021 | 9,050,109 | 252 | ||||||||||||
| 5-Year U.S. Treasury Note Future | 112 | 9/30/2021 | 13,870,500 | (2,397 | ) | |||||||||||
| U.S. Treasury Long Bond Future | 30 | 9/21/2021 | 4,692,188 | (11,300 | ) | |||||||||||
| Total Treasury Futures | 35,261,547 | (22,164 | ) | |||||||||||||
| Total Futures Contracts | $ | 46,461,947 | $ | 278,088 | ||||||||||||
The average monthly notional value of futures contracts during the year ended May 31, 2021 was $49,014,922.
See accompanying notes to financial statements.
8
| WAVELENGTH INTEREST RATE NEUTRAL FUND |
| STATEMENT OF ASSETS AND LIABILITIES |
| May 31, 2021 |
| ASSETS | ||||
| Investments in securities: | ||||
| At cost | $ | 138,287,844 | ||
| At value* (Note 2) | $ | 143,735,286 | ||
| Cash (Note 2) | 26,409,595 | |||
| Margin deposits for futures contracts (Note 2) | 3,989,743 | |||
| Variation margin receivable (Notes 2 and 5) | 54,175 | |||
| Receivable for capital shares sold | 156,139 | |||
| Dividends and interest receivable | 14,838 | |||
| Other assets | 15,839 | |||
| Total assets | 174,375,615 | |||
| LIABILITIES | ||||
| Payable for return of collateral received for securities on loan (Note 6) | 17,992,868 | |||
| Payable for capital shares redeemed | 57,750 | |||
| Payable for investment securities purchased | 327,182 | |||
| Payable to Adviser (Note 4) | 99,547 | |||
| Payable to administrator (Note 4) | 20,250 | |||
| Other accrued expenses | 16,215 | |||
| Total liabilities | 18,513,812 | |||
| NET ASSETS | $ | 155,861,803 | ||
| NET ASSETS CONSIST OF: | ||||
| Paid-in capital | $ | 149,851,566 | ||
| Accumulated earnings | 6,010,237 | |||
| NET ASSETS | $ | 155,861,803 | ||
| Shares of beneficial interest outstanding (unlimited number of shares authorized, no par value) | 14,182,894 | |||
| Net asset value, offering price and redemption price per share (Note 2) | $ | 10.99 |
| * | Includes value of securities on loan. |
See accompanying notes to financial statements.
9
| WAVELENGTH INTEREST RATE NEUTRAL FUND |
| STATEMENT OF OPERATIONS |
| For the Year Ended May 31, 2021 |
| INVESTMENT INCOME | ||||
| Dividends | $ | 2,227,479 | ||
| Securities lending income (Note 6) | 226,929 | |||
| Total investment income | 2,454,408 | |||
| EXPENSES | ||||
| Investment advisory fees (Note 4) | 1,157,994 | |||
| Administration fees (Note 4) | 122,300 | |||
| Registration and filing fees | 46,174 | |||
| Fund accounting fees (Note 4) | 42,233 | |||
| Legal fees | 22,145 | |||
| Transfer agent fees (Note 4) | 19,455 | |||
| Audit and tax services fees | 17,600 | |||
| Custody and bank service fees | 17,362 | |||
| Trustees’ fees and expenses (Note 4) | 16,750 | |||
| Compliance fees (Note 4) | 14,400 | |||
| Postage and supplies | 11,271 | |||
| Printing of shareholder reports | 5,736 | |||
| Insurance expense | 4,054 | |||
| Other expenses | 30,796 | |||
| Total expenses | 1,528,270 | |||
| Less fee reductions by the Adviser (Note 4) | (321,501 | ) | ||
| Net expenses | 1,206,769 | |||
| NET INVESTMENT INCOME | 1,247,639 | |||
| REALIZED AND UNREALIZED GAINS (LOSSES) ON INVESTMENTS AND FUTURES CONTRACTS | ||||
| Net realized gains from: | ||||
| Investments | 1,548,518 | |||
| Futures contracts (Note 5) | 2,092,167 | |||
| Net change in unrealized appreciation (depreciation) on: | ||||
| Investments | 3,628,529 | |||
| Futures contracts (Note 5) | (63,386 | ) | ||
| NET REALIZED AND UNREALIZED GAINS ON INVESTMENTS AND FUTURES CONTRACTS | 7,205,828 | |||
| NET INCREASE IN NET ASSETS RESULTING FROM OPERATIONS | $ | 8,453,467 |
See accompanying notes to financial statements.
10
| WAVELENGTH INTEREST RATE NEUTRAL FUND |
| STATEMENTS OF CHANGES IN NET ASSETS |
| Year | Year | |||||||
| Ended | Ended | |||||||
| May 31, | May 31, | |||||||
| 2021 | 2020 | |||||||
| FROM OPERATIONS | ||||||||
| Net investment income | $ | 1,247,639 | $ | 1,495,568 | ||||
| Net realized gains (losses) from: | ||||||||
| Investments | 1,548,518 | (3,214,366 | ) | |||||
| Futures contracts (Note 5) | 2,092,167 | 2,547,521 | ||||||
| Long-term capital gain distributions from regulated investment companies | — | 82 | ||||||
| Net change in unrealized appreciation (depreciation) on: | ||||||||
| Investments | 3,628,529 | 1,717,300 | ||||||
| Futures contracts (Note 5) | (63,386 | ) | 273,649 | |||||
| Net increase in net assets resulting from operations | 8,453,467 | 2,819,754 | ||||||
| DISTRIBUTIONS TO SHAREHOLDERS (Note 2) | (2,499,049 | ) | (3,699,999 | ) | ||||
| CAPITAL SHARE TRANSACTIONS | ||||||||
| Proceeds from shares sold | 102,097,480 | 60,584,918 | ||||||
| Net asset value of shares issued in reinvestment of distributions to shareholders | 1,871,694 | 2,322,824 | ||||||
| Payments for shares redeemed | (35,834,717 | ) | (33,522,882 | ) | ||||
| Net increase in net assets from capital share transactions | 68,134,457 | 29,384,860 | ||||||
| TOTAL INCREASE IN NET ASSETS | 74,088,875 | 28,504,615 | ||||||
| NET ASSETS | ||||||||
| Beginning of year | 81,772,928 | 53,268,313 | ||||||
| End of year | $ | 155,861,803 | $ | 81,772,928 | ||||
| CAPITAL SHARE ACTIVITY | ||||||||
| Shares sold | 9,408,498 | 5,832,350 | ||||||
| Shares issued in reinvestment of distributions to shareholders | 171,595 | 224,070 | ||||||
| Shares redeemed | (3,295,214 | ) | (3,347,977 | ) | ||||
| Net increase in shares outstanding | 6,284,879 | 2,708,443 | ||||||
| Shares outstanding at beginning of year | 7,898,015 | 5,189,572 | ||||||
| Shares outstanding at end of year | 14,182,894 | 7,898,015 | ||||||
See accompanying notes to financial statements.
11
| WAVELENGTH INTEREST RATE NEUTRAL FUND |
| FINANCIAL HIGHLIGHTS |
| Per Share Data for a Share Outstanding Throughout Each Year | ||||||||||||||||||||
| Year | Year | Year | Year | Year | ||||||||||||||||
| Ended | Ended | Ended | Ended | Ended | ||||||||||||||||
| May 31, | May 31, | May 31, | May 31, | May 31, | ||||||||||||||||
| 2021 | 2020 | 2019 | 2018 | 2017 | ||||||||||||||||
| Net asset value at beginning of year | $ | 10.35 | $ | 10.26 | $ | 9.97 | $ | 9.99 | $ | 9.54 | ||||||||||
| Income (loss) from investment operations: | ||||||||||||||||||||
| Net investment income (a) | 0.11 | 0.22 | 0.27 | 0.22 | 0.20 | |||||||||||||||
| Net realized and unrealized gains (losses) on investments and futures contracts | 0.75 | 0.38 | 0.28 | (0.03 | ) | 0.45 | ||||||||||||||
| Total from investment operations | 0.86 | 0.60 | 0.55 | 0.19 | 0.65 | |||||||||||||||
| Less distributions from: | ||||||||||||||||||||
| Net investment income | (0.10 | ) | (0.23 | ) | (0.26 | ) | (0.21 | ) | (0.20 | ) | ||||||||||
| Net realized gains | (0.12 | ) | (0.28 | ) | — | — | — | |||||||||||||
| Total distributions | (0.22 | ) | (0.51 | ) | (0.26 | ) | (0.21 | ) | (0.20 | ) | ||||||||||
| Net asset value at end of year | $ | 10.99 | $ | 10.35 | $ | 10.26 | $ | 9.97 | $ | 9.99 | ||||||||||
| Total return (b) | 8.39 | % | 5.92 | % | 5.68 | % | 1.95 | % | 6.83 | % | ||||||||||
| Net assets at end of year (000’s) | $ | 155,862 | $ | 81,773 | $ | 53,268 | $ | 48,434 | $ | 21,391 | ||||||||||
| Ratios/supplementary data: | ||||||||||||||||||||
| Ratio of total expenses to average net assets (c) | 1.25 | % | 1.34 | % | 1.41 | % | 1.55 | % | 1.85 | % | ||||||||||
| Ratio of net expenses to average net assets (c)(d) | 0.99 | % | 0.99 | % | 0.99 | % | 0.99 | % | 0.99 | % | ||||||||||
| Ratio of net investment income to average net assets (a)(c)(d) | 1.02 | % | 2.07 | % | 2.65 | % | 2.17 | % | 2.01 | % | ||||||||||
| Portfolio turnover rate | 12 | % | 52 | % | 20 | % | 9 | % | 53 | % | ||||||||||
| (a) | Recognition of net investment income by the Fund is affected by the timing of the declarations of dividends by the underlying investment companies in which the Fund invests. |
| (b) | Total return is a measure of the change in value of an investment in the Fund over the periods covered. The returns shown do not reflect the deduction of taxes a shareholder would pay on Fund distributions, if any, or the redemption of Fund shares. The total returns would be lower if the Adviser had not reduced advisory fees and/or reimbursed expenses. |
| (c) | The ratios of expenses and net investment income to average net assets do not reflect the Fund’s proportionate share of expenses of the underlying investment companies in which the Fund invests. |
| (d) | Ratio was determined after advisory fee reductions and/or expense reimbursements (Note 4). |
See accompanying notes to financial statements.
12
| WAVELENGTH INTEREST RATE NEUTRAL FUND |
| NOTES
TO FINANCIAL STATEMENTS May 31, 2021 |
| 1. | Organization |
Wavelength Interest Rate Neutral Fund (the “Fund”) is a diversified series of Ultimus Managers Trust (the “Trust”), an open-end investment company established as an Ohio business trust under a Declaration of Trust dated February 28, 2012. Other series of the Trust are not incorporated in this report.
The investment objective of the Fund is to seek total return.
| 2. | Significant Accounting Policies |
The Fund follows accounting and reporting guidance under Financial Accounting Standards Board Accounting Standards Codification Topic 946, “Financial Services – Investment Companies.” The following is a summary of the Fund’s significant accounting policies used in the preparation of its financial statements. These policies are in conformity with accounting principles generally accepted in the United States of America (“GAAP”).
Securities and futures valuation – The Fund values its portfolio securities at market value as of the close of regular trading on the New York Stock Exchange (the “NYSE”) (normally 4:00 p.m. Eastern time) on each business day the NYSE is open. Exchange-traded funds (“ETFs”) are valued at the security’s last sale price on the security’s primary exchange, if available, otherwise at the exchange’s most recently quoted mean price. Investments representing shares of money market funds and other open-end investment companies, except for ETFs, are valued at their net asset value (“NAV”) as reported by such companies. NASDAQ-listed securities are valued at the NASDAQ Official Closing Price. The Fund values its exchange-traded futures contracts at their last sale price as of the close of regular trading on the NYSE. Prices for these futures contracts are monitored daily by Wavelength Capital Management, LLC (the “Adviser”) until the close of regular trading to determine if fair valuation is required.
When using a quoted price and when the market for the security is considered active, a security will be classified as Level 1 within the fair value hierarchy (see below). In the event that market quotations are not readily available or are considered unreliable due to market or other events, the Fund values its securities and other assets at fair value pursuant to the procedures adopted by and under the general supervision of the Trust’s Board of Trustees (the “Board”). Under these procedures, the securities will be classified as Level 2 or 3 within the fair value hierarchy, depending on the inputs used. Unavailable or unreliable market quotes may be due to the following factors: a substantial bid-ask spread; infrequent sales resulting in stale prices; insufficient trading volume; small trade sizes; a temporary lapse in any reliable pricing source; and actions of the securities or futures markets, such as the suspension or limitation of trading.
GAAP establishes a single authoritative definition of fair value, sets out a framework for measuring fair value, and requires additional disclosures about fair value measurements.
13
| WAVELENGTH INTEREST RATE NEUTRAL FUND |
| NOTES TO FINANCIAL STATEMENTS (Continued) |
Various inputs are used in determining the value of the Fund’s investments. These inputs are summarized in the three broad levels listed below:
| ● | Level 1 – quoted prices in active markets for identical securities |
| ● | Level 2 – other significant observable inputs |
| ● | Level 3 – significant unobservable inputs |
The inputs or methods used for valuing securities are not necessarily an indication of the risks associated with investing in those securities. The inputs used to measure fair value may fall into different levels of the fair value hierarchy. In such cases, for disclosure purposes, the level in the fair value hierarchy within which the fair value measurement falls in its entirety is determined based on the lowest level input that is significant to the fair value measurement.
The following is a summary of the Fund’s investments and other financial instruments and the inputs used to value the investments and other financial instruments as of May 31, 2021:
| Level 1 | Level 2 | Level 3 | Total | |||||||||||||
| Investments in Securities | ||||||||||||||||
| Exchange-Traded Funds | $ | 100,841,782 | $ | — | $ | — | $ | 100,841,782 | ||||||||
| Money Market Funds | 24,900,636 | — | — | 24,900,636 | ||||||||||||
| Collateral for Securities Loaned * | — | — | — | 17,992,868 | ||||||||||||
| Total | $ | 125,742,418 | $ | — | $ | — | $ | 143,735,286 | ||||||||
| Other Financial Instruments | ||||||||||||||||
| Futures Contracts | $ | 278,088 | $ | — | $ | — | $ | 278,088 | ||||||||
| Total | $ | 278,088 | $ | — | $ | — | $ | 278,088 | ||||||||
| * | Certain investments that are measured at fair value using the NAV per share (or its equivalent) practical expedient have not been categorized in the fair value hierarchy. The fair value amounts presented in the table are intended to permit reconciliation of the fair value hierarchy to the amounts presented on the Statement of Assets and Liabilities. |
The Fund did not have any assets or liabilities that were measured at fair value on a recurring basis using significant unobservable inputs (Level 3) as of or during the year ended May 31, 2021. Other Financial Instruments are future contracts which are valued at the unrealized appreciation (depreciation) as of May 31, 2021.
Cash account – The Fund’s cash is held in a bank account with balances which, at times, may exceed United States federally insured limits by the Federal Deposit Insurance Corporation. The Fund maintains these balances with a high-quality financial institution and may incur charges on cash overdrafts.
Share valuation – The NAV per share of the Fund is calculated daily by dividing the total value of the Fund’s assets, less liabilities, by the number of shares outstanding. The offering price and redemption price per share of the Fund is equal to the NAV per share.
14
| WAVELENGTH INTEREST RATE NEUTRAL FUND |
| NOTES TO FINANCIAL STATEMENTS (Continued) |
Investment income – Dividend income is recorded on the ex-dividend date. Interest income, if any, is accrued as earned. Non-cash dividends included in dividend income, if any, are recorded at the fair value of the security received.
Investment transactions – Investment transactions are accounted for on the trade date. Realized gains and losses on investments sold are determined on a specific identification basis.
Common expenses – Common expenses of the Trust are allocated among the Fund and the other series of the Trust based on the relative net assets of each series, the number of series in the Trust, or the nature of the services performed and the relative applicability to each series.
Distributions to shareholders – The Fund distributes to shareholders any net investment income on a quarterly basis and any net realized capital gains at least annually. The amount of such dividends and distributions are determined in accordance with federal income tax regulations, which may differ from GAAP. Dividends and distributions to shareholders are recorded on the ex-dividend date. The tax character of distributions paid during the years ended May 31, 2021 and 2020 was as follows:
| Year | Ordinary | Tax-Exempt | Long-Term | Total | ||||||||||||
| Ended | Income | Distributions | Capital Gains | Distributions | ||||||||||||
| 5/31/2021 | $ | 1,980,645 | $ | 108,171 | $ | 410,233 | $ | 2,499,049 | ||||||||
| 5/31/2020 | $ | 2,317,659 | $ | 82,679 | $ | 1,299,661 | $ | 3,699,999 | ||||||||
Futures contracts – The Fund uses futures contracts to gain exposure to or to hedge against changes in the value of equities, real estate, interest rates or commodities. A futures contract represents a commitment for the future purchase or sale of an asset at a specified price on a specified date. When the Fund purchases or sells a futures contract, no price is paid to or received by the Fund. Instead, the Fund is required to deposit in a segregated asset account an amount of cash or qualifying securities currently ranging from 2% to 10% of the contract amount. This is called the “initial margin deposit.” Subsequent payments, known as “variation margin,” are made or received by the Fund each day, depending on the daily fluctuations in the fair value of the underlying asset. The Fund recognizes an unrealized gain or loss equal to the daily variation margin. If market conditions move unexpectedly, the Fund may not achieve the anticipated benefits of the futures contracts and may realize a loss. The margin deposits for futures contracts and the variation receivable/payable are reported on the Statement of Assets and Liabilities.
Estimates – The preparation of financial statements in conformity with GAAP requires management to make estimates and assumptions that affect the reported amounts of assets and liabilities and disclosure of contingent assets and liabilities as of the date of the financial statements and the reported amounts of increase (decrease) in net assets from operations during the reporting period. Actual results could differ from those estimates.
15
| WAVELENGTH INTEREST RATE NEUTRAL FUND |
| NOTES TO FINANCIAL STATEMENTS (Continued) |
Federal income tax – The Fund has qualified and intends to continue to qualify as a regulated investment company under the Internal Revenue Code of 1986, as amended (the “Code”). Qualification generally will relieve the Fund of liability for federal income taxes to the extent 100% of its net investment income and net realized capital gains are distributed in accordance with the Code.
In order to avoid imposition of the excise tax applicable to regulated investment companies, it is also the Fund’s intention to declare as dividends in each calendar year amounts equal to at least 98% of its net investment income (earned during the calendar year) and 98.2% of its net realized capital gains (earned during the twelve months ended October 31) plus undistributed amounts from prior years.
The following information is computed on a tax basis for each item as of May 31, 2021:
| Tax cost of portfolio investments | $ | 139,928,711 | ||
| Gross unrealized appreciation | $ | 4,548,168 | ||
| Gross unrealized depreciation | (741,593 | ) | ||
| Net unrealized appreciation | 3,806,575 | |||
| Undistributed ordinary income | 859,941 | |||
| Undistributed long-term capital gains | 1,343,721 | |||
| Accumulated earnings | $ | 6,010,237 |
The value of the federal income tax cost of portfolio investments may temporarily differ from the financial statement cost. This book/tax difference is due to the recognition of capital gains or losses under income tax regulations and GAAP, primarily the tax deferral of losses on wash sales, the tax treatment of realized and unrealized gains and losses on futures contracts and adjustments to basis on publicly traded partnerships.
For the year ended May 31, 2021, the Fund reclassified $135,154 of accumulated earnings against paid-in capital on the Statement of Assets and Liabilities. Such reclassification, the result of permanent differences between the financial statement and income tax reporting requirements due to adjustments for publicly traded partnerships and the utilization of earnings and profits on shareholder redemptions, had no effect on the Fund’s net assets or its NAV per share.
The Fund recognizes the tax benefits or expenses of uncertain tax positions only when the position is “more likely than not” to be sustained assuming examination by tax authorities. Management has reviewed the Fund’s tax positions for all open tax years (generally, three years) and has concluded that no provision for unrecognized tax benefits or expenses is required in these financial statements. The Fund identifies its major tax jurisdiction as U.S. Federal.
16
| WAVELENGTH INTEREST RATE NEUTRAL FUND |
| NOTES TO FINANCIAL STATEMENTS (Continued) |
| 3. | Investment Transactions |
During the year ended May 31, 2021, cost of purchases and proceeds from sales of investment securities, other than short-term investments, were $53,488,030 and $9,029,273, respectively.
| 4. | Transactions with Related Parties |
INVESTMENT ADVISORY AGREEMENT
The Fund’s investments are managed by the Adviser pursuant to the terms of the Investment Advisory Agreement. Under the Investment Advisory Agreement, the Fund pays the Adviser an investment advisory fee, computed and accrued daily and paid monthly, at the annual rate of 0.95% of its average daily net assets.
Pursuant to an Expense Limitation Agreement between the Fund and the Adviser (the “ELA”), the Adviser has agreed, until October 1, 2025, to reduce its investment advisory fees and reimburse other expenses to limit total annual operating expenses (exclusive of brokerage costs; taxes; interest; borrowing costs such as interest and dividends expenses on securities sold short; acquired fund fees and expenses; extraordinary expenses such as litigation and merger or reorganization costs and other expenses not incurred in the ordinary course of the Fund’s business) to an amount not exceeding 0.99% of the Fund’s average daily net assets. During the year ended May 31, 2021, the Adviser reduced its investment advisory fees by $321,501.
Under the terms of the ELA, investment advisory fee reductions and expense reimbursements by the Adviser are subject to recoupment by the Adviser for a period of three years after such fees and expenses were incurred, provided that the recoupments do not cause total annual operating expenses of the Fund to exceed the lesser of (i) the expense limitation then in effect, if any, and (ii) the expense limitation in effect at the time the expenses to be repaid were incurred. As of May 31, 2021, the Adviser may seek recoupment of investment advisory fee reductions and expense reimbursements in the amount of $783,932 no later than the dates as stated below:
| May 31, 2022 | May 31, 2023 | May 31, 2024 | Total | |||
| $211,390 | $251,041 | $321,501 | $783,932 |
OTHER SERVICE PROVIDERS
Ultimus Fund Solutions, LLC (“Ultimus”) provides administration, fund accounting, compliance and transfer agency services to the Fund. The Fund pays Ultimus fees in accordance with the agreements for such services. In addition, the Fund pays out-of-pocket expenses including, but not limited to, postage, supplies and certain costs related to the pricing of the Fund’s portfolio securities.
17
| WAVELENGTH INTEREST RATE NEUTRAL FUND |
| NOTES TO FINANCIAL STATEMENTS (Continued) |
Under the terms of a Distribution Agreement with the Trust, Ultimus Fund Distributors, LLC (the “Distributor”) serves as the principal underwriter to the Fund. The Distributor is a wholly-owned subsidiary of Ultimus. The Distributor is compensated by the Adviser (not the Fund) for acting as principal underwriter.
Certain officers and a Trustee of the Trust are also officers of Ultimus.
TRUSTEE COMPENSATION
Each member of the Board (a “Trustee”) who is not an “interested person” of the Trust (“Independent Trustee”) receives a $1,300 annual retainer from the Fund, paid quarterly, except for the Board Chairperson who receives a $1,500 annual retainer from the Fund, paid quarterly. Each Independent Trustee also receives from the Fund a fee of $500 for each Board meeting attended plus reimbursement for travel and other meeting-related expenses.
PRINCIPAL HOLDER OF FUND SHARES
As of May 31, 2021, the following shareholder owned of record 25% or more of the outstanding shares of the Fund:
| Name of Record Owner | % Ownership | |
| National Financial Services, LLC (for the benefit of its customers) | 31% |
A shareholder owning of record or beneficially 25% or more of the Fund’s outstanding shares may be considered a controlling person. That shareholder’s vote could have a more significant effect on matters presented at a shareholders’ meeting.
| 5. | Derivatives Transactions |
The Fund’s positions in derivative instruments as of May 31, 2021 are recorded in the following location on the Statement of Assets and Liabilities:
| Derivative Investment Type | Location |
| Futures contracts | Variation margin receivable |
The following table sets forth the values of variation margin of the Fund as of May 31, 2021:
| Variation Margin | ||||||||||||
| Type of Derivative and Risk | Receivable | (Payable) | Total | |||||||||
| Asset Derivatives | ||||||||||||
| Futures contracts | ||||||||||||
| Commodity | $ | 9,350 | $ | — | $ | 9,350 | ||||||
| Index | 26,437 | — | 26,437 | |||||||||
| Treasury | 18,388 | — | 18,388 | |||||||||
| Total | $ | 54,175 | $ | — | $ | 54,175 | ||||||
18
| WAVELENGTH INTEREST RATE NEUTRAL FUND |
| NOTES TO FINANCIAL STATEMENTS (Continued) |
The Fund’s transactions in derivative instruments during the year ended May 31, 2021 are recorded in the following locations on the Statement of Operations:
| Derivative Investment Type | Location |
| Futures contracts | Net realized gains from futures contracts |
| Net change in unrealized appreciation (depreciation) on futures contracts |
The following is a summary of the Fund’s net realized gains (losses) and net change in unrealized appreciation (depreciation) on derivative instruments recognized on the Statement of Operations during the year ended May 31, 2021:
| Net Change | ||||||||
| in Unrealized | ||||||||
| Net Realized | Appreciation | |||||||
| Type of Derivative and Risk | Gains (Losses) | (Depreciation) | ||||||
| Futures contracts | ||||||||
| Commodity | $ | 74,133 | $ | 4,421 | ||||
| Index | 3,042,599 | (4,350 | ) | |||||
| Treasury | (1,024,565 | ) | (63,457 | ) | ||||
| Total | $ | 2,092,167 | $ | (63,386 | ) | |||
In the ordinary course of business, the Fund may enter into transactions subject to enforceable netting agreements or other similar arrangements (“netting agreements”). Generally, the right to offset in netting agreements allows the Fund to offset any exposure to a specific counterparty with any collateral received or delivered to that counterparty based on the terms of the agreements. Generally, the Fund manages its cash collateral securities and securities collateral on a counterparty basis.
19
| WAVELENGTH INTEREST RATE NEUTRAL FUND |
| NOTES TO FINANCIAL STATEMENTS (Continued) |
As of May 31, 2021, the offsetting of financial assets and derivative assets is as follows:
| Gross | Gross | |||||||||||||||||||||||
| Amounts of | Amounts of | |||||||||||||||||||||||
| Recognized | Recognized | Net Amounts | ||||||||||||||||||||||
| Assets not | Liabilities | of Assets | ||||||||||||||||||||||
| Offset on | not Offset on | Presented on | ||||||||||||||||||||||
| Statement of | Statement of | Derivatives | Statement of | |||||||||||||||||||||
| Assets and | Assets and | Available for | Assets and | Collateral | ||||||||||||||||||||
| Description | Liabilities | Liabilities | Offset | Liabilities | Pledged | Net Amount | ||||||||||||||||||
| Variation margin receivable - futures contracts | $ | 54,175 | $ | — | $ | — | $ | 54,175 | $ | — | $ | 54,175 | ||||||||||||
| Variation margin payable - futures contracts | — | — | — | — | — | — | ||||||||||||||||||
| Total subject to a master netting or similar arrangement | $ | 54,175 | $ | — | $ | — | $ | 54,175 | $ | — | $ | 54,175 | ||||||||||||
| 6. | Securities Lending |
Under the terms of the securities lending agreement with U.S. Bank National Association (“U.S. Bank”), U.S. Bank is authorized to loan securities on behalf of the Fund to approved borrowers. The contractual maturity of securities lending transactions are on an overnight and continuous basis. In exchange, the Fund receives cash collateral in the amount of at least 102% of the value of the securities loaned. Any collateral shortfalls due to changes in security market prices are adjusted the next business day. The cash collateral is invested in a short-term investment instrument as noted on the Fund’s Schedule of Investments. As of May 31, 2021, the Fund had 11.5% of its net assets invested in this short-term investment instrument for securities lending purposes. Although risk is mitigated by the collateral, the Fund could experience a delay in recovering its securities and possible loss of income or value if the borrower fails to return them. The agreement provides that after predetermined rebates to borrowers, the Fund retains a portion of its net securities lending income and pays U.S. Bank the remaining portion. The Fund manages credit exposure arising from these lending transactions by, in appropriate circumstances, entering into a Securities Lending Agreement with U.S. Bank that provides the Fund, in the event of default (such as bankruptcy or borrower’s failure to pay or perform), the right to net rights and obligations under such agreements and liquidate and set off collateral against the net amount owed to the Fund. As of May 31, 201, the fair value of securities on loan and the collateral held were $17,616,649 and $17,992,868, respectively.
20
| WAVELENGTH INTEREST RATE NEUTRAL FUND |
| NOTES TO FINANCIAL STATEMENTS (Continued) |
| 7. | Certain Investments and Risks |
The securities in which the Fund invests, as well as the risks associated with these securities, are described in the Fund’s prospectus. Among these risks are those associated with investments in shares of ETFs. ETFs issue their shares to authorized participants in return for a specific basket of securities. The authorized participants then sell the ETF’s shares on the secondary market. In other words, ETF shares are traded on a securities exchange based on their market value. Investments in ETFs are subject to the risk that the ETF’s shares may trade at a premium (creating the risk that the Fund pays more than NAV for an ETF when making a purchase) or discount (creating the risk that the Fund receives less than NAV when selling an ETF) to the ETF’s NAV. Investments in ETFs are also subject to index-tracking risk because the total return generated by the securities will be reduced by transaction costs and expenses not incurred by the indices. Certain securities comprising the index tracked by an ETF may, from time to time, temporarily be unavailable, which may further impede the ETF’s ability to track its applicable index or match the index’s performance. To the extent that the Fund invests in an ETF, the Fund incurs additional expenses because the Fund bears its pro-rata portion of such ETF’s advisory fees and operational expenses. Finally, ETF shares are also subject to the risks applicable to the underlying basket of securities. As of May 31, 2021, the Fund had 64.7% of the value of its net assets invested in ETFs.
| 8. | Contingencies and Commitments |
The Fund indemnifies the Trust’s officers and Trustees for certain liabilities that might arise from their performance of their duties to the Fund. Additionally, in the normal course of business, the Fund enters into contracts that contain a variety of representations and warranties and which provide general indemnifications. The Fund’s maximum exposure under these arrangements is unknown, as this would involve future claims that may be made against the Fund that have not yet occurred. However, based on experience, the Fund expects the risk of loss to be remote.
| 9. | Subsequent Events |
The Fund is required to recognize in the financial statements the effects of all subsequent events that provide additional evidence about conditions that existed as of the date of the Statement of Assets and Liabilities. For non-recognized subsequent events that must be disclosed to keep the financial statements from being misleading, the Fund is required to disclose the nature of the event as well as an estimate of its financial effect, or a statement that such an estimate cannot be made. Management has evaluated subsequent events through the issuance of these financial statements and has noted no such events except for the following:
On June 30, 2021, the Fund paid an ordinary income dividend of $0.0362 per share to shareholders of record on June 29, 2021.
21
| WAVELENGTH INTEREST RATE NEUTRAL FUND |
| REPORT
OF INDEPENDENT REGISTERED PUBLIC ACCOUNTING FIRM |
To the Board of Trustees of Ultimus Managers Trust
and the Shareholders of Wavelength Interest Rate Neutral Fund
Opinion on the Financial Statements
We have audited the accompanying statement of assets and liabilities of Wavelength Interest Rate Neutral Fund, a series of shares of beneficial interest in Ultimus Managers Trust (the “Fund”), including the schedule of investments and schedule of futures contracts, as of May 31, 2021, and the related statement of operations for the year then ended, the statements of changes in net assets for each of the years in the two-year period then ended and the financial highlights for each of the years in the five-year period then ended, and the related notes (collectively referred to as the “financial statements”). In our opinion, the financial statements present fairly, in all material respects, the financial position of the Fund as of May 31, 2021, and the results of its operations for the year then ended, the changes in its net assets for each of the years in the two-year period then ended and its financial highlights for each of the years in the five-year period then ended, in conformity with accounting principles generally accepted in the United States of America.
Basis for Opinion
These financial statements are the responsibility of the Fund’s management. Our responsibility is to express an opinion on the Fund’s financial statements based on our audits. We are a public accounting firm registered with the Public Company Accounting Oversight Board (United States) (“PCAOB”) and are required to be independent with respect to the Fund in accordance with the U.S. federal securities law and the applicable rules and regulations of the Securities and Exchange Commission and the PCAOB.
We conducted our audits in accordance with the standards of the PCAOB. Those standards require that we plan and perform the audits to obtain reasonable assurance about whether the financial statements are free of material misstatement, whether due to error or fraud. The Fund is not required to have, nor were we engaged to perform, an audit of its internal control over financial reporting. As part of our audits, we are required to obtain an understanding of internal control over financial reporting but not for the purpose of expressing an opinion on the effectiveness of the Fund’s internal control over financial reporting. Accordingly, we express no such opinion.
Our audits included performing procedures to assess the risk of material misstatement of the financial statements, whether due to error or fraud, and performing procedures that respond to those risks. Such procedures included examining, on a test basis, evidence regarding the amounts and disclosures in the financial statements. Our procedures included confirmation of securities owned as of May 31, 2021 by correspondence with the custodian and brokers. Our
22
| WAVELENGTH INTEREST RATE NEUTRAL FUND |
| REPORT
OF INDEPENDENT REGISTERED PUBLIC ACCOUNTING FIRM (Continued) |
audits also included evaluating the accounting principles used and significant estimates made by management, as well as evaluating the overall presentation of the financial statements. We believe that our audits provide a reasonable basis for our opinion.
BBD, LLP
We have served as the auditor of one or more of the Funds in the Ultimus Managers Trust since 2013.
Philadelphia, Pennsylvania
July 23, 2021
23
| WAVELENGTH INTEREST RATE NEUTRAL FUND |
| ABOUT YOUR FUND’S EXPENSES (Unaudited) |
We believe it is important for you to understand the impact of costs on your investment. As a shareholder of the Fund, you incur ongoing costs, including management fees and other operating expenses. The following examples are intended to help you understand your ongoing costs (in dollars) of investing in the Fund and to compare these costs with the ongoing costs of investing in other mutual funds.
A mutual fund’s ongoing costs are expressed as a percentage of its average net assets. This figure is known as the expense ratio. The expenses in the table below are based on an investment of $1,000 made at the beginning of the most recent period (December 1, 2020) and held until the end of the period (May 31, 2021).
The table below illustrates the Fund’s ongoing costs in two ways:
Actual fund return – This section helps you to estimate the actual expenses that you paid over the period. The “Ending Account Value” shown is derived from the Fund’s actual return, and the third column shows the dollar amount of operating expenses that would have been paid by an investor who started with $1,000 in the Fund. You may use the information here, together with the amount you invested, to estimate the expenses that you paid over the period.
To do so, simply divide your account value by $1,000 (for example, an $8,600 account value divided by $1,000 = 8.6), then multiply the result by the number given for the Fund under the heading “Expenses Paid During Period.”
Hypothetical 5% return – This section is intended to help you compare the Fund’s ongoing costs with those of other mutual funds. It assumes that the Fund had an annual return of 5% before expenses during the period shown, but that the expense ratio is unchanged. In this case, because the return used is not the Fund’s actual return, the results do not apply to your investment. The example is useful in making comparisons because the U.S. Securities and Exchange Commission (the “SEC”) requires all mutual funds to calculate expenses based on a 5% return. You can assess the Fund’s ongoing costs by comparing this hypothetical example with the hypothetical examples that appear in shareholder reports of other funds.
Note that expenses shown in the table are meant to highlight and help you compare ongoing costs only. The Fund does not charge transaction fees, such as purchase or redemption fees, nor does it carry a “sales load.”
The calculations assume no shares were bought or sold during the period. Your actual costs may have been higher or lower, depending on the amount of your investment and the timing of any purchases or redemptions.
24
| WAVELENGTH INTEREST RATE NEUTRAL FUND |
| ABOUT YOUR FUND’S EXPENSES (Unaudited) |
More information about the Fund’s expenses can be found in this report. For additional information on operating expenses and other shareholder costs, please refer to the Fund’s prospectus.
| Beginning | Ending | Expenses | ||||
| Account Value | Account Value | Paid During | ||||
| December 1, 2020 | May 31, 2021 | Period* | ||||
| Based on Actual Fund Return | $1,000.00 | $1,017.90 | $4.98 | |||
| Based on Hypothetical 5% Return (before expenses) | $1,000.00 | $1,020.00 | $4.99 |
| * | Expenses are equal to the Fund’s annualized net expense ratio of 0.99% for the period, multiplied by the average account value over the period, multiplied by 182/365 (to reflect the one-half year period). |
| OTHER INFORMATION (Unaudited) |
A description of the policies and procedures that the Fund uses to vote proxies relating to portfolio securities is available without charge upon request by calling toll- free 1-866-896-9292, or on the SEC’s website at www.sec.gov. Information regarding how the Fund voted proxies relating to portfolio securities during the most recent 12-month period ended June 30 is available without charge upon request by calling toll-free 1-866-896-9292, or on the SEC’s website at www.sec.gov. The Trust files a complete listing of portfolio holdings for the Fund with the SEC as of the end of the first and third quarters of each fiscal year as an exhibit to its reports on Form N-PORT. These filings are available upon request by calling 1-866-896-9292. Furthermore, you may obtain a copy of the filings on the SEC’s website at www.sec.gov.
| FEDERAL TAX INFORMATION (Unaudited) |
For the fiscal year ended May 31, 2021, the Fund designated $410,233 as long-term capital gain distributions and $108,171 as tax-exempt income distributions.
25
| WAVELENGTH INTEREST RATE NEUTRAL FUND |
| BOARD OF TRUSTEES AND EXECUTIVE OFFICERS (Unaudited) |
The Board has overall responsibility for management of the Trust’s affairs. The Trustees serve during the lifetime of the Trust and until its termination, or until death, resignation, retirement, or removal. The Trustees, in turn, elect the officers of the Fund to actively supervise their day-to-day operations. The officers have been elected for an annual term. Each Trustee’s and officer’s address is 225 Pictoria Drive, Suite 450, Cincinnati, Ohio 45246. The following are the Trustees and executive officers of the Fund:
| Directorships | |||||
| Number | of Public | ||||
| of Funds | Companies | ||||
| Length | Principal | in Trust | Held by | ||
| Name and | of Time | Position(s) | Occupation(s) | Overseen by | Trustee During |
| Year of Birth | Served | Held with Trust | During Past 5 Years | Trustee | Past 5 Years |
| Interested Trustees: | |||||
| David
R. Carson* Year of Birth: 1958 |
Since 2013 |
Trustee and Vice President (January 2021 to present)
Principal Executive Officer (April 2017 to January 2021)
President
(October 2013 to present) |
SVP, Client Strategies of Ultimus Fund Solutions, LLC (2013 to present); President, Unified Series Trust (2016 to present) and Trustee (2020 to present); President, Centaur Mutual Funds Trust (2018 to present); Chief Compliance Officer, FSI Low Beta Absolute Return Fund (2013 to 2016) | 15 | Interested Trustee of Unified Series Trust (25 funds) |
| Independent Trustees: | |||||
| Janine
L. Cohen Year of Birth: 1952 |
Since January 2016 | Chairperson (October 2019 to present)
Trustee (January 2016 to present) |
Retired (2013) financial services executive | 15 | None |
26
| WAVELENGTH INTEREST RATE NEUTRAL FUND |
| BOARD OF TRUSTEES AND EXECUTIVE OFFICERS (Unaudited) (Continued) |
| Directorships | |||||
| Number | of Public | ||||
| of Funds | Companies | ||||
| Length | Principal | in Trust | Held by | ||
| Name and | of Time | Position(s) | Occupation(s) | Overseen by | Trustee During |
| Year of Birth | Served | Held with Trust | During Past 5 Years | Trustee | Past 5 Years |
| Independent Trustees (Continued): | |||||
| David
M. Deptula Year of Birth: 1958 |
Since June 2012 | Trustee | Vice President of Legal and Special Projects at Dayton Freight Lines, Inc. since 2016; Vice President of Tax Treasury at The Standard Register Inc. (formerly The Standard Register Company) from 2011 to 2016 | 15 | None |
| Robert
E. Morrison Year of Birth: 1957 |
Since June 2019 | Trustee | Senior Vice President and National Practice Lead for Investment, Huntington National Bank/Huntington Private Bank (2014 to present) | 15 | None |
| Clifford
N. Schireson Year of Birth: 1953 |
Since June 2019 | Trustee | Founder of Schireson Consulting, LLC (2017 to present); Director of Institutional Services for Brandes Investment Partners, LP (2004-2017) | 15 | Trustee of the San Diego City Employees’ Retirement System (2019 to present) |
| Jacqueline
A. Williams Year of Birth: 1954 |
Since June 2019 | Trustee | Managing Member of Custom Strategy Consulting, LLC (2017 to present); Managing Director of Global Investment Research (2005 to 2017), Cambridge Associates, LLC | 15 | None |
| * | Mr. Carson is considered an “interested person” of the Trust within the meaning of Section 2(a)(19) of the Investment Company Act of 1940, as amended, because of his relationship with the Trust’s administrator and transfer agent. |
27
| WAVELENGTH INTEREST RATE NEUTRAL FUND |
| BOARD OF TRUSTEES AND EXECUTIVE OFFICERS (Unaudited) (Continued) |
| Name
and Year of Birth |
Length of Time Served |
Position(s) Held with Trust |
Principal Occupation(s) During Past 5 Years |
| Executive Officers: | |||
| Todd
E. Heim Year of Birth: 1967 |
Since 2014 | Principal Executive Officer and President (January 2021 to present)
Vice President (2014-2021) |
VP, Relationship Management of Ultimus Fund Solutions, LLC (2018 to present); Client Implementation Manager and AVP of Ultimus Fund Solutions, LLC (2014 to 2018); Naval Flight Officer in the United States Navy (May 1989 to June 2017) |
| Jennifer
L. Leamer Year of Birth: 1976 |
Since 2014 | Treasurer (October 2014 to present)
Assistant Treasurer (April 2014 to October 2014) |
SVP, Fund Accounting of Ultimus Fund Solutions, LLC (2014 to present) |
| Daniel
D. Bauer Year of Birth: 1977 |
Since 2016 | Assistant Treasurer (April 2016 to present) | AVP, Fund Accounting (September 2015 to present) of Ultimus Fund Solutions, LLC |
| David
K. James Year of Birth: 1970 |
Since 2021 | Secretary (July 2021 to present) | EVP, Chief Legal and Risk Officer of Ultimus Fund Solutions, LLC (2018 to present); Managing Director and Managing Counsel at State Street Bank and Trust Company (2009 to 2018) |
| Natalie
S. Anderson Year of Birth: 1975 |
Since 2016 | Assistant Secretary (April 2016 to present) | Manager, Legal Administration (July 2016 to present) and Paralegal (January 2015 to June 2016) of Ultimus Fund Solutions, LLC |
| Gweneth
K. Gosselink Year of Birth: 1955 |
Since 2020 | Chief Compliance Officer (January 2020 to present) | AVP, Compliance Officer of Ultimus Fund Solutions, LLC (December 2019 to present); CCO Consultant at GKG Consulting, LLC (December 2019 to present); Chief Operating Office and CCO at Miles Capital, Inc. (June 2013 to December 2019) |
28
| WAVELENGTH INTEREST RATE NEUTRAL FUND |
| BOARD OF TRUSTEES AND EXECUTIVE OFFICERS (Unaudited) (Continued) |
| Name
and Year of Birth |
Length of Time Served |
Position(s) Held with Trust |
Principal Occupation(s) During Past 5 Years |
| Executive Officers (Continued): | |||
| Martin
R. Dean Year of Birth: 1963 |
Since 2016 | Assistant Chief Compliance Officer (January 2020 to present)
Interim Chief Compliance Officer (October 2019 to January 2020)
Assistant Chief Compliance Officer (January 2016 to 2017) |
SVP of Fund Compliance of Ultimus Fund Solutions, LLC (2016 to present) |
Additional information about members of the Board and executive officers is available in the Fund’s Statement of Additional Information (“SAI”). To obtain a free copy of the SAI, please call 1-866-896-9292.
29
WAVELENGTH-AR-21
| (b) | Not applicable |
| Item 2. | Code of Ethics. |
As of the end of the period covered by this report, the registrant has adopted a code of ethics that applies to the registrant’s principal executive officer, principal financial officer, principal accounting officer or controller, or persons performing similar functions, regardless of whether these individuals are employed by the registrant or a third party. Pursuant to Item 12(a)(1), a copy of registrant’s code of ethics is filed as an exhibit to this Form N-CSR. During the period covered by this report, the code of ethics has not been amended, and the registrant has not granted any waivers, including implicit waivers, from the provisions of the code of ethics.
| Item 3. | Audit Committee Financial Expert. |
The registrant’s board of trustees has determined that the registrant has at least one audit committee financial expert serving on its audit committee. The name of the audit committee financial expert is Janine L. Cohen. Ms. Cohen is “independent” for purposes of this Item.
| Item 4. | Principal Accountant Fees and Services. |
| (a) | Audit Fees. The aggregate fees billed for professional services rendered by the principal accountant for the audit of the registrant’s annual financial statements or for services that are normally provided by the accountant in connection with statutory and regulatory filings or engagements were $64,500 and $52,000 with respect to the registrant’s fiscal years ended May 31, 2021 and 2020, respectively. |
| (b) | Audit-Related Fees. No fees were billed in either of the last two fiscal years for assurance and related services by the principal accountant that are reasonably related to the performance of the audit of the registrant’s financial statements and are not reported under paragraph (a) of this Item. |
| (c) | Tax Fees. The aggregate fees billed for professional services rendered by the principal accountant for tax compliance, tax advice, and tax planning were $15,000 and $12,000 with respect to the registrant’s fiscal years ended May 31, 2021 and 2020, respectively. The services comprising these fees are the preparation of the registrant’s federal income and excise tax returns. |
| (d) | All Other Fees. No fees were billed in either of the last two fiscal years for products and services provided by the principal accountant, other than the services reported in paragraphs (a) through (c) of this Item. |
| (e)(1) | The audit committee has not adopted pre-approval policies and procedures described in paragraph (c)(7) of Rule 2-01 of Regulation S-X. |
| (e)(2) | None of the services described in paragraph (b) through (d) of this Item were approved by the audit committee pursuant to paragraph (c)(7)(i)(C) of Rule 2-01 of Regulation S-X. |
| (f) | Less than 50% of hours expended on the principal accountant’s engagement to audit the registrant’s financial statements for the most recent fiscal year were attributed to work performed by persons other than the principal accountant’s full-time, permanent employees. |
| (g) | During the fiscal years ended May 31, 2021 and 2020, aggregate non-audit fees of $15,000 and $12,000, respectively, were billed by the registrant’s accountant for services rendered to the registrant. No non-audit fees were billed in either of the last two fiscal years by the registrant’s accountant for services rendered to the registrant’s investment adviser (not including any sub-adviser whose role is primarily portfolio management and is subcontracted with or overseen by another investment adviser), and any entity controlling, controlled by, or under common control with the adviser that provides ongoing services to the registrant. |
| (h) | The principal accountant has not provided any non-audit services to the registrant’s investment adviser (not including any sub-adviser whose role is primarily portfolio management and is subcontracted with or overseen by another investment adviser), and any entity controlling, controlled by, or under common control with the investment adviser that provides ongoing services to the registrant. |
| Item 5. | Audit Committee of Listed Registrants. |
Not applicable
| Item 6. | Schedule of Investments. |
| (a) | Not applicable [schedule filed with Item 1] |
| (b) | Not applicable |
| Item 7. | Disclosure of Proxy Voting Policies and Procedures for Closed-End Management Investment Companies. |
Not applicable
| Item 8. | Portfolio Managers of Closed-End Management Investment Companies. |
Not applicable
| Item 9. | Purchases of Equity Securities by Closed-End Management Investment Company and Affiliated Purchasers. |
Not applicable
Item 10. Submission of Matters to a Vote of Security Holders.
The registrant’s Committee of Independent Trustees shall review shareholder recommendations to fill vacancies on the registrant’s board of trustees if such recommendations are submitted in writing, addressed to the Committee at the registrant’s offices and meet any minimum qualifications adopted by the Committee. The Committee may adopt, by resolution, a policy regarding its procedures for considering candidates for the board of trustees, including any recommended by shareholders.
| Item 11. | Controls and Procedures. |
(a) Based on their evaluation of the registrant’s disclosure controls and procedures (as defined in Rule 30a-3(c) under the Investment Company Act of 1940) as of a date within 90 days of the filing date of this report, the registrant’s principal executive officer and principal financial officer have concluded that such disclosure controls and procedures are reasonably designed and are operating effectively to ensure that material information relating to the registrant, including its consolidated subsidiaries, is made known to them by others within those entities, particularly during the period in which this report is being prepared, and that the information required in filings on Form N-CSR is recorded, processed, summarized, and reported on a timely basis.
(b) There were no changes in the registrant’s internal control over financial reporting (as defined in Rule 30a-3(d) under the Investment Company Act of 1940) that occurred during the period covered by this report that have materially affected, or are reasonably likely to materially affect, the registrant’s internal control over financial reporting.
Item 12. Disclosure of Securities Lending Activities for Closed-End Management Investment Companies.
Not applicable
| Item 13. | Exhibits. |
File the exhibits listed below as part of this Form. Letter or number the exhibits in the sequence indicated.
(a)(1) Any code of ethics, or amendment thereto, that is the subject of the disclosure required by Item 2, to the extent that the registrant intends to satisfy the Item 2 requirements through filing of an exhibit: Attached hereto
(a)(2) A separate certification for each principal executive officer and principal financial officer of the registrant as required by Rule 30a-2(a) under the Act (17 CFR 270.30a-2(a)): Attached hereto
(a)(3) Any written solicitation to purchase securities under Rule 23c-1 under the Act (17 CFR 270.23c-1) sent or given during the period covered by the report by or on behalf of the registrant to 10 or more persons: Not applicable
(a)(4) Change in the registrant’s independent public accountants: Not applicable
(b) Certifications required by Rule 30a-2(b) under the Act (17 CFR 270.30a-2(b)): Attached hereto
Exhibit 99.CODE ETH Code of Ethics
Exhibit 99.CERT Certifications required by Rule 30a-2(a) under the Act
Exhibit 99.906CERT Certifications required by Rule 30a-2(b) under the Act
SIGNATURES
Pursuant to the requirements of the Securities Exchange Act of 1934 and the Investment Company Act of 1940, the registrant has duly caused this report to be signed on its behalf by the undersigned, thereunto duly authorized.
| (Registrant) | Ultimus Managers Trust | |||
| By (Signature and Title)* | /s/ David K. James | |||
| David K. James, Secretary | ||||
| Date | August 3, 2021 | |||
| Pursuant to the requirements of the Securities Exchange Act of 1934 and the Investment Company Act of 1940, this report has been signed below by the following persons on behalf of the registrant and in the capacities and on the dates indicated. | ||||
| By (Signature and Title)* | /s/ Todd E. Heim | |||
| Todd E. Heim, Principal Executive Officer | ||||
| Date | August 3, 2021 | |||
| By (Signature and Title)* | /s/ Jennifer L. Leamer | |||
| Jennifer L. Leamer, Treasurer and Principal Financial Officer | ||||
| Date | August 3, 2021 | |||
* Print the name and title of each signing officer under his or her signature.
EX-99.CERT
CERTIFICATIONS
I, Todd E. Heim, certify that:
1. I have reviewed this report on Form N-CSR of Ultimus Managers Trust:
2. Based on my knowledge, this report does not contain any untrue statement of a material fact or omit to state a material fact necessary to make the statements made, in light of the circumstances under which such statements were made, not misleading with respect to the period covered by this report;
3. Based on my knowledge, the financial statements, and other financial information included in this report fairly present in all material respects the financial condition, results of operations, changes in net assets and cash flows (if the financial statements are required to include a statement of cash flows) of the registrant as of, and for, the periods presented in this report;
4. The registrant’s other certifying officer(s) and I are responsible for establishing and maintaining disclosure controls and procedures (as defined in Rule 30a-3(c) under the Investment Company Act of 1940) and internal control over financial reporting (as defined in Rule 30a-3(d) under the Investment Company Act of 1940) for the registrant and have:
(a) Designed such disclosure controls and procedures, or caused such disclosure controls and procedures to be designed under our supervision, to ensure that material information relating to the registrant, including its consolidated subsidiaries, is made known to us by others within those entities, particularly during the period in which this report is being prepared;
(b) Designed such internal control over financial reporting, or caused such internal control over financial reporting to be designed under our supervision, to provide reasonable assurance regarding the reliability of financial reporting and the preparation of financial statements for external purposes in accordance with generally accepted accounting principles;
(c) Evaluated the effectiveness of the registrant’s disclosure controls and procedures and presented in this report our conclusions about the effectiveness of the disclosure controls and procedures, as of a date within 90 days prior to the filing date of this report, based on such evaluation; and
(d) Disclosed in this report any change in the registrant’s internal control over financial reporting that occurred during the period that has materially affected, or is reasonably likely to materially affect, the registrant’s internal control over financial reporting; and
5. The registrant’s other certifying officer(s) and I have disclosed to the registrant’s auditors and the audit committee of the registrant’s board of directors (or persons performing the equivalent functions):
(a) All significant deficiencies and material weaknesses in the design or operation of internal control over financial reporting which are reasonably likely to adversely affect the registrant’s ability to record, process, summarize, and report financial information; and
(b) Any fraud, whether or not material, that involves management or other employees who have a significant role in the registrant’s internal control over financial reporting.
| Date: August 3, 2021 | /s/ Todd E. Heim | |
| Todd E. Heim, Principal Executive Officer |
EX-99.CERT
CERTIFICATIONS
I, Jennifer L. Leamer, certify that:
1. I have reviewed this report on Form N-CSR of Ultimus Managers Trust:
2. Based on my knowledge, this report does not contain any untrue statement of a material fact or omit to state a material fact necessary to make the statements made, in light of the circumstances under which such statements were made, not misleading with respect to the period covered by this report;
3. Based on my knowledge, the financial statements, and other financial information included in this report fairly present in all material respects the financial condition, results of operations, changes in net assets and cash flows (if the financial statements are required to include a statement of cash flows) of the registrant as of, and for, the periods presented in this report;
4. The registrant’s other certifying officer(s) and I are responsible for establishing and maintaining disclosure controls and procedures (as defined in Rule 30a-3(c) under the Investment Company Act of 1940) and internal control over financial reporting (as defined in Rule 30a-3(d) under the Investment Company Act of 1940) for the registrant and have:
(a) Designed such disclosure controls and procedures, or caused such disclosure controls and procedures to be designed under our supervision, to ensure that material information relating to the registrant, including its consolidated subsidiaries, is made known to us by others within those entities, particularly during the period in which this report is being prepared;
(b) Designed such internal control over financial reporting, or caused such internal control over financial reporting to be designed under our supervision, to provide reasonable assurance regarding the reliability of financial reporting and the preparation of financial statements for external purposes in accordance with generally accepted accounting principles;
(c) Evaluated the effectiveness of the registrant’s disclosure controls and procedures and presented in this report our conclusions about the effectiveness of the disclosure controls and procedures, as of a date within 90 days prior to the filing date of this report, based on such evaluation; and
(d) Disclosed in this report any change in the registrant’s internal control over financial reporting that occurred during the period that has materially affected, or is reasonably likely to materially affect, the registrant’s internal control over financial reporting; and
5. The registrant’s other certifying officer(s) and I have disclosed to the registrant’s auditors and the audit committee of the registrant’s board of directors (or persons performing the equivalent functions):
(a) All significant deficiencies and material weaknesses in the design or operation of internal control over financial reporting which are reasonably likely to adversely affect the registrant’s ability to record, process, summarize, and report financial information; and
(b) Any fraud, whether or not material, that involves management or other employees who have a significant role in the registrant’s internal control over financial reporting.
| Date: August 3, 2021 | /s/ Jennifer L. Leamer | |
| Jennifer L. Leamer, Treasurer and Principal Financial Officer |
EX-99.906CERT
CERTIFICATIONS
Todd E. Heim, Principal Executive Officer, and Jennifer L. Leamer, Principal Financial Officer, of Ultimus Managers Trust (the “Registrant”), each certify to the best of his/her knowledge that:
| 1. | The Registrant’s periodic report on Form N-CSR for the period ended May 31, 2021 (the “Form N-CSR”) fully complies with the requirements of section 13(a) or section 15(d) of the Securities Exchange Act of 1934, as amended; and |
| 2. | The information contained in the Form N-CSR fairly presents, in all material respects, the financial condition and results of operations of the Registrant. |
| PRINCIPAL EXECUTIVE OFFICER | PRINCIPAL FINANCIAL OFFICER | ||
| Ultimus Managers Trust | Ultimus Managers Trust | ||
| /s/ Todd E. Heim | /s/ Jennifer L. Leamer | ||
| Todd E. Heim, Principal Executive Officer | Jennifer L. Leamer, Treasurer and Principal Financial Officer | ||
| Date: August 3, 2021 | Date: August 3, 2021 |
A signed original of this written statement required by Section 906, or other document authenticating, acknowledging or otherwise adopting the signature that appears in typed form within the electronic version of this written statement required by Section 906, has been provided to Ultimus Managers Trust and will be retained by Ultimus Managers Trust and furnished to the Securities and Exchange Commission or its staff upon request.
This certification is being furnished to the Securities and Exchange Commission solely pursuant to 18 U.S.C. 1350 and is not being filed as part of the Form N-CSR filed with the Commission.
ULTIMUS MANAGERS TRUST

CODE OF ETHICS
Effective: April 23, 2018


| 1 |
CODE OF ETHICS
Rule 17j-1 under the Investment Company Act of 1940 (the “1940 Act”) addresses conflicts of interest that arise from personal trading activities of investment company personnel. In particular, Rule 17j-1 prohibits fraudulent, deceptive or manipulative acts by such personnel in connection with their personal transactions in securities held or to be acquired by the investment company. The Rule also requires an investment company to adopt a code of ethics containing provisions reasonably necessary to prevent fraudulent, deceptive or manipulative acts and requires certain persons to report their personal securities transactions to the investment company.
This Code of Ethics has been adopted by the Board of Trustees of Ultimus Managers Trust (the “Trust”). It is based on the principle that the trustees and officers of the Trust owe a fiduciary duty to the Trust’s shareholders to conduct their affairs, including their personal securities transactions, in such a manner as to avoid (1) serving their own personal interests ahead of the shareholders, (2) taking advantage of their position, and (3) any actual or potential conflicts of interest.
| 1. | Definitions |
As used in this Code of Ethics, the following terms shall have the following meanings:
| Ø | “Access person” shall mean any trustee or officer of the Trust. It shall also mean any consultant to the Trust or trustees who has access to the same information as a trustee or officer of the Trust. |
| Ø | “Adviser” shall mean an investment adviser and/or sub-advisor to a series of the Trust. |
| Ø | “Automatic Investment Plan” means a program in which regular periodic purchases (or withdrawals) are made automatically in (or from) investment accounts in accordance with a predetermined schedule and allocation. An Automatic Investment Plan includes a dividend reinvestment plan. |
| Ø | “Beneficial ownership” shall have the same meaning as in Rule 16a-1(a)(2) for the purposes of Section 16 of the Securities Exchange Act of 1934. Generally, a person is considered the beneficial owner of securities if the person has a pecuniary interest in the securities and includes securities held by members of the person’s immediate family1 sharing the same household, or other persons if, by reason of any contract, understanding, relationship, agreement or other arrangement, the person obtains from such securities benefits substantially equivalent to those of ownership. |
| Ø | “Disinterested person” shall mean a trustee of the Trust who is not an “interested person” of the Trust within the meaning of Section 2(a)(19) of the 1940 Act (a “Independent Trustee”) and any consultant to the Trust or the trustees to the extent the consultant’s access to information regarding the Trust and any series of the Trust is limited to the same information as an Independent Trustee. |
| Ø | “Investment Personnel of a Fund or of a Fund's investment adviser” means: (a) Any employee of the Fund or investment adviser (or of any company in a control relationship to the Fund or investment adviser) who, in connection with his or her regular functions or duties, makes or participates in making recommendations regarding the purchase or sale of securities by the Fund, or (b) Any natural person who controls the Fund or Adviser and who obtains information concerning recommendations made to the Fund regarding the purchase or sale of securities by the Fund. |
| 2 |
| Ø | “Fund” shall each existing and future series established by the Trust. |
| Ø | “Security” shall have the same meaning set forth in Section 2(a)(36) of the 1940 Act, except that it shall not include: shares of any registered open-end investment company (other than the Fund or any exchange-traded fund); direct obligations of the U.S. Government; bankers’ acceptances; bank certificates of deposit; commercial paper; and high-quality short-term debt instruments, including repurchase agreements. |
| Ø | A “security held or to be acquired by the Fund” shall mean (1) any security which, within the most recent fifteen (15) days, is or has been held by the Fund or is being or has been considered by the Fund or the Adviser for purchase by the Fund, or (2) any option to purchase or sell, and any security convertible into or exchangeable for, any such security. |
| Ø | “Transaction” shall mean any purchase, sale or any type of acquisition or disposition of securities, including the writing of an option to purchase or sell securities. |
| 2. | Prohibition on Certain Actions |
Trustees and officers of the Trust shall not, in connection with the purchase or sale, directly or indirectly, by such person of a security held or to be acquired by a Fund:
| Ø | Employ any device, scheme or artifice to defraud the Fund; |
| Ø | Make any untrue statement of a material fact to the Trust or to omit to state a |
material fact necessary in order to make the statements made to the Trust, in light of
the circumstances under which they are made, not misleading;
| Ø | Engage in any act, practice or course of business that operates or would operate as a fraud or deceit on the Fund; or |
| Ø | Engage in any manipulative practice with respect to the Fund. |
| 3. | Code of Ethics of Adviser and Distributor |
All trustees and officers of the Trust who are also directors, officers or employees of the Adviser or Distributor are subject to the Code of Ethics of the Adviser or the Distributor, as applicable, each of which is incorporated by reference herein. Such trustees and officers of the Trust will fulfill their reporting obligations of this Code of Ethics by following the reporting requirements of the Distributor’s or Adviser’s Code of Ethics, as applicable.
| 4. | Quarterly Reporting of Securities Transactions |
Each trustee and officer, other than a Disinterested person, shall file with the Chief Compliance Officer of the Trust (or his or her designee) no later than ten (10) days after the end of each calendar quarter, all personal transactions in securities for that quarter. All reports will be reviewed by the Chief Compliance Officer of the Trust. A Disinterested person shall be required to file such reports only with respect to transactions where such person knows, or in the course of fulfilling his or her duties should have known, that during the 15-day period immediately preceding or following the date of a transaction in a security by the person such security was purchased or sold by the Fund or the purchase or sale of the security by the Fund is or was considered by the Fund or the Adviser. A trustee or officer need not make these reports if the report would duplicate information contained in broker trade confirmations or account statements actually received by the Chief Compliance Officer
| 3 |
of the Trust with respect to the trustee or officer in the required time period, if all of the information required is contained in the broker trade confirmations or account statements or in the records of the Trust or the Adviser. An access person need not make a quarterly report with respect to transactions effected pursuant to an Automatic Investment Plan.
| 5. | Initial and Annual Reporting of Holdings |
Each trustee and officer, other than a Disinterested person, shall file with the Chief Compliance Officer of the Trust, no later than ten (10) days after he or she becomes a trustee or officer, an initial holdings report listing all securities (which information must be current as of a date no more than 45 days prior to the date the person becomes an Access Person) beneficially owned by such person as of the date he or she became a trustee or officer. On an annual basis, not later than January 30 of each year, each trustee and officer, other than a Disinterested person, shall file with the Chief Compliance Officer of the Trust, certification of compliance with this Code of Ethics which report shall also include a listing all securities beneficially owned by such person; such report must be current as of a date no more than thirty (30) days before the report is submitted. Any such initial or annual report shall set forth the following information: (1) the title, number of shares and principal amount of each security in which the trustee or officer had any direct or indirect beneficial ownership; (2) the name of any broker, dealer or bank which maintains an account in which any securities of which the trustee or officer has or had direct or indirect beneficial ownership were held; and (3) the date that the report is submitted. A trustee or officer need not make these reports if the report would duplicate information contained in broker trade confirmations or account statements actually received by the Chief Compliance Officer of the Trust with respect to the trustee or officer in the required time period, if all of the information required under this Section 5 is contained in the broker trade confirmations or account statements or in the records of the Trust or the Adviser.
| 6. | Disclaimer of Beneficial Ownership |
A trustee or officer may include in any report required under Sections 4 or 5, a disclaimer as to the beneficial ownership in any securities covered by the report.
| 7. | Review of Reports; Sanctions |
The Chief Compliance Officer of the Trust shall review the reports required under this Code and shall report violations of the Code at least quarterly to the Board of Trustees. If any trustee or officer violates any provisions set forth in this Code of Ethics, the Board of Trustees shall impose such sanctions as it deems appropriate including, but not limited to, a letter of censure or termination of employment, censure, fines, or to the extent possible freezing of one’s personal account or securities in that account for a specified time frame.
| 8. | Reporting to Board of Trustees |
(a.) At least once each year, the Chief Compliance Officer of the Trust shall provide the Board of Trustees with a written report that (1) describes issues that arose during the previous year under this Code of Ethics including, but not limited to, information about material violations and sanctions imposed in response to those material violations, and (2) certifies to the Board of Trustees that the Trust has adopted procedures reasonably necessary to prevent its Access Persons from violating this Code of Ethics.
| 4 |
(b.) At least once each year, the Chief Compliance Officer of the Trust shall provide the Board of Trustees with a written report from the Trust’s Advisers that (1) describes any issues arising under each Advisers’ code of ethics since the last report to the board of trustees, including, but not limited to, information about material violations of the code and sanctions imposed in response to the material violations, and (2) certifies that each Adviser has adopted procedures reasonably necessary to prevent access persons from violating its codes of ethics.
(c.) At least once each year, the Chief Compliance Officer of the Trust shall provide the Board of Trustees with a written report from the Trust’s Distributor that (1) describes any issues arising under the Distriubutor’s code of ethics since the last report to the board of trustees, including, but not limited to, information about material violations of the code and sanctions imposed in response to the material violations, and (2) certifies that the Trust’s Distributor has adopted procedures reasonably necessary to prevent access persons from violating its codes of ethics.
| 9. | Notification of Reporting Obligation |
The Chief Compliance Officer of the Trust shall identify all persons who are required to make the reports required under Sections 4 and 5 and shall inform those persons of their reporting obligation. Each Access Person of the Trust shall be required to acknowledge that he or she has received a copy of, has read and fully understands and will comply with, this Code of Ethics.
| 10. | Restrictions on Trading |
Investment Personnel of a Fund or its Adviser must obtain approval from the Chief Compliance Officer of the Trust or the Chief Compliance Officer of the Fund’s Adviser before directly or indirectly acquiring beneficial ownership in any securities in: (A) an offering of securities registered under the Securities Act of 1933, the issuer of which, immediately before the registration, was not subject to SEC reporting obligations under the 1934 Act; or (B) an offering that is exempt from registration under the Securities Act of 1933 pursuant to section 4(2) or section 4(6) or pursuant to rule 504, rule 505, or rule 506 under the Securities Act of 1933.
| 11. | Retention of Records |
The Trust shall maintain the following records, for the time periods and in the manner set forth below, at its principal place of business:
| Ø | A copy of this Code of Ethics and each code of ethics previously in effect for the Trust at any time within the past five years, must be maintained in an easily accessible place. |
| Ø | A record of any violation of the Trust’s Code of Ethics, and any action taken as a result of the violation, must be maintained in an easily accessible place for at least five years after the end of the fiscal year in which the violation occurs. |
| Ø | A copy of each report required to be made by an officer or trustee pursuant to this Code of Ethics must be maintained for at least five years after the end of the fiscal year in which the report is made, the first two years in an easily accessible place. |
| Ø | A record of all persons, currently or within the past five years, who are or were required to make reports under Sections 4 and 5, or who are or were responsible for reviewing these reports, must be maintained in an easily accessible place. |
| 5 |
| Ø | A copy of each report required to be made by the Chief Compliance Officer of the Trust to the Board of Trustees pursuant to Section 8 must be maintained for at least five years after the end of the fiscal year in which the report is made, the first two years in an easily accessible place. |
| Ø | A record of any decision, and the reasons supporting the decision, to approve the acquisition by investment personnel of securities under Section 10, for at least five years after the end of the fiscal year in which the approval is granted. |
| 6 |
Serious News for Serious Traders! Try StreetInsider.com Premium Free!
You May Also Be Interested In
- Antengene Announces One Oral and Three Poster Presentations at ASCO 2024
- Cognizant's Bluebolt Program Delivers More Than $150M in Estimated Annualized Cost Savings for Enterprises
- Alaska Airlines expands presence in Southern California with new routes and increased service to popular West Coast destinations
Create E-mail Alert Related Categories
SEC FilingsSign up for StreetInsider Free!
Receive full access to all new and archived articles, unlimited portfolio tracking, e-mail alerts, custom newswires and RSS feeds - and more!
