

Form N-CSR Trust for Advised Portfo For: Sep 30
 Tweet
Tweet Share
Share
UNITED STATES
SECURITIES AND EXCHANGE COMMISSION
Washington, D.C. 20549
FORM N-CSR
CERTIFIED SHAREHOLDER REPORT OF REGISTERED
MANAGEMENT
INVESTMENT COMPANIES
Investment Company Act file number 811-21422
Trust for Advised Portfolios
(Exact name of registrant as specified in charter)
615 East Michigan Street
Milwaukee, Wisconsin 53202
(Address of principal executive offices) (Zip code)
Russell B. Simon, President
Trust for Advised Portfolios
2020 East Financial Way, Suite 100
Glendora, CA 91741
(Name and address of agent for service)
(626) 914-7395
Registrant's telephone number, including area code
Date of fiscal year end: September 30
Date of reporting period: September 30, 2022
Item 1. Reports to Stockholders.
| (a) |

Annual Report
September 30, 2022
Miller Income Fund
Class A LMCJX
Class C LCMNX
Class FI LMCKX
Class I LMCLX
Class IS LMCMX
Table of contents
|
Miller Income Fund |
|||||||
|
Management commentary |
1 |
||||||
|
Fund at a glance |
7 |
||||||
|
Fund expenses |
8 |
||||||
|
Fund performance |
10 |
||||||
|
Schedule of investments |
11 |
||||||
|
Statement of assets and liabilities |
15 |
||||||
|
Statement of operations |
17 |
||||||
|
Statements of changes in net assets |
18 |
||||||
|
Financial highlights |
19 |
||||||
|
Notes to financial statements |
24 |
||||||
|
Report of independent registered public accounting firm |
34 |
||||||
|
Approval of Investment Advisory agreement |
36 |
||||||
|
Additional information |
39 |
||||||
|
Privacy notice |
43 |
||||||
| Directory of fund's service providers |
Back Cover |
||||||
Miller Income Fund 2022 Annual Report
Miller Income Fund manager commentary
The Miller Income Fund's I-shares returned -29.41% versus a -14.04% return for the ICE BofA US High Yield Index for the twelve-month period ending September 30. 2022. Every market environment is unique for its own reasons, but the current one is special for the severity and persistence of negative returns across asset classes, most notably the "safest" assets.
Average Annual Total Returns and Expenses (%) — as of 9/30/20221
|
Without Sales Charges |
|||||||||||||||||||
|
1 Yr |
3 Yr |
5 Yr |
Inception2 |
||||||||||||||||
|
Class A |
-29.56 |
-2.02 |
-0.20 |
1.17 |
|||||||||||||||
|
Class C |
-30.07 |
-2.75 |
-0.92 |
0.44 |
|||||||||||||||
|
Class FI |
-29.57 |
-1.91 |
-0.15 |
1.15 |
|||||||||||||||
|
Class I |
-29.41 |
-1.76 |
0.10 |
1.43 |
|||||||||||||||
|
Class IS |
-29.28 |
-1.69 |
0.18 |
1.51 |
|||||||||||||||
|
ICE BofA US High Yield Index |
-14.04 |
-0.66 |
1.41 |
2.95 |
|||||||||||||||
|
S&P 500 Index |
-15.47 |
8.16 |
9.24 |
10.03 |
|||||||||||||||
|
With Maximum Sales Charges |
|||||||||||||||||||
|
1 Yr |
3 Yr |
5 Yr |
Inception2 |
||||||||||||||||
|
Class A |
-33.59 |
-3.93 |
-1.37 |
0.47 |
|||||||||||||||
|
Class C |
-30.73 |
-2.75 |
-0.92 |
0.44 |
|||||||||||||||
1 Performance greater than one year is annualized.
2 Fund inception was on 2/28/2014
Gross (Net) Expenses (%): Class A 1.26 (1.23); Class C 2.00 (1.97); Class FI 1.38 (1.35); Class I 1.01 (0.98), Class IS 0.94 (0.91). Miller Value Partners, LLC (the "Adviser") has agreed to waive fees and/or reimburse operating expenses (other than front-end or contingent deferred loads, taxes, interest expense, brokerage commissions, acquired fund fees and expenses, expenses incurred in connection with any merger or reorganization, portfolio transaction expenses, dividends paid on short sales, extraordinary expenses such as litigation, Rule 12b-1 fees, intermediary servicing fees, or any other class-specific expenses) through January 31, 2023, so that such annual operating expenses will not exceed 0.89%, subject to recapture as described below. Separately, with respect to Class I only, the Adviser has agreed to waive fees and/or reimburse operating expenses such that the previously described annual operating expenses, plus intermediary servicing fees and other class-specific expenses, will not exceed 0.95%. Expense ratios are current to the most recent prospectus dated January 31, 2022. Net expenses are applicable to investors.
Performance shown represents past performance and is no guarantee of future results. Current performance may be higher or lower than the performance shown. Investment return and principal value will fluctuate so shares, when redeemed, may be worth more or less than the original cost. Class A shares have a maximum front end sales charge of 5.75%. Class C shares have a one-year contingent deferred sales charge (CDSC) of 1.0%. If sales charges were included, performance shown would be lower. Total returns assume the reinvestment of all distributions at net asset value and the deduction of all Fund expenses. Total return figures are based on the NAV per share applied to shareholder subscriptions and redemptions, which may differ from the NAV per share disclosed in Fund shareholder reports. Performance would have been lower if fees had not been waived in various periods. Numbers may be the same due to rounding. YTD is calculated from January 1 of the reporting year. All classes of shares may not be available to all investors or through all distribution channels. For the most recent month-end information, please call 888-593-5110 or visit millervaluefunds.com.
Miller Income Fund 2022 Annual Report
1
Miller Income Fund manager commentary (cont'd)
The Bloomberg US Aggregate Bond index is comprised of investment-grade bonds in the US with a par value outstanding of at least $100 million and with at least one year until maturity. Its holdings include everything from government debt to asset-backed securities and corporate bonds, with the effective idea being a representation of the investment-grade US bond market. Prior to this year, the index only had one occasion since inception in 1976 with three consecutive calendar quarters of negative returns — the third and fourth quarters of 1979 followed by the first quarter of 1980, causing a cumulative loss of 12.6%. The past three quarters of negative performance have eclipsed that period with a total loss of 14.6%.
The last time US bonds lost value for three consecutive quarters actually marked a multi-decade turning point for inflation and the bond bear market. Is it possible that the most recent string of unprecedented bond volatility and bad returns could mark the end of a shorter bond bear market and a broader return to the centuries-long pattern of falling interest rates? No one knows, but it seems unlikely given today's fundamental backdrop. Unemployment is still at a five-decade low, and while tightening financial conditions and an economic slowdown are contributing to a pullback in asset prices and a pause in the housing market, the US still has too little housing. Soaring mortgage costs have put an interlude in home price appreciation, but home prices are still up more over the past six months than it costs to finance a house for a full year at today's 30-year fixed rate, even after the cost has risen to a two-decade high. Recent data also show that rents have gone up at the same rate over the past twelve months as it costs to finance ownership of the asset.
Moreover, while the Fed is hiking the cost of money, the lower bound of the Federal funds target rate at the time of this writing is 3.00%, and the market expects it to go to 3.75% in two weeks. It is an oversimplified but instructive exercise to compare this cost of money to the rate at which things that cost money are going up, and it suggests the Fed could still be "behind the curve." People often criticize the Fed for being "backwards-looking" and citing trailing-twelve-month figures instead of focusing on leading indicators. However, the most up-to-date (but still trailing) information is often under-reported because of the one-month measurement interval. If you just annualize the prior three one-month readings on core PCE (personal consumption expenditures), costs have been going up by more than money costs since June of 2020, when societal responses to COVID caused unemployment to hit 13%. The most recent one-month reading (August) implies annualized inflation of 6.9%, while the trailing-three-month number implies a 5.0% inflation rate, both still well above the cost of money, meaning it still makes sense for those that can afford it to borrow and spend today instead of waiting until tomorrow, meaning that inflationary pressures may still be building.
Miller Income Fund 2022 Annual Report
2
How are we adjusting the portfolio to account for these conditions? We do not change our process based upon macroeconomic backdrops or predictions; rather, we look for yield trading at compelling prices relative to its future prospects with our base case being a growing economy, which tends to be the case most of the time. A lot of the portfolio today is in smaller-capitalization stocks, which are currently trading at historic discounts to large-caps. Today's small-cap valuation discount to the market is about the same as it was at the end of 2001, which proved to be an opportune time to buy small-caps for long-term investors. We also own a handful of opportunistic credits that we believe are underfollowed and mispriced. Our marginal focus is always on eliminating our mistakes (of which we make many) and on increasing our allocation to names where we have additional evidence suggesting we are right. A longer-term review of the fund's performance history will show that forward-looking returns have always been best after periods of poor performance, and we expect that today's net asset value will eventually prove to be a good entry point. As always, we appreciate your support and remain the largest investors in the fund.
|
Bill Miller, IV, CFA, CMT October 14, 2022 |
. |
||||||
What is the Fund's investment strategy?
The Fund seeks to provide a high level of income while maintaining potential for growth. The Fund is designed for long-term investors. The Fund's investment style is flexible and intended to generate a high level of income from a wide array of sources. The investment strategy involves identifying instances where the Adviser believes the capital markets have mispriced investment opportunities and exploiting price discrepancies and inefficiencies in the market. The ability to tactically move across asset classes and up and down the capital structure is intended to allow the Fund to access the greatest yield and valuation opportunities. The portfolio managers believe that this flexible approach will allow the Fund to maintain a high level of income while also preserving the opportunity for growth over time. The Fund may depart from its principal investment strategies in response to adverse market, economic or political conditions by taking temporary defensive positions, including by investing in any type of money market instruments, short-term debt securities or cash without regard to any percentage limitations. Although the Adviser has the ability to take defensive positions, it may choose not to do so for a variety of reasons, even during volatile market conditions. The Fund is classified as "non-diversified," which means it may invest a larger percentage of its assets in a smaller number of issuers than a diversified fund.
Miller Income Fund 2022 Annual Report
3
Miller Income Fund manager commentary (cont'd)
What were the market conditions and economic environment for the period?
While every market is characterized by certain factors, the severity and persistence of negative returns across asset classes makes this market unique. The Bloomberg US Aggregate Bond Index, widely viewed as the asset class that should outperform when "riskier" asset classes are out of favor, has returned -14.6% over the past twelve months. Prior to this year since 1976, the Index has only had three consecutive calendar quarters of negative returns one time. The broader US equity indexes are down over the last twelve months, with the S&P 500 at -15.5%, the NASDAQ 100 Index at -24.7%, and the Dow Jones Industrial Average at -13.4% over the last twelve months as of September 30, 2022.
Many factors have contributed to the negative sentiment and market volatility. Inflation peaked in June 2022 and while the Consumer Price Index has modestly decreased to just over 8%, this is still a level not seen since the early 1980s. The Federal Reserve has continued to raise rates throughout the year, with three consecutive quarters of 75 basis point hikes targeting a 3.0-3.25% range. Investor uncertainty has characterized the market's bearish tone as fears of recession dominate the news feed. The geopolitical state contributes to the uncertainty with the prolonged Russian War in Ukraine, energy price concerns in Europe, and China's zero-COVID policy stifling a return to economic growth.
Discuss investment strategies and techniques used that affected Fund performance the most.
The Fund's primary goal is to generate a high level of income while preserving the potential for capital appreciation. We aim to do this by owning securities that are not only high yielding but also undervalued. If we are correct that the price does not adequately reflect the security's potential future cash flows, we hope to capture capital appreciation on top of our yield. The Fund has a flexible mandate, enabling the managers to invest up and down the capital structure in securities with the best reward/risk opportunity. The Fund is flexible to invest in undervalued income-generating securities, regardless of sector, and offers daily liquidity.
Miller Income Fund is currently allocated 75% in income-generating equities and preferreds and 25% in fixed-income securities we believe have appreciation potential. The Fund continues to have a significant allocation to small-cap stocks, which are trading historic discounts to large-caps. For context, the current small-cap valuation discount to the market is about the same as it was at the end of 2001, which proved to be an opportune time for long-term investors to buy smaller companies. Furthermore, we own select opportunistic credits that we believe are underfollowed and mispriced. We believe our focus on bottom-up,
Miller Income Fund 2022 Annual Report
4
long-term, company specific fundamentals will serve our investors well over a long-term investment horizon.
Describe portfolio activity over the period.
Miller Income Fund's turnover for the 12-month period ending September 30, 2022 was 59.4%, compared to 65.0% for the previous period. We initiated 24 new positions and eliminated 28 positions during the year. As of September 30, 2022, the Fund had 38 holdings.
Describe portfolio positioning at period end.
As of September 30, 2022, the Fund is positioned 60% in equities, 25% in Fixed Income, 10% in Real Estate, 4% in Publicly Traded Partnerships, and 1% in Preferred Equity. The Fund's top ten holdings by issuer comprises 47.1% of the portfolio compared to 46.5% in the prior year.
The ICE BofA US High Yield Index tracks the performance of below-investment grade, but not in default, U.S. dollar-denominated corporate bonds publicly issued in the U.S. domestic market, and includes issues with a credit rating of BBB or below, as rated by Moody's and S&P. The Bloomberg US Aggregate Bond Index is a broad-based flagship benchmark that measures the investment grade, US dollar-dominated, fixed-rate taxable bond market. The index includes Treasuries, government-related and corporate securities, MBS (agency fixed-rate pass-throughs), ABS and CMBS (agency and non-agency). The CPI (Consumer Price Index) is a measure of the average change over time in the prices paid for a market basket of consumer goods and services. The Dow Jones Industrial Average is a price-weighted average of 30 blue-chip stocks that are generally the leaders in their industry. It has been a widely followed indicator of the stock market since October 1, 1928. The NASDAQ-100 Index is a modified captialization-weighted index of the 100 largest and most active non-financial domestic and international issues listed on the NASDAQ. No security can have more than a 24% weighting. The index was developed with a base value of 125 as of February 1, 1985. Prior to December 21, 1998 the Nasdaq 100 was a cap-weighted index. The S&P 500 Index is a market capitalization-weighted index of 500 widely held common stocks. An investor cannot invest directly in an index. Unmanaged index returns do not reflect any fees, expenses or sales charges.
Equity securities are subject to price fluctuation and possible loss of principal. Small- and mid-cap stocks involve greater risks and volatility than large-cap stocks. Real estate investment trusts (REITs) are closely linked to the performance of the real estate markets. REITs are subject to illiquidity, credit and interest rate risks, and risks associated with small and mid-cap investments. Asset-backed, mortgage-backed or mortgage related securities are subject to prepayment and extension risks.
Miller Income Fund 2022 Annual Report
5
Miller Income Fund manager commentary (cont'd)
Investments in MLP securities are subject to unique risks, including the risks of MLPs and the energy sector, including the risks of declines in energy and commodity prices, decreases in energy demand, adverse weather conditions, natural or other disasters, changes in government regulation, and changes in tax laws. Short selling is a speculative strategy. Unlike the possible loss on a security that is purchased, there is no limit on the amount of loss on an appreciating security that is sold short. International investments are subject to special risks, including currency fluctuations and social, economic and political uncertainties, which could increase volatility. These risks are magnified in emerging markets. Fixed income securities involve interest rate, credit, inflation, and reinvestment risks; and possible loss of principal. As interest rates rise, the value of fixed income securities falls. High yield bonds are subject to greater price volatility, illiquidity, and possibility of default. As a non-diversified Fund, it is permitted to invest a higher percentage of its assets in any one issuer than a diversified fund, which may magnify the Fund's losses from events affecting a particular issuer. Derivatives, such as options and futures, can be illiquid, may disproportionately increase losses, and have a potentially large impact on Fund performance.
An investor cannot invest directly in an index.
Miller Income Fund is distributed by Quasar Distributors, LLC.
Must be preceded or accompanied by a prospectus.
Miller Income Fund 2022 Annual Report
6
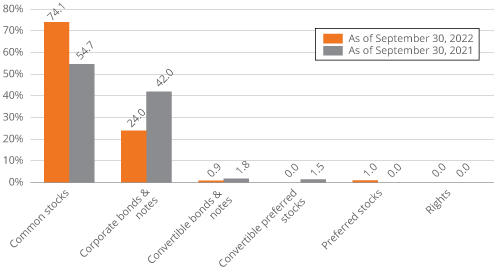
Fund at a glance (unaudited)
Investment breakdown (%) as a percent of total investments
Miller Income Fund 2022 Annual Report
7
Fund expenses (unaudited)
As a shareholder of the Fund, you may incur two types of costs: (1) transaction costs, including front-end and back-end sales charges (loads) on purchase payments; and (2) ongoing costs, including management fees; service and/or distribution (12b-1) fees; and other Fund expenses. This example is intended to help you understand your ongoing costs (in dollars) of investing in the Fund and to compare these costs with the ongoing costs of investing in other mutual funds.
The example is based on an investment of $1,000 invested on April 1, 2022 and held for the six months ended September 30, 2022.
Actual Expenses
The table below titled "Based on total actual return" provides information about actual account values and actual expenses. You may use the information provided in this table, together with the amount you invested, to estimate the expenses that you paid over the period. To estimate the expenses you paid on your account, divide your ending account value by $1,000 (for example, an $8,600 ending account value divided by $1,000 = 8.6), then multiply the result by the number under the heading entitled "Expenses Paid During the Period".
Hypothetical Example for Comparison Purposes
The table below titled "Based on hypothetical actual return" provides information about hypothetical account values and hypothetical expenses based on the actual expense ratio and an assumed rate of return of 5.00% per year before expenses, which is not the Fund's actual return. The hypothetical account values and expenses may not be used to estimate the actual ending account balance or expenses you paid for the period. You may use this information provided in this table to compare the ongoing costs of investing in the Fund and other funds. To do so, compare the 5.00% hypothetical example relating to the Fund with the 5.00% hypothetical examples that appear in the shareholder reports of the other funds.
Please note that the expenses shown in the table below are meant to highlight your ongoing costs only and do not reflect any transactional costs, such as front-end or back-end sales charges (loads). Therefore, the table is useful in comparing ongoing costs only, and will not help you determine the relative total costs of owning different funds. In addition, if these transactional costs were included, your costs could have been higher.
Miller Income Fund 2022 Annual Report
8
Based on total actual return1
|
Actual Total Return Without Sales Charges2 |
Beginning Account Value |
Ending Account Value |
Annualized Expense Ratio |
Expenses Paid During the Period3 |
|||||||||||||||||||
|
Class A |
-23.33 |
% |
$ |
1,000.00 |
$ |
766.70 |
1.21 |
% |
$ |
5.35 |
|||||||||||||
|
Class C |
-23.67 |
1,000.00 |
763.30 |
1.96 |
8.64 |
||||||||||||||||||
|
Class FI |
-23.35 |
1,000.00 |
766.50 |
1.25 |
5.55 |
||||||||||||||||||
|
Class I |
-23.26 |
1,000.00 |
767.40 |
0.96 |
4.25 |
||||||||||||||||||
|
Class IS |
-23.23 |
1,000.00 |
767.70 |
0.90 |
3.99 |
||||||||||||||||||
Based on hypothetical actual return1
|
Hypothetical Total Return Without Sales Charges2 |
Beginning Account Value |
Ending Account Value |
Annualized Expense Ratio |
Expenses Paid During the Period3 |
|||||||||||||||||||
|
Class A |
5.00 |
% |
$ |
1,000.00 |
$ |
1,019.01 |
1.21 |
% |
$ |
6.12 |
|||||||||||||
|
Class C |
5.00 |
1,000.00 |
1,015.27 |
1.96 |
9.88 |
||||||||||||||||||
|
Class FI |
5.00 |
1,000.00 |
1,018.79 |
1.25 |
6.34 |
||||||||||||||||||
|
Class I |
5.00 |
1,000.00 |
1,020.26 |
0.96 |
4.86 |
||||||||||||||||||
|
Class IS |
5.00 |
1,000.00 |
1,020.56 |
0.90 |
4.56 |
||||||||||||||||||
1 For the six months ended September 30, 2022.
2 Assumes the reinvestment of all distributions, including returns of capital, if any, at net asset value or does not reflect the deduction of the applicable sales charge with respect to Class A shares or the applicable contingent deferred sales charge ("CSDC") with respect to Class C shares. Total return is not annualized, as it may not be representative of the total return for the year. Performance figures may reflect compensating balance arrangements, fee waivers and/or expense reimbursements. In the absence of compensating balance arrangements, fee waivers and/or expense reimbursements, the total return would have been lower. Past performance is no guarantee of future results.
3 Expenses (net of compensating balance arrangements, fee waivers and/or expense reimbursements) are equal to each class respective annualized expense ratio multiplied by the average account value over the period, multiplied by the number of days in the most recent fiscal half-year (183), then divided by 365.
Miller Income Fund 2022 Annual Report
9
Fund performance (unaudited)
Historical Performance
Value of $10,000 invested in
Class A, C and FI Shares of Miller Income Fund vs. ICE BofA US High Yield Index and S&P 500 Index† — 2/28/14 to 9/30/22

Value of $1,000,000 invested in
Class I and IS Shares of Miller Income Fund vs. ICE BofA US High Yield Index and S&P 500 Index† — 2/28/14 to 9/30/22

† Hypothetical illustration of $10,000 invested in Class A, C and FI shares and $1,000,000 invested in Class I and IS shares of Miller Income Fund on February 28, 2014 (inception date), assuming the reinvestment of all distributions, including return of capital, if any, at net asset value through September 30, 2022. Returns shown do not reflect the deduction of taxes that a shareholder would pay on fund distributions or the redemption of fund shares. In the absence of fee waivers and reimbursements, total return would be reduced. Past performance is not predictive of future performance. Class A shares reflect the deduction of the maximum sales charge of 5.75% at the time of investment. The hypothetical illustration also assumes a $10,000 or $1,000,000 investment, if applicable, in the ICE BofA US High Yield Index and S&P 500 Index. Please note that an investor cannot invest directly in an index.
Miller Income Fund 2022 Annual Report
10
Schedule of Investments
September 30, 2022
Miller Income Fund
|
Security |
Shares |
Value |
|||||||||
|
Common Stocks — 73.6% |
|||||||||||
|
Consumer Discretionary — 9.1% |
|||||||||||
|
Specialty Retail — 9.1% |
|||||||||||
|
Buckle Inc/The |
251,200 |
$ |
7,952,992 |
||||||||
|
Camping World Holdings, Inc. |
67,000 |
1,696,440 |
|||||||||
|
Chico's FAS Inc. * |
982,900 |
4,757,236 |
|||||||||
|
Total Consumer Discretionary |
14,406,668 |
||||||||||
|
Consumer Staples — 3.8% |
|||||||||||
|
Tobacco — 3.8% |
|||||||||||
|
British American Tobacco PLC |
165,000 |
5,944,178 |
|||||||||
|
Total Consumer Staples |
5,944,178 |
||||||||||
|
Energy — 7.0% |
|||||||||||
|
Oil, Gas & Consumable Fuels — 7.0% |
|||||||||||
|
Alliance Resource Partners LP |
276,000 |
6,320,400 |
|||||||||
|
Chesapeake Energy Corp. |
50,000 |
4,710,500 |
|||||||||
|
Total Energy |
11,030,900 |
||||||||||
|
Financials — 19.5% |
|||||||||||
|
Banks — 0.0% |
|||||||||||
|
Sberbank of Russia PJSC — ADR *(b) |
2,532,000 |
— |
|||||||||
|
Total Banks |
— |
||||||||||
|
Capital Markets — 12.2% |
|||||||||||
|
Apollo Global Management Inc. |
73,000 |
3,394,500 |
|||||||||
|
Artisan Partners Asset Management, Inc. |
63,000 |
1,696,590 |
|||||||||
|
B Riley Financial, Inc. |
87,500 |
3,895,500 |
|||||||||
|
Lazard Ltd., Class A Shares |
137,200 |
4,367,076 |
|||||||||
|
Sculptor Capital Management Inc. |
442,400 |
3,910,816 |
|||||||||
|
T Rowe Price Group, Inc. |
19,175 |
2,013,567 |
|||||||||
|
Total Capital Markets |
19,278,049 |
||||||||||
|
Consumer Finance — 3.6% |
|||||||||||
|
OneMain Holdings Inc. |
192,700 |
5,688,504 |
|||||||||
|
Diversified Financial Services — 3.7% |
|||||||||||
|
Jackson Financial, Inc. |
208,000 |
5,772,000 |
|||||||||
|
Total Financials |
30,738,553 |
||||||||||
|
Health Care — 7.6% |
|||||||||||
|
Pharmaceuticals — 7.6% |
|||||||||||
|
Organon & Co. |
205,000 |
4,797,000 |
|||||||||
|
Viatris Inc. |
851,000 |
7,250,520 |
|||||||||
|
Total Health Care |
12,047,520 |
||||||||||
Miller Income Fund 2022 Annual Report
11
Schedule of Investments (cont'd)
September 30, 2022
Miller Income Fund
|
Security |
Shares |
Value |
|||||||||||||||||
|
Industrials — 5.0% |
|||||||||||||||||||
|
Commercial Services & Supplies — 5.0% |
|||||||||||||||||||
|
Public Policy Holding Co, Inc. |
4,120,025 |
$ |
6,601,277 |
||||||||||||||||
|
Quad/Graphics Inc. * |
487,800 |
1,248,768 |
|||||||||||||||||
|
Total Industrials |
7,850,045 |
||||||||||||||||||
|
Materials — 11.9% |
|||||||||||||||||||
|
Chemicals — 4.0% |
|||||||||||||||||||
|
Chemours Co/The |
254,000 |
6,261,100 |
|||||||||||||||||
|
Construction Materials — 3.7% |
|||||||||||||||||||
|
HeidelbergCement AG |
146,000 |
5,845,094 |
|||||||||||||||||
|
Metals & Mining — 4.2% |
|||||||||||||||||||
|
Alrosa PJSC *(b) |
2,978,100 |
— |
|||||||||||||||||
|
Vale SA — ADR |
504,000 |
6,713,280 |
|||||||||||||||||
|
Total Metals & Mining |
6,713,280 |
||||||||||||||||||
|
Total Materials |
18,819,474 |
||||||||||||||||||
|
Real Estate — 9.8% |
|||||||||||||||||||
|
Equity Real Estate Investment Trusts (REITs) — 9.8% |
|||||||||||||||||||
|
CTO Realty Growth, Inc. |
360,000 |
6,746,400 |
|||||||||||||||||
|
GEO Group Inc/The * |
300,000 |
2,310,000 |
|||||||||||||||||
|
Medical Properties Trust, Inc. |
332,000 |
3,937,520 |
|||||||||||||||||
|
Simon Property Group, Inc. |
29,000 |
2,602,750 |
|||||||||||||||||
|
Total Real Estate |
15,596,670 |
||||||||||||||||||
|
Total Common Stocks (Cost — $144,049,650) |
116,434,008 |
||||||||||||||||||
|
Rate |
|||||||||||||||||||
|
Preferred Stocks — 0.9% |
|||||||||||||||||||
|
Information Technology — 0.9% |
|||||||||||||||||||
|
Software — 0.9% |
|||||||||||||||||||
|
Greenidge Generation Holdings, Inc. |
8.500 |
% |
123,250 |
1,503,650 |
|||||||||||||||
|
Total Preferred Stocks (Cost — $3,060,938) |
1,503,650 |
||||||||||||||||||
|
Maturity Date |
Face Amount |
||||||||||||||||||
|
Convertible Bond — 0.9% |
|||||||||||||||||||
|
Information Technology — 0.9% |
|||||||||||||||||||
|
Software — 0.9% |
|||||||||||||||||||
|
MicroStrategy Inc. |
0.750 |
% |
12/15/25 |
$ |
1,900,000 |
1,443,920 |
|||||||||||||
|
Total Convertible Bond (Cost — $1,900,000) |
1,443,920 |
||||||||||||||||||
|
Corporate Bonds — 23.8% |
|||||||||||||||||||
|
Communication Services — 3.5% |
|||||||||||||||||||
|
Diversified Telecommunication Services — 1.3% |
|||||||||||||||||||
|
Lumen Technologies Inc. |
7.600 |
% |
9/15/39 |
2,900,000 |
1,986,500 |
||||||||||||||
Miller Income Fund 2022 Annual Report
12
Miller Income Fund
|
Security |
Rate |
Maturity Date |
Face Amount |
Value |
|||||||||||||||
|
Radio and Television Broadcasting — 2.2% |
|||||||||||||||||||
|
iHeartCommunications, Inc. |
8.375 |
% |
5/1/27 |
$ |
4,200,000 |
$ |
3,559,500 |
||||||||||||
|
Total Communication Services |
5,546,000 |
||||||||||||||||||
|
Consumer Discretionary — 3.4% |
|||||||||||||||||||
|
Specialty Retail — 3.4% |
|||||||||||||||||||
|
Carvana Co. (a) |
10.250 |
% |
5/1/30 |
8,000,000 |
5,360,000 |
||||||||||||||
|
Total Consumer Discretionary |
5,360,000 |
||||||||||||||||||
|
Health Care — 6.8% |
|||||||||||||||||||
|
Pharmaceuticals — 6.8% |
|||||||||||||||||||
|
Columbia Care, Inc. |
9.500 |
% |
2/3/26 |
10,000,000 |
9,950,000 |
||||||||||||||
|
Endo Finance LLC (a) |
6.000 |
% |
6/30/28 |
15,352,000 |
882,740 |
||||||||||||||
|
Total Health Care |
10,832,740 |
||||||||||||||||||
|
Industrials — 7.7% |
|||||||||||||||||||
|
Commercial Services & Supplies — 7.7% |
|||||||||||||||||||
|
GEO Group Inc/The |
10.500 |
% |
6/30/28 |
8,291,000 |
8,249,545 |
||||||||||||||
|
Pitney Bowes Inc. (a) |
7.250 |
% |
3/15/29 |
6,600,000 |
3,976,500 |
||||||||||||||
|
Total Commercial Services & Supplies |
12,226,045 |
||||||||||||||||||
|
Total Industrials |
12,226,045 |
||||||||||||||||||
|
Information Technology — 2.4% |
|||||||||||||||||||
|
Software — 2.4% |
|||||||||||||||||||
|
MicroStrategy, Inc. (a) |
6.125 |
% |
6/15/28 |
4,500,000 |
3,720,938 |
||||||||||||||
|
Total Information Technology |
3,720,938 |
||||||||||||||||||
|
Total Corporate Bonds (Cost — $52,503,081) |
37,685,723 |
||||||||||||||||||
|
Shares |
|||||||||||||||||||
|
Rights — 0.0% |
|||||||||||||||||||
|
Energy — 0.0% |
|||||||||||||||||||
|
Oil, Gas & Consumable Fuels — 0.0% |
|||||||||||||||||||
|
Ultra Resources Escrow Position *(b) |
11,195 |
— |
|||||||||||||||||
|
Total Rights (Cost — $0) |
— |
||||||||||||||||||
|
Total Investments — 99.2% (Cost — $201,513,669) |
157,067,301 |
||||||||||||||||||
|
Other Assets in Excess of Liabilities — 0.8% |
1,240,538 |
||||||||||||||||||
|
Total Net Assets — 100.0% |
$ |
158,307,839 |
|||||||||||||||||
Miller Income Fund 2022 Annual Report
13
Schedule of Investments (cont'd)
September 30, 2022
Miller Income Fund
ADR — American Depositary Receipt
PJSC — Public Joint-Stock Company
PLC — Public Limited Company
LP — Limited Partnership
* Non-income producing security.
(a) Security was purchased to rule 144 under the Securities Act of 1933 and may not be resold subject to that rule except to qualified institutional buyers. Unless otherwise noted, 144A securities are deemed to be liquid. At September 30, 2022, the value of these securities totaled $13,940,178 or 8.8% of net assets.
(b) Security is valued in good faith in accordance with procedures approved by the Board of Trustees (See Note 2).
The Global Industry Classification Standard (GICS®) was developed by and/or is the exclusive property of Morgan Stanley Capital International, Inc. ("MSCI") and Standard & Poor's Financial Services LLC ("S&P"). GICS is a service mark of MSCI and S&P and has been licensed for use by U.S. Bancorp Fund Services, LLC.
The Accompanying Notes are an Integral Part of these Financial Statements.
Miller Income Fund 2022 Annual Report
14
Statement of assets and liabilities
September 30, 2022
|
Assets: |
|||||||
|
Investments, at value (Cost $201,513,669) |
$ |
157,067,301 |
|||||
|
Cash |
934 |
||||||
|
Investment securities sold |
1,968,960 |
||||||
|
Dividends and interest receivable |
1,228,386 |
||||||
|
Receivable for fund shares sold |
11,950 |
||||||
|
Prepaid expenses |
32,278 |
||||||
|
Total Assets |
160,309,809 |
||||||
|
Liabilities: |
|||||||
|
Payables: |
|||||||
|
Investment securities purchased |
1,155,298 |
||||||
|
Payable for fund shares repurchased |
77,233 |
||||||
|
Line of credit payable (Note 9) |
516,000 |
||||||
|
Investment management fees payable |
94,961 |
||||||
|
Service and/or distribution fees payable |
17,079 |
||||||
|
Accrued other expenses |
141,399 |
||||||
|
Total Liabilities |
2,001,970 |
||||||
|
Total Net Assets |
$ |
158,307,839 |
|||||
|
Net Assets: |
|||||||
|
Paid-in capital |
$ |
223,170,239 |
|||||
|
Total accumulated loss |
(64,862,400 |
) |
|||||
|
Total Net Assets |
$ |
158,307,839 |
|||||
The Accompanying Notes are an Integral Part of these Financial Statements.
Miller Income Fund 2022 Annual Report
15
Statement of assets and liabilities (cont'd)
September 30, 2022
|
Net Assets: |
|||||||
|
Class A |
$ |
25,881,107 |
|||||
|
Class C |
$ |
19,859,876 |
|||||
|
Class FI |
$ |
247,562 |
|||||
|
Class I |
$ |
67,042,124 |
|||||
|
Class IS |
$ |
45,277,170 |
|||||
|
Shares Outstanding: |
|||||||
|
Class A |
4,291,740 |
||||||
|
Class C |
3,293,156 |
||||||
|
Class FI |
41,068 |
||||||
|
Class I |
11,136,155 |
||||||
|
Class IS |
7,525,977 |
||||||
|
Net Asset Value: |
|||||||
|
Class A (and redemption price) |
$ |
6.03 |
|||||
|
Class C * |
$ |
6.03 |
|||||
|
Class FI (and redemption price) |
$ |
6.03 |
|||||
|
Class I (and redemption price) |
$ |
6.02 |
|||||
|
Class IS (and redemption price) |
$ |
6.02 |
|||||
|
Maximum Public Offering Price Per Share: |
|||||||
|
Class A (based on maximum initial sales charge of 5.75%) |
$ |
6.40 |
|||||
* Redemption price per share of Class C shares is NAV reduced by 1.00% CDSC if shares are redeemed within one year of purchase (See Note 3)
The Accompanying Notes are an Integral Part of these Financial Statements.
Miller Income Fund 2022 Annual Report
16
Statement of operations
For the Year Ended September 30, 2022
|
Investment Income: |
|||||||
|
Dividends and distributions (Net of foreign tax of $112,228) |
$ |
7,202,289 |
|||||
|
Return of capital Distributions (Note 2(b)) |
(623,952 |
) |
|||||
|
Net Dividends and Distributions |
6,578,337 |
||||||
|
Interest |
6,903,492 |
||||||
|
Total Investment Income |
13,481,829 |
||||||
|
Expenses: |
|||||||
|
Investment management fee (Note 3) |
1,553,834 |
||||||
|
Distribution fees (Note 5) |
379,174 |
||||||
|
Transfer agent expenses (Note 3) |
146,015 |
||||||
|
Administration fees (Note 3) |
138,380 |
||||||
|
Shareholder servicing fees (Note 5) |
99,626 |
||||||
|
Registration fees |
74,460 |
||||||
|
Shareholder reports |
35,035 |
||||||
|
Custody fees (Note 3) |
34,055 |
||||||
|
Legal fees |
27,176 |
||||||
|
Audit and tax fees |
17,782 |
||||||
|
Trustees' fees (Note 3) |
15,476 |
||||||
|
Interest expense (Note 9) |
16,087 |
||||||
|
Compliance fees (Note 3) |
13,912 |
||||||
|
Miscellaneous expenses |
9,889 |
||||||
|
Insurance |
5,063 |
||||||
|
Total Expenses |
2,565,964 |
||||||
|
Less: Fee waivers and/or expense reimbursement (Note 3) |
(96,550 |
) |
|||||
|
Net Expenses |
2,469,414 |
||||||
|
Net Investment Income |
11,012,415 |
||||||
|
Realized and Unrealized Gain (Loss) on Investments, REIT Distributions and Foreign Currency Translation (Note 2): |
|||||||
|
Net Realized Gain From: |
|||||||
|
Investment transactions |
3,044,400 |
||||||
|
REIT distributions |
1,142,845 |
||||||
|
Net Realized Gain |
4,187,245 |
||||||
|
Net Change in Unrealized appreciation (depreciation) on: |
|||||||
|
Investment transactions |
(85,078,729 |
) |
|||||
|
Foreign currency translation |
(3,503 |
) |
|||||
|
Change in Net Unrealized Appreciation (Depreciation) on Investments |
(85,082,232 |
) |
|||||
|
Net Loss on Investments, REIT Distribution and Foreign Currency Translation |
(80,894,987 |
) |
|||||
|
Decrease in Net Assets from Operations |
$ |
(69,882,572 |
) |
||||
The Accompanying Notes are an Integral Part of these Financial Statements.
Miller Income Fund 2022 Annual Report
17
Statements of changes in net assets
|
For the Years Ended September 30 |
2022 |
2021 |
|||||||||
|
Operations: |
|||||||||||
|
Net investment income |
$ |
11,012,415 |
$ |
12,432,308 |
|||||||
|
Net realized gain |
4,187,245 |
24,681,977 |
|||||||||
|
Change in unrealized appreciation/depreciation |
(85,082,232 |
) |
50,362,954 |
||||||||
|
Increase (Decrease) in Net Assets from Operations |
(69,882,572 |
) |
87,477,239 |
||||||||
|
Distributions to shareholders from (Note 5): |
|||||||||||
|
Net investment income |
(10,786,365 |
) |
(12,511,052 |
) |
|||||||
|
Return of capital |
(683,636 |
) |
(818,958 |
) |
|||||||
|
Decrease in Net Assets from Distributions to Shareholders |
(11,470,001 |
) |
(13,330,010 |
) |
|||||||
|
Fund Share Transactions (Note 6): |
|||||||||||
|
Net proceeds from sale of shares |
24,504,222 |
44,753,477 |
|||||||||
|
Reinvestment of distributions |
10,801,780 |
12,970,052 |
|||||||||
|
Cost of shares repurchased |
(51,909,299 |
) |
(51,470,476 |
) |
|||||||
|
Increase (Decrease) in Net Assets from Fund Share Transactions |
(16,603,297 |
) |
6,253,053 |
||||||||
|
Increase (Decrease) in Net Assets |
(97,955,870 |
) |
80,400,282 |
||||||||
|
Net Assets: |
|||||||||||
|
Beginning of year |
256,263,709 |
175,863,427 |
|||||||||
|
End of year |
$ |
158,307,839 |
$ |
256,263,709 |
|||||||
The Accompanying Notes are an Integral Part of these Financial Statements.
Miller Income Fund 2022 Annual Report
18
Financial highlights
For a share of each class of beneficial interest outstanding throughout each year ended September 30,
|
Class A Shares |
2022 |
2021 |
2020 |
2019 |
2018 |
||||||||||||||||||
|
Net asset value, beginning of year |
$ |
9.06 |
$ |
6.36 |
$ |
7.74 |
$ |
8.90 |
$ |
8.58 |
|||||||||||||
|
Income (loss) from operations: |
|||||||||||||||||||||||
| Net investment income1 |
0.39 |
0.44 |
0.39 |
0.48 |
0.50 |
||||||||||||||||||
|
Net realized and unrealized gain (loss) |
(3.00 |
) |
2.73 |
(1.29 |
) |
(1.03 |
) |
0.47 |
|||||||||||||||
|
Total income (loss) from operations |
(2.61 |
) |
3.17 |
(0.90 |
) |
(0.55 |
) |
0.97 |
|||||||||||||||
|
Less distributions from: |
|||||||||||||||||||||||
|
Net investment income |
(0.39 |
) |
(0.44 |
) |
(0.34 |
) |
(0.48 |
) |
(0.53 |
) |
|||||||||||||
|
Return of capital |
(0.03 |
) |
(0.03 |
) |
(0.14 |
) |
(0.13 |
) |
(0.12 |
) |
|||||||||||||
|
Total distributions: |
(0.42 |
) |
(0.47 |
) |
(0.48 |
) |
(0.61 |
) |
(0.65 |
) |
|||||||||||||
|
Net asset value, end of year |
$ |
6.03 |
$ |
9.06 |
$ |
6.36 |
$ |
7.74 |
$ |
8.90 |
|||||||||||||
|
Total return2 |
-29.56 |
% |
50.36 |
% |
-11.19 |
% |
-5.76 |
% |
11.70 |
% |
|||||||||||||
|
Net assets, end of year (000s) |
$ |
25,881 |
$ |
36,250 |
$ |
27,444 |
$ |
36,462 |
$ |
37,749 |
|||||||||||||
|
Ratios to average net assets: |
|||||||||||||||||||||||
|
Gross expenses |
1.26 |
% |
1.26 |
% |
1.31 |
% |
1.29 |
% |
1.29 |
% |
|||||||||||||
| Net expenses3,4 |
1.21 |
5 |
1.23 |
5 |
1.23 |
1.26 |
5 |
1.25 |
|||||||||||||||
|
Net investment income |
4.90 |
5.22 |
5.62 |
6.10 |
5.67 |
||||||||||||||||||
|
Portfolio turnover rate |
59 |
% |
65 |
% |
77 |
% |
61 |
% |
37 |
% |
|||||||||||||
1 Per share amounts have been calculated using the average shares method.
2 Performance figures, exclusive of sales charges, may reflect compensating balance arrangements, fee waivers and/or expense reimbursements. In the absence of compensating balance arrangements, fee waivers and or/expense reimbursements, the total return would have been lower. Past performance is no guarantee of future results.
3 Effective January 31, 2020, the Adviser agreed to waive fees and/or reimburse operating expenses, (other than front-end or contingent deferred loads, taxes, interest expense, brokerage commissions, acquired fund fees and expenses, expenses incurred in connection with any merger or reorganization, portfolio transaction expenses, dividends paid on short sales, extraordinary expenses such as litigation, Rule 12b-1 fees, intermediary servicing fees, or any other class-specific expenses) through January 31, 2023, so that such annual operating expenses will not exceed 0.89%. Prior to January 31, 2020, the limit was 1.25% and established at the class level (inclusive of 12b-1 and shareholder servicing fees). See Note 3.
4 Reflects fee waivers and/or expense reimbursements.
5 Interest expenses were 0.01%, 0.02% and 0.01% for the years ended September 30, 2019, 2021 and 2022, respectively. Excluding interest, the net expense ratios were 1.25%, 1.21% and 1.20% for the years ended September 30, 2019, 2021 and 2022, respectively.
The Accompanying Notes are an Integral Part of these Financial Statements.
Miller Income Fund 2022 Annual Report
19
Financial highlights (cont'd)
For a share of each class of beneficial interest outstanding throughout each year ended September 30,
|
Class C Shares |
2022 |
2021 |
2020 |
2019 |
2018 |
||||||||||||||||||
|
Net asset value, beginning of year |
$ |
9.05 |
$ |
6.36 |
$ |
7.73 |
$ |
8.88 |
$ |
8.56 |
|||||||||||||
|
Income (loss) from operations: |
|||||||||||||||||||||||
| Net investment income1 |
0.33 |
0.38 |
0.33 |
0.43 |
0.40 |
||||||||||||||||||
|
Net realized and unrealized gain (loss) |
(3.00 |
) |
2.72 |
(1.27 |
) |
(1.02 |
) |
0.50 |
|||||||||||||||
|
Total income (loss) from operations |
(2.67 |
) |
3.10 |
(0.94 |
) |
(0.59 |
) |
0.90 |
|||||||||||||||
|
Less distributions from: |
|||||||||||||||||||||||
|
Net investment income |
(0.33 |
) |
(0.38 |
) |
(0.31 |
) |
(0.44 |
) |
(0.47 |
) |
|||||||||||||
|
Return of capital |
(0.02 |
) |
(0.03 |
) |
(0.12 |
) |
(0.12 |
) |
(0.11 |
) |
|||||||||||||
|
Total distributions: |
(0.35 |
) |
(0.41 |
) |
(0.43 |
) |
(0.56 |
) |
(0.58 |
) |
|||||||||||||
|
Net asset value, end of year |
$ |
6.03 |
$ |
9.05 |
$ |
6.36 |
$ |
7.73 |
$ |
8.88 |
|||||||||||||
|
Total return2 |
-30.07 |
% |
49.13 |
% |
-11.80 |
% |
-6.48 |
% |
11.00 |
% |
|||||||||||||
|
Net assets, end of year (000s) |
$ |
19,860 |
$ |
34,591 |
$ |
26,784 |
$ |
38,463 |
$ |
35,203 |
|||||||||||||
|
Ratios to average net assets: |
|||||||||||||||||||||||
|
Gross expenses |
2.00 |
% |
2.00 |
% |
2.05 |
% |
2.04 |
% |
2.04 |
% |
|||||||||||||
| Net expenses3,4 |
1.95 |
5 |
1.97 |
5 |
1.97 |
2.01 |
5 |
2.00 |
|||||||||||||||
|
Net investment income |
4.11 |
4.48 |
4.84 |
5.43 |
4.60 |
||||||||||||||||||
|
Portfolio turnover rate |
59 |
% |
65 |
% |
77 |
% |
61 |
% |
37 |
% |
|||||||||||||
1 Per share amounts have been calculated using the average shares method.
2 Performance figures, exclusive of CDSC, may reflect compensating balance arrangements, fee waivers and/or expense reimbursements. In the absence of compensating balance arrangements, fee waivers and or/expense reimbursements, the total return would have been lower. Past performance is no guarantee of future results.
3 Effective January 31, 2020, the Adviser agreed to waive fees and/or reimburse operating expenses, (other than front-end or contingent deferred loads, taxes, interest expense, brokerage commissions, acquired fund fees and expenses, expenses incurred in connection with any merger or reorganization, portfolio transaction expenses, dividends paid on short sales, extraordinary expenses such as litigation, Rule 12b-1 fees, intermediary servicing fees, or any other class-specific expenses) through January 31, 2023, so that such annual operating expenses will not exceed 0.89%. Prior to January 31, 2020, the limit was 2.00% and established at the class level (inclusive of 12b-1 and shareholder servicing fees). See Note 3.
4 Reflects fee waivers and/or expense reimbursements.
5 Interest expenses were 0.01%, 0.02% and 0.01% for the years ended September 30, 2019, 2021 and 2022, respectively. Excluding interest, the net expense ratios were 2.00%, 1.95% and 1.94% for the years ended September 30, 2019, 2021 and 2022, respectively.
The Accompanying Notes are an Integral Part of these Financial Statements.
Miller Income Fund 2022 Annual Report
20
For a share of each class of beneficial interest outstanding throughout each year ended September 30,
|
Class FI Shares |
2022 |
2021 |
2020 |
2019 |
2018 |
||||||||||||||||||
|
Net asset value, beginning of year |
$ |
9.06 |
$ |
6.36 |
$ |
7.71 |
$ |
8.86 |
$ |
8.55 |
|||||||||||||
|
Income (loss) from operations: |
|||||||||||||||||||||||
| Net investment income1 |
0.40 |
0.43 |
0.38 |
0.43 |
0.59 |
||||||||||||||||||
|
Net realized and unrealized gain (loss) |
(3.01 |
) |
2.74 |
(1.25 |
) |
(0.98 |
) |
0.37 |
|||||||||||||||
|
Total income (loss) from operations |
(2.61 |
) |
3.17 |
(0.87 |
) |
(0.55 |
) |
0.96 |
|||||||||||||||
|
Less distributions from: |
|||||||||||||||||||||||
|
Net investment income |
(0.39 |
) |
(0.44 |
) |
(0.34 |
) |
(0.47 |
) |
(0.53 |
) |
|||||||||||||
|
Return of capital |
(0.03 |
) |
(0.03 |
) |
(0.14 |
) |
(0.13 |
) |
(0.12 |
) |
|||||||||||||
|
Total distributions: |
(0.42 |
) |
(0.47 |
) |
(0.48 |
) |
(0.60 |
) |
(0.65 |
) |
|||||||||||||
|
Net asset value, end of year |
$ |
6.03 |
$ |
9.06 |
$ |
6.36 |
$ |
7.71 |
$ |
8.86 |
|||||||||||||
|
Total return2 |
-29.57 |
% |
50.25 |
% |
-10.82 |
% |
-5.80 |
% |
11.66 |
% |
|||||||||||||
|
Net assets, end of year (000s) |
$ |
248 |
$ |
208 |
$ |
118 |
$ |
209 |
$ |
866 |
|||||||||||||
|
Ratios to average net assets: |
|||||||||||||||||||||||
|
Gross expenses |
1.28 |
% |
1.38 |
% |
1.26 |
% |
1.26 |
% |
1.36 |
% |
|||||||||||||
| Net expenses3,4 |
1.24 |
5 |
1.35 |
5 |
1.20 |
1.26 |
5 |
1.25 |
|||||||||||||||
|
Net investment income |
4.98 |
5.07 |
5.54 |
5.41 |
6.58 |
||||||||||||||||||
|
Portfolio turnover rate |
59 |
% |
65 |
% |
77 |
% |
61 |
% |
37 |
% |
|||||||||||||
1 Per share amounts have been calculated using the average shares method.
2 Performance figures may reflect compensating balance arrangements, fee waivers and/or expense reimbursements. In the absence of compensating balance arrangements, fee waivers and or/expense reimbursements, the total return would have been lower. Past performance is no guarantee of future results.
3 Effective January 31, 2020, the adviser agreed to waive fees and/or reimburse operating expenses, (other than front-end or contingent deferred loads, taxes, interest expense, brokerage commissions, acquired fund fees and expenses, expenses incurred in connection with any merger or reorganization, portfolio transaction expenses, dividends paid on short sales, extraordinary expenses such as litigation, Rule 12b-1 fees, intermediary servicing fees, or any other class-specific expenses) through January 31, 2023, so that such annual operating expenses will not exceed 0.89%. Prior to January 31, 2020, the limit was 1.25% and established at the class level (inclusive of 12b-1 and shareholder servicing fees). See Note 3.
4 Reflects fee waivers and expense reimbursements, or recapture of previous waivers.
5 Interest expenses were 0.01%, 0.02% and 0.01% for the years ended September 30, 2019, 2021 and 2022, respectively. Excluding interest, the net expense ratios were 1.25%, 1.33% and 1.23% for the years ended September 30, 2019, 2021 and 2022, respectively.
The Accompanying Notes are an Integral Part of these Financial Statements.
Miller Income Fund 2022 Annual Report
21
Financial highlights (cont'd)
For a share of each class of beneficial interest outstanding throughout each year ended September 30,
|
Class I Shares |
2022 |
2021 |
2020 |
2019 |
2018 |
||||||||||||||||||
|
Net asset value, beginning of year |
$ |
9.05 |
$ |
6.35 |
$ |
7.73 |
$ |
8.89 |
$ |
8.56 |
|||||||||||||
|
Income (loss) from operations: |
|||||||||||||||||||||||
| Net investment income1 |
0.41 |
0.46 |
0.40 |
0.51 |
0.51 |
||||||||||||||||||
|
Net realized and unrealized gain (loss) |
(3.00 |
) |
2.73 |
(1.27 |
) |
(1.03 |
) |
0.49 |
|||||||||||||||
|
Total income (loss) from operations |
(2.59 |
) |
3.19 |
(0.87 |
) |
(0.52 |
) |
1.00 |
|||||||||||||||
|
Less distributions from: |
|||||||||||||||||||||||
|
Net investment income |
(0.41 |
) |
(0.46 |
) |
(0.36 |
) |
(0.50 |
) |
(0.54 |
) |
|||||||||||||
|
Return of capital |
(0.03 |
) |
(0.03 |
) |
(0.15 |
) |
(0.14 |
) |
(0.13 |
) |
|||||||||||||
|
Total distributions: |
(0.44 |
) |
(0.49 |
) |
(0.51 |
) |
(0.64 |
) |
(0.67 |
) |
|||||||||||||
|
Net asset value, end of year |
$ |
6.02 |
$ |
9.05 |
$ |
6.35 |
$ |
7.73 |
$ |
8.89 |
|||||||||||||
|
Total return2 |
-29.41 |
% |
50.82 |
% |
-10.94 |
% |
-5.48 |
% |
12.12 |
% |
|||||||||||||
|
Net assets, end of year (000s) |
$ |
67,042 |
$ |
123,349 |
$ |
80,483 |
$ |
79,411 |
$ |
68,138 |
|||||||||||||
|
Ratios to average net assets: |
|||||||||||||||||||||||
|
Gross expenses |
1.00 |
% |
1.01 |
% |
1.05 |
% |
1.03 |
% |
1.04 |
% |
|||||||||||||
| Net expenses3,4 |
0.96 |
5 |
0.98 |
5 |
0.95 |
0.96 |
5 |
0.95 |
|||||||||||||||
|
Net investment income |
5.09 |
5.48 |
5.89 |
6.47 |
5.78 |
||||||||||||||||||
|
Portfolio turnover rate |
59 |
% |
65 |
% |
77 |
% |
61 |
% |
37 |
% |
|||||||||||||
1 Per share amounts have been calculated using the average shares method.
2 Performance figures may reflect compensating balance arrangements, fee waivers and/or expense reimbursements. In the absence of compensating balance arrangements, fee waivers and or/expense reimbursements, the total return would have been lower. Past performance is no guarantee of future results.
3 Effective January 31, 2020, the Adviser agreed to waive fees and/or reimburse operating expenses, (other than front-end or contingent deferred loads, taxes, interest expense, brokerage commissions, acquired fund fees and expenses, expenses incurred in connection with any merger or reorganization, portfolio transaction expenses, dividends paid on short sales, extraordinary expenses such as litigation, Rule 12b-1 fees, intermediary servicing fees, or any other class-specific expenses) through January 31, 2023, so that such annual operating expenses will not exceed 0.89%. Separately, the Adviser has agreed to waive fees and/or reimburse operating expenses such that the previously described annual operating expenses, plus intermediary servicing fees and other class-specific expenses, will not exceed 0.95% for Class I. See Note 3.
4 Reflects fee waivers and/or expense reimbursements.
5 Interest expenses were 0.01%, 0.02% and 0.01% for the years ended September 30, 2019, 2021 and 2022, respectively. Excluding interest, the net expense ratios were 0.95%, 0.96% and 0.95% for the years ended September 30, 2019, 2021 and 2022, respectively.
The Accompanying Notes are an Integral Part of these Financial Statements.
Miller Income Fund 2022 Annual Report
22
For a share of each class of beneficial interest outstanding throughout each year ended September 30,
|
Class IS Shares |
2022 |
2021 |
2020 |
2019 |
2018 |
||||||||||||||||||
|
Net asset value, beginning of year |
$ |
9.04 |
$ |
6.35 |
$ |
7.73 |
$ |
8.88 |
$ |
8.56 |
|||||||||||||
|
Income (loss) from operations: |
|||||||||||||||||||||||
| Net investment income1 |
0.42 |
0.47 |
0.41 |
0.51 |
0.50 |
||||||||||||||||||
|
Net realized and unrealized gain (loss) |
(3.00 |
) |
2.72 |
(1.28 |
) |
(1.01 |
) |
0.50 |
|||||||||||||||
|
Total income (loss) from operations |
(2.58 |
) |
3.19 |
(0.87 |
) |
(0.50 |
) |
1.00 |
|||||||||||||||
|
Less distributions from: |
|||||||||||||||||||||||
|
Net investment income |
(0.41 |
) |
(0.47 |
) |
(0.36 |
) |
(0.51 |
) |
(0.55 |
) |
|||||||||||||
|
Return of capital |
(0.03 |
) |
(0.03 |
) |
(0.15 |
) |
(0.14 |
) |
(0.13 |
) |
|||||||||||||
|
Total distributions: |
(0.44 |
) |
(0.50 |
) |
(0.51 |
) |
(0.65 |
) |
(0.68 |
) |
|||||||||||||
|
Net asset value, end of year |
$ |
6.02 |
$ |
9.04 |
$ |
6.35 |
$ |
7.73 |
$ |
8.88 |
|||||||||||||
|
Total return2 |
-29.28 |
% |
50.75 |
% |
-10.87 |
% |
-5.38 |
% |
12.21 |
% |
|||||||||||||
|
Net assets, end of year (000s) |
$ |
45,277 |
$ |
61,866 |
$ |
41,034 |
$ |
51,497 |
$ |
54,829 |
|||||||||||||
|
Ratios to average net assets: |
|||||||||||||||||||||||
|
Gross expenses |
0.94 |
% |
0.94 |
% |
0.99 |
% |
0.97 |
% |
0.98 |
% |
|||||||||||||
| Net expenses3,4 |
0.90 |
5 |
0.91 |
5 |
0.88 |
0.86 |
5 |
0.85 |
|||||||||||||||
|
Net investment income |
5.23 |
5.55 |
5.92 |
6.49 |
5.69 |
||||||||||||||||||
|
Portfolio turnover rate |
59 |
% |
65 |
% |
77 |
% |
61 |
% |
37 |
% |
|||||||||||||
1 Per share amounts have been calculated using the average shares method.
2 Performance figures may reflect compensating balance arrangements, fee waivers and/or expense reimbursements. In the absence of compensating balance arrangements, fee waivers and or/expense reimbursements, the total return would have been lower. Past performance is no guarantee of future results.
3 Effective January 31, 2020, the Adviser agreed to waive fees and/or reimburse operating expenses, (other than front-end or contingent deferred loads, taxes, interest expense, brokerage commissions, acquired fund fees and expenses, expenses incurred in connection with any merger or reorganization, portfolio transaction expenses, dividends paid on short sales, extraordinary expenses such as litigation, Rule 12b-1 fees, intermediary servicing fees, or any other class-specific expenses) through January 31, 2023, so that such annual operating expenses will not exceed 0.89%. Prior to January 31, 2020, the limit was 0.85% and established at the class level (inclusive of 12b-1 and shareholder servicing fees). See Note 3.
4 Reflects fee waivers and/or expense reimbursements.
5 Interest expenses were 0.01%, 0.02% and 0.01% for the years ended September 30, 2019, 2021 and 2022, respectively. Excluding interest, the net expense ratios were 0.85%, 0.89% and 0.89% for the years ended September 30, 2019, 2021 and 2022, respectively.
The Accompanying Notes are an Integral Part of these Financial Statements.
Miller Income Fund 2022 Annual Report
23
Notes to financial statements
1. Organization
Miller Income Fund (the "Fund") is a separate non-diversified investment series of the Trust for Advised Portfolios (the "Trust"), a Delaware Statutory Trust registered under the Investment Company Act of 1940, as amended (the "1940 Act"). The Fund seeks to provide a high level of income while maintaining the potential for growth.
2. Significant accounting policies
The following is a summary of significant accounting policies consistently followed by the Fund in preparation of its financial statements. These policies are in conformity with U.S. generally accepted accounting principles ("U.S. GAAP") for investment companies. The Fund is considered an investment company under U.S. GAAP and follows the accounting and reporting guidance applicable to investment companies in the Financial Accounting Standards Board Accounting Standards Topic 946. The presentation of financial statements in conformity with U.S. GAAP requires management to make estimates and assumptions that affect the reported amounts of assets and liabilities and disclosure of contingent assets and liabilities at the date of the financial statements and the reported amounts of income and expenses. Actual results may differ from those estimates.
(a) Investment valuation. Investments in securities traded on a national securities exchange are valued at the last reported sales price on the exchange on which the security is principally traded. Securities traded on the NASDAQ exchanges are valued at the NASDAQ Official Closing Price ("NOCP"). Exchange-traded securities for which no sale was reported and NASDAQ securities for which there is no NOCP are valued at the mean of the most recent quoted bid and ask prices. Long-term fixed income securities are valued using prices provided by an independent pricing service approved by the Board of Trustees. Pricing services may use various valuation methodologies, including matrix pricing and other analytical models as well as market transactions and dealer quotations. Securities for which market quotations are not readily available are valued at their estimated fair value as determined in good faith by Miller Value Partners, LLC (the "Adviser") under procedures established by and under the general supervision and responsibility of the Board.
Various inputs are used in determining the value of the Fund's investments. These inputs are summarized into three broad levels and described below:
• Level 1 — quoted prices in active markets for identical investments
Miller Income Fund 2022 Annual Report
24
• Level 2 — other significant observable inputs (including quoted prices for similar investments, interest rates, prepayment speeds, credit risk, etc.).
• Level 3 — significant unobservable inputs, including the Fund's own assumptions in determining the fair value of investments.
The inputs or methodologies used for valuing securities are not necessarily an indication of the risk associated with investing in those securities. The following is a summary of the inputs used in valuing the Fund's assets carried at fair value:
|
Description |
Quoted Prices (Level 1) |
Other Significant Observable Inputs (Level 2) |
Significant Unobservable Inputs (Level 3) |
Total |
|||||||||||||||
|
Investments* |
|||||||||||||||||||
|
Common Stocks |
$ |
116,434,008 |
$ |
— |
$ |
— |
** |
$ |
116,434,008 |
||||||||||
|
Preferred Stocks |
1,503,650 |
— |
— |
1,503,650 |
|||||||||||||||
|
Convertible Bond |
— |
1,443,920 |
— |
1,443,920 |
|||||||||||||||
|
Corporate Bonds |
— |
37,685,723 |
— |
37,685,723 |
|||||||||||||||
|
Rights |
— |
— |
— |
*** |
— |
||||||||||||||
|
Total Investments |
$ |
117,937,658 |
$ |
39,129,643 |
$ |
— |
$ |
157,067,301 |
|||||||||||
* See Schedule of Investments for additional detailed categorizations.
** Russia's invasion of Ukraine has led to unprecedented market and policy responses of governments and regulators around the world. As a result there is no functioning or orderly market to the facilitate the liquidation of any Russian-based securities held by the Fund. As a result, the Russian securities held in the Fund are deemed illiquid and considered worthless.
*** Valued at zero.
The following is a reconciliation of investments in which significant unobservable inputs (Level 3) were used in determining fair value:
|
Investments in Securities |
Common Stocks |
Convertible Preferred Stocks |
|||||||||
|
Balance at September 30, 2021 |
$ |
— |
$ |
3,758,225 |
|||||||
|
Change in unrealized appreciation (depreciation) |
(5,312,204 |
) |
(327,545 |
) |
|||||||
|
Transfer into (Transfer out of) Level 3*** |
5,312,204 |
(3,430,680 |
) |
||||||||
|
Balance at September 30, 2022 |
$ |
— |
$ |
— |
|||||||
|
Change in unrealized appreciation (depreciation) for Level 3 securities held at September 30, 2022 |
$ |
— |
$ |
— |
|||||||
*** The Stronghold Digital Mining Series A & B convertible preferred stocks were converted into common stock in December 2021. The stock is valued using current market quotations. The Russian securities were transferred to level 3 as noted above.
Miller Income Fund 2022 Annual Report
25
Notes to financial statements (cont'd)
(b) Return of capital estimates. Distributions received from the Fund's investments in Master Limited Partnerships ("MLPs") generally are comprised of income and return of capital. Distributions received from the Fund's investments in Real Estate Investment Trusts ("REITs") generally are comprised of income, realized capital gains and return of capital. It is the policy of the Fund to estimate the character of distributions received from underlying REITs and MLPs based on historical information available from each MLP or REIT and other industry sources. These estimates may subsequently be revised based on information received from the MLPs and REITs after their tax reporting periods are concluded.
(c) Security transactions and investment income. Security transactions are accounted for on a trade date basis. Interest income, adjusted for amortization of premium and accretion of discount, is recorded on accrual basis. Dividend income is recorded on the ex-dividend date. The cost of investments sold is determined by use of the specific identification method. To the extent any issuer defaults or a credit event occurs that impacts the issuer, the Fund may halt any additional interest income accruals and consider the realizability of interest accrued up to the date of default or credit event.
(d) Distributions to shareholders. Distributions are declared and paid on a quarterly basis. The Fund intends to distribute all of its net investment income earned each quarter and any cash received during the quarter from its investments in MLPs and REITs. The Fund intends to distribute the cash received from MLPs and REITs even if all or a portion of that cash may represent a return of capital to the Fund. Distributions of net realized gains, if any, are declared at least annually. The character of distributions made to shareholders during the period may differ from their ultimate characterization for federal income tax purposes. Distributions to shareholders of the Fund are recorded on the ex-dividend date and are determined in accordance with income tax regulations, which may differ from U.S. GAAP.
(e) Share class accounting. Investment income, common expenses and realized/ unrealized gains (losses) on investments are allocated to the various classes of the Fund on the basis of daily net assets of each class. Fees relating to a specific class are charged directly to that share class.
(f) Federal and other taxes. It is the Fund's policy to comply with the federal income and excise tax requirements of the Internal Revenue Code of 1986 (the "Code"), as amended, applicable to regulated investment companies. Accordingly, the Fund intends to distribute its taxable income and net realized gains, if any, to shareholders in accordance with timing
Miller Income Fund 2022 Annual Report
26
requirements imposed by the Code. Therefore, no federal or state income tax provision is required in the Fund's financial statements.
Management has analyzed the Fund's tax positions taken on income tax returns for all open tax years (prior three fiscal years) and has concluded that as of September 30, 2022, no provision for income tax is required in the Fund's financial statements. The Fund's federal and state income and federal excise tax returns for tax years for which the applicable statutes of limitations have not expired are subject to examination by the Internal Revenue Service and state departments of revenue. The Fund has no examination in progress and are not aware of any tax positions for which it is reasonably possible that the total amounts of unrecognized tax benefits will significantly change in the next twelve months.
3. Investment management agreement and other related party transactions
The Trust has an agreement with the Adviser to furnish investment advisory services to the Fund. Under the investment management agreement, the Fund pays an investment management fee, calculated daily and paid monthly, in accordance with the following breakpoint schedule:
|
Average Daily Net Assets |
Annual Rate |
||||||
|
First $2.5 billion |
0.700 |
% |
|||||
|
Next $5 billion |
0.675 |
||||||
|
Over $7.5 billion |
0.650 |
||||||
Effective January 31, 2020, the Adviser contractually agreed to reduce fees and pay expenses, (other than front-end or contingent deferred loads, taxes, interest expense, brokerage commissions, acquired fund fees and expenses, expenses incurred in connection with any merger or reorganization, portfolio transaction expenses, dividends paid on short sales, extraordinary expenses such as litigation, Rule 12b-1 fees, intermediary servicing fees, or any other class-specific expenses), so that such annual operating expenses will not exceed 0.89%. Separately, with respect to Class I only, the Adviser has agreed to waive fees and/or reimburse operating expenses such that the previously described annual operating expenses, plus intermediary servicing fees and other class-specific expenses, will not exceed 0.95%. These arrangements cannot be terminated prior to January 31, 2023 without the Board of Trustees' consent.
Miller Income Fund 2022 Annual Report
27
Notes to financial statements (cont'd)
Prior to January 31, 2020, the limit on annual operating expenses was established at a class level and inclusive of 12b-1 fees and shareholder servicing fees and did not exceed the class levels set forth below.
|
Class A |
Class C |
Class FI |
Class I |
Class IS |
|||||||||||||||
|
1.25 |
% |
2.00 |
% |
1.25 |
% |
0.95 |
% |
0.85 |
% |
||||||||||
During the year ended September 30, 2022, fees waived and/or expenses reimbursed amounted to $96,550.
The Adviser is permitted to recapture amounts waived and/or reimbursed to a class within 36 months of the reimbursement date if the class's total annual operating expenses have fallen to a level below the expense limitation ("expense cap") in effect at the time the fees were earned or the expenses incurred. In no case will the Adviser recapture any amount that would result, on any particular business day of the Fund, in the class's total annual operating expenses exceeding the expense cap or any other lower limit then in effect.
At September 30, 2022, the Fund had remaining fee waivers and/or expense reimbursements subject to be recaptured by the Adviser and respective dates of expiration as follows:
|
Class A |
Class C |
Class FI |
Class I |
Class IS |
|||||||||||||||||||
|
Expires September 30, 2023 |
$ |
24,517 |
$ |
25,075 |
$ |
114 |
$ |
72,819 |
$ |
49,588 |
|||||||||||||
|
Expires September 30, 2024 |
11,604 |
11,385 |
60 |
36,428 |
18,475 |
||||||||||||||||||
|
Expires September 30, 2025 |
14,095 |
12,872 |
142 |
43,867 |
25,574 |
||||||||||||||||||
|
Total |
$ |
50,216 |
$ |
49,332 |
$ |
316 |
$ |
153,114 |
$ |
93,637 |
|||||||||||||
U.S. Bancorp Fund Services, LLC, doing business as U.S. Bank Global Fund Services ("Fund Services") serves as the Fund's administrator and transfer agent. The officers of the Trust are employees of Fund Services. U.S Bank, N.A. serves as the Fund's custodian. Quasar Distributors, LLC ("Quasar"), serves as the Fund's distributor and principal underwriter. For the year ended September 30, 2022, the Fund incurred the following expenses for administration & fund accounting, transfer agent, custody and compliance fees:
|
Administration & fund accounting |
$ |
138,380 |
|||||
|
Transfer agent |
$ |
146,015 |
|||||
|
Custody |
$ |
34,055 |
|||||
|
Compliance |
$ |
13,912 |
|||||
Miller Income Fund 2022 Annual Report
28
At September 30, 2022, the Fund had payables for administration & fund accounting, transfer agent, custody and compliance fees in the following amounts:
|
Administration & fund accounting |
$ |
33,158 |
|||||
|
Transfer agent |
$ |
38,251 |
|||||
|
Custody |
$ |
7,066 |
|||||
|
Compliance |
$ |
3,570 |
|||||
The above payable amounts are included in Accrued other expenses in the Statement of assets and liabilities.
The Independent Trustees were paid $15,476 for their services and reimbursement of travel expenses during the year ended September 30, 2022. The Fund pays no compensation to the Interested Trustee or officers of the Trust.
There is a maximum initial sales charge of 5.75% for Class A shares. There is a contingent deferred sales charge ("CDSC") of 1.00% on Class C shares, which applies if redemption occurs within 12 months from purchase payment. In certain cases, Class A shares have a 1.00% CDSC, which applies if redemption occurs within 18 months from purchase payment.
For the year ended September 30, 2022, Quasar did not retain any sales charges for the Fund's Class A shares, and CDSCs for Class A and C shares.
4. Investments
During the year ended September 30, 2022, the aggregate cost of purchases and proceeds from sales of investments (excluding short-term investments) were as follows:
|
Purchases |
$ |
128,922,805 |
|||||
|
Sales |
$ |
143,804,546 |
|||||
5. Class specific expenses and distributions
The Fund has adopted a Rule 12b-1 distribution and shareholder servicing plan and under that plan the Fund pays service and/or distribution fees with respect to its Class A, Class C and Class FI shares calculated at the annual rate of 0.25%, 1.00% and 0.25% of the average daily net assets of each class, respectively.
The Fund also has arrangements with various parties to provide ongoing sub-transfer agency services for each share class. Sub-transfer agency and/or distribution fees are accrued daily and paid monthly or quarterly.
Miller Income Fund 2022 Annual Report
29
Notes to financial statements (cont'd)
For the year ended September 30, 2022, class specific expenses were as follows:
|
Service and/or Distribution Fees |
Servicing Fees |
||||||||||
|
Class A |
$ |
80,782 |
$ |
20,825 |
|||||||
|
Class C |
297,651 |
17,204 |
|||||||||
|
Class FI |
741 |
262 |
|||||||||
|
Class I |
— |
61,335 |
|||||||||
|
Total |
$ |
379,174 |
$ |
99,626 |
|||||||
Distributions by class for the year ended September 30, 2022, and year ended September 30, 2021 were as follows:
|
Year Ended September 30, 2022 |
Year Ended September 30, 2021 |
||||||||||
|
Net Investment Income: |
|||||||||||
|
Class A |
$ |
1,571,022 |
$ |
1,783,694 |
|||||||
|
Class C |
1,189,838 |
1,515,986 |
|||||||||
|
Class FI |
15,204 |
9,855 |
|||||||||
|
Class I |
5,045,915 |
6,097,488 |
|||||||||
|
Class IS |
2,964,386 |
3,104,029 |
|||||||||
|
Total |
$ |
10,786,365 |
$ |
12,511,052 |
|||||||
|
Return of Capital |
|||||||||||
|
Class A |
$ |
109,265 |
$ |
144,309 |
|||||||
|
Class C |
74,457 |
96,169 |
|||||||||
|
Class FI |
1,050 |
669 |
|||||||||
|
Class I |
297,320 |
403,609 |
|||||||||
|
Class IS |
201,544 |
204,202 |
|||||||||
|
Total |
$ |
683,636 |
$ |
818,958 |
|||||||
6. Shares of beneficial interest
At September 30, 2022, the Trust had an unlimited number of shares of beneficial interest authorized with no par value. The Fund has the ability to issue multiple classes of shares. Each class of shares represents an identical interest and has the same rights, except that each class bears certain direct expenses, including those specifically related to the distribution of its shares.
Transactions in shares of each class were as follows:
|
Year Ended September 30, 2022 |
Year Ended September 30, 2021 |
||||||||||||||||||
|
Shares |
Amount |
Shares |
Amount |
||||||||||||||||
|
Class A |
|||||||||||||||||||
|
Shares sold |
954,895 |
$ |
7,249,681 |
1,136,088 |
$ |
9,459,909 |
|||||||||||||
|
Shares issued on reinvestment |
224,073 |
1,631,126 |
215,683 |
1,873,494 |
|||||||||||||||
|
Shares repurchased |
(888,161 |
) |
(7,021,902 |
) |
(1,663,320 |
) |
(13,746,659 |
) |
|||||||||||
|
Net increase (decrease) |
290,807 |
$ |
1,858,905 |
(311,549 |
) |
$ |
(2,413,256 |
) |
|||||||||||
Miller Income Fund 2022 Annual Report
30
|
Year Ended September 30, 2022 |
Year Ended September 30, 2021 |
||||||||||||||||||
|
Shares |
Amount |
Shares |
Amount |
||||||||||||||||
|
Class C |
|||||||||||||||||||
|
Shares sold |
140,290 |
$ |
1,261,983 |
563,981 |
$ |
4,541,288 |
|||||||||||||
|
Shares issued on reinvestment |
169,495 |
1,243,275 |
182,908 |
1,584,896 |
|||||||||||||||
|
Shares repurchased |
(837,582 |
) |
(6,429,441 |
) |
(1,137,349 |
) |
(9,504,048 |
) |
|||||||||||
|
Net decrease |
(527,797 |
) |
$ |
(3,924,183 |
) |
(390,460 |
) |
$ |
(3,377,864 |
) |
|||||||||
|
Class FI |
|||||||||||||||||||
|
Shares sold |
34,695 |
$ |
306,350 |
13,108 |
$ |
114,986 |
|||||||||||||
|
Shares issued on reinvestment |
2,246 |
16,253 |
1,071 |
9,466 |
|||||||||||||||
|
Shares repurchased |
(18,805 |
) |
(157,348 |
) |
(9,843 |
) |
(86,869 |
) |
|||||||||||
|
Net increase |
18,136 |
$ |
165,255 |
4,336 |
$ |
37,583 |
|||||||||||||
|
Class I |
|||||||||||||||||||
|
Shares sold |
1,641,524 |
$ |
13,230,435 |
3,603,979 |
$ |
30,637,294 |
|||||||||||||
|
Shares issued on reinvestment |
689,695 |
5,082,198 |
711,807 |
6,193,965 |
|||||||||||||||
|
Shares repurchased |
(4,829,740 |
) |
(38,300,608 |
) |
(3,347,463 |
) |
(28,132,900 |
) |
|||||||||||
|
Net increase (decrease) |
(2,498,521 |
) |
$ |
(19,987,975 |
) |
968,323 |
$ |
8,698,359 |
|||||||||||
|
Class IS |
|||||||||||||||||||
|
Shares issued on reinvestment |
296,950 |
$ |
2,455,773 |
380,847 |
$ |
3,308,231 |
|||||||||||||
|
Shares repurchased |
386,878 |
2,828,928 |
— |
— |
|||||||||||||||
|
Net increase |
683,828 |
$ |
5,284,701 |
380,847 |
$ |
3,308,231 |
|||||||||||||
|
Total increase (decrease) |
(2,033,547 |
) |
$ |
(16,603,297 |
) |
651,497 |
$ |
6,253,053 |
|||||||||||
7. Income tax information
At September 30, 2022, the components of accumulated earnings (losses) for federal income tax purposes were as follows:
|
Tax cost of investments |
$ |
201,823,014 |
|||||
|
Gross unrealized appreciation |
$ |
12,696,793 |
|||||
|
Gross unrealized depreciation |
(57,454,874 |
) |
|||||
|
Net unrealized depreciation |
$ |
(44,758,081 |
) |
||||
|
Capital loss carryforwards |
(20,027,109 |
) |
|||||
|
Other book/tax temporary differences(a) |
(77,210 |
) |
|||||
|
Total accumulated loss |
$ |
(64,862,400 |
) |
||||
(a) Other book/tax temporary differences are attributable to book/tax differences in the timing of the deductibility of various expenses.
GAAP requires that certain components of net assets be reclassified to reflect permanent differences between financial and tax reporting. These reclassifications have no effect on net assets or net asset value per share.
Miller Income Fund 2022 Annual Report
31
Notes to financial statements (cont'd)
For the year ended September 30, 2022, the following reclassifications have been made:
|
Accumulated Net Earnings |
Paid-in Capital |
||||||||||
|
(a) |
$ |
(336,705 |
) |
$ |
336,705 |
||||||
(a) Reclassifications are due to the difference between the estimated and actual tax return of capital amount and book/tax differences in the treatment of various items.
At September 30, 2022, the Fund had capital loss carryforwards, which reduce the Fund's taxable income arising from future net realized gains on investments, if any, to the extent permitted by the Internal Revenue Code, and thus will reduce the amount of distributions to shareholders which would otherwise be necessary to relieve the Fund of any liability for federal tax. Pursuant to the Internal Revenue Code, the character of such capital loss carryforwards is as follows:
|
Not Subject to Expiration |
|||||||||||||||
|
Short-Term |
Long-Term |
Total |
|||||||||||||
|
$ |
15,818,977 |
$ |
4,208,132 |
$ |
20,027,109 |
||||||||||
8. Control Ownership
The beneficial ownership, either directly or indirectly, of more than 25% of the voting securities of a fund creates presumption of control of the fund under 2(a)(9) of the 1940 Act. As of September 30, 2022, Morgan Stanley, LLC. held approximately 27%, in aggregate for the benefit of others, of the outstanding shares of the Fund.
9. Line of Credit
The Fund has access to a $25 million line of credit through an agreement with US Bank. The Fund may temporarily draw on the line of credit to satisfy redemption requests or settle investment transactions. Interest is charged to the Fund based on its borrowings at a rate per annum equal to the Prime Rate, to be paid monthly. Loan activity for the year ended September 30, 2022 was as follows:
|
Maximum available credit |
$ |
25,000,000 |
|||||
|
Largest amount outstanding on an individual day |
$ |
5,835,000 |
|||||
|
Average daily loan outstanding |
$ |
952,538 |
|||||
|
Interest expense |
$ |
16,087 |
|||||
|
Loan outstanding as of September 30, 2022 |
$ |
516,000 |
|||||
|
Average interest rate |
4.19 |
% |
|||||
Miller Income Fund 2022 Annual Report
32
10. Subsequent Events
Management has evaluated events and transactions that occurred subsequent to September 30, 2022 through the date the financial statements have been issued and has determined that there were no significant subsequent events that would require adjustment to or additional disclosure in these financial statements.
11. New Pronouncement
In June 2022, the FASB issued Accounting Standards Update 2022-03, which amends Fair Value Measurement (Topic 820): Fair Value Measurement of Equity Securities Subject to Contractual Sale Restrictions ("ASU 2022-03"). ASU 2022-03 clarifies guidance for fair value measurement of an equity security subject to a contractual sale restriction and establishes new disclosure requirements for such equity securities. ASU 2022-03 is effective for fiscal years beginning after December 15, 2023 and for interim periods within those fiscal years, with early adoption permitted. Management is currently evaluating the impact of these amendments on the financial statements.
Miller Income Fund 2022 Annual Report
33
Report of independent registered public accounting firm
To the Board of Trustees of Trust for Advised Portfolios
and the Shareholders of Miller Income Fund
Opinion on the Financial Statements
We have audited the accompanying statement of assets and liabilities of Miller Income Fund, a series of shares of beneficial interest in Trust for Advised Portfolios (the "Fund"), including the schedule of investments, as of September 30, 2022, and the related statement of operations for the year then ended, the statements of changes in net assets for each of the years in the two-year period then ended and the financial highlights for each of the years in the five-year period then ended, and the related notes (collectively referred to as the "financial statements"). In our opinion, the financial statements present fairly, in all material respects, the financial position of the Fund as of September 30, 2022, and the results of its operations for the year then ended, the changes in its net assets for each of the years in the two-year period then ended and its financial highlights for each of the years in the five-year period then ended, in conformity with accounting principles generally accepted in the United States of America.
Basis for Opinion
These financial statements are the responsibility of the Fund's management. Our responsibility is to express an opinion on the Fund's financial statements based on our audits. We are a public accounting firm registered with the Public Company Accounting Oversight Board (United States) ("PCAOB") and are required to be independent with respect to the Fund in accordance with the U.S. federal securities law and the applicable rules and regulations of the Securities and Exchange Commission and the PCAOB.
We conducted our audits in accordance with the standards of the PCAOB. Those standards require that we plan and perform the audits to obtain reasonable assurance about whether the financial statements are free of material misstatement, whether due to error or fraud. The Fund is not required to have, nor were we engaged to perform, an audit of its internal control over financial reporting. As part of our audits we are required to obtain an understanding of internal control over financial reporting but not for the purpose of expressing an opinion on the effectiveness of the Fund's internal control over financial reporting. Accordingly, we express no such opinion.
Miller Income Fund 2022 Annual Report
34
Our audits included performing procedures to assess the risk of material misstatement of the financial statements, whether due to error or fraud, and performing procedures that respond to those risks. Such procedures included examining, on a test basis, evidence regarding the amounts and disclosures in the financial statements. Our procedures included confirmation of securities owned as of September 30, 2022 by correspondence with the custodian, brokers, or by other appropriate auditing procedures where replies from brokers were not received. Our audits also included evaluating the accounting principles used and significant estimates made by management, as well as evaluating the overall presentation of the financial statements. We believe that our audits provide a reasonable basis for our opinion.

BBD, LLP
We have served as the auditor of one or more of the Funds in the Trust for Advised Portfolios since 2010.
Philadelphia, Pennsylvania
November 29, 2022
Miller Income Fund 2022 Annual Report
35
Approval of investment advisory agreement for Miller Income Fund (unaudited)
At a meeting held on August 25 and 26, 2022, the Board of Trustees (the "Board") of Trust for Advised Portfolios (the "Trust"), including all Trustees who are not "interested persons" of the Trust ("Independent Trustees"), as that term is defined in the Investment Company Act of 1940, considered and approved the continuance of the investment advisory agreement ("Advisory Agreement") with Miller Value Partners, LLC (the "Adviser"), for the Miller Income Fund (the "Fund").
Ahead of the August meeting, the Board received and reviewed substantial information regarding the Fund, the Adviser and the services provided by the Adviser to the Fund under the Advisory Agreement. This information formed the primary (but not exclusive) basis for the Board's determinations. The information prepared specifically for the annual review of the Advisory Agreement supplemented the information provided to the Board and its committees throughout the year. The Board and its committees met regularly during the year and the information provided and topics discussed at such meetings were relevant to the review of the Advisory Agreement. Some of these reports and other data included, among other things, materials that outlined the investment performance of the Fund; compliance, regulatory, and risk management matters; the trading practices of the Adviser; valuation of investments; fund expenses; and overall market and regulatory developments. The Trustees considered the review of the Advisory Agreement to be an ongoing process and employed the accumulated information, knowledge, and experience they had gained during their tenure on the Board governing the Fund and working with the Adviser in their review of the Advisory Agreement. The Independent Trustees were advised by independent legal counsel during the annual review process as well as throughout the year, including meeting in executive sessions with such counsel without representatives from the Adviser present. In connection with their annual review, the Independent Trustees also received a memorandum from independent legal counsel outlining their fiduciary duties and legal standards in reviewing the Advisory Agreement.
In considering the continuance of the Advisory Agreement, the Board considered the following factors and made the following determinations. In its deliberations, the Board did not identify any single factor or piece of information as all important, controlling, or determinative of its decision, and each Trustee may have attributed different weights to the various factors and information.
Miller Income Fund 2022 Annual Report
36
• In considering the nature, extent and quality of the services provided by the Adviser, the Trustees considered the Adviser's specific responsibilities in all aspects of the day-to-day management of the Fund, as well as the qualifications, experience and responsibilities of the portfolio managers and other key personnel who are involved in the day-to-day activities of the Fund. The Board also considered the Adviser's resources and compliance structure, including information regarding its compliance program, chief compliance officer, and compliance record and its disaster recovery/business continuity plan. The Board also considered the existing relationship between the Adviser and the Trust, as well as the Board's knowledge of the Adviser's operations, and noted that during the course of the year, it met with the Adviser to discuss fund performance and investment outlook, as well as various marketing and compliance topics, including the Adviser's risk management process. The Board concluded that the Adviser had sufficient quality and depth of personnel, resources, investment methods and compliance policies and procedures essential to performing its duties under the Advisory Agreement and that, in the Board's view, the nature, overall quality, and extent of the management services provided were and would continue to be satisfactory and reliable.
• In assessing the quality of the portfolio management delivered by the Adviser, the Board reviewed the performance of the Fund on both an absolute basis and in comparison to its peer group and relevant benchmark indexes. The Board considered that the Fund had underperformed relative to its peer group median and average for the one-, three, and five-year periods. The Board also considered that the Fund underperformed relative to its benchmark for the one-, three-, and five-year periods as of June 30, 2022.
• The Trustees also reviewed the cost of the Adviser's services, and the structure and level of the advisory fee payable by the Fund, including a comparison of the fee to fees payable by a peer group of funds. The Board noted that the Adviser had contractually agreed to maintain annual expense caps for the Fund. The Board noted that the Fund's advisory fee and net expense ratio were lower than the peer group median and average. After reviewing the materials that were provided, the Trustees noted that the fee to be received by the Adviser was within
Miller Income Fund 2022 Annual Report
37
Approval of investment advisory agreement for Miller Income Fund (unaudited) (cont'd)
the range of advisory fees charged to comparable funds and concluded that such fee was fair and reasonable.
• The Trustees considered that, in addition to the Adviser's commitment to maintain its caps on the Fund's expense ratio, the Adviser's advisory fee schedule includes breakpoints, which allow for economies of scale to be shared through reductions in the advisory fee as Fund assets grow.
• The Trustees considered the profitability of the Adviser from managing the Fund. In assessing the Adviser's profitability, the Trustees reviewed the financial information that was provided in the August meeting materials and took into account both the direct and indirect benefits to the Adviser from managing the Fund. The Trustees concluded that the Adviser's profits from managing the Fund were not excessive and, after a review of the relevant financial information, that the Adviser appeared to have adequate capitalization and/or would maintain adequate profit levels to support the Fund.
Miller Income Fund 2022 Annual Report
38
Additional information (unaudited)
September 30, 2022
Proxy Voting Policies and Procedures
You may obtain a description of the Fund's proxy voting policy and voting records, without charge, upon request by contacting the Funds directly at 1-888-593-5110 or on the EDGAR Database on the SEC's website at www.sec.gov. The Fund files its proxy voting records annually as of June 30, with the SEC on Form N-PX. The Fund's Form N-PX is available without charge by visiting the SEC's website at www.sec.gov and may be reviewed and copied at the SEC's Public Reference Room in Washington D.C. You may obtain information on the operation of the Public Reference Room by calling 1-800-SEC-0330.
Quarterly Portfolio Schedule
The Fund files its complete schedule of portfolio holdings for the first and third quarters of each fiscal year with the SEC as an exhibit to its reports on Form N-PORT. The Fund's Form N-PORT reports are available without charge by visiting the SEC's website at www.sec.gov and may be reviewed and copied at the SEC's Public Reference Room in Washington D.C. You may obtain information on the operation of the Public Reference Room by calling (800) SEC-0330.
Qualified Dividend Income/Dividends Received Reduction
For the year ended September 30, 2022, certain dividends paid by the Fund may be reported as qualified dividend income (QDI) and are eligible for taxation at capital gains rates.
The percentage of dividends declared from ordinary income designated as qualified dividend income was 52.90%.
For corporate shareholders, the percent of ordinary income distributions qualifying for the corporate dividends received deduction for the fiscal year ended September 30, 2022, was 37.13%.
Statement Regarding Liquidity Risk Management Program
The Fund has adopted a liquidity risk management program. The Fund's Board has designated a committee of the Adviser to serve as the administrator of the program. Personnel of the Adviser conducts the day-to-day operation of the program pursuant to policies and procedures administered by the committee.
Under the program, the committee manages the Fund's liquidity risk, which is the risk that the Fund could not meet shareholder redemption requests without significant dilution of remaining shareholders' interests in the Fund. This risk is managed by monitoring the degree of liquidity of
Miller Income Fund 2022 Annual Report
39
Additional information (unaudited) (cont'd)
September 30, 2022
the Fund's investments, limiting the amount of the Fund's illiquid investments, and utilizing various risk management tools and facilities available to the Fund for meeting shareholder redemptions, among other means. The committee's process of determining the degree of liquidity of the Fund's investments is supported by one or more third-party liquidity assessment vendors.
The Fund's Board reviewed a report prepared by the committee regarding the operation and effectiveness of the program for the period January 1, 2021 through December 31, 2021. No liquidity events impacting the Fund were noted in the report. In addition, the committee provided its assessment that the program had been effective in managing the Fund's liquidity risk.
Miller Income Fund 2022 Annual Report
40
Additional information (unaudited)
Information about Trustees and Officers
|
Name, Address and Age |
Position(s) Held with Trust |
Term of Office(1) and Length of Time Served |
Principal Occupation(s) During Past 5 Years |
Number of Portfolios in Fund Complex(2) Overseen by Trustee |
Other Directorships(3) Held During Past 5 Years by Trustee |
||||||||||||||||||
|
Independent Trustees(4) |
|||||||||||||||||||||||
|
Harry E. Resis 615 E. Michigan Street Milwaukee, WI 53202 Year of birth: 1945 |
Trustee |
Since 2012 |
Private investor. Previously served as Director of US Fixed Income for Henderson Global Investors |
1 |
None |
||||||||||||||||||
|
Brian S. Ferrie 615 E. Michigan Street Milwaukee, WI 53202 Year of birth: 1958 |
Trustee |
Since 2020 |
Chief Compliance Officer, Treasurer, The Jensen Quality Growth Fund (2004 to 2020); Treasurer, Jensen Investment Management (2003 to 2020) |
1 |
None |
||||||||||||||||||
|
Wan-Chong Kung 615 E. Michigan Street Milwaukee, WI 53202 Year of birth: 1960 |
Trustee |
Since 2020 |
Senior Fund Manager, Nuveen Asset Management (FAF Advisors/First American Funds) (2011 to 2019) |
1 |
None |
||||||||||||||||||
|
Interested Trustee(5) |
|||||||||||||||||||||||
|
Christopher E. Kashmerick 615 E. Michigan Street Milwaukee, WI 53202 Year of birth: 1974 |
Trustee, Chairman |
Since 2018 |
Senior Vice President, U.S. Bancorp Fund Services, LLC (2011 to present) |
1 |
None |
||||||||||||||||||
Miller Income Fund 2022 Annual Report
41
Additional information (unaudited) (cont'd)
Information about Trustees and Officers
|
Name, Address and Age |
Position(s) Held with Trust |
Term of Office(1) and Length of Time Served |
Principal Occupation(s) During Past 5 Years |
||||||||||||
|
Officers |
|||||||||||||||
|
Russell B. Simon 615 E. Michigan Street Milwaukee, WI 53202 Year of birth: 1980 |
President and Principal Executive Officer |
Since 2022 |
Vice President, U.S. Bancorp Fund Services, LLC (2011 to present) |
||||||||||||
|
Jack Huntington 615 E. Michigan Street Milwaukee, WI 53202 Year of birth: 1970 |
Vice President, Chief Compliance Officer and AML Officer |
Since 2022 |
Vice President, U.S. Bancorp Fund Services, LLC (2022 to present); Director and Fund Chief Compliance Officer, Foreside Fund Officer Services, LLC (2015 to 2022) |
||||||||||||
|
Eric T. McCormick 615 E. Michigan Street Milwaukee, WI 53202 Year of birth: 1971 |
Treasurer and Principal Financial Officer |
Since 2022 |
Vice President, U.S. Bancorp Fund Services, LLC (2005 to present) |
||||||||||||
|
Scott A. Resnick 615 E. Michigan Street Milwaukee, WI 53202 Year of birth: 1983 |
Secretary |
Since 2019 |
Assistant Vice President, U.S. Bancorp Fund Services, LLC (2018 to present); Associate, Legal & Compliance, PIMCO (2012 to 2018) |
||||||||||||
(1) Each Trustee serves an indefinite term; however, under the terms of the Board's retirement policy, a Trustee shall retire at the end of the calendar year in which he or she reaches the age of 75 (this policy does not apply to any Trustee serving at the time the policy was adopted). Each officer serves an indefinite term until the election of a successor.
(2) The Trust is comprised of numerous series managed by unaffiliated investment advisers. The term "Fund Complex" applies only to the Fund. The Fund does not hold itself out as related to any other series within the Trust for purposes of investment and investor services, nor do they share the same investment advisor with any other series.
(3) "Other Directorships Held" includes only directorships of companies required to register or file reports with the SEC under the Securities Exchange Act of 1934, as amended, (that is, "public companies") or other investment companies registered under the 1940 Act.
(4) The Trustees of the Trust who are not "interested persons" of the Trust as defined under the 1940 Act ("Independent Trustees").
(5) Mr. Kashmerick is an "interested person" of the Trust as defined by the 1940 Act. Mr. Kashmerick is an interested Trustee of the Trust by virtue of the fact that he is an interested person of U.S. Bancorp Fund Services, LLC, the Fund's administrator, fund accountant, and transfer agent.
The Fund's Statement of Additional Information ("SAI") includes information about the Fund's Trustees and is available without charge, upon request, by calling (888) 593-5110.
Miller Income Fund 2022 Annual Report
42
Privacy notice
The Fund collects non-public information about you from the following sources:
• Information we receive about you on applications or other forms;
• Information you give us orally; and/or
• Information about your transactions with us or others.
We do not disclose any non-public personal information about our customers or former customers without the customer's authorization, except as permitted by law or in response to inquiries from governmental authorities. We may share information with affiliated and unaffiliated third parties with whom we have contracts for servicing the Fund. We will provide unaffiliated third parties with only the information necessary to carry out their assigned responsibilities. We maintain physical, electronic and procedural safeguards to guard your non-public personal information and require third parties to treat your personal information with the same high degree of confidentiality.
In the event that you hold shares of the Fund through a financial intermediary, including, but not limited to, a broker-dealer, bank, or trust company, the privacy policy of your financial intermediary would govern how your non-public personal information would be shared by those entities with unaffiliated third parties.
Miller Income Fund 2022 Annual Report
43
Investment Adviser
Miller Value Partners, LLC
One South Street
Suite 2550
Baltimore, MD 21202
Distributor
Quasar Distributors, LLC
111 East Kilbourn Ave.
Suite 2200
Milwaukee, Wisconsin 53202
Custodian
U.S. Bank National Association
Custody Operations
1555 North River Center Drive, Suite 302
Milwaukee, Wisconsin 53212
Transfer Agent
U.S. Bancorp Fund Services, LLC
615 East Michigan Street
Milwaukee, Wisconsin 53202
Independent Registered Public Accounting Firm
BBD, LLP
1835 Market Street, 3rd Floor
Philadelphia, PA 19103
Legal Counsel
Morgan, Lewis & Bockius, LLP
1111 Pennsylvania Avenue, NW
Washington, DC 20004
This report has been prepared for shareholders and may be distributed to others only if preceded or accompanied by a current prospectus.
Miller Value Funds
888.593.5110
millervaluefunds.com

| (b) | Not applicable. |
Item 2. Code of Ethics.
The registrant has adopted a code of ethics that applies to the registrant’s principal executive officer and principal financial officer. The registrant has not made any substantive amendments to its code of ethics during the period covered by this report. The registrant has not granted any waivers from any provisions of the code of ethics during the period covered by this report.
A copy of the registrant’s Code of Ethics is filed herewith.
Item 3. Audit Committee Financial Expert.
The registrant’s Board of Trustees has determined that there is at least one audit committee financial expert serving on its audit committee. Harry E. Resis and Brian S. Ferrie are “audit committee financial experts” and are considered to be “independent” as each term is defined in Item 3 of Form N-CSR.
Item 4. Principal Accountant Fees and Services.
The registrant has engaged its principal accountant to perform audit services, audit-related services, tax services and other services during the past two fiscal years. “Audit services” refer to performing an audit of the registrant's annual financial statements or services that are normally provided by the accountant in connection with statutory and regulatory filings or engagements for those fiscal years. “Audit-related services” refer to the assurance and related services by the principal accountant that are reasonably related to the performance of the audit. “Tax services” refer to professional services rendered by the principal accountant for tax compliance, tax advice, and tax planning. There were no “Other services” provided by the principal accountant. The following table details the aggregate fees billed or expected to be billed for each of the last two fiscal years for audit fees, audit-related fees, tax fees and other fees by the principal accountant.
Miller Income Fund
| BBD, LLP | ||||||||
| FYE 9/30/2022 | FYE 9/30/2021 | |||||||
| (a) Audit Fees | $ | 14,700 | $ | 14,400 | ||||
| (b) Audit-Related Fees | N/A | N/A | ||||||
| (c) Tax Fees | $ | 3,100 | $ | 3,100 | ||||
| (d) All Other Fees | N/A | N/A | ||||||
(e)(1) The audit committee has adopted pre-approval policies and procedures that require the audit committee to pre-approve all audit and non-audit services of the registrant, including services provided to any entity affiliated with the registrant.
(e)(2) The percentage of fees billed by the principal accountant applicable to non-audit services pursuant to waiver of pre-approval requirement were as follows:
Miller Income Fund
| BBD, LLP | ||||||||
| FYE 9/30/2022 | FYE 9/30/2021 | |||||||
| Audit-Related Fees | 0 | % | 0 | % | ||||
| Tax Fees | 0 | % | 0 | % | ||||
| All Other Fees | 0 | % | 0 | % | ||||
(f) All of the principal accountant’s hours spent on auditing the registrant’s financial statements were attributed to work performed by full-time permanent employees of the principal accountant.
(g) The following table indicates the non-audit fees billed or expected to be billed by the registrant’s accountant for services to the registrant and to the registrant’s investment adviser (and any other controlling entity, etc.—not sub-adviser) for the last two years.
Miller Income Fund
| BBD, LLP | ||||||||
| Non-Audit Related Fees | FYE 9/30/2022 | FYE 9/30/2021 | ||||||
| Registrant | N/A | N/A | ||||||
| Registrant’s Investment Adviser | N/A | N/A | ||||||
(h) The audit committee of the board of trustees/directors has considered whether the provision of non-audit services that were rendered to the registrant's investment adviser is compatible with maintaining the principal accountant's independence and has concluded that the provision of such non-audit services by the accountant has not compromised the accountant’s independence.
(i) Not applicable
(j) Not applicable
Item 5. Audit Committee of Listed Registrants.
Not applicable to registrants who are not listed issuers (as defined in Rule 10A-3 under the Securities Exchange Act of 1934).
Item 6. Investments.
| (a) | Schedule of Investments is included as part of the report to shareholders filed under Item 1 of this Form. |
| (b) | Not Applicable |
Item 7. Disclosure of Proxy Voting Policies and Procedures for Closed-End Management Investment Companies.
Not applicable to open-end investment companies.
Item 8. Portfolio Managers of Closed-End Management Investment Companies.
Not applicable to open-end investment companies.
Item 9. Purchases of Equity Securities by Closed-End Management Investment Company and Affiliated Purchasers.
Not applicable to open-end investment companies.
Item 10. Submission of Matters to a Vote of Security Holders.
There have been no material changes to the procedures by which shareholders may recommend nominees to the registrant’s board of trustees.
Item 11. Controls and Procedures.
| (a) | The Registrant’s President and Treasurer have reviewed the Registrant's disclosure controls and procedures (as defined in Rule 30a-3(c) under the Investment Company Act of 1940 (the “Act”)) as of a date within 90 days of the filing of this report, as required by Rule 30a-3(b) under the Act and Rules 13a-15(b) or 15d-15(b) under the Securities Exchange Act of 1934. Based on their review, such officers have concluded that the disclosure controls and procedures are effective in ensuring that information required to be disclosed in this report is appropriately recorded, processed, summarized and reported and made known to them by others within the Registrant and by the Registrant’s service provider. |
| (b) | There were no changes in the Registrant's internal control over financial reporting (as defined in Rule 30a-3(d) under the Act) that occurred during the second fiscal quarter of the period covered by this report that has materially affected, or is reasonably likely to materially affect, the Registrant's internal control over financial reporting. |
Item 12. Disclosure of Securities Lending Activities for Closed-End Management Investment Companies
Not applicable to open-end investment companies.
Item 13. Exhibits.
(3) Any written solicitation to purchase securities under Rule 23c-1 under the Act sent or given during the period covered by the report by or on behalf of the registrant to 10 or more persons. Not applicable to open-end investment companies.
(4) Change in the registrant’s independent public accountant. There was no change in the registrant’s independent public accountant for the period covered by this report.
| (b) | Certifications pursuant to Section 906 of the Sarbanes-Oxley Act of 2002. Furnished herewith. |
SIGNATURES
Pursuant to the requirements of the Securities Exchange Act of 1934 and the Investment Company Act of 1940, the registrant has duly caused this report to be signed on its behalf by the undersigned, thereunto duly authorized.
| Trust for Advised Portfolios | |||
| By | /s/ Russell B. Simon | ||
| Russell B. Simon, President | |||
| Date | 12/6/2022 | ||
Pursuant to the requirements of the Securities Exchange Act of 1934 and the Investment Company Act of 1940, this report has been signed below by the following persons on behalf of the registrant and in the capacities and on the dates indicated.
| By | /s/ Russell B. Simon | ||
| Russell B. Simon, President | |||
| Date | 12/6/2022 | ||
| By | /s/ Eric T. McCormick | ||
| Eric T. McCormick, Treasurer | |||
| Date | 12/7/2022 | ||
ATTACHMENTS / EXHIBITS
Serious News for Serious Traders! Try StreetInsider.com Premium Free!
You May Also Be Interested In
- Rubrik Announces Pricing of Upsized Initial Public Offering
- Best’s Market Segment Report: Underwriting Conditions for UAE Insurers on Track to Improve Amid IFRS 17 Transition
- NICOLE ARI PARKER IS THE FACE OF KAREN MILLEN'S ICONS SERIES VOL. 6
Create E-mail Alert Related Categories
SEC FilingsSign up for StreetInsider Free!
Receive full access to all new and archived articles, unlimited portfolio tracking, e-mail alerts, custom newswires and RSS feeds - and more!
