

Form N-CSR Smead Funds Trust For: Nov 30
 Tweet
Tweet Share
ShareTable of Contents
UNITED STATES
SECURITIES AND EXCHANGE COMMISSION
Washington, D.C. 20549
FORM N-CSR
CERTIFIED SHAREHOLDER REPORT OF
REGISTERED MANAGEMENT INVESTMENT COMPANIES
Investment Company Act file number: 811-22985
SMEAD FUNDS TRUST
(Exact name of registrant as specified in charter)
2777 East Camelback Road, Suite 375
Phoenix, AZ 85016
(Address of principal executive offices) (Zip code)
Cole W. Smead
Smead Capital Management, Inc.
2777 East Camelback Road, Suite 375
Phoenix, AZ 85016
Copy to:
Pamela M. Krill, Esq
Godfrey & Kahn, S.C.
833 East Michigan Street, Suite 1800
Milwaukee, WI 53202
(Name and address of agent for service)
Registrant’s telephone number, including area code: (877) 701-2883
Date of fiscal year end: November 30
Date of reporting period: November 30, 2022
Table of Contents
Item 1. Report to Shareholders.
(a)
2
Table of Contents
Annual Report
November 30, 2022
Investment Adviser
Smead Capital Management, Inc.
2777 East Camelback Road
Suite 375
Phoenix, AZ 85016
Phone: 877-807-4122
www.smeadfunds.com
Table of Contents
| 1 | ||||
| 7 | ||||
| 9 | ||||
| 15 | ||||
| 20 | ||||
| 24 | ||||
| 26 | ||||
| 28 | ||||
| 34 | ||||
| 46 | ||||
| BASIS FOR TRUSTEES’ APPROVAL OF |
47 | |||
| 51 | ||||
| 52 | ||||
Table of Contents
Letter to Shareholders – Smead Value Fund
Fiscal 2022 in the Smead Value Fund (SMVLX) was especially rewarding for a number of reasons. First, we built on the gains we made in fiscal 2021. The Smead Value Fund, Investor Class, gained 5.70% versus a loss of 9.21% in the S&P 500 Index and a gain of 2.42% in the Russell 1000 Value Index. Second, we made those gains with a minimum of turnover and capital gains, while absorbing some sharp declines in meritorious companies we want to own in the future. Third, we believe we ended the year positioned to survive the remainder of the bear market in stocks, regardless of how long it lasts.
Our best-performing stocks were all oil and gas stocks. Continental Resources (CLR), Occidental Petroleum (OXY) and ConocoPhillips (COP) were our best performers. As you will see below, we have reasons to believe that owning fossil fuel production could be beneficial to our shareholders over the next decade.
The three poorest-performing stocks were Warner Bros. Discovery (WBD), Target (TGT) and eBay (EBAY). The tightening by the Federal Reserve Board to get control of inflation hit consumer/media companies hard. We also withstood a major correction in our home builder stocks. We feel that they will reward us over the next ten years as 92 million millennials get married, have children and buy houses. Those houses are unlikely to come from the nation’s existing homes (which are 45 years old on average).
Dallas Buyers Club
In one of his best movies, Matthew McConaughey plays a blue-collar guy who is quite the ladies’ man. His wide array of sexual partners quickly moved from being a badge of pride to a ticket to the scariest sexually transmitted disease of all, HIV/AIDS. A frantic quest took him to Mexico to find a medicine that was proving beneficial in slowing the progression of the disease.
Once he brought the medicine back to the U.S., he found out that he couldn’t sell the medicine to a large community of gay men with HIV/AIDS, because it had never been approved by the Food and Drug Administration. In response, a club was formed with membership dues to receive the medicine via membership in the Dallas Buyers Club. He was a blessing to those who needed the medicine.
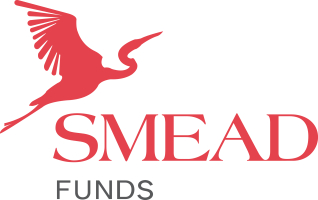
In 2022, oil prices shot all the way up to $120 per barrel as war raged in Ukraine and massive underinvestment in energy sources around the world came home to roost. Oil prices were a part of the economic disease called inflation. Even though the effect on the U.S. economy of higher oil prices has become muted in the last 20 years, it became politically expedient for President Biden to sell 200 million barrels of oil out of the Federal Government’s Strategic Petroleum Reserve. The added supply blessed gasoline buyers by bringing prices down temporarily. Numerous major oil companies took one look at refining oil without pulling it out of their reserves and formed their own Dallas Buyers Club.
1
Table of Contents
As we look out into 2023, there are many things we don’t know and a few things we think we know. We know that U.S. oil production averages around 16 million barrels per day. We know that oil and gas companies have been dissuaded from increasing oil and gas drilling as fossil fuels are treated like a pollution disease. We know that President Biden’s reserve release represented about 6.5% of U.S. oil production for about 200 days in 2022. Lastly, we know that the Strategic Petroleum Reserve must be refilled in the event that the U.S. is lured into a war somewhere around the world.
2
Table of Contents
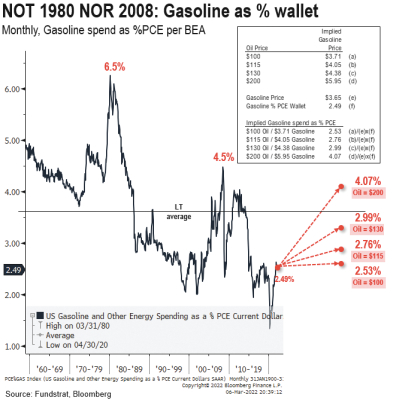
At the margin, a seller of 200 million barrels in 2022 would become one of the largest buyers of oil in 2023. As the chart below shows, oil and commodities hit a 246-year low in April 2020:
History would argue that we have years of higher oil and gas prices ahead of us, especially if the Communist government of the People’s Republic of China releases their population from its COVID-19 imprisonment and start competing on the world economic stage. Therefore, we are making every effort to over-weight our oil and gas stocks despite stock market success in 2021 and 2022.
We run a concentrated portfolio of primarily large-cap value stocks with boringly dry turnover. Thank you for participating as we work for investors who fear stock market failure.

|
| |
| William Smead Lead Portfolio Manager |
Cole Smead, CFA Co-Portfolio Manager |

3
Table of Contents
Letter to Shareholders – Smead International Value Fund
During the 2022 fiscal year, the Smead International Fund (SVXLX), Investor Class, had a gain of 17.46% versus a loss of 10.14% in the MSCI EAFE NR Index Net and a loss of 11.82% in the MSCI ACWI ex-USA NR Index.1 We are pleased that the investors of the Fund have benefited from what has transpired. The back half of the calendar year of 2022 has been more frustrating.
Our largest contributors for the fiscal year were Occidental (warrants OXY/WS US and equity OXY US), Meg Energy (MEG CN) and Cenovus (CVE CN). Energy and consumer staples were our best sector allocations. Our three largest detractors were Porsche (PAH3 GY), Persimmon (PSN LN) and IWG (IWG LN). The sectors that detracted the most were consumer discretionary and communication services.
The I Word and the R Word
The year 2022 has been notable for the number of references to the I word and the R word: Inflation and Recession. As we analyze the consequences of these words, we see that in some cases investors are acting how you’d expect and in other ways they are not. We are glad that the investing public doesn’t make perfect sense because this has been their role for the last 420 years since the Amsterdam Stock Exchange was founded in 1602.
Inflation has crept into the words of every politician, media outlet and investor dialogue. It went from being the subject of cranks and old fuddy-duddies to the word of the layman or laywoman. Inflation damages all assets in real terms. Humans begin to make different spending and capital allocation decisions based on it. For example, consumers begin to purchase non-perishable goods in advance of their need so that they can get a lower price before the prices rise. In business, companies begin to purchase higher quantities of their input. The effect of this is to hedge their future costs. We can see some of this going on in the real economy.
Historically, when inflation transforms the minds of investors, long bonds have gone to high yields and commodities have gone through the roof over time. Inflation-protecting assets became the talk of Wall Street. Stocks became hated and energy stocks became the only thing to own. We don’t see that zeitgeist in investing markets taking over yet. While Jay Powell would like to tame inflation from over 7% to lower amounts, a reduction to 5% would be the highest sustained inflation I’ve ever seen in my 39 years of life! Oil sure looks under-owned and wildly attractive to us based on how inflation hasn’t become the end-all for Wall Street yet. We like our ownership in energy companies like Occidental (OXY US), Cenovus Energy (CVE CN), MEG Energy (MEG CN) and oil tanker Frontline (FRO NO).
When it comes to recession, this is on the lips of every investor and person in the economy. It was last summer that the pool bartender at my favorite resort in Reno told me about the coming recession. Turn on any financial news and you will hear about the coming recession. In our opinion, this is the most over-played hand at the poker table. Investors particularly agree on this.
However, the economy continues to chug along. Further, in the most recent CPI and wage reports, you’ll see that workers had real wage gains as they were paid more than the inflation print. We find this to be a very dynamic economic set up globally. The recession fears are giving us great pricing in more economically-sensitive businesses. We can’t claim to know if and when these fears or the actual economic headwinds may come and subside. We just like the prices we got in brands like Canada Goose (GOOS CN),
4
Table of Contents
Pandora (PNDORA DC) and Next (NXT LN). We further like that this keeps everyone from getting more excited about higher rates in companies like BAWAG (BG AV), UniCredit (UCG IM) and Bankinter (BKT SM).
We thank you for being investors alongside us as we try to take advantage of the I and R words, inflation and recession, in investment markets.
Fear stock market failure,
|
|
| |
| Cole Smead, CFA Lead Portfolio Manager |
William Smead Co-Portfolio Manager |
| 1 | The Fund is a newly registered mutual fund and does not have a full calendar year of performance as a mutual fund. The Fund succeeded to substantially all of the assets and liabilities of the Smead International Value Fund LP, a Delaware Limited Partnership (the “Predecessor Fund”), in exchange solely for Class I1 shares of the Fund on January 11, 2022 (the “Reorganization”). Smead Private Fund Advisers, LLC, an affiliate of Smead Capital Management, Inc. (the “Adviser”), was the General Partner for the Predecessor Fund since its inception on January 12, 2015. Prior performance represents the historical performance of the Predecessor Fund, which offered partnership interests. Following the Reorganization, the Predecessor Fund was liquidated and dissolved. Please see the Fund’s Prospectus for more details. |
The information contained herein represents the opinion of Smead Capital Management, Inc. and is not intended to be a forecast of future events, a guarantee of future results, nor investment advice.
Consider the investment objectives, risks, charges and expenses of the Funds carefully before investing. The statutory and summary prospectuses contain this and other information about the Funds and are available at www.smeadcap.com or by calling 877-807-4122. Read carefully before investing.
Performance data quoted represents past performance; past performance does not guarantee future results. The investment return and principal value of an investment will fluctuate so that an investor’s shares, when redeemed, may be worth more or less than their original cost. Current performance of the Funds may be lower or higher than the performance quoted. Performance data current to the most recent month end may be obtained by calling 877-807-4122.
Mutual fund investing involves risk. Principal loss is possible.
Foreign Securities Risk. Investments in securities of foreign companies involve additional risks, including less liquidity, currency rate fluctuations, political and economic instability, differences in financial reporting standards and securities market regulation, and the imposition of foreign withholding taxes.
MSCI EAFE NR Index is a broad-based, unmanaged equity market index designed to measure the equity market performance of 21 developed markets, excluding the US and Canada. An index cannot be invested in directly. This benchmark calculates reinvested dividends net of withholding taxes using Luxembourg tax rates. MSCI ACWI ex-U.S. Index
5
Table of Contents
(Net) is a free float-adjusted market capitalization index that is designed to large and mid-cap representation across 22 of 23 Developed Markets (DM) countries (excluding the US) and 24 Emerging Markets (EM) countries. This benchmark calculates reinvested dividends net of withholding taxes using Luxembourg tax rates. One cannot invest directly in an index.
The S&P 500 Index is a broad-based unmanaged index of 500 stocks, which is widely recognized as representative of the equity market in general. The Russell 1000® Value Index measures the performance of those Russell 1000® Index companies with lower price-to-book ratios and lower forecasted growth values. Frank Russell Company is the source and owner of the trademarks, service marks and copyrights related to the Russell Indexes. Russell ® is a trademark of Russell Investment Group. One cannot invest directly in an index.
The Smead Funds are distributed by UMB Distribution Services, LLC. UMB Distribution Services, and Smead Capital Management, Inc. are not affiliated.
6
Table of Contents
SMEAD FUNDS
(Unaudited)
As a shareholder of the Funds, you incur two types of costs: (1) transaction costs, including sales charges (loads) on purchase payments and (2) ongoing costs, including management fees, distribution (12b-1) fees, shareholder servicing fees and other Fund expenses. These Examples are intended to help you understand your ongoing costs (in dollars) of investing in the Funds, and to compare these costs with the ongoing costs of investing in other mutual funds. The Examples are based on an investment of $1,000 invested at the beginning of the period and held for the entire period as indicated below.
Actual Expenses
The second and fourth columns of the following tables provide information about actual account values and actual expenses of each Class of the Funds. If you purchase Class A shares of the Funds you will pay a maximum initial sales charge of 5.75% when you invest. Class A shares and Class C shares of Smead Value Fund and the Smead International Value Fund are subject to a contingent deferred sales charge of 1.00% for purchases of $1,000,000 or more that are redeemed within eighteen months of purchase for Class A shares and redeemed within twelve months of purchase for Class C shares. In addition, you will be assessed fees for outgoing wire transfers, returned checks and stop payment orders at prevailing rates charged by UMB Fund Services, Inc., the Funds’ transfer agent. To the extent the Funds invest in shares of exchange-traded funds (“ETFs”) or other investment companies as part of their investment strategies, you will indirectly bear your proportionate share of any fees and expenses charged by the underlying funds in which the Funds invest in addition to the expenses of the Funds. Actual expenses of the underlying funds are expected to vary among the various underlying funds. These expenses are not included in the Examples. The Examples include, but are not limited to, advisory fees, fund administration and accounting, custody and transfer agent fees. You may use the information in the second and fourth columns, together with the amount you invested, to estimate the expenses that you paid over the period. Simply divide your account value by $1,000 (for example, an $8,600 account value divided by $1,000 = 8.6), then multiply the result by the applicable number under the column entitled “Actual Expenses Paid During Period” to estimate the expenses you paid on your account during this period.
Hypothetical Example for Comparison Purposes
The third and fifth columns of the following tables provide information about hypothetical account values and hypothetical expenses based on the Funds’ actual expense ratios and an assumed rate of return of 5% per year before expenses, which are not the Funds’ actual returns. The hypothetical account values and expenses may not be used to estimate the actual ending account balance or expenses you paid for the period. You may use this information to compare the ongoing costs of investing in the Funds and other funds. To do so, compare this 5% hypothetical example with the 5% hypothetical examples that appear in the shareholder reports of other funds. Please note that the expenses shown in the table are meant to highlight your ongoing costs only and do not reflect any transactional costs, such as sales charges (loads), redemption fees or exchange fees. Therefore, the third and fifth columns of the table are useful in comparing
7
Table of Contents
SMEAD FUNDS
Expense Examples (Continued)
(Unaudited)
ongoing costs only, and will not help you determine the relative total costs of owning different funds. In addition, if these transactional costs were included, your costs would have been higher.
Smead Value Fund
| Class |
Beginning Account Value 6/1/22 |
Actual Ending Account Value 11/30/22 |
Hypothetical Ending Account Value |
Actual Expense Paid During Period(1) |
Hypothetical Expenses Paid During Period(1) |
Net Expense Ratio During Period(2) | ||||||||||||||||||||||||
| Investor Class |
$ | 1,000.00 | $ | 1,036.20 | $ | 1,019.40 | $ | 5.77 | $ | 5.72 | 1.13 | % | ||||||||||||||||||
| Class A |
1,000.00 | 1,036.00 | 1,019.30 | 5.87 | 5.82 | 1.15 | ||||||||||||||||||||||||
| Class C |
1,000.00 | 1,033.20 | 1,016.60 | 8.61 | 8.54 | 1.69 | ||||||||||||||||||||||||
| Class I1 |
1,000.00 | 1,037.50 | 1,020.61 | 4.55 | 4.51 | 0.89 | ||||||||||||||||||||||||
| Class R1 |
1,000.00 | 1,034.40 | 1,017.95 | 7.24 | 7.18 | 1.42 | ||||||||||||||||||||||||
| Class R2 |
1,000.00 | 1,034.90 | 1,018.30 | 6.89 | 6.83 | 1.35 | ||||||||||||||||||||||||
| Class Y |
1,000.00 | 1,037.70 | 1,020.86 | 4.29 | 4.26 | 0.84 | ||||||||||||||||||||||||
| (1) | Investor Class, Class A, Class C, Class I1, Class R1, Class R2 and Class Y expenses are calculated using each Class’ annualized net expense ratio (as disclosed), multiplied by the average account value over the period, and multiplied by 183/365 (to reflect the most recent one-half year period). |
| (2) | Annualized. |
Smead International Value Fund
| Class |
Beginning Account Value 6/1/22 |
Actual Ending Account Value 11/30/22 |
Hypothetical Ending Account Value |
Actual Expense Paid During Period(1) |
Hypothetical Expenses Paid During Period(1) |
Net Expense Ratio During Period(2) | ||||||||||||||||||||||||
| Investor Class |
$ | 1,000.00 | $ | 914.10 | $ | 1,017.55 | $ | 7.20 | $ | 7.59 | 1.50 | % | ||||||||||||||||||
| Class A |
1,000.00 | 913.20 | 1,016.95 | 7.77 | 8.19 | 1.62 | ||||||||||||||||||||||||
| Class C |
1,000.00 | 911.40 | 1,014.94 | 9.68 | 10.20 | 2.02 | ||||||||||||||||||||||||
| Class I1 |
1,000.00 | 914.70 | 1,018.50 | 6.29 | 6.63 | 1.31 | ||||||||||||||||||||||||
| Class Y |
1,000.00 | 915.80 | 1,019.95 | 4.90 | 5.16 | 1.02 | ||||||||||||||||||||||||
| (1) | Investor Class, Class A, Class C, Class I1 and Class Y expenses are calculated using each Class’ annualized net expense ratio (as disclosed), multiplied by the average account value over the period, and multiplied by 183/365 (to reflect the most recent one-half year period). |
| (2) | Annualized. |
8
Table of Contents
SMEAD FUNDS
(Unaudited)
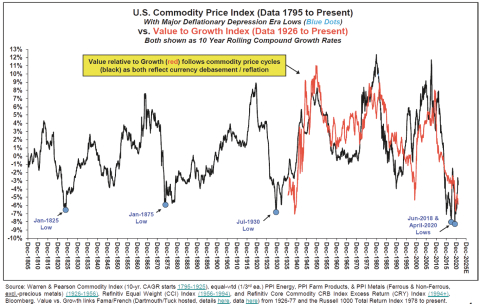
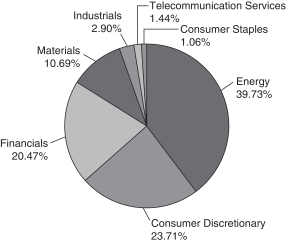
The Smead Value Fund seeks long-term capital appreciation. To achieve its investment objective, the Fund maintains approximately 25-30 companies in its portfolio and will invest in the common stocks of large capitalization U.S. companies.
Sector Breakdown
(% of Equity Investments as of November 30, 2022)
Top Ten Holdings (% of Net Assets as of November 30, 2022)
| Occidental Petroleum Corp. |
8.76% | ||||
| Merck & Co., Inc. |
6.15% | ||||
| Amgen, Inc. |
6.13% | ||||
| ConocoPhillips |
5.44% | ||||
| Simon Property Group, Inc. |
5.32% | ||||
| American Express Co. |
5.30% | ||||
| Macerich Co. (The) |
5.02% | ||||
| Lennar Corp. |
4.86% | ||||
| DR Horton, Inc. |
4.63% | ||||
| NVR, Inc. |
4.57% |
Fund holdings are subject to change at any time and should not be considered recommendations to buy or sell any security. Current and future portfolio holdings are subject to risk.
Continued
9
Table of Contents
SMEAD FUNDS
Investment Highlights (Continued)
(Unaudited)
The Smead International Value Fund seeks long-term capital appreciation. To achieve its investment objective, the Fund maintains approximately 25-30 companies in its portfolio and will invest in the common stocks of large capitalization non-U.S. companies.
Sector Breakdown
(% of Equity Investments as of November 30, 2022)
Top Ten Holdings (% of Net Assets as of November 30, 2022)
| Occidental Petroleum Corp. – Warrant |
9.34% | ||||
| Occidental Petroleum Corp. |
7.63% | ||||
| Cenovus Energy, Inc. |
7.47% | ||||
| MEG Energy Corp. |
7.45% | ||||
| West Fraser Timber Co. Ltd. |
5.83% | ||||
| UniCredit SpA |
4.63% | ||||
| BAWAG Group AG |
4.63% | ||||
| Interfor Corp. |
4.49% | ||||
| Frontline Ltd. |
4.42% | ||||
| Porsche Automobil Holding SE |
4.36% |
Fund holdings are subject to change at any time and should not be considered recommendations to buy or sell any security. Current and future portfolio holdings are subject to risk.
Continued
10
Table of Contents
SMEAD FUNDS
Investment Highlights (Continued)
(Unaudited)
Average Annual Total Returns for the period ended November 30, 2022
| Smead Value Fund |
Inception Date |
1 Year | 5 Year | 10 Year | Since Inception | ||||||||||||||||||||
| Investor Class |
1/2/2008 | 5.70% | 12.91% | 13.89% | 10.02% | ||||||||||||||||||||
| Smead Value Fund – Class A |
1/27/2014 | 5.69% | 12.94% | N/A | 9.91% | ||||||||||||||||||||
| Smead Value Fund – Class C |
4/16/2020 | 5.13% | N/A | N/A | 36.34% | ||||||||||||||||||||
| Smead Value Fund – Class I1 |
12/18/2009 | 5.99% | 13.21% | 14.19% | 10.27% | ||||||||||||||||||||
| Smead Value Fund – Class R1 |
11/25/2014 | 5.45% | 12.63% | N/A | 9.75% | ||||||||||||||||||||
| Smead Value Fund – Class R2 |
11/25/2014 | 5.57% | 13.41% | N/A | 10.03% | ||||||||||||||||||||
| Smead Value Fund – Class Y |
11/25/2014 | 6.06% | 13.35% | N/A | 10.27% | ||||||||||||||||||||
| S&P 500® Index (Total Return) |
(9.21)% | 10.98% | 13.34% | 9.29% | |||||||||||||||||||||
| Russell 1000® Value Index |
2.42% | 7.86% | 10.97% | 7.29% | |||||||||||||||||||||
Average Annual Total Returns for the period ended November 30, 2022
| Smead International Value Fund |
Inception Date(1) |
1 Year(2) | 5 Year(2) | 10 Year | Since Inception(1)(2) | ||||||||||||||||||||
| Investor Class |
1/12/2015 | 1.18% | 10.64% | N/A | 9.16% | ||||||||||||||||||||
| Smead International Value Fund – Class A |
1/12/2015 | 1.00% | 10.48% | N/A | 9.00% | ||||||||||||||||||||
| Smead International Value Fund – Class C |
1/12/2015 | 0.58% | 9.85% | N/A | 8.37% | ||||||||||||||||||||
| Smead International Value Fund – Class I1 |
1/12/2015 | 1.27% | 10.79% | N/A | 9.30% | ||||||||||||||||||||
| Smead International Value Fund – Class Y |
1/12/2015 | 1.45% | 10.95% | N/A | 9.44% | ||||||||||||||||||||
| MSCI All Country World Index ex-USA (Net-USD) |
(11.87)% | 1.48% | 4.23% | 3.85% | |||||||||||||||||||||
| MSCI EAFE Index Net |
(10.14)% | 1.85% | 4.99% | 4.23% | |||||||||||||||||||||
| (1) | On January 12, 2022 (date of the Reorganization), the Smead International Value Fund succeeded to substantially all the assets and liabilities of the Smead International Value Fund, L.P. (Predecessor Fund). Smead Private Fund Advisers, LLC, an affiliate of Smead Capital Management, Inc., the investment adviser to the Fund (the “Adviser”), served as the General Partner for the Predecessor Fund since its inception on January 12, 2015. |
| (2) | Includes the historical performance of Smead International Value Fund L.P. prior to the date of Reorganization (January 12, 2022). |
Performance data quoted represents past performance and does not guarantee future results. The investment return and principal value of an investment will fluctuate so that an investor’s shares, when redeemed, may be worth more or less
Continued
11
Table of Contents
SMEAD FUNDS
Investment Highlights (Continued)
(Unaudited)
than their original cost. Current performance of the Funds may be lower or higher than the performance quoted. Performance data current to the most recent month end may be obtained by calling 877-807-4122.
Investment performance for the Smead International Value Fund reflects fee waivers in effect. In the absence of such waivers, total returns would be reduced.
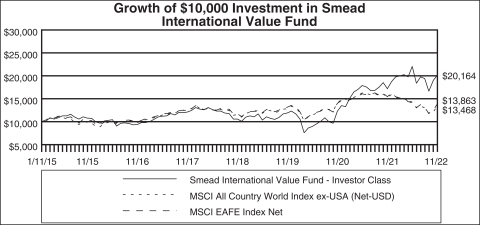
The returns shown assume reinvestment of Fund distributions and do not reflect the deduction of taxes that a shareholder would pay on Fund distributions or the redemption of Fund shares. The following graphs illustrate performance of hypothetical investments made in the Funds and broad-based securities indices on the Funds’ inception dates. The graphs do not reflect any future performance.
Continued
12
Table of Contents
SMEAD FUNDS
Investment Highlights (Continued)
(Unaudited)
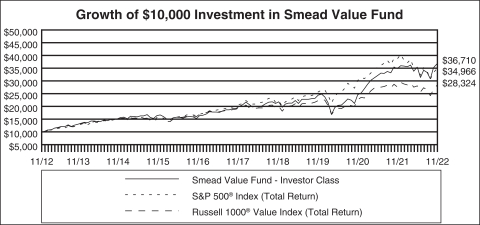
The S&P 500® Index is a broad based unmanaged index of 500 stocks, which is widely recognized as representative of the equity market in general.
Standard & Poor’s®, S&P®, S&P 500® and Standard & Poor’s 500® are trade names or trademarks of Standard & Poor’s Financial Services, LLC.
The Russell 1000® Value Index measures the performance of those Russell 1000® companies with lower price-to-book ratios and lower forecasted growth values.
Frank Russell Company is the source and owner of the trademarks, service marks and copyrights related to the Russell Indexes. Russell® is a trademark of Russell Investment Group.
Continued
13
Table of Contents
SMEAD FUNDS
Investment Highlights (Continued)
(Unaudited)
The MSCI EAFE Index is designed to represent the performance of large and mid-cap securities across 21 developed markets, including countries in Europe, Australasia and the Far East, excluding the U.S. and Canada. It covers approximately 85% of the free float-adjusted market capitalization in each country.
The MSCI World ex - USA All Cap Index captures large, mid, small and micro cap representation across 22 of 23 Developed Markets (DM) countries* (excluding the United States). With 8,723 constituents, the index covers approximately 99% of the free float adjusted market capitalization in each country.
One cannot invest directly in an index.
Continued
14
Table of Contents
SMEAD VALUE FUND
| Schedule of Investments |
| November 30, 2022 |
| Shares |
Value | |||||||||
| COMMON STOCKS 90.50% |
||||||||||
| Banks 7.32% |
||||||||||
| Bank of America Corp. |
4,396,675 | $ | 166,414,149 | |||||||
| JPMorgan Chase & Co. |
1,179,196 | 162,941,303 | ||||||||
|
|
|
|||||||||
| 329,355,452 | ||||||||||
|
|
|
|||||||||
| Consumer Durables & Apparel 14.06% |
||||||||||
| DR Horton, Inc. |
2,419,933 | 208,114,238 | ||||||||
| Lennar Corp. – Class A |
2,490,653 | 218,754,053 | ||||||||
| NVR, Inc. (a) |
44,327 | 205,633,396 | ||||||||
|
|
|
|||||||||
| 632,501,687 | ||||||||||
|
|
|
|||||||||
| Diversified Financials 8.07% |
||||||||||
| American Express Co. |
1,513,457 | 238,505,689 | ||||||||
| Berkshire Hathaway, Inc. – Class B (a) |
159,236 | 50,732,589 | ||||||||
| Credit Acceptance Corp. (a) |
156,155 | 74,011,224 | ||||||||
|
|
|
|||||||||
| 363,249,502 | ||||||||||
|
|
|
|||||||||
| Energy 21.15% |
||||||||||
| Chevron Corp. |
688,991 | 126,298,940 | ||||||||
| ConocoPhillips |
1,980,371 | 244,595,622 | ||||||||
| Occidental Petroleum Corp. |
5,670,251 | 394,025,742 | ||||||||
| Ovintiv, Inc. |
3,347,734 | 186,669,648 | ||||||||
|
|
|
|||||||||
| 951,589,952 | ||||||||||
|
|
|
|||||||||
| Media & Entertainment 1.47% |
||||||||||
| Warner Bros Discovery, Inc. (a) |
5,815,531 | 66,297,053 | ||||||||
|
|
|
|||||||||
| Pharmaceuticals, Biotechnology & Life Sciences 13.63% |
||||||||||
| Amgen, Inc. |
963,705 | 276,005,112 | ||||||||
| Merck & Co., Inc. |
2,514,512 | 276,898,062 | ||||||||
| Pfizer, Inc. |
1,201,254 | 60,218,863 | ||||||||
|
|
|
|||||||||
| 613,122,037 | ||||||||||
|
|
|
|||||||||
| Real Estate 10.34% |
||||||||||
| Macerich Co. (The) – REIT |
17,789,366 | 225,924,948 | ||||||||
| Simon Property Group, Inc. – REIT |
2,004,830 | 239,456,895 | ||||||||
|
|
|
|||||||||
| 465,381,843 | ||||||||||
|
|
|
|||||||||
| Retailing 9.60% |
||||||||||
| eBay, Inc. |
2,782,320 | 126,428,621 | ||||||||
| Home Depot, Inc. |
387,247 | 125,464,156 | ||||||||
| Target Corp. |
1,077,648 | 180,042,651 | ||||||||
|
|
|
|||||||||
| 431,935,428 | ||||||||||
|
|
|
|||||||||
The accompanying notes are an integral part of these financial statements.
15
Table of Contents
SMEAD VALUE FUND
| Schedule of Investments (Continued) |
| November 30, 2022 |
| Shares |
Value | |||||||||
| Semiconductors & Semiconductor Equipment 1.80% |
||||||||||
| Qualcomm, Inc. |
639,611 | $ | 80,904,395 | |||||||
|
|
|
|||||||||
| Transportation 3.06% |
||||||||||
| AMERCO |
510,581 | 32,319,778 | ||||||||
| AMERCO (a) |
1,667,201 | 105,317,087 | ||||||||
|
|
|
|||||||||
| 137,636,865 | ||||||||||
|
|
|
|||||||||
| TOTAL COMMON STOCKS (Cost $3,358,422,102) |
4,071,974,214 | |||||||||
|
|
|
|||||||||
| TOTAL INVESTMENTS (Cost $3,358,422,102) 90.50% |
4,071,974,214 | |||||||||
| Other Assets in Excess of Liabilities 9.50% |
427,534,713 | |||||||||
|
|
|
|||||||||
| TOTAL NET ASSETS 100.00% |
$ | 4,499,508,927 | ||||||||
|
|
|
|||||||||
| (a) | Non-income producing security. |
| REIT | - Real Estate Investment Trust |
The Global Industry Classification Standard (GICS®) was developed by and/or is the exclusive property of MSCI, Inc. and Standard & Poor Financial Services LLC (“S&P”). GICS® is a service mark of MSCI and S&P and has been licensed for use by Smead Capital Management, Inc. for the purpose of Industry Classification in the Schedule of Investments.
The accompanying notes are an integral part of these financial statements.
16
Table of Contents
SMEAD INTERNATIONAL VALUE FUND
| Schedule of Investments |
| November 30, 2022 |
| Shares |
Value | |||||||||
| COMMON STOCKS 87.17% |
||||||||||
| Austria 4.63% |
||||||||||
| Financials 4.63% |
||||||||||
| BAWAG Group AG (a),(b) |
66,811 | $ | 3,496,876 | |||||||
|
|
|
|||||||||
| Canada 31.20% |
||||||||||
| Consumer Discretionary 2.90% |
||||||||||
| Canada Goose Holdings, Inc. (b) |
116,702 | 2,186,292 | ||||||||
|
|
|
|||||||||
| Consumer Staples 1.02% |
||||||||||
| Alimentation Couche-Tard, Inc. |
16,974 | 773,272 | ||||||||
|
|
|
|||||||||
| Energy 16.97% |
||||||||||
| Cenovus Energy, Inc. |
283,826 | 5,644,237 | ||||||||
| MEG Energy Corp. (b) |
395,526 | 5,630,839 | ||||||||
| Whitecap Resources, Inc. |
192,918 | 1,538,869 | ||||||||
|
|
|
|||||||||
| 12,813,945 | ||||||||||
|
|
|
|||||||||
| Materials 10.31% |
||||||||||
| Interfor Corp. (b) |
180,994 | 3,390,736 | ||||||||
| West Fraser Timber Co. Ltd. |
56,251 | 4,400,052 | ||||||||
|
|
|
|||||||||
| 7,790,788 | ||||||||||
|
|
|
|||||||||
| 23,564,297 | ||||||||||
|
|
|
|||||||||
| Denmark 2.36% |
||||||||||
| Consumer Discretionary 2.36% |
||||||||||
| Pandora AS |
23,413 | 1,781,506 | ||||||||
|
|
|
|||||||||
| Germany 11.80% |
||||||||||
| Consumer Discretionary 11.80% |
||||||||||
| Bayerische Motoren Werke AG |
13,864 | 1,245,219 | ||||||||
| Dr Ing hc F Porsche AG – (Preference Shares) (b) |
9,696 | 1,101,746 | ||||||||
| Porsche Automobil Holding SE – (Preference Shares) |
54,225 | 3,292,224 | ||||||||
| Volkswagen AG – (Preference Shares) |
22,503 | 3,277,876 | ||||||||
|
|
|
|||||||||
| 8,917,065 | ||||||||||
|
|
|
|||||||||
| Italy 8.23% |
||||||||||
| Financials 8.23% |
||||||||||
| Assicurazioni Generali SpA |
151,881 | 2,715,983 | ||||||||
| UniCredit SpA |
253,985 | 3,499,201 | ||||||||
|
|
|
|||||||||
| 6,215,184 | ||||||||||
|
|
|
|||||||||
The accompanying notes are an integral part of these financial statements.
17
Table of Contents
SMEAD INTERNATIONAL VALUE FUND
| Schedule of Investments (Continued) |
| November 30, 2022 |
| Shares |
Value | |||||||||
| Netherlands 1.38% |
||||||||||
| Telecommunication Services 1.38% |
||||||||||
| Universal Music Group NV |
43,698 | $ | 1,046,857 | |||||||
|
|
|
|||||||||
| Norway 4.42% |
||||||||||
| Energy 4.42% |
||||||||||
| Frontline Ltd. |
240,464 | 3,338,874 | ||||||||
|
|
|
|||||||||
| Spain 3.39% |
||||||||||
| Financials 3.39% |
||||||||||
| Bankinter SA |
389,037 | 2,564,365 | ||||||||
|
|
|
|||||||||
| United Kingdom 12.13% |
||||||||||
| Consumer Discretionary 5.82% |
||||||||||
| Bellway PLC |
35,944 | 872,443 | ||||||||
| Berkeley Group Holdings PLC |
24,885 | 1,147,858 | ||||||||
| Next PLC |
15,892 | 1,134,072 | ||||||||
| WH Smith PLC (b) |
72,483 | 1,243,846 | ||||||||
|
|
|
|||||||||
| 4,398,219 | ||||||||||
|
|
|
|||||||||
| Industrials 2.80% |
||||||||||
| IWG PLC (b) |
1,099,483 | 2,113,068 | ||||||||
|
|
|
|||||||||
| Financials 3.51% |
||||||||||
| Lloyds Banking Group PLC |
2,099,436 | 1,208,936 | ||||||||
| NatWest Group PLC |
452,877 | 1,439,967 | ||||||||
|
|
|
|||||||||
| 2,648,903 | ||||||||||
|
|
|
|||||||||
| 9,160,190 | ||||||||||
|
|
|
|||||||||
| United States 7.63% |
||||||||||
| Energy 7.63% |
||||||||||
| Occidental Petroleum Corp. |
82,908 | 5,761,277 | ||||||||
|
|
|
|||||||||
| TOTAL COMMON STOCKS (Cost $64,101,445) |
65,846,491 | |||||||||
|
|
|
|||||||||
| WARRANTS 9.34% |
||||||||||
| United States 9.34% |
||||||||||
| Energy 9.34% |
||||||||||
| Occidental Petroleum Corp. Expiration date 8/3/2027 (b) |
148,479 | 7,052,753 | ||||||||
|
|
|
|||||||||
| TOTAL WARRANTS (Cost $2,011,078) |
7,052,753 | |||||||||
|
|
|
|||||||||
| TOTAL INVESTMENTS (Cost $66,112,523) 96.51% |
72,899,244 | |||||||||
| Other Assets in Excess of Liabilities 3.49% |
2,635,206 | |||||||||
|
|
|
|||||||||
| TOTAL NET ASSETS 100.00% |
$ | 75,534,450 | ||||||||
|
|
|
|||||||||
The accompanying notes are an integral part of these financial statements.
18
Table of Contents
SMEAD INTERNATIONAL VALUE FUND
| Schedule of Investments (Continued) |
| November 30, 2022 |
| (a) | Security exempt from registration under Rule 144A of the Securities Act of 1933. This security may be resold in transactions exempt from registration, normally to qualified institutional buyers. At the end of the period, the value of this security totaled $3,496,876 or 4.63% of net assets. |
| (b) | Non-income producing security. |
The Global Industry Classification Standard (GICS®) was developed by and/or is the exclusive property of MSCI, Inc. and Standard & Poor Financial Services LLC (“S&P”). GICS® is a service mark of MSCI and S&P and has been licensed for use by Smead Capital Management, Inc. for the purpose of Industry Classification in the Schedule of Investments.
The accompanying notes are an integral part of these financial statements.
19
Table of Contents
SMEAD VALUE FUND
| Statement of Assets and Liabilities |
| November 30, 2022 |
| Assets |
|||||
| Investments, at value (cost $3,358,422,102) |
$ | 4,071,974,214 | |||
| Cash |
513,571,531 | ||||
| Receivable for Fund shares sold |
4,764,557 | ||||
| Dividends and interest receivable |
11,330,317 | ||||
|
|
|
||||
| Total Assets |
4,601,640,619 | ||||
|
|
|
||||
| Liabilities |
|||||
| Payable for Fund shares redeemed |
4,980,051 | ||||
| Payable to Adviser |
2,590,490 | ||||
| Payable to Administrator |
43,655 | ||||
| Payable for investments purchased |
92,707,878 | ||||
| Payable for distribution fees |
130,028 | ||||
| Payable for shareholder servicing fees |
946,938 | ||||
| Accrued expenses and other liabilities |
732,652 | ||||
|
|
|
||||
| Total Liabilities |
102,131,692 | ||||
|
|
|
||||
| Net Assets |
$ | 4,499,508,927 | |||
|
|
|
||||
| Net Assets Consist Of: |
|||||
| Paid-in capital |
$ | 3,726,375,710 | |||
| Total distributable earnings (loss) |
773,133,217 | ||||
|
|
|
||||
| Net Assets |
$ | 4,499,508,927 | |||
|
|
|
||||
| Investor Class Shares |
|||||
| Net assets |
$ | 107,324,313 | |||
| Shares of beneficial interest outstanding (unlimited number of shares authorized, $0.001 par value) |
1,516,569 | ||||
| Net asset value, offering price and redemption price per share |
$ | 70.77 | |||
|
|
|
||||
| Class A Shares |
|||||
| Net assets |
$ | 427,615,504 | |||
| Shares of beneficial interest outstanding (unlimited number of shares authorized, $0.001 par value) |
6,097,315 | ||||
| Net asset value, offering price and redemption price per share(1) |
$ | 70.13 | |||
|
|
|
||||
| Maximum offering price per share (70.13/0.9425)(2) |
$ | 74.41 | |||
|
|
|
||||
| Class C Shares |
|||||
| Net assets |
$ | 41,043,282 | |||
| Shares of beneficial interest outstanding (unlimited number of shares authorized, $0.001 par value) |
599,882 | ||||
| Net asset value, offering price and redemption price per share(1) |
$ | 68.42 | |||
|
|
|
||||
The accompanying notes are an integral part of these financial statements.
20
Table of Contents
SMEAD VALUE FUND
| Statement of Assets and Liabilities (Continued) |
| November 30, 2022 |
| Class I1 Shares |
|||||
| Net assets |
$ | 3,531,197,928 | |||
| Shares of beneficial interest outstanding (unlimited number of shares authorized, $0.001 par value) |
49,822,841 | ||||
| Net asset value, offering price and redemption price per share |
$ | 70.88 | |||
|
|
|
||||
| Class R1 Shares |
|||||
| Net assets |
$ | 241,303 | |||
| Shares of beneficial interest outstanding (unlimited number of shares authorized, $0.001 par value) |
3,473 | ||||
| Net asset value, offering price and redemption price per share |
$ | 69.48 | |||
|
|
|
||||
| Class R2 Shares |
|||||
| Net assets |
$ | 74,174 | |||
| Shares of beneficial interest outstanding (unlimited number of shares authorized, $0.001 par value) |
1,033 | ||||
| Net asset value, offering price and redemption price per share |
$ | 71.80 | (3) | ||
|
|
|
||||
| Class Y Shares |
|||||
| Net assets |
$ | 392,012,423 | |||
| Shares of beneficial interest outstanding (unlimited number of shares authorized, $0.001 par value) |
5,520,162 | ||||
| Net asset value, offering price and redemption price per share |
$ | 71.01 | |||
|
|
|
||||
| (1) | A contingent deferred sales charge (“CDSC”) of 1.00% may be charged on shares redeemed within eighteen months of purchase for Class A shares and twelve months of purchase for Class C shares. Redemption price per share is equal to net asset value less any redemption or CDSC fees. |
| (2) | Reflects a maximum sales charge of 5.75%. |
| (3) | Calculated NAV may not equal actual NAV shown due to rounding of the Net assets and shares. |
The accompanying notes are an integral part of these financial statements.
21
Table of Contents
SMEAD INTERNATIONAL VALUE FUND
| Statement of Assets and Liabilities |
| November 30, 2022 |
| Assets |
|||||
| Investments, at value (cost $66,112,523) |
$ | 72,899,244 | |||
| Cash |
2,204,545 | ||||
| Receivable for Fund shares sold |
296,240 | ||||
| Dividends and interest receivable |
30,675 | ||||
| Other assets |
213,969 | ||||
|
|
|
||||
| Total Assets |
75,644,673 | ||||
|
|
|
||||
| Liabilities |
|||||
| Payable to Adviser |
70,261 | ||||
| Payable for distribution fees |
597 | ||||
| Payable for shareholder servicing fees |
3,808 | ||||
| Accrued expenses and other liabilities |
35,557 | ||||
|
|
|
||||
| Total Liabilities |
110,223 | ||||
|
|
|
||||
| Net Assets |
$ | 75,534,450 | |||
|
|
|
||||
| Net Assets Consist Of: |
|||||
| Paid-in capital |
$ | 71,923,612 | |||
| Total distributable earnings (loss) |
3,610,838 | ||||
|
|
|
||||
| Net Assets |
$ | 75,534,450 | |||
|
|
|
||||
| Investor Class Shares |
|||||
| Net assets |
$ | 18,865 | |||
| Shares of beneficial interest outstanding (unlimited number of shares authorized, $0.001 par value) |
378 | ||||
| Net asset value, offering price and redemption price per share |
$ | 49.91 | |||
|
|
|
||||
| Class A Shares |
|||||
| Net assets |
$ | 2,630,478 | |||
| Shares of beneficial interest outstanding (unlimited number of shares authorized, $0.001 par value) |
53,336 | ||||
| Net asset value, offering price and redemption price per share(1) |
$ | 49.32 | |||
|
|
|
||||
| Maximum offering price per share (49.32/0.9425)(2) |
$ | 52.33 | |||
|
|
|
||||
| Class C Shares |
|||||
| Net assets |
$ | 105,702 | |||
| Shares of beneficial interest outstanding (unlimited number of shares authorized, $0.001 par value) |
2,244 | ||||
| Net asset value, offering price and redemption price per share(1) |
$ | 47.10 | (3) | ||
|
|
|
||||
The accompanying notes are an integral part of these financial statements.
22
Table of Contents
SMEAD INTERNATIONAL VALUE FUND
| Statement of Assets and Liabilities (Continued) |
| November 30, 2022 |
| Class I1 Shares |
|||||
| Net assets |
$ | 39,428,112 | |||
| Shares of beneficial interest outstanding (unlimited number of shares authorized, $0.001 par value) |
782,188 | ||||
| Net asset value, offering price and redemption price per share |
$ | 50.41 | |||
|
|
|
||||
| Class Y Shares |
|||||
| Net assets |
$ | 33,351,293 | |||
| Shares of beneficial interest outstanding (unlimited number of shares authorized, $0.001 par value) |
655,057 | ||||
| Net asset value, offering price and redemption price per share |
$ | 50.91 | |||
|
|
|
||||
| (1) | A contingent deferred sales charge (“CDSC”) of 1.00% may be charged on shares redeemed within eighteen months of purchase for Class A shares and twelve months of purchase for Class C shares. Redemption price per share is equal to net asset value less any redemption or CDSC fees. |
| (2) | Reflects a maximum sales charge of 5.75%. |
| (3) | Calculated NAV may not equal actual NAV shown due to rounding of the Net assets and shares. |
The accompanying notes are an integral part of these financial statements.
23
Table of Contents
SMEAD VALUE FUND
| Statement of Operations | ||
| Year Ended November 30, 2022 | ||
| Investment Income |
|||||
| Dividend income |
$ | 70,162,751 | |||
| Interest income |
3,435,394 | ||||
|
|
|
||||
| Total Investment Income |
73,598,145 | ||||
|
|
|
||||
| Expenses |
|||||
| Management fees |
28,389,659 | ||||
| Distribution fees – Investor Class |
261,104 | ||||
| Distribution fees – Class A |
911,709 | ||||
| Distribution fees – Class C |
216,574 | ||||
| Distribution fees – Class R1 |
873 | ||||
| Distribution fees – Class R2 |
430 | ||||
| Shareholder servicing fees – Investor Class |
109,992 | ||||
| Shareholder servicing fees – Class A |
386,405 | ||||
| Shareholder servicing fees – Class C |
45,484 | ||||
| Shareholder servicing fees – Class I1 |
2,766,440 | ||||
| Shareholder servicing fees – Class R1 |
275 | ||||
| Shareholder servicing fees – Class R2 |
53 | ||||
| Administration fees |
642,796 | ||||
| Transfer agent fees and expenses |
500,134 | ||||
| Fund accounting fees |
503,530 | ||||
| Federal and state registration fees |
746,350 | ||||
| Custody fees |
159,336 | ||||
| Reports to shareholders |
244,384 | ||||
| Legal fees |
168,119 | ||||
| Audit and tax fees |
22,500 | ||||
| Trustees’ fees |
130,000 | ||||
| Recoupment of previously reimbursed expenses |
17,704 | ||||
| Other expenses |
40,851 | ||||
|
|
|
||||
| Total Expenses |
36,264,702 | ||||
|
|
|
||||
| Net Investment Income |
37,333,443 | ||||
|
|
|
||||
| Realized and Unrealized Gain on Investments |
|||||
| Net realized gain from investments |
51,416,018 | ||||
| Net realized gain from in-kind redemptions |
256,106,649 | ||||
| Change in net unrealized depreciation on investments |
(117,997,490 | ) | |||
|
|
|
||||
| Net Realized and Unrealized Gain on Investments |
189,525,177 | ||||
|
|
|
||||
| Net Increase in Net Assets from Operations |
$ | 226,858,620 | |||
|
|
|
||||
The accompanying notes are an integral part of these financial statements.
24
Table of Contents
SMEAD INTERNATIONAL VALUE FUND
| Statement of Operations | ||
| Period from January 12, 2022 (commencement of operations) to November 30, 2022 | ||
| Investment Income |
|||||
| Dividend income (net of taxes withheld of $135,516) |
$ | 1,166,063 | |||
| Interest income |
24,970 | ||||
|
|
|
||||
| Total Investment Income |
1,191,033 | ||||
|
|
|
||||
| Expenses |
|||||
| Management fees |
408,868 | ||||
| Distribution fees – Investor Class |
20 | ||||
| Distribution fees – Class A |
5,015 | ||||
| Distribution fees – Class C |
422 | ||||
| Shareholder servicing fees – Class A |
2,377 | ||||
| Shareholder servicing fees – Class C |
60 | ||||
| Shareholder servicing fees – Class I1 |
25,085 | ||||
| Administration fees |
10,907 | ||||
| Transfer agent fees and expenses |
24,258 | ||||
| Fund accounting fees |
9,544 | ||||
| Federal and state registration fees |
3,816 | ||||
| Custody fees |
34,652 | ||||
| Reports to shareholders |
30,855 | ||||
| Legal fees |
70,000 | ||||
| Audit and tax fees |
20,638 | ||||
| Trustees’ fees |
3,000 | ||||
| Other expenses |
9,011 | ||||
|
|
|
||||
| Total Expenses |
658,528 | ||||
| Expense Waiver by Adviser |
(33,480 | ) | |||
|
|
|
||||
| Net Expenses |
625,048 | ||||
|
|
|
||||
| Net Investment Income |
565,985 | ||||
|
|
|
||||
| Realized and Unrealized Gain on Investments |
|||||
| Net realized loss from investments |
(3,750,135 | ) | |||
| Foreign currency transactions |
9,092 | ||||
| Change in net unrealized appreciation on investments |
3,638,737 | ||||
| Change in net unrealized depreciation on foreign currency |
(825 | ) | |||
|
|
|
||||
| Net Realized and Unrealized Gain on Investments |
(103,131 | ) | |||
|
|
|
||||
| Net Increase in Net Assets from Operations |
$ | 462,854 | |||
|
|
|
||||
The accompanying notes are an integral part of these financial statements.
25
Table of Contents
SMEAD VALUE FUND
| Statements of Changes in Net Assets |
| Year Ended November 30, 2022 |
Year Ended November 30, 2021 | |||||||||
| From Operations |
|
|||||||||
| Net investment income |
$ | 37,333,443 | $ | 10,512,671 | ||||||
| Net realized gain from investments |
307,522,667 | 119,504,783 | ||||||||
| Change in net unrealized appreciation (depreciation) on investments |
(117,997,490 | ) | 472,600,790 | |||||||
|
|
|
|
|
|||||||
| Net increase in net assets from operations |
226,858,620 | 602,618,244 | ||||||||
|
|
|
|
|
|||||||
| From Distributions |
||||||||||
| Investor Class |
(4,255,078 | ) | (1,127,357 | ) | ||||||
| Class A |
(11,256,332 | ) | (1,572,940 | ) | ||||||
| Class C |
(682,470 | ) | (4,407 | ) | ||||||
| Class I1 |
(102,566,190 | ) | (16,339,105 | ) | ||||||
| Class R1 |
(6,379 | ) | (3,380 | ) | ||||||
| Class R2 |
(3,885 | ) | (931 | ) | ||||||
| Class Y |
(10,684,125 | ) | (1,677,290 | ) | ||||||
|
|
|
|
|
|||||||
| Net Increase (decrease) in net assets resulting from |
(129,454,459 | ) | (20,725,410 | ) | ||||||
|
|
|
|
|
|||||||
| From Capital Share Transactions |
||||||||||
| Proceeds from shares sold |
2,694,052,838 | 1,661,638,625 | ||||||||
| Issued in reinvestment of dividends |
88,737,360 | 11,207,979 | ||||||||
| Payments for shares redeemed |
(1,441,973,313 | ) | (419,159,099 | ) | ||||||
|
|
|
|
|
|||||||
| Net increase in net assets from |
1,340,816,885 | 1,253,687,505 | ||||||||
|
|
|
|
|
|||||||
| Total Increase in Net Assets |
1,438,221,046 | 1,835,580,339 | ||||||||
|
|
|
|
|
|||||||
| Net Assets |
||||||||||
| Beginning of year |
3,061,287,881 | 1,225,707,542 | ||||||||
|
|
|
|
|
|||||||
| End of year |
$ | 4,499,508,927 | $ | 3,061,287,881 | ||||||
|
|
|
|
|
|||||||
The accompanying notes are an integral part of these financial statements.
26
Table of Contents
SMEAD INTERNATIONAL VALUE FUND
| Statements of Changes in Net Assets |
| Period Ended November 30, 2022 (1) | |||||
| From Operations |
| ||||
| Net investment income |
$ | 565,985 | |||
| Net realized loss from investments and foreign currency |
(3,741,043 | ) | |||
| Change in net unrealized appreciation on investments and foreign currency |
3,637,912 | ||||
|
|
|
||||
| Net increase in net assets from operations |
462,854 | ||||
|
|
|
||||
| From Capital Share Transactions |
|||||
| Proceeds from shares sold |
79,963,231 | ||||
| Payments for shares redeemed |
(4,891,635 | ) | |||
|
|
|
||||
| Net increase in net assets from capital share transactions |
75,071,596 | ||||
|
|
|
||||
| Total Increase in Net Assets |
75,534,450 | ||||
|
|
|
||||
| Net Assets |
|||||
| Beginning of period |
— | ||||
|
|
|
||||
| End of year |
$ | 75,534,450 | |||
|
|
|
||||
| (1) | Period from January 12, 2022, date operations commenced, through November 30, 2022. |
The accompanying notes are an integral part of these financial statements.
27
Table of Contents
SMEAD VALUE FUND
| Financial Highlights | ||||
| November 30, 2022 | ||||
| Income from investment operations |
Less distributions paid | ||||||||||||||||||||||||||||||||||
| Net Asset Value, Beginning of Period |
Net investment income(1) |
Net realized and unrealized gain/(loss) on investments |
Total from investment operations |
Distributions from net investment income |
Distributions from net realized gain on investments |
Total distributions paid | |||||||||||||||||||||||||||||
| Investor Class |
|||||||||||||||||||||||||||||||||||
| November 30, 2022 |
$ | 69.63 | $ | 0.49 | $ | 3.35 | $ | 3.84 | $ | (0.15 | ) | $ | (2.55 | ) | $ | (2.70 | ) | ||||||||||||||||||
| November 30, 2021 |
49.68 | 0.17 | 20.49 | 20.66 | (0.35 | ) | (0.36 | ) | (0.71 | ) | |||||||||||||||||||||||||
| November 30, 2020 |
51.55 | 0.52 | (0.47 | ) | 0.05 | (0.35 | ) | (1.57 | ) | (1.92 | ) | ||||||||||||||||||||||||
| November 30, 2019 |
49.13 | 0.33 | 5.19 | 5.52 | — | (3.10 | ) | (3.10 | ) | ||||||||||||||||||||||||||
| November 30, 2018 |
47.29 | 0.19 | 3.75 | 3.94 | (0.10 | ) | (2.00 | ) | (2.10 | ) | |||||||||||||||||||||||||
| Class A |
|||||||||||||||||||||||||||||||||||
| November 30, 2022 |
69.08 | 0.50 | 3.31 | 3.81 | (0.21 | ) | (2.55 | ) | (2.76 | ) | |||||||||||||||||||||||||
| November 30, 2021 |
49.32 | 0.17 | 20.32 | 20.49 | (0.37 | ) | (0.36 | ) | (0.73 | ) | |||||||||||||||||||||||||
| November 30, 2020 |
51.20 | 0.50 | (0.45 | ) | 0.05 | (0.36 | ) | (1.57 | ) | (1.93 | ) | ||||||||||||||||||||||||
| November 30, 2019 |
48.82 | 0.33 | 5.15 | 5.48 | — | (3.10 | ) | (3.10 | ) | ||||||||||||||||||||||||||
| November 30, 2018 |
47.03 | 0.22 | 3.72 | 3.94 | (0.15 | ) | (2.00 | ) | (2.15 | ) | |||||||||||||||||||||||||
| Class C |
|||||||||||||||||||||||||||||||||||
| November 30, 2022 |
67.70 | 0.15 | 3.21 | 3.36 | (0.09 | ) | (2.55 | ) | (2.64 | ) | |||||||||||||||||||||||||
| November 30, 2021 |
48.70 | (0.18 | ) | 20.00 | 19.82 | (0.46 | ) | (0.36 | ) | (0.82 | ) | ||||||||||||||||||||||||
| November 30, 2020(5) |
36.22 | 0.08 | 12.40 | (6) | 12.48 | — | — | — | |||||||||||||||||||||||||||
| Class I1 |
|||||||||||||||||||||||||||||||||||
| November 30, 2022 |
69.74 | 0.68 | 3.35 | 4.03 | (0.34 | ) | (2.55 | ) | (2.89 | ) | |||||||||||||||||||||||||
| November 30, 2021 |
49.78 | 0.34 | 20.47 | 20.81 | (0.49 | ) | (0.36 | ) | (0.85 | ) | |||||||||||||||||||||||||
| November 30, 2020 |
51.65 | 0.62 | (0.43 | ) | 0.19 | (0.49 | ) | (1.57 | ) | (2.06 | ) | ||||||||||||||||||||||||
| November 30, 2019 |
49.10 | 0.47 | 5.19 | 5.66 | (0.01 | ) | (3.10 | ) | (3.11 | ) | |||||||||||||||||||||||||
| November 30, 2018 |
47.33 | 0.33 | 3.72 | 4.05 | (0.28 | ) | (2.00 | ) | (2.28 | ) | |||||||||||||||||||||||||
| Class R1 |
|||||||||||||||||||||||||||||||||||
| November 30, 2022 |
68.42 | 0.30 | 3.31 | 3.61 | — | (2.55 | ) | (2.55 | ) | ||||||||||||||||||||||||||
| November 30, 2021 |
48.81 | (0.03 | ) | 20.21 | 20.18 | (0.21 | ) | (0.36 | ) | (0.57 | ) | ||||||||||||||||||||||||
| November 30, 2020 |
50.46 | 0.38 | (0.46 | ) | (0.08 | ) | — | (1.57 | ) | (1.57 | ) | ||||||||||||||||||||||||
| November 30, 2019 |
48.30 | 0.19 | 5.07 | 5.26 | — | (3.10 | ) | (3.10 | ) | ||||||||||||||||||||||||||
| November 30, 2018 |
46.57 | 0.06 | 3.69 | 3.75 | (0.02 | ) | (2.00 | ) | (2.02 | ) | |||||||||||||||||||||||||
| Class R2 |
|||||||||||||||||||||||||||||||||||
| November 30, 2022 |
70.62 | 0.33 | 3.49 | 3.85 | (0.12 | ) | (2.55 | ) | (2.67 | ) | |||||||||||||||||||||||||
| November 30, 2021 |
50.43 | 0.08 | 20.75 | 20.83 | (0.28 | ) | (0.36 | ) | (0.64 | ) | |||||||||||||||||||||||||
| November 30, 2020 |
52.43 | 0.41 | (0.45 | ) | (0.04 | ) | (0.39 | ) | (1.57 | ) | (1.96 | ) | |||||||||||||||||||||||
| November 30, 2019 |
50.01 | 0.32 | 5.20 | 5.52 | — | (3.10 | ) | (3.10 | ) | ||||||||||||||||||||||||||
| November 30, 2018 |
46.73 | (0.16 | ) | 5.49 | 5.33 | (0.05 | ) | (2.00 | ) | (2.05 | ) | ||||||||||||||||||||||||
The accompanying notes are an integral part of these financial statements.
28
Table of Contents
| Ratio of expenses to average net assets |
Ratio of net investment income (loss) to average net assets |
|||||||||||||||||||||||||||||||||||||
| Net Asset Value, End of Period |
Total Return(2) |
Net assets at end of period (000’s) |
Before waivers and recoupment of expenses |
After waivers and recoupment of expenses |
Before waivers and recoupment of expenses |
After waivers and recoupments of expenses |
Portfolio turnover rate | |||||||||||||||||||||||||||||||
| $70.77 | 5.70 | % | $ | 107,324 | 1.19 | % | 1.19 | % | 0.73 | % | 0.73 | % | 11.15 | % | ||||||||||||||||||||||||
| 69.63 | 42.10 | % | 109,938 | 1.19 | % | 1.19 | % | 0.27 | % | 0.27 | % | 17.40 | % | |||||||||||||||||||||||||
| 49.68 | 0.09 | % | 79,894 | 1.22 | % | 1.22 | % | 1.16 | % | 1.16 | % | 40.26 | % | |||||||||||||||||||||||||
| 51.55 | 12.38 | % | 117,805 | 1.24 | % | 1.24 | % | 0.71 | % | 0.71 | % | 20.75 | % | |||||||||||||||||||||||||
| 49.13 | 8.65 | % | 136,278 | 1.24 | % | 1.26 | % | 0.43 | % | 0.41 | % | 10.98 | % | |||||||||||||||||||||||||
| 70.13 | 5.69 | % | 427,616 | 1.19 | % | 1.19 | % | 0.76 | % | 0.76 | % | 11.15 | % | |||||||||||||||||||||||||
| 69.08 | 42.11 | % | 274,607 | 1.20 | % | 1.20 | % | 0.27 | % | 0.27 | % | 17.40 | % | |||||||||||||||||||||||||
| 49.32 | 0.08 | % | 105,555 | 1.23 | % | 1.23 | % | 1.14 | % | 1.14 | % | 40.26 | % | |||||||||||||||||||||||||
| 51.20 | 12.35 | % | 119,181 | 1.24 | % | 1.24 | % | 0.72 | % | 0.72 | % | 20.75 | % | |||||||||||||||||||||||||
| 48.82 | 8.80 | % | 122,653 | 1.19 | % | 1.19 | % | 0.47 | % | 0.47 | % | 10.98 | % | |||||||||||||||||||||||||
| 68.42 | 5.13 | % | 41,043 | 1.75 | % | 1.75 | % | 0.23 | % | 0.23 | % | 11.15 | % | |||||||||||||||||||||||||
| 67.70 | 41.29 | % | 16,544 | 1.76 | % | 1.76 | % | (0.27 | )% | (0.27 | )% | 17.40 | % | |||||||||||||||||||||||||
| 48.70 | 34.46 | %(3) | 199 | 1.85 | %(4) | 1.84 | %(4) | 0.27 | %(4) | 0.28 | %(4) | 40.26 | %(3) | |||||||||||||||||||||||||
| 70.88 | 5.99 | % | 3,531,198 | 0.93 | % | 0.93 | % | 1.01 | % | 1.01 | % | 11.15 | % | |||||||||||||||||||||||||
| 69.74 | 42.43 | % | 2,417,546 | 0.93 | % | 0.93 | % | 0.54 | % | 0.54 | % | 17.40 | % | |||||||||||||||||||||||||
| 49.78 | 0.36 | % | 947,872 | 0.97 | % | 0.97 | % | 1.40 | % | 1.40 | % | 40.26 | % | |||||||||||||||||||||||||
| 51.65 | 12.67 | % | 1,066,128 | 0.97 | % | 0.97 | % | 1.00 | % | 1.00 | % | 20.75 | % | |||||||||||||||||||||||||
| 49.10 | 8.93 | % | 963,978 | 0.97 | % | 0.98 | % | 0.72 | % | 0.70 | % | 10.98 | % | |||||||||||||||||||||||||
| 69.48 | 5.45 | % | 241 | 1.49 | % | 1.49 | % | 0.46 | % | 0.46 | % | 11.15 | % | |||||||||||||||||||||||||
| 68.42 | 41.75 | % | 171 | 1.49 | % | 1.49 | % | (0.05 | )% | (0.05 | )% | 17.40 | % | |||||||||||||||||||||||||
| 48.81 | (0.18 | )% | 291 | 1.52 | % | 1.52 | % | 0.85 | % | 0.85 | % | 40.26 | % | |||||||||||||||||||||||||
| 50.46 | 12.01 | % | 872 | 1.55 | % | 1.55 | % | 0.43 | % | 0.43 | % | 20.75 | % | |||||||||||||||||||||||||
| 48.30 | 8.47 | % | 792 | 1.50 | % | 1.50 | % | 0.12 | % | 0.12 | % | 10.98 | % | |||||||||||||||||||||||||
| 71.80 | 5.57 | % | 74 | 1.38 | % | 1.38 | % | 0.49 | % | 0.49 | % | 11.15 | % | |||||||||||||||||||||||||
| 70.62 | 41.78 | % | 95 | 1.40 | % | 1.40 | % | 0.11 | % | 0.11 | % | 17.40 | % | |||||||||||||||||||||||||
| 50.43 | (0.10 | )% | 73 | 1.43 | % | 1.43 | % | 0.91 | % | 0.91 | % | 40.26 | % | |||||||||||||||||||||||||
| 52.43 | 12.12 | % | 74 | 1.44 | % | 1.44 | % | 0.66 | % | 0.66 | % | 20.75 | % | |||||||||||||||||||||||||
| 50.01 | 11.88 | % | 10 | 1.44 | % | 1.49 | % | (0.28 | )% | (0.33 | )% | 10.98 | % | |||||||||||||||||||||||||
29
Table of Contents
SMEAD VALUE FUND
| Financial Highlights (Continued) | ||||
| November 30, 2022 | ||||
| Income from investment operations |
Less distributions paid | ||||||||||||||||||||||||||||||||||
| Net Asset Value, Beginning of Period |
Net investment income(1) |
Net realized and unrealized gain/(loss) on investments |
Total from investment operations |
Distributions from net investment income |
Distributions from net realized gain on investments |
Total distributions paid | |||||||||||||||||||||||||||||
| Class Y |
|||||||||||||||||||||||||||||||||||
| November 30, 2022 |
$ | 69.86 | $ | 0.74 | $ | 3.36 | $ | 4.09 | $ | (0.39 | ) | $ | (2.55 | ) | $ | (2.94 | ) | ||||||||||||||||||
| November 30, 2021 |
49.86 | 0.40 | 20.51 | 20.91 | (0.55 | ) | (0.36 | ) | (0.91 | ) | |||||||||||||||||||||||||
| November 30, 2020 |
51.73 | 0.61 | (0.35 | ) | 0.26 | (0.56 | ) | (1.57 | ) | (2.13 | ) | ||||||||||||||||||||||||
| November 30, 2019 |
49.19 | 0.53 | 5.19 | 5.72 | (0.08 | ) | (3.10 | ) | (3.18 | ) | |||||||||||||||||||||||||
| November 30, 2018 |
47.40 | 0.40 | 3.73 | 4.13 | (0.34 | ) | (2.00 | ) | (2.34 | ) | |||||||||||||||||||||||||
| (1) | Based on average shares outstanding. |
| (2) | Total return in the above table represents the rate that the investor would have earned or lost on an investment in the Fund, assuming reinvestment of dividends. |
| (3) | Not annualized for periods of less than one year. |
| (4) | Annualized for periods of less than one year. |
| (5) | Class C shares commenced operations on April 16, 2020. |
| (6) | The amount shown for a share outstanding throughout the year does not correspond with the change in aggregate gains and losses in the portfolio of securities during the year because of the timing of sales and purchases of fund shares in relation to fluctuating values during the year. |
The accompanying notes are an integral part of these financial statements.
30
Table of Contents
| Ratio of expenses to average net assets |
Ratio of net investment income (loss) to average net assets |
|||||||||||||||||||||||||||||||||||||
| Net Asset Value, End of Period |
Total Return(2) |
Net assets at end of period (000’s) |
Before waivers and recoupment of expenses |
After waivers and recoupment of expenses |
Before waivers and recoupment of expenses |
After waivers and recoupments of expenses |
Portfolio turnover rate | |||||||||||||||||||||||||||||||
| $71.01 | 6.06 | % | $ | 392,012 | 0.84 | % | 0.84 | % | 1.12 | % | 1.11 | % | 11.15 | % | ||||||||||||||||||||||||
| 69.86 | 42.62 | % | 242,387 | 0.84 | % | 0.84 | % | 0.63 | % | 0.62 | % | 17.40 | % | |||||||||||||||||||||||||
| 49.86 | 0.48 | % | 91,824 | 0.88 | % | 0.84 | % | 1.32 | % | 1.36 | % | 40.26 | % | |||||||||||||||||||||||||
| 51.73 | 12.81 | % | 15,443 | 0.86 | % | 0.84 | % | 1.12 | % | 1.14 | % | 20.75 | % | |||||||||||||||||||||||||
| 49.19 | 9.11 | % | 13,787 | 0.86 | % | 0.84 | % | 0.84 | % | 0.86 | % | 10.98 | % | |||||||||||||||||||||||||
31
Table of Contents
SMEAD INTERNATIONAL VALUE FUND
| Financial Highlights | ||||
| November 30, 2022 | ||||
| Income from investment operations | |||||||||||||||||||||||||||||||||||||||||||
| Net Asset Value, Beginning of Period |
Net investment income(2) |
Net realized and unrealized gain/(loss) on investments |
Total from investment operations |
Net Asset Value, End of Period |
Total Return(3)(4) |
Net assets at end of period (000’s) | |||||||||||||||||||||||||||||||||||||
| Investor Class |
|||||||||||||||||||||||||||||||||||||||||||
| November 30, 2022(1) |
$ | 49.33 | $ | 0.08 | $ | 0.50 | $ | 0.58 | $ | 49.91 | 1.18 | % | $ | 19 | |||||||||||||||||||||||||||||
| Class A |
|||||||||||||||||||||||||||||||||||||||||||
| November 30, 2022(1) |
48.83 | 0.33 | 0.16 | 0.49 | 49.32 | 1.00 | % | 2,630 | |||||||||||||||||||||||||||||||||||
| Class C |
|||||||||||||||||||||||||||||||||||||||||||
| November 30, 2022(1) |
46.84 | (0.14 | )(6) | 0.40 | 0.26 | 47.10 | 0.58 | % | 106 | ||||||||||||||||||||||||||||||||||
| Class I1 |
|||||||||||||||||||||||||||||||||||||||||||
| November 30, 2022(1) |
49.78 | 0.43 | 0.20 | 0.63 | 50.41 | 1.27 | % | 39,428 | |||||||||||||||||||||||||||||||||||
| Class Y |
|||||||||||||||||||||||||||||||||||||||||||
| November 30, 2022(1) |
50.18 | 0.49 | 0.24 | 0.73 | 50.91 | 1.45 | % | 33,351 | |||||||||||||||||||||||||||||||||||
| (1) | Period from January 12, 2022, date operations commenced, through November 30, 2022. |
| (2) | Based on average shares outstanding. |
| (3) | Total return in the above table represents the rate that the investor would have earned or lost on an investment in the Fund, assuming reinvestment of dividends. |
| (4) | Not annualized for periods of less than one year. |
| (5) | Annualized for periods of less than one year. |
| (6) | The amount shown for a share outstanding throughout the year does not correspond with the change in aggregate gains and losses in the portfolio of securities during the year because of the timing of sales and purchases of fund shares in relation to fluctuating values during the year. |
The accompanying notes are an integral part of these financial statements.
32
Table of Contents
| Ratio of expenses to average net assets |
Ratio of net investment income (loss) to average net assets |
||||||||||||||||||||||
| Before waivers and recoupment of expenses(5) |
After waivers and recoupment of expenses(5) |
Before waivers and recoupment of expenses(5) |
After waivers and recoupments of expenses(5) |
Portfolio turnover rate(4) | |||||||||||||||||||
| 1.42% | 1.42 | % | 0.19 | % | 0.19 | % | 20.30 | % | |||||||||||||||
| 1.51% | 1.51 | % | 0.78 | % | 0.78 | % | 20.30 | % | |||||||||||||||
| 2.02% | 2.02 | % | (0.34 | )% | (0.34 | )% | 20.30 | % | |||||||||||||||
| 1.23% | 1.23 | % | 0.99 | % | 0.99 | % | 20.30 | % | |||||||||||||||
| 1.15% | 1.00 | % | 0.97 | % | 1.12 | % | 20.30 | % | |||||||||||||||
33
Table of Contents
SMEAD FUNDS
November 30, 2022
| (1) | Organization |
The Smead Value Fund and the Smead International Value Fund (each, a “Fund” and together, the “Funds”) are non-diversified series of Smead Funds Trust, a Delaware statutory trust (the “Trust”) organized on July 17, 2014. The Trust is registered under the Investment Company Act of 1940, as amended (the “1940 Act”), as an open-end management investment company. Each Fund is an investment company and accordingly follows the investment company accounting and reporting guidance of the Financial Accounting Standards Board (FASB) Accounting Standards Codification Topic 946 Financial Services-Investment Companies. Each Fund’s investment objective is long-term capital appreciation. The Trust may issue an unlimited number of interests (or shares) of beneficial interest, each with a par value of $0.001. The Smead Value Fund currently offers seven classes of shares: Investor Class, Class A, Class C, Class I1, Class R1, Class R2 and Class Y shares. Class I2, Class R3 and Class R4 shares are not yet in operation and thus not currently offered by the Smead Value Fund. The Smead International Value Fund currently offers five classes of shares: Investor Class, Class A, Class C, Class I1 and Class Y shares. The Class I2 shares are not currently available for purchase. Each class of shares of the Funds has identical rights and privileges except with respect to the distribution and shareholder servicing fees, and voting rights on matters affecting a single class of shares. The classes differ principally in their respective distribution and shareholder servicing expenses. Smead Capital Management, Inc., acts as the Funds’ investment adviser (the “Adviser”).
The Smead International Value Fund succeeded to substantially all of the assets and liabilities of the Smead International Value Fund LP, a Delaware Limited Partnership, in exchange solely for Class I1 shares of the Fund on January 11, 2022 (the “Reorganization”).
In January 2022, the partners of the Smead International Value Fund, L.P. (the “International Partnership”) approved the conversion of the International Partnership into the Smead International Value Fund effective January 12, 2022. The Smead International Value Fund is a successor to the International Partnership and has substantially the same investment objectives and strategies as did the International Partnership. The conversion was accomplished through a tax-free exchange of 163,932 shares of Smead International Value Fund, for the value of $8,170,405. The investment portfolio of International Partnership with a fair value of $8,056,631, identified cost of $4,908,647 and unrealized appreciation of $3,147,984 at January 11, 2022, was the principal asset acquired by Smead International Value Fund. For financial reporting purposes, assets received and shares issued by Smead International Value Fund were recorded at fair value. However, the cost basis of the investments received from International Partnership was carried forward to align ongoing reporting of Smead International Value Fund’s realized and unrealized gains and losses with amounts distributable to shareholders for tax purposes.
| (2) | Significant Accounting Policies |
The following is a summary of significant accounting policies consistently followed by the Funds in the preparation of the financial statements. These policies are in conformity with generally accepted accounting principles in the United States of America (“GAAP”).
34
Table of Contents
SMEAD FUNDS
Notes to Financial Statements (Continued)
November 30, 2022
| (a) | Investment Valuation |
The Funds value their investments at fair value. Each security owned by the Funds that is listed on a securities exchange is valued at its last sale price on that exchange on the date as of which assets are valued. When the security is listed on more than one exchange, the Funds will use the price of the exchange that the Funds generally consider to be the principal exchange on which the security is traded.
Fund securities listed on The NASDAQ Stock Market, Inc. (“NASDAQ”) will be valued at the NASDAQ Official Closing Price (“NOCP”), which may not necessarily represent the last sale price. If the NOCP is not available, such securities shall be valued at the last sale price on the day of valuation. If there has been no sale on such exchange or on NASDAQ on such day, the security is valued at the mean between the most recent bid and asked prices on such day. Over-the-counter securities that are not traded on NASDAQ shall be valued at the most recent trade price.
Debt securities, other than short-term instruments, are valued at the mean between the closing bid and asked prices provided by a pricing service (“Pricing Service”). If the closing bid and asked prices are not readily available, the Pricing Service may provide a price determined by matrix pricing or other analytical pricing models. Short-term debt securities, such as commercial paper, bankers’ acceptances and U.S. Treasury bills having a maturity of less than 60 days, are valued at amortized cost, which approximates fair value. If a short-term debt security has a maturity of greater than 60 days, it is valued at market price.
Redeemable securities issued by open-end, registered investment companies, including money market funds, are valued at the net asset value (“NAV”) of such companies for purchase and/or redemption orders placed on that day.
When market quotations are not readily available, any security or other asset is valued at its fair value as determined under fair value pricing procedures approved by the Trust’s Board of Trustees (the “Board of Trustees”). These fair value pricing procedures will also be used to price a security when corporate events, events in the securities market and/or world events cause the Adviser to believe that a security’s last sale price may not reflect its actual fair market value. The intended effect of using fair value pricing procedures is to ensure that the Funds are accurately priced.
The Funds’ fair value procedures considers fair valuation accounting standards that establish an authoritative definition of fair value and set out a hierarchy for measuring fair value. These standards require additional disclosures about the various inputs used to develop the measurements of fair value. These inputs are summarized in the three broad levels listed below:
| Level 1—unadjusted | quoted prices in active markets for identical securities. |
| Level 2—other | significant observable inputs (including unadjusted quoted prices for similar securities, interest rates, prepayment speeds, credit risk, etc.). |
| Level 3—significant | unobservable inputs (including a Fund’s own assumptions in determining the fair value of investments). |
35
Table of Contents
SMEAD FUNDS
Notes to Financial Statements (Continued)
November 30, 2022
The inputs or methodology used for valuing securities are not necessarily an indication of the risk associated with investing in those securities. The following table summarizes the valuation inputs of each Fund’s investments by each fair value hierarchy level as of November 30, 2022:
| Level 1 |
Level 2 |
Level 3 |
Total | |||||||||||||||||
| Smead Value Fund | ||||||||||||||||||||
| Equity |
| |||||||||||||||||||
| Common Stocks(1) |
$ | 4,071,974,214 | $ | — | $ | — | $ | 4,071,974,214 | ||||||||||||
|
|
|
|
|
|
|
|
|
|||||||||||||
| Total Equity |
4,071,974,214 | — | — | 4,071,974,214 | ||||||||||||||||
|
|
|
|
|
|
|
|
|
|||||||||||||
| Total Investments in Securities |
$ | 4,071,974,214 | $ | — | $ | — | $ | 4,071,974,214 | ||||||||||||
|
|
|
|
|
|
|
|
|
|||||||||||||
| Smead International Value Fund | ||||||||||||||||||||
| Equity |
| |||||||||||||||||||
| Common Stocks(1) |
$ | 29,325,574 | $ | 36,520,917 | $ | — | $ | 65,846,491 | ||||||||||||
| Warrants |
7,052,753 | — | — | 7,052,753 | ||||||||||||||||
|
|
|
|
|
|
|
|
|
|||||||||||||
| Total Equity |
36,378,327 | 36,520,917 | — | 72,899,244 | ||||||||||||||||
|
|
|
|
|
|
|
|
|
|||||||||||||
| Total Investments in Securities |
$ | 36,378,327 | $ | 36,520,917 | $ | — | $ | 72,899,244 | ||||||||||||
|
|
|
|
|
|
|
|
|
|||||||||||||
| (1) | See the Schedule of Investments for industry classification. |
No Level 3 securities were held in the Funds at November 30, 2022. For the year ended November 30, 2022, there were no transfers between levels for the Funds. The Funds did not hold financial derivative instruments during the reporting period.
In accordance with procedures adopted by the Trust’s Board of Trustees, fair value pricing may be used if events materially affecting the value of foreign equity securities occur between the time the exchange on which they are traded closes and the time the Smead International Value Fund’s NAVs are calculated. The Fund uses a systematic valuation model, provided daily by an independent third party, to fair value their international equity securities. These valuations are considered as Level 2 in the fair value hierarchy.
| (b) | Share Valuation |
The NAV per share of each class is calculated by dividing the sum of the value of the securities held by the class plus cash or other assets, minus all liabilities (including estimated accrued expenses) by the total number of shares outstanding for the class rounded to the nearest cent. The class’s shares will not be priced on the days on which the New York Stock Exchange is closed for trading.
| (c) | Use of Estimates |
The preparation of financial statements in conformity with GAAP requires management to make estimates and assumptions that affect the reported amounts of assets and liabilities and disclosure of contingent assets and liabilities at the date of
36
Table of Contents
SMEAD FUNDS
Notes to Financial Statements (Continued)
November 30, 2022
the financial statements and the reported amounts of increases and decreases in net assets from operations during the reporting period. Actual results could differ from those estimates.
| (d) | Allocation of Income, Expenses and Gains/Losses |
Income, expenses (other than those deemed attributable to a specific share class, such as distribution and shareholder servicing fees), and gains and losses of the Funds are allocated daily to each class of shares based upon the ratio of net assets represented by each class as a percentage of the net assets of the Funds. Expenses deemed directly attributable to a class of shares are recorded by the specific class. Most Fund expenses are allocated by class based on relative net assets. Rule 12b-1 fees for Smead Value Fund are expensed at 0.25% of average daily net assets of the Investor Class and Class A shares, 0.75% of average daily net assets of the Class C shares, and 0.50% of the average daily net assets of the Class R1 and Class R2 shares. Rule 12b-1 fees for Smead International Value Fund are expensed at 0.25% of average daily net assets of the Investor Class and Class A shares, and 0.75% of average daily net assets of the Class C shares. A separate shareholder servicing fee is authorized up to 0.25% of the average daily net assets attributable to Class A shares, Class C shares, Investor Class shares, Class I1 shares, Class I2 shares, Class R1 shares and Class R2 shares of Smead Value Fund, and Class A shares, Class C shares, Investor Class shares, Class I1 shares, Class I2 shares and Class Y shares of Smead International Value Fund, respectively. However, as of November 30, 2022, those fees were expensed at the following rates: 0.11% for the Investor Class shares and Class A, 0.16% for Class C shares, 0.09% for Class I1 shares, 0.16% for Class R1 shares, and 0.06% for Class R2 shares of Smead Value Fund. Additionally, as of November 30, 2022, those fees were expensed at the following rates: 0.00% for the Investor Class shares, 0.12% for the Class A shares, 0.11% for Class C, 0.08% for Class I1 shares and 0.00% for class Y shares of Smead International Value Fund.
| (e) | Federal Income Taxes |
The Funds comply with the requirements of Subchapter M of the Internal Revenue Code of 1986, as amended, necessary to qualify as regulated investment companies and make the requisite distributions of income and capital gains to their shareholders sufficient to relieve them from all or substantially all federal income taxes. Therefore, no federal income tax provision has been provided.
As of and during the fiscal year ended November 30, 2022, the Smead Value Fund and Smead International Value Fund did not have a liability for any unrecognized tax benefits. The Smead Value Fund and Smead International Value Fund recognize interest and penalties, if any, related to unrecognized tax benefits as income tax expense in the statement of operations. During the fiscal year ended November 30, 2022, the Smead Value Fund and Smead International Value Fund did not incur any interest or penalties.
37
Table of Contents
SMEAD FUNDS
Notes to Financial Statements (Continued)
November 30, 2022
As of November 30, 2022, the components of accumulated earnings on a tax basis were as follows :
| Smead Value Fund |
Smead International Value Fund | |||||||||
| Cost basis of investments for federal income tax purposes |
$ | 3,381,237,299 | $ | 66,284,255 | ||||||
|
|
|
|
|
|||||||
| Gross tax unrealized appreciation |
760,276,968 | 13,952,087 | ||||||||
| Gross tax unrealized depreciation |
(69,540,053 | ) | (7,337,098 | ) | ||||||
|
|
|
|
|
|||||||
| Net tax unrealized appreciation |
$ | 690,736,915 | $ | 6,614,989 | ||||||
|
|
|
|
|
|||||||
| Undistributed ordinary income |
$ | 34,811,565 | $ | 575,077 | ||||||
| Undistributed long-term capital gain |
47,584,737 | — | ||||||||
|
|
|
|
|
|||||||
| Total accumulated gains |
$ | 82,396,302 | $ | 575,077 | ||||||
|
|
|
|
|
|||||||
| Other accumulated losses |
— | (3,578,404 | )(1) | |||||||
|
|
|
|
|
|||||||
| Total distributable earnings |
$ | 773,133,217 | $ | 3,610,838 | ||||||
|
|
|
|
|
|||||||
| (1) | Other accumulated losses disclosed above pertains to Capital Loss Carryforwards, and are deemed Short Term in nature. |
The tax basis of investments for tax and financial reporting purposes differs principally due to the deferral of losses on wash sales.
| (f) | Distributions to Shareholders |
The Funds will distribute any net investment income and any net realized long or short-term capital gains at least annually. Distributions from net realized gains for book purposes may include short-term capital gains. All short-term capital gains are included in ordinary income for tax purposes. Distributions to shareholders are recorded on the ex-dividend date. The Funds may also pay a special distribution at the end of the calendar year to comply with federal tax requirements. Income and capital gains distributions may differ from GAAP, primarily due to timing differences in the recognition of income, gains and losses by the Funds. GAAP requires that certain components of net assets relating to permanent differences be reclassified between the components of net assets. These reclassifications have no effect on net assets or net asset value per share. For the fiscal year ended November 30, 2022, reclassifications were made for equalization utilized and redemption in kinds.
| Fund name |
Total Distributable Earnings (Loss) |
Paid-in Capital |
||||||
| Smead Value Fund | $ | (260,750,995 | ) | $ | 260,750,995 | |||
| Smead International Value Fund | — | — | ||||||
The tax character of distributions paid during the fiscal years ended November 30, 2022 and November 30, 2021 was as follows:
| Smead Value Fund |
November 30, 2022 |
November 30, 2021 | ||||||||
| Ordinary Income |
$ | 14,553,327 | $ | 11,796,035 | ||||||
| Long-Term Capital Gain |
$ | 114,901,132 | $ | 8,929,375 | ||||||
38
Table of Contents
SMEAD FUNDS
Notes to Financial Statements (Continued)
November 30, 2022
| Smead International Value Fund |
November 30, 2022 | ||||
| Ordinary Income |
$ | — | |||
| Long-Term Capital Gain |
$ | — | |||
| Smead Value Fund |
Distributions Paid from | Total Distributions Paid | |||||||||||||
| Class |
Ordinary Income |
Realized Gain/Loss | |||||||||||||
| Investor Class |
$ | 240,533 | $ | 4,014,545 | $ | 4,255,078 | |||||||||
| Class A |
843,949 | 10,412,383 | 11,256,332 | ||||||||||||
| Class C |
22,896 | 659,574 | 682,470 | ||||||||||||
| Class I1 |
12,038,104 | 90,528,086 | 102,566,190 | ||||||||||||
| Class R1 |
— | 6,379 | 6,379 | ||||||||||||
| Class R2 |
175 | 3,710 | 3,885 | ||||||||||||
| Class Y |
1,407,670 | 9,276,455 | 10,684,125 | ||||||||||||
On December 16, 2022, the Smead Funds declared and paid distributions from ordinary income and long-term capital gains to shareholders of record on December 14, 2022.
| (g) | Other |
Investment transactions are recorded on the trade date. The Funds determine the gain or loss from investment transactions based on specific identification using the first in, first out method. Dividend income, less foreign withholding tax, is recognized on the ex-dividend date and interest income is recognized on an accrual basis. Withholding taxes on foreign dividends have been provided for in accordance with the Funds’ understanding of the applicable country’s tax rules and rates.
(h) Foreign currency translation
The books and records of the Funds are maintained in U.S. dollars. Investment securities and other assets and liabilities denominated in a foreign currency are translated into U.S. dollars on the date of valuation. The Funds do not isolate that portion of realized or unrealized gains and losses resulting from changes in the foreign exchange rate from fluctuations arising from changes in the market prices of the securities. These gains and losses are included in net realized and unrealized gains (losses) on investments on the Statements of Operations.
Net realized and unrealized gains (losses) on foreign currency transactions represent net foreign exchange gains or losses from disposition of foreign currencies, currency gains or losses realized between trade and settlement dates on securities transactions and the difference between the amount of the investment income and foreign withholding taxes recorded on the Funds’ books and the U.S. dollar equivalent amounts actually received or paid.
| (3) | Investment Adviser |
The Funds have an Investment Advisory Agreement (the “Agreement”) with the Adviser to furnish investment advisory services to the Funds. Under the terms of the Agreement, each Fund compensates the Adviser for its management services at the annual rate of 0.75% of the Fund’s average daily net assets.
39
Table of Contents
SMEAD FUNDS
Notes to Financial Statements (Continued)
November 30, 2022
The Adviser has contractually agreed to waive its management fee and/or reimburse each Fund’s other expenses (the “Expense Limitation Caps”) at least through March 31, 2023 to the extent necessary to ensure that the Fund’s operating expenses do not exceed 1.26%, 1.26%, 1.84%, 0.99%, 1.59%, 1.44% and 0.84% of the Fund’s average daily net assets for the Investor Class, Class A, Class C, Class I1, Class R1, Class R2 and Class Y shares for the Smead Value Fund and 1.25%, 1.42%, 2.00%, 1.15% and 1.00% of the Fund’s average daily net assets for the Investor Class, Class A, Class C, Class I1 and Class Y shares for the Smead International Value Fund, respectively. Any such waiver or reimbursement is subject to later adjustment to allow the Adviser to recoup amounts waived or reimbursed to the extent actual fees and expenses for a fiscal period (taking into account the reimbursement) does not exceed the Expense Limitation Caps in place at the time of waiver; provided, however, that the Adviser shall only be entitled to recoup such amounts over the following three fiscal years. For the year ended November 30, 2022, the Adviser waived expenses of $33,480 for Smead International Value Fund. The following table shows the waived or reimbursed expenses subject to potential recovery expiring on November 30:
| Year incurred |
Expiration Year | Smead Value Fund |
Smead International Value Fund |
|||||||||
| 2020 | 2022 | $ | — | $ | — | |||||||
| 2021 | 2023 | — | — | |||||||||
| 2022 | 2024 | — | 33,480 | |||||||||
For the year ended November 30, 2022, the Smead Value Fund made repayments to the Adviser for previously waived and reimbursed fees to the amount of $17,704.
| (4) | Distribution Plan and Shareholder Servicing Plan |
The Funds have adopted a plan pursuant to Rule 12b-1 (the “12b-1 Plan”), which authorizes it to pay UMB Distribution Services, LLC, the Funds’ principal distributor (the “Distributor”), a fee for the Smead Value Fund at an annual rate of 0.25% of the Fund’s average daily net assets of Investor Class and Class A shares, 0.75% of the Fund’s average daily net assets of Class C shares, and 0.50% of the Fund’s average daily net assets of Class R1 and Class R2 shares for services to prospective Fund shareholders and distribution of Fund shares of the Smead Value Fund. There is no 12b-1 fee for Class Y and Class I1 shares of the Smead Value Fund. Under the 12b-1 Plan, the Smead International Value Fund pays a fee at the annual rate of 0.25% of the Fund’s average daily net assets of Investor Class and Class A shares and 0.75% of the Fund’s average daily net assets of Class C shares for services to prospective Fund shareholders and distribution of Fund shares of the Smead International Value Fund. There are no 12b-1 fees for Class I1, Class I2 and Class Y shares of the Smead International Value Fund. During the year ended November 30, 2022, the Trust accrued expenses pursuant to the 12b-1 Plan as per below:
40
Table of Contents
SMEAD FUNDS
Notes to Financial Statements (Continued)
November 30, 2022
| Smead Value Fund |
|||||
| Investor Class |
$ | 261,104 | |||
| Class A |
911,709 | ||||
| Class C |
216,574 | ||||
| Class R1 |
873 | ||||
| Class R2 |
430 | ||||
| Smead International Value Fund |
|||||
| Investor Class |
$ | 20 | |||
| Class A |
5,015 | ||||
| Class C |
422 | ||||
As of November 30, 2022, the Smead Value Fund and Smead International Value Fund owed the Distributor fees of $130,028 and $597, respectively.
The Funds have also adopted a separate shareholder servicing plan (the “Shareholder Servicing Plan”). The Shareholder Servicing Plan also authorizes payment of a shareholder servicing fee to financial intermediaries and other service providers up to 0.25% of the average daily net assets attributable to the Class A shares, Class C shares, Investor Class shares, Class I1 shares, Class I2 shares, Class R1 shares and Class R2 shares, respectively (this fee is referred to as the “Shareholder Servicing Fee”). However, as of November 30, 2022, these Shareholder Servicing Fees were expensed at the following rates: 0.11% for the Investor Class shares and Class A, 0.16% for Class C shares, 0.09% for Class I1 shares, 0.16% for Class R1 shares, and 0.06% for Class R2 shares of Smead Value Fund. Additionally, as of November 30, 2022, those fees were expensed at the following rates: 0.00% for the Investor Class shares, 0.12% for the Class A shares, 0.11% for Class C and 0.08% for Class I1 shares of Smead International Value Fund. There is no Shareholder Servicing Fee for the Class Y shares of the Funds. For those share classes that currently charge less than the maximum Shareholder Servicing Fee permitted under the Shareholder Servicing Plan, the Funds may increase such fee, but not beyond the maximum of 0.25%, only after providing affected shareholders with 30 days’ prior written notice. The following table details the Shareholder Servicing Plan fees paid for the year ended November 30, 2022.
| Smead Value Fund |
|||||
| Investor Class |
$ | 109,992 | |||
| Class A |
386,405 | ||||
| Class C |
45,484 | ||||
| Class I1 |
2,766,440 | ||||
| Class R1 |
275 | ||||
| Class R2 |
53 | ||||
| Smead International Value Fund |
|||||
| Class A |
$ | 2,377 | |||
| Class C |
60 | ||||
| Class I1 |
25,085 | ||||
41
Table of Contents
SMEAD FUNDS
Notes to Financial Statements (Continued)
November 30, 2022
| (5) | Accounting, Custody, Administration and Transfer Agent Fees |
State Street Bank and Trust Company (“State Street”) serves as the Funds’ accounting agent, custodian of the Funds’ investments and administrator of the Funds. For its services, the Funds pay State Street a fee that is calculated daily and paid monthly at an annual rate based on the aggregate average daily net assets of the Funds, along with transactional and out-of-pocket fees.
Effective December 1, 2022, The Trust replaced State Street with The Northern Trust as the Funds’ accounting agent, custodian and administrator. Fees payable to The Northern Trust are calculated in a similar fashion as the manner in which such fees were calculated for State Street.
UMB Fund Services, Inc. (“UMB”) is the Funds’ transfer and dividend disbursing agent. UMB receives a fee that is calculated daily and paid monthly at an annual rate based on the average daily net assets of the Funds, and is reimbursed for certain out-of-pocket expenses.
| (6) | Capital Share Transactions |
Transactions in shares of the Funds were as follows:
| Smead Value Fund | ||||||||||||||||||||
| For The Year Ended November 30, 2022 |
For The Year Ended November 30, 2021 | |||||||||||||||||||
| Shares | Amount | Shares | Amount | |||||||||||||||||
| Proceeds from shares sold |
||||||||||||||||||||
| Investor Class |
99,745 | $ | 6,794,192 | 286,945 | $ | 17,699,957 | ||||||||||||||
| Class A |
3,992,778 | 267,269,120 | 2,324,320 | 148,472,498 | ||||||||||||||||
| Class C |
411,277 | 26,868,991 | 245,193 | 15,554,280 | ||||||||||||||||
| Class I1 |
25,895,502 | 1,749,633,388 | 20,924,678 | 1,357,662,229 | ||||||||||||||||
| Class R1 |
1,066 | 71,379 | 221 | 12,384 | ||||||||||||||||
| Class R2 |
498 | 33,958 | 968 | 61,431 | ||||||||||||||||
| Class Y |
9,249,855 | 643,381,810 | 1,931,764 | 122,175,846 | ||||||||||||||||
| Issued in reinvestment of dividends and distributions |
||||||||||||||||||||
| Investor Class |
58,748 | 3,986,070 | 20,200 | 1,022,342 | ||||||||||||||||
| Class A |
129,616 | 8,715,869 | 22,238 | 1,116,851 | ||||||||||||||||
| Class C |
6,377 | 420,517 | 89 | 4,407 | ||||||||||||||||
| Class I1 |
1,045,630 | 70,872,795 | 172,003 | 8,698,174 | ||||||||||||||||
| Class R2 |
3 | 204 | — | — | ||||||||||||||||
| Class Y |
69,867 | 4,741,905 | 7,236 | 366,205 | ||||||||||||||||
| Payments for shares redeemed |
||||||||||||||||||||
| Investor Class |
(220,825 | ) | (14,844,231 | ) | (336,316 | ) | (20,481,907 | ) | ||||||||||||
| Class A |
(2,000,190 | ) | (130,436,680 | ) | (511,476 | ) | (32,498,488 | ) | ||||||||||||
| Class C |
(62,159 | ) | (3,861,718 | ) | (4,985 | ) | (322,111 | ) | ||||||||||||
| Class I1 |
(11,785,775 | ) | (782,476,775 | ) | (5,472,298 | ) | (345,892,058 | ) | ||||||||||||
| Class R1 |
(92 | ) | (6,272 | ) | (3,674 | ) | (235,195 | ) | ||||||||||||
| Class R2 |
(817 | ) | (55,890 | ) | (1,069 | ) | (54,416 | ) | ||||||||||||
| Class Y |
(7,268,942 | ) | (510,291,747 | ) | (311,206 | ) | (19,674,924 | ) | ||||||||||||
|
|
|
|
|
|
|
|
|
|||||||||||||
| Total increase in net assets from capital share transactions |
19,622,162 | $ | 1,340,816,885 | 19,294,831 | $ | 1,253,687,505 | ||||||||||||||
|
|
|
|
|
|
|
|
|
|||||||||||||
42
Table of Contents
SMEAD FUNDS
Notes to Financial Statements (Continued)
November 30, 2022
| Smead International Value Fund | ||||||||||
| For The Period Ended November 30, 2022 | ||||||||||
| Shares | Amount | |||||||||
| Proceeds from shares sold |
||||||||||
| Investor Class |
378 | $ | 16,233 | |||||||
| Class A |
66,640 | 3,288,896 | ||||||||
| Class C |
2,244 | 108,017 | ||||||||
| Class I1 |
842,878 | 39,105,686 | ||||||||
| Class Y |
683,082 | 34,296,415 | ||||||||
| Payments for shares redeemed |
||||||||||
| Class A |
(13,304 | ) | (641,752 | ) | ||||||
| Class I1 |
(60,690 | ) | (2,893,374 | ) | ||||||
| Class Y |
(28,025 | ) | (1,356,509 | ) | ||||||
|
|
|
|
|
|||||||
| Total increase in net assets from capital share transactions |
1,493,203 | $ | 71,923,612 | |||||||
|
|
|
|
|
|||||||
The Smead International Value Fund reorganized on January 11, 2022, hence no comparative information for prior periods is provided.
| (7) | Investment Transactions |
The aggregate purchases and sales of securities, excluding short-term investments, for the Smead Value Fund for the year ended November 30, 2022 were $1,747,233,340 and $399,190,506, respectively. The aggregate purchases and sales of securities, excluding short-term investments, for the Smead International Value Fund for the period ended November 30, 2022 were $76,681,457 and $12,249,438, respectively. There were no purchases or sales of U.S. government securities for the Funds.
| (8) | Beneficial Ownership |
The beneficial ownership, either directly or indirectly, of more than 25% of the voting securities of a fund creates a presumption of control of the fund, under Section 2(a)(9) of the 1940 Act. At November 30, 2022, the record holder information for Smead Value Fund and Smead International Value Fund were as follows:
| Percentage | |||||
| Smead Value Fund |
|||||
| National Financial Services LLC, |
|||||
| Investor Class |
54.75 | % | |||
| Class I1 |
27.63 | % | |||
| Wells Fargo Clearing Services LLC, |
|||||
| Class C |
50.53 | % | |||
| Merrill Lynch Pierce Fenner & Smith, |
|||||
| Class C |
32.24 | % | |||
| Class I1 |
25.10 | % | |||
| Class R1 |
100.00 | % | |||
| Class R2 |
83.41 | % | |||
43
Table of Contents
SMEAD FUNDS
Notes to Financial Statements (Continued)
November 30, 2022
| Percentage | |||||
| Smead International Value Fund |
|||||
| Skamokawa Living Trust |
|||||
| Investor Class |
26.82 | % | |||
| TD Ameritrade Inc., |
|||||
| Class A |
69.32 | % | |||
| Charles Schwab & Company, Inc, |
|||||
| Class C |
95.24 | % | |||
| Class I1 |
63.00 | % | |||
| The Timothy A Gaar Living Trust |
|||||
| Investor Class |
61.18 | % | |||
| National Financial Services LLC, |
|||||
| Class A |
26.77 | % | |||
| (9) | Principal Risks |
| General | Investment Risks |
An investment in the Funds represents an indirect investment in the assets owned by the Funds. As with any mutual fund, the value of the assets owned by the Funds may move up or down, and as a result, an investment in the Funds at any point in time may be worth more or less than the original amount invested.
Each Fund’s transactions in listed securities are settled/paid for upon delivery to or from their counterparties; therefore, the risk of counterparty default for listed securities is considered minimal, as delivery of securities sold is only made once the Funds have received payment. Payment is made on a purchase once the securities have been delivered by the counterparty. The trade will fail if either party fails to meet its obligations.
| Market | and Regulatory Risks |
Events in the financial markets and economy may cause volatility and uncertainty and affect Fund performance. Market events may affect a single issuer, industry, sector, or the market as a whole. In addition, because of interdependencies between markets, events in one market may adversely impact other markets or issuers in which the Funds invest in unforeseen ways. For example, the global outbreak of COVID-19 has disrupted financial markets and the prolonged economic impact is uncertain. Traditionally liquid investments may experience periods of diminished liquidity. During a general downturn in the financial markets, multiple asset classes may decline in value and the Funds may lose value, regardless of the individual results of the securities and other instruments in which the Funds invest. Governmental and regulatory actions, including tax law changes, may also impair Fund management and have unexpected or adverse consequences on particular markets, strategies, or investments. Future market or regulatory events may impact the Funds in unforeseen ways, such as causing the Funds to alter their existing strategies or potentially, to liquidate and close.
44
Table of Contents
SMEAD FUNDS
Notes to Financial Statements (Continued)
November 30, 2022
| Equity | Investments Risks |
Stock markets are volatile. Equity investments tend to go up or down in value, sometimes rapidly and unpredictably, in response to many factors, including a company’s historical and prospective earnings, the value of its assets, general economic conditions, interest rates, investor perceptions, and market liquidity. Due to the complexities of markets, events in one market or sector may adversely impact other markets or sectors.
| (10) | Subsequent Event |
Management has evaluated the possibility of subsequent events through the date of issuance and determined that there are no material events that would require adjustment to or disclosure in the Funds’ financial statements.
45
Table of Contents
SMEAD FUNDS
Report of Independent Registered Public Accounting Firm
To the Shareholders and Board of Trustees of
Smead Funds Trust
Opinion on the Financial Statements
We have audited the accompanying statements of assets and liabilities, including the schedules of investments, of Smead Funds Trust comprising the funds listed below (the “Funds”) as of November 30, 2022, the related statements of operations, the statements of changes in net assets, the related notes, and the financial highlights for each of the periods indicated below (collectively referred to as the “financial statements”). In our opinion, the financial statements present fairly, in all material respects, the financial position of each of the Funds as of November 30, 2022, the results of their operations, the changes in net assets, and the financial highlights for each of the periods indicated below in conformity with accounting principles generally accepted in the United States of America.
| Fund Name |
Statements of |
Statements of |
Financial Highlights | ||||
| Smead Value Fund |
For the year ended November 30, 2022 | For the years ended November 30, 2022 and 2021 | For the years ended November 30, 2022, 2021, 2020, 2019 and 2018 | ||||
| Smead International Value Fund | For the period from January 12, 2022 (commencement of operations) through November 30, 2022. | ||||||
Basis for Opinion
These financial statements are the responsibility of the Funds’ management. Our responsibility is to express an opinion on the Funds’ financial statements based on our audits. We are a public accounting firm registered with the Public Company Accounting Oversight Board (United States) (“PCAOB”) and are required to be independent with respect to the Funds in accordance with the U.S. federal securities laws and the applicable rules and regulations of the Securities and Exchange Commission and the PCAOB.
We conducted our audits in accordance with the standards of the PCAOB. Those standards require that we plan and perform the audit to obtain reasonable assurance about whether the financial statements are free of material misstatement whether due to error or fraud.
Our audits included performing procedures to assess the risks of material misstatement of the financial statements, whether due to error or fraud, and performing procedures that respond to those risks. Such procedures included examining, on a test basis, evidence regarding the amounts and disclosures in the financial statements. Our procedures included confirmation of securities owned as of November 30, 2022, by correspondence with the custodians and brokers. Our audits also included evaluating the accounting principles used and significant estimates made by management, as well as evaluating the overall presentation of the financial statements. We believe that our audits provide a reasonable basis for our opinion.
We have served as the Funds’ auditor since 2007.

COHEN & COMPANY, LTD.
Cleveland, Ohio
January 27, 2023
46
Table of Contents
SMEAD FUNDS
Basis for Trustees’ Approval of Investment Advisory Agreement
(Unaudited)
The Board of Trustees (the “Board” or the “Trustees”) of Smead Funds Trust (the “Trust”) met on August 2, 2022 to consider the renewal of the Investment Advisory Agreement (the “Agreement”) between the Trust, on behalf of the Smead Value Fund (the “Value Fund”), a series of the Trust, and Smead Capital Management, Inc., the Fund’s investment adviser (the “Adviser”). Prior to this meeting, the Independent Trustees (defined below) requested and received materials to assist them in considering the renewal of the Agreement. The materials provided contained information with respect to the factors enumerated below, including a copy of the Agreement, a memorandum prepared by legal counsel to the Trust and the Independent Trustees discussing in detail the Trustees’ fiduciary obligations and the factors they should assess in considering the renewal of the Agreement, detailed comparative performance and fee information prepared by an independent consulting firm, due diligence materials relating to the Adviser (including the Adviser’s response to the Independent Trustees’ request for information, the Adviser’s Form ADV and select financial statements of the Adviser) and other pertinent information. Based on their evaluation of the information provided by the Adviser, in conjunction with the Value Fund’s other service providers, the Trustees, by a unanimous vote (including a separate vote of the Trustees who are not “interested persons,” as that term is defined in the Investment Company Act of 1940, as amended (the “Independent Trustees”)), approved the renewal of the Agreement for an additional one-year term.
It was noted that at the time of the meeting, the Trustees were not required to consider the renewal of the Investment Advisory Agreement between the Trust, on behalf of the Smead International Value Fund, and the Adviser because the Board approved the agreement for the Smead International Value Fund on December 9, 2021, and the agreement has an initial term of two years beginning January 12, 2022.
DISCUSSION OF FACTORS CONSIDERED
In considering the renewal of the Agreement and reaching their conclusions, the Board reviewed and analyzed various factors that they determined were relevant, including the factors enumerated below.
| 1. | NATURE, EXTENT AND QUALITY OF SERVICES |
The Independent Trustees reviewed and considered the nature, extent and quality of the services provided by the Adviser and expected that they would continue to be of high quality. They noted that the Adviser’s history, experience and reputation were exceptional. The Independent Trustees considered the experience and qualifications of the personnel at the Adviser who were responsible for providing services to the Value Fund and the compensation structure of the Adviser. The Independent Trustees also considered the resources, policies, procedures and infrastructure of the Adviser devoted to ensuring compliance with applicable laws and regulations, as well as the Adviser’s commitment to those programs, including the Adviser’s use of third-party compliance and cybersecurity providers to support the Adviser’s own compliance efforts. The Independent Trustees noted that there were currently no known pending regulatory actions by the Securities and Exchange Commission (the “SEC”) or other regulatory agencies involving the Adviser, the Trust or the Value Fund. The Independent Trustees also noted that during the past year, the Adviser has
47
Table of Contents
SMEAD FUNDS
Basis for Trustees’ Approval of Investment Advisory Agreement (Continued)
(Unaudited)
added several new analysts to the portfolio management team. The Independent Trustees concluded that the Adviser’s key personnel had sufficient expertise necessary to continue to serve as investment adviser to the Value Fund and that the nature, overall quality and extent of the management services were satisfactory and reliable.
| 2. | INVESTMENT PERFORMANCE |
The Independent Trustees then considered the performance of the Value Fund. As part of its evaluation, the Independent Trustees reviewed a report prepared by an independent consulting firm, Broadridge. It was noted that the Broadridge report was prepared using the same methodology that the Board relied on in previous years, although the Value Fund changed its Morningstar category from “large blend” to “large value” in January 2018. Even so, Broadridge continued to use both categories for category and peer selection, with an emphasis on both institutional and no-load retail share classes that have no Rule 12b-1 fee and share a high concentration, low turnover, value-oriented strategy. The Broadridge report included comparative information on each share class of the Value Fund, but designated the Value Fund’s I1 Class shares, which is currently the share class with the most assets, as the primary share class. The report compared the Value Fund’s performance to (i) certain funds determined by Broadridge to be comparable based on investment style, expense structure and asset size (the “Morningstar Performance Peer Group”), (ii) funds included in Morningstar’s Large Value and Large Blend categories (the “Morningstar Categories”), and (iii) the Value Fund’s benchmark index (the “S&P 500 Index”). The Independent Trustees examined the performance of the Value Fund, focusing on the Fund’s I1 Class, for the 1-year, 3-year, 5-year and 10-year periods ended June 30, 2022, and noted that the Fund ranked 5th out of 19 funds, 2nd out of 19 funds, 1st out of 19 funds and 1st out of 15 funds respectively, in the Morningstar Performance Peer Group, putting the Fund in the top quartile for each of these periods. For the same periods, the Fund ranked 167th out of 543 funds, 45th out of 513 funds, 35th out of 485 funds, and 5th out of 336 funds, respectively, in the Morningstar Category, putting the Fund in the second quartile for the 1-year period and the top quartile for each of the remaining periods. The Independent Trustees noted that the Fund’s performance outperformed the primary benchmark for the 1-year, 3-year, 5-year and 10-year periods ended June 30, 2022.
The Independent Trustees concluded that the performance obtained by the Adviser for the Value Fund was very good, both from a long-term and a short-term perspective. Although past performance is not a guarantee or indication of future results, the Independent Trustees determined that the Value Fund and its shareholders were likely to benefit from the Adviser’s continued management.
| 3. | COST OF SERVICES PROVIDED AND PROFITS REALIZED BY THE ADVISER |
The Independent Trustees considered the gross advisory fee rate charged by the Adviser to the Value Fund, as well as the effective advisory fee rate (to the extent different) after taking into consideration the Fund’s expense limitation arrangements with the Adviser. The Independent Trustees discussed Broadridge’s analysis which,
48
Table of Contents
SMEAD FUNDS
Basis for Trustees’ Approval of Investment Advisory Agreement (Continued)
(Unaudited)
as of June 30, 2022, showed that the Value Fund’s net expenses of 0.93% exceeded the Morningstar Performance Peer Group and Morningstar Category medians by 22 and 23 basis points, respectively, placing the Value Fund in the fourth quartile. In addition, the Broadridge report noted that, at June 30, 2022 asset levels, the advisory fee of 0.75% fell within the fourth quartile within the Morningstar Category. The Independent Trustees noted that while such fees and expenses were above the median of the Morningstar Performance Peer Group and the Morningstar Category, the short-term and long-term performance of the Value Fund was quite good. Additionally, it was noted that the Adviser’s investment advisory fee was below the fee charged to separately managed accounts using the same investment strategy as the Value Fund. The Independent Trustees also noted that the current expense limitation structure would remain in effect for the Value Fund until at least March 31, 2022.
The Board also reviewed the Adviser’s 2021 and 2020 profitability analysis reports and the Adviser’s most recent audited financial statements which cover the year ended December 31, 2020. The Adviser explained that once the audited financial statements for fiscal 2021 are available, the Adviser will share them with the Independent Trustees, noting that the Adviser’s financial condition has remained stable from year to year.
The Independent Trustees concluded that the Value Fund’s expenses and management fees paid to the Adviser were fair and reasonable in light of the comparative performance, expense and advisory fee information. The Independent Trustees further concluded that the Adviser’s profits in connection with the management of the Value Fund were not excessive and that the Adviser maintained adequate profit levels to support its services to the Value Fund.
| 4. | EXTENT OF ECONOMIES OF SCALE |
The Independent Trustees compared the Value Fund’s expenses relative to its Morningstar Performance Peer Group and its Morningstar Category and discussed realized and potential economies of scale. The Independent Trustees noted that, although the Value Fund did not have advisory fee breakpoints, the Adviser had contractually agreed to limit the expenses of each share class of the Value Fund so that each share class does not exceed its operating expense limitation. The Independent Trustees discussed the possibility of including breakpoints in the investment advisory fee and considered the Adviser’s thoughts on this subject. After further discussion, the Independent Trustees concluded that the current fee structure was reasonable.
| 5. | INDIRECT BENEFITS REALIZED BY THE ADVISER |
The Independent Trustees considered the direct and indirect benefits that have been and may continue to be realized by the Adviser from its association with the Value Fund. The Independent Trustees concluded that the benefits the Adviser received, such as greater name recognition, growth in separate account management services and increased ability to obtain research or brokerage services through the use of soft dollars, appeared to be reasonable, and in many cases benefited the Value Fund through growth in assets. With regard to soft dollars, it was noted that the Value Fund,
49
Table of Contents
SMEAD FUNDS
Basis for Trustees’ Approval of Investment Advisory Agreement (Continued)
(Unaudited)
as the Adviser’s single largest client, generates the most soft dollars for the Adviser, which are then used to service all of the Adviser’s client accounts, including those that do not pay any soft dollars.
CONCLUSIONS
On the basis of the foregoing and without assigning particular weight to any single conclusion, the Independent Trustees determined to recommend the renewal of the Advisory Agreement to the full Board.
50
Table of Contents
SMEAD FUNDS
Notice of Privacy Policies and Practices
We collect non-public personal information about you from the following sources:
| • | information we receive about you on applications or other forms; |
| • | information you give us orally; and |
| • | information about your transactions with us or others. |
We do not disclose any non-public personal information about our shareholders or former shareholders without the shareholder’s authorization, except as permitted by law or in response to inquiries from governmental authorities. We may share information with affiliated parties and unaffiliated third parties with whom we have contracts for servicing the Funds. We will provide unaffiliated third parties with only the information necessary to carry out their assigned responsibility. All shareholder records will be disposed of in accordance with applicable law. We maintain physical, electronic and procedural safeguards to protect your non-public personal information and require third parties to treat your non-public personal information with the same high degree of confidentiality.
In the event that you hold shares of the Funds through a financial intermediary, including, but not limited to, a broker-dealer, bank or trust company, the privacy policy of your financial intermediary would govern how your non-public personal information would be shared with unaffiliated third parties.
51
Table of Contents
SMEAD FUNDS
(Unaudited)
Tax Information
For the year ended November 30, 2022, 100% of dividends paid from net ordinary income qualified for the dividends received deduction available to corporate shareholders of the Smead Value Fund. There were no dividends paid from net ordinary income for Smead International Value Fund.
Statement Regarding Liquidity Risk Management Program
In accordance with Rule 22e-4 under the Investment Company Act of 1940, Smead Funds Trust (the “Trust”) has adopted and implemented a liquidity risk management program (the “Program”). The Program seeks to promote effective liquidity risk management for the Smead Value Fund (the “Value Fund”) and the Smead International Value Fund (“International Fund”) and to protect Fund shareholders from dilution of their interests. The Board of Trustees (the “Board”) of the Trust has appointed Smead Capital Management, Inc., the Fund’s investment adviser, as the program administrator (the “Program Administrator”). The Program Administrator has further delegated administration of the Program to the Liquidity Risk Management Committee. The Program Administrator is required to provide an annual report to the Board regarding the adequacy and effectiveness of the Program and any material changes to the Program.
On November 1, 2022, the Board reviewed the Program Administrator’s annual written report for the period of November 3, 2021 through November 1, 2022 (the “Report”). The Report provided an assessment of each Fund’s liquidity risk: the risk that a Fund could not meet requests to redeem shares issued by the Fund without significant dilution of the remaining investors’ interests in the Fund. The Program assesses liquidity risk under both normal and reasonably foreseeable stressed market conditions. The Program Administrator uses an affiliate of State Street Bank, a third party vendor, to provide portfolio investment classification services, and the Report noted that each Fund primarily held investments that were classified as highly liquid during the review period. The Report noted that each Fund’s portfolio is expected to primarily hold highly liquid investments and each Fund will be considered a “primarily highly liquid fund” (as defined in the Program) and can therefore continue to rely on the exclusion in Rule 22e-4 from the requirements to determine and review a highly liquid investment minimum (“HLIM”) for the Fund and to adopt policies and procedures for responding to a HLIM shortfall. The Report also noted that each Fund did not hold any illiquid investments and the Trust was not required to file Form N-LIQUID during the review period. The Report noted that no material changes had been made to the Program since the Board’s last approval of the Program and no changes were warranted to the Program at such time.
The Program Administrator concluded that each Fund has been able to meet redemption needs in all market conditions during the review period without significant dilution to the Fund’s remaining investors. The Program Administrator determined that the Program is operating effectively.
Indemnifications
Under the Trust’s organizational documents, its officers and trustees are indemnified against certain liabilities arising out of the performance of their duties to the Funds. In
52
Table of Contents
SMEAD FUNDS
Additional Information (Continued)
(Unaudited)
addition, in the normal course of business, the Funds enter into contracts that provide general indemnifications to other parties. The Funds’ maximum exposure under these arrangements is unknown as this would involve future claims that may be made against the Funds that have not yet occurred. However, the Funds have not had prior claims or losses pursuant to these contracts and expects the risk of loss to be remote.
Information about Trustees
The business and affairs of the Trust are managed under the direction of the Board of Trustees. Information pertaining to the Trustees of the Trust is set forth below. The Statement of Additional Information includes additional information about the Trustees and is available, without charge, upon request by calling 877-807-4122. This table is as of November 30, 2022.
| Name and Age |
Position(s) Held with the Trust |
Term of Time Served |
Number of Portfolios in Trust Overseen by Trustee |
Principal |
Other Directorships Held by During Five Years | |||||
| Independent Trustees |
||||||||||
| Gregory A. Demopulos Age: 63 |
Trustee | Indefinite Term (since September 2014). | 2 | Chairman and CEO, Omeros Corp. (biopharmaceutical company) (since 1994). | Director, Onconome, Inc. (2004 to 2017). | |||||
| Peter M. Musser Age: 65 |
Trustee | Indefinite Term (since September 2014). | 2 | Principal, Angeline Properties, LLC (a private investment firm) (since 2014); and Principal and Senior Equity Portfolio Manager with Rainier Investment Management (from 1994 to 2013). | Trustee, Lawrence University (since 2012); Trustee, Berry College (since 2010); and Director, Boys and Girls Clubs of King County (2008 to 2016). | |||||
53
Table of Contents
SMEAD FUNDS
Additional Information (Continued)
(Unaudited)
| Name and Age |
Position(s) Held with the Trust |
Term of Time Served |
Number of Portfolios in Trust Overseen by Trustee |
Principal |
Other Directorships Held by During Five Years | |||||
| Walter F. Walker Age: 67 |
Trustee | Indefinite Term (since September 2014). | 2 | Principal, Hana Road Capital LLC (hedge fund) (since 2007). | Advisory Council, Stone Arch Capital (since 2005); and Independent Director, Atlas Financial Holdings, Inc. (since 2017); and Independent Director, Harbor Custom Development, Inc. (real estate development company) (since 2020). | |||||
| Nancy A. Zevenbergen Age: 63 |
Trustee | Indefinite Term (since September 2014). | 2 | Principal and Chief Investment Officer, Zevenbergen Capital Investments LLC (since 1987). | Director, Seattle Pacific Foundation (since 1993); Director, Anduin Foundation (since 2010); Director, University of Washington Foster School of Business (since 2014); and Director, evenstar3 Inc. (since 2005). | |||||
54
Table of Contents
SMEAD FUNDS
Additional Information (Continued)
(Unaudited)
| Name and Age |
Position(s) Held with the Trust |
Term of Time Served |
Number of Portfolios in Trust Overseen by Trustee |
Principal |
Other Directorships Held by During Five Years | |||||
| Interested Trustees and Officers |
||||||||||
| William W. Smead1 Age: 64 |
Trustee and Chairman | Indefinite Term (since September 2014). | 2 | Chief Investment Officer of the Adviser (since 2007); Chief Executive Officer of the Adviser (2007-2019); and President and Chief Executive Officer of the Trust (from September 2014 to January 2016). |
None. | |||||
| Cole W. Smead1 Age: 38 |
Trustee President and Chief Executive Officer |
Indefinite Term (since September 2014). Elected annually (since January 2016). |
2 | President of the Adviser (since 2020); Managing Director of the Adviser (2007-2019). | Director and Chairman, Smead Funds S.A. (since 2015). | |||||
| Steven J. LeMire Age: 52 |
Chief Compliance Officer Treasurer, Principal Financial and Accounting Officer |
Elected annually (since September 2014). Elected annually (since January 2016). |
N/A | Chief Compliance Officer of the Adviser (since 2014). | N/A | |||||
| Heather Peterson Age: 37 |
Secretary | Elected annually (since August 2020). | N/A | Director - Marketing & Brand Development of the Adviser (since 2022). Vice President - Marketing of the Adviser (2016-2021). |
N/A | |||||
| 1 | Mr. William Smead and Mr. Cole Smead are each deemed to be an “interested person” of the Fund under the 1940 Act because of his position with Smead Capital Management, Inc. Mr. William Smead and Mr. Cole Smead are father and son, respectively. |
55
Table of Contents
A NOTE ON FORWARD LOOKING STATEMENTS (Unaudited)
Except for historical information contained in this report for the Funds, the matters discussed in this report may constitute forward-looking statements made pursuant to the safe-harbor provisions of the Private Securities Litigation Reform Act of 1995. These include any adviser or portfolio manager predictions, assessments, analyses or outlooks for individual securities, industries, market sectors and/or markets. These statements involve risks and uncertainties. In addition to the general risks described for the Funds in the current Prospectus, other factors bearing on this report include the accuracy of the Adviser’s or portfolio managers’ forecasts and predictions, and the appropriateness of the investment programs designed by the adviser or portfolio managers to implement their strategies efficiently and effectively. Any one or more of these factors, as well as other risks affecting the securities markets and investment instruments generally, could cause the actual results of the Funds to differ materially as compared to benchmarks associated with the Funds.
ADDITIONAL INFORMATION (Unaudited)
The Funds have adopted proxy voting policies and procedures that delegate to the Adviser the authority to vote proxies. A description of the Funds’ proxy voting policies and procedures is available without charge, upon request, by calling the Funds toll free at 877-807-4122. A description of these policies and procedures is also included in the Funds’ Statement of Additional Information, which is available on the SEC’s website at http://www.sec.gov.
The Funds’ proxy voting records for the most recent 12-month period ended June 30 are available without charge, upon request, by calling, toll free, 877-807-4122, or by accessing the SEC’s website at http://www.sec.gov.
The Funds file their complete schedules of portfolio holdings with the SEC for the first and third quarters of each fiscal year as an exhibit to its reports on Form N-PORT. Shareholders may view the Funds’ Form N-PORT report on the SEC’s website at www.sec.gov.
HOUSEHOLDING (Unaudited)
In an effort to decrease costs, the Funds intend to reduce the number of duplicate prospectuses and annual and semi-annual reports you receive by sending only one copy of each to those addresses shared by two or more accounts and to shareholders the Funds reasonably believe are from the same family or household. Once implemented, if you would like to discontinue householding for your accounts, please call toll-free at 877-807-4122 to request individual copies of these documents. Once the Funds receive notice to stop householding, the Funds will begin sending individual copies 30 days after receiving your request. This policy does not apply to account statements.
Table of Contents
SMEAD FUNDS
| Investment Adviser |
Smead Capital Management, Inc. 2777 East Camelback Road Suite 375 Phoenix, AZ 85016 | |
| Legal Counsel |
Godfrey & Kahn, S.C. 833 East Michigan Street Suite 1800 Milwaukee, Wisconsin 53202 | |
| Independent Registered Public Accounting Firm |
Cohen & Company, Ltd. 1350 Euclid Avenue Suite 800 Cleveland, Ohio 44115 | |
| Custodian, Fund Accountant and Fund Administrator |
State Street Bank and Trust Company One Lincoln Street Boston, Massachusetts 02111
Northern Trust Corporation(1) 50 South La Salle Street, Chicago, Illinois 60603 | |
| Transfer Agent |
UMB Fund Services, Inc. 235 W Galena Street Milwaukee, WI 53212 | |
| Distributor |
UMB Distribution Services, LLC 235 W Galena Street Milwaukee, WI 53212 | |
| (1) | Effective December 1, 2022 |
This report is intended for shareholders of the Funds and may not be used as sales literature unless preceded or accompanied by a current prospectus.
Table of Contents
| (b) | Not applicable. |
Item 2. Code of Ethics.
| (a) | As of November 30, 2022, the Registrant had adopted a code of ethics, as defined in Item 2(b) of Form N-CSR, that applies to the Registrant’s principal executive officer, principal financial officer, principal accounting officer or controller, or persons performing similar functions (the “Code of Ethics”). |
| (c) | There have been no amendments to the Registrant’s Code of Ethics during the reporting period for this Form N-CSR. |
| (d) | During the period covered by the report, the Registrant did not grant any waivers to the provisions of the Code of Ethics. |
| (e) | Not applicable. |
| (f) | The Code of Ethics is included with this Form N-CSR as Exhibit 13(a)(1). |
Item 3. Audit Committee Financial Expert.
| (a)(1) | The Registrant’s Board of Trustees has determined that there is at least one member who qualifies as an “Audit Committee Financial Expert” serving on its Audit Committee. |
| (a)(2) | Mr. Walter F. Walker and Mr. Peter M. Musser serve as the “Audit Committee Financial Experts” and are considered to be “Independent Trustees” as each term is defined in Item 3 of Form N-CSR. |
Item 4. Principal Accountant Fees and Services.
| Fiscal Year Ended | (a) Audit Fees |
(b) Audit-Related Fees |
(c)1 Tax Fees |
(d) All Other Fees |
||||||||||||
| November 30, 2022 |
||||||||||||||||
| Smead International Value Fund |
$ | 17,500 | $ - | $ | 3,000 | $ - | ||||||||||
| Smead Value Fund |
$ | 17,500 | $ - | $ | 3,000 | $ - | ||||||||||
| November 30, 2021 |
||||||||||||||||
| Smead Value Fund |
$ | 19,500 | $ - | $ | 3,000 | $ - | ||||||||||
| 1 | The Tax Fees are the aggregate fees billed for professional services rendered by Cohen & Company, Ltd. for the review of Form 1120-RIC and Form 8613, and the review of excise tax distribution calculations. |
| (e)(1) | Audit Committee Pre-Approval Policies and Procedures. The Registrant’s Audit Committee pre-approves all audit and non-audit services to be performed by the Registrant’s accountant before the accountant is engaged by the Registrant to perform such services. |
| (e)(2) | The percentage of services described in each of paragraphs (b) through (d) of this Item that were approved by the Audit Committee pursuant to paragraph (c)(7)(i)(C) and (c)(7)(ii) of Rule 2-01 of Regulation S-X are as follows: None. |
3
Table of Contents
| (f) | Not applicable. |
| (g) | There were no non-audit fees billed by Registrant’s accountant for the Registrant’s fiscal years ended November 30, 2022 and November 30, 2021. |
| (h) | Not applicable. |
| (i) | Not applicable. |
| (j) | Not applicable. |
Item 5. Audit Committee of Listed Registrants.
Not applicable.
Item 6. Investments.
| (a) | Included as part of the Report to Shareholders under Item 1 of this Form N-CSR. |
| (b) | Not applicable. |
Item 7. Disclosure of Proxy Voting Policies and Procedures for Closed-End Management Investment Companies.
Not applicable.
Item 8. Portfolio Managers of Closed-End Management Investment Companies.
Not applicable.
Item 9. Purchases of Equity Securities by Closed-End Management Investment Company and Affiliated Purchasers.
Not applicable.
Item 10. Submission of Matters to a Vote of Security Holders.
During the period ended November 30, 2022, there were no material changes to the procedures by which shareholders may recommend nominees to the Registrant’s Board of Trustees.
Item 11. Controls and Procedures.
| (a) | The Registrant’s principal executive and principal financial officers, or persons performing similar functions, have concluded that the Registrant’s disclosure controls and procedures (as defined in Rule 30a-3(c) under the Investment Company Act of 1940 (the “Act”)) are effective, as of a date within 90 days of the filing date of this Form N-CSR, based on the evaluation of these controls and procedures required by the Act and under the Securities Exchange Act of 1934. |
| (b) | There were no changes in the Registrant’s internal control over financial reporting (as defined in Rule 30a-3(d) under the Act) that occurred during the period covered by this report that have materially affected, or are reasonably likely to materially affect, the Registrant’s internal control over financial reporting. |
4
Table of Contents
Item 12. Disclosure of Securities Lending Activities for Closed-End Management Investment Companies.
Not applicable.
Item 13. Exhibits.
| (a)(1) |
| (a)(2) | Certifications of the Registrant pursuant to Rule 30a-2(a) under the Act are filed herewith. |
| (a)(3) | Not applicable. |
| (a)(4) | Not applicable. |
| (b) | Certifications of the Registrant pursuant to Rule 30a-2(b) under the Act are filed herewith. |
5
Table of Contents
SIGNATURES
Pursuant to the requirements of the Securities Exchange Act of 1934 and the Investment Company Act of 1940, the Registrant has duly caused this report to be signed on its behalf by the undersigned, thereunto duly authorized.
| Smead Funds Trust | ||
| By: |
/s/ Cole W. Smead | |
| Cole W. Smead | ||
| President | ||
| (Principal Executive Officer) | ||
Date: January 31, 2023
Pursuant to the requirements of the Securities Exchange Act of 1934 and the Investment Company Act of 1940, this report has been signed below by the following persons on behalf of the Registrant and in the capacities and on the dates indicated.
| By: |
/s/ Cole W. Smead | |
| Cole W. Smead | ||
| President | ||
| (Principal Executive Officer) | ||
Date: January 31, 2023
| By: |
/s/ Steven J. LeMire | |
| Steven J. LeMire | ||
| Treasurer | ||
| (Principal Financial Officer) | ||
Date: January 31, 2023
ATTACHMENTS / EXHIBITS
Serious News for Serious Traders! Try StreetInsider.com Premium Free!
You May Also Be Interested In
- Cafely Releases 2024 Coffee Statistics - Breakdown by Country, Region, and Demographics
- Udemy Named to TIME’s Inaugural List of the World’s Top EdTech Companies in 2024
- Global Architecture & Design Firm, Corgan, Joins the Climate Group
Create E-mail Alert Related Categories
SEC FilingsSign up for StreetInsider Free!
Receive full access to all new and archived articles, unlimited portfolio tracking, e-mail alerts, custom newswires and RSS feeds - and more!
