

Form N-CSR PRUDENTIAL INVESTMENT For: Aug 31
 Tweet
Tweet Share
ShareUNITED STATES
SECURITIES AND EXCHANGE COMMISSION
Washington, D.C. 20549
FORM N-CSR
CERTIFIED SHAREHOLDER REPORT OF REGISTERED MANAGEMENT INVESTMENT
COMPANIES
| Investment Company Act file number: | 811-04930 | |
| Exact name of registrant as specified in charter: | Prudential Investment Portfolios 4 | |
| Address of principal executive offices: | 655 Broad Street, 17th Floor Newark, New Jersey 07102 | |
| Name and address of agent for service: | Andrew R. French 655 Broad Street, 17th Floor Newark, New Jersey 07102 | |
| Registrant’s telephone number, including area code: | 800-225-1852 | |
| Date of fiscal year end: | 8/31/2021 (The Fund changed its fiscal year end from April 30) | |
| Date of reporting period: | 8/31/2021 | |
Item 1 – Reports to Stockholders

PGIM MUNI HIGH INCOME FUND
ANNUAL REPORT
AUGUST 31, 2021

|
To enroll in e-delivery, go to pgim.com/investments/resource/edelivery
|
| 3 | ||||||||
| 4 | ||||||||
| 5 | ||||||||
| 9 | ||||||||
| 11 | ||||||||
| 13 | ||||||||
This report is not authorized for distribution to prospective investors unless preceded or accompanied by a current prospectus.
The views expressed in this report and information about the Fund’s portfolio holdings are for the period covered by this report and are subject to change thereafter.
Mutual funds are distributed by Prudential Investment Management Services LLC (PIMS), member SIPC. PGIM Fixed Income is a unit of PGIM, Inc. (PGIM), a registered investment adviser. PIMS and PGIM are Prudential Financial companies © 2021 Prudential Financial, Inc. and its related entities. PGIM and the PGIM logo are service marks of Prudential Financial, Inc. and its related entities, registered in many jurisdictions worldwide.
2 Visit our website at pgim.com/investments
|
|
Dear Shareholder:
We hope you find the annual report for the PGIM Muni High Income Fund informative and useful. The report covers performance for the period that ended August 31, 2021.
The COVID-19 pandemic had a significant impact on the global economy and markets early in 2020, but a dramatic recovery was underway as the summer began. The Federal Reserve slashed interest rates to encourage borrowing. Congress passed stimulus bills worth several trillion dollars to help consumers and businesses. And several effective COVID-19 vaccines received regulatory approval later in the year. |

At the start of the period, stocks had recovered most of the steep losses they had suffered at the onset of the pandemic. Equities rallied as states reopened their economies but became more volatile in the fall as investors worried that a surge in COVID-19 infections would stall the recovery. However, rising corporate profits and economic growth, the resolution of the US presidential election, and the global rollout of approved vaccines lifted equity markets to record levels, helping stocks around the globe post gains for the full period.
Much of the bond market performed well during the period as investors sought safety in fixed income. Investment-grade bonds in the US declined slightly as the economy recovered, but global bonds and emerging market debt rose. While the 10-year US Treasury yield hovered near record lows early in the period after a significant rally in interest rates, rates moved higher later on as investors began to focus on stronger economic growth and the prospects of higher inflation. The Fed also took several aggressive actions to keep the bond markets running smoothly, restarting many of the relief programs that proved to be successful in helping end the global financial crisis in 2008-09.
Regarding your investments with PGIM, we believe it is important to maintain a diversified portfolio of funds consistent with your tolerance for risk, time horizon, and financial goals. Your financial advisor can help you create a diversified investment plan that may include funds covering all the basic asset classes and that reflects your personal investor profile and risk tolerance. However, diversification and asset allocation strategies do not assure a profit or protect against loss in declining markets.
At PGIM Investments, we consider it a great privilege and responsibility to help investors participate in opportunities across global markets while meeting their toughest investment challenges. PGIM is a top-10 global investment manager with more than $1 trillion in assets under management. This scale and investment expertise allow us to deliver actively managed funds and strategies to meet the needs of investors around the globe.
Thank you for choosing our family of funds.
Sincerely,

Stuart S. Parker, President
PGIM Muni High Income Fund
October 15, 2021
PGIM Muni High Income Fund 3
Your Fund’s Performance (unaudited)
Performance data quoted represent past performance. Past performance does not guarantee future results. The investment return and principal value of an investment will fluctuate so that an investor’s shares, when redeemed, may be worth more or less than their original cost. Current performance may be lower or higher than the past performance data quoted. An investor may obtain performance data as of the most recent month-end by visiting our website at pgiminvestments.com or by calling (800) 225-1852.
Subsequent to April 30, 2021, the Fund’s fiscal and tax year changed from an annual reporting period that ends April 30 to one that ends August 31. As a result of this change, shareholders are being provided with a short-period annual report, including audited financial statements, for the four-month period from May 1, 2021, through August 31, 2021. Please see page 8 for a more detailed look at the prevailing economic and market conditions during the 12-month period that ended August 31, 2021, and to learn how those conditions have affected Fund performance.
| Performance Snapshot as of 8/31/21 | ||
| Price per Share | Total Return for 4 Months Ended 8/31/21* | |
| Class A |
2.11% | |
| Class C |
1.84% | |
| Class Z |
2.19% | |
|
Class R6 |
2.22% | |
* Subsequent to April 30, 2021, the Fund’s fiscal and tax year changed from an annual reporting period that ends April 30 to one that ends August 31.
| Average Annual Total Returns as of 8/31/21 | ||||||||
| One Year (%) | Five Years (%) | Ten Years (%) | Since Inception (%) | |||||
| Class A |
||||||||
| (with sales charges) |
4.46 | 3.47 | 5.20 | — | ||||
| (without sales charges) |
7.97 | 4.16 | 5.55 | — | ||||
| Class C |
||||||||
| (with sales charges) |
6.14 | 3.36 | 4.77 | — | ||||
| (without sales charges) |
7.14 | 3.36 | 4.77 | — | ||||
| Class Z |
||||||||
| (without sales charges) |
8.22 | 4.39 | 5.81 | — | ||||
| Class R6 |
||||||||
| (without sales charges) |
8.31 | N/A | N/A | 5.47 (06/27/2017) | ||||
4 Visit our website at pgim.com/investments
| Average Annual Total Returns as of 8/31/21 | ||||||||
| One Year (%) | Five Years (%) | Ten Years (%) | Since Inception (%) | |||||
| Bloomberg Municipal Bond Index | ||||||||
| 3.40 | 3.30 | 4.05 | — | |||||
| Bloomberg Municipal High Yield Bond Index | ||||||||
| 12.17 | 6.19 | 6.89 | — | |||||
| Bloomberg Municipal Bond Index (50%)/Bloomberg Municipal High Yield Bond Index (50%) | ||||||||
| 7.71 | 4.77 | 5.48 | — | |||||
| Average Annual Total Returns as of 8/31/21 Since Inception (%) | ||
| Class R6 (06/27/2017) | ||
| Bloomberg Municipal Bond Index |
4.15 | |
| Bloomberg Municipal High Yield Bond Index |
7.43 | |
| Bloomberg Municipal Bond Index (50%)/Bloomberg Municipal High Yield Bond Index (50%) |
5.80 | |
Since Inception returns are provided for any share class that has less than 10 fiscal years of returns. Since Inception returns for the Indexes are measured from the closest month-end to the class’ inception date.
Growth of a $10,000 Investment (unaudited)
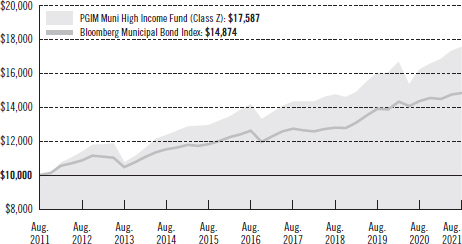
The graph compares a $10,000 investment in the Fund’s Class Z shares with a similar investment in the Bloomberg Municipal Bond Index by portraying the initial account
PGIM Muni High Income Fund 5
Your Fund’s Performance (continued)
values at the beginning of the 10-year period for Class Z shares (August 31, 2011) and the account values at the end of the current fiscal year (August 31, 2021), as measured on a quarterly basis. For purposes of the graph, and unless otherwise indicated, it has been assumed that (a) all recurring fees (including management fees) were deducted and (b) all dividends and distributions were reinvested. The line graph provides information for Class Z shares only. As indicated in the tables provided earlier and in the following paragraphs, performance for other share classes will vary due to the differing fees and expenses applicable to each share class (as indicated in the following paragraphs). Without waiver of fees and/or expense reimbursements, if any, the returns would have been lower.
Past performance does not predict future performance. Total returns and the ending account values in the graph include changes in share price and reinvestment of dividends and capital gains distributions in a hypothetical investment for the periods shown. The Fund’s total returns do not reflect the deduction of income taxes on an individual’s investment. Taxes may reduce your actual investment returns on income or gains paid by the Fund or any gains you may realize if you sell your shares.
The returns in the tables do not reflect the deduction of taxes that a shareholder would pay on Fund distributions or following the redemption of Fund shares. The average annual total returns take into account applicable sales charges, which are described for each share class in the table below.
| Class A | Class C | Class Z | Class R6 | |||||
| Maximum initial sales charge | 3.25% of the public offering price. |
None | None | None | ||||
| Contingent deferred sales charge (CDSC) (as a percentage of the lower of the original purchase price or the net asset value at redemption) | 1.00% on sales of |
1.00% on sales made within 12 months of purchase |
None | None | ||||
| Annual distribution and service (12b-1) fees (shown as a percentage of average daily net assets) | 0.25% | 1.00% | None | None | ||||
Benchmark Definitions
Bloomberg Municipal Bond Index—The Bloomberg Municipal Bond Index is an unmanaged index of long-term investment-grade municipal bonds. It gives a broad look at how long-term investment-grade municipal bonds have performed.
6 Visit our website at pgim.com/investments
Bloomberg Municipal High Yield Bond Index—The Bloomberg Municipal High Yield Bond Index is an unmanaged index of non-rated or Ba1 or below-rated municipal bonds. It gives a broad look at how non-investment-grade municipal bonds have performed.
Bloomberg Municipal Bond Index (50%) / Bloomberg Municipal High Yield Bond Index (50%)—This is a custom blend of the Bloomberg Municipal Bond Index (50%) and the Bloomberg Municipal High Yield Bond Index (50%).
Investors cannot invest directly in an index. The returns for the Indexes would be lower if they included the effects of sales charges, operating expenses of a mutual fund, or taxes that may be paid by an investor.
| Distributions and Yields as of 8/31/21 |
| |||||||||||||||||||||||||||
| Total Distributions Paid for 4 Months**** ($) |
SEC 30-Day Subsidized Yield* (%) |
Taxable Equivalent 30-Day Subsidized Yield*** at Federal Tax Rates of |
SEC 30-Day Unsubsidized Yield** (%) |
Taxable Equivalent 30-Day Unsubsidized Yield*** at Federal Tax Rates of |
||||||||||||||||||||||||
| 37.0 (%) | 40.8 (%) | 37.0 (%) | 40.8 (%) | |||||||||||||||||||||||||
| Class A |
0.11 | 0.85 | 1.35 | 1.44 | 0.83 | 1.32 | 1.40 | |||||||||||||||||||||
| Class C |
0.08 | 0.20 | 0.32 | 0.34 | 0.17 | 0.27 | 0.29 | |||||||||||||||||||||
| Class Z |
0.11 | 1.11 | 1.76 | 1.88 | 1.05 | 1.67 | 1.77 | |||||||||||||||||||||
| Class R6 |
0.12 | 1.21 | 1.92 | 2.04 | 1.14 | 1.81 | 1.93 | |||||||||||||||||||||
*SEC 30-Day Subsidized Yield (%)—A standardized yield calculation created by the Securities and Exchange Commission, it reflects the income earned during a 30-day period, after the deduction of the Fund’s net expenses (net of any expense waivers or reimbursements). The investor experience is represented by the SEC 30-Day Subsidized Yield.
**SEC 30-Day Unsubsidized Yield (%)—A standardized yield calculation created by the Securities and Exchange Commission, it reflects the income earned during a 30-day period, after the deduction of the Fund’s gross expenses. The investor experience is represented by the SEC 30-Day Subsidized Yield.
***Some investors may be subject to the federal alternative minimum tax (AMT) and/or state and local taxes. Taxable equivalent yields reflect federal taxes only. The taxable equivalent yield is the yield an investor would have to earn on a taxable investment in order to equal the yield provided by a tax-exempt municipal bond. The taxable equivalent yields presented in the table use the highest marginal federal individual income tax rate (37.0%) and the highest marginal federal individual income tax rate plus the 3.8% net investment income tax (40.8%).
****The data represents total dividends paid from April 30, 2021 to August 31, 2021.
PGIM Muni High Income Fund 7
Your Fund’s Performance (continued)
| Credit Quality expressed as a percentage of total investments as of 8/31/21 (%) |
||||
| AAA |
2.7 | |||
| AA |
12.5 | |||
| A |
23.7 | |||
| BBB |
27.6 | |||
| BB |
7.3 | |||
| B |
1.4 | |||
| CCC |
1.3 | |||
| NR |
21.3 | |||
| Cash/Cash Equivalents |
2.2 | |||
|
Total |
100.0 | |||
Credit ratings reflect the highest rating assigned by a nationally recognized statistical rating organization (NRSRO) such as Moody’s Investors Service, Inc. (Moody’s), S&P Global Ratings (S&P), or Fitch, Inc. (Fitch). Credit ratings reflect the common nomenclature used by both S&P and Fitch. Where applicable, ratings are converted to the comparable S&P/Fitch rating tier nomenclature. These rating agencies are independent and are widely used. The Not Rated category consists of securities that have not been rated by an NRSRO. Credit ratings are subject to change.
8 Visit our website at pgim.com/investments
Strategy and Performance Overview (unaudited)
How did the Fund perform?
The PGIM Muni High Income Fund’s Class Z shares returned 8.22% in the 12-month reporting period that ended August 31, 2021, outperforming 3.40% return of the Bloomberg Municipal Bond Index (the Index).
What were the market conditions?
| ● | Municipal securities exhibited solid performance during the reporting period, as the fixed income markets stabilized and eventually recovered from the market upheaval in the spring of 2020 that was triggered by the COVID-19 pandemic and related shutdowns. The Federal Reserve (the Fed) and the US Treasury took unprecedented steps to stabilize the markets, including establishing the Municipal Liquidity Facility that facilitated borrowing for issuers experiencing hardship and difficulty accessing the market. Direct federal aid was also provided to state and local governments to help offset lost revenues during the crisis. Mutual fund flows subsequently turned positive and have remained positive since then, with inflows from the beginning of 2021 through the end of the period totaling $83.5 billion, according to Lipper. |
| ● | On the issuance front, supply was manageable during the period, contributing to a favorable supply-demand environment. For the full period, municipal bonds significantly outperformed Treasury bonds across the yield curve. (A yield curve is a line graph that illustrates the relationship between the yields and maturities of fixed income securities. It is created by plotting the yields of different maturities for the same type of bonds.) |
| ● | During the period, the Fed kept the federal funds target rate in a range of 0.00%–0.25%, and it is maintaining a very accommodative policy as the economic recovery continues. Tapering of asset purchases by the Fed is likely to commence by year-end and continue into 2022, but the specific timing and scale will depend on financial conditions. The municipal yield curve flattened during the period, as short-end rates rose while rates declined on the long end. |
What worked?
| ● | The Fund’s longer duration versus the Index added to performance, as yields moved lower during most of the reporting period. (Duration measures the sensitivity of the price—the value of principal—of a bond to a change in interest rates.) |
| ● | The Fund’s overweight relative to the Index in BBB-rated bonds, including Illinois and Chicago general obligation bonds, contributed to performance as spreads tightened during the period. |
| ● | The Fund’s overweight relative to the Index to Puerto Rico Aqueduct and Sewer Authority bonds contributed to performance as spreads tightened. |
What didn’t work?
| ● | The Fund’s overweight relative to the Index in higher-quality healthcare names, including hospitals and lifecare facilities, detracted from performance as they lagged during the reporting period. |
PGIM Muni High Income Fund 9
Strategy and Performance Overview (continued)
| ● | The Fund’s overweight relative to the Index in the pre-pay gas sector detracted from performance, as the spread compression lagged that of the general market’s move in spreads. |
Did the Fund use derivatives?
The Fund sold futures contracts on US Treasuries to shorten the portfolio’s duration, which reduced its sensitivity to changes in the level of rates. Overall, this strategy had a modestly negative impact on performance during the reporting period.
Current outlook
| ● | PGIM Fixed Income expects the strong technical environment will likely weaken a bit early in the reporting period, as net supply is expected to turn positive. However, PGIM Fixed Income expects this to be relatively short lived, believing that technicals likely will improve toward year-end with negative net supply. PGIM Fixed Income would view any spread widening during a softer technical period as an attractive buying opportunity. |
| ● | In general, municipal credit is solidly positioned based on the strong economic rebound that began in the second half of 2020 and the significant amount of federal aid received via various stimulus packages. Near-term focus for the municipal market will be on Congress and the details of a final infrastructure bill. While inclusion of a Build America Bond type of program would be beneficial to issuers over time, PGIM Fixed Income would not anticipate a significant increase in taxable municipal issuance near term given the current health of the tax-exempt market. Municipal market participants will also pay close attention to any progress made toward resurrecting tax-exempt advance refundings for issuers. PGIM Fixed Income would not be surprised if these measures were excluded from a final infrastructure bill. |
| ● | Finally, any increase in personal or corporate income tax rates to fund projects identified in a final infrastructure bill will add to the benefit of owning tax-exempt municipal bonds for a variety of constituents, in PGIM Fixed Income’s view. |
10 Visit our website at pgim.com/investments
As a shareholder of the Fund, you incur two types of costs: (1) transaction costs, including sales charges (loads) on purchase payments and redemptions, as applicable, and (2) ongoing costs, including management fees, distribution and/or service (12b-1) fees, and other Fund expenses, as applicable. This example is intended to help you understand your ongoing costs (in dollars) of investing in the Fund and to compare these costs with the ongoing costs of investing in other mutual funds.
The example is based on an investment of $1,000 held through the six-month period ended August 31, 2021. The example is for illustrative purposes only; you should consult the Prospectus for information on initial and subsequent minimum investment requirements.
Actual Expenses
The first line for each share class in the table on the following page provides information about actual account values and actual expenses. You may use the information on this line, together with the amount you invested, to estimate the expenses that you paid over the period. Simply divide your account value by $1,000 (for example, an $8,600 account value ÷ $1,000 = 8.6), then multiply the result by the number on the first line under the heading “Expenses Paid During the Six-Month Period” to estimate the expenses you paid on your account during this period.
Hypothetical Example for Comparison Purposes
The second line for each share class in the table on the following page provides information about hypothetical account values and hypothetical expenses based on the Fund’s actual expense ratio and an assumed rate of return of 5% per year before expenses, which is not the Fund’s actual return. The hypothetical account values and expenses may not be used to estimate the actual ending account balance or expenses you paid for the period. You may use this information to compare the ongoing costs of investing in the Fund and other funds. To do so, compare this 5% hypothetical example with the 5% hypothetical examples that appear in the shareholder reports of the other funds.
The Fund’s transfer agent may charge additional fees to holders of certain accounts that are not included in the expenses shown in the table on the following page. These fees apply to individual retirement accounts (IRAs) and Section 403(b) accounts. As of the close of the six-month period covered by the table, IRA fees included an annual maintenance fee of $15 per account (subject to a maximum annual maintenance fee of $25 for all accounts held by the same shareholder). Section 403(b) accounts are charged an annual $25 fiduciary maintenance fee. Some of the fees may vary in amount, or may be waived, based on your total account balance or the number of PGIM funds, including the Fund, that you own. You should consider the additional fees that were charged to your Fund account over the six-month period when you estimate the total ongoing expenses paid over the period and the impact of these fees on your ending account value, as these additional expenses are not reflected in the information
PGIM Muni High Income Fund 11
provided in the expense table. Additional fees have the effect of reducing investment returns.
Please note that the expenses shown in the table are meant to highlight your ongoing costs only and do not reflect any transactional costs such as sales charges (loads). Therefore, the second line for each share class in the table is useful in comparing ongoing costs only and will not help you determine the relative total costs of owning different funds. In addition, if these transactional costs were included, your costs would have been higher.
| PGIM Muni High Income Fund | Beginning Account Value March 1, 2021 |
Ending Account Value August 31, 2021 |
Annualized Expense Ratio Based on the Six-Month Period |
Expenses Paid During the Six-Month Period* | ||||||
| Class A |
Actual** | $1,000.00 | $1,041.80 | 0.80% | $2.75 | |||||
| Hypothetical | $1,000.00 | $1,021.17 | 0.80% | $4.08 | ||||||
| Class C |
Actual** | $1,000.00 | $1,037.80 | 1.58% | $5.43 | |||||
| Hypothetical | $1,000.00 | $1,017.24 | 1.58% | $8.03 | ||||||
| Class Z |
Actual** | $1,000.00 | $1,043.10 | 0.57% | $1.96 | |||||
| Hypothetical | $1,000.00 | $1,022.33 | 0.57% | $2.91 | ||||||
| Class R6 |
Actual** | $1,000.00 | $1,043.50 | 0.48% | $1.65 | |||||
| Hypothetical | $1,000.00 | $1,022.79 | 0.48% | $2.45 | ||||||
*Fund expenses (net of fee waivers or subsidies, if any) for each share class are equal to the annualized expense ratio for each share class (provided in the table), multiplied by the average account value over the period, multiplied by the 184 days in the six-month period ended August 31, 2021, and divided by the 365 days in the Fund’s fiscal year ended August 31, 2021 (to reflect the six-month period). Expenses presented in the table include the expenses of any underlying portfolios in which the Fund may invest.
**“Actual” expenses are calculated using 123-day period ended August 31, 2021 due to fiscal year-end change from April 30 to August 31.
12 Visit our website at pgim.com/investments
PGIM Muni High Income Fund
Schedule of Investments
as of August 31, 2021
| Description | Interest Rate |
Maturity Date |
Principal Amount (000)# |
Value | ||||||||
| LONG-TERM INVESTMENTS 100.6% |
||||||||||||
| MUNICIPAL BONDS |
||||||||||||
|
Alabama 0.4% |
||||||||||||
| Jefferson Cnty. Swr. Rev., |
||||||||||||
| Sr. Lien, Warrants, Series A, Rfdg., AGM |
5.000% | 10/01/44 | 500 | $ | 550,635 | |||||||
| Sr. Lien, Warrants, Series A, Rfdg., AGM |
5.250 | 10/01/48 | 500 | 552,225 | ||||||||
| Southeast Energy Auth. Cooperative Dist. Rev., |
||||||||||||
| Proj. No. 2, Series B (Mandatory put date 12/01/31) |
4.000(cc) | 12/01/51 | 2,500 | 3,088,900 | ||||||||
|
|
|
|||||||||||
| 4,191,760 | ||||||||||||
|
|
|
|||||||||||
| Alaska 0.8% |
||||||||||||
| Alaska Indl. Dev. & Export Auth. Rev., |
||||||||||||
| Tanana Chiefs Conference Proj., Series A |
4.000 | 10/01/49 | 4,320 | 4,949,208 | ||||||||
| Northern Tob. Secur. Corp. Rev., |
||||||||||||
| Sr. Series A, Class 1, Rfdg. |
4.000 | 06/01/50 | 2,000 | 2,340,380 | ||||||||
| Sr. Series B-2, Class 2, Rfdg., CABS |
3.163(t) | 06/01/66 | 1,000 | 226,260 | ||||||||
| Valdez Rev., |
||||||||||||
| ExxonMobil Proj., Rfdg., FRDD (Mandatory put date 09/01/21) |
0.010(cc) | 12/01/29 | 1,425 | 1,425,000 | ||||||||
|
|
|
|||||||||||
| 8,940,848 | ||||||||||||
|
|
|
|||||||||||
|
Arizona 4.4% |
||||||||||||
| Arizona Indl. Dev. Auth. Rev., |
||||||||||||
| Basis Schs. Proj., Series A, Rfdg., 144A |
5.375 | 07/01/50 | 1,000 | 1,150,170 | ||||||||
| Cadence Campus Proj., Series A, 144A |
4.000 | 07/15/50 | 1,600 | 1,709,792 | ||||||||
| Macombs Facs. Proj., Series A, Social Bonds |
4.000 | 07/01/61 | 1,000 | 1,132,360 | ||||||||
| Pinecrest Academy-Horizon Inspirada & St. Rose Campus, Series A, 144A |
5.750 | 07/15/48 | 1,500 | 1,696,665 | ||||||||
| Somerset Academy of LV-Aliante & Skye Canyon Campus Proj., Series A, 144A |
4.000 | 12/15/51 | 700 | 755,230 | ||||||||
| Glendale Indl. Dev. Auth. Rev., |
||||||||||||
| Royal Oaks Inspirata Pointe Proj., Series A |
5.000 | 05/15/56 | 1,500 | 1,686,450 | ||||||||
| Maricopa Cnty. Indl. Dev. Auth. Rev., |
||||||||||||
| Honorhealth, Series A |
4.000 | 09/01/51 | 1,250 | 1,461,050 | ||||||||
| Horizon Cmnty. Learning Ctr., Rfdg. |
5.000 | 07/01/35 | 2,000 | 2,244,760 | ||||||||
| Reid Traditional Schs. Projs. |
5.000 | 07/01/47 | 1,000 | 1,143,670 | ||||||||
| Phoenix City Indl. Dev. Auth. Rev., |
||||||||||||
| Basis Schs. Projs., Rfdg., 144A |
5.000 | 07/01/45 | 1,000 | 1,108,760 | ||||||||
| Basis Schs. Projs., Series A, Rfdg., 144A |
5.000 | 07/01/46 | 1,000 | 1,108,090 | ||||||||
| Great Hearts Academies Proj. |
5.000 | 07/01/44 | 2,250 | 2,485,597 | ||||||||
See Notes to Financial Statements.
PGIM Muni High Income Fund 13
PGIM Muni High Income Fund
Schedule of Investments (continued)
as of August 31, 2021
| Description | Interest Rate |
Maturity Date |
Principal Amount (000)# |
Value | ||||||||
| MUNICIPAL BONDS (Continued) |
||||||||||||
| Arizona (cont’d.) |
||||||||||||
| Pima Cnty. Indl. Dev. Auth. Rev., |
||||||||||||
| Tucson Elec. Pwr. Co. Proj., Rfdg. |
4.000% | 09/01/29 | 3,000 | $ | 3,157,500 | |||||||
| Salt Verde Finl. Corp. Rev., |
||||||||||||
| Sr. Gas Rev., Sr. Bonds |
5.000 | 12/01/32 | 4,890 | 6,469,177 | ||||||||
| Sr. Gas Rev., Sr. Bonds |
5.000 | 12/01/37 | 12,300 | 17,311,143 | ||||||||
| Tempe Indl. Dev. Auth. Rev., |
||||||||||||
| Friendship Vlg. |
5.000 | 12/01/50 | 1,045 | 1,126,353 | ||||||||
| Friendship Vlg., Series A, Rfdg. |
6.250 | 12/01/42 | 1,000 | 1,006,280 | ||||||||
|
|
|
|||||||||||
| 46,753,047 | ||||||||||||
|
|
|
|||||||||||
|
California 7.8% |
||||||||||||
| ABAG Fin. Auth. for Nonprofit Corp. Rev., |
||||||||||||
| Episcopal Sr. Cmnty., Rfdg. |
6.125 | 07/01/41 | 775 | 778,588 | ||||||||
| California Cnty. Tob. Secur. Agcy. Rev., |
||||||||||||
| Sr. Series A, Rfdg. |
4.000 | 06/01/49 | 1,000 | 1,179,380 | ||||||||
| Sub. Series B-1, Rfdg. |
5.000 | 06/01/49 | 2,100 | 2,596,797 | ||||||||
| Sub. Series B-2, Rfdg., CABS |
3.176(t) | 06/01/55 | 3,000 | 608,280 | ||||||||
| California Hlth. Facs. Fing. Auth. Rev., |
4.000 | 05/15/51 | 2,500 | 2,876,900 | ||||||||
| California Infrast. & Econ. Dev. Bank Rev., |
||||||||||||
| Sr. Bonds, WFCS Port. Proj., Series A-1, 144A |
5.000 | 01/01/56 | 500 | 583,090 | ||||||||
| California Muni. Fin. Auth. Rev., |
||||||||||||
| ExxonMobil Proj., Rfdg., FRDD (Mandatory put date 09/01/21) |
0.020(cc) | 12/01/29 | 4,200 | 4,200,000 | ||||||||
| Series A, 144A |
5.000 | 12/01/54 | 500 | 570,795 | ||||||||
| Series A, 144A |
5.500 | 06/01/48 | 750 | 837,217 | ||||||||
| Sr. Lien-LINXS APM Proj., AMT |
5.000 | 12/31/43 | 2,000 | 2,430,300 | ||||||||
| California Poll. Ctrl. Fing. Auth. Rev., |
||||||||||||
| Green Bond, Calplant I Proj., AMT, 144A |
8.000 | 07/01/39(d) | 2,750 | 1,849,375 | ||||||||
| California Sch. Fin. Auth. Rev., |
||||||||||||
| Alliance Clg.-Ready Pub. Schs., Series A, 144A |
5.000 | 07/01/45 | 750 | 857,558 | ||||||||
| KIPP LA Proj., Series A, 144A |
5.000 | 07/01/45 | 650 | 743,256 | ||||||||
| KIPP LA Proj., Series A, 144A |
5.000 | 07/01/47 | 820 | 976,817 | ||||||||
| California St. Pub. Wks. Brd. Lease Rev., |
||||||||||||
| Judicial Council Proj., Series D |
5.000 | 12/01/31 | 1,000 | 1,011,890 | ||||||||
| California Statewide Cmntys. Dev. Auth. Rev., |
||||||||||||
| 899 Charleston Proj., Series A, Rfdg., 144A |
5.250 | 11/01/44 | 750 | 796,822 | ||||||||
| CHF Irvine LLC, Rfdg. |
5.000 | 05/15/29 | 1,405 | 1,679,045 | ||||||||
See Notes to Financial Statements.
14
PGIM Muni High Income Fund
Schedule of Investments (continued)
as of August 31, 2021
| Description | Interest Rate |
Maturity Date |
Principal Amount (000)# |
Value | ||||||||
| MUNICIPAL BONDS (Continued) |
||||||||||||
| California (cont’d.) |
||||||||||||
| California Statewide Cmntys. Dev. Auth. Rev., (cont’d.) |
||||||||||||
| CHF Irvine LLC, Rfdg. |
5.000% | 05/15/40 | 1,030 | $ | 1,214,937 | |||||||
| Loma Linda Univ. Med. Ctr., Series A, 144A |
5.250 | 12/01/43 | 4,475 | 5,431,979 | ||||||||
| Loma Linda Univ. Med. Ctr., Series A, 144A |
5.250 | 12/01/56 | 3,500 | 3,992,870 | ||||||||
| Loma Linda Univ. Med. Ctr., Series A, 144A |
5.500 | 12/01/58 | 1,530 | 1,851,836 | ||||||||
| Loma Linda Univ. Med. Ctr., Series A, Rfdg. |
5.250 | 12/01/44 | 2,500 | 2,838,075 | ||||||||
| Golden St. Tob. Secur. Corp., Tob. Settlement Rev., |
||||||||||||
| Asset Bkd., 1st Sub. Series B, Rfdg., CABS |
(5.000)(t) | 06/01/47 | 10,100 | 2,274,318 | ||||||||
| Asset Bkd., Sr., Series A-2, Rfdg., CABS |
5.300(cc) | 06/01/37 | 5,000 | 5,168,700 | ||||||||
| Series A-1, Rfdg. |
5.000 | 06/01/47 | 5,235 | 5,408,802 | ||||||||
| Series A-1, Rfdg. |
5.250 | 06/01/47 | 5,150 | 5,330,301 | ||||||||
| Series A-2, Rfdg. |
5.000 | 06/01/47 | 1,500 | 1,549,725 | ||||||||
| Inland Vlly. Dev. Agcy., |
||||||||||||
| Tax Alloc., Series A, Rfdg. |
5.000 | 09/01/44 | 1,000 | 1,097,950 | ||||||||
| Irvine Unified Sch. Dist., |
||||||||||||
| Spl. Tax, Series A |
4.000 | 09/01/44 | 1,000 | 1,085,340 | ||||||||
| Lincoln Pub. Fing. Auth., |
||||||||||||
| Tax Alloc., Twelve Bridges, Sub. Series B, Rfdg. |
6.000 | 09/02/27 | 936 | 940,296 | ||||||||
| Long Beach Bond Fin. Auth. Nat. Gas Pur. Rev., |
||||||||||||
| Series A |
5.000 | 11/15/35 | 3,800 | 5,309,132 | ||||||||
| Series A |
5.500 | 11/15/37 | 685 | 1,028,144 | ||||||||
| M-S-R Energy Auth. Rev., |
||||||||||||
| Series A |
6.500 | 11/01/39 | 2,060 | 3,389,627 | ||||||||
| Series A |
7.000 | 11/01/34 | 1,650 | 2,586,045 | ||||||||
| Northern California Tob. Secur. Auth. Rev., |
||||||||||||
| Sr. Sacramento Co. Tob. Sec. Corp., Series B-2, Class 2, Rfdg., CABS |
3.178(t) | 06/01/60 | 3,500 | 873,705 | ||||||||
| Riverside Cnty. Pub. Fing. Auth. Rev., |
||||||||||||
| Cap. Facs. Proj. |
5.250 | 11/01/45 | 1,000 | 1,182,450 | ||||||||
| Roseville, |
||||||||||||
| Spl. Tax, Fiddyment Ranch Cmnty. Facs |
4.000 | 09/01/50 | 1,000 | 1,130,750 | ||||||||
| Sacramento, |
||||||||||||
| Spl. Tax |
4.000 | 09/01/46 | 750 | 852,975 | ||||||||
| Spl. Tax |
4.000 | 09/01/50 | 1,000 | 1,132,580 | ||||||||
| San Buenaventura Rev., |
||||||||||||
| Cmnty. Mem. Hlth. Sys. (Pre-refunded date 12/01/21)(ee) |
7.500 | 12/01/41 | 1,000 | 1,018,440 | ||||||||
| Cmnty. Mem. Hlth. Sys. (Pre-refunded date 12/01/21)(ee) |
8.000 | 12/01/26 | 500 | 509,690 | ||||||||
See Notes to Financial Statements.
PGIM Muni High Income Fund 15
PGIM Muni High Income Fund
Schedule of Investments (continued)
as of August 31, 2021
| Description | Interest Rate |
Maturity Date |
Principal Amount (000)# |
Value | ||||||||
| MUNICIPAL BONDS (Continued) |
||||||||||||
| California (cont’d.) |
||||||||||||
| Santa Margarita Wtr. Dist., |
||||||||||||
| Spl. Tax, Cmnty. Facs. Dist. No. 2013-1 |
5.625% | 09/01/36 | 645 | $ | 698,941 | |||||||
| Southern California Tob. Secur. Auth. Rev., |
||||||||||||
| San Diego Co. Tob., Rfdg., CABS |
3.178(t) | 06/01/54 | 3,000 | 594,120 | ||||||||
|
|
|
|||||||||||
| 83,067,838 | ||||||||||||
|
|
|
|||||||||||
|
Colorado 3.5% |
||||||||||||
| City & Cnty. of Denver Arpt. Sys. Rev., |
||||||||||||
| Sub. Sys., Series A, Rfdg., AMT |
4.000 | 12/01/48 | 2,000 | 2,252,860 | ||||||||
| Colorado Edl. & Cultural Facs. Auth. Rev., |
||||||||||||
| Aspen View Academy Proj. |
4.000 | 05/01/61 | 550 | 603,102 | ||||||||
| Impt. Chrt. Sch. Skyview Academy Proj., Rfdg., 144A |
5.375 | 07/01/44 | 1,350 | 1,440,774 | ||||||||
| Impt. Chrt. Sch. Univ. LA, Rfdg. |
5.000 | 12/15/45 | 1,000 | 1,116,670 | ||||||||
| Rfdg. |
5.000 | 11/01/44 | 885 | 970,252 | ||||||||
| Windsor Chrt. Sch., Rfdg. |
5.000 | 09/01/46 | 1,390 | 1,391,529 | ||||||||
| Colorado Hlth. Facs. Auth. Rev., |
||||||||||||
| Adventhealth Oblig. Grp., Series A, Rfdg. |
4.000 | 11/15/50 | 5,000 | 5,987,600 | ||||||||
| Commonspirit Hlth., Series A, Rfdg. |
4.000 | 08/01/49 | 5,140 | 5,869,109 | ||||||||
| Covenant Living Cmntys., Series A, Rfdg. |
4.000 | 12/01/50 | 2,000 | 2,271,360 | ||||||||
| Covenant Retirement Cmntys., Rfdg. |
5.000 | 12/01/35 | 1,250 | 1,438,825 | ||||||||
| Impt. Bonds, Chrisitna Living Neighborhoods, Rfdg.(hh) |
4.000 | 01/01/42 | 1,000 | 1,103,590 | ||||||||
| Vail Vlly. Med. Ctr. Proj. |
4.000 | 01/15/45 | 2,500 | 2,721,650 | ||||||||
| Park Creek Met. Dist. Ltd. Ppty. Tax Alloc. Rev., |
||||||||||||
| Sr. Lmt. Prop. TA., Rfdg. |
5.000 | 12/01/45 | 1,500 | 1,720,455 | ||||||||
| Plaza Co. Met. Dist. No. 1, |
||||||||||||
| Tax Alloc., Rfdg., 144A |
5.000 | 12/01/40 | 1,000 | 1,031,040 | ||||||||
| Pub. Auth. Energy Nat. Gas Pur. Rev., |
||||||||||||
| Nat. Gas Util. Imps. |
6.500 | 11/15/38 | 4,045 | 6,324,236 | ||||||||
| Sterling Ranch Cmnty. Auth. Brd. Rev., |
||||||||||||
| Series A, Rfdg. |
4.250 | 12/01/50 | 1,000 | 1,098,180 | ||||||||
|
|
|
|||||||||||
| 37,341,232 | ||||||||||||
|
|
|
|||||||||||
See Notes to Financial Statements.
16
PGIM Muni High Income Fund
Schedule of Investments (continued)
as of August 31, 2021
| Description | Interest Rate |
Maturity Date |
Principal Amount (000)# |
Value | ||||||||
| MUNICIPAL BONDS (Continued) |
||||||||||||
|
Connecticut 0.3% |
||||||||||||
| Connecticut St. Hlth. & Edl. Facs. Auth. Rev., |
||||||||||||
| Stamford Hosp. Iss. Forward Delivery, Series M, Rfdg.(hh) |
4.000% | 07/01/42 | 1,000 | $ | 1,148,950 | |||||||
| Harbor Point Infrast. Impt. Dist., |
||||||||||||
| Tax Alloc., Harbor Point Proj., Rfdg., 144A |
5.000 | 04/01/39 | 2,000 | 2,360,860 | ||||||||
|
|
|
|||||||||||
| 3,509,810 | ||||||||||||
|
|
|
|||||||||||
|
Delaware 0.2% |
||||||||||||
| Delaware St. Econ. Dev. Auth. Rev., |
||||||||||||
| Newark Chrt. Sch., Inc., Series A, Rfdg. |
5.000 | 09/01/46 | 500 | 583,005 | ||||||||
| Delaware St. Hlth. Facs. Auth. Rev., |
||||||||||||
| Nanticoke Mem. Hosp., Rfdg. (Pre-refunded date 07/01/23)(ee) |
5.000 | 07/01/32 | 1,375 | 1,497,169 | ||||||||
|
|
|
|||||||||||
| 2,080,174 | ||||||||||||
|
|
|
|||||||||||
| District of Columbia 2.0% |
||||||||||||
| Dist. of Columbia Rev., |
||||||||||||
| Dist. of Columbia Intl. Oblig. Grp. |
5.000 | 07/01/54 | 1,000 | 1,182,000 | ||||||||
| Friendship Pub. Chrt. Sch. (Pre-refunded date 12/01/22)(ee) |
5.000 | 06/01/42 | 3,500 | 3,707,760 | ||||||||
| KIPP Chrt. Sch., Rfdg. (Pre-refunded date 07/01/23)(ee) |
6.000 | 07/01/43 | 850 | 939,284 | ||||||||
| KIPP Chrt. Sch., Rfdg. (Pre-refunded date 07/01/23)(ee) |
6.000 | 07/01/48 | 725 | 801,154 | ||||||||
| KIPP DC Iss., Series A, Rfdg. |
5.000 | 07/01/37 | 1,250 | 1,508,550 | ||||||||
| KIPP DC Proj. |
4.000 | 07/01/49 | 1,000 | 1,128,150 | ||||||||
| Rfdg. |
5.000 | 06/01/40 | 1,500 | 1,770,285 | ||||||||
| Rfdg. |
5.000 | 06/01/55 | 1,500 | 1,735,290 | ||||||||
| Rocketship DC Oblig. Grp., Series A, 144A |
5.000 | 06/01/49 | 2,000 | 2,276,580 | ||||||||
| Metropolitan Washington D.C. Arpt. Auth. Sys. Rev., |
||||||||||||
| Dulles Toll Rd., Series A, Rfdg. |
5.000 | 10/01/53 | 2,500 | 2,562,425 | ||||||||
| Dulles Toll Rd., Sub. Series B, Rfdg. |
4.000 | 10/01/49 | 2,000 | 2,298,420 | ||||||||
| Series A, Rfdg., AMT |
4.000 | 10/01/51 | 1,000 | 1,169,100 | ||||||||
|
|
|
|||||||||||
| 21,078,998 | ||||||||||||
|
|
|
|||||||||||
|
Florida 10.0% |
||||||||||||
| Broward Cnty. Arpt. Sys. Rev., |
||||||||||||
| Series A, AMT |
4.000 | 10/01/49 | 3,000 | 3,413,430 | ||||||||
See Notes to Financial Statements.
PGIM Muni High Income Fund 17
PGIM Muni High Income Fund
Schedule of Investments (continued)
as of August 31, 2021
| Description | Interest Rate |
Maturity Date |
Principal Amount (000)# |
Value | ||||||||
| MUNICIPAL BONDS (Continued) |
||||||||||||
| Florida (cont’d.) |
||||||||||||
| Broward Cnty. Arpt. Sys. Rev., (cont’d.) |
||||||||||||
| Series A, AMT (Pre-refunded date 10/01/23)(ee) |
5.250% | 10/01/43 | 1,500 | $ | 1,655,550 | |||||||
| Broward Cnty. Port Facs. Rev., |
||||||||||||
| Sr. Bonds, Series B, AMT |
4.000 | 09/01/49 | 2,000 | 2,282,420 | ||||||||
| Capital Tr. Agcy. Rev., |
||||||||||||
| Air Cargo, Aero Miami FX LLC, Sr. Lien, Series A, Rfdg. |
5.350 | 07/01/29 | 1,515 | 1,521,075 | ||||||||
| Edl. Growth Fund LLC Chrt. Sch. Port Proj., Series A-1, 144A |
5.000 | 07/01/56 | 1,000 | 1,178,850 | ||||||||
| WFCS Port. Proj., Series A-1, 144A |
5.000 | 01/01/56 | 500 | 585,230 | ||||||||
| Wonderful Fndtn. Chrt. Sch. Port., Series A-1, 144A |
5.000 | 01/01/55 | 3,000 | 3,417,480 | ||||||||
| Citizens Ppty. Ins., Inc. Rev., |
||||||||||||
| Sr. Sec’d., Series A-1 |
5.000 | 06/01/22 | 1,000 | 1,035,490 | ||||||||
| Cityplace CDD., |
||||||||||||
| Spl. Assmt., Rfdg. |
5.000 | 05/01/26 | 1,000 | 1,139,260 | ||||||||
| Davie Edl. Facs. Rev., |
||||||||||||
| Nova Southeastern Univ. Proj., Series A (Pre-refunded date 04/01/23)(ee) |
5.625 | 04/01/43 | 500 | 543,205 | ||||||||
| Nova Southeastern Univ. Proj., Series A (Pre-refunded date 04/01/23)(ee) |
6.000 | 04/01/42 | 1,000 | 1,092,330 | ||||||||
| Florida Dev. Fin. Corp. Rev., |
||||||||||||
| Bay Area Chrt. Fndtn., Series A (Pre-refunded date 12/15/21)(ee) |
7.750 | 06/15/42 | 2,000 | 2,043,720 | ||||||||
| Glendridge on Palmer Ranch Proj., Rfdg. |
5.000 | 06/01/51 | 2,000 | 2,304,360 | ||||||||
| Green Bond, Brightline Passenger Rail, Rmkt., Series B, AMT, 144A |
7.375 | 01/01/49 | 2,000 | 2,191,200 | ||||||||
| Mater Academy Proj., Series A, 144A |
5.000 | 06/15/55 | 1,000 | 1,125,460 | ||||||||
| Renaissance Chrt. Sch., Rfdg., 144A |
5.000 | 09/15/50 | 2,000 | 2,205,780 | ||||||||
| River City Science Academy Proj., Series A |
4.000 | 07/01/45 | 565 | 623,737 | ||||||||
| River City Science Academy Proj., Series A |
4.000 | 07/01/55 | 2,460 | 2,697,981 | ||||||||
| Virgin Trains USA Pass, Series A, Rfdg., AMT |
||||||||||||
| (Mandatory put date 01/01/29), 144A |
6.500(cc) | 01/01/49 | 4,210 | 4,352,382 | ||||||||
| Wst. Pro USA, Inc. Proj., AMT |
3.000 | 06/01/32 | 2,500 | 2,628,000 | ||||||||
| Florida Higher Edl. Facs. Finl. Auth. Rev., |
||||||||||||
| Ringling Clg. Proj. |
5.000 | 03/01/42 | 4,795 | 5,536,115 | ||||||||
| Greater Orlando Aviation Auth. Rev., |
||||||||||||
| Priority Sub. Series A, AMT |
4.000 | 10/01/52 | 3,350 | 3,702,688 | ||||||||
| Priority Sub. Series A, AMT |
5.000 | 10/01/52 | 2,000 | 2,379,360 | ||||||||
| Spl. Purp., JetBlue Airways Corp. Proj., Rfdg. |
5.000 | 11/15/36 | 4,700 | 5,050,009 | ||||||||
| Hillsborough Cnty. Indl. Dev. Auth. Rev., |
||||||||||||
| Tampa Gen. Hosp. Proj., Series A |
4.000 | 08/01/50 | 2,500 | 2,899,975 | ||||||||
See Notes to Financial Statements.
18
PGIM Muni High Income Fund
Schedule of Investments (continued)
as of August 31, 2021
| Description | Interest Rate |
Maturity Date |
Principal Amount (000)# |
Value | ||||||||
| MUNICIPAL BONDS (Continued) |
||||||||||||
| Florida (cont’d.) |
||||||||||||
| Indigo Cmnty. Dev. Dist., |
||||||||||||
| Spl. Assmt.^ |
5.750% | 05/01/36(d) | 820 | $ | 483,800 | |||||||
| Jacksonville Rev., |
||||||||||||
| Brooks Rehabitation Proj., Rfdg. |
4.000 | 11/01/45 | 1,000 | 1,141,360 | ||||||||
| Lakewood Ranch Stewardship Dist., |
||||||||||||
| Spl. Assmt., Lakewood Centre North Proj. |
4.875 | 05/01/45 | 1,000 | 1,062,560 | ||||||||
| Spl. Assmt., Lakewood Nat’l. & Polo Run Projs. |
4.625 | 05/01/27 | 500 | 544,215 | ||||||||
| Spl. Assmt., Lakewood Nat’l. & Polo Run Projs. |
5.375 | 05/01/47 | 1,000 | 1,117,900 | ||||||||
| Spl. Assmt., N E Sector Proj., Phase 1B |
5.450 | 05/01/48 | 1,000 | 1,158,790 | ||||||||
| Spl. Assmt., N E Sector Proj., Phase 2B, Rfdg., 144A |
4.000 | 05/01/50 | 750 | 798,667 | ||||||||
| Spl. Assmt., Stewardship Dist., Azario Proj. |
4.000 | 05/01/50 | 1,000 | 1,064,890 | ||||||||
| Spl. Assmt., Vlg. Lakewood Ranch S. Proj. |
4.250 | 05/01/26 | 250 | 264,443 | ||||||||
| Spl. Assmt., Vlg. Lakewood Ranch S. Proj. |
5.125 | 05/01/46 | 1,300 | 1,414,972 | ||||||||
| Miami Beach Hlth. Facs. Auth. Rev., |
||||||||||||
| Mt. Sinai Med. Ctr. of Florida, Series B(hh) |
4.000 | 11/15/51 | 2,000 | 2,327,560 | ||||||||
| Miami-Dade Cnty. Seaport Dept. Rev., |
||||||||||||
| Sub. Series B-1, Rfdg., AMT(hh) |
4.000 | 10/01/50 | 2,505 | 2,899,613 | ||||||||
| Midtown Miami Cmnty. Dev. Dist., |
||||||||||||
| Spl. Assmt., Pkg. Garage Proj., Series A, Rfdg. |
5.000 | 05/01/37 | 1,980 | 2,061,437 | ||||||||
| North Sumter Cnty. Util. Dependent Dist. Rev., |
||||||||||||
| Solid Wste. |
5.000 | 10/01/42 | 2,000 | 2,092,220 | ||||||||
| Orange Cnty. Hlth. Facs. Auth. Rev., |
||||||||||||
| Orlando Hlth. Oblig. Grp., Series A |
4.000 | 10/01/49 | 3,450 | 3,959,117 | ||||||||
| Osceola Cnty. Trans. Rev., |
||||||||||||
| Series A-1, Rfdg. |
4.000 | 10/01/54 | 1,500 | 1,707,435 | ||||||||
| Series A-2, Rfdg., CABS |
2.682(t) | 10/01/54 | 1,000 | 325,570 | ||||||||
| Palm Beach Cnty. Hlth. Facs. Auth. Rev., |
||||||||||||
| BRRH Corp. Oblig. Grp., Rfdg. (Pre-refunded date 12/01/24)(ee) |
5.000 | 12/01/31 | 500 | 576,485 | ||||||||
| Sinai Residences Boca Raton Proj., Series A, Rfdg. |
7.500 | 06/01/49 | 1,000 | 1,061,800 | ||||||||
| Sarasota Cnty. Pub. Hosp. Dist. Rev., |
||||||||||||
| Sarasota Mem. Hosp. |
4.000 | 07/01/48 | 5,000 | 5,692,550 | ||||||||
| South Miami Hlth. Facs. Auth., Inc. Rev., |
||||||||||||
| Baptist Hlth. South Florida, Rfdg. |
5.000 | 08/15/47 | 1,000 | 1,226,230 | ||||||||
| St. Johns Cnty. Indl. Dev. Auth. Rev., |
||||||||||||
| Vicar’s Landing Proj., Series A, Rfdg. |
4.000 | 12/15/46 | 1,500 | 1,649,655 | ||||||||
| Tallahassee Hlth. Facs. Mem. Rev., |
||||||||||||
| Tallahassee Mem. Hlth., Inc., Series A |
5.000 | 12/01/55 | 1,430 | 1,645,258 | ||||||||
| Vlg. CDD No. 07, |
||||||||||||
| Spl. Assmt., Fla., Rfdg. |
4.000 | 05/01/36 | 1,790 | 1,978,773 | ||||||||
See Notes to Financial Statements.
PGIM Muni High Income Fund 19
PGIM Muni High Income Fund
Schedule of Investments (continued)
as of August 31, 2021
| Description | Interest Rate |
Maturity Date |
Principal Amount (000)# |
Value | ||||||||
| MUNICIPAL BONDS (Continued) |
||||||||||||
| Florida (cont’d.) |
||||||||||||
| Vlg. CDD No. 09, |
||||||||||||
| Spl. Assmt., Fla., Rfdg. |
5.500% | 05/01/42 | 1,915 | $ | 1,943,208 | |||||||
| Vlg. CDD No. 10, |
||||||||||||
| Spl. Assmt., Fla. |
5.125 | 05/01/43 | 970 | 1,001,768 | ||||||||
| Spl. Assmt., Fla. |
6.000 | 05/01/44 | 700 | 742,161 | ||||||||
| Vlg. CDD No. 11, |
||||||||||||
| Spl. Assmt., Fla. |
4.500 | 05/01/45 | 1,310 | 1,382,784 | ||||||||
| Vlg. CDD No. 12, |
||||||||||||
| Spl. Assmt., Fla., 144A |
4.250 | 05/01/43 | 2,765 | 2,972,762 | ||||||||
| Vlg. CDD No. 13, |
||||||||||||
| Spl. Assmt., Fla. |
3.550 | 05/01/39 | 495 | 526,631 | ||||||||
| Spl. Assmt., Fla. |
3.700 | 05/01/50 | 995 | 1,052,819 | ||||||||
| Spl. Assmt., Fla., 144A |
3.500 | 05/01/51 | 1,210 | 1,252,967 | ||||||||
|
|
|
|||||||||||
| 106,735,487 | ||||||||||||
|
|
|
|||||||||||
| Georgia 0.7% |
||||||||||||
| Burke Cnty. Dev. Auth. Rev., |
||||||||||||
| Oglethorpe Pwr. Corp.-Vogtle Proj., Series D, Rfdg. |
4.125 | 11/01/45 | 2,000 | 2,230,940 | ||||||||
| George L Smith II Congress Ctr. Auth. Rev., |
||||||||||||
| Convention Ctr. Hotel, 1st Tier, Series A |
4.000 | 01/01/54 | 500 | 569,740 | ||||||||
| Convention Ctr. Hotel, 2nd Tier, Series B, 144A |
5.000 | 01/01/54 | 500 | 589,515 | ||||||||
| Muni. Elec. Auth. of Georgia Rev., |
||||||||||||
| Plant Vogtle Units 3&4 Proj., Series A, Rfdg. |
4.000 | 01/01/51 | 500 | 570,260 | ||||||||
| Priv. Clgs. & Univs. Auth. Rev., |
||||||||||||
| Mercer Univ. Proj., Rfdg. |
4.000 | 10/01/50 | 500 | 589,770 | ||||||||
| Savannah Clg. of Art & Design Proj. |
5.000 | 04/01/44 | 1,500 | 1,657,470 | ||||||||
| Rockdale Cnty. Dev. Auth. Rev., |
||||||||||||
| Pratt Paper LLC Proj., Rfdg., AMT, 144A |
4.000 | 01/01/38 | 1,000 | 1,113,690 | ||||||||
|
|
|
|||||||||||
| 7,321,385 | ||||||||||||
|
|
|
|||||||||||
| Guam 0.1% |
||||||||||||
| Guam Govt. Wtrwks. Auth. Rev., |
||||||||||||
| Series A |
5.000 | 01/01/50 | 1,000 | 1,222,190 | ||||||||
|
|
|
|||||||||||
| Hawaii 0.3% |
||||||||||||
| Hawaii St. Dept. Budget & Fin. Rev., |
||||||||||||
| Pac. Hlth. Oblig., Series A, Rfdg. |
5.500 | 07/01/43 | 2,500 | 2,744,725 | ||||||||
|
|
|
|||||||||||
See Notes to Financial Statements.
20
PGIM Muni High Income Fund
Schedule of Investments (continued)
as of August 31, 2021
| Description | Interest Rate |
Maturity Date |
Principal Amount (000)# |
Value | ||||||||
| MUNICIPAL BONDS (Continued) |
||||||||||||
| Illinois 13.5% |
||||||||||||
| Chicago Brd. of Ed., |
||||||||||||
| Series A, GO |
5.000% | 12/01/41 | 1,000 | $ | 1,265,850 | |||||||
| Series A, GO |
5.500 | 12/01/39 | 635 | 642,099 | ||||||||
| Series A, GO, 144A |
7.000 | 12/01/46 | 1,500 | 1,960,965 | ||||||||
| Series A, GO, Rfdg. |
4.000 | 12/01/27 | 500 | 586,940 | ||||||||
| Series A, GO, Rfdg. |
5.000 | 12/01/35 | 500 | 618,980 | ||||||||
| Series A, GO, Rfdg. |
7.000 | 12/01/44 | 3,390 | 4,139,122 | ||||||||
| Series C, GO |
5.250 | 12/01/35 | 1,015 | 1,138,018 | ||||||||
| Series D, GO |
5.000 | 12/01/46 | 2,470 | 2,994,949 | ||||||||
| Series G, GO, Rfdg. |
5.000 | 12/01/34 | 2,155 | 2,618,864 | ||||||||
| Series H, GO |
5.000 | 12/01/46 | 2,390 | 2,833,584 | ||||||||
| Chicago Brd. of Ed. Rev., |
||||||||||||
| Spl. Tax |
6.000 | 04/01/46 | 1,500 | 1,867,050 | ||||||||
| Chicago O’Hare Int’l. Arpt. Rev., |
||||||||||||
| Gen., Sr. Lien, Series B, Rfdg., AGM |
4.000 | 01/01/53 | 3,005 | 3,414,581 | ||||||||
| Gen., Sr. Lien, Series C, Rfdg., AMT |
5.375 | 01/01/39 | 1,500 | 1,596,510 | ||||||||
| Series C, Rfdg., AMT |
4.375 | 01/01/40 | 2,000 | 2,226,460 | ||||||||
| Trips Oblig. Grp., AMT |
5.000 | 07/01/48 | 1,000 | 1,195,500 | ||||||||
| Chicago Trans. Auth. Rev., |
5.000 | 12/01/46 | 5,000 | 5,915,650 | ||||||||
| Series A, Rfdg. |
4.000 | 12/01/50 | 1,000 | 1,136,360 | ||||||||
| Chicago Wstewtr. Transmn. Rev., |
5.000 | 01/01/39 | 3,355 | 3,807,757 | ||||||||
| Chicago, IL, |
||||||||||||
| Rmkt., Series 2003 B, GO, Rfdg. |
5.000 | 01/01/23 | 750 | 795,158 | ||||||||
| Rmkt., Series 2005 D, GO, Rfdg. |
5.500 | 01/01/37 | 6,520 | 7,478,309 | ||||||||
| Rmkt., Series 2007 E, GO, Rfdg. |
5.500 | 01/01/35 | 3,000 | 3,445,560 | ||||||||
| Series A, GO |
5.500 | 01/01/39 | 1,865 | 2,136,954 | ||||||||
| Series A, GO, Rfdg. |
5.000 | 01/01/27 | 1,525 | 1,840,675 | ||||||||
| Series A, GO, Rfdg. |
5.000 | 01/01/31 | 1,500 | 1,919,685 | ||||||||
| Series A, GO, Rfdg. |
5.000 | 01/01/34 | 3,650 | 4,004,086 | ||||||||
| Series A, GO, Rfdg. |
5.500 | 01/01/49 | 3,000 | 3,741,150 | ||||||||
| Series A, GO, Rfdg. |
6.000 | 01/01/38 | 2,500 | 3,127,775 | ||||||||
| Series C, GO, Rfdg. |
5.000 | 01/01/26 | 1,000 | 1,176,180 | ||||||||
| Series C, GO, Rfdg. |
5.000 | 01/01/38 | 2,500 | 2,877,425 | ||||||||
| Illinois Edl. Facs. Auth. Rev., |
||||||||||||
| Field Museum of Natural History, Rmkt. |
4.450 | 11/01/36 | 1,075 | 1,258,825 | ||||||||
| Illinois Fin. Auth. Rev., |
||||||||||||
| Impt. Chicago Intl., Rfdg. |
5.000 | 12/01/47 | 1,000 | 1,133,500 | ||||||||
| Northshore Univ. Hlth. Sys., Series A, Rfdg. |
4.000 | 08/15/41 | 1,000 | 1,195,000 | ||||||||
See Notes to Financial Statements.
PGIM Muni High Income Fund 21
PGIM Muni High Income Fund
Schedule of Investments (continued)
as of August 31, 2021
| Description | Interest Rate |
Maturity Date |
Principal Amount (000)# |
Value | ||||||||
| MUNICIPAL BONDS (Continued) |
||||||||||||
| Illinois (cont’d.) |
||||||||||||
| Illinois Fin. Auth. Rev., (cont’d.) |
||||||||||||
| Plymouth Place, Inc., Rfdg. |
5.000% | 05/15/51 | 1,835 | $ | 2,131,114 | |||||||
| Presence Hlth. Netw., Series C, Rfdg. (Pre-refunded date 02/15/27)(ee) |
4.000 | 02/15/41 | 10 | 11,938 | ||||||||
| Presence Hlth. Netw., Series C, Rfdg. (Pre-refunded date 02/15/27)(ee) |
4.000 | 02/15/41 | 265 | 316,344 | ||||||||
| Presence Hlth. Netw., Series C, Unrefunded, Rfdg. |
4.000 | 02/15/41 | 5,725 | 6,540,813 | ||||||||
| Social Bonds, Learn Chrt. Sch. Proj., Rfdg. |
4.000 | 11/01/51 | 350 | 403,221 | ||||||||
| The Carle Fndtn., Series A, Rfdg. |
3.000 | 08/15/48 | 3,580 | 3,831,602 | ||||||||
| The Carle Fndtn., Series A, Rfdg. |
4.000 | 08/15/48 | 1,400 | 1,665,174 | ||||||||
| Illinois St., |
||||||||||||
| GO |
4.000 | 06/01/36 | 3,000 | 3,318,420 | ||||||||
| GO |
5.000 | 04/01/31 | 2,000 | 2,204,240 | ||||||||
| GO |
5.000 | 01/01/32 | 1,335 | 1,562,471 | ||||||||
| GO |
5.000 | 05/01/33 | 950 | 1,047,461 | ||||||||
| GO |
5.000 | 03/01/36 | 1,800 | 1,836,936 | ||||||||
| GO |
5.000 | 05/01/36 | 2,000 | 2,201,860 | ||||||||
| GO |
5.000 | 02/01/39 | 2,215 | 2,413,951 | ||||||||
| GO |
5.000 | 05/01/39 | 2,000 | 2,196,320 | ||||||||
| GO |
5.250 | 07/01/31 | 1,000 | 1,076,960 | ||||||||
| GO |
5.500 | 05/01/30 | 1,500 | 2,006,595 | ||||||||
| GO |
5.500 | 05/01/39 | 2,500 | 3,219,575 | ||||||||
| GO, Rfdg. |
5.000 | 08/01/25 | 1,000 | 1,042,610 | ||||||||
| Rebuild Illinois Prog., Series B, GO |
4.000 | 11/01/35 | 2,000 | 2,321,880 | ||||||||
| Series A, GO |
5.000 | 01/01/33 | 2,000 | 2,027,960 | ||||||||
| Series A, GO |
5.000 | 01/01/34 | 1,600 | 1,622,256 | ||||||||
| Series A, GO |
5.000 | 12/01/39 | 2,500 | 2,985,475 | ||||||||
| Series A, GO, Rfdg. |
5.000 | 10/01/28 | 1,250 | 1,567,600 | ||||||||
| Series C, GO |
5.000 | 11/01/29 | 2,800 | 3,400,768 | ||||||||
| Series D, GO |
5.000 | 11/01/26 | 1,500 | 1,812,270 | ||||||||
| Series D, GO |
5.000 | 11/01/27 | 950 | 1,167,712 | ||||||||
| Metropolitan Pier & Exposition Auth. Dedicated St. Tax Rev., |
||||||||||||
| Mccormick Place Expansion Proj., Series A, Rfdg.(hh) |
4.000 | 06/15/52 | 1,000 | 1,124,240 | ||||||||
| Regl. Trans. Auth. Rev., |
||||||||||||
| Series A |
4.000 | 06/01/38 | 4,015 | 4,495,676 | ||||||||
| Series A |
4.000 | 06/01/39 | 3,015 | 3,369,051 | ||||||||
See Notes to Financial Statements.
22
PGIM Muni High Income Fund
Schedule of Investments (continued)
as of August 31, 2021
| Description | Interest Rate |
Maturity Date |
Principal Amount (000)# |
Value | ||||||||
| MUNICIPAL BONDS (Continued) |
||||||||||||
| Illinois (cont’d.) |
||||||||||||
| Sales Tax Secur. Corp. Rev., |
4.000% | 01/01/38 | 1,000 | $ | 1,182,220 | |||||||
| Springfield Elec. Rev., |
||||||||||||
| Sr. Lien, Rfdg., AGM |
4.000 | 03/01/40 | 1,500 | 1,643,115 | ||||||||
|
|
|
|||||||||||
| 143,837,349 | ||||||||||||
|
|
|
|||||||||||
| Indiana 0.3% |
||||||||||||
| Valparaiso Rev., |
||||||||||||
| Pratt Paper LLC Proj., AMT |
5.875 | 01/01/24 | 500 | 528,290 | ||||||||
| Pratt Paper LLC Proj., AMT |
7.000 | 01/01/44 | 1,500 | 1,649,475 | ||||||||
| Vigo Cnty. Hosp. Auth. Rev., |
||||||||||||
| Union Hosp., Inc., Rfdg. (Pre-refunded date 09/01/21)(ee) |
7.750 | 09/01/31 | 1,500 | 1,500,000 | ||||||||
|
|
|
|||||||||||
| 3,677,765 | ||||||||||||
|
|
|
|||||||||||
| Iowa 0.3% |
||||||||||||
| Iowa St. Fin. Auth. Rev., |
||||||||||||
| Lifespace Cmntys., Inc. |
2.875 | 05/15/49 | 705 | 705,169 | ||||||||
| Midwstrn. Disaster Area, Iowa Fertilizer Co. Proj., Rfdg. |
3.125 | 12/01/22 | 250 | 255,258 | ||||||||
| Iowa Tob. Settlement Auth. Rev., |
||||||||||||
| Sr. Series A-2, Class 1, Rfdg. |
4.000 | 06/01/49 | 1,000 | 1,165,900 | ||||||||
| Sr. Series B-1, Class 2, Rfdg. |
4.000 | 06/01/49 | 1,000 | 1,157,370 | ||||||||
| Sr. Series B-2, Class 2, Rfdg., CABS |
3.278(t) | 06/01/65 | 1,000 | 186,300 | ||||||||
|
|
|
|||||||||||
| 3,469,997 | ||||||||||||
|
|
|
|||||||||||
| Kansas 0.1% |
||||||||||||
| Wyandotte Cnty.-Kansas City Unified Govt. Rev., |
||||||||||||
| Legends Apts. Garage & West Lawn Proj. |
4.500 | 06/01/40 | 880 | 902,449 | ||||||||
|
|
|
|||||||||||
| Kentucky 0.4% |
||||||||||||
| Kentucky Econ. Dev. Fin. Auth. Hosp. Facs. Rev., |
||||||||||||
| Baptist Healthcare Sys., Series B |
5.000 | 08/15/46 | 3,500 | 4,216,835 | ||||||||
|
|
|
|||||||||||
See Notes to Financial Statements.
PGIM Muni High Income Fund 23
PGIM Muni High Income Fund
Schedule of Investments (continued)
as of August 31, 2021
| Description | Interest Rate |
Maturity Date |
Principal Amount (000)# |
Value | ||||||||
| MUNICIPAL BONDS (Continued) |
||||||||||||
| Louisiana 0.6% |
||||||||||||
| Jefferson Parish Econ. Dev. & Port Dist. Rev., |
||||||||||||
| Kenner Discovery Hlth. Sciences Academy Proj., Series A, 144A |
5.625% | 06/15/48 | 2,000 | $ | 2,257,120 | |||||||
| Louisiana Pub. Facs. Auth. Rev., |
||||||||||||
| Ochsner Clinic Fndtn. Proj., Rfdg. |
5.000 | 05/15/47 | 1,000 | 1,144,500 | ||||||||
| New Orleans Sewerage Serv. Rev., |
||||||||||||
| Rfdg. (Pre-refunded date 06/01/24)(ee) |
5.000 | 06/01/44 | 1,000 | 1,131,080 | ||||||||
| Parish of St. James Rev., |
||||||||||||
| Nustar Logistics LP Proj., Rmkt., Series 2010, 144A |
6.350 | 07/01/40 | 1,000 | 1,334,000 | ||||||||
|
|
|
|||||||||||
| 5,866,700 | ||||||||||||
|
|
|
|||||||||||
| Maryland 0.4% |
||||||||||||
| Frederick Cnty., |
||||||||||||
| Spl. Oblig. Tax, Sub. Series C |
4.000 | 07/01/50 | 1,000 | 1,127,690 | ||||||||
| Howard Cnty., |
||||||||||||
| Tax Alloc., Annapolis Junction Twn. Ctr. Proj. |
6.100 | 02/15/44 | 1,420 | 1,503,453 | ||||||||
| Maryland Econ. Dev. Corp. Poll. Ctrl. Rev., |
||||||||||||
| Transn. Facs. Proj., Series A, Rfdg. |
5.000 | 06/01/35 | 1,000 | 1,214,260 | ||||||||
|
|
|
|||||||||||
| 3,845,403 | ||||||||||||
|
|
|
|||||||||||
| Michigan 0.8% |
||||||||||||
| Kentwood Econ. Dev. Corp. Rev., |
||||||||||||
| Holland Home Oblig. Grp., Series 2022, Rfdg.(hh) |
4.000 | 11/15/43 | 1,000 | 1,077,750 | ||||||||
| Michigan Fin. Auth. Rev., |
||||||||||||
| Great Lakes Wtr. Auth., Sr. Lien, Series C-1, Rfdg. |
||||||||||||
| (Pre-refunded date 07/01/22)(ee) |
5.000 | 07/01/44 | 1,000 | 1,040,770 | ||||||||
| Sr. Series A, Class 1, Rfdg. |
4.000 | 06/01/49 | 2,000 | 2,317,920 | ||||||||
| Sr. Series B-1, Class 2, Rfdg. |
5.000 | 06/01/49 | 500 | 603,265 | ||||||||
| Sr. Series B-2, Class 2, Rfdg., CABS |
3.429(t) | 06/01/65 | 2,000 | 268,420 | ||||||||
| Michigan St. Bldg. Auth. Rev., |
||||||||||||
| Facs. Prog., Series I-A, Rfdg. (Pre-refunded date 10/15/21)(ee) |
5.375 | 10/15/41 | 750 | 754,748 | ||||||||
| Summit Academy Rev., |
||||||||||||
| Rfdg. |
6.250 | 11/01/25 | 1,185 | 1,188,780 | ||||||||
| Wayne Cnty. Arpt. Auth. Rev., |
||||||||||||
| Det. Met. Arpt., Series D, Rfdg., AMT |
5.000 | 12/01/28 | 1,500 | 1,588,665 | ||||||||
|
|
|
|||||||||||
| 8,840,318 | ||||||||||||
|
|
|
|||||||||||
See Notes to Financial Statements.
24
PGIM Muni High Income Fund
Schedule of Investments (continued)
as of August 31, 2021
| Description | Interest Rate |
Maturity Date |
Principal Amount (000)# |
Value | ||||||||
| MUNICIPAL BONDS (Continued) |
||||||||||||
| Minnesota 0.8% |
||||||||||||
| Hugo Rev., |
||||||||||||
| Chrt. Sch. Lease, Noble Academy Proj., Series A |
5.000% | 07/01/44 | 1,250 | $ | 1,327,100 | |||||||
| Rochester Rev., |
||||||||||||
| Mayo. Clnc. |
4.000 | 11/15/48 | 3,000 | 3,415,860 | ||||||||
| St. Cloud Rev., |
||||||||||||
| Centracare Hlth., Series A, Rfdg. |
4.000 | 05/01/37 | 1,250 | 1,407,062 | ||||||||
| St. Paul Hsg. & Redev. Auth. Hosp. Rev., |
||||||||||||
| Hlth. East Care Sys. Proj., Rfdg. (Pre-refunded date 11/15/25)(ee) |
5.000 | 11/15/44 | 1,000 | 1,191,660 | ||||||||
| St. Paul Port Auth. Sol. Wste. Disp. Rev., |
||||||||||||
| Gerdau St. Paul Steel Mill Proj., Series 7, 144A |
4.500 | 10/01/37 | 1,000 | 1,033,430 | ||||||||
|
|
|
|||||||||||
| 8,375,112 | ||||||||||||
|
|
|
|||||||||||
| Mississippi 0.3% |
||||||||||||
| Mississippi Bus. Fin. Corp. Rev., |
||||||||||||
| Chevron USA, Inc., Series F, FRDD (Mandatory put date 09/01/21) |
0.010(cc) | 11/01/35 | 850 | 850,000 | ||||||||
| Sys. Energy Resources, Inc. Proj., Rfdg. |
2.375 | 06/01/44 | 2,000 | 2,018,780 | ||||||||
|
|
|
|||||||||||
| 2,868,780 | ||||||||||||
|
|
|
|||||||||||
| Missouri 2.0% |
||||||||||||
| Kansas City Indl. Dev. Auth. Rev. , |
||||||||||||
| Kansas City Intl. Arpt., Series A, AMT |
4.000 | 03/01/45 | 2,500 | 2,872,700 | ||||||||
| Lees Summit, |
||||||||||||
| Tax Alloc., Impt. Summit Fair Proj., Rfdg., 144A |
4.875 | 11/01/37 | 2,000 | 2,058,820 | ||||||||
| Missouri St. Hlth. & Edl. Facs. Auth. Rev., |
||||||||||||
| BJC Hlth. Sys., Series A |
4.000 | 01/01/45 | 2,010 | 2,200,669 | ||||||||
| Lutheran Sr. Svcs., Rfdg. |
4.000 | 02/01/42 | 1,115 | 1,262,648 | ||||||||
| Lutheran Sr. Svcs., Rfdg. |
4.000 | 02/01/48 | 2,000 | 2,238,220 | ||||||||
| Lutheran Sr. Svcs., Rfdg. |
5.000 | 02/01/44 | 4,000 | 4,374,440 | ||||||||
| Poplar Bluff Regl. Trans. Dev. Dist. Rev., |
||||||||||||
| Transn. Sales Tax |
4.750 | 12/01/42 | 2,100 | 2,208,003 | ||||||||
| St. Louis Cnty. Indl. Dev. Auth. Rev., |
||||||||||||
| Friendship Vlg. St. Louis Oblig. Grp., Series A |
5.250 | 09/01/53 | 2,000 | 2,237,520 | ||||||||
| Friendship Vlg. Sunset Hills, Series A |
5.875 | 09/01/43 | 1,000 | 1,064,700 | ||||||||
| St. Andrews Res. Srs. Oblig., Series A, Rfdg. |
5.125 | 12/01/45 | 1,000 | 1,065,700 | ||||||||
|
|
|
|||||||||||
| 21,583,420 | ||||||||||||
|
|
|
|||||||||||
See Notes to Financial Statements.
PGIM Muni High Income Fund 25
PGIM Muni High Income Fund
Schedule of Investments (continued)
as of August 31, 2021
| Description | Interest Rate |
Maturity Date |
Principal Amount (000)# |
Value | ||||||||
| MUNICIPAL BONDS (Continued) |
||||||||||||
| Nebraska 0.1% |
||||||||||||
| Central Plns. Energy. Proj. Rev., |
||||||||||||
| Proj. No. 3, Series A, Rfdg. |
5.000% | 09/01/42 | 1,000 | $ | 1,474,370 | |||||||
|
|
|
|||||||||||
| Nevada 0.3% |
||||||||||||
| Clark Cnty. Impt. Dist., |
||||||||||||
| Spl. Assmt., Dist. No. 142, Mountains Edge Loc. Impvt., Rfdg. |
4.000 | 08/01/23 | 860 | 885,809 | ||||||||
| Sparks Rev., |
||||||||||||
| Sales Tax, Sr. Series A, Rfdg., 144A |
2.750 | 06/15/28 | 1,000 | 1,043,540 | ||||||||
| Tahoe-Douglas Visitors Auth. Rev., |
||||||||||||
| Stateline |
5.000 | 07/01/45 | 1,000 | 1,158,900 | ||||||||
|
|
|
|||||||||||
| 3,088,249 | ||||||||||||
|
|
|
|||||||||||
| New Hampshire 0.2% |
||||||||||||
| New Hampshire Bus. Fin. Auth. Rev., |
||||||||||||
| Green Bond, Series B, Rfdg., AMT (Mandatory put date 07/02/40), 144A |
3.750(cc) | 07/01/45 | 1,000 | 1,052,480 | ||||||||
| Springpoint Sr. Living, Rfdg. |
4.000 | 01/01/51 | 1,000 | 1,093,420 | ||||||||
|
|
|
|||||||||||
| 2,145,900 | ||||||||||||
|
|
|
|||||||||||
| New Jersey 8.0% |
||||||||||||
| Essex Cnty. Impt. Auth. Rev., |
||||||||||||
| CHF Newark LLC NJIT Student Hsg. Proj., Series A, BAM |
4.000 | 08/01/56 | 1,000 | 1,181,750 | ||||||||
| New Jersey Econ. Dev. Auth. Rev., |
||||||||||||
| Continental Airlines, Inc. Proj., Spec. Facs. |
5.250 | 09/15/29 | 5,000 | 5,247,650 | ||||||||
| Continental Airlines, Inc., United Airlines, Inc. Proj. |
5.125 | 09/15/23 | 3,860 | 4,068,865 | ||||||||
| Continental Airlines, Inc., United Airlines, Inc. Proj., |
||||||||||||
| Series A, AMT |
5.625 | 11/15/30 | 2,275 | 2,549,342 | ||||||||
| Goethals Bridge, AMT |
5.375 | 01/01/43 | 1,390 | 1,529,278 | ||||||||
| N. Star Academy Chrt. Sch. Newark |
5.000 | 07/15/47 | 1,000 | 1,164,480 | ||||||||
| NJ Transit Trans. Proj. |
4.000 | 11/01/44 | 1,000 | 1,137,610 | ||||||||
| NJ Transit Trans. Proj. |
5.000 | 11/01/44 | 2,000 | 2,491,320 | ||||||||
| Port Newark Container, Rfdg., AMT |
5.000 | 10/01/47 | 2,500 | 2,927,050 | ||||||||
| Sch. Facs. Construction |
4.000 | 06/15/49 | 3,000 | 3,427,290 | ||||||||
| Series AAA |
5.000 | 06/15/41 | 2,020 | 2,422,263 | ||||||||
| Series BBB, Rfdg. |
5.500 | 06/15/30 | 1,500 | 1,859,175 | ||||||||
| Series DDD |
5.000 | 06/15/42 | 1,000 | 1,203,520 | ||||||||
See Notes to Financial Statements.
26
PGIM Muni High Income Fund
Schedule of Investments (continued)
as of August 31, 2021
| Description | Interest Rate |
Maturity Date |
Principal Amount (000)# |
Value | ||||||||
| MUNICIPAL BONDS (Continued) |
||||||||||||
| New Jersey (cont’d.) |
||||||||||||
| New Jersey Econ. Dev. Auth. Rev., (cont’d.) |
||||||||||||
| Series WW, Rfdg. (Pre-refunded date 06/15/25)(ee) |
5.250% | 06/15/40 | 65 | $ | 77,098 | |||||||
| Series WW, Unrefunded |
5.250 | 06/15/40 | 1,185 | 1,370,725 | ||||||||
| St. Gov’t. Bldgs. Proj., Series C |
5.000 | 06/15/47 | 2,000 | 2,411,660 | ||||||||
| St. House Proj., Rmkt., Series B |
5.000 | 06/15/43 | 1,000 | 1,231,050 | ||||||||
| Team Academy Chrt. Sch. Proj. |
6.000 | 10/01/43 | 1,700 | 1,858,627 | ||||||||
| Umm Energy Partners, Series A, AMT |
5.000 | 06/15/37 | 1,500 | 1,549,545 | ||||||||
| Umm Energy Partners, Series A, AMT |
5.125 | 06/15/43 | 1,100 | 1,136,069 | ||||||||
| United Airlines, Inc. Proj., Rmkt. |
5.500 | 06/01/33 | 2,000 | 2,168,560 | ||||||||
| New Jersey Healthcare Facs. Fing. Auth. Rev., |
||||||||||||
| RWJ Barnabas Hlth. Oblig. Grp., Series A, Rfdg. |
5.000 | 07/01/43 | 1,500 | 1,794,375 | ||||||||
| New Jersey Tpke. Auth. Rev., |
||||||||||||
| Series A |
4.000 | 01/01/48 | 1,000 | 1,148,760 | ||||||||
| Series D, Rfdg. |
5.000 | 01/01/28 | 2,150 | 2,605,305 | ||||||||
| New Jersey Trans. Tr. Fd. Auth. Rev., |
||||||||||||
| Series A, Rfdg.(hh) |
4.000 | 06/15/42 | 1,000 | 1,144,600 | ||||||||
| Series AA |
4.000 | 06/15/50 | 5,000 | 5,780,500 | ||||||||
| Trans. Sys., Rfdg. |
4.000 | 12/15/39 | 500 | 584,570 | ||||||||
| Trans. Sys., Rfdg. |
5.000 | 12/15/39 | 555 | 699,278 | ||||||||
| Trans. Sys., Series A, Rfdg. |
5.000 | 12/15/36 | 1,250 | 1,551,300 | ||||||||
| Trans. Sys., Series AA |
5.000 | 06/15/45 | 1,200 | 1,378,284 | ||||||||
| Trans. Sys., Series AA |
5.000 | 06/15/46 | 1,940 | 2,390,060 | ||||||||
| Trans. Sys., Series AA |
5.250 | 06/15/41 | 1,000 | 1,160,790 | ||||||||
| Trans. Sys., Series AA |
5.250 | 06/15/43 | 4,595 | 5,813,962 | ||||||||
| South Jersey Trans. Auth. Rev., |
||||||||||||
| Series A |
5.000 | 11/01/45 | 500 | 624,290 | ||||||||
| Series A, Rfdg. |
5.000 | 11/01/39 | 750 | 843,315 | ||||||||
| Tob. Settlement Fing. Corp. Rev., |
||||||||||||
| Series A, Rfdg. |
5.250 | 06/01/46 | 5,350 | 6,514,695 | ||||||||
| Sub. Series B, Rfdg. |
5.000 | 06/01/46 | 7,000 | 8,325,590 | ||||||||
|
|
|
|||||||||||
| 85,372,601 | ||||||||||||
|
|
|
|||||||||||
| New York 7.0% |
||||||||||||
| Build NYC Resource Corp. Rev., |
||||||||||||
| Friends of Hellenic Classical Chrt. Sch., Inc., Series A, 144A |
5.000 | 12/01/51 | 500 | 572,580 | ||||||||
| NY Preparatory Chrt. Sch. Proj., Series A |
4.000 | 06/15/51 | 690 | 754,087 | ||||||||
| Pratt Paper, Inc. Proj., Rfdg., AMT, 144A |
5.000 | 01/01/35 | 1,000 | 1,138,250 | ||||||||
See Notes to Financial Statements.
PGIM Muni High Income Fund 27
PGIM Muni High Income Fund
Schedule of Investments (continued)
as of August 31, 2021
| Description | Interest Rate |
Maturity Date |
Principal Amount (000)# |
Value | ||||||||
| MUNICIPAL BONDS (Continued) |
||||||||||||
| New York (cont’d.) |
||||||||||||
| Erie Cnty. Tob. Asset Secur. Corp. Cap. Apprec. Rev., |
||||||||||||
| Asset Bkd., 1st Sub. Series B, Rfdg., CABS |
(5.000)%(t) | 06/01/47 | 5,000 | $ | 1,129,300 | |||||||
| Asset Bkd., 2nd Sub. Series C, Rfdg., CABS, 144A |
(5.000)(t) | 06/01/50 | 4,000 | 658,600 | ||||||||
| Hempstead Town Loc. Dev. Corp. Rev., |
||||||||||||
| Hofstra Univ. Proj., Series A, Rfdg. |
3.000 | 07/01/51 | 1,000 | 1,073,160 | ||||||||
| Metropolitan Trans. Auth. Rev., |
||||||||||||
| Bid Grp. 1, Green Bond, Series A-1 |
4.000 | 11/15/44 | 1,500 | 1,738,785 | ||||||||
| Climate Bond Certified, Green Bond, Series E, Rfdg. |
4.000 | 11/15/45 | 1,595 | 1,830,661 | ||||||||
| Green Bond, Series C-1, Rfdg. |
5.000 | 11/15/50 | 3,725 | 4,552,025 | ||||||||
| Green Bond, Series C-1, Rfdg. |
5.250 | 11/15/55 | 3,000 | 3,720,300 | ||||||||
| Green Bond, Series D1 |
5.000 | 11/15/43 | 2,000 | 2,492,680 | ||||||||
| Series A-2 |
4.000 | 11/15/42 | 2,000 | 2,329,840 | ||||||||
| Series A-2 |
4.000 | 11/15/43 | 2,000 | 2,323,860 | ||||||||
| New York City Indl. Dev. Agcy. Rev., |
||||||||||||
| Yankee Stadium Proj. Pilot, Rfdg. |
4.000 | 03/01/45 | 1,000 | 1,148,030 | ||||||||
| New York Liberty Dev. Corp. Rev., |
5.750 | 11/15/51 | 1,750 | 1,770,388 | ||||||||
| Class 1-3 World Trade Ctr., Rfdg., 144A |
5.000 | 11/15/44 | 5,000 | 5,579,550 | ||||||||
| Green Bonds, 4 World Trade Ctr. Proj., Series A, Rfdg.(hh) |
3.000 | 11/15/51 | 1,000 | 1,024,780 | ||||||||
| New York St. Dorm. Auth. Rev., |
||||||||||||
| St. Johns Univ., Series A, Rfdg. |
4.000 | 07/01/48 | 2,625 | 3,078,889 | ||||||||
| New York St. Envir. Facs. Corp. Rev., |
||||||||||||
| Draw Down Casella Wste. Sys., Inc. Proj., Series R-1, AMT |
2.750(cc) | 09/01/50 | 550 | 579,232 | ||||||||
| New York Trans. Dev. Corp. Rev., |
||||||||||||
| Delta Air Lines, Inc., Laguardia Arpt. Terms. C&D Redev., AMT |
4.000 | 01/01/36 | 1,475 | 1,665,423 | ||||||||
| Delta Air Lines, Inc., Laguardia Arpt. Terms. C&D Redev., AMT |
4.375 | 10/01/45 | 2,000 | 2,370,900 | ||||||||
| Delta Air Lines, Inc., Laguardia Arpt. Terms. C&D Redev., AMT |
5.000 | 01/01/26 | 2,000 | 2,366,400 | ||||||||
| Delta Air Lines, Inc., Laguardia Arpt. Terms. C&D Redev., AMT |
5.000 | 01/01/31 | 1,000 | 1,236,170 | ||||||||
| Delta Air Lines, Inc., Laguardia Arpt. Terms. C&D Redev., AMT |
5.000 | 10/01/40 | 2,500 | 3,134,375 | ||||||||
| John F. Kennedy Int’l. Arpt. Proj., Rfdg., AMT |
5.250 | 08/01/31 | 935 | 1,126,750 | ||||||||
| John F. Kennedy Int’l. Arpt. Proj., Rfdg., AMT |
5.375 | 08/01/36 | 1,000 | 1,258,830 | ||||||||
| Laguardia Arpt., Term. B Redev., Series A, AMT |
5.000 | 07/01/46 | 2,995 | 3,340,473 | ||||||||
| Laguardia Arpt., Term. B Redev., Series A, AMT |
5.250 | 01/01/50 | 9,480 | 10,631,915 | ||||||||
See Notes to Financial Statements.
28
PGIM Muni High Income Fund
Schedule of Investments (continued)
as of August 31, 2021
| Description | Interest Rate |
Maturity Date |
Principal Amount (000)# |
Value | ||||||||
| MUNICIPAL BONDS (Continued) |
||||||||||||
| New York (cont’d.) |
||||||||||||
| New York Trans. Dev. Corp. Rev., (cont’d.) |
||||||||||||
| NY St. Thruway Srvc. Areas Proj., AMT |
4.000% | 04/30/53 | 750 | $ | 863,152 | |||||||
| Port Auth. of NY & NJ Rev., |
||||||||||||
| Series 223, Rfdg., AMT |
4.000 | 07/15/61 | 1,625 | 1,872,699 | ||||||||
| TSASC, Inc. Rev., |
||||||||||||
| Series A, Rfdg. |
5.000 | 06/01/41 | 4,875 | 5,660,070 | ||||||||
| Yonkers Econ. Dev. Corp. Rev., |
||||||||||||
| Chrt. Sch. Ed. Excellence Proj., Series A |
5.000 | 10/15/49 | 1,000 | 1,169,410 | ||||||||
|
|
|
|||||||||||
| 74,191,564 | ||||||||||||
|
|
|
|||||||||||
| North Carolina 0.4% |
||||||||||||
| North Carolina Med. Care Commn. Rev., |
||||||||||||
| Pennybyrn at Maryfield Proj., Rfdg. |
5.000 | 10/01/35 | 1,000 | 1,078,410 | ||||||||
| Pennybyrn at Maryfield Proj., Series A |
5.000 | 10/01/50 | 750 | 857,610 | ||||||||
| The Presbyterian Homes Oblig. Grp., Series A |
5.000 | 10/01/50 | 1,000 | 1,201,930 | ||||||||
| North Carolina Tpke. Auth. Rev., |
||||||||||||
| Series A, Rfdg. |
5.000 | 07/01/51 | 1,250 | 1,441,413 | ||||||||
|
|
|
|||||||||||
| 4,579,363 | ||||||||||||
|
|
|
|||||||||||
|
Ohio 4.8% |
||||||||||||
| Akron Bath Copley Joint Township Hosp. Dist. Rev., |
||||||||||||
| Summa Hlth. Oblig. Grp. Hosp. Facs., Rfdg. |
3.000 | 11/15/40 | 3,000 | 3,207,750 | ||||||||
| Buckeye Tob. Settlement Fing. Auth. Rev., |
||||||||||||
| Sr. Series A-2, Class 1, Rfdg. |
4.000 | 06/01/48 | 3,000 | 3,439,020 | ||||||||
| Sr. Series B-2, Class 2, Rfdg. |
5.000 | 06/01/55 | 19,850 | 23,065,303 | ||||||||
| Cuyahoga Cnty. Hosp. Rev., |
||||||||||||
| Metro Hlth. Sys., Rfdg. |
5.000 | 02/15/52 | 575 | 674,768 | ||||||||
| Metro Hlth. Sys., Rfdg. |
5.250 | 02/15/47 | 2,000 | 2,390,180 | ||||||||
| Metro Hlth. Sys., Rfdg. |
5.500 | 02/15/57 | 6,540 | 7,950,417 | ||||||||
| Franklin Cnty. Hosp. Facs. Rev., |
||||||||||||
| Nationwide Children’s Hosp. Proj. |
4.000 | 11/01/45 | 2,000 | 2,222,000 | ||||||||
| Ohio Hlth. Corp., Series A |
4.000 | 05/15/47 | 2,500 | 2,843,925 | ||||||||
| Lucas Cnty. Hosp. Rev., |
||||||||||||
| Promedica Healthcare, Series A, Rfdg. (Pre-refunded date 11/15/21)(ee) |
6.500 | 11/15/37 | 875 | 886,384 | ||||||||
| Middleburg Heights Hosp. Rev. Facs., |
||||||||||||
| Southwest Gen. Hlth. Ctr., Series A, Rfdg. |
4.000 | 08/01/41 | 2,005 | 2,287,103 | ||||||||
See Notes to Financial Statements.
PGIM Muni High Income Fund 29
PGIM Muni High Income Fund
Schedule of Investments (continued)
as of August 31, 2021
| Description | Interest Rate |
Maturity Date |
Principal Amount (000)# |
Value | ||||||||
| MUNICIPAL BONDS (Continued) |
||||||||||||
| Ohio (cont’d.) |
||||||||||||
| Ohio Air Qlty. Dev. Auth. Rev., |
||||||||||||
| Pratt Paper OH LLC Proj., AMT, 144A |
4.500% | 01/15/48 | 1,000 | $ | 1,147,890 | |||||||
| Ohio St. Pvt. Act. Rev., |
||||||||||||
| Portsmouth Bypass Proj., AMT |
5.000 | 06/30/53 | 1,000 | 1,122,790 | ||||||||
|
|
|
|||||||||||
| 51,237,530 | ||||||||||||
|
|
|
|||||||||||
| Oklahoma 1.8% |
||||||||||||
| Oklahoma Dev. Fin. Auth. Rev., |
||||||||||||
| OU Medicine Proj., Series B |
5.000 | 08/15/38 | 250 | 304,837 | ||||||||
| OU Medicine Proj., Series B |
5.250 | 08/15/48 | 1,730 | 2,108,040 | ||||||||
| OU Medicine Proj., Series B |
5.500 | 08/15/52 | 7,530 | 9,315,664 | ||||||||
| OU Medicine Proj., Series B |
5.500 | 08/15/57 | 4,950 | 6,108,795 | ||||||||
| St. Johns Hlth. Sys., Rfdg. (Pre-refunded date 02/15/22)(ee) |
5.000 | 02/15/42 | 300 | 306,624 | ||||||||
| Tulsa Cnty. Indl. Auth. Rev., |
||||||||||||
| Montereau, Inc. Proj., Rfdg. |
5.250 | 11/15/45 | 1,000 | 1,125,840 | ||||||||
|
|
|
|||||||||||
| 19,269,800 | ||||||||||||
|
|
|
|||||||||||
| Oregon 0.8% |
||||||||||||
| Multnomah Cnty. Hosp. Facs. Auth. Rev., |
||||||||||||
| Mirabella at South Waterfront, Series A., Rfdg. |
5.400 | 10/01/44 | 1,000 | 1,063,380 | ||||||||
| Terwilliger Plaza Parkview Proj., Green Bond, Series A, |
4.000 | 12/01/51 | 2,000 | 2,244,640 | ||||||||
| Port of Portland Airport Rev., |
||||||||||||
| Series 27A, Rfdg., AMT |
4.000 | 07/01/50 | 3,395 | 3,957,857 | ||||||||
| Salem Hosp. Facs. Auth. Rev., |
||||||||||||
| Capital Manor, Inc., Rfdg. |
6.000 | 05/15/42 | 1,000 | 1,029,220 | ||||||||
|
|
|
|||||||||||
| 8,295,097 | ||||||||||||
|
|
|
|||||||||||
| Pennsylvania 3.8% |
||||||||||||
| Bucks Cnty. Indl. Dev. Auth. Rev., |
||||||||||||
| Grand View Hosp. Proj. |
4.000 | 07/01/51 | 750 | 840,315 | ||||||||
| Central Bradford Progress Auth. Rev., |
||||||||||||
| Guthrie Healthcare Sys., Rfdg. (Pre-refunded date 12/01/21)(ee) |
5.375 | 12/01/41 | 2,700 | 2,735,073 | ||||||||
| Chester Cnty. Indl. Dev. Auth. Rev., |
||||||||||||
| Renaissance Academy Chrt. Sch., Rfdg. |
5.000 | 10/01/44 | 1,000 | 1,108,550 | ||||||||
See Notes to Financial Statements.
30
PGIM Muni High Income Fund
Schedule of Investments (continued)
as of August 31, 2021
| Description | Interest Rate |
Maturity Date |
Principal Amount (000)# |
Value | ||||||||
| MUNICIPAL BONDS (Continued) |
||||||||||||
| Pennsylvania (cont’d.) |
||||||||||||
| Moon Indl. Dev. Auth. Rev., |
||||||||||||
| Baptist Homes Society Oblig., Rfdg. |
6.000% | 07/01/45 | 2,000 | $ | 2,155,200 | |||||||
| Pennsylvania Comnwlth., |
||||||||||||
| Series A, Rfdg., COP |
4.000 | 07/01/46 | 1,500 | 1,692,030 | ||||||||
| Pennsylvania Higher Edl. Facs. Auth. Rev., |
||||||||||||
| Univ. of Pennsylvania Hlth. Sys., Series B, Rfdg.(hh) |
4.000 | 08/15/42 | 700 | 798,441 | ||||||||
| Pennsylvania Tpke. Commn. Rev., |
||||||||||||
| Series A-1 |
5.000 | 12/01/46 | 3,950 | 4,684,779 | ||||||||
| Sub. Series A |
4.000 | 12/01/50 | 1,000 | 1,156,360 | ||||||||
| Sub. Series A |
5.500 | 12/01/42 | 1,500 | 1,846,320 | ||||||||
| Sub. Series A |
5.500 | 12/01/46 | 1,740 | 2,163,116 | ||||||||
| Sub. Series A-1 |
5.000 | 12/01/46 | 2,000 | 2,336,240 | ||||||||
| Sub. Series B-1 |
5.250 | 06/01/47 | 2,000 | 2,441,420 | ||||||||
| Philadelphia Auth. for Indl. Dev. Rev., |
7.250 | 06/15/43 | 2,000 | 2,269,240 | ||||||||
| Gtr. Philadelphia Hlth. Action, Rfdg. |
6.625 | 06/01/50 | 2,795 | 2,991,572 | ||||||||
| Mariana Bracetti Academy (Pre-refunded date 12/15/21)(ee) |
7.625 | 12/15/41 | 2,000 | 2,042,960 | ||||||||
| New Fndtn. Chrt. Sch. Proj., (Pre-refunded date 12/15/22)(ee) |
6.625 | 12/15/41 | 1,000 | 1,082,950 | ||||||||
| String Theory Chrt. Sch. Proj., Rfdg., 144A |
5.000 | 06/15/50 | 1,000 | 1,161,790 | ||||||||
| Philadelphia Hosp. & Higher Ed. Facs. Auth. Rev., |
||||||||||||
| Temple Univ. Hlth. Sys., Series A |
5.625 | 07/01/42 | 6,750 | 7,009,335 | ||||||||
|
|
|
|||||||||||
| 40,515,691 | ||||||||||||
|
|
|
|||||||||||
| Puerto Rico 7.2% |
||||||||||||
| Puerto Rico Comnwlth., |
||||||||||||
| Pub Impt. Series A, PSA, GO, Rfdg. |
5.000 | 07/01/41(d) | 6,620 | 5,924,900 | ||||||||
| Pub Impt. Series A, PSA, GO, Rfdg. |
5.500 | 07/01/39(d) | 5,000 | 4,475,000 | ||||||||
| Puerto Rico Comnwlth. Aqu. & Swr. Auth. Rev., |
||||||||||||
| Sr. Lien, Series A |
4.000 | 07/01/22 | 2,535 | 2,616,804 | ||||||||
| Sr. Lien, Series A |
4.250 | 07/01/25 | 1,285 | 1,328,985 | ||||||||
| Sr. Lien, Series A |
5.000 | 07/01/33 | 2,780 | 2,892,646 | ||||||||
| Sr. Lien, Series A |
5.125 | 07/01/37 | 155 | 161,440 | ||||||||
| Sr. Lien, Series A |
5.250 | 07/01/42 | 1,250 | 1,303,225 | ||||||||
| Sr. Lien, Series A |
5.750 | 07/01/37 | 1,375 | 1,439,295 | ||||||||
| Sr. Lien, Series A |
6.000 | 07/01/47 | 1,170 | 1,227,131 | ||||||||
| Sr. Lien, Series A, Rfdg., 144A |
5.000 | 07/01/35 | 5,000 | 6,189,650 | ||||||||
| Sr. Lien, Series A, Rfdg., 144A |
5.000 | 07/01/47 | 5,000 | 5,998,100 | ||||||||
See Notes to Financial Statements.
PGIM Muni High Income Fund 31
PGIM Muni High Income Fund
Schedule of Investments (continued)
as of August 31, 2021
| Description | Interest Rate |
Maturity Date |
Principal Amount (000)# |
Value | ||||||||
| MUNICIPAL BONDS (Continued) |
||||||||||||
| Puerto Rico (cont’d.) |
||||||||||||
| Puerto Rico Sales Tax Fing. Corp. Sales Tax Rev., |
||||||||||||
| Restructured, Series A-1 |
4.750% | 07/01/53 | 5,720 | $ | 6,547,627 | |||||||
| Restructured, Series A-1 |
5.000 | 07/01/58 | 12,364 | 14,289,693 | ||||||||
| Restructured, Series A-2 |
4.329 | 07/01/40 | 10,500 | 11,866,470 | ||||||||
| Restructured, Series A-1, CABS |
3.220(t) | 07/01/46 | 18,766 | 6,241,760 | ||||||||
| Restructured, Series A-1, CABS |
3.244(t) | 07/01/51 | 16,834 | 4,054,637 | ||||||||
|
|
|
|||||||||||
| 76,557,363 | ||||||||||||
|
|
|
|||||||||||
| Rhode Island 0.5% |
||||||||||||
| Tob. Settlement Fing. Corp. Rev., |
||||||||||||
| Series A, Rfdg. |
5.000 | 06/01/40 | 4,350 | 4,917,327 | ||||||||
|
|
|
|||||||||||
| South Carolina 1.0% |
||||||||||||
| Berkeley Cnty., |
||||||||||||
| Spl. Assmt., Nexton Impt. Dist. |
4.375 | 11/01/49 | 1,000 | 1,119,940 | ||||||||
| South Carolina Jobs-Econ. Dev. Auth. Rev., |
||||||||||||
| Green Chrt. Sch. Proj., Series A, Rfdg., 144A |
4.000 | 06/01/56 | 1,060 | 1,122,625 | ||||||||
| South Carolina Prt. Auth. Rev., |
||||||||||||
| AMT |
4.000 | 07/01/45 | 1,500 | 1,611,180 | ||||||||
| AMT |
4.000 | 07/01/55 | 2,000 | 2,201,820 | ||||||||
| South Carolina St. Pub. Svc. Auth. Rev., |
||||||||||||
| Series B, Rfdg.(hh) |
4.000 | 12/01/51 | 1,500 | 1,761,945 | ||||||||
| Series E, Rfdg. |
5.250 | 12/01/55 | 2,500 | 2,904,675 | ||||||||
|
|
|
|||||||||||
| 10,722,185 | ||||||||||||
|
|
|
|||||||||||
| South Dakota 0.2% |
||||||||||||
| South Dakota Hlth. & Edl. Facs. Auth. Rev., |
||||||||||||
| Monument Hlth., Series A, Rfdg. |
4.000 | 09/01/50 | 1,500 | 1,736,325 | ||||||||
|
|
|
|||||||||||
|
Tennessee 0.7% |
||||||||||||
| Knox Cnty. Hlth. Edl. & Hsg. Facs. Brd. Rev., |
||||||||||||
| East Tennessee Children’s Hosp., Rfdg. |
4.000 | 11/15/48 | 2,170 | 2,443,702 | ||||||||
| Metropolitan Govt. Nashville & Davidson Cnty. Hlth. & |
||||||||||||
| Edl. Facs. Brd. Rev., |
||||||||||||
| Impt. Blakeford at Green Hills, Rfdg. (Pre-refunded date 07/01/22)(ee) |
5.000 | 07/01/37 | 850 | 884,179 | ||||||||
See Notes to Financial Statements.
32
PGIM Muni High Income Fund
Schedule of Investments (continued)
as of August 31, 2021
| Description | Interest Rate |
Maturity Date |
Principal Amount (000)# |
Value | ||||||||
| MUNICIPAL BONDS (Continued) |
||||||||||||
| Tennessee (cont’d.) |
||||||||||||
| Shelby Cnty. Hlth. Edl. & Hsg. Facs. Brd. Rev., |
||||||||||||
| Germantown Vlg., Rfdg. (Pre-refunded date 12/01/22)(ee) |
5.250% | 12/01/42 | 1,100 | $ | 1,169,498 | |||||||
| Tennessee Energy Acq. Corp. Gas Rev., |
||||||||||||
| Series C |
5.000 | 02/01/22 | 1,000 | 1,018,260 | ||||||||
| The Tennessee Energy Acq. Corp. Commodity Proj., |
||||||||||||
| Series A (Mandatory put date 11/01/31) |
5.000(cc) | 05/01/52 | 1,200 | 1,597,860 | ||||||||
|
|
|
|||||||||||
| 7,113,499 | ||||||||||||
|
|
|
|||||||||||
| Texas 8.6% |
||||||||||||
| Arlington Higher Ed. Fin. Corp. Rev., |
||||||||||||
| Series A, Rfdg. |
4.000 | 08/15/46 | 1,360 | 1,474,770 | ||||||||
| Bexar Cnty. Hlth. Facs. Dev. Corp. Rev., |
||||||||||||
| Army Retmnt. Residence Fndt., Rfdg. |
5.000 | 07/15/41 | 1,250 | 1,413,150 | ||||||||
| Central Texas Regl. Mobility Auth. Rev., |
||||||||||||
| Sr. Lien, Series A |
5.000 | 01/01/45 | 1,000 | 1,153,670 | ||||||||
| Sub., Rfdg. |
4.000 | 01/01/41 | 1,100 | 1,214,147 | ||||||||
| Clifton Higher Ed. Fin. Corp. Rev., |
||||||||||||
| Idea Pub. Sch. |
5.000 | 08/15/42 | 1,000 | 1,038,750 | ||||||||
| Idea Pub. Sch. |
6.000 | 08/15/43 | 1,100 | 1,214,444 | ||||||||
| Decatur Hosp. Auth. Rev., |
||||||||||||
| Wise Regl. Hlth. Sys., Series A, Rfdg. |
5.250 | 09/01/44 | 1,370 | 1,527,112 | ||||||||
| Grand Parkway Trans. Corp. Rev., |
||||||||||||
| 1st Tier Toll Rev., Series A |
5.125 | 10/01/43 | 2,000 | 2,166,220 | ||||||||
| Gulf Coast Wste. Disp. Auth. Rev., |
||||||||||||
| Exxon Proj., Rfdg., FRDD (Mandatory put date 09/01/21) |
0.010(cc) | 10/01/24 | 300 | 300,000 | ||||||||
| ExxonMobil Proj., FRDD (Mandatory put date 09/01/21) |
0.020(cc) | 09/01/25 | 3,650 | 3,650,000 | ||||||||
| ExxonMobil Proj., FRDD (Mandatory put date 09/01/21) |
0.020(cc) | 12/01/25 | 15,530 | 15,530,000 | ||||||||
| ExxonMobil Proj., FRDD (Mandatory put date 09/01/21) |
0.020(cc) | 06/01/30 | 900 | 900,000 | ||||||||
| ExxonMobil Proj., Series A, FRDD (Mandatory put date 09/01/21) |
0.020(cc) | 06/01/30 | 4,020 | 4,020,000 | ||||||||
| ExxonMobil Proj., Series B, FRDD (Mandatory put date 09/01/21) |
0.020(cc) | 06/01/25 | 200 | 200,000 | ||||||||
| Harris Cnty. Cultural Ed. Facs. Fin. Corp. Rev., |
||||||||||||
| Texas Children’s Hosp., Series A, Rfdg. |
3.000 | 10/01/51 | 1,000 | 1,067,380 | ||||||||
See Notes to Financial Statements.
PGIM Muni High Income Fund 33
PGIM Muni High Income Fund
Schedule of Investments (continued)
as of August 31, 2021
| Description | Interest Rate |
Maturity Date |
Principal Amount (000)# |
Value | ||||||||
| MUNICIPAL BONDS (Continued) |
||||||||||||
| Texas (cont’d.) |
||||||||||||
| Houston Arpt. Sys. Rev., |
||||||||||||
| Series B-1, AMT |
5.000% | 07/15/35 | 2,000 | $ | 2,212,720 | |||||||
| Spl. Facs. Continental Airlines, Inc., Series A, Rfdg., |
||||||||||||
| AMT |
6.625 | 07/15/38 | 1,500 | 1,506,600 | ||||||||
| Sub. Lien, Series A, Rfdg., AMT (Pre-refunded date 07/01/22)(ee) |
5.000 | 07/01/32 | 1,000 | 1,039,620 | ||||||||
| Sub. Series A, Rfdg., AMT |
4.000 | 07/01/46 | 750 | 876,203 | ||||||||
| United Airlines, Inc. Terminal Impt. Proj., Series B-1, |
||||||||||||
| AMT |
4.000 | 07/15/41 | 1,000 | 1,086,410 | ||||||||
| United Airlines, Inc., Rfdg., AMT |
5.000 | 07/15/27 | 500 | 590,760 | ||||||||
| Houston Higher Ed. Fin. Corp. Rev., |
||||||||||||
| Cosmos Fndtn., Inc., Series A |
5.000 | 02/15/42 | 1,250 | 1,271,675 | ||||||||
| Kerryville Hlth. Facs. Dev. Corp. Rev., |
||||||||||||
| Peterson Regl. Med. Ctr. Proj., Rfdg. |
5.000 | 08/15/35 | 3,000 | 3,495,000 | ||||||||
| Lower Neches Vlly. Auth. Indl. Dev. Corp. Rev., |
||||||||||||
| ExxonMobil Proj., Series B, Rfdg., FRDD (Mandatory put date 09/01/21) |
0.020(cc) | 11/01/29 | 8,980 | 8,980,000 | ||||||||
| Matagorda Cnty. Nav. Dist. No. 1, Poll. Ctrl. Rev., |
||||||||||||
| AEP Texas Central Co. Proj., Series B-1, Rfdg. |
4.000 | 06/01/30 | 1,000 | 1,054,830 | ||||||||
| AEP Texas Central Co. Proj., Series B-2, Rfdg. |
4.000 | 06/01/30 | 1,800 | 1,898,604 | ||||||||
| Mission Econ. Dev. Corp. Rev., |
||||||||||||
| Natgosoline Proj., Sr. Lien, Rfdg., AMT, 144A |
4.625 | 10/01/31 | 2,000 | 2,104,820 | ||||||||
| New Hope Cultural Ed. Facs. Fin. Corp. Rev., |
||||||||||||
| Jubilee Academic Ctr., Series A, Rfdg., 144A |
4.000 | 08/15/26 | 1,375 | 1,377,654 | ||||||||
| Jubilee Academic Ctr., Series A, Rfdg., 144A |
5.000 | 08/15/46 | 2,000 | 2,003,760 | ||||||||
| MRC Crestview, Rfdg. |
5.000 | 11/15/46 | 1,150 | 1,237,883 | ||||||||
| Westminster Proj., Rfdg. |
4.000 | 11/01/55 | 1,750 | 1,979,442 | ||||||||
| North Texas Twy. Auth. Rev., |
||||||||||||
| 2nd Tier, Rfdg. |
5.000 | 01/01/48 | 1,250 | 1,524,562 | ||||||||
| 2nd Tier, Series A, Rfdg. |
4.000 | 01/01/38 | 2,000 | 2,218,800 | ||||||||
| 2nd Tier, Series B, Rfdg. |
3.000 | 01/01/51 | 2,200 | 2,323,112 | ||||||||
| Port Beaumont Navigation Dist. Rev., |
||||||||||||
| Jefferson Gulf Coast Energy Proj., Series A, AMT, 144A |
3.000 | 01/01/50 | 1,000 | 983,610 | ||||||||
| Jefferson Gulf Coast, Rfdg., AMT, 144A |
4.000 | 01/01/50 | 2,000 | 2,068,300 | ||||||||
| Pottsboro Higher Ed. Fin. Corp. Rev., |
||||||||||||
| Series A |
5.000 | 08/15/46 | 1,000 | 1,093,900 | ||||||||
| San Antonio Ed. Facs. Corp. Rev., |
||||||||||||
| Univ. of the Incarnate Word Proj., Series A, Rfdg. |
4.000 | 04/01/54 | 1,000 | 1,149,040 | ||||||||
| Tarrant Cnty. Cultural Ed. Facs. Fin. Corp. Rev., |
||||||||||||
| Barton Creek Sr. Living Ctr., Rfdg. |
5.000 | 11/15/40 | 1,100 | 1,230,504 | ||||||||
See Notes to Financial Statements.
34
PGIM Muni High Income Fund
Schedule of Investments (continued)
as of August 31, 2021
| Description | Interest Rate |
Maturity Date |
Principal Amount (000)# |
Value | ||||||||
| MUNICIPAL BONDS (Continued) |
||||||||||||
| Texas (cont’d.) |
||||||||||||
| Tarrant Cnty. Cultural Ed. Facs. Fin. Corp. Rev., (cont’d.) |
||||||||||||
| Trinity Terrace Proj., Series A-1, Rfdg. |
5.000% | 10/01/44 | 1,000 | $ | 1,087,710 | |||||||
| Texas Muni. Gas Acq. & Sply. Corp. Rev., |
||||||||||||
| Sr. Lien, Series A |
5.250 | 12/15/26 | 4,100 | 5,092,364 | ||||||||
| Texas Priv. Activ. Surf. Trans. Corp. Rev., |
||||||||||||
| LBJ Infrast. Grp. LLC, Series A, Rfdg. |
4.000 | 06/30/40 | 600 | 710,118 | ||||||||
| Sr. Lien, NTE Mobility Partners, Series 3A & 3B, AMT |
6.750 | 06/30/43 | 500 | 560,425 | ||||||||
| Sr. Lien, NTE Mobility Partners, Series 3A & 3B, AMT |
7.000 | 12/31/38 | 1,500 | 1,692,015 | ||||||||
|
|
|
|||||||||||
| 91,320,084 | ||||||||||||
|
|
|
|||||||||||
| Utah 0.5% |
||||||||||||
| Salt Lake City Corp. Arpt. Rev., |
||||||||||||
| Series A, AMT |
4.000 | 07/01/51 | 3,000 | 3,491,070 | ||||||||
| Series A, AMT |
5.000 | 07/01/47 | 1,100 | 1,309,550 | ||||||||
| Utah Cnty. Hosp. Rev., |
||||||||||||
| IHC Hlth. Svcs., Inc., Series A |
4.000 | 05/15/43 | 510 | 600,709 | ||||||||
|
|
|
|||||||||||
| 5,401,329 | ||||||||||||
|
|
|
|||||||||||
| Virginia 1.5% |
||||||||||||
| City of Chesapeake Expressway Toll Road Rev., |
||||||||||||
| Transn. Sys., Sr. Series B, Rfdg., CABS (Convert to |
||||||||||||
| Fixed on 07/15/23) |
0.000(cc) | 07/15/40 | 1,000 | 1,120,610 | ||||||||
| Norfolk Econ. Dev. Auth. Rev., |
||||||||||||
| Sentara Healthcare, Series B, Rfdg. |
4.000 | 11/01/48 | 2,000 | 2,270,100 | ||||||||
| Virginia Small Bus. Fing. Auth. Rev., |
||||||||||||
| National Sr. Campuses, Inc., Rfdg. |
4.000 | 01/01/51 | 1,750 | 1,978,760 | ||||||||
| Sr. Lien, Elizabeth River Crossings OpCo LLC Proj. |
5.250 | 01/01/32 | 2,055 | 2,142,194 | ||||||||
| Sr. Lien, Elizabeth River Crossings OpCo LLC Proj. |
5.500 | 01/01/42 | 3,000 | 3,130,140 | ||||||||
| Sr. Lien, Express Lanes LLC Proj. |
5.000 | 01/01/40 | 4,780 | 4,855,858 | ||||||||
|
|
|
|||||||||||
| 15,497,662 | ||||||||||||
|
|
|
|||||||||||
| Washington 1.5% |
||||||||||||
| Port of Seattle Indl. Dev. Corp. Rev., |
||||||||||||
| Spl. Facs., Delta Airlines, Rfdg., AMT |
5.000 | 04/01/30 | 1,000 | 1,059,270 | ||||||||
| Port of Seattle Rev., |
||||||||||||
| Intermediate Lein Priv. Activ., Series C, Rfdg., AMT |
5.000 | 08/01/46 | 2,000 | 2,546,140 | ||||||||
| Skagit Cnty. Pub. Hosp. Dist. No. 1 Rev., |
||||||||||||
| Rfdg. & Impvt., Series A |
5.000 | 12/01/37 | 3,000 | 3,291,570 | ||||||||
See Notes to Financial Statements.
PGIM Muni High Income Fund 35
PGIM Muni High Income Fund
Schedule of Investments (continued)
as of August 31, 2021
| Description | Interest Rate |
Maturity Date |
Principal Amount (000)# |
Value | ||||||||
| MUNICIPAL BONDS (Continued) |
||||||||||||
| Washington (cont’d.) |
||||||||||||
| Tob. Settlement Auth. Wash. Rev., |
||||||||||||
| Rfdg. |
5.250% | 06/01/32 | 720 | $ | 721,757 | |||||||
| Washington Healthcare Facs. Auth. Rev., |
||||||||||||
| Overlake Hosp. Med. Ctr., Rfdg. |
5.000 | 07/01/38 | 1,100 | 1,234,123 | ||||||||
| Overlake Hosp. Med. Ctr., Series A |
4.000 | 07/01/42 | 2,500 | 2,847,025 | ||||||||
| Washington St. Hsg. Fin. Commn. Rev., |
||||||||||||
| Rockwood Retmnt. Cmnty. Proj., Series A, Rfdg., 144A |
7.375 | 01/01/44 | 2,000 | 2,219,160 | ||||||||
| Social Certificate, Series A-1 |
3.500 | 12/20/35 | 1,993 | 2,335,026 | ||||||||
|
|
|
|||||||||||
| 16,254,071 | ||||||||||||
|
|
|
|||||||||||
| West Virginia 0.2% |
||||||||||||
| West Virginia Hosp. Fin. Auth. Rev., |
||||||||||||
| Cabell Huntington Hosp. Oblig. Grp., Series A, Rfdg. |
4.125 | 01/01/47 | 1,600 | 1,815,712 | ||||||||
|
|
|
|||||||||||
|
Wisconsin 1.5% |
||||||||||||
| Pub. Fin. Auth. Rev., |
||||||||||||
| Bancroft Neurohealth Proj., Series A, 144A |
5.125 | 06/01/48 | 1,000 | 1,116,520 | ||||||||
| Corvian Cmnty. Sch., Series A, 144A |
5.000 | 06/15/49 | 1,000 | 1,066,810 | ||||||||
| Corvian Cmnty. Sch., Series A, 144A |
5.125 | 06/15/47 | 2,000 | 2,090,220 | ||||||||
| Mountain Island Chrt. Sch., Series L, Rfdg. |
5.000 | 07/01/47 | 1,000 | 1,100,990 | ||||||||
| Sr. Bond, WFCS Port. Proj., Series A-1, 144A |
5.000 | 01/01/56 | 500 | 585,255 | ||||||||
| Sr. MD Proton Treatment Ctr., Series A-1, 144A |
6.250 | 01/01/38 | 1,750 | 1,481,672 | ||||||||
| Sr. MD Proton Treatment Ctr., Series A-1, 144A |
6.375 | 01/01/48 | 3,000 | 2,398,470 | ||||||||
| Sr. Oblig. Grp., Series B, Rfdg., AMT |
5.000 | 07/01/42 | 1,500 | 1,552,395 | ||||||||
| Sr. Oblig. Grp., Series B, Rfdg., AMT |
5.250 | 07/01/28 | 1,000 | 1,039,340 | ||||||||
| Wonderful Fndtn. Chrt. Sch. Port., Series A-1, 144A |
5.000 | 01/01/55 | 1,600 | 1,819,040 | ||||||||
| Wisconsin Hlth. & Edl. Facs. Auth. Rev., |
||||||||||||
| Ascension Hlth. Alliance, Rmkt., Series B-1, Rfdg. |
4.000 | 11/15/43 | 1,500 | 1,742,415 | ||||||||
|
|
|
|||||||||||
| 15,993,127 | ||||||||||||
|
|
|
|||||||||||
| TOTAL INVESTMENTS 100.6% |
1,069,970,471 | |||||||||||
| Liabilities in excess of other assets(z) (0.6)% |
(6,110,682 | ) | ||||||||||
|
|
|
|||||||||||
| NET ASSETS 100.0% |
$ | 1,063,859,789 | ||||||||||
|
|
|
|||||||||||
See Notes to Financial Statements.
36
PGIM Muni High Income Fund
Schedule of Investments (continued)
as of August 31, 2021
Below is a list of the abbreviation(s) used in the annual report:
USD—US Dollar
144A—Security was purchased pursuant to Rule 144A under the Securities Act of 1933 and, pursuant to the requirements of Rule 144A, may not be resold except to qualified institutional buyers.
AGM—Assured Guaranty Municipal Corp.
AMT—Alternative Minimum Tax
BAM—Build America Mutual
CABS—Capital Appreciation Bonds
CDD—Community Development District
COP—Certificates of Participation
FRDD—Floating Rate Daily Demand Note
GO—General Obligation
IDB—Industrial Development Bond
LIBOR—London Interbank Offered Rate
PCR—Pollution Control Revenue
| # | Principal amount is shown in U.S. dollars unless otherwise stated. |
| ^ | Indicates a Level 3 instrument. The aggregate value of Level 3 instruments is $483,800 and 0.0% of net assets. |
| (cc) | Variable rate instrument. The rate shown is based on the latest available information as of August 31, 2021. Certain variable rate securities are not based on a published reference rate and spread but are determined by the issuer or agent and are based on current market conditions. These securities do not indicate a reference rate and spread in their description. |
| (d) | Represents issuer in default on interest payments and/or principal repayment. Non-income producing security. Such securities may be post-maturity. |
| (ee) | All or partial escrowed to maturity and pre-refunded issues are secured by escrowed cash, a guaranteed investment contract and /or U.S. guaranteed obligations. |
| (hh) | When-issued security. |
| (t) | Represents zero coupon. Rate quoted represents effective yield at August 31, 2021. |
| (z) | Includes net unrealized appreciation/(depreciation) and/or market value of the below holdings which are excluded from the Schedule of Investments: |
Futures contracts outstanding at August 31, 2021:
| Number |
Type |
Expiration |
Current Notional Amount |
Value
/ | ||||||||||||
| Short Position: |
||||||||||||||||
| 30 |
20 Year U.S. Treasury Bonds | Dec. 2021 | $ | 4,889,063 | $ | 12,474 | ||||||||||
|
|
|
|||||||||||||||
Summary of Collateral for Centrally Cleared/Exchange-traded Derivatives:
Cash and securities segregated as collateral, including pending settlement for closed positions, to cover requirements for centrally cleared/exchange-traded derivatives are listed by broker as follows:
|
Broker |
Cash and/or Foreign Currency | Securities Market Value | ||||||||
| Citigroup Global Markets, Inc. |
$ | 270,000 | $ | — | ||||||
|
|
|
|
|
|||||||
See Notes to Financial Statements.
PGIM Muni High Income Fund 37
PGIM Muni High Income Fund
Schedule of Investments (continued)
as of August 31, 2021
Fair Value Measurements:
Various inputs are used in determining the value of the Fund’s investments. These inputs are summarized in the three broad levels listed below.
Level 1—unadjusted quoted prices generally in active markets for identical securities.
Level 2—quoted prices for similar securities, interest rates and yield curves, prepayment speeds, foreign currency exchange rates and other observable inputs.
Level 3—unobservable inputs for securities valued in accordance with Board approved fair valuation procedures.
The following is a summary of the inputs used as of August 31, 2021 in valuing such portfolio securities:
| Level 1 | Level 2 | Level 3 | ||||||||||
| Investments in Securities |
||||||||||||
| Assets |
||||||||||||
| Long-Term Investments |
||||||||||||
| Municipal Bonds |
||||||||||||
| Alabama |
$ | — | $ | 4,191,760 | $ | — | ||||||
| Alaska |
— | 8,940,848 | — | |||||||||
| Arizona |
— | 46,753,047 | — | |||||||||
| California |
— | 83,067,838 | — | |||||||||
| Colorado |
— | 37,341,232 | — | |||||||||
| Connecticut |
— | 3,509,810 | — | |||||||||
| Delaware |
— | 2,080,174 | — | |||||||||
| District of Columbia |
— | 21,078,998 | — | |||||||||
| Florida |
— | 106,251,687 | 483,800 | |||||||||
| Georgia |
— | 7,321,385 | — | |||||||||
| Guam |
— | 1,222,190 | — | |||||||||
| Hawaii |
— | 2,744,725 | — | |||||||||
| Illinois |
— | 143,837,349 | — | |||||||||
| Indiana |
— | 3,677,765 | — | |||||||||
| Iowa |
— | 3,469,997 | — | |||||||||
| Kansas |
— | 902,449 | — | |||||||||
| Kentucky |
— | 4,216,835 | — | |||||||||
| Louisiana |
— | 5,866,700 | — | |||||||||
| Maryland |
— | 3,845,403 | — | |||||||||
| Michigan |
— | 8,840,318 | — | |||||||||
| Minnesota |
— | 8,375,112 | — | |||||||||
| Mississippi |
— | 2,868,780 | — | |||||||||
| Missouri |
— | 21,583,420 | — | |||||||||
| Nebraska |
— | 1,474,370 | — | |||||||||
| Nevada |
— | 3,088,249 | — | |||||||||
| New Hampshire |
— | 2,145,900 | — | |||||||||
| New Jersey |
— | 85,372,601 | — | |||||||||
| New York |
— | 74,191,564 | — | |||||||||
| North Carolina |
— | 4,579,363 | — | |||||||||
| Ohio |
— | 51,237,530 | — | |||||||||
See Notes to Financial Statements.
38
PGIM Muni High Income Fund
Schedule of Investments (continued)
as of August 31, 2021
| Level 1 | Level 2 | Level 3 | ||||||||||
| Investments in Securities (continued) |
||||||||||||
| Assets (continued) |
||||||||||||
| Long-Term Investments (continued) |
||||||||||||
| Municipal Bonds (continued) |
||||||||||||
| Oklahoma |
$ | — | $ | 19,269,800 | $ | — | ||||||
| Oregon |
— | 8,295,097 | — | |||||||||
| Pennsylvania |
— | 40,515,691 | — | |||||||||
| Puerto Rico |
— | 76,557,363 | — | |||||||||
| Rhode Island |
— | 4,917,327 | — | |||||||||
| South Carolina |
— | 10,722,185 | — | |||||||||
| South Dakota |
— | 1,736,325 | — | |||||||||
| Tennessee |
— | 7,113,499 | — | |||||||||
| Texas |
— | 91,320,084 | — | |||||||||
| Utah |
— | 5,401,329 | — | |||||||||
| Virginia |
— | 15,497,662 | — | |||||||||
| Washington |
— | 16,254,071 | — | |||||||||
| West Virginia |
— | 1,815,712 | — | |||||||||
| Wisconsin |
— | 15,993,127 | — | |||||||||
|
|
|
|
|
|
|
|||||||
| Total |
$ | — | $ | 1,069,486,671 | $483,800 | |||||||
|
|
|
|
|
|
|
|||||||
| Other Financial Instruments* |
||||||||||||
| Assets |
||||||||||||
| Futures Contracts |
$ | 12,474 | $ | — | $ | — | ||||||
|
|
|
|
|
|
|
|||||||
| * | Other financial instruments are derivative instruments not reflected in the Schedule of Investments, such as futures, forwards and centrally cleared swap contracts, which are recorded at the unrealized appreciation (depreciation) on the instrument, and OTC swap contracts which are recorded at fair value. |
Sector Classification:
The sector classification of investments and liabilities in excess of other assets shown as a percentage of net assets as of August 31, 2021 were as follows (unaudited):
| Healthcare |
21.0 | % | ||
| Transportation |
12.9 | |||
| Corporate Backed IDB & PCR |
11.5 | |||
| Special Tax/Assessment District |
10.6 | |||
| General Obligation |
9.7 | |||
| Education |
8.8 | |||
| Tobacco Appropriated |
8.3 | |||
| Pre-pay Gas |
5.1 | |||
| Lease Backed Certificate of Participation |
4.2 | |||
| Pre-Refunded |
2.9 |
| Water & Sewer |
2.8 | % | ||
| Development |
1.3 | |||
| Power |
0.9 | |||
| Solid Waste/Resource Recovery |
0.6 | |||
|
|
|
|||
| 100.6 | ||||
| Liabilities in excess of other assets |
(0.6 | ) | ||
|
|
|
|||
| 100.0 | % | |||
|
|
|
See Notes to Financial Statements.
PGIM Muni High Income Fund 39
PGIM Muni High Income Fund
Schedule of Investments (continued)
as of August 31, 2021
Effects of Derivative Instruments on the Financial Statements and Primary Underlying Risk Exposure:
The Fund invested in derivative instruments during the reporting period. The primary type of risk associated with these derivative instruments is interest rate contracts risk. See the Notes to Financial Statements for additional detail regarding these derivative instruments and their risks. The effect of such derivative instruments on the Fund’s financial position and financial performance as reflected in the Statement of Assets and Liabilities and Statement of Operations is presented in the summary below.
Fair values of derivative instruments as of August 31, 2021 as presented in the Statement of Assets and Liabilities:
| Asset Derivatives | Liability Derivatives | |||||||||
| Derivatives not accounted for as hedging instruments, carried at fair value |
Statement of Assets and Liabilities Location |
Fair Value |
Statement of Assets and Liabilities Location |
Fair Value |
||||||
| Interest rate contracts |
Due from/to broker-variation margin futures |
$12,474* | — | $— | ||||||
|
|
|
|
||||||||
| * | Includes cumulative appreciation (depreciation) as reported in the schedule of open futures and centrally cleared swap contracts. Only unsettled variation margin receivable (payable) is reported within the Statement of Assets and Liabilities. |
The effects of derivative instruments on the Statement of Operations for the period ended August 31, 2021 are as follows:
| Amount of Realized Gain (Loss) on Derivatives Recognized in Income | ||
| Derivatives not accounted for as hedging |
Futures | |
| Interest rate contracts |
$(372,613) | |
|
| ||
| Change in Unrealized Appreciation (Depreciation) on Derivatives Recognized in Income | ||
| Derivatives not accounted for |
Futures | |
| Interest rate contracts |
$107,206 | |
|
| ||
See Notes to Financial Statements.
40
PGIM Muni High Income Fund
Schedule of Investments (continued)
as of August 31, 2021
For the period ended August 31, 2021, the Fund’s average volume of derivative activities is as follows:
|
Futures |
| $4,767,500 |
| (1) | Notional Amount in USD. |
Average volume is based on average period end balances as noted for the four months ended August 31, 2021.
See Notes to Financial Statements.
PGIM Muni High Income Fund 41
Statement of Assets and Liabilities
as of August 31, 2021
| Assets |
||||||
| Unaffiliated investments (cost $974,484,786) |
$ | 1,069,970,471 | ||||
| Cash |
4,623,912 | |||||
| Interest receivable |
9,907,585 | |||||
| Receivable for Fund shares sold |
1,727,688 | |||||
| Deposit with broker for centrally cleared/exchange-traded derivatives |
270,000 | |||||
| Due from broker—variation margin futures |
15,000 | |||||
| Prepaid expenses |
217 | |||||
|
|
|
|||||
| Total Assets |
1,086,514,873 | |||||
|
|
|
|||||
| Liabilities |
||||||
| Payable for investments purchased |
19,358,593 | |||||
| Payable for Fund shares purchased |
2,307,896 | |||||
| Management fee payable |
400,658 | |||||
| Dividends payable |
290,351 | |||||
| Distribution fee payable |
149,858 | |||||
| Accrued expenses and other liabilities |
134,374 | |||||
| Affiliated transfer agent fee payable |
10,421 | |||||
| Trustees’ fees payable |
2,933 | |||||
|
|
|
|||||
| Total Liabilities |
22,655,084 | |||||
|
|
|
|||||
| Net Assets |
$ | 1,063,859,789 | ||||
|
|
|
|||||
| Net assets were comprised of: |
||||||
| Shares of beneficial interest, at par |
$ | 981,155 | ||||
| Paid-in capital in excess of par |
988,460,401 | |||||
| Total distributable earnings (loss) |
74,418,233 | |||||
|
|
|
|||||
| Net assets, August 31, 2021 |
$ | 1,063,859,789 | ||||
|
|
|
|||||
See Notes to Financial Statements.
42
| Class A |
||||||||
| Net asset value and redemption price per share, ($447,158,337 ÷ 41,204,437 shares of beneficial interest issued and outstanding) |
$10.85 | |||||||
| Maximum sales charge (3.25% of offering price) |
0.36 | |||||||
|
|
|
|||||||
| Maximum offering price to public |
$11.21 | |||||||
|
|
|
|||||||
| Class C |
||||||||
| Net asset value, offering price and redemption price per share, ($64,345,802 ÷ 5,929,283 shares of beneficial interest issued and outstanding) |
$10.85 | |||||||
|
|
|
|||||||
| Class Z |
||||||||
| Net asset value, offering price and redemption price per share, ($512,346,793 ÷ 47,291,683 shares of beneficial interest issued and outstanding) |
$10.83 | |||||||
|
|
|
|||||||
| Class R6 |
||||||||
| Net asset value, offering price and redemption price per share, ($40,008,857 ÷ 3,690,074 shares of beneficial interest issued and outstanding) |
$10.84 | |||||||
|
|
|
|||||||
See Notes to Financial Statements.
PGIM Muni High Income Fund 43
Statements of Operations
| Four Months Ended August 31, 2021 |
Year Ended April 30, 2021 |
|||||||||||
| Net Investment Income (Loss) |
||||||||||||
| Interest income |
$ | 12,925,386 | $ | 36,714,556 | ||||||||
|
|
|
|
|
|||||||||
| Expenses |
||||||||||||
| Management fee |
1,701,161 | 4,385,105 | ||||||||||
| Distribution fee(a) |
588,940 | 1,738,753 | ||||||||||
| Transfer agent’s fees and expenses (including affiliated expense of $20,575 and $56,274, respectively)(a) |
232,276 | 570,732 | ||||||||||
| Registration fees(a) |
52,281 | 108,252 | ||||||||||
| Audit fee |
29,625 | 44,574 | ||||||||||
| Custodian and accounting fees |
28,425 | 96,852 | ||||||||||
| Shareholders’ reports |
15,473 | 28,740 | ||||||||||
| Legal fees and expenses |
13,089 | 32,027 | ||||||||||
| Trustees’ fees |
5,870 | 21,673 | ||||||||||
| Miscellaneous |
9,095 | 29,972 | ||||||||||
|
|
|
|
|
|||||||||
| Total expenses |
2,676,235 | 7,056,680 | ||||||||||
| Less: Fee waiver and/or expense reimbursement(a) |
(112,605 | ) | (243,407 | ) | ||||||||
| Custodian fee credit |
(56 | ) | (891 | ) | ||||||||
|
|
|
|
|
|||||||||
| Net expenses |
2,563,574 | 6,812,382 | ||||||||||
|
|
|
|
|
|||||||||
| Net investment income (loss) |
10,361,812 | 29,902,174 | ||||||||||
|
|
|
|
|
|||||||||
| Realized And Unrealized Gain (Loss) On Investments |
||||||||||||
| Net realized gain (loss) on: |
||||||||||||
| Investment transactions |
601,535 | (2,462,871 | ) | |||||||||
| Futures transactions |
(372,613 | ) | (558,728 | ) | ||||||||
|
|
|
|
|
|||||||||
| 228,922 | (3,021,599 | ) | ||||||||||
|
|
|
|
|
|||||||||
| Net change in unrealized appreciation (depreciation) on: |
||||||||||||
| Investments |
10,998,634 | 98,436,277 | ||||||||||
| Futures |
107,206 | 458,468 | ||||||||||
|
|
|
|
|
|||||||||
| 11,105,840 | 98,894,745 | |||||||||||
|
|
|
|
|
|||||||||
| Net gain (loss) on investment transactions |
11,334,762 | 95,873,146 | ||||||||||
|
|
|
|
|
|||||||||
| Net Increase (Decrease) In Net Assets Resulting From Operations |
$ | 21,696,574 | $ | 125,775,320 | ||||||||
|
|
|
|
|
|||||||||
| (a) | Class specific expenses and waivers were as follows: |
| Class A | Class B | Class C | Class Z | Class R6 | ||||||||||||||||
| Four Months Ended August 31, 2021 |
||||||||||||||||||||
| Distribution fee |
369,724 | — | 219,216 | — | — | |||||||||||||||
| Transfer agent’s fees and expenses |
82,080 | — | 11,709 | 138,418 | 69 | |||||||||||||||
| Registration fees |
12,629 | — | 9,349 | 22,475 | 7,828 | |||||||||||||||
| Fee waiver and/or expense reimbursement |
(39,049 | ) | — | (5,788 | ) | (56,780 | ) | (10,988 | ) | |||||||||||
See Notes to Financial Statements.
44
| Class A | Class B | Class C | Class Z | Class R6 | ||||||||||||||||
| Year Ended April 30, 2021 |
||||||||||||||||||||
| Distribution Fee |
977,035 | 3,462 | 758,256 | — | — | |||||||||||||||
| Transfer agent’s fees and expenses |
201,550 | 282 | 39,390 | 329,418 | 92 | |||||||||||||||
| Registration fees |
31,881 | 4,934 | 19,425 | 31,348 | 20,664 | |||||||||||||||
| Management fee waiver and/or expense reimbursement |
(94,627 | ) | (211 | ) | (18,359 | ) | (105,643 | ) | (24,567 | ) | ||||||||||
See Notes to Financial Statements.
PGIM Muni High Income Fund 45
Statements of Changes in Net Assets
| Four months ended August 31, 2021 |
Year Ended April 30, | ||||||||||||||
| 2021 | 2020 | ||||||||||||||
| Increase (Decrease) in Net Assets |
|||||||||||||||
| Operations |
|||||||||||||||
| Net investment income (loss) |
$ | 10,361,812 | $ | 29,902,174 | $ | 33,015,512 | |||||||||
| Net realized gain (loss) on investment transactions |
228,922 | (3,021,599 | ) | (1,263,035 | ) | ||||||||||
| Net change in unrealized appreciation (depreciation) on investments |
11,105,840 | 98,894,745 | (61,762,451 | ) | |||||||||||
|
|
|
|
|
|
|
||||||||||
| Net increase (decrease) in net assets resulting from operations |
21,696,574 | 125,775,320 | (30,009,974 | ) | |||||||||||
|
|
|
|
|
|
|
||||||||||
| Dividends and Distributions |
|||||||||||||||
| Distributions from distributable earnings |
|||||||||||||||
| Class A |
(4,272,756 | ) | (13,111,581 | ) | (13,324,426 | ) | |||||||||
| Class B |
— | (19,292 | ) | (349,176 | ) | ||||||||||
| Class C |
(462,713 | ) | (1,979,603 | ) | (2,711,864 | ) | |||||||||
| Class Z |
(5,196,105 | ) | (14,703,348 | ) | (16,504,120 | ) | |||||||||
| Class R6 |
(373,781 | ) | (566,593 | ) | (314,010 | ) | |||||||||
|
|
|
|
|
|
|
||||||||||
| (10,305,355 | ) | (30,380,417 | ) | (33,203,596 | ) | ||||||||||
|
|
|
|
|
|
|
||||||||||
| Fund share transactions (Net of share conversions) |
|||||||||||||||
| Net proceeds from shares sold |
89,878,439 | 271,561,788 | 249,540,688 | ||||||||||||
| Net asset value of shares issued in reinvestment of dividends and distributions |
8,988,702 | 26,485,180 | 28,995,090 | ||||||||||||
| Cost of shares purchased |
(43,183,177 | ) | (168,716,358 | ) | (307,205,741 | ) | |||||||||
|
|
|
|
|
|
|
||||||||||
| Net increase (decrease) in net assets from Fund share transactions |
55,683,964 | 129,330,610 | (28,669,963 | ) | |||||||||||
|
|
|
|
|
|
|
||||||||||
| Total increase (decrease) |
67,075,183 | 224,725,513 | (91,883,533 | ) | |||||||||||
| Net Assets: |
|||||||||||||||
| Beginning of period |
996,784,606 | 772,059,093 | 863,942,626 | ||||||||||||
|
|
|
|
|
|
|
||||||||||
| End of period |
$ | 1,063,859,789 | $ | 996,784,606 | $ | 772,059,093 | |||||||||
|
|
|
|
|
|
|
||||||||||
See Notes to Financial Statements.
46
Financial Highlights
| Class A Shares |
||||||||||||||||||||||||||||
|
Four months 2021 |
Year Ended April 30, | |||||||||||||||||||||||||||
| 2021 | 2020 | 2019 | 2018 | 2017 | ||||||||||||||||||||||||
|
Per Share Operating Performance(a): |
||||||||||||||||||||||||||||
|
Net Asset Value, Beginning of Period |
$10.73 | $9.58 | $10.28 | $10.12 | $10.12 | $10.45 | ||||||||||||||||||||||
|
Income (loss) from investment operations: |
||||||||||||||||||||||||||||
|
Net investment income (loss) |
0.11 | 0.34 | 0.38 | 0.39 | 0.39 | 0.41 | ||||||||||||||||||||||
| Net realized and unrealized gain (loss) on investment transactions | 0.12 | 1.16 | (0.70 | ) | 0.17 | 0.01 | (0.33 | ) | ||||||||||||||||||||
|
Total from investment operations |
0.23 | 1.50 | (0.32 | ) | 0.56 | 0.40 | 0.08 | |||||||||||||||||||||
|
Less Dividends and Distributions: |
||||||||||||||||||||||||||||
|
Dividends from net investment income |
(0.11 | ) | (0.35 | ) | (0.38 | ) | (0.40 | ) | (0.40 | ) | (0.41 | ) | ||||||||||||||||
|
Net asset value, end of period |
$10.85 | $10.73 | $9.58 | $10.28 | $10.12 | $10.12 | ||||||||||||||||||||||
|
Total Return(b): |
2.11 | % | 15.82 | % | (3.37 | )% | 5.67 | % | 3.99 | % | 0.73 | % | ||||||||||||||||
|
Ratios/Supplemental Data: |
||||||||||||||||||||||||||||
|
Net assets, end of period (000) |
$447,158 | $425,013 | $342,085 | $339,940 | $322,606 | $343,939 | ||||||||||||||||||||||
|
Average net assets (000) |
$438,859 | $390,814 | $367,591 | $323,381 | $337,410 | $387,190 | ||||||||||||||||||||||
|
Ratios to average net assets(c): |
||||||||||||||||||||||||||||
| Expenses after waivers and/or expense reimbursement | 0.80 | %(d) | 0.80 | % | 0.85 | % | 0.85 | % | 0.86 | % | 0.87 | % | ||||||||||||||||
| Expenses before waivers and/or expense reimbursement | 0.83 | %(d) | 0.82 | % | 0.85 | % | 0.85 | % | 0.86 | % | 0.87 | % | ||||||||||||||||
|
Net investment income (loss) |
2.91 | %(d) | 3.30 | % | 3.60 | % | 3.88 | % | 3.86 | % | 3.99 | % | ||||||||||||||||
|
Portfolio turnover rate(e)(f) |
7 | % | 25 | % | 53 | % | 54 | % | 36 | % | 39 | % | ||||||||||||||||
| (a) | Calculated based on average shares outstanding during the period. |
| (b) | Total return does not consider the effects of sales loads. Total return is calculated assuming a purchase of a share on the first day and a sale on the last day of each period reported and includes reinvestment of dividends and distributions, if any. Total returns may reflect adjustments to conform to GAAP. Total returns for periods less than one full year are not annualized. |
| (c) | Effective January 1, 2018, class specific expenses include transfer agent fees and expenses and registration fees, which are charged to their respective share class. |
| (d) | Annualized, with the exception of certain non-recurring expenses. |
| (e) | The Fund’s portfolio turnover rate is calculated in accordance with regulatory requirements, without regard to transactions involving short-term investments and certain derivatives. If such transactions were included, the Fund’s portfolio turnover rate may be higher. |
| (f) | The portfolio turnover rate includes variable rate demand notes. |
See Notes to Financial Statements.
PGIM Muni High Income Fund 47
Financial Highlights (continued)
| Class C Shares |
||||||||||||||||||||||||||||
|
Four months 2021 |
Year Ended April 30, | |||||||||||||||||||||||||||
| 2021 | 2020 | 2019 | 2018 | 2017 | ||||||||||||||||||||||||
|
Per Share Operating Performance(a): |
||||||||||||||||||||||||||||
|
Net Asset Value, Beginning of Period |
$10.73 | $9.58 | $10.28 | $10.12 | $10.12 | $10.45 | ||||||||||||||||||||||
|
Income (loss) from investment operations: |
||||||||||||||||||||||||||||
|
Net investment income (loss) |
0.08 | 0.27 | 0.30 | 0.31 | 0.32 | 0.33 | ||||||||||||||||||||||
| Net realized and unrealized gain (loss) on investment transactions | 0.12 | 1.15 | (0.70 | ) | 0.17 | - | (b) | (0.33 | ) | |||||||||||||||||||
|
Total from investment operations |
0.20 | 1.42 | (0.40 | ) | 0.48 | 0.32 | 0.00 | |||||||||||||||||||||
|
Less Dividends and Distributions: |
||||||||||||||||||||||||||||
|
Dividends from net investment income |
(0.08 | ) | (0.27 | ) | (0.30 | ) | (0.32 | ) | (0.32 | ) | (0.33 | ) | ||||||||||||||||
|
Net asset value, end of period |
$10.85 | $10.73 | $9.58 | $10.28 | $10.12 | $10.12 | ||||||||||||||||||||||
|
Total Return(c): |
1.84 | % | 14.94 | % | (4.09 | )% | 4.88 | % | 3.21 | % | 0.01 | % | ||||||||||||||||
|
Ratios/Supplemental Data: |
||||||||||||||||||||||||||||
|
Net assets, end of period (000) |
$64,346 | $65,412 | $79,180 | $95,749 | $110,077 | $119,937 | ||||||||||||||||||||||
|
Average net assets (000) |
$65,052 | $75,826 | $94,394 | $104,786 | $114,788 | $127,425 | ||||||||||||||||||||||
|
Ratios to average net assets(d): |
||||||||||||||||||||||||||||
| Expenses after waivers and/or expense reimbursement | 1.58 | %(e) | 1.57 | % | 1.60 | % | 1.60 | % | 1.62 | % | 1.62 | % | ||||||||||||||||
| Expenses before waivers and/or expense reimbursement | 1.61 | %(e) | 1.59 | % | 1.60 | % | 1.60 | % | 1.62 | % | 1.62 | % | ||||||||||||||||
|
Net investment income (loss) |
2.13 | %(e) | 2.56 | % | 2.85 | % | 3.10 | % | 3.11 | % | 3.24 | % | ||||||||||||||||
|
Portfolio turnover rate(f)(g) |
7 | % | 25 | % | 53 | % | 54 | % | 36 | % | 39 | % | ||||||||||||||||
| (a) | Calculated based on average shares outstanding during the period. |
| (b) | Amount rounds to zero. |
| (c) | Total return does not consider the effects of sales loads. Total return is calculated assuming a purchase of a share on the first day and a sale on the last day of each period reported and includes reinvestment of dividends and distributions, if any. Total returns may reflect adjustments to conform to GAAP. Total returns for periods less than one full year are not annualized. |
| (d) | Effective January 1, 2018, class specific expenses include transfer agent fees and expenses and registration fees, which are charged to their respective share class. |
| (e) | Annualized, with the exception of certain non-recurring expenses. |
| (f) | The Fund’s portfolio turnover rate is calculated in accordance with regulatory requirements, without regard to transactions involving short-term investments and certain derivatives. If such transactions were included, the Fund’s portfolio turnover rate may be higher. |
| (g) | The portfolio turnover rate includes variable rate demand notes. |
See Notes to Financial Statements.
48
| Class Z Shares |
||||||||||||||||||||||||||||
|
Four months 2021 |
Year Ended April 30, |
|||||||||||||||||||||||||||
| 2021 | 2020 | 2019 | 2018 | 2017 | ||||||||||||||||||||||||
|
Per Share Operating Performance(a): |
||||||||||||||||||||||||||||
|
Net Asset Value, Beginning of Period |
$10.71 | $9.57 | $10.26 | $10.10 | $10.11 | $10.44 | ||||||||||||||||||||||
|
Income (loss) from investment operations: |
||||||||||||||||||||||||||||
|
Net investment income (loss) |
0.11 | 0.37 | 0.40 | 0.41 | 0.42 | 0.44 | ||||||||||||||||||||||
| Net realized and unrealized gain (loss) on investment transactions | 0.12 | 1.14 | (0.69 | ) | 0.17 | - | (b) | (0.33 | ) | |||||||||||||||||||
|
Total from investment operations |
0.23 | 1.51 | (0.29 | ) | 0.58 | 0.42 | 0.11 | |||||||||||||||||||||
|
Less Dividends and Distributions: |
||||||||||||||||||||||||||||
|
Dividends from net investment income |
(0.11 | ) | (0.37 | ) | (0.40 | ) | (0.42 | ) | (0.43 | ) | (0.44 | ) | ||||||||||||||||
|
Net asset value, end of period |
$10.83 | $10.71 | $9.57 | $10.26 | $10.10 | $10.11 | ||||||||||||||||||||||
|
Total Return(c): |
2.19 | % | 15.98 | % | (3.06 | )% | 5.90 | % | 4.15 | % | 1.02 | % | ||||||||||||||||
|
Ratios/Supplemental Data: |
||||||||||||||||||||||||||||
|
Net assets, end of period (000) |
$512,347 | $482,104 | $337,094 | $404,188 | $375,466 | $336,781 | ||||||||||||||||||||||
|
Average net assets (000) |
$495,019 | $411,850 | $428,468 | $385,217 | $370,141 | $307,480 | ||||||||||||||||||||||
|
Ratios to average net assets(d): |
||||||||||||||||||||||||||||
| Expenses after waivers and/or expense reimbursement | 0.57 | %(e) | 0.58 | % | 0.62 | % | 0.63 | % | 0.62 | % | 0.62 | % | ||||||||||||||||
| Expenses before waivers and/or expense reimbursement | 0.60 | %(e) | 0.61 | % | 0.62 | % | 0.63 | % | 0.62 | % | 0.62 | % | ||||||||||||||||
|
Net investment income (loss) |
3.14 | %(e) | 3.52 | % | 3.83 | % | 4.08 | % | 4.11 | % | 4.24 | % | ||||||||||||||||
|
Portfolio turnover rate(f)(g) |
7 | % | 25 | % | 53 | % | 54 | % | 36 | % | 39 | % | ||||||||||||||||
| (a) | Calculated based on average shares outstanding during the period. |
| (b) | Amount rounds to zero. |
| (c) | Total return is calculated assuming a purchase of a share on the first day and a sale on the last day of each period reported and includes reinvestment of dividends and distributions, if any. Total returns may reflect adjustments to conform to GAAP. Total returns for periods less than one full year are not annualized. |
| (d) | Effective January 1, 2018, class specific expenses include transfer agent fees and expenses and registration fees, which are charged to their respective share class. |
| (e) | Annualized, with the exception of certain non-recurring expenses. |
| (f) | The Fund’s portfolio turnover rate is calculated in accordance with regulatory requirements, without regard to transactions involving short-term investments and certain derivatives. If such transactions were included, the Fund’s portfolio turnover rate may be higher. |
| (g) | The portfolio turnover rate includes variable rate demand notes. |
See Notes to Financial Statements.
PGIM Muni High Income Fund 49
Financial Highlights (continued)
| Class R6 Shares |
||||||||||||||||||||||||||||
|
Four months 2021 |
Year Ended April 30, | June 27, 2017(a) through April 30 2018 |
||||||||||||||||||||||||||
| 2021 | 2020 | 2019 | ||||||||||||||||||||||||||
|
Per Share Operating Performance(b): |
||||||||||||||||||||||||||||
|
Net Asset Value, Beginning of Period |
$10.72 | $9.57 | $10.27 | $10.11 | $10.23 | |||||||||||||||||||||||
|
Income (loss) from investment operations: |
||||||||||||||||||||||||||||
|
Net investment income (loss) |
0.12 | 0.37 | 0.40 | 0.42 | 0.36 | |||||||||||||||||||||||
| Net realized and unrealized gain (loss) on investment transactions | 0.12 | 1.16 | (0.70 | ) | 0.17 | (0.11 | ) | |||||||||||||||||||||
|
Total from investment operations |
0.24 | 1.53 | (0.30 | ) | 0.59 | 0.25 | ||||||||||||||||||||||
|
Less Dividends and Distributions: |
||||||||||||||||||||||||||||
|
Dividends from net investment income |
(0.12 | ) | (0.38 | ) | (0.40 | ) | (0.43 | ) | (0.37 | ) | ||||||||||||||||||
|
Net asset value, end of period |
$10.84 | $10.72 | $9.57 | $10.27 | $10.11 | |||||||||||||||||||||||
|
Total Return(c): |
2.22 | % | 16.19 | % | (3.13 | )% | 5.94 | % | 2.50 | % | ||||||||||||||||||
|
Ratios/Supplemental Data: |
||||||||||||||||||||||||||||
|
Net assets, end of period (000) |
$40,009 | $24,256 | $9,028 | $6,998 | $398 | |||||||||||||||||||||||
|
Average net assets (000) |
$34,742 | $15,737 | $8,116 | $4,932 | $53 | |||||||||||||||||||||||
|
Ratios to average net assets(d): |
||||||||||||||||||||||||||||
| Expenses after waivers and/or expense reimbursement | 0.48 | %(e) | 0.49 | % | 0.59 | % | 0.60 | % | 0.59 | %(f) | ||||||||||||||||||
| Expenses before waivers and/or expense reimbursement | 0.57 | %(e) | 0.65 | % | 0.73 | % | 0.89 | % | 25.88 | %(f) | ||||||||||||||||||
|
Net investment income (loss) |
3.22 | %(e) | 3.55 | % | 3.85 | % | 4.19 | % | 4.31 | %(f) | ||||||||||||||||||
|
Portfolio turnover rate(g)(h) |
7 | % | 25 | % | 53 | % | 54 | % | 36 | % | ||||||||||||||||||
| (a) | Commencement of offering. |
| (b) | Calculated based on average shares outstanding during the period. |
| (c) | Total return is calculated assuming a purchase of a share on the first day and a sale on the last day of each period reported and includes reinvestment of dividends and distributions, if any. Total returns may reflect adjustments to conform to GAAP. Total returns for periods less than one full year are not annualized. |
| (d) | Effective January 1, 2018, class specific expenses include transfer agent fees and expenses and registration fees, which are charged to their respective share class. |
| (e) | Annualized, with the exception of certain non-recurring expenses. |
| (f) | Annualized. |
| (g) | The Fund’s portfolio turnover rate is calculated in accordance with regulatory requirements, without regard to transactions involving short-term investments and certain derivatives. If such transactions were included, the Fund’s portfolio turnover rate may be higher. |
| (h) | The portfolio turnover rate includes variable rate demand notes. |
See Notes to Financial Statements.
50
Notes to Financial Statements
1. Organization
Prudential Investment Portfolios 4 (the “Trust”) is registered under the Investment Company Act of 1940, as amended (“1940 Act”), as an open-end management investment company. The Trust was organized as an unincorporated business trust in Massachusetts on November 3, 1986. PGIM Muni High Income Fund (the “Fund”) is the sole series of the Trust. The Fund is classified as a diversified fund for purposes of the 1940 Act.
The Fund’s fiscal and tax year changed from an annual reporting period that ends April 30 to one that ends August 31. This change is not expected to have any impact on the way the Fund is managed. Shareholders will receive future annual and semi-annual reports on the new fiscal year end schedule.
The investment objective of the Fund is to provide the maximum amount of income that is eligible for exclusion from federal income taxes.
2. Accounting Policies
The Fund follows the investment company accounting and reporting guidance of the Financial Accounting Standards Board (“FASB”) Accounting Standard Codification (“ASC”) Topic 946 Financial Services — Investment Companies. The following is a summary of significant accounting policies followed by the Fund in the preparation of its financial statements. The policies conform to U.S. generally accepted accounting principles (“GAAP”). The Fund consistently follows such policies in the preparation of its financial statements.
Securities Valuation: The Fund holds securities and other assets and liabilities that are fair valued as of the close of each day (generally, 4:00 PM Eastern time) the New York Stock Exchange (“NYSE”) is open for trading. As described in further detail below, the Fund’s investments are valued daily based on a number of factors, including the type of investment and whether market quotations are readily available. The Trust’s Board of Trustees (the “Board”) has adopted valuation procedures for security valuation under which fair valuation responsibilities have been delegated to PGIM Investments LLC (“PGIM Investments” or the “Manager”). Pursuant to the Board’s delegation, the Manager has established a Valuation Committee responsible for supervising the fair valuation of portfolio securities and other assets and liabilities. The valuation procedures permit the Fund to utilize independent pricing vendor services, quotations from market makers, and alternative valuation methods when market quotations are either not readily available or not deemed representative of fair value. Fair value is the price that would be received to sell an asset or paid to transfer a liability in an orderly transaction between market participants on the measurement date. A record of the Valuation Committee’s actions is subject to the Board’s review at its first quarterly meeting following the quarter in which such actions take place.
PGIM Muni High Income Fund 51
Notes to Financial Statements (continued)
For the fiscal reporting year-end, securities and other assets and liabilities were fair valued at the close of the last U.S. business day. Trading in certain foreign securities may occur when the NYSE is closed (including weekends and holidays). Because such foreign securities trade in markets that are open on weekends and U.S. holidays, the values of some of the Fund’s foreign investments may change on days when investors cannot purchase or redeem Fund shares.
Various inputs determine how the Fund’s investments are valued, all of which are categorized according to the three broad levels (Level 1, 2, or 3) detailed in the Schedule of Investments and referred to herein as the “fair value hierarchy” in accordance with FASB ASC Topic 820 - Fair Value Measurements and Disclosures.
Common or preferred stocks, exchange-traded funds and derivative instruments, if applicable, that are traded on a national securities exchange are valued at the last sale price as of the close of trading on the applicable exchange where the security principally trades. Securities traded via NASDAQ are valued at the NASDAQ official closing price. To the extent these securities are valued at the last sale price or NASDAQ official closing price, they are classified as Level 1 in the fair value hierarchy. In the event that no sale or official closing price on valuation date exists, these securities are generally valued at the mean between the last reported bid and ask prices, or at the last bid price in the absence of an ask price. These securities are classified as Level 2 in the fair value hierarchy.
Fixed income securities traded in the OTC market are generally classified as Level 2 in the fair value hierarchy. Such fixed income securities are typically valued using the market approach which generally involves obtaining data from an approved independent third-party vendor source. The Fund utilizes the market approach as the primary method to value securities when market prices of identical or comparable instruments are available. The third-party vendors’ valuation techniques used to derive the evaluated bid price are based on evaluating observable inputs, including but not limited to, yield curves, yield spreads, credit ratings, deal terms, tranche level attributes, default rates, cash flows, prepayment speeds, broker/dealer quotations and reported trades. Certain Level 3 securities are also valued using the market approach when obtaining a single broker quote or when utilizing transaction prices for identical securities that have been used in excess of five business days. During the reporting period, there were no changes to report with respect to the valuation approach and/or valuation techniques discussed above.
Securities and other assets that cannot be priced according to the methods described above are valued based on pricing methodologies approved by the Board. In the event that unobservable inputs are used when determining such valuations, the securities will be classified as Level 3 in the fair value hierarchy. Altering one or more unobservable inputs may result in a significant change to a Level 3 security’s fair value measurement.
52
When determining the fair value of securities, some of the factors influencing the valuation include: the nature of any restrictions on disposition of the securities; assessment of the general liquidity of the securities; the issuer’s financial condition and the markets in which it does business; the cost of the investment; the size of the holding and the capitalization of the issuer; the prices of any recent transactions or bids/offers for such securities or any comparable securities; any available analyst media or other reports or information deemed reliable by the Manager regarding the issuer or the markets or industry in which it operates. Using fair value to price securities may result in a value that is different from a security’s most recent closing price and from the price used by other unaffiliated mutual funds to calculate their net asset values.
Financial Futures Contracts: A financial futures contract is an agreement to purchase (long) or sell (short) an agreed amount of securities at a set price for delivery on a future date. Upon entering into a financial futures contract, the Fund is required to pledge to the broker an amount of cash and/or other assets equal to a certain percentage of the contract amount. This amount is known as the “initial margin.” Subsequent payments, known as “variation margin,” are made or received by the Fund each day, depending on the daily fluctuations in the value of the underlying security. Such variation margin is recorded for financial statement purposes on a daily basis as unrealized gain (loss). When the contract expires or is closed, the gain (loss) is realized and is presented in the Statement of Operations as net realized gain (loss) on futures transactions.
The Fund invested in financial futures contracts in order to hedge its existing portfolio securities, or securities the Fund intends to purchase, against fluctuations in value caused by changes in prevailing interest rates. Should interest rates move unexpectedly, the Fund may not achieve the anticipated benefits of the financial futures contracts and may realize a loss. The use of futures transactions involves the risk of imperfect correlation in movements in the price of futures contracts, interest rates and the underlying hedged assets. Since futures contracts are exchange-traded, there is minimal counterparty credit risk to the Fund since the exchanges’ clearinghouse acts as counterparty to all exchange-traded futures and guarantees the futures contracts against default.
Delayed-Delivery Transactions: The Fund purchased or sold securities on a when-issued or delayed-delivery and forward commitment basis. These transactions involve a commitment by the Fund to purchase or sell securities for a predetermined price or yield, with payment and delivery taking place beyond the customary settlement period. When delayed-delivery purchases are outstanding, the Fund will set aside and maintain an amount of liquid assets sufficient to meet the purchase price in a segregated account until the settlement date. When purchasing a security on a delayed-delivery basis, the Fund assumes the rights and risks of ownership of the security, including the risk of price and yield fluctuations, and takes such fluctuations into account when determining its net asset value. The Fund may dispose of or renegotiate a delayed-delivery transaction subsequent to establishment, and may sell when-issued securities before they are delivered, which may result in a realized gain (loss). When selling a security on a delayed-delivery basis, the Fund forfeits its eligibility to realize future gains (losses) with respect to the security.
PGIM Muni High Income Fund 53
Notes to Financial Statements (continued)
Securities Transactions and Net Investment Income: Securities transactions are recorded on the trade date. Realized gains (losses) from investment and currency transactions are calculated on the specific identification method. Dividend income is recorded on the ex-date, or for certain foreign securities, when the Fund becomes aware of such dividends. Interest income, including amortization of premium and accretion of discount on debt securities, as required, is recorded on the accrual basis. Expenses are recorded on an accrual basis, which may require the use of certain estimates by management that may differ from actual. Net investment income or loss (other than class specific expenses and waivers, which are allocated as noted below) and unrealized and realized gains (losses) are allocated daily to each class of shares based upon the relative proportion of adjusted net assets of each class at the beginning of the day. Class specific expenses and waivers, where applicable, are charged to the respective share classes. Such class specific expenses and waivers include distribution fees and distribution fee waivers, shareholder servicing fees, transfer agent’s fees and expenses, registration fees and fee waivers and/or expense reimbursements, as applicable.
Taxes: It is the Fund’s policy to continue to meet the requirements of the Internal Revenue Code applicable to regulated investment companies and to distribute all of its taxable net investment income and capital gains, if any, to its shareholders. Therefore, no federal income tax provision is required. Withholding taxes on foreign dividends, interest and capital gains, if any, are recorded, net of reclaimable amounts, at the time the related income is earned.
Custody Fee Credits: The Fund has an arrangement with its custodian bank, whereby uninvested monies earn credits which reduce the fees charged by the custodian. Such custody fee credits, if any, are presented as a reduction of gross expenses in the accompanying Statement of Operations.
Dividends and Distributions: The Fund expects to declare dividends of its net investment income daily and pay such dividends monthly. Distributions of net realized capital gains, if any, are declared and paid at least annually. Dividends and distributions to shareholders, which are determined in accordance with federal income tax regulations and which may differ from GAAP, are recorded on the ex-date. Permanent book/tax differences relating to income and gain (loss) are reclassified between total distributable earnings (loss) and paid-in capital in excess of par, as appropriate.
Estimates: The preparation of financial statements requires management to make estimates and assumptions that affect the reported amounts and disclosures in the financial statements. Actual results could differ from those estimates.
54
3. Agreements
The Trust, on behalf of the Fund, has a management agreement with the Manager. Pursuant to this agreement, the Manager has responsibility for all investment advisory services and supervises the subadviser’s performance of such services.
The Manager has entered into a subadvisory agreement with PGIM, Inc. (the “subadviser”), which provides subadvisory services to the Fund through its PGIM Fixed Income unit. The Manager pays for the services of PGIM, Inc.
The management fee paid to the Manager is accrued daily and payable monthly at an annual rate of 0.49% of the Fund’s average daily net assets up to $1 billion and 0.44% of the average daily net assets in excess of $1 billion. The effective management fee rate before any waivers and/or expense reimbursements was 0.49% for the reporting period ended August 31, 2021.
The Manager has contractually agreed, through December 31, 2022, to limit total annual operating expenses after fee waivers and/or expense reimbursements to 0.58% of average daily net assets for Class Z shares and 0.49% of average daily net assets for Class R6 shares. This contractual waiver excludes interest, brokerage, taxes (such as income and foreign withholding taxes, stamp duty and deferred tax expenses), acquired fund fees and expenses, extraordinary expenses, and certain other Fund expenses such as dividend and interest expense and broker charges on short sales.
Where applicable, the Manager agrees to waive management fees or shared operating expenses on any share class to the same extent that it waives such expenses on any other share class. In addition, total annual operating expenses for Class R6 shares will not exceed total annual operating expenses for Class Z shares. Fees and/or expenses waived and/or reimbursed by the Manager may be recouped by the Manager within the same fiscal year during which such waiver and/or reimbursement is made if such recoupment can be realized without exceeding the expense limit in effect at the time of the recoupment for that fiscal year.
The Trust, on behalf of the Fund, has a distribution agreement with Prudential Investment Management Services LLC (“PIMS”), which acts as the distributor of the Class A, Class C, Class Z and Class R6 shares of the Fund. The Fund compensates PIMS for distributing and servicing the Fund’s Class A and Class C shares, pursuant to the plans of distribution (the “Distribution Plans”), regardless of expenses actually incurred by PIMS.
Pursuant to the Distribution Plans, the Fund compensates PIMS for distribution related activities at an annual rate of up to 0.25% and 1% of the average daily net assets of the Class A and Class C shares, respectively. The distribution fees are accrued daily and payable monthly. No distribution or service fees are paid to PIMS as distributor of the Class Z or Class R6 shares of the Fund.
PGIM Muni High Income Fund 55
Notes to Financial Statements (continued)
For the reporting period ended August 31, 2021, PIMS received $113,559 in front-end sales charges resulting from sales of Class A shares. Additionally, for the reporting period ended August 31, 2021, PIMS received $3,205 and $606 in contingent deferred sales charges imposed upon redemptions by certain Class A and Class C shareholders, respectively. From these fees, PIMS paid such sales charges to broker-dealers, who in turn paid commissions to salespersons and incurred other distribution costs.
PGIM Investments, PGIM, Inc. and PIMS are indirect, wholly-owned subsidiaries of Prudential Financial, Inc. (“Prudential”).
4. Other Transactions with Affiliates
Prudential Mutual Fund Services LLC (“PMFS”), an affiliate of PGIM Investments and an indirect, wholly-owned subsidiary of Prudential, serves as the Trust’s transfer agent. Transfer agent’s fees and expenses in the Statement of Operations include certain out-of-pocket expenses paid to non-affiliates, where applicable.
The Fund may enter into certain securities purchase or sale transactions under Board approved Rule 17a-7 procedures. Rule 17a-7 is an exemptive rule under the 1940 Act, that subject to certain conditions, permits purchase and sale transactions among affiliated investment companies, or between an investment company and a person that is affiliated solely by reason of having a common (or affiliated) investment adviser, common directors/trustees, and/or common officers.
For the reporting period ended August 31, 2021, the Fund’s purchase and sales transactions under Rule 17a-7 and realized gain (loss) as a result of 17a-7 sales transactions were as follows:
| Purchases | Sales | Realized Gain (Loss) | ||||
| $18,875,110 | $ | 17,695,126 | $— | |||
5. Portfolio Securities
The aggregate cost of purchases and proceeds from sales of portfolio securities (excluding short-term investments and U.S. Government securities) for the reporting period ended August 31, 2021, were $140,600,325 and $74,263,126, respectively.
6. Distributions and Tax Information
Distributions to shareholders, which are determined in accordance with federal income tax regulations and which may differ from GAAP, are recorded on the ex-date.
56
For the four months ended August 31, 2021, the tax character of dividends paid by the Fund was $10,305,355 of tax-exempt income. For the year ended April 30, 2021, the tax character of dividends paid by the Fund were $635,413 of ordinary income and $29,745,004 of tax-exempt income. For the year ended April 30, 2020, the tax character of dividends paid by the Fund were $376,976 of ordinary income and $32,826,620 of tax-exempt income.
As of August 31, 2021, the accumulated undistributed earnings on a tax basis was $9,103,157 of tax-exempt income (includes timing difference of $290,350 for dividends payable).
The United States federal income tax basis of the Fund’s investments and the net unrealized appreciation as of August 31, 2021 were as follows:
| Tax Basis | Gross Unrealized Appreciation |
Gross Unrealized Depreciation |
Net Unrealized Appreciation | |||
| $975,698,327 |
$98,789,911 | $(4,505,293) | $94,284,618 | |||
The difference between GAAP and tax basis was primarily due to the difference between financial and tax reporting with respect to accretion of market discount, futures and defaulted securities.
For federal income tax purposes, the Fund had a capital loss carryforward as of August 31, 2021 of approximately $28,679,000 which can be carried forward for an unlimited period. The Fund utilized approximately $336,000 of its capital loss carryforward to offset net taxable gains realized in the fiscal year ended August 31, 2021. No capital gains distributions are expected to be paid to shareholders until net gains have been realized in excess of such losses.
The Manager has analyzed the Fund’s tax positions taken on federal, state and local income tax returns for all open tax years and has concluded that no provision for income tax is required in the Fund’s financial statements for the current reporting period. Since tax authorities can examine previously filed tax returns, the Fund’s U.S. federal and state tax returns for each of the four fiscal years up to the most recent fiscal year ended August 31, 2021 are subject to such review.
7. Capital and Ownership
The Fund offers Class A, Class C, Class Z and Class R6 shares. Class A shares are sold with a maximum front-end sales charge of 3.25%. Investors who purchase $500,000 or more of Class A shares and sell those shares within 12 months of purchase are subject to a contingent deferred sales charge (“CDSC”) of 1.00% on sales although these purchases are not subject to a front-end sales charge. The Class A CDSC is waived for certain retirement and/or benefit plans. A special exchange privilege is also available for shareholders who qualified to purchase Class A shares at net asset value. Effective June 26, 2020, all of the
PGIM Muni High Income Fund 57
Notes to Financial Statements (continued)
issued and outstanding Class B shares of the Fund converted into Class A shares. Class C shares are sold with a CDSC of 1% on sales made within 12 months of purchase. Class C shares will automatically convert to Class A shares on a monthly basis approximately eight years (ten years prior to January 22, 2021) after purchase. Class Z and Class R6 shares are not subject to any sales or redemption charges and are available exclusively for sale to a limited group of investors.
Under certain circumstances, an exchange may be made from specified share classes of the Fund to one or more other share classes of the Fund as presented in the table of transactions in shares of beneficial interest, below.
The Fund is authorized to issue an unlimited number of shares of beneficial interest of each class at $0.01 par value currently divided into five classes, designated Class A, Class B, Class C, Class Z and Class R6. The Fund currently does not have any Class B shares outstanding.
As of August 31, 2021, Prudential, through its affiliated entities, including affiliated funds (if applicable), owned shares of the Fund as follows:
| Number of Shares |
Percentage of Outstanding Shares | |||
|
Class A |
399 | 0.1% | ||
|
Class R6 |
1,153 | 0.1% | ||
At the reporting period end, the number of shareholders holding greater than 5% of the Fund are as follows:
| Affiliated | Unaffiliated | |||||
|
Number of Shareholders |
Percentage of Outstanding Shares |
Number of Shareholders |
Percentage of Outstanding Shares | |||
|
— |
—% | 8 | 77.6% | |||
58
Transactions in shares of beneficial interest were as follows:
| Class A |
Shares | Amount | ||||||
| Four months ended August 31, 2021: |
||||||||
| Shares sold |
2,642,951 | $ | 28,684,130 | |||||
| Shares issued in reinvestment of dividends and distributions |
360,051 | 3,906,439 | ||||||
| Shares purchased |
(1,422,788 | ) | (15,446,207 | ) | ||||
|
|
|
|
|
|||||
| Net increase (decrease) in shares outstanding before conversion |
1,580,214 | 17,144,362 | ||||||
| Shares issued upon conversion from other share class(es) |
228,846 | 2,475,905 | ||||||
| Shares purchased upon conversion into other share class(es) |
(216,720 | ) | (2,351,705 | ) | ||||
|
|
|
|
|
|||||
| Net increase (decrease) in shares outstanding |
1,592,340 | $ | 17,268,562 | |||||
|
|
|
|
|
|||||
| Year ended April 30, 2021: |
||||||||
| Shares sold |
5,823,287 | $ | 60,999,987 | |||||
| Shares issued in reinvestment of dividends and distributions |
1,138,806 | 11,883,202 | ||||||
| Shares purchased |
(5,322,073 | ) | (55,567,636 | ) | ||||
|
|
|
|
|
|||||
| Net increase (decrease) in shares outstanding before conversion |
1,640,020 | 17,315,553 | ||||||
| Shares issued upon conversion from other share class(es) |
2,826,174 | 29,664,449 | ||||||
| Shares purchased upon conversion into other share class(es) |
(557,169 | ) | (5,831,711 | ) | ||||
|
|
|
|
|
|||||
| Net increase (decrease) in shares outstanding |
3,909,025 | $ | 41,148,291 | |||||
|
|
|
|
|
|||||
| Year ended April 30, 2020: |
||||||||
| Shares sold |
6,966,925 | $ | 72,822,730 | |||||
| Shares issued in reinvestment of dividends and distributions |
1,160,670 | 12,089,570 | ||||||
| Shares purchased |
(7,187,945 | ) | (73,188,834 | ) | ||||
|
|
|
|
|
|||||
| Net increase (decrease) in shares outstanding before conversion |
939,650 | 11,723,466 | ||||||
| Shares issued upon conversion from other share class(es) |
2,357,319 | 24,636,901 | ||||||
| Shares reacquired upon conversion into other share class(es) |
(669,485 | ) | (6,978,543 | ) | ||||
|
|
|
|
|
|||||
| Net increase (decrease) in shares outstanding |
2,627,484 | $ | 29,381,824 | |||||
|
|
|
|
|
|||||
| Class B |
||||||||
| Period ended June 26, 2020*: |
||||||||
| Shares sold |
7,559 | $ | 76,704 | |||||
| Shares issued in reinvestment of dividends and distributions |
1,227 | 12,148 | ||||||
| Shares purchased |
(7,261 | ) | (66,309 | ) | ||||
|
|
|
|
|
|||||
| Net increase (decrease) in shares outstanding before conversion |
1,525 | 22,543 | ||||||
| Shares purchased upon conversion into other share class(es) |
(489,105 | ) | (4,962,326 | ) | ||||
|
|
|
|
|
|||||
| Net increase (decrease) in shares outstanding |
(487,580 | ) | $ | (4,939,783 | ) | |||
|
|
|
|
|
|||||
| Year ended April 30, 2020: |
||||||||
| Shares sold |
36,988 | $ | 387,083 | |||||
| Shares issued in reinvestment of dividends and distributions |
29,853 | 311,712 | ||||||
| Shares purchased |
(225,500 | ) | (2,351,614 | ) | ||||
|
|
|
|
|
|||||
| Net increase (decrease) in shares outstanding before conversion |
(158,659 | ) | (1,652,819 | ) | ||||
| Shares reacquired upon conversion into other share class(es) |
(1,014,073 | ) | (10,582,134 | ) | ||||
|
|
|
|
|
|||||
| Net increase (decrease) in shares outstanding |
(1,172,732 | ) | $ | (12,234,953 | ) | |||
|
|
|
|
|
|||||
PGIM Muni High Income Fund 59
Notes to Financial Statements (continued)
| Class C |
Shares | Amount | ||||||
| Four months ended August 31, 2021: |
||||||||
| Shares sold |
147,373 | $ | 1,596,362 | |||||
| Shares issued in reinvestment of dividends and distributions |
39,299 | 426,349 | ||||||
| Shares purchased |
(168,314 | ) | (1,823,714 | ) | ||||
|
|
|
|
|
|||||
| Net increase (decrease) in shares outstanding before conversion |
18,358 | 198,997 | ||||||
| Shares purchased upon conversion into other share class(es) |
(185,647 | ) | (2,010,933 | ) | ||||
|
|
|
|
|
|||||
| Net increase (decrease) in shares outstanding |
(167,289 | ) | $ | (1,811,936 | ) | |||
|
|
|
|
|
|||||
| Year ended April 30, 2021: |
||||||||
| Shares sold |
919,757 | $ | 9,614,055 | |||||
| Shares issued in reinvestment of dividends and distributions |
173,396 | 1,805,779 | ||||||
| Shares purchased |
(959,145 | ) | (9,922,101 | ) | ||||
|
|
|
|
|
|||||
| Net increase (decrease) in shares outstanding before conversion |
134,008 | 1,497,733 | ||||||
| Shares purchased upon conversion into other share class(es) |
(2,300,709 | ) | (24,348,365 | ) | ||||
|
|
|
|
|
|||||
| Net increase (decrease) in shares outstanding |
(2,166,701 | ) | $ | (22,850,632 | ) | |||
|
|
|
|
|
|||||
| Year ended April 30, 2020: |
||||||||
| Shares sold |
1,761,291 | $ | 18,490,403 | |||||
| Shares issued in reinvestment of dividends and distributions |
222,321 | 2,317,165 | ||||||
| Shares purchased |
(1,734,393 | ) | (17,683,469 | ) | ||||
|
|
|
|
|
|||||
| Net increase (decrease) in shares outstanding before conversion |
249,219 | 3,124,099 | ||||||
| Shares reacquired upon conversion into other share class(es) |
(1,301,545 | ) | (13,604,826 | ) | ||||
|
|
|
|
|
|||||
| Net increase (decrease) in shares outstanding |
(1,052,326 | ) | $ | (10,480,727 | ) | |||
|
|
|
|
|
|||||
| Class Z |
||||||||
| Four months ended August 31, 2021: |
||||||||
| Shares sold |
4,880,484 | $ | 52,880,900 | |||||
| Shares issued in reinvestment of dividends and distributions |
395,384 | 4,282,133 | ||||||
| Shares purchased |
(2,206,804 | ) | (23,892,642 | ) | ||||
|
|
|
|
|
|||||
| Net increase (decrease) in shares outstanding before conversion |
3,069,064 | 33,270,391 | ||||||
| Shares issued upon conversion from other share class(es) |
237,134 | 2,569,253 | ||||||
| Shares purchased upon conversion into other share class(es) |
(1,024,242 | ) | (11,005,195 | ) | ||||
|
|
|
|
|
|||||
| Net increase (decrease) in shares outstanding |
2,281,956 | $ | 24,834,449 | |||||
|
|
|
|
|
|||||
| Year ended April 30, 2021: |
||||||||
| Shares sold |
17,811,968 | $ | 185,209,335 | |||||
| Shares issued in reinvestment of dividends and distributions |
1,172,272 | 12,217,461 | ||||||
| Shares purchased |
(9,709,056 | ) | (100,428,422 | ) | ||||
|
|
|
|
|
|||||
| Net increase (decrease) in shares outstanding before conversion |
9,275,184 | 96,998,374 | ||||||
| Shares issued upon conversion from other share class(es) |
726,989 | 7,592,775 | ||||||
| Shares purchased upon conversion into other share class(es) |
(233,787 | ) | (2,431,634 | ) | ||||
|
|
|
|
|
|||||
| Net increase (decrease) in shares outstanding |
9,768,386 | $ | 102,159,515 | |||||
|
|
|
|
|
|||||
| Year ended April 30, 2020: |
||||||||
| Shares sold |
14,614,488 | $ | 152,645,619 | |||||
| Shares issued in reinvestment of dividends and distributions |
1,340,546 | 13,962,639 | ||||||
| Shares purchased |
(20,718,413 | ) | (211,069,996 | ) | ||||
|
|
|
|
|
|||||
| Net increase (decrease) in shares outstanding before conversion |
(4,763,379 | ) | (44,461,738 | ) | ||||
| Shares issued upon conversion from other share class(es) |
842,818 | 8,776,768 | ||||||
| Shares reacquired upon conversion into other share class(es) |
(232,443 | ) | (2,444,901 | ) | ||||
|
|
|
|
|
|||||
| Net increase (decrease) in shares outstanding |
(4,153,004 | ) | $ | (38,129,871 | ) | |||
|
|
|
|
|
|||||
60
| Class R6 |
Shares | Amount | ||||||
| Four months ended August 31, 2021: |
||||||||
| Shares sold |
619,639 | $ | 6,717,047 | |||||
| Shares issued in reinvestment of dividends and distributions |
34,468 | 373,781 | ||||||
| Shares purchased |
(186,890 | ) | (2,020,614 | ) | ||||
|
|
|
|
|
|||||
| Net increase (decrease) in shares outstanding before conversion |
467,217 | 5,070,214 | ||||||
| Shares issued upon conversion from other share class(es) |
960,036 | 10,322,675 | ||||||
|
|
|
|
|
|||||
| Net increase (decrease) in shares outstanding |
1,427,253 | $ | 15,392,889 | |||||
|
|
|
|
|
|||||
| Year ended April 30, 2021: |
||||||||
| Shares sold |
1,498,597 | $ | 15,661,707 | |||||
| Shares issued in reinvestment of dividends and distributions |
54,109 | 566,590 | ||||||
| Shares purchased |
(262,967 | ) | (2,731,890 | ) | ||||
|
|
|
|
|
|||||
| Net increase (decrease) in shares outstanding before conversion |
1,289,739 | 13,496,407 | ||||||
| Shares issued upon conversion from other share class(es) |
29,996 | 316,812 | ||||||
|
|
|
|
|
|||||
| Net increase (decrease) in shares outstanding |
1,319,735 | $ | 13,813,219 | |||||
|
|
|
|
|
|||||
| Year ended April 30, 2020: |
||||||||
| Shares sold |
501,516 | $ | 5,194,853 | |||||
| Shares issued in reinvestment of dividends and distributions |
30,222 | 314,004 | ||||||
| Shares purchased |
(288,785 | ) | (2,911,828 | ) | ||||
|
|
|
|
|
|||||
| Net increase (decrease) in shares outstanding before conversion |
242,953 | 2,597,029 | ||||||
| Shares issued upon conversion from other share class(es) |
18,663 | 196,735 | ||||||
|
|
|
|
|
|||||
| Net increase (decrease) in shares outstanding |
261,616 | $ | 2,793,764 | |||||
|
|
|
|
|
|||||
| * | Effective June 26, 2020, all of the issued and outstanding Class B shares of the Fund converted into Class A shares. |
8. Borrowings
The Trust, on behalf of the Fund, along with other affiliated registered investment companies (the “Participating Funds”), is a party to a Syndicated Credit Agreement (“SCA”) with a group of banks. The purpose of the SCA is to provide an alternative source of temporary funding for capital share redemptions. The table below provides details of the SCA.
| SCA | ||
|
Term of Commitment |
10/2/2020 – 9/30/2021 | |
|
Total Commitment |
$ 1,200,000,000 | |
|
Annualized Commitment Fee on the Unused Portion of the SCA |
0.15% | |
|
Annualized Interest Rate on Borrowings |
1.30% plus the higher of (1) the effective federal funds rate, (2) the one-month LIBOR rate or (3) zero percent | |
Subsequent to the reporting period end, the SCA has been renewed and effective October 1, 2021 will provide a commitment of $1,200,000,000 through September 29, 2022. The commitment fee paid by the Participating Funds will continue to be .15% of the unused portion of the SCA. The interest on borrowings under the renewed SCA will be paid monthly and at a per annum interest rate of 1.20% plus the higher of (1) the effective federal funds rate, (2) the one-month LIBOR rate or (3) zero percent.
PGIM Muni High Income Fund 61
Notes to Financial Statements (continued)
Certain affiliated registered investment companies that are parties to the SCA include portfolios that are subject to a predetermined mathematical formula used to manage certain benefit guarantees offered under variable annuity contracts. The formula may result in large scale asset flows into and out of these portfolios. Consequently, these portfolios may be more likely to utilize the SCA for purposes of funding redemptions. It may be possible for those portfolios to fully exhaust the committed amount of the SCA, thereby requiring the Manager to allocate available funding per a Board-approved methodology designed to treat the Participating Funds in the SCA equitably.
The Fund did not utilize the SCA during the reporting period ended August 31, 2021.
9. Risks of Investing in the Fund
The Fund’s risks include, but are not limited to, some or all of the risks discussed below. For further information on the Fund’s risks, please refer to the Fund’s Prospectus and Statement of Additional Information .
Bond Obligations Risk: As with credit risk, market risk and interest rate risk, the Fund’s holdings, share price, yield and total return may fluctuate in response to bond market movements. The value of bonds may decline for issuer-related reasons, including management performance, financial leverage and reduced demand for the issuer’s goods and services. Certain types of fixed income obligations also may be subject to “call and redemption risk,” which is the risk that the issuer may call a bond held by the Fund for redemption before it matures and the Fund may lose income.
Credit Risk: This is the risk that the issuer, the guarantor or the insurer of a fixed income security, or the counterparty to a contract, may be unable or unwilling to make timely principal and interest payments, or to otherwise honor its obligations. Additionally, fixed income securities could lose value due to a loss of confidence in the ability of the issuer, guarantor, insurer or counterparty to pay back debt. The longer the maturity and the lower the credit quality of a bond, the more sensitive it is to credit risk.
Derivatives Risk: Derivatives involve special risks and costs and may result in losses to the Fund. The successful use of derivatives requires sophisticated management, and, to the extent that derivatives are used, the Fund will depend on the subadviser’s ability to analyze and manage derivative transactions. The prices of derivatives may move in unexpected ways, especially in abnormal market conditions. Some derivatives are “leveraged” and therefore may magnify or otherwise increase investment losses to the Fund. The Fund’s use of derivatives may also increase the amount of taxes payable by shareholders. Other risks arise from the potential inability to terminate or sell derivatives positions. A liquid secondary market may not always exist for the Fund’s derivatives positions. In fact, many OTC
62
derivative instruments will not have liquidity beyond the counterparty to the instrument. OTC derivative instruments also involve the risk that the other party will not meet its obligations to the Fund.
The U.S. Government and foreign governments have adopted (and may adopt further) regulations governing derivatives markets, including mandatory clearing of certain derivatives, margin and reporting requirements and risk exposure limitations. The ultimate impact of the regulations remains unclear. Additional regulation of derivatives may make derivatives more costly, limit their availability or utility, or otherwise adversely affect their performance or disrupt markets.
Economic and Market Events Risk: Events in the U.S. and global financial markets, including actions taken by the U.S. Federal Reserve or foreign central banks to stimulate or stabilize economic growth or the functioning of the securities markets, may at times result in unusually high market volatility, which could negatively impact performance. Relatively reduced liquidity in credit and fixed income markets could adversely affect issuers worldwide.
Increase in Expenses Risk: Your actual cost of investing in the Fund may be higher than the expenses shown in the expense table for a variety of reasons. For example, expense ratios may be higher than those shown if average net assets decrease. Net assets are more likely to decrease and Fund expense ratios are more likely to increase when markets are volatile. Active and frequent trading of Fund securities can increase expenses.
Interest Rate Risk: The value of your investment may go down when interest rates rise. A rise in rates tends to have a greater impact on the prices of longer term or duration debt securities. For example, a fixed income security with a duration of three years is expected to decrease in value by approximately 3% if interest rates increase by 1%. This is referred to as “duration risk.” When interest rates fall, the issuers of debt obligations may prepay principal more quickly than expected, and the Fund may be required to reinvest the proceeds at a lower interest rate. This is referred to as “prepayment risk.” When interest rates rise, debt obligations may be repaid more slowly than expected, and the value of the Fund’s holdings may fall sharply. This is referred to as “extension risk.” The Fund may lose money if short-term or long-term interest rates rise sharply or in a manner not anticipated by the subadviser.
Junk Bonds Risks: High-yield, high-risk bonds have predominantly speculative characteristics, including particularly high credit risk. Junk bonds tend to have lower market liquidity than higher-rated securities. The liquidity of particular issuers or industries within a particular investment category may shrink or disappear suddenly and without warning. The non-investment grade bond market can experience sudden and sharp price swings and become illiquid due to a variety of factors, including changes in economic forecasts, stock market activity, large sustained sales by major investors, a high profile default or a change in the market’s psychology.
PGIM Muni High Income Fund 63
Notes to Financial Statements (continued)
Large Shareholder and Large Scale Redemption Risk: Certain individuals, accounts, funds (including funds affiliated with the Manager) or institutions, including the Manager and its affiliates, may from time to time own or control a substantial amount of the Fund’s shares. There is no requirement that these entities maintain their investment in the Fund. There is a risk that such large shareholders or that the Fund’s shareholders generally may redeem all or a substantial portion of their investments in the Fund in a short period of time, which could have a significant negative impact on the Fund’s NAV, liquidity, and brokerage costs. Large redemptions could also result in tax consequences to shareholders and impact the Fund’s ability to implement its investment strategy. The Fund’s ability to pursue its investment objective after one or more large scale redemptions may be impaired and, as a result, the Fund may invest a larger portion of its assets in cash or cash equivalents.
LIBOR Risk: Many financial instruments use or may use a floating rate based on the London Interbank Offered Rate, or “LIBOR,” which is the offered rate for short-term Eurodollar deposits between major international banks. Over the course of the last several years, global regulators have indicated an intent to phase out the use of LIBOR and similar interbank offering rates (“IBORs”). There still remains uncertainty regarding the nature of any replacement rates for LIBOR and the other IBORs as well as around fallback approaches for instruments extending beyond the any phase-out of these reference rates. The lack of consensus around replacement rates and the uncertainty of the phase out of LIBOR and other IBORs may result in increased volatility in corporate or governmental debt, bank loans, derivatives and other instruments invested in by the Fund as well as loan facilities used by the Fund.
The potential effect of a transition away from LIBOR on the Fund or the financial instruments in which the Fund invests cannot yet be determined. The elimination of LIBOR or changes to other reference rates or any other changes or reforms to the determination or supervision of reference rates could have an adverse impact on the market for, or value of, any securities or payments linked to those reference rates, which may adversely affect the Fund’s performance and/or net asset value. Certain proposed replacement rates to LIBOR, such as the Secured Overnight Financing Rate (“SOFR”), are materially different from LIBOR, and changes in the applicable spread for instruments previously linked to LIBOR will need to be made in order for instruments to pay similar rates. Uncertainty and risk also remain regarding the willingness and ability of issuers and lenders to include revised provisions in new and existing contracts or instruments. Consequently, the transition away from LIBOR to other reference rates may lead to reduced coupons on debt held by the Fund, higher rates required to be paid by the Fund on bank lines of credit due to increases in spreads, increased volatility and illiquidity in markets that are tied to LIBOR, fluctuations in values of LIBOR-related investments or investments in issuers that utilize LIBOR, increased difficulty in borrowing or refinancing and diminished effectiveness of hedging strategies, adversely affecting the Fund’s performance. Furthermore, the risks associated with the expected
64
discontinuation of LIBOR and transition may be exacerbated if the work necessary to effect an orderly transition to an alternative reference rate is not completed in a timely manner. Because the usefulness of LIBOR and the other IBORs as benchmarks could deteriorate during the transition period, these effects could begin to be experienced by the end of 2021 and beyond until the anticipated discontinuance date in 2023 for the majority of the LIBOR rates.
Liquidity Risk: Liquidity risk is the risk that the Fund could not meet requests to redeem shares issued by the Fund without significant dilution of remaining investors’ interests in the Fund. The Fund may invest in instruments that trade in lower volumes and are more illiquid than other investments. If the Fund is forced to sell these investments to pay redemption proceeds or for other reasons, the Fund may lose money. In addition, when there is no willing buyer and investments cannot be readily sold at the desired time or price, the Fund may have to accept a lower price or may not be able to sell the instrument at all. An inability to sell a portfolio position can adversely affect the Fund’s value or prevent the Fund from being able to take advantage of other investment opportunities.
Management Risk: The value of your investment may decrease if judgments by the subadviser about the attractiveness, value or market trends affecting a particular security, industry or sector or about market movements are incorrect.
Market Disruption and Geopolitical Risks: International wars or conflicts and geopolitical developments in foreign countries, along with instability in regions such as Asia, Eastern Europe, and the Middle East, possible terrorist attacks in the United States or around the world, public health epidemics such as the outbreak of infectious diseases like the outbreak of COVID-19 globally in 2020 or the 2014–2016 outbreak in West Africa of the Ebola virus, and other similar events could adversely affect the U.S. and foreign financial markets, including increases in market volatility, reduced liquidity in the securities markets and government intervention, and may cause further long-term economic uncertainties in the United States and worldwide generally. The coronavirus pandemic and the related governmental and public responses have had and may continue to have an impact on the Fund’s investments and net asset value and have led and may continue to lead to increased market volatility and the potential for illiquidity in certain classes of securities and sectors of the market. Preventative or protective actions that governments may take in respect of pandemic or epidemic diseases may result in periods of business disruption, business closures, inability to obtain raw materials, supplies and component parts, and reduced or disrupted operations for the issuers in which the Fund invests. Government intervention in markets may impact interest rates, market volatility and security pricing. The occurrence, reoccurrence and pendency of such diseases could adversely affect the economies (including through changes in business activity and increased unemployment) and financial markets either in specific countries or worldwide.
Market Risk: Securities markets may be volatile and the market prices of the Fund’s securities may decline. Securities fluctuate in price based on changes in an issuer’s
PGIM Muni High Income Fund 65
Notes to Financial Statements (continued)
financial condition and overall market and economic conditions. If the market prices of the securities owned by the Fund fall, the value of your investment in the Fund will decline.
Municipal Bonds Risk: Municipal bonds are subject to credit risk, market risk and interest rate risk. The Fund’s holdings, share price, yield and total return may also fluctuate in response to municipal bond market movements. Municipal bonds are also subject to the risk that potential future legislative changes could affect the market for and value of municipal bonds, which may adversely affect the Fund’s yield or the value of the Fund’s investments in municipal bonds. Certain municipal bonds with principal and interest payments that are made from the revenues of a specific project or facility, and not general tax revenues, may have increased risks. Factors affecting the project or facility, such as local business or economic conditions, could have a significant effect on the project’s ability to make payments of principal and interest on these securities. Municipal securities of a particular state are vulnerable to events adversely affecting that state, including economic, political and regulatory occurrences, court decisions, terrorism, public health epidemics, social unrest and catastrophic natural disasters, such as hurricanes or earthquakes. Many municipal bonds are also subject to prepayment risk, which is the risk that when interest rates fall, issuers may redeem a security by repaying it early, which may reduce the Fund’s income if the proceeds are reinvested at a lower interest rate. In addition, income from municipal bonds could be declared taxable because of non-compliant conduct of a bond issuer.
10. Recent Accounting Pronouncement and Regulatory Developments
In March 2020, the FASB issued Accounting Standard Update (“ASU”) No. 2020-04, which provides optional guidance for applying GAAP to contract modifications, hedging relationships and other transactions affected by the reference rate reform if certain criteria are met. ASU 2020-04 is elective and is effective on March 12, 2020 through December 31, 2022. At this time, management is evaluating the implications of certain provisions of the ASU and any impact on the financial statement disclosures has not yet been determined.
On December 3, 2020, the SEC announced that it voted to adopt a new rule that establishes an updated regulatory framework for fund valuation practices (the “Rule”). The Rule, in part, provides (i) a framework for determining fair value in good faith and (ii) provides for a fund Board’s assignment of its responsibility for the execution of valuation-related activities to a fund’s investment adviser. Further, the SEC is rescinding previously issued guidance on related issues. The Rule took effect on March 8, 2021, with a compliance date of September 8, 2022. Management is currently evaluating the Rule and its impact to the Fund.
66
Report of Independent Registered Public Accounting Firm
To the Board of Trustees of Prudential Investment Portfolios 4 and Shareholders of PGIM Muni High Income Fund
Opinions on the Financial Statements
We have audited the accompanying statement of assets and liabilities, including the schedule of investments, of PGIM Muni High Income Fund (the “Fund”) as of August 31, 2021, the related statements of operations and changes in net assets for the period from May 1, 2021 through August 31, 2021 and the year ended April 30, 2021, including the related notes, and the financial highlights for the period from May 1, 2021 through August 31, 2021 and the year ended April 30, 2021 (collectively referred to as the “financial statements”). In our opinion, the financial statements present fairly, in all material respects, the financial position of the Fund as of August 31, 2021, and the results of its operations and changes in its net assets for the period from May 1, 2021 through August 31, 2021 and the year ended April 30, 2021, and the financial highlights for the period from May 1, 2021 through August 31, 2021 and the year ended April 30, 2021 in conformity with accounting principles generally accepted in the United States of America.
The financial statements of the Fund as of and for the year ended April 30, 2020 and the financial highlights for each of the periods ended on or prior to April 30, 2020 (not presented herein, other than the statement of changes in net assets and the financial highlights) were audited by other auditors whose report dated June 15, 2020 expressed an unqualified opinion on those financial statements and financial highlights.
Basis for Opinions
These financial statements are the responsibility of the Fund’s management. Our responsibility is to express an opinion on the Fund’s financial statements based on our audits. We are a public accounting firm registered with the Public Company Accounting Oversight Board (United States) (PCAOB) and are required to be independent with respect to the Fund in accordance with the U.S. federal securities laws and the applicable rules and regulations of the Securities and Exchange Commission and the PCAOB.
We conducted our audits of these financial statements in accordance with the standards of the PCAOB. Those standards require that we plan and perform the audit to obtain reasonable assurance about whether the financial statements are free of material misstatement, whether due to error or fraud.
Our audits included performing procedures to assess the risks of material misstatement of the financial statements, whether due to error or fraud, and performing procedures that respond to those risks. Such procedures included examining, on a test basis, evidence regarding the amounts and disclosures in the financial statements. Our audits also included evaluating the accounting principles used and significant estimates made by management, as well as evaluating the overall presentation of the financial statements. Our procedures included confirmation of securities owned as of August 31, 2021 by correspondence with the custodian, transfer agent and brokers; when replies were not received from brokers, we performed other auditing procedures. We believe that our audits provide a reasonable basis for our opinions.
/s/PricewaterhouseCoopers LLP
New York, New York
October 19, 2021
We have served as the auditor of one or more investment companies in the PGIM Retail Funds complex since 2020.
| PGIM Muni High Income Fund |
67 |
Fund Liquidity Risk Management Program (unaudited)
Consistent with Rule 22e-4 under the 1940 Act (the “Liquidity Rule”), the Fund has adopted and implemented a liquidity risk management program (the “LRMP”). The Fund’s LRMP seeks to assess and manage the Fund’s liquidity risk, which is defined as the risk that the Fund is unable to meet investor redemption requests without significantly diluting the remaining investors’ interests in the Fund. The Trust’s Board of Trustees (the “Board”) has approved PGIM Investments LLC (“PGIM Investments”), the Fund’s investment manager, to serve as the administrator of the Fund’s LRMP. As part of its responsibilities as administrator, PGIM Investments has retained a third party to perform certain functions, including providing market data and liquidity classification model information.
The Fund’s LRMP includes a number of processes designed to support the assessment and management of its liquidity risk. In particular, the Fund’s LRMP includes no less than annual assessments of factors that influence the Fund’s liquidity risk; no less than monthly classifications of the Fund’s investments into one of four liquidity classifications provided for in the Liquidity Rule; a 15% of net assets limit on the acquisition of “illiquid investments” (as defined under the Liquidity Rule); establishment of a minimum percentage of the Fund’s assets to be invested in investments classified as “highly liquid” (as defined under the Liquidity Rule) if the Fund does not invest primarily in highly liquid investments; and regular reporting to the Board.
At a meeting of the Board on March 2-5, 2021, PGIM Investments provided a written report (“LRMP Report”) to the Board addressing the operation, adequacy, and effectiveness of the Fund’s LRMP, including any material changes to the LRMP for the period from January 1, 2020 through December 31, 2020 (“Reporting Period”). The LRMP Report concluded that the Fund’s LRMP was reasonably designed to assess and manage the Fund’s liquidity risk and was adequately and effectively implemented during the Reporting Period. There were no material changes to the LRMP during the Reporting Period. The LRMP Report further concluded that the Fund’s investment strategies continue to be appropriate given the Fund’s status as an open-end fund.
There can be no assurance that the LRMP will achieve its objectives in the future. Additional information regarding risks of investing in the Fund including liquidity risks presented by the Fund’s investment portfolio, is found in the Fund’s Prospectus and Statement of Additional Information.
| 68 |
Tax Information (unaudited)
We are advising you that during the period ended August 31, 2021, the Fund designates the maximum amount allowable per share but not less than the following amounts as exempt-interest dividends in accordance with Section 852(b)(5) of the Internal Revenue Code.
| Per Share | ||||||||||||||||
| Class A | Class C | Class Z | Class R6 | |||||||||||||
| Tax-Exempt Dividends |
$ | 0.11 | $ | 0.08 | $ | 0.11 | $ | 0.12 | ||||||||
|
|
|
|
|
|
|
|
|
|||||||||
In January 2022, you will be advised on IRS Form 1099-DIV and/or 1099-INT, if applicable, or substitute forms as to the federal tax status of the dividends received in calendar year 2021.
For more detailed information regarding your state and local taxes, you should contact your tax adviser or the state/local taxing authorities.
| PGIM Muni High Income Fund |
69 |
INFORMATION ABOUT BOARD MEMBERS AND OFFICERS (unaudited)
Information about Board Members and Officers of the Fund is set forth below. Board Members who are not deemed to be “interested persons” of the Fund, as defined in the 1940 Act, are referred to as “Independent Board Members.” Board Members who are deemed to be “interested persons” of the Fund are referred to as “Interested Board Members.” The Board Members are responsible for the overall supervision of the operations of the Fund and perform the various duties imposed on the directors of investment companies by the 1940 Act. The Board in turn elects the Officers, who are responsible for administering the day-to-day operations of the Fund.
| Independent Board Members | ||||||
| Name Year of Birth Position(s) Portfolios Overseen |
Principal Occupation(s) During Past Five Years |
Other Directorships Held During Past Five Years |
Length of Board Service | |||
|
Ellen S. Alberding 1958 Board Member Portfolios Overseen: 98 |
President and Board Member, The Joyce Foundation (charitable foundation) (since 2002); formerly Vice Chair, City Colleges of Chicago (community college system) (2011-2015); Trustee, National Park Foundation (charitable foundation for national park system) (2009-2018); Trustee, Economic Club of Chicago (2009-2016); Trustee, Loyola University (since 2018).
|
None. | Since September 2013 | |||
|
Kevin J. Bannon 1952 Board Member Portfolios Overseen: 98 |
Retired; formerly Managing Director (April 2008-May 2015) and Chief Investment Officer (October 2008-November 2013) of Highmount Capital LLC (registered investment adviser); formerly Executive Vice President and Chief Investment Officer (April 1993-August 2007) of Bank of New York Company; President (May 2003-May 2007) of BNY Hamilton Family of Mutual Funds.
|
Director of Urstadt Biddle Properties (equity real estate investment trust) (since September 2008). | Since July 2008 | |||
PGIM Muni High Income Fund
| Independent Board Members | ||||||
| Name Year of Birth Position(s) Portfolios Overseen |
Principal Occupation(s) During Past Five Years |
Other Directorships Held During Past Five Years |
Length of Board Service | |||
| Linda W. Bynoe 1952 Board Member Portfolios Overseen: 95 |
President and Chief Executive Officer (since March 1995) and formerly Chief Operating Officer (December 1989-February 1995) of Telemat Limited LLC (formerly Telemat Ltd) (management consulting); formerly Vice President (January 1985-June 1989) at Morgan Stanley & Co. (broker-dealer).
|
Trustee of Equity Residential (residential real estate) (since December 2009); Director of Northern Trust Corporation (financial services) (since April 2006); formerly Director of Anixter International, Inc. (communication products distributor) (January 2006-June 2020). | Since March 2005 | |||
| Barry H. Evans 1960 Board Member Portfolios Overseen: 97 |
Retired; formerly President (2005-2016), Global Chief Operating Officer (2014-2016), Chief Investment Officer - Global Head of Fixed Income (1998-2014), and various portfolio manager roles (1986-2006), Manulife Asset Management (asset management). | Formerly Director, Manulife Trust Company (2011-2018); formerly Director, Manulife Asset Management Limited (2015-2017); formerly Chairman of the Board of Directors of Manulife Asset Management U.S. (2005-2016); formerly Chairman of the Board, Declaration Investment Management and Research (2008-2016).
|
Since September 2017 | |||
| Keith F. Hartstein 1956 Board Member & Independent Chair Portfolios Overseen: 98 |
Retired; Executive Committee of the Independent Directors Council (IDC) Board of Governors (since October 2019); Member (since November 2014) of the Governing Council of the IDC (organization of independent mutual fund directors); formerly President and Chief Executive Officer (2005-2012), Senior Vice President (2004-2005), Senior Vice President of Sales and Marketing (1997-2004), and various executive management positions (1990-1997), John Hancock Funds, LLC (asset management); Chairman, Investment Company Institute’s Sales Force Marketing Committee (2003-2008).
|
None. | Since September 2013 | |||
Visit our website at pgim.com/investments
| Independent Board Members | ||||||
| Name Year of Birth Position(s) Portfolios Overseen |
Principal Occupation(s) During Past Five Years |
Other Directorships Held During Past Five Years |
Length of Board Service | |||
|
Laurie Simon Hodrick 1962 Board Member Portfolios Overseen: 94 |
A. Barton Hepburn Professor Emerita of Economics in the Faculty of Business, Columbia Business School (since 2018); Visiting Fellow at the Hoover Institution, Stanford University (since 2015); Sole Member, ReidCourt LLC (since 2008) (a consulting firm); formerly Visiting Professor of Law, Stanford Law School (2015-2021); formerly A. Barton Hepburn Professor of Economics in the Faculty of Business, Columbia Business School (1996-2017); formerly Managing Director, Global Head of Alternative Investment Strategies, Deutsche Bank (2006-2008).
|
Independent Director, Roku (since December 2020) (communication services); formerly Independent Director, Synnex Corporation (2019-2021) (information technology); formerly Independent Director, Kabbage, Inc. (2018-2020) (financial services); formerly Independent Director, Corporate Capital Trust (2017-2018) (a business development company). | Since September 2017 | |||
|
Brian K. Reid 1961 Board Member Portfolios Overseen: 97 |
Retired; formerly Chief Economist for the Investment Company Institute (ICI) (2005-2017); formerly Senior Economist and Director of Industry and Financial Analysis at the ICI (1998-2004); formerly Senior Economist, Industry and Financial Analysis at the ICI (1996-1998); formerly Staff Economist at the Federal Reserve Board (1989-1996); Director, ICI Mutual Insurance Company (2012-2017).
|
None. | Since March 2018 | |||
PGIM Muni High Income Fund
| Independent Board Members | ||||||
| Name Year of Birth Position(s) Portfolios Overseen |
Principal Occupation(s) During Past Five Years |
Other Directorships Held During Past Five Years |
Length of Board Service | |||
|
Grace C. Torres 1959 Board Member Portfolios Overseen: 97 |
Retired; formerly Treasurer and Principal Financial and Accounting Officer of the PGIM Funds, Target Funds, Advanced Series Trust, Prudential Variable Contract Accounts and The Prudential Series Fund (1998-June 2014); Assistant Treasurer (March 1999-June 2014) and Senior Vice President (September 1999-June 2014) of PGIM Investments LLC; Assistant Treasurer (May 2003-June 2014) and Vice President (June 2005-June 2014) of AST Investment Services, Inc.; Senior Vice President and Assistant Treasurer (May 2003-June 2014) of Prudential Annuities Advisory Services, Inc.
|
Director (since January 2018) of OceanFirst Financial Corp. and OceanFirst Bank; formerly Director (July 2015-January 2018) of Sun Bancorp, Inc. N.A. and Sun National Bank. | Since November 2014 | |||
| Interested Board Members | ||||||
| Name Year of Birth Position(s) Portfolios Overseen |
Principal Occupation(s) During Past Five Years |
Other Directorships Held During Past Five Years |
Length of Board Service | |||
|
Stuart S. Parker 1962 Board Member & President Portfolios Overseen: 97 |
President, Chief Executive Officer, Chief Operating Officer and Officer in Charge of PGIM Investments LLC (formerly known as Prudential Investments LLC) (since January 2012); formerly Executive Vice President of Jennison Associates LLC and Head of Retail Distribution of PGIM Investments LLC (June 2005-December 2011); Investment Company Institute - Board of Governors (since May 2012).
|
None. | Since January 2012 | |||
Visit our website at pgim.com/investments
| Interested Board Members | ||||||
| Name Year of Birth Position(s) Portfolios Overseen |
Principal Occupation(s) During Past Five Years |
Other Directorships Held During Past Five Years |
Length of Board Service | |||
|
Scott E. Benjamin 1973 Board Member & Vice President Portfolios Overseen: 98 |
Executive Vice President (since May 2009) of PGIM Investments LLC; Vice President (since June 2012) of Prudential Investment Management Services LLC; Executive Vice President (since September 2009) of AST Investment Services, Inc.; Senior Vice President of Product Development and Marketing, PGIM Investments (since February 2006); formerly Vice President of Product Development and Product Management, PGIM Investments LLC (2003-2006).
|
None. | Since March 2010 | |||
| Fund Officers(a) | ||||
| Name Year of Birth Fund Position |
Principal Occupation(s) During Past Five Years | Length of Service as Fund Officer | ||
|
Claudia DiGiacomo 1974 Chief Legal Officer |
Chief Legal Officer, Executive Vice President and Secretary of PGIM Investments LLC (since August 2020); Chief Legal Officer of Prudential Mutual Fund Services LLC (since August 2020); Chief Legal Officer of PIFM Holdco, LLC (since August 2020); Vice President and Corporate Counsel (since January 2005) of Prudential; and Corporate Counsel of AST Investment Services, Inc. (since August 2020); formerly Vice President and Assistant Secretary of PGIM Investments LLC (2005-2020); formerly Associate at Sidley Austin Brown & Wood LLP (1999-2004).
|
Since December 2005 | ||
|
Dino Capasso 1974 Chief Compliance Officer |
Chief Compliance Officer (since July 2019) of PGIM Investments LLC; Chief Compliance Officer (since July 2019) of the PGIM Funds, Target Funds, Advanced Series Trust, The Prudential Series Fund, Prudential’s Gibraltar Fund, Inc., PGIM Global High Yield Fund, Inc., PGIM High Yield Bond Fund, Inc., and PGIM Short Duration High Yield Opportunities Fund; Vice President and Deputy Chief Compliance Officer (June 2017-2019) of PGIM Investments LLC; formerly Senior Vice President and Senior Counsel (January 2016-June 2017), and Vice President and Counsel (February 2012-December 2015) of Pacific Investment Management Company LLC.
|
Since July 2019 | ||
PGIM Muni High Income Fund
| Fund Officers(a) | ||||
| Name Year of Birth Fund Position |
Principal Occupation(s) During Past Five Years | Length of Service as Fund Officer | ||
|
Andrew R. French 1962 Secretary |
Vice President (since December 2018) of PGIM Investments LLC; formerly Vice President and Corporate Counsel (2010-2018) of Prudential; formerly Director and Corporate Counsel (2006-2010) of Prudential; Vice President and Assistant Secretary (since January 2007) of PGIM Investments LLC; Vice President and Assistant Secretary (since January 2007) of Prudential Mutual Fund Services LLC. | Since October 2006 | ||
|
Diana N. Huffman 1982 Assistant Secretary |
Vice President and Corporate Counsel (since September 2015) of Prudential; Vice President and Assistant Secretary (since August 2020) of PGIM Investments LLC; formerly Associate at Willkie Farr & Gallagher LLP (2009-2015). | Since March 2019 | ||
|
Melissa Gonzalez 1980 Assistant Secretary |
Vice President and Corporate Counsel (since September 2018) of Prudential; Vice President and Assistant Secretary (since August 2020) of PGIM Investments LLC; formerly Director and Corporate Counsel (March 2014-September 2018) of Prudential. | Since March 2020 | ||
|
Patrick E. McGuinness 1986 Assistant Secretary |
Vice President and Assistant Secretary (since August 2020) of PGIM Investments LLC; Director and Corporate Counsel (since February 2017) of Prudential; and Corporate Counsel (2012-2017) of IIL, Inc. | Since June 2020 | ||
|
Debra Rubano 1975 Assistant Secretary |
Vice President and Corporate Counsel (since November 2020) of Prudential; formerly Director and Senior Counsel of Allianz Global Investors U.S. Holdings LLC (2010-2020) and Assistant Secretary of numerous funds in the Allianz fund complex (2015-2020). | Since December 2020 | ||
|
Kelly A. Coyne 1968 Assistant Secretary |
Director, Investment Operations of Prudential Mutual Fund Services LLC (since 2010). | Since March 2015 | ||
|
Christian J. Kelly 1975 Treasurer and Principal Financial and Accounting Officer |
Vice President, Head of Fund Administration of PGIM Investments LLC (since November 2018); formerly Director of Fund Administration of Lord Abbett & Co. LLC (2009-2018), Treasurer and Principal Accounting Officer of the Lord Abbett Family of Funds (2017-2018); Director of Accounting, Avenue Capital Group (2008-2009); Senior Manager, Investment Management Practice of Deloitte & Touche LLP (1998-2007). | Since January 2019 | ||
|
Lana Lomuti 1967 Assistant Treasurer |
Vice President (since 2007) and Director (2005-2007), within PGIM Investments Fund Administration; formerly Assistant Treasurer (December 2007-February 2014) of The Greater China Fund, Inc. | Since April 2014 | ||
|
Russ Shupak 1973 Assistant Treasurer |
Vice President (since 2017) and Director (2013-2017), within PGIM Investments Fund Administration. | Since September 2019 | ||
Visit our website at pgim.com/investments
| Fund Officers(a) |
||||
| Name Year of Birth Fund Position |
Principal Occupation(s) During Past Five Years | Length of Service as Fund Officer | ||
| Deborah Conway 1969 Assistant Treasurer |
Vice President (since 2017) and Director (2007-2017), within PGIM Investments Fund Administration. | Since September 2019 | ||
| Elyse M. McLaughlin 1974 Assistant Treasurer |
Vice President (since 2017) and Director (2011-2017), within PGIM Investments Fund Administration. | Since September 2019 | ||
| Dana E. Cordes 1978 Anti-Money Laundering Compliance Officer |
Vice President, Corporate Compliance (since June 2021) of Prudential; formerly, Director Global Financial Crimes Unit (December 2015 to June 2021) of Prudential; formerly, Director, Operational Risk Management for Prudential Real Estate Investors (January 2010 to December 2015). | Since September 2021 | ||
(a) Excludes Mr. Parker and Mr. Benjamin, interested Board Members who also serve as President and Vice President, respectively.
Explanatory Notes to Tables:
| ∎ | Board Members are deemed to be “Interested,” as defined in the 1940 Act, by reason of their affiliation with PGIM Investments LLC and/or an affiliate of PGIM Investments LLC. |
| ∎ | Unless otherwise noted, the address of all Board Members and Officers is c/o PGIM Investments LLC, 655 Broad Street, Newark, New Jersey 07102-4410. |
| ∎ | There is no set term of office for Board Members or Officers. The Board Members have adopted a retirement policy, which calls for the retirement of Board Members on December 31 of the year in which they reach the age of 75. |
| ∎ | “Other Directorships Held” includes all directorships of companies required to register or file reports with the SEC under the 1934 Act (that is, “public companies”) or other investment companies registered under the 1940 Act. |
| ∎ | “Portfolios Overseen” includes all investment companies managed by PGIM Investments LLC. The investment companies for which PGIM Investments LLC serves as manager include the PGIM Funds, Target Funds, The Prudential Variable Contract Accounts, PGIM ETF Trust, PGIM High Yield Bond Fund, Inc., PGIM Global High Yield Fund, Inc., PGIM Short Duration High Yield Opportunities Fund, The Prudential Series Fund, Prudential’s Gibraltar Fund, Inc. and the Advanced Series Trust. |
| ∎ | As used in the Fund Officers table “Prudential” means The Prudential Insurance Company of America. |
PGIM Muni High Income Fund
Approval of Advisory Agreements (unaudited)
The Fund’s Board of Trustees
The Board of Trustees (the “Board”) of PGIM Muni High Income Fund (the “Fund”)1 consists of ten individuals, eight of whom are not “interested persons” of the Fund, as defined in the Investment Company Act of 1940, as amended (the “1940 Act”) (the “Independent Trustees”). The Board is responsible for the oversight of the Fund and its operations, and performs the various duties imposed on the directors of investment companies by the 1940 Act. The Independent Trustees have retained independent legal counsel to assist them in connection with their duties. The Chair of the Board is an Independent Trustee. The Board has established four standing committees: the Audit Committee, the Nominating and Governance Committee, and two Investment Committees. Each committee is chaired by, and composed of, Independent Trustees.
Annual Approval of the Fund’s Advisory Agreements
As required under the 1940 Act, the Board determines annually whether to renew the Fund’s management agreement with PGIM Investments LLC (“PGIM Investments”) and the Fund’s subadvisory agreement with PGIM, Inc. (“PGIM”) on behalf of its PGIM Fixed Income unit (“PGIM Fixed Income”). In considering the renewal of the agreements, the Board, including all of the Independent Trustees, met on June 7-10, 2021 and approved the renewal of the agreements through July 31, 2022, after concluding that the renewal of the agreements was in the best interests of the Fund and its shareholders.
In advance of the meetings, the Board requested and received materials relating to the agreements, and had the opportunity to ask questions and request further information in connection with its consideration. Among other things, the Board considered comparative fee information from PGIM Investments and PGIM. Also, the Board considered comparisons with other mutual funds in relevant Peer Universes and Peer Groups, as is further discussed below.
In approving the agreements, the Board, including the Independent Trustees advised by independent legal counsel, considered the factors it deemed relevant, including the nature, quality and extent of services provided by PGIM Investments and the subadviser, the performance of the Fund, the profitability of PGIM Investments and its affiliates, expenses and fees, and the potential for economies of scale that may be shared with the Fund and its shareholders as the Fund’s assets grow. In their deliberations, the Trustees did not identify any single factor which alone was responsible for the Board’s decision to approve the agreements with respect to the Fund. In connection with its deliberations, the Board considered information provided by PGIM Investments throughout the year at regular Board meetings, presentations from portfolio managers and other information, as well as information furnished at or in advance of the meetings on June 7-10, 2021.
The Trustees determined that the overall arrangements between the Fund and PGIM Investments, which serves as the Fund’s investment manager pursuant to a
| 1 | PGIM Muni High Income Fund is the sole series of Prudential Investment Portfolios 4. |
PGIM Muni High Income Fund
Approval of Advisory Agreements (continued)
management agreement, and between PGIM Investments and PGIM, which, through its PGIM Fixed Income unit, serves as the Fund’s subadviser pursuant to the terms of a subadvisory agreement with PGIM Investments, are in the best interests of the Fund and its shareholders in light of the services performed, fees charged and such other matters as the Trustees considered relevant in the exercise of their business judgment.
The material factors and conclusions that formed the basis for the Trustees’ reaching their determinations to approve the continuance of the agreements are separately discussed below.
Nature, Quality and Extent of Services
The Board received and considered information regarding the nature, quality and extent of services provided to the Fund by PGIM Investments and PGIM Fixed Income. The Board noted that PGIM Fixed Income is affiliated with PGIM Investments. The Board considered the services provided by PGIM Investments, including but not limited to the oversight of the subadviser for the Fund, as well as the provision of fund recordkeeping, compliance and other services to the Fund, and PGIM Investments’ role as administrator for the Fund’s liquidity risk management program. With respect to PGIM Investments’ oversight of the subadviser, the Board noted that PGIM Investments’ Strategic Investment Research Group (“SIRG”), which is a business unit of PGIM Investments, is responsible for monitoring and reporting to PGIM Investments’ senior management on the performance and operations of the subadviser. The Board also considered that PGIM Investments pays the salaries of all of the officers and interested Trustees of the Fund who are part of Fund management. The Board also considered the investment subadvisory services provided by PGIM Fixed Income, including investment research and security selection, as well as adherence to the Fund’s investment restrictions and compliance with applicable Fund policies and procedures. The Board considered PGIM Investments’ evaluation of the subadviser, as well as PGIM Investments’ recommendation, based on its review of the subadviser, to renew the subadvisory agreement.
The Board considered the qualifications, backgrounds and responsibilities of PGIM Investments’ senior management responsible for the oversight of the Fund and PGIM Fixed Income, and also considered the qualifications, backgrounds and responsibilities of PGIM Fixed Income’s portfolio managers who are responsible for the day-to-day management of the Fund’s portfolio. The Board was provided with information pertaining to PGIM Investments’ and PGIM Fixed Income’s organizational structure, senior management, investment operations, and other relevant information pertaining to both PGIM Investments and PGIM Fixed Income. The Board also noted that it received favorable compliance reports from the Fund’s Chief Compliance Officer (“CCO”) as to both PGIM Investments and PGIM Fixed Income.
The Board concluded that it was satisfied with the nature, extent and quality of the investment management services provided by PGIM Investments and the subadvisory services provided to the Fund by PGIM Fixed Income, and that there was a reasonable
Visit our website at pgim.com/investments
basis on which to conclude that the Fund benefits from the services provided by PGIM Investments and PGIM Fixed Income under the management and subadvisory agreements.
Costs of Services and Profits Realized by PGIM Investments
The Board was provided with information on the profitability of PGIM Investments and its affiliates in serving as the Fund’s investment manager. The Board discussed with PGIM Investments the methodology utilized in assembling the information regarding profitability and considered its reasonableness. The Board recognized that it is difficult to make comparisons of profitability from fund management contracts because comparative information is not generally publicly available and is affected by numerous factors, including the structure of the particular adviser, the types of funds it manages, its business mix, numerous assumptions regarding allocations and the adviser’s capital structure and cost of capital. Taking these factors into account, the Board concluded that the profitability of PGIM Investments and its affiliates in relation to the services rendered was not unreasonable.
Economies of Scale
The Board received and discussed information concerning economies of scale that PGIM Investments may realize as the Fund’s assets grow beyond current levels. The Board noted that the management fee schedule for the Fund includes breakpoints, which have the effect of decreasing the fee rate as assets increase. During the course of time, the Board has considered information regarding the launch date of the Fund, the management fees of the Fund compared to those of similarly managed funds and PGIM Investments’ investment in the Fund over time. The Board noted that economies of scale can be shared with the Fund in other ways, including low management fees from inception, additional technological and personnel investments to enhance shareholder services, and maintaining existing expense structures in the face of a rising cost environment. The Board also considered PGIM Investments’ assertion that it continually evaluates the management fee schedule of the Fund and the potential to share economies of scale through breakpoints or fee waivers as asset levels increase.
The Board recognized the inherent limitations of any analysis of economies of scale, stemming largely from the Board’s understanding that most of PGIM Investments’ costs are not specific to individual funds, but rather are incurred across a variety of products and services.
Other Benefits to PGIM Investments and PGIM Fixed Income
The Board considered potential ancillary benefits that might be received by PGIM Investments, PGIM Fixed Income and their affiliates as a result of their relationship with the Fund. The Board concluded that potential benefits to be derived by PGIM Investments included transfer agency fees received by the Fund’s transfer agent (which is affiliated with PGIM Investments), and benefits to its reputation as well as other intangible benefits resulting from PGIM Investments’ association with the Fund. The Board concluded that the potential benefits to be derived by PGIM Fixed Income
PGIM Muni High Income Fund
Approval of Advisory Agreements (continued)
included its ability to use soft dollar credits, as well as the potential benefits consistent with those generally resulting from an increase in assets under management, specifically, potential access to additional research resources and benefits to its reputation. The Board concluded that the benefits derived by PGIM Investments and PGIM Fixed Income were consistent with the types of benefits generally derived by investment managers and subadvisers to mutual funds.
Performance of the Fund / Fees and Expenses
The Board considered certain additional factors and made related conclusions relating to the historical performance of the Fund for the one-, three-, five- and ten-year periods ended December 31, 2020.
The Board also considered the Fund’s actual management fee, as well as the Fund’s net total expense ratio, for the fiscal year ended April 30, 2020. The Board considered the management fee for the Fund as compared to the management fee charged by PGIM Investments to other funds and the fee charged by other advisers to comparable mutual funds in a Peer Group. The actual management fee represents the fee rate actually paid by Fund shareholders and includes any fee waivers or reimbursements. The net total expense ratio for the Fund represents the actual expense ratio incurred by Fund shareholders.
The mutual funds included in the Peer Universe, which was used to consider performance, and the Peer Group, which was used to consider fees and expenses, were objectively determined by Broadridge, an independent provider of mutual fund data. In certain circumstances, PGIM Investments also provided supplemental Peer Universe or Peer Group information for reasons addressed with the Board. The comparisons placed the Fund in various quartiles over various periods, with the first quartile being the best 25% of the mutual funds (for performance, the best performing mutual funds and, for expenses, the lowest cost mutual funds).
The section below summarizes key factors considered by the Board and the Board’s conclusions regarding the Fund’s performance, fees and overall expenses. The table sets forth net performance comparisons (which reflect the impact on performance of fund expenses, or any subsidies, expense caps or waivers that may be applicable) with the Peer Universe, actual management fees with the Peer Group (which reflect the impact of any subsidies or fee waivers), and net total expenses with the Peer Group, each of which were key factors considered by the Board.
| Net Performance |
1 Year |
3 Years | 5 Years | 10 Years | ||||
| 1st Quartile |
2nd Quartile | 2nd Quartile | 2nd Quartile | |||||
|
Actual Management Fees: 3rd Quartile | ||||||||
|
Net Total Expenses: 3rd Quartile |
||||||||
| ● | The Board noted that the Fund outperformed its benchmark index over the ten-year period, though it underperformed over the other periods. |
Visit our website at pgim.com/investments
| ● | The Board also noted PGIM Investments’ assertion that the Fund has strong returns over the long term as demonstrated by its 10-year performance. |
| ● | The Board noted that, effective April 1, 2020, PGIM Investments contractually reduced its management fee schedule. The current contractual fee rate schedule is as follows: 0.49% up to $1 billion; 0.44% over $1 billion. |
| ● | The Board noted that, effective April 1, 2020, PGIM Fixed Income contractually reduced its subadvisory fee schedule. The current contractual fee rate schedule is as follows: 0.245% up to $1 billion; 0.22% over $1 billion. |
| ● | PGIM Investments has contractually agreed, through December 31, 2022, to limit (exclusive of certain fees and expenses) total annual fund operating expenses after fee waivers and/or expense reimbursements to 0.58% of average daily net assets for Class Z shares, and 0.49% of average daily net assets for Class R6 shares. |
| ● | In addition, PGIM Investments will waive management fees or shared operating expenses on any share class to the same extent that it waives such expenses on any other share class, and has agreed that total annual fund operating expenses for Class R6 shares will not exceed total annual fund operating expenses for Class Z shares. |
| ● | The Board concluded that, in light of the above, it would be in the best interests of the Fund and its shareholders to renew the agreements. |
| ● | The Board concluded that the management fees (including subadvisory fees) and total expenses were reasonable in light of the services provided. |
* * *
After full consideration of these factors, the Board concluded that approval of the agreements was in the best interests of the Fund and its shareholders.
PGIM Muni High Income Fund
| |
∎ TELEPHONE |
∎ WEBSITE | ||
| 655 Broad Street Newark, NJ 07102 |
(800) 225-1852 |
pgim.com/investments |
| PROXY VOTING |
| The Board of Trustees of the Fund has delegated to the Fund’s subadviser the responsibility for voting any proxies and maintaining proxy recordkeeping with respect to the Fund. A description of these proxy voting policies and procedures is available without charge, upon request, by calling (800) 225-1852 or by visiting the Securities and Exchange Commission’s website at sec.gov. Information regarding how the Fund voted proxies relating to portfolio securities during the most recent 12-month period ended June 30 is available on the Fund’s website and on the Securities and Exchange Commission’s website. |
| TRUSTEES |
| Ellen S. Alberding ● Kevin J. Bannon ● Scott E. Benjamin ● Linda W. Bynoe ● Barry H. Evans ● Keith F. Hartstein ● Laurie Simon Hodrick ● Stuart S. Parker ● Brian K. Reid ● Grace C. Torres |
| OFFICERS |
| Stuart S. Parker, President ● Scott E. Benjamin, Vice President ● Christian J. Kelly, Treasurer and Principal Financial and Accounting Officer ● Claudia DiGiacomo, Chief Legal Officer ● Dino Capasso, Chief Compliance Officer ● Dana E. Cordes, Anti-Money Laundering Compliance Officer ● Andrew R. French, Secretary ● Melissa Gonzalez, Assistant Secretary ● Diana N. Huffman, Assistant Secretary ● Kelly A. Coyne, Assistant Secretary ● Patrick E. McGuinness, Assistant Secretary ● Debra Rubano, Assistant Secretary ● Lana Lomuti, Assistant Treasurer ● Russ Shupak, Assistant Treasurer ● Elyse M. McLaughlin, Assistant Treasurer ● Deborah Conway, Assistant Treasurer |
| MANAGER | PGIM Investments LLC | 655 Broad Street Newark, NJ 07102 | ||
|
| ||||
| SUBADVISER | PGIM Fixed Income | 655 Broad Street Newark, NJ 07102 | ||
|
| ||||
| DISTRIBUTOR | Prudential Investment Management Services LLC |
655 Broad Street Newark, NJ 07102 | ||
|
| ||||
| CUSTODIAN | The Bank of New York Mellon | 240 Greenwich Street New York, NY 10286 | ||
|
| ||||
| TRANSFER AGENT | Prudential Mutual Fund Services LLC |
PO Box 9658 Providence, RI 02940 | ||
|
| ||||
| INDEPENDENT REGISTERED PUBLIC ACCOUNTING FIRM |
PricewaterhouseCoopers LLP |
300 Madison Avenue New York, NY 10017 | ||
|
| ||||
| FUND COUNSEL | Willkie Farr & Gallagher LLP | 787 Seventh Avenue New York, NY 10019 | ||
|
| ||||
| An investor should consider the investment objectives, risks, charges, and expenses of the Fund carefully before investing. The prospectus and summary prospectus contain this and other information about the Fund. An investor may obtain the prospectus and summary prospectus by visiting our website at pgim.com/investments or by calling (800) 225-1852. The prospectus and summary prospectus should be read carefully before investing. |
| E-DELIVERY |
| To receive your mutual fund documents online, go to pgim.com/investments/resource/edelivery and enroll. Instead of receiving printed documents by mail, you will receive notification via email when new materials are available. You can cancel your enrollment or change your email address at any time by visiting the website address above. |
| SHAREHOLDER COMMUNICATIONS WITH TRUSTEES |
| Shareholders can communicate directly with the Board of Trustees by writing to the Chair of the Board, PGIM Muni High Income Fund, PGIM Investments, Attn: Board of Trustees, 655 Broad Street, Newark, NJ 07102. Shareholders can communicate directly with an individual Trustee by writing to the same address. Communications are not screened before being delivered to the addressee. |
| AVAILABILITY OF PORTFOLIO HOLDINGS |
| The Fund files its complete schedule of portfolio holdings with the Securities and Exchange Commission for the first and third quarters of each fiscal year as an exhibit to its reports on Form N-PORT. The Fund’s Form N-PORT filings are available on the Commission’s website at sec.gov. |
| The Fund’s Statement of Additional Information contains additional information about the Fund’s Trustees and is available without charge, upon request, by calling (800) 225-1852. |
Mutual Funds:
| ARE NOT INSURED BY THE FDIC OR ANY FEDERAL GOVERNMENT AGENCY |
MAY LOSE VALUE | ARE NOT A DEPOSIT OF OR GUARANTEED BY ANY BANK OR ANY BANK AFFILIATE | ||
PGIM MUNI HIGH INCOME FUND
| SHARE CLASS | A | C | Z | R6 | ||||
| NASDAQ | PRHAX | PHICX | PHIZX | PHIQX | ||||
| CUSIP | 74440M104 | 74440M302 | 74440M401 | 74440M609 |
MF133E
Item 2 – Code of Ethics — See Exhibit (a)
As of the end of the period covered by this report, the registrant has adopted a code of ethics (the “Section 406 Standards for Investment Companies – Ethical Standards for Principal Executive and Financial Officers”) that applies to the registrant’s Principal Executive Officer and Principal Financial Officer; the registrant’s Principal Financial Officer also serves as the Principal Accounting Officer.
The registrant hereby undertakes to provide any person, without charge, upon request, a copy of the code of ethics. To request a copy of the code of ethics, contact the registrant 800-225-1852, and ask for a copy of the Section 406 Standards for Investment Companies - Ethical Standards for Principal Executive and Financial Officers.
Item 3 – Audit Committee Financial Expert –
The registrant’s Board has determined that Ms. Grace C. Torres, member of the Board’s Audit Committee is an “audit committee financial expert,” and that she is “independent,” for purposes of this item.
Item 4 – Principal Accountant Fees and Services –
(a) Audit Fees
For the fiscal period May 1, 2021 through August 31, 2021, the Registrant’s principal accountant was PricewaterhouseCoopers LLP (“PwC”). For the fiscal period ended August 31, 2021, PwC billed the Registrant $29,625 for professional services rendered for the audit of the Registrant’s annual financial statements or services that are normally provided in connection with statutory and regulatory filings.
For the fiscal year ended April 30, 2021, the Registrant’s principal accountant was PricewaterhouseCoopers LLP (“PwC”). For the fiscal year ended April 30, 2021, PwC billed the Registrant $39,500 for professional services rendered for the audit of the Registrant’s annual financial statements or services that are normally provided in connection with statutory and regulatory filings.
For the fiscal year ended April 30, 2020, the Registrant’s principal accountant was KPMG LLP (“KPMG”). For the fiscal year ended April 30, 2020, KPMG billed the Registrant $39,950 for professional services rendered for the audit of the Registrant’s annual financial statements or services that are normally provided in connection with statutory and regulatory filings.
(b) Audit-Related Fees
For the fiscal period May 1, 2021 through August 31, 2021, PwC did not bill the Registrant for audit-related services
For the fiscal year ended April 30, 2021, PwC did not bill the Registrant for audit-related services.
For the fiscal year ended April 30, 2021, fees of $5,075 were billed to the Registrant for services rendered by KPMG in connection with the auditor transition.
For the fiscal year ended April 30, 2020, fees of $1,418 were billed to the Registrant for services rendered by KPMG in connection with an accounting system conversion and were paid by The Bank of New York Mellon.
(c) Tax Fees
For the fiscal period May 1, 2021 through August 31, 2021 and the fiscal years ended April 30, 2021 and April 30, 2020: none.
(d) All Other Fees
For the fiscal period May 1, 2021 through August 31, 2021 and the fiscal years ended April 30, 2021 and April 30, 2020: none.
(e) (1) Audit Committee Pre-Approval Policies and Procedures
THE PGIM MUTUAL FUNDS
AUDIT COMMITTEE POLICY
on
Pre-Approval of Services Provided by the Independent
Accountants
The Audit Committee of each PGIM Mutual Fund is charged with the responsibility to monitor the independence of the Fund’s independent accountants. As part of this responsibility, the Audit Committee must pre-approve the independent accounting firm’s engagement to render audit and/or permissible non-audit services, as required by law. In evaluating a proposed engagement of the independent accountants, the Audit Committee will assess the effect that the engagement might reasonably be expected to have on the accountant’s independence. The Committee’s evaluation will be based on:
| • | a review of the nature of the professional services expected to be provided, |
| • | a review of the safeguards put into place by the accounting firm to safeguard independence, and |
| • | periodic meetings with the accounting firm. |
Policy for Audit and Non-Audit Services Provided to the Funds
On an annual basis, the scope of audits for each Fund, audit fees and expenses, and audit-related and non-audit services (and fees proposed in respect thereof) proposed to be performed by the Fund’s independent accountants will be presented by the Treasurer and the independent accountants to the Audit Committee for review and, as appropriate, approval prior to the initiation of such services.
Such presentation shall be accompanied by confirmation by both the Treasurer and the independent accountants that the proposed
non-audit services will not adversely affect the independence of the independent accountants. Such proposed non-audit services shall be described in sufficient detail to enable the Audit Committee to assess the appropriateness of such services and fees, and the compatibility of the provision of such services with the auditor’s independence. The Committee shall receive periodic reports on the progress of the audit and other services which are approved by the Committee or by the Committee Chair pursuant to authority delegated in this Policy.
The categories of services enumerated under “Audit Services”, “Audit-related Services”, and “Tax Services” are intended to provide guidance to the Treasurer and the independent accountants as to those categories of services which the Committee believes are generally consistent with the independence of the independent accountants and which the Committee (or the Committee Chair) would expect upon the presentation of specific proposals to pre-approve. The enumerated categories are not intended as an exclusive list of audit, audit-related or tax services, which the Committee (or the Committee Chair) would consider for pre-approval.
Audit Services
The following categories of audit services are considered to be consistent with the role of the Fund’s independent accountants:
| • | Annual Fund financial statement audits |
| • | Seed audits (related to new product filings, as required) |
| • | SEC and regulatory filings and consents |
Audit-related Services
The following categories of audit-related services are considered to be consistent with the role of the Fund’s independent accountants:
| • | Accounting consultations |
| • | Fund merger support services |
| • | Agreed Upon Procedure Reports |
| • | Attestation Reports |
| • | Other Internal Control Reports |
Individual audit-related services that fall within one of these categories (except for fund merger support services) and are not presented to the Audit Committee as part of the annual pre-approval process are subject to an authorized pre-approval by the Audit Committee so long as the estimated fee for those services does not exceed $30,000. Any services provided under such pre-approval will be reported to the Audit Committee at its next regular meeting. Should the amount of such services exceed $30,000 any additional fees will be subject to pre-approval by the Committee Chair (or any other Committee member on whom this responsibility has been delegated). Fees related to fund merger support services are subject to a separate authorized pre-approval by the Audit Committee with fees determined on a per occurrence and merger complexity basis.
Tax Services
The following categories of tax services are considered to be consistent with the role of the Fund’s independent accountants:
| • | Tax compliance services related to the filing or amendment of the following: |
| • | Federal, state and local income tax compliance; and, |
| • | Sales and use tax compliance |
| • | Timely RIC qualification reviews |
| • | Tax distribution analysis and planning |
| • | Tax authority examination services |
| • | Tax appeals support services |
| • | Accounting methods studies |
| • | Fund merger support services |
| • | Tax consulting services and related projects |
Individual tax services that fall within one of these categories and are not presented to the Audit Committee as part of the annual pre-approval process are subject to an authorized pre-approval by the Audit Committee so long as the estimated fee for those services does not exceed $30,000. Any services provided under such pre-approval will be reported to the Audit Committee at its next regular meeting. Should the amount of such services exceed $30,000 any additional fees will be subject to pre-approval by the Committee Chair (or any other Committee member on whom this responsibility has been delegated).
Other Non-Audit Services
Certain non-audit services that the independent accountants are legally permitted to render will be subject to pre-approval by the Committee or by one or more Committee members to whom the Committee has delegated this authority and who will report to the full Committee any pre-approval decisions made pursuant to this Policy. Non-audit services presented for
pre-approval pursuant to this paragraph will be accompanied by a confirmation from both the Treasurer and the independent accountants that the proposed services will not adversely affect the independence of the independent accountants.
Proscribed Services
The Fund’s independent accountants will not render services in the following categories of non-audit services:
| • | Bookkeeping or other services related to the accounting records or financial statements of the Fund |
| • | Financial information systems design and implementation |
| • | Appraisal or valuation services, fairness opinions, or contribution-in-kind reports |
| • | Actuarial services |
| • | Internal audit outsourcing services |
| • | Management functions or human resources |
| • | Broker or dealer, investment adviser, or investment banking services |
| • | Legal services and expert services unrelated to the audit |
| • | Any other service that the Public Company Accounting Oversight Board determines, by regulation, is impermissible. |
Pre-approval of Non-Audit Services Provided to Other Entities Within the PGIM Fund Complex
Certain non-audit services provided to PGIM Investments LLC or any of its affiliates that also provide ongoing services to the PGIM Mutual Funds will be subject to pre-approval by the Audit Committee. The only non-audit services provided to these entities that will require pre-approval are those related directly to the operations and financial reporting of the Funds. Individual projects that are not presented to the Audit Committee as part of the annual pre-approval process will be subject to pre-approval by the Committee Chair (or any other Committee member on whom this responsibility has been delegated) so long as the estimated fee for those services does not exceed $30,000. Services presented for pre-approval pursuant to this paragraph will be accompanied by a confirmation from both the Treasurer and the independent accountants that the proposed services will not adversely affect the independence of the independent accountants.
Although the Audit Committee will not pre-approve all services provided to PGIM Investments LLC and its affiliates, the Committee will receive an annual report from the Fund’s independent accounting firm showing the aggregate fees for all services provided to PGIM Investments and its affiliates.
(e) (2) Percentage of services referred to in 4(b) – 4(d) that were approved by the audit committee –
For the fiscal period May 1, 2021 through August 31, 2021 and the fiscal years ended April 30, 2021 and April 30, 2020, 100% of the services referred to in Item 4(b) was approved by the audit committee.
(f) Percentage of hours expended attributable to work performed by other than full time employees of principal accountant if greater than 50%.
The percentage of hours expended on the principal accountant’s engagement to audit the registrant’s financial statements for the most recent fiscal year that were attributed to work performed by persons other than the principal accountant’s full-time, permanent employees was 0%.
(g) Non-Audit Fees
The aggregate non-audit fees billed by the Registrant’s principal accountant for services rendered to the registrant’s investment adviser and any entity controlling, controlled by, or under common control with the investment adviser that provides ongoing services to the registrant for the fiscal period May 1, 2021 through August 31, 2021 and fiscal years ended April 30, 2021 and April 30, 2020 was $0, $0 and $0, respectively.
(h) Principal Accountant’s Independence
Not applicable as the Registrant’s principal accountant has not provided non-audit services to the registrant’s investment adviser and any entity controlling, controlled by, or under common control with the investment adviser that provides ongoing services to the registrant that were not pre-approved pursuant to Rule 2-01(c)(7)(ii) of Regulation S-X.
Item 5 – Audit Committee of Listed Registrants – Not applicable.
Item 6 – Schedule of Investments – The schedule is included as part of the report to shareholders filed under Item 1 of this Form.
Item 7 – Disclosure of Proxy Voting Policies and Procedures for Closed-End Management Investment Companies – Not applicable.
Item 8 – Portfolio Managers of Closed-End Management Investment Companies – Not applicable.
Item 9 – Purchases of Equity Securities by Closed-End Management Investment Company and Affiliated Purchasers – Not applicable.
Item 10 – Submission of Matters to a Vote of Security Holders – There have been no material changes to these procedures.
Item 11 – Controls and Procedures
| (a) | It is the conclusion of the registrant’s principal executive officer and principal financial officer that the effectiveness of the registrant’s current disclosure controls and procedures (such disclosure controls and procedures having been evaluated within 90 days of the date of this filing) provide reasonable assurance that the information required to be disclosed by the registrant has been recorded, processed, summarized and reported within the time period specified in the Commission’s rules and forms and that the information required to be disclosed by the registrant has been accumulated and communicated to the registrant’s principal executive officer and principal financial officer in order to allow timely decisions regarding required disclosure. |
| (b) | There has been no significant change in the registrant’s internal control over financial reporting that occurred during the registrant’s most recent fiscal quarter of the period covered by this report that has materially affected, or is likely to materially affect, the registrant’s internal control over financial reporting. |
Item 12 – Controls and Procedures - Disclosure of Securities Lending Activities for Closed-End Management Investment Companies – Not applicable.
Item 13 – Exhibits
| (a) | (1) Code of Ethics – Attached hereto as Exhibit EX-99.CODE-ETH. |
(3) Any written solicitation to purchase securities under Rule 23c-1 – Not applicable.
| (b) |
SIGNATURES
Pursuant to the requirements of the Securities Exchange Act of 1934 and the Investment Company Act of 1940, the registrant has duly caused this report to be signed on its behalf by the undersigned, thereunto duly authorized.
| Registrant: | Prudential Investment Portfolios 4 | |
| By: | /s/ Andrew R. French | |
| Andrew R. French | ||
| Secretary | ||
| Date: | October 19, 2021 | |
Pursuant to the requirements of the Securities Exchange Act of 1934 and the Investment Company Act of 1940, this report has been signed below by the following persons on behalf of the registrant and in the capacities and on the dates indicated.
| By: | /s/ Stuart S. Parker | |
| Stuart S. Parker | ||
| President and Principal Executive Officer | ||
| Date: | October 19, 2021 | |
| By: | /s/ Christian J. Kelly | |
| Christian J. Kelly | ||
| Treasurer and Principal Financial and Accounting Officer | ||
| Date: | October 19, 2021 | |
CODE OF ETHICS FOR PRINCIPAL EXECUTIVE AND
PRINCIPAL FINANCIAL OFFICERS
| I. | Covered Officers/Purpose of the Code |
This code of ethics (the “Code”) is established for the funds listed on Attachment A hereto (each a Fund” and together the “Funds”) pursuant to Section 406 of the Sarbanes-Oxley Act and the rules adopted thereunder by the Securities and Exchange Commission (“SEC”). The Code applies to each Fund’s Principal Executive Officer, Principal Financial Officer and Principal Accounting Officer or Controller, or senior officers performing similar functions (the “Covered Officers” each of whom are set forth in Exhibit B) for the purpose of promoting:
| • | honest and ethical conduct, including the ethical handling of actual or apparent conflicts of interest between personal and professional relationships; |
| • | full, fair, accurate, timely and understandable disclosure in reports and documents that a registrant files with, or submits to, the SEC and in other public communications made by a Fund; |
| • | compliance with applicable governmental laws, rules and regulations; |
| • | the prompt internal reporting of violations of the Code to an appropriate person or persons identified in the Code; and |
| • | accountability for adherence to the Code. |
Each Covered Officer should adhere to a high standard of business ethics and should be sensitive to situations that may give rise to actual as well as apparent conflicts of interest.
| II. | Conflicts of Interest |
A “conflict of interest” occurs when a Covered Officer’s private interest interferes with the interests of, or his service to, a Fund. For example, a conflict of interest would arise if a Covered Officer, or a member of his family, receives improper personal benefits as a result of his position with a Fund.
Certain conflicts of interest arise out of the relationships between Covered Officers and a Fund and already are subject to conflict of interest provisions in the Investment Company Act of 1940, as amended (the “1940 Act”) and the Investment Advisers Act of 1940, as amended (the “Advisers Act”). For example, Covered Officers may not individually engage in certain transactions (such as the purchase or sale of securities or other property) with a Fund because of their status as “affiliated persons” of the Fund. A Fund’s and its investment adviser’s compliance programs and procedures are designed to prevent, or identify and correct, violations of these provisions. This Code does not, and is not intended to, repeat or replace these programs and procedures, and such conflicts fall outside of the parameters of this Code.
Although typically not presenting an opportunity for improper personal benefit, conflicts arise from, or as a result of, the contractual relationships between a Fund and the Fund’s investment adviser, principal underwriter, administrator, or other service providers to the Fund (together “Service Providers”), of which the Covered Officers may also be principals or employees. As a result, this Code recognizes that the Covered Officers will, in the normal course of their duties (whether formally for a Fund or for a Service Provider, or for both), be involved in establishing policies and implementing decisions that will have different effects on such Service Providers and a Fund. The participation of the Covered Officers in such activities is inherent in the contractual relationships between a Fund and its Service Providers and is consistent with the performance by the Covered Officers of their duties as officers of the Fund. Thus, if performed in conformity with the provisions of the 1940 Act and the Advisers Act, such activities will be deemed to have been handled ethically. In addition, it is recognized by the Funds’ Board of Directors/Trustees (“Boards”) that the Covered Officers may also be officers or employees of one or more other investment companies covered by this or other codes.
Other conflicts of interest are covered by the Code, even if such conflicts of interest are not subject to provisions in the 1940 Act and the Advisers Act. The following list provides examples of conflicts of interest under the Code, but Covered Officers should keep in mind that these examples are not exhaustive. The overarching principle is that the personal interest of a Covered Officer should not be placed improperly before the interest of a Fund.
Each Covered Officer must:
| • | not use his personal influence or personal relationships improperly to influence investment decisions or financial reporting by a Fund whereby the Covered Officer would benefit personally to the detriment of the Fund; |
| • | not cause a Fund to take action, or fail to take action, for the individual personal benefit of the Covered Officer rather than the benefit the Fund; and |
| • | not retaliate against any other Covered Officer or any employee of a Fund or its affiliated persons for reports of potential violations that are made in good faith. |
There are some actual or potential conflict of interest situations that should always be brought to the attention of, and discussed with, the Funds’ Chief Legal Officer or other senior legal officer, if material. Examples of these include:
| • | service as a director on the board of any public or private company; |
| • | the receipt of any non-nominal gifts; |
| • | the receipt of any entertainment from any company with which a Fund has current or prospective business dealings unless such entertainment is business-related, reasonable in cost, appropriate as to time and place, and not so frequent as to raise any question of impropriety; |
| • | any ownership interest in (other than insubstantial interests in publicly traded entities), or any consulting or employment relationship with, any of a Fund’s Service Providers, other than its investment adviser, principal underwriter, administrator or any affiliated person thereof; and |
| • | a direct or indirect financial interest in commissions, transaction charges or spreads paid by a Fund for effecting portfolio transactions or for selling or redeeming shares other than an interest arising from the Covered Officer’s employment, such as compensation or equity ownership. |
| III. | Disclosure and Compliance |
Each Covered Officer:
| • | should familiarize himself with the disclosure requirements generally applicable to the Funds; |
| • | should not knowingly misrepresent, or cause others to misrepresent, facts about a Fund to others, whether within or outside the Fund, including to the Fund’s Board of Directors/Trustees and its auditors, and to governmental regulators and self-regulatory organizations; |
| • | should, to the extent appropriate within his area of responsibility, consult with other officers and employees of a Fund and its Service Providers with the goal of promoting full, fair, accurate, timely and understandable disclosure in the reports and documents the Fund files with, or submits to, the SEC and in other public communications made by the Fund; and |
| • | is responsible to promote compliance with the standards and restrictions imposed by applicable laws, rules and regulations. |
| IV. | Reporting and Accountability |
Each Covered Officer must:
| • | upon adoption of the Code (or thereafter as applicable, upon becoming a Covered Officer), affirm in writing to the Board of Directors/Trustees that he has received, read, and understands the Code; |
| • | annually thereafter affirm to the Board of Directors/Trustees that he has complied with the requirements of the Code; and |
| • | notify the Funds’ Chief Legal Officer promptly if he knows of any violation of this Code. Failure to do so is itself a violation of this Code. |
The Funds’ Chief Legal Officer is responsible for applying this Code to specific situations in which questions are presented under it and has the authority to interpret this Code in any particular situation. In such situations, the Chief Legal Officer is authorized to consult, as appropriate, with counsel to the Funds, counsel to the Independent Directors/Trustees, a Board Committee comprised of Independent Directors/Trustees, or the full Board.
The Funds will follow the following procedures in investigating and enforcing this Code:
| • | the Funds Chief Legal Officer will take all appropriate action to investigate any potential violations reported to her; |
| • | if, after such investigation, the Chief Legal Officer believes that no violation has occurred, the Chief Legal Officer is not required to take any further action; |
| • | any matter that the Chief Legal Officer believes is a violation or that the Chief Legal Officer believes should be reviewed by a Fund’s Board or Board Committee comprised of Independent Directors/Trustees will be reported to the Fund’s Board or Board Committee comprised of Independent Directors/Trustees; |
| • | based upon its review of any matter referred to it, a Fund’s Board or Board Committee comprised of Independent Directors/Trustees shall determine whether or not a violation has occurred, whether a grant of waiver is appropriate or whether some other action should be taken. Based upon its determination, the Fund’s Board or Board Committee comprised of Independent Directors/Trustees may take such action as it deems appropriate, which may include without limitation: modifications of applicable policies and procedures; notification to appropriate personnel of the Fund’s investment adviser, principal underwriter or administrator, or their boards; notification to other Funds for which the Covered Officer serves as a Covered Officer; or recommendation to dismiss the Covered Officer; and |
| • | any changes to or waivers of this Code will, to the extent required, be disclosed as provided by SEC rules. |
| V. | Other Policies and Procedures |
This Code shall be the sole code of ethics adopted by the Funds for purposes of Section 406 of the Sarbanes-Oxley Act and the rules and forms applicable to registered investment companies thereunder. Insofar as other policies or procedures of a Fund or its Service Providers govern or purport to govern the behavior or activities of the Covered Officers who are subject to this Code, they are superseded by this Code to the extent that they overlap or conflict with the provisions of this Code. The Funds’ and their investment adviser’s and principal underwriter’s code of ethics under Rule 17j-1 under the 1940 Act are separate requirements applying to the Covered Officers and others, and are not part of this Code.
| VI. | Amendments |
Any amendments to this Code, other than amendments to Exhibit A, must be approved or ratified by a majority vote of the Board, including a majority of Independent Directors/Trustees.
| VII. | Confidentiality |
All reports and records prepared or maintained pursuant to this Code will be considered confidential and shall be maintained and protected accordingly. Except as otherwise required by law or this Code, such matters shall not be disclosed to anyone other than the Fund Board of Directors/Trustees, counsel to the Fund, and counsel to the Fund Independent Directors/Trustees.
| VIII. | Internal Use |
The Code is intended solely for the internal use by the Funds and does not constitute an admission, by or on behalf of a Fund, as to any fact, circumstance, or legal conclusion.
| IX. | Recordkeeping |
A Fund shall keep the information disclosed about waivers and amendments under the Code for the period of time as specified in the rules adopted pursuant to Section 406 of the Sarbanes-Oxley Act, and furnish such information to the SEC or its staff upon request.
Adopted and approved as of September 3, 2003.
EXHIBIT A
Funds Covered by this Code of Ethics
| • | The Prudential Investment Portfolios, Inc. |
| • | Prudential Investment Portfolios 2 |
| • | Prudential Investment Portfolios 3 |
| • | Prudential Investment Portfolios 4 |
| • | Prudential Investment Portfolios 5 |
| • | Prudential Investment Portfolios 6 |
| • | Prudential Investment Portfolios 7 |
| • | Prudential Investment Portfolios 8 |
| • | Prudential Investment Portfolios 9 |
| • | Prudential Investment Portfolios, Inc. 10 |
| • | Prudential Investment Portfolios 12 |
| • | Prudential Government Money Market Fund, Inc. |
| • | Prudential Investment Portfolios, Inc. 14 |
| • | Prudential Investment Portfolios, Inc. 15 |
| • | Prudential Investment Portfolios 16 |
| • | Prudential Investment Portfolios, Inc. 17 |
| • | Prudential Investment Portfolios 18 |
| • | Prudential Global Total Return Fund, Inc. |
| • | Prudential Jennison Blend Fund, Inc. |
| • | Prudential Jennison Mid-Cap Growth Fund, Inc. |
| • | Prudential Jennison Natural Resources Fund, Inc. |
| • | Prudential Jennison Small Company Fund, Inc. |
| • | Prudential National Muni Fund, Inc. |
| • | Prudential Sector Funds, Inc. |
| • | Prudential Short-Term Corporate Bond Fund, Inc. |
| • | Prudential World Fund, Inc. |
| • | The Target Portfolio Trust |
| • | PGIM ETF Trust |
| • | The Prudential Variable Contract Account – 2 |
| • | The Prudential Variable Contract Account – 10 |
| • | PGIM High Yield Bond Fund, Inc. |
| • | PGIM Global High Yield Fund, Inc. |
| • | PGIM Short Duration High Yield Opportunities Fund |
| • | Advanced Series Trust |
| • | Prudential’s Gibraltar Fund, Inc. |
| • | The Prudential Series Fund |
EXHIBIT B
Persons Covered by this Code of Ethics
Stuart S. Parker – President and Chief Executive Officer of the PGIM Funds, PGIM ETF Trust, the Target Mutual Funds, PGIM High Yield Bond Fund, Inc., PGIM Global High Yield Fund, Inc., PGIM Short Duration High Yield Opportunities Fund and The Prudential Variable Contract Account-2.
Timothy S. Cronin – President and Chief Executive Officer of Advanced Series Trust, Prudential’s Gibraltar Fund, Inc. and The Prudential Series Fund.
Christian J. Kelly – Treasurer and Chief Financial Officer for the PGIM Funds, PGIM ETF Trust, the Target Mutual Funds, PGIM High Yield Bond Fund, Inc., PGIM Global High Yield Fund, Inc., PGIM Short Duration High Yield Opportunities Fund, The Prudential Variable Contract Accounts – 2 and -10, Advanced Series Trust, Prudential’s Gibraltar Fund, Inc. and The Prudential Series Fund.
Item 13
Prudential Investment Portfolios 4
Annual period ending 8/31/21
File No. 811-04930
CERTIFICATIONS
I, Stuart S. Parker, certify that:
| 1. | I have reviewed this report on Form N-CSR of the above named Fund(s). |
| 2. | Based on my knowledge, this report does not contain any untrue statement of a material fact or omit to state a material fact necessary to make the statements made, in light of the circumstances under which such statements were made, not misleading with respect to the period covered by this report; |
| 3. | Based on my knowledge, the financial statements, and other financial information included in this report, fairly present in all material respects the financial condition, results of operations, changes in net assets, and cash flows (if the financial statements are required to include a statement of cash flows) of the registrant as of, and for, the periods presented in this report. |
| 4. | The registrant’s other certifying officer(s) and I are responsible for establishing and maintaining disclosure controls and procedures (as defined in Rule 30a-3(c) under the Investment Company Act of 1940) and internal control over financial reporting (as defined in Rule 30a-3(d) under the Investment Company Act of 1940) for the registrant and have: |
| a) | Designed such disclosure controls and procedures, or caused such disclosure controls and procedures to be designed under our supervision, to ensure that material information relating to the registrant, including its consolidated subsidiaries, is made known to us by others within those entities, particularly during the period in which this report is being prepared; |
| b) | Designed such internal control over financial reporting, or caused such internal control over financial reporting to be designed under our supervision, to provide reasonable assurance regarding the reliability of financial reporting and the preparation of financial statements for external purposes in accordance with generally accepted accounting principles; |
| c) | Evaluated the effectiveness of the registrant’s disclosure controls and procedures and presented in this report our conclusions about the effectiveness of the disclosure controls and procedures, as of a date within 90 days prior to the filing date of this report based on such evaluation; and |
| d) | Disclosed in this report any change in the registrant’s internal control over financial reporting that occurred during the period covered by this report that has materially affected, or is reasonably likely to materially affect, the registrant’s internal control over financial reporting. |
| 5. | The registrant’s other certifying officer(s) and I have disclosed to the registrant’s auditors and the audit committee of the registrant’s board of directors (or persons performing the equivalent functions): |
| a) | All significant deficiencies and material weaknesses in the design or operation of internal controls which are reasonably likely to adversely affect the registrant’s ability to record, process, summarize, and report financial information; and |
| b) | Any fraud, whether or not material, that involves management or other employees who have a significant role in the registrant’s internal control over financial reporting. |
October 19, 2021
| /s/ Stuart S. Parker |
| Stuart S. Parker |
| President and Principal Executive Officer |
Item 13
Prudential Investment Portfolios 4
Annual period ending 8/31/21
File No. 811-04930
CERTIFICATIONS
I, Christian J. Kelly, certify that:
| 1. | I have reviewed this report on Form N-CSR of the above named Fund(s). |
| 2. | Based on my knowledge, this report does not contain any untrue statement of a material fact or omit to state a material fact necessary to make the statements made, in light of the circumstances under which such statements were made, not misleading with respect to the period covered by this report; |
| 3. | Based on my knowledge, the financial statements, and other financial information included in this report, fairly present in all material respects the financial condition, results of operations, changes in net assets, and cash flows (if the financial statements are required to include a statement of cash flows) of the registrant as of, and for, the periods presented in this report. |
| 4. | The registrant’s other certifying officer(s) and I are responsible for establishing and maintaining disclosure controls and procedures (as defined in Rule 30a-3(c) under the Investment Company Act of 1940) and internal control over financial reporting (as defined in Rule 30a-3(d) under the Investment Company Act of 1940) for the registrant and have: |
| a) | Designed such disclosure controls and procedures, or caused such disclosure controls and procedures to be designed under our supervision, to ensure that material information relating to the registrant, including its consolidated subsidiaries, is made known to us by others within those entities, particularly during the period in which this report is being prepared; |
| b) | Designed such internal control over financial reporting, or caused such internal control over financial reporting to be designed under our supervision, to provide reasonable assurance regarding the reliability of financial reporting and the preparation of financial statements for external purposes in accordance with generally accepted accounting principles; |
| c) | Evaluated the effectiveness of the registrant’s disclosure controls and procedures and presented in this report our conclusions about the effectiveness of the disclosure controls and procedures, as of a date within 90 days prior to the filing date of this report based on such evaluation; and |
| d) | Disclosed in this report any change in the registrant’s internal control over financial reporting that occurred during the period covered by this report that has materially affected, or is reasonably likely to materially affect, the registrant’s internal control over financial reporting, |
| 5. | The registrant’s other certifying officer(s) and I have disclosed to the registrant’s auditors and the audit committee of the registrant’s board of directors (or persons performing the equivalent functions): |
| a) | All significant deficiencies and material weaknesses in the design or operation of internal controls which are reasonably likely to adversely affect the registrant’s ability to record, process, summarize, and report financial information; and |
| b) | Any fraud, whether or not material, that involves management or other employees who have a significant role in the registrant’s internal control over financial reporting. |
October 19, 2021
| /s/ Christian J. Kelly |
| Christian J. Kelly |
| Treasurer and Principal Financial and Accounting Officer |
Certification Pursuant to 18 U.S.C. Section 1350
As Adopted Pursuant to
Section 906 of the Sarbanes-Oxley Act of 2002
| Name of Issuer: | Prudential Investment Portfolios 4 |
In connection with the Report on Form N-CSR of the above-named issuer that is accompanied by this certification, the undersigned hereby certifies, to his or her knowledge, that:
| 1. | The Report fully complies with the requirements of Section 13(a) or 15(d) of the Securities Exchange Act of 1934; and |
| 2. | The information contained in the Report fairly presents, in all material respects, the financial condition and results of operations of the Issuer. |
| October 19, 2021 | /s/ Stuart S. Parker | |
| Stuart S. Parker | ||
| President and Principal Executive Officer | ||
| October 19, 2021 | /s/ Christian J. Kelly | |
| Christian J. Kelly | ||
| Treasurer and Principal Financial and | ||
| Accounting Officer | ||
This certification is being furnished solely pursuant to 18 U.S.C. Section 1350 and is not being filed as part of the Report or as a separate disclosure document.
Serious News for Serious Traders! Try StreetInsider.com Premium Free!
You May Also Be Interested In
- Gannett Schedules First Quarter 2024 Results
- Dr. Phyllis Worthy Dawkins, HBCU Executive Leadership Institute Executive Director, To Receive the Johnson C. Smith 2024 'Arch of Triumph' Award
- TCI Releases Smallest Active Filters Yet
Create E-mail Alert Related Categories
SEC FilingsSign up for StreetInsider Free!
Receive full access to all new and archived articles, unlimited portfolio tracking, e-mail alerts, custom newswires and RSS feeds - and more!
