

Form N-CSR PROFESSIONALLY MANAGED For: Mar 31
 Tweet
Tweet Share
ShareUNITED STATES
SECURITIES AND EXCHANGE COMMISSION
Washington, D.C. 20549
SECURITIES AND EXCHANGE COMMISSION
Washington, D.C. 20549
FORM N-CSR
CERTIFIED SHAREHOLDER REPORT OF REGISTERED
MANAGEMENT INVESTMENT COMPANIES
Investment Company Act file number (811-05037)
Professionally Managed Portfolios
(Exact name of registrant as specified in charter)
(Exact name of registrant as specified in charter)
615 East Michigan Street
Milwaukee, WI 53202
(Address of principal executive offices) (Zip code)
(Address of principal executive offices) (Zip code)
Jason Hadler
Professionally Managed Portfolios
c/o U.S. Bank Global Fund Services
777 E. Wisconsin Avenue
Milwaukee, WI 53202
(Name and address of agent for service)
777 E. Wisconsin Avenue
Milwaukee, WI 53202
(Name and address of agent for service)
(414) 516-1523
Registrant's telephone number, including area code
Date of fiscal year end: March 31
Date of reporting period: March 31, 2023
Item 1. Report to Stockholders.
|
(a)
|
|
ANNUAL REPORT • MARCH 31, 2023
Hodges Fund
Small Cap Fund
Small Intrinsic Value Fund
Blue Chip Equity Income Fund
www.hodgesfunds.com
Hodges Capital — Managing Equity Funds Since 1992
Table of Contents
|
Shareholder Letter
|
1
|
|
|
Sector Allocations
|
8
|
|
|
Schedules of Investments
|
15
|
|
|
Statements of Assets and Liabilities
|
22
|
|
|
Statements of Operations
|
23
|
|
|
Statements of Changes in Net Assets
|
24
|
|
|
Financial Highlights
|
28
|
|
|
Notes to Financial Statements
|
33
|
|
|
Report of Independent Registered Public Accounting Firm
|
42
|
|
|
Expense Examples
|
43
|
|
|
Trustees and Executive Officers
|
45
|
|
|
Statement Regarding Liquidity Risk Management Program
|
48
|
|
|
Additional Information
|
49
|
|
|
Privacy Notice
|
51
|
Hodges Mutual Funds
Dear Board of Directors:
The past twelve months have proven to be volatile for U.S. stocks as market sentiment shifts daily between pricing in a hard, soft, or emergency landing for the economy. The S&P
500 declined by 7.73%, and the NASDAQ Composite was down 11.30% in the one year ending March 31, 2023, reflecting weakness in mega-cap tech stocks in 2022. As measured by the Russell 2000, small-caps fell 11.61% over the past year, lagging due to
their cyclical sensitivity and exposure to regional banks. Value stocks have underperformed growth in recent months as economic uncertainty and tighter credit conditions have created an expectation that interest rates may stabilize and could contract
by year-end if economic conditions worsen. While turbulence surrounding bank failures and systemic risk to financial markets is unsettling, we are pleased to report that the performance of three Hodges Mutual Funds exceeded their benchmarks for the
twelve months ending March 31, 2023. Positive relative performance in several of our fund strategies was attributed to our steadfast focus on companies with sound business fundamentals and reasonable valuations.
It has been a whole year since the Fed started its tightening cycle, and capital markets have at least partially priced in one of the most anticipated recessions in the past forty
years. However, there is still ample uncertainty regarding the trajectory of interest rates and the prospects for changing economic conditions in the months ahead. In our opinion, the first-quarter relief rally in many mega-cap tech stocks has been a
function of a false flight to safety based on the anticipation that softer economic conditions could result in lower rates and higher valuations for growth stocks in the second half of 2023. We view the broad contraction in PE multiples relative to
current interest rates over the past year as warranted. According to the most recent data published by FactSet, the S&P 500 is trading at approximately 17.8X forward earnings estimates compared to 19.5X a year ago and 21.2X at the beginning of
2022. The inverse of the current S&P 500 PE multiple reflects an earnings yield of 5.56%, which was still above the 10-year Treasury yield of 3.56% at the quarter-end. The big macro questions are now; Not if, but how much will the U.S. economy
contract, and to what degree will it drag on corporate earnings and cash flow? We would point out that many businesses have spent the last six months cutting costs, scrutinizing capital expenditures, tightening supply chains, and cautiously managing
inventories in anticipation of a slowdown. However, the inevitable contraction in bank lending and tighter credit will be challenging for businesses and industries dependent on accessing easy credit.
This sometimes creates opportunities for companies with conservative balance sheets, low-cost operations, and ample liquidity to weather a downturn. Our investment team’s recent
discussions with public company management teams over the past few months suggest that labor costs are stabilizing. Many other input costs have also been moderated in recent months. Consumer spending increased last year due to excess savings built up
during the pandemic but appears more challenging in 2023. The housing market has cooled down due to higher mortgage rates but does not appear to be overbuilt. The most recent Purchasing Managers Index (PMI), which measures the direction of economic
trends in manufacturing and service sectors, fell below 46.3, a reading that has historically occurred during or just before a recession. Although the odds of a recession have risen this year, we believe many facets of manufacturing could undergo a
renaissance over the next several years due to onshoring and nearshoring supply chains and an increase in infrastructure-related spending. It is also important to note that not every economic slowdown looks the same, and not every business will be
affected the same by potential macro headwinds. In this environment, active portfolio management becomes essential to navigate quickly changing business conditions across many sectors. Furthermore, an economic slowdown and tighter credit conditions
favor stocks with solid balance sheets whose underlying assets can produce stable cash flow and earnings. With this in mind, the Hodges Capital Management investment team has positioned our portfolios to benefit from shifting economic trends and
secular and structural changes across different industries.
As we look at the balance of 2023, our portfolios remain laser-focused on fundamental investing and individual stock selection. Our investing approach involves spending little time
predicting short-term fluctuations in interest rates, foreign currencies, or commodity prices. Instead, we pay close attention to how prices and, more importantly, the pricing power that our portfolio companies exhibit within the goods and services
they produce. For many businesses, tighter credit conditions and a slowdown in demand could adversely impact profit margins and revenues in the months ahead. As a result, the investment team at Hodges Capital is rigorously looking for bargains in
businesses that we believe are well-run and control their destiny by relying on ingenuity and well-calculated business decisions rather than day-to-day momentum in the economy or stock market. Despite challenging macro conditions, we are
overweighting our portfolios with growth and value stocks that can create shareholder value.
During this time of ambiguity, investors in the Hodges Funds can be assured that we are not changing our core investment discipline, designed to seek out quality companies running
great businesses with excellent management teams trading at reasonable prices. Furthermore, we see this as an ideal environment for active portfolio managers to carefully select individual stocks that we believe can generate long-term value for
shareholders.
1
Hodges Mutual Funds
Returns (Retail Class) as of 03/31/2023:
|
Since
|
|||||
|
1 Year
|
3 Years
|
5 Years
|
10 Years
|
Inception
|
|
|
Hodges Fund
|
|||||
|
(HDPMX) 10/09/1992
|
-12.44%
|
36.33%
|
3.18%
|
8.72%
|
9.17%
|
|
S&P 500® Index
|
-7.73%
|
18.60%
|
11.19%
|
12.24%
|
10.06%
|
|
Hodges Small Cap Fund
|
|||||
|
(HDPSX) 12/18/2007
|
-4.68%
|
34.12%
|
7.18%
|
8.28%
|
8.98%
|
|
Russell 2000® Return Index
|
-11.61%
|
17.51%
|
4.71%
|
8.04%
|
7.33%
|
|
Hodges Small Intrinsic Value Fund
|
|||||
|
(HDSVX) 12/26/2013
|
-5.92%
|
38.98%
|
8.01%
|
—
|
8.25%
|
|
Russell 2000® Value Return Index
|
-12.96%
|
21.01%
|
4.55%
|
—
|
5.68%
|
|
Russell 2000® Index
|
-11.61%
|
17.51%
|
4.71%
|
—
|
6.27%
|
|
Hodges Blue Chip Equity Income Fund
|
|||||
|
(HDPBX) 09/10/2009
|
-4.96%
|
20.49%
|
10.53%
|
11.29%
|
10.97%
|
|
Russell 1000® Index
|
-8.39%
|
18.55%
|
10.87%
|
12.01%
|
12.76%
|
|
Average Annualized
|
|
HDPSX
|
HDPMX
|
HDSVX
|
HDPBX
|
||
|
Gross Expense Ratio
|
1.38%
|
1.35%
|
2.05%
|
1.49%
|
|
|
Net Expense Ratio
|
1.36%*
|
1.17%*
|
1.29%*
|
1.30%*
|
|
*
|
The Advisor has contractually agreed to reduce its fees at least until July 31, 2023. This figure excludes Acquired Fund Fees and Expenses, interest, taxes, and extraordinary expenses. The
Advisor is permitted, with Board approval, to be reimbursed for fee reduction and/or expense payments made in the prior three years from the date the fees were waived and/or expenses were paid. Please see prospectus for details.
|
Performance data quoted represents past performance and does not guarantee future results. The investment return and principal value of an investment will fluctuate so that an
investor’s shares, when redeemed, may be worth more or less than their original cost. The current performance of the Funds may be lower or higher than the performance quoted. Performance data current to the most recent month-end may be obtained by
calling 866-811-0224. The Funds impose a 1.00% redemption fee on shares held for thirty days or less (60 days or less for Institutional Class shares). Performance data quoted does not reflect the redemption fee. If reflected, total returns would be
reduced. See the Financial Highlights in this report for the most current expense ratios.
2
Hodges Mutual Funds
Hodges Fund (HDPMX)
The Hodges Fund’s twelve-month return amounted to a loss of 12.44% compared to a loss of 7.73% for the S&P 500 Index. Lackluster performance was attributed to a handful of
consumer discretionary, materials, healthcare, and technology stocks. The Hodges Fund’s turnover was elevated over the past year to exploit prevailing market conditions. We have upgraded many portfolio holdings into stocks that we believe offer
above-average returns relative to their downside risks over the next twelve to eighteen months.
The Hodges Fund’s portfolio managers remain laser-focused on investments where we have the highest conviction based on fundamentals and relative valuations. The number of positions
held in the Fund decreased to 40 from 43 a the same time a year ago. On March 31, 2023, the top ten holdings represented 44.61% of the Fund’s holdings. They included Matador Resources Co (MTDR), Uber Technologies (UBER), Texas Pacific Land Corp
(TPL), On Holding (ONON), On Semiconductor (ON), Encore Wire Corp (WIRE), Cleveland-Cliffs Inc (CLF), Chesapeake Energy Corp (CHK), Cinemark Holdings (CNK), and Eagle Materials Inc (EXP).
Hodges Fund vs S&P 500® Index
As of 03/31/2023

3
Hodges Mutual Funds
Hodges Small Cap Fund (HDPSX)
The Small Cap Fund’s one-year performance as of March 31, 2023, amounted to a loss of 4.68% compared to a loss of 11.61% for the Russell 2000 Index during the same period. Although
small-caps have been underperforming large-cap stocks this year, we view the current risk-reward for holding quality small-cap stocks as attractive. While small-cap stocks tend to experience greater volatility during market turmoil, we expect this
segment to generate above-average relative risk-adjusted returns over the long term.
The Hodges Small Cap Fund remains well diversified across industrials, transportation, healthcare, technology, and consumer-related names, which we expect to contribute to the Fund’s
long-term performance. The Fund recently took profits in several stocks that appeared overvalued relative to their underlying fundamentals and established new positions with an attractive risk/reward profile. The Fund had a total of 51 positions on
March 31, 2023. The top ten holdings amounted to 37.05% of the Fund’s holdings and included Eagle Materials Inc (EXP), Matador Resources (MTDR), SM Energy Co (SM), Taylor Morrison Home Corp (TMHC), On Holding (ONON), Texas Pacific Land Corp (TPL),
Cleveland-Cliffs Inc (CLF), Vista Outdoor (VSTO), Hilltop Holdings Inc (HTH), and Encore Wire Corp (WIRE).
Hodges Small Cap Fund vs Russell 2000® Return Index
As of 03/31/2023

4
Hodges Mutual Funds
Hodges Small Intrinsic Value Fund (HDSVX)
Over the last twelve months, the Hodges Small Intrinsic Value Fund experienced a loss of 5.92% compared to a loss of 12.96% for the Russell 2000 Value Index. The Fund’s solid relative
performance over the past year was attributed to several of the Fund’s material, consumer staples, and industrial stocks. The Fund held 49 positions on March 31, 2023. The top 10 holdings, excluding cash, represented 32.11% of the Fund’s holdings and
included Eagle Materials Inc (EXP), Triumph Financial Inc (TFIN), Taylor Morrison Home Corp (TMHC), Builders FirstSource (BLDR), Brunswick Corp (BC), Chord Energy Corp (CHRD), Vista Outdoor Inc (VSTO), Cleveland-Cliffs Inc (CLF), Home Bancshares Inc
(HOMB), and Treehouse Foods Inc (THS).
Hodges Small Intrinsic Value Fund vs
Russell 2000® Value Return Index & Russell 2000® Index
As of 03/31/2023

5
Hodges Mutual Funds
Hodges Blue Chip Equity Income Fund (HDPBX)
The Hodges Blue Chip Equity Income Fund experienced a negative annualized return of 4.96% compared to a loss of 8.39% for the Russell 1000 Index. Positive relative performance was
attributed to sector allocation among energy and technology names. Although large-cap stocks have held up better than small and mid-cap stocks during the recent sell-off, we see the current investing landscape as offering plenty of attractive,
high-quality dividend-paying stocks with solid upside potential. We expect underleveraged balance sheets and corporate profits across most blue-chip stocks to support stable dividends over the next several years. The Blue Chip Equity Income Fund
remains well-diversified in companies that we believe can generate above-average income and total returns on a risk-adjusted basis. The Fund held 27 positions on March 31, 2023. The top ten holdings represented 49.15% of the Fund’s holdings and
included Apple Inc (AAPL), Microsoft Corp (MSFT), Deere & Co (DE), Exxon Mobil Corp (XOM), Tesla (TSLA), Texas Instruments Inc (TXN), Novo Nordisk (NVO), Nvidia (NVDA), PepsiCo Inc (PEP), and Costco Wholesale (COST).
Hodges Blue Chip Equity Income Fund vs Russell 1000® Index
As of 03/31/2023

6
Hodges Mutual Funds
In conclusion, we remain optimistic regarding the long-term investment opportunities surrounding the Hodges Mutual Funds. By offering four distinct mutual fund strategies covering
most segments of the domestic equity market, we can serve most financial advisors’ and individual investors’ diverse needs. Our entire investment team is rigorously studying companies, meeting with management teams, observing trends, and navigating
today’s ever-changing financial markets. Feel free to contact us directly if we can address any specific questions.
Sincerely,
 |
 |
|
|
Craig Hodges
|
 |
Eric Marshall, CFA
|
|
Co-Portfolio Manager
|
Co-Portfolio Manager
|
|
 |
 |
|
|
Gary Bradshaw
|
Chris Terry, CFA
|
Derek Maupin
|
|
Co-Portfolio Manager
|
Co-Portfolio Manager
|
Co-Portfolio Manager
|
The above discussion is based on the opinions of Eric Marshall, CFA, and is subject to change. It is not intended to be a forecast of future events, a guarantee of future results,
and is not a recommendation to buy or sell any security. Portfolio composition and company ownership in the Hodges Funds are subject to daily change.
Must be preceded or accompanied by a prospectus.
Mutual fund investing involves risk. Principal loss is possible. Investments in foreign securities involve greater volatility and political, economic and currency risks and
differences in accounting methods. These risks are greater for investments in emerging markets. Options and future contracts have the risks of unlimited losses of the underlying holdings due to unanticipated market movements and failure to correctly
predict the direction of securities prices, interest rates and currency exchange rates. These risks may be greater than risks associated with more traditional investments. Short sales of securities involve the risk that losses may exceed the original
amount invested. Investments in debt securities typically decrease in value when interest rates rise. This risk is usually greater for longer term debt securities. Investments in small and medium capitalization companies involve additional risks such
as limited liquidity and greater volatility. Funds that are non-diversified are more exposed to individual stock volatility than a diversified fund. Investments in companies that demonstrate special situations or turnarounds, meaning companies that
have experienced significant business problems but are believed to have favorable prospects for recovery, involve greater risk.
Value investing carries the risk that the market will not recognize a security’s inherent value for a long time, or that a stock judged to be undervalued may be appropriately priced
or overvalued.
Diversification does not assure a profit or protect against a loss in a declining market.
Fund holdings and/or sector allocations are subject to change at any time and are not recommendations to buy or sell any security.
Investment performance reflects fee waivers in effect. In the absence of such waivers, total return would be reduced.
The S&P 500 Index is a broad-based unmanaged index of 500 stocks that is widely recognized as representative of the equity market in general. The Russell 1000 Index is a subset of the Russell 3000
Index and consists of the 1,000 largest companies comprising over 90% of the total market capitalization of all listed stocks. The Russell 2000 Index consists of the smallest 2,000 companies in a group of 3,000 U.S. companies in the Russell 3000
Index, as ranked by market capitalization. The Russell 2500 Index consists of the smallest 2,500 companies in a group of 3,000 U.S. companies in the Russell 3000 Index, as ranked by market capitalization. The Russell 3000 Index is a stock index
consisting of the 3000 largest publicly listed companies, representing about 98% of the total capitalization of the entire U.S. stock market. You cannot invest directly in an index. The Russell 2000 Value Index measures the performance of small-cap
value segment of the U.S. equity universe. It includes those Russell 2000 companies with lower price-to-book ratios and lower forecasted growth values. The Russell 2000 Value Index is constructed to provide a comprehensive and unbiased barometer for
the small-cap value segment. The Index is completely reconstituted annually to ensure larger stocks do not distort the performance and characteristics of the true small-cap opportunity set and that the represented companies continue to reflect value
characteristics.
Cash Flow: A revenue or expense stream that changes a cash account over a given period.
Price/earnings (P/E): The most common measure of how expensive a stock is.
Earnings Growth is not a measure of the Fund’s future performance.
Hodges Capital Management is the Advisor to the Hodges Funds.
Hodges Funds are distributed by Quasar Distributors LLC.
7
Hodges Mutual Funds
|
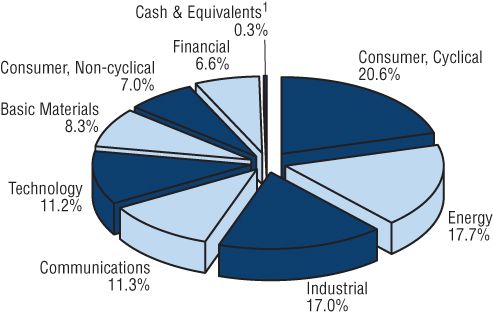
SECTOR ALLOCATIONS At March 31, 2023 (Unaudited)
|
(as a percentage of net assets)
Hodges Fund
(HDPMX)
Small Cap Fund
(HDPSX & HDSIX)
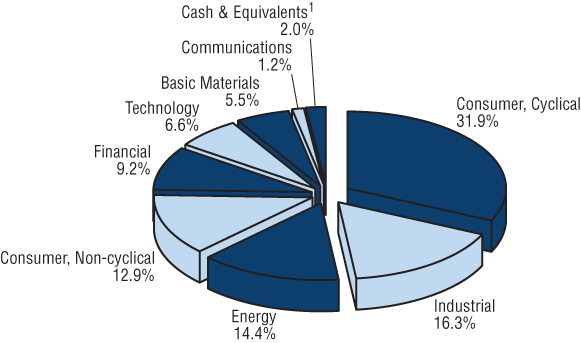
1 Other assets in excess of liabilities.
8
Hodges Mutual Funds
|
SECTOR ALLOCATIONS At March 31, 2023 (Unaudited)
|
(as a percentage of net assets)
Small Intrinsic Value Fund
(HDSVX)

Blue Chip Equity Income Fund
(HDPBX)

1 Other assets in excess of liabilities.
9
Hodges Fund (Unaudited)
Value of $10,000 vs. S&P 500® Index
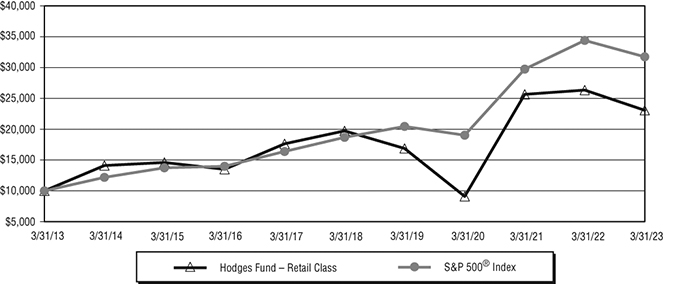
Annualized Returns for the periods ended March 31, 2023
|
Since Inception
|
Ending Value
|
|||||
|
One Year
|
Three Year
|
Five Year
|
Ten Year
|
(10/9/92)
|
(3/31/2023)
|
|
|
Hodges Fund
|
-12.44%
|
36.33%
|
3.18%
|
8.72%
|
9.17%
|
$23,063
|
|
S&P 500® Index
|
-7.73%
|
18.60%
|
11.19%
|
12.24%
|
10.06%
|
31,736
|
This chart illustrates the performance of a hypothetical $10,000 investment made on March 31, 2013, and is not intended to imply any future performance. The returns shown do not reflect the deduction of
taxes that a shareholder would pay on Fund distributions or the redemption of Fund shares. The returns reflect fee waivers in effect. In the absence of such waivers, total return would be reduced. The chart assumes reinvestment of capital gains,
dividends, and return of capital, if applicable, for a Fund and dividends for an index.
Performance data quoted represents past performance and does not guarantee future results. The investment return and principal value of an investment will fluctuate so that an
investor’s shares, when redeemed, may be worth more or less than their original cost. Current performance of the Fund may be lower or higher than the performance quoted. Performance data current to the most recent month end may be obtained by
calling (866) 811-0224.
The Fund imposes a 1.00% redemption fee on Retail shares held for less than 30 days. Performance does not reflect the redemption fee. If reflected, total returns would be reduced.
10
Small Cap Fund – Retail Class (Unaudited)
Value of $10,000 vs. Russell 2000® Index

Annualized Returns for the periods ended March 31, 2023
|
Since Inception
|
Ending Value
|
|||||
|
One Year
|
Three Year
|
Five Year
|
Ten Year
|
(12/18/07)
|
(3/31/2023)
|
|
|
Small Cap Fund – Retail Class
|
-4.68%
|
34.12%
|
7.18%
|
8.28%
|
8.98%
|
$22,148
|
|
Russell 2000® Index
|
-11.61%
|
17.51%
|
4.71%
|
8.04%
|
7.33%
|
21,661
|
This chart illustrates the performance of a hypothetical $10,000 investment made on March 31, 2013, and is not intended to imply any future performance. The returns shown do not reflect the deduction of
taxes that a shareholder would pay on Fund distributions or the redemption of Fund shares. The returns reflect fee waivers in effect. In the absence of such waivers, total return would be reduced. The chart assumes reinvestment of capital gains,
dividends, and return of capital, if applicable, for a Fund and dividends for an index.
Performance data quoted represents past performance and does not guarantee future results. The investment return and principal value of an investment will fluctuate so that an
investor’s shares, when redeemed, may be worth more or less than their original cost. Current performance of the Fund may be lower or higher than the performance quoted. Performance data current to the most recent month end may be obtained by
calling (866) 811-0224.
The Fund imposes a 1.00% redemption fee on Retail shares held for less than 30 days. Performance does not reflect the redemption fee. If reflected, total returns would be reduced.
11
Small Cap Fund – Institutional Class (Unaudited)
Value of $1,000,000 vs. Russell 2000® Index

Annualized Returns for the periods ended March 31, 2023
|
Since Inception
|
Ending Value
|
|||||
|
One Year
|
Three Year
|
Five Year
|
Ten Year
|
(12/12/08)
|
(3/31/2023)
|
|
|
Small Cap Fund – Institutional Class
|
-4.40%
|
34.50%
|
7.45%
|
8.58%
|
14.73%
|
$2,278,527
|
|
Russell 2000® Index
|
-11.61%
|
17.51%
|
4.71%
|
8.04%
|
11.39%
|
2,166,070
|
This chart illustrates the performance of a hypothetical $1,000,000 investment made on March 31, 2013, and is not intended to imply any future performance. The returns shown do not reflect the deduction
of taxes that a shareholder would pay on Fund distributions or the redemption of Fund shares. The returns reflect fee waivers in effect. In the absence of such waivers, total return would be reduced. The chart assumes reinvestment of capital
gains, dividends, and return of capital, if applicable, for a Fund and dividends for an index.
Performance data quoted represents past performance and does not guarantee future results. The investment return and principal value of an investment will fluctuate so that an
investor’s shares, when redeemed, may be worth more or less than their original cost. Current performance of the Fund may be lower or higher than the performance quoted. Performance data current to the most recent month end may be obtained by
calling (866) 811-0224.
The Fund imposes a 1.00% redemption fee on Institutional shares held for less than 60 days. Performance does not reflect the redemption fee. If reflected, total returns would be
reduced.
12
Small Intrinsic Value Fund (Unaudited)
Value of $10,000 vs. Russell 2000® Index & Russell 2000® Value Index

Annualized Returns for the periods ended March 31, 2023
|
Since Inception
|
Ending Value
|
||||
|
One Year
|
Three Year
|
Five Year
|
(12/26/13)
|
(3/31/2023)
|
|
|
Small Intrinsic Value Fund
|
-5.92%
|
38.98%
|
8.01%
|
8.25%
|
$20,843
|
|
Russell 2000® Index
|
-11.61%
|
17.51%
|
4.71%
|
6.27%
|
17,559
|
|
Russell 2000® Value Index
|
-12.96%
|
21.01%
|
4.55%
|
5.68%
|
16,677
|
This chart illustrates the performance of a hypothetical $10,000 investment made on December 26, 2013, and is not intended to imply any future performance. The returns shown do not reflect the deduction
of taxes that a shareholder would pay on Fund distributions or the redemption of Fund shares. The returns reflect fee waivers in effect. In the absence of such waivers, total return would be reduced. The chart assumes reinvestment of capital
gains, dividends, and return of capital, if applicable, for a Fund and dividends for an index.
Performance data quoted represents past performance and does not guarantee future results. The investment return and principal value of an investment will fluctuate so that an
investor’s shares, when redeemed, may be worth more or less than their original cost. Current performance of the Fund may be lower or higher than the performance quoted. Performance data current to the most recent month end may be obtained by
calling (866) 811-0224.
The Fund imposes a 1.00% redemption fee on Retail shares held for less than 30 days. Performance does not reflect the redemption fee. If reflected, total returns would be reduced.
13
Blue Chip Equity Income Fund (Unaudited)
Value of $10,000 vs. Russell 1000® Index

Annualized Returns for the periods ended March 31, 2023
|
Since Inception
|
Ending Value
|
|||||
|
One Year
|
Three Year
|
Five Year
|
Ten Year
|
(9/10/09)
|
(3/31/2023)
|
|
|
Blue Chip Equity Income Fund
|
-4.96%
|
20.49%
|
10.53%
|
11.29%
|
10.97%
|
$29,147
|
|
Russell 1000® Index
|
-8.39%
|
18.55%
|
10.87%
|
12.01%
|
12.76%
|
31,095
|
This chart illustrates the performance of a hypothetical $10,000 investment made on March 31, 2013, and is not intended to imply any future performance. The returns shown do not reflect the deduction of
taxes that a shareholder would pay on Fund distributions or the redemption of Fund shares. The returns reflect fee waivers in effect. In the absence of such waivers, total return would be reduced. The chart assumes reinvestment of capital gains,
dividends, and return of capital, if applicable, for a Fund and dividends for an index.
Performance data quoted represents past performance and does not guarantee future results. The investment return and principal value of an investment will fluctuate so that an
investor’s shares, when redeemed, may be worth more or less than their original cost. Current performance of the Fund may be lower or higher than the performance quoted. Performance data current to the most recent month end may be obtained by
calling (866) 811-0224.
The Fund imposes a 1.00% redemption fee on Retail shares held for less than 30 days. Performance does not reflect the redemption fee. If reflected, total returns would be reduced.
14
Hodges Fund
|
SCHEDULE OF INVESTMENTS at March 31, 2023
|
|
Shares
|
Value
|
||||||
|
COMMON STOCKS: 96.5%
|
|||||||
|
Aerospace & Defense: 2.3%
|
|||||||
|
100,000
|
Spirit AeroSystems
|
||||||
|
Holdings, Inc. – Class A
|
$
|
3,453,000
|
|||||
|
Airlines: 0.8%
|
|||||||
|
116,063
|
Frontier Group Holdings, Inc. 1
|
1,142,060
|
|||||
|
Apparel: 4.5%
|
|||||||
|
220,000
|
On Holding AG – Class A 1
|
6,826,600
|
|||||
|
Auto Manufacturers: 2.5%
|
|||||||
|
75,000
|
General Motors Co.
|
2,751,000
|
|||||
|
5,000
|
Tesla, Inc. 1
|
1,037,300
|
|||||
|
3,788,300
|
|||||||
|
Banks: 2.9%
|
|||||||
|
40,000
|
Comerica, Inc.
|
1,736,800
|
|||||
|
25,000
|
Cullen/Frost Bankers, Inc.
|
2,633,500
|
|||||
|
4,370,300
|
|||||||
|
Building Materials: 6.7%
|
|||||||
|
75,000
|
The AZEK Co., Inc. – Class A 1
|
1,765,500
|
|||||
|
45,000
|
Builders FirstSource, Inc. 1
|
3,995,100
|
|||||
|
30,000
|
Eagle Materials, Inc.
|
4,402,500
|
|||||
|
10,163,100
|
|||||||
|
Commercial Services: 3.9%
|
|||||||
|
400,000
|
The GEO Group, Inc. 1
|
3,156,000
|
|||||
|
150,000
|
Toast, Inc. – Class A 1
|
2,662,500
|
|||||
|
5,818,500
|
|||||||
|
Computers: 1.6%
|
|||||||
|
100,000
|
NCR Corp. 1
|
2,359,000
|
|||||
|
Diversified Financial Services: 2.4%
|
|||||||
|
70,000
|
The Charles Schwab Corp.
|
3,666,600
|
|||||
|
Electrical Components & Equipment: 4.3%
|
|||||||
|
35,000
|
Encore Wire Corp.
|
6,486,550
|
|||||
|
Electronics: 2.5%
|
|||||||
|
100,000
|
Coherent Corp. 1
|
3,808,000
|
|||||
|
Entertainment: 2.9%
|
|||||||
|
300,000
|
Cinemark Holdings, Inc. 1
|
4,437,000
|
|||||
|
Healthcare Products: 1.7%
|
|||||||
|
750,000
|
ViewRay, Inc. 1
|
2,595,000
|
|||||
|
Internet: 10.4%
|
|||||||
|
100,000
|
Revolve Group, Inc. – Class A 1
|
2,630,000
|
|||||
|
500,000
|
Solo Brands, Inc. – Class A 1
|
3,590,000
|
|||||
|
300,000
|
Uber Technologies, Inc. 1
|
9,510,000
|
|||||
|
15,730,000
|
|||||||
|
Iron & Steel: 5.6%
|
|||||||
|
350,000
|
Cleveland-Cliffs, Inc. 1
|
6,415,500
|
|||||
|
40,000
|
Commercial Metals Co.
|
1,956,000
|
|||||
|
8,371,500
|
|||||||
|
Leisure Time: 7.7%
|
|||||||
|
250,000
|
Norwegian Cruise Line Holdings Ltd. 1
|
3,362,500
|
|||||
|
200,000
|
Topgolf Callaway Brands Corp. 1
|
4,324,000
|
|||||
|
140,000
|
Vista Outdoor, Inc. 1
|
3,879,400
|
|||||
|
11,565,900
|
|||||||
|
Lodging: 1.9%
|
|||||||
|
25,000
|
Wynn Resorts Ltd. 1
|
2,797,750
|
|||||
|
Mining: 2.7%
|
|||||||
|
100,000
|
Freeport-McMoRan, Inc.
|
4,091,000
|
|||||
|
Oil & Gas Drilling: 2.1%
|
|||||||
|
500,000
|
Transocean Ltd. 1
|
3,180,000
|
|||||
|
Oil Companies Exploration & Production: 9.8%
|
|||||||
|
70,000
|
Chesapeake Energy Corp.
|
5,322,800
|
|||||
|
200,000
|
Matador Resources Co.
|
9,530,000
|
|||||
|
14,852,800
|
|||||||
|
Oil Field Services: 0.7%
|
|||||||
|
150,000
|
ProPetro Holding Corp. 1
|
1,078,500
|
|||||
|
Pharmaceuticals: 0.8%
|
|||||||
|
75,000
|
Takeda Pharmaceutical Co Ltd. 1
|
1,236,000
|
|||||
|
Private Equity: 1.3%
|
|||||||
|
200,000
|
P10, Inc. – Class A
|
2,022,000
|
|||||
|
Semiconductors: 6.4%
|
|||||||
|
50,000
|
Micron Technology, Inc.
|
3,017,000
|
|||||
|
80,000
|
ON Semiconductor Corp. 1
|
6,585,600
|
|||||
|
9,602,600
|
|||||||
|
Software: 1.8%
|
|||||||
|
619,923
|
Upland Software, Inc. 1
|
2,665,669
|
|||||
|
Telecommunications: 0.9%
|
|||||||
|
40,000
|
Corning, Inc.
|
1,411,200
|
|||||
|
Textiles: 0.3%
|
|||||||
|
564,641
|
The Dixie Group, Inc. 1
|
429,127
|
|||||
|
U.S. Royalty Trusts: 5.1%
|
|||||||
|
4,500
|
Texas Pacific Land Corp.
|
7,654,590
|
|||||
|
TOTAL COMMON STOCKS
|
|||||||
|
(Cost $115,987,214)
|
145,602,646
|
||||||
The accompanying notes are an integral part of these financial statements.
15
Hodges Fund
|
SCHEDULE OF INVESTMENTS at March 31, 2023 (Continued)
|
|
Notional
|
|||||||||||
|
Shares
|
Amount
|
Value
|
|||||||||
|
CALL OPTIONS PURCHASED: 3.2%
|
|||||||||||
|
Machinery – Diversified: 1.2%
|
|||||||||||
|
1,000
|
AGCO Corp.,
|
||||||||||
|
Expiration:
|
|||||||||||
|
May 2023,
|
|||||||||||
|
Exercise Price:
$120.00
|
|||||||||||
|
$
|
13,520,000
|
$
|
1,830,000
|
||||||||
|
Pharmaceuticals: 0.6%
|
|||||||||||
|
250
|
Novo Nordisk A/S,
|
||||||||||
|
Expiration:
|
|||||||||||
|
June 2023,
|
|||||||||||
|
Exercise Price:
$125.00
|
|||||||||||
|
3,978,500
|
913,750
|
||||||||||
|
Semiconductors: 1.4%
|
|||||||||||
|
250
|
NVIDIA Corp.,
|
||||||||||
|
Expiration:
|
|||||||||||
|
June 2023,
|
|||||||||||
|
Exercise Price:
$200.00
|
|||||||||||
|
6,944,250
|
2,090,625
|
||||||||||
|
TOTAL CALL OPTIONS PURCHASED
|
|||||||||||
|
(Cost $3,883,810)
|
4,834,375
|
||||||||||
|
TOTAL INVESTMENTS IN SECURITIES: 99.7%
|
|||||||||||
|
(Cost $119,871,024)
|
150,437,021
|
||||||||||
|
Other Assets in Excess of Liabilities: 0.3%
|
498,460
|
||||||||||
|
TOTAL NET ASSETS: 100.0%
|
$
|
150,935,481
|
|||||||||
|
1
|
Non-income producing security.
|
The accompanying notes are an integral part of these financial statements.
16
Small Cap Fund
|
SCHEDULE OF INVESTMENTS at March 31, 2023
|
|
Shares
|
Value
|
||||||
|
COMMON STOCKS: 98.0%
|
|||||||
|
Airlines: 3.2%
|
|||||||
|
60,000
|
Alaska Air Group, Inc. 1
|
$
|
2,517,600
|
||||
|
275,000
|
Frontier Group Holdings, Inc. 1
|
2,706,000
|
|||||
|
25,000
|
Spirit Airlines, Inc.
|
429,250
|
|||||
|
5,652,850
|
|||||||
|
Apparel: 3.5%
|
|||||||
|
200,000
|
On Holding AG – Class A 1
|
6,206,000
|
|||||
|
Apparel & Shoe Retail: 2.1%
|
|||||||
|
150,000
|
Shoe Carnival, Inc.
|
3,847,500
|
|||||
|
Automobile: 2.1%
|
|||||||
|
17,000
|
Group 1 Automotive, Inc.
|
3,849,140
|
|||||
|
Banks: 7.9%
|
|||||||
|
60,000
|
Comerica, Inc.
|
2,605,200
|
|||||
|
25,000
|
Cullen/Frost Bankers, Inc.
|
2,633,500
|
|||||
|
180,000
|
Hilltop Holdings, Inc.
|
5,340,600
|
|||||
|
57,000
|
Prosperity Bancshares, Inc.
|
3,506,640
|
|||||
|
14,085,940
|
|||||||
|
Building Materials: 5.0%
|
|||||||
|
60,000
|
Eagle Materials, Inc.
|
8,805,000
|
|||||
|
Commercial Services: 3.4%
|
|||||||
|
75,000
|
Lawson Products, Inc. 1
|
3,409,500
|
|||||
|
150,000
|
Toast, Inc. – Class A 1
|
2,662,500
|
|||||
|
6,072,000
|
|||||||
|
Computers: 1.5%
|
|||||||
|
110,000
|
NCR Corp. 1
|
2,594,900
|
|||||
|
Electrical Components & Equipment: 2.9%
|
|||||||
|
28,000
|
Encore Wire Corp.
|
5,189,240
|
|||||
|
Electronics: 3.6%
|
|||||||
|
50,000
|
Avnet, Inc.
|
2,260,000
|
|||||
|
170,000
|
Kimball Electronics, Inc. 1
|
4,097,000
|
|||||
|
6,357,000
|
|||||||
|
Entertainment: 2.5%
|
|||||||
|
300,000
|
Cinemark Holdings, Inc. 1
|
4,437,000
|
|||||
|
Food: 3.9%
|
|||||||
|
100,000
|
Sprouts Farmers Market, Inc. 1
|
3,503,000
|
|||||
|
450,000
|
SunOpta, Inc. 1
|
3,465,000
|
|||||
|
6,968,000
|
|||||||
|
Healthcare Products: 5.6%
|
|||||||
|
150,000
|
Bausch + Lomb Corp. 1
|
2,611,500
|
|||||
|
130,000
|
Inmode Ltd. 1
|
4,154,800
|
|||||
|
50,000
|
STAAR Surgical Co. 1
|
3,197,500
|
|||||
|
9,963,800
|
|||||||
|
Home Builders: 4.0%
|
|||||||
|
185,000
|
Taylor Morrison Home Corp. 1
|
7,078,100
|
|||||
|
Home Furnishings: 4.7%
|
|||||||
|
140,000
|
Ethan Allen Interiors, Inc.
|
3,844,400
|
|||||
|
60,000
|
The Lovesac Co. 1
|
1,734,000
|
|||||
|
11,000
|
RH 1
|
2,679,050
|
|||||
|
8,257,450
|
|||||||
|
Insurance: 1.3%
|
|||||||
|
45,868
|
Goosehead Insurance, Inc. – Class A 1
|
2,394,310
|
|||||
|
Internet: 0.9%
|
|||||||
|
60,000
|
Revolve Group, Inc. – Class A 1
|
1,578,000
|
|||||
|
Iron & Steel: 5.5%
|
|||||||
|
320,000
|
Cleveland-Cliffs, Inc. 1
|
5,865,600
|
|||||
|
80,000
|
Commercial Metals Co.
|
3,912,000
|
|||||
|
9,777,600
|
|||||||
|
Leisure Time: 5.5%
|
|||||||
|
30,000
|
Brunswick Corp.
|
2,460,000
|
|||||
|
125,000
|
Norwegian Cruise Line Holdings Ltd. 1
|
1,681,250
|
|||||
|
200,000
|
Vista Outdoor, Inc. 1
|
5,542,000
|
|||||
|
9,683,250
|
|||||||
|
Lodging: 1.6%
|
|||||||
|
45,000
|
Boyd Gaming Corp.
|
2,885,400
|
|||||
|
Machinery – Diversified: 1.0%
|
|||||||
|
10,000
|
Alamo Group, Inc.
|
1,841,600
|
|||||
|
Oil Companies Exploration & Production: 11.0%
|
|||||||
|
175,000
|
Matador Resources Co.
|
8,338,750
|
|||||
|
350,000
|
Permian Resources Corp. – Class A
|
3,675,000
|
|||||
|
265,000
|
SM Energy Co.
|
7,462,400
|
|||||
|
19,476,150
|
|||||||
|
Packaging & Containers: 2.2%
|
|||||||
|
150,000
|
Graphic Packaging Holding Co.
|
3,823,500
|
|||||
|
Restaurants: 1.2%
|
|||||||
|
20,000
|
Texas Roadhouse, Inc.
|
2,161,200
|
|||||
|
Semiconductors: 4.8%
|
|||||||
|
45,000
|
Diodes, Inc. 1
|
4,174,200
|
|||||
|
40,000
|
Kulicke & Soffa Industries, Inc.
|
2,107,600
|
|||||
|
35,000
|
Silicon Motion
|
||||||
|
Technology Corp. – ADR
|
2,293,200
|
||||||
|
8,575,000
|
|||||||
|
Software: 0.3%
|
|||||||
|
120,000
|
Upland Software, Inc. 1
|
516,000
|
|||||
|
Sporting Goods: 1.5%
|
|||||||
|
40,000
|
Academy Sports & Outdoors, Inc.
|
2,610,000
|
|||||
The accompanying notes are an integral part of these financial statements.
17
Small Cap Fund
|
SCHEDULE OF INVESTMENTS at March 31, 2023 (Continued)
|
|
Shares
|
Value
|
||||||
|
Telecommunications: 0.3%
|
|||||||
|
70,000
|
DZS, Inc. 1
|
$
|
552,300
|
||||
|
Transportation: 1.6%
|
|||||||
|
40,000
|
Kirby Corp. 1
|
2,787,999
|
|||||
|
U.S. Royalty Trusts: 3.4%
|
|||||||
|
3,500
|
Texas Pacific Land Corp.
|
5,953,570
|
|||||
|
TOTAL COMMON STOCKS
|
|||||||
|
(Cost $117,918,114)
|
173,979,799
|
||||||
|
TOTAL INVESTMENTS IN SECURITIES: 98.0%
|
|||||||
|
(Cost $117,918,114)
|
173,979,799
|
||||||
|
Other Assets in Excess of Liabilities: 2.0%
|
3,565,057
|
||||||
|
TOTAL NET ASSETS: 100.0%
|
$
|
177,544,856
|
|||||
ADR – American Depositary Receipt
|
1
|
Non-income producing security.
|
The accompanying notes are an integral part of these financial statements.
18
Small Intrinsic Value Fund
|
SCHEDULE OF INVESTMENTS at March 31, 2023
|
|
Shares
|
Value
|
||||||
|
COMMON STOCKS: 96.5%
|
|||||||
|
Apparel & Shoe Retail: 2.1%
|
|||||||
|
31,000
|
Shoe Carnival, Inc.
|
$
|
795,150
|
||||
|
Banks: 13.3%
|
|||||||
|
9,500
|
BancFirst Corp.
|
789,450
|
|||||
|
32,000
|
Hilltop Holdings, Inc.
|
949,440
|
|||||
|
48,000
|
Home Bancshares, Inc.
|
1,042,080
|
|||||
|
19,000
|
Texas Capital BancShares, Inc. 1
|
930,240
|
|||||
|
24,000
|
Triumph Bancorp, Inc. 1
|
1,393,440
|
|||||
|
5,104,650
|
|||||||
|
Beverages: 1.4%
|
|||||||
|
138,000
|
Farmer Brothers Co. 1
|
532,680
|
|||||
|
Building Materials: 7.4%
|
|||||||
|
13,500
|
Builders FirstSource, Inc. 1
|
1,198,530
|
|||||
|
11,100
|
Eagle Materials, Inc.
|
1,628,925
|
|||||
|
2,827,455
|
|||||||
|
Chemicals: 2.2%
|
|||||||
|
20,800
|
AZZ, Inc.
|
857,792
|
|||||
|
Commercial Services: 4.7%
|
|||||||
|
30,000
|
European Wax Center, Inc. – Class A
|
570,000
|
|||||
|
4,100
|
Herc Holdings, Inc.
|
466,990
|
|||||
|
150,000
|
Research Solutions, Inc. 1
|
301,500
|
|||||
|
58,200
|
The GEO Group, Inc. 1
|
459,198
|
|||||
|
1,797,688
|
|||||||
|
Computers: 1.8%
|
|||||||
|
28,700
|
NCR Corp. 1
|
677,033
|
|||||
|
Electrical Components & Equipment: 1.9%
|
|||||||
|
4,000
|
Encore Wire Corp.
|
741,320
|
|||||
|
Electronics: 1.9%
|
|||||||
|
30,000
|
Kimball Electronics, Inc. 1
|
723,000
|
|||||
|
Engineering & Construction: 1.1%
|
|||||||
|
50,000
|
Southland Holdings, Inc. 1
|
420,000
|
|||||
|
Entertainment: 2.3%
|
|||||||
|
60,900
|
Cinemark Holdings, Inc. 1
|
900,711
|
|||||
|
Food: 8.2%
|
|||||||
|
8,500
|
John B Sanfilippo & Son, Inc.
|
823,820
|
|||||
|
11,500
|
Sprouts Farmers Market, Inc. 1
|
402,845
|
|||||
|
114,500
|
SunOpta, Inc. 1
|
881,650
|
|||||
|
20,500
|
TreeHouse Foods, Inc. 1
|
1,033,815
|
|||||
|
3,142,130
|
|||||||
|
Healthcare Products: 2.0%
|
|||||||
|
44,100
|
Bausch + Lomb Corp. 1
|
767,781
|
|||||
|
Home Builders: 3.2%
|
|||||||
|
32,000
|
Taylor Morrison Home Corp. 1
|
1,224,320
|
|||||
|
Home Furnishings: 4.1%
|
|||||||
|
36,000
|
Ethan Allen Interiors, Inc.
|
988,560
|
|||||
|
19,350
|
Sleep Number Corp. 1
|
588,434
|
|||||
|
1,576,994
|
|||||||
|
Insurance: 3.1%
|
|||||||
|
18,000
|
Horace Mann Educators Corp.
|
602,640
|
|||||
|
40,000
|
Tiptree, Inc.
|
582,800
|
|||||
|
1,185,440
|
|||||||
|
Internet: 2.8%
|
|||||||
|
75,000
|
CarParts.com, Inc. 1
|
400,500
|
|||||
|
93,000
|
Solo Brands, Inc. – Class A 1
|
667,740
|
|||||
|
1,068,240
|
|||||||
|
Iron & Steel: 4.5%
|
|||||||
|
58,000
|
Cleveland-Cliffs, Inc. 1
|
1,063,140
|
|||||
|
13,465
|
Commercial Metals Co.
|
658,438
|
|||||
|
1,721,578
|
|||||||
|
Leisure Time: 5.9%
|
|||||||
|
14,000
|
Brunswick Corp.
|
1,148,000
|
|||||
|
40,000
|
Vista Outdoor, Inc. 1
|
1,108,400
|
|||||
|
2,256,400
|
|||||||
|
Machinery – Diversified: 3.0%
|
|||||||
|
100,100
|
GrafTech International Ltd.
|
486,486
|
|||||
|
20,100
|
Ichor Holdings Ltd. 1
|
658,074
|
|||||
|
1,144,560
|
|||||||
|
Oil Companies Exploration & Production: 7.5%
|
|||||||
|
12,000
|
Chesapeake Energy Corp.
|
912,480
|
|||||
|
8,500
|
Chord Energy Corp.
|
1,144,100
|
|||||
|
35,000
|
HighPeak Energy, Inc.
|
805,000
|
|||||
|
2,861,580
|
|||||||
|
Oil Field Services: 2.0%
|
|||||||
|
105,000
|
ProPetro Holding Corp. 1
|
754,950
|
|||||
|
Pharmaceuticals: 1.1%
|
|||||||
|
18,100
|
Organon & Co.
|
425,712
|
|||||
|
Private Equity: 0.9%
|
|||||||
|
35,000
|
P10, Inc. – Class A
|
353,850
|
|||||
|
Real Estate: 2.0%
|
|||||||
|
38,000
|
Stratus Properties, Inc.
|
760,000
|
|||||
|
Semiconductors: 3.8%
|
|||||||
|
10,800
|
Diodes, Inc. 1
|
1,001,808
|
|||||
|
28,000
|
Photronics, Inc. 1
|
464,240
|
|||||
|
1,466,048
|
|||||||
|
Telecommunications: 2.3%
|
|||||||
|
26,100
|
Aviat Networks, Inc. 1
|
899,405
|
|||||
|
TOTAL COMMON STOCKS
|
|||||||
|
(Cost $33,048,131)
|
36,986,467
|
||||||
The accompanying notes are an integral part of these financial statements.
19
Small Intrinsic Value Fund
|
SCHEDULE OF INVESTMENTS at March 31, 2023 (Continued)
|
|
Shares
|
Value
|
||||||
|
WARRANTS: 0.1%
|
|||||||
|
25,000
|
Southland Holdings, Inc.,
|
||||||
|
Expiration:
|
|||||||
|
September 2026 1
|
$
|
19,749
|
|||||
|
TOTAL WARRANTS
|
|||||||
|
(Cost $15,185)
|
19,749
|
||||||
|
TOTAL INVESTMENTS IN SECURITIES: 96.5%
|
|||||||
|
(Cost $33,063,316)
|
37,006,216
|
||||||
|
Other Assets in Excess of Liabilities: 3.5%
|
1,367,856
|
||||||
|
TOTAL NET ASSETS: 100.0%
|
$
|
38,374,072
|
|||||
|
1
|
Non-income producing security.
|
The accompanying notes are an integral part of these financial statements.
20
Blue Chip Equity Income Fund
|
SCHEDULE OF INVESTMENTS at March 31, 2023
|
|
Shares
|
Value
|
||||||
|
COMMON STOCKS: 97.5%
|
|||||||
|
Auto Manufacturers: 4.5%
|
|||||||
|
6,000
|
Tesla, Inc. 1
|
$
|
1,244,760
|
||||
|
Banks: 6.8%
|
|||||||
|
3,000
|
The Goldman Sachs Group, Inc.
|
981,330
|
|||||
|
7,000
|
JPMorgan Chase & Co.
|
912,170
|
|||||
|
1,893,500
|
|||||||
|
Beverages: 3.9%
|
|||||||
|
6,000
|
PepsiCo, Inc.
|
1,093,800
|
|||||
|
Building Products Retail: 5.9%
|
|||||||
|
3,250
|
The Home Depot, Inc.
|
959,140
|
|||||
|
3,500
|
Lowe’s Companies, Inc.
|
699,895
|
|||||
|
1,659,035
|
|||||||
|
Computers: 7.1%
|
|||||||
|
12,000
|
Apple, Inc.
|
1,978,800
|
|||||
|
Discount Retail: 3.6%
|
|||||||
|
2,000
|
Costco Wholesale Corp.
|
993,740
|
|||||
|
Diversified Financial Services: 3.5%
|
|||||||
|
6,000
|
American Express Co.
|
989,700
|
|||||
|
Insurance: 2.8%
|
|||||||
|
4,000
|
Chubb Ltd.
|
776,720
|
|||||
|
Internet: 3.0%
|
|||||||
|
8,000
|
Amazon.com, Inc. 1
|
826,320
|
|||||
|
Machinery – Diversified: 5.9%
|
|||||||
|
4,000
|
Deere & Co.
|
1,651,520
|
|||||
|
Oil Companies Exploration & Production: 1.8%
|
|||||||
|
5,000
|
ConocoPhillips
|
496,050
|
|||||
|
Oil Companies Integrated: 5.9%
|
|||||||
|
15,000
|
Exxon Mobil Corp.
|
1,644,900
|
|||||
|
Oil Refining & Marketing: 2.9%
|
|||||||
|
8,000
|
Phillips 66
|
811,040
|
|||||
|
Pharmaceuticals: 9.9%
|
|||||||
|
5,000
|
AbbVie, Inc.
|
796,850
|
|||||
|
8,000
|
Merck & Co., Inc.
|
851,120
|
|||||
|
7,000
|
Novo Nordisk A/S – Class A
|
1,113,980
|
|||||
|
2,761,950
|
|||||||
|
Pipelines: 3.4%
|
|||||||
|
15,000
|
ONEOK, Inc.
|
953,100
|
|||||
|
Semiconductors: 11.3%
|
|||||||
|
4,000
|
NVIDIA Corp.
|
1,111,080
|
|||||
|
10,000
|
Taiwan Semiconductor
|
||||||
|
Manufacturing Co. Ltd. – ADR
|
930,200
|
||||||
|
6,000
|
Texas Instruments, Inc.
|
1,116,060
|
|||||
|
3,157,340
|
|||||||
|
Software: 8.6%
|
|||||||
|
8,000
|
Activision Blizzard, Inc.
|
684,720
|
|||||
|
6,000
|
Microsoft Corp.
|
1,729,800
|
|||||
|
2,414,520
|
|||||||
|
Transportation: 6.7%
|
|||||||
|
4,500
|
Union Pacific Corp.
|
905,670
|
|||||
|
5,000
|
United Parcel Service, Inc. – Class B
|
969,950
|
|||||
|
1,875,620
|
|||||||
|
TOTAL COMMON STOCKS
|
|||||||
|
(Cost $18,047,661)
|
27,222,415
|
||||||
|
TOTAL INVESTMENTS IN SECURITIES: 97.5%
|
|||||||
|
(Cost $18,047,661)
|
27,222,415
|
||||||
|
Other Assets in Excess of Liabilities: 2.5%
|
706,858
|
||||||
|
TOTAL NET ASSETS: 100.0%
|
$
|
27,929,273
|
|||||
ADR – American Depositary Receipt
|
1
|
Non-income producing security.
|
The accompanying notes are an integral part of these financial statements.
21
Hodges Mutual Funds
|
STATEMENTS OF ASSETS AND LIABILITIES at March 31, 2023
|
|
|
Small
|
Blue Chip
|
||||||||||||||
|
|
Small Cap
|
Intrinsic
|
Equity
|
|||||||||||||
|
|
Hodges Fund
|
Fund
|
Value Fund
|
Income Fund
|
||||||||||||
|
ASSETS
|
||||||||||||||||
|
Investments in unaffiliated securities, at value
|
$
|
150,437,021
|
$
|
173,979,799
|
$
|
37,006,216
|
$
|
27,222,415
|
||||||||
|
(Cost $119,871,024, $117,918,114, $33,063,316, and $18,047,661)
|
||||||||||||||||
|
Cash
|
1,853,415
|
502,862
|
2,184,653
|
307,218
|
||||||||||||
|
Receivables:
|
||||||||||||||||
|
Investment securities sold
|
1,085,292
|
4,666,024
|
—
|
448,456
|
||||||||||||
|
Fund shares sold
|
11,324
|
42,682
|
51,924
|
474
|
||||||||||||
|
Dividends and interest
|
39,599
|
134,850
|
11,504
|
27,730
|
||||||||||||
|
Prepaid expenses
|
14,657
|
23,424
|
20,044
|
11,648
|
||||||||||||
|
Total assets
|
153,441,308
|
179,349,641
|
39,274,341
|
28,017,941
|
||||||||||||
|
LIABILITIES
|
||||||||||||||||
|
Payables:
|
||||||||||||||||
|
Investment securities purchased
|
2,185,903
|
1,383,931
|
811,012
|
—
|
||||||||||||
|
Fund shares redeemed
|
2,050
|
72,183
|
14,635
|
2,772
|
||||||||||||
|
Investment advisory fees
|
82,209
|
148,503
|
17,581
|
8,059
|
||||||||||||
|
Fund administration fees
|
12,161
|
16,786
|
969
|
4,029
|
||||||||||||
|
Fund accounting fees
|
6,885
|
10,032
|
137
|
1,450
|
||||||||||||
|
Distribution fees
|
130,629
|
73,527
|
22,015
|
18,410
|
||||||||||||
|
Audit fees
|
25,797
|
25,804
|
23,800
|
23,800
|
||||||||||||
|
Transfer agent fees
|
6,954
|
7,536
|
2,859
|
3,216
|
||||||||||||
|
Custody fees
|
1,455
|
1,987
|
1,152
|
909
|
||||||||||||
|
Chief Compliance Officer fees
|
1,875
|
1,874
|
1,875
|
1,875
|
||||||||||||
|
Trustee fees
|
3,555
|
3,665
|
3,178
|
3,296
|
||||||||||||
|
Distribution to shareholders
|
—
|
—
|
—
|
6,664
|
||||||||||||
|
Sub-transfer agent fees
|
8,443
|
21,894
|
695
|
1,483
|
||||||||||||
|
Other accrued expenses
|
37,911
|
37,063
|
361
|
12,705
|
||||||||||||
|
Total liabilities
|
2,505,827
|
1,804,785
|
900,269
|
88,668
|
||||||||||||
|
NET ASSETS
|
$
|
150,935,481
|
$
|
177,544,856
|
$
|
38,374,072
|
$
|
27,929,273
|
||||||||
|
COMPONENTS OF NET ASSETS
|
||||||||||||||||
|
Paid-in capital
|
$
|
120,509,748
|
$
|
114,680,488
|
$
|
34,590,599
|
$
|
19,534,540
|
||||||||
|
Total distributable (accumulated) earnings (losses)
|
30,425,733
|
62,864,368
|
3,783,473
|
8,394,733
|
||||||||||||
|
Total net assets
|
$
|
150,935,481
|
$
|
177,544,856
|
$
|
38,374,072
|
$
|
27,929,273
|
||||||||
|
Net Asset Value (unlimited shares authorized):
|
||||||||||||||||
|
Retail Class:
|
||||||||||||||||
|
Net assets
|
$
|
150,935,481
|
$
|
139,428,303
|
$
|
38,374,072
|
$
|
27,929,273
|
||||||||
|
Shares of beneficial interest issued and outstanding
|
2,937,950
|
7,280,106
|
2,285,467
|
1,550,521
|
||||||||||||
|
Net asset value, offering price, and redemption price per share
|
$
|
51.37
|
$
|
19.15
|
$
|
16.79
|
$
|
18.01
|
||||||||
|
Institutional Class:
|
||||||||||||||||
|
Net assets
|
$
|
—
|
$
|
38,116,553
|
$
|
—
|
$
|
—
|
||||||||
|
Shares of beneficial interest issued and outstanding
|
—
|
1,863,474
|
—
|
—
|
||||||||||||
|
Net asset value, offering price, and redemption price per share
|
$
|
—
|
$
|
20.45
|
$
|
—
|
$
|
—
|
||||||||
The accompanying notes are an integral part of these financial statements.
22
Hodges Mutual Funds
|
STATEMENTS OF OPERATIONS For the Year Ended March 31,
2023
|
|
|
Small
|
Blue Chip
|
||||||||||||||
|
|
Small Cap
|
Intrinsic
|
Equity
|
|||||||||||||
|
|
Hodges Fund
|
Fund
|
Value Fund
|
Income Fund
|
||||||||||||
|
INVESTMENT INCOME
|
||||||||||||||||
|
Dividends from unaffiliated securities
|
$
|
1,334,770
|
$
|
2,513,930
|
$
|
498,070
|
$
|
573,966
|
||||||||
|
(net of $-, $95, $-, and $3,316 foreign withholding tax, respectively)
|
||||||||||||||||
|
Other income
|
1,340
|
1,363
|
1,183
|
1,194
|
||||||||||||
|
Total investment income
|
1,336,110
|
2,515,293
|
499,253
|
575,160
|
||||||||||||
|
EXPENSES
|
||||||||||||||||
|
Investment advisory fees
|
1,276,349
|
1,571,966
|
209,848
|
176,025
|
||||||||||||
|
Distribution fees – Retail Class
|
375,397
|
360,227
|
61,720
|
67,702
|
||||||||||||
|
Fund administration fees
|
79,188
|
105,308
|
20,956
|
26,018
|
||||||||||||
|
Sub-transfer agent fees
|
70,409
|
157,654
|
8,406
|
8,024
|
||||||||||||
|
Fund accounting fees
|
45,526
|
65,706
|
6,979
|
10,003
|
||||||||||||
|
Transfer agent fees
|
43,391
|
47,247
|
19,135
|
19,563
|
||||||||||||
|
Miscellaneous expenses
|
30,770
|
26,882
|
12,667
|
14,151
|
||||||||||||
|
Registration expenses
|
25,711
|
43,171
|
22,404
|
20,263
|
||||||||||||
|
Audit fees
|
23,644
|
23,644
|
23,645
|
23,645
|
||||||||||||
|
Reports to shareholders
|
22,630
|
23,239
|
3,962
|
4,002
|
||||||||||||
|
Trustees fees
|
19,772
|
20,562
|
17,784
|
17,945
|
||||||||||||
|
Chief Compliance Officer fees
|
11,250
|
11,250
|
11,250
|
11,250
|
||||||||||||
|
Interest expense
|
12,074
|
2,135
|
—
|
75
|
||||||||||||
|
Legal fees
|
8,208
|
8,207
|
8,207
|
8,207
|
||||||||||||
|
Custody fees
|
6,625
|
10,320
|
6,629
|
5,456
|
||||||||||||
|
Insurance expenses
|
6,009
|
5,946
|
5,206
|
5,359
|
||||||||||||
|
Total expenses
|
2,056,953
|
2,483,464
|
438,798
|
417,688
|
||||||||||||
|
Less: fees waived
|
(285,080
|
)
|
—
|
(120,325
|
)
|
(65,638
|
)
|
|||||||||
|
Net expenses
|
1,771,873
|
2,483,464
|
318,473
|
352,050
|
||||||||||||
|
Net investment income (loss)
|
(435,763
|
)
|
31,829
|
180,780
|
223,110
|
|||||||||||
|
|
||||||||||||||||
|
REALIZED AND UNREALIZED GAIN (LOSS) ON INVESTMENTS
|
||||||||||||||||
|
Net realized gain (loss) on transactions from:
|
||||||||||||||||
|
Unaffiliated investments
|
2,116,282
|
10,493,744
|
(3,954
|
)
|
(780,034
|
)
|
||||||||||
|
Affiliated investments
|
(10,437
|
)
|
—
|
—
|
—
|
|||||||||||
|
Options written
|
191,699
|
—
|
—
|
—
|
||||||||||||
|
Net realized gain (loss)
|
2,297,544
|
10,493,744
|
(3,954
|
)
|
(780,034
|
)
|
||||||||||
|
Net change in unrealized appreciation/depreciation on:
|
||||||||||||||||
|
Unaffiliated investments
|
(22,860,120
|
)
|
(21,028,141
|
)
|
(930,891
|
)
|
(1,073,740
|
)
|
||||||||
|
Affiliated investments
|
(2,791,232
|
)
|
—
|
—
|
—
|
|||||||||||
|
Options written
|
(180,123
|
)
|
9,010
|
—
|
—
|
|||||||||||
|
Net unrealized appreciation/depreciation
|
(25,831,475
|
)
|
(21,019,131
|
)
|
(930,891
|
)
|
(1,073,740
|
)
|
||||||||
|
Net realized and unrealized gain (loss) on investments
|
(23,533,931
|
)
|
(10,525,387
|
)
|
(934,845
|
)
|
(1,853,774
|
)
|
||||||||
|
Net increase (decrease) in net
|
||||||||||||||||
|
assets resulting from operations
|
$
|
(23,969,694
|
)
|
$
|
(10,493,558
|
)
|
$
|
(754,065
|
)
|
$
|
(1,630,664
|
)
|
||||
The accompanying notes are an integral part of these financial statements.
23
Hodges Fund
|
STATEMENTS OF CHANGES IN NET ASSETS
|
|
|
Year Ended
|
Year Ended
|
||||||
|
|
March 31, 2023
|
March 31, 2022
|
||||||
|
INCREASE (DECREASE) IN NET ASSETS FROM:
|
||||||||
|
|
||||||||
|
OPERATIONS
|
||||||||
|
Net investment income (loss)
|
$
|
(435,763
|
)
|
$
|
(1,697,688
|
)
|
||
|
Net realized gain (loss) on transactions from:
|
||||||||
|
Unaffiliated investments
|
2,116,282
|
20,597,653
|
||||||
|
Affiliated investments
|
(10,437
|
)
|
(403,591
|
)
|
||||
|
Options written
|
191,699
|
318,088
|
||||||
|
Net change in unrealized appreciation/depreciations on:
|
||||||||
|
Unaffiliated investments
|
(22,860,120
|
)
|
(15,925,717
|
)
|
||||
|
Affiliated investments
|
(2,791,232
|
)
|
3,761,573
|
|||||
|
Options written
|
(180,123
|
)
|
64,257
|
|||||
|
Net increase (decrease) in net assets resulting from operations
|
(23,969,694
|
)
|
6,714,575
|
|||||
|
|
||||||||
|
DISTRIBUTIONS TO SHAREHOLDERS
|
||||||||
|
Net distributions to shareholders – Retail Class
|
(685,796
|
)
|
—
|
|||||
|
Total distributions to shareholders
|
(685,796
|
)
|
—
|
|||||
|
|
||||||||
|
CAPITAL SHARE TRANSACTIONS
|
||||||||
|
Increase (decrease) in net assets derived from net change
|
||||||||
|
in outstanding shares – Retail Class 1
|
(10,791,626
|
)
|
(31,050,208
|
)
|
||||
|
Total increase (decrease) in net assets from capital share transactions
|
(10,791,626
|
)
|
(31,050,208
|
)
|
||||
|
Total increase (decrease) in net assets
|
(35,447,116
|
)
|
(24,335,633
|
)
|
||||
|
|
||||||||
|
NET ASSETS
|
||||||||
|
Beginning of year
|
186,382,597
|
210,718,230
|
||||||
|
End of year
|
$
|
150,935,481
|
$
|
186,382,597
|
||||
|
1
|
Summary of share transactions is as follows:
|
|
Year Ended
|
Year Ended
|
||||||||||||||||
|
March 31, 2023
|
March 31, 2022
|
||||||||||||||||
|
Shares
|
Amount
|
Shares
|
Amount
|
||||||||||||||
|
Retail Class:
|
|||||||||||||||||
|
Shares sold
|
164,324
|
$
|
8,346,430
|
588,658
|
$
|
35,381,517
|
|||||||||||
|
Shares issued in reinvestment of distributions
|
13,359
|
666,867
|
—
|
—
|
|||||||||||||
|
Shares redeemed 2
|
(403,531
|
)
|
(19,804,923
|
)
|
(1,096,789
|
)
|
(66,431,725
|
)
|
|||||||||
|
Net increase (decrease)
|
(225,848
|
)
|
$
|
(10,791,626
|
)
|
(508,131
|
)
|
$
|
(31,050,208
|
)
|
|||||||
|
2
|
Net of redemption fees of $2,335 and $4,557, respectively.
|
The accompanying notes are an integral part of these financial statements.
24
Small Cap Fund
|
STATEMENTS OF CHANGES IN NET ASSETS
|
|
|
Year Ended
|
Year Ended
|
||||||
|
|
March 31, 2023
|
March 31, 2022
|
||||||
|
INCREASE (DECREASE) IN NET ASSETS FROM:
|
||||||||
|
|
||||||||
|
OPERATIONS
|
||||||||
|
Net investment income (loss)
|
$
|
31,829
|
$
|
(1,274,102
|
)
|
|||
|
Net realized gain (loss) on transactions from:
|
||||||||
|
Unaffiliated investments
|
10,493,744
|
31,320,456
|
||||||
|
Net change in unrealized appreciation/depreciation on:
|
||||||||
|
Unaffiliated investments
|
(21,028,141
|
)
|
(27,276,823
|
)
|
||||
|
Options written
|
9,010
|
—
|
||||||
|
Net increase (decrease) in net assets resulting from operations
|
(10,493,558
|
)
|
2,769,531
|
|||||
|
|
||||||||
|
DISTRIBUTIONS TO SHAREHOLDERS
|
||||||||
|
Net distributions to shareholders – Retail Class
|
(8,378,272
|
)
|
(29,838,464
|
)
|
||||
|
Net distributions to shareholders – Institutional Class
|
(2,211,622
|
)
|
(8,325,118
|
)
|
||||
|
Total distributions to shareholders
|
(10,589,894
|
)
|
(38,163,582
|
)
|
||||
|
|
||||||||
|
CAPITAL SHARE TRANSACTIONS
|
||||||||
|
Increase (decrease) in net assets derived from net change
|
||||||||
|
in outstanding shares – Retail Class 1
|
(5,232,890
|
)
|
5,764,730
|
|||||
|
Increase (decrease) in net assets derived from net change
|
||||||||
|
in outstanding shares – Institutional Class 1
|
(4,021,260
|
)
|
450,891
|
|||||
|
Total increase (decrease) in net assets from capital share transactions
|
(9,254,150
|
)
|
6,215,621
|
|||||
|
Total increase (decrease) in net assets
|
(30,337,602
|
)
|
(29,178,430
|
)
|
||||
|
|
||||||||
|
NET ASSETS
|
||||||||
|
Beginning of year
|
207,882,458
|
237,060,888
|
||||||
|
End of year
|
$
|
177,544,856
|
$
|
207,882,458
|
||||
|
1
|
Summary of share transactions is as follows:
|
|
Year Ended
|
Year Ended
|
||||||||||||||||
|
March 31, 2023
|
March 31, 2022
|
||||||||||||||||
|
Shares
|
Amount
|
Shares
|
Amount
|
||||||||||||||
|
Retail Class:
|
|||||||||||||||||
|
Shares sold
|
351,720
|
$
|
7,149,799
|
938,955
|
$
|
24,307,825
|
|||||||||||
|
Shares issued in reinvestment of distributions
|
436,542
|
8,224,458
|
1,329,539
|
29,263,158
|
|||||||||||||
|
Shares redeemed 2
|
(1,053,459
|
)
|
(20,607,147
|
)
|
(1,970,518
|
)
|
(47,806,253
|
)
|
|||||||||
|
Net increase (decrease)
|
(265,197
|
)
|
$
|
(5,232,890
|
)
|
297,976
|
$
|
5,764,730
|
|||||||||
|
2
|
Net of redemption fees of $13,806 and $7,785, respectively.
|
|
Year Ended
|
Year Ended
|
||||||||||||||||
|
March 31, 2023
|
March 31, 2022
|
||||||||||||||||
|
Shares
|
Amount
|
Shares
|
Amount
|
||||||||||||||
|
Institutional Class:
|
|||||||||||||||||
|
Shares sold
|
281,217
|
$
|
6,034,690
|
336,797
|
$
|
8,610,140
|
|||||||||||
|
Shares issued in reinvestment of distributions
|
106,459
|
2,139,821
|
336,027
|
7,842,879
|
|||||||||||||
|
Shares redeemed 3
|
(589,820
|
)
|
(12,195,771
|
)
|
(637,935
|
)
|
(16,002,128
|
)
|
|||||||||
|
Net increase (decrease)
|
(202,144
|
)
|
$
|
(4,021,260
|
)
|
34,889
|
$
|
450,891
|
|||||||||
|
3
|
Net of redemption fees of $3,992 and $2,273, respectively.
|
The accompanying notes are an integral part of these financial statements.
25
Small Intrinsic Value Fund
|
STATEMENTS OF CHANGES IN NET ASSETS
|
|
|
Year Ended
|
Year Ended
|
||||||
|
|
March 31, 2023
|
March 31, 2022
|
||||||
|
INCREASE (DECREASE) IN NET ASSETS FROM:
|
||||||||
|
|
||||||||
|
OPERATIONS
|
||||||||
|
Net investment income (loss)
|
$
|
180,780
|
$
|
15,462
|
||||
|
Net realized gain (loss) on transactions from:
|
||||||||
|
Unaffiliated investments
|
(3,954
|
)
|
1,628,225
|
|||||
|
Affiliated investments
|
—
|
118,588
|
||||||
|
Net change in unrealized appreciation/depreciations on:
|
||||||||
|
Unaffiliated investments
|
(930,891
|
)
|
233,272
|
|||||
|
Affiliated investments
|
—
|
(38,800
|
)
|
|||||
|
Net increase (decrease) in net assets resulting from operations
|
(754,065
|
)
|
1,956,747
|
|||||
|
|
||||||||
|
DISTRIBUTIONS TO SHAREHOLDERS
|
||||||||
|
Net distributions to shareholders – Retail Class
|
(967,105
|
)
|
(1,012,021
|
)
|
||||
|
Total distributions to shareholders
|
(967,105
|
)
|
(1,012,021
|
)
|
||||
|
|
||||||||
|
CAPITAL SHARE TRANSACTIONS
|
||||||||
|
Increase (decrease) in net assets derived from net change
|
||||||||
|
in outstanding shares – Retail Class 1
|
22,518,447
|
472,817
|
||||||
|
Total increase (decrease) in net assets from capital share transactions
|
22,518,447
|
472,817
|
||||||
|
Total increase (decrease) in net assets
|
20,797,277
|
1,417,543
|
||||||
|
|
||||||||
|
NET ASSETS
|
||||||||
|
Beginning of year
|
17,576,795
|
16,159,252
|
||||||
|
End of year
|
$
|
38,374,072
|
$
|
17,576,795
|
||||
|
1
|
Summary of share transactions is as follows:
|
|
Year Ended
|
Year Ended
|
||||||||||||||||
|
March 31, 2023
|
March 31, 2022
|
||||||||||||||||
|
Shares
|
Amount
|
Shares
|
Amount
|
||||||||||||||
|
Retail Class:
|
|||||||||||||||||
|
Shares sold
|
1,489,965
|
$
|
25,275,624
|
200,375
|
$
|
3,616,763
|
|||||||||||
|
Shares issued in reinvestment of distributions
|
58,150
|
956,580
|
54,864
|
986,448
|
|||||||||||||
|
Shares redeemed 2
|
(219,688
|
)
|
(3,713,757
|
)
|
(230,002
|
)
|
(4,130,394
|
)
|
|||||||||
|
Net increase (decrease)
|
1,328,427
|
$
|
22,518,447
|
25,237
|
$
|
472,817
|
|||||||||||
|
2
|
Net of redemption fees of $182 and $216, respectively.
|
The accompanying notes are an integral part of these financial statements.
26
Blue Chip Equity Income Fund
|
STATEMENTS OF CHANGES IN NET ASSETS
|
|
|
Year Ended
|
Year Ended
|
||||||
|
|
March 31, 2023
|
March 31, 2022
|
||||||
|
INCREASE (DECREASE) IN NET ASSETS FROM:
|
||||||||
|
|
||||||||
|
OPERATIONS
|
||||||||
|
Net investment income (loss)
|
$
|
223,110
|
$
|
166,416
|
||||
|
Net realized gain (loss) on transactions from:
|
||||||||
|
Unaffiliated investments
|
(780,034
|
)
|
4,150,051
|
|||||
|
Net change in unrealized appreciation/depreciations on:
|
||||||||
|
Unaffiliated investments
|
(1,073,740
|
)
|
225,645
|
|||||
|
Net increase (decrease) in net assets resulting from operations
|
(1,630,664
|
)
|
4,542,112
|
|||||
|
|
||||||||
|
DISTRIBUTIONS TO SHAREHOLDERS
|
||||||||
|
Net distributions to shareholders – Retail Class
|
(2,218,532
|
)
|
(3,037,713
|
)
|
||||
|
Total distributions to shareholders
|
(2,218,532
|
)
|
(3,037,713
|
)
|
||||
|
|
||||||||
|
CAPITAL SHARE TRANSACTIONS
|
||||||||
|
Increase (decrease) in net assets derived from net change
|
||||||||
|
in outstanding shares – Retail Class 1
|
1,638,069
|
2,540,049
|
||||||
|
Total increase (decrease) in net assets from capital share transactions
|
1,638,069
|
2,540,049
|
||||||
|
Total increase (decrease) in net assets
|
(2,211,127
|
)
|
4,044,448
|
|||||
|
|
||||||||
|
NET ASSETS
|
||||||||
|
Beginning of year
|
30,140,400
|
26,095,952
|
||||||
|
End of year
|
$
|
27,929,273
|
$
|
30,140,400
|
||||
|
1
|
Summary of share transactions is as follows:
|
|
Year Ended
|
Year Ended
|
||||||||||||||||
|
March 31, 2023
|
March 31, 2022
|
||||||||||||||||
|
Shares
|
Amount
|
Shares
|
Amount
|
||||||||||||||
|
Retail Class:
|
|||||||||||||||||
|
Shares sold
|
133,388
|
$
|
2,542,305
|
79,155
|
$
|
1,701,034
|
|||||||||||
|
Shares issued in reinvestment of distributions
|
123,619
|
2,101,392
|
137,990
|
2,874,038
|
|||||||||||||
|
Shares redeemed 2
|
(165,645
|
)
|
(3,005,628
|
)
|
(96,479
|
)
|
(2,035,023
|
)
|
|||||||||
|
Net increase (decrease)
|
91,362
|
$
|
1,638,069
|
120,666
|
$
|
2,540,049
|
|||||||||||
|
2
|
Net of redemption fees of $10 and $710, respectively.
|
The accompanying notes are an integral part of these financial statements.
27
Hodges Fund
|
FINANCIAL HIGHLIGHTS For a capital share outstanding
throughout each year
|
RETAIL CLASS
|
|
Year Ended March 31,
|
|||||||||||||||||||
|
|
2023
|
2022
|
2021
|
2020
|
2019
|
|||||||||||||||
|
Net asset value, beginning of year
|
$
|
58.91
|
$
|
57.39
|
$
|
20.36
|
$
|
37.76
|
$
|
48.44
|
||||||||||
|
INCOME FROM INVESTMENT OPERATIONS:
|
||||||||||||||||||||
|
Net investment income (loss) 1
|
(0.14
|
)
|
(0.46
|
)
|
(0.31
|
)
|
(0.19
|
)
|
(0.36
|
)
|
||||||||||
|
Net realized and unrealized gain (loss) on investments
|
(7.17
|
)
|
1.98
|
37.34
|
(17.21
|
)
|
(7.15
|
)
|
||||||||||||
|
Total from investment operations
|
(7.31
|
)
|
1.52
|
37.03
|
(17.40
|
)
|
(7.51
|
)
|
||||||||||||
|
LESS DISTRIBUTIONS:
|
||||||||||||||||||||
|
From net realized gain
|
(0.23
|
)
|
—
|
—
|
—
|
(3.17
|
)
|
|||||||||||||
|
Total distributions
|
(0.23
|
)
|
—
|
—
|
—
|
(3.17
|
)
|
|||||||||||||
|
Paid-in capital from redemption fees
|
0.00
|
2
|
0.00
|
2
|
0.00
|
2
|
0.00
|
2
|
0.00
|
2
|
||||||||||
|
Net asset value, end of year
|
$
|
51.37
|
$
|
58.91
|
$
|
57.39
|
$
|
20.36
|
$
|
37.76
|
||||||||||
|
Total return
|
(12.44
|
)%
|
2.70
|
%
|
181.74
|
%
|
(46.05
|
)%
|
(14.45
|
)%
|
||||||||||
|
SUPPLEMENTAL DATA:
|
||||||||||||||||||||
|
Net assets, end of year (millions)
|
$
|
150.9
|
$
|
186.4
|
$
|
210.7
|
$
|
73.9
|
$
|
177.4
|
||||||||||
|
Portfolio turnover rate
|
74
|
%
|
96
|
%
|
220
|
%
|
107
|
%
|
119
|
%
|
||||||||||
|
RATIO OF EXPENSES TO AVERAGE NET ASSETS:
|
||||||||||||||||||||
|
Before fees waived and expenses absorbed
|
1.37
|
%
|
1.35
|
%
|
1.40
|
%
|
1.37
|
%
|
1.34
|
%
|
||||||||||
|
After fees waived and expenses absorbed 3
|
1.18
|
%
|
1.17
|
%
|
1.16
|
%
|
1.18
|
%
|
1.18
|
%
|
||||||||||
|
RATIO OF NET INVESTMENT INCOME (LOSS) TO AVERAGE NET ASSETS:
|
||||||||||||||||||||
|
Before fees waived and expenses absorbed
|
(0.48
|
)%
|
(0.93
|
)%
|
(1.03
|
)%
|
(0.75
|
)%
|
(0.97
|
)%
|
||||||||||
|
After fees waived and expenses absorbed 3
|
(0.29
|
)%
|
(0.76
|
)%
|
(0.79
|
)%
|
(0.56
|
)%
|
(0.81
|
)%
|
||||||||||
|
1
|
Calculated using the average shares outstanding method.
|
|
2
|
Does not round to $0.01 or $(0.01), as applicable.
|
|
3
|
Effective September 1, 2020, the Advisor contractually agreed to limit the Retail Class shares’ annual ratio of expenses to 1.15% of the Retail Class’ daily net assets Effective September 1,
2021, the annual ratio of expenses returned to 1.18% of the Retail Class’ daily net assets. See Note 3.
|
The accompanying notes are an integral part of these financial statements.
28
Small Cap Fund
|
FINANCIAL HIGHLIGHTS For a capital share outstanding
throughout each year
|
RETAIL CLASS
|
|
Year Ended March 31,
|
|||||||||||||||||||
|
|
2023
|
2022
|
2021
|
2020
|
2019
|
|||||||||||||||
|
Net asset value, beginning of year
|
$
|
21.35
|
$
|
25.28
|
$
|
10.10
|
$
|
18.13
|
$
|
19.51
|
||||||||||
|
INCOME FROM INVESTMENT OPERATIONS:
|
||||||||||||||||||||
|
Net investment income (loss) 1
|
(0.01
|
)
|
(0.15
|
)
|
(0.13
|
)
|
(0.07
|
)
|
(0.12
|
)
|
||||||||||
|
Net realized and unrealized gain (loss) on investments
|
(1.01
|
)
|
0.56
|
15.31
|
(6.58
|
)
|
(0.54
|
)
|
||||||||||||
|
Total from investment operations
|
(1.02
|
)
|
0.41
|
15.18
|
(6.65
|
)
|
(0.66
|
)
|
||||||||||||
|
LESS DISTRIBUTIONS:
|
||||||||||||||||||||
|
From net realized gain
|
(1.18
|
)
|
(4.34
|
)
|
—
|
(1.38
|
)
|
(0.72
|
)
|
|||||||||||
|
Total distributions
|
(1.18
|
)
|
(4.34
|
)
|
—
|
(1.38
|
)
|
(0.72
|
)
|
|||||||||||
|
Paid-in capital from redemption
|
0.00
|
2
|
0.00
|
2
|
0.00
|
2
|
0.00
|
2
|
0.00
|
2
|
||||||||||
|
Net asset value, end of year
|
$
|
19.15
|
$
|
21.35
|
$
|
25.28
|
$
|
10.10
|
$
|
18.13
|
||||||||||
|
Total return
|
(4.68
|
)%
|
1.12
|
%
|
150.30
|
%
|
(39.59
|
)%
|
(2.96
|
)%
|
||||||||||
|
SUPPLEMENTAL DATA:
|
||||||||||||||||||||
|
Net assets, end of year (millions)
|
$
|
139.4
|
$
|
161.1
|
$
|
183.2
|
$
|
91.5
|
$
|
354.5
|
||||||||||
|
Portfolio turnover rate
|
69
|
%
|
67
|
%
|
124
|
%
|
81
|
%
|
81
|
%
|
||||||||||
|
RATIO OF EXPENSES TO AVERAGE NET ASSETS:
|
||||||||||||||||||||
|
Before fees waived and expenses absorbed
|
1.40
|
%
|
1.38
|
%
|
1.40
|
%
|
1.33
|
%
|
1.29
|
%
|
||||||||||
|
After fees waived and expenses absorbed 3
|
1.40
|
%
|
1.36
|
%
|
1.35
|
%
|
1.33
|
%
|
1.29
|
%
|
||||||||||
|
RATIO OF NET INVESTMENT INCOME (LOSS) TO AVERAGE NET ASSETS:
|
||||||||||||||||||||
|
Before fees waived and expenses absorbed
|
(0.04
|
)%
|
(0.62
|
)%
|
(0.83
|
)%
|
(0.43
|
)%
|
(0.60
|
)%
|
||||||||||
|
After fees waived and expenses absorbed 3
|
(0.04
|
)%
|
(0.60
|
)%
|
(0.78
|
)%
|
(0.43
|
)%
|
(0.60
|
)%
|
||||||||||
|
1
|
Calculated using the average shares outstanding method.
|
|
2
|
Does not round to $0.01 or $(0.01), as applicable.
|
|
3
|
Effective September 1, 2020, the Advisor contractually agreed to limit the Retail Class shares’ annual ratio of expenses to 1.37% of the Retail Class’ daily net assets. Effective September 1,
2021, the annual ratio of expenses returned to 1.40% of the Retail Class’ daily net assets. See Note 3.
|
The accompanying notes are an integral part of these financial statements.
29
Small Cap Fund
|
FINANCIAL HIGHLIGHTS For a capital share outstanding
throughout each year
|
INSTITUTIONAL CLASS
|
|
Year Ended March 31,
|
|||||||||||||||||||
|
|
2023
|
2022
|
2021
|
2020
|
2019
|
|||||||||||||||
|
Net asset value, beginning of year
|
$
|
22.66
|
$
|
26.51
|
$
|
10.56
|
$
|
18.85
|
$
|
20.21
|
||||||||||
|
INCOME FROM INVESTMENT OPERATIONS:
|
||||||||||||||||||||
|
Net investment income (loss) 1
|
0.05
|
(0.09
|
)
|
(0.09
|
)
|
(0.03
|
)
|
(0.07
|
)
|
|||||||||||
|
Net realized and unrealized gain (loss) on investments
|
(1.08
|
)
|
0.58
|
16.04
|
(6.88
|
)
|
(0.57
|
)
|
||||||||||||
|
Total from investment operations
|
(1.03
|
)
|
0.49
|
15.95
|
(6.91
|
)
|
(0.64
|
)
|
||||||||||||
|
LESS DISTRIBUTIONS:
|
||||||||||||||||||||
|
From net realized gain
|
(1.18
|
)
|
(4.34
|
)
|
—
|
(1.38
|
)
|
(0.72
|
)
|
|||||||||||
|
Total distributions
|
(1.18
|
)
|
(4.34
|
)
|
—
|
(1.38
|
)
|
(0.72
|
)
|
|||||||||||
|
Paid-in capital from redemption
|
0.00
|
2
|
0.00
|
2
|
0.00
|
2
|
0.00
|
2
|
0.00
|
2
|
||||||||||
|
Net asset value, end of year
|
$
|
20.45
|
$
|
22.66
|
$
|
26.51
|
$
|
10.56
|
$
|
18.85
|
||||||||||
|
Total return
|
(4.40
|
)%
|
1.34
|
%
|
151.14
|
%
|
(39.46
|
)%
|
(2.76
|
)%
|
||||||||||
|
SUPPLEMENTAL DATA:
|
||||||||||||||||||||
|
Net assets, end of year (millions)
|
$
|
38.1
|
$
|
46.8
|
$
|
53.8
|
$
|
32.2
|
$
|
105.0
|
||||||||||
|
Portfolio turnover rate
|
69
|
%
|
67
|
%
|
124
|
%
|
81
|
%
|
81
|
%
|
||||||||||
|
RATIO OF EXPENSES TO AVERAGE NET ASSETS:
|
||||||||||||||||||||
|
Before fees waived and expenses absorbed
|
1.15
|
%
|
1.12
|
%
|
1.15
|
%
|
1.09
|
%
|
1.04
|
%
|
||||||||||
|
After fees waived and expenses absorbed 3
|
1.15
|
%
|
1.11
|
%
|
1.10
|
%
|
1.09
|
%
|
1.04
|
%
|
||||||||||
|
RATIO OF NET INVESTMENT INCOME (LOSS) TO AVERAGE NET ASSETS:
|
||||||||||||||||||||
|
Before fees waived and expenses absorbed
|
0.22
|
%
|
(0.36
|
)%
|
(0.58
|
)%
|
(0.18
|
)%
|
(0.35
|
)%
|
||||||||||
|
After fees waived and expenses absorbed 3
|
0.22
|
%
|
(0.35
|
)%
|
(0.53
|
)%
|
(0.18
|
)%
|
(0.35
|
)%
|
||||||||||
|
1
|
Calculated using the average shares outstanding method.
|
|
2
|
Does not round to $0.01 or $(0.01), as applicable.
|
|
3
|
Effective September 1, 2020, the Advisor contractually agreed to limit the Institutional Class shares’ annual ratio of expenses to 1.12% of the Institutional Class’ daily net assets. Effective
September 1, 2021, the annual ratio of expenses returned to 1.15% of the Institutional Class’ daily net assets. See Note 3.
|
The accompanying notes are an integral part of these financial statements.
30
Small Intrinsic Value Fund
|
FINANCIAL HIGHLIGHTS For a capital share outstanding
throughout each year
|
RETAIL CLASS
|
|
Year Ended March 31,
|
|||||||||||||||||||
|
|
2023
|
2022
|
2021
|
2020
|
2019
|
|||||||||||||||
|
Net asset value, beginning of year
|
$
|
18.37
|
$
|
17.34
|
$
|
6.84
|
$
|
11.13
|
$
|
13.65
|
||||||||||
|
INCOME FROM INVESTMENT OPERATIONS:
|
||||||||||||||||||||
|
Net investment income (loss) 1
|
0.13
|
0.02
|
(0.06
|
)
|
(0.01
|
)
|
(0.08
|
)
|
||||||||||||
|
Net realized and unrealized gain (loss) on investments
|
(1.24
|
)
|
2.15
|
10.56
|
(4.28
|
)
|
(1.47
|
)
|
||||||||||||
|
Total from investment operations
|
(1.11
|
)
|
2.17
|
10.50
|
(4.29
|
)
|
(1.55
|
)
|
||||||||||||
|
LESS DISTRIBUTIONS:
|
||||||||||||||||||||
|
From net investment income
|
(0.11
|
)
|
(0.01
|
)
|
—
|
(0.00
|
)2
|
—
|
||||||||||||
|
From net realized gain
|
(0.36
|
)
|
(1.13
|
)
|
—
|
—
|
(0.97
|
)
|
||||||||||||
|
Total distributions
|
(0.47
|
)
|
(1.14
|
)
|
—
|
(0.00
|
)2
|
(0.97
|
)
|
|||||||||||
|
Paid-in capital from redemption
|
0.00
|
2
|
0.00
|
2
|
0.00
|
2
|
0.00
|
2
|
0.00
|
2
|
||||||||||
|
Net asset value, end of year
|
$
|
16.79
|
$
|
18.37
|
$
|
17.34
|
$
|
6.84
|
$
|
11.13
|
||||||||||
|
Total return
|
(5.92
|
)%
|
12.56
|
%
|
153.51
|
%
|
(38.53
|
)%
|
(10.91
|
)%
|
||||||||||
|
SUPPLEMENTAL DATA:
|
||||||||||||||||||||
|
Net assets, end of year (millions)
|
$
|
38.4
|
$
|
17.6
|
$
|
16.2
|
$
|
4.0
|
$
|
13.7
|
||||||||||
|
Portfolio turnover rate
|
56
|
%
|
62
|
%
|
136
|
%
|
115
|
%
|
137
|
%
|
||||||||||
|
RATIO OF EXPENSES TO AVERAGE NET ASSETS:
|
||||||||||||||||||||
|
Before fees waived and expenses absorbed
|
1.78
|
%
|
2.05
|
%
|
2.48
|
%
|
2.43
|
%
|
1.50
|
%
|
||||||||||
|
After fees waived and expenses absorbed
|
1.29
|
%
|
1.29
|
%
|
1.29
|
%
|
1.29
|
%
|
1.29
|
%
|
||||||||||
|
RATIO OF NET INVESTMENT INCOME (LOSS) TO AVERAGE NET ASSETS:
|
||||||||||||||||||||
|
Before fees waived and expenses absorbed
|
0.24
|
%
|
(0.67
|
)%
|
(1.73
|
)%
|
(1.21
|
)%
|
(0.78
|
)%
|
||||||||||
|
After fees waived and expenses absorbed
|
0.73
|
%
|
0.09
|
%
|
(0.54
|
)%
|
(0.07
|
)%
|
(0.57
|
)%
|
||||||||||
|
1
|
Calculated using the average shares outstanding method.
|
|
2
|
Does not round to $0.01 or $(0.01), as applicable.
|
The accompanying notes are an integral part of these financial statements.
31
Blue Chip Equity Income Fund
|
FINANCIAL HIGHLIGHTS For a capital share outstanding
throughout each year
|
RETAIL CLASS
|
|
Year Ended March 31,
|
|||||||||||||||||||
|
|
2023
|
2022
|
2021
|
2020
|
2019
|
|||||||||||||||
|
Net asset value, beginning of year
|
$
|
20.66
|
$
|
19.50
|
$
|
13.11
|
$
|
15.83
|
$
|
15.86
|
||||||||||
|
INCOME FROM INVESTMENT OPERATIONS:
|
||||||||||||||||||||
|
Net investment income (loss) 1
|
0.15
|
0.12
|
0.13
|
0.15
|
0.12
|
|||||||||||||||
|
Net realized and unrealized gain (loss) on investments
|
(1.28
|
)
|
3.32
|
7.22
|
(1.56
|
)
|
0.65
|
|||||||||||||
|
Total from investment operations
|
(1.13
|
)
|
3.44
|
7.35
|
(1.41
|
)
|
0.77
|
|||||||||||||
|
LESS DISTRIBUTIONS:
|
||||||||||||||||||||
|
From net investment income
|
(0.15
|
)
|
(0.12
|
)
|
(0.12
|
)
|
(0.15
|
)
|
(0.12
|
)
|
||||||||||
|
From net realized gain
|
(1.37
|
)
|
(2.16
|
)
|
(0.84
|
)
|
(1.16
|
)
|
(0.68
|
)
|
||||||||||
|
Total distributions
|
(1.52
|
)
|
(2.28
|
)
|
(0.96
|
)
|
(1.31
|
)
|
(0.80
|
)
|
||||||||||
|
Paid-in capital from redemption
|
0.00
|
2
|
0.00
|
2
|
0.00
|
2
|
0.00
|
2
|
0.00
|
2
|
||||||||||
|
Net asset value, end of year
|
$
|
18.01
|
$
|
20.66
|
$
|
19.50
|
$
|
13.11
|
$
|
15.83
|
||||||||||
|
Total return
|
(4.96
|
)%
|
17.59
|
%
|
56.53
|
%
|
(10.66
|
)%
|
5.52
|
%
|
||||||||||
|
SUPPLEMENTAL DATA:
|
||||||||||||||||||||
|
Net assets, end of year (millions)
|
$
|
27.9
|
$
|
30.1
|
$
|
26.1
|
$
|
18.8
|
$
|
24.0
|
||||||||||
|
Portfolio turnover rate
|
53
|
%
|
79
|
%
|
67
|
%
|
51
|
%
|
44
|
%
|
||||||||||
|
RATIO OF EXPENSES TO AVERAGE NET ASSETS:
|
||||||||||||||||||||
|
Before fees waived and expenses absorbed
|
1.54
|
%
|
1.49
|
%
|
1.64
|
%
|
1.47
|
%
|
1.48
|
%
|
||||||||||
|
After fees waived and expenses absorbed
|
1.30
|
%
|
1.30
|
%
|
1.30
|
%
|
1.30
|
%
|
1.30
|
%
|
||||||||||
|
RATIO OF NET INVESTMENT INCOME (LOSS) TO AVERAGE NET ASSETS:
|
||||||||||||||||||||
|
Before fees waived and expenses absorbed
|
0.58
|
%
|
0.39
|
%
|
0.37
|
%
|
0.73
|
%
|
0.59
|
%
|
||||||||||
|
After fees waived and expenses absorbed
|
0.82
|
%
|
0.58
|
%
|
0.71
|
%
|
0.90
|
%
|
0.76
|
%
|
||||||||||
|
1
|
Calculated using the average shares outstanding method.
|
|
2
|
Does not round to $0.01 or $(0.01), as applicable.
|
The accompanying notes are an integral part of these financial statements.
32
Hodges Mutual Funds
|
NOTES TO FINANCIAL STATEMENTS March 31, 2023
|
|
NOTE 1 – ORGANIZATION
|
The Hodges Fund, Small Cap Fund, Small Intrinsic Value Fund, and Blue Chip Equity Income Fund (each a “Fund” and collectively the “Funds”) are each a diversified
series of shares of beneficial interest of Professionally Managed Portfolios (the “Trust”), which is registered under the Investment Company Act of 1940, as amended (the “1940 Act”) as an open-end management investment company. Each Fund is an
investment company and accordingly follows the investment company accounting and reporting guidance of the Financial Accounting Standards Board (FASB) Accounting Standard Codification Topic 946 “Financial Services—Investment Companies”. The Hodges
Fund commenced operations on October 9, 1992. The Hodges Fund currently offers a Retail Class of shares only. The Small Cap Fund commenced operations on December 18, 2007. The Small Cap Fund currently offers two classes of shares: Retail Class and
Institutional Class. The Retail Class commenced operations on December 18, 2007 and the Institutional Class commenced operations on December 12, 2008. The Small Intrinsic Value Fund commenced operations on December 26, 2013 and offers a Retail Class
of shares only. The Blue Chip Equity Income Fund commenced operations on September 10, 2009 and offers a Retail Class of shares only.
Each class of shares has equal rights as to earnings and assets except that each class bears its own distribution expenses. Each class of shares has exclusive
voting rights with respect to matters that affect just that class. Income, expenses (other than expenses attributable to a specific class), and realized and unrealized gains or losses on investments are allocated to each class of shares based on its
relative net assets.
The investment objective of the Hodges Fund, Small Cap Fund, and Small Intrinsic Value Fund is long-term capital appreciation. The investment objective of the Blue
Chip Equity Income Fund is to seek income and long-term capital appreciation.
|
NOTE 2 – SIGNIFICANT ACCOUNTING POLICIES
|
The following is a summary of significant accounting policies consistently followed by the Funds. These policies are in conformity with accounting principles
generally accepted in the United States of America (“U.S. GAAP”).
|
A.
|
Security Valuation. All equity securities, which may include Real Estate Investment Trusts (“REITs”), Business Development Companies (“BDCs”), and
Master Limited Partnerships (“MLPs”), that are traded on U.S. or foreign national securities exchanges, are valued at the last reported sale price on the exchange on which the security is principally traded or the exchange’s official closing
price, if applicable. If, on a particular day, an exchange-traded security does not trade, then the mean between the most recent quoted bid and asked prices will be used. All equity securities, which may include REITs, BDCs, and MLPs, that
are not traded on a listed exchange are valued at the last sale price in the over-the-counter market. If a non-exchange traded security does not trade on a particular day, then the mean between the last quoted closing bid and asked price
will be used.
|
|
|
Debt securities are valued by using the evaluated mean price supplied by an approved independent pricing service. The independent pricing service may use various valuation methodologies
including, matrix pricing and other analytical pricing models as well as market transactions and dealer quotations. These models generally consider such factors as yields or prices of bonds of comparable quality, type of issue, coupon,
maturity, ratings and general market conditions.
|
||
|
Exchange traded options are valued at the composite price, using the National Best Bid and Offer quotes (“NBBO”). NBBO consists of the highest bid price and lowest ask price across any of the
exchanges on which an option is quoted, thus providing a view across the entire U.S. options marketplace. Composite option pricing calculates the mean of the highest bid price and lowest ask price across the exchanges where the option is
traded.
|
||
|
Prior to the compliance date of Rule 2a-5 of the 1940 Act (“Rule 2a-5”) on September 8, 2022, the Board of Trustees (the “Board”) had delegated day-today valuation issues to a Valuation
Committee of the Trust, which was comprised of representatives from the Fund’s administrator, U.S. Bancorp Fund Services, LLC, doing business as U.S. Bank Global Fund Services (“Fund Services”). The function of the Valuation Committee was to
value securities where current and reliable market quotations were not readily available or the closing price did not represent fair value by following procedures approved by the Board. These procedures considered many factors, including the
type of security, size of holding, trading volume and news events. All actions taken by the Valuation Committee were subsequently reviewed and ratified by the Board. The Valuation Committee served until September 7, 2022. Effective September
8, 2022, the Board approved Hodges Capital Management, Inc. (the “Advisor”), as the Fund’s valuation designee under Rule 2a-5 which shall determine fair value of securities for which readily available market quotes are not available in
accordance with procedures approved by the Board.
|
33
Hodges Mutual Funds
|
NOTES TO FINANCIAL STATEMENTS March 31, 2023 (Continued)
|
|
As described above, the Funds utilize various methods to measure the fair value of their investments on a recurring basis. U.S. GAAP establishes a hierarchy that prioritizes inputs to valuation
methods. The three levels of inputs are:
|
|
Level 1 –
|
Unadjusted quoted prices in active markets for identical assets or liabilities that the Funds have the ability to access.
|
|
|
Level 2 –
|
Observable inputs other than quoted prices included in Level 1 that are observable for the asset or liability, either directly or indirectly. These inputs may include quoted prices for the
identical instrument on an inactive market, prices for similar instruments, interest rates, prepayment speeds, credit risk, yield curves, default rates and similar data.
|
|
|
Level 3 –
|
Unobservable inputs for the asset or liability, to the extent relevant observable inputs are not available; representing the Funds’ own assumptions about the assumptions a market participant
would use in valuing the asset or liability, and would be based on the best information available.
|
|
The availability of observable inputs can vary from security to security and is affected by a wide variety of factors, including, for example, the type of security, whether the security is new
and not yet established in the marketplace, the liquidity of markets and other characteristics particular to the security. To the extent that valuation is based on models or inputs that are less observable or unobservable in the market, the
determination of fair value requires more judgment. Accordingly, the degree of judgment exercised in determining fair value is greatest for instruments categorized in Level 3.
|
|
|
The inputs used to measure fair value may fall into different levels of the fair value hierarchy. In such cases, for disclosure purposes, the level in the fair value hierarchy within which the
fair value measurement falls in its entirety, is determined based on the lowest level input that is significant to the fair value measurement in its entirety.
|
|
|
The following are summaries of the inputs used to value the Funds’ investments as of March 31, 2023. See the Schedules of Investments for industry breakouts.
|
|
Hodges Fund:
|
Level 1
|
Level 2
|
Level 3
|
Total
|
|||||||||||||
|
Common Stocks
|
$
|
145,602,646
|
$
|
—
|
$
|
—
|
$
|
145,602,646
|
|||||||||
|
Options
|
—
|
4,834,375
|
—
|
4,834,375
|
|||||||||||||
|
Total Investments in Securities
|
$
|
145,602,646
|
$
|
4,834,375
|
$
|
—
|
$
|
150,437,021
|
|||||||||
|
Small Cap Fund:
|
Level 1
|
Level 2
|
Level 3
|
Total
|
|||||||||||||
|
Common Stocks
|
$
|
173,979,799
|
$
|
—
|
$
|
—
|
$
|
173,979,799
|
|||||||||
|
Total Investments in Securities
|
$
|
173,979,799
|
$
|
—
|
$
|
—
|
$
|
173,979,799
|
|||||||||
|
Small Intrinsic Value Fund:
|
Level 1
|
Level 2
|
Level 3
|
Total
|
|||||||||||||
|
Common Stocks
|
$
|
36,986,467
|
$
|
—
|
$
|
—
|
$
|
36,986,467
|
|||||||||
|
Warrants
|
19,749
|
—
|
—
|
19,749
|
|||||||||||||
|
Total Investments in Securities
|
$
|
37,006,216
|
$
|
—
|
$
|
—
|
$
|
37,006,216
|
|||||||||
|
Blue Chip Equity Income Fund:
|
Level 1
|
Level 2
|
Level 3
|
Total
|
|||||||||||||
|
Common Stocks
|
$
|
27,222,415
|
$
|
—
|
$
|
—
|
$
|
27,222,415
|
|||||||||
|
Total Investments in Securities
|
$
|
27,222,415
|
$
|
—
|
$
|
—
|
$
|
27,222,415
|
|||||||||
|
The Funds have adopted financial reporting rules and regulations that require enhanced disclosure regarding derivatives and hedging activity intending to improve financial reporting of
derivative instruments by enabling investors to understand how an entity uses derivatives, how derivatives are accounted for, and how derivative instruments affect an entity’s results of operations and financial position.
|
|
|
Each Fund may invest in options, traded on U.S. and foreign exchanges, on equities, debt and stock indices as a substitute for a comparable market position in the underlying security, to attempt
to hedge or limit the exposure of a Fund’s position, and to effect closing transactions. Each Fund may write covered put and call options on securities, securities indices and currencies in which it may invest to serve as a partial hedge
against a price decline of the underlying security.
|
34
Hodges Mutual Funds
|
NOTES TO FINANCIAL STATEMENTS March 31, 2023 (Continued)
|
|
Balance Sheet
|
|
|
Values of derivative instruments as of March 31, 2023:
|
|
|
Hodges Fund
|
|
Asset Derivatives as of
|
Liability Derivatives as of
|
|||||||||||
|
March 31, 2023
|
March 31, 2023
|
|||||||||||
|
Derivative Instruments
|
Balance Sheet Location
|
Value
|
Balance Sheet Location
|
Value
|
||||||||
|
Equity Contracts:
|
Investments in unaffiliated
|
|||||||||||
|
Call Options Purchased
|
securities, at value
|
$
|
4,834,375
|
None
|
$
|
—
|
||||||
|
Total
|
$
|
4,834,375
|
$
|
—
|
||||||||
|
The effect of derivative instruments on the Statements of Operations for the year ended March 31, 2023:
|
|
|
Hodges Fund
|
|
Change in Unrealized
|
||||
|
Location of Gain
|
Realized Gain
|
Appreciation/Depreciation
|
||
|
(Loss) on Derivatives
|
(Loss) on Derivatives
|
on Derivatives
|
||
|
Derivative Instruments
|
Recognized in Income
|
Recognized in Income
|
Recognized in Income
|
|
|
Equity Contracts:
|
Realized and Unrealized
|
|||
|
Call Options Purchased
|
Gain (Loss) on Investments
|
$435,267
|
$(871,319)
|
|
|
Equity Contracts:
|
Realized and Unrealized
|
|||
|
Call Options Written
|
Gain (Loss) on Investments
|
191,699
|
(180,123)
|
|
|
Small Cap Fund
|
||||
|
Change in Unrealized
|
||||
|
Location of Gain
|
Realized Gain
|
Appreciation/Depreciation
|
||
|
(Loss) on Derivatives
|
(Loss) on Derivatives
|
on Derivatives
|
||
|
Derivative Instruments
|
Recognized in Income
|
Recognized in Income
|
Recognized in Income
|
|
|
Equity Contracts:
|
Realized and Unrealized
|
|||
|
Equity Contracts:
|
Realized and Unrealized
|
|||
|
Call Options Written
|
Gain (Loss) on Investments
|
$ —
|
$ 9,010
|
|
The average absolute notional value of options held and written during the year ended March 31, 2023 was $21,592,368 in the Hodges Fund.
|
||
|
B.
|
Foreign Currency. Investment securities and other assets and liabilities denominated in foreign currencies are translated into U.S. dollar amounts at the
date of valuation. Purchases and sales of investment securities and income and expense items denominated in foreign currencies are translated into U.S. dollar amounts on the respective dates of such transactions.
|
|
|
The Funds do not isolate that portion of the results of operations resulting from changes in foreign exchange rates on investments from the fluctuations arising from changes in market prices of
securities held. Such fluctuations are included with the net unrealized and realized gain or loss from investments.
|
||
|
The Funds do not isolate net realized foreign exchange gains or losses that arise from sales of foreign currencies, currency gains or losses realized between the trade and settlement dates on
securities transactions, and the difference between the amounts of dividends, interest, and foreign withholding taxes recorded on the Funds’ books and the U.S. dollar equivalent of the amounts actually received or paid. Such fluctuations are
included with the net realized gain or loss from investments. Net fair values of assets and liabilities, other than investments in securities at fiscal period end, resulting from changes in exchange rates.
|
||
|
C.
|
Federal Income Taxes. Each Fund has elected to be taxed as a “regulated investment company” and intends to distribute substantially all taxable income
to its shareholders and otherwise comply with the provisions of the Internal Revenue Code applicable to regulated investment companies. Therefore, no provision for federal income taxes or excise taxes has been made.
|
35
Hodges Mutual Funds
|
NOTES TO FINANCIAL STATEMENTS March 31, 2023 (Continued)
|
|
In order to avoid imposition of the excise tax applicable to regulated investment companies, each Fund intends to declare each year as dividends in each calendar year at least 98.0% of its net
investment income (earned during the calendar year) and at least 98.2% of its net realized capital gains (earned during the twelve months ended October 31) plus undistributed amounts, if any, from prior years.
|
|
|
Net capital losses incurred after October 31 and within the taxable year are deemed to arise on the first business day of each Fund’s next taxable year. Net investment losses incurred after
December 31, and within the taxable year, are deemed to arise on the first business day of the Funds’ next taxable year.
|
|
|
As of fiscal year end March 31, 2023, the Funds deferred, on a tax basis, late year and post-October losses of:
|
|
Late Year Losses
|
Post-October Losses
|
||||||||
|
Hodges Fund
|
$
|
228,761
|
$
|
—
|
|||||
|
Small Cap Fund
|
198,014
|
—
|
|||||||
|
Small Intrinsic Value Fund
|
—
|
59,363
|
|||||||
|
Blue Chip Equity Income Fund
|
—
|
—
|
|||||||
|
As of fiscal year end March 31, 2023, the Funds had the following capital loss carryovers available for federal income tax purposes, which do not expire:
|
|
Capital Loss Carryovers
|
|||||||||
|
Short-Term
|
Long-Term
|
||||||||
|
Hodges Fund
|
$
|
—
|
$
|
—
|
|||||
|
Small Cap Fund
|
—
|
—
|
|||||||
|
Small Intrinsic Value Fund
|
—
|
—
|
|||||||
|
Blue Chip Equity Income Fund
|
780,021
|
—
|
|||||||
|
As of March 31, 2023, the Funds did not have any tax positions that did not meet the “more likely-than-not” threshold of being sustained by the applicable tax authority. Generally, tax
authorities can examine all the tax returns filed for the last three fiscal years. The Funds identify their major tax jurisdictions as U.S. Federal and the Commonwealth of Massachusetts. As of March 31, 2023, the Funds are not aware of any
tax positions for which it is reasonably possible that the total amounts of unrecognized tax benefits will change materially.
|
||
|
D.
|
Securities Transactions and Investment Income. Investment securities transactions are accounted for on the trade date. Gains and losses realized on
sales of securities are determined on a specific identification basis. Discounts/premiums on debt securities purchased are accreted/amortized over the life of the respective securities using the effective interest method. Dividend income is
recorded on the ex-dividend date. Interest income is recorded on an accrual basis. Dividends received from REITs generally are comprised of ordinary income, capital gains, and may include return of capital. Other non-cash dividends are
recognized as investment income at the fair value of the property received. Withholding taxes on foreign dividends have been provided for in accordance with the Trust’s understanding of the applicable country’s tax rules and rates.
|
|
|
E.
|
Distributions to Shareholders. Distributions to shareholders from net investment income and net realized gains, if any, on securities for the Hodges
Fund, Small Cap Fund, and Small Intrinsic Value Fund are normally declared and paid on an annual basis. Distributions to shareholders from net investment income for the Blue Chip Equity Income Fund normally are declared and paid on a
quarterly basis. Distributions to shareholders from net realized gains on securities normally are declared and paid on an annual basis. Distributions are recorded on the ex-dividend date.
|
|
|
F.
|
Options Contracts. The Funds may purchase call and put options on securities and indices. As the holder of a call option, each Fund has the right to
purchase the underlying security at the exercise price at any time until the expiration date. As a holder of a put option, each Fund has the right to sell the underlying security at the exercise price at any time until the expiration date.
The Funds may enter into closing sale transactions with respect to such options, exercise such options, or permit such options to expire. If an option expires on the stipulated date or if a Fund enters into a closing sale transaction, a gain
or loss is realized. If a Fund exercises a call option, the cost of the security acquired is increased by the premium paid for the call. Each Fund may write (sell) covered put and call options on securities, security indices, and currencies
in which it may invest. When a Fund writes an option, an amount equal to the premium received by a Fund is recorded as a liability and is subsequently adjusted to reflect the current fair value of the option written. Premiums received from
writing options that expire unexercised are treated by the Fund on the expiration date as realized gains from investments. The difference between the premium and the amount paid on effecting a closing purchase transaction, including brokerage
commissions, is also treated as a realized gain, or, if the premium is less than the amount paid for the
|
36
Hodges Mutual Funds
|
NOTES TO FINANCIAL STATEMENTS March 31, 2023 (Continued)
|
|
closing purchase transaction, as a realized loss. If a call option is exercised, the premium is added to the proceeds from the sale of the underlying security in determining whether a Fund has
realized a gain or loss. If a put option is exercised, the premium reduces the cost basis of the securities purchased by the Fund. Each Fund, as writer of an option, bears the market risk of an unfavorable change in the price of the security
underlying the written option.
|
||
|
G.
|
Use of Estimates. The preparation of financial statements in conformity with U.S. GAAP requires management to make estimates and assumptions that affect
the reported amounts of assets and liabilities at the date of the financial statements and the reported amount of revenue and expenses during the reporting period. Actual results could differ from those estimates.
|
|
|
H.
|
Share Valuation. The net asset value (“NAV”) per share of each Fund is calculated by dividing the sum of the value of the securities held by each Fund,
plus cash or other assets, minus all liabilities (including estimated accrued expenses) by the total number of shares outstanding for each Fund, rounded to the nearest cent. The Funds’ shares will not be priced on the days on which the New
York Stock Exchange is closed for trading. The offering and redemption price per share for each Fund is equal to each Fund’s NAV per share. The Hodges Fund Retail Class, Small Cap Fund Retail Class, Small Intrinsic Value Fund, and Blue Chip
Equity Income Fund charge a redemption fee equal to 1% of the net amount of redemptions if redeemed within 30 calendar days after purchase. The Institutional Class of the Small Cap Fund charges a redemption fee equal to 1% of the net amount
of redemptions if redeemed within 60 calendar days after purchase. These fees are deducted from the redemption proceeds otherwise payable to the shareholder. Each Fund will retain the fee charged as paid-in capital and such fees become part
of that Fund’s daily NAV calculation.
|
|
|
I.
|
Guarantees and Indemnifications. In the normal course of business, each Fund enters into contracts with service providers that contain general
indemnification clauses. The Funds’ maximum exposure under these arrangements is unknown as this would involve future claims that may be made against the Funds that have not yet occurred. However, based on experience, the Funds expect the
risk of loss to be remote.
|
|
|
J.
|
Recently Issued Accounting Pronouncements. In June 2022, the FASB issued Accounting Standards Update 2022-03, which amends Fair Value Measurement (Topic
820): Fair Value Measurement of Equity Securities Subject to Contractual Sale Restrictions (“ASU 2022-03”). ASU 202203 clarifies guidance for fair value measurement of an equity security subject to a contractual sale restriction and
establishes new disclosure requirements for such equity securities. ASU 2022-03 is effective for fiscal years beginning after December 15, 2023 and for interim periods within those fiscal years, with early adoption permitted. Management is
currently evaluating the impact of these amendments on their financial statements.
|
|
|
K.
|
Reclassification of Capital Accounts. U.S. GAAP requires that certain components of net assets relating to permanent differences be reclassified between
financial and tax reporting. These reclassifications have no effect on net assets or net asset value per share. For the year ended March 31, 2022, the following adjustments were made 1.
|
|
Total Distributable Earnings
|
Paid-in Capital
|
||||||||
|
Hodges Fund
|
$
|
(36,933
|
)
|
$
|
36,933
|
||||
|
Small Cap Fund
|
(2,611,161
|
)
|
2,611,161
|
||||||
|
Small Intrinsic Value Fund
|
(63,334
|
)
|
63,334
|
||||||
|
Blue Chip Equity Income Fund
|
1,053
|
(1,053
|
)
|
||||||
|
1
|
These differences are primarily due to adjustments for net operating losses, foreign currency, equalization and reclassification of dividends.
|
|
L.
|
Subsequent Events. In preparing these financial statements, the Funds have evaluated events and transactions for potential recognition or disclosure
through the date the financial statements were issued. The Funds have determined that there were no subsequent events that would need to be disclosed in the Funds’ financial statements.
|
|
NOTE 3 – COMMITMENTS AND OTHER RELATED PARTY TRANSACTIONS
|
The Advisor provides the Funds with investment management services under an Investment Advisory Agreement (the “Advisory Agreement”). Under the Advisory Agreement,
the Advisor furnishes all investment advice, office space, certain administrative services, and provides most of the personnel needed by the Funds. As compensation for its services, the Advisor is entitled to a monthly fee at the annual rate of 0.85%
for the Hodges Fund, Small Cap Fund, Small Intrinsic Value Fund, and 0.65% for the Blue Chip Equity Income Fund, based upon the average daily net assets of each Fund. Effective as of September 1, 2020, the Advisor has contractually agreed to lower
its management fee in the Hodges Fund and Small Cap Fund from 0.85% to 0.82% until August 31, 2022 (the “Management Fee Waiver”). This contractual waiver may not be terminated without the approval of the Board. The Advisor has waived its right to
receive reimbursement of the portion of its advisory fees waived
37
Hodges Mutual Funds
|
NOTES TO FINANCIAL STATEMENTS March 31, 2023 (Continued)
|
pursuant to the advisory fee waiver agreement. Effective September 1, 2022, the Management Fee Waiver was terminated. For the year ended March 31, 2023, the advisory fees incurred by
the Funds are disclosed in the Statements of Operations. The investment advisory fees incurred are paid monthly to the Advisor, net of any monthly waiver or reimbursement discussed below.
The Funds are responsible for their own operating expenses. The Advisor has contractually agreed to limit Fund expenses as follows by reducing all or a portion of
its fees and reimbursing the Fund expenses so that its ratio of expenses to average net assets will not exceed:
|
Hodges Fund
|
0.93% 1
|
|
|
Small Cap Fund Retail Class
|
1.15% 1
|
|
|
Small Intrinsic Value Fund
|
1.04%
|
|
|
Blue Chip Equity Income Fund
|
1.05%
|
|
1
|
Prior to the termination of the Management Fee Waiver, these amounts were 0.90% and 1.12% for the Hodges Fund and Small Cap Fund, respectively.
|
Any fees waived and/or any Fund expenses absorbed (excluding any fees waived under the Management Fee Waiver) by the Advisor pursuant to an agreed upon expense cap
shall be reimbursed by the respective Fund to the Advisor, if so requested by the Advisor, any time before the end of the third year following the period to which the fee waiver and/or expense absorption relates, provided the aggregate amount of the
respective Fund’s current operating expenses for such period does not exceed the lesser expense cap in place at the time of waiver or at the time of reimbursement. Each Fund must pay its current ordinary operating expenses before the Advisor is
entitled to any reimbursements of fees and/or expenses. Any such reimbursement is also contingent upon Board’s review and approval. For the year ended March 31, 2023, the amount of fees waived and expenses reimbursed by the Advisor are disclosed in
the Statements of Operations. Amounts due from the Advisor are paid monthly to the Funds, if applicable.
At March 31, 2023, the cumulative unreimbursed amount paid and/or waived by the Advisor on behalf of the Hodges Fund, Small Cap Fund, Small Intrinsic Value Fund,
and Blue Chip Equity Income Fund that may be recouped was $965,782, $71,950, $381,356, and $200,834, respectively. The Advisor may recapture portions of the above amounts no later than the dates stated below:
|
March 31, 2024
|
March 31, 2025
|
March 31, 2026
|
|||||||||||
|
Hodges Fund
|
$
|
302,379
|
$
|
378,323
|
$
|
285,080
|
|||||||
|
Small Cap Fund
|
61,633
|
10,317
|
—
|
||||||||||
|
Small Intrinsic Value Fund
|
132,627
|
128,404
|
120,325
|
||||||||||
|
Blue Chip Equity Income Fund
|
80,210
|
54,986
|
65,638
|
||||||||||
U.S. Bancorp Fund Services, LLC, doing business as U.S. Bank Global Fund Services (“Fund Services”), serves as the Funds’ administrator, fund accountant, and
transfer agent. In those capacities, Fund Services maintains the Funds’ books and records, calculates each Fund’s NAV, prepares various federal and state regulatory filings, coordinates the payment of the Funds’ expenses, reviews expense accruals,
and prepares materials supplied to the Board. The officers of the Trust and the Chief Compliance Officer are also employees of Fund Services. Fees paid by the Funds to Fund Services for these services for the year ended March 31, 2023, are disclosed
in the Statements of Operations.
Quasar Distributors, LLC (the “Distributor”) acts as the Funds’ principal underwriter in a continuous public offering of the Funds’ shares. U.S. Bank N.A. serves
as custodian to the Funds. U.S. Bank N.A. is an affiliate of Fund Services.
Each Fund has adopted a Distribution Plan (the “Plan”) in accordance with Rule 12b-1 under the 1940 Act. The Plan provides that each Fund’s Retail Class may pay a
fee to the Distributor at an annual rate of up to 0.25% of the average daily net assets of each Fund. The fee is paid to the Distributor for the sale and distribution of a Fund’s shares and services it provides to shareholders. Fees paid by the Funds
to the Distributor for services for the year ended March 31, 2023, are disclosed in the Statements of Operations. For the year ended March 31, 2023, First Dallas Securities, an affiliate of the Advisor, received $78,132, $71,872, $9,849, and $13,784
in distribution fees from the Hodges Fund, Small Cap Fund, Small Intrinsic Value Fund, and Blue Chip Equity Income Fund, respectively.
Each Fund has entered into sub-transfer agent arrangements (the “Arrangements”), for sub-transfer agent fees paid to third-party intermediaries, with respect to
each Fund. All Arrangements must be approved by the Board. For the year ended March 31, 2023, sub-transfer agent fees incurred by the Funds are disclosed in the Statements of Operations.
38
Hodges Mutual Funds
|
NOTES TO FINANCIAL STATEMENTS March 31, 2023 (Continued)
|
For the year ended March 31, 2023 First Dallas Securities received $114,306, $67,486, $15,514, and $4,133 in brokerage commissions with respect to the Hodges Fund,
Small Cap Fund, Small Intrinsic Value Fund, and Blue Chip Equity Income Fund for portfolio transactions, respectively.
The Funds may purchase securities from, or sell securities to, an affiliated Fund under specific conditions outlined in procedures adopted by the Board. The
procedures have been designed to ensure that any purchase or sale of securities by the Funds from or to another Fund or portfolio that is or could be considered an affiliate by virtue of having a common investment advisor (or affiliated investment
advisors), common Trustees, and/or common officers complies with Rule 17a-7 of the 1940 Act. Further, as defined under the procedures, each transaction is effected at the current market price. Pursuant to these procedures, for the year ended March
31, 2023, the Small Cap Fund and Small Intrinsic Value Fund engaged in the following securities purchases and sales. The Hodges Fund and Blue Chip Equity Income Fund did not engage in any securities purchases or sales pursuant to these procedures for
the year ended March 31, 2023.
|
Purchases
|
Sales
|
||||||||
|
Small Cap Fund
|
$
|
—
|
$
|
429,600
|
|||||
|
Small Intrinsic Value Fund
|
429,600
|
—
|
|||||||
|
NOTE 4 – PURCHASES AND SALES OF SECURITIES
|
The cost of purchases and proceeds from the sale or maturity of securities for the Funds, excluding short-term investments, for the year ended March 31, 2023, were
as follows:
|
Purchases
|
Sales
|
||||||||
|
Hodges Fund
|
$
|
108,427,228
|
$
|
115,996,481
|
|||||
|
Small Cap Fund
|
127,535,727
|
148,102,564
|
|||||||
|
Small Intrinsic Value Fund
|
34,300,343
|
13,059,799
|
|||||||
|
Blue Chip Equity Income Fund
|
14,326,255
|
15,225,811
|
|||||||
There were no purchases or sales of U.S. Government obligations for any of the Funds for the year ended March 31, 2023.
|
NOTE 5 – DISTRIBUTIONS TO SHAREHOLDERS
|
The tax character of distributions paid during the year ended March 31, 2023, and the year ended March 31, 2022, for each Fund were as follows:
|
Hodges Fund
|
March 31, 2023
|
March 31, 2022
|
|||||||
|
Distributions paid from:
|
|||||||||
|
Ordinary income
|
$
|
685,796
|
$
|
—
|
|||||
|
Total
|
$
|
685,796
|
$
|
—
|
|||||
|
Small Cap Fund
|
March 31, 2023
|
March 31, 2022
|
|||||||
|
Distributions paid from:
|
|||||||||
|
Long-term capital gain 1
|
$
|
10,589,894
|
$
|
24,601,714
|
|||||
|
Ordinary income
|
—
|
13,561,868
|
|||||||
|
Total
|
$
|
10,589,894
|
$
|
38,163,582
|
|||||
|
Small Intrinsic Value Fund
|
March 31, 2023
|
March 31, 2022
|
|||||||
|
Distributions paid from:
|
|||||||||
|
Long-term capital gain 1
|
$
|
508,617
|
$
|
760,153
|
|||||
|
Ordinary income
|
458,488
|
251,868
|
|||||||
|
Total
|
$
|
967,105
|
$
|
1,012,021
|
|||||
|
Blue Chip Equity Income Fund
|
March 31, 2023
|
March 31, 2022
|
|||||||
|
Distributions paid from:
|
|||||||||
|
Long-term capital gain 1
|
$
|
1,816,609
|
$
|
1,765,782
|
|||||
|
Ordinary income
|
401,923
|
1,271,931
|
|||||||
|
Total
|
$
|
2,218,532
|
$
|
3,037,713
|
|||||
|
1
|
Designated as long-term capital gain dividend, pursuant to Internal Revenue Code Section 852(b)(3).
|
39
Hodges Mutual Funds
|
NOTES TO FINANCIAL STATEMENTS March 31, 2023 (Continued)
|
As of the year end March 31, 2023, the components of distributable earnings on a tax basis were as follows 1:
|
Hodges Fund
|
Small Cap Fund
|
||||||||
|
Cost of Investments
|
$
|
121,011,343
|
$
|
118,864,603
|
|||||
|
Gross tax unrealized appreciation
|
42,510,508
|
59,665,028
|
|||||||
|
Gross tax unrealized depreciation
|
13,084,830
|
4,549,832
|
|||||||
|
Net unrealized appreciation
|
29,425,678
|
55,115,196
|
|||||||
|
Undistributed ordinary income
|
—
|
—
|
|||||||
|
Undistributed long-term capital gain
|
1,228,816
|
7,947,186
|
|||||||
|
Total distributable earnings
|
1,228,816
|
7,947,186
|
|||||||
|
Other accumulated gains/(losses)
|
(228,761
|
)
|
(198,014
|
)
|
|||||
|
Total accumulated gains
|
$
|
30,425,733
|
$
|
62,864,368
|
|||||
|
Small Intrinsic
|
Blue Chip Equity
|
||||||||
|
Value Fund
|
Income Fund
|
||||||||
|
Cost of Investments
|
$
|
33,163,380
|
$
|
18,047,661
|
|||||
|
Gross tax unrealized appreciation
|
6,323,304
|
9,238,098
|
|||||||
|
Gross tax unrealized depreciation
|
2,480,468
|
63,344
|
|||||||
|
Net unrealized appreciation
|
3,842,836
|
9,174,754
|
|||||||
|
Undistributed ordinary income
|
—
|
—
|
|||||||
|
Undistributed long-term capital gain
|
—
|
—
|
|||||||
|
Total distributable earnings
|
—
|
—
|
|||||||
|
Other accumulated gains/(losses)
|
(59,363
|
)
|
(780,021
|
)
|
|||||
|
Total accumulated gains
|
$
|
3,783,473
|
$
|
8,394,733
|
|||||
|
1
|
The difference between book basis and tax basis unrealized appreciation was primarily attributable to the treatment of wash sale adjustments and straddle loss deferrals.
|
|
NOTE 6 – INVESTMENTS IN AFFILIATES
|
Affiliated companies are those that are “affiliated persons” as defined in Section 2(a)(3) of the 1940 Act. They include, among other entities, issuers 5% or more
of whose outstanding voting shares are held by the Fund. For the year ended March 31, 2023, the Funds’ had the following transactions with affiliated companies:
Hodges Fund
|
Share
|
Change in
|
||||||||||||||||||||||||||||||||||
|
Balance
|
Value
|
Realized
|
Unrealized
|
Value
|
|||||||||||||||||||||||||||||||
|
March 31,
|
March 31,
|
Acqui-
|
Dispo-
|
Corporate
|
Gain
|
Appreciation/
|
March 31,
|
Dividend
|
|||||||||||||||||||||||||||
|
Common Stocks
|
2023
|
2022
|
sitions
|
sitions
|
Actions
|
(Loss)
|
Depreciation
|
2023
|
Income
|
||||||||||||||||||||||||||
|
The Dixie
|
|||||||||||||||||||||||||||||||||||
|
Group, Inc. 1,2
|
564,641
|
$
|
3,100,000
|
$
|
—
|
$
|
(328,639
|
)
|
$
|
—
|
$
|
(1,941,979
|
)
|
$
|
(400,255
|
)
|
$
|
429,127
|
$
|
—
|
|||||||||||||||
|
Luby’s, Inc. 1,2
|
—
|
3,732,314
|
—
|
(2,952,879
|
)
|
(320,000
|
)
|
1,931,542
|
(2,390,977
|
)
|
—
|
—
|
|||||||||||||||||||||||
|
Total
|
$
|
(10,437
|
)
|
$
|
(2,791,232
|
)
|
$
|
429,127
|
$
|
—
|
|||||||||||||||||||||||||
|
1
|
Non-income producing security.
|
|
2
|
Security was not considered an affiliate at March 31, 2023, but was considered an affiliate at March 31, 2022.
|
The Hodges Fund did not have investments in majority-owned subsidiaries or other controlled companies.
The Small Cap Fund, Small Intrinsic Value Fund, and Blue Chip Equity Income Fund had no transactions with affiliated companies during the year ended March 31,
2023.
40
Hodges Mutual Funds
|
NOTES TO FINANCIAL STATEMENTS March 31, 2023 (Continued)
|
|
NOTE 7 – CREDIT FACILITY
|
U.S. Bank N.A. has made available to the Funds credit facilities pursuant to separate Loan and Security Agreements for temporary or extraordinary purposes. Credit
facility activity for the year ended March 31, 2023, was as follows:
|
Small
|
Small Intrinsic
|
Blue Chip Equity
|
|||||||||||||||
|
Hodges Fund
|
Cap Fund
|
Value Fund
|
Income Fund
|
||||||||||||||
|
Maximum available credit
|
$
|
20,000,000
|
$
|
30,000,000
|
$
|
1,000,000
|
$
|
2,000,000
|
|||||||||
|
Largest amount outstanding on an individual day
|
2,406,000
|
887,000
|
14,000
|
271,000
|
|||||||||||||
|
Average balance when in use
|
333,913
|
229,517
|
14,000
|
165,750
|
|||||||||||||
|
Credit facility outstanding as of March 31, 2023
|
—
|
—
|
—
|
—
|
|||||||||||||
|
Average interest rate when in use
|
5.97
|
%
|
6.51
|
%
|
6.25
|
%
|
6.50
|
%
|
|||||||||
Interest expense for the year ended March 31, 2023, is disclosed in the Statements of Operations, as applicable.
41
Hodges Mutual Funds
|
REPORT OF INDEPENDENT REGISTERED PUBLIC ACCOUNTING FIRM
|
To the Board of Trustees of Professionally Managed Portfolios
and Shareholders of the Hodges Funds
Opinion on the Financial Statements
We have audited the accompanying statements of assets and liabilities of Hodges Fund, Hodges Small Cap Fund, Hodges Small Intrinsic Value Fund, and Hodges Blue Chip Equity Income
Fund (the “Funds”), each a series of Professionally Managed Portfolios (the “Trust”), including the schedule of investments, as of March 31, 2023, the related statements of operations for the year then ended, the statements of changes in net assets
for each of the two years in the period then ended, the financial highlights for each of the five years in the period then ended, and the related notes (collectively referred to as the “financial statements”). In our opinion, the financial statements
present fairly, in all material respects, the financial position of the Funds as of March 31, 2023, the results of their operations for the year then ended, the changes in their net assets for each of the two years in the period then ended, and their
financial highlights for each of the five years in the period then ended, in conformity with accounting principles generally accepted in the United States of America.
Basis for Opinion
These financial statements are the responsibility of the Funds’ management. Our responsibility is to express an opinion on the Funds’ financial statements based on our audits. We are
a public accounting firm registered with the Public Company Accounting Oversight Board (United States) (“PCAOB”) and are required to be independent with respect to the Funds in accordance with the U.S. federal securities laws and the applicable rules
and regulations of the Securities and Exchange Commission and the PCAOB. We have served as the auditor of one or more of the funds in the Trust since 1995.
We conducted our audits in accordance with the standards of the PCAOB. Those standards require that we plan and perform the audits to obtain reasonable assurance about whether the
financial statements are free of material misstatement, whether due to error or fraud. The Funds are not required to have, nor were we engaged to perform, an audit of the Funds’ internal control over financial reporting. As part of our audits we are
required to obtain an understanding of internal control over financial reporting, but not for the purpose of expressing an opinion on the effectiveness of the Funds’ internal control over financial reporting. Accordingly, we express no such opinion.
Our audits included performing procedures to assess the risks of material misstatement of the financial statements, whether due to error or fraud, and performing procedures that
respond to those risks. Such procedures included examining, on a test basis, evidence regarding the amounts and disclosures in the financial statements. Our audits also included evaluating the accounting principles used and significant estimates made
by management, as well as evaluating the overall presentation of the financial statements. Our procedures included confirmation of securities owned as of March 31, 2023 by correspondence with the custodian and brokers; when replies were not received
from brokers, we performed other auditing procedures. We believe that our audits provide a reasonable basis for our opinion.
TAIT, WELLER & BAKER LLP
Philadelphia, Pennsylvania
May 30, 2023
42
Hodges Mutual Funds
|
EXPENSE EXAMPLES For the Six Months Ended March 31,
2023 (Unaudited)
|
As a shareholder of the Funds, you incur two types of costs: (1) transaction costs and (2) ongoing costs, including investment advisory fees, distribution fees,
and other Fund expenses. The examples are intended to help you understand your ongoing costs (in dollars) of investing in the Funds and to compare these costs with the ongoing costs of investing in other mutual funds. The examples are based on an
investment of $1,000 invested at the beginning of the period and held for the entire period (10/1/2022-3/31/2023).
Actual Expenses
The “Actual” lines of the following tables provide information about actual account values based on actual returns and actual expenses. Although the Funds charge
no sales loads, you will be assessed fees for outgoing wire transfers, returned checks and stop payment orders at prevailing rates charged by Fund Services, the Funds’ transfer agent. If you request that a redemption be made by wire transfer,
currently a $15 fee is charged by Fund Services. You will be charged a redemption fee equal to 1% of the net amount of the redemption if you redeem shares within 30 calendar days after you purchase them for the Hodges Fund, Small Cap Fund Retail
Class, Small Intrinsic Value Fund, and Blue Chip Equity Income Fund. You will be charged a redemption fee equal to 1% of the net amount of the redemption if you redeem shares within 60 calendar days after you purchase them for the Institutional Class
of the Small Cap Fund. An Individual Retirement Account will be charged an annual maintenance fee. To the extent the Funds invest in shares of other investment companies as part of their investment strategy, you will indirectly bear your
proportionate share of any fees and expenses charged by the underlying funds in which the Funds invest in addition to the expenses of the Funds. Actual expenses of the underlying funds may vary. These expenses are not included in the following
examples. The following examples include, but are not limited to, investment advisory fees, fund accounting fees, administration fees, custody fees, and transfer agent fees. However, the following examples do not include portfolio trading commissions
and related expenses. You may use the information in this line, together with the amount you invested, to estimate the expenses that you paid over the period. Simply divide your account value by $1,000 (for example, an $8,600 account value divided by
$1,000 = 8.6), then multiply the result by the number in the first line under the heading titled, “Expenses Paid During the Period” to estimate the expenses you paid on your account during this period.
Hypothetical Examples for Comparison Purposes
The “Hypothetical” lines of the following tables provide information about hypothetical account values and hypothetical expenses based on the Funds’ actual expense
ratios and an assumed rate of return of 5% per year before expenses, which are not the Funds’ actual returns. The hypothetical account values and expenses may not be used to estimate the actual ending account balance or expenses you paid for the
period. You may use this information to compare the ongoing costs of investing in each Fund and other funds. To do so, compare this 5% hypothetical example with the 5% hypothetical examples that appear in the shareholder reports of the other funds.
Please note that the expenses shown in the table are meant to highlight your ongoing costs only and do not reflect any transaction costs, such as redemption fees. Therefore, the hypothetical lines of the tables are useful in comparing ongoing costs
only and will not help you determine the relative total costs of owning different funds. In addition, if these transaction costs were included, your costs would have been higher.
Hodges Fund
|
Beginning
|
Ending
|
Expenses Paid
|
|
|
Account Value
|
Account Value
|
During the Period
|
|
|
10/1/22
|
3/31/23
|
10/1/22 – 3/31/23 1
|
|
|
HDPMX:
|
|||
|
Actual
|
$1,000.00
|
$1,217.50
|
$6.52
|
|
Hypothetical (5% annual return before expenses)
|
1,000.00
|
1,019.05
|
5.94
|
|
1
|
Expenses are equal to the expense ratio for the most recent six-month period of 1.18% (fee waivers in effect) multiplied by the average account value over the period multiplied by 182/365 (to
reflect the one-half year period).
|
43
Hodges Mutual Funds
|
EXPENSE EXAMPLES For the Six Months Ended March 31,
2023 (Unaudited)
|
Small Cap Fund
|
Beginning
|
Ending
|
Expenses Paid
|
|
|
Account Value
|
Account Value
|
During the Period
|
|
|
10/1/22
|
3/31/23
|
10/1/22 – 3/31/23 2
|
|
|
HDPSX:
|
|||
|
Retail Class Actual
|
$1,000.00
|
$1,174.30
|
$7.59
|
|
Retail Class Hypothetical (5% annual return before expenses)
|
1,000.00
|
1,017.95
|
7.04
|
|
HDSIX:
|
|||
|
Institutional Class Actual
|
1,000.00
|
1,176.60
|
6.24
|
|
Institutional Class Hypothetical (5% annual return before expenses)
|
1,000.00
|
1,019.20
|
5.79
|
|
2
|
Expenses are equal to the expense ratio for the most recent six-month period of 1.40% for the Retail Class, and 1.15% for the Institutional Class, multiplied by the average account value over
the period multiplied by 182/365 (to reflect the one-half year period).
|
Small Intrinsic Value Fund
|
Beginning
|
Ending
|
Expenses Paid
|
|
|
Account Value
|
Account Value
|
During the Period
|
|
|
10/1/22
|
3/31/23
|
10/1/22 – 3/31/23 3
|
|
|
HDSVX:
|
|||
|
Actual
|
$1,000.00
|
$1,113.60
|
$6.80
|
|
Hypothetical (5% annual return before expenses)
|
1,000.00
|
1,018.50
|
6.49
|
|
3
|
Expenses are equal to the expense ratio for the most recent six-month period of 1.29% (fee waivers in effect) multiplied by the average account value over the period multiplied by 182/365 (to
reflect the one-half year period).
|
Blue Chip Equity Income Fund
|
Beginning
|
Ending
|
Expenses Paid
|
|
|
Account Value
|
Account Value
|
During the Period
|
|
|
10/1/22
|
3/31/23
|
10/1/22 – 3/31/23 4
|
|
|
HDPBX:
|
|||
|
Actual
|
$1,000.00
|
$1,189.80
|
$7.10
|
|
Hypothetical (5% annual return before expenses)
|
1,000.00
|
1,018.45
|
6.54
|
|
4
|
Expenses are equal to the expense ratio for the most recent six-month period of 1.30% (fee waivers in effect) multiplied by the average account value over the period multiplied by 182/365 (to
reflect the one-half year period).
|
44
Hodges Mutual Funds
|
TRUSTEES AND EXECUTIVE OFFICERS (Unaudited)
|
The Board is responsible for the overall management of the Trust, including general supervision and review of the investment activities of the Funds. The Board,
in turn, elects the officers of the Trust, who are responsible for administering the day-to-day operations of the Trust and its separate series. The current trustees and officers of the Trust, their year of birth, positions with the Trust, terms of
office with the Trust and length of time served, their principal occupations for the past five years and other directorships are set forth in the table below.
|
Number of
|
|||||
|
Portfolios
|
|||||
|
Term of
|
in Fund
|
Other
|
|||
|
Position
|
Office(2) and
|
Complex(3)
|
Directorships
|
||
|
Name,
|
with the
|
Length of
|
Principal Occupation
|
Overseen
|
Held During
|
|
Address And Age
|
Trust(1)
|
Time Served
|
During Past Five Years
|
by Trustees
|
the Past 5 Years
|
|
Independent Trustees of the Trust
|
|||||
|
Kathleen T. Barr
|
Trustee
|
Indefinite
|
Retired; Chair of the Governing Council,
|
4
|
Independent
|
|
(born 1955)
|
Term;
|
Independent Directors Council (since 2020);
|
Director, Muzinich
|
||
|
c/o U.S. Bank Global
|
Since
|
formerly, President, owner of a registered
|
BDC, Inc.
|
||
|
Fund Services
|
November
|
investment adviser, Productive Capital
|
(2019 to present);
|
||
|
615 East Michigan Street
|
2018.
|
Management, Inc. (2010 to 2013); formerly, Chief
|
Independent
|
||
|
Milwaukee, WI 53202
|
Chairperson
|
Indefinite
|
Administrative Officer, Senior Vice President and
|
Trustee for the
|
|
|
Term;
|
Senior Managing Director of Allegiant Asset
|
William Blair
|
|||
|
Since
|
Management Company (merged with PNC
|
Funds (2013 to
|
|||
|
February
|
Capital Advisors, LLC in 2009); formerly, Chief
|
present)
|
|||
|
2023.
|
Administrative Officer, Chief Compliance Officer
|
(18 series).
|
|||
|
and Senior Vice President of PNC Funds and PNC
|
|||||
|
Advantage Funds (f/k/a Allegiant Funds)
|
|||||
|
(registered investment companies).
|
|||||
|
Eric W. Falkeis
|
Trustee
|
Indefinite
|
Chief Growth Officer, Tidal Financial Group
|
4
|
Interested Trustee,
|
|
(born 1973)
|
Term;
|
(2022 to present); Chief Executive Officer, Tidal
|
Tidal ETF Trust II
|
||
|
c/o U.S. Bank Global
|
Since
|
ETF Services LLC (2018 to present); formerly,
|
(2022 to present)
|
||
|
Fund Services
|
September
|
Chief Operating Officer, Direxion Funds
|
(7 series);
|
||
|
615 East Michigan Street
|
2011.
|
(2013 to 2018); formerly, Senior Vice President
|
Independent
|
||
|
Milwaukee, WI 53202
|
and Chief Financial Officer (and other positions),
|
Director, Muzinich
|
|||
|
U.S. Bancorp Fund Services, LLC (1997 to 2013).
|
BDC, Inc. (2019
|
||||
|
to present);
|
|||||
|
Interested Trustee,
|
|||||
|
Tidal ETF Trust
|
|||||
|
(2018 to Present)
|
|||||
|
(36 series); Former
|
|||||
|
Interested Trustee,
|
|||||
|
Direxion Funds
|
|||||
|
(22 series),
|
|||||
|
Direxion Shares
|
|||||
|
ETF Trust
|
|||||
|
(112 series) and
|
|||||
|
Direxion
|
|||||
|
Insurance Trust
|
|||||
|
(2013 to 2018).
|
|||||
|
Steven J. Paggioli
|
Trustee
|
Indefinite
|
Consultant; formerly, Executive Vice President,
|
4
|
Independent
|
|
(born 1950)
|
Term;
|
Investment Company Administration, LLC
|
Director, Muzinich
|
||
|
c/o U.S. Bank Global
|
Since
|
(mutual fund administrator).
|
BDC, Inc.
|
||
|
Fund Services
|
May 1991.
|
(2019 to present);
|
|||
|
615 East Michigan Street
|
Independent
|
||||
|
Milwaukee, WI 53202
|
Trustee,
|
||||
|
AMG Funds
|
|||||
|
(1993 to present)
|
|||||
|
(42 series).
|
|||||
45
Hodges Mutual Funds
|
TRUSTEES AND EXECUTIVE OFFICERS (Unaudited) (Continued)
|
|
Number of
|
|||||
|
Portfolios
|
|||||
|
Term of
|
in Fund
|
Other
|
|||
|
Position
|
Office(2) and
|
Complex(3)
|
Directorships
|
||
|
Name,
|
with the
|
Length of
|
Principal Occupation
|
Overseen
|
Held During
|
|
Address And Age
|
Trust(1)
|
Time Served
|
During Past Five Years
|
by Trustees
|
the Past 5 Years
|
|
Ashi S. Parikh
|
Trustee
|
Indefinite
|
Investment professional; formerly, Chief
|
4
|
Board of Directors
|
|
(born 1966)
|
Term;
|
Executive and Chief Investment Officer and
|
Member,
|
||
|
c/o U.S. Bank Global
|
Since
|
various other positions, RidgeWorth Investments,
|
Investment
|
||
|
Fund Services
|
June 2020.
|
LLC (global investment management firm)
|
Working Group,
|
||
|
615 East Michigan Street
|
(2006 to 2017); formerly, Chief Investment Officer
|
The Ohio State
|
|||
|
Milwaukee, WI 53202
|
Institutional Growth Equities, Eagle Asset
|
University
|
|||
|
Management (investment management firm);
|
Endowments and
|
||||
|
formerly Sr. Managing Director, Growth Equities,
|
Foundation
|
||||
|
Banc One Investment Advisors
|
(2016 to present);
|
||||
|
(investment management firm).
|
Board of Directors,
|
||||
|
World Methodist
|
|||||
|
Council,
|
|||||
|
Investment
|
|||||
|
Committee
|
|||||
|
(2018 to present);
|
|||||
|
Independent
|
|||||
|
Trustee, PNC
|
|||||
|
Funds (2018 to
|
|||||
|
2019) (32 series);
|
|||||
|
Interested Trustee,
|
|||||
|
RidgeWorth Funds
|
|||||
|
(2014 to 2017)
|
|||||
|
(35 series).
|
|||||
|
Cynthia M. Fornelli
|
Trustee
|
Indefinite
|
Independent Director of TriplePoint Venture
|
4
|
Independent
|
|
(born 1960)
|
Term;
|
Growth BDC Corp. (2019 to present); Retired;
|
Director,
|
||
|
c/o U.S. Bank Global
|
Since
|
formerly, Executive Director of the Center for
|
TriplePoint
|
||
|
Fund Services
|
January
|
Audit Quality (2007 to 2019); formerly, Senior
|
Private Venture
|
||
|
615 East Michigan Street
|
2022.
|
Vice President of Regulatory Conflicts Management
|
Credit, Inc.
|
||
|
Milwaukee, WI 53202
|
at Bank of America (2005 to 2007); formerly,
|
(2020 to present).
|
|||
|
Deputy Director, Division of Investment
|
|||||
|
Management with the U.S. Securities and
|
|||||
|
Exchange Commission (1998 to 2005).
|
|||||
|
Officers of the Trust
|
|||||
|
Jason F. Hadler
|
President &
|
Indefinite
|
Senior Vice President and Head of Client
|
Not
|
Not
|
|
(born 1975)
|
Principal
|
Term;
|
Experience, U.S. Bank Global Fund Services,
|
Applicable.
|
Applicable.
|
|
c/o U.S. Bank Global
|
Executive
|
Since
|
since March 2022; Senior Vice President and
|
||
|
Fund Services
|
Officer
|
September
|
Head of Fund Services Fund Administration
|
||
|
615 East Michigan Street
|
2021.
|
Department, U.S. Bank Global Fund Services
|
|||
|
Milwaukee, WI 53202
|
(December 2003 to March 2022).
|
||||
|
Carl G. Gee, Esq.
|
Secretary
|
Indefinite
|
Assistant Secretary of the Trust (2020 to 2021);
|
Not
|
Not
|
|
(born 1990)
|
& Vice
|
Term;
|
Assistant Vice President and Counsel,
|
Applicable.
|
Applicable.
|
|
c/o U.S. Bank Global
|
President
|
Since
|
U.S. Bank Global Fund Services since
|
||
|
Fund Services
|
February
|
August 2016; Summer Associate, Husch
|
|||
|
615 East Michigan Street
|
2021.
|
Blackwell LLP (2015); Law Clerk, Brady
|
|||
|
Milwaukee, WI 53202
|
Corporation (global printing systems, labels
|
||||
|
and safety products company) (2014 to 2015).
|
|||||
46
Hodges Mutual Funds
|
TRUSTEES AND EXECUTIVE OFFICERS (Unaudited) (Continued)
|
|
Number of
|
|||||
|
Portfolios
|
|||||
|
Term of
|
in Fund
|
Other
|
|||
|
Position
|
Office(2) and
|
Complex(3)
|
Directorships
|
||
|
Name,
|
with the
|
Length of
|
Principal Occupation
|
Overseen
|
Held During
|
|
Address And Age
|
Trust(1)
|
Time Served
|
During Past Five Years
|
by Trustees
|
the Past 5 Years
|
|
Craig Benton
|
Treasurer
|
Indefinite
|
Assistant Treasurer of the Trust (2016 to 2021);
|
Not
|
Not
|
|
(born 1985)
|
& Vice
|
Term;
|
Assistant Vice President, U.S. Bank Global
|
Applicable.
|
Applicable.
|
|
c/o U.S. Bank Global
|
President
|
Since
|
Fund Services since November 2007.
|
||
|
Fund Services
|
December
|
||||
|
615 East Michigan Street
|
2021.
|
||||
|
Milwaukee, WI 53202
|
|||||
|
Kyle J. Buscemi
|
Assistant
|
Indefinite
|
Mutual Funds Administrator, U.S. Bank Global
|
Not
|
Not
|
|
(born 1996)
|
Treasurer
|
Term;
|
Fund Services since June 2018; Business
|
Applicable.
|
Applicable.
|
|
c/o U.S. Bank Global
|
Since
|
Administration Student, 2014 to 2018.
|
|||
|
Fund Services
|
June 2022.
|
||||
|
615 East Michigan Street
|
|||||
|
Milwaukee, WI 53202
|
|||||
|
Jennifer N. Smith
|
Assistant
|
Indefinite
|
Mutual Funds Administrator, U.S. Bank Global
|
Not
|
Not
|
|
(born 1985)
|
Treasurer
|
Term;
|
Fund Services since 2007.
|
Applicable.
|
Applicable.
|
|
c/o U.S. Bank Global
|
Since
|
||||
|
Fund Services
|
February
|
||||
|
615 East Michigan Street
|
2023.
|
||||
|
Milwaukee, WI 53202
|
|||||
|
Gazala Khan
|
Chief
|
Indefinite
|
Vice President and Compliance Officer,
|
Not
|
Not
|
|
(born 1969)
|
Compliance
|
Term;
|
U.S. Bank Global Fund Services since July 2022;
|
Applicable.
|
Applicable.
|
|
c/o U.S. Bank Global
|
Officer
|
Since
|
Chief Compliance Officer Matthews Asia Fund
|
||
|
Fund Services
|
November
|
(May 2019 to July 15, 2022); Chief Compliance
|
|||
|
615 East Michigan Street
|
Anti-
|
2022.
|
Officer GS Trust/VIT (June 2009 to May 2019);
|
||
|
Milwaukee, WI 53202
|
Money
|
Vice President GSAM (May 2005 to June 2009);
|
|||
|
|
Laundering
|
Staff Accountant, SEC Office of Compliance
|
|||
|
|
Officer |
Inspection and Examination (1999 to 2005).
|
|
(1)
|
All Trustees of the Trust who are not “interested persons” of the Trust as defined under the 1940 Act (“Independent Trustees”).
|
|
(2)
|
Under the terms of the Board’s retirement policy, a Trustee shall retire at the end of the calendar year in which he or she reaches the age of 78.
|
|
(3)
|
The Trust is comprised of numerous series managed by unaffiliated investment advisers. The term “Fund Complex” applies only to the Funds. The Funds do not hold themselves out as related to any
other series within the Trust for investment purposes, nor do they share the same investment advisor with any other series.
|
47
Hodges Mutual Funds
|
STATEMENT REGARDING LIQUIDITY RISK MANAGEMENT PROGRAM (Unaudited)
|
The Funds have adopted a liquidity risk management program (the “program”). The Board has designated the Advisor to serve as the administrator of the program.
Personnel of the Advisor conducts the day-to-day operation of the programs pursuant to policies and procedures administered by the Advisor.
Under the program, the Advisor manages each Fund’s liquidity risk, which is the risk that the Funds could not meet shareholder redemption requests without
significant dilution of remaining shareholders’ interests in the Funds. This risk is managed by monitoring the degree of liquidity of each Fund’s investments, limiting the amount of each Fund’s illiquid investments, and utilizing various risk
management tools and facilities available to each Fund for meeting shareholder redemptions, among other means. The Advisor’s process of determining the degree of liquidity of each Fund’s investments is supported by one or more third-party liquidity
assessment vendors.
The Board reviewed a report prepared by the Advisor regarding the operation and effectiveness of the program for the period January 1, 2022 through December 31,
2022. No significant liquidity events impacting the Funds were noted in the report. In addition, the Advisor provided its assessment that the program had been effective in managing the Funds’ liquidity risk.
48
Hodges Mutual Funds
|
QUALIFIED DIVIDEND INCOME, DIVIDENDS RECEIVED DEDUCTION (Unaudited)
|
For the fiscal year ended March 31, 2023, certain dividends paid by the Funds may be subject to a maximum tax rate of 20%, as provided for by the Jobs and Growth
Tax Relief Reconciliation Act of 2003 and the Tax Cuts and Jobs Act of 2017. The percentage of dividends declared from ordinary income designated as qualified dividend income was as follows:
|
Hodges Fund
|
80.99%
|
||
|
Small Cap Fund
|
0.00%
|
||
|
Small Intrinsic Value Fund
|
78.79%
|
||
|
Blue Chip Equity Income Fund
|
76.59%
|
For corporate shareholders, the percent of ordinary income distributions qualifying for the corporate dividends received deduction for the fiscal year ended March
31, 2023, was as follows:
|
Hodges Fund
|
80.99%
|
||
|
Small Cap Fund
|
0.00%
|
||
|
Small Intrinsic Value Fund
|
77.68%
|
||
|
Blue Chip Equity Income Fund
|
76.37%
|
The percentage of taxable ordinary income distributions that are designated as short-term capital gain distributions under Internal Revenue Section 871 (k)(2)(C)
for the fiscal year ended March 31, 2023, was as follows:
|
Hodges Fund
|
100.00%
|
||
|
Small Cap Fund
|
0.00%
|
||
|
Small Intrinsic Value Fund
|
50.97%
|
||
|
Blue Chip Equity Income Fund
|
43.15%
|
49
Hodges Mutual Funds
|
INFORMATION ABOUT PROXY VOTING (Unaudited)
|
A description of the polices and procedures that the Funds use to determine how to vote proxies relating to portfolio securities is available without charge, upon
request, by calling (866) 811-0224. Furthermore, you can obtain the description on the SEC’s website at www.sec.gov.
Information regarding how the Funds voted proxies relating to portfolio securities during the most recent 12-month period ended June 30 is available without
charge, upon request, by calling (866) 811-0224. Furthermore, you can obtain the Funds’ proxy voting records on the SEC’s website at www.sec.gov.
|
INFORMATION ABOUT THE PORTFOLIO HOLDINGS (Unaudited)
|
The Funds file their complete schedule of portfolio holdings with the SEC for the first and third quarters of each fiscal year as an exhibit to their reports on
Form N-PORT. The Funds’ Form N -PORT reports are available on the SEC’s website at www.sec.gov. The Funds’ Form N-PORT may also be obtained by calling (866) 811-0224.
|
INFORMATION ABOUT HOUSEHOLDING (Unaudited)
|
Each year, you are automatically sent an updated prospectus as well as annual and semi annual reports for the Funds, if applicable. To reduce expenses, the Funds
may mail only one copy of each Fund’s prospectus and each annual and semi-annual report to those addresses shared by two or more accounts. If you wish to receive individual copies of these documents, please call us at (866) 811-0224. We will begin
sending you individual copies thirty days after receiving your request. This policy does not apply to account statements.
|
INFORMATION ABOUT THE FUNDS’ TRUSTEES (Unaudited)
|
The Statement of Additional Information (“SAI”) includes additional information about the Funds’ Trustees and is available without charge, upon request, by calling
(866) 811-0224. Furthermore, you can obtain the SAI on the SEC’s web site at www.sec.gov or the Funds’ web site at www.hodgesfunds.com.
50
Hodges Mutual Funds
|
PRIVACY NOTICE (Unaudited)
|
The Funds collect non-public personal information about you from the following sources:
• Information we receive about you on applications or other forms;
• Information you give us verbally; and/or
• Information about your transactions with us or others.
We do not disclose any non-public personal information about our shareholders or former shareholders without the shareholder’s authorization,
except as permitted by law or in response to inquiries from governmental authorities. We may share information with affiliated parties and unaffiliated third parties with whom we have contracts for servicing the Funds. We will provide unaffiliated
third parties with only the information necessary to carry out their assigned responsibilities. All shareholder records will be disposed of in accordance with applicable law. We maintain physical, electronic and procedural safeguards to protect
your non-public personal information and require third parties to treat your non-public personal information with the same high degree of confidentiality.
In the event that you hold shares of a Fund through a financial intermediary, including, but not limited to, a broker-dealer, bank or trust
company, the privacy policy of your financial intermediary would govern how your non-public personal information would be shared with unaffiliated third parties.
51
(This Page Intentionally Left Blank.)
ANNUAL REPORT • MARCH 31, 2023
|
Retail Class
|
Institutional Class
|
|||
|
Fund
|
Shares
|
Shares
|
||
|
Hodges Fund
|
||||
|
Ticker Symbol
|
HDPMX
|
N/A
|
||
|
CUSIP
|
742935109
|
N/A
|
||
|
Small Cap Fund
|
||||
|
Ticker Symbol
|
HDPSX
|
HDSIX
|
||
|
CUSIP
|
742935299
|
742935224
|
||
|
Small Intrinsic Value Fund
|
||||
|
Ticker Symbol
|
HDSVX
|
N/A
|
||
|
CUSIP
|
74316J318
|
N/A
|
||
|
Blue Chip Equity Income Fund
|
||||
|
Ticker Symbol
|
HDPBX
|
N/A
|
||
|
CUSIP
|
742935174
|
N/A
|
HODGES MUTUAL FUNDS
www.hodgesfunds.com | (866) 811-0224
INVESTMENT ADVISOR
HODGES CAPITAL MANAGEMENT, INC.
2905 Maple Avenue, Dallas, Texas 75201 | (888) 878-4426 | www.hodgescapital.com
CUSTODIAN
U.S. BANK N.A.
1555 N. RiverCenter Drive, Suite 302, Milwaukee,Wisconsin 53212
TRANSFER AGENT, FUND ACCOUNTANT, AND FUND ADMINISTRATOR
U.S. BANCORP FUND SERVICES, LLC
P.O. Box 701, Milwaukee,Wisconsin 53201-0701 | (866) 811-0224
DISTRIBUTOR
QUASAR DISTRIBUTORS, LLC
111 East Kilbourn Avenue, Suite 2200, Milwaukee,Wisconsin 53202
INDEPENDENT REGISTERED PUBLIC ACCOUNTING FIRM
TAIT, WELLER & BAKER LLP
50 South 16th Street, Suite 2900, Philadelphia, Pennsylvania 19102
LEGAL COUNSEL
SULLIVAN & WORCESTER LLP
1633 Broadway, 32nd Floor, New York, New York 10019
|
(b)
|
Not applicable.
|
Item 2. Code of Ethics.
The registrant has adopted a code of ethics that applies to the registrant’s principal executive officer and principal financial officer. The registrant has not made any amendments to its code of ethics during the period covered by this
report. The registrant has not granted any waivers from any provisions of the code of ethics during the period covered by this report.
A copy of the registrant’s Code of Ethics is filed herewith.
Item 3. Audit Committee Financial Expert.
The registrant’s Board of Trustees of the Trust has determined that there is at least one audit committee financial expert serving on its audit committee. Ms. Kathleen T. Barr and Messrs. Wallace L.
Cook, Carl A. Froebel, Eric W. Falkeis, Steven J. Paggioli, and Ashi S. Parikh are each an “audit committee financial expert” and are considered to be “independent” as each term is defined in Item 3 of Form N-CSR.
Item 4. Principal Accountant Fees and Services.
The registrant has engaged its principal accountant to perform audit services, audit-related services, tax services and other services during the past two fiscal years. “Audit services” refer to performing an audit of the registrant's annual
financial statements or services that are normally provided by the accountant in connection with statutory and regulatory filings or engagements for those fiscal years. “Audit-related services” refer to the assurance and related services by the
principal accountant that are reasonably related to the performance of the audit. “Tax services” refer to professional services rendered by the principal accountant for tax compliance, tax advice, and tax planning. There were no “Other services”
provided by the principal accountant. The following tables detail the aggregate fees billed or expected to be billed for each of the last two fiscal years for audit fees, audit-related fees, tax fees and other fees by the principal accountant.
Hodges Fund
|
FYE 3/31/2023
|
FYE 3/31/2022
|
|
|
Audit Fees
|
$21,200
|
$19,400
|
|
Audit-Related Fees
|
N/A
|
N/A
|
|
Tax Fees
|
$2,900
|
$2,800
|
|
All Other Fees
|
N/A
|
N/A
|
Hodges Small Cap Fund
|
FYE 3/31/2023
|
FYE 3/31/2022
|
|
|
Audit Fees
|
$21,200
|
$19,400
|
|
Audit-Related Fees
|
N/A
|
N/A
|
|
Tax Fees
|
$2,900
|
$2,800
|
|
All Other Fees
|
N/A
|
N/A
|
Hodges Blue Chip Equity Income Fund
|
FYE 3/31/2023
|
FYE 3/31/2022
|
|
|
Audit Fees
|
$21,200
|
$19,400
|
|
Audit-Related Fees
|
N/A
|
N/A
|
|
Tax Fees
|
$2,900
|
$2,800
|
|
All Other Fees
|
N/A
|
N/A
|
Hodges Small Intrinsic Value Fund
|
FYE 3/31/2023
|
FYE 3/31/2022
|
|
|
Audit Fees
|
$21,200
|
$19,400
|
|
Audit-Related Fees
|
N/A
|
N/A
|
|
Tax Fees
|
$2,900
|
$2,800
|
|
All Other Fees
|
N/A
|
N/A
|
The audit committee has adopted pre-approval policies and procedures that require the audit committee to pre‑approve all audit and non‑audit services of the registrant, including services provided to any entity affiliated with the registrant.
The percentages of fees billed by Tait, Weller & Baker LLP applicable to non-audit services pursuant to waiver of pre-approval requirement were as follows:
|
FYE 3/31/2023
|
FYE 3/31/2022
|
|
|
Audit-Related Fees
|
0%
|
0%
|
|
Tax Fees
|
0%
|
0%
|
|
All Other Fees
|
0%
|
0%
|
All of the principal accountant’s hours spent on auditing the registrant’s financial statements were attributed to work performed by full‑time permanent employees of the principal accountant.
The following table indicates the non-audit fees billed or expected to be billed by the registrant’s accountant for services to the registrant and to the registrant’s investment advisor (and any other
controlling entity, etc.—not sub-advisor) for the last two years. The audit committee of the board of trustees has considered whether the provision of non-audit services that were rendered to the registrant's investment advisor is compatible with
maintaining the principal accountant's independence and has concluded that the provision of such non-audit services by the accountant has not compromised the accountant’s independence.
|
Non-Audit Related Fees
|
FYE 3/31/2023
|
FYE 3/31/2022
|
|
Registrant
|
N/A
|
N/A
|
|
Registrant’s Investment Advisor
|
N/A
|
N/A
|
The registrant has not been identified by the U.S. Securities and Exchange Commission as having filed an annual report issued by a registered public accounting firm branch or office that is located in a foreign jurisdiction where the Public
Company Accounting Oversight Board is unable to inspect or completely investigate because of a position taken by an authority in that jurisdiction.
The registrant is not a foreign issuer.
Item 5. Audit Committee of Listed Registrants.
Not applicable to registrants who are not listed issuers (as defined in Rule 10A-3 under the Securities Exchange Act of 1934).
Item 6. Investments.
(a) Schedule of Investments is included as part of the report to shareholders filed under Item 1 of this Form.
(b) Not applicable.
Item 7. Disclosure of Proxy Voting Policies and Procedures for Closed-End Management Investment Companies.
Not applicable to open-end investment companies.
Item 8. Portfolio Managers of Closed-End Management Investment Companies.
Not applicable to open-end investment companies.
Item 9. Purchases of Equity Securities by Closed‑End Management Investment Company and Affiliated Purchasers.
Not applicable to open-end investment companies.
Item 10. Submission of Matters to a Vote of Security Holders.
The registrant has adopted a nominating committee charter that contains the procedures by which shareholders may recommend nominees to the registrant’s board of trustees. There have been no material changes to the procedures by which
shareholders may recommend nominees to the registrant’s board of trustees for the period.
Item 11. Controls and Procedures.
|
(a)
|
The Registrant’s Principal Executive Officer and Principal Financial Officer have reviewed the Registrant's disclosure controls and procedures (as defined in Rule 30a-3(c) under the Investment Company Act of 1940 (the “Act”)) as of a
date within 90 days of the filing of this report, as required by Rule 30a-3(b) under the Act and Rules 13a-15(b) or 15d‑15(b) under the Securities Exchange Act of 1934. Based on their review, such officers have concluded that the
disclosure controls and procedures are effective in ensuring that information required to be disclosed in this report is appropriately recorded, processed, summarized and reported and made known to them by others within the Registrant and
by the Registrant’s service provider.
|
|
(b)
|
There were no changes in the Registrant's internal control over financial reporting (as defined in Rule 30a-3(d) under the Act) that occurred during the period covered by this report that has
materially affected, or is reasonably likely to materially affect, the Registrant's internal control over financial reporting.
|
Item 12. Disclosure of Securities Lending Activities for Closed-End Management Investment Companies.
Not applicable to open-end investment companies.
Item 13. Exhibits.
(3) Any written solicitation to purchase securities under Rule 23c‑1 under the Act sent or given during the period covered by the report by or on behalf of the registrant to 10 or
more persons. Not applicable to open-end investment companies.
(4) Change in the registrant’s independent public accountant. There was no change in the registrant’s independent public accountant for the period covered by this report.
SIGNATURES
Pursuant to the requirements of the Securities Exchange Act of 1934 and the Investment Company Act of 1940, the registrant has duly caused this report to be signed on its behalf by the undersigned, thereunto duly
authorized.
(Registrant) Professionally Managed Portfolios
By (Signature and Title) /s/Jason Hadler
Jason Hadler, President/Principal Executive Officer
Date June 8, 2023
Pursuant to the requirements of the Securities Exchange Act of 1934 and the Investment Company Act of 1940, this report has been signed below by the following persons on behalf of the registrant and in the capacities
and on the dates indicated.
By (Signature and Title) /s/Jason Hadler
Jason Hadler, President/Principal Executive Officer
Date June 8, 2023
By (Signature and Title) /s/Craig Benton
Craig Benton, Treasurer/Principal Financial Officer
Date June 8, 2023
* Print the name and title of each signing officer under his or her signature.
ATTACHMENTS / EXHIBITS
Serious News for Serious Traders! Try StreetInsider.com Premium Free!
You May Also Be Interested In
- Pre-Investor Call Presentation available to shareholders
- FD Capital Launches Head Of Finance Recruitment Team
- New CPS Protection Platform: TXOne Networks Presents SageOne in Hannover
Create E-mail Alert Related Categories
SEC FilingsSign up for StreetInsider Free!
Receive full access to all new and archived articles, unlimited portfolio tracking, e-mail alerts, custom newswires and RSS feeds - and more!
