

Form N-CSR Northern Lights Fund For: Nov 30
 Tweet
Tweet Share
Shareunited
states
securities and exchange commission
washington, d.c. 20549
form n-csr
certified shareholder report of registered management
investment companies
Investment Company Act file number 811-23066
Northern Lights Fund Trust IV
(Exact name of registrant as specified in charter)
225 Pictoria Drive , Suite 450,Cincinnati, Ohio 45246
(Address of principal executive offices) (Zip code)
The Corporation Trust Company
1209 Orange Street Wilmington, DE 19801
(Name and address of agent for service)
Registrant's telephone number, including area code: 631-490-4300
Date of fiscal year end: 11/30
Date of reporting period: 11/30/22
Item 1. Reports to Stockholders.
 |
| Inspire Global Hope ETF (BLES) |
| Inspire Small/Mid Cap ETF (ISMD) |
| Inspire Corporate Bond ETF (IBD) |
| Inspire 100 ETF (BIBL) |
| Inspire International ETF (WWJD) |
| (formerly known as Inspire International ESG ETF) |
| Inspire Tactical Balanced ETF (RISN) |
| (formerly known as Inspire Tactical Balanced ESG ETF) |
| Inspire Faithward Mid Cap Momentum ETF (GLRY) |
| (formerly known as Inspire Faithward Mid Cap Momentum ESG ETF) |
| Inspire Fidelis Multi Factor ETF (FDLS) |
| Annual Report |
| November 30, 2022 |
| 1-877-658-9473 |
| www.inspireetf.com |
INSPIRE ETF ANNUAL REPORT
| SHAREHOLDER LETTER (unaudited) |
Dear Shareholders:
We are honored and privileged to present you with the Annual Report for the Inspire Investing suite of Exchange Traded Funds (ETFs) as of November 30, 2022.
With a slowing economy, the highest inflation numbers in four decades and the Federal Reserve raising interest rates at an accelerated rate over the past year we have seen the much anticipated correction in the equity markets turn into a true bear market. Not all the headwinds are resolved, but we are exceedingly grateful to look back at 2022 and see the protection and provision that God gave us at Inspire, as well as our advisors and clients. We could not do what we do without you and we sincerely appreciate the trust you have placed in Inspire by investing in one or more of the ETFs.
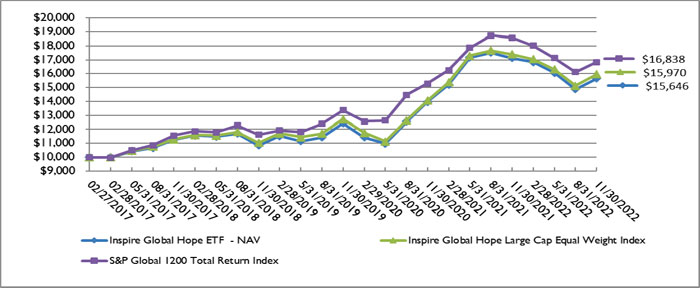
BLES – Inspire Global Hope ETF
As the global economy slowed down due to high inflation and increased interest rates, BLES participated in the market correction with negative returns over the past twelve months ended November 30, 2022. BLES has a target weight of 50% US Large Cap stocks, 40% international developed markets stocks and 10% emerging markets stocks. The US markets along with the international and emerging markets all slipped into bear market territory during the year but rallied to finish the fiscal year just outside the “correction” threshold of down -10% or more. For the twelve months ended November 30, 2022, BLES was down -8.54% on a market price basis and -8.59% on the NAV. Since inception (2-27-2017) BLES has an annualized return of 8.14% on a market price basis and 8.09 on the NAV.
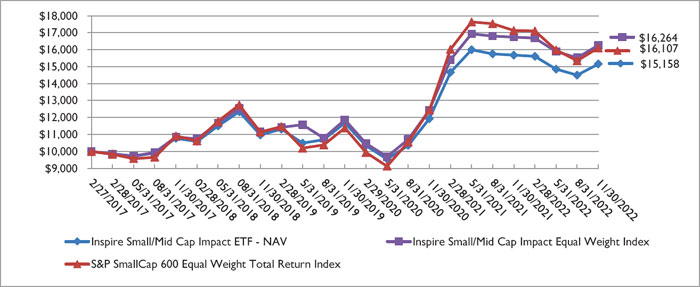
ISMD – Inspire Small/Mid Cap ETF
The small cap and mid cap markets actually outperformed the large cap market for the year by being down less. Even with the small cap and mid cap markets outperforming the large cap markets they fell short of positive returns. For the twelve months ended November 30, 2022, ISMD returned -4.07% on a market price basis and -3.34% on the NAV. Since inception (2-27-2017), ISMD has an annualized return of 7.36% on a market price basis and 7.49% on the NAV.
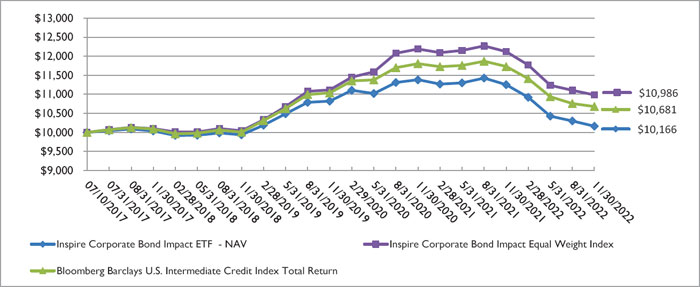
IBD – Inspire Corporate Bond ETF
The Federal Reserve jumped off the sidelines and initiated the most aggressive interest rate increase path over the past year that we have seen in quite some time as well as trimming their balance sheet at the same time. Due to rising inflation and a slowing economy, interest rates rose dramatically during the year across the yield curve manifesting in negative total returns for IBD over the past fiscal year. We believe interest rates will continue to move upward for the next 6 months but should peak in early 2023. For the twelve months ended November 30, 2022, IBD returned -9.20% on a market price basis and -9.64% on the NAV. Since inception (7-10-2017), IBD has an annualized return of 0.36% on a market price basis and 0.31% on the NAV.
1
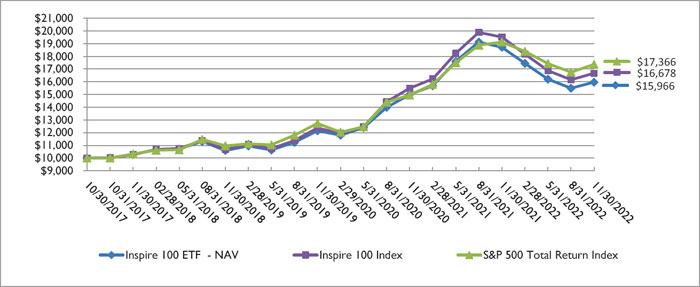
BIBL – Inspire 100 ETF
BIBL has 100 US Large Cap positions that are capitalization weighted and is designed to give advisors and investors a biblically responsible alternative to the popular market cap weighted
funds that are so prevalent in the marketplace (i.e. SPY or VOO). BIBL suffered along with the correction in the US and global markets and suffered double-digit negative returns this year. For the twelve months ended November 30, 2022, BIBL was down -14.85% on a market price basis and -14.69% on the NAV. Since inception (10-30-2017) BIBL has an annualized return of 9.61% on a market price basis and 9.64% on the NAV.
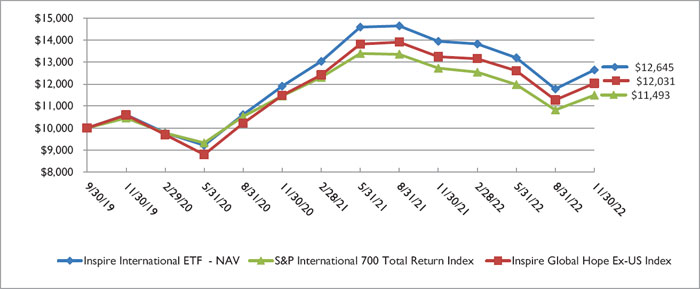
WWJD – Inspire International ETF
WWJD reached its 3rd anniversary on 9-30-2022 and holds approximately 200 stocks with an 80% exposure to international developed markets and 20% to emerging markets. Although the international and emerging markets participated in the global market correction along with the US large cap markets, the performance has been in line with expectations given the global market pullback. We believe the global economy will recover in the coming couple of years and the international and emerging markets should play a more positive role in portfolios in 2023. For the twelve months ended November 30, 2022, WWJD was down -9.34% on a market price basis and -9.32% on the NAV. Since inception (9-30-2019), WWJD has an annualized return of 7.95% on a market price basis and 7.69% on the NAV.
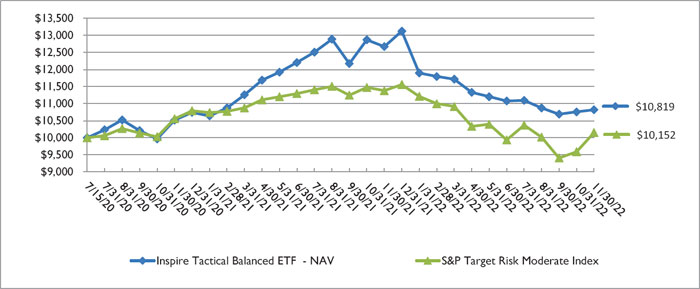
RISN – Inspire Tactical Balanced ETF
RISN was launched in the middle of the pandemic on 7-15-2020 and now has more than two full years of history. RISN holds an 80% exposure to US large cap stocks and 20% to US fixed income during normal market condition but is adjusted to a neutral allocation of 50% US large cap stocks/50% US fixed income or a conservative allocation of 20% US large cap stocks/80% US fixed income when deemed appropriate by the portfolio managers. RISN has been in a very defensive/conservative allocation most of the fiscal year due to the risk metrics seen during the market correction/bear market. It is possible for the fund to transition toward the normal market allocation targets in 2023 but that will depend on how the market and economy move in the next few months. For the twelve months ended November 30, 2022, RISN was down -14.56% on a market price basis and -14.63% on the NAV. Since inception (7-15-2020), RISN has an annualized return of 3.40% on a market price basis and 3.36% on the NAV.
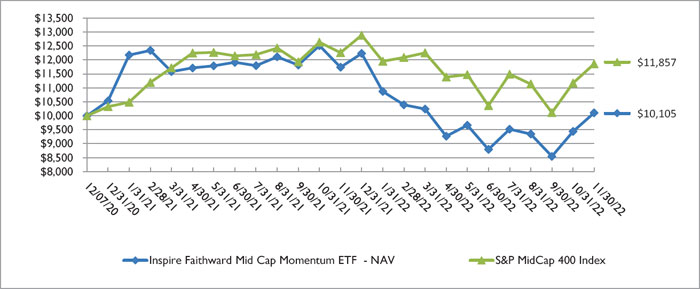
GLRY – Inspire Faithward Mid Cap Momentum ETF
GLRY was launched as an active fund in the mid cap momentum space. GLRY will hold between 35 and 45 stocks that have a market capitalization between $3 billion and $13 billion and that the portfolio managers believe have the best opportunity for outperformance in the near term. GLRY utilizes a dual screening approach that overlays a quantitative investment screening process, called FEVRR, on top of the Inspire Impact Score methodology, which identifies some of the most inspiring, biblically aligned companies in the world. The FEVRR process screens companies based on financial health, earnings trends, valuation, relative strength, and risk to find high-quality stocks with strong earning potential. For the twelve months ended November 30, 2022, GLRY was down -14.07% on a market price basis and -13.89% on the NAV. Since inception (12-07-2020), GLRY has an annualized return of 0.49% on a market price basis and 0.53% on the NAV.
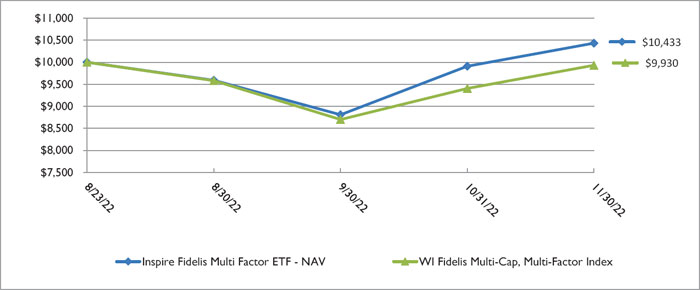
FDLS – Inspire Fidelis Multi Factor ETF
FDLS was launched on 8-23-2022 as a globally diversified fund with exposure to companies across the large cap, mid cap, small cap and micro space as well as international developed and emerging markets. FDLS holds 100 positions to replicate the holdings and weights of the WI Fidelis Multi-Cap, Multi-Factor Index. In addition to using the Inspire Impact Score as one of the factors, the index also incorporates fundamental and quantitative factor analysis to select the constituents on a quarterly rebalancing
2
schedule. Since FDLS has less than twelve months of history as of November 30, 2022, the performance since inception (8-23-2022), is 4.69% on a market price basis and 4.33% on the NAV.
Closing Comments
2022 has been another challenging year as the world saw a slowing economy, rising interest rates, high inflation and continued geo-political tensions that have brought on a global correction in the capital markets. Some believe this is a bear market that isn’t ready to go into hibernation yet. We have all been subject to some difficulties this year but we are thankful to God our Father for His provision and protection. We pray the Lord has protected and provided for you and your family and will keep you safe and healthy in the coming year. We are also grateful to be part of the mission of making a positive impact in the world through these ETFs alongside you, our brothers and sisters in Christ and fellow shareholders.
Even with the many challenges mentioned above we hope that we can return to a more normal year in 2023. The bottom line is that - God is Sovereign, and our trust is in Him, not in politicians or the markets.
Thank you again for being shareholders, but more importantly thank you for being co-workers with us in making a positive impact in the world by inspiring transformation for God’s Glory.
May the Grace and Peace of Jesus Christ our Lord be with you in 2023.
Sincerely,
Darrell Jayroe
Senior Portfolio Manager
Inspire Investing
The views in this report were those of the Author as of November 30, 2022 and may not reflect their views on the date that this report is first published or anytime thereafter. These views are intended to assist shareholders in understanding their investments and do not constitute investment advice.
Inspire, the Adviser, provides certain indices that the Inspire ETFs track. The indices use software that analyzes publicly available data relating to the primary business activities, products and services, philanthropy, legal activities, policies, and practices when assigning Inspire Impact Scores to a company. The securities with the highest Inspire Impact Scores are included in the indices and are equally weighted. As an ETF may not fully replicate its index, it is subject to the risk that investment management strategy may not produce the intended results. There is no guarantee that the Funds will achieve their objective, generate positive returns, or avoid losses.
Biblically Responsible Investment Risk. The Funds utilize related biblical values screening criteria in selecting its component securities. As a result of its strategy, a Funds’ exclusion of securities of certain issuers for nonfinancial reasons may cause the Fund to forgo some market opportunities available to funds that do not use these criteria. This could be due to biblically responsible companies falling out of favor with investors or failing to perform as well as companies that do not screen favorably.
3
ETF shares are not redeemable with the issuing fund other than in large creation unit aggregations. Instead, investors must buy or sell ETF Shares in the secondary market with the assistance of a stockbroker. In doing so, the investor may incur brokerage commissions and may pay more than net asset value when buying and receive less than net asset value when selling. Each Fund may focus its investments in securities of a particular industry to the extent its Index does. This may cause the Funds’ net asset value to fluctuate more than that of a fund that does not focus in a particular industry.
BLES, ISMD, IBD, BIBL, WWJD and FDLS are not actively managed and the adviser will not sell shares of an equity security due to current or projected underperformance of a security, industry or sector, unless that security is removed from the index or the selling of shares of that security is otherwise required upon a rebalancing of the index as addressed in the index methodology. Tracking error may occur because of imperfect correlation between the Funds’ holdings of portfolio securities and those in the index. The use of a representative sampling approach could result in a fund holding a smaller number of securities than are in the index. To the extent the assets in the Funds are smaller, these risks will be greater.
Before investing, consider the Funds’ investment objectives, risks, charges and expenses. To obtain a prospectus which contains this and other information, call 877.658.9473, or visit http://www.inspireetf.com. Read it carefully. The Inspire ETFs are distributed by Foreside Distributors, LLC.
Inspire and Foreside Distributors, LLC are not affiliated.
4
Inspire
Global Hope ETF
PORTFOLIO REVIEW (Unaudited)
November 30, 2022
The Fund’s performance figures* for the periods ended November 30, 2022, as compared to its benchmarks:
| Annualized | ||||
| Annualized | Annualized | Since Inception** - | ||
| One Year | Three Year | Five Year | November 30, 2022 | |
| Inspire Global Hope ETF - NAV | (8.59)% | 7.99% | 6.80% | 8.09% |
| Inspire Global Hope ETF - Market Price | (8.54)% | 7.67% | 6.92% | 8.14% |
| Inspire Global Hope Large Cap Equal Weight Index *** | (8.25)% | 7.85% | 7.19% | 8.47% |
| S&P Global 1200 Total Return Index **** | (9.40)% | 8.01% | 7.81% | 9.47% |
| * | The Fund’s past performance does not guarantee future results. The investment return and principal value of an investment in the Fund will fluctuate so that an investor’s shares, when redeemed, may be worth more or less than their original cost. The returns shown do not reflect the deduction of taxes a shareholder would pay on Fund distributions, if any, or the redemption of the Fund shares. Current performance of the Fund may be lower or higher than the performance quoted. Performance data current to the most recent month-end may be obtained by visiting www.inspireetf.com or by calling 1-877-658-9473. |
The Fund’s per share net asset value or NAV is the value of one share of the Fund as calculated in accordance with the standard formula for valuing shares. The NAV return is based on the NAV of the Fund and the market return is based on the market price per share of the Fund. Since November 2, 2020, market price returns are calculated using the closing price and account for distributions from the Fund. Prior to November 2, 2020, market price returns were calculated using the midpoint price and accounted for distributions from the Fund. Market Price and NAV returns assume that dividends and capital gain distributions have been reinvested in the Fund at Market Price and NAV, respectively. The Fund’s adviser had contractually agreed to reduce its fees and/or absorb expenses of the Fund until March 31, 2022 to ensure that total annual fund operating expenses after fee waiver and/or reimbursement (exclusive of any front-end or contingent deferred loads, taxes, brokerage fees and commissions, borrowing costs (such as interest and dividend expense on securities sold short), acquired fund fees and expenses, fees and expenses associated with investments in other collective investment vehicles or derivative instruments (including for example option and swap fees and expenses), or extraordinary expenses such as litigation) did not exceed 0.52% of average daily net assets. Effective April 1, 2022 the Fund does not have a waiver agreement in place. The fee waiver and expense reimbursements are subject to possible recoupment from the Fund by the adviser in future years (within the three years after the fees have been waived or reimbursed) if such recoupment can be achieved within the lesser of the foregoing expense limits or those in place at the time of recapture. The Fund’s total annual operating expenses (gross) are 0.49% per the March 30, 2022 prospectus.
| ** | As of the commencement of operations on February 27, 2017. |
| *** | Inspire Global Hope Large Cap Equal Weight Index (BLESI) tracks the stock performance of 400 of the most inspiring large cap companies from around the globe, as determined by the adviser’s revolutionary Inspire Impact Score4 methodology which measures a company’s positive impact on the world. Under normal circumstances, the index will be comprised of 50% US large cap companies, 40% international developed large cap companies and 10% emerging market large cap companies. Inspire defines “large cap” as a market capitalization of $5B or greater. The index is equally weighted, rebalanced quarterly and calculated on a gross total return basis in United States Dollars. Investors cannot invest directly in an index. |
| **** | The S&P Global 1200 Total Return Index provides efficient exposure to the global equity market. Capturing approximately 70% of global market capitalization, it is constructed as a composite of 7 headline indices, many of which are accepted leaders in their regions. These include the S&P 500® (US), S&P Europe 350, S&P TOPIX 150 (Japan), S&P/TSX 60 (Canada), S&P/ASX All Australian 50, S&P Asia 50 and S&P Latin America 40. Investors cannot invest directly in an index. |
An index is a statistical measure of a specified financial market or sector. An index does not actually hold a portfolio of securities and therefore does not reflect deductions for fees or expenses. In comparison, the Fund’s performance is negatively impacted by these deductions. Index returns reflect all items of income, gain and loss and the reinvestment of dividends and other income.
5
Inspire
Global Hope ETF
PORTFOLIO REVIEW (Unaudited)(Continued)
November 30, 2022
Comparison of the Change in Value of a $10,000 Investment
The Fund’s Top Sectors and Industries are as follows:
| Sectors/Industries | % of Net Assets | |||
| Oil & Gas Producers | 7.9 | % | ||
| Banking | 7.0 | % | ||
| Electric Utilities | 6.2 | % | ||
| Medical Equipment & Devices | 4.3 | % | ||
| Chemicals | 4.1 | % | ||
| Semiconductors | 3.6 | % | ||
| Metals & Mining | 3.5 | % | ||
| Insurance | 3.5 | % | ||
| Software | 3.4 | % | ||
| Technology Services | 3.3 | % | ||
| Collateral For Securities Loaned | 0.7 | % | ||
| Other Sectors | 52.0 | % | ||
| Other Assets in Excess of Liabilities | 0.5 | % | ||
| 100.0 | % | |||
Please refer to the Schedule of Investments in this Annual Report for a detailed listing of the Fund’s holdings.
6
Inspire
Small/Mid Cap ETF
PORTFOLIO REVIEW (Unaudited)
November 30, 2022
The Fund’s performance figures* for the periods ended November 30, 2022, as compared to its benchmarks:
| Annualized | ||||
| Annualized | Annualized | Since Inception** - | ||
| One Year | Three Year | Five Year | November 30, 2022 | |
| Inspire Small/Mid Cap Impact ETF - NAV | (3.34)% | 9.07% | 7.06% | 7.49% |
| Inspire Small/Mid Cap Impact ETF - Market Price | (4.07)% | 8.80% | 6.91% | 7.36% |
| Inspire Small/Mid Cap Impact Equal Weight Index *** | (2.87)% | 11.06% | 8.41% | 8.82% |
| S&P SmallCap 600 Equal Weight Total Return Index **** | (5.98)% | 12.25% | 8.09% | 8.63% |
| * | The Fund’s past performance does not guarantee future results. The investment return and principal value of an investment in the Fund will fluctuate so that an investor’s shares, when redeemed, may be worth more or less than their original cost. The returns shown do not reflect the deduction of taxes a shareholder would pay on Fund distributions, if any, or the redemption of the Fund shares. Current performance of the Fund may be lower or higher than the performance quoted. Performance data current to the most recent month-end may be obtained by visiting www.inspireetf.com or by calling 1-877-658-9473. |
The Fund’s per share net asset value or NAV is the value of one share of the Fund as calculated in accordance with the standard formula for valuing shares. The NAV return is based on the NAV of the Fund and the market return is based on the market price per share of the Fund. Since November 2, 2020, market price returns are calculated using the closing price and account for distributions from the Fund. Prior to November 2, 2020, market price returns were calculated using the midpoint price and accounted for distributions from the Fund. Market Price and NAV returns assume that dividends and capital gain distributions have been reinvested in the Fund at Market Price and NAV, respectively. The Fund’s adviser had contractually agreed to reduce its fees and/or absorb expenses of the Fund until March 31, 2022 to ensure that total annual fund operating expenses after fee waiver and/or reimbursement (exclusive of any front-end or contingent deferred loads, taxes, brokerage fees and commissions, borrowing costs (such as interest and dividend expense on securities sold short), acquired fund fees and expenses, fees and expenses associated with investments in other collective investment vehicles or derivative instruments (including for example option and swap fees and expenses), or extraordinary expenses such as litigation) did not exceed 0.60% of average daily net assets. Effective April 1, 2022 the Fund does not have a waiver agreement in place. The fee waiver and expense reimbursements are subject to possible recoupment from the Fund by the adviser in future years (within the three years after the fees have been waived or reimbursed) if such recoupment can be achieved within the lesser of the foregoing expense limits or those in place at the time of recapture. The Fund’s total annual operating expenses (gross) are 0.48% per the March 30, 2022 prospectus.
| ** | As of the commencement of operations on February 27, 2017. |
| *** | Inspire Small/Mid Cap Impact Equal Weight Index (ISMDI) tracks the stock performance of 500 of the most inspiring small and mid cap companies in the U.S., as determined by the adviser’s revolutionary Inspire Impact Score4 methodology which measures a company’s positive impact on the world. Under normal circumstances the index will be comprised of 50% U.S. mid cap companies with market cap between $2B-3.5B, and 50% U.S. small cap companies with market cap between $1B-2B. The adviser believes that companies in this “smid cap” capitalization range have the potential to deliver above average growth. The index is equally weighted, rebalanced quarterly and calculated on a gross total return basis in United States Dollars. Investors cannot invest directly in an index. |
| **** | The S&P SmallCap 600 Equal Weight Total Return Index (EWI) is the equal-weight version of the S&P SmallCap 600. The index has the same constituents as the capitalization weighted S&P SmallCap 600, but each company in the S&P SmallCap 600 EWI is allocated a fixed weight. Investors cannot invest directly in an index. |
An index is a statistical measure of a specified financial market or sector. An index does not actually hold a portfolio of securities and therefore does not reflect deductions for fees or expenses. In comparison, the Fund’s performance is negatively impacted by these deductions. Index returns reflect all items of income, gain and loss and the reinvestment of dividends and other income.
7
Inspire
Small/Mid Cap ETF
PORTFOLIO REVIEW (Unaudited)(Continued)
November 30, 2022
Comparison of the Change in Value of a $10,000 Investment
The Fund’s Top Sectors and Industries are as follows:
| Sectors/Industries | % of Net Assets | |||
| Banking | 10.1 | % | ||
| Machinery | 4.4 | % | ||
| Semiconductors | 4.1 | % | ||
| Biotech & Pharma | 3.9 | % | ||
| Software | 3.9 | % | ||
| Chemicals | 3.8 | % | ||
| Technology Hardware | 3.8 | % | ||
| Insurance | 3.4 | % | ||
| Retail - Discretionary | 3.1 | % | ||
| Home Construction | 3.0 | % | ||
| Collateral For Securities Loaned | 0.8 | % | ||
| Other Sectors | 55.6 | % | ||
| Other Assets in Excess of Liabilities | 0.1 | % | ||
| 100.0 | % | |||
Please refer to the Schedule of Investments in this Annual Report for a detailed listing of the Fund’s holdings.
8
Inspire
Corporate Bond ETF
PORTFOLIO REVIEW (Unaudited)
November 30, 2022
The Fund’s performance figures* for the periods ended November 30, 2022, as compared to its benchmarks:
| Annualized | ||||
| Annualized | Annualized | Since Inception** - | ||
| One Year | Three Year | Five Year | November 30, 2022 | |
| Inspire Corporate Bond Impact ETF - NAV | (9.64)% | (2.07)% | 0.26% | 0.31% |
| Inspire Corporate Bond Impact ETF - Market Price | (9.20)% | (2.05)% | 0.20% | 0.36% |
| Inspire Corporate Bond Impact Equal Weight Index *** | (9.36)% | (0.39)% | 1.69% | 1.76% |
| Bloomberg U.S. Intermediate Credit Total Return Index **** | (8.93)% | (1.08)% | 1.15% | 1.23% |
| * | The Fund’s past performance does not guarantee future results. The investment return and principal value of an investment in the Fund will fluctuate so that an investor’s shares, when redeemed, may be worth more or less than their original cost. The returns shown do not reflect the deduction of taxes a shareholder would pay on Fund distributions, if any, or the redemption of the Fund shares. Current performance of the Fund may be lower or higher than the performance quoted. Performance data current to the most recent month-end may be obtained by visiting www.inspireetf.com or by calling 1-877-658-9473. |
The Fund’s per share net asset value or NAV is the value of one share of the Fund as calculated in accordance with the standard formula for valuing shares. The NAV return is based on the NAV of the Fund and the market return is based on the market price per share of the Fund. Since November 2, 2020, market price returns are calculated using the closing price and account for distributions from the Fund. Prior to November 2, 2020, market price returns were calculated using the midpoint price and accounted for distributions from the Fund. Market Price and NAV returns assume that dividends and capital gain distributions have been reinvested in the Fund at Market Price and NAV, respectively. The Fund’s total annual operating expenses (gross) are 0.44% per the March 30, 2022 prospectus.
| ** | As of the commencement of operations on July 10, 2017. |
| *** | Inspire Corporate Bond Impact Equal Weight Index (INSP BOND) is comprised of 250 investment grade, intermediate term corporate bonds issued by some of the most inspiring large cap “blue chip” companies in the United States, as determined by Inspire’s revolutionary Inspire Impact Score methodology which measures a company’s positive impact on the world. The adviser defines “large cap” as a market capitalization of $5B or greater and “investment grade” as BBB-/Baa3 or higher. The index is equally weighted, rebalanced quarterly and calculated on a total return basis in U.S. Dollars (“USD”). Investors cannot invest directly in an index. |
| **** | The Bloomberg U.S. Intermediate Credit Total Return Index (LUICTRUU) measures the investment grade, fixed-rate, taxable corporate bond market whose maturity ranges between 1 to 9.9999 years. It includes USD denominated securities publicly issued by US and non-US industrial, utility and financial issuers. Investors cannot invest directly in an index. |
An index is a statistical measure of a specified financial market or sector. An index does not actually hold a portfolio of securities and therefore does not reflect deductions for fees or expenses. In comparison, the Fund’s performance is negatively impacted by these deductions. Index returns reflect all items of income, gain and loss and the reinvestment of dividends and other income.
9
Inspire
Corporate Bond ETF
PORTFOLIO REVIEW (Unaudited)(Continued)
November 30, 2022
Comparison of the Change in Value of a $10,000 Investment
The Fund’s Top Sectors and Industries are as follows:
| Sectors/Industries | % of Net Assets | |||
| Real Estate Investment Trusts | 20.0 | % | ||
| Oil & Gas Producers | 11.0 | % | ||
| Electric Utilities | 6.5 | % | ||
| Commercial Support Services | 6.3 | % | ||
| Technology Services | 6.2 | % | ||
| Electrical Equipment | 4.2 | % | ||
| Semiconductors | 3.5 | % | ||
| Oil & Gas Services & Equipment | 3.4 | % | ||
| Food | 2.9 | % | ||
| Medical Equipment & Devices | 2.8 | % | ||
| Other Sectors | 32.0 | % | ||
| Other Assets in Excess of Liabilities | 1.2 | % | ||
| 100.0 | % | |||
Please refer to the Schedule of Investments in this Annual Report for a detailed listing of the Fund’s holdings.
10
Inspire
100 ETF
PORTFOLIO REVIEW (Unaudited)
November 30, 2022
The Fund’s performance figures* for the periods ended November 30, 2022, as compared to its benchmarks:
| Annualized | ||||
| Annualized | Annualized | Since Inception** - | ||
| One Year | Three Year | Five Year | November 30, 2022 | |
| Inspire 100 ETF - NAV | (14.69)% | 9.55% | 9.21% | 9.64% |
| Inspire 100 ETF - Market Price | (14.85)% | 9.50% | 9.18% | 9.61% |
| Inspire 100 Index *** | (14.61)% | 10.50% | 10.17% | 10.58% |
| S&P 500 Total Return Index **** | (9.21)% | 10.91% | 10.98% | 11.47% |
| * | The Fund’s past performance does not guarantee future results. The investment return and principal value of an investment in the Fund will fluctuate so that an investor’s shares, when redeemed, may be worth more or less than their original cost. The returns shown do not reflect the deduction of taxes a shareholder would pay on Fund distributions, if any, or the redemption of the Fund shares. Current performance of the Fund may be lower or higher than the performance quoted. Performance data current to the most recent month-end may be obtained by visiting www.inspireetf.com or by calling 1-877-658-9473. |
The Fund’s per share net asset value or NAV is the value of one share of the Fund as calculated in accordance with the standard formula for valuing shares. The NAV return is based on the NAV of the Fund and the market return is based on the market price per share of the Fund. Since November 2, 2020, market price returns are calculated using the closing price and account for distributions from the Fund. Prior to November 2, 2020, market price returns were calculated using the midpoint price and accounted for distributions from the Fund. Market Price and NAV returns assume that dividends and capital gain distributions have been reinvested in the Fund at Market Price and NAV, respectively. The Fund’s adviser has contractually agreed to reduce its fees and/or absorb expenses of the Fund until at least March 31, 2023 to ensure that total annual fund operating expenses after fee waiver and/or reimbursement (exclusive of any front-end or contingent deferred loads, taxes, brokerage fees and commissions, borrowing costs (such as interest and dividend expense on securities sold short), acquired fund fees and expenses, fees and expenses associated with investments in other collective investment vehicles or derivative instruments (including for example option and swap fees and expenses), or extraordinary expenses such as litigation) will not exceed 0.35% of average daily net assets. This fee waiver and expense reimbursement is subject to possible recoupment from the Fund if such recoupment does not cause the Fund’s expense ratio (after the repayment is taken into account) to exceed both: (i) the Fund’s expense cap in place at the time such expenses were waived, and (ii) the Fund’s current expense cap at the time of recoupment. This agreement may be terminated by the Board of Trustees only on 60 days’ written notice to the Fund’s adviser. The Fund’s total annual operating expenses (gross) are 0.42% per the March 30, 2022 prospectus.
| ** | As of the commencement of operations on October 30, 2017. |
| *** | The Inspire 100 Index (INSP100) is a rules based, passive index which tracks the stock performance of the one-hundred highest Inspire Impact Scoring companies in the United States with market capitalizations above $20B. The index is market-cap weighted, rebalanced annually and calculated on a total return basis in U.S. Dollars. Investors cannot invest directly in an index. |
| **** | The S&P 500 Total Return Index is an unmanaged market capitalization-weighted index which is comprised of 500 of the largest U.S. domiciled companies and includes the reinvestment of all dividends. Investors cannot invest directly in an index or benchmark. |
An index is a statistical measure of a specified financial market or sector. An index does not actually hold a portfolio of securities and therefore does not reflect deductions for fees or expenses. In comparison, a Fund’s performance is negatively impacted by these deductions. Index returns reflect all items of income, gain and loss and the reinvestment of dividends and other income.
11
Inspire
100 ETF
PORTFOLIO REVIEW (Unaudited)(Continued)
November 30, 2022
Comparison of the Change in Value of a $10,000 Investment
The Fund’s Top Sectors and Industries are as follows:
| Sectors/Industries | % of Net Assets | |||
| Technology Services | 10.9 | % | ||
| Semiconductors | 10.0 | % | ||
| Medical Equipment & Devices | 10.0 | % | ||
| Software | 8.2 | % | ||
| Commercial Support Services | 4.7 | % | ||
| Electrical Equipment | 4.6 | % | ||
| Residential Reit | 3.7 | % | ||
| Metals & Mining | 3.5 | % | ||
| Industrial Reit | 3.2 | % | ||
| Oil & Gas Producers | 3.0 | % | ||
| Other Sectors | 38.1 | % | ||
| Other Assets in Excess of Liabilities | 0.1 | % | ||
| 100.0 | % | |||
Please refer to the Schedule of Investments in this Annual Report for a detailed listing of the Fund’s holdings.
12
Inspire
International ETF
PORTFOLIO REVIEW (Unaudited)
November 30, 2022
The Fund’s performance figures* for the periods ended November 30, 2022, as compared to its benchmarks:
| Annualized | |||
| Annualized | Since Inception** - | ||
| One Year | Three Year | November 30, 2022 | |
| Inspire International ETF - NAV | (9.32)% | 6.04% | 7.69% |
| Inspire International ETF - Market Price | (9.34)% | 6.04% | 7.95% |
| Inspire Global Hope Ex-US Index *** | (9.18)% | 4.34% | 6.01% |
| S&P International 700 Total Return Index **** | (9.72)% | 3.22% | 4.49% |
| * | The Fund’s past performance does not guarantee future results. The investment return and principal value of an investment in the Fund will fluctuate so that an investor’s shares, when redeemed, may be worth more or less than their original cost. The returns shown do not reflect the deduction of taxes a shareholder would pay on Fund distributions, if any, or the redemption of the Fund shares. Current performance of the Fund may be lower or higher than the performance quoted. Performance data current to the most recent month-end may be obtained by visiting www.inspireetf.com or by calling 1-877-658-9473. |
The Fund’s per share net asset value or NAV is the value of one share of the Fund as calculated in accordance with the standard formula for valuing shares. The NAV return is based on the NAV of the Fund and the market return is based on the market price per share of the Fund. Since November 2, 2020, market price returns are calculated using the closing price and account for distributions from the Fund. Prior to November 2, 2020, market price returns were calculated using the midpoint price and accounted for distributions from the Fund. Market Price and NAV returns assume that dividends and capital gain distributions have been reinvested in the Fund at Market Price and NAV, respectively. The Fund’s adviser had contractually agreed to reduce its fees and/or absorb expenses of the Fund until March 31, 2022 to ensure that total annual fund operating expenses after fee waiver and/or reimbursement (exclusive of any front-end or contingent deferred loads, taxes, brokerage fees and commissions, borrowing costs (such as interest and dividend expense on securities sold short), acquired fund fees and expenses, fees and expenses associated with investments in other collective investment vehicles or derivative instruments (including for example option and swap fees and expenses), or extraordinary expenses such as litigation) did not exceed 0.80% of average daily net assets. Effective April 1, 2022 the Fund does not have a aiver agreement in place. The fee waiver and expense reimbursements are subject to possible recoupment from the Fund by the adviser in future years (within the three years after the fees have been waived or reimbursed), if such recoupment can be achieved within the lesser of the foregoing expense limits or those in place at the time of recapture. The Fund’s total annual operating expenses (gross) are 0.69% per the March 30, 2022 prospectus.
| ** | As of the commencement of operations on September 30, 2019. |
| *** | The Inspire Global Hope Ex-US Index (IGHXUSG) intends to track the price movements of a portfolio of 150 of the most inspiring, biblically aligned large cap companies outside of the United States. The index is comprised of 80% international developed large cap companies and 20% emerging markets large cap companies. The adviser defines “large cap” as a market capitalization of $5B U.S. Dollars (“USD”) or greater. The index is equally weighted, rebalanced quarterly and calculated on a gross total return basis in USD. Investors cannot invest directly in an index. |
| **** | The S&P International 700 Total Return Index measures the non-U.S. component of the global equity market through an index that is designed to be highly liquid and efficient to replicate. The index covers all regions included in the S&P Global 1200 except for the U.S., which is represented by the S&P 500. Investors cannot invest directly in an index. |
An index is a statistical measure of a specified financial market or sector. An index does not actually hold a portfolio of securities and therefore does not reflect deductions for fees or expenses. In comparison, a Fund’s performance is negatively impacted by these deductions. Index returns reflect all items of income, gain and loss and the reinvestment of dividends and other income.
13
Inspire
International ETF
PORTFOLIO REVIEW (Unaudited)(Continued)
November 30, 2022
Comparison of the Change in Value of a $10,000 Investment
The Fund’s Top Sectors and Industries are as follows:
| Sectors/Industries | % of Net Assets | |||
| Banking | 11.4 | % | ||
| Electric Utilities | 8.8 | % | ||
| Oil & Gas Producers | 7.9 | % | ||
| Metals & Mining | 5.9 | % | ||
| Chemicals | 4.7 | % | ||
| Insurance | 4.4 | % | ||
| Transportation & Logistics | 4.1 | % | ||
| Telecommunications | 3.2 | % | ||
| Real Estate Owners & Developers | 3.1 | % | ||
| Machinery | 3.1 | % | ||
| Collateral For Securities Loaned | 0.4 | % | ||
| Other Sectors | 43.0 | % | ||
| Other Assets in Excess of Liabilities | 0.0 | % * | ||
| 100.0 | % | |||
| * | Amount Less than 0.1% |
Please refer to the Schedule of Investments in this Annual Report for a detailed listing of the Fund’s holdings.
14
Inspire
Tactical Balanced ETF
PORTFOLIO REVIEW (Unaudited)
November 30, 2022
The Fund’s performance figures* for the periods ended November 30, 2022, as compared to its benchmark:
| Since Inception** - | ||
| One Year | November 30, 2022 | |
| Inspire Tactical Balanced ETF - NAV | (14.63)% | 3.36% |
| Inspire Tactical Balanced ETF - Market Price | (14.56)% | 3.40% |
| S&P Target Risk Moderate Index *** | (10.80)% | 0.64% |
| * | The Fund’s past performance does not guarantee future results. The investment return and principal value of an investment in the Fund will fluctuate so that an investor’s shares, when redeemed, may be worth more or less than their original cost. The returns shown do not reflect the deduction of taxes a shareholder would pay on Fund distributions, if any, or the redemption of the Fund shares. Current performance of the Fund may be lower or higher than the performance quoted. Performance data current to the most recent month-end may be obtained by visiting www.inspireetf.com or by calling 1-877-658-9473. |
The Fund’s per share net asset value or NAV is the value of one share of the Fund as calculated in accordance with the standard formula for valuing shares. The NAV return is based on the NAV of the Fund and the market return is based on the market price per share of the Fund. Since November 2, 2020, market price returns are calculated using the closing price and account for distributions from the Fund. Prior to November 2, 2020, market price returns were calculated using the midpoint price and accounted for distributions from the Fund. Market Price and NAV returns assume that dividends and capital gain distributions have been reinvested in the Fund at Market Price and NAV, respectively. The Fund’s total annual operating expenses (gross) are 0.71% per the March 30, 2022 prospectus.
| ** | As of the commencement of operations on July 15, 2020. |
| *** | The S&P Target Risk Moderate Index is designed to measure the performance of moderate stock-bond allocations to fixed income while seeking to increase opportunities for higher returns through equities. Investors cannot invest directly in an index. |
An index is a statistical measure of a specified financial market or sector. An index does not actually hold a portfolio of securities and therefore does not reflect deductions for fees or expenses. In comparison, a Fund’s performance is negatively impacted by these deductions. Index returns reflect all items of income, gain and loss and the reinvestment of dividends and other income.
15
Inspire
Tactical Balanced ETF
PORTFOLIO REVIEW (Unaudited)(Continued)
November 30, 2022
Comparison of the Change in Value of a $10,000 Investment
The Fund’s Top Asset Types are as follows:
| Asset Type | % of Net Assets | |||
| Exchange Traded Fund | ||||
| Fixed Income | 93.6 | % | ||
| Common Stock | ||||
| Technology Services | 0.6 | % | ||
| Medical Equipment & Devices | 0.6 | % | ||
| Semiconductors | 0.6 | % | ||
| Software | 0.5 | % | ||
| Commercial Support Services | 0.3 | % | ||
| Electrical Equipment | 0.3 | % | ||
| Residential Reit | 0.2 | % | ||
| Metals & Mining | 0.2 | % | ||
| Industrial Reit | 0.2 | % | ||
| Oil & Gas Producers | 0.2 | % | ||
| Other Sectors | 1.9 | % | ||
| Other Assets in Excess of Liabilities | 0.8 | % | ||
| 100.0 | % | |||
Please refer to the Schedule of Investments in this Annual Report for a detailed listing of the Fund’s holdings.
16
Inspire
Faithward Mid Cap Momentum ETF
PORTFOLIO REVIEW (Unaudited)
November 30, 2022
The Fund’s performance figures* for the periods ended November 30, 2022, as compared to its benchmark:
| Since Inception** - | ||
| One Year | November 30, 2022 | |
| Inspire Faithward Mid Cap Momentum ETF - NAV | (13.89)% | 0.53% |
| Inspire Faithward Mid Cap Momentum ETF - Market Price | (14.07)% | 0.49% |
| S&P MidCap 400 Index® *** | (3.29)% | 8.98% |
| * | The Fund’s past performance does not guarantee future results. The investment return and principal value of an investment in the Fund will fluctuate so that an investor’s shares, when redeemed, may be worth more or less than their original cost. The returns shown do not reflect the deduction of taxes a shareholder would pay on Fund distributions, if any, or the redemption of the Fund shares. Current performance of the Fund may be lower or higher than the performance quoted. Performance data current to the most recent month-end may be obtained by visiting www.inspireetf.com or by calling 1-877-658-9473. |
The Fund’s per share net asset value or NAV is the value of one share of the Fund as calculated in accordance with the standard formula for valuing shares. The NAV return is based on the NAV of the Fund and the market return is based on the market price per share of the Fund. Market Price and NAV returns assume that dividends and capital gain distributions have been reinvested in the Fund at Market Price and NAV, respectively. The Fund’s adviser has contractually agreed to reduce its fees and/or absorb expenses of the Fund until at least March 31, 2023 to ensure that total annual fund operating expenses after fee waiver and/or reimbursement (exclusive of any front-end or contingent deferred loads, taxes, brokerage fees and commissions, borrowing costs (such as interest and dividend expense on securities sold short), acquired fund fees and expenses, fees and expenses associated with investments in other collective investment vehicles or derivative instruments (including for example option and swap fees and expenses), or extraordinary expenses such as litigation) will not exceed 0.80% of average daily net assets. This fee waiver and expense reimbursement is subject to possible recoupment from the Fund if such recoupment does not cause the Fund’s expense ratio (after the repayment is taken into account) to exceed both: (i) the Fund’s expense cap in place at the time such expenses were waived, and (ii) the Fund’s current expense cap at the time of recoupment. This agreement may be terminated by the Board of Trustees only on 60 days’ written notice to the Fund’s adviser. The Fund’s total annual operating expenses (gross) are 1.02% per the March 30, 2022 prospectus.
| ** | As of the commencement of operations on December 7, 2020. |
| *** | The S&P MidCap 400 Index® provides investors with a benchmark for mid-sized companies. The index, which is distinct from the large-cap S&P 500®, is designed to measure the performance of 400 mid-sized companies, reflecting the distinctive risk and return characteristics of this market segment. Investors cannot invest directly in an |
An index is a statistical measure of a specified financial market or sector. An index does not actually hold a portfolio of securities and therefore does not reflect deductions for fees or expenses. In comparison, a Fund’s performance is negatively impacted by these deductions. Index returns reflect all items of income, gain and loss and the reinvestment of dividends and other income.
17
Inspire
Faithward Mid Cap Momentum ETF
PORTFOLIO REVIEW (Unaudited)(Continued)
November 30, 2022
Comparison of the Change in Value of a $10,000 Investment
The Fund’s Top Sectors and Industries are as follows:
| Sectors/Industries | % of Net Assets | |||
| Insurance | 10.3 | % | ||
| Oil & Gas Producers | 7.6 | % | ||
| Retail - Discretionary | 5.9 | % | ||
| Health Care Facilities & Services | 5.5 | % | ||
| Chemicals | 5.3 | % | ||
| Retail - Consumer Staples | 5.3 | % | ||
| Steel | 5.3 | % | ||
| Gas & Water Utilities | 5.2 | % | ||
| Semiconductors | 3.6 | % | ||
| Construction Materials | 3.0 | % | ||
| Other Sectors | 41.4 | % | ||
| Other Assets in Excess of Liabilities | 1.6 | % | ||
| 100.0 | % | |||
Please refer to the Schedule of Investments in this Annual Report for a detailed listing of the Fund’s holdings.
18
Inspire Fidelis Multi Factor ETF |
| PORTFOLIO REVIEW (Unaudited) |
| November 30, 2022 |
The Fund’s performance figures* for the periods ended November 30, 2022, as compared to its benchmark:
| Since Inception** - | |
| November 30, 2022 | |
| Inspire Fidelis Multi Factor ETF - NAV | 4.33% |
| Inspire Fidelis Multi Factor ETF - Market Price | 4.69% |
| WI Fidelis Multi-Cap, Multi-Factor Index *** | 4.92% |
| * | The Fund’s past performance does not guarantee future results. The investment return and principal value of an investment in the Fund will fluctuate so that an investor’s shares, when redeemed, may be worth more or less than their original cost. The returns shown do not reflect the deduction of taxes a shareholder would pay on Fund distributions, if any, or the redemption of the Fund shares. Current performance of the Fund may be lower or higher than the performance quoted. Performance data current to the most recent month-end may be obtained by visiting www.inspireetf.com or by calling 1-877-658-9473. |
The Fund’s per share net asset value or NAV is the value of one share of the Fund as calculated in accordance with the standard formula for valuing shares. The NAV return is based on the NAV of the Fund and the market return is based on the market price per share of the Fund. Market Price and NAV returns assume that dividends and capital gain distributions have been reinvested in the Fund at Market Price and NAV, respectively. The Fund’s total annual operating expenses (gross) are 0.85%s per the August 18, 2022 prospectus.
| ** | As of the commencement of operations on August 23, 2022. |
| *** | The WI Fidelis Multi-Cap, Multi-Factor Index tracks the performance of the 100 stocks which rank the highest within their market cap and sector based on WI Fidelis Index’s factor-based methodology. This methodology is designed to provide access to high quality companies (i.e. faith-based social impact, profitability, financial health, and growth) with market caps greater than $250M that also have value (including low volatility and higher dividend yield) and momentum (including positive earnings per share trend) characteristics. |
An index is a statistical measure of a specified financial market or sector. An index does not actually hold a portfolio of securities and therefore does not reflect deductions for fees or expenses. In comparison, a Fund’s performance is negatively impacted by these deductions. Index returns reflect all items of income, gain and loss and the reinvestment of dividends and other income.
19
Inspire
Fidelis Multi Factor ETF
PORTFOLIO REVIEW (Unaudited)(Continued)
November 30, 2022
Comparison of the Change in Value of a $10,000 Investment
The Fund’s Top Sectors and Industries are as follows:
| Sectors/Industries | % of Net Assets | |||
| Banking | 8.7 | % | ||
| Technology Hardware | 8.2 | % | ||
| Semiconductors | 7.1 | % | ||
| Biotech & Pharma | 6.9 | % | ||
| Oil & Gas Producers | 6.6 | % | ||
| Retail - Discretionary | 6.6 | % | ||
| Electrical Equipment | 5.0 | % | ||
| Steel | 4.6 | % | ||
| Commercial Support Services | 4.2 | % | ||
| Software | 3.8 | % | ||
| Other Sectors | 36.3 | % | ||
| Other Assets in Excess of Liabilities | 2.0 | % | ||
| 100.0 | % | |||
Please refer to the Schedule of Investments in this Annual Report for a detailed listing of the Fund’s holdings.
20
| INSPIRE GLOBAL HOPE ETF |
| SCHEDULE OF INVESTMENTS |
| November 30, 2022 |
| Shares | Fair Value | |||||||
| COMMON STOCKS — 98.8% | ||||||||
| AEROSPACE & DEFENSE - 1.6% | ||||||||
| 2,035 | HEICO Corporation | $ | 330,301 | |||||
| 3,216 | Safran S.A. | 393,438 | ||||||
| 865 | Teledyne Technologies, Inc.(a) | 363,387 | ||||||
| 5,002 | Textron, Inc. | 357,043 | ||||||
| 2,684 | Thales S.A. | 341,582 | ||||||
| 557 | TransDigm Group, Inc. | 350,075 | ||||||
| 2,135,826 | ||||||||
| APPAREL & TEXTILE PRODUCTS - 0.8% | ||||||||
| 3,115 | Cie Financiere Richemont S.A. | 408,344 | ||||||
| 252 | Hermes International | 404,991 | ||||||
| 63,286 | PRADA SpA | 346,378 | ||||||
| 1,159,713 | ||||||||
| ASSET MANAGEMENT - 2.0% | ||||||||
| 24,406 | 3i Group plc | 396,777 | ||||||
| 7,082 | Brookfield Asset Management, Inc., Class A | 333,894 | ||||||
| 4,048 | Charles Schwab Corporation (The) | 334,122 | ||||||
| 4,202 | Groupe Bruxelles Lambert S.A. | 335,442 | ||||||
| 20,439 | Investor A.B. | 375,742 | ||||||
| 6,500 | KKR & Company, Inc. | 337,480 | ||||||
| 1,347 | LPL Financial Holdings, Inc. | 318,848 | ||||||
| 367 | Partners Group Holding A.G. | 358,739 | ||||||
| 2,791,044 | ||||||||
| AUTOMOTIVE - 1.5% | ||||||||
| 13,072 | Cie Generale des Etablissements Michelin SCA | 363,981 | ||||||
| 6,631 | Continental A.G. | 395,732 | ||||||
| 6,033 | Denso Corporation | 328,293 | ||||||
| 1,577 | Ferrari N.V. | 351,750 | ||||||
| 209,741 | Geely Automobile Holdings Ltd. | 305,585 | ||||||
| 5,894 | Toyota Industries Corporation | 333,363 | ||||||
| 2,078,704 | ||||||||
| BANKING - 7.0% | ||||||||
| 480,916 | Bank Mandiri Persero Tbk P.T. | 323,696 | ||||||
| 992,962 | Bank Rakyat Indonesia Persero Tbk P.T. | 316,234 | ||||||
| 6,681 | Canadian Imperial Bank of Commerce | 321,792 | ||||||
See accompanying notes to financial statements.
21
| INSPIRE GLOBAL HOPE ETF |
| SCHEDULE OF INVESTMENTS (Continued) |
| November 30, 2022 |
| Shares | Fair Value | |||||||
| COMMON STOCKS — 98.8% (Continued) | ||||||||
| BANKING - 7.0% (Continued) | ||||||||
| 4,847 | Commonwealth Bank of Australia | $ | 354,872 | |||||
| 36,170 | Credit Agricole S.A. | 362,152 | ||||||
| 23,471 | Danske Bank A/S | 418,723 | ||||||
| 4,348 | East West Bancorp, Inc. | 305,273 | ||||||
| 12,733 | First Horizon Corporation | 316,415 | ||||||
| 2,226 | First Republic Bank | 284,060 | ||||||
| 45,470 | Grupo Financiero Banorte S.A.B. de C.V. | 365,007 | ||||||
| 13,949 | ICICI Bank Ltd. - ADR | 330,870 | ||||||
| 177,775 | Intesa Sanpaolo SpA | 393,039 | ||||||
| 20,327 | KakaoBank Corporation(a) | 390,484 | ||||||
| 6,207 | KBC Group N.V. | 341,068 | ||||||
| 1,660 | M&T Bank Corporation | 282,233 | ||||||
| 2,829 | Macquarie Group Ltd. | 343,179 | ||||||
| 158,781 | Malayan Banking Bhd | 308,240 | ||||||
| 15,419 | National Australia Bank Ltd. | 330,108 | ||||||
| 15,841 | OTP Bank Nyrt | 433,179 | ||||||
| 66,575 | Powszechna Kasa Oszczednosci Bank Polski S.A. | 420,666 | ||||||
| 323,612 | Public Bank Bhd | 327,579 | ||||||
| 14,572 | Regions Financial Corporation | 338,216 | ||||||
| 29,200 | Skandinaviska Enskilda Banken A.B. | 354,344 | ||||||
| 36,971 | Standard Bank Group Ltd. | 385,492 | ||||||
| 866 | SVB Financial Group(a) | 200,721 | ||||||
| 35,791 | Svenska Handelsbanken A.B., A Shares | 360,177 | ||||||
| 22,342 | Swedbank A.B., A Shares | 360,076 | ||||||
| 16,094 | United Overseas Bank Ltd. | 369,006 | ||||||
| 9,636,901 | ||||||||
| BEVERAGES - 0.5% | ||||||||
| 6,887 | Coca-Cola Europacific Partners plc | 365,631 | ||||||
| 3,351 | Monster Beverage Corporation(a) | 344,684 | ||||||
| 710,315 | ||||||||
| BIOTECH & PHARMA - 1.8% | ||||||||
| 1,442 | Alnylam Pharmaceuticals, Inc.(a) | 318,091 | ||||||
| 969 | Biohaven Ltd.(a) | 15,330 | ||||||
| 2,449 | Celltrion, Inc. | 330,540 | ||||||
See accompanying notes to financial statements.
22
| INSPIRE GLOBAL HOPE ETF |
| SCHEDULE OF INVESTMENTS (Continued) |
| November 30, 2022 |
| Shares | Fair Value | |||||||
| COMMON STOCKS — 98.8% (Continued) | ||||||||
| BIOTECH & PHARMA - 1.8% (Continued) | ||||||||
| 11,658 | Chugai Pharmaceutical Company Ltd. | $ | 305,963 | |||||
| 1,574 | CSL Ltd. | 320,644 | ||||||
| 4,708 | Horizon Therapeutics plc(a) | 472,165 | ||||||
| 4,401 | Incyte Corporation(a) | 350,628 | ||||||
| 4,225 | UCB S.A. | 337,982 | ||||||
| 2,451,343 | ||||||||
| CABLE & SATELLITE - 0.3% | ||||||||
| 3,890 | Liberty Broadband Corporation - Series A(a) | 350,878 | ||||||
| CHEMICALS - 4.1% | ||||||||
| 2,573 | Air Liquide S.A. | 370,535 | ||||||
| 5,178 | Akzo Nobel N.V. | 368,037 | ||||||
| 1,108 | Albemarle Corporation | 308,013 | ||||||
| 3,044 | CF Industries Holdings, Inc. | 329,330 | ||||||
| 1,845,839 | Chandra Asri Petrochemical Tbk P.T. | 282,123 | ||||||
| 460 | EMS-Chemie Holding A.G. | 316,940 | ||||||
| 96 | Givaudan S.A. | 321,184 | ||||||
| 2,590 | Koninklijke DSM N.V. | 330,024 | ||||||
| 3,905 | LyondellBasell Industries N.V., Class A | 331,964 | ||||||
| 6,058 | Mosaic Company (The) | 310,775 | ||||||
| 5,867 | Novozymes A/S, Class B | 336,906 | ||||||
| 3,484 | Nutrien Ltd. | 280,008 | ||||||
| 2,636 | PPG Industries, Inc. | 356,440 | ||||||
| 3,501 | RPM International, Inc. | 362,774 | ||||||
| 3,106 | Sociedad Quimica y Minera de Chile S.A., Class B | 307,356 | ||||||
| 2,998 | Symrise A.G. | 340,313 | ||||||
| 3,386 | Westlake Corporation | 364,503 | ||||||
| 5,617,225 | ||||||||
| COMMERCIAL SUPPORT SERVICES - 1.9% | ||||||||
| 753 | Cintas Corporation | 347,721 | ||||||
| 6,354 | Edenred | 347,424 | ||||||
| 4,983 | Eurofins Scientific S.E. | 344,833 | ||||||
| 2,151 | Republic Services, Inc. | 299,613 | ||||||
| 8,435 | Rollins, Inc. | 341,111 | ||||||
See accompanying notes to financial statements.
23
| INSPIRE GLOBAL HOPE ETF |
| SCHEDULE OF INVESTMENTS (Continued) |
| November 30, 2022 |
| Shares | Fair Value | |||||||
| COMMON STOCKS — 98.8% (Continued) | ||||||||
| COMMERCIAL SUPPORT SERVICES - 1.9% (Continued) | ||||||||
| 137 | SGS S.A. | $ | 318,504 | |||||
| 2,157 | Waste Connections, Inc.(b) | 311,309 | ||||||
| 1,827 | Waste Management, Inc. | 306,424 | ||||||
| 2,616,939 | ||||||||
| CONSTRUCTION MATERIALS - 2.2% | ||||||||
| 2,343 | Advanced Drainage Systems, Inc. | 227,880 | ||||||
| 1,042 | Carlisle Companies, Inc. | 274,161 | ||||||
| 8,183 | Cie de Saint-Gobain | 372,958 | ||||||
| 9,149 | CRH plc | 363,161 | ||||||
| 7,075 | Holcim Ltd. | 364,554 | ||||||
| 901 | Martin Marietta Materials, Inc. | 330,198 | ||||||
| 34,148 | Siam Cement PCL (The) - ADR | 326,561 | ||||||
| 1,456 | Sika A.G. | 364,654 | ||||||
| 1,849 | Vulcan Materials Company | 338,977 | ||||||
| 2,963,104 | ||||||||
| CONTAINERS & PACKAGING - 0.8% | ||||||||
| 27,298 | Amcor plc - ADR | 332,980 | ||||||
| 9,228 | International Paper Company | 342,543 | ||||||
| 2,616 | Packaging Corp of America | 355,489 | ||||||
| 1,031,012 | ||||||||
| DATA CENTER REIT - 0.2% | ||||||||
| 2,963 | Digital Realty Trust, Inc. | 333,219 | ||||||
| DIVERSIFIED INDUSTRIALS - 0.8% | ||||||||
| 12,013 | Alfa Laval A.B. | 340,645 | ||||||
| 2,506 | Dover Corporation | 355,727 | ||||||
| 1,614 | Illinois Tool Works, Inc. | 367,137 | ||||||
| 1,063,509 | ||||||||
| ELECTRIC UTILITIES - 6.2% | ||||||||
| 3,010,534 | AC Energy Corporation | 379,452 | ||||||
| 12,969 | AES Corporation (The) | 375,063 | ||||||
| 5,533 | Alliant Energy Corporation | 311,508 | ||||||
| 6,991 | Avangrid, Inc. | 299,005 | ||||||
| 10,431 | CenterPoint Energy, Inc. | 324,508 | ||||||
See accompanying notes to financial statements.
24
| INSPIRE GLOBAL HOPE ETF |
| SCHEDULE OF INVESTMENTS (Continued) |
| November 30, 2022 |
| Shares | Fair Value | |||||||
| COMMON STOCKS — 98.8% (Continued) | ||||||||
| ELECTRIC UTILITIES - 6.2% (Continued) | ||||||||
| 38,929 | CLP Holdings Ltd. | $ | 282,096 | |||||
| 38,087 | E.ON S.E. | 362,061 | ||||||
| 67,605 | EDP - Energias de Portugal S.A. | 318,303 | ||||||
| 14,180 | EDP Renovaveis S.A. | 325,765 | ||||||
| 7,169 | Emera, Inc. | 279,105 | ||||||
| 19,397 | Endesa S.A. | 357,707 | ||||||
| 2,765,202 | Enel Americas S.A. | 365,256 | ||||||
| 71,397 | Enel SpA | 381,905 | ||||||
| 25,456 | Engie S.A. | 385,102 | ||||||
| 2,908 | Entergy Corporation | 338,113 | ||||||
| 4,930 | Evergy, Inc. | 291,905 | ||||||
| 7,650 | Fortis, Inc.(b) | 307,897 | ||||||
| 22,324 | Fortum OYJ | 353,886 | ||||||
| 213,058 | Gulf Energy Development PCL - ADR | 321,391 | ||||||
| 31,431 | Iberdrola S.A. | 353,017 | ||||||
| 17,430 | SSE plc | 359,014 | ||||||
| 164,748 | Tenaga Nasional Bhd | 349,100 | ||||||
| 47,754 | Terna Rete Elettrica Nazionale SpA | 363,703 | ||||||
| 3,470 | Verbund A.G. | 311,100 | ||||||
| 3,276 | WEC Energy Group, Inc. | 324,783 | ||||||
| 8,420,745 | ||||||||
| ELECTRICAL EQUIPMENT - 2.1% | ||||||||
| 2,569 | AMETEK, Inc. | 365,877 | ||||||
| 4,354 | Amphenol Corporation, Class A | 350,192 | ||||||
| 15,810 | Assa Abloy A.B., Class B | 358,863 | ||||||
| 16,867 | Delta Electronics Thailand PCL | 322,602 | ||||||
| 1,652 | Generac Holdings, Inc.(a) | 174,319 | ||||||
| 1,846 | Keysight Technologies, Inc.(a) | 333,923 | ||||||
| 810 | Roper Technologies, Inc. | 355,501 | ||||||
| 1,864 | Schindler Holding A.G. | 348,946 | ||||||
| 5,347 | Trimble, Inc.(a) | 319,483 | ||||||
| 2,929,706 | ||||||||
| ENGINEERING & CONSTRUCTION - 0.7% | ||||||||
| 12,970 | Ferrovial S.A. | 345,939 | ||||||
See accompanying notes to financial statements.
25
| INSPIRE GLOBAL HOPE ETF |
| SCHEDULE OF INVESTMENTS (Continued) |
| November 30, 2022 |
| Shares | Fair Value | |||||||
| COMMON STOCKS — 98.8% (Continued) | ||||||||
| ENGINEERING & CONSTRUCTION - 0.7% (Continued) | ||||||||
| 2,294 | Quanta Services, Inc. | $ | 343,825 | |||||
| 15,589 | Sitios Latinoamerica S.A.B. de C.V.(a) | 6,950 | ||||||
| 2,654 | WSP Global, Inc. | 318,343 | ||||||
| 1,015,057 | ||||||||
| ENTERTAINMENT CONTENT - 0.3% | ||||||||
| 63,404 | Bollore S.E. | 354,079 | ||||||
| FOOD - 2.6% | ||||||||
| 10,676 | Ajinomoto Company, Inc. | 335,162 | ||||||
| 154 | Barry Callebaut A.G. | 312,947 | ||||||
| 6,241 | Campbell Soup Company | 334,954 | ||||||
| 74,635 | China Mengniu Dairy Company Ltd. | 332,528 | ||||||
| 30 | Chocoladefabriken Lindt & Spruengli A.G. | 314,488 | ||||||
| 8,946 | Conagra Brands, Inc. | 339,769 | ||||||
| 4,457 | Darling Ingredients, Inc.(a) | 320,146 | ||||||
| 82,496 | Grupo Bimbo S.A.B. de C.V. | 350,126 | ||||||
| 6,453 | Hormel Foods Corporation | 303,291 | ||||||
| 3,780 | Lamb Weston Holdings, Inc. | 328,482 | ||||||
| 108,945 | Wilmar International Ltd. | 328,251 | ||||||
| 3,600,144 | ||||||||
| FORESTRY, PAPER & WOOD PRODUCTS - 0.8% | ||||||||
| 23,409 | Stora Enso OYJ, R Shares | 340,843 | ||||||
| 35,806 | Suzano S.A. | 364,460 | ||||||
| 9,338 | UPM-Kymmene OYJ | 340,227 | ||||||
| 1,045,530 | ||||||||
| GAS & WATER UTILITIES - 1.0% | ||||||||
| 2,872 | Atmos Energy Corporation | 345,214 | ||||||
| 334,122 | Hong Kong & China Gas Company Ltd. | 284,040 | ||||||
| 12,729 | Naturgy Energy Group S.A. | 355,160 | ||||||
| 71,797 | Snam SpA | 364,147 | ||||||
| 1,348,561 | ||||||||
| HEALTH CARE FACILITIES & SERVICES - 1.6% | ||||||||
| 4,042 | Catalent, Inc.(a) | 202,625 | ||||||
| 643 | Elevance Health, Inc. | 342,668 | ||||||
See accompanying notes to financial statements.
26
| INSPIRE GLOBAL HOPE ETF |
| SCHEDULE OF INVESTMENTS (Continued) |
| November 30, 2022 |
| Shares | Fair Value | |||||||
| COMMON STOCKS — 98.8% (Continued) | ||||||||
| HEALTH CARE FACILITIES & SERVICES - 1.6% (Continued) | ||||||||
| 13,640 | Fresenius S.E. & Company KGaA | $ | 377,452 | |||||
| 1,586 | ICON plc(a) | 341,688 | ||||||
| 229,589 | IHH Healthcare Bhd | 299,543 | ||||||
| 1,610 | IQVIA Holdings, Inc.(a) | 351,012 | ||||||
| 887 | Molina Healthcare, Inc.(a) | 298,715 | ||||||
| 2,213,703 | ||||||||
| HEALTH CARE REIT - 0.5% | ||||||||
| 12,749 | Healthpeak Properties, Inc. | 334,789 | ||||||
| 7,279 | Ventas, Inc. | 338,692 | ||||||
| 673,481 | ||||||||
| HOME CONSTRUCTION - 1.0% | ||||||||
| 4,328 | DR Horton, Inc. | 372,208 | ||||||
| 683 | Geberit A.G. | 322,482 | ||||||
| 3,903 | Lennar Corporation, Class A | 342,800 | ||||||
| 73 | NVR, Inc.(a) | 338,648 | ||||||
| 1,376,138 | ||||||||
| HOUSEHOLD PRODUCTS - 1.0% | ||||||||
| 2,982 | Beiersdorf A.G. | 322,962 | ||||||
| 4,093 | Church & Dwight Company, Inc. | 335,094 | ||||||
| 14,885 | Essity A.B. - Series B | 362,395 | ||||||
| 643 | LG Household & Health Care Ltd. | 323,472 | ||||||
| 1,343,923 | ||||||||
| INDUSTRIAL REIT - 0.8% | ||||||||
| 27,807 | Goodman Group | 360,895 | ||||||
| 5,739 | Prologis, Inc. | 675,996 | ||||||
| 1,036,891 | ||||||||
| INDUSTRIAL SUPPORT SERVICES - 1.0% | ||||||||
| 6,654 | Ashtead Group plc | 399,095 | ||||||
| 6,357 | Fastenal Company | 327,449 | ||||||
| 1,078 | United Rentals, Inc.(a) | 380,566 | ||||||
| 1,133 | Watsco, Inc. | 304,754 | ||||||
| 1,411,864 | ||||||||
| INSTITUTIONAL FINANCIAL SERVICES - 1.7% | ||||||||
| 121,780 | B3 S.A. - Brasil Bolsa Balcao | 299,336 | ||||||
See accompanying notes to financial statements.
27
| INSPIRE GLOBAL HOPE ETF |
| SCHEDULE OF INVESTMENTS (Continued) |
| November 30, 2022 |
| Shares | Fair Value | |||||||
| COMMON STOCKS — 98.8% (Continued) | ||||||||
| INSTITUTIONAL FINANCIAL SERVICES - 1.7% (Continued) | ||||||||
| 2,490 | Cboe Global Markets, Inc. | $ | 315,832 | |||||
| 1,788 | Deutsche Boerse A.G. | 327,682 | ||||||
| 8,527 | Hong Kong Exchanges & Clearing Ltd. | 334,060 | ||||||
| 4,542 | Interactive Brokers Group, Inc., Class A | 364,722 | ||||||
| 3,216 | Intercontinental Exchange, Inc. | 348,325 | ||||||
| 3,491 | London Stock Exchange Group plc | 347,135 | ||||||
| 2,337,092 | ||||||||
| INSURANCE - 3.5% | ||||||||
| 4,846 | Brown & Brown, Inc. | 288,773 | ||||||
| 3,265 | Cincinnati Financial Corporation | 362,284 | ||||||
| 18,163 | Dai-ichi Life Holdings, Inc. | 334,562 | ||||||
| 636 | Fairfax Financial Holdings Ltd. | 364,903 | ||||||
| 2,038 | Intact Financial Corporation | 304,921 | ||||||
| 123,275 | Legal & General Group plc | 373,926 | ||||||
| 5,860 | Loews Corporation | 340,759 | ||||||
| 268 | Markel Corporation(a) | 355,057 | ||||||
| 12,872 | Power Corp of Canada | 323,819 | ||||||
| 30,067 | Prudential plc | 355,017 | ||||||
| 6,881 | Sampo OYJ, A Shares | 347,993 | ||||||
| 660 | Swiss Life Holding A.G. | 349,843 | ||||||
| 14,291 | Tryg A/S | 330,937 | ||||||
| 4,533 | W R Berkley Corporation | 345,777 | ||||||
| 4,778,571 | ||||||||
| INTERNET MEDIA & SERVICES - 1.4% | ||||||||
| 177 | Booking Holdings, Inc.(a) | 368,064 | ||||||
| 17,793,885 | GoTo Gojek Tokopedia Tbk P.T.(a) | 171,828 | ||||||
| 2,356 | Naspers Ltd., N Shares | 359,763 | ||||||
| 5,613 | Prosus N.V. | 365,447 | ||||||
| 3,817 | REA Group Ltd. | 319,491 | ||||||
| 29,201 | Snap, Inc., Class A(a) | 301,062 | ||||||
| 1,885,655 | ||||||||
| MACHINERY – 2.9% | ||||||||
| 32,177 | Atlas Copco A.B. | 395,864 | ||||||
| 1,788 | Caterpillar, Inc. | 422,700 | ||||||
See accompanying notes to financial statements.
28
| INSPIRE GLOBAL HOPE ETF |
| SCHEDULE OF INVESTMENTS (Continued) |
| November 30, 2022 |
| Shares | Fair Value | |||||||
| COMMON STOCKS — 98.8% (Continued) | ||||||||
| MACHINERY – 2.9% (Continued) | ||||||||
| 25,941 | CNH Industrial N.V. | $ | 412,709 | |||||
| 2,049 | FANUC Corporation | 302,192 | ||||||
| 4,857 | Graco, Inc. | 339,844 | ||||||
| 1,377 | Nordson Corporation | 325,647 | ||||||
| 1,200 | Parker-Hannifin Corporation | 358,728 | ||||||
| 21,946 | Sandvik A.B. | 399,265 | ||||||
| 707 | SMC Corporation | 316,216 | ||||||
| 1,451 | Snap-on, Inc. | 349,111 | ||||||
| 49,903 | WEG S.A. | 373,850 | ||||||
| 3,996,126 | ||||||||
| MEDICAL EQUIPMENT & DEVICES - 4.3% | ||||||||
| 1,184 | ABIOMED, Inc.(a) | 447,302 | ||||||
| 1,402 | Align Technology, Inc.(a) | 275,717 | ||||||
| 701 | Bio-Rad Laboratories, Inc., Class A(a) | 290,712 | ||||||
| 2,900 | Coloplast A/S - Series B | 338,253 | ||||||
| 3,523 | Edwards Lifesciences Corporation(a) | 272,152 | ||||||
| 2,150 | EssilorLuxottica S.A. | 397,161 | ||||||
| 4,521 | Hologic, Inc.(a) | 344,319 | ||||||
| 889 | IDEXX Laboratories, Inc.(a) | 378,598 | ||||||
| 1,271 | Insulet Corporation(a) | 380,499 | ||||||
| 1,561 | Intuitive Surgical, Inc.(a) | 422,079 | ||||||
| 267 | Mettler-Toledo International, Inc.(a) | 392,373 | ||||||
| 1,551 | Repligen Corporation(a) | 277,381 | ||||||
| 1,343 | ResMed, Inc. | 309,159 | ||||||
| 1,332 | Sonova Holding A.G. | 340,636 | ||||||
| 1,436 | Stryker Corporation | 335,866 | ||||||
| 1,082 | Waters Corporation(a) | 375,021 | ||||||
| 1,183 | West Pharmaceutical Services, Inc. | 277,603 | ||||||
| 5,854,831 | ||||||||
| METALS & MINING - 3.5% | ||||||||
| 6,844 | Agnico Eagle Mines Ltd. | 344,703 | ||||||
| 4,123 | Anglo American Platinum Ltd. | 410,200 | ||||||
| 22,554 | Antofagasta plc | 382,983 | ||||||
| 11,824 | BHP Group Ltd. | 365,347 | ||||||
See accompanying notes to financial statements.
29
| INSPIRE GLOBAL HOPE ETF |
| SCHEDULE OF INVESTMENTS (Continued) |
| November 30, 2022 |
| Shares | Fair Value | |||||||
| COMMON STOCKS — 98.8% (Continued) | ||||||||
| METALS & MINING - 3.5% (Continued) | ||||||||
| 26,896 | Fortescue Metals Group Ltd. | $ | 353,818 | |||||
| 2,430 | Franco-Nevada Corporation | 354,955 | ||||||
| 10,662 | Freeport-McMoRan, Inc. | 424,347 | ||||||
| 6,978 | Newmont Corporation | 331,246 | ||||||
| 55,077 | Norsk Hydro ASA | 405,950 | ||||||
| 4,964 | Rio Tinto Ltd. | 369,369 | ||||||
| 118,700 | South32 Ltd. | 323,903 | ||||||
| 6,506 | Southern Copper Corporation | 396,996 | ||||||
| 8,900 | Wheaton Precious Metals Corporation | 347,356 | ||||||
| 4,811,173 | ||||||||
| MULTI ASSET CLASS REIT - 0.5% | ||||||||
| 35,937 | Segro plc | 342,616 | ||||||
| 4,202 | WP Carey, Inc. | 331,118 | ||||||
| 673,734 | ||||||||
| OFFICE REIT - 0.4% | ||||||||
| 2,078 | Alexandria Real Estate Equities, Inc. | 323,358 | ||||||
| 3,883 | Boston Properties, Inc. | 279,887 | ||||||
| 603,245 | ||||||||
| OIL & GAS PRODUCERS - 7.9% | ||||||||
| 10,233 | Aker BP ASA | 355,086 | ||||||
| 9,628 | Antero Resources Corporation(a) | 351,903 | ||||||
| 8,631 | APA Corporation | 404,362 | ||||||
| 6,271 | Canadian Natural Resources Ltd. | 374,397 | ||||||
| 19,074 | Cenovus Energy, Inc. | 379,308 | ||||||
| 3,124 | Chesapeake Energy Corporation | 323,334 | ||||||
| 11,211 | Coterra Energy, Inc. | 312,899 | ||||||
| 4,886 | Devon Energy Corporation | 334,789 | ||||||
| 2,445 | Diamondback Energy, Inc. | 361,909 | ||||||
| 89,319 | ENEOS Holdings, Inc. | 301,430 | ||||||
| 27,553 | Eni SpA | 411,199 | ||||||
| 2,636 | EOG Resources, Inc. | 374,127 | ||||||
| 7,322 | EQT Corporation | 310,526 | ||||||
| 8,974 | Equinor ASA | 345,482 | ||||||
| 30,980 | Inpex Corporation | 343,938 | ||||||
See accompanying notes to financial statements.
30
| INSPIRE GLOBAL HOPE ETF |
| SCHEDULE OF INVESTMENTS (Continued) |
| November 30, 2022 |
| Shares | Fair Value | |||||||
| COMMON STOCKS — 98.8% (Continued) | ||||||||
| OIL & GAS PRODUCERS - 7.9% (Continued) | ||||||||
| 17,593 | Kinder Morgan, Inc. | $ | 336,378 | |||||
| 52,467 | MOL Hungarian Oil & Gas plc | 376,366 | ||||||
| 4,776 | Occidental Petroleum Corporation | 331,884 | ||||||
| 8,054 | OMV A.G. | 420,910 | ||||||
| 5,720 | ONEOK, Inc. | 382,782 | ||||||
| 6,410 | Ovintiv, Inc. | 357,422 | ||||||
| 27,359 | Polski Koncern Naftowy ORLEN S.A. | 398,186 | ||||||
| 69,145 | PTT Exploration & Production PCL - ADR | 369,980 | ||||||
| 64,290 | Santos Ltd. | 322,934 | ||||||
| 4,846 | Targa Resources Corporation - Series MLP | 360,494 | ||||||
| 6,256 | TotalEnergies S.E.,(b) | 393,102 | ||||||
| 5,622 | Tourmaline Oil Corporation | 342,170 | ||||||
| 2,737 | Valero Energy Corporation | 365,718 | ||||||
| 10,249 | Williams Companies, Inc. (The) | 355,640 | ||||||
| 14,242 | Woodside Energy Group Ltd. | 360,497 | ||||||
| 10,759,152 | ||||||||
| OIL & GAS SERVICES & EQUIPMENT - 0.6% | ||||||||
| 11,936 | Halliburton Company | 452,255 | ||||||
| 8,199 | Schlumberger N.V. | 422,658 | ||||||
| 874,913 | ||||||||
| PUBLISHING & BROADCASTING - 0.2% | ||||||||
| 5,583 | Liberty Media Corp-Liberty Formula One - Series A(a) | 306,898 | ||||||
| REAL ESTATE OWNERS & DEVELOPERS - 1.6% | ||||||||
| 48,703 | CK Asset Holdings Ltd. | 290,257 | ||||||
| 65,806 | Hongkong Land Holdings Ltd. | 263,882 | ||||||
| 234,807 | Sino Land Company Ltd. | 291,902 | ||||||
| 537,932 | SM Prime Holdings, Inc. | 347,114 | ||||||
| 12,997 | Sumitomo Realty & Development Company Ltd. | 349,764 | ||||||
| 137,322 | Swire Properties Ltd. | 307,318 | ||||||
| 13,765 | Vonovia S.E. | 336,883 | ||||||
| 2,187,120 | ||||||||
| RENEWABLE ENERGY - 0.7% | ||||||||
| 1,054 | Enphase Energy, Inc.(a) | 337,902 | ||||||
See accompanying notes to financial statements.
31
| INSPIRE GLOBAL HOPE ETF |
| SCHEDULE OF INVESTMENTS (Continued) |
| November 30, 2022 |
| Shares | Fair Value | |||||||
| COMMON STOCKS — 98.8% (Continued) | ||||||||
| RENEWABLE ENERGY - 0.7% (Continued) | ||||||||
| 2,211 | First Solar, Inc.(a) | $ | 381,464 | |||||
| 13,804 | Plug Power, Inc.(a) | 220,312 | ||||||
| 939,678 | ||||||||
| RESIDENTIAL REIT - 1.7% | ||||||||
| 2,455 | Camden Property Trust | 295,410 | ||||||
| 4,633 | Equity LifeStyle Properties, Inc. | 307,724 | ||||||
| 4,346 | Equity Residential | 281,882 | ||||||
| 1,208 | Essex Property Trust, Inc. | 266,219 | ||||||
| 8,651 | Invitation Homes, Inc. | 282,282 | ||||||
| 1,880 | Mid-America Apartment Communities, Inc. | 309,974 | ||||||
| 2,158 | Sun Communities, Inc. | 317,010 | ||||||
| 7,019 | UDR, Inc. | 291,078 | ||||||
| 2,351,579 | ||||||||
| RETAIL - CONSUMER STAPLES - 1.2% | ||||||||
| 15,682 | Aeon Company Ltd. | 320,604 | ||||||
| 228,864 | Cencosud S.A. | 339,198 | ||||||
| 1,218 | Dollar General Corporation | 311,418 | ||||||
| 2,165 | Dollar Tree, Inc.(a) | 325,378 | ||||||
| 15,598 | Jeronimo Martins SGPS S.A. | 344,528 | ||||||
| 1,641,126 | ||||||||
| RETAIL - DISCRETIONARY - 1.3% | ||||||||
| 136 | AutoZone, Inc.(a) | 350,744 | ||||||
| 4,409 | CarMax, Inc.(a) | 305,808 | ||||||
| 1,962 | Genuine Parts Company | 359,693 | ||||||
| 22,579 | SM Investments Corporation | 375,850 | ||||||
| 1,583 | Tractor Supply Company | 358,249 | ||||||
| 1,750,344 | ||||||||
| RETAIL REIT – 0.8% | ||||||||
| 15,897 | Kimco Realty Corporation | 364,359 | ||||||
| 5,034 | Realty Income Corporation | 317,494 | ||||||
| 3,252 | Simon Property Group, Inc. | 388,418 | ||||||
| 1,070,271 | ||||||||
| SELF-STORAGE REIT - 0.4% | ||||||||
| 1,701 | Extra Space Storage, Inc. | 273,334 | ||||||
See accompanying notes to financial statements.
32
| INSPIRE GLOBAL HOPE ETF |
| SCHEDULE OF INVESTMENTS (Continued) |
| November 30, 2022 |
| Shares | Fair Value | |||||||
| COMMON STOCKS — 98.8% (Continued) | ||||||||
| SELF-STORAGE REIT - 0.4% (Continued) | ||||||||
| 1,001 | Public Storage | $ | 298,258 | |||||
| 571,592 | ||||||||
| SEMICONDUCTORS - 3.6% | ||||||||
| 2,093 | Analog Devices, Inc. | 359,808 | ||||||
| 705 | ASML Holding N.V. | 412,143 | ||||||
| 657 | Broadcom, Inc. | 362,027 | ||||||
| 3,487 | Entegris, Inc. | 269,510 | ||||||
| 13,622 | Infineon Technologies A.G. | 447,348 | ||||||
| 966 | KLA Corporation | 379,782 | ||||||
| 4,763 | Microchip Technology, Inc. | 377,182 | ||||||
| 808 | Monolithic Power Systems, Inc. | 308,624 | ||||||
| 1,970 | NXP Semiconductors N.V. | 346,405 | ||||||
| 4,676 | ON Semiconductor Corporation(a) | 351,635 | ||||||
| 3,409 | Skyworks Solutions, Inc. | 325,969 | ||||||
| 9,525 | STMicroelectronics N.V. | 357,808 | ||||||
| 3,884 | Teradyne, Inc. | 362,960 | ||||||
| 2,801 | Wolfspeed, Inc.(a) | 254,667 | ||||||
| 4,915,868 | ||||||||
| SOFTWARE - 3.4% | ||||||||
| 1,313 | ANSYS, Inc.(a) | 333,896 | ||||||
| 1,786 | Cadence Design Systems, Inc.(a) | 307,263 | ||||||
| 2,606 | Check Point Software Technologies Ltd.(a) | 346,156 | ||||||
| 5,207 | Cloudflare, Inc., Class A(a) | 255,872 | ||||||
| 8,706 | Dassault Systemes S.E. | 318,243 | ||||||
| 3,540 | Datadog, Inc.(a) | 268,261 | ||||||
| 5,389 | DocuSign, Inc.(a) | 253,660 | ||||||
| 5,937 | Fortinet, Inc.(a) | 315,611 | ||||||
| 1,077 | HubSpot, Inc.(a) | 326,363 | ||||||
| 1,540 | Nice Ltd.(a) | 292,065 | ||||||
| 767 | ServiceNow, Inc.(a) | 319,302 | ||||||
| 6,118 | SS&C Technologies Holdings, Inc. | 328,904 | ||||||
| 958 | Synopsys, Inc.(a) | 325,279 | ||||||
| 841 | Tyler Technologies, Inc.(a) | 288,244 | ||||||
See accompanying notes to financial statements.
33
| INSPIRE GLOBAL HOPE ETF |
| SCHEDULE OF INVESTMENTS (Continued) |
| November 30, 2022 |
| Shares | Fair Value | |||||||
| COMMON STOCKS — 98.8% (Continued) | ||||||||
| SOFTWARE - 3.4% (Continued) | ||||||||
| 1,772 | Veeva Systems, Inc., Class A(a) | $ | 337,319 | |||||
| 4,616,438 | ||||||||
| STEEL - 0.9% | ||||||||
| 2,729 | Nucor Corporation | 409,214 | ||||||
| 1,671 | Reliance Steel & Aluminum Company | 353,066 | ||||||
| 4,123 | Steel Dynamics, Inc. | 428,503 | ||||||
| 1,190,783 | ||||||||
| TECHNOLOGY HARDWARE - 1.3% | ||||||||
| 2,584 | Arista Networks, Inc.(a) | 359,951 | ||||||
| 3,619 | Garmin Ltd. | 336,531 | ||||||
| 4,690 | NetApp, Inc. | 317,091 | ||||||
| 740 | Samsung SDI Company Ltd. | 413,696 | ||||||
| 1,103 | Zebra Technologies Corporation, Class A(a) | 298,119 | ||||||
| 1,725,388 | ||||||||
| TECHNOLOGY SERVICES - 3.3% | ||||||||
| 5,083 | Cognizant Technology Solutions Corporation, Class A | 316,213 | ||||||
| 4,181 | CoStar Group, Inc.(a) | 338,828 | ||||||
| 808 | EPAM Systems, Inc.(a) | 297,813 | ||||||
| 1,710 | Equifax, Inc. | 337,503 | ||||||
| 3,865 | Fidelity National Information Services, Inc. | 280,522 | ||||||
| 1,658 | FleetCor Technologies, Inc.(a) | 325,300 | ||||||
| 1,053 | Gartner, Inc.(a) | 368,939 | ||||||
| 2,706 | Global Payments, Inc. | 280,829 | ||||||
| 1,604 | Jack Henry & Associates, Inc. | 303,717 | ||||||
| 689 | MSCI, Inc. | 349,895 | ||||||
| 2,594 | Paychex, Inc. | 321,734 | ||||||
| 1,711 | Verisk Analytics, Inc. | 314,328 | ||||||
| 3,596 | WNS Holdings Ltd. - ADR(a) | 303,215 | ||||||
| 3,034 | Wolters Kluwer N.V. | 332,545 | ||||||
| 4,471,381 | ||||||||
| TELECOMMUNICATIONS - 1.6% | ||||||||
| 353,441 | America Movil S.A.B. de C.V. | 343,544 | ||||||
| 108,916 | Koninklijke KPN N.V. | 333,852 | ||||||
| 44,446 | MTN Group Ltd. | 362,558 | ||||||
See accompanying notes to financial statements.
34
| INSPIRE GLOBAL HOPE ETF |
| SCHEDULE OF INVESTMENTS (Continued) |
| November 30, 2022 |
| Shares | Fair Value | |||||||
| COMMON STOCKS — 98.8% (Continued) | ||||||||
| TELECOMMUNICATIONS - 1.6% (Continued) | ||||||||
| 157,501 | Singapore Telecommunications Ltd. | $ | 314,824 | |||||
| 39,060 | Telefonica Brasil S.A. | 285,772 | ||||||
| 102,181 | Telia Company A.B. | 278,556 | ||||||
| 116,318 | Telstra Group Ltd. | 314,245 | ||||||
| 2,233,351 | ||||||||
| TIMBER REIT - 0.2% | ||||||||
| 10,238 | Weyerhaeuser Company | 334,885 | ||||||
| TRANSPORTATION & LOGISTICS - 3.1% | ||||||||
| 2,785 | Aena SME S.A.,(a) | 357,773 | ||||||
| 13,262 | Atlantia SpA | 316,834 | ||||||
| 11,001 | CSX Corporation | 359,623 | ||||||
| 2,532 | DSV A/S | 396,441 | ||||||
| 5,604 | East Japan Railway Company | 317,002 | ||||||
| 3,307 | Expeditors International of Washington, Inc. | 383,810 | ||||||
| 1,853 | JB Hunt Transport Services, Inc. | 340,748 | ||||||
| 1,419 | Kuehne + Nagel International A.G. | 342,791 | ||||||
| 1,173 | Old Dominion Freight Line, Inc. | 354,962 | ||||||
| 39,066 | Poste Italiane SpA | 382,031 | ||||||
| 4,994 | Ryanair Holdings plc - ADR(a) | 377,996 | ||||||
| 34,717 | Transurban Group | 336,754 | ||||||
| 4,266,765 | ||||||||
| TRANSPORTATION EQUIPMENT - 0.5% | ||||||||
| 3,486 | PACCAR, Inc. | 369,202 | ||||||
| 20,123 | Volvo A.B. | 382,967 | ||||||
| 752,169 | ||||||||
| WHOLESALE - CONSUMER STAPLES - 0.5% | ||||||||
| 3,554 | Bunge Ltd. | 372,602 | ||||||
| 11,795 | ITOCHU Corporation | 366,191 | ||||||
| 738,793 | ||||||||
| WHOLESALE - DISCRETIONARY - 0.7% | ||||||||
| 5,462 | Copart, Inc.(a) | 363,550 | ||||||
| 6,175 | LKQ Corporation | 335,488 | ||||||
See accompanying notes to financial statements.
35
| INSPIRE GLOBAL HOPE ETF |
| SCHEDULE OF INVESTMENTS (Continued) |
| November 30, 2022 |
| Shares | Fair Value | |||||||
| COMMON STOCKS — 98.8% (Continued) | ||||||||
| WHOLESALE - DISCRETIONARY - 0.7% (Continued) | ||||||||
| 914 | Pool Corporation | $ | 301,081 | |||||
| 1,000,119 | ||||||||
| TOTAL COMMON STOCKS (Cost $127,998,560) | 135,348,594 | |||||||
| COLLATERAL FOR SECURITIES LOANED — 0.7% | ||||||||
| MONEY MARKET FUND - 0.7% | ||||||||
| 944,652 | Fidelity Government Portfolio - Institutional Class, 3.60% (Cost $944,652)(c)(d) | 944,652 | ||||||
| TOTAL INVESTMENTS - 99.5% (Cost $128,943,212) | $ | 136,293,246 | ||||||
| OTHER ASSETS IN EXCESS OF LIABILITIES - 0.5% | 616,705 | |||||||
| NET ASSETS - 100.0% | $ | 136,909,951 | ||||||
| A.B. | - Aktiebolag |
| ADR | - American Depositary Receipt |
| A.G. | - Aktiengesellschaft |
| A/S | - Anonim Sirketi |
| LTD | - Limited Company |
| MSCI | - Morgan Stanley Capital International |
| N.V. | - Naamioze Vennootschap |
| OYJ | - Julkinen osakeyhtiö |
| PLC | - Public Limited Company |
| P.T. | - Perseroan Terbatas |
| REIT | - Real Estate Investment Trust |
| S.A. | - Société Anonyme |
| S.A.B. de C.V. | - Sociedad Anonima Bursátil de Capital Variable |
| S.E. | - Societas Europaea |
| SpA | - Società per azioni |
| (a) | - Non-income producing security. |
| (b) | - All or a portion of the security is on loan. The total fair value of the securities on loan as of November 30, 2022 was $883,352. |
| (c) | - Security was purchased with cash received as collateral for securities on loan at November 30, 2022. Total collateral had a value of $944,652 at November 30, 2022. |
| (d) | - Rate disclosed is the seven day effective yield as of November 30, 2022. |
See accompanying notes to financial statements.
36
| INSPIRE SMALL/MID CAP ETF |
| SCHEDULE OF INVESTMENTS |
| November 30, 2022 |
| Shares | Fair Value | |||||||
| COMMON STOCKS — 99.1% | ||||||||
| ADVERTISING & MARKETING - 0.2% | ||||||||
| 20,540 | QuinStreet, Inc.(a) | $ | 292,284 | |||||
| AEROSPACE & DEFENSE - 1.4% | ||||||||
| 6,018 | AAR Corporation(a) | 280,198 | ||||||
| 5,396 | Aerojet Rocketdyne Holdings, Inc.(a) | 280,592 | ||||||
| 2,587 | AeroVironment, Inc.(a) | 237,978 | ||||||
| 4,170 | Hexcel Corporation | 249,992 | ||||||
| 974 | Huntington Ingalls Industries, Inc. | 225,929 | ||||||
| 9,839 | Spirit AeroSystems Holdings, Inc., Class A | 257,880 | ||||||
| 2,686 | Woodward, Inc. | 257,319 | ||||||
| 1,789,888 | ||||||||
| APPAREL & TEXTILE PRODUCTS - 0.8% | ||||||||
| 30,967 | Hanesbrands, Inc. | 208,098 | ||||||
| 6,411 | Kontoor Brands, Inc. | 278,558 | ||||||
| 2,402 | Oxford Industries, Inc. | 271,090 | ||||||
| 6,799 | Skechers USA, Inc., Class A(a) | 286,714 | ||||||
| 1,044,460 | ||||||||
| ASSET MANAGEMENT - 0.6% | ||||||||
| 4,844 | B Riley Financial, Inc. | 212,748 | ||||||
| 3,444 | Cohen & Steers, Inc. | 228,165 | ||||||
| 4,155 | Stifel Financial Corporation | 266,959 | ||||||
| 707,872 | ||||||||
| AUTOMOTIVE - 1.8% | ||||||||
| 18,861 | Dana, Inc. | 332,142 | ||||||
| 2,626 | Dorman Products, Inc.(a) | 235,395 | ||||||
| 9,059 | Gentex Corporation | 261,805 | ||||||
| 4,337 | Gentherm, Inc.(a) | 310,486 | ||||||
| 21,374 | Goodyear Tire & Rubber Company (The)(a) | 239,816 | ||||||
| 1,802 | Lear Corporation | 259,920 | ||||||
| 6,636 | Standard Motor Products, Inc. | 254,889 | ||||||
| 2,032 | Visteon Corporation(a) | 298,298 | ||||||
| 2,192,751 | ||||||||
| BANKING - 10.1% | ||||||||
| 4,824 | Ameris Bancorp | 255,093 | ||||||
See accompanying notes to financial statements.
37
| INSPIRE SMALL/MID CAP ETF |
| SCHEDULE OF INVESTMENTS (Continued) |
| November 30, 2022 |
| Shares | Fair Value | |||||||
| COMMON STOCKS — 99.1% (Continued) | ||||||||
| BANKING - 10.1% (Continued) | ||||||||
| 2,411 | BancFirst Corporation | $ | 245,777 | |||||
| 6,308 | BankUnited, Inc. | 231,630 | ||||||
| 18,512 | Brookline Bancorp, Inc. | 263,241 | ||||||
| 10,645 | Byline Bancorp, Inc. | 242,600 | ||||||
| 2,432 | City Holding Company | 247,869 | ||||||
| 3,258 | Commerce Bancshares, Inc. | 244,089 | ||||||
| 3,591 | Community Bank System, Inc. | 233,918 | ||||||
| 7,316 | Customers Bancorp, Inc.(a) | 236,087 | ||||||
| 4,812 | Eagle Bancorp, Inc. | 226,934 | ||||||
| 3,212 | East West Bancorp, Inc. | 225,515 | ||||||
| 5,644 | FB Financial Corporation | 241,620 | ||||||
| 9,806 | First Busey Corporation | 255,642 | ||||||
| 16,797 | First Commonwealth Financial Corporation | 247,252 | ||||||
| 10,231 | First Financial Bancorp | 270,405 | ||||||
| 5,155 | First Financial Bankshares, Inc. | 190,477 | ||||||
| 9,426 | First Horizon Corporation | 234,236 | ||||||
| 5,345 | First Interstate BancSystem, Inc., Class A | 233,149 | ||||||
| 6,457 | Flagstar Bancorp, Inc. | 242,396 | ||||||
| 18,577 | FNB Corporation | 261,936 | ||||||
| 13,646 | Fulton Financial Corporation | 253,679 | ||||||
| 4,390 | Glacier Bancorp, Inc. | 254,181 | ||||||
| 8,679 | Hilltop Holdings, Inc. | 258,634 | ||||||
| 9,585 | Home BancShares, Inc. | 243,938 | ||||||
| 17,056 | Hope Bancorp, Inc. | 232,303 | ||||||
| 3,513 | Independent Bank Group, Inc. | 231,647 | ||||||
| 5,075 | International Bancshares Corporation | 267,351 | ||||||
| 13,439 | Lakeland Bancorp, Inc. | 251,041 | ||||||
| 5,683 | NBT Bancorp, Inc. | 262,327 | ||||||
| 25,283 | New York Community Bancorp, Inc.(b) | 236,396 | ||||||
| 15,929 | Northwest Bancshares, Inc. | 243,554 | ||||||
| 3,234 | Prosperity Bancshares, Inc. | 244,393 | ||||||
| 6,895 | Renasant Corporation | 281,110 | ||||||
| 7,358 | S&T Bancorp, Inc. | 275,337 | ||||||
| 6,117 | Sandy Spring Bancorp, Inc. | 212,994 | ||||||
See accompanying notes to financial statements.
38
| INSPIRE SMALL/MID CAP ETF |
| SCHEDULE OF INVESTMENTS (Continued) |
| November 30, 2022 |
| Shares | Fair Value | |||||||
| COMMON STOCKS — 99.1% (Continued) | ||||||||
| BANKING - 10.1% (Continued) | ||||||||
| 2,696 | ServisFirst Bancshares, Inc. | $ | 204,411 | |||||
| 6,099 | Southside Bancshares, Inc. | 221,638 | ||||||
| 5,742 | Synovus Financial Corporation | 241,910 | ||||||
| 3,654 | Texas Capital Bancshares, Inc.(a) | 219,203 | ||||||
| 16,590 | TFS Financial Corporation | 226,454 | ||||||
| 8,038 | Towne Bank | 259,627 | ||||||
| 2,559 | UMB Financial Corporation | 218,846 | ||||||
| 12,620 | Umpqua Holdings Corporation | 255,807 | ||||||
| 6,033 | United Bankshares, Inc. | 258,755 | ||||||
| 6,516 | United Community Banks, Inc. | 253,929 | ||||||
| 19,961 | Valley National Bancorp | 252,706 | ||||||
| 4,767 | Webster Financial Corporation | 259,039 | ||||||
| 6,463 | WesBanco, Inc. | 261,428 | ||||||
| 4,124 | Westamerica BanCorporation | 254,657 | ||||||
| 3,281 | Western Alliance Bancorp | 224,880 | ||||||
| 2,644 | Wintrust Financial Corporation | 241,741 | ||||||
| 4,238 | Zions Bancorp NA | 219,613 | ||||||
| 12,653,395 | ||||||||
| BEVERAGES - 0.2% | ||||||||
| 524 | Coca-Cola Consolidated, Inc. | 257,703 | ||||||
| BIOTECH & PHARMA - 4.0% | ||||||||
| 7,624 | Agios Pharmaceuticals, Inc.(a) | 229,787 | ||||||
| 20,658 | Amicus Therapeutics, Inc.(a) | 249,962 | ||||||
| 8,244 | Arcus Biosciences, Inc.(a) | 289,941 | ||||||
| 17,117 | BioCryst Pharmaceuticals, Inc.(a) | 228,683 | ||||||
| 716 | Biohaven Ltd.(a) | 11,327 | ||||||
| 22,454 | Coherus Biosciences, Inc.(a) | 154,034 | ||||||
| 4,451 | Cytokinetics, Inc.(a) | 189,168 | ||||||
| 11,658 | Deciphera Pharmaceuticals, Inc.(a) | 185,479 | ||||||
| 10,265 | Emergent BioSolutions, Inc.(a) | 126,260 | ||||||
| 4,161 | Enanta Pharmaceuticals, Inc.(a) | 182,210 | ||||||
| 13,746 | Exelixis, Inc.(a) | 234,782 | ||||||
| 5,452 | Halozyme Therapeutics, Inc.(a) | 312,181 | ||||||
See accompanying notes to financial statements.
39
| INSPIRE SMALL/MID CAP ETF |
| SCHEDULE OF INVESTMENTS (Continued) |
| November 30, 2022 |
| Shares | Fair Value | |||||||
| COMMON STOCKS — 99.1% (Continued) | ||||||||
| BIOTECH & PHARMA - 4.0% (Continued) | ||||||||
| 2,958 | Heska Corporation(a) | $ | 190,347 | |||||
| 4,635 | Intra-Cellular Therapies, Inc.(a) | 251,310 | ||||||
| 20,798 | Ironwood Pharmaceuticals, Inc.(a) | 251,864 | ||||||
| 3,086 | Mirati Therapeutics, Inc.(a) | 281,999 | ||||||
| 67,396 | Nektar Therapeutics(a) | 188,709 | ||||||
| 2,029 | Neurocrine Biosciences, Inc.(a) | 257,805 | ||||||
| 4,055 | Pacira BioSciences, Inc.(a) | 195,654 | ||||||
| 4,328 | Prestige Consumer Healthcare, Inc.(a) | 265,999 | ||||||
| 7,997 | Revance Therapeutics, Inc.(a) | 173,615 | ||||||
| 5,507 | Sage Therapeutics, Inc.(a) | 226,007 | ||||||
| 1,951 | Sarepta Therapeutics, Inc.(a) | 239,602 | ||||||
| 4,916,725 | ||||||||
| BUSINESS DEVELOPMENT COMPANIES - 0.4% | ||||||||
| 18,617 | Hercules Capital, Inc.(b) | 263,617 | ||||||
| 18,705 | New Mountain Finance Corporation | 238,863 | ||||||
| 502,480 | ||||||||
| CABLE & SATELLITE - 0.1% | ||||||||
| 253 | Cable One, Inc. | 183,245 | ||||||
| CHEMICALS - 3.8% | ||||||||
| 6,719 | AdvanSix, Inc. | 276,554 | ||||||
| 1,774 | Balchem Corporation | 249,779 | ||||||
| 3,376 | Cabot Corporation | 248,541 | ||||||
| 8,755 | Chemours Company (The) | 271,843 | ||||||
| 35,589 | Codexis, Inc.(a) | 194,672 | ||||||
| 3,591 | HB Fuller Company | 288,393 | ||||||
| 3,557 | Ingevity Corporation(a) | 278,406 | ||||||
| 2,518 | Innospec, Inc. | 279,221 | ||||||
| 2,696 | Materion Corporation | 217,190 | ||||||
| 4,365 | Minerals Technologies, Inc. | 263,166 | ||||||
| 716 | NewMarket Corporation | 226,270 | ||||||
| 5,031 | Olin Corporation | 286,666 | ||||||
| 1,494 | Quaker Houghton | 294,004 | ||||||
| 892 | Rogers Corporation(a) | 97,264 | ||||||
See accompanying notes to financial statements.
40
| INSPIRE SMALL/MID CAP ETF |
| SCHEDULE OF INVESTMENTS (Continued) |
| November 30, 2022 |
| Shares | Fair Value | |||||||
| COMMON STOCKS — 99.1% (Continued) | ||||||||
| CHEMICALS - 3.8% (Continued) | ||||||||
| 2,588 | RPM International, Inc. | $ | 268,169 | |||||
| 3,110 | Sensient Technologies Corporation | 232,348 | ||||||
| 11,965 | Trinseo plc | 294,936 | ||||||
| 8,508 | Valvoline, Inc. | 280,594 | ||||||
| 1,227 | WD-40 Company | 205,523 | ||||||
| 4,753,539 | ||||||||
| COMMERCIAL SUPPORT SERVICES - 2.5% | ||||||||
| 5,664 | ABM Industries, Inc. | 267,228 | ||||||
| 5,168 | Brady Corporation, Class A | 247,547 | ||||||
| 4,452 | Brink’s Company (The) | 266,007 | ||||||
| 5,047 | CBIZ, Inc.(a) | 250,584 | ||||||
| 1,558 | CorVel Corporation(a) | 238,327 | ||||||
| 5,989 | Forrester Research, Inc.(a) | 210,693 | ||||||
| 57,908 | Harsco Corporation(a) | 433,151 | ||||||
| 2,113 | Insperity, Inc. | 250,496 | ||||||
| 4,596 | Korn Ferry | 262,110 | ||||||
| 11,303 | TrueBlue, Inc.(a) | 243,919 | ||||||
| 1,282 | UniFirst Corporation | 248,400 | ||||||
| 6,829 | Viad Corporation(a) | 202,207 | ||||||
| 3,120,669 | ||||||||
| CONSTRUCTION MATERIALS - 1.0% | ||||||||
| 769 | Carlisle Companies, Inc. | 202,332 | ||||||
| 2,012 | Eagle Materials, Inc. | 274,316 | ||||||
| 7,885 | MDU Resources Group, Inc. | 248,299 | ||||||
| 2,759 | Simpson Manufacturing Company, Inc. | 256,725 | ||||||
| 8,998 | Summit Materials, Inc., Class A(a) | 272,549 | ||||||
| 1,254,221 | ||||||||
| CONSUMER SERVICES - 1.1% | ||||||||
| 2,622 | Grand Canyon Education, Inc.(a) | 296,470 | ||||||
| 9,624 | Matthews International Corporation, Class A | 304,695 | ||||||
| 1,990 | Medifast, Inc. | 250,840 | ||||||
| 12,548 | Rent-A-Center, Inc. | 302,281 | ||||||
| 3,738 | Service Corp International | 267,080 | ||||||
| 1,421,366 | ||||||||
See accompanying notes to financial statements.
41
| INSPIRE SMALL/MID CAP ETF |
| SCHEDULE OF INVESTMENTS (Continued) |
| November 30, 2022 |
| Shares | Fair Value | |||||||
| COMMON STOCKS — 99.1% (Continued) | ||||||||
| CONTAINERS & PACKAGING - 0.4% | ||||||||
| 2,271 | AptarGroup, Inc. | $ | 241,044 | |||||
| 5,131 | Silgan Holdings, Inc. | 271,430 | ||||||
| 512,474 | ||||||||
| ELECTRIC UTILITIES - 1.6% | ||||||||
| 4,309 | ALLETE, Inc. | 285,256 | ||||||
| 3,187 | Black Hills Corporation | 228,285 | ||||||
| 6,228 | Hawaiian Electric Industries, Inc. | 255,846 | ||||||
| 2,178 | IDACORP, Inc. | 240,734 | ||||||
| 3,283 | MGE Energy, Inc. | 236,409 | ||||||
| 5,915 | OGE Energy Corporation | 239,321 | ||||||
| 2,504 | Ormat Technologies, Inc. | 226,437 | ||||||
| 4,716 | PNM Resources, Inc. | 231,084 | ||||||
| 1,943,372 | ||||||||
| ELECTRICAL EQUIPMENT - 2.7% | ||||||||
| 3,996 | AAON, Inc. | 316,723 | ||||||
| 2,786 | Advanced Energy Industries, Inc. | 258,095 | ||||||
| 3,327 | Alarm.com Holdings, Inc.(a) | 166,017 | ||||||
| 2,770 | Atkore International Group, Inc.(a) | 338,356 | ||||||
| 2,334 | Badger Meter, Inc. | 270,324 | ||||||
| 3,593 | Belden, Inc. | 289,021 | ||||||
| 5,208 | Cognex Corporation | 259,254 | ||||||
| 7,860 | FARO Technologies, Inc.(a) | 235,171 | ||||||
| 5,122 | Itron, Inc.(a) | 272,388 | ||||||
| 5,715 | National Instruments Corporation | 234,429 | ||||||
| 2,993 | OSI Systems, Inc.(a) | 264,821 | ||||||
| 13,577 | SMART Global Holdings, Inc.(a) | 229,587 | ||||||
| 1,715 | Watts Water Technologies, Inc., Class A | 271,742 | ||||||
| 3,405,928 | ||||||||
| ENGINEERING & CONSTRUCTION - 1.9% | ||||||||
| 3,163 | AECOM | 268,855 | ||||||
| 2,216 | Comfort Systems USA, Inc. | 280,900 | ||||||
| 1,868 | EMCOR Group, Inc. | 289,353 | ||||||
| 2,460 | Exponent, Inc. | 254,389 | ||||||
| 2,666 | Installed Building Products, Inc. | 226,423 | ||||||
See accompanying notes to financial statements.
42
| INSPIRE SMALL/MID CAP ETF |
| SCHEDULE OF INVESTMENTS (Continued) |
| November 30, 2022 |
| Shares | Fair Value | |||||||
| COMMON STOCKS — 99.1% (Continued) | ||||||||
| ENGINEERING & CONSTRUCTION - 1.9% (Continued) | ||||||||
| 4,991 | KBR, Inc. | $ | 257,885 | |||||
| 3,392 | MasTec, Inc.(a) | 308,095 | ||||||
| 1,678 | Tetra Tech, Inc. | 259,402 | ||||||
| 1,309 | TopBuild Corporation(a) | 201,691 | ||||||
| 2,346,993 | ||||||||
| FOOD - 2.5% | ||||||||
| 3,881 | Cal-Maine Foods, Inc. | 226,185 | ||||||
| 3,263 | Darling Ingredients, Inc.(a) | 234,381 | ||||||
| 8,728 | Flowers Foods, Inc. | 262,276 | ||||||
| 9,280 | Fresh Del Monte Produce, Inc. | 256,870 | ||||||
| 12,784 | Hain Celestial Group, Inc. (The)(a) | 239,572 | ||||||
| 10,843 | Herbalife Nutrition Ltd.(a) | 189,969 | ||||||
| 2,703 | Ingredion, Inc. | 264,813 | ||||||
| 1,666 | J & J Snack Foods Corporation | 273,258 | ||||||
| 2,848 | John B Sanfilippo & Son, Inc. | 241,197 | ||||||
| 2,787 | Lamb Weston Holdings, Inc. | 242,190 | ||||||
| 1,435 | Lancaster Colony Corporation | 297,247 | ||||||
| 16,228 | Phibro Animal Health Corporation, Class A | 199,767 | ||||||
| 2,633 | Post Holdings, Inc.(a) | 246,475 | ||||||
| 3,174,200 | ||||||||
| FORESTRY, PAPER & WOOD PRODUCTS - 0.4% | ||||||||
| 4,213 | Louisiana-Pacific Corporation | 268,789 | ||||||
| 4,911 | Trex Company, Inc.(a) | 225,366 | ||||||
| 494,155 | ||||||||
| GAS & WATER UTILITIES - 1.8% | ||||||||
| 2,767 | American States Water Company | 271,138 | ||||||
| 2,117 | Atmos Energy Corporation | 254,463 | ||||||
| 1,869 | Chesapeake Utilities Corporation | 223,775 | ||||||
| 3,503 | National Fuel Gas Company | 232,004 | ||||||
| 5,567 | New Jersey Resources Corporation | 276,958 | ||||||
| 3,064 | ONE Gas, Inc. | 266,415 | ||||||
| 6,453 | South Jersey Industries, Inc. | 223,919 | ||||||
| 3,093 | Southwest Gas Holdings, Inc. | 211,747 | ||||||
See accompanying notes to financial statements.
43
| INSPIRE SMALL/MID CAP ETF |
| SCHEDULE OF INVESTMENTS (Continued) |
| November 30, 2022 |
| Shares | Fair Value | |||||||
| COMMON STOCKS — 99.1% (Continued) | ||||||||
| GAS & WATER UTILITIES - 1.8% (Continued) | ||||||||
| 3,460 | Spire, Inc. | $ | 256,386 | |||||
| 2,216,805 | ||||||||
| HEALTH CARE FACILITIES & SERVICES - 2.9% | ||||||||
| 2,759 | Acadia Healthcare Company, Inc.(a) | 245,717 | ||||||
| 2,264 | Addus HomeCare Corporation(a) | 249,674 | ||||||
| 2,228 | Amedisys, Inc.(a) | 202,949 | ||||||
| 494 | Chemed Corporation | 256,880 | ||||||
| 100,311 | Community Health Systems, Inc.(a) | 344,066 | ||||||
| 2,713 | Ensign Group, Inc. (The) | 257,735 | ||||||
| 3,213 | HealthEquity, Inc.(a) | 203,961 | ||||||
| 1,318 | LHC Group, Inc.(a) | 215,374 | ||||||
| 1,374 | Medpace Holdings, Inc.(a) | 288,389 | ||||||
| 3,405 | National HealthCare Corporation | 209,884 | ||||||
| 8,949 | Owens & Minor, Inc. | 184,439 | ||||||
| 6,360 | Premier, Inc., Class A | 212,106 | ||||||
| 9,751 | Select Medical Holdings Corporation | 239,680 | ||||||
| 9,217 | Surgery Partners, Inc.(a) | 260,933 | ||||||
| 4,178 | Tenet Healthcare Corporation(a) | 192,940 | ||||||
| 3,564,727 | ||||||||
| HEALTH CARE REIT – 0.9% | ||||||||
| 11,915 | CareTrust REIT, Inc. | 235,917 | ||||||
| 18,169 | Medical Properties Trust, Inc. | 238,377 | ||||||
| 7,311 | Omega Healthcare Investors, Inc. | 221,377 | ||||||
| 14,562 | Physicians Realty Trust | 217,411 | ||||||
| 16,426 | Sabra Health Care REIT, Inc. | 212,060 | ||||||
| 1,125,142 | ||||||||
| HOME & OFFICE PRODUCTS - 0.7% | ||||||||
| 8,130 | HNI Corporation | 235,770 | ||||||
| 15,511 | Newell Brands, Inc. | 201,178 | ||||||
| 8,928 | Tempur Sealy International, Inc. | 283,643 | ||||||
| 32,926 | Tupperware Brands Corporation(a) | 152,447 | ||||||
| 873,038 | ||||||||
| HOME CONSTRUCTION - 3.0% | ||||||||
| 4,917 | American Woodmark Corporation(a) | 266,501 | ||||||
See accompanying notes to financial statements.
44
| INSPIRE SMALL/MID CAP ETF |
| SCHEDULE OF INVESTMENTS (Continued) |
| November 30, 2022 |
| Shares | Fair Value | |||||||
| COMMON STOCKS — 99.1% (Continued) | ||||||||
| HOME CONSTRUCTION - 3.0% (Continued) | ||||||||
| 2,735 | Armstrong World Industries, Inc. | $ | 208,981 | |||||
| 4,020 | Fortune Brands Home & Security, Inc. | 262,667 | ||||||
| 7,306 | Griffon Corporation | 257,975 | ||||||
| 24,001 | Interface, Inc. | 259,931 | ||||||
| 8,318 | KB Home | 261,102 | ||||||
| 2,650 | LGI Homes, Inc.(a) | 263,251 | ||||||
| 5,961 | M/I Homes, Inc.(a) | 269,318 | ||||||
| 3,032 | Masonite International Corporation(a) | 228,219 | ||||||
| 3,069 | Meritage Homes Corporation(a) | 265,192 | ||||||
| 4,919 | Patrick Industries, Inc. | 275,120 | ||||||
| 10,294 | PGT Innovations, Inc.(a) | 203,718 | ||||||
| 9,245 | Taylor Morrison Home Corporation(a) | 280,955 | ||||||
| 5,135 | Toll Brothers, Inc. | 246,018 | ||||||
| 14,273 | Tri Pointe Homes, Inc.(a) | 263,194 | ||||||
| 3,812,142 | ||||||||
| HOTEL REIT - 0.8% | ||||||||
| 28,681 | DiamondRock Hospitality Company | 269,888 | ||||||
| 21,291 | RLJ Lodging Trust | 258,047 | ||||||
| 2,930 | Ryman Hospitality Properties, Inc. | 268,183 | ||||||
| 15,629 | Xenia Hotels & Resorts, Inc. | 240,999 | ||||||
| 1,037,117 | ||||||||
| HOUSEHOLD PRODUCTS - 1.0% | ||||||||
| 5,769 | Edgewell Personal Care Company | 249,278 | ||||||
| 8,579 | Energizer Holdings, Inc. | 292,458 | ||||||
| 2,243 | Helen of Troy Ltd.(a) | 221,025 | ||||||
| 2,857 | Inter Parfums, Inc. | 272,244 | ||||||
| 6,463 | Nu Skin Enterprises, Inc., Class A | 269,572 | ||||||
| 1,304,577 | ||||||||
| INDUSTRIAL INTERMEDIATE PROD - 0.7% | ||||||||
| 1,170 | Chart Industries, Inc.(a) | 167,298 | ||||||
| 5,928 | Proto Labs, Inc.(a) | 157,211 | ||||||
| 3,650 | Timken Company (The) | 277,327 | ||||||
| 803 | Valmont Industries, Inc. | 271,944 | ||||||
| 873,780 | ||||||||
See accompanying notes to financial statements.
45
| INSPIRE SMALL/MID CAP ETF |
| SCHEDULE OF INVESTMENTS (Continued) |
| November 30, 2022 |
| Shares | Fair Value | |||||||
| COMMON STOCKS — 99.1% (Continued) | ||||||||
| INDUSTRIAL REIT - 0.6% | ||||||||
| 1,494 | EastGroup Properties, Inc. | $ | 231,929 | |||||
| 4,810 | First Industrial Realty Trust, Inc. | 243,146 | ||||||
| 4,146 | Rexford Industrial Realty, Inc. | 229,232 | ||||||
| 704,307 | ||||||||
| INDUSTRIAL SUPPORT SERVICES - 0.8% | ||||||||
| 2,098 | Applied Industrial Technologies, Inc. | 277,965 | ||||||
| 8,029 | Textainer Group Holdings Ltd. | 244,724 | ||||||
| 838 | Watsco, Inc. | 225,405 | ||||||
| 1,808 | WESCO International, Inc.(a) | 233,087 | ||||||
| 981,181 | ||||||||
| INSTITUTIONAL FINANCIAL SERVICES - 0.5% | ||||||||
| 2,622 | Evercore, Inc., Class A | 302,002 | ||||||
| 4,396 | SEI Investments Company | 273,783 | ||||||
| 575,785 | ||||||||
| INSURANCE - 3.4% | ||||||||
| 1,754 | American Financial Group, Inc. | 249,454 | ||||||
| 4,615 | AMERISAFE, Inc. | 273,993 | ||||||
| 1,485 | Assurant, Inc. | 190,407 | ||||||
| 11,992 | CNO Financial Group, Inc. | 281,572 | ||||||
| 6,253 | Employers Holdings, Inc. | 290,577 | ||||||
| 61,619 | Genworth Financial, Inc., Class A(a) | 309,943 | ||||||
| 1,683 | Hanover Insurance Group, Inc. (The) | 247,906 | ||||||
| 6,115 | Horace Mann Educators Corporation | 235,978 | ||||||
| 5,232 | Kemper Corporation | 297,804 | ||||||
| 7,584 | Mercury General Corporation | 275,148 | ||||||
| 10,588 | NMI Holdings, Inc., Class A(a) | 227,960 | ||||||
| 1,746 | Primerica, Inc. | 260,206 | ||||||
| 11,043 | ProAssurance Corporation | 220,750 | ||||||
| 1,715 | Reinsurance Group of America, Inc. | 247,646 | ||||||
| 2,107 | RLI Corporation | 274,057 | ||||||
| 2,644 | Safety Insurance Group, Inc. | 242,561 | ||||||
| 3,634 | Trupanion, Inc.(a) | 189,949 | ||||||
| 4,315,911 | ||||||||
See accompanying notes to financial statements.
46
| INSPIRE SMALL/MID CAP ETF |
| SCHEDULE OF INVESTMENTS (Continued) |
| November 30, 2022 |
| Shares | Fair Value | |||||||
| COMMON STOCKS — 99.1% (Continued) | ||||||||
| INTERNET MEDIA & SERVICES - 0.3% | ||||||||
| 10,144 | HealthStream, Inc.(a) | $ | 257,658 | |||||
| 3,643 | TechTarget, Inc.(a) | 166,339 | ||||||
| 423,997 | ||||||||
| LEISURE FACILITIES & SERVICES - 2.2% | ||||||||
| 9,043 | BJ’s Restaurants, Inc.(a) | 290,099 | ||||||
| 7,366 | Cheesecake Factory, Inc. (The) | 258,105 | ||||||
| 17,809 | Cinemark Holdings, Inc.(a) | 242,380 | ||||||
| 2,918 | Jack in the Box, Inc. | 210,971 | ||||||
| 1,770 | Marriott Vacations Worldwide Corporation | 263,695 | ||||||
| 3,081 | Papa John’s International, Inc. | 256,524 | ||||||
| 4,744 | SeaWorld Entertainment, Inc.(a) | 270,693 | ||||||
| 4,790 | Shake Shack, Inc., Class A(a) | 251,954 | ||||||
| 6,739 | St Joe Company (The) | 258,980 | ||||||
| 2,471 | Texas Roadhouse, Inc. | 245,420 | ||||||
| 11,539 | Wendy’s Company (The) | 260,320 | ||||||
| 2,809,141 | ||||||||
| LEISURE PRODUCTS - 1.6% | ||||||||
| 3,295 | Brunswick Corporation | 244,489 | ||||||
| 2,727 | Fox Factory Holding Corporation(a) | 289,335 | ||||||
| 2,255 | Polaris, Inc. | 257,205 | ||||||
| 4,246 | Sturm Ruger & Company, Inc. | 233,233 | ||||||
| 3,082 | Thor Industries, Inc. | 265,483 | ||||||
| 11,181 | Topgolf Callaway Brands Corporation(a) | 234,242 | ||||||
| 8,871 | Vista Outdoor, Inc.(a) | 248,122 | ||||||
| 4,054 | Winnebago Industries, Inc. | 237,524 | ||||||
| 2,009,633 | ||||||||
| MACHINERY - 4.4% | ||||||||
| 2,244 | AGCO Corporation | 297,824 | ||||||
| 2,736 | Albany International Corporation, Class A | 277,348 | ||||||
| 2,464 | Crane Holdings Company | 261,036 | ||||||
| 1,551 | Curtiss-Wright Corporation | 273,984 | ||||||
| 4,401 | Donaldson Company, Inc. | 268,109 | ||||||
| 2,940 | ESCO Technologies, Inc. | 276,389 | ||||||
| 2,640 | Franklin Electric Company, Inc. | 219,912 | ||||||
See accompanying notes to financial statements.
47
| INSPIRE SMALL/MID CAP ETF |
| SCHEDULE OF INVESTMENTS (Continued) |
| November 30, 2022 |
| Shares | Fair Value | |||||||
| COMMON STOCKS — 99.1% (Continued) | ||||||||
| MACHINERY - 4.4% (Continued) | ||||||||
| 3,598 | Graco, Inc. | $ | 251,752 | |||||
| 5,873 | Hillenbrand, Inc. | 293,650 | ||||||
| 2,508 | John Bean Technologies Corporation | 230,385 | ||||||
| 1,293 | Kadant, Inc. | 249,601 | ||||||
| 10,480 | Kennametal, Inc. | 276,882 | ||||||
| 1,716 | Lincoln Electric Holdings, Inc. | 253,762 | ||||||
| 1,016 | Nordson Corporation | 240,274 | ||||||
| 3,066 | Oshkosh Corporation | 282,287 | ||||||
| 1,537 | Regal Rexnord Corporation | 201,516 | ||||||
| 2,641 | Standex International Corporation | 277,437 | ||||||
| 3,813 | Tennant Company | 242,240 | ||||||
| 7,250 | Terex Corporation | 332,848 | ||||||
| 2,502 | Toro Company (The) | 277,697 | ||||||
| 8,799 | Zurn Elkay Water Solutions Corporation | 213,024 | ||||||
| 5,497,957 | ||||||||
| MEDICAL EQUIPMENT & DEVICES - 1.9% | ||||||||
| 15,583 | Artivion, Inc.(a) | 199,307 | ||||||
| 6,640 | Exact Sciences Corporation(a) | 298,467 | ||||||
| 4,051 | Glaukos Corporation(a) | 188,655 | ||||||
| 3,620 | Globus Medical, Inc., Class A(a) | 267,482 | ||||||
| 2,913 | Haemonetics Corporation(a) | 248,508 | ||||||
| 1,433 | ICU Medical, Inc.(a) | 228,177 | ||||||
| 5,091 | Integra LifeSciences Holdings Corporation(a) | 279,699 | ||||||
| 11,306 | Myriad Genetics, Inc.(a) | 229,060 | ||||||
| 15,444 | Neogen Corporation(a) | 255,753 | ||||||
| 4,922 | NuVasive, Inc.(a) | 191,170 | ||||||
| 2,386,278 | ||||||||
| METALS & MINING - 1.0% | ||||||||
| 62,976 | Coeur Mining, Inc.(a) | 220,416 | ||||||
| 5,608 | Compass Minerals International, Inc. | 248,715 | ||||||
| 1,866 | Encore Wire Corporation | 272,641 | ||||||
| 54,738 | Hecla Mining Company | 298,322 | ||||||
| 2,299 | Royal Gold, Inc. | 258,247 | ||||||
| 1,298,341 | ||||||||
See accompanying notes to financial statements.
48
| INSPIRE SMALL/MID CAP ETF |
| SCHEDULE OF INVESTMENTS (Continued) |
| November 30, 2022 |
| Shares | Fair Value | |||||||
| COMMON STOCKS — 99.1% (Continued) | ||||||||
| MORTGAGE FINANCE - 0.5% | ||||||||
| 25,984 | Apollo Commercial Real Estate Finance, Inc. - REIT | $ | 321,162 | |||||
| 19,430 | Invesco Mortgage Capital, Inc.(b) - REIT | 255,116 | ||||||
| 576,278 | ||||||||
| MULTI ASSET CLASS REIT - 0.4% | ||||||||
| 12,289 | Elme Communities | 242,831 | ||||||
| 23,519 | LXP Industrial Trust | 253,064 | ||||||
| 495,895 | ||||||||
| OFFICE REIT - 1.0% | ||||||||
| 9,280 | Corporate Office Properties Trust | 257,706 | ||||||
| 8,003 | Highwoods Properties, Inc. | 238,489 | ||||||
| 5,122 | Kilroy Realty Corporation | 221,373 | ||||||
| 20,423 | Piedmont Office Realty Trust, Inc., Class A | 212,603 | ||||||
| 18,968 | Veris Residential, Inc.(a) | 304,626 | ||||||
| 1,234,797 | ||||||||
| OIL & GAS PRODUCERS - 0.8% | ||||||||
| 1,577 | Chord Energy Corporation | 240,540 | ||||||
| 5,757 | SM Energy Company | 248,184 | ||||||
| 35,312 | Southwestern Energy Company(a) | 244,359 | ||||||
| 9,211 | World Fuel Services Corporation | 262,053 | ||||||
| 995,136 | ||||||||
| OIL & GAS SERVICES & EQUIPMENT - 0.3% | ||||||||
| 27,094 | Oceaneering International, Inc.(a) | 411,558 | ||||||
| PUBLISHING & BROADCASTING - 0.9% | ||||||||
| 19,106 | EW Scripps Company (The), Class A(a) | 286,208 | ||||||
| 140,960 | Gannett Company, Inc.(a) | 352,401 | ||||||
| 7,011 | Scholastic Corporation | 288,292 | ||||||
| 3,113 | World Wrestling Entertainment, Inc., Class A | 248,666 | ||||||
| 1,175,567 | ||||||||
| RENEWABLE ENERGY - 0.6% | ||||||||
| 3,244 | Ameresco, Inc., Class A(a) | 212,547 | ||||||
| 3,708 | EnerSys | 280,251 | ||||||
| 7,431 | Green Plains, Inc.(a) | 256,815 | ||||||
| 749,613 | ||||||||
See accompanying notes to financial statements.
49
| INSPIRE SMALL/MID CAP ETF |
| SCHEDULE OF INVESTMENTS (Continued) |
| November 30, 2022 |
| Shares | Fair Value | |||||||
| COMMON STOCKS — 99.1% (Continued) | ||||||||
| RESIDENTIAL REIT - 0.2% | ||||||||
| 12,883 | Independence Realty Trust, Inc. | $ | 233,440 | |||||
| RETAIL - CONSUMER STAPLES - 1.3% | ||||||||
| 13,785 | Big Lots, Inc. | 268,807 | ||||||
| 1,064 | Casey’s General Stores, Inc. | 258,573 | ||||||
| 1,566 | Five Below, Inc.(a) | 251,907 | ||||||
| 4,179 | Ollie’s Bargain Outlet Holdings, Inc.(a) | 254,501 | ||||||
| 7,778 | Sprouts Farmers Market, Inc.(a) | 267,019 | ||||||
| 3,027 | Weis Markets, Inc. | 263,985 | ||||||
| 1,564,792 | ||||||||
| RETAIL - DISCRETIONARY - 3.1% | ||||||||
| 1,427 | Asbury Automotive Group, Inc.(a) | 267,734 | ||||||
| 1,452 | Avis Budget Group, Inc.(a) | 324,666 | ||||||
| 3,662 | Builders FirstSource, Inc.(a) | 234,112 | ||||||
| 1,928 | Burlington Stores, Inc.(a) | 377,270 | ||||||
| 791 | Dillard’s, Inc., Class A(b) | 284,523 | ||||||
| 27,233 | EVgo, Inc.(a) | 174,291 | ||||||
| 4,324 | Hibbett, Inc. | 288,238 | ||||||
| 1,005 | Lithia Motors, Inc. | 240,507 | ||||||
| 7,228 | MarineMax, Inc.(a) | 238,741 | ||||||
| 4,962 | Monro, Inc. | 225,622 | ||||||
| 6,602 | National Vision Holdings, Inc.(a) | 267,117 | ||||||
| 4,919 | Rush Enterprises, Inc., Class A | 253,476 | ||||||
| 17,104 | Sally Beauty Holdings, Inc.(a) | 201,143 | ||||||
| 6,379 | Sleep Number Corporation(a) | 186,586 | ||||||
| 4,972 | Sonic Automotive, Inc., Class A | 264,212 | ||||||
| 3,828,238 | ||||||||
| RETAIL REIT - 1.5% | ||||||||
| 17,063 | Acadia Realty Trust | 262,429 | ||||||
| 8,916 | Four Corners Property Trust, Inc. | 241,980 | ||||||
| 12,514 | Kite Realty Group Trust | 285,319 | ||||||
| 5,409 | National Retail Properties, Inc. | 250,761 | ||||||
| 15,668 | Retail Opportunity Investments Corporation | 238,937 | ||||||
| 5,751 | Saul Centers, Inc. | 247,868 | ||||||
See accompanying notes to financial statements.
50
| INSPIRE SMALL/MID CAP ETF |
| SCHEDULE OF INVESTMENTS (Continued) |
| November 30, 2022 |
| Shares | Fair Value | |||||||
| COMMON STOCKS — 99.1% (Continued) | ||||||||
| RETAIL REIT - 1.5% (Continued) | ||||||||
| 15,765 | Tanger Factory Outlet Centers, Inc. | $ | 306,630 | |||||
| 1,833,924 | ||||||||
| SEMICONDUCTORS - 4.1% | ||||||||
| 12,646 | Amkor Technology, Inc. | 354,341 | ||||||
| 3,573 | Axcelis Technologies, Inc.(a) | 285,340 | ||||||
| 5,032 | Azenta, Inc. | 302,977 | ||||||
| 8,222 | CEVA, Inc.(a) | 223,392 | ||||||
| 3,135 | Cirrus Logic, Inc.(a) | 234,216 | ||||||
| 8,389 | Cohu, Inc.(a) | 300,494 | ||||||
| 3,321 | Diodes, Inc.(a) | 306,296 | ||||||
| 8,603 | FormFactor, Inc.(a) | 198,471 | ||||||
| 2,556 | IPG Photonics Corporation(a) | 232,673 | ||||||
| 4,387 | Lattice Semiconductor Corporation(a) | 319,505 | ||||||
| 6,604 | MaxLinear, Inc., A(a) | 241,706 | ||||||
| 2,612 | MKS Instruments, Inc. | 219,042 | ||||||
| 3,356 | Power Integrations, Inc. | 270,091 | ||||||
| 7,333 | Semtech Corporation(a) | 225,416 | ||||||
| 1,749 | Silicon Laboratories, Inc.(a) | 254,375 | ||||||
| 2,177 | Synaptics, Inc.(a) | 230,697 | ||||||
| 2,286 | Universal Display Corporation | 257,449 | ||||||
| 11,772 | Veeco Instruments, Inc.(a) | 234,027 | ||||||
| 12,117 | Vishay Intertechnology, Inc. | 279,176 | ||||||
| 2,089 | Wolfspeed, Inc.(a) | 189,932 | ||||||
| 5,159,616 | ||||||||
| SOFTWARE - 3.9% | ||||||||
| 62,426 | 8x8, Inc.(a) | 267,183 | ||||||
| 10,312 | ACI Worldwide, Inc.(a) | 215,521 | ||||||
| 18,215 | Alignment Healthcare, Inc.(a) | 242,260 | ||||||
| 14,156 | Allscripts Healthcare Solutions, Inc.(a) | 268,115 | ||||||
| 3,862 | Alteryx, Inc., Class A(a) | 173,211 | ||||||
| 4,889 | Blackbaud, Inc.(a) | 289,770 | ||||||
| 3,525 | Calix, Inc.(a) | 251,333 | ||||||
| 4,068 | CommVault Systems, Inc.(a) | 268,488 | ||||||
| 6,244 | Digi International, Inc.(a) | 265,183 | ||||||
See accompanying notes to financial statements.
51
| INSPIRE SMALL/MID CAP ETF |
| SCHEDULE OF INVESTMENTS (Continued) |
| November 30, 2022 |
| Shares | Fair Value | |||||||
| COMMON STOCKS — 99.1% (Continued) | ||||||||
| SOFTWARE - 3.9% (Continued) | ||||||||
| 3,503 | Guidewire Software, Inc.(a) | $ | 207,763 | |||||
| 22,873 | LivePerson, Inc.(a) | 268,529 | ||||||
| 1,621 | Manhattan Associates, Inc.(a) | 204,149 | ||||||
| 1,016 | MicroStrategy, Inc., Class A(a),(b) | 201,259 | ||||||
| 3,766 | New Relic, Inc.(a) | 211,913 | ||||||
| 2,478 | Omnicell, Inc.(a) | 127,890 | ||||||
| 6,704 | Pegasystems, Inc. | 243,020 | ||||||
| 5,066 | Progress Software Corporation | 270,118 | ||||||
| 6,700 | Q2 Holdings, Inc.(a) | 182,240 | ||||||
| 1,547 | Qualys, Inc.(a) | 190,776 | ||||||
| 5,026 | Rapid7, Inc.(a) | 147,764 | ||||||
| 1,736 | SPS Commerce, Inc.(a) | 246,963 | ||||||
| 8,141 | Varonis Systems, Inc.(a) | 172,915 | ||||||
| 4,916,363 | ||||||||
| SPECIALTY FINANCE - 1.5% | ||||||||
| 4,742 | Encore Capital Group, Inc.(a) | 238,997 | ||||||
| 6,182 | Essent Group Ltd. | 247,836 | ||||||
| 4,678 | First American Financial Corporation | 255,653 | ||||||
| 9,043 | LendingTree, Inc.(a) | 216,580 | ||||||
| 16,823 | MGIC Investment Corporation | 230,980 | ||||||
| 2,723 | Nelnet, Inc., Class A | 268,324 | ||||||
| 2,576 | Walker & Dunlop, Inc. | 230,063 | ||||||
| 2,228 | World Acceptance Corporation(a) | 157,987 | ||||||
| 1,846,420 | ||||||||
| SPECIALTY REIT - 0.2% | ||||||||
| 2,615 | Lamar Advertising Company, Class A | 261,866 | ||||||
| STEEL - 1.2% | ||||||||
| 8,113 | ATI, Inc.(a) | 247,528 | ||||||
| 6,088 | Commercial Metals Company | 299,651 | ||||||
| 1,237 | Reliance Steel & Aluminum Company | 261,366 | ||||||
| 3,039 | Steel Dynamics, Inc. | 315,843 | ||||||
| 5,655 | Worthington Industries, Inc. | 320,865 | ||||||
| 1,445,253 | ||||||||
See accompanying notes to financial statements.
52
| INSPIRE SMALL/MID CAP ETF |
| SCHEDULE OF INVESTMENTS (Continued) |
| November 30, 2022 |
| Shares | Fair Value | |||||||
| COMMON STOCKS — 99.1% (Continued) | ||||||||
| TECHNOLOGY HARDWARE - 3.8% | ||||||||
| 11,020 | ADTRAN Holdings, Inc. | $ | 223,375 | |||||
| 2,339 | Arrow Electronics, Inc.(a) | 254,343 | ||||||
| 8,703 | Benchmark Electronics, Inc. | 251,256 | ||||||
| 16,536 | Extreme Networks, Inc.(a) | 346,760 | ||||||
| 1,490 | F5, Inc.(a) | 230,369 | ||||||
| 43,746 | GoPro, Inc., Class A(a) | 239,728 | ||||||
| 16,482 | Harmonic, Inc.(a) | 252,834 | ||||||
| 5,336 | InterDigital, Inc. | 267,707 | ||||||
| 3,740 | Jabil, Inc. | 269,991 | ||||||
| 17,694 | Knowles Corporation(a) | 276,026 | ||||||
| 3,146 | Lumentum Holdings, Inc.(a) | 172,841 | ||||||
| 11,339 | NCR Corporation(a) | 270,662 | ||||||
| 6,888 | NetScout Systems, Inc.(a) | 256,785 | ||||||
| 2,463 | Plexus Corporation(a) | 271,472 | ||||||
| 4,681 | Sanmina Corporation(a) | 309,367 | ||||||
| 3,916 | Super Micro Computer, Inc.(a) | 353,341 | ||||||
| 16,363 | TTM Technologies, Inc.(a) | 262,953 | ||||||
| 7,138 | ViaSat, Inc.(a) | 243,334 | ||||||
| 4,753,144 | ||||||||
| TECHNOLOGY SERVICES - 2.7% | ||||||||
| 826 | CACI International, Inc., Class A(a) | 257,960 | ||||||
| 4,078 | CSG Systems International, Inc. | 252,184 | ||||||
| 1,464 | ExlService Holdings, Inc.(a) | 274,061 | ||||||
| 523 | Fair Isaac Corporation(a) | 324,113 | ||||||
| 4,932 | Genpact Ltd. | 227,415 | ||||||
| 1,978 | ICF International, Inc. | 214,356 | ||||||
| 1,183 | Jack Henry & Associates, Inc. | 224,001 | ||||||
| 969 | MarketAxess Holdings, Inc. | 259,614 | ||||||
| 3,727 | MAXIMUS, Inc. | 262,008 | ||||||
| 3,316 | Perficient, Inc.(a) | 235,602 | ||||||
| 41,842 | Sabre Corporation(a) | 255,655 | ||||||
| 2,439 | Science Applications International Corporation | 268,558 | ||||||
| 1,699 | WEX, Inc.(a) | 287,368 | ||||||
| 3,342,895 | ||||||||
See accompanying notes to financial statements.
53
| INSPIRE SMALL/MID CAP ETF |
| SCHEDULE OF INVESTMENTS (Continued) |
| November 30, 2022 |
| Shares | Fair Value | |||||||
| COMMON STOCKS — 99.1% (Continued) | ||||||||
| TELECOMMUNICATIONS - 1.3% | ||||||||
| 51,843 | Consolidated Communications Holdings, Inc.(a) | $ | 239,515 | |||||
| 13,087 | EchoStar Corporation, Class A(a) | 227,714 | ||||||
| 135,640 | Globalstar, Inc.(a) | 257,716 | ||||||
| 4,861 | Iridium Communications, Inc.(a) | 258,118 | ||||||
| 12,679 | Shenandoah Telecommunications Company | 246,860 | ||||||
| 6,402 | Switch, Inc., Class A | 219,269 | ||||||
| 15,516 | Telephone and Data Systems, Inc. | 163,539 | ||||||
| 1,612,731 | ||||||||
| TIMBER REIT - 0.2% | ||||||||
| 7,196 | Rayonier, Inc. | 258,192 | ||||||
| TRANSPORTATION & LOGISTICS - 2.4% | ||||||||
| 8,953 | Air Transport Services Group, Inc.(a) | 251,042 | ||||||
| 2,955 | Allegiant Travel Company(a) | 244,113 | ||||||
| 8,850 | CryoPort, Inc.(a) | 174,788 | ||||||
| 2,389 | Forward Air Corporation | 268,452 | ||||||
| 15,081 | Heartland Express, Inc. | 252,456 | ||||||
| 3,127 | Hub Group, Inc., Class A(a) | 263,137 | ||||||
| 4,408 | Knight-Swift Transportation Holdings, Inc. | 244,335 | ||||||
| 1,494 | Landstar System, Inc. | 258,432 | ||||||
| 3,505 | Matson, Inc. | 223,479 | ||||||
| 2,857 | Ryder System, Inc. | 267,101 | ||||||
| 1,135 | Saia, Inc.(a) | 276,474 | ||||||
| 5,736 | Werner Enterprises, Inc. | 252,269 | ||||||
| 2,976,078 | ||||||||
| TRANSPORTATION EQUIPMENT - 0.2% | ||||||||
| 6,383 | Allison Transmission Holdings, Inc. | 285,958 | ||||||
| WHOLESALE - CONSUMER STAPLES - 0.2% | ||||||||
| 6,950 | Andersons, Inc. (The) | 267,575 | ||||||
| WHOLESALE - DISCRETIONARY - 0.9% | ||||||||
| 5,192 | ePlus, Inc.(a) | 257,835 | ||||||
| 19,323 | KAR Auction Services, Inc.(a) | 265,498 | ||||||
See accompanying notes to financial statements.
54
| INSPIRE SMALL/MID CAP ETF |
| SCHEDULE OF INVESTMENTS (Continued) |
| November 30, 2022 |
| Shares | Fair Value | |||||||
| COMMON STOCKS — 99.1% (Continued) | ||||||||
| WHOLESALE - DISCRETIONARY - 0.9% (Continued) | ||||||||
| 8,166 | ScanSource, Inc.(a) | $ | 243,837 | |||||
| 2,206 | Veritiv Corporation | 296,795 | ||||||
| 1,063,965 | ||||||||
| TOTAL COMMON STOCKS (Cost $122,472,333) | 124,066,873 | |||||||
| COLLATERAL FOR SECURITIES LOANED — 0.8% | ||||||||
| MONEY MARKET FUND - 0.8% | ||||||||
| 955,613 | Fidelity Government Portfolio - Institutional Class, 3.60% (Cost $955,613)(c)(d) | 955,613 | ||||||
| TOTAL INVESTMENTS - 99.9% (Cost $123,427,946) | $ | 125,022,486 | ||||||
| OTHER ASSETS IN EXCESS OF LIABILITIES - 0.1% | 90,288 | |||||||
| NET ASSETS - 100.0% | $ | 125,112,774 | ||||||
| (a) | Non-income producing security. |
| (b) | All or a portion of the security is on loan. The total fair value of the securities on loan as of November 30, 2022 was $933,413. |
| (c) | Security was purchased with cash received as collateral for securities on loan at November 30, 2022. Total collateral had a value of $955,613 at November 30, 2022. |
| (d) | Rate disclosed is the seven day effective yield as of November 30, 2022. |
See accompanying notes to financial statements.
55
| INSPIRE CORPORATE BOND ETF |
| SCHEDULE OF INVESTMENTS |
| November 30, 2022 |
| Principal | Coupon Rate | |||||||||||
| Amount ($) | (%) | Maturity | Fair Value | |||||||||
| CORPORATE BONDS — 98.8% | ||||||||||||
| AEROSPACE & DEFENSE — 1.5% | ||||||||||||
| 800,000 | Teledyne Technologies, Inc. | 0.9500 | 04/01/24 | $ | 755,353 | |||||||
| 800,000 | Teledyne Technologies, Inc. | 1.6000 | 04/01/26 | 711,547 | ||||||||
| 1,500,000 | Teledyne Technologies, Inc. | 2.2500 | 04/01/28 | 1,291,964 | ||||||||
| 800,000 | Textron, Inc. | 3.0000 | 06/01/30 | 681,797 | ||||||||
| 3,440,661 | ||||||||||||
| ASSET MANAGEMENT — 0.4% | ||||||||||||
| 1,000,000 | Charles Schwab Corporation (The) | 0.9000 | 03/11/26 | 890,546 | ||||||||
| BANKING — 2.1% | ||||||||||||
| 1,000,000 | CIT Group, Inc. | 6.1250 | 03/09/28 | 1,025,425 | ||||||||
| 800,000 | M&T Bank Corporation | 3.5500 | 07/26/23 | 792,096 | ||||||||
| 350,000 | Regions Financial Corporation | 1.8000 | 08/12/28 | 297,515 | ||||||||
| 1,500,000 | SVB Financial Group | 2.1000 | 05/15/28 | 1,230,352 | ||||||||
| 800,000 | SVB Financial Group | 3.1250 | 06/05/30 | 653,566 | ||||||||
| 1,000,000 | SVB Financial Group | 1.8000 | 02/02/31 | 718,669 | ||||||||
| 4,717,623 | ||||||||||||
| BIOTECH & PHARMA — 0.4% | ||||||||||||
| 1,000,000 | Royalty Pharma plc | 1.2000 | 09/02/25 | 895,440 | ||||||||
| CHEMICALS — 1.8% | ||||||||||||
| 1,000,000 | LYB International Finance III, LLC | 1.2500 | 10/01/25 | 890,038 | ||||||||
| 1,000,000 | Mosaic Company (The) | 4.0500 | 11/15/27 | 953,188 | ||||||||
| 800,000 | PPG Industries, Inc. | 1.2000 | 03/15/26 | 709,728 | ||||||||
| 1,500,000 | PPG Industries, Inc. | 3.7500 | 03/15/28 | 1,407,498 | ||||||||
| 3,960,452 | ||||||||||||
| COMMERCIAL SUPPORT SERVICES — 6.3% | ||||||||||||
| 1,000,000 | Cintas Corp No 2 | 3.4500 | 05/01/25 | 970,948 | ||||||||
| 902,000 | Cintas Corp No 2 | 3.7000 | 04/01/27 | 872,632 | ||||||||
| 1,000,000 | Cintas Corp No 2 | 4.0000 | 05/01/32 | 944,667 | ||||||||
| 1,500,000 | Republic Services, Inc. | 2.5000 | 08/15/24 | 1,437,984 | ||||||||
| 338,000 | Republic Services, Inc. | 3.2000 | 03/15/25 | 324,611 | ||||||||
| 1,000,000 | Republic Services, Inc. B | 3.3750 | 11/15/27 | 938,557 | ||||||||
| 1,500,000 | Republic Services, Inc. | 3.9500 | 05/15/28 | 1,434,977 | ||||||||
| 950,000 | Republic Services, Inc. | 2.3000 | 03/01/30 | 803,077 | ||||||||
See accompanying notes to financial statements.
56
| INSPIRE CORPORATE BOND ETF |
| SCHEDULE OF INVESTMENTS (Continued) |
| November 30, 2022 |
| Principal | Coupon Rate | |||||||||||
| Amount ($) | (%) | Maturity | Fair Value | |||||||||
| CORPORATE BONDS — 98.8% (Continued) | ||||||||||||
| COMMERCIAL SUPPORT SERVICES — 6.3% (Continued) | ||||||||||||
| 1,000,000 | Republic Services, Inc. | 1.4500 | 02/15/31 | $ | 773,516 | |||||||
| 1,000,000 | Republic Services, Inc. | 1.7500 | 02/15/32 | 775,978 | ||||||||
| 1,700,000 | Waste Connections, Inc. | 4.2500 | 12/01/28 | 1,638,573 | ||||||||
| 800,000 | Waste Management, Inc. | 2.4000 | 05/15/23 | 790,950 | ||||||||
| 800,000 | Waste Management, Inc. Series 19-SFR4 A | 3.1250 | 03/01/25 | 772,796 | ||||||||
| 1,000,000 | Waste Management, Inc. | 0.7500 | 11/15/25 | 894,524 | ||||||||
| 800,000 | Waste Management, Inc. | 3.1500 | 11/15/27 | 747,811 | ||||||||
| 14,121,601 | ||||||||||||
| CONSTRUCTION MATERIALS — 1.6% | ||||||||||||
| 1,000,000 | Carlisle Companies, Inc. | 3.7500 | 12/01/27 | 936,594 | ||||||||
| 1,000,000 | Carlisle Companies, Inc. | 2.7500 | 03/01/30 | 835,016 | ||||||||
| 1,000,000 | Carlisle Companies, Inc. | 2.2000 | 03/01/32 | 765,275 | ||||||||
| 800,000 | Martin Marietta Materials, Inc. | 0.6500 | 07/15/23 | 777,427 | ||||||||
| 338,000 | Vulcan Materials Company | 3.9000 | 04/01/27 | 322,464 | ||||||||
| 3,636,776 | ||||||||||||
| CONTAINERS & PACKAGING — 1.3% | ||||||||||||
| 1,000,000 | Amcor Finance USA, Inc. | 3.6250 | 04/28/26 | 946,881 | ||||||||
| 400,000 | Amcor Finance USA, Inc. | 4.5000 | 05/15/28 | 372,524 | ||||||||
| 1,000,000 | Amcor Flexibles North America, Inc. | 2.6900 | 05/25/31 | 805,552 | ||||||||
| 800,000 | Bemis Company, Inc. | 2.6300 | 06/19/30 | 650,862 | ||||||||
| 2,775,819 | ||||||||||||
| DIVERSIFIED INDUSTRIALS — 2.3% | ||||||||||||
| 800,000 | Dover Corporation | 3.1500 | 11/15/25 | 764,854 | ||||||||
| 800,000 | Illinois Tool Works, Inc. | 3.5000 | 03/01/24 | 789,540 | ||||||||
| 1,000,000 | Illinois Tool Works, Inc. | 2.6500 | 11/15/26 | 933,151 | ||||||||
| 800,000 | Parker-Hannifin Corporation | 3.2500 | 03/01/27 | 748,684 | ||||||||
| 1,000,000 | Parker-Hannifin Corporation | 4.2500 | 09/15/27 | 969,173 | ||||||||
| 1,000,000 | Parker-Hannifin Corporation | 4.5000 | 09/15/29 | 969,787 | ||||||||
| 5,175,189 | ||||||||||||
| ELECTRIC UTILITIES — 6.5% | ||||||||||||
| 1,000,000 | AES Corporation (The) | 1.3750 | 01/15/26 | 887,784 | ||||||||
| 1,000,000 | Alliant Energy Finance, LLC(a) | 3.7500 | 06/15/23 | 991,966 | ||||||||
| 1,000,000 | Avangrid, Inc. | 3.1500 | 12/01/24 | 958,696 | ||||||||
| 1,260,000 | Avangrid, Inc. | 3.8000 | 06/01/29 | 1,150,963 | ||||||||
See accompanying notes to financial statements.
57
| INSPIRE CORPORATE BOND ETF |
| SCHEDULE OF INVESTMENTS (Continued) |
| November 30, 2022 |
| Principal | Coupon Rate | |||||||||||
| Amount ($) | (%) | Maturity | Fair Value | |||||||||
| CORPORATE BONDS — 98.8% (Continued) | ||||||||||||
| ELECTRIC UTILITIES — 6.5% (Continued) | ||||||||||||
| 800,000 | CenterPoint Energy, Inc. | 1.4500 | 06/01/26 | $ | 712,291 | |||||||
| 1,000,000 | CenterPoint Energy, Inc. | 4.2500 | 11/01/28 | 942,309 | ||||||||
| 1,000,000 | CenterPoint Energy, Inc. | 2.9500 | 03/01/30 | 862,491 | ||||||||
| 400,000 | CenterPoint Energy, Inc. | 2.6500 | 06/01/31 | 329,664 | ||||||||
| 1,000,000 | Emera US Finance, L.P. | 3.5500 | 06/15/26 | 937,304 | ||||||||
| 1,000,000 | Entergy Arkansas, LLC | 3.5000 | 04/01/26 | 965,261 | ||||||||
| 800,000 | Entergy Corporation | 0.9000 | 09/15/25 | 712,967 | ||||||||
| 800,000 | Entergy Corporation | 1.9000 | 06/15/28 | 677,396 | ||||||||
| 800,000 | Evergy, Inc. | 2.4500 | 09/15/24 | 758,789 | ||||||||
| 1,500,000 | Evergy, Inc. | 2.9000 | 09/15/29 | 1,292,552 | ||||||||
| 800,000 | WEC Energy Group, Inc. | 0.5500 | 09/15/23 | 771,782 | ||||||||
| 1,700,000 | WEC Energy Group, Inc. | 1.3750 | 10/15/27 | 1,442,250 | ||||||||
| 14,394,465 | ||||||||||||
| ELECTRICAL EQUIPMENT — 4.2% | ||||||||||||
| 1,000,000 | Amphenol Corporation | 2.0500 | 03/01/25 | 941,740 | ||||||||
| 1,417,000 | Amphenol Corporation | 4.3500 | 06/01/29 | 1,366,928 | ||||||||
| 1,000,000 | Amphenol Corporation | 2.8000 | 02/15/30 | 862,046 | ||||||||
| 1,000,000 | Amphenol Corporation | 2.2000 | 09/15/31 | 800,723 | ||||||||
| 800,000 | Keysight Technologies, Inc. | 4.5500 | 10/30/24 | 789,301 | ||||||||
| 800,000 | Keysight Technologies, Inc. | 4.6000 | 04/06/27 | 776,908 | ||||||||
| 800,000 | Keysight Technologies, Inc. | 3.0000 | 10/30/29 | 695,457 | ||||||||
| 800,000 | Roper Technologies, Inc. | 3.6500 | 09/15/23 | 790,523 | ||||||||
| 800,000 | Trimble, Inc. | 4.7500 | 12/01/24 | 792,720 | ||||||||
| 1,500,000 | Trimble, Inc. | 4.9000 | 06/15/28 | 1,452,353 | ||||||||
| 9,268,699 | ||||||||||||
| ENGINEERING & CONSTRUCTION — 0.6% | ||||||||||||
| 800,000 | Quanta Services, Inc. B | 2.9000 | 10/01/30 | 663,496 | ||||||||
| 1,000,000 | Quanta Services, Inc. | 2.3500 | 01/15/32 | 767,837 | ||||||||
| 1,431,333 | ||||||||||||
| FOOD — 2.9% | ||||||||||||
| 1,000,000 | Campbell Soup Company | 4.1500 | 03/15/28 | 965,859 | ||||||||
| 800,000 | Conagra Brands, Inc. | 0.5000 | 08/11/23 | 774,370 | ||||||||
| 800,000 | Conagra Brands, Inc. | 4.6000 | 11/01/25 | 790,159 | ||||||||
| 1,500,000 | Conagra Brands, Inc. | 1.3750 | 11/01/27 | 1,246,842 | ||||||||
See accompanying notes to financial statements.
58
| INSPIRE CORPORATE BOND ETF |
| SCHEDULE OF INVESTMENTS (Continued) |
| November 30, 2022 |
| Principal | Coupon Rate | |||||||||||
| Amount ($) | (%) | Maturity | Fair Value | |||||||||
| CORPORATE BONDS — 98.8% (Continued) | ||||||||||||
| FOOD — 2.9% (Continued) | ||||||||||||
| 706,000 | Conagra Brands, Inc. | 4.8500 | 11/01/28 | $ | 689,010 | |||||||
| 800,000 | Hormel Foods Corporation | 0.6500 | 06/03/24 | 752,339 | ||||||||
| 800,000 | Hormel Foods Corporation | 1.7000 | 06/03/28 | 692,487 | ||||||||
| 800,000 | Hormel Foods Corporation | 1.8000 | 06/11/30 | 652,238 | ||||||||
| 6,563,304 | ||||||||||||
| GAS & WATER UTILITIES — 0.7% | ||||||||||||
| 1,000,000 | Atmos Energy Corporation | 1.5000 | 01/15/31 | 777,092 | ||||||||
| 1,000,000 | CenterPoint Energy Resources Corporation | 1.7500 | 10/01/30 | 796,372 | ||||||||
| 1,573,464 | ||||||||||||
| HEALTH CARE FACILITIES & SERVICES — 0.4% | ||||||||||||
| 1,000,000 | Anthem, Inc. | 1.5000 | 03/15/26 | 899,563 | ||||||||
| HOME CONSTRUCTION — 2.7% | ||||||||||||
| 800,000 | DR Horton, Inc. | 5.7500 | 08/15/23 | 801,999 | ||||||||
| 800,000 | DR Horton, Inc. | 2.5000 | 10/15/24 | 762,642 | ||||||||
| 1,000,000 | DR Horton, Inc. | 2.6000 | 10/15/25 | 932,659 | ||||||||
| 1,500,000 | DR Horton, Inc. | 1.3000 | 10/15/26 | 1,287,190 | ||||||||
| 1,500,000 | Lennar Corporation | 4.8750 | 12/15/23 | 1,491,813 | ||||||||
| 800,000 | Lennar Corporation | 5.8750 | 11/15/24 | 804,101 | ||||||||
| 6,080,404 | ||||||||||||
| HOUSEHOLD PRODUCTS — 0.3% | ||||||||||||
| 800,000 | Church & Dwight Company, Inc. | 3.1500 | 08/01/27 | 751,006 | ||||||||
| INSTITUTIONAL FINANCIAL SERVICES — 0.8% | ||||||||||||
| 1,802,000 | Cboe Global Markets, Inc. | 3.6500 | 01/12/27 | 1,720,732 | ||||||||
| INSURANCE — 1.2% | ||||||||||||
| 1,000,000 | Arch Capital Finance, LLC | 4.0110 | 12/15/26 | 960,526 | ||||||||
| 800,000 | Brown & Brown, Inc. | 4.2000 | 09/15/24 | 787,590 | ||||||||
| 1,000,000 | Loews Corporation | 3.7500 | 04/01/26 | 971,450 | ||||||||
| 2,719,566 | ||||||||||||
| INTERNET MEDIA & SERVICES — 1.5% | ||||||||||||
| 800,000 | Booking Holdings, Inc. | 3.6500 | 03/15/25 | 784,781 | ||||||||
| 1,000,000 | Booking Holdings, Inc. | 3.6000 | 06/01/26 | 964,928 | ||||||||
See accompanying notes to financial statements.
59
| INSPIRE CORPORATE BOND ETF |
| SCHEDULE OF INVESTMENTS (Continued) |
| November 30, 2022 |
| Principal | Coupon Rate | |||||||||||
| Amount ($) | (%) | Maturity | Fair Value | |||||||||
| CORPORATE BONDS — 98.8% (Continued) | ||||||||||||
| INTERNET MEDIA & SERVICES — 1.5% (Continued) | ||||||||||||
| 800,000 | Booking Holdings, Inc. | 3.5500 | 03/15/28 | $ | 750,104 | |||||||
| 920,000 | Booking Holdings, Inc. | 4.6250 | 04/13/30 | 895,045 | ||||||||
| 3,394,858 | ||||||||||||
| MACHINERY — 2.7% | ||||||||||||
| 1,000,000 | Caterpillar Financial Services Corporation | 0.8000 | 11/13/25 | 898,760 | ||||||||
| 1,000,000 | Caterpillar Financial Services Corporation | 0.9000 | 03/02/26 | 896,615 | ||||||||
| 1,500,000 | Caterpillar, Inc. | 2.6000 | 09/19/29 | 1,336,766 | ||||||||
| 1,000,000 | CNH Industrial Capital, LLC | 1.8750 | 01/15/26 | 905,146 | ||||||||
| 812,000 | Parker-Hannifin Corporation | 3.3000 | 11/21/24 | 785,308 | ||||||||
| 1,313,000 | Parker-Hannifin Corporation | 3.2500 | 06/14/29 | 1,183,372 | ||||||||
| 6,005,967 | ||||||||||||
| MEDICAL EQUIPMENT & DEVICES — 2.8% | ||||||||||||
| 1,500,000 | Edwards Lifesciences Corporation | 4.3000 | 06/15/28 | 1,446,834 | ||||||||
| 800,000 | Stryker Corporation | 0.6000 | 12/01/23 | 764,440 | ||||||||
| 1,000,000 | Stryker Corporation | 3.3750 | 11/01/25 | 966,152 | ||||||||
| 1,000,000 | Stryker Corporation | 3.5000 | 03/15/26 | 968,943 | ||||||||
| 800,000 | Stryker Corporation | 3.6500 | 03/07/28 | 762,948 | ||||||||
| 1,500,000 | Stryker Corporation | 1.9500 | 06/15/30 | 1,231,633 | ||||||||
| 6,140,950 | ||||||||||||
| OIL & GAS PRODUCERS — 11.0% | ||||||||||||
| 1,000,000 | Continental Resources, Inc. | 4.3750 | 01/15/28 | 919,112 | ||||||||
| 1,000,000 | Devon Energy Corporation | 5.8500 | 12/15/25 | 1,022,278 | ||||||||
| 1,000,000 | Devon Energy Corporation | 4.5000 | 01/15/30 | 936,590 | ||||||||
| 400,000 | Devon Energy Corporation | 7.8750 | 09/30/31 | 455,471 | ||||||||
| 1,500,000 | Diamondback Energy, Inc. | 3.1250 | 03/24/31 | 1,259,017 | ||||||||
| 800,000 | EOG Resources, Inc. | 3.1500 | 04/01/25 | 773,745 | ||||||||
| 1,000,000 | EOG Resources, Inc. | 4.1500 | 01/15/26 | 985,862 | ||||||||
| 1,000,000 | EQT Corporation | 3.9000 | 10/01/27 | 925,502 | ||||||||
| 1,000,000 | EQT Corporation | 5.7000 | 04/01/28 | 1,000,240 | ||||||||
| 800,000 | Kinder Morgan Energy Partners, L.P. | 3.5000 | 09/01/23 | 789,439 | ||||||||
| 800,000 | Kinder Morgan, Inc. | 4.3000 | 06/01/25 | 787,932 | ||||||||
| 920,000 | Kinder Morgan, Inc. | 4.3000 | 03/01/28 | 886,550 | ||||||||
| 800,000 | Kinder Morgan, Inc. | 7.8000 | 08/01/31 | 900,769 | ||||||||
| 1,000,000 | Newfield Exploration Company | 5.3750 | 01/01/26 | 994,238 | ||||||||
See accompanying notes to financial statements.
60
| INSPIRE CORPORATE BOND ETF |
| SCHEDULE OF INVESTMENTS (Continued) |
| November 30, 2022 |
| Principal | Coupon Rate | |||||||||||
| Amount ($) | (%) | Maturity | Fair Value | |||||||||
| CORPORATE BONDS — 98.8% (Continued) | ||||||||||||
| OIL & GAS PRODUCERS — 11.0% (Continued) | ||||||||||||
| 812,000 | ONEOK Partners, L.P. | 4.9000 | 03/15/25 | $ | 801,572 | |||||||
| 800,000 | ONEOK, Inc. | 7.5000 | 09/01/23 | 808,683 | ||||||||
| 1,000,000 | ONEOK, Inc. | 5.8500 | 01/15/26 | 1,013,497 | ||||||||
| 800,000 | ONEOK, Inc. | 4.0000 | 07/13/27 | 749,686 | ||||||||
| 1,000,000 | Targa Resources Partners, L.P. / Targa Resources | 5.0000 | 01/15/28 | 948,485 | ||||||||
| 1,000,000 | Tennessee Gas Pipeline Company, LLC | 7.0000 | 10/15/28 | 1,070,775 | ||||||||
| 1,000,000 | Transcontinental Gas Pipe Line Company, LLC | 7.8500 | 02/01/26 | 1,074,817 | ||||||||
| 902,000 | Valero Energy Corporation | 3.4000 | 09/15/26 | 854,397 | ||||||||
| 1,000,000 | Valero Energy Corporation | 4.3500 | 06/01/28 | 974,136 | ||||||||
| 1,437,000 | Williams Companies, Inc. | 3.9000 | 01/15/25 | 1,403,197 | ||||||||
| 1,500,000 | Williams Companies, Inc. (The) | 4.5000 | 11/15/23 | 1,488,438 | ||||||||
| 800,000 | Williams Companies, Inc. (The) | 3.7500 | 06/15/27 | 756,035 | ||||||||
| 24,580,463 | ||||||||||||
| OIL & GAS SERVICES & EQUIPMENT — 3.4% | ||||||||||||
| 1,858,000 | Halliburton Company | 3.8000 | 11/15/25 | 1,817,228 | ||||||||
| 1,000,000 | Schlumberger Holdings Corporation(a) | 4.0000 | 12/21/25 | 972,577 | ||||||||
| 1,000,000 | Schlumberger Holdings Corporation | 4.0000 | 12/21/25 | 972,577 | ||||||||
| 1,000,000 | Schlumberger Holdings Corporation(a) | 3.9000 | 05/17/28 | 943,479 | ||||||||
| 1,000,000 | Schlumberger Holdings Corporation | 3.9000 | 05/17/28 | 943,479 | ||||||||
| 1,000,000 | Schlumberger Holdings Corporation(a) | 4.3000 | 05/01/29 | 948,762 | ||||||||
| 1,000,000 | Schlumberger Holdings Corporation | 4.3000 | 05/01/29 | 948,762 | ||||||||
| 7,546,864 | ||||||||||||
| REAL ESTATE INVESTMENT TRUSTS — 20.0% | ||||||||||||
| 800,000 | Alexandria Real Estate Equities, Inc. | 3.9500 | 01/15/28 | 751,566 | ||||||||
| 1,500,000 | Alexandria Real Estate Equities, Inc. | 2.7500 | 12/15/29 | 1,267,383 | ||||||||
| 1,000,000 | Alexandria Real Estate Equities, Inc. | 4.7000 | 07/01/30 | 957,779 | ||||||||
| 1,000,000 | Alexandria Real Estate Equities, Inc. | 4.9000 | 12/15/30 | 971,895 | ||||||||
| 1,000,000 | Alexandria Real Estate Equities, Inc. | 3.3750 | 08/15/31 | 870,617 | ||||||||
| 1,000,000 | Alexandria Real Estate Equities, Inc. | 2.0000 | 05/18/32 | 762,309 | ||||||||
| 1,000,000 | Boston Properties, L.P. | 3.6500 | 02/01/26 | 950,590 | ||||||||
| 1,000,000 | Boston Properties, L.P. | 4.5000 | 12/01/28 | 930,784 | ||||||||
| 1,000,000 | Boston Properties, L.P. | 3.4000 | 06/21/29 | 862,921 | ||||||||
| 1,000,000 | Boston Properties, L.P. | 2.9000 | 03/15/30 | 814,789 | ||||||||
| 1,000,000 | Boston Properties, L.P. | 3.2500 | 01/30/31 | 834,148 | ||||||||
See accompanying notes to financial statements.
61
| INSPIRE CORPORATE BOND ETF |
| SCHEDULE OF INVESTMENTS (Continued) |
| November 30, 2022 |
| Principal | Coupon Rate | |||||||||||
| Amount ($) | (%) | Maturity | Fair Value | |||||||||
| CORPORATE BONDS — 98.8% (Continued) | ||||||||||||
| REAL ESTATE INVESTMENT TRUSTS — 20.0% (Continued) | ||||||||||||
| 1,000,000 | Boston Properties, L.P. | 2.5500 | 04/01/32 | $ | 760,272 | |||||||
| 890,000 | Digital Realty Trust, L.P. | 3.7000 | 08/15/27 | 829,416 | ||||||||
| 1,000,000 | Digital Realty Trust, L.P. | 4.4500 | 07/15/28 | 952,544 | ||||||||
| 800,000 | Digital Realty Trust, L.P. | 3.6000 | 07/01/29 | 724,274 | ||||||||
| 1,000,000 | Extra Space Storage, L.P. | 3.9000 | 04/01/29 | 901,104 | ||||||||
| 1,000,000 | Extra Space Storage, L.P. | 2.5500 | 06/01/31 | 786,337 | ||||||||
| 1,000,000 | Extra Space Storage, L.P. | 2.3500 | 03/15/32 | 758,611 | ||||||||
| 800,000 | Invitation Homes Operating Partnership, L.P. | 2.0000 | 08/15/31 | 590,351 | ||||||||
| 902,000 | Kimco Realty Corporation | 2.7000 | 03/01/24 | 873,590 | ||||||||
| 800,000 | Kimco Realty Corporation | 2.8000 | 10/01/26 | 732,771 | ||||||||
| 1,500,000 | Kimco Realty Corporation | 1.9000 | 03/01/28 | 1,260,003 | ||||||||
| 800,000 | Kimco Realty Corporation | 2.7000 | 10/01/30 | 658,257 | ||||||||
| 1,000,000 | Prologis, L.P. | 3.8750 | 09/15/28 | 948,990 | ||||||||
| 1,000,000 | Prologis, L.P. | 2.2500 | 04/15/30 | 834,815 | ||||||||
| 1,000,000 | Prologis, L.P. | 1.2500 | 10/15/30 | 763,916 | ||||||||
| 1,000,000 | Prologis, L.P. | 1.6250 | 03/15/31 | 769,336 | ||||||||
| 1,000,000 | Public Storage | 0.8750 | 02/15/26 | 883,020 | ||||||||
| 800,000 | Public Storage | 3.0940 | 09/15/27 | 748,048 | ||||||||
| 800,000 | Realty Income Corporation | 3.8750 | 04/15/25 | 782,953 | ||||||||
| 1,000,000 | Realty Income Corporation | 4.6250 | 11/01/25 | 993,076 | ||||||||
| 902,000 | Realty Income Corporation | 4.1250 | 10/15/26 | 874,409 | ||||||||
| 1,000,000 | Realty Income Corporation | 3.4000 | 01/15/28 | 922,956 | ||||||||
| 1,000,000 | Realty Income Corporation | 3.6500 | 01/15/28 | 936,371 | ||||||||
| 1,500,000 | Realty Income Corporation | 2.2000 | 06/15/28 | 1,285,855 | ||||||||
| 1,500,000 | Realty Income Corporation | 3.2500 | 06/15/29 | 1,334,905 | ||||||||
| 1,000,000 | Realty Income Corporation | 3.1000 | 12/15/29 | 872,043 | ||||||||
| 1,000,000 | Realty Income Corporation | 3.2500 | 01/15/31 | 872,213 | ||||||||
| 1,000,000 | Simon Property Group, L.P. | 3.3000 | 01/15/26 | 952,242 | ||||||||
| 400,000 | Sun Communities Operating, L.P. | 2.3000 | 11/01/28 | 328,877 | ||||||||
| 800,000 | Sun Communities Operating, L.P. | 2.7000 | 07/15/31 | 620,884 | ||||||||
| 800,000 | UDR, Inc. | 3.2000 | 01/15/30 | 687,141 | ||||||||
| 1,000,000 | Ventas Realty, L.P. | 4.1250 | 01/15/26 | 966,327 | ||||||||
| 902,000 | Ventas Realty, L.P. | 3.2500 | 10/15/26 | 834,509 | ||||||||
| 800,000 | Ventas Realty, L.P. | 4.0000 | 03/01/28 | 745,112 | ||||||||
See accompanying notes to financial statements.
62
| INSPIRE CORPORATE BOND ETF |
| SCHEDULE OF INVESTMENTS (Continued) |
| November 30, 2022 |
| Principal | Coupon Rate | |||||||||||
| Amount ($) | (%) | Maturity | Fair Value | |||||||||
| CORPORATE BONDS — 98.8% (Continued) | ||||||||||||
| REAL ESTATE INVESTMENT TRUSTS — 20.0% (Continued) | ||||||||||||
| 1,130,000 | Ventas Realty, L.P. | 4.4000 | 01/15/29 | $ | 1,060,113 | |||||||
| 1,000,000 | Ventas Realty, L.P. | 3.0000 | 01/15/30 | 847,846 | ||||||||
| 1,000,000 | Ventas Realty, L.P. | 4.7500 | 11/15/30 | 940,353 | ||||||||
| 1,000,000 | Ventas Realty, L.P. | 2.5000 | 09/01/31 | 785,202 | ||||||||
| 800,000 | WP Carey, Inc. | 4.6000 | 04/01/24 | 795,174 | ||||||||
| 800,000 | WP Carey, Inc. | 4.0000 | 02/01/25 | 778,000 | ||||||||
| 800,000 | WP Carey, Inc. | 2.4000 | 02/01/31 | 633,875 | ||||||||
| 44,600,872 | ||||||||||||
| RETAIL - CONSUMER STAPLES — 1.5% | ||||||||||||
| 1,000,000 | Dollar General Corporation | 4.1500 | 11/01/25 | 978,420 | ||||||||
| 1,500,000 | Dollar General Corporation | 3.8750 | 04/15/27 | 1,442,467 | ||||||||
| 917,000 | Dollar Tree, Inc. | 4.2000 | 05/15/28 | 874,895 | ||||||||
| 3,295,782 | ||||||||||||
| RETAIL - DISCRETIONARY — 1.4% | ||||||||||||
| 902,000 | AutoZone, Inc. | 3.7500 | 06/01/27 | 863,071 | ||||||||
| 800,000 | Genuine Parts Company | 1.8750 | 11/01/30 | 614,504 | ||||||||
| 1,000,000 | Genuine Parts Company | 2.7500 | 02/01/32 | 806,625 | ||||||||
| 980,000 | Tractor Supply Company | 1.7500 | 11/01/30 | 760,205 | ||||||||
| 3,044,405 | ||||||||||||
| SEMICONDUCTORS — 3.5% | ||||||||||||
| 262,000 | Analog Devices, Inc. | 2.9500 | 04/01/25 | 252,703 | ||||||||
| 1,000,000 | Analog Devices, Inc. | 3.5000 | 12/05/26 | 958,837 | ||||||||
| 1,500,000 | Analog Devices, Inc. | 1.7000 | 10/01/28 | 1,281,909 | ||||||||
| 1,000,000 | Analog Devices, Inc. | 2.1000 | 10/01/31 | 817,503 | ||||||||
| 1,000,000 | Broadcom, Inc. | 3.4590 | 09/15/26 | 943,762 | ||||||||
| 50,000 | Broadcom, Inc. | 4.1100 | 09/15/28 | 46,674 | ||||||||
| 800,000 | KLA Corporation | 4.6500 | 11/01/24 | 797,217 | ||||||||
| 980,000 | KLA Corporation | 4.1000 | 03/15/29 | 953,079 | ||||||||
| 800,000 | Microchip Technology, Inc. | 4.3330 | 06/01/23 | 796,689 | ||||||||
| 1,000,000 | Microchip Technology, Inc. | 4.2500 | 09/01/25 | 972,551 | ||||||||
| 7,820,924 | ||||||||||||
| SOFTWARE — 1.4% | ||||||||||||
| 1,000,000 | Fortinet, Inc. | 1.0000 | 03/15/26 | 879,410 | ||||||||
| 1,000,000 | Fortinet, Inc. | 2.2000 | 03/15/31 | 777,892 | ||||||||
See accompanying notes to financial statements.
63
| INSPIRE CORPORATE BOND ETF |
| SCHEDULE OF INVESTMENTS (Continued) |
| November 30, 2022 |
| Principal | Coupon Rate | |||||||||||
| Amount ($) | (%) | Maturity | Fair Value | |||||||||
| CORPORATE BONDS — 98.8% (Continued) | ||||||||||||
| SOFTWARE — 1.4% (Continued) | ||||||||||||
| 800,000 | Roper Technologies, Inc. | 2.3500 | 09/15/24 | $ | 765,625 | |||||||
| 800,000 | ServiceNow, Inc. | 1.4000 | 09/01/30 | 617,391 | ||||||||
| 3,040,318 | ||||||||||||
| STEEL — 1.6% | ||||||||||||
| 800,000 | Nucor Corporation | 2.0000 | 06/01/25 | 746,358 | ||||||||
| 1,500,000 | Nucor Corporation | 2.7000 | 06/01/30 | 1,279,684 | ||||||||
| 800,000 | Steel Dynamics, Inc. | 2.8000 | 12/15/24 | 760,802 | ||||||||
| 800,000 | Steel Dynamics, Inc. | 3.4500 | 04/15/30 | 703,341 | ||||||||
| 3,490,185 | ||||||||||||
| TECHNOLOGY HARDWARE — 1.6% | ||||||||||||
| 1,000,000 | FLIR Systems, Inc. | 2.5000 | 08/01/30 | 817,040 | ||||||||
| 800,000 | NetApp, Inc. | 3.3000 | 09/29/24 | 774,378 | ||||||||
| 800,000 | NetApp, Inc. | 2.3750 | 06/22/27 | 717,596 | ||||||||
| 1,500,000 | NetApp, Inc. | 2.7000 | 06/22/30 | 1,249,041 | ||||||||
| 3,558,055 | ||||||||||||
| TECHNOLOGY SERVICES — 6.2% | ||||||||||||
| 800,000 | Equifax, Inc. | 3.9500 | 06/15/23 | 794,939 | ||||||||
| 800,000 | Equifax, Inc. | 2.6000 | 12/01/24 | 762,382 | ||||||||
| 1,000,000 | Equifax, Inc. | 2.6000 | 12/15/25 | 929,464 | ||||||||
| 1,000,000 | Equifax, Inc. | 5.1000 | 12/15/27 | 985,179 | ||||||||
| 1,000,000 | Fidelity National Information Services, Inc. | 0.6000 | 03/01/24 | 945,989 | ||||||||
| 920,000 | Fidelity National Information Services, Inc. | 1.1500 | 03/01/26 | 811,126 | ||||||||
| 920,000 | Fidelity National Information Services, Inc. | 1.6500 | 03/01/28 | 771,973 | ||||||||
| 800,000 | Global Payments, Inc. | 3.7500 | 06/01/23 | 793,429 | ||||||||
| 920,000 | Global Payments, Inc. | 2.6500 | 02/15/25 | 864,161 | ||||||||
| 1,000,000 | Global Payments, Inc. | 1.2000 | 03/01/26 | 871,417 | ||||||||
| 1,000,000 | Global Payments, Inc. | 4.8000 | 04/01/26 | 976,766 | ||||||||
| 800,000 | Global Payments, Inc. | 4.4500 | 06/01/28 | 746,448 | ||||||||
| 890,000 | Global Payments, Inc. | 3.2000 | 08/15/29 | 759,146 | ||||||||
| 1,000,000 | Global Payments, Inc. | 5.3000 | 08/15/29 | 967,621 | ||||||||
| 1,160,000 | Verisk Analytics, Inc. | 4.0000 | 06/15/25 | 1,129,412 | ||||||||
| 800,000 | Verisk Analytics, Inc. | 4.1250 | 03/15/29 | 755,143 | ||||||||
| 13,864,595 | ||||||||||||
See accompanying notes to financial statements.
64
| INSPIRE CORPORATE BOND ETF |
| SCHEDULE OF INVESTMENTS (Continued) |
| November 30, 2022 |
| Principal | Coupon Rate | |||||||||||
| Amount ($) | (%) | Maturity | Fair Value | |||||||||
| CORPORATE BONDS — 98.8% (Continued) | ||||||||||||
| TRANSPORTATION & LOGISTICS — 2.2% | ||||||||||||
| 800,000 | CSX Corporation | 3.4000 | 08/01/24 | $ | 781,430 | |||||||
| 800,000 | CSX Corporation | 3.3500 | 11/01/25 | 770,552 | ||||||||
| 1,000,000 | CSX Corporation | 3.8000 | 03/01/28 | 958,789 | ||||||||
| 920,000 | CSX Corporation | 4.2500 | 03/15/29 | 887,142 | ||||||||
| 800,000 | JB Hunt Transport Services, Inc. | 3.8750 | 03/01/26 | 777,418 | ||||||||
| 800,000 | Kansas City Southern | 3.0000 | 05/15/23 | 791,714 | ||||||||
| 4,967,045 | ||||||||||||
| TOTAL CORPORATE BONDS (Cost $234,610,066) | 220,367,926 | |||||||||||
| TOTAL INVESTMENTS - 98.8% (Cost $234,610,066) | $ | 220,367,926 | ||||||||||
| OTHER ASSETS IN EXCESS OF LIABILITIES - 1.2% | 2,644,655 | |||||||||||
| NET ASSETS - 100.0% | $ | 223,012,581 | ||||||||||
| (a) | Security exempt from registration under Rule 144A or Section 4(2) of the Securities Act of 1933. The security may be resold in transactions exempt from registration, normally to qualified institutional buyers. As of November 30, 2022 the total market value of 144A securities is $3,856,784 or 1.7% of net assets. |
See accompanying notes to financial statements.
65
| INSPIRE 100 ETF |
| SCHEDULE OF INVESTMENTS |
| November 30, 2022 |
| Shares | Fair Value | |||||||
| COMMON STOCKS — 99.9% | ||||||||
| AEROSPACE & DEFENSE - 0.7% | ||||||||
| 4,701 | Teledyne Technologies, Inc.(a) | $ | 1,974,890 | |||||
| ASSET MANAGEMENT - 0.7% | ||||||||
| 8,036 | LPL Financial Holdings, Inc. | 1,902,202 | ||||||
| BANKING - 1.3% | ||||||||
| 1,591 | First Citizens BancShares, Inc., Class A | 1,298,988 | ||||||
| 6,299 | Signature Bank | 878,711 | ||||||
| 5,954 | SVB Financial Group(a) | 1,380,017 | ||||||
| 3,557,716 | ||||||||
| BIOTECH & PHARMA - 1.6% | ||||||||
| 12,071 | Alnylam Pharmaceuticals, Inc.(a) | 2,662,742 | ||||||
| 3,633 | Biohaven Ltd.(a) | 57,474 | ||||||
| 22,321 | Incyte Corporation(a) | 1,778,314 | ||||||
| 4,498,530 | ||||||||
| CHEMICALS - 1.8% | ||||||||
| 11,805 | Albemarle Corporation | 3,281,672 | ||||||
| 34,790 | Mosaic Company (The) | 1,784,727 | ||||||
| 5,066,399 | ||||||||
| COMMERCIAL SUPPORT SERVICES - 4.7% | ||||||||
| 10,248 | Cintas Corporation | 4,732,321 | ||||||
| 31,934 | Republic Services, Inc. | 4,448,087 | ||||||
| 25,987 | Waste Connections, Inc. | 3,755,122 | ||||||
| 12,935,530 | ||||||||
| CONSTRUCTION MATERIALS - 0.8% | ||||||||
| 8,437 | Advanced Drainage Systems, Inc. | 820,583 | ||||||
| 5,220 | Carlisle Companies, Inc. | 1,373,434 | ||||||
| 2,194,017 | ||||||||
| CONTAINERS & PACKAGING - 0.4% | ||||||||
| 12,355 | Crown Holdings, Inc. | 1,015,705 | ||||||
| DATA CENTER REIT - 1.2% | ||||||||
| 29,786 | Digital Realty Trust, Inc. | 3,349,733 | ||||||
See accompanying notes to financial statements.
66
| INSPIRE 100 ETF |
| SCHEDULE OF INVESTMENTS (Continued) |
| November 30, 2022 |
| Shares | Fair Value | |||||||
| COMMON STOCKS — 99.9% (Continued) | ||||||||
| DIVERSIFIED INDUSTRIALS - 0.7% | ||||||||
| 14,449 | Dover Corporation | $ | 2,051,036 | |||||
| ELECTRIC UTILITIES - 2.5% | ||||||||
| 66,950 | AES Corporation (The) | 1,936,194 | ||||||
| 25,333 | Alliant Energy Corporation | 1,426,248 | ||||||
| 39,211 | Avangrid, Inc. | 1,677,054 | ||||||
| 63,231 | CenterPoint Energy, Inc. | 1,967,117 | ||||||
| 7,006,613 | ||||||||
| ELECTRICAL EQUIPMENT - 4.6% | ||||||||
| 60,111 | Amphenol Corporation, Class A | 4,834,728 | ||||||
| 18,005 | Keysight Technologies, Inc.(a) | 3,256,924 | ||||||
| 10,739 | Roper Technologies, Inc. | 4,713,240 | ||||||
| 12,804,892 | ||||||||
| ENGINEERING & CONSTRUCTION - 0.8% | ||||||||
| 14,366 | Quanta Services, Inc. | 2,153,176 | ||||||
| FOOD - 1.8% | ||||||||
| 16,214 | Darling Ingredients, Inc.(a) | 1,164,652 | ||||||
| 55,633 | Hormel Foods Corporation | 2,614,751 | ||||||
| 14,509 | Lamb Weston Holdings, Inc. | 1,260,832 | ||||||
| 5,040,235 | ||||||||
| HEALTH CARE FACILITIES & SERVICES - 1.0% | ||||||||
| 18,223 | Catalent, Inc.(a) | 913,519 | ||||||
| 5,845 | Molina Healthcare, Inc.(a) | 1,968,421 | ||||||
| 2,881,940 | ||||||||
| HEALTH CARE REIT - 0.7% | ||||||||
| 40,086 | Ventas, Inc. | 1,865,202 | ||||||
| INDUSTRIAL REIT - 3.2% | ||||||||
| 74,681 | Prologis, Inc. | 8,796,674 | ||||||
| INDUSTRIAL SUPPORT SERVICES - 0.9% | ||||||||
| 7,047 | United Rentals, Inc.(a) | 2,487,802 | ||||||
See accompanying notes to financial statements.
67
| INSPIRE 100 ETF |
| SCHEDULE OF INVESTMENTS (Continued) |
| November 30, 2022 |
| Shares | Fair Value | |||||||
| COMMON STOCKS — 99.9% (Continued) | ||||||||
| INSTITUTIONAL FINANCIAL SERVICES - 1.2% | ||||||||
| 43,149 | Interactive Brokers Group, Inc., Class A | $ | 3,464,865 | |||||
| INSURANCE - 0.5% | ||||||||
| 24,479 | Loews Corporation | 1,423,454 | ||||||
| MACHINERY - 1.9% | ||||||||
| 5,749 | Nordson Corporation | 1,359,581 | ||||||
| 12,996 | Parker-Hannifin Corporation | 3,885,024 | ||||||
| 5,244,605 | ||||||||
| MEDICAL EQUIPMENT & DEVICES - 10.0% | ||||||||
| 62,614 | Edwards Lifesciences Corporation(a) | 4,836,932 | ||||||
| 8,390 | IDEXX Laboratories, Inc.(a) | 3,573,049 | ||||||
| 36,059 | Intuitive Surgical, Inc.(a) | 9,749,992 | ||||||
| 2,274 | Mettler-Toledo International, Inc.(a) | 3,341,779 | ||||||
| 5,608 | Repligen Corporation(a) | 1,002,935 | ||||||
| 14,773 | ResMed, Inc. | 3,400,745 | ||||||
| 7,438 | West Pharmaceutical Services, Inc. | 1,745,401 | ||||||
| 27,650,833 | ||||||||
| METALS & MINING - 3.5% | ||||||||
| 145,191 | Freeport-McMoRan, Inc. | 5,778,601 | ||||||
| 80,111 | Newmont Corporation | 3,802,869 | ||||||
| 9,581,470 | ||||||||
| MULTI ASSET CLASS REIT - 0.6% | ||||||||
| 19,582 | WP Carey, Inc. | 1,543,062 | ||||||
| OFFICE REIT - 1.3% | ||||||||
| 16,524 | Alexandria Real Estate Equities, Inc. | 2,571,300 | ||||||
| 15,948 | Boston Properties, Inc. | 1,149,532 | ||||||
| 3,720,832 | ||||||||
| OIL & GAS PRODUCERS – 3.0% | ||||||||
| 31,152 | Antero Resources Corporation(a) | 1,138,606 | ||||||
| 66,196 | Devon Energy Corporation | 4,535,750 | ||||||
| 18,044 | Diamondback Energy, Inc. | 2,670,873 | ||||||
| 8,345,229 | ||||||||
See accompanying notes to financial statements.
68
| INSPIRE 100 ETF |
| SCHEDULE OF INVESTMENTS (Continued) |
| November 30, 2022 |
| Shares | Fair Value | |||||||
| COMMON STOCKS — 99.9% (Continued) | ||||||||
| OIL & GAS SERVICES & EQUIPMENT - 2.7% | ||||||||
| 142,897 | Schlumberger Ltd | $ | 7,366,340 | |||||
| RENEWABLE ENERGY - 2.3% | ||||||||
| 13,721 | Enphase Energy, Inc.(a) | 4,398,816 | ||||||
| 10,712 | First Solar, Inc.(a) | 1,848,141 | ||||||
| 6,246,957 | ||||||||
| RESIDENTIAL REIT - 3.7% | ||||||||
| 10,824 | Camden Property Trust | 1,302,452 | ||||||
| 18,625 | Equity LifeStyle Properties, Inc. | 1,237,073 | ||||||
| 38,109 | Equity Residential | 2,471,750 | ||||||
| 61,390 | Invitation Homes, Inc. | 2,003,156 | ||||||
| 12,443 | Sun Communities, Inc. | 1,827,877 | ||||||
| 33,069 | UDR, Inc. | 1,371,371 | ||||||
| 10,213,679 | ||||||||
| RETAIL - DISCRETIONARY – 0.9% | ||||||||
| 14,221 | Genuine Parts Company | 2,607,136 | ||||||
| RETAIL REIT - 1.4% | ||||||||
| 62,468 | Realty Income Corporation | 3,939,856 | ||||||
| SELF-STORAGE REIT - 0.8% | ||||||||
| 13,558 | Extra Space Storage, Inc. | 2,178,635 | ||||||
| SEMICONDUCTORS - 10.0% | ||||||||
| 52,021 | Analog Devices, Inc. | 8,942,931 | ||||||
| 14,992 | Entegris, Inc. | 1,158,732 | ||||||
| 14,364 | KLA Corporation | 5,647,207 | ||||||
| 55,965 | Microchip Technology, Inc. | 4,431,868 | ||||||
| 43,832 | ON Semiconductor Corporation(a) | 3,296,166 | ||||||
| 16,304 | Skyworks Solutions, Inc. | 1,558,988 | ||||||
| 15,925 | Teradyne, Inc. | 1,488,191 | ||||||
| 12,509 | Wolfspeed, Inc.(a) | 1,137,318 | ||||||
| 27,661,401 | ||||||||
See accompanying notes to financial statements.
69
| INSPIRE 100 ETF |
| SCHEDULE OF INVESTMENTS (Continued) |
| November 30, 2022 |
| Shares | Fair Value | |||||||
| COMMON STOCKS — 99.9% (Continued) | ||||||||
| SOFTWARE - 8.2% | ||||||||
| 8,793 | ANSYS, Inc.(a) | $ | 2,236,060 | |||||
| 20,066 | DocuSign, Inc.(a) | 944,507 | ||||||
| 4,864 | HubSpot, Inc.(a) | 1,473,938 | ||||||
| 20,423 | ServiceNow, Inc.(a) | 8,502,096 | ||||||
| 15,412 | Synopsys, Inc.(a) | 5,232,990 | ||||||
| 4,214 | Tyler Technologies, Inc.(a) | 1,444,306 | ||||||
| 15,693 | Veeva Systems, Inc., Class A(a) | 2,987,319 | ||||||
| 22,821,216 | ||||||||
| STEEL - 2.1% | ||||||||
| 26,450 | Nucor Corporation | 3,966,178 | ||||||
| 18,570 | Steel Dynamics, Inc. | 1,929,980 | ||||||
| 5,896,158 | ||||||||
| TECHNOLOGY HARDWARE - 1.1% | ||||||||
| 22,262 | NetApp, Inc. | 1,505,134 | ||||||
| 5,222 | Zebra Technologies Corporation, Class A(a) | 1,411,402 | ||||||
| 2,916,536 | ||||||||
| TECHNOLOGY SERVICES - 10.9% | ||||||||
| 40,978 | CoStar Group, Inc.(a) | 3,320,857 | ||||||
| 5,795 | EPAM Systems, Inc.(a) | 2,135,921 | ||||||
| 2,547 | Fair Isaac Corporation(a) | 1,578,427 | ||||||
| 61,335 | Fidelity National Information Services, Inc. | 4,451,694 | ||||||
| 7,618 | FleetCor Technologies, Inc.(a) | 1,494,652 | ||||||
| 8,035 | Gartner, Inc.(a) | 2,815,223 | ||||||
| 28,012 | Global Payments, Inc. | 2,907,085 | ||||||
| 8,159 | MSCI, Inc. | 4,143,385 | ||||||
| 36,320 | Paychex, Inc. | 4,504,769 | ||||||
| 15,885 | Verisk Analytics, Inc. | 2,918,233 | ||||||
| 30,270,246 | ||||||||
| TRANSPORTATION & LOGISTICS - 2.6% | ||||||||
| 16,572 | Expeditors International of Washington, Inc. | 1,923,346 | ||||||
| 10,447 | JB Hunt Transport Services, Inc. | 1,921,099 | ||||||
| 11,276 | Old Dominion Freight Line, Inc. | 3,412,231 | ||||||
| 7,256,676 | ||||||||
See accompanying notes to financial statements.
70
| INSPIRE 100 ETF |
| SCHEDULE OF INVESTMENTS (Continued) |
| November 30, 2022 |
| Shares | Fair Value | |||||||
| COMMON STOCKS — 99.9% (Continued) | ||||||||
| TRANSPORTATION EQUIPMENT - 1.3% | ||||||||
| 35,008 | PACCAR, Inc. | $ | 3,707,697 | |||||
| WHOLESALE - DISCRETIONARY - 0.5% | ||||||||
| 27,956 | LKQ Corporation | 1,518,849 | ||||||
| TOTAL COMMON STOCKS (Cost $292,287,196) | 277,158,024 | |||||||
| TOTAL INVESTMENTS - 99.9% (Cost $292,287,196) | $ | 277,158,024 | ||||||
| OTHER ASSETS IN EXCESS OF LIABILITIES - 0.1% | 379,997 | |||||||
| NET ASSETS - 100.0% | $ | 277,538,021 | ||||||
| LTD | - Limited Company |
| MSCI | - Morgan Stanley Capital International |
| REIT | - Real Estate Investment Trust |
| (a) | - Non-income producing security. |
See accompanying notes to financial statements.
71
| INSPIRE INTERNATIONAL ETF |
| SCHEDULE OF INVESTMENTS |
| November 30, 2022 |
| Shares | Fair Value | |||||||
| COMMON STOCKS — 99.6% | ||||||||
| AEROSPACE & DEFENSE - 1.0% | ||||||||
| 6,466 | Safran S.A. | $ | 791,037 | |||||
| 5,384 | Thales S.A. | 685,201 | ||||||
| 1,476,238 | ||||||||
| APPAREL & TEXTILE PRODUCTS - 1.7% | ||||||||
| 6,254 | Cie Financiere Richemont S.A. | 819,834 | ||||||
| 505 | Hermes International | 811,588 | ||||||
| 127,693 | PRADA SpA | 698,892 | ||||||
| 2,330,314 | ||||||||
| ASSET MANAGEMENT - 2.6% | ||||||||
| 49,069 | 3i Group plc | 797,733 | ||||||
| 14,273 | Brookfield Asset Management, Inc., Class A | 672,926 | ||||||
| 8,429 | Groupe Bruxelles Lambert S.A. | 672,880 | ||||||
| 39,833 | Investor A.B. | 732,272 | ||||||
| 737 | Partners Group Holding A.G. | 720,411 | ||||||
| 3,596,222 | ||||||||
| AUTOMOTIVE – 3.0% | ||||||||
| 26,269 | Cie Generale des Etablissements Michelin SCA | 731,443 | ||||||
| 13,300 | Continental A.G. | 793,733 | ||||||
| 13,000 | Denso Corporation | 707,410 | ||||||
| 3,180 | Ferrari N.V. | 709,299 | ||||||
| 429,577 | Geely Automobile Holdings Ltd. | 625,878 | ||||||
| 12,444 | Toyota Industries Corporation | 703,830 | ||||||
| 4,271,593 | ||||||||
| BANKING - 11.4% | ||||||||
| 963,541 | Bank Mandiri Persero Tbk P.T. | 648,543 | ||||||
| 1,990,071 | Bank Rakyat Indonesia Persero Tbk P.T. | 633,789 | ||||||
| 13,455 | Canadian Imperial Bank of Commerce | 648,064 | ||||||
| 10,126 | Commonwealth Bank of Australia | 741,373 | ||||||
| 72,787 | Credit Agricole S.A. | 728,780 | ||||||
| 47,133 | Danske Bank A/S | 840,854 | ||||||
| 91,566 | Grupo Financiero Banorte S.A.B. de C.V. | 735,040 | ||||||
| 28,091 | ICICI Bank Ltd. - ADR | 666,319 | ||||||
| 357,138 | Intesa Sanpaolo SpA | 789,588 | ||||||
| 42,237 | KakaoBank Corporation(a) | 811,378 | ||||||
See accompanying notes to financial statements.
72
| INSPIRE INTERNATIONAL ETF |
| SCHEDULE OF INVESTMENTS (Continued) |
| November 30, 2022 |
| Shares | Fair Value | |||||||
| COMMON STOCKS — 99.6% (Continued) | ||||||||
| BANKING - 11.4% (Continued) | ||||||||
| 12,459 | KBC Group N.V. | $ | 684,609 | |||||
| 6,012 | Macquarie Group Ltd. | 729,300 | ||||||
| 320,216 | Malayan Banking Bhd | 621,632 | ||||||
| 31,876 | National Australia Bank Ltd. | 682,439 | ||||||
| 32,514 | OTP Bank Nyrt | 889,106 | ||||||
| 134,235 | Powszechna Kasa Oszczednosci Bank Polski S.A. | 848,187 | ||||||
| 649,517 | Public Bank Bhd | 657,480 | ||||||
| 55,727 | Skandinaviska Enskilda Banken A.B. | 676,250 | ||||||
| 75,117 | Standard Bank Group Ltd. | 783,235 | ||||||
| 71,897 | Svenska Handelsbanken A.B., A Shares | 723,523 | ||||||
| 44,818 | Swedbank A.B., A Shares | 722,313 | ||||||
| 32,253 | United Overseas Bank Ltd. | 739,503 | ||||||
| 16,001,305 | ||||||||
| BEVERAGES - 0.5% | ||||||||
| 13,653 | Coca-Cola Europacific Partners plc | 724,838 | ||||||
| BIOTECH & PHARMA - 1.8% | ||||||||
| 4,757 | Celltrion, Inc. | 642,049 | ||||||
| 23,365 | Chugai Pharmaceutical Company Ltd. | 613,212 | ||||||
| 3,222 | CSL Ltd. | 656,363 | ||||||
| 8,494 | UCB S.A. | 679,485 | ||||||
| 2,591,109 | ||||||||
| CHEMICALS - 4.7% | ||||||||
| 5,166 | Air Liquide S.A. | 743,952 | ||||||
| 10,380 | Akzo Nobel N.V. | 737,782 | ||||||
| 3,699,831 | Chandra Asri Petrochemical Tbk P.T. | 565,492 | ||||||
| 923 | EMS-Chemie Holding A.G. | 635,946 | ||||||
| 194 | Givaudan S.A. | 649,058 | ||||||
| 5,201 | Koninklijke DSM N.V. | 662,724 | ||||||
| 11,776 | Novozymes A/S, Class B | 676,224 | ||||||
| 7,024 | Nutrien Ltd. | 564,516 | ||||||
| 6,595 | Sociedad Quimica y Minera de Chile S.A., Class B | 652,612 | ||||||
| 6,016 | Symrise A.G. | 682,896 | ||||||
| 6,571,202 | ||||||||
See accompanying notes to financial statements.
73
| INSPIRE INTERNATIONAL ETF |
| SCHEDULE OF INVESTMENTS (Continued) |
| November 30, 2022 |
| Shares | Fair Value | |||||||
| COMMON STOCKS — 99.6% (Continued) | ||||||||
| COMMERCIAL SUPPORT SERVICES - 1.4% | ||||||||
| 12,759 | Edenred | $ | 697,638 | |||||
| 9,981 | Eurofins Scientific S.E. | 690,704 | ||||||
| 276 | SGS S.A. | 641,657 | ||||||
| 2,029,999 | ||||||||
| CONSTRUCTION MATERIALS - 2.5% | ||||||||
| 16,146 | Cie de Saint-Gobain | 735,891 | ||||||
| 18,392 | CRH plc | 730,052 | ||||||
| 14,198 | Holcim Ltd. | 731,580 | ||||||
| 68,429 | Siam Cement PCL (The) - ADR | 654,394 | ||||||
| 2,909 | Sika A.G. | 728,556 | ||||||
| 3,580,473 | ||||||||
| CONTAINERS & PACKAGING - 0.5% | ||||||||
| 54,756 | Amcor plc - ADR | 667,910 | ||||||
| DIVERSIFIED INDUSTRIALS - 0.5% | ||||||||
| 23,367 | Alfa Laval A.B. | 662,604 | ||||||
| ELECTRIC UTILITIES - 8.8% | ||||||||
| 6,205,242 | AC Energy Corporation | 782,119 | ||||||
| 78,316 | CLP Holdings Ltd. | 567,510 | ||||||
| 76,573 | E.ON S.E. | 727,914 | ||||||
| 135,882 | EDP - Energias de Portugal S.A. | 639,769 | ||||||
| 28,481 | EDP Renovaveis S.A. | 654,309 | ||||||
| 13,893 | Emera, Inc. | 540,885 | ||||||
| 39,015 | Endesa S.A. | 719,489 | ||||||
| 5,463,337 | Enel Americas S.A. (a) | 721,652 | ||||||
| 143,176 | Enel SpA | 765,853 | ||||||
| 51,117 | Engie S.A. | 773,306 | ||||||
| 15,391 | Fortis, Inc.(b) | 619,457 | ||||||
| 44,719 | Fortum OYJ | 708,897 | ||||||
| 426,902 | Gulf Energy Development PCL - ADR | 643,968 | ||||||
| 63,200 | Iberdrola S.A. | 709,831 | ||||||
| 35,095 | SSE plc | 722,869 | ||||||
| 341,299 | Tenaga Nasional Bhd | 723,211 | ||||||
See accompanying notes to financial statements.
74
| INSPIRE INTERNATIONAL ETF |
| SCHEDULE OF INVESTMENTS (Continued) |
| November 30, 2022 |
| Shares | Fair Value | |||||||
| COMMON STOCKS — 99.6% (Continued) | ||||||||
| ELECTRIC UTILITIES - 8.8% (Continued) | ||||||||
| 96,233 | Terna Rete Elettrica Nazionale SpA | $ | 732,927 | |||||
| 7,010 | Verbund A.G. | 628,475 | ||||||
| 12,382,441 | ||||||||
| ELECTRICAL EQUIPMENT - 1.5% | ||||||||
| 31,728 | Assa Abloy A.B., Class B | 720,177 | ||||||
| 33,805 | Delta Electronics Thailand PCL | 646,562 | ||||||
| 3,742 | Schindler Holding A.G. | 700,513 | ||||||
| 2,067,252 | ||||||||
| ENGINEERING & CONSTRUCTION - 1.0% | ||||||||
| 25,974 | Ferrovial S.A. | 692,784 | ||||||
| 33,121 | Sitios Latinoamerica S.A.B. de C.V.(a) | 14,766 | ||||||
| 5,347 | WSP Global, Inc. | 641,365 | ||||||
| 1,348,915 | ||||||||
| ENTERTAINMENT CONTENT - 0.5% | ||||||||
| 127,218 | Bollore S.E. | 710,449 | ||||||
| FOOD - 2.8% | ||||||||
| 21,398 | Ajinomoto Company, Inc. | 671,767 | ||||||
| 310 | Barry Callebaut A.G. | 629,959 | ||||||
| 146,754 | China Mengniu Dairy Company Ltd. | 653,847 | ||||||
| 60 | Chocoladefabriken Lindt & Spruengli A.G. | 628,976 | ||||||
| 166,643 | Grupo Bimbo S.A.B. de C.V. | 707,256 | ||||||
| 218,361 | Wilmar International Ltd. | 657,922 | ||||||
| 3,949,727 | ||||||||
| FORESTRY, PAPER & WOOD PRODUCTS - 1.5% | ||||||||
| 45,856 | Stora Enso OYJ, R Shares | 667,678 | ||||||
| 70,866 | Suzano S.A. | 721,328 | ||||||
| 18,786 | UPM-Kymmene OYJ | 684,462 | ||||||
| 2,073,468 | ||||||||
| GAS & WATER UTILITIES - 1.4% | ||||||||
| 671,679 | Hong Kong & China Gas Company Ltd. | 571,001 | ||||||
| 25,643 | Naturgy Energy Group S.A. | 715,482 | ||||||
| 147,689 | Snam SpA | 749,062 | ||||||
| 2,035,545 | ||||||||
See accompanying notes to financial statements.
75
| INSPIRE INTERNATIONAL ETF |
| SCHEDULE OF INVESTMENTS (Continued) |
| November 30, 2022 |
| Shares | Fair Value | |||||||
| COMMON STOCKS — 99.6% (Continued) | ||||||||
| HEALTH CARE FACILITIES & SERVICES - 1.5% | ||||||||
| 27,370 | Fresenius S.E. & Company KGaA | $ | 757,395 | |||||
| 3,196 | ICON plc(a) | 688,546 | ||||||
| 465,671 | IHH Healthcare Bhd | 607,556 | ||||||
| 2,053,497 | ||||||||
| HOME CONSTRUCTION - 0.5% | ||||||||
| 1,372 | Geberit A.G. | 647,796 | ||||||
| HOUSEHOLD PRODUCTS - 1.4% | ||||||||
| 5,986 | Beiersdorf A.G. | 648,307 | ||||||
| 29,262 | Essity A.B. - Series B | 712,422 | ||||||
| 1,338 | LG Household & Health Care Ltd. | 673,104 | ||||||
| 2,033,833 | ||||||||
| INDUSTRIAL REIT - 0.5% | ||||||||
| 58,198 | Goodman Group | 755,326 | ||||||
| INDUSTRIAL SUPPORT SERVICES - 0.6% | ||||||||
| 13,027 | Ashtead Group plc | 781,334 | ||||||
| INSTITUTIONAL FINANCIAL SERVICES - 1.9% | ||||||||
| 252,333 | B3 S.A. - Brasil Bolsa Balcao | 620,236 | ||||||
| 3,603 | Deutsche Boerse A.G. | 660,312 | ||||||
| 17,240 | Hong Kong Exchanges & Clearing Ltd. | 675,407 | ||||||
| 7,016 | London Stock Exchange Group plc | 697,650 | ||||||
| 2,653,605 | ||||||||
| INSURANCE - 4.4% | ||||||||
| 37,354 | Dai-ichi Life Holdings, Inc. | 688,059 | ||||||
| 1,282 | Fairfax Financial Holdings Ltd. | 735,542 | ||||||
| 4,105 | Intact Financial Corporation | 614,181 | ||||||
| 247,847 | Legal & General Group plc | 751,785 | ||||||
| 25,931 | Power Corp of Canada | 652,343 | ||||||
| 60,519 | Prudential plc | 714,581 | ||||||
| 13,823 | Sampo OYJ, A Shares | 699,071 | ||||||
| 1,324 | Swiss Life Holding A.G. | 701,805 | ||||||
See accompanying notes to financial statements.
76
| INSPIRE INTERNATIONAL ETF |
| SCHEDULE OF INVESTMENTS (Continued) |
| November 30, 2022 |
| Shares | Fair Value | |||||||
| COMMON STOCKS — 99.6% (Continued) | ||||||||
| INSURANCE - 4.4% (Continued) | ||||||||
| 28,685 | Tryg A/S | $ | 664,260 | |||||
| 6,221,627 | ||||||||
| INTERNET MEDIA & SERVICES - 1.8% | ||||||||
| 36,669,696 | GoTo Gojek Tokopedia Tbk P.T.(a) | 354,104 | ||||||
| 4,693 | Naspers Ltd., N Shares | 716,625 | ||||||
| 11,299 | Prosus N.V. | 735,648 | ||||||
| 7,996 | REA Group Ltd. | 669,282 | ||||||
| 2,475,659 | ||||||||
| MACHINERY - 3.1% | ||||||||
| 61,832 | Atlas Copco A.B. | 760,700 | ||||||
| 52,241 | CNH Industrial N.V. | 831,133 | ||||||
| 4,226 | FANUC Corporation | 623,262 | ||||||
| 42,782 | Sandvik A.B. | 778,335 | ||||||
| 1,471 | SMC Corporation | 657,925 | ||||||
| 100,258 | WEG S.A. | 751,085 | ||||||
| 4,402,440 | ||||||||
| MEDICAL EQUIPMENT & DEVICES - 1.5% | ||||||||
| 5,817 | Coloplast A/S - Series B | 678,488 | ||||||
| 4,319 | EssilorLuxottica S.A. | 797,832 | ||||||
| 2,671 | Sonova Holding A.G. | 683,062 | ||||||
| 2,159,382 | ||||||||
| METALS & MINING - 5.9% | ||||||||
| 13,797 | Agnico Eagle Mines Ltd. | 694,896 | ||||||
| 8,289 | Anglo American Platinum Ltd. | 824,680 | ||||||
| 48,073 | Antofagasta plc | 816,315 | ||||||
| 23,697 | BHP Group Ltd. | 732,207 | ||||||
| 53,913 | Fortescue Metals Group Ltd. | 709,227 | ||||||
| 4,982 | Franco-Nevada Corporation | 727,730 | ||||||
| 110,097 | Norsk Hydro ASA | 811,479 | ||||||
| 9,948 | Rio Tinto Ltd. | 740,225 | ||||||
| 246,090 | South32 Ltd. | 671,519 | ||||||
| 13,116 | Southern Copper Corporation | 800,338 | ||||||
| 18,390 | Wheaton Precious Metals Corporation | 717,740 | ||||||
| 8,246,356 | ||||||||
See accompanying notes to financial statements.
77
| INSPIRE INTERNATIONAL ETF |
| SCHEDULE OF INVESTMENTS (Continued) |
| November 30, 2022 |
| Shares | Fair Value | |||||||
| COMMON STOCKS — 99.6% (Continued) | ||||||||
| MULTI ASSET CLASS REIT - 0.5% | ||||||||
| 69,609 | Segro plc | $ | 663,638 | |||||
| OIL & GAS PRODUCERS - 7.9% | ||||||||
| 20,613 | Aker BP ASA | 715,272 | ||||||
| 13,011 | Canadian Natural Resources Ltd. | 776,795 | ||||||
| 40,109 | Cenovus Energy, Inc. | 797,612 | ||||||
| 184,082 | ENEOS Holdings, Inc. | 621,232 | ||||||
| 55,456 | Eni SpA | 827,622 | ||||||
| 18,052 | Equinor ASA | 694,967 | ||||||
| 62,098 | Inpex Corporation | 689,408 | ||||||
| 105,408 | MOL Hungarian Oil & Gas plc | 756,132 | ||||||
| 16,306 | OMV A.G. | 852,167 | ||||||
| 55,206 | Polski Koncern Naftowy ORLEN S.A. | 803,475 | ||||||
| 138,564 | PTT Exploration & Production PCL - ADR | 741,427 | ||||||
| 128,850 | Santos Ltd. | 647,224 | ||||||
| 12,596 | TotalEnergies S.E. | 791,482 | ||||||
| 11,329 | Tourmaline Oil Corporation | 689,513 | ||||||
| 28,549 | Woodside Energy Group Ltd. | 722,639 | ||||||
| 11,126,967 | ||||||||
| REAL ESTATE OWNERS & DEVELOPERS - 3.1% | ||||||||
| 98,475 | CK Asset Holdings Ltd. | 586,884 | ||||||
| 131,903 | Hongkong Land Holdings Ltd. | 528,931 | ||||||
| 447,786 | Sino Land Company Ltd. | 556,668 | ||||||
| 1,154,464 | SM Prime Holdings, Inc. | 744,948 | ||||||
| 26,044 | Sumitomo Realty & Development Company Ltd. | 700,874 | ||||||
| 275,031 | Swire Properties Ltd. | 615,502 | ||||||
| 27,647 | Vonovia S.E. | 676,629 | ||||||
| 4,410,436 | ||||||||
| RETAIL - CONSUMER STAPLES - 1.4% | ||||||||
| 31,430 | Aeon Company Ltd. | 642,557 | ||||||
| 464,306 | Cencosud S.A. | 688,146 | ||||||
| 31,400 | Jeronimo Martins SGPS S.A. | 693,561 | ||||||
| 2,024,264 | ||||||||
See accompanying notes to financial statements.
78
| INSPIRE INTERNATIONAL ETF |
| SCHEDULE OF INVESTMENTS (Continued) |
| November 30, 2022 |
| Shares | Fair Value | |||||||
| COMMON STOCKS — 99.6% (Continued) | ||||||||
| RETAIL - DISCRETIONARY - 0.6% | ||||||||
| 47,930 | SM Investments Corporation | $ | 797,842 | |||||
| SEMICONDUCTORS - 2.2% | ||||||||
| 1,441 | ASML Holding N.V. | 842,410 | ||||||
| 26,749 | Infineon Technologies A.G. | 878,442 | ||||||
| 3,975 | NXP Semiconductors N.V. | 698,964 | ||||||
| 19,152 | STMicroelectronics N.V. | 719,447 | ||||||
| 3,139,263 | ||||||||
| SOFTWARE - 1.4% | ||||||||
| 5,256 | Check Point Software Technologies Ltd.(a) | 698,154 | ||||||
| 16,920 | Dassault Systemes S.E. | 618,502 | ||||||
| 3,138 | Nice Ltd.(a) | 595,130 | ||||||
| 1,911,786 | ||||||||
| SPECIALTY FINANCE - 0.0%(d) | ||||||||
| 1 | Isracard Ltd. | 2 | ||||||
| TECHNOLOGY HARDWARE - 1.1% | ||||||||
| 7,300 | Garmin Ltd. | 678,827 | ||||||
| 1,551 | Samsung SDI Company Ltd. | 867,085 | ||||||
| 1,545,912 | ||||||||
| TECHNOLOGY SERVICES - 0.9% | ||||||||
| 7,259 | WNS Holdings Ltd. - ADR(a) | 612,079 | ||||||
| 6,095 | Wolters Kluwer N.V. | 668,050 | ||||||
| 1,280,129 | ||||||||
| TELECOMMUNICATIONS - 3.2% | ||||||||
| 712,719 | America Movil S.A.B. de C.V. | 692,764 | ||||||
| 218,644 | Koninklijke KPN N.V. | 670,192 | ||||||
| 88,714 | MTN Group Ltd. | 723,665 | ||||||
| 315,675 | Singapore Telecommunications Ltd. | 630,993 | ||||||
| 80,624 | Telefonica Brasil S.A. | 589,864 | ||||||
| 204,979 | Telia Company A.B. | 558,793 | ||||||
| 238,537 | Telstra Group Ltd. | 644,432 | ||||||
| 4,510,703 | ||||||||
See accompanying notes to financial statements.
79
| INSPIRE INTERNATIONAL ETF |
| SCHEDULE OF INVESTMENTS (Continued) |
| November 30, 2022 |
| Shares | Fair Value | |||||||
| COMMON STOCKS — 99.6% (Continued) | ||||||||
| TRANSPORTATION & LOGISTICS - 4.1% | ||||||||
| 5,686 | Aena SME S.A.,(a) | $ | 730,448 | |||||
| 26,608 | Atlantia SpA | 635,676 | ||||||
| 5,084 | DSV A/S | 796,013 | ||||||
| 11,537 | East Japan Railway Company | 652,614 | ||||||
| 2,850 | Kuehne + Nagel International A.G. | 688,481 | ||||||
| 78,488 | Poste Italiane SpA | 767,544 | ||||||
| 10,080 | Ryanair Holdings plc - ADR(a) | 762,955 | ||||||
| 74,422 | Transurban Group | 721,891 | ||||||
| 5,755,622 | ||||||||
| TRANSPORTATION EQUIPMENT - 0.5% | ||||||||
| 40,468 | Volvo A.B. | 770,158 | ||||||
| WHOLESALE - CONSUMER STAPLES - 0.5% | ||||||||
| 24,455 | ITOCHU Corporation | 759,238 | ||||||
| TOTAL COMMON STOCKS (Cost $140,202,997) | 140,198,419 | |||||||
See accompanying notes to financial statements.
80
| INSPIRE INTERNATIONAL ETF |
| SCHEDULE OF INVESTMENTS (Continued) |
| November 30, 2022 |
| Shares | Fair Value | |||||||
| COLLATERAL FOR SECURITIES LOANED — 0.4% | ||||||||
| MONEY MARKET FUND - 0.4% | ||||||||
| 588,390 | Fidelity Government Portfolio - Institutional Class, 3.60% (Cost $588,390) (c)(e) | 588,390 | ||||||
| TOTAL INVESTMENTS - 100.0% (Cost $140,791,387) | $ | 140,786,809 | ||||||
| OTHER ASSETS IN EXCESS OF LIABILITIES - 0.0%(d) | 42,062 | |||||||
| NET ASSETS - 100.0% | $ | 140,828,871 | ||||||
| A.B. | - Aktiebolag |
| ADR | - American Depositary Receipt |
| A.G. | - Aktiengesellschaft |
| A/S | - Anonim Sirketi |
| LTD | - Limited Company |
| N.V. | - Naamioze Vennootschap |
| OYJ | - Julkinen osakeyhtiö |
| PLC | - Public Limited Company |
| P.T. | - Perseroan Terbatas |
| REIT | - Real Estate Investment Trust |
| S.A. | - Société Anonyme |
| S.A.B. de C.V. | - Sociedad Anonima Bursátil de Capital Variable |
| S.E. | - Societas Europaea |
| SpA | - Società per azioni |
| (a) | - Non-income producing security. |
| (b) | - All or a portion of the security is on loan. The total fair value of the securities on loan as of November 30, 2022 was $545,387. |
| (c) | - Security was purchased with cash received as collateral for securities on loan at November 30, 2022. Total collateral had a value of $588,390 at November 30, 2022. |
| (d) | - Percentage rounds to less than 0.1%. |
| (e) | - Rate disclosed is the seven day effective yield as of November 30, 2022. |
See accompanying notes to financial statements.
81
| INSPIRE TACTICAL BALANCED ETF |
| SCHEDULE OF INVESTMENTS |
| November 30, 2022 |
| Shares | Fair Value | |||||||
| COMMON STOCKS — 5.6% | ||||||||
| AEROSPACE & DEFENSE - 0.0%(a) | ||||||||
| 99 | Teledyne Technologies, Inc.(b) | $ | 41,590 | |||||
| ASSET MANAGEMENT - 0.0%(a) | ||||||||
| 171 | LPL Financial Holdings, Inc. | 40,477 | ||||||
| BANKING - 0.1% | ||||||||
| 34 | First Citizens BancShares, Inc., Class A | 27,760 | ||||||
| 133 | Signature Bank | 18,554 | ||||||
| 126 | SVB Financial Group(b) | 29,204 | ||||||
| 75,518 | ||||||||
| BIOTECH & PHARMA - 0.1% | ||||||||
| 258 | Alnylam Pharmaceuticals, Inc.(b) | 56,912 | ||||||
| 77 | Biohaven Ltd.(b) | 1,218 | ||||||
| 474 | Incyte Corporation(b) | 37,764 | ||||||
| 95,894 | ||||||||
| CHEMICALS - 0.1% | ||||||||
| 252 | Albemarle Corporation | 70,054 | ||||||
| 741 | Mosaic Company (The) | 38,013 | ||||||
| 108,067 | ||||||||
| COMMERCIAL SUPPORT SERVICES - 0.3% | ||||||||
| 218 | Cintas Corporation | 100,667 | ||||||
| 679 | Republic Services, Inc. | 94,578 | ||||||
| 553 | Waste Connections, Inc. | 79,909 | ||||||
| 275,154 | ||||||||
| CONSTRUCTION MATERIALS - 0.0%(a) | ||||||||
| 179 | Advanced Drainage Systems, Inc. | 17,410 | ||||||
| 110 | Carlisle Companies, Inc. | 28,942 | ||||||
| 46,352 | ||||||||
| CONTAINERS & PACKAGING - 0.0%(a) | ||||||||
| 264 | Crown Holdings, Inc. | 21,703 | ||||||
| DATA CENTER REIT - 0.1% | ||||||||
| 632 | Digital Realty Trust, Inc. | 71,075 | ||||||
See accompanying notes to financial statements.
82
| INSPIRE TACTICAL BALANCED ETF |
| SCHEDULE OF INVESTMENTS (Continued) |
| November 30, 2022 |
| Shares | Fair Value | |||||||
| COMMON STOCKS — 5.6% (Continued) | ||||||||
| DIVERSIFIED INDUSTRIALS - 0.0%(a) | ||||||||
| 307 | Dover Corporation | $ | 43,579 | |||||
| ELECTRIC UTILITIES - 0.1% | ||||||||
| 1,424 | AES Corporation (The) | 41,182 | ||||||
| 538 | Alliant Energy Corporation | 30,289 | ||||||
| 833 | Avangrid, Inc. | 35,627 | ||||||
| 1,345 | CenterPoint Energy, Inc. | 41,844 | ||||||
| 148,942 | ||||||||
| ELECTRICAL EQUIPMENT - 0.3% | ||||||||
| 1,279 | Amphenol Corporation, Class A | 102,870 | ||||||
| 383 | Keysight Technologies, Inc.(b) | 69,281 | ||||||
| 229 | Roper Technologies, Inc. | 100,506 | ||||||
| 272,657 | ||||||||
| ENGINEERING & CONSTRUCTION - 0.0%(a) | ||||||||
| 305 | Quanta Services, Inc. | 45,713 | ||||||
| FOOD - 0.1% | ||||||||
| 345 | Darling Ingredients, Inc.(b) | 24,781 | ||||||
| 1,182 | Hormel Foods Corporation | 55,555 | ||||||
| 308 | Lamb Weston Holdings, Inc. | 26,765 | ||||||
| 107,101 | ||||||||
| HEALTH CARE FACILITIES & SERVICES - 0.1% | ||||||||
| 388 | Catalent, Inc.(b) | 19,450 | ||||||
| 124 | Molina Healthcare, Inc.(b) | 41,760 | ||||||
| 61,210 | ||||||||
| HEALTH CARE REIT - 0.0%(a) | ||||||||
| 852 | Ventas, Inc. | 39,644 | ||||||
| INDUSTRIAL REIT - 0.2% | ||||||||
| 1,587 | Prologis, Inc. | 186,933 | ||||||
| INDUSTRIAL SUPPORT SERVICES - 0.1% | ||||||||
| 150 | United Rentals, Inc.(b) | 52,955 | ||||||
See accompanying notes to financial statements.
83
| INSPIRE TACTICAL BALANCED ETF |
| SCHEDULE OF INVESTMENTS (Continued) |
| November 30, 2022 |
| Shares | Fair Value | |||||||
| COMMON STOCKS — 5.6% (Continued) | ||||||||
| INSTITUTIONAL FINANCIAL SERVICES - 0.1% | ||||||||
| 918 | Interactive Brokers Group, Inc., Class A | $ | 73,715 | |||||
| INSURANCE - 0.0%(a) | ||||||||
| 520 | Loews Corporation | 30,238 | ||||||
| MACHINERY - 0.1% | ||||||||
| 122 | Nordson Corporation | 28,852 | ||||||
| 275 | Parker-Hannifin Corporation | 82,208 | ||||||
| 111,060 | ||||||||
| MEDICAL EQUIPMENT & DEVICES - 0.6% | ||||||||
| 1,331 | Edwards Lifesciences Corporation(b) | 102,820 | ||||||
| 178 | IDEXX Laboratories, Inc.(b) | 75,805 | ||||||
| 767 | Intuitive Surgical, Inc.(b) | 207,389 | ||||||
| 49 | Mettler-Toledo International, Inc.(b) | 72,008 | ||||||
| 119 | Repligen Corporation(b) | 21,282 | ||||||
| 313 | ResMed, Inc. | 72,053 | ||||||
| 158 | West Pharmaceutical Services, Inc. | 37,076 | ||||||
| 588,433 | ||||||||
| METALS & MINING - 0.2% | ||||||||
| 3,092 | Freeport-McMoRan, Inc. | 123,062 | ||||||
| 1,704 | Newmont Corporation | 80,889 | ||||||
| 203,951 | ||||||||
| MULTI ASSET CLASS REIT - 0.0%(a) | ||||||||
| 417 | WP Carey, Inc. | 32,860 | ||||||
| OFFICE REIT - 0.1% | ||||||||
| 352 | Alexandria Real Estate Equities, Inc. | 54,775 | ||||||
| 339 | Boston Properties, Inc. | 24,435 | ||||||
| 79,210 | ||||||||
| OIL & GAS PRODUCERS - 0.2% | ||||||||
| 662 | Antero Resources Corporation(b) | 24,196 | ||||||
| 1,406 | Devon Energy Corporation | 96,339 | ||||||
| 384 | Diamondback Energy, Inc. | 56,840 | ||||||
| 177,375 | ||||||||
See accompanying notes to financial statements.
84
| INSPIRE TACTICAL BALANCED ETF |
| SCHEDULE OF INVESTMENTS (Continued) |
| November 30, 2022 |
| Shares | Fair Value | |||||||
| COMMON STOCKS — 5.6% (Continued) | ||||||||
| OIL & GAS SERVICES & EQUIPMENT - 0.1% | ||||||||
| 3,035 | Schlumberger N.V. | $ | 156,454 | |||||
| RENEWABLE ENERGY - 0.1% | ||||||||
| 291 | Enphase Energy, Inc.(b) | 93,292 | ||||||
| 228 | First Solar, Inc.(b) | 39,337 | ||||||
| 132,629 | ||||||||
| RESIDENTIAL REIT - 0.2% | ||||||||
| 231 | Camden Property Trust | 27,796 | ||||||
| 397 | Equity LifeStyle Properties, Inc. | 26,369 | ||||||
| 811 | Equity Residential | 52,601 | ||||||
| 1,307 | Invitation Homes, Inc. | 42,647 | ||||||
| 266 | Sun Communities, Inc. | 39,075 | ||||||
| 703 | UDR, Inc. | 29,153 | ||||||
| 217,641 | ||||||||
| RETAIL - DISCRETIONARY - 0.1% | ||||||||
| 302 | Genuine Parts Company | 55,366 | ||||||
| RETAIL REIT - 0.1% | ||||||||
| 1,330 | Realty Income Corporation | 83,883 | ||||||
| SELF-STORAGE REIT - 0.0%(a) | ||||||||
| 288 | Extra Space Storage, Inc. | 46,279 | ||||||
| SEMICONDUCTORS - 0.6% | ||||||||
| 1,107 | Analog Devices, Inc. | 190,303 | ||||||
| 319 | Entegris, Inc. | 24,656 | ||||||
| 305 | KLA Corporation | 119,911 | ||||||
| 1,190 | Microchip Technology, Inc. | 94,236 | ||||||
| 933 | ON Semiconductor Corporation(b) | 70,162 | ||||||
| 347 | Skyworks Solutions, Inc. | 33,180 | ||||||
| 338 | Teradyne, Inc. | 31,586 | ||||||
| 267 | Wolfspeed, Inc.(b) | 24,276 | ||||||
| 588,310 | ||||||||
See accompanying notes to financial statements.
85
| INSPIRE TACTICAL BALANCED ETF |
| SCHEDULE OF INVESTMENTS (Continued) |
| November 30, 2022 |
| Shares | Fair Value | |||||||
| COMMON STOCKS — 5.6% (Continued) | ||||||||
| SOFTWARE - 0.5% | ||||||||
| 187 | ANSYS, Inc.(b) | $ | 47,554 | |||||
| 428 | DocuSign, Inc.(b) | 20,146 | ||||||
| 103 | HubSpot, Inc.(b) | 31,212 | ||||||
| 435 | ServiceNow, Inc.(b) | 181,090 | ||||||
| 327 | Synopsys, Inc.(b) | 111,030 | ||||||
| 91 | Tyler Technologies, Inc.(b) | 31,189 | ||||||
| 333 | Veeva Systems, Inc., Class A(b) | 63,390 | ||||||
| 485,611 | ||||||||
| STEEL - 0.1% | ||||||||
| 563 | Nucor Corporation | 84,422 | ||||||
| 395 | Steel Dynamics, Inc. | 41,052 | ||||||
| 125,474 | ||||||||
| TECHNOLOGY HARDWARE - 0.1% | ||||||||
| 472 | NetApp, Inc. | 31,912 | ||||||
| 110 | Zebra Technologies Corporation, Class A(b) | 29,731 | ||||||
| 61,643 | ||||||||
| TECHNOLOGY SERVICES - 0.6% | ||||||||
| 871 | CoStar Group, Inc.(b) | 70,586 | ||||||
| 123 | EPAM Systems, Inc.(b) | 45,335 | ||||||
| 55 | Fair Isaac Corporation(b) | 34,085 | ||||||
| 1,305 | Fidelity National Information Services, Inc. | 94,717 | ||||||
| 162 | FleetCor Technologies, Inc.(b) | 31,784 | ||||||
| 171 | Gartner, Inc.(b) | 59,913 | ||||||
| 596 | Global Payments, Inc. | 61,853 | ||||||
| 173 | MSCI, Inc. | 87,855 | ||||||
| 773 | Paychex, Inc. | 95,874 | ||||||
| 338 | Verisk Analytics, Inc. | 62,094 | ||||||
| 644,096 | ||||||||
| TRANSPORTATION & LOGISTICS - 0.1% | ||||||||
| 353 | Expeditors International of Washington, Inc. | 40,969 | ||||||
| 223 | JB Hunt Transport Services, Inc. | 41,007 | ||||||
| 241 | Old Dominion Freight Line, Inc. | 72,930 | ||||||
| 154,906 | ||||||||
See accompanying notes to financial statements.
86
| INSPIRE TACTICAL BALANCED ETF |
| SCHEDULE OF INVESTMENTS (Continued) |
| November 30, 2022 |
| Shares | Fair Value | |||||||
| COMMON STOCKS — 5.6% (Continued) | ||||||||
| TRANSPORTATION EQUIPMENT - 0.1% | ||||||||
| 744 | PACCAR, Inc. | $ | 78,797 | |||||
| WHOLESALE - DISCRETIONARY - 0.0%(a) | ||||||||
| 595 | LKQ Corporation | 32,326 | ||||||
| TOTAL COMMON STOCKS (Cost $4,887,461) | 5,894,821 | |||||||
| EXCHANGE-TRADED FUNDS — 93.6% | ||||||||
| FIXED INCOME - 93.6% | ||||||||
| 980,792 | iShares Treasury Floating Rate Bond ETF | 49,559,419 | ||||||
| 982,818 | WisdomTree Floating Rate Treasury Fund | 49,386,605 | ||||||
| TOTAL EXCHANGE-TRADED FUNDS (Cost $98,950,152) | 98,946,024 | |||||||
| TOTAL INVESTMENTS - 99.2% (Cost $103,837,613) | $ | 104,840,845 | ||||||
| OTHER ASSETS IN EXCESS OF LIABILITIES - 0.8% | 893,043 | |||||||
| NET ASSETS - 100.0% | $ | 105,733,888 | ||||||
| ETF | - Exchange-Traded Fund |
| LTD | - Limited Company |
| MSCI | - Morgan Stanley Capital International |
| NV | - Naamioze Vennootschap |
| REIT | - Real Estate Investment Trust |
| (a) | - Percentage rounds to less than 0.1%. |
| (b) | - Non-income producing security. |
See accompanying notes to financial statements.
87
| INSPIRE FAITHWARD MID CAP MOMENTUM ETF |
| SCHEDULE OF INVESTMENTS |
| November 30, 2022 |
| Shares | Fair Value | |||||||
| COMMON STOCKS — 98.4% | ||||||||
| BIOTECH & PHARMA - 2.7% | ||||||||
| 3,886 | United Therapeutics Corporation(a) | $ | 1,087,653 | |||||
| CHEMICALS - 5.3% | ||||||||
| 18,023 | Olin Corporation | 1,026,951 | ||||||
| 10,385 | Westlake Corporation | 1,117,944 | ||||||
| 2,144,895 | ||||||||
| COMMERCIAL SUPPORT SERVICES - 2.8% | ||||||||
| 6,499 | FTI Consulting, Inc.(a) | 1,123,157 | ||||||
| CONSTRUCTION MATERIALS - 3.0% | ||||||||
| 4,623 | Carlisle Companies, Inc. | 1,216,358 | ||||||
| ELECTRIC UTILITIES - 2.8% | ||||||||
| 27,604 | OGE Energy Corporation | 1,116,858 | ||||||
| ENGINEERING & CONSTRUCTION - 2.7% | ||||||||
| 11,993 | MasTec, Inc.(a) | 1,089,324 | ||||||
| GAS & WATER UTILITIES - 5.2% | ||||||||
| 16,348 | National Fuel Gas Company | 1,082,728 | ||||||
| 14,740 | Southwest Gas Holdings, Inc. | 1,009,100 | ||||||
| 2,091,828 | ||||||||
| HEALTH CARE FACILITIES & SERVICES - 5.5% | ||||||||
| 2,144 | Chemed Corporation | 1,114,880 | ||||||
| 18,961 | Encompass Health Corporation | 1,108,839 | ||||||
| 2,223,719 | ||||||||
| INDUSTRIAL INTERMEDIATE PROD - 2.7% | ||||||||
| 3,216 | Valmont Industries, Inc. | 1,089,131 | ||||||
| INDUSTRIAL SUPPORT SERVICES - 2.6% | ||||||||
| 3,953 | Watsco, Inc. | 1,063,278 | ||||||
See accompanying notes to financial statements.
88
| INSPIRE FAITHWARD MID CAP MOMENTUM ETF |
| SCHEDULE OF INVESTMENTS (Continued) |
| November 30, 2022 |
| Shares | Fair Value | |||||||
| COMMON STOCKS — 98.4% (Continued) | ||||||||
| INSTITUTIONAL FINANCIAL SERVICES – 3.0% | ||||||||
| 19,028 | SEI Investments Company | $ | 1,185,064 | |||||
| INSURANCE - 10.3% | ||||||||
| 7,102 | American Financial Group, Inc. | 1,010,046 | ||||||
| 3,216 | Kinsale Capital Group, Inc. | 991,203 | ||||||
| 44,756 | Old Republic International Corporation | 1,096,523 | ||||||
| 7,236 | Reinsurance Group of America, Inc. | 1,044,878 | ||||||
| 4,142,650 | ||||||||
| LEISURE PRODUCTS - 2.8% | ||||||||
| 9,983 | Polaris, Inc. | 1,138,661 | ||||||
| MACHINERY - 2.6% | ||||||||
| 6,030 | Curtiss-Wright Corporation | 1,065,200 | ||||||
| OIL & GAS PRODUCERS - 7.6% | ||||||||
| 16,415 | HF Sinclair Corporation | 1,023,311 | ||||||
| 22,110 | Murphy Oil Corporation | 1,043,592 | ||||||
| 3,417 | Murphy USA, Inc. | 1,010,783 | ||||||
| 3,077,686 | ||||||||
| OIL & GAS SERVICES & EQUIPMENT - 2.5% | ||||||||
| 44,622 | NOV, Inc. | 1,002,210 | ||||||
| RETAIL - CONSUMER STAPLES - 5.3% | ||||||||
| 13,534 | BJ’s Wholesale Club Holdings, Inc.(a) | 1,018,298 | ||||||
| 4,623 | Casey’s General Stores, Inc. | 1,123,482 | ||||||
| 2,141,780 | ||||||||
| RETAIL - DISCRETIONARY - 5.9% | ||||||||
| 9,782 | AutoNation, Inc.(a) | 1,212,087 | ||||||
| 18,291 | Builders FirstSource, Inc.(a) | 1,169,344 | ||||||
| 2,381,431 | ||||||||
| RETAIL REIT - 2.7% | ||||||||
| 9,849 | Federal Realty Investment Trust | 1,094,224 | ||||||
See accompanying notes to financial statements.
89
| INSPIRE FAITHWARD MID CAP MOMENTUM ETF |
| SCHEDULE OF INVESTMENTS (Continued) |
| November 30, 2022 |
| Shares | Fair Value | |||||||
| COMMON STOCKS — 98.4% (Continued) | ||||||||
| SELF-STORAGE REIT - 2.7% | ||||||||
| 10,050 | Life Storage, Inc. | $ | 1,080,275 | |||||
| SEMICONDUCTORS - 3.6% | ||||||||
| 19,765 | Lattice Semiconductor Corporation(a) | 1,439,485 | ||||||
| SOFTWARE - 2.9% | ||||||||
| 9,313 | Qualys, Inc.(a) | 1,148,479 | ||||||
| SPECIALTY REITS - 2.9% | ||||||||
| 11,658 | Lamar Advertising Company, Class A | 1,167,432 | ||||||
| STEEL - 5.3% | ||||||||
| 5,092 | Reliance Steel & Aluminum Company | 1,075,889 | ||||||
| 33,500 | Ternium S.A. - ADR | 1,054,915 | ||||||
| 2,130,804 | ||||||||
| TRANSPORTATION & LOGISTICS - 3.0% | ||||||||
| 21,507 | Knight-Swift Transportation Holdings, Inc. | 1,192,132 | ||||||
| TOTAL COMMON STOCKS (Cost $38,230,874) | 39,633,714 | |||||||
| TOTAL INVESTMENTS - 98.4% (Cost $38,230,874) | $ | 39,633,714 | ||||||
| OTHER ASSETS IN EXCESS OF LIABILITIES - 1.6% | 648,546 | |||||||
| NET ASSETS - 100.0% | $ | 40,282,260 | ||||||
| ADR | - American Depositary Receipt |
| REIT | - Real Estate Investment Trust |
| S/A | - Société Anonyme |
| (a) | - Non-income producing security. |
See accompanying notes to financial statements.
90
| INSPIRE FIDELIS MULTI FACTOR ETF |
| SCHEDULE OF INVESTMENTS |
| November 30, 2022 |
| Shares | Fair Value | |||||||
| COMMON STOCKS — 98.0% | ||||||||
| BANKING - 8.7% | ||||||||
| 15,120 | Bancolombia S.A. - ADR | $ | 402,192 | |||||
| 13,095 | Capital City Bank Group, Inc. | 460,944 | ||||||
| 28,296 | First BanCorporation | 435,192 | ||||||
| 12,588 | First Business Financial Services, Inc. | 482,372 | ||||||
| 17,994 | First Horizon Corporation | 447,151 | ||||||
| 17,406 | Hanmi Financial Corporation | 470,832 | ||||||
| 2,301 | M&T Bank Corporation | 391,216 | ||||||
| 14,535 | Mid Penn Bancorp, Inc. | 479,655 | ||||||
| 12,441 | Peapack-Gladstone Financial Corporation | 512,818 | ||||||
| 4,082,372 | ||||||||
| BIOTECH & PHARMA - 6.9% | ||||||||
| 31,131 | Catalyst Pharmaceuticals, Inc.(a) | 522,067 | ||||||
| 16,707 | Corcept Therapeutics, Inc.(a) | 422,353 | ||||||
| 8,211 | Dr Reddy’s Laboratories Ltd. - ADR | 462,361 | ||||||
| 36,918 | Dynavax Technologies Corporation(a) | 458,152 | ||||||
| 24,696 | Exelixis, Inc.(a) | 421,808 | ||||||
| 6,120 | Incyte Corporation(a) | 487,580 | ||||||
| 33,768 | Innoviva, Inc.(a) | 443,374 | ||||||
| 3,217,695 | ||||||||
| CHEMICALS - 0.8% | ||||||||
| 4,749 | Nutrien Ltd. | 381,820 | ||||||
| COMMERCIAL SUPPORT SERVICES - 4.2% | ||||||||
| 5,184 | Barrett Business Services, Inc. | 509,743 | ||||||
| 14,472 | Cross Country Healthcare, Inc.(a) | 517,808 | ||||||
| 22,179 | Hackett Group, Inc. (The) | 512,335 | ||||||
| 13,608 | Heritage-Crystal Clean, Inc.(a) | 430,013 | ||||||
| 1,969,899 | ||||||||
| CONSTRUCTION MATERIALS - 1.5% | ||||||||
| 3,168 | Advanced Drainage Systems, Inc. | 308,120 | ||||||
| 1,440 | Carlisle Companies, Inc. | 378,878 | ||||||
| 686,998 | ||||||||
See accompanying notes to financial statements.
91
| INSPIRE FIDELIS MULTI FACTOR ETF |
| SCHEDULE OF INVESTMENTS (Continued) |
| November 30, 2022 |
| Shares | Fair Value | |||||||
| COMMON STOCKS — 98.0% (Continued) | ||||||||
| E-COMMERCE DISCRETIONARY - 1.0% | ||||||||
| 40,152 | Vipshop Holdings Ltd. - ADR(a) | $ | 447,695 | |||||
| ELECTRIC UTILITIES - 1.8% | ||||||||
| 6,048 | Otter Tail Corporation | 360,642 | ||||||
| 16,128 | Pampa Energia S.A. - ADR(a) | 462,067 | ||||||
| 822,709 | ||||||||
| ELECTRICAL EQUIPMENT - 5.0% | ||||||||
| 14,688 | Allied Motion Technologies, Inc. | 520,543 | ||||||
| 5,760 | Amphenol Corporation, Class A | 463,277 | ||||||
| 2,520 | Keysight Technologies, Inc.(a) | 455,843 | ||||||
| 12,534 | nVent Electric plc | 501,485 | ||||||
| 23,778 | SMART Global Holdings, Inc.(a) | 402,086 | ||||||
| 2,343,234 | ||||||||
| ENGINEERING & CONSTRUCTION - 0.0%(b) | ||||||||
| 24,225 | Sitios Latinoamerica S.A.B. de C.V.(a) | 10,800 | ||||||
| ENTERTAINMENT CONTENT - 0.8% | ||||||||
| 5,043 | NetEase, Inc. - ADR | 358,658 | ||||||
| FOOD - 3.8% | ||||||||
| 5,616 | Darling Ingredients, Inc.(a) | 403,397 | ||||||
| 17,700 | Hostess Brands, Inc.(a) | 467,280 | ||||||
| 5,469 | Lamb Weston Holdings, Inc. | 475,256 | ||||||
| 16,416 | Pilgrim’s Pride Corporation(a) | 429,443 | ||||||
| 1,775,376 | ||||||||
| FORESTRY, PAPER & WOOD PRODUCTS - 0.9% | ||||||||
| 31,749 | Mercer International, Inc. | 438,136 | ||||||
| HEALTH CARE FACILITIES & SERVICES - 1.9% | ||||||||
| 4,965 | Ensign Group, Inc. (The) | 471,675 | ||||||
| 1,224 | Molina Healthcare, Inc.(a) | 412,206 | ||||||
| 883,881 | ||||||||
| HOME CONSTRUCTION - 2.0% | ||||||||
| 5,832 | DR Horton, Inc. | 501,552 | ||||||
See accompanying notes to financial statements.
92
| INSPIRE FIDELIS MULTI FACTOR ETF |
| SCHEDULE OF INVESTMENTS (Continued) |
| November 30, 2022 |
| Shares | Fair Value | |||||||
| COMMON STOCKS — 98.0% (Continued) | ||||||||
| HOME CONSTRUCTION - 2.0% (Continued) | ||||||||
| 18,828 | Green Brick Partners, Inc.(a) | $ | 455,261 | |||||
| 956,813 | ||||||||
| INDUSTRIAL SUPPORT SERVICES - 2.4% | ||||||||
| 14,406 | Titan Machinery, Inc.(a) | 634,296 | ||||||
| 1,440 | United Rentals, Inc.(a) | 508,363 | ||||||
| 1,142,659 | ||||||||
| INSURANCE - 3.2% | ||||||||
| 8,928 | Arch Capital Group Ltd.(a) | 534,877 | ||||||
| 1,512 | Everest Re Group Ltd. | 510,965 | ||||||
| 6,264 | W R Berkley Corporation | 477,818 | ||||||
| 1,523,660 | ||||||||
| MACHINERY - 0.9% | ||||||||
| 1,872 | Nordson Corporation | 442,709 | ||||||
| MEDICAL EQUIPMENT & DEVICES - 2.3% | ||||||||
| 51,201 | EDAP TMS S.A. - ADR(a) | 579,596 | ||||||
| 6,267 | Hologic, Inc.(a) | 477,295 | ||||||
| 1,056,891 | ||||||||
| METALS & MINING - 1.1% | ||||||||
| 3,528 | Encore Wire Corporation | 515,476 | ||||||
| OIL & GAS PRODUCERS - 6.6% | ||||||||
| 7,776 | Canadian Natural Resources Ltd. | 464,383 | ||||||
| 6,129 | Devon Energy Corporation | 419,959 | ||||||
| 3,171 | Diamondback Energy, Inc. | 469,371 | ||||||
| 9,138 | Imperial Oil Ltd. | 521,323 | ||||||
| 1,512 | Murphy USA, Inc. | 447,265 | ||||||
| 13,605 | Suncor Energy, Inc. | 447,196 | ||||||
| 17,043 | Vermilion Energy, Inc. | 337,111 | ||||||
| 3,106,608 | ||||||||
| RETAIL - DISCRETIONARY - 6.6% | ||||||||
| 2,598 | Avis Budget Group, Inc.(a) | 580,913 | ||||||
| 12,732 | Buckle, Inc. (The) | 559,571 | ||||||
| 7,344 | Builders FirstSource, Inc.(a) | 469,502 | ||||||
See accompanying notes to financial statements.
93
| INSPIRE FIDELIS MULTI FACTOR ETF |
| SCHEDULE OF INVESTMENTS (Continued) |
| November 30, 2022 |
| Shares | Fair Value | |||||||
| COMMON STOCKS — 98.0% (Continued) | ||||||||
| RETAIL - DISCRETIONARY - 6.6% (Continued) | ||||||||
| 84,063 | Chico’s FAS, Inc.(a) | $ | 493,450 | |||||
| 2,664 | Genuine Parts Company | 488,391 | ||||||
| 3,960 | Penske Automotive Group, Inc. | 500,742 | ||||||
| 3,092,569 | ||||||||
| SELF-STORAGE REIT - 0.8% | ||||||||
| 2,235 | Extra Space Storage, Inc. | 359,142 | ||||||
| SEMICONDUCTORS - 7.1% | ||||||||
| 23,385 | Amkor Technology, Inc. | 655,248 | ||||||
| 864 | Broadcom, Inc. | 476,090 | ||||||
| 9,864 | CTS Corporation | 419,220 | ||||||
| 5,976 | ON Semiconductor Corporation(a) | 449,395 | ||||||
| 4,245 | Skyworks Solutions, Inc. | 405,907 | ||||||
| 21,249 | Veeco Instruments, Inc.(a) | 422,430 | ||||||
| 22,320 | Vishay Intertechnology, Inc. | 514,253 | ||||||
| 3,342,543 | ||||||||
| SOFTWARE - 3.8% | ||||||||
| 7,485 | Calix, Inc.(a) | 533,681 | ||||||
| 12,177 | Digi International, Inc.(a) | 517,157 | ||||||
| 10,725 | Donnelley Financial Solutions, Inc.(a) | 409,481 | ||||||
| 2,739 | Qualys, Inc.(a) | 337,773 | ||||||
| 1,798,092 | ||||||||
| SPECIALTY FINANCE - 2.2% | ||||||||
| 12,591 | Enova International, Inc.(a) | 507,921 | ||||||
| 51,195 | EZCORP, Inc., Class A(a) | 512,974 | ||||||
| 1,020,895 | ||||||||
| STEEL - 4.6% | ||||||||
| 3,600 | Nucor Corporation | 539,820 | ||||||
| 2,373 | Reliance Steel & Aluminum Company | 501,391 | ||||||
| 5,472 | Steel Dynamics, Inc. | 568,705 | ||||||
| 15,408 | Tenaris S.A. - ADR | 531,114 | ||||||
| 2,141,030 | ||||||||
| TECHNOLOGY HARDWARE - 8.2% | ||||||||
| 32,898 | A10 Networks, Inc. | 615,522 | ||||||
See accompanying notes to financial statements.
94
| INSPIRE FIDELIS MULTI FACTOR ETF |
| SCHEDULE OF INVESTMENTS (Continued) |
| November 30, 2022 |
| Shares | Fair Value | |||||||
| COMMON STOCKS — 98.0% (Continued) | ||||||||
| TECHNOLOGY HARDWARE - 8.2% (Continued) | ||||||||
| 32,262 | Extreme Networks, Inc.(a) | $ | 676,534 | |||||
| 37,704 | Harmonic, Inc.(a) | 578,379 | ||||||
| 7,128 | Jabil, Inc. | 514,570 | ||||||
| 8,928 | Sanmina Corporation(a) | 590,052 | ||||||
| 13,749 | Sierra Wireless, Inc.(a) | 403,258 | ||||||
| 28,809 | TTM Technologies, Inc.(a) | 462,961 | ||||||
| 3,841,276 | ||||||||
| TECHNOLOGY SERVICES - 1.0% | ||||||||
| 5,253 | Amdocs Ltd. | 466,782 | ||||||
| TELECOMMUNICATIONS - 1.8% | ||||||||
| 24,927 | America Movil S.A.B. de C.V., Class L - ADR | 485,079 | ||||||
| 14,184 | Telekomunikasi Indonesia Persero Tbk P.T. - ADR | 361,408 | ||||||
| 846,487 | ||||||||
| TIMBER REIT - 0.9% | ||||||||
| 13,392 | Weyerhaeuser Company | 438,052 | ||||||
| TRANSPORTATION & LOGISTICS - 2.9% | ||||||||
| 5,619 | Hub Group, Inc., Class A(a) | 472,839 | ||||||
| 2,448 | JB Hunt Transport Services, Inc. | 450,163 | ||||||
| 21,237 | Marten Transport Ltd. | 452,560 | ||||||
| 1,375,562 | ||||||||
See accompanying notes to financial statements.
95
| INSPIRE FIDELIS MULTI FACTOR ETF |
| SCHEDULE OF INVESTMENTS (Continued) |
| November 30, 2022 |
| Shares | Fair Value | |||||||
| WHOLESALE - DISCRETIONARY - 2.3% | ||||||||
| 55,818 | Hudson Technologies, Inc.(a) | $ | 630,185 | |||||
| 8,424 | LKQ Corporation | 457,676 | ||||||
| 1,087,861 | ||||||||
| TOTAL COMMON STOCKS (Cost $42,246,390) | 45,974,380 | |||||||
| TOTAL INVESTMENTS - 98.0% (Cost $42,246,390) | $ | 45,974,380 | ||||||
| OTHER ASSETS IN EXCESS OF LIABILITIES - 2.0% | 940,918 | |||||||
| NET ASSETS - 100.0% | $ | 46,915,298 | ||||||
| ADR | - American Depositary Receipt |
| REIT | - Real Estate Investment Trust |
| S.A. | - Société Anonyme |
| S.A.B de CV | - Sociedad Anonima de Capital Variable |
| (a) | - Non-income producing security. |
| (b) | - Percentage rounds to less than 0.1%. |
See accompanying notes to financial statements.
96
| The Inspire ETFs |
| STATEMENTS OF ASSETS AND LIABILITIES |
| November 30, 2022 |
| Inspire Global Hope | Inspire Small/Mid | Inspire Corporate | ||||||||||||||
| ETF | Cap ETF | Bond ETF | Inspire 100 ETF | |||||||||||||
| ASSETS | ||||||||||||||||
| Investment securities: | ||||||||||||||||
| At cost | $ | 128,943,212 | $ | 123,427,946 | $ | 234,610,066 | $ | 292,287,196 | ||||||||
| At value (includes securities on loan with a market value of $883,352, $933,413, $0, $0) | $ | 136,293,246 | $ | 125,022,486 | $ | 220,367,926 | $ | 277,158,024 | ||||||||
| Cash | 995,172 | 961,746 | 1,495,736 | 289,758 | ||||||||||||
| Foreign currencies (Cost $173,755, $0, $0 and $0, respectively) | 177,532 | — | — | — | ||||||||||||
| Receivable for investments sold | — | — | 34,387,706 | — | ||||||||||||
| Dividends and interest receivable | 467,082 | 145,623 | 2,195,395 | 194,823 | ||||||||||||
| Prepaid expenses | — | 5,064 | 6,292 | 8,219 | ||||||||||||
| TOTAL ASSETS | 137,933,032 | 126,134,919 | 258,453,055 | 277,650,824 | ||||||||||||
| LIABILITIES | ||||||||||||||||
| Payable for Fund shares repurchased | — | — | 34,387,706 | — | ||||||||||||
| Payable for investments purchased | — | — | 939,468 | — | ||||||||||||
| Securities lending collateral payable | 944,652 | 955,613 | — | — | ||||||||||||
| Investment advisory fees payable | 32,443 | 27,984 | 62,763 | 53,057 | ||||||||||||
| Payable to related parties | 15,842 | 14,915 | 24,149 | 24,817 | ||||||||||||
| Accrued expenses and other liabilities | 30,144 | 23,633 | 26,388 | 34,929 | ||||||||||||
| TOTAL LIABILITIES | 1,023,081 | 1,022,145 | 35,440,474 | 112,803 | ||||||||||||
| NET ASSETS | $ | 136,909,951 | $ | 125,112,774 | $ | 223,012,581 | $ | 277,538,021 | ||||||||
| Net Assets Consist Of: | ||||||||||||||||
| Paid in capital | $ | 135,484,557 | $ | 124,885,511 | $ | 249,298,822 | $ | 320,671,548 | ||||||||
| Accumulated earnings (deficit) | 1,425,394 | 227,263 | (26,286,241 | ) | (43,133,527 | ) | ||||||||||
| NET ASSETS | $ | 136,909,951 | $ | 125,112,774 | $ | 223,012,581 | $ | 277,538,021 | ||||||||
| Net Asset Value Per Share: | ||||||||||||||||
| Net Assets | $ | 136,909,951 | $ | 125,112,774 | $ | 223,012,581 | $ | 277,538,021 | ||||||||
| Shares of beneficial interest outstanding ($0 par value, unlimited shares authorized) | 4,250,000 | 3,950,000 | 9,700,000 | 8,750,000 | ||||||||||||
| Net asset value, offering and redemption price per share (Net Assets ÷ Shares Outstanding) | $ | 32.21 | $ | 31.67 | $ | 22.99 | $ | 31.72 | ||||||||
See accompanying notes to financial statements.
97
| The Inspire ETFs |
| STATEMENTS OF ASSETS AND LIABILITIES (Continued) |
| November 30, 2022 |
| Inspire Faithward Mid | ||||||||||||||||
| Inspire International | Inspire Tactical | Cap | Inspire Fidelis Multi | |||||||||||||
| ETF | Balanced ETF | Momentum ETF | Factor ETF | |||||||||||||
| ASSETS | ||||||||||||||||
| Investment securities: | ||||||||||||||||
| At cost | $ | 140,791,387 | $ | 103,837,613 | $ | 38,230,874 | $ | 42,246,390 | ||||||||
| At value (includes securities on loan with a market value of $545,387, $0, $0, $0) | $ | 140,786,809 | $ | 104,840,845 | $ | 39,633,714 | $ | 45,974,380 | ||||||||
| Cash | 47,990 | 964,794 | 625,392 | 947,144 | ||||||||||||
| Foreign currencies (Cost $168,554, $0, $0, and $0, respectively) | 170,089 | — | — | — | ||||||||||||
| Dividends and interest receivable | 508,609 | 6,094 | 42,389 | 30,528 | ||||||||||||
| Prepaid expenses | 3,488 | 2,699 | 2,616 | 22,608 | ||||||||||||
| TOTAL ASSETS | 141,516,985 | 105,814,432 | 40,304,111 | 46,974,660 | ||||||||||||
| LIABILITIES | ||||||||||||||||
| Securities lending collateral payable | 588,390 | — | — | — | ||||||||||||
| Investment advisory fees payable | 49,943 | 44,017 | 1,453 | 16,435 | ||||||||||||
| Payable to related parties | 19,071 | 13,482 | 4,970 | 10,030 | ||||||||||||
| Accrued expenses and other liabilities | 30,710 | 23,045 | 15,428 | 32,897 | ||||||||||||
| TOTAL LIABILITIES | 688,114 | 80,544 | 21,851 | 59,362 | ||||||||||||
| NET ASSETS | $ | 140,828,871 | $ | 105,733,888 | $ | 40,282,260 | $ | 46,915,298 | ||||||||
| Net Assets Consist Of: | ||||||||||||||||
| Paid in capital | $ | 151,877,526 | $ | 118,307,377 | $ | 45,488,916 | $ | 45,809,388 | ||||||||
| Accumulated earnings (deficit) | (11,048,655 | ) | (12,573,489 | ) | (5,206,656 | ) | 1,105,910 | |||||||||
| NET ASSETS | $ | 140,828,871 | $ | 105,733,888 | $ | 40,282,260 | $ | 46,915,298 | ||||||||
| Net Asset Value Per Share: | ||||||||||||||||
| Net Assets | $ | 140,828,871 | $ | 105,733,888 | $ | 40,282,260 | $ | 46,915,298 | ||||||||
| Shares of beneficial interest outstanding ($0 par value, unlimited shares authorized) | 5,350,000 | 4,525,000 | 1,675,000 | 1,800,000 | ||||||||||||
| Net asset value, offering and redemption price per share (Net Assets ÷ Shares Outstanding) | $ | 26.32 | $ | 23.37 | $ | 24.05 | $ | 26.06 | ||||||||
See accompanying notes to financial statements.
98
| The Inspire ETFs |
| STATEMENTS OF OPERATIONS |
| For the Year Ended November 30, 2022 |
| Inspire Global Hope | Inspire Small/Mid | Inspire Corporate | ||||||||||||||
| ETF | Cap ETF | Bond ETF | Inspire 100 ETF | |||||||||||||
| INVESTMENT INCOME | ||||||||||||||||
| Dividends | $ | 3,471,747 | $ | 1,974,634 | $ | — | $ | 3,966,915 | ||||||||
| Interest | 7,223 | 6,567 | 4,744,781 | 3,853 | ||||||||||||
| Securities lending income | 11,664 | 43,730 | — | 3,118 | ||||||||||||
| Less: Foreign withholding taxes | (338,253 | ) | (582 | ) | — | (994 | ) | |||||||||
| TOTAL INVESTMENT INCOME | 3,152,381 | 2,024,349 | 4,744,781 | 3,972,892 | ||||||||||||
| EXPENSES | ||||||||||||||||
| Investment advisory fees | 402,577 | 345,969 | 709,037 | 853,271 | ||||||||||||
| Custodian fees | 186,349 | 94,666 | 41,406 | 86,686 | ||||||||||||
| Administrative services | 123,448 | 80,200 | 168,523 | 160,161 | ||||||||||||
| Trustees fees and expenses | 18,509 | 17,439 | 20,674 | 22,999 | ||||||||||||
| Transfer agent fees | 16,228 | 12,910 | 12,456 | 12,338 | ||||||||||||
| Printing and postage expenses | 15,711 | 17,140 | 26,386 | 46,208 | ||||||||||||
| Audit fees | 15,014 | 14,993 | 14,927 | 15,007 | ||||||||||||
| Legal fees | 11,606 | 10,561 | 11,672 | 20,600 | ||||||||||||
| Professional fees | 11,097 | 13,883 | 20,810 | 31,404 | ||||||||||||
| Insurance expense | 1,821 | 1,814 | 3,510 | 3,506 | ||||||||||||
| Other Expenses | 19,133 | 13,893 | 23,127 | 22,850 | ||||||||||||
| TOTAL EXPENSES | 821,493 | 623,468 | 1,052,528 | 1,275,030 | ||||||||||||
| Less: Fees waived by the Adviser | (3,420 | ) | — | — | (279,811 | ) | ||||||||||
| NET EXPENSES | 818,073 | 623,468 | 1,052,528 | 995,219 | ||||||||||||
| NET INVESTMENT INCOME | 2,334,308 | 1,400,881 | 3,692,253 | 2,977,673 | ||||||||||||
| REALIZED AND UNREALIZED GAIN (LOSS) ON INVESTMENTS | ||||||||||||||||
| Net realized gain (loss) on: | ||||||||||||||||
| In-kind redemptions | — | 3,105,797 | (3,768,328 | ) | 9,202,366 | |||||||||||
| Investments | (6,094,522 | ) | (1,869,349 | ) | (12,198,109 | ) | (28,725,054 | ) | ||||||||
| Foreign currency transactions | 831 | (3 | ) | — | — | |||||||||||
| (6,093,691 | ) | 1,236,445 | (15,966,437 | ) | (19,522,688 | ) | ||||||||||
| Net change in unrealized appreciation (depreciation) on: | ||||||||||||||||
| Investments | (8,746,252 | ) | (5,788,115 | ) | (11,760,519 | ) | (32,276,314 | ) | ||||||||
| Foreign currency translations | (23,279 | ) | 11 | — | — | |||||||||||
| (8,769,531 | ) | (5,788,104 | ) | (11,760,519 | ) | (32,276,314 | ) | |||||||||
| NET REALIZED AND UNREALIZED LOSS ON INVESTMENTS | (14,863,222 | ) | (4,551,659 | ) | (27,726,956 | ) | (51,799,002 | ) | ||||||||
| NET DECREASE IN NET ASSETS RESULTING FROM OPERATIONS | $ | (12,528,914 | ) | $ | (3,150,778 | ) | $ | (24,034,703 | ) | $ | (48,821,329 | ) | ||||
See accompanying notes to financial statements.
99
| The Inspire ETFs |
| STATEMENTS OF OPERATIONS (Continued) |
| For the Year or Period Ended November 30, 2022 |
| Inspire Faithward | ||||||||||||||||
| Inspire International | Inspire Tactical | Mid Cap | Inspire Fidelis Multi | |||||||||||||
| ETF | Balanced ETF | Momentum ETF | Factor ETF * | |||||||||||||
| INVESTMENT INCOME | ||||||||||||||||
| Dividends | $ | 4,235,978 | $ | 1,675,082 | $ | 567,424 | $ | 175,315 | ||||||||
| Interest | 7,224 | 5,606 | 1,550 | 840 | ||||||||||||
| Securities lending income | 25,722 | 16,577 | — | — | ||||||||||||
| Less: Foreign withholding taxes | (605,058 | ) | (22 | ) | (127 | ) | (3,557 | ) | ||||||||
| TOTAL INVESTMENT INCOME | 3,663,866 | 1,697,243 | 568,847 | 172,598 | ||||||||||||
| EXPENSES | ||||||||||||||||
| Investment advisory fees | 532,835 | 554,868 | 173,966 | 49,119 | ||||||||||||
| Custodian fees | 187,194 | 49,176 | 21,599 | 8,931 | ||||||||||||
| Administrative services | 107,544 | 70,407 | 49,510 | 15,584 | ||||||||||||
| Printing and postage expenses | 20,750 | 9,157 | 13,867 | 11,700 | ||||||||||||
| Transfer agent fees | 19,000 | 11,954 | 9,424 | 3,013 | ||||||||||||
| Trustees fees and expenses | 18,807 | 16,309 | 13,580 | 2,565 | ||||||||||||
| Audit fees | 14,967 | 14,986 | 15,251 | 15,030 | ||||||||||||
| Professional fees | 14,165 | 13,986 | 10,235 | 2,853 | ||||||||||||
| Legal fees | 11,414 | 12,777 | 18,467 | 5,841 | ||||||||||||
| Insurance expense | 3,498 | 1,810 | 1,803 | 64 | ||||||||||||
| Other Expenses | 16,519 | 12,471 | 13,727 | 5,460 | ||||||||||||
| TOTAL EXPENSES | 946,693 | 767,901 | 341,429 | 120,160 | ||||||||||||
| Less: Fees waived by the Adviser | — | — | (88,117 | ) | — | |||||||||||
| NET EXPENSES | 946,693 | 767,901 | 253,312 | 120,160 | ||||||||||||
| NET INVESTMENT INCOME | 2,717,173 | 929,342 | 315,535 | 52,438 | ||||||||||||
| REALIZED AND UNREALIZED GAIN (LOSS) ON INVESTMENTS | ||||||||||||||||
| Net realized gain (loss) on: | ||||||||||||||||
| In-kind redemptions | 687,774 | 106,222 | 1,260,197 | 64,481 | ||||||||||||
| Investments | (10,908,931 | ) | (13,927,294 | ) | (6,681,464 | ) | (2,671,628 | ) | ||||||||
| Foreign currency transactions | (214,114 | ) | — | 5 | (141 | ) | ||||||||||
| (10,435,271 | ) | (13,821,072 | ) | (5,421,262 | ) | (2,607,288 | ) | |||||||||
| Net change in unrealized appreciation (depreciation) on: | ||||||||||||||||
| Investments | (3,237,825 | ) | (5,117,127 | ) | 1,738,275 | 3,727,990 | ||||||||||
| Foreign currency translations | (3,622 | ) | — | (19 | ) | 4 | ||||||||||
| (3,241,447 | ) | (5,117,127 | ) | 1,738,256 | 3,727,994 | |||||||||||
| NET REALIZED AND UNREALIZED GAIN (LOSS) ON INVESTMENTS | (13,676,718 | ) | (18,938,199 | ) | (3,683,006 | ) | 1,120,706 | |||||||||
| NET INCREASE (DECREASE) IN NET ASSETS RESULTING FROM OPERATIONS | $ | (10,959,545 | ) | $ | (18,008,857 | ) | $ | (3,367,471 | ) | $ | 1,173,144 | |||||
| * | The Inspire Fidelis Multi Factor ETF commenced operations on August 23, 2022. |
See accompanying notes to financial statements.
100
| Inspire Global Hope ETF |
| STATEMENTS OF CHANGES IN NET ASSETS |
| Year Ended | Year Ended | |||||||
| November 30, 2022 | November 30, 2021 | |||||||
| FROM OPERATIONS | ||||||||
| Net investment income | $ | 2,334,308 | $ | 2,758,181 | ||||
| Net realized gain (loss) on investments and foreign currency transactions | (6,093,691 | ) | 20,956,535 | |||||
| Net change in unrealized appreciation (depreciation) on investments and foreign currency translations | (8,769,531 | ) | 1,676,880 | |||||
| Net increase (decrease) in net assets resulting from operations | (12,528,914 | ) | 25,391,596 | |||||
| DISTRIBUTIONS TO SHAREHOLDERS | ||||||||
| From distributable earnings: | (12,383,320 | ) | (2,405,165 | ) | ||||
| Net decrease in net assets resulting from distributions to shareholders | (12,383,320 | ) | (2,405,165 | ) | ||||
| FROM SHARES OF BENEFICIAL INTEREST | ||||||||
| Proceeds from shares sold | 24,488,819 | 16,826,653 | ||||||
| Cost of shares redeemed | — | (22,942,204 | ) | |||||
| Transaction fees (Note 5) | 4,500 | 5,000 | ||||||
| Net increase (decrease) in net assets resulting from shares of beneficial interest | 24,493,319 | (6,110,551 | ) | |||||
| TOTAL INCREASE (DECREASE) IN NET ASSETS | (418,915 | ) | 16,875,880 | |||||
| NET ASSETS | ||||||||
| Beginning of Year | 137,328,866 | 120,452,986 | ||||||
| End of Year | $ | 136,909,951 | $ | 137,328,866 | ||||
| SHARE ACTIVITY | ||||||||
| Shares Sold | 700,000 | 450,000 | ||||||
| Shares Redeemed | — | (650,000 | ) | |||||
| Net increase (decrease) in shares of beneficial interest outstanding | 700,000 | (200,000 | ) | |||||
See accompanying notes to financial statements.
101
| Inspire Small/Mid Cap ETF |
| STATEMENTS OF CHANGES IN NET ASSETS |
| Year Ended | Year Ended | |||||||
| November 30, 2022 | November 30, 2021 | |||||||
| FROM OPERATIONS | ||||||||
| Net investment income | $ | 1,400,881 | $ | 1,232,021 | ||||
| Net realized gain on investments and foreign currency transactions | 1,236,445 | 29,850,226 | ||||||
| Net change in unrealized depreciation on investments and foreign currency translations | (5,788,104 | ) | (4,504,325 | ) | ||||
| Net increase (decrease) in net assets resulting from operations | (3,150,778 | ) | 26,577,922 | |||||
| DISTRIBUTIONS TO SHAREHOLDERS | ||||||||
| From return of capital | (226,508 | ) | — | |||||
| From distributable earnings: | (11,493,232 | ) | (1,008,145 | ) | ||||
| Net decrease in net assets resulting from distributions to shareholders | (11,719,740 | ) | (1,008,145 | ) | ||||
| FROM SHARES OF BENEFICIAL INTEREST | ||||||||
| Proceeds from shares sold | 41,691,699 | 23,410,418 | ||||||
| Cost of shares redeemed | (26,373,245 | ) | (10,314,230 | ) | ||||
| Transaction fees (Note 5) | 7,000 | 4,000 | ||||||
| Net increase in net assets resulting from shares of beneficial interest | 15,325,454 | 13,100,188 | ||||||
| TOTAL INCREASE IN NET ASSETS | 454,936 | 38,669,965 | ||||||
| NET ASSETS | ||||||||
| Beginning of Year | 124,657,838 | 85,987,873 | ||||||
| End of Year | $ | 125,112,774 | $ | 124,657,838 | ||||
| SHARE ACTIVITY | ||||||||
| Shares Sold | 1,350,000 | 650,000 | ||||||
| Shares Redeemed | (850,000 | ) | (300,000 | ) | ||||
| Net increase in shares of beneficial interest outstanding | 500,000 | 350,000 | ||||||
See accompanying notes to financial statements.
102
| Inspire Corporate Bond ETF |
| STATEMENTS OF CHANGES IN NET ASSETS |
| Year Ended | Year Ended | |||||||
| November 30, 2022 | November 30, 2021 | |||||||
| FROM OPERATIONS | ||||||||
| Net investment income | $ | 3,692,253 | $ | 1,997,066 | ||||
| Net realized gain (loss) on investments | (15,966,437 | ) | 3,197,394 | |||||
| Net change in unrealized depreciation on investments | (11,760,519 | ) | (7,460,826 | ) | ||||
| Net decrease in net assets resulting from operations | (24,034,703 | ) | (2,266,366 | ) | ||||
| DISTRIBUTIONS TO SHAREHOLDERS | ||||||||
| From distributable earnings: | (4,205,140 | ) | (2,091,010 | ) | ||||
| Net decrease in net assets resulting from distributions to shareholders | (4,205,140 | ) | (2,091,010 | ) | ||||
| FROM SHARES OF BENEFICIAL INTEREST | ||||||||
| Proceeds from shares sold | 81,092,592 | 118,021,775 | ||||||
| Cost of shares redeemed | (68,069,358 | ) | (42,275,130 | ) | ||||
| Transaction fees (Note 5) | 4,500 | 6,750 | ||||||
| Net increase in net assets resulting from shares of beneficial interest | 13,027,734 | 75,753,395 | ||||||
| TOTAL INCREASE (DECREASE) IN NET ASSETS | (15,212,109 | ) | 71,396,019 | |||||
| NET ASSETS | ||||||||
| Beginning of Year | 238,224,690 | 166,828,671 | ||||||
| End of Year | $ | 223,012,581 | $ | 238,224,690 | ||||
| SHARE ACTIVITY | ||||||||
| Shares Sold | 3,400,000 | 4,500,000 | ||||||
| Shares Redeemed | (2,900,000 | ) | (1,600,000 | ) | ||||
| Net increase in shares of beneficial interest outstanding | 500,000 | 2,900,000 | ||||||
See accompanying notes to financial statements.
103
| Inspire 100 ETF |
| STATEMENTS OF CHANGES IN NET ASSETS |
| Year Ended | Year Ended | |||||||
| November 30, 2022 | November 30, 2021 | |||||||
| FROM OPERATIONS | ||||||||
| Net investment income | $ | 2,977,673 | $ | 2,395,648 | ||||
| Net realized gain (loss) on investments | (19,522,688 | ) | 53,803,970 | |||||
| Net change in unrealized depreciation on investments | (32,276,314 | ) | (9,930,520 | ) | ||||
| Net increase (decrease) in net assets resulting from operations | (48,821,329 | ) | 46,269,098 | |||||
| DISTRIBUTIONS TO SHAREHOLDERS | ||||||||
| From distributable earnings: | (47,948,095 | ) | (3,163,725 | ) | ||||
| Net decrease in net assets resulting from distributions to shareholders | (47,948,095 | ) | (3,163,725 | ) | ||||
| FROM SHARES OF BENEFICIAL INTEREST | ||||||||
| Proceeds from shares sold | 135,768,391 | 126,510,363 | ||||||
| Cost of shares redeemed | (57,439,730 | ) | (22,987,934 | ) | ||||
| Transaction fees (Note 5) | 17,250 | 13,250 | ||||||
| Net increase in net assets resulting from shares of beneficial interest | 78,345,911 | 103,535,679 | ||||||
| TOTAL INCREASE (DECREASE) IN NET ASSETS | (18,423,513 | ) | 146,641,052 | |||||
| NET ASSETS | ||||||||
| Beginning of Year | 295,961,534 | 149,320,482 | ||||||
| End of Year | $ | 277,538,021 | $ | 295,961,534 | ||||
| SHARE ACTIVITY | ||||||||
| Shares Sold | 3,850,000 | 3,100,000 | ||||||
| Shares Redeemed | (1,800,000 | ) | (550,000 | ) | ||||
| Net increase in shares of beneficial interest outstanding | 2,050,000 | 2,550,000 | ||||||
See accompanying notes to financial statements.
104
| Inspire International ETF |
| STATEMENTS OF CHANGES IN NET ASSETS |
| Year Ended | Year Ended | |||||||
| November 30, 2022 | November 30, 2021 | |||||||
| FROM OPERATIONS | ||||||||
| Net investment income | $ | 2,717,173 | $ | 2,310,590 | ||||
| Net realized gain (loss) on investments and foreign currency transactions | (10,435,271 | ) | 18,893,284 | |||||
| Net change in unrealized depreciation on investments and foreign currency translations | (3,241,447 | ) | (8,512,922 | ) | ||||
| Net increase (decrease) in net assets resulting from operations | (10,959,545 | ) | 12,690,952 | |||||
| DISTRIBUTIONS TO SHAREHOLDERS | ||||||||
| From distributable earnings: | (15,197,630 | ) | (2,312,460 | ) | ||||
| Net decrease in net assets resulting from distributions to shareholders | (15,197,630 | ) | (2,312,460 | ) | ||||
| FROM SHARES OF BENEFICIAL INTEREST | ||||||||
| Proceeds from shares sold | 61,144,967 | 38,749,118 | ||||||
| Cost of shares redeemed | (5,175,616 | ) | (16,028,210 | ) | ||||
| Transaction fees (Note 5) | 8,000 | 7,500 | ||||||
| Net increase in net assets resulting from shares of beneficial interest | 55,977,351 | 22,728,408 | ||||||
| TOTAL INCREASE IN NET ASSETS | 29,820,176 | 33,106,900 | ||||||
| NET ASSETS | ||||||||
| Beginning of Year | 111,008,695 | 77,901,795 | ||||||
| End of Year | $ | 140,828,871 | $ | 111,008,695 | ||||
| SHARE ACTIVITY | ||||||||
| Shares Sold | 2,200,000 | 1,150,000 | ||||||
| Shares Redeemed | (150,000 | ) | (500,000 | ) | ||||
| Net increase in shares of beneficial interest outstanding | 2,050,000 | 650,000 | ||||||
See accompanying notes to financial statements.
105
| Inspire Tactical Balanced ETF |
| STATEMENTS OF CHANGES IN NET ASSETS |
| Year Ended | Year Ended | |||||||
| November 30, 2022 | November 30, 2021 | |||||||
| FROM OPERATIONS | ||||||||
| Net investment income | $ | 929,342 | $ | 642,124 | ||||
| Net realized gain (loss) on investments | (13,821,072 | ) | 11,271,049 | |||||
| Net change in unrealized appreciation (depreciation) on investments | (5,117,127 | ) | 4,294,080 | |||||
| Net increase (decrease) in net assets resulting from operations | (18,008,857 | ) | 16,207,253 | |||||
| DISTRIBUTIONS TO SHAREHOLDERS | ||||||||
| From distributable earnings: | (10,101,833 | ) | (3,641,975 | ) | ||||
| Net decrease in net assets resulting from distributions to shareholders | (10,101,833 | ) | (3,641,975 | ) | ||||
| FROM SHARES OF BENEFICIAL INTEREST | ||||||||
| Proceeds from shares sold | 32,986,481 | 29,948,906 | ||||||
| Cost of shares redeemed | (8,975,358 | ) | (4,250,027 | ) | ||||
| Transaction fees (Note 5) | 9,250 | 7,750 | ||||||
| Net increase in net assets resulting from shares of beneficial interest | 24,020,373 | 25,706,629 | ||||||
| TOTAL INCREASE (DECREASE) IN NET ASSETS | (4,090,317 | ) | 38,271,907 | |||||
| NET ASSETS | ||||||||
| Beginning of Year | 109,824,205 | 71,552,298 | ||||||
| End of Year | $ | 105,733,888 | $ | 109,824,205 | ||||
| SHARE ACTIVITY | ||||||||
| Shares Sold | 1,250,000 | 1,075,000 | ||||||
| Shares Redeemed | (375,000 | ) | (150,000 | ) | ||||
| Net increase in shares of beneficial interest outstanding | 875,000 | 925,000 | ||||||
See accompanying notes to financial statements.
106
| Inspire Faithward Mid Cap Momentum ETF |
| STATEMENT OF CHANGES IN NET ASSETS |
| Year Ended | Period Ended | |||||||
| November 30, 2022 | November 30, 2021 (a) | |||||||
| FROM OPERATIONS | ||||||||
| Net investment income | $ | 315,535 | $ | 108,082 | ||||
| Net realized gain (loss) on investments and foreign currency transactions | (5,421,262 | ) | 3,906,784 | |||||
| Net change in unrealized appreciation (depreciation) on investments and foreign currency translations | 1,738,256 | (335,449 | ) | |||||
| Net increase (decrease) in net assets resulting from operations | (3,367,471 | ) | 3,679,417 | |||||
| DISTRIBUTIONS TO SHAREHOLDERS | ||||||||
| From distributable earnings: | (1,890,822 | ) | (58,050 | ) | ||||
| Net decrease in net assets resulting from distributions to shareholders | (1,890,822 | ) | (58,050 | ) | ||||
| FROM SHARES OF BENEFICIAL INTEREST | ||||||||
| Proceeds from shares sold | 25,843,038 | 59,461,608 | ||||||
| Cost of shares redeemed | (24,250,314 | ) | (19,147,396 | ) | ||||
| Transaction fees (Note 5) | 4,000 | 8,250 | ||||||
| Net increase in net assets resulting from shares of beneficial interest | 1,596,724 | 40,322,462 | ||||||
| TOTAL INCREASE (DECREASE) IN NET ASSETS | (3,661,569 | ) | 43,943,829 | |||||
| NET ASSETS | ||||||||
| Beginning of Period | 43,943,829 | — | ||||||
| End of Period | $ | 40,282,260 | $ | 43,943,829 | ||||
| SHARE ACTIVITY | ||||||||
| Shares Sold | 1,100,000 | 2,125,000 | ||||||
| Shares Redeemed | (925,000 | ) | (625,000 | ) | ||||
| Net increase in shares of beneficial interest outstanding | 175,000 | 1,500,000 | ||||||
| (a) | The Inspire Faithward Mid Cap Momentum ETF commenced operations on December 7, 2020. |
See accompanying notes to financial statements.
107
| Inspire Fidelis Multi Factor ETF |
| STATEMENT OF CHANGES IN NET ASSETS |
| Period Ended | ||||
| November 30, 2022 (a) | ||||
| FROM OPERATIONS | ||||
| Net investment income | $ | 52,438 | ||
| Net realized loss on investments | (2,607,288 | ) | ||
| Net change in unrealized appreciation on investments | 3,727,994 | |||
| Net increase in net assets resulting from operations | 1,173,144 | |||
| DISTRIBUTIONS TO SHAREHOLDERS | ||||
| From distributable earnings: | (33,425 | ) | ||
| Net decrease in net assets resulting from distributions to shareholders | (33,425 | ) | ||
| FROM SHARES OF BENEFICIAL INTEREST | ||||
| Proceeds from shares sold | 46,975,373 | |||
| Cost of shares redeemed | (1,202,044 | ) | ||
| Transaction fees (Note 5) | 2,250 | |||
| Net increase in net assets resulting from shares of beneficial interest | 45,775,579 | |||
| TOTAL INCREASE IN NET ASSETS | 46,915,298 | |||
| NET ASSETS | ||||
| Beginning of Period | — | |||
| End of Period | $ | 46,915,298 | ||
| SHARE ACTIVITY | ||||
| Shares Sold | 1,850,000 | |||
| Shares Redeemed | (50,000 | ) | ||
| Net increase in shares of beneficial interest outstanding | 1,800,000 | |||
| (a) | The Inspire Fidelis Multi Factor ETF commenced operations on August 23, 2022. |
See accompanying notes to financial statements.
108
| Inspire Global Hope ETF |
| FINANCIAL HIGHLIGHTS |
Per Share Data and Ratios for a Share of Beneficial Interest Outstanding Throughout Each Year Presented
| Year Ended | Year Ended | Year Ended | Year Ended | Year Ended | ||||||||||||||||
| November 30, 2022 | November 30, 2021 | November 30, 2020 | November 30, 2019 | November 30, 2018 | ||||||||||||||||
| Net asset value, beginning of year | $ | 38.68 | $ | 32.12 | $ | 29.21 | $ | 26.20 | $ | 27.86 | ||||||||||
| Activity from investment operations: | ||||||||||||||||||||
| Net investment income (1) | 0.57 | 0.78 | 0.50 | 0.67 | 0.48 | |||||||||||||||
| Net realized and unrealized gain (loss) on investments | (3.62 | ) | 6.46 | 2.96 | 3.08 | (1.49 | ) | |||||||||||||
| Total from investment operations | (3.05 | ) | 7.24 | 3.46 | 3.75 | (1.01 | ) | |||||||||||||
| Less distributions from: | ||||||||||||||||||||
| Net investment income | (0.52 | ) | (0.68 | ) | (0.52 | ) | (0.58 | ) | (0.49 | ) | ||||||||||
| Net realized gains | (2.90 | ) | — | (0.03 | ) | (0.16 | ) | (0.16 | ) | |||||||||||
| Total distributions | (3.42 | ) | (0.68 | ) | (0.55 | ) | (0.74 | ) | (0.65 | ) | ||||||||||
| Net asset value, end of year | $ | 32.21 | $ | 38.68 | $ | 32.12 | $ | 29.21 | $ | 26.20 | ||||||||||
| Total return (3) | (8.59 | )% | 22.63 | % | 12.35 | % | 14.60 | % | (3.74 | )% | ||||||||||
| Net assets, at end of year (000s) | $ | 136,910 | $ | 137,329 | $ | 120,453 | $ | 160,673 | $ | 87,770 | ||||||||||
| Ratio of gross expenses to average net assets | 0.61 | % (5) | 0.49 | % | 0.61 | % | 0.52 | % (5) | 0.62 | % | ||||||||||
| Ratio of net expenses to average net assets | 0.61 | % (4) | 0.49 | % | 0.61 | % | 0.54 | % (4) | 0.62 | % | ||||||||||
| Ratio of net investment income to average net assets | 1.74 | % | 2.08 | % | 1.82 | % | 2.42 | % | 1.71 | % | ||||||||||
| Portfolio Turnover Rate (2) | 51 | % | 94 | % | 36 | % | 22 | % | 22 | % | ||||||||||
| (1) | Per share amounts calculated using the average shares method, which more appropriately presents the per share data for the period. |
| (2) | Portfolio turnover rate excludes portfolio securities received or delivered as a result of processing capital share transactions in Creation Units. |
| (3) | Total return is calculated assuming a purchase of shares at net asset value on the first day and a sale at net asset value on the last day of the period. Distributions are assumed, for the purpose of this calculation, to be reinvested at the ex-dividend date net asset value per share on their respective payment dates. |
| (4) | Represents the ratio of expenses to average net assets after adviser recapture of waived/reimbursed fees from prior periods. |
| (5) | Represents the ratio of expenses to average net assets before adviser recapture of waived/reimbursed fees from prior periods. |
See accompanying notes to financial statements.
109
| Inspire Small/Mid Cap ETF |
| FINANCIAL HIGHLIGHTS |
Per Share Data and Ratios for a Share of Beneficial Interest Outstanding Throughout Each Year Presented
| Year Ended | Year Ended | Year Ended | Year Ended | Year Ended | ||||||||||||||||
| November 30, 2022 | November 30, 2021 | November 30, 2020 | November 30, 2019 | November 30, 2018 | ||||||||||||||||
| Net asset value, beginning of year | $ | 36.13 | $ | 27.74 | $ | 27.56 | $ | 26.73 | $ | 26.82 | ||||||||||
| Activity from investment operations: | ||||||||||||||||||||
| Net investment income (1) | 0.38 | 0.38 | 0.37 | 0.32 | 0.30 | |||||||||||||||
| Net realized and unrealized gain (loss) on investments | (1.46 | ) | 8.32 | 0.13 | (4) | 1.29 | 0.20 | (4) | ||||||||||||
| Total from investment operations | (1.08 | ) | 8.70 | 0.50 | 1.61 | 0.50 | ||||||||||||||
| Less distributions from: | ||||||||||||||||||||
| Net investment income | (0.32 | ) | (0.31 | ) | (0.31 | ) | (0.22 | ) | (0.21 | ) | ||||||||||
| Net realized gains | (3.00 | ) | — | (0.01 | ) | (0.56 | ) | (0.38 | ) | |||||||||||
| Return of capital | (0.06 | ) | — | — | — | — | ||||||||||||||
| Total distributions | (3.38 | ) | (0.31 | ) | (0.32 | ) | (0.78 | ) | (0.59 | ) | ||||||||||
| Net asset value, end of year | $ | 31.67 | $ | 36.13 | $ | 27.74 | $ | 27.56 | $ | 26.73 | ||||||||||
| Total return (3) | (3.34 | )% | 31.44 | % | 2.12 | % | 6.42 | % | 1.89 | % | ||||||||||
| Net assets, at end of year (000s) | $ | 125,113 | $ | 124,658 | $ | 85,988 | $ | 99,226 | $ | 50,788 | ||||||||||
| Ratio of gross expenses to average net assets | 0.54 | % | 0.48 | % (6) | 0.57 | % (6) | 0.64 | % | 0.71 | % | ||||||||||
| Ratio of net expenses to average net assets | 0.54 | % | 0.52 | % (5) | 0.60 | % (5) | 0.60 | % | 0.62 | % | ||||||||||
| Ratio of net investment income to average net assets | 1.21 | % | 1.08 | % | 1.53 | % | 1.24 | % | 1.07 | % | ||||||||||
| Portfolio Turnover Rate (2) | 43 | % | 168 | % | 92 | % | 42 | % | 24 | % | ||||||||||
| (1) | Per share amounts calculated using the average shares method, which more appropriately presents the per share data for the period. |
| (2) | Portfolio turnover rate excludes portfolio securities received or delivered as a result of processing capital share transactions in Creation Units. |
| (3) | Total return is calculated assuming a purchase of shares at net asset value on the first day and a sale at net asset value on the last day of the period. Distributions are assumed, for the purpose of this calculation, to be reinvested at the ex-dividend date net asset value per share on their respective payment dates. |
| (4) | The amount of net realized and unrealized gain (loss) on investments per share does not accord with the amounts in the Statements of Operations due to the timing of shareholder subscriptions and redemptions relative to fluctuating net asset values during the year. |
| (5) | Represents the ratio of expenses to average net assets after adviser recapture of waived/reimbursed fees from prior periods. |
| (6) | Represents the ratio of expenses to average net assets before adviser recapture of waived/reimbursed fees from prior periods. |
See accompanying notes to financial statements.
110
| Inspire Corporate Bond ETF |
| FINANCIAL HIGHLIGHTS |
Per Share Data and Ratios for a Share of Beneficial Interest Outstanding Throughout Each Year Presented
| Year Ended | Year Ended | Year Ended | Year Ended | Year Ended | ||||||||||||||||
| November 30, 2022 | November 30, 2021 | November 30, 2020 | November 30, 2019 | November 30, 2018 | ||||||||||||||||
| Net asset value, beginning of year | $ | 25.89 | $ | 26.48 | $ | 25.69 | $ | 24.18 | $ | 24.95 | ||||||||||
| Activity from investment operations: | ||||||||||||||||||||
| Net investment income (1) | 0.37 | 0.27 | 0.45 | 0.64 | 0.56 | |||||||||||||||
| Net realized and unrealized gain (loss) on investments | (2.85 | ) | (0.57 | ) | 0.86 | 1.49 | (0.81 | ) | ||||||||||||
| Total from investment operations | (2.48 | ) | (0.30 | ) | 1.31 | 2.13 | (0.25 | ) | ||||||||||||
| Less distributions from: | ||||||||||||||||||||
| Net investment income | (0.35 | ) | (0.29 | ) | (0.44 | ) | (0.62 | ) | (0.52 | ) | ||||||||||
| Net realized gains | (0.07 | ) | — | (0.08 | ) | — | (0.00 | ) (6) | ||||||||||||
| Total distributions | (0.42 | ) | (0.29 | ) | (0.52 | ) | (0.62 | ) | (0.52 | ) | ||||||||||
| Net asset value, end of year | $ | 22.99 | $ | 25.89 | $ | 26.48 | $ | 25.69 | $ | 24.18 | ||||||||||
| Total return (3) | (9.64 | )% | (1.15 | )% | 5.16 | % | 8.91 | % | (0.99 | )% | ||||||||||
| Net assets, at end of year (000s) | $ | 223,013 | $ | 238,225 | $ | 166,829 | $ | 138,723 | $ | 58,031 | ||||||||||
| Ratio of gross expenses to average net assets | 0.45 | % | 0.44 | % | 0.49 | % | 0.50% (5) | 0.68 | % | |||||||||||
| Ratio of net expenses to average net assets | 0.45 | % | 0.44 | % | 0.49 | % | 0.58% (4) | 0.62 | % | |||||||||||
| Ratio of net investment income to average net assets | 1.56 | % | 1.04 | % | 1.75 | % | 2.52 | % | 2.27 | % | ||||||||||
| Portfolio Turnover Rate (2) | 47 | % | 126 | % | 35 | % | 18 | % | 5 | % | ||||||||||
| (1) | Per share amounts calculated using the average shares method, which more appropriately presents the per share data for the period. |
| (2) | Portfolio turnover rate excludes portfolio securities received or delivered as a result of processing capital share transactions in Creation Units. |
| (3) | Total return is calculated assuming a purchase of shares at net asset value on the first day and a sale at net asset value on the last day of the period. Distributions are assumed, for the purpose of this calculation, to be reinvested at the ex-dividend date net asset value per share on their respective payment dates. |
| (4) | Represents the ratio of expenses to average net assets after adviser recapture of waived/reimbursed fees from prior periods. |
| (5) | Represents the ratio of expenses to average net assets before adviser recapture of waived/reimbursed fees from prior periods. |
| (6) | Represents less than $0.005. |
See accompanying notes to financial statements.
111
| Inspire 100 ETF |
| FINANCIAL HIGHLIGHTS |
Per Share Data and Ratios for a Share of Beneficial Interest Outstanding Throughout Each Year Presented
| Year Ended | Year Ended | Year Ended | Year Ended | Year Ended | ||||||||||||||||
| November 30, 2022 | November 30, 2021 | November 30, 2020 | November 30, 2019 | November 30, 2018 | ||||||||||||||||
| Net asset value, beginning of year | $ | 44.17 | $ | 35.98 | $ | 29.52 | $ | 26.06 | $ | 25.69 | ||||||||||
| Activity from investment operations: | ||||||||||||||||||||
| Net investment income (1) | 0.35 | 0.43 | 0.41 | 0.43 | 0.61 | |||||||||||||||
| Net realized and unrealized gain (loss) on investments | (5.81 | ) | 8.39 | 6.43 | 3.35 | 0.19 | (4) | |||||||||||||
| Total from investment operations | (5.46 | ) | 8.82 | 6.84 | 3.78 | 0.80 | ||||||||||||||
| Less distributions from: | ||||||||||||||||||||
| Net investment income | (0.33 | ) | (0.43 | ) | (0.38 | ) | (0.31 | ) | (0.42 | ) | ||||||||||
| Net realized gains | (6.66 | ) | (0.20 | ) | — | (0.01 | ) | — | ||||||||||||
| Return of capital | — | — | — | — | (0.01 | ) | ||||||||||||||
| Total distributions | (6.99 | ) | (0.63 | ) | (0.38 | ) | (0.32 | ) | (0.43 | ) | ||||||||||
| Net asset value, end of year | $ | 31.72 | $ | 44.17 | $ | 35.98 | $ | 29.52 | $ | 26.06 | ||||||||||
| Total return (3) | (14.69 | )% | 24.79 | % | 23.50 | % | 14.64 | % | 3.09 | % | ||||||||||
| Net assets, at end of year (000s) | $ | 277,538 | $ | 295,962 | $ | 149,320 | $ | 92,986 | $ | 39,085 | ||||||||||
| Ratio of gross expenses to average net assets (5) | 0.45 | % | 0.42 | % | 0.48 | % | 0.57 | % | 0.84 | % | ||||||||||
| Ratio of net expenses to average net assets | 0.35 | % | 0.35 | % | 0.35 | % | 0.35 | % | 0.35 | % | ||||||||||
| Ratio of net investment income to average net assets | 1.05 | % | 1.04 | % | 1.31 | % | 1.59 | % | 2.27 | % | ||||||||||
| Portfolio Turnover Rate (2) | 28 | % | 100 | % | 60 | % | 23 | % | 8 | % | ||||||||||
| (1) | Per share amounts calculated using the average shares method, which more appropriately presents the per share data for the period. |
| (2) | Portfolio turnover rate excludes portfolio securities received or delivered as a result of processing capital share transactions in Creation Units. |
| (3) | Total return is calculated assuming a purchase of shares at net asset value on the first day and a sale at net asset value on the last day of the period. Distributions are assumed, for the purpose of this calculation, to be reinvested at the ex-dividend date net asset value per share on their respective payment dates. |
| (4) | The amount of net realized and unrealized gain (loss) on investments per share does not accord with the amounts in the Statements of Operations due to the timing of shareholder subscriptions and redemptions relative to fluctuating net asset values during the year. |
| (5) | Represents the ratio of expenses to average net assets absent fee waivers and/or expense reimbursements by the adviser. |
See accompanying notes to financial statements.
112
| Inspire International ETF |
| FINANCIAL HIGHLIGHTS |
Per Share Data and Ratios for a Share of Beneficial Interest Outstanding Throughout Each Year or Period Presented
| Year Ended | Year Ended | Year Ended | Period Ended | |||||||||||||
| November 30, 2022 | November 30, 2021 | November 30, 2020 | November 30, 2019 (1) | |||||||||||||
| Net asset value, beginning of period | $ | 33.64 | $ | 29.40 | $ | 26.51 | $ | 25.00 | ||||||||
| Activity from investment operations: | ||||||||||||||||
| Net investment income (loss) (2) | 0.61 | 0.81 | 0.36 | (0.05 | ) | |||||||||||
| Net realized and unrealized gain (loss) on investments | (3.36 | ) | 4.22 | 2.81 | 1.56 | |||||||||||
| Total from investment operations | (2.75 | ) | 5.03 | 3.17 | 1.51 | |||||||||||
| Less distributions from: | ||||||||||||||||
| Net investment income | (0.60 | ) | (0.79 | ) | (0.28 | ) | — | |||||||||
| Net realized gains | (3.97 | ) | — | — | — | |||||||||||
| Total distributions | (4.57 | ) | (0.79 | ) | (0.28 | ) | — | |||||||||
| Net asset value, end of period | $ | 26.32 | $ | 33.64 | $ | 29.40 | $ | 26.51 | ||||||||
| Total return (4) | (9.32 | )% | 17.11 | % | 12.29 | % | 6.04 | % (6) | ||||||||
| Net assets, at end of period (000s) | $ | 140,829 | $ | 111,009 | $ | 77,902 | $ | 11,930 | ||||||||
| Ratio of net expenses to average net assets (5) | 0.80 | % | 0.69 | % | 0.94 | % | 2.44 | % | ||||||||
| Ratio of net investment income (loss) to average net assets (5) | 2.29 | % | 2.38 | % | 1.44 | % | (1.16 | )% | ||||||||
| Portfolio Turnover Rate (3) | 61 | % | 106 | % | 27 | % | 0 | % (6) | ||||||||
| (1) | The Inspire International ETF commenced operations on September 30, 2019. |
| (2) | Per share amounts calculated using the average shares method, which more appropriately presents the per share data for the period. |
| (3) | Portfolio turnover rate excludes portfolio securities received or delivered as a result of processing capital share transactions in Creation Units. |
| (4) | Total return is calculated assuming a purchase of shares at net asset value on the first day and a sale at net asset value on the last day of the period. Distributions are assumed, for the purpose of this calculation, to be reinvested at the ex-dividend date net asset value per share on their respective payment dates. |
| (5) | Annualized for periods less than one year. |
| (6) | Not annualized. |
See accompanying notes to financial statements.
113
| Inspire Tactical Balanced ETF |
| FINANCIAL HIGHLIGHTS |
Per Share Data and Ratios for a Share of Beneficial Interest Outstanding Throughout the Year or Period Presented
| Year Ended | Year Ended | Period Ended | ||||||||||
| November 30, 2022 | November 30, 2021 | November 30, 2020 (1) | ||||||||||
| Net asset value, beginning of period | $ | 30.09 | $ | 26.26 | $ | 25.00 | ||||||
| Activity from investment operations: | ||||||||||||
| Net investment income (2) | 0.21 | 0.20 | 0.08 | |||||||||
| Net realized and unrealized gain (loss) on investments | (4.22 | ) | 4.93 | 1.21 | ||||||||
| Total from investment operations | (4.01 | ) | 5.13 | 1.29 | ||||||||
| Less distributions from: | ||||||||||||
| Net investment income | (0.11 | ) | (0.25 | ) | (0.03 | ) | ||||||
| Net realized gains | (2.60 | ) | (1.05 | ) | — | |||||||
| Total distributions | (2.71 | ) | (1.30 | ) | (0.03 | ) | ||||||
| Net asset value, end of period | $ | 23.37 | $ | 30.09 | $ | 26.26 | ||||||
| Total return (4) | (14.63 | )% | 20.49 | % | 5.18 | % (6) | ||||||
| Net assets, at end of period (000s) | $ | 105,734 | $ | 109,824 | $ | 71,552 | ||||||
| Ratio of net expenses to average net assets (5) | 0.69 | % | 0.69 | % | 0.80 | % | ||||||
| Ratio of net investment income to average net assets (5) | 0.84 | % | 0.70 | % | 0.81 | % | ||||||
| Portfolio Turnover Rate (3) | 469 | % | 114 | % | 282 | % (6) | ||||||
| (1) | The Inspire Tactical Balanced ETF commenced operations on July 15, 2020. |
| (2) | Per share amounts calculated using the average shares method, which more appropriately presents the per share data for the period. |
| (3) | Portfolio turnover rate excludes portfolio securities received or delivered as a result of processing capital share transactions in Creation Units. |
| (4) | Total return is calculated assuming a purchase of shares at net asset value on the first day and a sale at net asset value on the last day of the period. Distributions are assumed, for the purpose of this calculation, to be reinvested at the ex-dividend date net asset value per share on their respective payment dates. |
| (5) | Annualized for periods less than one year. |
| (6) | Not annualized. |
See accompanying notes to financial statements.
114
| Inspire Faithward Mid Cap Momentum ETF |
| FINANCIAL HIGHLIGHTS |
Per Share Data and Ratios for a Share of Beneficial Interest Outstanding Throughout the Period Presented
| Year Ended | Period Ended | |||||||
| November 30, 2022 | November 30, 2021 (1) | |||||||
| Net asset value, beginning of period | $ | 29.30 | $ | 25.00 | ||||
| Activity from investment operations: | ||||||||
| Net investment income (2) | 0.28 | 0.08 | ||||||
| Net realized and unrealized gain (loss) on investments | (4.21 | ) | 4.26 | |||||
| Total from investment operations | (3.93 | ) | 4.34 | |||||
| Less distributions from: | ||||||||
| Net investment income | (0.24 | ) | (0.04 | ) | ||||
| Net realized gains | (1.08 | ) | — | |||||
| Total distributions | (1.32 | ) | (0.04 | ) | ||||
| Net asset value, end of period | $ | 24.05 | $ | 29.30 | ||||
| Total return (4) | (13.89 | )% | 17.35 | % (6) | ||||
| Net assets, at end of period (000s) | $ | 40,282 | $ | 43,944 | ||||
| Ratio of gross expenses to average net assets (5) | 1.28 | % | 1.02 | % | ||||
| Ratio of net expenses to average net assets (5) | 0.95 | % | 1.02 | % | ||||
| Ratio of net investment income to average net assets (5) | 1.18 | % | 0.27 | % | ||||
| Portfolio Turnover Rate (3) | 95 | % | 270 | % (6) | ||||
| (1) | The Inspire Faithward Mid Cap Momentum ETF commenced operations on December 7, 2020. |
| (2) | Per share amounts calculated using the average shares method, which more appropriately presents the per share data for the period. |
| (3) | Portfolio turnover rate excludes portfolio securities received or delivered as a result of processing capital share transactions in Creation Units. |
| (4) | Total return is calculated assuming a purchase of shares at net asset value on the first day and a sale at net asset value on the last day of the period. Distributions are assumed, for the purpose of this calculation, to be reinvested at the ex-dividend date net asset value per share on their respective payment dates. |
| (5) | Annualized for periods less than one year. |
| (6) | Not annualized. |
See accompanying notes to financial statements.
115
| Inspire Fidelis Multi Factor ETF |
| FINANCIAL HIGHLIGHTS |
Per Share Data and Ratios for a Share of Beneficial Interest Outstanding Throughout the Period Presented
| Year Ended | ||||
| November 30, 2022 (1) | ||||
| Net asset value, beginning of period | $ | 25.00 | ||
| Activity from investment operations: | ||||
| Net investment income (2) | 0.03 | |||
| Net realized and unrealized gain on investments | 1.05 | |||
| Total from investment operations | 1.08 | |||
| Less distributions from: | ||||
| Net investment income | (0.02 | ) | ||
| Total distributions | (0.02 | ) | ||
| Net asset value, end of period | $ | 26.06 | ||
| Total return (4) | 4.33 | % (6) | ||
| Net assets, at end of period (000s) | $ | 46,915 | ||
| Ratio of net expenses to average net assets (5) | 1.09 | % | ||
| Ratio of net investment income to average net assets (5) | 0.48 | % | ||
| Portfolio Turnover Rate (3) | 61 | % (6) | ||
| (1) | The Inspire Fidelis Multi Factor ETF commenced operations on August 23, 2022. |
| (2) | Per share amounts calculated using the average shares method, which more appropriately presents the per share data for the period. |
| (3) | Portfolio turnover rate excludes portfolio securities received or delivered as a result of processing capital share transactions in Creation Units. |
| (4) | Total return is calculated assuming a purchase of shares at net asset value on the first day and a sale at net asset value on the last day of the period. Distributions are assumed, for the purpose of this calculation, to be reinvested at the ex-dividend date net asset value per share on their respective payment dates. |
| (5) | Annualized for periods less than one year. |
| (6) | Not annualized. |
See accompanying notes to financial statements.
116
The Inspire ETFs
NOTES TO FINANCIAL STATEMENTS
November 30, 2022
| 1. | ORGANIZATION |
The Inspire Global Hope ETF (“BLES”), Inspire Small/Mid Cap ETF (“ISMD”), Inspire Corporate Bond ETF (“IBD”), Inspire 100 ETF (“BIBL”), Inspire International ETF (“WWJD”), Inspire Tactical Balanced ETF (“RISN”), Inspire Faithward Mid Cap Momentum ETF (“GLRY”), and Inspire Fidelis Multi Factor ETF (“FDLS”) (each a “Fund” and collectively the “Funds”) are each a diversified series of Northern Lights Fund Trust IV (the “Trust”), a statutory trust organized under the laws of the State of Delaware on June 2, 2015, which is registered under the Investment Company Act of 1940, as amended (the “1940 Act”), as an open-end management investment company. BLES’s investment objective seeks to replicate investment results that generally correspond, before fees and expenses, to the performance of the Inspire Global Hope Large Cap Equal Weight Index. ISMD’s investment objective seeks to replicate investment results that generally correspond, before fees and expenses, to the performance of the Inspire Small/Mid Cap Impact Equal Weight Index. IBD’s investment objective seeks to replicate investment results that generally correspond, before fees and expenses, to the performance of the Inspire Corporate Bond Impact Equal Weight Index. BIBL’s investment objective seeks to replicate investment results that generally correspond, before fees and expenses, to the performance of the Inspire 100 Index. WWJD’s investment objective seeks to replicate the investment results that generally correspond, before fees and expenses, to the performance of the Inspire Global Hope ex-US Index. RISN’s investment objective seeks to provide capital appreciation with lower volatility than the US large cap stock market over the long term. GLRY’s investment objective seeks to outperform the results (before fees and expenses) of the broader U.S. midcap stock market when Momentum is in favor. FDLS’s investment objective seeks to replicate investment results that generally correspond, before fees and expenses, to the performance of the WI Fidelis Multi-Cap, Multi-Factor Index. The investment objectives are non-fundamental. BLES and ISMD commenced operations on February 27, 2017. IBD commenced operations on July 10, 2017. BIBL commenced operations on October 30, 2017. WWJD commenced operations on September 30, 2019. RISN commenced operations on July 15, 2020. GLRY commenced operations on December 7, 2020. FDLS commenced operations on August 23, 2022.
| 2. | SIGNIFICANT ACCOUNTING POLICIES |
The following is a summary of significant accounting policies followed by the Funds in preparation of their financial statements. These policies are in conformity with accounting principles generally accepted in the United States of America (“GAAP”). The preparation of financial statements requires management to make estimates and assumptions that affect the reported amounts of assets and liabilities and disclosure of contingent assets and liabilities at the date of the financial statements and the reported amounts of income and expenses for the period. Actual results could differ from those estimates. The Funds are investment companies and accordingly follow the investment company accounting and reporting guidance of the Financial Accounting Standards Board (“FASB”) Accounting Standards Codification Topic 946 “Financial Services – Investment Companies” including FASB Accounting Standards Update (“ASU”) 2013-08.
Securities valuation – Securities listed on an exchange are valued at the last reported sale price at the close of the regular trading session of the primary exchange on the business day the value is being determined or, in the case of securities listed on NASDAQ at the NASDAQ Official Closing Price (“NOCP”). In the absence of a sale, such securities shall be valued at the mean between the current bid
117
The Inspire ETFs
NOTES TO FINANCIAL STATEMENTS (Continued)
November 30, 2022
and ask prices on the primary exchange on the day of valuation. Debt securities (other than short-term obligations) are valued each day by an independent pricing service approved by the Trust’s Board of Trustees (the “Board”) based on methods which include consideration of: yields or prices of securities of comparable quality, coupon, maturity and type, indications as to values from dealers, and general market conditions or market quotations from a major market maker in the securities. Investments valued in currencies other than the U.S. dollar are converted to U.S. dollars using exchange rates obtained from pricing services. The independent pricing service does not distinguish between smaller-sized bond positions known as “odd lots” and larger institutional-sized bond positions known as “round lots”. Short-term debt obligations having 60 days or less remaining until maturity, at time of purchase, may be valued at amortized cost. Investments in open-end investment companies are valued at net asset value (“NAV”).
The Funds may hold securities, such as private investments, interests in commodity pools, other non-traded securities or temporarily illiquid securities, for which market quotations are not readily available or are determined to be unreliable. These securities are valued using the “fair value” procedures approved by the Board. The Board has designated the adviser as its valuation designee (the “Valuation Designee”) to execute these procedures. The Board may also enlist third party consultants such a valuation specialist at a public accounting firm, valuation consultant or financial officer of a security issuer on an as-needed basis to assist the Valuation Designee in determining a security-specific fair value. The Board is responsible for reviewing and approving fair value methodologies utilized by the Valuation Designee, approval of which shall be based upon whether the Valuation Designee followed the valuation procedures established by the Board.
Fair Valuation Process – The applicable investments are valued by the Valuation Designee pursuant to valuation procedures established by the Board. For example, fair value determinations are required for the following securities: (i) securities for which market quotations are insufficient or not readily available on a particular business day (including securities for which there is a short and temporary lapse in the provision of a price by the regular pricing source); (ii) securities for which, in the judgment of the Valuation Designee, the prices or values available do not represent the fair value of the instrument; factors which may cause the Valuation Designee to make such a judgment include, but are not limited to, the following: only a bid price or an ask price is available; the spread between bid and ask prices is substantial; the frequency of sales; the thinness of the market; the size of reported trades; and actions of the securities markets, such as the suspension or limitation of trading; (iii) securities determined to be illiquid; and (iv) securities with respect to which an event that affects the value thereof has occurred (a “significant event”) since the closing prices were established on the principal exchange on which they are traded, but prior to a Fund’s calculation of its NAV. Specifically, interests in commodity pools or managed futures pools are valued on a daily basis by reference to the closing market prices of each futures contract or other asset held by a pool, as adjusted for pool expenses. Restricted or illiquid securities, such as private investments or non-traded securities are valued based upon the current bid for the security from two or more independent dealers or other parties reasonably familiar with the facts and circumstances of the security (who should take into consideration all relevant factors as may be appropriate under the circumstances). If a current bid from such independent dealers or other independent parties is unavailable, the Valuation Designee shall determine the fair value of such security using the following factors: (i) the type of security; (ii) the cost at date of purchase; (iii) the size and nature of the Fund’s holdings; (iv) the discount from market value of unrestricted securities of the same class at the time of
118
The Inspire ETFs
NOTES TO FINANCIAL STATEMENTS (Continued)
November 30, 2022
purchase and subsequent thereto; (v) information as to any transactions or offers with respect to the security; (vi) the nature and duration of restrictions on disposition of the security and the existence of any registration rights; (vii) how the yield of the security compares to similar securities of companies of similar or equal creditworthiness; (viii) the level of recent trades of similar or comparable securities; (ix) the liquidity characteristics of the security; (x) current market conditions; and (xi) the market value of any securities into which the security is convertible or exchangeable.
Securities Lending Risk – Securities lending involves exposure to certain risks, including operational risk (i.e., the risk of losses resulting from problems in the settlement and accounting process), “gap” risk (i.e., the risk of a mismatch between the return on cash collateral reinvestments and the fees a Fund has agreed to pay a borrower), and credit, legal, counterparty and market risk. In the event a borrower does not return a Fund’s securities as agreed, the Fund may experience losses if the proceeds received from liquidating the collateral do not at least equal the value of the loaned security at the time the collateral is liquidated plus the transaction costs incurred in purchasing replacement securities.
Fixed Income Risk – When a Fund invests in fixed income securities, the value of your investment in the Fund will fluctuate with changes in interest rates. Typically, a rise in interest rates causes a decline in the value of fixed income securities owned by the Fund. In general, the market price of fixed income securities with longer maturities will increase or decrease more in response to changes in interest rates than shorter-term securities. Other risk factors include credit risk (the debtor may default), extension risk (an issuer may exercise its right to repay principal on a fixed rate obligation held by the Fund later than expected), and prepayment risk (the debtor may pay its obligation early, reducing the amount of interest payments) . These risks could affect the value of a particular investment by each Fund, possibly causing the Fund’s share price and total return to be reduced and fluctuate more than other types of investments.
Foreign Securities Risk – Foreign companies are generally not subject to the same regulatory requirements of U.S. companies thereby resulting in less publicly available information about these companies. The lack of readily available public information may lead to inaccurate Inspire Impact Scores. Not all countries and jurisdictions monitor or regulate Inspire Impact Score factors so that there may be no relevant information available for certain factors. In addition, foreign accounting, auditing and financial reporting standards generally differ from those applicable to U.S. companies.
The Funds utilize various methods to measure the fair value of all of their investments on a recurring basis. GAAP establishes a hierarchy that prioritizes inputs to valuation methods. The three levels of input are:
Level 1 – Unadjusted quoted prices in active markets for identical assets and liabilities that the Funds have the ability to access.
119
The Inspire ETFs
NOTES TO FINANCIAL STATEMENTS (Continued)
November 30, 2022
Level 2 – Observable inputs other than quoted prices included in Level 1 that are observable for the asset or liability, either directly or indirectly. These inputs may include quoted prices for the identical instrument in an inactive market, prices for similar instruments, interest rates, prepayment speeds, credit risk, yield curves, default rates and similar data.
Level 3 – Unobservable inputs for the asset or liability, to the extent relevant observable inputs are not available, representing the Funds’ own assumptions about the assumptions a market participant would use in valuing the asset or liability, and would be based on the best information available.
The availability of observable inputs can vary from security to security and is affected by a wide variety of factors, including, for example, the type of security, whether the security is new and not yet established in the marketplace, the liquidity of markets, and other characteristics particular to the security. To the extent that valuation is based on models or inputs that are less observable or unobservable in the market, the determination of value requires more judgment. Accordingly, the degree of judgment exercised in determining value is greatest for instruments categorized in Level 3.
The inputs used to measure value may fall into different levels of the fair value hierarchy. In such cases, for disclosure purposes, the level in the fair value hierarchy within which the fair value measurement falls in its entirety, is determined based on the lowest level input that is significant to the fair value measurement in its entirety.
The inputs or methodology used for valuing securities are not necessarily an indication of the risk associated with investing in those securities. The following tables summarize the inputs used as of November 30, 2022 for the Funds’ assets measured at value:
| BLES | ||||||||||||||||
| Assets * | Level 1 | Level 2 | Level 3 | Total | ||||||||||||
| Common Stocks | $ | 134,246,178 | $ | 1,102,416 | $ | — | $ | 135,348,594 | ||||||||
| Collateral For Securities Loaned | 944,652 | — | — | 944,652 | ||||||||||||
| Total | $ | 135,190,830 | $ | 1,102,416 | $ | — | $ | 136,293,246 | ||||||||
| ISMD | ||||||||||||||||
| Assets * | Level 1 | Level 2 | Level 3 | Total | ||||||||||||
| Common Stocks | $ | 124,066,873 | $ | — | $ | — | $ | 124,066,873 | ||||||||
| Collateral For Securities Loaned | 955,613 | — | — | 955,613 | ||||||||||||
| Total | $ | 125,022,486 | $ | — | $ | — | $ | 125,022,486 | ||||||||
| IBD | ||||||||||||||||
| Assets * | Level 1 | Level 2 | Level 3 | Total | ||||||||||||
| Corporate Bonds | $ | — | $ | 220,367,926 | $ | — | $ | 220,367,926 | ||||||||
| Total | $ | — | $ | 220,367,926 | $ | — | $ | 220,367,926 | ||||||||
120
The Inspire ETFs
NOTES TO FINANCIAL STATEMENTS (Continued)
November 30, 2022
| BIBL | ||||||||||||||||
| Assets * | Level 1 | Level 2 | Level 3 | Total | ||||||||||||
| Common Stocks | $ | 277,158,024 | $ | — | $ | — | $ | 277,158,024 | ||||||||
| Total | $ | 277,158,024 | $ | — | $ | — | $ | 277,158,024 | ||||||||
| WWJD | ||||||||||||||||
| Assets * | Level 1 | Level 2 | Level 3 | Total | ||||||||||||
| Common Stocks | $ | 137,873,510 | $ | 2,324,909 | $ | — | $ | 140,198,419 | ||||||||
| Collateral For Securities Loaned | 588,390 | — | — | 588,390 | ||||||||||||
| Total | $ | 138,461,900 | $ | 2,324,909 | $ | — | $ | 140,786,809 | ||||||||
| RISN | ||||||||||||||||
| Common Stocks | $ | 5,894,821 | $ | — | $ | — | $ | 5,894,821 | ||||||||
| Exchange Traded Funds | 98,946,024 | — | — | 98,946,024 | ||||||||||||
| Total | $ | 104,840,845 | $ | — | $ | — | $ | 104,840,845 | ||||||||
| GLRY | ||||||||||||||||
| Assets * | Level 1 | Level 2 | Level 3 | Total | ||||||||||||
| Common Stocks | $ | 39,633,714 | $ | — | $ | — | $ | 39,633,714 | ||||||||
| Total | $ | 39,633,714 | $ | — | $ | — | $ | 39,633,714 | ||||||||
| FDLS | ||||||||||||||||
| Assets * | Level 1 | Level 2 | Level 3 | Total | ||||||||||||
| Common Stocks | $ | 45,974,380 | $ | — | $ | — | $ | 45,974,380 | ||||||||
| Total | $ | 45,974,380 | $ | — | $ | — | $ | 45,974,380 | ||||||||
The Funds did not hold any Level 3 securities during the period.
| * | See Schedule of Investments for industry classification. |
Security Transactions and Related Income – Security transactions are accounted for on the trade date. Interest income is recognized on an accrual basis. Discounts are accreted and premiums are amortized on securities purchased over the lives of the respective securities using the effective yield method. Dividend income is recorded on the ex-dividend date. Realized gains or losses from sales of securities are determined by comparing the identified cost of the security lot sold with the net sales proceeds.
Dividends and Distributions to Shareholders – Dividends from net investment income, if any, are declared and paid quarterly for BLES, ISMD, BIBL, WWJD, RISN, GLRY and FDLS and monthly for IBD. Dividends and distributions to shareholders are recorded on the ex-dividend date. Distributable net realized capital gains, if any, are declared and distributed annually. Dividends from net investment income and distributions from net realized gains are determined in accordance with federal income tax regulations, which may differ from GAAP. These “book/tax” differences are considered either temporary (e.g., deferred losses) or permanent in nature. To the extent these differences are permanent in nature,
121
The Inspire ETFs
NOTES TO FINANCIAL STATEMENTS (Continued)
November 30, 2022
such amounts are reclassified within the composition of net assets based on their federal tax-basis treatment; temporary differences do not require reclassification.
Withholding taxes on foreign dividends, if applicable, are paid (a portion of which may be reclaimable) or provided for in accordance with the applicable country’s tax rules and rates and are disclosed in the Statement of Operations. Withholding tax reclaims are filed in certain countries to recover a portion of the amounts previously withheld. The Funds record a reclaim receivable based on a number of factors, including a jurisdiction’s legal obligation to pay reclaims, as well as payment history and market convention. The Funds may be subject to foreign taxation related to capital gains on the sale of securities in the foreign jurisdictions in which they invest. When a capital gain tax is determined to apply, the Funds record an estimated deferred tax liability in an amount that may be payable if securities were disposed of on the valuation date.
Federal Income Taxes – The Funds comply with the requirements of the Internal Revenue Code applicable to regulated investment companies and to distribute all of their taxable income to shareholders. Therefore, no provision for federal income tax is required.
The Funds recognize the tax benefits of uncertain tax positions only where the position is “more likely than not” to be sustained assuming examination by tax authorities. Management has analyzed each Fund’s tax position and has concluded that no liability for unrecognized tax benefits should be recorded related to uncertain tax positions taken on returns filed for open tax years or expected to be taken in each Fund’s November 30, 2022 year-end tax return. Each Fund identified its major tax jurisdictions as U.S. federal, Ohio and foreign jurisdictions where the Fund makes significant investments. Each Fund recognizes interest and penalties, if any, related to unrecognized tax benefits as income tax expenses, in the Statements of Operations. The Funds are not aware of any tax positions for which it is reasonably possible that the total amounts of unrecognized tax benefits will change materially in the next twelve months.
Exchange Traded Funds (“ETFs”) – The Funds may invest in ETFs. ETFs are generally a type of fund bought and sold on a securities exchange. An ETF trades like common stock and represents a portfolio of securities. The risks of owning an ETF generally reflect the risks of owning the underlying securities they hold, although the lack of liquidity on an ETF could result in it being more volatile. Additionally, ETFs have fees and expenses that reduce their value.
Expenses – Expenses of the Trust that are directly identifiable to a specific Fund are charged to that Fund. Expenses, which are not readily identifiable to a specific Fund, are allocated in such a manner as deemed equitable (as determined by the Board), taking into consideration the nature and type of expense and the relative sizes of the Funds in the Trust.
Cash – The Funds consider their investments in an FDIC insured interest bearing savings account to be cash. The Funds maintain cash balances, which, at times, may exceed federally insured limits. The Funds maintain these balances with a high quality financial institution.
122
The Inspire ETFs
NOTES TO FINANCIAL STATEMENTS (Continued)
November 30, 2022
Foreign Currency – The accounting records of the Funds are maintained in U.S. dollars. Investment securities and other assets and liabilities denominated in a foreign currency, and income receipts and expense payments are translated into U.S. dollars using the prevailing exchange rate at the London market close. Purchases and sales of securities are translated into U.S. dollars at the contractual currency rates established at the approximate time of the trade. Net realized gains and losses on foreign currency transactions represent net gains and losses from currency realized between the trade and settlement dates on securities transactions, gains and losses on the purchase and sale of foreign currencies and the difference between income accrued versus income received. The effects of changes in foreign currency exchange rates on investments in securities are included with the net realized and unrealized gain or loss on investment securities.
Indemnification – The Trust indemnifies its officers and Trustees for certain liabilities that may arise from the performance of their duties to the Trust. Additionally, in the normal course of business, the Funds enter into contracts that contain a variety of representations and warranties and which provide general indemnities. The Funds’ maximum exposure under these arrangements is unknown, as this would involve future claims that may be made against the Funds that have not yet occurred. However, based on experience, the risk of loss due to these warranties and indemnities appears to be remote.
| 3. | INVESTMENT TRANSACTIONS |
For the year or period ended November 30, 2022, cost of purchases and proceeds from sales of portfolio securities (excluding in-kind transactions and short-term investments) for the Funds were as follows:
| Ticker | Purchases | Sales | ||||||
| BLES | $ | 67,736,999 | $ | 75,000,522 | ||||
| ISMD | $ | 49,649,061 | $ | 57,173,078 | ||||
| IBD | $ | 115,321,567 | $ | 107,941,660 | ||||
| BIBL | $ | 80,932,206 | $ | 127,591,091 | ||||
| WWJD | $ | 75,362,830 | $ | 71,225,985 | ||||
| RISN | $ | 516,643,450 | $ | 523,451,688 | ||||
| GLRY | $ | 25,829,344 | $ | 27,200,324 | ||||
| FDLS | $ | 25,644,579 | $ | 26,222,722 | ||||
For the year or period ended November 30, 2022, cost of purchases and proceeds from sales of portfolio securities for in-kind transactions for the Funds were as follows:
| Ticker | Purchases | Sales | ||||||
| BLES | $ | 21,581,386 | $ | — | ||||
| ISMD | $ | 39,903,402 | $ | 26,233,105 | ||||
| IBD | $ | 78,680,719 | $ | 65,821,057 | ||||
| BIBL | $ | 138,426,219 | $ | 57,086,532 | ||||
| WWJD | $ | 56,223,824 | $ | 4,396,822 | ||||
| RISN | $ | 29,963,515 | $ | 8,310,208 | ||||
| GLRY | $ | 25,500,897 | $ | 24,281,759 | ||||
| FDLS | $ | 46,625,074 | $ | 1,193,393 | ||||
123
The Inspire ETFs
NOTES TO FINANCIAL STATEMENTS (Continued)
November 30, 2022
| 4. | INVESTMENT ADVISORY AGREEMENT AND TRANSACTIONS WITH RELATED PARTIES |
The business activities of the Funds are overseen by the Board. Inspire Investing, LLC (the “Adviser”) serves as the Funds’ investment adviser pursuant to an Investment Advisory Agreement with the Trust (the “Advisory Agreement”). The Adviser has engaged SevenOneSeven Capital Management, LTD as the sub-adviser (the “Sub-Adviser”) to manage the assets of GLRY. The Sub-Advisor is paid by the Advisor, not the Funds. The Trust has entered into a Global Custody Agreement with Brown Brothers Harriman & Co. (the “Custodian”) to serve as custodian and to act as transfer and shareholder services agent. The Trust has also entered into an Underwriting Agreement with Foreside Financial Services, LLC (the “Distributor”) to serve as the principal underwriter and distributor for the Funds.
Pursuant to the Advisory Agreement, the Adviser, under the oversight of the Board, directs the daily operations of the Funds and supervises the performance of administrative and professional services provided by others. As compensation for its services and the related expenses borne by the Adviser, the Funds pay the Adviser a fee, computed and accrued daily and paid monthly, at an annual rate indicated below of each Fund’s average daily net assets. For the year or period ended November 30, 2022, each Fund incurred the following in advisory fees:
| Ticker | ANNUAL RATE | TOTAL ADVISORY FEE | ||||
| BLES | 0.30% | $ | 402,577 | |||
| ISMD | 0.30% | $ | 345,969 | |||
| IBD | 0.30% | $ | 709,037 | |||
| BIBL | 0.30% | $ | 853,271 | |||
| WWJD | 0.45% | $ | 532,835 | |||
| RISN | 0.50% | $ | 554,868 | |||
| GLRY | 0.65% | $ | 173,966 | |||
| FDLS | 0.45% | $ | 49,119 | |||
Pursuant to a written contract (the “Waiver Agreement”), the Adviser has agreed for BIBL and GLRY, at least until March 31, 2023, to waive a portion of its advisory fee and has agreed to reimburse the Funds for other expenses to the extent necessary so that total expenses incurred (exclusive of any front-end or contingent deferred loads, taxes, brokerage fees and commissions, borrowing costs (such as interest and dividend expense on securities sold short), acquired fund fees and expenses, fees and expenses associated with investments in other collective investment vehicles or derivative instruments (including, for example, option and swap fees and expenses), or extraordinary expenses such as litigation) will not exceed 0.52%, 0.35% and 0.80% of average daily net assets for BLES, BIBL and GLRY, respectively. Effective April 1, 2022, the BLES, ISMD and WWJD do not have a Waiver Agreement in place. BLES, ISMD, IBD, WWJD, RISN and FDLS currently do not have a Waiver Agreement in place.
If the Adviser waives any fee or reimburses any expenses pursuant to the Waiver Agreement, and a Fund’s operating expenses are subsequently lower than its expense limitation, or limitation in place at time of waiver, the Adviser, on a rolling three-year period, shall be entitled to reimbursement by the Fund provided that such reimbursement does not cause that Fund’s operating expense to exceed the expense limitation. If a Fund’s operating expenses subsequently exceed the expense limitation, the
124
The Inspire ETFs
NOTES TO FINANCIAL STATEMENTS (Continued)
November 30, 2022
reimbursements for the Fund shall be suspended. For the year or period ended November 30, 2022, the Adviser waived fees and/or reimbursed expenses in the amount of $3,420, $279,811, and $88,117 for BLES, BIBL, and GLRY, respectively, pursuant to the Waiver Agreement.
The following amounts previously waived by the Adviser are subject to recapture by the Funds by the following dates:
| Ticker | 11/30/2023 | 11/30/2024 | 11/30/2025 | |||||||||
| BLES | $ | — | $ | — | $ | 3,420 | ||||||
| BIBL | $ | 133,196 | $ | 168,196 | $ | 279,811 | ||||||
| GLRY | $ | — | $ | — | $ | 88,117 | ||||||
The Adviser may seek reimbursement only for expenses waived or paid by it during the three years prior to such reimbursement; provided, however, that such expenses may only be reimbursed to the extent they were waived or paid after the effective date of the Waiver Agreement (or any similar agreement).
The Board may terminate this expense reimbursement arrangement at any time on 60 days’ notice to the Adviser.
The Trust, with respect to the Funds, has adopted a distribution and service plan (“Plan”) pursuant to Rule 12b-1 under the 1940 Act. Under the Plan, the Funds are authorized to pay distribution fees to the distributor and other firms that provide distribution and shareholder services (“Service Providers”). If a Service Provider provides these services, the Funds may pay fees at an annual rate not to exceed 0.25% of average daily net assets, pursuant to Rule 12b-1 under the 1940 Act.
No distribution or service fees are currently paid by the Funds and there are no current plans to impose these fees. In the event Rule 12b-1 fees were charged, over time they would increase the cost of an investment in the Funds.
Ultimus Fund Solutions, LLC (“UFS”) - UFS provides administration and fund accounting services to the Trust. Pursuant to separate servicing agreements with UFS, the Funds pay UFS customary fees for providing administration and fund accounting services to the Funds. Certain officers of the Trust are also officers of UFS and are not paid any fees directly by the Funds for serving in such capacities.
Northern Lights Compliance Services, LLC (“NLCS”) - NLCS, an affiliate of UFS, provides a Chief Compliance Officer to the Trust, as well as related compliance services, pursuant to a consulting agreement between NLCS and the Trust. Under the terms of such agreement, NLCS receives customary fees from each Fund.
Blu Giant, LLC (“Blu Giant”) – Blu Giant, an affiliate of UFS, provides EDGAR conversion and filing services as well as print management services for the Funds on an ad-hoc basis. For the provision of these services, Blu Giant receives customary fees from the Funds.
125
The Inspire ETFs
NOTES TO FINANCIAL STATEMENTS (Continued)
November 30, 2022
| 5. | CAPITAL SHARE TRANSACTIONS |
Shares are not individually redeemable and may be redeemed by the Funds at the NAV only in large blocks known as “Creation Units.” Shares are created and redeemed by the Funds only in Creation Unit size aggregations of 50,000 shares for BLES, ISMD, BIBL, and WWJD, 100,000 shares for IBD, and 25,000 for RISN, GLRY and FDLS. Only Authorized Participants or transactions done through an Authorized Participant are permitted to purchase or redeem Creation Units from the Funds. An Authorized Participant is either (i) a broker-dealer or other participant in the clearing process through the Continuous Net Settlement System of the National Securities Clearing Corporation or (ii) a DTC participant and, in each case, must have executed a Participant Agreement with the Distributor. Such transactions are generally permitted on an in-kind basis, with a balancing cash component to equate the transaction to the NAV per share of the Funds on the transaction date. Cash may be substituted equivalent to the value of certain securities generally when they are not available in sufficient quantity for delivery, not eligible for trading by the Authorized Participant or as a result of other market circumstances. In addition, the Funds may impose transaction fees on purchases and redemptions of Fund shares to cover the custodial and other costs incurred by the Funds in effecting trades. A fixed fee may be imposed on each creation and redemption transaction regardless of the number of Creation Units involved in the transaction (“Fixed Fee”). Purchases and redemptions of Creation Units for cash or involving cash-in-lieu are required to pay an additional variable charge to compensate the Funds and their ongoing shareholders for brokerage and market impact expenses relating to Creation Unit transactions (“Variable Charge,” and together with the Fixed Fee, the “Transaction Fees”).
The Transaction Fees for the Funds are listed in the table below:
| Fee for In-Kind and Cash | Maximum Additional Variable | |
| Ticker | Purchases | Charge for Cash Purchases* |
| BLES | $500 | 0.00% |
| ISMD | $250 | 0.00% |
| IBD | $250 | 0.00% |
| BIBL | $250 | 0.00% |
| WWJD | $500 | 0.00% |
| RISN | $250 | 0.00% |
| GLRY | $250 | 2.00% |
| FDLS | $250 | 0.00% |
| * | The maximum Transaction Fee may be up to 2.00% as a percentage of the amount invested. |
126
The Inspire ETFs
NOTES TO FINANCIAL STATEMENTS (Continued)
November 30, 2022
| 6. | DISTRIBUTIONS TO SHAREHOLDERS AND TAX COMPONENTS OF CAPITAL |
The tax character of fund distributions paid for the years ended November 30, 2022, and November 30, 2021, was as follows:
| For the period ended November 30, 2022: | ||||||||||||||||
| Ordinary | Long-Term | Return | ||||||||||||||
| Portfolio | Income | Capital Gains | Of Capital | Total | ||||||||||||
| Inspire Global Hope ETF | $ | 4,957,965 | $ | 7,425,355 | $ | — | $ | 12,383,320 | ||||||||
| Inspire Small/Mid Cap Impact ETF | 11,493,232 | — | 226,508 | 11,719,740 | ||||||||||||
| Inspire Corporate Bond Impact ETF | 3,574,103 | 631,037 | — | 4,205,140 | ||||||||||||
| Inspire 100 ETF | 13,552,964 | 34,395,131 | — | 47,948,095 | ||||||||||||
| Inspire International ETF | 5,448,753 | 9,748,877 | — | 15,197,630 | ||||||||||||
| Inspire Tactical Balanced ETF | 9,905,373 | 196,460 | — | 10,101,833 | ||||||||||||
| Inspire Faithward Mid Cap Momentum ETF | 1,890,822 | — | — | 1,890,822 | ||||||||||||
| Inspire Fidelis Multi Factor ETF | 33,425 | — | — | 33,425 | ||||||||||||
| For the period ended November 30, 2021: | ||||||||||||||||
| Ordinary | Long-Term | Return | ||||||||||||||
| Portfolio | Income | Capital Gains | Of Capital | Total | ||||||||||||
| Inspire Global Hope ETF | $ | 2,405,165 | $ | — | $ | — | $ | 2,405,165 | ||||||||
| Inspire Small/Mid Cap Impact ETF | 1,008,145 | — | — | 1,008,145 | ||||||||||||
| Inspire Corporate Bond Impact ETF | 2,091,010 | — | — | 2,091,010 | ||||||||||||
| Inspire 100 ETF | 3,163,725 | — | — | 3,163,725 | ||||||||||||
| Inspire International ETF * | 2,505,170 | — | — | 2,505,170 | ||||||||||||
| Inspire Tactical Balanced ETF | 3,640,613 | 1,362 | — | 3,641,975 | ||||||||||||
| Inspire Faithward Mid Cap Momentum ETF | 58,050 | — | — | 58,050 | ||||||||||||
| Inspire Fidelis Multi Factor ETF | — | — | — | — | ||||||||||||
| * | The difference between ordinary distributions paid from book and ordinary distributions paid from tax relates to allowable foreign tax credits of $192,710 for fiscal year ended November 30, 2021, for Inspire International ETF, which have been passed through to the Funds’ underlying shareholders and are deemed dividends for tax purposes. |
As of November 30, 2022, the components of accumulated earnings/ (deficit) on a tax basis were as follows:
| Undistributed | Undistributed | Post October Loss | Capital Loss | Other | Unrealized | Total | ||||||||||||||||||||||
| Ordinary | Long-Term | and | Carry | Book/Tax | Appreciation/ | Accumulated | ||||||||||||||||||||||
| Portfolio | Income | Capital Gains | Late Year Loss | Forwards | Differences | (Depreciation) | Earnings/(Deficit) | |||||||||||||||||||||
| Inspire Global Hope ETF | $ | 114,250 | $ | — | $ | — | $ | (5,858,856 | ) | $ | — | $ | 7,170,000 | $ | 1,425,394 | |||||||||||||
| Inspire Small/Mid Cap Impact ETF | — | — | — | (961,753 | ) | — | 1,189,016 | 227,263 | ||||||||||||||||||||
| Inspire Corporate Bond Impact ETF | 167,932 | — | — | (12,139,799 | ) | — | (14,314,374 | ) | (26,286,241 | ) | ||||||||||||||||||
| Inspire 100 ETF | — | — | — | (26,493,350 | ) | — | (16,640,177 | ) | (43,133,527 | ) | ||||||||||||||||||
| Inspire International ETF | 79,979 | — | — | (10,793,991 | ) | — | (334,643 | ) | (11,048,655 | ) | ||||||||||||||||||
| Inspire Tactical Balanced ETF | 585,694 | — | — | (13,982,031 | ) | — | 822,848 | (12,573,489 | ) | |||||||||||||||||||
| Inspire Faithward Mid Cap Momentum ETF | 49,609 | — | (546,233 | ) | (6,113,422 | ) | — | 1,403,390 | (5,206,656 | ) | ||||||||||||||||||
| Inspire Fidelis Multi Factor ETF | 46,146 | — | — | (2,651,006 | ) | — | 3,710,770 | 1,105,910 | ||||||||||||||||||||
127
The Inspire ETFs
NOTES TO FINANCIAL STATEMENTS (Continued)
November 30, 2022
The difference between book basis and tax basis undistributed net investment income (loss), accumulated net realized gains (losses), and unrealized appreciation/(depreciation) from investments is primarily attributable to the tax deferral of losses on wash sales and adjustments for real estate investment trusts, passive foreign investment companies, and C-Corporation return of capital distributions.
Capital losses incurred after October 31 within the fiscal year are deemed to arise on the first business day of the following fiscal year for tax purposes. The following funds incurred and elected to defer such capital losses as follows:
| Post October | ||||
| Portfolio | Losses | |||
| Inspire Global Hope ETF | $ | — | ||
| Inspire Small/Mid Cap Impact ETF | — | |||
| Inspire Corporate Bond Impact ETF | — | |||
| Inspire 100 ETF | — | |||
| Inspire International ETF | — | |||
| Inspire Tactical Balanced ETF | — | |||
| Inspire Faithward Mid Cap Momentum ETF | 546,233 | |||
| Inspire Fidelis Multi Factor ETF | — | |||
At November 30, 2022, the Funds had capital loss carry forwards for federal income tax purposes available to offset future capital gains as follows:
| Non-Expiring | ||||||||||||
| Portfolio | Short-Term | Long-Term | Total | |||||||||
| Inspire Global Hope ETF | $ | 3,909,697 | $ | 1,949,159 | $ | 5,858,856 | ||||||
| Inspire Small/Mid Cap Impact ETF | — | 961,753 | 961,753 | |||||||||
| Inspire Corporate Bond Impact ETF | 4,223,831 | 7,915,968 | 12,139,799 | |||||||||
| Inspire 100 ETF | 16,563,119 | 9,930,231 | 26,493,350 | |||||||||
| Inspire International ETF | 6,646,268 | 4,147,723 | 10,793,991 | |||||||||
| Inspire Tactical Balanced ETF | 13,982,031 | — | 13,982,031 | |||||||||
| Inspire Faithward Mid Cap Momentum ETF | 4,724,490 | 1,388,932 | 6,113,422 | |||||||||
| Inspire Fidelis Multi Factor ETF | 2,651,006 | — | 2,651,006 | |||||||||
Permanent book and tax differences, primarily attributable to realized gain (loss) on in-kind redemptions, adjustments for prior year tax returns, non-deductible expenses and distributions in excess, resulted in reclassifications for the Funds for the year ended November 30, 2022, as follows:
| Paid | ||||||||
| In | Accumulated | |||||||
| Portfolio | Capital | Earnings (Losses) | ||||||
| Inspire Global Hope ETF | $ | 181 | $ | (181 | ) | |||
| Inspire Small/Mid Cap Impact ETF | 2,904,386 | (2,904,386 | ) | |||||
| Inspire Corporate Bond Impact ETF | (3,768,328 | ) | 3,768,328 | |||||
| Inspire 100 ETF | 8,988,019 | (8,988,019 | ) | |||||
| Inspire International ETF | 687,774 | (687,774 | ) | |||||
| Inspire Tactical Balanced ETF | 62,415 | (62,415 | ) | |||||
| Inspire Faithward Mid Cap Momentum ETF | 1,257,767 | (1,257,767 | ) | |||||
| Inspire Fidelis Multi Factor ETF | 33,809 | (33,809 | ) | |||||
128
The Inspire ETFs
NOTES TO FINANCIAL STATEMENTS (Continued)
November 30, 2022
| 7. | AGGREGATE UNREALIZED APPRECIATION AND DEPRECIATION – TAX BASIS |
| Gross | Gross | Net Unrealized | ||||||||||||||
| Tax | Unrealized | Unrealized | Appreciation/ | |||||||||||||
| Portfolio | Cost | Appreciation | Depreciation | (Depreciation) | ||||||||||||
| Inspire Global Hope ETF | $ | 129,114,266 | $ | 19,052,905 | $ | (11,873,925 | ) | $ | 7,178,980 | |||||||
| Inspire Small/Mid Cap Impact ETF | 123,833,470 | 13,757,113 | (12,568,097 | ) | 1,189,016 | |||||||||||
| Inspire Corporate Bond Impact ETF | 234,682,300 | 1,178,131 | (15,492,505 | ) | (14,314,374 | ) | ||||||||||
| Inspire 100 ETF | 293,798,201 | 23,692,457 | (40,332,634 | ) | (16,640,177 | ) | ||||||||||
| Inspire International ETF | 141,112,046 | 10,735,321 | (11,060,558 | ) | (325,237 | ) | ||||||||||
| Inspire Tactical Balanced ETF | 104,017,997 | 1,194,725 | (371,877 | ) | 822,848 | |||||||||||
| Inspire Faithward Mid Cap Momentum ETF | 38,230,291 | 2,181,030 | (777,607 | ) | 1,403,423 | |||||||||||
| Inspire Fidelis Multi Factor ETF | 42,263,614 | 4,718,244 | (1,007,478 | ) | 3,710,766 | |||||||||||
| 8. | SECURITIES LENDING |
Each Fund may lend up to 33 1/3% of the value of the securities in its portfolio to brokers, dealers and financial institutions (but not individuals) under terms of participation in a securities lending program administered by the Custodian. The securities lending agreement requires that loans are collateralized at all times in an amount equal to at least 100% of the value of any loaned securities at the time of the loan. Each Fund receives compensation in the form of fees. The amount of fees depends on a number of factors including the type of security and length of the loan. Each Fund continues to receive interest payments or dividends on the securities loaned during the borrowing period. Gain or loss in the fair value of securities loaned that may occur during the term of the loan will be for the account of each Fund. Each Fund has the right under the terms of the securities lending agreement to recall the securities from the borrower on demand. The cash collateral is held by the Custodian in accordance with the custody agreement. Each Fund could experience delays in recovering their securities and possible loss of income or value if the borrower fails to return the borrowed securities, although the Funds are indemnified from this risk by contract with the securities lending agent.
As of November 30, 2022, the below table shows the securities loan and collateral for the loan, both of which are presented gross on the Statement of Assets and Liabilities. All individual open security loan transactions were over collateralized. The remaining contractual maturity of those transactions are overnight and continuous. This cash is invested in the Fidelity Government Portfolio – Institutional Class.
| Fair Value of | Collateral Value of | |||||||
| Ticker | Securities on Loan | Securities on Loan | ||||||
| BLES | $ | 883,352 | $ | 944,652 | ||||
| ISMD | 933,413 | 955,613 | ||||||
| WWJD | 545,387 | 588,390 | ||||||
129
The Inspire ETFs
NOTES TO FINANCIAL STATEMENTS (Continued)
November 30, 2022
The following table is a summary of the Funds’ securities loaned and related collateral, which are subject to a netting agreement as of November 30, 2022:
| Gross Amounts Not Offset in the Statement of Assets & Liabilities | ||||||||||||||||||||||||
| ETF | Gross Amounts of Recognized Assets | Gross Amounts Offset in the Statement of Assets & Liabilities | Net Amounts of Assets Presented in the Statement of Assets & Liabilities | Financial Instruments | Collateral Received | Net Amount | ||||||||||||||||||
| BLES Securities Lending | $ | 944,652 | $ | — | $ | 944,652 | $ | — | $ | 944,652 | $ | — | ||||||||||||
| ISMD Securities Lending | $ | 955,613 | $ | — | $ | 955,613 | $ | — | $ | 955,613 | $ | — | ||||||||||||
| WWJD Securities Lending | $ | 588,390 | $ | — | $ | 588,390 | $ | — | $ | 588,390 | $ | — | ||||||||||||
It is each Fund’s policy to obtain additional collateral from, or return excess collateral to, the borrower by the end of the next business day following the valuation date of the securities loaned. Therefore, the value of the collateral held may be temporarily less than that required under the lending contract. As of November 30, 2022, the collateral consisted of institutional government money market funds.
| 9. | UNDERLYING INVESTMENT IN OTHER INVESTMENT COMPANIES |
RISN currently invests a significant portion of its assets in the iShares Treasury Floating Rate Bond ETF (“TFLO”) and WisdomTree Floating Rate Treasury Fund (“USFR”). RISN may redeem its investments in TFLO and USFR at any time if the Adviser determines that it is in the best interest of RISN and its shareholders to do so. RISN’s performance will be directly affected by the performance of TFLO and USFR. The financial statements for TFLO and USFR, including the portfolio of investments, can be found on the Securities and Exchange Commission’s website www.sec.gov and should be read in conjunction with the RISN’s financial statements. As of November 30, 2022, TFLO and USFR comprise 46.87% and 46.71% of RISN’s net assets, respectively.
| 10. | RECENT ACCOUNTING PRONOUNCEMENTS AND REPORTING UPDATES |
In March 2020, FASB issued ASU 2020-04, Reference Rate Reform (Topic 848): Facilitation of the Effects of Reference Rate Reform on Financial Reporting (’‘ASU 2020-04’’). The amendments in ASU 2020-04 provided optional temporary financial reporting relief from the effect of certain types of contract modifications due to the planned discontinuation of LIBOR and other interbank-offered based reference rates. ASU 2020-04 was effective for certain reference rate-related contract modifications that occur during the period March 12, 2020 through December 31, 2022.
130
The Inspire ETFs
NOTES TO FINANCIAL STATEMENTS (Continued)
November 30, 2022
| 11. | SUBSEQUENT EVENTS |
Subsequent events after the date of the Statements of Assets and Liabilities have been evaluated through the date the financial statements were issued.
Management has determined that no other events or transactions occurred requiring adjustment or disclosure in the financial statements other than the following.
The Board declared the following distributions after November 30, 2022:
| Ticker | Dividend Per Share | Ex Date | Record Date | Payable Date | ||||||
| BLES | $ | 0.0534 | 12/14/2022 | 12/15/2022 | 12/20/2022 | |||||
| ISMD | $ | 0.0239 | 12/14/2022 | 12/15/2022 | 12/20/2022 | |||||
| IBD | $ | 0.0803 | 12/14/2022 | 12/15/2022 | 12/20/2022 | |||||
| BIBL | $ | 0.0567 | 12/14/2022 | 12/15/2022 | 12/20/2022 | |||||
| WWJD | $ | 0.0231 | 12/14/2022 | 12/15/2022 | 12/20/2022 | |||||
| RISN | $ | 0.2310 | 12/14/2022 | 12/15/2022 | 12/20/2022 | |||||
| GLRY | $ | 0.0541 | 12/14/2022 | 12/15/2022 | 12/20/2022 | |||||
| FDLS | $ | 0.0567 | 12/14/2022 | 12/15/2022 | 12/20/2022 | |||||
131

REPORT OF INDEPENDENT REGISTERED PUBLIC ACCOUNTING FIRM
To the Board of Trustees of Northern Lights Fund Trust IV and the Shareholders of Inspire Global Hope ETF, Inspire Small/Mid Cap ETF, Inspire Corporate Bond ETF, Inspire 100 ETF, Inspire International ETF, Inspire Tactical Balanced ETF, Inspire Faithward Mid Cap Momentum ETF, and Inspire Fidelis Multi Factor ETF
Opinion on the Financial Statements
We have audited the accompanying statements of assets and liabilities Inspire Global Hope ETF, Inspire Small/Mid Cap ETF, Inspire Corporate Bond ETF, Inspire 100 ETF, Inspire International ETF (formerly known as Inspire International ESG ETF), Inspire Tactical Balanced ETF (formerly known as Inspire Tactical Balanced ESG ETF), Inspire Faithward Mid Cap Momentum ETF (formerly known as Inspire Faithward Mid Cap Momentum ESG ETF), and Inspire Fidelis Multi Factor ETF, each a series of shares of beneficial interest in Northern Lights Fund Trust IV (the “Funds”), including the schedules of investments, as of November 30, 2022, and the related statements of operations, statements of changes in net assets, and the financial highlights as noted in the table below, and the related notes (collectively referred to as the “financial statements”). In our opinion, the financial statements present fairly, in all material respects, the financial position of the Funds as of November 30, 2022, and the results of their operations, the changes in their net assets, and their financial highlights for each of the periods noted in the table below, in conformity with accounting principles generally accepted in the United States of America.
| Fund | Statement of Operations, Statements
of Changes, and Financial Highlights Presented |
| Inspire Global Hope ETF | The statement of operations for the year ended November 30, 2022, the statements of changes in net assets for each of the years in the two-year period then ended, and the financial highlights for each of the years in the five-year period then ended |
| Inspire Small/Mid Cap ETF | The statement of operations for the year ended November 30, 2022, the statements of changes in net assets for each of the years in the two-year period then ended, and the financial highlights for each of the years in the five-year period then ended |
| Inspire Corporate Bond ETF | The statement of operations for the year ended November 30, 2022, the statements of changes in net assets for each of the years in the two-year period then ended, and the financial highlights for each of the years in the five-year period then ended |
| Inspire 100 ETF | The statement of operations for the year ended November 30, 2022, the statements of changes in net assets for each of the years in the two-year period then ended, and the financial highlights for each of the years in the five-year period then ended |
| Inspire International ETF | The statement of operations for the year ended November 30, 2022, the statements of changes in net assets for each of the years in the two-year period ended November 30, 2022 and the financial highlights for each of the years in the three-year period ended November 30, 2022 and for the period from September 30, 2019 (commencement of operations) to November 30, 2019 |
| Inspire Tactical Balanced ETF | The statement of operations for the year ended November 30, 2022, the statements of changes in net assets and the financial highlights for each of the years in the two-year period ended November 30, 2022 and the financial highlights for the period from July 15, 2020 (commencement of operations) to November 30, 2020 |
| Inspire Faithward Mid Cap Momentum ETF | The statement of operations for the year ended November 30, 2022, the statements of changes in net assets and the financial highlights for the year then ended and for the period from December 7, 2020 (commencement of operations) to November 30, 2021 |
| Inspire Fidelis Multi Factor ETF | The statement of operations, the statement of changes in net assets and the financial highlights for the period from August 23, 2022 (commencement of operations) to November 30, 2022 |
132
Basis for Opinion
These financial statements are the responsibility of the Funds’ management. Our responsibility is to express an opinion on the Funds’ financial statements based on our audits. We are a public accounting firm registered with the Public Company Accounting Oversight Board (United States) (“PCAOB”) and are required to be independent with respect to the Funds in accordance with the U.S. federal securities law and the applicable rules and regulations of the Securities and Exchange Commission and the PCAOB.
We conducted our audits in accordance with the standards of the PCAOB. Those standards require that we plan and perform the audits to obtain reasonable assurance about whether the financial statements are free of material misstatement, whether due to error or fraud. The Funds are not required to have, nor were we engaged to perform, an audit of their internal control over financial reporting. As part of our audits we are required to obtain an understanding of internal control over financial reporting but not for the purpose of expressing an opinion on the effectiveness of the Funds’ internal control over financial reporting. Accordingly, we express no such opinion.
Our audits included performing procedures to assess the risk of material misstatement of the financial statements, whether due to error or fraud, and performing procedures that respond to those risks. Such procedures included examining, on a test basis, evidence regarding the amounts and disclosures in the financial statements. Our procedures included confirmation of securities owned as of November 30, 2022 by correspondence with the custodian, brokers, or by other appropriate auditing procedures where replies from brokers were not received. Our audits also included evaluating the accounting principles used and significant estimates made by management, as well as evaluating the overall presentation of the financial statements. We believe that our audits provide a reasonable basis for our opinion.

BBD, LLP
We have served as the auditor of one or more of the Funds in the Northern Lights Fund Trust IV since 2015.
Philadelphia, Pennsylvania
January 27, 2023
134
The Inspire ETFs
EXPENSE EXAMPLES (Unaudited)
November 30, 2022
As a shareholder of one or more of the Funds, you incur two types of costs: (1) transaction costs, including brokerage commissions on purchases and sales of Fund shares; (2) ongoing costs, including management fees and other Fund expenses. This example is intended to help you understand your ongoing costs (in dollars) of investing in the Fund and to compare these costs with the ongoing costs of investing in other funds.
The example is based on an investment of $1,000 invested at the beginning of the period and held for the entire period from June 1, 2022 through November 30, 2022.
Actual Expenses
The “Actual” lines in the table below provide information about actual account values and actual expenses. You may use the information below, together with the amount you invested, to estimate the expenses that you paid over the period. Simply divide your account value by $1,000 (for example, an $8,600 account value divided by $1,000 = 8.6), then multiply the result by the number in the table under the heading entitled “Expenses Paid During Period” to estimate the expenses you paid on your account during this period.
Hypothetical Example for Comparison Purposes
The “Hypothetical” lines in the table below provide information about hypothetical account values and hypothetical expenses based on the Funds’ actual expense ratio and an assumed rate of return of 5% per year before expenses, which is not the Funds’ actual return. The hypothetical account values and expenses may not be used to estimate the actual ending account balances or expenses you paid for the period. You may use this information to compare this 5% hypothetical example with the 5% hypothetical examples that appear in the shareholder reports of other funds.
Please note that the expenses shown in the table are meant to highlight your ongoing costs only and do not reflect any transactional costs, such as brokerage commissions paid on purchases and sales of Fund shares. Therefore, the table is useful in comparing ongoing costs only, and will not help you determine the relative total costs of owning different funds. In addition, if these transactional costs were included, your costs would have been higher.
| Beginning | Ending | Expenses Paid | Expenses Paid | ||
| Account Value | Account Value | During Period* | During Period** | ||
| Actual | 6/1/2022 | 11/30/2022 | 6/1/22 - 11/30/2022 | 6/1/22 - 11/30/2022 | |
| BLES | $1,000.00 | $974.10 | $3.77 | 0.76% | |
| ISMD | $1,000.00 | $1,020.30 | $2.52 | 0.50% | |
| IBD | $1,000.00 | $974.90 | $2.39 | 0.48% | |
| BIBL | $1,000.00 | $985.60 | $1.74 | 0.35% | |
| WWJD | $1,000.00 | $957.80 | $4.48 | 0.91% | |
| RISN | $1,000.00 | $965.50 | $3.39 | 0.69% | |
| GLRY | $1,000.00 | $1,046.10 | $4.86 | 0.95% | |
| FDLS *** | $1,000.00 | $1,042.90 | $3.02 | 1.09% |
135
The Inspire ETFs
EXPENSE EXAMPLES (Unaudited)(Continued)
November 30, 2022
| Beginning | Ending | Expenses Paid | Expenses Paid | ||
| Hypothetical | Account Value | Account Value | During Period* | During Period** | |
| (5% return before expenses) | 6/1/2022 | 11/30/2022 | 6/1/22 - 11/30/2022 | 6/1/22 - 11/30/2022 | |
| BLES | $1,000.00 | $1,021.25 | $3.86 | 0.76% | |
| ISMD | $1,000.00 | $1,022.57 | $2.52 | 0.50% | |
| IBD | $1,000.00 | $1,022.65 | $2.45 | 0.48% | |
| BIBL | $1,000.00 | $1,023.31 | $1.78 | 0.35% | |
| WWJD | $1,000.00 | $1,020.49 | $4.63 | 0.91% | |
| RISN | $1,000.00 | $1,021.62 | $3.48 | 0.69% | |
| GLRY | $1,000.00 | $1,020.32 | $4.80 | 0.95% | |
| FDLS *** | $1,000.00 | $1,010.61 | $2.97 | 1.09% |
| * | Expenses are equal to the average account value over the period, multiplied by each Fund’s annualized expense ratio net of waived/reimbursed fees, multiplied by the number of days in the period (183) divided by the number of days in the fiscal year (365). “Hypothetical” expense information is presented on the basis of the full one -half year period to enable a comparison to other funds. It is based on assuming the same net expense ratio and average account value over the period but is multiplied by 183/365 (to reflect the full half-year period). |
| ** | Annualized. |
| *** | FDLS commenced operations on August 23, 2022 therefore its “Actual” expenses are equal to the average account value over the period, multiplied by the Fund’s annualized expense ratio, multiplied by the number of days in the period (99) divided by the number of days in the fiscal year (365). |
136
The Inspire ETFs
SUPPLEMENTAL INFORMATION
(Unaudited) November 30, 2022
Approval of the Investment Advisory Agreement with Inspire Investing, LLC
In connection with meetings of the Board of Trustees (the “Board”) of Northern Lights Fund Trust IV (the “Trust”) held on April 25, 2022 and August 11, 2022, the Trustees, including a majority of the Trustees who are not “interested persons” as that term is defined in the Investment Company Act of 1940, as amended (the “1940 Act”), discussed the approval of an investment advisory agreement (the “Inspire Advisory Agreement”) between Inspire Investing, LLC (“Inspire”) and the Trust, with respect to Inspire Fidelis Multi Factor ETF (“Inspire FE”). In considering the approval of the Inspire Advisory Agreement, the Board received materials specifically relating to the Inspire Advisory Agreement in advance of their meetings.
The Board was assisted by legal counsel throughout the review process. The Board relied upon the advice of legal counsel and its own business judgment in determining the material factors to be considered in evaluating the Inspire Advisory Agreement and the weight to be given to each such factor. The conclusions reached by the Board were based on a comprehensive evaluation of all of the information provided, including a peer group for Inspire FE that were independently sourced by Broadridge Financial Solutions, Inc. (“Broadridge”) and were not the result of any one factor. Moreover, each Trustee may have afforded different weight to the various factors in reaching his conclusions with respect to the approval of the Inspire Advisory Agreement.
Nature, Extent and Quality of Services. The Board noted that Inspire had approximately $1.9 billion in assets under management and had been in operation since August 2015. The Board further noted that Inspire currently advises five index Biblically Responsible Investing ETFs in the Trust and noted the portfolio management teams experience in managing those ETFs using its proprietary selection methodology, Inspire Impact Score©. The Board noted Inspire’s use of an index provider and Inspire’s oversight. The Board reviewed Inspire’s practices for monitoring compliance as set forth in the investment adviser questionnaire response. The Trust CCO noted the adequacy of Inspire’s compliance program. The Board observed that Inspire selected broker/dealers on the basis of best execution. The Board noted that Inspire monitors daily trading on the listing exchange by, among other means, using a third-party data and analysis provider. After further discussion, the Board concluded that Inspire has the ability to provide a level of service consistent with the Board’s expectations.
Performance. The Board recognized that Inspire FE has not yet begun operations and has no prior investment performance.
Fees and Expenses. The Board discussed the report prepared by Broadridge and reviewed the report prepared by Broadridge regarding Inspire FE’s fees and expenses. The Board discussed that the proposed advisory fee of 0.45% was higher than the Broadridge peer group average of 0.38% but included the costs associated with offering a fund utilizing a third party index provider. They further noted that the Inspire FE’s net expense ratio was higher than its peer group average and Morningstar category average, but noted Inspire’s assertion of the index licensing fee. After further discussion, the Board concluded that the proposed advisory fee was not unreasonable.
Profitability. The Board reviewed a profitability analysis provided by Inspire and considered whether the level of anticipated profit was reasonable. They noted Inspire anticipated realizing a profit in connection with its relationship with Inspire FE, but agreed that such profit was not excessive, both in actual dollars and as a percentage of revenue. The Board concluded, after further discussion, that excessive profit was not a concern at this time.
137
The Inspire ETFs
SUPPLEMENTAL INFORMATION
(Unaudited)(Continued) November 30, 2022
Economies of Scale. The Board noted that economies of scale was not an issue at this time as Inspire FE had not yet launched. The Board noted that consideration of economies of scale would be revisited to the extent assets of Inspire FE grow significantly.
Conclusion. Having requested and received such information from Inspire as the Board believed to be reasonably necessary to evaluate the terms of the Inspire Advisory Agreement, and as assisted by the advice of independent counsel, the Board determined that approval of the Inspire Advisory Agreement is in the best interests of Inspire FE and its future shareholders.
138
The Inspire ETFs
SUPPLEMENTAL INFORMATION (Unaudited)
November 30, 2022
The business address of each Trustee and Officer is 225 Pictoria Drive, Suite 450, Cincinnati, OH 45246. All correspondence to the Trustees and Officers should be directed to c/o Ultimus Fund Solutions, LLC, P.O. Box 541150, Omaha, Nebraska 68154.
Independent Trustees * **
| Name, Address and Year of Birth |
Position/Term of Office * |
Principal
Occupation During the Past Five Years |
Number
of Funds in Fund Complex** Overseen by Trustee |
Other
Directorships held by Trustee During the Past Five Years |
| Joseph
Breslin Year of Birth: 1953 |
Independent Trustee and Chairman of the Board since 2015 | President and Consultant, Adviser Counsel, Inc. (formerly J.E. Breslin & Co.) (management consulting firm to investment advisers), (since 2009); Senior Counsel, White Oak Global Advisors, LLC. (since 2016). | 8 | Northern Lights Fund Trust IV (for series not affiliated with the Fund since 2015); Director, Kinetics Mutual Funds, Inc. (since 2000); Trustee, Kinetics Portfolios Trust (since 2000); Trustee, Forethought Variable Insurance Trust (since 2013); Trustee, BlueArc Multi- Strategy Fund (2014-2017); |
| Thomas
Sarkany Year of Birth: 1946 |
Independent Trustee since 2015 | Founder and President, TTS Consultants, LLC (financial services) (since 2010). | 8 | Northern Lights Fund Trust IV (for series not affiliated with the Fund since 2015); Arrow Investments Trust (since 2014), Arrow ETF Trust (since 2012), Trustee, Northern Lights Fund Trust II (since 2011); Director, Aquila Distributors (since 1981) |
| Charles
Ranson Year of Birth: 1947 |
Independent Trustee since 2015 | Principal, Ranson & Associates (strategic analysis and planning, including risk assessment and capital formation for entrepreneurial ventures) (since 2003). | 8 | Northern Lights Fund Trust IV (for series not affiliated with the Fund since 2015); Advisors Preferred Trust (since November 2012) |
11/30/22 – NLFT IV_v1
139
The Inspire ETFs
SUPPLEMENTAL INFORMATION (Unaudited) (Continued)
November 30, 2022
Officers
| Name,
Address and Year of Birth |
Position/Term of Office * |
Principal
Occupation During the Past Five Years |
Number
of Funds in Fund Complex** Overseen by Trustee |
Other
Directorships held by Trustee During the Past Five Years |
Wendy Wang 80 Arkay Drive Hauppauge, NY 11788 Year of Birth: 1970 |
President since 2015 |
Senior Vice President, Director of Tax and Compliance Administration, Ultimus Fund Solutions, LLC (since 2012). |
N/A |
N/A |
Sam Singh 80 Arkay Drive Hauppauge, NY 11788 Year of Birth: 1976 |
Treasurer since 2015 |
Vice President, Ultimus Fund Solutions, LLC (since 2015); Assistant Vice President, Gemini Fund Services, LLC (2011-2014). |
N/A | N/A |
Jennifer Farrell 80 Arkay Drive Hauppauge, NY 11788 Year of Birth: 1969 |
Secretary since 2017 | Associate Director (since 2022) and Manager, Legal Administration) (2018- 2022, Ultimus Fund Solutions, LLC; Senior Paralegal, Gemini Fund Services, LLC (since 2015); Legal Trainer, Gemini Fund Services, LLC (2013-2015); Senior Paralegal, Gemini Fund Services, LLC (2006-2012). | N/A | N/A |
| James
Ash Year of Birth: 1976 |
Chief Compliance Officer since 2019 | Senior Compliance Officer, Northern Lights Compliance, LLC (since 2019); Senior Vice President, National Sales Gemini Fund Services, LLC (2017-2019); Senior Vice President and Director of Legal Administration, Gemini Fund Services, LLC (2012 - 2017). | N/A | N/A |
| * | The term of office for each Trustee and officer listed above will continue indefinitely until the individual resigns or is removed. |
| ** | As of November 30, 2022, the Trust was comprised of 30 active portfolios managed by unaffiliated investment advisers. The term “Fund Complex” applies only to the Funds. The Funds do not hold themselves out as related to any other series within the Trust for investment purposes, nor do they share the same investment adviser with any other series. |
The Funds SAI includes additional information about the Trustees and is available free of charge, upon request, by calling toll-free at 1-877-658-9473.
11/30/22 – NLFT IV_v1
140
The Inspire ETFs
Additional Information (Unaudited)
November 30, 2022
LIQUIDITY RISK MANAGEMENT PROGRAM
The Funds have adopted and implemented a written liquidity risk management program as required by Rule 22e-4 (the “Liquidity Rule”) under the 1940 Act. The program is reasonably designed to assess and manage the Funds’ liquidity risk, taking into consideration, among other factors, the Funds’ investment strategies and the liquidity of their portfolio investments during normal and reasonably foreseeable stressed conditions; their short and long-term cash flow projections; and their cash holdings and access to other funding sources.
During the year ended November 30, 2022, the Trust’s Liquidity Risk Management Program Committee (the “Committee”) reviewed the Funds’ investments and determined that the Funds held adequate levels of cash and highly liquid investments to meet shareholder redemption activities in accordance with applicable requirements. Accordingly, the Committee concluded that (i) the Funds’ liquidity risk management program is reasonably designed to prevent violations of the Liquidity Rule and (ii) the Funds’ liquidity risk management program has been effectively implemented.
141
PRIVACY NOTICE
Northern Lights Fund Trust IV
Rev. August 2015
| FACTS | WHAT DOES NORTHERN LIGHTS FUND TRUST IV DO WITH YOUR PERSONAL INFORMATION? |
| Why? | Financial companies choose how they share your personal information. Federal law gives consumers the right to limit some, but not all sharing. Federal law also requires us to tell you how we collect, share, and protect your personal information. Please read this notice carefully to understand what we do. |
| What? | The types of personal information we collect and share depends on the product or service that you have with us. This information can include:
● Social Security number and wire transfer instructions
● account transactions and transaction history
● investment experience and purchase history
When you are no longer our customer, we continue to share your information as described in this notice. |
| How? | All financial companies need to share customers’ personal information to run their everyday business. In the section below, we list the reasons financial companies can share their customers’ personal information; the reasons Northern Lights Fund Trust IV chooses to share; and whether you can limit this sharing. |
| Reasons
we can share your personal information: |
Does
Northern Lights Fund Trust IV share information? |
Can you limit this sharing? |
| For our everyday business purposes - such as to process your transactions, maintain your account(s), respond to court orders and legal investigations, or report to credit bureaus. | YES | NO |
| For our marketing purposes - to offer our products and services to you. | NO | We don’t share |
| For joint marketing with other financial companies. | NO | We don’t share |
| For our affiliates’ everyday business purposes - information about your transactions and records. | NO | We don’t share |
| For our affiliates’ everyday business purposes - information about your credit worthiness. | NO | We don’t share |
| For nonaffiliates to market to you | NO | We don’t share |
| QUESTIONS? | Call 1-402-493-4603 |
142
PRIVACY NOTICE
Northern Lights Fund Trust IV
| Page 2 |
| What we do: | |
How does Northern Lights Fund Trust IV protect my personal information? |
To protect your personal information from unauthorized access and use, we use security measures that comply with federal law. These measures include computer safeguards and secured files and buildings.
Our service providers are held accountable for adhering to strict policies and procedures to prevent any misuse of your nonpublic personal information. |
How does Northern Lights Fund Trust IV collect my personal information? |
We collect your personal information, for example, when you ● open an account or deposit money
● direct us to buy securities or direct us to sell your securities
● seek advice about your investments
We also collect your personal information from others, such as credit bureaus, affiliates, or other companies. |
Why can’t I limit all sharing? |
Federal law gives you the right to limit only: ● sharing for affiliates’ everyday business purposes – information about your creditworthiness.
● affiliates from using your information to market to you.
● sharing for nonaffiliates to market to you.
State laws and individual companies may give you additional rights to limit sharing. |
| Definitions | |
| Affiliates | Companies related by common ownership or control. They can be financial and nonfinancial companies.
● Northern Lights Fund Trust IV has no affiliates. |
| Nonaffiliates | Companies not related by common ownership or control. They can be financial and nonfinancial companies.
● Northern Lights Fund Trust IV does not share with nonaffiliates so they can market to you. |
| Joint marketing | A formal agreement between nonaffiliated financial companies that together market financial products or services to you.
● Northern Lights Fund Trust IV does not jointly market. |
143
PROXY VOTING POLICY
Information regarding how the Funds voted proxies relating to portfolio securities for the most recent twelve-month period ended June 30 as well as a description of the policies and procedures that the Funds use to determine how to vote proxies is available without charge, upon request, by calling 1-877-658-9473 or by referring to the Securities and Exchange Commission’s (“SEC”) website at http://www.sec.gov.
PORTFOLIO HOLDINGS
The Funds file a complete schedule of portfolio holdings with the SEC for the first and third quarters of each fiscal year as an exhibit to their reports on Form N-PORT, within sixty days after the end of the period. Form N-PORT reports are available at the SEC’s website at www.sec.gov.
PREMIUM/DISCOUNT INFORMATION
Information regarding how often the Shares of each Fund traded on the exchange at a price above (i.e. at a premium) or below (i.e. at a discount) the NAV of the Fund during the past calendar year can be found at www.inspireetf.com.
INVESTMENT ADVISER
Inspire Investing, LLC
3597 E Monarch Sky Lane, Suite 330
Meridian, ID 83646
INVESTMENT SUB-ADVISER
Seven One Seven Capital Management LTD
1755 Oregon Pike
Lancaster, PA 17601
ADMINISTRATOR
Ultimus Fund Solutions, LLC
4221 North 203rd Street, Suite 100
Elkhorn, NE 68022-3474
INSPIRE-A22
Item 2. Code of Ethics.
(a) As of the end of the period covered by this report, the registrant has adopted a code of ethics that applies to the registrant's principal executive officer, principal financial officer, principal accounting officer or controller, or persons performing similar functions, regardless of whether these individuals are employed by the registrant or a third party.
(b) For purposes of this item, “code of ethics” means written standards that are reasonably designed to deter wrongdoing and to promote:
| (1) | Honest and ethical conduct, including the ethical handling of actual or apparent conflicts of interest between personal and professional relationships; |
| (2) | Full, fair, accurate, timely, and understandable disclosure in reports and documents that a registrant files with, or submits to, the Commission and in other public communications made by the registrant; |
(3) Compliance with applicable governmental laws, rules, and regulations;
| (4) | The prompt internal reporting of violations of the code to an appropriate person or persons identified in the code; and |
(5) Accountability for adherence to the code.
(c) Amendments: During the period covered by the report, there have not been any amendments to the provisions of the code of ethics.
(d) Waivers: During the period covered by the report, the registrant has not granted any express or implicit waivers from the provisions of the code of ethics.
(e) The Code of Ethics is not posted on Registrant’ website.
(f) A copy of the Code of Ethics is attached as an exhibit.
Item 3. Audit Committee Financial Expert.
(a) The Registrant’s board of trustees has determined that Joseph Breslin is an audit committee financial expert, as defined in Item 3 of Form N-CSR. Mr. Breslin is independent for purposes of this Item 3.
Item 4. Principal Accountant Fees and Services.
| (a) | Audit Fees |
2022 – $99,200
2021 – $96,000
| (b) | Audit-Related Fees |
2022 – None
2021 – None
| (c) | Tax Fees |
2022 – $24,800
2021 – $24,000
Preparation of Federal & State income tax returns, assistance with calculation of required income, capital gain and excise distributions and preparation of Federal excise tax returns.
| (d) | All Other Fees |
2022 - None
2021 - None
| (e) | (1) Audit Committee’s Pre-Approval Policies |
The registrant’s Audit Committee is required to pre-approve all audit services and, when appropriate, any non-audit services (including audit-related, tax and all other services) to the registrant. The registrant’s Audit Committee also is required to pre-approve, when appropriate, any non-audit services (including audit-related, tax and all other services) to its adviser, or any entity controlling, controlled by or under common control with the adviser that provides ongoing services to the registrant, to the extent that the services may be determined to have an impact on the operations or financial reporting of the registrant. Services are reviewed on an engagement by engagement basis by the Audit Committee.
| (2) | Percentages of Services Approved by the Audit Committee |
2022 2021
Audit-Related Fees: 0.00% 0.00%
Tax Fees: 0.00% 0.00%
All Other Fees: 0.00% 0.00%
| (f) | During the audit of registrant's financial statements for the most recent fiscal year, less than 50 percent of the hours expended on the principal accountant's engagement were attributed to work performed by persons other than the principal accountant's full-time, permanent employees. |
| (g) | The aggregate non-audit fees billed by the registrant's accountant for services rendered to the registrant, and rendered to the registrant's investment adviser (not including any sub-adviser whose role is primarily portfolio management and is subcontracted with or overseen by another investment adviser), and any entity controlling, controlled by, or under common control with the adviser that provides ongoing services to the registrant: |
2022 - $24,800
(h) The registrant's audit committee has considered whether the provision of non-audit services to the registrant's investment adviser (not including any sub-adviser whose role is primarily portfolio management and is subcontracted with or overseen by another investment adviser), and any entity controlling, controlled by, or under common control with the investment adviser that provides ongoing services to the registrant, that were not pre-approved pursuant to paragraph (c)(7)(ii) of Rule 2-01 of Regulation S-X, is compatible with maintaining the principal accountant's independence.
Item 5. Audit Committee of Listed Companies. The registrant is an issuer as defined in Rule 10A-3 under the Securities Exchange Act of 1934, as amended (the “Exchange Act”) and has a separately-designated standing audit committee established in accordance with Section 3(a)(58)A of the Exchange Act. The registrant’s audit committee members are Joseph Breslin, Charles Ranson and Thomas T. Sarkany
Item 6. Schedule of Investments. Schedule of investments in securities of unaffiliated issuers is included under Item 1.
Item 7. Disclosure of Proxy Voting Policies and Procedures for Closed-End Funds. Not applicable to open-end investment companies.
Item 8. Portfolio Managers of Closed-End Management Investment Companies. Not applicable to open-end investment companies.
Item 9. Purchases of Equity Securities by Closed-End Funds. Not applicable to open-end investment companies.
Item 10. Submission of Matters to a Vote of Security Holders. None
Item 11. Controls and Procedures.
(a) Based on an evaluation of the Registrant’s disclosure controls and procedures as of a date within 90 days of filing date of this Form N-CSR, the principal executive officer and principal financial officer of the Registrant have concluded that the disclosure controls and procedures of the Registrant are reasonably designed to ensure that the information required in filings on Form N-CSR is recorded, processed, summarized, and reported by the filing date, including that information required to be disclosed is accumulated and communicated to the Registrant’s management, including the Registrant’s principal executive officer and principal financial officer, as appropriate to allow timely decisions regarding required disclosure.
(b) There were no significant changes in the Registrant’s internal control over financial reporting that occurred during the Registrant’s last fiscal half-year that have materially affected, or are reasonably likely to materially affect, the Registrant’s internal control over financial reporting.
Item 12. Disclosure of Securities Lending Activities for Closed-End Management Investment Companies. Not applicable to open-end investment companies.
Item 13. Exhibits.
(a)(1) Not applicable.
(a)(3) Not applicable for open-end investment companies.
SIGNATURES
Pursuant to the requirements of the Securities Exchange Act of 1934 and the Investment Company Act of 1940, the registrant has duly caused this report to be signed on its behalf by the undersigned, thereunto duly authorized.
(Registrant) Northern Lights Fund Trust IV
By (Signature and Title)
/s/ Wendy Wang
Wendy Wang, Principal Executive Officer/President
Date 2/7/23
Pursuant to the requirements of the Securities Exchange Act of 1934 and the Investment Company Act of 1940, this report has been signed below by the following persons on behalf of the registrant and in the capacities and on the dates indicated.
By (Signature and Title)
/s/ Wendy Wang
Wendy Wang, Principal Executive Officer/President
Date 2/7/23
By (Signature and Title)
/s/ Sam Singh
Sam Singh, Principal Financial Officer/Treasurer
Date 2/7/23
ATTACHMENTS / EXHIBITS
Serious News for Serious Traders! Try StreetInsider.com Premium Free!
You May Also Be Interested In
- Volato Announces Changes to Board Composition
- Thermo Fisher Scientific to Host Investor Day
- Bunge Reports First Quarter 2024 Results
Create E-mail Alert Related Categories
SEC FilingsSign up for StreetInsider Free!
Receive full access to all new and archived articles, unlimited portfolio tracking, e-mail alerts, custom newswires and RSS feeds - and more!
