

Form N-CSR Manager Directed Portfol For: Sep 30
 Tweet
Tweet Share
ShareUNITED STATES
SECURITIES AND EXCHANGE COMMISSION
Washington, D.C. 20549
SECURITIES AND EXCHANGE COMMISSION
Washington, D.C. 20549
FORM N-CSR
CERTIFIED SHAREHOLDER REPORT OF REGISTERED
MANAGEMENT INVESTMENT COMPANIES
Investment Company Act file number 811-21897
Manager Directed Portfolios
(Exact name of registrant as specified in charter)
(Exact name of registrant as specified in charter)
615 East Michigan Street
Milwaukee, WI 53202
(Address of principal executive offices) (Zip code)
(Address of principal executive offices) (Zip code)
Scott M. Ostrowski, President
Manager Directed Portfolios
c/o U.S. Bank Global Fund Services
811 East Wisconsin Avenue, 8th Floor
Milwaukee, WI 53202
(Name and address of agent for service)
(Name and address of agent for service)
(414) 516-3087
Registrant's telephone number, including area code
Date of fiscal year end: September 30, 2022
Date of reporting period: September 30, 2022
Item 1. Reports to Stockholders.
|
(a)
|
|
GREENSPRING INCOME
OPPORTUNITIES FUND
ANNUAL REPORT
SEPTEMBER 30, 2022
This report is intended for shareholders of the
Greenspring Income Opportunities Fund and may not be
used as sales literature unless preceded or
accompanied by a current prospectus.
Greenspring Income Opportunities Fund (Unaudited)
Dear Fellow Shareholder,
The Annual Report for the Greenspring Income Opportunities Fund (“GRIOX” or the “Fund”) covers the period from the Fund’s inception on December 15, 2021 through September 30, 2022. During this time,
GRIOX embarked on its objective to provide a high level of current income through a conservative approach to the high-yield bond market, by focusing on securities with short duration and attractive risk-adjusted returns. During this period, GRIOX
declined -3.82%, while the Fund’s benchmark, the ICE BofA 1-3 Year BB US Cash Pay High Yield Index, declined -5.13%. Since GRIOX was launched with only 15 days remaining in the fourth quarter of 2021, most of the performance impact occurred
throughout the first three quarters of 2022, during which time the Fund declined -3.82%, while the ICE BofA 1-3 Year BB US Cash Pay High Yield Index dropped -5.63%.
The Fund’s outperformance relative to its benchmark was largely attributable to its defensive security selection, including positions that benefitted from early redemptions in the period, as well as
higher amounts of cash or “dry powder.” This portfolio construction was by design and buffered the Fund from much of the market volatility in the period, while providing the opportunity to deploy capital at higher yields, as interest rates increased
significantly over the period. GRIOX’s strong relative performance vs. its benchmark was accomplished despite the Fund having a slightly longer duration than the benchmark.
As of September 30, 2022, the Fund’s sector allocation was well diversified and driven by fundamentally based bottom-up security selection, with a strong emphasis on capital structure and duration
considerations. Several of the Fund’s largest impacts to positive performance came from company specific catalysts identified through our security specific selection process, including the early redemptions of ChampionX Corp, Rockpoint Gas Storage,
and Genworth Financial bonds, as well as the pending early redemptions of Change Healthcare and Istar Financial bonds, due to announced corporate actions. With respect to sector allocation, the largest positive contributor to performance in the
period was from the Energy sector, which has benefited from a significant increase in commodity prices. The largest negative contributor was from the Industrial sector, led by the Building Products industry group, as softer demand in the housing
market and acute cost inflation has pressured many of the companies in this industry group. The Fund’s largest overall exposure was to the Consumer Discretionary sector, which is comprised of a diverse set of sub-industries and the Fund’s holdings
in this sector feature many secured bonds and issuers with balance sheet strength and company-
|
Greenspring Income Opportunities Fund
|
|||
|
Performance for the
|
|||
|
Periods Ended September 30, 2022
|
|||
|
Quarter
|
1.01%
|
||
|
Year to Date
|
-3.82%
|
||
|
Since inception on 12/15/21*
|
-3.82%
|
||
|
Expense Ratio**
|
1.53%
|
||
|
30-Day SEC Yield (unsubsidized)
|
5.78%
|
||
|
*
|
annualized.
|
|
|
**
|
The net expense ratio is 0.85%, as stated in the Fund’s Prospectus dated December 15, 2021. The Fund’s investment advisor has contractually agreed to waive a portion of its
fees and reimburse certain expenses for the Fund to limit the total annual fund operating expenses (excluding taxes, Rule 12b-1 fees, shareholder servicing fees, extraordinary expenses, brokerage commissions, interest and acquired fund fees
and expenses) to 0.75% through December 15, 2024. Absent advisory fee reductions and expense reimbursements, the expense ratio (gross) would be 1.53% for the Fund’s current fiscal year. The net expense ratio is applicable to investors.
|
Performance data quoted represents past performance; past performance does not guarantee future results. The investment return and principal value of an
investment will fluctuate so that an investor’s shares, when redeemed, may be worth more or less than their original cost. Current performance of the Fund may be lower or higher than the performance quoted. Performance data current to the most recent
month end may be obtained by calling 1-800-366-3863 or by visiting www.greenspringfunds.com.
1
Greenspring Income Opportunities Fund (Unaudited)
specific catalysts. Overall, the Fund’s 144 securities are diversified across 48 industry groups. We believe that diversification and careful security selection are important factors in mitigating
portfolio risk.
The Fund ended the period with a duration-to-worst of 2.4 years, a duration to maturity of 2.5 years, and a subsidized 30-Day SEC Yield of 5.78%.
|
% of Net
|
||
|
Greenspring Income Opportunities Fund
|
Assets
|
|
|
Top 10 Holdings
|
as of
|
|
|
9/30/22
|
||
|
1.
|
Change Healthcare Holdings LLC
|
|
|
5.750% 3/1/25(a)
|
1.4%
|
|
|
2.
|
Stericycle, Inc.
|
|
|
5.375% 7/15/24(a)
|
1.4%
|
|
|
3.
|
Prime Security Services
|
|
|
5.250% 4/15/24(a)
|
1.4%
|
|
|
4.
|
Marriott Ownership Resorts, Inc.
|
|
|
6.125% 9/15/25(a)
|
1.3%
|
|
|
5.
|
Compass Minerals International, Inc.
|
|
|
4.875% 7/15/24(a)
|
1.3%
|
|
|
6.
|
Jaguar Land Rover Automotive PLC
|
|
|
5.625% 2/1/23(a)
|
1.3%
|
|
|
7.
|
Picasso Finance Sub, Inc.
|
|
|
6.125% 6/15/25(a)
|
1.2%
|
|
|
8.
|
PDC Energy, Inc.
|
|
|
6.125% 9/15/24
|
1.2%
|
|
|
9.
|
Dave & Buster’s, Inc.
|
|
|
7.625% 11/1/25(a)
|
1.2%
|
|
|
10.
|
Arconic Corp.
|
|
|
6.000% 5/15/25(a)
|
1.2%
|
|
|
(a)
|
144A Securities available only to qualified institutional buyers, issued by a publicly-traded entity or parent.
|
Fund holdings and sector allocations do not reflect last day of month securities transactions and are subject to change at any time and should not be considered a
recommendation to buy or sell any security.
Market Commentary
The first three quarters of the year have been marked by significant volatility in the fixed income markets, and by a sharp increase in the projected path of interest rates. The Federal Reserve (the
“Fed”) has aggressively raised the Fed Funds rate as well as its projection for future hikes to combat stubbornly high inflation and a tight labor market. Supply chain shortages caused by the pandemic remain in several key markets, and the conflict
between Russia and Ukraine continues to impact several markets, most notably energy. Over the course of the year, the Fed has raised the Fed Funds rate from a zero lower bound to 3.25%, with 75 basis point increases at each of the last two Federal
Open Market Committee meetings. At the September meeting, the Fed also increased its terminal rate forecast to a range of 4.375%-4.875%, and multiple Federal Reserve members have recently discussed their priorities, guiding to a “higher for longer”
interest rate path as inflation continues to be well above the targeted range. These comments inflamed existing concerns of a potential interest rate-driven recession, pushing both Treasury yields higher and corporate bond credit spreads wider. The
10-year U.S. Treasury yield more than doubled, moving from 1.46% to 3.83% and the 2-year U.S. Treasury move was even more dramatic, moving from 0.66% to 4.28% at the end of the period. The resulting yield inversion reflects a prevailing view that a
significant economic slowdown is on the horizon but the questions of when and how severe remain debatable.
The rapid pace of rate increases, combined with increasing fears of a looming recession, drove the broader fixed income markets lower throughout the year, with the Bloomberg US Aggregate Bond Index
declining 14.5% and the Bloomberg US Corporate High Yield Bond Index declining 14.0%. While the macro environment continues to evolve, corporate earnings across many industry groups have been impacted by inflationary pressures. However, following
years of lower rates and robust capital markets, many corporate bond issuers were able to refinance near-term maturities and create substantial flexibility across the capital structure. Despite the earnings headwinds, this flexibility has kept
corporate default rates low across the leveraged capital markets. We anticipate a softer demand
2
Greenspring Income Opportunities Fund (Unaudited)
environment may begin to impact earnings but we remain focused on companies with solid industry positions, strong balance sheets, and cash flow flexibility that can remain resilient even during an
economic slowdown.
With the move higher in both prevailing interest rates and spreads between Treasuries and corporate debt, we see increasingly attractive investment opportunities across the short duration high yield
market. While current spreads remain well below past recessionary environments, all-in absolute yields have moved above long-term averages and are likely to remain elevated during this period of rising interest rates. With the backdrop of evolving
macroeconomic conditions, market volatility is likely to remain, making careful security selection imperative. GRIOX will remain focused on securities with a relatively short duration and continue to rely on our bottoms-up fundamental approach to
security selection in order to drive long-term performance.
Thank you for your support and trust in GRIOX. We look forward to growing with you, as we draw upon the Advisor’s long history in navigating the fixed income markets.
Respectfully,
 |
 |
 |
|
Charles vK. Carlson, CFA
|
Michael J. Pulcinella
|
George A. Truppi, CFA
|
|
Portfolio Manager
|
Portfolio Manager
|
Portfolio Manager
|
Mutual fund investing involves risk. Principal loss is possible. Investments in debt securities are subject to credit, interest rate, call or prepayment, liquidity
and extension risks. Investments in debt securities that are rated below investment grade present a greater risk of loss to principal and interest than higher-rated securities.
Opinions expressed are subject to change, are not guaranteed and should not be considered recommendations to buy or sell any security. Fund holdings and/or sector allocations are subject to change at
any time and are not recommendations to buy or sell any security. Current and future portfolio holdings are subject to risk.
ICE BofA 1-3 Year BB U.S. Cash Pay High Yield Index is a subset of ICE BofA U.S. Cash Pay High Yield Index including all securities with a remaining term to final maturity less than 3 years and rated
BB1 through BB3, inclusive. The Bloomberg U.S. Aggregate Bond Index is a benchmark that measures the investment grade, U.S. dollar-denominated, fixed-rate taxable bond market and includes Treasuries, government-related and corporate securities, MBS,
ABS, and CMBS. The Bloomberg U.S. Corporate High Yield Bond Index measures the USD-denominated, high yield, fixed-rate corporate bond market. Securities are classified as high yield if the middle rating of Moody’s, Fitch and S&P is Ba1/BB+ or
below. Bonds from issuers with an emerging markets country of risk, based on Bloomberg EM country definition, are excluded. Index returns reflect the reinvestment of dividends and capital gains, if any, but do not reflect brokerage commissions or
other expenses of investing. It is not possible to invest directly in an index.
Duration is a commonly used measure of the potential volatility of the price of a debt security, or the aggregate market value of a portfolio of debt securities, prior to maturity. Securities with a
longer duration generally have more volatile prices than securities of comparable quality with a shorter duration. Duration to maturity (modified duration) is a formula that expresses the measurable change in the value of a security in response to a
change in interest rates. Modified duration follows the concept that interest rates and bond prices move in opposite directions. This formula is used to determine the effect that a 100-basis-point (1%) change in interest rates will have on the
price of a bond. Duration to worst is modified duration to the corresponding call date associated with yield to worst. Basis point is one hundredth of one percent. 30-Day SEC Yield (Subsidized/Unsubsidized) represents net investment income earned
by a fund over a 30-day period, expressed as an annual percentage rate based on the fund's share price at the end of the 30-day period. Subsidized yield reflects fee waivers and/or expense reimbursements during the period. Cash flow refers to the net
amount of cash and cash equivalents being transferred in and out of a company. A credit spread, also known as a yield spread, is the difference in yield between two debt securities of the same maturity but different credit quality.
Distributed by Quasar Distributors, LLC
Diversification does not assure a profit, nor does it protect against a loss.
3
Greenspring Income Opportunities Fund
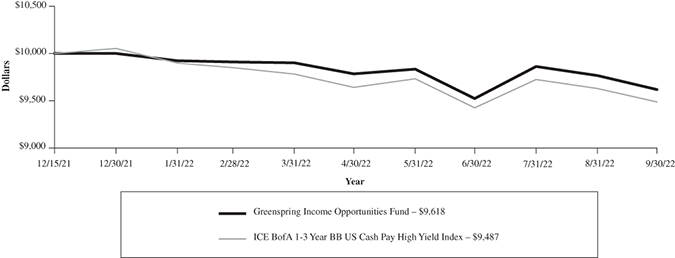
Growth of a $10,000 Investment in the Greenspring Income Opportunities Fund
|
Since Inception
|
|
|
Annualized Total Return Periods Ended September 30, 2022:
|
(12/15/2021)
|
|
Greenspring Income Opportunities Fund
|
(3.82)%
|
|
ICE BofA 1-3 Year BB US Cash Pay High Yield Index
|
(5.13)%
|
Expense ratios*: Gross 1.53%, Net 0.85%
Performance data quoted represents past performance; past performance does not guarantee future results. The investment return and principal value of an investment will fluctuate so
that an investor’s shares, when redeemed, may be worth more or less than their original cost. Current performance of the Fund may be lower or higher than the performance quoted. Performance data current to the most recent month end may be obtained by
calling 1-800-497-2960.
This chart illustrates the performance of a hypothetical $10,000 investment made in the Fund on December 15, 2021, the Fund’s inception date. Returns reflect the reinvestment of dividends and capital
gain distributions. The performance data and expense ratios shown reflect a contractual fee waiver made by the Advisor, currently, through December 15, 2023. In the absence of fee waivers, returns would be reduced. The performance data and graph do
not reflect the deduction of taxes that a shareholder may pay on dividends, capital gain distributions, or redemption of Fund shares. This chart does not imply any future performance.
* The expense ratios presented are from the most recent prospectus.
4
Greenspring Income Opportunities Fund
|
EXPENSE EXAMPLE For the Period Ended September 30, 2022
(Unaudited)
|
As a shareholder of the Fund, you incur two types of costs: (1) transaction costs including sales charges (loads) and redemption fees, if applicable; and (2) ongoing costs, including management fees;
and other Fund expenses. This Example is intended to help you understand your ongoing costs (in dollars) of investing in the Fund and to compare these costs with the ongoing costs of investing in other mutual funds.
The Example is based on an investment of $1,000 invested at the beginning of the period indicated and held for the period from April 1, 2022 to September 30, 2022, for the Institutional Shares.
Actual Expenses
The information in the table under the heading “Actual” provides information about actual account values and actual expenses. You may use the information in these columns together with the amount you
invested, to estimate the expenses that you paid over the period. Simply divide your account value by $1,000 (for example, an $8,600 account value divided by $1,000 = 8.6), then multiply the result by the number in the row entitled “Expenses Paid
During Period” to estimate the expenses you paid on your account during this period. There are some account fees that are charged to certain types of accounts, such as Individual Retirement Accounts (generally, a $15 fee is charged to the account
annually) that would increase the amount of expenses paid on your account. The example below does not include portfolio trading commissions and related expenses and other extraordinary expenses as determined under generally accepted accounting
principles.
Hypothetical Example for Comparison Purposes
The information in the table under the heading “Hypothetical (5% return before expenses)” provides information about hypothetical account values and hypothetical expenses based on the Fund’s actual
expense ratio and assumed rate of return of 5% per year before expenses, which is not the Fund’s actual return. The hypothetical account values and expenses may not be used to estimate the actual ending account balance or expenses you paid for the
period. You may use this information to compare the ongoing costs of investing in the Fund and other funds. To do so, compare this 5% hypothetical example with the 5% hypothetical examples that appear in the shareholder reports of the other funds.
As noted above, there are some account fees that are charged to certain types of accounts that would increase the amount of expense paid on your account.
Please note that the expenses shown in the table are meant to highlight your ongoing costs only and do not reflect any transaction costs, such as sales charges (loads), redemption fees, or exchange
fees. Therefore, the information under the heading “Hypothetical (5% return before expenses)” is useful in comparing ongoing costs only, and will not help you determine the relative total costs of owning different funds. In addition, if these
transactional costs were included, your costs would have been higher.
|
Beginning
|
Ending
|
Expenses Paid
|
||
|
Account Value
|
Account Value
|
During Period(1)
|
||
|
4/1/2022
|
9/30/2022
|
4/1/2022-9/30/2022
|
||
|
Actual
|
||||
|
Institutional Shares
|
$1,000.00
|
$971.40
|
$4.20
|
|
|
Hypothetical
|
||||
|
(5% return before expenses)
|
||||
|
Institutional Shares
|
$1,000.00
|
$1,020.81
|
$4.31
|
|
(1)
|
Expenses are equal to the Institutional Shares’ annualized expense ratios of 0.85% multiplied by the average account value over the period, multiplied by 183/365 (to reflect the 6-month period
ending September 30, 2022).
|
5
Greenspring Income Opportunities Fund
|
ALLOCATION OF PORTFOLIO ASSETS at September 30, 2022
(Unaudited)
|
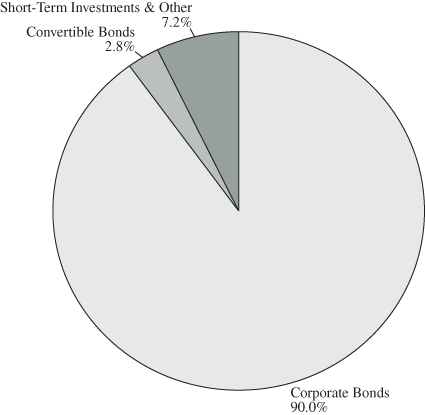
Percentages represent market value as a percentage of net assets.
Note: For Presentation purposes, the Fund has grouped some of the industry categories for purposes of categorizing securities for compliance with Section 8(b)(1) of the Investment Company Act of 1940,
as amended, the Fund uses more specific industry classifications.
6
Greenspring Income Opportunities Fund
|
SCHEDULE OF INVESTMENTS at September 30, 2022
|
|
Par Value
|
Value
|
|||||||
|
CORPORATE BONDS – 90.0%
|
||||||||
|
COMMUNICATION SERVICES – 7.1%
|
||||||||
|
Cable & Satellite – 2.1%
|
||||||||
|
CCO Holdings Capital Corp./
|
||||||||
|
Charter Communications
|
||||||||
|
4.000%, 03/01/2023 (b)
|
$
|
350,000
|
$
|
348,425
|
||||
|
5.500%, 05/01/2026 (b)
|
350,000
|
332,134
|
||||||
|
5.125%, 05/01/2027 (b)
|
304,000
|
274,859
|
||||||
|
Viasat, Inc.
|
||||||||
|
5.625%, 09/15/2025 (b)
|
535,000
|
416,128
|
||||||
|
Videotron Ltd.
|
||||||||
|
5.375%, 06/15/2024 (b)
|
618,000
|
606,431
|
||||||
|
1,977,977
|
||||||||
|
Internet & Media – 1.4%
|
||||||||
|
Uber Technologies, Inc.
|
||||||||
|
7.500%, 05/15/2025 (b)
|
1,080,000
|
1,078,887
|
||||||
|
8.000%, 11/01/2026 (b)
|
232,000
|
231,962
|
||||||
|
1,310,849
|
||||||||
|
Media & Entertainment – 3.1%
|
||||||||
|
Cinemark USA, Inc.
|
||||||||
|
8.750%, 05/01/2025 (b)
|
735,000
|
745,948
|
||||||
|
iHeartCommunications, Inc.
|
||||||||
|
8.375%, 05/01/2027
|
350,000
|
295,094
|
||||||
|
Nexstar Media, Inc.
|
||||||||
|
5.625%, 07/15/2027 (b)
|
920,000
|
847,667
|
||||||
|
Nielsen Co. (Luxembourg)
|
||||||||
|
5.000%, 02/01/2025 (b)
|
750,000
|
736,378
|
||||||
|
TEGNA, Inc.
|
||||||||
|
4.625%, 03/15/2028
|
300,000
|
277,616
|
||||||
|
2,902,703
|
||||||||
|
Telecommunication Services – 0.5%
|
||||||||
|
Level 3 Financing, Inc.
|
||||||||
|
4.625%, 09/15/2027 (b)
|
540,000
|
448,222
|
||||||
|
TOTAL COMMUNICATION SERVICES
|
6,639,751
|
|||||||
|
CONSUMER DISCRETIONARY – 21.7%
|
||||||||
|
Apparel & Textiles – 0.8%
|
||||||||
|
Hanesbrands, Inc.
|
||||||||
|
4.625%, 05/15/2024 (b)
|
833,000
|
795,411
|
||||||
|
Automobiles – 1.3%
|
||||||||
|
Jaguar Land Rover Automotive PLC
|
||||||||
|
5.625%, 02/01/2023 (b)
|
1,200,000
|
1,174,816
|
||||||
|
Auto Components – 1.5%
|
||||||||
|
Dana, Inc.
|
||||||||
|
5.625%, 06/15/2028
|
100,000
|
82,720
|
||||||
|
Dana Financing Luxembourg
|
||||||||
|
5.750%, 04/15/2025(b)
|
575,000
|
548,406
|
||||||
|
Goodyear Tire & Rubber Co.
|
||||||||
|
9.500%, 05/31/2025
|
725,000
|
753,380
|
||||||
|
1,384,506
|
||||||||
|
Automobile Wholesalers – 1.1%
|
||||||||
|
IAA, Inc.
|
||||||||
|
5.500%, 06/15/2027 (b)
|
897,000
|
819,665
|
||||||
|
KAR Auction Services, Inc.
|
||||||||
|
5.125%, 06/01/2025 (b)
|
187,000
|
180,725
|
||||||
|
1,000,390
|
||||||||
|
Casinos & Gaming – 3.3%
|
||||||||
|
Boyd Gaming Corp.
|
||||||||
|
4.750%, 12/01/2027
|
675,000
|
598,725
|
||||||
|
Caesars Entertainment, Inc.
|
||||||||
|
6.250%, 07/01/2025 (b)
|
880,000
|
849,570
|
||||||
|
MGM Resorts International
|
||||||||
|
6.000%, 03/15/2023
|
250,000
|
250,392
|
||||||
|
6.750%, 05/01/2025
|
395,000
|
389,575
|
||||||
|
Scientific Games International, Inc.
|
||||||||
|
8.625%, 07/01/2025 (b)
|
958,000
|
981,969
|
||||||
|
3,070,231
|
||||||||
|
Diversified Consumer Services – 0.9%
|
||||||||
|
Graham Holdings Co.
|
||||||||
|
5.750%, 06/01/2026 (b)
|
850,000
|
825,431
|
||||||
|
Homebuilding – 0.9%
|
||||||||
|
Beazer Homes USA, Inc.
|
||||||||
|
6.750%, 03/15/2025
|
250,000
|
232,330
|
||||||
|
Century Communities, Inc.
|
||||||||
|
6.750%, 06/01/2027
|
685,000
|
641,132
|
||||||
|
873,462
|
||||||||
|
Household Durables – 0.3%
|
||||||||
|
Newell Brands, Inc.
|
||||||||
|
6.375%, 09/15/2027
|
250,000
|
248,162
|
||||||
The accompanying notes are an integral part of these financial statements.
7
Greenspring Income Opportunities Fund
|
SCHEDULE OF INVESTMENTS at September 30, 2022 (Con’t)
|
|
Par Value
|
Value
|
|||||||
|
CORPORATE BONDS – 90.0% (Con’t)
|
||||||||
|
CONSUMER DISCRETIONARY – 21.7% (Con’t)
|
||||||||
|
Leisure – 2.9%
|
||||||||
|
Cedar Fair LP
|
||||||||
|
5.500%, 05/01/2025 (b)
|
$
|
333,000
|
$
|
320,784
|
||||
|
5.375%, 04/15/2027
|
350,000
|
325,587
|
||||||
|
6.500%, 10/01/2028
|
225,000
|
208,555
|
||||||
|
Six Flags Entertainment Corp.
|
||||||||
|
4.875%, 07/31/2024 (b)
|
980,000
|
934,705
|
||||||
|
7.000%, 07/01/2025 (b)
|
180,000
|
180,194
|
||||||
|
Vail Resorts, Inc.
|
||||||||
|
6.250%, 05/15/2025 (b)
|
730,000
|
721,174
|
||||||
|
2,690,999
|
||||||||
|
Lodging – 3.5%
|
||||||||
|
Arrow Bidco LLC
|
||||||||
|
9.500%, 03/15/2024 (b)
|
750,000
|
750,891
|
||||||
|
Hilton Domestic Operating Co, Inc.
|
||||||||
|
5.375%, 05/01/2025 (b)
|
125,000
|
122,482
|
||||||
|
4.875%, 04/01/2027
|
125,000
|
114,959
|
||||||
|
Marriott Ownership Resorts, Inc.
|
||||||||
|
6.125%, 09/15/2025 (b)
|
1,261,000
|
1,234,697
|
||||||
|
4.750%, 01/15/2028
|
137,000
|
114,870
|
||||||
|
Travel + Leisure Co.
|
||||||||
|
5.650%, 04/01/2024
|
925,000
|
905,409
|
||||||
|
3,243,308
|
||||||||
|
Restaurants – 1.7%
|
||||||||
|
Brinker International, Inc.
|
||||||||
|
3.875%, 05/15/2023
|
55,000
|
54,090
|
||||||
|
Dave & Buster’s, Inc.
|
||||||||
|
7.625%, 11/01/2025 (b)
|
1,110,000
|
1,094,566
|
||||||
|
New Red Finance, Inc.
|
||||||||
|
(Restaurant Brands International)
|
||||||||
|
5.750%, 04/15/2025 (b)
|
500,000
|
496,094
|
||||||
|
1,644,750
|
||||||||
|
Retail – 3.5%
|
||||||||
|
Academy Ltd.
|
||||||||
|
6.000%, 11/15/2027 (b)
|
590,000
|
536,280
|
||||||
|
NMG Holding Co., Inc. / Neiman Marcus
|
||||||||
|
7.125%, 04/01/2026 (b)
|
1,157,000
|
1,064,807
|
||||||
|
Sally Holdings LLC
|
||||||||
|
5.625%, 12/01/2025
|
875,000
|
830,401
|
||||||
|
Signet UK Finance PLC
|
||||||||
|
4.700%, 06/15/2024
|
925,000
|
892,588
|
||||||
|
3,324,076
|
||||||||
|
TOTAL CONSUMER DISCRETIONARY
|
20,275,542
|
|||||||
|
CONSUMER STAPLES – 4.8%
|
||||||||
|
Food & Beverage – 0.5%
|
||||||||
|
Darling Ingredients, Inc.
|
||||||||
|
5.250%, 04/15/2027 (b)
|
518,000
|
489,294
|
||||||
|
Food & Staples Retailing – 2.2%
|
||||||||
|
Albertsons Cos.
|
||||||||
|
7.500%, 03/15/2026 (b)
|
500,000
|
503,710
|
||||||
|
5.875%, 02/15/2028 (b)
|
533,000
|
492,801
|
||||||
|
US Foods, Inc.
|
||||||||
|
6.250%, 04/15/2025 (b)
|
1,065,000
|
1,047,896
|
||||||
|
2,044,407
|
||||||||
|
Household & Personal Products – 2.1%
|
||||||||
|
Coty, Inc.
|
||||||||
|
5.000%, 04/15/2026 (b)
|
950,000
|
866,078
|
||||||
|
6.500%, 04/15/2026 (b)
|
235,000
|
216,826
|
||||||
|
Spectrum Brands, Inc.
|
||||||||
|
5.750%, 07/15/2025
|
525,000
|
496,878
|
||||||
|
5.000%, 10/01/2029 (b)
|
450,000
|
359,001
|
||||||
|
1,938,783
|
||||||||
|
TOTAL CONSUMER STAPLES
|
4,472,484
|
|||||||
|
ENERGY – 6.3%
|
||||||||
|
Energy Equipment & Services – 0.6%
|
||||||||
|
Weatherford International Ltd.
|
||||||||
|
11.000%, 12/01/2024 (b)
|
571,000
|
581,832
|
||||||
|
Energy Midstream – 1.9%
|
||||||||
|
Antero Midstream Partners LP
|
||||||||
|
7.875%, 05/15/2026 (b)
|
925,000
|
930,855
|
||||||
|
New Fortress Energy, Inc.
|
||||||||
|
6.750%, 09/15/2025 (b)
|
850,000
|
806,599
|
||||||
|
1,737,454
|
||||||||
|
Exploration & Production – 3.8%
|
||||||||
|
Carrizo Oil & Gas, Inc.
|
||||||||
|
8.250%, 07/15/2025
|
350,000
|
341,876
|
||||||
The accompanying notes are an integral part of these financial statements.
8
Greenspring Income Opportunities Fund
|
SCHEDULE OF INVESTMENTS at September 30, 2022 (Con’t)
|
|
Par Value
|
Value
|
|||||||
|
CORPORATE BONDS – 90.0% (Con’t)
|
||||||||
|
ENERGY – 6.3% (Con’t)
|
||||||||
|
Exploration & Production – 3.8% (Con’t)
|
||||||||
|
Chesapeake Energy Corp.
|
||||||||
|
5.500%, 02/01/2026 (b)
|
$
|
944,000
|
$
|
905,074
|
||||
|
PDC Energy, Inc.
|
||||||||
|
6.125%, 09/15/2024
|
1,115,000
|
1,102,732
|
||||||
|
5.750%, 05/15/2026
|
263,000
|
243,663
|
||||||
|
Range Resources Corp.
|
||||||||
|
5.000%, 03/15/2023
|
740,000
|
738,568
|
||||||
|
SM Energy Co.
|
||||||||
|
5.625%, 06/01/2025
|
250,000
|
240,344
|
||||||
|
3,572,257
|
||||||||
|
TOTAL ENERGY
|
5,891,543
|
|||||||
|
FINANCIALS – 2.5%
|
||||||||
|
Consumer Finance – 1.4%
|
||||||||
|
Credit Acceptance Corp.
|
||||||||
|
5.125%, 12/31/2024 (b)
|
725,000
|
676,213
|
||||||
|
6.625%, 03/15/2026
|
153,000
|
142,113
|
||||||
|
OneMain Finance Corp.
|
||||||||
|
5.625%, 03/15/2023
|
500,000
|
498,198
|
||||||
|
1,316,524
|
||||||||
|
Specialty Insurance – 1.1%
|
||||||||
|
Enact Holdings, Inc.
|
||||||||
|
6.500%, 08/15/2025 (b)
|
800,000
|
765,860
|
||||||
|
Radian Group, Inc.
|
||||||||
|
4.500%, 10/01/2024
|
253,000
|
239,697
|
||||||
|
1,005,557
|
||||||||
|
TOTAL FINANCIALS
|
2,322,081
|
|||||||
|
HEALTHCARE – 6.8%
|
||||||||
|
Healthcare Equipment & Supplies – 0.4%
|
||||||||
|
Teleflex, Inc.
|
||||||||
|
4.625%, 11/15/2027
|
450,000
|
406,091
|
||||||
|
Healthcare Providers & Services – 3.7%
|
||||||||
|
Acadia Healthcare Co, Inc.
|
||||||||
|
5.500%, 07/01/2028 (b)
|
610,000
|
557,418
|
||||||
|
AdaptHealth LLC
|
||||||||
|
6.125%, 08/01/2028 (b)
|
847,000
|
760,365
|
||||||
|
Encompass Health Corp.
|
||||||||
|
5.750%, 09/15/2025
|
500,000
|
496,132
|
||||||
|
Select Medical Corp.
|
||||||||
|
6.250%, 08/15/2026 (b)
|
950,000
|
895,043
|
||||||
|
Tenet Healthcare Corp.
|
||||||||
|
4.875%, 01/01/2026 (b)
|
813,000
|
756,574
|
||||||
|
3,465,532
|
||||||||
|
Healthcare Technology – 1.4%
|
||||||||
|
Change Healthcare Holdings LLC
|
||||||||
|
5.750%, 03/01/2025 (b)
|
1,350,000
|
1,343,803
|
||||||
|
Life Sciences Tools & Services – 0.9%
|
||||||||
|
Avantor Funding, Inc.
|
||||||||
|
4.625%, 07/15/2028 (b)
|
250,000
|
223,037
|
||||||
|
IQVIA, Inc.
|
||||||||
|
5.000%, 10/15/2026 (b)
|
645,000
|
615,406
|
||||||
|
838,443
|
||||||||
|
Pharmaceuticals – 0.4%
|
||||||||
|
Elanco Animal Health, Inc.
|
||||||||
|
5.772%, 08/28/2023
|
350,000
|
344,893
|
||||||
|
TOTAL HEALTHCARE
|
6,398,762
|
|||||||
|
INDUSTRIALS – 18.9%
|
||||||||
|
Aerospace & Defense – 1.7%
|
||||||||
|
Maxar Technologies, Inc.
|
||||||||
|
7.750%, 06/15/2027 (b)
|
576,000
|
542,442
|
||||||
|
TransDigm, Inc.
|
||||||||
|
8.000%, 12/15/2025 (b)
|
450,000
|
457,083
|
||||||
|
6.250%, 03/15/2026 (b)
|
497,000
|
482,930
|
||||||
|
6.375%, 06/15/2026
|
158,000
|
149,461
|
||||||
|
1,631,916
|
||||||||
|
Building Products – 2.3%
|
||||||||
|
Advanced Drainage Systems, Inc.
|
||||||||
|
5.000%, 09/30/2027 (b)
|
715,000
|
658,658
|
||||||
|
Griffon Corp.
|
||||||||
|
5.750%, 03/01/2028
|
805,000
|
693,367
|
||||||
|
JELD-WEN, Inc.
|
||||||||
|
6.250%, 05/15/2025 (b)
|
375,000
|
353,293
|
||||||
|
4.625%, 12/15/2025 (b)
|
500,000
|
405,937
|
||||||
|
2,111,255
|
||||||||
The accompanying notes are an integral part of these financial statements.
9
Greenspring Income Opportunities Fund
|
SCHEDULE OF INVESTMENTS at September 30, 2022 (Con’t)
|
|
Par Value
|
Value
|
|||||||
|
CORPORATE BONDS – 90.0% (Con’t)
|
||||||||
|
INDUSTRIALS – 18.9% (Con’t)
|
||||||||
|
Commercial Services & Supplies – 5.1%
|
||||||||
|
Aramark Services, Inc.
|
||||||||
|
6.375%, 05/01/2025 (b)
|
$
|
1,112,000
|
$
|
1,091,400
|
||||
|
Matthews International Corp.
|
||||||||
|
5.250%, 12/01/2025 (b)
|
1,165,000
|
1,057,803
|
||||||
|
Prime Security Services Borrower LLC /
|
||||||||
|
Prime Finance, Inc.
|
||||||||
|
5.250%, 04/15/2024 (b)
|
1,320,000
|
1,275,562
|
||||||
|
Stericycle, Inc.
|
||||||||
|
5.375%, 07/15/2024 (b)
|
1,385,000
|
1,333,367
|
||||||
|
4,758,132
|
||||||||
|
Electrical Equipment & Instruments – 0.9%
|
||||||||
|
EnerSys
|
||||||||
|
5.000%, 04/30/2023 (b)
|
825,000
|
816,284
|
||||||
|
Engineering & Construction – 1.7%
|
||||||||
|
Picasso Finance Sub, Inc.
|
||||||||
|
6.125%, 06/15/2025 (b)
|
1,154,000
|
1,132,293
|
||||||
|
Pike Corp.
|
||||||||
|
5.500%, 09/01/2028 (b)
|
620,000
|
502,994
|
||||||
|
1,635,287
|
||||||||
|
Environmental Services – 1.6%
|
||||||||
|
Clean Harbors, Inc.
|
||||||||
|
4.875%, 07/15/2027 (b)
|
650,000
|
594,006
|
||||||
|
GFL Environmental, Inc.
|
||||||||
|
4.250%, 06/01/2025 (b)
|
750,000
|
704,925
|
||||||
|
5.125%, 12/15/2026 (b)
|
270,000
|
251,775
|
||||||
|
1,550,706
|
||||||||
|
Machinery – 1.7%
|
||||||||
|
EnPro Industries, Inc.
|
||||||||
|
5.750%, 10/15/2026
|
750,000
|
724,999
|
||||||
|
Stevens Holding Co, Inc.
|
||||||||
|
6.125%, 10/01/2026 (b)
|
850,000
|
831,912
|
||||||
|
1,556,911
|
||||||||
|
Trading Companies & Distributors – 2.8%
|
||||||||
|
Herc Holdings, Inc.
|
||||||||
|
5.500%, 07/15/2027 (b)
|
964,000
|
869,542
|
||||||
|
Univar Solutions USA, Inc.
|
||||||||
|
5.125%, 12/01/2027 (b)
|
730,000
|
651,211
|
||||||
|
WESCO Distribution, Inc.
|
||||||||
|
7.125%, 06/15/2025 (b)
|
594,000
|
595,277
|
||||||
|
7.250%, 06/15/2028 (b)
|
475,000
|
466,254
|
||||||
|
2,582,284
|
||||||||
|
Transportation – 1.1%
|
||||||||
|
XPO Logistics, Inc.
|
||||||||
|
6.250%, 05/01/2025 (b)
|
1,000,000
|
1,004,210
|
||||||
|
TOTAL INDUSTRIALS
|
17,646,985
|
|||||||
|
INFORMATION TECHNOLOGY – 4.0%
|
||||||||
|
Software & Services – 3.9%
|
||||||||
|
ACI WORLDWIDE, Inc.
|
||||||||
|
5.750%, 08/15/2026 (b)
|
1,056,000
|
999,889
|
||||||
|
Consensus Cloud Solutions, Inc.
|
||||||||
|
6.000%, 10/15/2026 (b)
|
915,000
|
811,299
|
||||||
|
NortonLifeLock, Inc.
|
||||||||
|
5.000%, 04/15/2025 (b)
|
965,000
|
920,485
|
||||||
|
6.750%, 09/30/2027 (b)
|
410,000
|
394,385
|
||||||
|
PTC, Inc.
|
||||||||
|
3.625%, 02/15/2025 (b)
|
500,000
|
466,419
|
||||||
|
3,592,477
|
||||||||
|
Technology & Hardwares – 0.1%
|
||||||||
|
CDW LLC
|
||||||||
|
5.500%, 12/01/2024
|
15,000
|
14,937
|
||||||
|
4.250%, 04/01/2028
|
125,000
|
111,689
|
||||||
|
126,626
|
||||||||
|
TOTAL INFORMATION TECHNOLOGY
|
3,719,103
|
|||||||
|
MATERIALS – 10.6%
|
||||||||
|
Chemicals – 2.3%
|
||||||||
|
Avient Corp.
|
||||||||
|
5.750%, 05/15/2025 (b)
|
800,000
|
772,980
|
||||||
|
Axalta Coating Systems LLC
|
||||||||
|
4.750%, 06/15/2027 (b)
|
1,050,000
|
937,289
|
||||||
|
H.B. Fuller Co.
|
||||||||
|
4.250%, 10/15/2028
|
260,000
|
219,296
|
||||||
|
Scotts Miracle-Gro Co.
|
||||||||
|
5.250%, 12/15/2026
|
250,000
|
227,380
|
||||||
|
2,156,945
|
||||||||
The accompanying notes are an integral part of these financial statements.
10
Greenspring Income Opportunities Fund
|
SCHEDULE OF INVESTMENTS at September 30, 2022 (Con’t)
|
|
Par Value
|
Value
|
|||||||
|
CORPORATE BONDS – 90.0% (Con’t)
|
||||||||
|
MATERIALS – 10.6% (Con’t)
|
||||||||
|
Metals & Mining – 5.8%
|
||||||||
|
Allegheny Ludlum LLC
|
||||||||
|
6.950%, 12/15/2025
|
$
|
500,000
|
$
|
493,897
|
||||
|
Arconic Corp.
|
||||||||
|
6.000%, 05/15/2025 (b)
|
1,134,000
|
1,094,384
|
||||||
|
Cleveland-Cliffs, Inc.
|
||||||||
|
6.750%, 03/15/2026 (b)
|
636,000
|
626,380
|
||||||
|
5.875%, 06/01/2027
|
258,000
|
232,744
|
||||||
|
Compass Minerals International, Inc.
|
||||||||
|
4.875%, 07/15/2024 (b)
|
1,250,000
|
1,177,483
|
||||||
|
First Quantum Minerals Ltd.
|
||||||||
|
6.500%, 03/01/2024 (b)
|
1,114,000
|
1,093,090
|
||||||
|
7.500%, 04/01/2025 (b)
|
680,000
|
655,374
|
||||||
|
5,373,352
|
||||||||
|
Packaging & Containers – 2.5%
|
||||||||
|
Berry Global, Inc.
|
||||||||
|
4.500%, 02/15/2026 (b)
|
440,000
|
408,179
|
||||||
|
4.875%, 07/15/2026 (b)
|
502,000
|
472,518
|
||||||
|
Crown Americas LLC /
|
||||||||
|
Crown Americas Capital Corp VI
|
||||||||
|
4.750%, 02/01/2026
|
250,000
|
233,299
|
||||||
|
Graphic Packaging International LLC
|
||||||||
|
4.875%, 11/15/2022
|
200,000
|
200,001
|
||||||
|
4.125%, 08/15/2024
|
450,000
|
432,563
|
||||||
|
Pactiv Evergreen Group, Inc.
|
||||||||
|
4.000%, 10/15/2027 (b)
|
250,000
|
210,100
|
||||||
|
7.950%, 12/15/2025
|
415,000
|
386,153
|
||||||
|
2,342,813
|
||||||||
|
TOTAL MATERIALS
|
9,873,110
|
|||||||
|
REAL ESTATE – 4.8%
|
||||||||
|
REITs – 4.2%
|
||||||||
|
Iron Mountain, Inc.
|
||||||||
|
4.875%, 09/15/2027 (b)
|
893,000
|
801,467
|
||||||
|
iStar, Inc.
|
||||||||
|
4.750%, 10/01/2024
|
670,000
|
661,762
|
||||||
|
5.500%, 02/15/2026
|
775,000
|
780,836
|
||||||
|
MPT Operating Partnership LP
|
||||||||
|
5.250%, 08/01/2026
|
900,000
|
825,176
|
||||||
|
Starwood Property Trust, Inc.
|
||||||||
|
5.500%, 11/01/2023 (b)
|
850,000
|
836,965
|
||||||
|
3,906,206
|
||||||||
|
Real Estate Management & Services – 0.6%
|
||||||||
|
Newmark Group, Inc.
|
||||||||
|
6.125%, 11/15/2023
|
550,000
|
542,615
|
||||||
|
TOTAL REAL ESTATE
|
4,448,821
|
|||||||
|
UTILITIES – 2.5%
|
||||||||
|
Utilities – 2.5%
|
||||||||
|
NextEra Energy Operating Partners LP
|
||||||||
|
4.250%, 07/15/2024 (b)
|
695,000
|
666,492
|
||||||
|
NRG Energy, Inc.
|
||||||||
|
6.625%, 01/15/2027
|
816,000
|
801,048
|
||||||
|
Vistra Operations Co LLC
|
||||||||
|
5.500%, 09/01/2026 (b)
|
406,000
|
377,111
|
||||||
|
5.625%, 02/15/2027 (b)
|
500,000
|
469,142
|
||||||
|
TOTAL UTILITIES
|
2,313,793
|
|||||||
|
TOTAL CORPORATE BONDS
|
||||||||
|
(Cost $88,154,952)
|
84,001,975
|
|||||||
|
CONVERTIBLE BONDS – 2.8%
|
||||||||
|
FINANCIALS – 0.7%
|
||||||||
|
Commercial Banks & Thrifts – 0.7%
|
||||||||
|
Hope Bancorp, Inc.
|
||||||||
|
2.000%, 05/15/2038
|
713,000
|
683,125
|
||||||
|
HEALTHCARE – 0.4%
|
||||||||
|
Healthcare Equipment & Supplies – 0.4%
|
||||||||
|
Haemonetics Corp.
|
||||||||
|
0.000%, 03/01/2026
|
510,000
|
407,976
|
||||||
|
REAL ESTATE – 1.7%
|
||||||||
|
REITs – 1.7%
|
||||||||
|
Blackstone Mortgage Trust, Inc.
|
||||||||
|
4.750%, 03/15/2023
|
625,000
|
622,678
|
||||||
|
DigitalBridge Group, Inc.
|
||||||||
|
5.000%, 04/15/2023
|
934,000
|
924,193
|
||||||
|
TOTAL REAL ESTATE
|
1,546,871
|
|||||||
|
TOTAL CONVERTIBLE BONDS
|
||||||||
|
(Cost $2,661,024)
|
2,637,972
|
|||||||
The accompanying notes are an integral part of these financial statements.
11
Greenspring Income Opportunities Fund
|
SCHEDULE OF INVESTMENTS at September 30, 2022 (Con’t)
|
|
Shares
|
Value
|
|||||||
|
SHORT-TERM INVESTMENTS – 7.3%
|
||||||||
|
MONEY MARKET FUNDS – 7.3%
|
||||||||
|
First American Treasury Obligations
|
||||||||
|
Fund, Class X, 2.87% (a)
|
4,048,000
|
$
|
4,048,000
|
|||||
|
Invesco Treasury Portfolio –
|
||||||||
|
Institutional Class, 2.87% (a)
|
2,718,413
|
2,718,413
|
||||||
|
TOTAL SHORT TERM INVESTMENTS
|
||||||||
|
(Cost $6,766,413)
|
6,766,413
|
|||||||
|
TOTAL INVESTMENTS – 100.1%
|
||||||||
|
(Cost $97,582,389)
|
93,406,360
|
|||||||
|
Liabilities in Excess
|
||||||||
|
of Other Assets – (0.1)%
|
(123,749
|
)
|
||||||
|
TOTAL NET ASSETS – 100.0%
|
$
|
93,282,611
|
||||||
Percentages are stated as a percent of net assets.
| PLC |
Public Limited Company | |
|
(a)
|
The rate shown represents the fund’s 7-day yield as of September 30, 2022.
|
|
|
(b)
|
Security exempt from registration pursuant to Rule 144A under the Securities Act of 1933, as amended. These securities may be resold in transactions exempt from registration to qualified
institutional investors. At September 30, 2022, the market value of these securities total $63,763,983 which represents 68.4% of total net assets.
|
The accompanying notes are an integral part of these financial statements.
12
Greenspring Income Opportunities Fund
|
STATEMENT OF ASSETS AND LIABILITIES at September 30,
2022
|
|
Assets:
|
||||
|
Investments, at value (cost of $97,582,389)
|
$
|
93,406,360
|
||
|
Receivables:
|
||||
|
Fund shares sold
|
271,112
|
|||
|
Interest
|
1,474,907
|
|||
|
Prepaid expenses
|
19,548
|
|||
|
Total assets
|
95,171,927
|
|||
|
Liabilities:
|
||||
|
Payables:
|
||||
|
Distributions to shareholders
|
1,916
|
|||
|
Securities purchased
|
1,711,358
|
|||
|
Fund shares redeemed
|
59,459
|
|||
|
Advisory fee
|
36,911
|
|||
|
Service fees – Institutional Shares
|
7,498
|
|||
|
Other accrued expenses
|
72,174
|
|||
|
Total liabilities
|
1,889,316
|
|||
|
|
||||
|
Net assets
|
$
|
93,282,611
|
||
|
Net assets consist of:
|
||||
|
Paid in capital
|
$
|
97,542,780
|
||
|
Total accumulated loss
|
(4,260,169
|
)
|
||
|
Net assets
|
$
|
93,282,611
|
||
|
Institutional Shares:
|
||||
|
Net assets applicable to outstanding Institutional Shares
|
93,282,611
|
|||
|
Shares issued (Unlimited number of beneficial interest authorized, $0.01 par value)
|
9,950,368
|
|||
|
Net asset value, offering price and redemption price per share
|
$
|
9.37
|
||
The accompanying notes are an integral part of these financial statements.
13
Greenspring Income Opportunities Fund
|
STATEMENT OF OPERATIONS For the Period Ended September
30, 2022*
|
|
Investment income:
|
||||
|
Interest
|
$
|
2,204,729
|
||
|
Total investment income
|
2,204,729
|
|||
|
Expenses:
|
||||
|
Investment advisory fees (Note 4)
|
292,013
|
|||
|
Administration and fund accounting fees (Note 4)
|
88,182
|
|||
|
Transfer agent fees and expenses
|
26,544
|
|||
|
Service fees – Institutional Shares (Note 5)
|
48,669
|
|||
|
Federal and state registration fees
|
28,914
|
|||
|
Audit fees
|
20,001
|
|||
|
Trustees’ fees and expenses
|
11,000
|
|||
|
Legal fees
|
10,577
|
|||
|
Compliance expense
|
9,266
|
|||
|
Custody fees
|
7,253
|
|||
|
Reports to shareholders
|
5,919
|
|||
|
Other
|
1,959
|
|||
|
Total expenses before reimbursement from advisor
|
550,297
|
|||
|
Expense reimbursement from advisor (Note 4)
|
(136,611
|
)
|
||
|
Net expenses
|
413,686
|
|||
|
Net investment income
|
$
|
1,791,043
|
||
|
Realized and unrealized loss:
|
||||
|
Net realized loss on transactions from:
|
||||
|
Investments
|
$
|
(84,146
|
)
|
|
|
Net change in unrealized depreciation on investments
|
(4,176,029
|
)
|
||
|
Net realized and unrealized loss
|
(4,260,175
|
)
|
||
|
Net decrease in net assets resulting from operations
|
$
|
(2,469,132
|
)
|
|
|
*
|
The Greenspring Income Opportunities Fund commenced operations on December 15, 2021.
|
The accompanying notes are an integral part of these financial statements.
14
Greenspring Income Opportunities Fund
|
STATEMENTS OF CHANGES IN NET ASSETS
|
|
Fiscal Period Ended
|
||||
|
September 30, 2022*
|
||||
|
Operations:
|
||||
|
Net investment income
|
$
|
1,791,043
|
||
|
Net realized loss on investments
|
(84,146
|
)
|
||
|
Net change in unrealized depreciation on investments
|
(4,176,029
|
)
|
||
|
Net decrease in net assets resulting from operations
|
(2,469,132
|
)
|
||
|
Distributions:
|
||||
|
Distributable earnings
|
(1,791,037
|
)
|
||
|
Total distributions
|
(1,791,037
|
)
|
||
|
Capital Share Transactions:
|
||||
|
Proceeds from shares sold
|
110,954,241
|
|||
|
Proceeds from shares in reinvestment of distributions
|
1,775,153
|
|||
|
Cost of shares redeemed
|
(15,186,614
|
)
|
||
|
Net increase in net assets from capital share transactions
|
97,542,780
|
|||
|
Total increase in net assets
|
93,282,611
|
|||
|
Net Assets:
|
||||
|
Beginning of period
|
—
|
|||
|
End of period
|
$
|
93,282,611
|
||
|
Changes in Shares Outstanding:
|
||||
|
Shares sold
|
11,332,501
|
|||
|
Shares reinvested
|
185,191
|
|||
|
Shares redeemed
|
(1,567,324
|
)
|
||
|
Net increase in shares outstanding
|
9,950,368
|
|||
|
*
|
The Greenspring Income Opportunities Fund commenced operations on December 15, 2021.
|
The accompanying notes are an integral part of these financial statements.
15
Greenspring Income Opportunities Fund
|
FINANCIAL HIGHLIGHTS For a capital share outstanding
throughout the period
|
Institutional Shares
|
December 15, 2021
|
||||
|
Through
|
||||
|
September 30, 2022*
|
||||
|
Net Asset Value – Beginning of Period
|
$
|
10.00
|
||
|
Income from Investment Operations:
|
||||
|
Net investment income1
|
0.28
|
|||
|
Net realized and unrealized loss on investments
|
(0.66
|
)
|
||
|
Total from investment operations
|
(0.38
|
)
|
||
|
Less Distributions:
|
||||
|
From net investment income
|
(0.25
|
)
|
||
|
Total distributions
|
(0.25
|
)
|
||
|
Net Asset Value – End of Period
|
$
|
9.37
|
||
|
Total Return2
|
(3.82
|
)%^ | ||
|
Ratios and Supplemental Data:
|
||||
|
Net assets, end of period (thousands)
|
$
|
93,283
|
||
|
Ratio of operating expenses to average net assets:
|
||||
|
Before reimbursements
|
1.13
|
%+
|
||
|
After reimbursements
|
0.85
|
%+
|
||
|
Ratio of net investment income (loss) to average net assets:
|
||||
|
Before reimbursements
|
3.66
|
%+
|
||
|
After reimbursements
|
3.38
|
%+
|
||
|
Portfolio turnover rate
|
34
|
%^
|
||
|
*
|
Commencement of operations for Institutional Shares was December 15, 2021
|
|
+
|
Annualized
|
|
^
|
Not Annualized
|
|
1
|
The net investment income (loss) per share was calculated using the average shares outstanding method.
|
|
2
|
Total investment return is calculated assuming a purchase of shares on the first day and a sale of shares on the last day of each period reported and includes reinvestment of dividends and
distributions, if any.
|
The accompanying notes are an integral part of these financial statements.
16
Greenspring Income Opportunities Fund
|
NOTES TO FINANCIAL STATEMENTS September 30, 2022
|
|
NOTE 1 – ORGANIZATION
|
The Greenspring Income Opportunities Fund (the “Fund”) is a series of Manager Directed Portfolios (the “Trust”). The Trust is registered under the Investment Company Act of 1940, as amended (the “1940
Act”), and was organized as a Delaware statutory trust on April 4, 2006. The Fund is an open-end investment management company and is a diversified series of the Trust. The Fund commenced operations on December 15, 2021. Corbyn Investment
Management, Inc. (the “Advisor”) serves as the investment advisor to the Fund. The investment objective of the Fund is to provide investors with a high level of current income and the potential for capital appreciation through a total return
approach to investing.
|
NOTE 2 – SIGNIFICANT ACCOUNTING POLICIES
|
The following is a summary of significant accounting policies consistently followed by the Fund. These policies are in conformity with U.S. generally accepted accounting principles (“GAAP”). The Fund
is an investment company and accordingly follows the investment company accounting and reporting guidance of the Financial Accounting Standards Board (“FASB”) Accounting Standard Codification Topic 946 Financial Services – Investment Companies.
|
A.
|
Security Valuation: All investments in securities are recorded at their estimated fair value, as described in Note 3.
|
|
B.
|
Federal Income Taxes: It is the Fund’s policy to comply with the requirements of Subchapter M of the Internal Revenue Code applicable to regulated
investment companies and to distribute substantially all of its taxable income to its shareholders. Therefore, no federal income or excise tax provisions are required.
|
|
The Fund recognizes the tax benefits of uncertain tax positions only where the position is “more likely than not” to be sustained assuming examination by tax authorities. Management has
analyzed the Fund’s tax positions, and has concluded that no liability for unrecognized tax benefits should be recorded related to uncertain tax positions taken or expected to be taken on a tax return. The tax return for the Fund for the
current fiscal period is open for examination. The Fund identifies its major tax jurisdictions as U.S. Federal and the state of Delaware.
|
|
|
C.
|
Securities Transactions, Income and Distributions: Securities transactions are accounted for on the trade date. Realized gains and losses on securities
sold are determined on the basis of identified cost. Interest income is recorded on an accrual basis. Dividend income and distributions to shareholders are recorded on the ex-dividend date. Discounts and premiums on fixed income securities
are amortized using the yield to worst call and yield to best put methods.
|
|
The Fund distributes substantially all of its net investment income, if any, which is declared daily as a dividend and paid monthly. Any net capital gain realized by the Fund will be
distributed annually. Distributions from net realized gains for book purposes may include short-term capital gains. All short-term capital gains are included in ordinary income for tax purposes. The amount of dividends and distributions to
shareholders from net investment income and net realized capital gains is determined in accordance with federal income tax regulations, which differ from GAAP. To the extent these book/tax differences are permanent, such amounts are
reclassified within the capital accounts based on their federal tax treatment.
|
|
|
The Fund is charged for those expenses that are directly attributable to it, such as investment advisory, custody and transfer agent fees. Expenses that are not attributable to a Fund are
typically allocated among the funds in the Trust proportionately based on allocation methods approved by the Board of Trustees (the “Board”). Common expenses of the Trust are typically allocated among the funds in the Trust based on a fund’s
respective net assets, or by other equitable means.
|
17
Greenspring Income Opportunities Fund
|
NOTES TO FINANCIAL STATEMENTS September 30, 2022 (Con’t)
|
|
D.
|
Use of Estimates: The preparation of financial statements in conformity with GAAP requires management to make estimates and assumptions that affect the
reported amounts of assets and liabilities at the date of the financial statements and the reported amounts of increases and decreases in net assets during the reporting period. Actual results could differ from those estimates.
|
|
E.
|
Redemption Fees: The Fund does not charge redemption fees to shareholders.
|
|
F.
|
Reclassification of Capital Accounts: GAAP requires that certain components of net assets relating to permanent differences be reclassified between
financial and tax reporting. These reclassifications have no effect on net assets or net asset value per share.
|
|
G.
|
Events Subsequent to the Fiscal Period End: In preparing the financial statements as of September 30, 2022 and through the date the financial statements
were available to be issued, management considered the impact of subsequent events for potential recognition or disclosure in the financial statements and had concluded that no additional disclosures are necessary.
|
|
NOTE 3 – SECURITIES VALUATION
|
The Fund has adopted authoritative fair value accounting standards which establish an authoritative definition of fair value and set out a hierarchy for measuring fair value. These standards require
additional disclosures about the various inputs and valuation techniques used to develop the measurements of fair value, a discussion of changes in valuation techniques and related inputs during the period, and expanded disclosure of valuation levels
for major security types. These inputs are summarized in the three broad levels listed below:
|
Level 1 –
|
Unadjusted quoted prices in active markets for identical assets or liabilities that the Fund has the ability to access.
|
|
Level 2 –
|
Observable inputs other than quoted prices included in Level 1 that are observable for the asset or liability, either directly or indirectly. These inputs may include quoted prices for the
identical instrument on an inactive market, prices for similar instruments, interest rates, prepayment speeds, credit risk, yield curves, default rates and similar data.
|
|
Level 3 –
|
Unobservable inputs for the asset or liability, to the extent relevant observable inputs are not available, representing the Fund’s own assumptions about the assumptions a market participant
would use in valuing the asset or liability, and would be based on the best information available.
|
Following is a description of the valuation techniques applied to the Fund’s major categories of assets and liabilities measured at fair value on a recurring basis.
Debt Securities: Debt securities, including corporate bonds, asset-backed securities, mortgage-backed securities, municipal bonds, U.S. Treasuries, and U.S.
government agency issues, are generally valued at market on the basis of valuations furnished by an independent pricing service that utilizes both dealer-supplied valuations and formula-based techniques. The pricing service may consider recently
executed transactions in securities of the issuer or comparable issuers, market price quotations (where observable), bond spreads, and fundamental data relating to the issuer. In addition, the model may incorporate market observable data, such as
reported sales of similar securities, broker quotes, yields, bids, offers, and reference data. Certain securities are valued primarily using dealer quotations. To the extent these securities are actively traded and valuation adjustments are not
applied, they are categorized in Level 2 of the fair value hierarchy.
18
Greenspring Income Opportunities Fund
|
NOTES TO FINANCIAL STATEMENTS September 30, 2022 (Con’t)
|
Registered Investment Companies: Investments in registered investment companies (e.g., mutual funds) are generally priced at the ending NAV provided by the
applicable registered investment company’s service agent and will be classified in Level 1 of the fair value hierarchy.
Short-Term Debt Securities: Short-term debt instruments having a maturity of less than 60 days are valued at the evaluated mean price supplied by an approved
pricing service. Pricing services may use various valuation methodologies including matrix pricing and other analytical pricing models as well as market transactions and dealer quotations. In the absence of prices from a pricing service, the
securities will be priced in accordance with the procedures adopted by the Board. Short-term debt securities are generally classified in Level 1 or Level 2 of the fair value hierarchy depending on the inputs used and market activity levels for
specific securities.
In the absence of prices from a pricing service or in the event that market quotations are not readily available, fair value will be determined under the Fund’s valuation procedures adopted pursuant to
Rule 2a-5. Pursuant to those procedures, the Board has appointed the Advisor as the Fund’s valuation designee (the “Valuation Designee”) to perform all fair valuations of the Fund’s portfolio investments, subject to the Board’s oversight. As the
Valuation Designee, the Advisor has established procedures for its fair valuation of the Fund’s portfolio investments. These procedures address, among other things, determining when market quotations are not readily available or reliable and the
methodologies to be used for determining the fair value of investments, as well as the use and oversight of third-party pricing services for fair valuation.
Depending on the relative significance of the valuation inputs, fair valued securities may be classified in either Level 2 or Level 3 of the fair value hierarchy.
The inputs or methodology used for valuing securities are not an indication of the risk associated with investing in those securities. The following is a summary of the fair valuation hierarchy of the
Fund’s securities as of September 30, 2022:
|
Level 1
|
Level 2
|
Level 3
|
Total
|
|||||||||||||
|
Corporate Bonds and Notes
|
$
|
—
|
$
|
84,001,975
|
$
|
—
|
$
|
84,001,975
|
||||||||
|
Convertible Bonds
|
—
|
2,637,972
|
—
|
2,637,972
|
||||||||||||
|
Short-Term Investments
|
6,766,413
|
—
|
—
|
6,766,413
|
||||||||||||
|
Total Investments in Securities
|
$
|
6,766,413
|
$
|
86,639,947
|
$
|
—
|
$
|
93,406,360
|
||||||||
|
NOTE 4 – INVESTMENT ADVISORY FEE AND OTHER TRANSACTIONS WITH AFFILIATES
|
For the fiscal year ended September 30, 2022, the Advisor provided the Fund with investment management services under an Investment Advisory Agreement. The Advisor furnishes all investment advice,
office space, and facilities, and provides most of the personnel needed by the Fund. As compensation for its services, the Advisor is entitled to a monthly fee at an annual rate of 0.60% from the Fund based upon the average daily net assets of the
Fund. For the fiscal year ended September 30, 2022, the Fund incurred $292,013 in advisory fees. Advisory fees payable on September 30, 2022 for the Fund were $36,911.
The Fund is responsible for its own operating expenses. The Advisor has contractually agreed to waive its management fees and/or absorb expenses of the Fund to ensure that the total annual operating
expenses [excluding front-end or contingent deferred loads, Rule 12b-1 plan fees, shareholder servicing plan fees, taxes, leverage, interest, brokerage commissions and other transactional expenses, expenses in connection with a merger or
reorganization, dividends or
19
Greenspring Income Opportunities Fund
|
NOTES TO FINANCIAL STATEMENTS September 30, 2022 (Con’t)
|
interest on short positions, acquired fund fees and expenses or extraordinary expenses (collectively, “Excludable Expenses”)] do not exceed 0.75% of the average daily net assets for the Institutional
Shares.
For the fiscal year ended September 30, 2022, the Advisor reduced its fees and absorbed Fund expenses in the amount of $136,611 for the Fund. The waivers and reimbursements will remain in effect through
December 15, 2024 unless terminated sooner by, or with the consent of, the Board.
The Advisor may request recoupment of previously waived fees and paid expenses in any subsequent month in the three-year period from the date of the management fee reduction and expense payment if the
aggregate amount actually paid by the Fund toward the operating expenses for such fiscal year (taking into account the reimbursement) will not cause the Fund to exceed the lesser of: (1) the expense limitation in place at the time of the management
fee reduction and expense payment; or (2) the expense limitation in place at the time of the reimbursement. Any such reimbursement is also contingent upon Board of Trustees review and approval at the time the reimbursement is made. Such
reimbursement may not be paid prior to the Fund’s payment of current ordinary operating expenses. Cumulative expenses subject to recapture pursuant to the aforementioned conditions expire as follows:
|
Amount
|
Expiration
|
|
$136,611
|
09/30/2025
|
U.S. Bancorp Fund Services, LLC, doing business as U.S. Bank Global Fund Services, LLC (“Fund Services” or the “Administrator”) acts as the Fund’s Administrator under an Administration Agreement. The
Administrator prepares various federal and state regulatory filings, reports and returns for the Fund; prepares reports and materials to be supplied to the Trustees; monitors the activities of the Fund’s custodian, transfer agent and accountants;
coordinates the preparation and payment of the Fund’s expenses and reviews the Fund’s expense accruals. Fund Services also serves as the fund accountant and transfer agent to the Fund. Vigilant Compliance, LLC serves as the Chief Compliance Officer
to the Fund. U.S. Bank N.A., an affiliate of Fund Services, serves as the Fund’s custodian. For the fiscal year ended September 30, 2022, the Fund incurred the following expenses for administration, fund accounting, transfer agency and custody
fees:
|
Administration and fund accounting
|
$88,182
|
|
Custody
|
$ 7,253
|
|
Transfer agency
|
$26,544
|
At September 30, 2022, the Fund had payables due to Fund Services for administration, fund accounting and transfer agency fees and to U.S. Bank N.A. for custody fees in the following amounts:
|
Administration and fund accounting
|
$26,453
|
|
Custody
|
$ 2,082
|
|
Transfer agency
|
$ 8,358
|
Quasar Distributors, LLC (the “Distributor”) acts as the Fund’s principal underwriter in a continuous public offering of the Fund’s shares.
Certain officers of the Fund are employees of the Administrator and are not paid any fees by the Fund for serving in such capacities.
20
Greenspring Income Opportunities Fund
|
NOTES TO FINANCIAL STATEMENTS September 30, 2022 (Con’t)
|
|
NOTE 5 – SHAREHOLDER SERVICING FEE
|
The Fund has adopted a shareholder servicing plan (the “Plan”) on behalf of the Greenspring Income Opportunities Fund’s Institutional Share Class. Under the Plan, the Institutional Share Class is
authorized to pay an annual shareholder servicing fee of up to 0.10% of its average daily net assets. This fee is used to finance certain activities related to servicing and maintaining shareholder accounts. Payments made under the Plan may not be
used to pay for any services in connection with the distribution and sale of the Institutional Shares.
Payments to the Advisor under the Plan may reimburse the Advisor for payments it makes to selected brokers, dealers and administrators which have entered into service agreements with the Advisor for
services provided to Institutional Class shareholders of the Fund. The services provided by such intermediaries are primarily designed to assist Institutional Class shareholders of the Fund and include the furnishing of office space and equipment,
telephone facilities, personnel, and assistance to the Fund in servicing such shareholders. Services provided by such intermediaries also include the provision of support services to the Fund and include establishing and maintaining shareholders’
accounts and record processing, purchase and redemption transactions, answering routine client inquiries regarding the Fund, and providing such other personal services to shareholders as the Fund may reasonably request. For the fiscal year ended
September 30, 2022, the Fund incurred, under the Agreement, shareholder servicing fees of $48,669. As of September 30, 2022, the Fund had a payable due for shareholder servicing fees in the amount of $7,498.
|
NOTE 6 – SECURITIES TRANSACTIONS
|
For the fiscal year ended September 30, 2022, the cost of purchases and the proceeds from sales of securities, excluding short-term securities, were as follows:
|
Purchases
|
|
|
U.S. Government Obligations
|
$ 9,220,010
|
|
Other
|
$96,046,465
|
|
Sales
|
|
|
U.S. Government Obligations
|
$ 9,208,254
|
|
Other
|
$ 9,537,495
|
21
Greenspring Income Opportunities Fund
|
NOTES TO FINANCIAL STATEMENTS September 30, 2022 (Con’t)
|
|
NOTE 7 – INCOME TAXES AND DISTRIBUTIONS TO SHAREHOLDERS
|
As of September 30, 2022, the Fund’s most recent fiscal year end, the components of accumulated earnings/(losses) on a tax basis were as follows:
|
Cost of investments(a)
|
$
|
97,582,543
|
||
|
Gross unrealized appreciation
|
29,189
|
|||
|
Gross unrealized depreciation
|
(4,205,372
|
)
|
||
|
Net unrealized depreciation
|
(4,176,183
|
)
|
||
|
Undistributed ordinary income
|
1,922
|
|||
|
Undistributed long-term capital gain
|
—
|
|||
|
Total distributable earnings
|
1,922
|
|||
|
Other accumulated gains/(losses)
|
(85,908
|
)
|
||
|
Total accumulated earnings/(losses)
|
$
|
(4,260,169
|
)
|
|
(a)
|
The difference between the book basis and tax basis net unrealized appreciation and cost is attributable primarily to wash sales.
|
As of September 30, 2022, the Fund had short-term tax basis capital losses to offset future capital gains in the amount of $83,993.
The tax character of distributions paid during the fiscal period ended September 30, 2022 was as follows:
|
Period Ended
|
|
|
September 30, 2022
|
|
|
Ordinary income
|
$1,791,037
|
|
NOTE 8 – PRINCIPAL RISKS
|
The following is a list of certain risks that may apply to your investment in the Fund. Further information about investment risks is available in the Fund’s Statement of Additional Information.
Credit Risk: Credit risk is the risk that an issuer will not make timely payments of principal and interest. A credit rating assigned to a particular debt
security is essentially the opinion of a nationally recognized statistical rating organization (“NRSRO”) as to the credit quality of an issuer and may prove to be inaccurate.
Fixed Income Securities Risk: The value of investments in fixed income securities fluctuates with changes in interest rates. Typically, a rise in interest rates
causes a decline in the value of fixed income securities owned indirectly by the Fund. On the other hand, if rates fall, the value of the fixed income securities generally increases. The Fund may be subject to a greater risk of rising interest rates
due to the current period of historically low rates and the effect of potential government fiscal policy initiatives and resulting market reaction to those initiatives. Below are several specific risks associated with investments in fixed income
securities.
Interest Rate Risk: Interest rates may go up resulting in a decrease in the value of the securities held by the Fund. Interest rates have been historically
low, so the Fund faces a heightened risk that interest rates may rise. Debt securities subject to prepayment can offer less potential for gains during a declining interest rate environment.
22
Greenspring Income Opportunities Fund
|
NOTES TO FINANCIAL STATEMENTS September 30, 2022 (Con’t)
|
Management Risk: Investment strategies employed by the Advisor in selecting investments for the Fund may not result in an increase in the value of your
investment or in overall performance equal to other investments.
General Market Risk; Recent Market Events: The value of the Fund’s shares will fluctuate based on the performance of the Fund’s investments and other factors
affecting the securities markets generally. Certain investments selected for the Fund’s portfolio may be worth less than the price originally paid for them, or less than they were worth at an earlier time. The value of the Fund’s investments may go
up or down, sometimes dramatically and unpredictably, based on current market conditions, such as real or perceived adverse political or economic conditions, inflation, changes in interest rates, lack of liquidity in the fixed income markets or
adverse investor sentiment.
U.S. and international markets have experienced volatility in recent months and years due to a number of economic, political and global macro factors, including the impact of the coronavirus (COVID-19)
global pandemic, which has resulted in a public health crisis, business interruptions, growth concerns in the U.S. and overseas, layoffs, rising unemployment claims, changed travel and social behaviors and reduced consumer spending. The effects of
COVID-19 may lead to a substantial economic downturn or recession in the U.S. and global economies, the recovery from which is uncertain and may last for an extended period of time.
Call or Prepayment Risk: During periods of declining interest rates, a bond issuer may “call” or repay its high yielding bonds before their maturity dates. In
times of declining interest rates, the Fund’s higher yielding securities may be prepaid, and the Fund may have to replace them with securities having a lower yield.
U.S. Government Agencies and Instrumentalities Securities Risk: Securities issued by U.S. Government agencies and instrumentalities have different levels of
U.S. Government credit support. Some are backed by the full faith and credit of the U.S. Government, while others are supported by only the discretionary authority of the U.S. Government or only by the credit of the agency or instrumentality. No
assurance can be given that the U.S. Government will provide financial support to U.S. Government-sponsored instrumentalities because they are not obligated to do so by law. Guarantees of timely prepayment of principal and interest do not assure
that the market prices and yields of the securities are guaranteed nor do they guarantee the net asset value or performance of the Fund, which will vary with changes in interest rates, the Advisor’s success and other market conditions.
New Fund Risk: The Fund is a recently organized registered investment company with no operating history. As a result, prospective investors have no track record
or history on which to base their investment decision.
|
NOTE 9 – GUARANTEES AND INDEMNIFICATION
|
In the normal course of business, the Fund enters into contracts that contain a variety of representations and warranties and which provide general indemnifications. The Fund’s maximum exposure under
these arrangements is unknown, as this would involve future claims that may be made against the Fund that have not yet occurred. However, based on experience, the Fund expects the risk of loss to be remote.
|
NOTE 10 – CONTROL OWNERSHIP
|
The beneficial ownership, either directly or indirectly, of more than 25% of the voting securities of a fund creates a presumption of control of the fund, under Section 2(a)(9) of the 1940 Act. As of
September 30, 2022, National Financial Services LLC held 62% of the outstanding Institutional Shares of the Fund and Charles Schwab & Co., Inc. held 33% of the outstanding Institutional Shares of the Fund. The Fund has no knowledge as to whether
all or any portion of the shares owned of record by National Financial Services LLC or by Charles Schwab & Co., Inc. are also owned beneficially.
23
Greenspring Income Opportunities Fund
REPORT OF INDEPENDENT REGISTERED PUBLIC ACCOUNTING FIRM
To the Board of Trustees of Manager Directed Portfolios
and the Shareholders of Greenspring Income Opportunities Fund
Opinion on the Financial Statements
We have audited the accompanying statement of assets and liabilities of Greenspring Income Opportunities Fund, a series of shares of beneficial interest in Manager Directed Portfolios (the “Fund”), including the schedule of investments, as of September 30, 2022, and the related statement of operations, the statement of changes in net assets and the financial highlights for the
period December 15, 2021 (commencement of operations) through September 30, 2022, and the related notes (collectively referred to as the “financial statements”). In our opinion, the
financial statements present fairly, in all material respects, the financial position of the Fund as of September 30, 2022, and the results of its operations, the changes in its net assets, and its financial highlights for the period December 15,
2021 through September 30, 2022, in conformity with accounting principles generally accepted in the United States of America.
Basis for Opinion
These financial statements are the responsibility of the Fund’s management. Our responsibility is to express an opinion on the Fund’s financial statements based on our audit. We are a public accounting
firm registered with the Public Company Accounting Oversight Board (United States) (“PCAOB”) and are required to be independent with respect to the Fund in accordance with the U.S. federal
securities law and the applicable rules and regulations of the Securities and Exchange Commission and the PCAOB.
We conducted our audit in accordance with the standards of the PCAOB. Those standards require that we plan and perform the audit to obtain reasonable assurance about whether the financial statements
are free of material misstatement, whether due to error or fraud. The Fund is not required to have, nor were we engaged to perform, an audit of its internal control over financial reporting. As part of our audit we are required to obtain an
understanding of internal control over financial reporting but not for the purpose of expressing an opinion on the effectiveness of the Fund’s internal control over financial reporting. Accordingly, we express no such opinion.
Our audit included performing procedures to assess the risk of material misstatement of the financial statements, whether due to error or fraud, and performing procedures that respond to those risks.
Such procedures included examining, on a test basis, evidence regarding the amounts and disclosures in the financial statements. Our procedures included confirmation of securities owned as of September 30, 2022 by correspondence with the custodian,
brokers, or by other appropriate auditing procedures where replies from brokers were not received. Our audit also included evaluating the accounting principles used and significant estimates made by management, as well as evaluating the overall
presentation of the financial statements. We believe that our audit provides a reasonable basis for our opinion.

BBD, LLP
We have served as the auditor of one or more of the Funds in the Manager Directed Portfolios since 2007.
Philadelphia, Pennsylvania
November 29, 2022
24
Greenspring Income Opportunities Fund
|
NOTICE TO SHAREHOLDERS September 30, 2022 (Unaudited)
|
How to Obtain a Copy of the Fund’s Proxy Voting Policies
A description of the policies and procedures that the Fund uses to determine how to vote proxies relating to portfolio securities is available without charge, upon request, by calling 1-800-366-3863 or
on the U.S. Securities and Exchange Commission’s (“SEC”) website at http://www.sec.gov.
How to Obtain a Copy of the Fund’s Proxy Voting Records for the most recent 12-Month Period Ended June 30
Information regarding how the Fund voted proxies relating to portfolio securities during the most recent 12-month period ended June 30 is available no later than August 31 without charge, upon request,
by calling 1-800-366-3863. Furthermore, you can obtain the Fund’s proxy voting records on the SEC’s website at http://www.sec.gov.
Quarterly Filings on Form N-PORT
The Fund files its complete schedule of portfolio holdings with the SEC for the first and third quarters of each fiscal year on Form N-PORT. The Fund’s Form N-PORT is available on the SEC’s website at
http://www.sec.gov. The Fund’s Form N-PORT may be reviewed and copied at the SEC’s Public Reference Room in Washington, DC, and information on the operation of the Public Reference Room may be obtained by calling 1-202-551-8090. Information
included in the Fund’s Form N-PORT is also available, upon request, by calling 1-800-366-3863.
Qualified Dividend Income/Dividends Received Deduction
For the fiscal year ended September 30, 2022 certain dividends paid by the Funds may be subject to a maximum tax rate of 15%, as provided for by the Jobs and Growth Tax Relief Reconciliation Act of
2003. The percentage of dividends declared from ordinary income designated as qualified dividend income was as follows:
|
Greenspring Income Opportunities Fund
|
0.00%
|
For corporate shareholders, the percent of ordinary income distributions qualifying for the corporate dividends received deduction for the fiscal year ended September 30, 2022 was as follows:
|
Greenspring Income Opportunities Fund
|
0.00%
|
25
Greenspring Income Opportunities Fund
|
TRUSTEES AND OFFICERS (Unaudited)
|
The business and affairs of the Trust are managed under the oversight of the Board, subject to the laws of the State of Delaware and the Trust’s Agreement and Declaration of Trust. The Board, as of
September 30, 2022, is currently comprised of four trustees who are not interested persons of the Trust within the meaning of the 1940 Act (the “Independent Trustees”). The Trustees are responsible for deciding matters of overall policy and
overseeing the actions of the Trust’s service providers. The officers of the Trust conduct and supervise the Trust’s daily business operations.
|
Position(s)
|
Number of
|
|||
|
Held with
|
Funds in
|
|||
|
Name,
|
the Trust
|
Fund Complex
|
Other Directorships
|
|
|
Year of Birth
|
and Length of
|
Principal Occupation(s)
|
Overseen
|
Held by Trustee During
|
|
and Address(1)
|
Time Served(2)
|
During the Past Five Years
|
by Trustee(3)
|
the Past Five Years
|
|
INDEPENDENT TRUSTEES
|
||||
|
Gaylord B. Lyman
|
Trustee and
|
Senior Portfolio Manager, Affinity Investment
|
10
|
None
|
|
(Born 1962)
|
Audit Committee
|
Advisors, LLC, since 2017; Managing Director of
|
||
|
Chairman, since
|
Kohala Capital Partners, LLC (2011 – 2016).
|
|||
|
April 2015
|
||||
|
Scott Craven Jones
|
Trustee since
|
Managing Director, Carne Global Financial
|
10
|
Trustee, Madison Funds, since
|
|
(Born 1962)
|
July 2016 and
|
Services (US) LLC (a provider of independent
|
2019 (18 portfolios); Trustee,
|
|
|
Lead Independent
|
governance and distribution support for the asset
|
XAI Octagon Floating Rate &
|
||
|
Trustee since
|
management industry), since 2013; interim
|
Alternative Income Term Trust,
|
||
|
May 2017
|
Managing Director, Park Agency, Inc., since 2020.
|
since 2017 (2 portfolios).
|
||
|
Lawrence T. Greenberg
|
Trustee
|
Senior Vice President and Chief Legal Officer,
|
10
|
None
|
|
(Born 1963)
|
since July 2016
|
The Motley Fool Holdings, Inc., since 1996;
|
||
|
Venture Partner and General Counsel, Motley
|
||||
|
Fool Ventures LP, since 2018; Manager, Motley
|
||||
|
Fool Wealth Management, LLC, since 2013;
|
||||
|
Adjunct Professor, Washington College of Law,
|
||||
|
American University, since 2006; General Counsel
|
||||
|
Motley Fool Asset Management, LLC (2008 – 2019).
|
||||
|
James R. Schoenike
|
Trustee
|
Distribution consultant since 2018, President and
|
10
|
None
|
|
(Born 1959)
|
since July 2016(4)
|
CEO, Board of Managers, Quasar Distributors,
|
||
|
LLC (2013 – 2018).
|
|
(1)
|
The address of each Trustee as it relates to the Trust’s business is c/o U.S. Bank Global Fund Services, 615 East Michigan Street, Milwaukee, WI 53202.
|
|
(2)
|
Each Trustee serves during the continued lifetime of the Trust until he dies, resigns, is declared bankrupt or incompetent by a court of competent jurisdiction, or is removed.
|
|
(3)
|
The Trust currently has ten active portfolios.
|
|
(4)
|
Prior to January 1, 2021, Mr. Schoenike was considered to be an “interested person” of the Fund by virtue of his previous position as President of Quasar Distributors, LLC.
|
As of the date of this report, no Independent Trustee nor any of his immediate family members (i.e., spouse or dependent children) serves as an officer or
director or is an employee of the Advisor, Sub-Advisor or Distributor, or any of their respective affiliates, nor is such person an officer, director or employee of any company controlled by or under common control with such entities.
26
Greenspring Income Opportunities Fund
|
TRUSTEES AND OFFICERS (Unaudited) (Con’t)
|
|
Name
|
||
|
(Year of Birth)
|
Position(s) Held with Trust
|
Principal Occupation(s)
|
|
and Address
|
and Length of Time Served(3)
|
During Past Five Years
|
|
OFFICERS
|
||
|
Scott M. Ostrowski(1)
|
President and Principal Executive Officer,
|
Senior Vice President, Compliance and
|
|
(Born 1980)
|
since August 10, 2021
|
Administration, Fund Services, since 2006
|
|
Ryan Frank(1)
|
Treasurer, and Principal Financial
|
Vice President, Fund Services, since 2008
|
|
(Born 1985)
|
Officer, since August 17, 2022
|
|
|
Colton W. Scarmardo(1)
|
Assistant Treasurer, since May 11, 2021
|
Fund Administrator, Compliance and
|
|
(Born 1997)
|
Administration, Fund Services, since 2019;
|
|
|
Business Administration Student, 2015 – 2019,
|
||
|
MBA obtained May 2022.
|
||
|
Justin Dausch(2)
|
Chief Compliance Officer and
|
Director, Vigilant, since 2017; Compliance
|
|
(Born 1989)
|
Anti-Money Laundering Compliance Officer,
|
Associate, HSBC (investment banking
|
|
since January 1, 2020
|
company), 2015 – 2017
|
|
|
Alyssa M. Bernard(1)(4)
|
Vice President and Secretary,
|
Assistant Vice President, Compliance and
|
|
(Born 1988)
|
since August 20, 2019(4)
|
Administration, Fund Services, since 2018;
|
|
Attorney, Mutual Fund Disclosure, Waddell
|
||
|
& Reed Financial, Inc., 2017 – 2018; Attorney,
|
||
|
Corporate Governance, American Century
|
||
|
Companies, Inc., 2014 – 2017
|
||
|
Isabella K. Zoller(1)
|
Assistant Secretary,
|
Assistant Vice President, Fund Services,
|
|
(Born 1994)
|
since February 15, 2022
|
since 2021; Regulatory Administration Attorney,
|
|
Fund Services, since 2019; Regulatory
|
||
|
Administration Intern, Fund Services,
|
||
|
2018 – 2019; Law Student 2016 – 2019.
|
|
(1)
|
The mailing address of this officer is: 615 East Michigan Street, Milwaukee, Wisconsin 53202.
|
|
(2)
|
The mailing address of this officer is: 223 Wilmington West Chester Pike, Suite 216, Chadds Ford, Pennsylvania 19317.
|
|
(3)
|
Each officer is elected annually and serves until his or her successor has been duly elected and qualified.
|
|
(4)
|
Ms. Bernard has served as Vice President of the Trust, in addition to her other positions held with the Trust, since May 11, 2021.
|
The Statement of Additional Information includes additional information about the Fund’s Trustees and Officers and is available, without charge, upon request by calling 1-800-497-2960.
27
Greenspring Income Opportunities Fund
|
STATEMENT REGARDING LIQUIDITY RISK MANAGEMENT PROGRAM
(Unaudited)
|
In accordance with Rule 22e-4 under the Investment Company Act of 1940, as amended, the Fund, a series of Manager Directed Portfolios (the “Trust”), has adopted and implemented a liquidity risk
management program tailored specifically to the Fund (the “Program”). The Program seeks to promote effective liquidity risk management for the Fund and to protect Fund shareholders from dilution of their interests. The Board has designated the Fund’s
investment advisor to serve as the administrator of the Program (the “Program Administrator”). Personnel of the Fund’s investment advisor conduct the day-to-day operation of the Program pursuant to policies and procedures administered by the Program
Administrator. The Program Administrator is required to provide a written annual report to the Board and the chief compliance officer of the Trust regarding the adequacy and effectiveness of the Program and any material changes to the Program.
Under the Program, the Program Administrator manages the Fund’s liquidity risk, which is the risk that the Fund could not meet shareholder redemption requests without significant dilution of remaining
shareholders’ interests in the Fund. The Program assesses liquidity risk under both normal and reasonably foreseeable stressed market conditions. This risk is managed by monitoring the degree of liquidity of the Fund’s investments, limiting the
amount of the Fund’s illiquid investments, and utilizing various risk management tools and facilities available to the Fund for meeting shareholder redemptions, among other means. The Program Administrator’s process of determining the degree of
liquidity of the Fund’s investments is supported by one or more third-party liquidity assessment vendors.
On November 18, 2022, the Board reviewed the Program Administrator’s assessment of the operation and effectiveness of the Program for the period December 15, 2021 through September 30, 2022 (the
“Report”) and a memorandum regarding the Report prepared by the Trust’s chief compliance officer. The Report noted that the Fund’s portfolio is expected to continue to primarily hold highly liquid investments and the determination that the Fund be
designated as a “primarily highly liquid fund” (as defined in Rule 22e-4) remains appropriate. The Fund can therefore continue to rely on the exclusion in Rule 22e-4 from the requirements to determine and review a highly liquid investment minimum for
the Fund and to adopt policies and procedures for responding to a highly liquid investment minimum shortfall. The Report noted that there were no breaches of the Fund’s restriction on holding illiquid investments exceeding 15% of its net assets
during the review period. The Report confirmed that the Fund’s investment strategy was appropriate for an open-end management investment company. The Report also indicated that no material changes had been made to the Program during the review
period.
The Program Administrator determined that the Fund is reasonably likely to be able to meet redemption requests without adversely affecting non-redeeming Fund shareholders through significant dilution.
The Program Administrator concluded that the during the review period, the Program was adequately designed and effectively operating to monitor the liquidity risk to the Fund, taking into account the size of the Fund, the type of business conducted,
and other relevant factors.
28
Greenspring Income Opportunities Fund
|
PRIVACY POLICY (Unaudited)
|
Protecting the privacy of Fund shareholders is important to us. The following is a description of the practices and policies through which we protect the privacy and security of your non-public
personal information.
What Information We Collect
We collect and maintain information about you so that we can open and maintain your account in the Fund and provide various services to you. We collect non-public personal information about you from
the following sources:
• information we receive about you
on applications or other forms;
• information you give us orally;
and
• information about your
transactions with us or others.
The types of non-public personal information we collect and share can include:
• social security number;
• account balances;
• account transactions;
• transaction history;
• wire transfer instructions; and
• checking account information.
What Information We Disclose
We do not disclose any non-public personal information about shareholders or former shareholders of the Fund without the shareholder’s authorization, except as permitted by law or in response to
inquiries from governmental authorities. We may share information with affiliated parties and unaffiliated third parties with whom we have contracts for servicing the Fund. We will provide unaffiliated third parties with only the information
necessary to carry out their assigned responsibility.
How We Protect Your Information
All shareholder records will be disposed of in accordance with applicable law. We maintain physical, electronic and procedural safeguards to protect your non-public personal information and require
third parties to treat your non-public personal information with the same high degree of confidentiality.
In the event that you hold shares of the Fund through a financial intermediary, including, but not limited to, a broker-dealer, bank or trust company, the privacy policy of your financial intermediary
would govern how your non-public personal information would be shared with unaffiliated third parties.
If you have any questions or concerns regarding this notice or our Privacy Policy, please contact us at 1-800-366-3863.
29
Investment Advisor
Corbyn Investment Management, Inc.
2330 West Joppa Road, Suite 108
Lutherville, Maryland 21093
Independent Registered Public Accounting Firm
BBD, LLP
1835 Market Street, 3rd Floor
Philadelphia, Pennsylvania 19103
Legal Counsel
Godfrey & Kahn, S.C.
833 East Michigan Street, Suite 1800
Milwaukee, Wisconsin 53202
Custodian
U.S. Bank, N.A.
Custody Operations
1555 North River Center Drive, Suite 302
Milwaukee, Wisconsin 53212
Transfer Agent, Fund Accountant and Fund Administrator
U.S. Bancorp Fund Services, LLC
615 East Michigan Street
Milwaukee, Wisconsin 53202
Distributor
Quasar Distributors, LLC
111 East Kilbourn Avenue, Suite 2200
Milwaukee, Wisconsin 53202
Compliance Services
Vigilant Compliance, LLC
223 Wilmington West Chester Pike, Suite 216
Chadds Ford, Pennsylvania 19317
|
(b)
|
Not Applicable.
|
Item 2. Code of Ethics.
The registrant has adopted a code of ethics that applies to the registrant’s principal executive officer and principal financial officer. The registrant has not made any substantive amendments to its code of ethics during the period covered by
this report. The registrant has not granted any waivers from any provisions of the code of ethics during the period covered by this report.
A copy of the registrant’s Code of Ethics is filed herewith.
Item 3. Audit Committee Financial Experts.
The registrant’s Board of Trustees has determined that there are at least two audit committee financial experts serving on its audit committee. Messrs. Gaylord B. Lyman and Scott C. Jones are the “audit committee financial experts” and are
considered to be “independent” as each term is defined in Item 3 of Form N‑CSR.
Item 4. Principal Accountant Fees and Services.
The registrant has engaged its principal accountant to perform audit services, audit-related services, tax services and other services during the past two fiscal years. “Audit services” refer to performing an audit of the registrant's annual
financial statements or services that are normally provided by the accountant in connection with statutory and regulatory filings or engagements for those fiscal years. “Audit-related services” refer to the assurance and related services by the
principal accountant that are reasonably related to the performance of the audit. “Tax services” refer to professional services rendered by the principal accountant for tax compliance, tax advice, and tax planning. There were no “other services”
provided by the principal accountant. The following table details the aggregate fees billed or expected to be billed for each of the last two fiscal years for audit fees, audit-related fees, tax fees and other fees by the principal accountant.
|
FYE 9/30/2022
|
FYE 9/30/2021
|
|
|
Audit Fees
|
$17,000
|
N/A
|
|
Audit-Related Fees
|
N/A
|
N/A
|
|
Tax Fees
|
$3,000
|
N/A
|
|
All Other Fees
|
N/A
|
N/A
|
The audit committee has adopted pre-approval policies and procedures that require the audit committee to pre‑approve all audit and non‑audit services of the registrant, including services provided to any entity affiliated
with the registrant.
The percentage of fees billed by BBD, LLP applicable to non-audit services pursuant to waiver of pre-approval requirement were as follows for the Greenspring Income Opportunities Fund:
|
FYE 9/30/2022
|
FYE 9/30/2021
|
|
|
Audit-Related Fees
|
0%
|
N/A
|
|
Tax Fees
|
0%
|
N/A
|
|
All Other Fees
|
0%
|
N/A
|
All of the principal accountant’s hours spent on auditing the registrant’s financial statements were attributed to work performed by full‑time permanent employees of the principal accountant.
The following table indicates the non-audit fees billed or expected to be billed by the registrant’s accountant for services to the registrant and to the registrant’s investment adviser (and any other
controlling entity, etc.—not sub-adviser) for the last two years for both funds. The audit committee of the Board of Trustees has considered whether the provision of non-audit services that were rendered to the registrant's investment adviser is
compatible with maintaining the principal accountant's independence and has concluded that the provision of such non-audit services by the accountant has not compromised the accountant’s independence.
|
Non-Audit Related Fees
|
FYE 9/30/2022
|
FYE 9/30/2021
|
|
Registrant
|
N/A
|
N/A
|
|
Registrant’s Investment Adviser
|
N/A
|
N/A
|
The registrant has not been identified by the U.S. Securities and Exchange Commission as having filed an annual report issued by a registered public accounting firm branch or office that is located in a foreign jurisdiction where the Public
Company Accounting Oversight Board is unable to inspect or completely investigate because of a position taken by an authority in that jurisdiction.
The registrant is not a foreign issuer.
Item 5. Audit Committee of Listed Registrants.
(a) Not applicable to registrants who are not listed issuers (as defined in Rule 10A-3 under the Securities Exchange Act of 1934).
(b) Not Applicable.
Item 6. Investments.
|
(a)
|
Schedule of Investments is included as part of the report to shareholders filed under Item 1 of this Form.
|
|
(b)
|
Not Applicable.
|
Item 7. Disclosure of Proxy Voting Policies and Procedures for Closed-End Management Investment Companies.
Not applicable to open-end investment companies.
Item 8. Portfolio Managers of Closed-End Management Investment Companies.
Not applicable to open-end investment companies.
Item 9. Purchases of Equity Securities by Closed‑End Management Investment Company and Affiliated Purchasers.
Not applicable to open-end investment companies.
Item 10. Submission of Matters to a Vote of Security Holders.
There have been no material changes to the procedures by which shareholders may recommend nominees to the Registrant’s Board of Trustees.
Item 11. Controls and Procedures.
|
(a)
|
The Registrant’s President/Principal Executive Officer and Treasurer/Principal Financial Officer have reviewed the Registrant's disclosure controls and procedures (as defined in Rule 30a-3(c) under the Investment Company Act of 1940,
as amended, (the “Act”)) as of a date within 90 days of the filing of this report, as required by Rule 30a-3(b) under the Act and Rules 13a-15(b) or 15d‑15(b) under the Securities Exchange Act of 1934. Based on their review, such
officers have concluded that the disclosure controls and procedures are effective in ensuring that information required to be disclosed in this report is appropriately recorded, processed, summarized and reported and made known to them by
others within the Registrant and by the Registrant’s service provider.
|
|
(b)
|
There were no changes in the Registrant's internal control over financial reporting (as defined in Rule 30a-3(d) under the Act) that occurred during the second fiscal quarter of the period covered by this report that has materially
affected, or is reasonably likely to materially affect, the Registrant's internal control over financial reporting.
|
Item 12. Disclosure of Securities Lending Activities for Closed-End Management Investment Companies.
Not applicable to open-end investment companies.
Item 13. Exhibits.
(3) Any written solicitation to purchase securities under Rule 23c‑1 under the Act sent or given during the period covered by the report by or on behalf of the registrant to 10 or
more persons. Not applicable to open-end investment companies.
(4) Change in the registrant’s independent public accountant. There was no change in the registrant’s independent public accountant for the period covered by this report.
SIGNATURES
Pursuant to the requirements of the Securities Exchange Act of 1934 and the Investment Company Act of 1940, as amended, the registrant has duly caused this report to be signed on its behalf by the undersigned,
thereunto duly authorized.
(Registrant) Manager Directed Portfolios
By (Signature and Title)* /s/Scott M. Ostrowski
Scott M. Ostrowski, President/
Principal Executive Officer
Date 12/5/2022
Pursuant to the requirements of the Securities Exchange Act of 1934 and the Investment Company Act of 1940, as amended, this report has been signed below by the following persons on behalf of the registrant and in the
capacities and on the dates indicated.
By (Signature and Title)* /s/Scott M. Ostrowski
Scott M. Ostrowski, President/
Principal Executive Officer
Date 12/5/2022
By (Signature and Title)* /s/Ryan Frank
Ryan Frank, Treasurer/
Principal Financial Officer
Principal Financial Officer
Date 12/5/2022
* Print the name and title of each signing officer under his or her signature.
ATTACHMENTS / EXHIBITS
Serious News for Serious Traders! Try StreetInsider.com Premium Free!
You May Also Be Interested In
- Gecina: All of the Resolutions Approved by the Combined General Meeting
- August Health Unveils Inaugural Members of New Advisory Board
- Sedgwick announces retirement of Executive Chairman Dave North
Create E-mail Alert Related Categories
SEC FilingsSign up for StreetInsider Free!
Receive full access to all new and archived articles, unlimited portfolio tracking, e-mail alerts, custom newswires and RSS feeds - and more!
