UNITED STATES
SECURITIES AND EXCHANGE COMMISSION
Washington, D.C. 20549
FORM N-CSR
CERTIFIED SHAREHOLDER REPORT OF
REGISTERED MANAGEMENT INVESTMENT COMPANIES
Investment Company Act file
number 811-03090
MFS SERIES TRUST VII
(Exact name of registrant as specified in charter)
111 Huntington Avenue, Boston, Massachusetts 02199
(Address of principal
executive offices) (Zip code)
Christopher R. Bohane
Massachusetts Financial Services Company
111 Huntington Avenue
Boston, Massachusetts 02199
(Name and address of agents for service)
Registrant’s telephone number, including area code: (617) 954-5000
Date of fiscal year end: July 31*
Date of reporting period: July 31, 2021
| * |
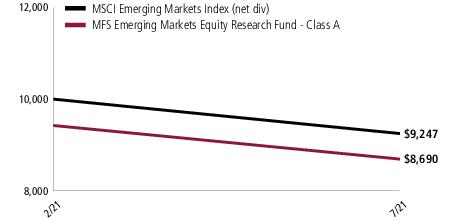
This Form N-CSR pertains to the following series of the Registrant: MFS Equity Income Fund and MFS
Emerging Markets Equity Research Fund. MFS Emerging Markets Equity Research Fund commenced investment operations on February 23, 2021. |
| ITEM 1. |
REPORTS TO STOCKHOLDERS. |
Item 1(a):
Annual Report
July 31, 2021
|
1
|
|
2
|
|
3
|
|
6
|
|
9
|
|
11
|
|
16
|
|
18
|
|
19
|
|
20
|
|
29
|
|
40
|
|
42
|
|
47
|
|
51
|
|
52
|
|
52
|
|
52
|
|
52
|
|
52
|
|
54
|
The
report is prepared for the general information of shareholders. It is authorized for distribution to prospective investors only when preceded or accompanied by a current prospectus.
NOT FDIC INSURED • MAY LOSE VALUE
• NO BANK GUARANTEE
LETTER FROM THE CEO
Dear Shareholders:
After experiencing dramatic swings in the early days of the
coronavirus pandemic, global equity markets have performed strongly over the past year. Though the speedy development of vaccines brightened the economic and market outlook, uncertainty remains as new variants of the virus appear, and questions
persist over how fast vaccines can be made widely available in the developing world.
Global central banks have taken aggressive
steps to cushion the economic and market fallout related to the virus, and governments are deploying unprecedented levels of fiscal support. Having passed a $1.9 trillion stimulus package in March, the U.S. Congress could approve additional stimulus
later this year, some of it focused on infrastructure. Along with extraordinary government expenditures, pent-up consumer demand fueled a surge in economic activity as coronavirus restrictions were eased, pushing up inflation, at least temporarily.
Markets initially reacted by pushing yields on global government bonds higher, though some of the rate rise has since been corrected. Some emerging market central banks have begun to raise interest rates in recent months while the U.S. Federal
Reserve has started to discuss tapering its bond buying program before the end of 2021.
A spirited debate is underway among investors over whether the
current price pressures will persist or prove to be the temporary result of pandemic-induced bottlenecks. The policy measures put in place to counteract the pandemic's effects have helped build a supportive environment and are encouraging economic
recovery; however, if markets disconnect from fundamentals, they can sow the seeds of instability. As such, recent dramatic increases in speculative trading in cryptocurrencies, special purpose acquisition companies (SPACs), and the like bear
watching.
In the aftermath of the crisis, we could see
societal changes as households, businesses, and governments adjust to a new reality, and any such alterations could affect the investment landscape. For investors, events such as the COVID-19 outbreak demonstrate the importance of having a deep
understanding of company fundamentals, and we have built our global research platform to do just that.
At MFS®, we put our clients’ assets to work responsibly by carefully navigating the increasing complexity of global markets and economies. Guided by our
long-term philosophy and adhering to our commitment to sustainable investing, we tune out the noise and aim to uncover what we believe are the best, most durable investment opportunities in the market. Our unique global investment platform combines
collective expertise, long-term discipline, and thoughtful risk management to create sustainable value for investors.
Respectfully,
Michael W.
Roberge
Chief Executive Officer
MFS Investment Management
September 15, 2021
The opinions expressed in this letter are subject to change
and may not be relied upon for investment advice. No forecasts can be guaranteed.
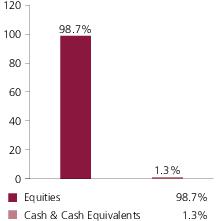
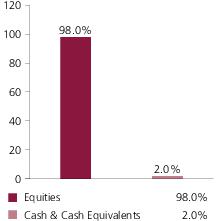
Portfolio structure
Top ten
holdings
| Microsoft
Corp. |
7.4%
|
| Apple,
Inc. |
3.8%
|
| Eaton
Corp. PLC |
3.1%
|
| Alphabet,
Inc., “A” |
3.1%
|
| Comcast
Corp., “A” |
2.6%
|
| Goldman
Sachs Group, Inc. |
2.3%
|
| Bank
of America Corp. |
2.3%
|
| Johnson
& Johnson |
2.3%
|
| Citigroup,
Inc. |
2.2%
|
| Merck
& Co., Inc. |
2.2%
|
GICS equity sectors (g)
| Information
Technology |
18.7%
|
| Financials
|
16.1%
|
| Health
Care |
12.6%
|
| Industrials
|
9.3%
|
| Communication
Services |
7.8%
|
| Consumer
Staples |
7.3%
|
| Consumer
Discretionary |
6.2%
|
| Real
Estate |
5.9%
|
| Energy
|
5.1%
|
| Utilities
|
3.9%
|
| Convertible
Debt |
3.7%
|
| Materials
|
2.1%
|
| (g)
|
The
Global Industry Classification Standard (GICS®) was developed by and/or is the exclusive property of MSCI, Inc. and S&P Global Market
Intelligence Inc. (“S&P Global Market Intelligence”). GICS is a service mark of MSCI and S&P Global Market Intelligence and has been licensed for use by MFS. MFS has applied its own internal sector/industry classification
methodology for equity securities and non-equity securities that are unclassified by GICS. |
Cash & Cash Equivalents includes any cash,
investments in money market funds, short-term securities, and other assets less liabilities. Please see the Statement of Assets and Liabilities for additional information related to the fund’s cash position and other assets and
liabilities.
Percentages are based on net
assets as of July 31, 2021.
The portfolio is
actively managed and current holdings may be different.
Management Review
Summary of Results
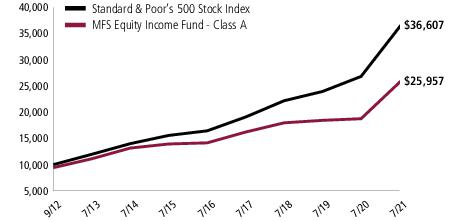
For the twelve months ended July 31, 2021, Class A shares of
the MFS Equity Income Fund (fund) provided a total return of 38.34%, at net asset value. This compares with a return of 36.45% for the fund’s benchmark, the Standard & Poor's 500 Stock Index (S&P 500 Stock Index).
Market Environment
The global economy continued to recover from the most unusual
recession in memory as financial markets benefited from massive fiscal and monetary intervention aimed at offsetting the economic effects of the pandemic. In developed markets, vaccine distribution broadened after getting off to a
slower-than-hoped-for start in some locales, though concerns remained that too few people will be inoculated for herd immunity to be achieved, which could result in the emergence of additional variants. On balance, emerging markets experienced
slower rollouts than developed markets amid ongoing vaccine supply constraints.
Around the world, central banks responded quickly and massively
to the crisis with programs to improve liquidity and support markets. These undertakings proved largely successful in helping to restore market function, ease volatility and stimulate a prolonged rebound. In the first half of the period, the US
Federal Reserve adopted a new, flexible average-inflation-targeting framework, which is expected to result in the federal funds rate remaining at low levels longer than under its previous model. Due to relatively manageable external liabilities and
balances of payments in many countries and persistently low inflation, even emerging market countries were able to implement countercyclical policies — a departure from the usual market-dictated response to risk-off crises.
Late in the period, markets grappled with the threat of
resurgent inflation resulting from pandemic-induced production bottlenecks, monumental levels of economic stimulus and the unleashing of post-lockdown pent-up demand. Meanwhile, raw materials prices rebounded strongly on account of the surprising
resilience of the global manufacturing sector during the pandemic. Global sovereign bond yields initially rose in response to these factors before yields moderated in the second half of the period. The vaccine breakthroughs announced in November
2020 saw market leadership shift from a handful of mega-cap technology companies to a broader array of small-cap and value stocks, though growth stocks have performed strongly in recent months. Signs of excess investor enthusiasm were seen in
pockets of the market, such as the “meme stocks” popular with users of online message boards and heavy retail participation in the market for short-dated equity options.
Contributors to Performance
Security selection in the industrials sector was a primary
factor that contributed to the fund's performance relative to the S&P 500 Stock Index over the reporting period. Notably, the fund's holdings of agriculture equipment manufacturer AGCO(b) and electronics company Hitachi(b) (Japan), as well as
the fund's overweight position in
Management Review -
continued
shares of leading diversified industrial manufacturer Eaton (Ireland),
benefited relative returns. The stock price of AGCO rose steadily throughout most of the reporting period, benefiting from strong demand for farm equipment and improved operating profitability across all business regions.
Both stock selection and an underweight position in the
consumer discretionary sector also aided relative performance. Here, the fund's overweight position in retail giant Target, and its underweight position in internet retailer Amazon.com, both supported relative results. The share price of Target
rose, aided by same-store sales growth and gross margin expansion over the reporting period.
An overweight position in the financials sector further helped
relative performance. Within this sector, the timing of the fund's overweight position in global financial services company Morgan Stanley(h), and its overweight position in financial services firm Bank of America, aided relative returns. The share
price of Bank of America advanced during the reporting period, appearing to have benefited from lower-than-expected credit costs and strong capital market related revenues.
Elsewhere, the fund's overweight position in pharmaceutical
company Eli Lilly, the timing of its ownership in shares of storage space operator Extra Space Storage, and its holdings of semiconductor manufacturer Taiwan Semiconductor Manufacturing(b) (Taiwan) supported relative results.
Detractors from Performance
A combination of the fund's overweight position and stock
selection in the consumer staples sector weakened relative performance over the reporting period. Notably, the fund's overweight position in office and consumer paper products maker Kimberly-Clark weighed on relative returns as pandemic-related
softness in the company's professional division and higher selling, general and administrative costs weighed on its earnings results.
An underweight position and security selection in the
information technology sector further detracted from relative results, led by the timing of the fund's underweight position in computer graphics processor maker NVIDIA(h). Shares of NVIDIA rose in the latter part of the reporting period, driven by
strong gaming and crypto-related demand.
Stock selection
in the real estate sector also held back relative results. Here, the timing of the fund's positions in data center infrastructure solutions provider QTS Realty Trust(b)(h) and wireless communications infrastructure firm SBA Communications(h)
hindered relative returns. Shares of QTS Realty declined over the reporting period amid concerns that vaccines and reopening expectations could reduce data center demand and hurt its business results.
Stocks in other sectors that further weakened relative results
included the fund's holdings of pharmaceutical and diagnostic company Roche Holding(b) (Switzerland) and insurance provider Zurich Insurance Group(b) (Switzerland), as well as its overweight position in shares of pharmaceutical company Merck &
Co. Underweighting shares of technology company Alphabet, and the timing of the fund's ownership in shares of diversified financial services firm Wells Fargo(h), also hindered relative returns.
Management Review -
continued
The fund’s cash and/or cash equivalents position during
the period was another detractor from relative performance. Under normal market conditions, the fund strives to be fully invested and generally holds cash to buy new holdings and to provide liquidity. In a period when equity markets rose, as
measured by the fund’s benchmark, holding cash hurt performance versus the benchmark, which has no cash position.
Respectfully,
Portfolio Manager(s)
Jim Fallon, Matt Krummell, Jonathan Sage, and Jed Stocks
| (b)
|
Security is not a
benchmark constituent. |
| (h)
|
Security was not held in
the portfolio at period end. |
The
views expressed in this report are those of the portfolio manager(s) only through the end of the period of the report as stated on the cover and do not necessarily reflect the views of MFS or any other person in the MFS organization. These views are
subject to change at any time based on market or other conditions, and MFS disclaims any responsibility to update such views. These views may not be relied upon as investment advice or an indication of trading intent on behalf of any MFS portfolio.
References to specific securities are not recommendations of such securities, and may not be representative of any MFS portfolio’s current or future investments.
Performance Summary THROUGH
7/31/21
The following chart illustrates a representative
class of the fund’s historical performance in comparison to its benchmark(s). Performance results include the deduction of the maximum applicable sales charge and reflect the percentage change in net asset value, including reinvestment of
dividends and capital gains distributions. The performance of other share classes will be greater than or less than that of the class depicted below. Benchmarks are unmanaged and may not be invested in directly. Benchmark returns do not reflect
sales charges, commissions or expenses. (See Notes to Performance Summary.)
Performance data shown represents past performance and is no
guarantee of future results. Investment return and principal value fluctuate so your shares, when sold, may be worth more or less than the original cost; current performance may be lower or higher than quoted. The performance shown does not reflect
the deduction of taxes, if any, that a shareholder would pay on fund distributions or the redemption of fund shares.
Growth of a Hypothetical $10,000 Investment (t)
Performance Summary -
continued
Total Returns through 7/31/21
Average annual without sales charge
| Share
Class |
Class
Inception Date |
1-yr
|
5-yr
|
Life
(t) |
| A
|
9/27/12
|
38.34%
|
12.89%
|
12.14%
|
| B
|
9/27/12
|
37.26%
|
12.04%
|
11.30%
|
| C
|
9/27/12
|
37.27%
|
12.04%
|
11.31%
|
| I
|
9/27/12
|
38.66%
|
13.19%
|
12.42%
|
| R1
|
9/27/12
|
37.27%
|
12.04%
|
11.29%
|
| R2
|
9/27/12
|
37.92%
|
12.61%
|
11.85%
|
| R3
|
9/27/12
|
38.29%
|
12.89%
|
12.13%
|
| R4
|
9/27/12
|
38.64%
|
13.18%
|
12.41%
|
| R6
|
9/27/12
|
38.76%
|
13.30%
|
12.59%
|
Comparative benchmark(s)
| |
|
|
|
| Standard
& Poor's 500 Stock Index (f) |
36.45%
|
17.35%
|
15.79%
|
Average annual with sales
charge
| |
|
|
|
A
With Initial Sales Charge (5.75%) |
30.38%
|
11.56%
|
11.39%
|
B
With CDSC (Declining over six years from 4% to 0%) (v) |
33.26%
|
11.78%
|
11.30%
|
C
With CDSC (1% for 12 months) (v) |
36.27%
|
12.04%
|
11.31%
|
CDSC – Contingent Deferred
Sales Charge.
Class I, R1, R2, R3, R4, and R6 shares do
not have a sales charge.
| (f)
|
Source:
FactSet Research Systems Inc. |
| (t)
|
For the
period from the class inception date through the stated period end. (See Notes to Performance Summary.) |
| (v)
|
Assuming
redemption at the end of the applicable period. |
Benchmark Definition(s)
Standard & Poor's 500 Stock Index(g) – a market capitalization-weighted index of 500 widely held equity securities, designed to measure broad U.S. equity performance.
It is not possible to invest directly in an index.
| (g)
|
“Standard
& Poor's®” and
“S&P®” are registered trademarks of Standard & Poor's Financial Services LLC (“S&P”) and Dow Jones is a
registered trademark of Dow Jones Trademark Holdings LLC (“Dow Jones”) and have been licensed for use by S&P Dow Jones Indices LLC and sublicensed for certain purposes by MFS. The S&P 500® is a product of S&P Dow Jones Indices LLC, and has been licensed for use by MFS. MFS's product(s) is not sponsored, |
Performance Summary -
continued
endorsed, sold, or promoted by S&P Dow Jones Indices
LLC, Dow Jones, S&P, or their respective affiliates, and neither S&P Dow Jones Indices LLC, Dow Jones, S&P, nor their respective affiliates make any representation regarding the advisability of investing in such product(s).
Notes to Performance Summary
Average annual total return represents the average annual
change in value for each share class for the periods presented. Life returns are presented where the share class has less than 10 years of performance history and represent the average annual total return from the class inception date to the stated
period end date.
Performance results reflect any
applicable expense subsidies and waivers in effect during the periods shown. Without such subsidies and waivers the fund's performance results would be less favorable. Please see the prospectus and financial statements for complete details.
Performance results do not include adjustments made for
financial reporting purposes in accordance with U.S. generally accepted accounting principles and may differ from amounts reported in the financial highlights.
From time to time the fund may receive proceeds from litigation
settlements, without which performance would be lower.
Expense Table
Fund expenses borne by the shareholders during the period,
February 1, 2021 through July 31, 2021
As a
shareholder of the fund, you incur two types of costs: (1) transaction costs, including sales charges (loads) on certain purchase or redemption payments, and (2) ongoing costs, including management fees; distribution and service (12b-1) fees; and
other fund expenses. This example is intended to help you understand your ongoing costs (in dollars) of investing in the fund and to compare these costs with the ongoing costs of investing in other mutual funds.
The example is based on an investment of $1,000 invested at the
beginning of the period and held for the entire period February 1, 2021 through July 31, 2021.
Actual Expenses
The first line for each share class in the following table
provides information about actual account values and actual expenses. You may use the information in this line, together with the amount you invested, to estimate the expenses that you paid over the period. Simply divide your account value by $1,000
(for example, an $8,600 account value divided by $1,000 = 8.6), then multiply the result by the number in the first line under the heading entitled “Expenses Paid During Period” to estimate the expenses you paid on your account during
this period.
Hypothetical Example for Comparison
Purposes
The second line for each share class in the
following table provides information about hypothetical account values and hypothetical expenses based on the fund’s actual expense ratio and an assumed rate of return of 5% per year before expenses, which is not the fund’s actual
return. The hypothetical account values and expenses may not be used to estimate the actual ending account balance or expenses you paid for the period. You may use this information to compare the ongoing costs of investing in the fund and other
funds. To do so, compare this 5% hypothetical example with the 5% hypothetical examples that appear in the shareholder reports of the other funds.
Please note that the expenses shown in the table are meant to
highlight your ongoing costs only and do not reflect any transactional costs, such as sales charges (loads). Therefore, the second line for each share class in the table is useful in comparing ongoing costs only, and will not help you determine the
relative total costs of owning different funds. In addition, if these transactional costs were included, your costs would have been higher.
Expense Table -
continued
Share
Class |
|
Annualized
Expense
Ratio |
Beginning
Account Value
2/01/21 |
Ending
Account Value
7/31/21 |
Expenses
Paid During
Period (p)
2/01/21-7/31/21 |
| A
|
Actual
|
0.87%
|
$1,000.00
|
$1,175.64
|
$4.69
|
| Hypothetical
(h) |
0.87%
|
$1,000.00
|
$1,020.48
|
$4.36
|
| B
|
Actual
|
1.62%
|
$1,000.00
|
$1,171.59
|
$8.72
|
| Hypothetical
(h) |
1.62%
|
$1,000.00
|
$1,016.76
|
$8.10
|
| C
|
Actual
|
1.62%
|
$1,000.00
|
$1,171.59
|
$8.72
|
| Hypothetical
(h) |
1.62%
|
$1,000.00
|
$1,016.76
|
$8.10
|
| I
|
Actual
|
0.62%
|
$1,000.00
|
$1,177.03
|
$3.35
|
| Hypothetical
(h) |
0.62%
|
$1,000.00
|
$1,021.72
|
$3.11
|
| R1
|
Actual
|
1.62%
|
$1,000.00
|
$1,171.60
|
$8.72
|
| Hypothetical
(h) |
1.62%
|
$1,000.00
|
$1,016.76
|
$8.10
|
| R2
|
Actual
|
1.12%
|
$1,000.00
|
$1,174.13
|
$6.04
|
| Hypothetical
(h) |
1.12%
|
$1,000.00
|
$1,019.24
|
$5.61
|
| R3
|
Actual
|
0.86%
|
$1,000.00
|
$1,175.74
|
$4.64
|
| Hypothetical
(h) |
0.86%
|
$1,000.00
|
$1,020.53
|
$4.31
|
| R4
|
Actual
|
0.62%
|
$1,000.00
|
$1,176.99
|
$3.35
|
| Hypothetical
(h) |
0.62%
|
$1,000.00
|
$1,021.72
|
$3.11
|
| R6
|
Actual
|
0.55%
|
$1,000.00
|
$1,177.98
|
$2.97
|
| Hypothetical
(h) |
0.55%
|
$1,000.00
|
$1,022.07
|
$2.76
|
| (h)
|
5% class return per year
before expenses. |
| (p)
|
“Expenses
Paid During Period” are equal to each class’s annualized expense ratio, as shown above, multiplied by the average account value over the period, multiplied by 181/365 (to reflect the one-half year period). Expenses paid do not include
any applicable sales charges (loads). If these transaction costs had been included, your costs would have been higher. |
Portfolio of
Investments
7/31/21
The Portfolio of Investments is a complete list of all
securities owned by your fund. It is categorized by broad-based asset classes.
| Issuer
|
|
|
Shares/Par
|
Value
($) |
| Common
Stocks – 94.4% |
| Aerospace
& Defense – 0.8% |
|
| Honeywell
International, Inc. |
|
10,442 |
$
2,441,235 |
| Automotive
– 0.2% |
|
| Magna
International, Inc. |
|
8,204 |
$
687,831 |
| Biotechnology
– 0.4% |
|
| Gilead
Sciences, Inc. |
|
15,865 |
$
1,083,421 |
| Brokerage
& Asset Managers – 0.3% |
|
| Invesco
Ltd. |
|
32,002 |
$
780,209 |
| Business
Services – 1.1% |
|
| Accenture
PLC, “A” |
|
5,090 |
$
1,616,991 |
| Cognizant
Technology Solutions Corp., “A” |
|
21,430 |
1,575,748 |
| |
|
|
|
$3,192,739 |
| Cable
TV – 2.6% |
|
| Comcast
Corp., “A” |
|
130,820 |
$
7,696,141 |
| Computer
Software – 7.4% |
|
| Microsoft
Corp. |
|
77,467 |
$
22,071,123 |
| Computer
Software - Systems – 5.9% |
|
| Apple,
Inc. |
|
77,724 |
$
11,336,823 |
| Hitachi
Ltd. |
|
77,800 |
4,468,104 |
| Samsung
Electronics Co. Ltd. |
|
14,930 |
1,020,975 |
| SS&C
Technologies Holdings, Inc. |
|
9,547 |
748,389 |
| |
|
|
|
$17,574,291 |
| Consumer
Products – 1.1% |
|
| Kimberly-Clark
Corp. |
|
25,108 |
$
3,407,658 |
| Electrical
Equipment – 0.6% |
|
| Johnson
Controls International PLC |
|
7,175 |
$
512,439 |
| Schneider
Electric SE |
|
6,864 |
1,150,523 |
| |
|
|
|
$1,662,962 |
| Electronics
– 5.1% |
|
| Intel
Corp. |
|
95,532 |
$
5,131,979 |
| Taiwan
Semiconductor Manufacturing Co. Ltd., ADR |
|
40,173 |
4,685,779 |
| Texas
Instruments, Inc. |
|
28,095 |
5,355,469 |
| |
|
|
|
$15,173,227 |
Portfolio of
Investments – continued
| Issuer
|
|
|
Shares/Par
|
Value
($) |
| Common
Stocks – continued |
| Energy
- Independent – 1.3% |
|
| Valero
Energy Corp. |
|
56,395 |
$
3,776,773 |
| Food
& Beverages – 2.6% |
|
| General
Mills, Inc. |
|
21,287 |
$
1,252,953 |
| J.M.
Smucker Co. |
|
34,701 |
4,549,648 |
| PepsiCo,
Inc. |
|
12,061 |
1,892,974 |
| |
|
|
|
$7,695,575 |
| Food
& Drug Stores – 1.3% |
|
| Wal-Mart
Stores, Inc. |
|
26,264 |
$
3,743,933 |
| Forest
& Paper Products – 0.6% |
|
| Weyerhaeuser
Co., REIT |
|
56,934 |
$
1,920,384 |
| Health
Maintenance Organizations – 2.1% |
|
| Cigna
Corp. |
|
26,745 |
$
6,137,710 |
| Insurance
– 4.4% |
|
| Equitable
Holdings, Inc. |
|
79,239 |
$
2,446,108 |
| Everest
Re Group Ltd. |
|
4,591 |
1,160,743 |
| Manulife
Financial Corp. |
|
168,277 |
3,252,794 |
| MetLife,
Inc. |
|
74,955 |
4,324,903 |
| Zurich
Insurance Group AG |
|
4,836 |
1,952,872 |
| |
|
|
|
$13,137,420 |
| Internet
– 4.1% |
|
| Alphabet,
Inc., “A” (a) |
|
3,373 |
$
9,088,650 |
| Facebook,
Inc., “A” (a) |
|
8,852 |
3,153,967 |
| |
|
|
|
$12,242,617 |
| Leisure
& Toys – 1.1% |
|
| Activision
Blizzard, Inc. |
|
25,510 |
$
2,133,146 |
| Nintendo
Co. Ltd. |
|
2,000 |
1,030,471 |
| |
|
|
|
$3,163,617 |
| Machinery
& Tools – 4.9% |
|
| AGCO
Corp. |
|
33,766 |
$
4,460,826 |
| Eaton
Corp. PLC |
|
58,054 |
9,175,435 |
| Regal
Beloit Corp. |
|
6,700 |
986,441 |
| |
|
|
|
$14,622,702 |
| Major
Banks – 7.9% |
|
| Bank
of America Corp. |
|
175,887 |
$
6,747,025 |
| Bank
of Nova Scotia |
|
28,613 |
1,785,904 |
| Goldman
Sachs Group, Inc. |
|
18,169 |
6,811,195 |
| JPMorgan
Chase & Co. |
|
21,292 |
3,231,700 |
Portfolio of
Investments – continued
| Issuer
|
|
|
Shares/Par
|
Value
($) |
| Common
Stocks – continued |
| Major
Banks – continued |
|
| Toronto-Dominion
Bank |
|
17,040 |
$
1,132,950 |
| UBS
Group AG |
|
219,300 |
3,616,870 |
| |
|
|
|
$23,325,644 |
| Medical
& Health Technology & Services – 1.8% |
|
| McKesson
Corp. |
|
26,113 |
$
5,322,613 |
| Metals
& Mining – 2.1% |
|
| Glencore
PLC |
|
495,860 |
$
2,230,055 |
| Rio
Tinto PLC |
|
45,535 |
3,861,548 |
| |
|
|
|
$6,091,603 |
| Natural
Gas - Distribution – 0.5% |
|
| UGI
Corp. |
|
31,551 |
$
1,451,030 |
| Natural
Gas - Pipeline – 3.8% |
|
| Enbridge,
Inc. |
|
105,584 |
$
4,162,088 |
| Enterprise
Products Partners LP |
|
230,785 |
5,208,818 |
| ONEOK,
Inc. |
|
18,544 |
963,732 |
| Plains
All American Pipeline LP |
|
104,641 |
1,047,456 |
| |
|
|
|
$11,382,094 |
| Other
Banks & Diversified Financials – 2.6% |
|
| Citigroup,
Inc. |
|
97,934 |
$
6,622,297 |
| Synchrony
Financial |
|
21,136 |
993,815 |
| |
|
|
|
$7,616,112 |
| Pharmaceuticals
– 8.4% |
|
| Bayer
AG |
|
38,717 |
$
2,309,720 |
| Eli
Lilly & Co. |
|
13,004 |
3,166,474 |
| Johnson
& Johnson |
|
38,915 |
6,701,163 |
| Merck
& Co., Inc. |
|
83,520 |
6,420,183 |
| Novartis
AG |
|
8,438 |
781,343 |
| Roche
Holding AG |
|
14,030 |
5,426,296 |
| |
|
|
|
$24,805,179 |
| Real
Estate – 6.2% |
|
| Extra
Space Storage, Inc., REIT |
|
31,016 |
$
5,401,126 |
| Medical
Properties Trust, Inc., REIT |
|
95,862 |
2,015,978 |
| National
Retail Properties, Inc., REIT |
|
32,297 |
1,578,354 |
| National
Storage Affiliates Trust, REIT |
|
17,026 |
922,299 |
| Omega
Healthcare Investors, Inc., REIT |
|
23,479 |
851,818 |
| Public
Storage, Inc., REIT |
|
3,421 |
1,068,994 |
| Spirit
Realty Capital, Inc., REIT |
|
52,969 |
2,660,103 |
| Starwood
Property Trust, Inc., REIT |
|
107,265 |
2,792,108 |
Portfolio of
Investments – continued
| Issuer
|
|
|
Shares/Par
|
Value
($) |
| Common
Stocks – continued |
| Real
Estate – continued |
|
| STORE
Capital Corp., REIT |
|
33,998 |
$
1,230,388 |
| |
|
|
|
$18,521,168 |
| Restaurants
– 2.0% |
|
| Starbucks
Corp. |
|
47,792 |
$
5,803,383 |
| Specialty
Stores – 4.0% |
|
| Amazon.com,
Inc. (a) |
|
1,657 |
$
5,513,817 |
| Home
Depot, Inc. |
|
9,374 |
3,076,453 |
| Target
Corp. |
|
12,792 |
3,339,351 |
| |
|
|
|
$11,929,621 |
| Tobacco
– 2.3% |
|
| British
American Tobacco PLC |
|
37,705 |
$
1,404,850 |
| Japan
Tobacco, Inc. |
|
108,200 |
2,115,944 |
| Philip
Morris International, Inc. |
|
34,227 |
3,425,780 |
| |
|
|
|
$6,946,574 |
| Trucking
– 1.5% |
|
| United
Parcel Service, Inc., “B” |
|
23,637 |
$
4,523,176 |
| Utilities
- Electric Power – 3.4% |
|
| CenterPoint
Energy, Inc. |
|
24,991 |
$
636,271 |
| Edison
International |
|
31,342 |
1,708,139 |
| Exelon
Corp. |
|
109,163 |
5,108,828 |
| NextEra
Energy Partners LP |
|
19,399 |
1,504,004 |
| NRG
Energy, Inc. |
|
28,019 |
1,155,504 |
| |
|
|
|
$10,112,746 |
| Total
Common Stocks (Identified Cost, $195,345,350) |
|
$
280,042,511 |
| Convertible
Preferred Stocks – 3.7% |
| Medical
Equipment – 2.3% |
|
| Boston
Scientific Corp., 5.5% |
|
18,583 |
$
2,283,108 |
| Danaher
Corp., 4.75% |
|
2,235 |
4,453,796 |
| |
|
|
|
$6,736,904 |
| Utilities
- Electric Power – 1.4% |
|
| CenterPoint
Energy, Inc., 7% |
|
87,791 |
$
4,134,078 |
| Total
Convertible Preferred Stocks (Identified Cost, $9,500,251) |
$
10,870,982 |
| Preferred
Stocks – 0.6% |
| Computer
Software - Systems – 0.6% |
|
|
|
|
| Samsung
Electronics Co. Ltd. (Identified Cost, $1,263,994) |
|
28,949 |
$
1,817,209 |
Portfolio of
Investments – continued
| Issuer
|
|
|
Shares/Par
|
Value
($) |
| Investment
Companies (h) – 1.1% |
| Money
Market Funds – 1.1% |
|
| MFS
Institutional Money Market Portfolio, 0.03% (v) (Identified Cost, $3,365,969) |
|
|
3,365,969
|
$
3,365,969 |
| |
| |
| Other
Assets, Less Liabilities – 0.2% |
|
546,812 |
| Net
Assets – 100.0% |
$
296,643,483 |
| (a)
|
Non-income
producing security. |
|
|
|
| (h)
|
An
affiliated issuer, which may be considered one in which the fund owns 5% or more of the outstanding voting securities, or a company which is under common control. At period end, the aggregate values of the fund's investments in affiliated issuers
and in unaffiliated issuers were $3,365,969 and $292,730,702, respectively. |
|
|
|
| (v)
|
Affiliated
issuer that is available only to investment companies managed by MFS. The rate quoted for the MFS Institutional Money Market Portfolio is the annualized seven-day yield of the fund at period end. |
|
|
|
| The
following abbreviations are used in this report and are defined: |
| ADR
|
American
Depositary Receipt |
| REIT
|
Real
Estate Investment Trust |
See Notes to
Financial Statements
Financial Statements
Statement of Assets and Liabilities
At 7/31/21
This statement represents your fund’s balance sheet,
which details the assets and liabilities comprising the total value of the fund.
| Assets
|
|
| Investments
in unaffiliated issuers, at value (identified cost, $206,109,595) |
$292,730,702
|
| Investments
in affiliated issuers, at value (identified cost, $3,365,969) |
3,365,969
|
| Receivables
for |
|
| Fund
shares sold |
216,542
|
| Dividends
|
721,805
|
| Receivable
from investment adviser |
3,982
|
| Other
assets |
356
|
| Total
assets |
$297,039,356
|
| Liabilities
|
|
| Payables
for |
|
| Fund
shares reacquired |
$239,046
|
| Payable
to affiliates |
|
| Administrative
services fee |
409
|
| Shareholder
servicing costs |
68,568
|
| Distribution
and service fees |
5,892
|
| Payable
for independent Trustees' compensation |
11
|
| Accrued
expenses and other liabilities |
81,947
|
| Total
liabilities |
$395,873
|
| Net
assets |
$296,643,483
|
| Net
assets consist of |
|
| Paid-in
capital |
$193,859,384
|
| Total
distributable earnings (loss) |
102,784,099
|
| Net
assets |
$296,643,483
|
| Shares
of beneficial interest outstanding |
14,492,019
|
Statement of Assets and
Liabilities – continued
| |
Net
assets |
Shares
outstanding |
Net
asset value
per share (a) |
| Class
A |
$200,390,869
|
9,798,830
|
$20.45
|
| Class
B |
3,911,382
|
191,250
|
20.45
|
| Class
C |
16,921,692
|
827,591
|
20.45
|
| Class
I |
40,721,825
|
1,990,068
|
20.46
|
| Class
R1 |
177,195
|
8,626
|
20.54
|
| Class
R2 |
241,529
|
11,776
|
20.51
|
| Class
R3 |
806,370
|
39,367
|
20.48
|
| Class
R4 |
423,758
|
20,701
|
20.47
|
| Class
R6 |
33,048,863
|
1,603,810
|
20.61
|
| (a)
|
Maximum
offering price per share was equal to the net asset value per share for all share classes, except for Class A, for which the maximum offering price per share was $21.70 [100 / 94.25 x $20.45]. On sales of $50,000 or more, the maximum offering price
of Class A shares is reduced. A contingent deferred sales charge may be imposed on redemptions of Class A, Class B, and Class C shares. Redemption price per share was equal to the net asset value per share for Classes I, R1, R2, R3, R4, and R6.
|
See Notes to Financial Statements
Financial Statements
Statement of Operations
Year ended 7/31/21
This statement describes how much your fund earned in
investment income and accrued in expenses. It also describes any gains and/or losses generated by fund operations.
| Net
investment income (loss) |
|
| Income
|
|
| Dividends
|
$6,797,607
|
| Other
|
6,726
|
| Dividends
from affiliated issuers |
1,448
|
| Income
on securities loaned |
805
|
| Foreign
taxes withheld |
(176,112)
|
| Total
investment income |
$6,630,474
|
| Expenses
|
|
| Management
fee |
$1,230,870
|
| Distribution
and service fees |
623,404
|
| Shareholder
servicing costs |
221,054
|
| Administrative
services fee |
42,516
|
| Independent
Trustees' compensation |
6,649
|
| Custodian
fee |
23,330
|
| Shareholder
communications |
23,272
|
| Audit
and tax fees |
57,219
|
| Legal
fees |
1,574
|
| Registration
fees |
149,927
|
| Miscellaneous
|
33,200
|
| Total
expenses |
$2,413,015
|
| Reduction
of expenses by investment adviser and distributor |
(256,624)
|
| Net
expenses |
$2,156,391
|
| Net
investment income (loss) |
$4,474,083
|
| Realized
and unrealized gain (loss) |
| Realized
gain (loss) (identified cost basis) |
|
| Unaffiliated
issuers |
$17,515,484
|
| Affiliated
issuers |
(95)
|
| Foreign
currency |
2,225
|
| Net
realized gain (loss) |
$17,517,614
|
| Change
in unrealized appreciation or depreciation |
|
| Unaffiliated
issuers |
$56,160,613
|
| Affiliated
issuers |
(54)
|
| Translation
of assets and liabilities in foreign currencies |
2,170
|
| Net
unrealized gain (loss) |
$56,162,729
|
| Net
realized and unrealized gain (loss) |
$73,680,343
|
| Change
in net assets from operations |
$78,154,426
|
See Notes to Financial
Statements
Financial Statements
Statements of Changes in Net Assets
These statements describe the increases and/or decreases in
net assets resulting from operations, any distributions, and any shareholder transactions.
| |
Year
ended |
| |
7/31/21
|
7/31/20
|
| Change
in net assets |
|
|
| From
operations |
|
|
| Net
investment income (loss) |
$4,474,083
|
$4,142,068
|
| Net
realized gain (loss) |
17,517,614
|
2,450,590
|
| Net
unrealized gain (loss) |
56,162,729
|
(3,187,388)
|
| Change
in net assets from operations |
$78,154,426
|
$3,405,270
|
| Total
distributions to shareholders |
$(8,020,112)
|
$(4,694,613)
|
| Change
in net assets from fund share transactions |
$21,280,462
|
$(5,054,242)
|
| Total
change in net assets |
$91,414,776
|
$(6,343,585)
|
| Net
assets |
|
|
| At
beginning of period |
205,228,707
|
211,572,292
|
| At
end of period |
$296,643,483
|
$205,228,707
|
See Notes to Financial
Statements
Financial
Statements
Financial Highlights
The financial highlights table is intended to help you
understand the fund's financial performance for the past 5 years. Certain information reflects financial results for a single fund share. The total returns in the table represent the rate that an investor would have earned (or lost) on an investment
in the fund share class (assuming reinvestment of all distributions) held for the entire period.
| Class
A |
Year
ended |
| |
7/31/21
|
7/31/20
|
7/31/19
|
7/31/18
|
7/31/17
|
| Net
asset value, beginning of period |
$15.29
|
$15.40
|
$16.05
|
$15.25
|
$13.57
|
| Income
(loss) from investment operations |
| Net
investment income (loss) (d) |
$0.33
|
$0.31
|
$0.30
|
$0.31
|
$0.29
|
| Net
realized and unrealized gain (loss) |
5.42
|
(0.06)
|
0.00(w)
|
1.32
|
1.67
|
| Total
from investment operations |
$5.75
|
$0.25
|
$0.30
|
$1.63
|
$1.96
|
| Less
distributions declared to shareholders |
| From
net investment income |
$(0.30)
|
$(0.32)
|
$(0.31)
|
$(0.34)
|
$(0.28)
|
| From
net realized gain |
(0.29)
|
(0.04)
|
(0.64)
|
(0.49)
|
—
|
| Total
distributions declared to shareholders |
$(0.59)
|
$(0.36)
|
$(0.95)
|
$(0.83)
|
$(0.28)
|
| Net
asset value, end of period (x) |
$20.45
|
$15.29
|
$15.40
|
$16.05
|
$15.25
|
| Total
return (%) (r)(s)(t)(x) |
38.34
|
1.69
|
2.56
|
10.91
|
14.57
|
Ratios
(%) (to average net assets)
and Supplemental data: |
| Expenses
before expense reductions (f) |
0.99
|
1.02
|
1.02
|
1.03
|
1.17
|
| Expenses
after expense reductions (f) |
0.88
|
0.89
|
0.89
|
0.89
|
0.99
|
| Net
investment income (loss) |
1.81
|
2.05
|
1.97
|
1.95
|
2.02
|
| Portfolio
turnover |
43
|
42
|
39
|
51
|
47
|
| Net
assets at end of period (000 omitted) |
$200,391
|
$139,563
|
$138,043
|
$135,139
|
$134,180
|
See Notes to Financial
Statements
Financial
Highlights – continued
| Class
B |
Year
ended |
| |
7/31/21
|
7/31/20
|
7/31/19
|
7/31/18
|
7/31/17
|
| Net
asset value, beginning of period |
$15.29
|
$15.39
|
$16.03
|
$15.23
|
$13.56
|
| Income
(loss) from investment operations |
| Net
investment income (loss) (d) |
$0.19
|
$0.20
|
$0.19
|
$0.19
|
$0.18
|
| Net
realized and unrealized gain (loss) |
5.42
|
(0.06)
|
0.00(w)
|
1.32
|
1.66
|
| Total
from investment operations |
$5.61
|
$0.14
|
$0.19
|
$1.51
|
$1.84
|
| Less
distributions declared to shareholders |
| From
net investment income |
$(0.16)
|
$(0.20)
|
$(0.19)
|
$(0.22)
|
$(0.17)
|
| From
net realized gain |
(0.29)
|
(0.04)
|
(0.64)
|
(0.49)
|
—
|
| Total
distributions declared to shareholders |
$(0.45)
|
$(0.24)
|
$(0.83)
|
$(0.71)
|
$(0.17)
|
| Net
asset value, end of period (x) |
$20.45
|
$15.29
|
$15.39
|
$16.03
|
$15.23
|
| Total
return (%) (r)(s)(t)(x) |
37.26
|
0.92
|
1.86
|
10.07
|
13.66
|
Ratios
(%) (to average net assets)
and Supplemental data: |
| Expenses
before expense reductions (f) |
1.74
|
1.77
|
1.77
|
1.78
|
1.92
|
| Expenses
after expense reductions (f) |
1.63
|
1.64
|
1.64
|
1.64
|
1.74
|
| Net
investment income (loss) |
1.07
|
1.32
|
1.21
|
1.20
|
1.26
|
| Portfolio
turnover |
43
|
42
|
39
|
51
|
47
|
| Net
assets at end of period (000 omitted) |
$3,911
|
$3,534
|
$4,604
|
$4,378
|
$4,298
|
See Notes to Financial
Statements
Financial
Highlights – continued
| Class
C |
Year
ended |
| |
7/31/21
|
7/31/20
|
7/31/19
|
7/31/18
|
7/31/17
|
| Net
asset value, beginning of period |
$15.29
|
$15.39
|
$16.03
|
$15.23
|
$13.55
|
| Income
(loss) from investment operations |
| Net
investment income (loss) (d) |
$0.19
|
$0.20
|
$0.19
|
$0.19
|
$0.18
|
| Net
realized and unrealized gain (loss) |
5.42
|
(0.06)
|
0.00(w)
|
1.32
|
1.67
|
| Total
from investment operations |
$5.61
|
$0.14
|
$0.19
|
$1.51
|
$1.85
|
| Less
distributions declared to shareholders |
| From
net investment income |
$(0.16)
|
$(0.20)
|
$(0.19)
|
$(0.22)
|
$(0.17)
|
| From
net realized gain |
(0.29)
|
(0.04)
|
(0.64)
|
(0.49)
|
—
|
| Total
distributions declared to shareholders |
$(0.45)
|
$(0.24)
|
$(0.83)
|
$(0.71)
|
$(0.17)
|
| Net
asset value, end of period (x) |
$20.45
|
$15.29
|
$15.39
|
$16.03
|
$15.23
|
| Total
return (%) (r)(s)(t)(x) |
37.27
|
0.95
|
1.84
|
10.06
|
13.76
|
Ratios
(%) (to average net assets)
and Supplemental data: |
| Expenses
before expense reductions (f) |
1.74
|
1.77
|
1.77
|
1.78
|
1.92
|
| Expenses
after expense reductions (f) |
1.63
|
1.64
|
1.64
|
1.64
|
1.74
|
| Net
investment income (loss) |
1.07
|
1.31
|
1.21
|
1.20
|
1.26
|
| Portfolio
turnover |
43
|
42
|
39
|
51
|
47
|
| Net
assets at end of period (000 omitted) |
$16,922
|
$15,705
|
$19,000
|
$19,927
|
$21,460
|
See Notes to Financial
Statements
Financial
Highlights – continued
| Class
I |
Year
ended |
| |
7/31/21
|
7/31/20
|
7/31/19
|
7/31/18
|
7/31/17
|
| Net
asset value, beginning of period |
$15.30
|
$15.41
|
$16.06
|
$15.26
|
$13.57
|
| Income
(loss) from investment operations |
| Net
investment income (loss) (d) |
$0.37
|
$0.35
|
$0.34
|
$0.34
|
$0.34
|
| Net
realized and unrealized gain (loss) |
5.43
|
(0.06)
|
0.00(w)
|
1.33
|
1.67
|
| Total
from investment operations |
$5.80
|
$0.29
|
$0.34
|
$1.67
|
$2.01
|
| Less
distributions declared to shareholders |
| From
net investment income |
$(0.35)
|
$(0.36)
|
$(0.35)
|
$(0.38)
|
$(0.32)
|
| From
net realized gain |
(0.29)
|
(0.04)
|
(0.64)
|
(0.49)
|
—
|
| Total
distributions declared to shareholders |
$(0.64)
|
$(0.40)
|
$(0.99)
|
$(0.87)
|
$(0.32)
|
| Net
asset value, end of period (x) |
$20.46
|
$15.30
|
$15.41
|
$16.06
|
$15.26
|
| Total
return (%) (r)(s)(t)(x) |
38.66
|
1.95
|
2.82
|
11.18
|
14.97
|
Ratios
(%) (to average net assets)
and Supplemental data: |
| Expenses
before expense reductions (f) |
0.73
|
0.77
|
0.77
|
0.78
|
0.91
|
| Expenses
after expense reductions (f) |
0.63
|
0.64
|
0.64
|
0.64
|
0.74
|
| Net
investment income (loss) |
2.05
|
2.31
|
2.20
|
2.19
|
2.37
|
| Portfolio
turnover |
43
|
42
|
39
|
51
|
47
|
| Net
assets at end of period (000 omitted) |
$40,722
|
$21,344
|
$23,261
|
$13,878
|
$8,992
|
See Notes to Financial
Statements
Financial
Highlights – continued
| Class
R1 |
Year
ended |
| |
7/31/21
|
7/31/20
|
7/31/19
|
7/31/18
|
7/31/17
|
| Net
asset value, beginning of period |
$15.36
|
$15.47
|
$16.11
|
$15.30
|
$13.62
|
| Income
(loss) from investment operations |
| Net
investment income (loss) (d) |
$0.19
|
$0.19
|
$0.19
|
$0.19
|
$0.18
|
| Net
realized and unrealized gain (loss) |
5.45
|
(0.05)
|
0.01
|
1.33
|
1.67
|
| Total
from investment operations |
$5.64
|
$0.14
|
$0.20
|
$1.52
|
$1.85
|
| Less
distributions declared to shareholders |
| From
net investment income |
$(0.17)
|
$(0.21)
|
$(0.20)
|
$(0.22)
|
$(0.17)
|
| From
net realized gain |
(0.29)
|
(0.04)
|
(0.64)
|
(0.49)
|
—
|
| Total
distributions declared to shareholders |
$(0.46)
|
$(0.25)
|
$(0.84)
|
$(0.71)
|
$(0.17)
|
| Net
asset value, end of period (x) |
$20.54
|
$15.36
|
$15.47
|
$16.11
|
$15.30
|
| Total
return (%) (r)(s)(t)(x) |
37.27
|
0.92
|
1.85
|
10.09
|
13.68
|
Ratios
(%) (to average net assets)
and Supplemental data: |
| Expenses
before expense reductions (f) |
1.73
|
1.77
|
1.77
|
1.78
|
1.92
|
| Expenses
after expense reductions (f) |
1.63
|
1.64
|
1.64
|
1.64
|
1.74
|
| Net
investment income (loss) |
1.06
|
1.28
|
1.21
|
1.20
|
1.27
|
| Portfolio
turnover |
43
|
42
|
39
|
51
|
47
|
| Net
assets at end of period (000 omitted) |
$177
|
$121
|
$103
|
$85
|
$83
|
See Notes to Financial
Statements
Financial
Highlights – continued
| Class
R2 |
Year
ended |
| |
7/31/21
|
7/31/20
|
7/31/19
|
7/31/18
|
7/31/17
|
| Net
asset value, beginning of period |
$15.34
|
$15.44
|
$16.08
|
$15.28
|
$13.60
|
| Income
(loss) from investment operations |
| Net
investment income (loss) (d) |
$0.28
|
$0.28
|
$0.26
|
$0.26
|
$0.25
|
| Net
realized and unrealized gain (loss) |
5.43
|
(0.06)
|
0.01
|
1.34
|
1.67
|
| Total
from investment operations |
$5.71
|
$0.22
|
$0.27
|
$1.60
|
$1.92
|
| Less
distributions declared to shareholders |
| From
net investment income |
$(0.25)
|
$(0.28)
|
$(0.27)
|
$(0.31)
|
$(0.24)
|
| From
net realized gain |
(0.29)
|
(0.04)
|
(0.64)
|
(0.49)
|
—
|
| Total
distributions declared to shareholders |
$(0.54)
|
$(0.32)
|
$(0.91)
|
$(0.80)
|
$(0.24)
|
| Net
asset value, end of period (x) |
$20.51
|
$15.34
|
$15.44
|
$16.08
|
$15.28
|
| Total
return (%) (r)(s)(t)(x) |
37.92
|
1.46
|
2.38
|
10.63
|
14.26
|
Ratios
(%) (to average net assets)
and Supplemental data: |
| Expenses
before expense reductions (f) |
1.24
|
1.27
|
1.27
|
1.28
|
1.42
|
| Expenses
after expense reductions (f) |
1.13
|
1.14
|
1.14
|
1.14
|
1.24
|
| Net
investment income (loss) |
1.57
|
1.80
|
1.69
|
1.64
|
1.76
|
| Portfolio
turnover |
43
|
42
|
39
|
51
|
47
|
| Net
assets at end of period (000 omitted) |
$242
|
$210
|
$369
|
$298
|
$94
|
See Notes to Financial
Statements
Financial
Highlights – continued
| Class
R3 |
Year
ended |
| |
7/31/21
|
7/31/20
|
7/31/19
|
7/31/18
|
7/31/17
|
| Net
asset value, beginning of period |
$15.32
|
$15.43
|
$16.08
|
$15.27
|
$13.59
|
| Income
(loss) from investment operations |
| Net
investment income (loss) (d) |
$0.33
|
$0.31
|
$0.31
|
$0.31
|
$0.29
|
| Net
realized and unrealized gain (loss) |
5.43
|
(0.06)
|
(0.01)
|
1.33
|
1.67
|
| Total
from investment operations |
$5.76
|
$0.25
|
$0.30
|
$1.64
|
$1.96
|
| Less
distributions declared to shareholders |
| From
net investment income |
$(0.31)
|
$(0.32)
|
$(0.31)
|
$(0.34)
|
$(0.28)
|
| From
net realized gain |
(0.29)
|
(0.04)
|
(0.64)
|
(0.49)
|
—
|
| Total
distributions declared to shareholders |
$(0.60)
|
$(0.36)
|
$(0.95)
|
$(0.83)
|
$(0.28)
|
| Net
asset value, end of period (x) |
$20.48
|
$15.32
|
$15.43
|
$16.08
|
$15.27
|
| Total
return (%) (r)(s)(t)(x) |
38.29
|
1.69
|
2.57
|
10.94
|
14.56
|
Ratios
(%) (to average net assets)
and Supplemental data: |
| Expenses
before expense reductions (f) |
0.97
|
1.02
|
1.02
|
1.03
|
1.17
|
| Expenses
after expense reductions (f) |
0.87
|
0.89
|
0.89
|
0.89
|
0.99
|
| Net
investment income (loss) |
1.74
|
2.05
|
2.04
|
1.97
|
2.02
|
| Portfolio
turnover |
43
|
42
|
39
|
51
|
47
|
| Net
assets at end of period (000 omitted) |
$806
|
$201
|
$182
|
$98
|
$137
|
See Notes to Financial
Statements
Financial
Highlights – continued
| Class
R4 |
Year
ended |
| |
7/31/21
|
7/31/20
|
7/31/19
|
7/31/18
|
7/31/17
|
| Net
asset value, beginning of period |
$15.31
|
$15.42
|
$16.06
|
$15.26
|
$13.58
|
| Income
(loss) from investment operations |
| Net
investment income (loss) (d) |
$0.39
|
$0.35
|
$0.34
|
$0.35
|
$0.32
|
| Net
realized and unrealized gain (loss) |
5.41
|
(0.06)
|
0.01
|
1.32
|
1.67
|
| Total
from investment operations |
$5.80
|
$0.29
|
$0.35
|
$1.67
|
$1.99
|
| Less
distributions declared to shareholders |
| From
net investment income |
$(0.35)
|
$(0.36)
|
$(0.35)
|
$(0.38)
|
$(0.31)
|
| From
net realized gain |
(0.29)
|
(0.04)
|
(0.64)
|
(0.49)
|
—
|
| Total
distributions declared to shareholders |
$(0.64)
|
$(0.40)
|
$(0.99)
|
$(0.87)
|
$(0.31)
|
| Net
asset value, end of period (x) |
$20.47
|
$15.31
|
$15.42
|
$16.06
|
$15.26
|
| Total
return (%) (r)(s)(t)(x) |
38.64
|
1.95
|
2.88
|
11.18
|
14.85
|
Ratios
(%) (to average net assets)
and Supplemental data: |
| Expenses
before expense reductions (f) |
0.72
|
0.77
|
0.77
|
0.78
|
0.92
|
| Expenses
after expense reductions (f) |
0.63
|
0.64
|
0.64
|
0.64
|
0.74
|
| Net
investment income (loss) |
2.09
|
2.29
|
2.25
|
2.22
|
2.27
|
| Portfolio
turnover |
43
|
42
|
39
|
51
|
47
|
| Net
assets at end of period (000 omitted) |
$424
|
$101
|
$88
|
$56
|
$63
|
See Notes to Financial
Statements
Financial
Highlights – continued
| Class
R6 |
Year
ended |
| |
7/31/21
|
7/31/20
|
7/31/19
|
7/31/18
|
7/31/17
|
| Net
asset value, beginning of period |
$15.41
|
$15.52
|
$16.15
|
$15.35
|
$13.65
|
| Income
(loss) from investment operations |
| Net
investment income (loss) (d) |
$0.39
|
$0.36
|
$0.36
|
$0.36
|
$0.26
|
| Net
realized and unrealized gain (loss) |
5.46
|
(0.06)
|
0.01
|
1.33
|
1.77
|
| Total
from investment operations |
$5.85
|
$0.30
|
$0.37
|
$1.69
|
$2.03
|
| Less
distributions declared to shareholders |
| From
net investment income |
$(0.36)
|
$(0.37)
|
$(0.36)
|
$(0.40)
|
$(0.33)
|
| From
net realized gain |
(0.29)
|
(0.04)
|
(0.64)
|
(0.49)
|
—
|
| Total
distributions declared to shareholders |
$(0.65)
|
$(0.41)
|
$(1.00)
|
$(0.89)
|
$(0.33)
|
| Net
asset value, end of period (x) |
$20.61
|
$15.41
|
$15.52
|
$16.15
|
$15.35
|
| Total
return (%) (r)(s)(t)(x) |
38.76
|
2.03
|
3.02
|
11.23
|
15.06
|
Ratios
(%) (to average net assets)
and Supplemental data: |
| Expenses
before expense reductions (f) |
0.65
|
0.68
|
0.68
|
0.68
|
0.84
|
| Expenses
after expense reductions (f) |
0.55
|
0.55
|
0.55
|
0.54
|
0.63
|
| Net
investment income (loss) |
2.14
|
2.39
|
2.31
|
2.30
|
1.73
|
| Portfolio
turnover |
43
|
42
|
39
|
51
|
47
|
| Net
assets at end of period (000 omitted) |
$33,049
|
$24,451
|
$25,922
|
$25,684
|
$23,293
|
| (d)
|
Per share
data is based on average shares outstanding. |
| (f)
|
Ratios do
not reflect reductions from fees paid indirectly, if applicable. |
| (r)
|
Certain
expenses have been reduced without which performance would have been lower. |
| (s)
|
From time
to time the fund may receive proceeds from litigation settlements, without which performance would be lower. |
| (t)
|
Total
returns do not include any applicable sales charges. |
| (w)
|
Per share
amount was less than $0.01. |
| (x)
|
The
net asset values and total returns have been calculated on net assets which include adjustments made in accordance with U.S. generally accepted accounting principles required at period end for financial reporting purposes. |
See Notes to Financial Statements
Notes to Financial
Statements
(1) Business and Organization
MFS Equity Income Fund (the fund) is a diversified series of
MFS Series Trust VII (the trust). The trust is organized as a Massachusetts business trust and is registered under the Investment Company Act of 1940, as amended, as an open-end management investment company.
The fund is an investment company and accordingly follows the
investment company accounting and reporting guidance of the Financial Accounting Standards Board (FASB) Accounting Standards Codification Topic 946 Financial Services - Investment Companies.
(2) Significant Accounting Policies
General — The preparation
of financial statements in conformity with U.S. generally accepted accounting principles requires management to make estimates and assumptions that affect the reported amounts of assets and liabilities, and disclosure of contingent assets and
liabilities at the date of the financial statements and the reported amounts of increases and decreases in net assets from operations during the reporting period. Actual results could differ from those estimates. In the preparation of these
financial statements, management has evaluated subsequent events occurring after the date of the fund’s Statement of Assets and Liabilities through the date that the financial statements were issued.
The fund invests in foreign securities. Investments in foreign securities are vulnerable to the effects of changes in the relative values of the local currency and the U.S. dollar and to the effects of changes in each country’s market,
economic, industrial, political, regulatory, geopolitical, environmental, public health, and other conditions.
Certain of the fund's investments, including its investments in
derivatives, as well as any debt issued by the fund and other contractual arrangements of the fund may be based on reference interest rates such as the London Interbank Offered Rate (“LIBOR”). In 2017, the regulatory authority that
oversees financial services firms in the United Kingdom announced plans to transition away from LIBOR by the end of 2021. In March 2021, the administrator of LIBOR announced the extension of the publication of the more commonly used U.S. dollar
LIBOR settings to the end of June 2023. Although the full impacts of the transition away from LIBOR are not fully known, the transition may result in, among other things, an increase in volatility or illiquidity of the markets for instruments that
currently rely on LIBOR to determine interest rates and this could have an adverse impact on the fund's performance. With respect to the fund's accounting for investments, including its investments in derivatives, as well as any debt issued by the
fund and other contractual arrangements of the fund that undergo reference rate-related modifications as a result of the transition, management will rely upon the relief provided by FASB Codification Topic 848 – Reference Rate Reform (Topic
848). The guidance in Topic 848 permits the fund to disregard the GAAP accounting requirements around certain contract modifications resulting from the LIBOR transition such that for contracts considered in scope, the fund can account for those
modified contracts as a continuation of the existing contracts.
Balance Sheet Offsetting
— The fund's accounting policy with respect to balance sheet offsetting is that, absent an event of default by the counterparty or a termination of the agreement, the International Swaps and Derivatives Association (ISDA) Master Agreement, or
similar agreement, does not result in an offset of reported amounts of financial assets and financial liabilities in the Statement of Assets and Liabilities across
Notes to Financial
Statements - continued
transactions between the fund and the applicable counterparty. The fund's
right to setoff may be restricted or prohibited by the bankruptcy or insolvency laws of the particular jurisdiction to which a specific master netting agreement counterparty is subject. Balance sheet offsetting disclosures, to the extent applicable
to the fund, have been included in the fund’s Significant Accounting Policies note under the captions for each of the fund’s in-scope financial instruments and transactions.
Investment Valuations
— Equity securities, including restricted equity securities, are generally valued at the last sale or official closing price on their primary market or exchange as provided by a third-party pricing
service. Equity securities, for which there were no sales reported that day, are generally valued at the last quoted daily bid quotation on their primary market or exchange as provided by a third-party pricing service. Short-term instruments with a maturity at issuance of 60 days or less may be valued at amortized cost, which approximates market value. Open-end investment companies are
generally valued at net asset value per share. Securities and other assets generally valued on the basis of information from a third-party pricing service may also be valued at a broker/dealer bid
quotation. In determining values, third-party pricing services can utilize both transaction data and market information such as yield, quality, coupon rate, maturity, type of issue, trading characteristics,
and other market data. The values of foreign securities and other assets and liabilities expressed in foreign currencies are converted to U.S. dollars using the mean of bid and asked prices for rates provided
by a third-party pricing service.
The Board of
Trustees has delegated primary responsibility for determining or causing to be determined the value of the fund’s investments (including any fair valuation) to the adviser pursuant to valuation policies and procedures approved by the Board. If
the adviser determines that reliable market quotations are not readily available, investments are valued at fair value as determined in good faith by the adviser in accordance with such procedures under the oversight of the Board of Trustees. Under
the fund’s valuation policies and procedures, market quotations are not considered to be readily available for most types of debt instruments and floating rate loans and many types of derivatives. These investments are generally valued at fair
value based on information from third-party pricing services. In addition, investments may be valued at fair value if the adviser determines that an investment’s value has been materially affected by events occurring after the close of the
exchange or market on which the investment is principally traded (such as foreign exchange or market) and prior to the determination of the fund’s net asset value, or after the halt of trading of a specific security where trading does not
resume prior to the close of the exchange or market on which the security is principally traded. Events that occur after foreign markets close (such as developments in foreign markets and significant movements in the U.S. markets) and prior to the
determination of the fund’s net asset value may be deemed to have a material effect on the value of securities traded in foreign markets. Accordingly, the fund’s foreign equity securities may often be valued at fair value. The adviser
generally relies on third-party pricing services or other information (such as the correlation with price movements of similar securities in the same or other markets; the type, cost and investment characteristics of the security; the business and
financial condition of the issuer; and trading and other market data) to assist in determining whether to fair value and at what value to fair value an investment. The value of an investment for purposes of calculating the fund’s net asset
value can differ depending on the source and method used to determine value. When fair valuation is used, the value of an investment used to determine the fund’s net asset value may differ from quoted or
Notes to Financial
Statements - continued
published prices for the same investment. There can be no assurance that the
fund could obtain the fair value assigned to an investment if it were to sell the investment at the same time at which the fund determines its net asset value per share.
Various inputs are used in determining the value of the fund's
assets or liabilities. These inputs are categorized into three broad levels. In certain cases, the inputs used to measure fair value may fall into different levels of the fair value hierarchy. In such cases, an investment's level within the fair
value hierarchy is based on the lowest level of input that is significant to the fair value measurement. The fund's assessment of the significance of a particular input to the fair value measurement in its entirety requires judgment, and considers
factors specific to the investment. Level 1 includes unadjusted quoted prices in active markets for identical assets or liabilities. Level 2 includes other significant observable market-based inputs (including quoted prices for similar securities,
interest rates, prepayment speed, and credit risk). Level 3 includes unobservable inputs, which may include the adviser's own assumptions in determining the fair value of investments. The following is a summary of the levels used as of July 31, 2021
in valuing the fund's assets or liabilities:
| Financial
Instruments |
Level
1 |
Level
2 |
Level
3 |
Total
|
| Equity
Securities: |
|
|
|
|
| United
States |
$243,836,576
|
$—
|
$—
|
$243,836,576
|
| Switzerland
|
11,777,381
|
—
|
—
|
11,777,381
|
| Canada
|
11,021,567
|
—
|
—
|
11,021,567
|
| Japan
|
—
|
7,614,519
|
—
|
7,614,519
|
| United
Kingdom |
7,496,453
|
—
|
—
|
7,496,453
|
| Taiwan
|
4,685,779
|
—
|
—
|
4,685,779
|
| South
Korea |
—
|
2,838,184
|
—
|
2,838,184
|
| Germany
|
2,309,720
|
—
|
—
|
2,309,720
|
| France
|
1,150,523
|
—
|
—
|
1,150,523
|
| Mutual
Funds |
3,365,969
|
—
|
—
|
3,365,969
|
| Total
|
$285,643,968
|
$10,452,703
|
$—
|
$296,096,671
|
For further information regarding
security characteristics, see the Portfolio of Investments.
Foreign Currency Translation
— Purchases and sales of foreign investments, income, and expenses are converted into U.S. dollars based upon currency exchange rates prevailing on the respective dates of such transactions or on the reporting date for foreign denominated
receivables and payables. Gains and losses attributable to foreign currency exchange rates on sales of securities are recorded for financial statement purposes as net realized gains and losses on investments. Gains and losses attributable to foreign
exchange rate movements on receivables, payables, income and expenses are recorded for financial statement purposes as foreign currency transaction gains and losses. That portion of both realized and unrealized gains and losses on investments that
results from fluctuations in foreign currency exchange rates is not separately disclosed.
Security Loans — Under
its Securities Lending Agency Agreement with the fund, State Street Bank and Trust Company, as lending agent, loans the securities of the fund to certain qualified institutions (the “Borrowers”) approved by the fund. Security loans can
be terminated at the discretion of either the lending agent or the fund and the related securities must be returned within the earlier of the standard trade settlement
Notes to Financial
Statements - continued
period for such securities or within three business days. The loans are
collateralized by cash and/or U.S. Treasury and federal agency obligations in an amount typically at least equal to the market value of the securities loaned. On loans collateralized by cash, the cash collateral is invested in a money market fund.
The market value of the loaned securities is determined at the close of business of the fund and any additional required collateral is delivered to the fund on the next business day. The lending agent provides the fund with indemnification against
Borrower default. In the event of Borrower default, the lending agent will, for the benefit of the fund, either purchase securities identical to those loaned or, when such purchase is commercially impracticable, pay the fund the market value of the
loaned securities. In return, the lending agent assumes the fund's rights to the related collateral. If the collateral value is less than the cost to purchase identical securities, the lending agent is responsible for the shortfall, but only to the
extent that such shortfall is not due to a decline in collateral value resulting from collateral reinvestment for which the fund bears the risk of loss. A portion of the income generated upon investment of the collateral is remitted to the
Borrowers, and the remainder is allocated between the fund and the lending agent. On loans collateralized by U.S. Treasury and/or federal agency obligations, a fee is received from the Borrower, and is allocated between the fund and the lending
agent. Income from securities lending is separately reported in the Statement of Operations. The dividend and interest income earned on the securities loaned is accounted for in the same manner as other dividend and interest income. At July 31,
2021, there were no securities on loan or collateral outstanding.
Indemnifications — Under
the fund's organizational documents, its officers and Trustees may be indemnified against certain liabilities and expenses arising out of the performance of their duties to the fund. Additionally, in the normal course of business, the fund enters
into agreements with service providers that may contain indemnification clauses. The fund's maximum exposure under these agreements is unknown as this would involve future claims that may be made against the fund that have not yet
occurred.
Investment Transactions and Income — Investment transactions are recorded on the trade date. Dividends received in cash are recorded on the ex-dividend date. Certain dividends from foreign securities will be
recorded when the fund is informed of the dividend if such information is obtained subsequent to the ex-dividend date. Dividend payments received in additional securities are recorded on the ex-dividend date in an amount equal to the value of the
security on such date.
The fund may receive
proceeds from litigation settlements. Any proceeds received from litigation involving portfolio holdings are reflected in the Statement of Operations in realized gain/loss if the security has been disposed of by the fund or in unrealized gain/loss
if the security is still held by the fund. Any other proceeds from litigation not related to portfolio holdings are reflected as other income in the Statement of Operations.
Tax Matters and Distributions
— The fund intends to qualify as a regulated investment company, as defined under Subchapter M of the Internal Revenue Code, and to distribute all of its taxable income, including realized capital gains. As a result, no provision for federal
income tax is required. The fund’s federal tax returns, when filed, will remain subject to examination by the Internal Revenue Service for a three year period. Management has analyzed the fund’s tax positions taken on federal and state
tax returns for all open tax years and does not believe that there are any uncertain
Notes to Financial
Statements - continued
tax positions that require recognition of a tax liability. Foreign taxes, if
any, have been accrued by the fund in the accompanying financial statements in accordance with the applicable foreign tax law. Foreign income taxes may be withheld by certain countries in which the fund invests. Additionally, capital gains realized
by the fund on securities issued in or by certain foreign countries may be subject to capital gains tax imposed by those countries.
Distributions to shareholders are recorded on the ex-dividend
date. Income and capital gain distributions are determined in accordance with income tax regulations, which may differ from U.S. generally accepted accounting principles. Certain capital accounts in the financial statements are periodically adjusted
for permanent differences in order to reflect their tax character. These adjustments have no impact on net assets or net asset value per share. Temporary differences which arise from recognizing certain items of income, expense, gain or loss in
different periods for financial statement and tax purposes will reverse at some time in the future.
Book/tax differences primarily relate to wash sale loss
deferrals, treating a portion of the proceeds from redemptions as a distribution for tax purposes, and partnership adjustments.
The tax character of distributions declared to shareholders for
the last two fiscal years is as follows:
| |
Year
ended
7/31/21 |
Year
ended
7/31/20 |
| Ordinary
income (including any short-term capital gains) |
$4,662,077
|
$4,014,800
|
| Long-term
capital gains |
3,358,035
|
679,813
|
| Total
distributions |
$8,020,112
|
$4,694,613
|
The federal tax cost and the tax
basis components of distributable earnings were as follows:
| As
of 7/31/21 |
|
| Cost
of investments |
$210,306,473
|
| Gross
appreciation |
87,852,955
|
| Gross
depreciation |
(2,062,757)
|
| Net
unrealized appreciation (depreciation) |
$
85,790,198 |
| Undistributed
ordinary income |
3,074,549
|
| Undistributed
long-term capital gain |
12,350,829
|
| Other
temporary differences |
1,568,523
|
| Total
distributable earnings (loss) |
$102,784,099
|
Multiple Classes of Shares of
Beneficial Interest — The fund offers multiple classes of shares, which differ in their respective distribution and service fees. The fund's income, realized and unrealized gain (loss), and common expenses are
allocated to shareholders based on the daily net assets of each class. Dividends are declared separately for each class. Differences in per share dividend rates are generally due to differences in separate class expenses. Class B and Class C shares
will convert to
Notes to Financial
Statements - continued
Class A shares approximately eight years after purchase. The fund’s
distributions declared to shareholders as reported in the Statements of Changes in Net Assets are presented by class as follows:
| |
Year
ended
7/31/21 |
|
Year
ended
7/31/20 |
| Class
A |
$5,427,649
|
|
$3,169,345
|
| Class
B |
96,065
|
|
61,646
|
| Class
C |
432,420
|
|
271,014
|
| Class
I |
996,672
|
|
515,942
|
| Class
R1 |
3,722
|
|
1,815
|
| Class
R2 |
6,705
|
|
5,950
|
| Class
R3 |
10,995
|
|
4,398
|
| Class
R4 |
6,774
|
|
2,426
|
| Class
R6 |
1,039,110
|
|
662,077
|
| Total
|
$8,020,112
|
|
$4,694,613
|
(3) Transactions with
Affiliates
Investment Adviser — The fund has an investment advisory agreement with MFS to provide overall investment management and related administrative services and facilities to the fund. The
management fee is computed daily and paid monthly at the following annual rates based on the fund's average daily net assets:
| Up
to $1 billion |
0.50%
|
| In
excess of $1 billion and up to $2.5 billion |
0.475%
|
| In
excess of $2.5 billion |
0.45%
|
MFS has agreed in writing to reduce
its management fee by a specified amount if certain MFS mutual fund assets exceed thresholds agreed to by MFS and the fund's Board of Trustees. For the year ended July 31, 2021, this management fee reduction amounted to $28,995, which is included in
the reduction of total expenses in the Statement of Operations. The management fee incurred for the year ended July 31, 2021 was equivalent to an annual effective rate of 0.49% of the fund's average daily net assets.
The investment adviser has agreed in writing to pay a portion
of the fund’s total annual operating expenses, excluding interest, taxes, extraordinary expenses, brokerage and transaction costs, and investment-related expenses, such that total fund operating expenses do not exceed the following rates
annually of each class’s average daily net assets:
| Classes
|
| A
|
B
|
C
|
I
|
R1
|
R2
|
R3
|
R4
|
R6
|
| 0.89%
|
1.64%
|
1.64%
|
0.64%
|
1.64%
|
1.14%
|
0.89%
|
0.64%
|
0.55%
|
This written agreement will continue
until modified by the fund’s Board of Trustees, but such agreement will continue at least until November 30, 2022. For the year ended July 31, 2021, this reduction amounted to $227,454, which is included in the reduction of total expenses in
the Statement of Operations.
Notes to Financial
Statements - continued
Distributor — MFS Fund
Distributors, Inc. (MFD), a wholly-owned subsidiary of MFS, as distributor, received $54,958 for the year ended July 31, 2021, as its portion of the initial sales charge on sales of Class A shares of the fund.
The Board of Trustees has adopted a distribution plan for
certain share classes pursuant to Rule 12b-1 of the Investment Company Act of 1940.
The fund's distribution plan provides that the fund will pay
MFD for services provided by MFD and financial intermediaries in connection with the distribution and servicing of certain share classes. One component of the plan is a distribution fee paid to MFD and another component of the plan is a service fee
paid to MFD. MFD may subsequently pay all, or a portion, of the distribution and/or service fees to financial intermediaries.
Distribution Plan Fee Table:
| |
Distribution
Fee Rate (d) |
Service
Fee Rate (d) |
Total
Distribution
Plan (d) |
Annual
Effective
Rate (e) |
Distribution
and Service
Fee |
| Class
A |
—
|
0.25%
|
0.25%
|
0.25%
|
$
416,539 |
| Class
B |
0.75%
|
0.25%
|
1.00%
|
1.00%
|
37,561
|
| Class
C |
0.75%
|
0.25%
|
1.00%
|
1.00%
|
165,595
|
| Class
R1 |
0.75%
|
0.25%
|
1.00%
|
1.00%
|
1,486
|
| Class
R2 |
0.25%
|
0.25%
|
0.50%
|
0.50%
|
1,118
|
| Class
R3 |
—
|
0.25%
|
0.25%
|
0.25%
|
1,105
|
| Total
Distribution and Service Fees |
|
|
|
|
$623,404
|
| (d)
|
In
accordance with the distribution plan for certain classes, the fund pays distribution and/or service fees equal to these annual percentage rates of each class’s average daily net assets. The distribution and service fee rates disclosed by
class represent the current rates in effect at the end of the reporting period. Any rate changes, if applicable, are detailed below. |
| (e)
|
The
annual effective rates represent actual fees incurred under the distribution plan for the year ended July 31, 2021 based on each class's average daily net assets. MFD has voluntarily agreed to rebate a portion of each class's 0.25% service fee
attributable to accounts for which there is no financial intermediary specified on the account except for accounts attributable to MFS or its affiliates' seed money. For the year ended July 31, 2021, this rebate amounted to $69 and $106 for Class A
and Class C, respectively, and is included in the reduction of total expenses in the Statement of Operations. |
Certain Class A shares are subject to a contingent deferred
sales charge (CDSC) in the event of a shareholder redemption within 18 months of purchase. Class B shares are subject to a CDSC in the event of a shareholder redemption within six years of purchase. Class C shares are subject to a CDSC in the event
of a shareholder redemption within 12 months of purchase. All contingent deferred sales charges are paid to MFD and during the year ended July 31, 2021, were as follows:
| |
Amount
|
| Class
A |
$1,286
|
| Class
B |
2,001
|
| Class
C |
935
|
Shareholder Servicing Agent — MFS Service Center, Inc. (MFSC), a wholly-owned subsidiary of MFS, receives a fee from the fund for its services as shareholder servicing agent calculated as a percentage of the average daily net assets of the
fund as
Notes to Financial
Statements - continued
determined periodically under the supervision of the fund's Board of Trustees.
For the year ended July 31, 2021, the fee was $26,179, which equated to 0.0106% annually of the fund's average daily net assets. MFSC also receives reimbursement from the fund for out-of-pocket expenses, sub-accounting and other shareholder
servicing costs which may be paid to affiliated and unaffiliated service providers. Class R6 shares do not incur sub-accounting fees. For the year ended July 31, 2021, these out-of-pocket expenses, sub-accounting and other shareholder servicing
costs amounted to $194,875.
Administrator — MFS provides certain financial, legal, shareholder communications, compliance, and other administrative services to the fund. Under an administrative services agreement, the fund reimburses MFS the costs incurred
to provide these services. The fund is charged an annual fixed amount of $17,500 plus a fee based on average daily net assets. The administrative services fee incurred for the year ended July 31, 2021 was equivalent to an annual effective rate of
0.0172% of the fund's average daily net assets.
Trustees’ and Officers’ Compensation — The fund pays compensation to independent Trustees in the form of a retainer, attendance fees, and additional compensation to Board and Committee chairpersons. The fund does not pay compensation directly to
Trustees or officers of the fund who are also officers of the investment adviser, all of whom receive remuneration from MFS for their services to the fund. Certain officers and Trustees of the fund are officers or directors of MFS, MFD, and
MFSC.
Other
— The fund invests in the MFS Institutional Money Market Portfolio which is managed by MFS and seeks current income consistent with preservation of capital and liquidity. This money market fund does not pay a
management fee to MFS but does incur investment and operating costs.
At July 31, 2021, MFS held approximately 54% of the outstanding
shares of Class R1.
The adviser has voluntarily
undertaken to reimburse the fund from its own resources on a quarterly basis for the cost of investment research embedded in the cost of the fund’s securities trades. This agreement may be rescinded at any time. For the year ended July 31,
2021, this reimbursement amounted to $6,647, which is included in “Other” income in the Statement of Operations.
(4) Portfolio Securities
For the year ended July 31, 2021, purchases and sales of
investments, other than short-term obligations, aggregated $118,846,523 and $103,774,479, respectively.
Notes to Financial
Statements - continued
(5) Shares of Beneficial Interest
The fund's Declaration of Trust permits the Trustees to issue
an unlimited number of full and fractional shares of beneficial interest. Transactions in fund shares were as follows:
| |
Year
ended
7/31/21 |
|
Year
ended
7/31/20 |
| |
Shares
|
Amount
|
|
Shares
|
Amount
|
| Shares
sold |
|
|
|
|
|
| Class
A |
1,849,009
|
$33,945,171
|
|
1,664,588
|
$24,235,950
|
| Class
B |
7,502
|
140,379
|
|
6,406
|
94,249
|
| Class
C |
160,824
|
2,952,073
|
|
125,536
|
1,831,768
|
| Class
I |
904,887
|
16,860,998
|
|
589,270
|
8,499,926
|
| Class
R1 |
647
|
12,075
|
|
1,088
|
16,020
|
| Class
R2 |
524
|
9,258
|
|
1,072
|
16,242
|
| Class
R3 |
42,476
|
812,602
|
|
1,057
|
17,301
|
| Class
R4 |
13,759
|
249,326
|
|
737
|
11,052
|
| Class
R6 |
380,858
|
6,932,197
|
|
252,287
|
3,769,744
|
| |
3,360,486
|
$61,914,079
|
|
2,642,041
|
$38,492,252
|
Shares
issued to shareholders
in reinvestment of distributions |
|
|
|
|
|
| Class
A |
308,877
|
$5,418,146
|
|
213,924
|
$3,162,669
|
| Class
B |
5,481
|
95,400
|
|
4,107
|
61,408
|
| Class
C |
24,792
|
431,174
|
|
18,147
|
269,980
|
| Class
I |
54,440
|
961,835
|
|
32,409
|
480,294
|
| Class
R1 |
212
|
3,722
|
|
122
|
1,815
|
| Class
R2 |
384
|
6,705
|
|
391
|
5,950
|
| Class
R3 |
596
|
10,995
|
|
298
|
4,398
|
| Class
R4 |
372
|
6,774
|
|
164
|
2,426
|
| Class
R6 |
54,439
|
962,285
|
|
41,543
|
618,613
|
| |
449,593
|
$7,897,036
|
|
311,105
|
$4,607,553
|
| Shares
reacquired |
|
|
|
|
|
| Class
A |
(1,484,551)
|
$(26,024,199)
|
|
(1,714,286)
|
$(25,130,150)
|
| Class
B |
(52,853)
|
(946,476)
|
|
(78,535)
|
(1,130,659)
|
| Class
C |
(385,328)
|
(6,963,612)
|
|
(350,868)
|
(5,247,621)
|
| Class
I |
(364,047)
|
(6,609,096)
|
|
(735,907)
|
(10,823,431)
|
| Class
R1 |
(93)
|
(1,775)
|
|
(33)
|
(547)
|
| Class
R2 |
(2,808)
|
(48,089)
|
|
(11,681)
|
(196,775)
|
| Class
R3 |
(16,838)
|
(327,666)
|
|
(18)
|
(279)
|
| Class
R4 |
(26)
|
(514)
|
|
(12)
|
(181)
|
| Class
R6 |
(418,513)
|
(7,609,226)
|
|
(377,403)
|
(5,624,404)
|
| |
(2,725,057)
|
$(48,530,653)
|
|
(3,268,743)
|
$(48,154,047)
|
Notes to Financial
Statements - continued
| |
Year
ended
7/31/21 |
|
Year
ended
7/31/20 |
| |
Shares
|
Amount
|
|
Shares
|
Amount
|
| Net
change |
|
|
|
|
|
| Class
A |
673,335
|
$13,339,118
|
|
164,226
|
$2,268,469
|
| Class
B |
(39,870)
|
(710,697)
|
|
(68,022)
|
(975,002)
|
| Class
C |
(199,712)
|
(3,580,365)
|
|
(207,185)
|
(3,145,873)
|
| Class
I |
595,280
|
11,213,737
|
|
(114,228)
|
(1,843,211)
|
| Class
R1 |
766
|
14,022
|
|
1,177
|
17,288
|
| Class
R2 |
(1,900)
|
(32,126)
|
|
(10,218)
|
(174,583)
|
| Class
R3 |
26,234
|
495,931
|
|
1,337
|
21,420
|
| Class
R4 |
14,105
|
255,586
|
|
889
|
13,297
|
| Class
R6 |
16,784
|
285,256
|
|
(83,573)
|
(1,236,047)
|
| |
1,085,022
|
$21,280,462
|
|
(315,597)
|
$(5,054,242)
|
Effective June 1, 2019, purchases of
the fund’s Class B shares are closed to new and existing investors subject to certain exceptions. Please see the fund’s prospectus for details.
(6) Line of Credit
The fund and certain other funds managed by MFS participate in
a $1.25 billion unsecured committed line of credit of which $1 billion is reserved for use by the fund and certain other MFS U.S. funds. The line of credit is provided by a syndicate of banks under a credit agreement. Borrowings may be made for
temporary financing needs. Interest is charged to each fund, based on its borrowings, generally at a rate equal to the highest of one month LIBOR, the Federal Funds Effective Rate and the Overnight Bank Funding Rate, plus an agreed upon spread. A
commitment fee, based on the average daily, unused portion of the committed line of credit, is allocated among the participating funds. In addition, the fund and other funds managed by MFS have established unsecured uncommitted borrowing
arrangements with certain banks for temporary financing needs. Interest is charged to each fund, based on its borrowings, at rates equal to customary reference rates plus an agreed upon spread. For the year ended July 31, 2021, the fund’s
commitment fee and interest expense were $951 and $0, respectively, and are included in “Miscellaneous” expense in the Statement of Operations.
(7) Investments in Affiliated Issuers
An affiliated issuer may be considered one in which the fund
owns 5% or more of the outstanding voting securities, or a company which is under common control. For the purposes of this report, the following were affiliated issuers:
| Affiliated
Issuers |
Beginning
Value |
Purchases
|
Sales
Proceeds |
Realized
Gain
(Loss) |
Change
in
Unrealized
Appreciation or
Depreciation |
Ending
Value |
| MFS
Institutional Money Market Portfolio |
$1,492,382
|
$34,994,968
|
$33,121,232
|
$(95)
|
$(54)
|
$3,365,969
|
Notes to Financial
Statements - continued
| Affiliated
Issuers |
Dividend
Income |
Capital
Gain
Distributions |
| MFS
Institutional Money Market Portfolio |
$1,448
|
$—
|
(8) Impacts of COVID-19
The pandemic related to the global spread of novel coronavirus
disease (COVID-19), which was first detected in December 2019, has resulted in significant disruptions to global business activity and the global economy, as well as the economies of individual countries, the financial performance of individual
companies and sectors, and the securities and commodities markets in general. Multiple surges in cases globally, the availability and widespread adoption of vaccines, and the emergence of variant strains of the virus continue to create uncertainty
as to the future and long-term impacts resulting from the pandemic including impacts to the prices and liquidity of the fund's investments and the fund's performance.
Report of Independent
Registered Public Accounting Firm
To the Shareholders of
MFS Equity Income Fund and the Board of Trustees of MFS Series Trust VII
Opinion on the Financial Statements
We have audited the accompanying statement of assets and
liabilities of MFS Equity Income Fund (the “Fund”) (one of the funds constituting MFS Series Trust VII (the “Trust”)), including the portfolio of investments, as of July 31, 2021, and the related statement of operations for
the year then ended, the statements of changes in net assets for each of the two years in the period then ended, the financial highlights for each of the five years in the period then ended and the related notes (collectively referred to as the
“financial statements”). In our opinion, the financial statements present fairly, in all material respects, the financial position of the Fund (one of the funds constituting MFS Series Trust VII) at July 31, 2021, the results of its
operations for the year then ended, the changes in its net assets for each of the two years in the period then ended and its financial highlights for each of the five years in the period then ended, in conformity with U.S. generally accepted
accounting principles.
Basis for Opinion
These financial statements are the responsibility of the
Trust’s management. Our responsibility is to express an opinion on the Fund’s financial statements based on our audits. We are a public accounting firm registered with the Public Company Accounting Oversight Board (United States)
(“PCAOB”) and are required to be independent with respect to the Trust in accordance with the U.S. federal securities laws and the applicable rules and regulations of the Securities and Exchange Commission and the PCAOB.
We conducted our audits in accordance with the standards of the
PCAOB. Those standards require that we plan and perform the audit to obtain reasonable assurance about whether the financial statements are free of material misstatement, whether due to error or fraud. The Trust is not required to have, nor were we
engaged to perform, an audit of the Trust’s internal control over financial reporting. As part of our audits we are required to obtain an understanding of internal control over financial reporting but not for the purpose of expressing an
opinion on the effectiveness of the Trust’s internal control over financial reporting. Accordingly, we express no such opinion.
Report of Independent
Registered Public Accounting Firm – continued
Our audits included performing procedures to assess the risks
of material misstatement of the financial statements, whether due to error or fraud, and performing procedures that respond to those risks. Such procedures included examining, on a test basis, evidence regarding the amounts and disclosures in the
financial statements. Our procedures included confirmation of securities owned as of July 31, 2021, by correspondence with the custodian and others. Our audits also included evaluating the accounting principles used and significant estimates made by
management, as well as evaluating the overall presentation of the financial statements. We believe that our audits provide a reasonable basis for our opinion.
We have served as
the auditor of one or more MFS investment companies since 1993.
Boston, Massachusetts
September 15, 2021
Trustees and
Officers — Identification and Background
The Trustees and Officers of the Trust, as of September 1,
2021, are listed below, together with their principal occupations during the past five years. (Their titles may have varied during that period.) The address of each Trustee and Officer is 111 Huntington Avenue, Boston, Massachusetts
02199-7618.
| Name,
Age |
|
Position(s)
Held with Fund |
|
Trustee/Officer
Since(h) |
|
Number
of MFS Funds overseen by the Trustee |
|
Principal
Occupations During
the Past Five Years |
|
Other
Directorships During
the Past Five Years (j) |
| INTERESTED
TRUSTEES |
|
|
Robert
J. Manning (k)
(age 57) |
|
Trustee
|
|
February
2004 |
|
136
|
|
Massachusetts
Financial Services Company, Non-Executive Chairman (since January 2021); Director; Chairman of the Board; Executive Chairman (January 2017-2020); Co-Chief Executive Officer (2015-2016) |
|
N/A
|
Michael
W. Roberge (k)
(age 54) |
|
Trustee
|
|
January
2021 |
|
136
|
|
Massachusetts
Financial Services Company, Chairman (since January 2021); Chief Executive Officer (since January 2017); Director; President (until December 2018); Chief Investment Officer (until December 2018); Co-Chief Executive Officer (until December 2016)
|
|
N/A
|
| INDEPENDENT
TRUSTEES |
|
|
John
P. Kavanaugh
(age 66) |
|
Trustee
and Chair of Trustees |
|
January
2009 |
|
136
|
|
Private
investor |
|
N/A
|
Steven
E. Buller
(age 70) |
|
Trustee
|
|
February
2014 |
|
136
|
|
Private
investor |
|
N/A
|
John
A. Caroselli
(age 67) |
|
Trustee
|
|
March
2017 |
|
136
|
|
Private
investor; JC Global Advisors, LLC (management consulting), President (since 2015) |
|
N/A
|
Maureen
R. Goldfarb
(age 66) |
|
Trustee
|
|
January
2009 |
|
136
|
|
Private
investor |
|
N/A
|
Peter
D. Jones
(age 66) |
|
Trustee
|
|
January
2019 |
|
136
|
|
Private
investor |
|
N/A
|
Trustees and Officers -
continued
| Name,
Age |
|
Position(s)
Held with Fund |
|
Trustee/Officer
Since(h) |
|
Number
of MFS Funds overseen by the Trustee |
|
Principal
Occupations During
the Past Five Years |
|
Other
Directorships During
the Past Five Years (j) |
James
W. Kilman, Jr.
(age 60) |
|
Trustee
|
|
January
2019 |
|
136
|
|
Burford
Capital Limited (finance and investment management), Senior Advisor (since May 3, 2021), Chief Financial Officer (2019 - May 2, 2021); KielStrand Capital LLC (family office), Chief Executive Officer (since 2016); Morgan Stanley & Co. (financial
services), Vice Chairman of Investment Banking, Co-Head of Diversified Financials Coverage – Financial Institutions Investment Banking Group (until 2016) |
|
Alpha-En
Corporation, Director (2016-2019) |
Clarence
Otis, Jr.
(age 65) |
|
Trustee
|
|
March
2017 |
|
136
|
|
Private
investor |
|
VF
Corporation, Director; Verizon Communications, Inc., Director; The Travelers Companies, Director |
Maryanne
L. Roepke
(age 65) |
|
Trustee
|
|
May
2014 |
|
136
|
|
Private
investor |
|
N/A
|
Laurie
J. Thomsen
(age 64) |
|
Trustee
|
|
March
2005 |
|
136
|
|
Private
investor |
|
The
Travelers Companies, Director; Dycom Industries, Inc., Director |
| Name,
Age |
|
Position(s)
Held with
Fund |
|
Trustee/Officer
Since(h) |
|
Number
of MFS Funds for which the Person is an Officer |
|
Principal
Occupations During
the Past Five Years |
| OFFICERS
|
|
|
|
|
|
|
|
|
Christopher
R. Bohane (k)
(age 47) |
|
Assistant
Secretary and Assistant Clerk |
|
July
2005 |
|
136
|
|
Massachusetts
Financial Services Company, Senior Vice President and Associate General Counsel |
Kino
Clark (k)
(age 53) |
|
Assistant
Treasurer |
|
January
2012 |
|
136
|
|
Massachusetts
Financial Services Company, Vice President |
Trustees and Officers -
continued
| Name,
Age |
|
Position(s)
Held with
Fund |
|
Trustee/Officer
Since(h) |
|
Number
of MFS Funds for which the Person is an Officer |
|
Principal
Occupations During
the Past Five Years |
John
W. Clark, Jr. (k)
(age 54) |
|
Assistant
Treasurer |
|
April
2017 |
|
136
|
|
Massachusetts
Financial Services Company, Vice President (since March 2017); Deutsche Bank (financial services), Department Head - Treasurer's Office (until February 2017) |
Thomas
H. Connors (k)
(age 61) |
|
Assistant
Secretary and Assistant Clerk |
|
September
2012 |
|
136
|
|
Massachusetts
Financial Services Company, Vice President and Senior Counsel |
David
L. DiLorenzo (k)
(age 53) |
|
President
|
|
July
2005 |
|
136
|
|
Massachusetts
Financial Services Company, Senior Vice President |
Heidi
W. Hardin (k)
(age 54) |
|
Secretary
and Clerk |
|
April
2017 |
|
136
|
|
Massachusetts
Financial Services Company, Executive Vice President and General Counsel (since March 2017); Harris Associates (investment management), General Counsel (until January 2017) |
Brian
E. Langenfeld (k)
(age 48) |
|
Assistant
Secretary and Assistant Clerk |
|
June
2006 |
|
136
|
|
Massachusetts
Financial Services Company, Vice President and Senior Counsel |
Amanda
S. Mooradian (k)
(age 42) |
|
Assistant
Secretary and Assistant Clerk |
|
September
2018 |
|
136
|
|
Massachusetts
Financial Services Company, Assistant Vice President and Senior Counsel |
Susan
A. Pereira (k)
(age 50) |
|
Assistant
Secretary and Assistant Clerk |
|
July
2005 |
|
136
|
|
Massachusetts
Financial Services Company, Vice President and Assistant General Counsel |
Kasey
L. Phillips (k)
(age 50) |
|
Assistant
Treasurer |
|
September
2012 |
|
136
|
|
Massachusetts
Financial Services Company, Vice President |
Matthew
A. Stowe (k)
(age 46) |
|
Assistant
Secretary and Assistant Clerk |
|
October
2014 |
|
136
|
|
Massachusetts
Financial Services Company, Vice President and Assistant General Counsel |
Martin
J. Wolin (k)
(age 53) |
|
Chief
Compliance Officer |
|
July
2015 |
|
136
|
|
Massachusetts
Financial Services Company, Senior Vice President and Chief Compliance Officer |
Trustees and Officers -
continued
| Name,
Age |
|
Position(s)
Held with
Fund |
|
Trustee/Officer
Since(h) |
|
Number
of MFS Funds for which the Person is an Officer |
|
Principal
Occupations During
the Past Five Years |
James
O. Yost (k)
(age 61) |
|
Treasurer
|
|
September
1990 |
|
136
|
|
Massachusetts
Financial Services Company, Senior Vice President |
| (h)
|
Date
first appointed to serve as Trustee/Officer of an MFS Fund. Each Trustee has served continuously since appointment unless indicated otherwise. For the period from December 15, 2004 until February 22, 2005, Mr. Manning served as Advisory Trustee.
From January 2012 through December 2016, Messrs. DiLorenzo and Yost served as Treasurer and Deputy Treasurer of the Funds, respectively. |
| (j)
|
Directorships
or trusteeships of companies required to report to the Securities and Exchange Commission (i.e., “public companies”). |
| (k)
|
“Interested
person” of the Trust within the meaning of the Investment Company Act of 1940 (referred to as the 1940 Act), which is the principal federal law governing investment companies like the fund, as a result of a position with MFS. The address of
MFS is 111 Huntington Avenue, Boston, Massachusetts 02199-7618. |
Each Trustee (other than Messrs. Jones, Kilman and Roberge) has
been elected by shareholders and each Trustee and Officer holds office until his or her successor is chosen and qualified or until his or her earlier death, resignation, retirement or removal. Mr. Roberge became a Trustee of the Funds on January 1,
2021 and Messrs. Jones and Kilman became Trustees of the Funds on January 1, 2019. The Trust does not hold annual meetings for the purpose of electing Trustees, and Trustees are not elected for fixed terms. Under the terms of the Board's retirement
policy, an Independent Trustee shall retire at the end of the calendar year in which he or she reaches the earlier of 75 years of age or 15 years of service on the Board (or, in the case of any Independent Trustee who joined the Board prior to 2015,
20 years of service on the Board).
Messrs. Buller, Kilman
and Otis and Ms. Roepke are members of the Trust’s Audit Committee.
Each of the Interested Trustees and certain Officers hold
comparable officer positions with certain affiliates of MFS.
Trustees and Officers -
continued
The Statement of Additional Information for a Fund includes
further information about the Trustees and is available without charge upon request by calling 1-800-225-2606.
| Investment
Adviser |
Custodian
|
Massachusetts
Financial Services Company
111 Huntington Avenue
Boston, MA 02199-7618 |
State
Street Bank and Trust Company
1 Lincoln Street
Boston, MA 02111-2900 |
| Distributor
|
Independent
Registered Public Accounting Firm |
MFS Fund
Distributors, Inc.
111 Huntington Avenue
Boston, MA 02199-7618 |
Ernst &
Young LLP
200 Clarendon Street
Boston, MA 02116 |
| Portfolio
Manager(s) |
|
Jim
Fallon
Matt Krummell
Jonathan Sage
Jed Stock |
|
Board Review of Investment
Advisory Agreement
MFS Equity Income Fund
The Investment Company Act of 1940 requires that both the full
Board of Trustees and a majority of the non-interested (“independent”) Trustees, voting separately, annually approve the continuation of the Fund’s investment advisory agreement with MFS. The Trustees consider matters bearing on
the Fund and its advisory arrangements at their meetings throughout the year, including a review of performance data at each regular meeting. In addition, the independent Trustees met several times by videoconference (in accordance with Securities
and Exchange Commission relief) over the course of three months beginning in May and ending in July, 2021 (“contract review meetings”) for the specific purpose of considering whether to approve the continuation of the investment advisory
agreement for the Fund and the other investment companies that the Board oversees (the “MFS Funds”). The independent Trustees were assisted in their evaluation of the Fund’s investment advisory agreement by independent legal
counsel, from whom they received separate legal advice and with whom they met separately from MFS during various contract review meetings. The independent Trustees were also assisted in this process by an independent consultant who was retained by
and reported to the independent Trustees.
In connection
with their deliberations regarding the continuation of the investment advisory agreement, the Trustees, including the independent Trustees, considered such information and factors as they believed, in light of the legal advice furnished to them and
their own business judgment, to be relevant. The investment advisory agreement for the Fund was considered separately, although the Trustees also took into account the common interests of all MFS Funds in their review. As described below, the
Trustees considered the nature, quality, and extent of the various investment advisory, administrative, and shareholder services performed by MFS under the existing investment advisory agreement and other arrangements with the Fund.
In connection with their contract review meetings, the Trustees
received and relied upon materials that included, among other items: (i) information provided by Broadridge Financial Solutions, Inc. (“Broadridge”), an independent third party, on the investment performance of the Fund for various time
periods ended December 31, 2020 and the investment performance of a group of funds with substantially similar investment classifications/objectives (the “Broadridge performance universe”), (ii) information provided by Broadridge on the
Fund’s advisory fees and other expenses and the advisory fees and other expenses of comparable funds identified by Broadridge as well as all other funds in the same investment classification/category (the “Broadridge expense group and
universe”), (iii) information provided by MFS on the advisory fees of portfolios of other clients of MFS, including institutional separate accounts and other clients, (iv) information as to whether and to what extent applicable expense
waivers, reimbursements or fee “breakpoints” are observed for the Fund, (v) information regarding MFS’ financial results and financial condition, including MFS’ and certain of its affiliates’ estimated profitability
from services performed for the Fund and the MFS Funds as a whole, and compared to MFS’ institutional business, (vi) MFS’ views regarding the outlook for the mutual fund industry and the strategic business plans of MFS, (vii)
descriptions of various functions performed by MFS for the Funds, such as compliance monitoring and portfolio trading practices, and (viii)
Board Review of Investment
Advisory Agreement - continued
information regarding the overall organization of MFS, including information
about MFS’ senior management and other personnel providing investment advisory, administrative and other services to the Fund and the other MFS Funds. The comparative performance, fee and expense information prepared and provided by Broadridge
was not independently verified and the independent Trustees did not independently verify any information provided to them by MFS.
The Trustees’ conclusion as to the continuation of the
investment advisory agreement was based on a comprehensive consideration of all information provided to the Trustees and not the result of any single factor. Some of the factors that figured particularly in the Trustees’ deliberations are
described below, although individual Trustees may have evaluated the information presented differently from one another, giving different weights to various factors. It is also important to recognize that the fee arrangements for the Fund and other
MFS Funds are the result of years of review and discussion between the independent Trustees and MFS, that certain aspects of such arrangements may receive greater scrutiny in some years than in others, and that the Trustees’ conclusions may be
based, in part, on their consideration of these same arrangements during the course of the year and in prior years.
Based on information provided by Broadridge and MFS, the
Trustees reviewed the Fund’s total return investment performance as well as the Broadridge performance universe over various time periods. The Trustees placed particular emphasis on the total return performance of the Fund’s Class I
shares in comparison to the performance of funds in its Broadridge performance universe over the five-year period ended December 31, 2020, which the Trustees believed was a long enough period to reflect differing market conditions. The total return
performance of the Fund’s Class I shares was in the 1st quintile relative to the other funds in the universe for this five-year period (the 1st quintile being the best performers and the 5th quintile being the worst performers). The total
return performance of the Fund’s Class I shares was in the 1st quintile for each of the one- and three-year periods ended December 31, 2020 relative to the Broadridge performance universe. Because of the passage of time, these performance
results may differ from the performance results for more recent periods, including those shown elsewhere in this report.
In the course of their deliberations, the Trustees took into
account information provided by MFS in connection with the contract review meetings, as well as during investment review meetings conducted with portfolio management personnel during the course of the year regarding the Fund’s performance.
After reviewing these and related factors, the Trustees concluded, within the context of their overall conclusions regarding the investment advisory agreement, that they were satisfied with MFS’ responses and efforts relating to investment
performance.
In assessing the reasonableness of the
Fund’s advisory fee, the Trustees considered, among other information, the Fund’s advisory fee and the total expense ratio of the Fund’s Class I shares as a percentage of average daily net assets and the advisory fee and total
expense ratios of the Broadridge expense group based on information provided by Broadridge. The Trustees considered that MFS currently observes an expense limitation for the Fund, which may not be changed without the Trustees’ approval. The
Trustees also considered that, according to the data provided by
Board Review of Investment
Advisory Agreement - continued
Broadridge (which takes into account any fee reductions or expense limitations
that were in effect during the Fund’s last fiscal year), the Fund’s effective advisory fee rate and total expense ratio were each approximately at the Broadridge expense group median.
The Trustees also considered the advisory fees charged by MFS
to any institutional separate accounts advised by MFS (“separate accounts”) and unaffiliated investment companies for which MFS serves as subadviser (“subadvised funds”) that have comparable investment strategies to the Fund,
if any. In comparing these fees, the Trustees considered information provided by MFS as to the generally broader scope of services provided by MFS to the Fund, as well as the more extensive regulatory burdens imposed on MFS in managing the Fund, in
comparison to separate accounts and subadvised funds. The Trustees also considered the higher demands placed on MFS’ investment personnel and trading infrastructure as a result of the daily cash in-flows and out-flows of the Fund in comparison
to separate accounts.
The Trustees also considered
whether the Fund may benefit from any economies of scale in the management of the Fund in the event of growth in assets of the Fund and/or growth in assets of the MFS Funds as a whole. They noted that the Fund’s advisory fee rate schedule is
subject to contractual breakpoints that reduce the Fund’s advisory fee rate on average daily net assets over $1 billion and $2.5 billion. The Trustees also noted that MFS has agreed in writing to waive a portion of the management fees of
certain MFS Funds, including the Fund, if the total combined assets of certain funds within the MFS Funds’ complex increase above agreed upon thresholds (the “group fee waiver”), enabling the Fund’s shareholders to share in
the benefits from any economies of scale at the complex level. The group fee waiver is reviewed and renewed annually between the Board and MFS. The Trustees concluded that the breakpoints and the group fee waiver were sufficient to allow the Fund to
benefit from economies of scale as its assets and overall complex assets grow.
The Trustees also considered information prepared by MFS
relating to MFS’ costs and profits with respect to the Fund, the MFS Funds considered as a group, and other investment companies and accounts advised by MFS, as well as MFS’ methodologies used to determine and allocate its costs to the
MFS Funds, the Fund and other accounts and products for purposes of estimating profitability.
After reviewing these and other factors described herein, the
Trustees concluded, within the context of their overall conclusions regarding the investment advisory agreement, that the advisory fees charged to the Fund represent reasonable compensation in light of the services being provided by MFS to the
Fund.
In addition, the Trustees considered MFS’
resources and related efforts to continue to retain, attract and motivate capable personnel to serve the Fund. The Trustees also considered current and developing conditions in the financial services industry, including the presence of large and
well-capitalized companies which are spending, and appear to be prepared to continue to spend, substantial sums to engage personnel and to provide services to competing investment companies. In this regard, the Trustees also considered the financial
resources of MFS and its ultimate parent, Sun Life Financial Inc. The Trustees also considered the advantages and possible disadvantages to the Fund of having an adviser that also serves other investment companies as well as other accounts.
Board Review of Investment
Advisory Agreement - continued
The Trustees also considered the nature, quality, cost, and
extent of administrative, transfer agency, and distribution services provided to the Fund by MFS and its affiliates under agreements and plans other than the investment advisory agreement, including any 12b-1 fees the Fund pays to MFS Fund
Distributors, Inc., an affiliate of MFS. The Trustees also considered the nature, extent and quality of certain other services MFS performs or arranges for on the Fund’s behalf, which may include securities lending programs, directed expense
payment programs, class action recovery programs, and MFS’ interaction with third-party service providers, principally custodians and sub-custodians. The Trustees concluded that the various non-advisory services provided by MFS and its
affiliates on behalf of the Fund were satisfactory.
The
Trustees considered so-called “fall-out benefits” to MFS such as reputational value derived from serving as investment manager to the MFS Funds. The Trustees also considered that MFS discontinued its historic practice of obtaining
investment research from portfolio brokerage commissions paid by certain MFS Funds effective January 2018, and directly pays or voluntarily reimburses a Fund, if applicable, for the costs of external research acquired through the use of the
Fund’s portfolio brokerage commissions.
Based on
their evaluation of factors that they deemed to be material, including those factors described above, the Board of Trustees, including the independent Trustees, concluded that the Fund’s investment advisory agreement with MFS should be
continued for an additional one-year period, commencing August 1, 2021.
Statement Regarding
Liquidity Risk Management Program
The fund has adopted
and implemented a liquidity risk management program (the “Program”) as required by Rule 22e-4 under the Investment Company Act of 1940, as amended. The fund’s Board of Trustees (the “Board”) has designated MFS as the
administrator of the Program. The Program is reasonably designed to assess and manage the liquidity risk of the fund. Liquidity risk is the risk that the fund could not meet requests to redeem shares issued by the fund without significant dilution
of remaining investors' interests.
MFS provided a written
report to the Board for consideration at its April 2021 meeting that addressed the operation of the Program and provided an assessment of the adequacy and effectiveness of the Program during the period from January 1, 2020 to December 31, 2020 (the
“Covered Period”). The report concluded that during the Covered Period the Program had operated effectively and had adequately and effectively been implemented to assess and manage the fund’s liquidity risk. MFS also reported that
there were no liquidity events that impacted the fund or its ability to timely meet redemptions without dilution to existing shareholders during the Covered Period.
There can be no assurance that the Program will achieve its
objectives in the future. Further information on liquidity risk, and other principal risks to which an investment in the fund may be subject, can be found in the prospectus.
Proxy
Voting Policies and Information
MFS votes proxies on
behalf of the fund pursuant to proxy voting policies and procedures that are available without charge, upon request, by calling 1-800-225-2606, by visiting mfs.com/proxyvoting, or by visiting the SEC’s
Web site at http://www.sec.gov.
Information regarding how the fund voted proxies relating to
portfolio securities during the most recent twelve-month period ended June 30 is available by August 31 of each year without charge by visiting mfs.com/proxyvoting, or by visiting the SEC’s Web site at http://www.sec.gov.
Quarterly Portfolio Disclosure
The fund files a complete schedule of portfolio holdings with
the SEC for the first and third quarters of each fiscal year as an exhibit to its reports on Form N-PORT. The fund's Form N-PORT reports are available on the SEC's Web site at http://www.sec.gov. A
shareholder can obtain the portfolio holdings report for the first and third quarters of the fund's fiscal year at mfs.com/openendfunds by choosing the fund's name and then scrolling to the
“Resources” section and clicking on the “Prospectus and Reports” tab.
Further Information
From time to time, MFS may post important information about the
fund or the MFS Funds on the MFS Web site (mfs.com). This information is available at https://www.mfs.com/announcements or at
mfs.com/openendfunds by choosing the fund’s name and then scrolling to the “Resources” section and clicking on the “Announcements” tab, if any.
Information About Fund Contracts and Legal Claims
The fund has entered into contractual arrangements with an
investment adviser, administrator, distributor, shareholder servicing agent, 529 program manager (if applicable), and custodian who each provide services to the fund. Unless expressly stated otherwise, shareholders are not parties to, or intended
beneficiaries of these contractual arrangements, and these contractual arrangements are not intended to create any shareholder right to enforce them against the service providers or to seek any remedy under them against the service providers, either
directly or on behalf of the fund.
Under the
Trust’s By-Laws and Declaration of Trust, any claims asserted against or on behalf of the MFS Funds, including claims against Trustees and Officers, must be brought in state and federal courts located within the Commonwealth of
Massachusetts.
Federal Tax Information (unaudited)
The
fund will notify shareholders of amounts for use in preparing 2021 income tax forms in January 2022. The following information is provided pursuant to provisions of the Internal Revenue Code.
The fund designates the maximum amount allowable as qualified
dividend income eligible to be taxed at the same rate as long-term capital gain.
The fund designates $4,255,000 as capital gain dividends paid
during the fiscal year.
For corporate shareholders,
47.89% of the ordinary income dividends paid during the fiscal year qualify for the corporate dividends received deduction.
Federal Tax Information (unaudited) - continued
The fund designates the maximum amount allowable as Section
199A dividends as defined in Proposed Treasury Regulation §1.199A-3(d).
| FACTS
|
WHAT
DOES MFS DO WITH YOUR PERSONAL INFORMATION? |
| Why?
|
Financial
companies choose how they share your personal information. Federal law gives consumers the right to limit some but not all sharing. Federal law also requires us to tell you how we collect, share, and protect your personal information. Please read
this notice carefully to understand what we do. |
| What?
|
The types of
personal information we collect and share depend on the product or service you have with us. This information can include: |
| • Social
Security number and account balances |
| • Account
transactions and transaction history |
| • Checking
account information and wire transfer instructions |
| When
you are no longer our customer, we continue to share your information as described in this notice. |
| How?
|
All
financial companies need to share customers' personal information to run their everyday business. In the section below, we list the reasons financial companies can share their customers' personal information; the reasons MFS chooses to share; and
whether you can limit this sharing. |
Reasons
we can share your
personal information |
Does
MFS share? |
Can
you limit
this sharing? |
For
our everyday business purposes –
such as to process your transactions, maintain your
account(s), respond to court orders and legal
investigations, or report to credit bureaus |
Yes
|
No
|
For
our marketing purposes –
to offer our products and services to you |
No
|
We
don't share |
For
joint marketing with other
financial companies |
No
|
We
don't share |
For
our affiliates' everyday business purposes –
information about your transactions and experiences |
No
|
We
don't share |
For
our affiliates' everyday business purposes –
information about your creditworthiness |
No
|
We
don't share |
| For
nonaffiliates to market to you |
No
|
We
don't share |
| Questions?
|
Call
800-225-2606 or go to mfs.com. |
| Who
we are |
| Who
is providing this notice? |
MFS
Funds, MFS Investment Management, MFS Institutional Advisors, Inc., and MFS Heritage Trust Company. |
| What
we do |
How
does MFS
protect my personal
information? |
To
protect your personal information from unauthorized access and use, we use security measures that comply with federal law. These measures include procedural, electronic, and physical safeguards for the protection of the personal information we
collect about you. |
How
does MFS
collect my personal
information? |
We
collect your personal information, for example, when you |
| • open
an account or provide account information |
| • direct
us to buy securities or direct us to sell your securities |
| • make
a wire transfer |
| We
also collect your personal information from others, such as credit bureaus, affiliates, or other companies. |
| Why
can't I limit all sharing? |
Federal
law gives you the right to limit only |
| • sharing
for affiliates' everyday business purposes – information about your creditworthiness |
| • affiliates
from using your information to market to you |
| • sharing
for nonaffiliates to market to you |
| State
laws and individual companies may give you additional rights to limit sharing. |
| Definitions
|
| Affiliates
|
Companies
related by common ownership or control. They can be financial and nonfinancial companies. |
| •
MFS does not share personal information with affiliates, except for everyday business purposes as described on page one of this notice. |
| Nonaffiliates
|
Companies
not related by common ownership or control. They can be financial and nonfinancial companies. |
| •
MFS does not share with nonaffiliates so they can market to you. |
| Joint
marketing |
A
formal agreement between nonaffiliated financial companies that together market financial products or services to you. |
| •
MFS doesn't jointly market. |
| Other
important information |
| If
you own an MFS product or receive an MFS service in the name of a third party such as a bank or broker-dealer, their privacy policy may apply to you instead of ours. |
Save paper with eDelivery.
MFS® will send you prospectuses, reports, and proxies directly via e-mail so you will get information faster with less mailbox clutter.
To sign up:
1. Go to mfs.com.
2. Log in via MFS® Access.
3. Select eDelivery.
If you own your MFS fund shares through a financial institution
or a retirement plan, MFS® TALK, MFS® Access,
or eDelivery may not be available to you.
CONTACT
WEB SITE
mfs.com
MFS TALK
1-800-637-8255
24 hours a day
ACCOUNT SERVICE AND LITERATURE
Shareholders
1-800-225-2606
Financial advisors
1-800-343-2829
Retirement plan services
1-800-637-1255
MAILING ADDRESS
MFS Service Center, Inc.
P.O. Box 219341
Kansas City, MO 64121-9341
OVERNIGHT MAIL
MFS Service Center, Inc.
Suite 219341
430 W 7th Street
Kansas City, MO 64105-1407
Annual Report
July 31, 2021
MFS® Emerging Markets
Equity Research Fund
MFS® Emerging Markets
Equity Research Fund
|
1
|
|
2
|
|
4
|
|
7
|
|
10
|
|
12
|
|
16
|
|
18
|
|
19
|
|
20
|
|
25
|
|
34
|
|
36
|
|
41
|
|
44
|
|
44
|
|
44
|
|
44
|
|
44
|
|
45
|
The
report is prepared for the general information of shareholders. It is authorized for distribution to prospective investors only when preceded or accompanied by a current prospectus.
NOT FDIC INSURED • MAY LOSE VALUE
• NO BANK GUARANTEE
LETTER FROM THE CEO
Dear Shareholders:
After experiencing dramatic swings in the early days of the
coronavirus pandemic, global equity markets have performed strongly over the past year. Though the speedy development of vaccines brightened the economic and market outlook, uncertainty remains as new variants of the virus appear, and questions
persist over how fast vaccines can be made widely available in the developing world.
Global central banks have taken aggressive
steps to cushion the economic and market fallout related to the virus, and governments are deploying unprecedented levels of fiscal support. Having passed a $1.9 trillion stimulus package in March, the U.S. Congress could approve additional stimulus
later this year, some of it focused on infrastructure. Along with extraordinary government expenditures, pent-up consumer demand fueled a surge in economic activity as coronavirus restrictions were eased, pushing up inflation, at least temporarily.
Markets initially reacted by pushing yields on global government bonds higher, though some of the rate rise has since been corrected. Some emerging market central banks have begun to raise interest rates in recent months while the U.S. Federal
Reserve has started to discuss tapering its bond buying program before the end of 2021.
A spirited debate is underway among investors over whether the
current price pressures will persist or prove to be the temporary result of pandemic-induced bottlenecks. The policy measures put in place to counteract the pandemic's effects have helped build a supportive environment and are encouraging economic
recovery; however, if markets disconnect from fundamentals, they can sow the seeds of instability. As such, recent dramatic increases in speculative trading in cryptocurrencies, special purpose acquisition companies (SPACs), and the like bear
watching.
In the aftermath of the crisis, we could see
societal changes as households, businesses, and governments adjust to a new reality, and any such alterations could affect the investment landscape. For investors, events such as the COVID-19 outbreak demonstrate the importance of having a deep
understanding of company fundamentals, and we have built our global research platform to do just that.
At MFS®, we put our clients’ assets to work responsibly by carefully navigating the increasing complexity of global markets and economies. Guided by our
long-term philosophy and adhering to our commitment to sustainable investing, we tune out the noise and aim to uncover what we believe are the best, most durable investment opportunities in the market. Our unique global investment platform combines
collective expertise, long-term discipline, and thoughtful risk management to create sustainable value for investors.
Respectfully,
Michael W.
Roberge
Chief Executive Officer
MFS Investment Management
September 15, 2021
The opinions expressed in this letter are subject to change
and may not be relied upon for investment advice. No forecasts can be guaranteed.
Portfolio structure
Top ten
holdings
| Taiwan
Semiconductor Manufacturing Co. Ltd. |
8.1%
|
| Tencent
Holdings Ltd. |
6.3%
|
| Samsung
Electronics Co. Ltd. |
5.8%
|
| Reliance
Industries Ltd. |
3.0%
|
| Yum
China Holdings, Inc. |
2.7%
|
| Maruti
Suzuki India Ltd. |
2.6%
|
| Hellenic
Telecommunications Organization S.A. |
2.5%
|
| PT
United Tractors Tbk |
2.5%
|
| Tata
Consultancy Services Ltd. |
2.5%
|
| UPL
Ltd. |
2.5%
|
GICS equity industries (g)
| Information
Technology |
21.1%
|
| Financials
|
19.4%
|
| Communication
Services |
14.8%
|
| Consumer
Discretionary |
12.0%
|
| Consumer
Staples |
10.1%
|
| Energy
|
6.6%
|
| Industrials
|
4.3%
|
| Materials
|
3.9%
|
| Utilities
|
3.1%
|
| Real
Estate |
1.5%
|
| Health
Care |
1.2%
|
Issuer country weightings (x)
| China
|
31.1%
|
| India
|
15.7%
|
| Taiwan
|
12.1%
|
| South
Korea |
10.5%
|
| Hong
Kong |
6.0%
|
| Russia
|
4.7%
|
| United
States |
3.6%
|
| Indonesia
|
3.5%
|
| Mexico
|
2.5%
|
| Other
Countries |
10.3%
|
Currency exposure weightings
(y)
| Hong
Kong Dollar |
25.2%
|
| Indian
Rupee |
15.7%
|
| Taiwan
Dollar |
12.1%
|
| South
Korean Won |
10.5%
|
| Chinese
Renminbi |
9.2%
|
| United
States Dollar |
6.6%
|
| Russian
Ruble |
4.7%
|
| Indonesian
Rupiah |
3.5%
|
| Mexican
Peso |
2.5%
|
| Other
Currencies |
10.0%
|
Portfolio Composition -
continued
| (g)
|
The
Global Industry Classification Standard (GICS®) was developed by and/or is the exclusive property of MSCI, Inc. and S&P Global Market
Intelligence Inc. (“S&P Global Market Intelligence”). GICS is a service mark of MSCI and S&P Global Market Intelligence and has been licensed for use by MFS. MFS has applied its own internal sector/industry classification
methodology for equity securities and non-equity securities that are unclassified by GICS. |
| (x)
|
Represents
the portfolio’s exposure to issuer countries as a percentage of a portfolio’s net assets. For purposes of this presentation, United States includes Cash & Cash Equivalents. |
| (y)
|
Represents
the portfolio’s exposure to a particular currency as a percentage of a portfolio's net assets. For purposes of this presentation, United States Dollar includes Cash & Cash Equivalents. |
Cash & Cash Equivalents includes any cash, investments in
money market funds, short-term securities, and other assets less liabilities. Please see the Statement of Assets and Liabilities for additional information related to the fund’s cash position and other assets and liabilities.
Percentages are based on net assets as of July 31, 2021.
The portfolio is actively managed and current holdings may be
different.
Management Review
Summary of Results
For the period February 23, 2021 to July 31, 2021, Class A
shares of the MFS Emerging Markets Equity Research Fund (fund) provided a total return of -7.80%, at net asset value. This compares with a return of -7.53% for the fund’s benchmark, the MSCI Emerging Markets Index (net div).
Market Environment
The global economy continued to recover from the most unusual
recession in memory as financial markets benefited from massive fiscal and monetary intervention aimed at offsetting the economic effects of the pandemic. In developed markets, vaccine distribution broadened after getting off to a
slower-than-hoped-for start in some locales, though concerns remained that too few people will be inoculated for herd immunity to be achieved, which could result in the emergence of additional variants. On balance, emerging markets experienced
slower rollouts than developed markets amid ongoing vaccine supply constraints.
Around the world, central banks responded quickly and massively
to the crisis with programs to improve liquidity and support markets. These undertakings proved largely successful in helping to restore market function, ease volatility and stimulate a prolonged rebound. In the first half of the period, the US
Federal Reserve adopted a new, flexible average-inflation-targeting framework, which is expected to result in the federal funds rate remaining at low levels longer than under its previous model. Due to relatively manageable external liabilities and
balances of payments in many countries and persistently low inflation, even emerging market countries were able to implement countercyclical policies — a departure from the usual market-dictated response to risk-off crises.
Late in the period, markets grappled with the threat of
resurgent inflation resulting from pandemic-induced production bottlenecks, monumental levels of economic stimulus and the unleashing of post-lockdown pent-up demand. Meanwhile, raw materials prices rebounded strongly on account of the surprising
resilience of the global manufacturing sector during the pandemic. Global sovereign bond yields initially rose in response to these factors before yields moderated in the second half of the period. The vaccine breakthroughs announced in November
2020 saw market leadership shift from a handful of mega-cap technology companies to a broader array of small-cap and value stocks, though growth stocks have performed strongly in recent months. Signs of excess investor enthusiasm were seen in
pockets of the market, such as the “meme stocks” popular with users of online message boards and heavy retail participation in the market for short-dated equity options.
Detractors from Performance
Stock selection within the consumer staples, industrials and
energy sectors detracted from performance relative to the MSCI Emerging Markets Index. Within the consumer staples sector, the fund's overweight positions in dairy products and health drinks producer Inner Mongolia Yili Industrial Group (China) and
distilled Chinese liquor producer Kweichow Moutai (China) weighed on relative returns. The stock price of Inner Mongolia Yili Industrial Group suffered during the reporting period, primarily due to pressure on raw milk prices that were expected to
extend well into 2021. Within the
Management Review -
continued
industrials sector, the fund's overweight position in bus manufacturer
Zhengzhou Yutong Bus (China) held back relative performance. Within the energy sector, the fund's overweight position in heavy equipment retailer PT United Tractors (Indonesia) detracted from relative returns. Shares of PT United Tractors fell as
the company posted weak financial results across the board, with lower profits, weak volumes, erosion of margins due to higher discounts and negative operating leverage.
Elsewhere, the fund's overweight holdings of internet-based,
multiple services company Tencent Holdings (China), investment holdings company Kingsoft Corp. (China), biotech firm Burning Rock Biotech (China) and forest products producer Empresas CMPC (Chile) held back relative returns. The stock price for
Tencent Holdings declined after management reported a slowdown in mobile game and media revenue growth. Non-GAAP operating margins also came in below estimates due to higher-than-expected research and development spending. The company also cited
headwinds for its advertising business for the rest of the year, including tightening regulation on the after-school tutoring industry and potential delays in the release of new popular video dramas. The fund's holding of air conditioner
manufacturer Gree Electric Appliances(b) (China) also weighed on relative performance. The share price of Gree Electric Appliances was negatively impacted by net profit results that were lower than expected as air conditioners, lifestyle appliances
and smart equipment revenue declined. Not owning shares of iron ore and pellets producer Vale (Brazil) further held back relative results.
During the reporting period, the fund’s relative currency
exposure, resulting primarily from differences between the portfolio's and the benchmark's exposures to holdings of securities denominated in foreign currencies, was another detractor from relative performance. All of MFS’ investment decisions
are driven by the fundamentals of each individual opportunity and as such, it is common for our portfolios to have different currency exposure than the benchmark.
Contributors to Performance
The combination of an underweight position and stock selection
in the consumer discretionary sector benefited relative performance over the reporting period. Notably, the timing of the fund's ownership in shares of online and mobile commerce company Alibaba Group Holding(h) (China) boosted relative performance.
The stock price of Alibaba Group Holding declined as the company reported lower-than-expected adjusted earnings due to higher investments in new businesses, such as its Taobao Deals and local services. Avoiding shares of poor-performing e-commerce
platform developer Pinduoduo (China) and after-school tutoring programs provider TAL Education Group (China) further aided relative results.
Stock selection within the information technology sector also
contributed to relative returns. Here, the fund's position in software engineering solutions and technology services provider EPAM Systems(b) and commercial electronic paper technology company E Ink Holdings(b) (Taiwan) bolstered relative
performance. The stock price for EPAM Systems appreciated during the reporting period, after the company reported financial results ahead of consensus expectations, COVID-19 challenges began to subside, and nearly all segments showed material
revenue acceleration, with the Financial Services and Travel & Consumer segments being the leaders.
Management Review -
continued
Security selection within the communication services sector was
another area of relative strength, led by the fund's overweight holding of telecommunication services provider Hellenic Telecommunications Organization (Greece), and avoiding shares of underperforming internet search provider Baidu (China).
Stocks in other sectors that also supported relative results
included the fund's overweight holdings of agrochemical company UPL (India), gas distributor China Resources Gas Group (Hong Kong) and financial services firm Chailease Holding (China). The stock price of UPL advanced during the reporting period
after the company reported solid financial results, primarily due to strong revenue growth in India and both the European Union and Latin American regions.
Respectfully,
Portfolio Manager(s)
Sanjay Natarajan and Deividas Seferis
| (b)
|
Security is not a
benchmark constituent. |
| (h)
|
Security was not held in
the portfolio at period end. |
The
views expressed in this report are those of the portfolio manager(s) only through the end of the period of the report as stated on the cover and do not necessarily reflect the views of MFS or any other person in the MFS organization. These views are
subject to change at any time based on market or other conditions, and MFS disclaims any responsibility to update such views. These views may not be relied upon as investment advice or an indication of trading intent on behalf of any MFS portfolio.
References to specific securities are not recommendations of such securities, and may not be representative of any MFS portfolio’s current or future investments.
Performance Summary THROUGH
7/31/21
The following chart illustrates a representative
class of the fund’s historical performance in comparison to its benchmark(s). Performance results include the deduction of the maximum applicable sales charge and reflect the percentage change in net asset value, including reinvestment of
dividends and capital gains distributions. The performance of other share classes will be greater than or less than that of the class depicted below. Benchmarks are unmanaged and may not be invested in directly. Benchmark returns do not reflect
sales charges, commissions or expenses. (See Notes to Performance Summary.)
Performance data shown represents past performance and is no
guarantee of future results. Investment return and principal value fluctuate so your shares, when sold, may be worth more or less than the original cost; current performance may be lower or higher than quoted. The performance shown does not reflect
the deduction of taxes, if any, that a shareholder would pay on fund distributions or the redemption of fund shares.
Growth of a Hypothetical $10,000 Investment (t)
Performance Summary -
continued
Total Returns through 7/31/21
Average annual without sales charge
| Share
Class |
Class
inception date |
Life
(t) |
| A
|
2/23/21
|
(7.80)%
|
| C
|
2/23/21
|
(8.10)%
|
| I
|
2/23/21
|
(7.70)%
|
| R1
|
2/23/21
|
(8.10)%
|
| R2
|
2/23/21
|
(7.90)%
|
| R3
|
2/23/21
|
(7.80)%
|
| R4
|
2/23/21
|
(7.70)%
|
| R6
|
2/23/21
|
(7.70)%
|
Comparative benchmark(s)
| |
|
| MSCI
Emerging Markets Index (net div) (f) |
(7.53)%
|
Average annual with sales
charge
| |
|
A
With Initial Sales Charge (5.75%) |
(13.10)%
|
C
With CDSC (1% for 12 months) (v) |
(9.02)%
|
CDSC – Contingent Deferred
Sales Charge.
Class I, R1, R2, R3, R4, and R6 shares do
not have a sales charge.
| (f)
|
Source:
FactSet Research Systems Inc. |
| (t)
|
For the
period from the class inception date through the stated period end. (See Notes to Performance Summary.) |
| (v)
|
Assuming
redemption at the end of the applicable period. |
Benchmark Definition(s)
MSCI Emerging Markets Index(e) (net div) - a market capitalization-weighted index that is designed to measure equity market performance in the global emerging markets.
It is not possible to invest directly in an index.
| (e)
|
Morgan
Stanley Capital International (“MSCI”) makes no express or implied warranties or representations and shall have no liability whatsoever with respect to any MSCI data contained herein. The MSCI data may not be further redistributed or
used as a basis for other indices or any securities or financial products. This report is not approved, reviewed, or produced by MSCI. |
Notes to Performance Summary
Average annual total return represents the average annual
change in value for each share class for the periods presented. Life returns are presented where the share class has less than 10 years of performance history and represent the average annual total return from the class inception date to the stated
period end date.
Performance results reflect any
applicable expense subsidies and waivers in effect during the periods shown. Without such subsidies and waivers the fund's performance results would be less favorable. Please see the prospectus and financial statements for complete details.
Performance Summary -
continued
Performance results do not include adjustments made for
financial reporting purposes in accordance with U.S. generally accepted accounting principles and may differ from amounts reported in the financial highlights.
From time to time the fund may receive proceeds from litigation
settlements, without which performance would be lower.
Expense Table
Fund expenses borne by the shareholders during the period,
February 23, 2021 through July 31, 2021
As a
shareholder of the fund, you incur two types of costs: (1) transaction costs, including sales charges (loads) on certain purchase or redemption payments, and (2) ongoing costs, including management fees; distribution and service (12b-1) fees; and
other fund expenses. This example is intended to help you understand your ongoing costs (in dollars) of investing in the fund and to compare these costs with the ongoing costs of investing in other mutual funds.
The example is based on an investment of $1,000 invested at the
beginning of the period and held for the entire period February 23, 2021 through July 31, 2021.
Actual Expenses
The first line for each share class in the following table
provides information about actual account values and actual expenses. You may use the information in this line, together with the amount you invested, to estimate the expenses that you paid over the period. Simply divide your account value by $1,000
(for example, an $8,600 account value divided by $1,000 = 8.6), then multiply the result by the number in the first line under the heading entitled “Expenses Paid During Period” to estimate the expenses you paid on your account during
this period.
Hypothetical Example for Comparison
Purposes
The second line for each share class in the
following table provides information about hypothetical account values and hypothetical expenses based on the fund’s actual expense ratio and an assumed rate of return of 5% per year before expenses, which is not the fund’s actual
return. The hypothetical account values and expenses may not be used to estimate the actual ending account balance or expenses you paid for the period. You may use this information to compare the ongoing costs of investing in the fund and other
funds. To do so, compare this 5% hypothetical example with the 5% hypothetical examples that appear in the shareholder reports of the other funds.
Please note that the expenses shown in the table are meant to
highlight your ongoing costs only and do not reflect any transactional costs, such as sales charges (loads). Therefore, the second line for each share class in the table is useful in comparing ongoing costs only, and will not help you determine the
relative total costs of owning different funds. In addition, if these transactional costs were included, your costs would have been higher.
Expense Table -
continued
Share
Class |
|
Annualized
Expense
Ratio |
Beginning
Account Value
2/23/21 |
Ending
Account Value
7/31/21 |
Expenses
Paid During
Period (p)
2/23/21-7/31/21 |
| A
|
Actual
|
1.25%
|
$1,000.00
|
$922.00
|
$5.23
|
| Hypothetical
(h) |
1.25%
|
$1,000.00
|
$1,018.60
|
$6.26
|
| C
|
Actual
|
2.00%
|
$1,000.00
|
$919.00
|
$8.36
|
| Hypothetical
(h) |
2.00%
|
$1,000.00
|
$1,014.88
|
$9.99
|
| I
|
Actual
|
1.00%
|
$1,000.00
|
$923.00
|
$4.19
|
| Hypothetical
(h) |
1.00%
|
$1,000.00
|
$1,019.84
|
$5.01
|
| R1
|
Actual
|
2.00%
|
$1,000.00
|
$919.00
|
$8.36
|
| Hypothetical
(h) |
2.00%
|
$1,000.00
|
$1,014.88
|
$9.99
|
| R2
|
Actual
|
1.50%
|
$1,000.00
|
$921.00
|
$6.28
|
| Hypothetical
(h) |
1.50%
|
$1,000.00
|
$1,017.36
|
$7.50
|
| R3
|
Actual
|
1.25%
|
$1,000.00
|
$922.00
|
$5.23
|
| Hypothetical
(h) |
1.25%
|
$1,000.00
|
$1,018.60
|
$6.26
|
| R4
|
Actual
|
1.00%
|
$1,000.00
|
$923.00
|
$4.19
|
| Hypothetical
(h) |
1.00%
|
$1,000.00
|
$1,019.84
|
$5.01
|
| R6
|
Actual
|
0.99%
|
$1,000.00
|
$923.00
|
$4.15
|
| Hypothetical
(h) |
0.99%
|
$1,000.00
|
$1,019.89
|
$4.96
|
| (h)
|
5% class return per year
before expenses. |
(p) “Expenses
Paid During Period” are equal to each class’s annualized expense ratio, as shown above, multiplied by the average account value over the period, multiplied by 159/365 for Actual Expenses (for Hypothetical Expenses, multiplied by 181/365
to reflect the one-half year period). Expenses paid do not include any applicable sales charges (loads). If these transaction costs had been included, your costs would have been higher. For actual expenses paid, the calculation is based on the
period from the commencement of the fund's investment operations, February 23, 2021, through July 31, 2021. For hypothetical expenses paid, it is assumed that the fund was in existence for the entire six month period ended July 31, 2021.
Portfolio of
Investments
7/31/21
The Portfolio of Investments is a complete list of all
securities owned by your fund. It is categorized by broad-based asset classes.
| Issuer
|
|
|
Shares/Par
|
Value
($) |
| Common
Stocks – 98.0% |
| Alcoholic
Beverages – 3.8% |
|
| China
Resources Beer Holdings Co. Ltd. |
|
4,000 |
$
30,004 |
| Jiangsu
Yanghe Brewery JSC Ltd. |
|
900 |
22,721 |
| Kweichow
Moutai Co. Ltd. |
|
100 |
26,005 |
| |
|
|
|
$78,730 |
| Automotive
– 8.3% |
|
| BYD
Co. Ltd. |
|
1,000 |
$
30,755 |
| Maruti
Suzuki India Ltd. |
|
561 |
52,739 |
| PT
United Tractors Tbk |
|
37,500
|
50,765 |
| Zhengzhou
Yutong Bus Co. Ltd., “A” |
|
20,700
|
36,390 |
| |
|
|
|
$170,649 |
| Biotechnology
– 0.8% |
|
| Hugel,
Inc. (a) |
|
80 |
$
16,609 |
| Brokerage
& Asset Managers – 3.8% |
|
| B3
S.A. - Brasil Bolsa Balcao |
|
6,700 |
$
19,618 |
| Hong
Kong Exchanges & Clearing Ltd. |
|
500 |
31,913 |
| Moscow
Exchange MICEX-RTS PJSC |
|
11,203
|
26,517 |
| |
|
|
|
$78,048 |
| Business
Services – 2.5% |
|
| Tata
Consultancy Services Ltd. |
|
1,192 |
$
50,737 |
| Chemicals
– 2.5% |
|
| UPL
Ltd. |
|
4,644 |
$
50,697 |
| Computer
Software – 5.2% |
|
| Kingsoft
Corp. Ltd. |
|
3,000 |
$
13,975 |
| Naver
Corp. |
|
118 |
44,556 |
| NetEase.com,
Inc., ADR |
|
475 |
48,549 |
| |
|
|
|
$107,080 |
| Computer
Software - Systems – 7.5% |
|
| EPAM
Systems, Inc. (a) |
|
61 |
$
34,148 |
| Samsung
Electronics Co. Ltd. |
|
1,748 |
119,535 |
| |
|
|
|
$153,683 |
| Construction
– 3.6% |
|
| Gree
Electric Appliances, Inc., “A” |
|
6,400 |
$
47,086 |
| Techtronic
Industries Co. Ltd. |
|
1,500 |
26,810 |
| |
|
|
|
$73,896 |
Portfolio of
Investments – continued
| Issuer
|
|
|
Shares/Par
|
Value
($) |
| Common
Stocks – continued |
| Consumer
Products – 1.7% |
|
| Amorepacific
Corp. |
|
188 |
$
36,202 |
| Consumer
Services – 1.2% |
|
| 51job,
Inc., ADR (a) |
|
346 |
$
24,919 |
| Electrical
Equipment – 1.3% |
|
| Advantech
Co. Ltd. |
|
2,000 |
$
26,075 |
| Electronics
– 9.2% |
|
| E
Ink Holdings, Inc. |
|
8,000 |
$
23,057 |
| Taiwan
Semiconductor Manufacturing Co. Ltd. |
|
8,000 |
166,581 |
| |
|
|
|
$189,638 |
| Energy
- Independent – 3.0% |
|
| Reliance
Industries Ltd. |
|
2,253 |
$
61,621 |
| Energy
- Integrated – 1.1% |
|
| LUKOIL
PJSC, ADR |
|
264 |
$
22,625 |
| Food
& Beverages – 2.2% |
|
| Gruma
S.A.B. de C.V. |
|
2,145 |
$
23,208 |
| Inner
Mongolia Yili Industrial Group Co. Ltd., “A” |
|
4,400 |
22,756 |
| |
|
|
|
$45,964 |
| Forest
& Paper Products – 0.7% |
|
| Empresas
CMPC S.A. |
|
6,832 |
$
14,764 |
| General
Merchandise – 2.3% |
|
| BIM
Birlesik Magazalar A.S. |
|
2,525 |
$
18,999 |
| Wal-Mart
de Mexico S.A.B. de C.V. |
|
8,602 |
28,356 |
| |
|
|
|
$47,355 |
| Insurance
– 2.5% |
|
| AIA
Group Ltd. |
|
2,800 |
$
33,545 |
| Ping
An Insurance (Group) Co. of China Ltd., “H” |
|
2,000 |
17,539 |
| |
|
|
|
$51,084 |
| Internet
– 7.2% |
|
| Allegro.EU
S.A. (a) |
|
1,133 |
$
19,440 |
| Tencent
Holdings Ltd. |
|
2,100 |
129,440 |
| |
|
|
|
$148,880 |
| Major
Banks – 3.0% |
|
| China
Construction Bank Corp. |
|
48,000
|
$
33,478 |
| SBI
Cards & Payment Services Ltd. (a) |
|
2,056 |
28,578 |
| |
|
|
|
$62,056 |
Portfolio of
Investments – continued
| Issuer
|
|
|
Shares/Par
|
Value
($) |
| Common
Stocks – continued |
| Medical
& Health Technology & Services – 0.4% |
|
| Burning
Rock Biotech Ltd., ADR (a) |
|
402 |
$
9,158 |
| Natural
Gas - Distribution – 2.4% |
|
| China
Resources Gas Group Ltd. |
|
8,000 |
$
49,311 |
| Other
Banks & Diversified Financials – 9.6% |
|
| Bank
Central Asia Tbk PT |
|
10,600
|
$
21,878 |
| Chailease
Holding Co. Ltd. |
|
4,000 |
33,113 |
| Credicorp
Ltd. (a) |
|
68 |
6,865 |
| HDFC
Bank Ltd. |
|
2,061 |
39,659 |
| Komercni
Banka A.S. (a) |
|
665 |
24,715 |
| Kotak
Mahindra Bank Ltd. (a) |
|
1,041 |
23,228 |
| Sberbank
of Russia PJSC |
|
7,922 |
33,176 |
| TCS
Group Holding PLC |
|
184 |
15,220 |
| |
|
|
|
$197,854 |
| Real
Estate – 1.5% |
|
| ESR
Cayman Ltd. (a) |
|
8,800 |
$
30,914 |
| Restaurants
– 2.7% |
|
| Yum
China Holdings, Inc. |
|
896 |
$
55,722 |
| Special
Products & Services – 0.5% |
|
| Tisco
Financial Group PCL |
|
4,200 |
$
11,245 |
| Specialty
Chemicals – 0.8% |
|
| Asian
Paints Ltd. |
|
396 |
$
15,743 |
| Specialty
Stores – 2.0% |
|
| Meituan,
“B” (a) |
|
1,500 |
$
41,500 |
| Telecommunications
- Wireless – 1.5% |
|
| Advanced
Info Service Public Co. Ltd. |
|
5,700 |
$
31,129 |
| Telephone
Services – 2.5% |
|
| Hellenic
Telecommunications Organization S.A. |
|
2,784 |
$
50,793 |
| Utilities
- Electric Power – 0.7% |
|
| Energisa
S.A., IEU |
|
1,700 |
$
13,954 |
| Total
Common Stocks (Identified Cost, $2,201,618) |
|
$
2,018,635 |
Portfolio of
Investments – continued
| Issuer
|
|
|
Shares/Par
|
Value
($) |
| Investment
Companies (h) – 3.3% |
| Money
Market Funds – 3.3% |
|
| MFS
Institutional Money Market Portfolio, 0.03% (v) (Identified Cost, $67,408) |
|
|
67,408
|
$
67,408 |
| |
| |
| Other
Assets, Less Liabilities – (1.3)% |
|
(27,759) |
| Net
Assets – 100.0% |
$
2,058,284 |
| (a)
|
Non-income
producing security. |
|
|
|
| (h)
|
An
affiliated issuer, which may be considered one in which the fund owns 5% or more of the outstanding voting securities, or a company which is under common control. At period end, the aggregate values of the fund's investments in affiliated issuers
and in unaffiliated issuers were $67,408 and $2,018,635, respectively. |
|
|
|
| (v)
|
Affiliated
issuer that is available only to investment companies managed by MFS. The rate quoted for the MFS Institutional Money Market Portfolio is the annualized seven-day yield of the fund at period end. |
|
|
|
| The
following abbreviations are used in this report and are defined: |
| ADR
|
American
Depositary Receipt |
| IEU
|
International
Equity Unit |
| PCL
|
Public
Company Limited |
See Notes to Financial
Statements
Financial Statements
Statement of Assets and Liabilities
At 7/31/21
This statement represents your fund’s balance sheet,
which details the assets and liabilities comprising the total value of the fund.
| Assets
|
|
| Investments
in unaffiliated issuers, at value (identified cost, $2,201,618) |
$2,018,635
|
| Investments
in affiliated issuers, at value (identified cost, $67,408) |
67,408
|
| Cash
|
6
|
| Foreign
currency, at value (identified cost, $196) |
196
|
| Receivables
for |
|
| Dividends
|
4,401
|
| Receivable
from investment adviser |
16,038
|
| Total
assets |
$2,106,684
|
| Liabilities
|
|
| Payable
to affiliates |
|
| Administrative
services fee |
$144
|
| Shareholder
servicing costs |
81
|
| Distribution
and service fees |
14
|
| Payable
for independent Trustees' compensation |
14
|
| Deferred
country tax expense payable |
2,434
|
| Accrued
expenses and other liabilities |
45,713
|
| Total
liabilities |
$48,400
|
| Net
assets |
$2,058,284
|
| Net
assets consist of |
|
| Paid-in
capital |
$2,229,873
|
| Total
distributable earnings (loss) |
(171,589)
|
| Net
assets |
$2,058,284
|
| Shares
of beneficial interest outstanding |
223,130
|
Statement of Assets and
Liabilities – continued
| |
Net
assets |
Shares
outstanding |
Net
asset value
per share (a) |
| Class
A |
$165,692
|
17,975
|
$9.22
|
| Class
C |
46,833
|
5,098
|
9.19
|
| Class
I |
46,665
|
5,057
|
9.23
|
| Class
R1 |
45,938
|
5,000
|
9.19
|
| Class
R2 |
46,038
|
5,000
|
9.21
|
| Class
R3 |
46,088
|
5,000
|
9.22
|
| Class
R4 |
46,138
|
5,000
|
9.23
|
| Class
R6 |
1,614,892
|
175,000
|
9.23
|
| (a)
|
Maximum
offering price per share was equal to the net asset value per share for all share classes, except for Class A, for which the maximum offering price per share was $9.78 [100 / 94.25 x $9.22]. On sales of $50,000 or more, the maximum offering price
of Class A shares is reduced. A contingent deferred sales charge may be imposed on redemptions of Class A and Class C shares. Redemption price per share was equal to the net asset value per share for Classes I, R1, R2, R3, R4, and R6.
|
See Notes to Financial Statements
Financial Statements
Statement of Operations
Year ended 7/31/21 (c)
This statement describes how much your fund earned in
investment income and accrued in expenses. It also describes any gains and/or losses generated by fund operations.
| Net
investment income (loss) |
|
| Income
|
|
| Dividends
|
$23,028
|
| Dividends
from affiliated issuers |
6
|
| Foreign
taxes withheld |
(2,755)
|
| Total
investment income |
$20,279
|
| Expenses
|
|
| Management
fee |
$8,782
|
| Distribution
and service fees |
746
|
| Shareholder
servicing costs |
189
|
| Administrative
services fee |
7,624
|
| Independent
Trustees' compensation |
1,728
|
| Custodian
fee |
10,428
|
| Shareholder
communications |
1,258
|
| Audit
and tax fees |
36,707
|
| Legal
fees |
106
|
| Registration
fees |
12,153
|
| Form
N-CEN/N-PORT preparation fees |
4,900
|
| Miscellaneous
|
3,960
|
| Total
expenses |
$88,581
|
| Fees
paid indirectly |
(35)
|
| Reduction
of expenses by investment adviser |
(78,664)
|
| Net
expenses |
$9,882
|
| Net
investment income (loss) |
$10,397
|
| Realized
and unrealized gain (loss) |
| Realized
gain (loss) (identified cost basis) |
|
| Unaffiliated
issuers (net of $1,109 country tax) |
$5,048
|
| Foreign
currency |
(2,072)
|
| Net
realized gain (loss) |
$2,976
|
| Change
in unrealized appreciation or depreciation |
|
| Unaffiliated
issuers (net of $2,392 increase in deferred country tax) |
$(185,375)
|
| Translation
of assets and liabilities in foreign currencies |
5
|
| Net
unrealized gain (loss) |
$(185,370)
|
| Net
realized and unrealized gain (loss) |
$(182,394)
|
| Change
in net assets from operations |
$(171,997)
|
| (c)
For the period from the commencement of the fund’s investment operations, February 23, 2021, through the stated period end. |
|
See Notes to Financial Statements
Financial Statements
Statement of Changes in Net Assets
This statement describes the increases and/or decreases in net
assets resulting from operations, any distributions, and any shareholder transactions.
| |
Year
ended |
| |
7/31/21
(c) |
| Change
in net assets |
|
| From
operations |
|
| Net
investment income (loss) |
$10,397
|
| Net
realized gain (loss) |
2,976
|
| Net
unrealized gain (loss) |
(185,370)
|
| Change
in net assets from operations |
$(171,997)
|
| Change
in net assets from fund share transactions |
$2,230,281
|
| Total
change in net assets |
$2,058,284
|
| Net
assets |
|
| At
beginning of period |
—
|
| At
end of period |
$2,058,284
|
| (c)
|
For
the period from the commencement of the fund’s investment operations, February 23, 2021, through the stated period end. |
See Notes to Financial Statements
Financial
Statements
Financial Highlights
The financial highlights table is intended to help you
understand the fund's financial performance for the past 5 years (or life of a particular share class, if shorter). Certain information reflects financial results for a single fund share. The total returns in the table represent the rate that an
investor would have earned (or lost) on an investment in the fund share class (assuming reinvestment of all distributions) held for the entire period.
| Class
A |
Year
ended |
| |
7/31/21(c)
|
| Net
asset value, beginning of period |
$10.00
|
| Income
(loss) from investment operations |
| Net
investment income (loss) (d) |
$0.04
|
| Net
realized and unrealized gain (loss) |
(0.82)
|
| Total
from investment operations |
$(0.78)
|
| Net
asset value, end of period (x) |
$9.22
|
| Total
return (%) (r)(s)(t)(x) |
(7.80)(n)
|
Ratios
(%) (to average net assets)
and Supplemental data: |
| Expenses
before expense reductions (f) |
9.75(a)
|
| Expenses
after expense reductions (f) |
1.25(a)
|
| Net
investment income (loss) |
0.97(a)
|
| Portfolio
turnover |
17(n)
|
| Net
assets at end of period (000 omitted) |
$166
|
See Notes to Financial
Statements
Financial
Highlights – continued
| Class
C |
Year
ended |
| |
7/31/21(c)
|
| Net
asset value, beginning of period |
$10.00
|
| Income
(loss) from investment operations |
| Net
investment income (loss) (d) |
$0.01
|
| Net
realized and unrealized gain (loss) |
(0.82)
|
| Total
from investment operations |
$(0.81)
|
| Net
asset value, end of period (x) |
$9.19
|
| Total
return (%) (r)(s)(t)(x) |
(8.10)(n)
|
Ratios
(%) (to average net assets)
and Supplemental data: |
| Expenses
before expense reductions (f) |
10.51(a)
|
| Expenses
after expense reductions (f) |
2.00(a)
|
| Net
investment income (loss) |
0.20(a)
|
| Portfolio
turnover |
17(n)
|
| Net
assets at end of period (000 omitted) |
$47
|
| Class
I |
Year
ended |
| |
7/31/21(c)
|
| Net
asset value, beginning of period |
$10.00
|
| Income
(loss) from investment operations |
| Net
investment income (loss) (d) |
$0.05
|
| Net
realized and unrealized gain (loss) |
(0.82)
|
| Total
from investment operations |
$(0.77)
|
| Net
asset value, end of period (x) |
$9.23
|
| Total
return (%) (r)(s)(t)(x) |
(7.70)(n)
|
Ratios
(%) (to average net assets)
and Supplemental data: |
| Expenses
before expense reductions (f) |
9.51(a)
|
| Expenses
after expense reductions (f) |
1.00(a)
|
| Net
investment income (loss) |
1.20(a)
|
| Portfolio
turnover |
17(n)
|
| Net
assets at end of period (000 omitted) |
$47
|
See Notes to Financial
Statements
Financial
Highlights – continued
| Class
R1 |
Year
ended |
| |
7/31/21(c)
|
| Net
asset value, beginning of period |
$10.00
|
| Income
(loss) from investment operations |
| Net
investment income (loss) (d) |
$0.01
|
| Net
realized and unrealized gain (loss) |
(0.82)
|
| Total
from investment operations |
$(0.81)
|
| Net
asset value, end of period (x) |
$9.19
|
| Total
return (%) (r)(s)(t)(x) |
(8.10)(n)
|
Ratios
(%) (to average net assets)
and Supplemental data: |
| Expenses
before expense reductions (f) |
10.51(a)
|
| Expenses
after expense reductions (f) |
2.00(a)
|
| Net
investment income (loss) |
0.21(a)
|
| Portfolio
turnover |
17(n)
|
| Net
assets at end of period (000 omitted) |
$46
|
| Class
R2 |
Year
ended |
| |
7/31/21(c)
|
| Net
asset value, beginning of period |
$10.00
|
| Income
(loss) from investment operations |
| Net
investment income (loss) (d) |
$0.03
|
| Net
realized and unrealized gain (loss) |
(0.82)
|
| Total
from investment operations |
$(0.79)
|
| Net
asset value, end of period (x) |
$9.21
|
| Total
return (%) (r)(s)(t)(x) |
(7.90)(n)
|
Ratios
(%) (to average net assets)
and Supplemental data: |
| Expenses
before expense reductions (f) |
10.01(a)
|
| Expenses
after expense reductions (f) |
1.50(a)
|
| Net
investment income (loss) |
0.70(a)
|
| Portfolio
turnover |
17(n)
|
| Net
assets at end of period (000 omitted) |
$46
|
See Notes to Financial
Statements
Financial
Highlights – continued
| Class
R3 |
Year
ended |
| |
7/31/21(c)
|
| Net
asset value, beginning of period |
$10.00
|
| Income
(loss) from investment operations |
| Net
investment income (loss) (d) |
$0.04
|
| Net
realized and unrealized gain (loss) |
(0.82)
|
| Total
from investment operations |
$(0.78)
|
| Net
asset value, end of period (x) |
$9.22
|
| Total
return (%) (r)(s)(t)(x) |
(7.80)(n)
|
Ratios
(%) (to average net assets)
and Supplemental data: |
| Expenses
before expense reductions (f) |
9.76(a)
|
| Expenses
after expense reductions (f) |
1.25(a)
|
| Net
investment income (loss) |
0.95(a)
|
| Portfolio
turnover |
17(n)
|
| Net
assets at end of period (000 omitted) |
$46
|
| Class
R4 |
Year
ended |
| |
7/31/21(c)
|
| Net
asset value, beginning of period |
$10.00
|
| Income
(loss) from investment operations |
| Net
investment income (loss) (d) |
$0.05
|
| Net
realized and unrealized gain (loss) |
(0.82)
|
| Total
from investment operations |
$(0.77)
|
| Net
asset value, end of period (x) |
$9.23
|
| Total
return (%) (r)(s)(t)(x) |
(7.70)(n)
|
Ratios
(%) (to average net assets)
and Supplemental data: |
| Expenses
before expense reductions (f) |
9.51(a)
|
| Expenses
after expense reductions (f) |
1.00(a)
|
| Net
investment income (loss) |
1.19(a)
|
| Portfolio
turnover |
17(n)
|
| Net
assets at end of period (000 omitted) |
$46
|
See Notes to Financial
Statements
Financial
Highlights – continued
| Class
R6 |
Year
ended |
| |
7/31/21(c)
|
| Net
asset value, beginning of period |
$10.00
|
| Income
(loss) from investment operations |
| Net
investment income (loss) (d) |
$0.05
|
| Net
realized and unrealized gain (loss) |
(0.82)
|
| Total
from investment operations |
$(0.77)
|
| Net
asset value, end of period (x) |
$9.23
|
| Total
return (%) (r)(s)(t)(x) |
(7.70)(n)
|
Ratios
(%) (to average net assets)
and Supplemental data: |
| Expenses
before expense reductions (f) |
9.50(a)
|
| Expenses
after expense reductions (f) |
0.99(a)
|
| Net
investment income (loss) |
1.20(a)
|
| Portfolio
turnover |
17(n)
|
| Net
assets at end of period (000 omitted) |
$1,615
|
| (a)
|
Annualized.
|
| (c)
|
For the
period from the commencement of the fund’s investment operations, February 23, 2021, through the stated period end. |
| (d)
|
Per share
data is based on average shares outstanding. |
| (f)
|
Ratios do
not reflect reductions from fees paid indirectly, if applicable. |
| (n)
|
Not
annualized. |
| (r)
|
Certain
expenses have been reduced without which performance would have been lower. |
| (s)
|
From time
to time the fund may receive proceeds from litigation settlements, without which performance would be lower. |
| (t)
|
Total
returns do not include any applicable sales charges. |
| (x)
|
The
net asset values and total returns have been calculated on net assets which include adjustments made in accordance with U.S. generally accepted accounting principles required at period end for financial reporting purposes. |
See Notes to Financial Statements
Notes to Financial
Statements
(1) Business and Organization
MFS Emerging Markets Equity Research Fund (the fund) is a
non-diversified series of MFS Series Trust VII (the trust). The trust is organized as a Massachusetts business trust and is registered under the Investment Company Act of 1940, as amended, as an open-end management investment company.
The fund is an investment company and accordingly follows the
investment company accounting and reporting guidance of the Financial Accounting Standards Board (FASB) Accounting Standards Codification Topic 946 Financial Services - Investment Companies.
(2) Significant Accounting Policies
General — The preparation
of financial statements in conformity with U.S. generally accepted accounting principles requires management to make estimates and assumptions that affect the reported amounts of assets and liabilities, and disclosure of contingent assets and
liabilities at the date of the financial statements and the reported amounts of increases and decreases in net assets from operations during the reporting period. Actual results could differ from those estimates. In the preparation of these
financial statements, management has evaluated subsequent events occurring after the date of the fund’s Statement of Assets and Liabilities through the date that the financial statements were issued.
The fund invests in foreign securities, including securities of emerging market issuers. Investments in foreign securities are vulnerable to the effects of changes in the relative values of the local currency and the U.S. dollar and to the effects
of changes in each country’s market, economic, industrial, political, regulatory, geopolitical, environmental, public health, and other conditions. Investments in emerging markets can involve additional and greater risks than the risks
associated with investments in developed foreign markets. Emerging markets can have less developed markets, greater custody and operational risk, less developed legal, regulatory, accounting, and auditing systems, and greater political, social, and
economic instability than developed markets.
Certain of the fund's investments, including its investments in
derivatives, as well as any debt issued by the fund and other contractual arrangements of the fund may be based on reference interest rates such as the London Interbank Offered Rate (“LIBOR”). In 2017, the regulatory authority that
oversees financial services firms in the United Kingdom announced plans to transition away from LIBOR by the end of 2021. In March 2021, the administrator of LIBOR announced the extension of the publication of the more commonly used U.S. dollar
LIBOR settings to the end of June 2023. Although the full impacts of the transition away from LIBOR are not fully known, the transition may result in, among other things, an increase in volatility or illiquidity of the markets for instruments that
currently rely on LIBOR to determine interest rates and this could have an adverse impact on the fund's performance. With respect to the fund's accounting for investments, including its investments in derivatives, as well as any debt issued by the
fund and other contractual arrangements of the fund that undergo reference rate-related modifications as a result of the transition, management will rely upon the relief provided by FASB Codification Topic 848 – Reference Rate Reform (Topic
848). The guidance in Topic 848 permits the fund to disregard the GAAP accounting requirements around certain contract modifications resulting from the LIBOR transition such that for contracts considered in scope, the fund can account for those
modified contracts as a continuation of the existing contracts.
Notes to Financial
Statements - continued
Balance Sheet Offsetting
— The fund's accounting policy with respect to balance sheet offsetting is that, absent an event of default by the counterparty or a termination of the agreement, the International Swaps and Derivatives Association (ISDA) Master Agreement, or
similar agreement, does not result in an offset of reported amounts of financial assets and financial liabilities in the Statement of Assets and Liabilities across transactions between the fund and the applicable counterparty. The fund's right to
setoff may be restricted or prohibited by the bankruptcy or insolvency laws of the particular jurisdiction to which a specific master netting agreement counterparty is subject. Balance sheet offsetting disclosures, to the extent applicable to the
fund, have been included in the fund’s Significant Accounting Policies note under the captions for each of the fund’s in-scope financial instruments and transactions.
Investment Valuations
— Equity securities, including restricted equity securities, are generally valued at the last sale or official closing price on their primary market or exchange as provided by a third-party pricing
service. Equity securities, for which there were no sales reported that day, are generally valued at the last quoted daily bid quotation on their primary market or exchange as provided by a third-party pricing service. Short-term instruments with a maturity at issuance of 60 days or less may be valued at amortized cost, which approximates market value. Open-end investment companies are
generally valued at net asset value per share. Securities and other assets generally valued on the basis of information from a third-party pricing service may also be valued at a broker/dealer bid
quotation. In determining values, third-party pricing services can utilize both transaction data and market information such as yield, quality, coupon rate, maturity, type of issue, trading characteristics,
and other market data. The values of foreign securities and other assets and liabilities expressed in foreign currencies are converted to U.S. dollars using the mean of bid and asked prices for rates provided
by a third-party pricing service.
The Board of
Trustees has delegated primary responsibility for determining or causing to be determined the value of the fund’s investments (including any fair valuation) to the adviser pursuant to valuation policies and procedures approved by the Board. If
the adviser determines that reliable market quotations are not readily available, investments are valued at fair value as determined in good faith by the adviser in accordance with such procedures under the oversight of the Board of Trustees. Under
the fund’s valuation policies and procedures, market quotations are not considered to be readily available for most types of debt instruments and floating rate loans and many types of derivatives. These investments are generally valued at fair
value based on information from third-party pricing services. In addition, investments may be valued at fair value if the adviser determines that an investment’s value has been materially affected by events occurring after the close of the
exchange or market on which the investment is principally traded (such as foreign exchange or market) and prior to the determination of the fund’s net asset value, or after the halt of trading of a specific security where trading does not
resume prior to the close of the exchange or market on which the security is principally traded. Events that occur after foreign markets close (such as developments in foreign markets and significant movements in the U.S. markets) and prior to the
determination of the fund’s net asset value may be deemed to have a material effect on the value of securities traded in foreign markets. Accordingly, the fund’s foreign equity securities may often be valued at fair value. The adviser
generally relies on third-party pricing services or other information (such as the correlation with price movements of similar securities in the same or other markets; the type, cost and investment characteristics of the security; the business and
financial condition of the
Notes to Financial
Statements - continued
issuer; and trading and other market data) to assist in determining whether to
fair value and at what value to fair value an investment. The value of an investment for purposes of calculating the fund’s net asset value can differ depending on the source and method used to determine value. When fair valuation is used, the
value of an investment used to determine the fund’s net asset value may differ from quoted or published prices for the same investment. There can be no assurance that the fund could obtain the fair value assigned to an investment if it were to
sell the investment at the same time at which the fund determines its net asset value per share.
Various inputs are used in determining the value of the fund's
assets or liabilities. These inputs are categorized into three broad levels. In certain cases, the inputs used to measure fair value may fall into different levels of the fair value hierarchy. In such cases, an investment's level within the fair
value hierarchy is based on the lowest level of input that is significant to the fair value measurement. The fund's assessment of the significance of a particular input to the fair value measurement in its entirety requires judgment, and considers
factors specific to the investment. Level 1 includes unadjusted quoted prices in active markets for identical assets or liabilities. Level 2 includes other significant observable market-based inputs (including quoted prices for similar securities,
interest rates, prepayment speed, and credit risk). Level 3 includes unobservable inputs, which may include the adviser's own assumptions in determining the fair value of investments. The following is a summary of the levels used as of July 31, 2021
in valuing the fund's assets or liabilities:
| Financial
Instruments |
Level
1 |
Level
2 |
Level
3 |
Total
|
| Equity
Securities: |
|
|
|
|
| China
|
$609,304
|
$30,004
|
$—
|
$639,308
|
| India
|
128,101
|
194,901
|
—
|
323,002
|
| Taiwan
|
56,170
|
192,656
|
—
|
248,826
|
| South
Korea |
52,811
|
164,091
|
—
|
216,902
|
| Hong
Kong |
123,182
|
—
|
—
|
123,182
|
| Russia
|
37,845
|
59,693
|
—
|
97,538
|
| Indonesia
|
21,878
|
50,765
|
—
|
72,643
|
| Mexico
|
51,564
|
—
|
—
|
51,564
|
| Greece
|
50,793
|
—
|
—
|
50,793
|
| Other
Countries |
152,503
|
42,374
|
—
|
194,877
|
| Mutual
Funds |
67,408
|
—
|
—
|
67,408
|
| Total
|
$1,351,559
|
$734,484
|
$—
|
$2,086,043
|
For further information regarding
security characteristics, see the Portfolio of Investments.
Foreign Currency Translation
— Purchases and sales of foreign investments, income, and expenses are converted into U.S. dollars based upon currency exchange rates prevailing on the respective dates of such transactions or on the reporting date for foreign denominated
receivables and payables. Gains and losses attributable to foreign currency exchange rates on sales of securities are recorded for financial statement purposes as net realized gains and losses on investments. Gains and losses attributable to foreign
exchange rate movements on receivables, payables, income and expenses
Notes to Financial
Statements - continued
are recorded for financial statement purposes as foreign currency transaction
gains and losses. That portion of both realized and unrealized gains and losses on investments that results from fluctuations in foreign currency exchange rates is not separately disclosed.
Indemnifications — Under
the fund's organizational documents, its officers and Trustees may be indemnified against certain liabilities and expenses arising out of the performance of their duties to the fund. Additionally, in the normal course of business, the fund enters
into agreements with service providers that may contain indemnification clauses. The fund's maximum exposure under these agreements is unknown as this would involve future claims that may be made against the fund that have not yet
occurred.
Investment Transactions and Income — Investment transactions are recorded on the trade date. Dividends received in cash are recorded on the ex-dividend date. Certain dividends from foreign securities will be
recorded when the fund is informed of the dividend if such information is obtained subsequent to the ex-dividend date. Dividend payments received in additional securities are recorded on the ex-dividend date in an amount equal to the value of the
security on such date.
The fund may receive
proceeds from litigation settlements. Any proceeds received from litigation involving portfolio holdings are reflected in the Statement of Operations in realized gain/loss if the security has been disposed of by the fund or in unrealized gain/loss
if the security is still held by the fund. Any other proceeds from litigation not related to portfolio holdings are reflected as other income in the Statement of Operations.
Fees Paid Indirectly —
The fund's custody fee may be reduced by a credit earned under an arrangement that measures the value of U.S. dollars deposited with the custodian by the fund. The amount of the credit, for the period ended July 31, 2021, is shown as a reduction of
total expenses in the Statement of Operations.
Tax
Matters and Distributions — The fund intends to qualify as a regulated investment company, as defined under Subchapter M of the Internal Revenue Code, and to distribute all of its taxable income, including
realized capital gains. As a result, no provision for federal income tax is required. The fund’s federal tax returns, when filed, will remain subject to examination by the Internal Revenue Service for a three year period. Management has
analyzed the fund’s tax positions taken on federal and state tax returns for all open tax years and does not believe that there are any uncertain tax positions that require recognition of a tax liability. Foreign taxes, if any, have been
accrued by the fund in the accompanying financial statements in accordance with the applicable foreign tax law. Foreign income taxes may be withheld by certain countries in which the fund invests. Additionally, capital gains realized by the fund on
securities issued in or by certain foreign countries may be subject to capital gains tax imposed by those countries.
Distributions to shareholders are recorded on the ex-dividend
date. Income and capital gain distributions are determined in accordance with income tax regulations, which may differ from U.S. generally accepted accounting principles. Certain capital accounts in the financial statements are periodically adjusted
for permanent differences in order to reflect their tax character. These adjustments have no impact on net assets or net
Notes to Financial
Statements - continued
asset value per share. Temporary differences which arise from recognizing
certain items of income, expense, gain or loss in different periods for financial statement and tax purposes will reverse at some time in the future.
Book/tax differences primarily relate to wash sale loss
deferrals.
The fund declared no distributions for the
period ended July 31, 2021.
The federal tax cost and the
tax basis components of distributable earnings were as follows:
| As
of 7/31/21 |
|
| Cost
of investments |
$2,277,393
|
| Gross
appreciation |
93,213
|
| Gross
depreciation |
(284,563)
|
| Net
unrealized appreciation (depreciation) |
$
(191,350) |
| Undistributed
ordinary income |
20,542
|
| Other
temporary differences |
(781)
|
| Total
distributable earnings (loss) |
$
(171,589) |
Multiple Classes of Shares of Beneficial Interest — The fund offers multiple classes of shares, which differ in their respective distribution and service fees. The fund's income, realized and unrealized gain (loss), and common expenses are allocated to
shareholders based on the daily net assets of each class. Dividends are declared separately for each class. Differences in per share dividend rates are generally due to differences in separate class expenses. Class C shares will convert to Class A
shares approximately eight years after purchase.
(3) Transactions with Affiliates
Investment Adviser — The
fund has an investment advisory agreement with MFS to provide overall investment management and related administrative services and facilities to the fund. The management fee is computed daily and paid
monthly at the following annual rates based on the fund's average daily net assets:
| Up
to $1 billion |
0.95%
|
| In
excess of $1 billion and up to $2.5 billion |
0.90%
|
| In
excess of $2.5 billion and up to $5 billion |
0.85%
|
| In
excess of $5 billion |
0.825%
|
MFS has agreed in writing to reduce
its management fee by a specified amount if certain MFS mutual fund assets exceed thresholds agreed to by MFS and the fund's Board of Trustees. For the period ended July 31, 2021, this management fee reduction amounted to $115, which is included in
the reduction of total expenses in the Statement of Operations. The management fee incurred for the period ended July 31, 2021 was equivalent to an annual effective rate of 0.94% of the fund's average daily net assets.
Notes to Financial
Statements - continued
The investment adviser has agreed in writing to pay a portion
of the fund’s total annual operating expenses, excluding interest, taxes, extraordinary expenses, brokerage and transaction costs, and investment-related expenses, such that total fund operating expenses do not exceed the following rates
annually of each class’s average daily net assets:
| Classes
|
| A
|
C
|
I
|
R1
|
R2
|
R3
|
R4
|
R6
|
| 1.31%
|
2.06%
|
1.06%
|
2.06%
|
1.56%
|
1.31%
|
1.06%
|
0.99%
|
This written agreement will continue
until modified by the fund’s Board of Trustees, but such agreement will continue at least until November 30, 2022. For the period ended July 31, 2021, this reduction amounted to $78,549, which is included in the reduction of total expenses in
the Statement of Operations.
Distributor — MFS Fund Distributors, Inc. (MFD), a wholly-owned subsidiary of MFS, as distributor, received $129 for the period ended July 31, 2021, as its portion of the initial sales charge on sales of Class A shares of the
fund.
The Board of Trustees has adopted a
distribution plan for certain share classes pursuant to Rule 12b-1 of the Investment Company Act of 1940.
The fund's distribution plan provides that the fund will pay
MFD for services provided by MFD and financial intermediaries in connection with the distribution and servicing of certain share classes. One component of the plan is a distribution fee paid to MFD and another component of the plan is a service fee
paid to MFD. MFD may subsequently pay all, or a portion, of the distribution and/or service fees to financial intermediaries.
Distribution Plan Fee Table:
| |
Distribution
Fee Rate (d) |
Service
Fee Rate (d) |
Total
Distribution
Plan (d) |
Annual
Effective
Rate (e) |
Distribution
and Service
Fee |
| Class
A |
—
|
0.25%
|
0.25%
|
0.25%
|
$
174 |
| Class
C |
0.75%
|
0.25%
|
1.00%
|
1.00%
|
208
|
| Class
R1 |
0.75%
|
0.25%
|
1.00%
|
1.00%
|
208
|
| Class
R2 |
0.25%
|
0.25%
|
0.50%
|
0.50%
|
104
|
| Class
R3 |
—
|
0.25%
|
0.25%
|
0.25%
|
52
|
| Total
Distribution and Service Fees |
|
|
|
|
$746
|
| (d)
|
In
accordance with the distribution plan for certain classes, the fund pays distribution and/or service fees equal to these annual percentage rates of each class’s average daily net assets. The distribution and service fee rates disclosed by
class represent the current rates in effect at the end of the reporting period. Any rate changes, if applicable, are detailed below. |
| (e)
|
The
annual effective rates represent actual fees incurred under the distribution plan for the period ended July 31, 2021 based on each class's average daily net assets. MFD has voluntarily agreed to rebate a portion of each class's 0.25% service fee
attributable to accounts for which there is no financial intermediary specified on the account except for accounts attributable to MFS or its affiliates' seed money. There were no service fee rebates for the period ended July 31, 2021.
|
Notes to Financial
Statements - continued
Certain Class A shares are subject to a contingent deferred
sales charge (CDSC) in the event of a shareholder redemption within 18 months of purchase. Class C shares are subject to a CDSC in the event of a shareholder redemption within 12 months of purchase. There were no contingent deferred sales charges
imposed during the period ended July 31, 2021.
Shareholder
Servicing Agent — MFS Service Center, Inc. (MFSC), a wholly-owned subsidiary of MFS, receives a fee from the fund for its services as shareholder servicing agent calculated as a percentage of the average daily
net assets of the fund as determined periodically under the supervision of the fund's Board of Trustees. For the period ended July 31, 2021, the fee was $38, which equated to 0.0042% annually of the fund's average daily net assets. MFSC also
receives reimbursement from the fund for out-of-pocket expenses, sub-accounting and other shareholder servicing costs which may be paid to affiliated and unaffiliated service providers. Class R6 shares do not incur sub-accounting fees. For the
period ended July 31, 2021, these out-of-pocket expenses, sub-accounting and other shareholder servicing costs amounted to $151.
Administrator — MFS
provides certain financial, legal, shareholder communications, compliance, and other administrative services to the fund. Under an administrative services agreement, the fund reimburses MFS the costs incurred to provide these services. The fund is
charged an annual fixed amount of $17,500 plus a fee based on average daily net assets. The administrative services fee incurred for the period ended July 31, 2021 was equivalent to an annual effective rate of 0.8249% of the fund's average daily net
assets.
Trustees’ and Officers’
Compensation — The fund pays compensation to independent Trustees in the form of a retainer, attendance fees, and additional compensation to Board and Committee chairpersons. The fund does not pay compensation
directly to Trustees or officers of the fund who are also officers of the investment adviser, all of whom receive remuneration from MFS for their services to the fund. Certain officers and Trustees of the fund are officers or directors of MFS, MFD,
and MFSC.
Other
— The fund invests in the MFS Institutional Money Market Portfolio which is managed by MFS and seeks current income consistent with preservation of capital and liquidity. This money market fund does not pay a
management fee to MFS but does incur investment and operating costs.
On February 22, 2021, MFS purchased 15,000 shares of Class A,
5,000 shares each of Class C, Class I, Class R1, Class R2, Class R3, and Class R4, and 175,000 shares of Class R6 for an aggregate amount of $2,200,000 as an initial investment in the fund.
At July 31, 2021, MFS held approximately 83%, 98%, and 99% of
the outstanding shares of Class A, Class C, and Class I, respectively, and 100% of the outstanding shares of Class R1, Class R2, Class R3, Class R4, and Class R6.
(4) Portfolio Securities
For the period ended July 31, 2021, purchases and sales of
investments, other than short-term obligations, aggregated $2,547,685 and $352,238, respectively.
Notes to Financial
Statements - continued
(5) Shares of Beneficial Interest
The fund's Declaration of Trust permits the Trustees to issue
an unlimited number of full and fractional shares of beneficial interest. Transactions in fund shares were as follows:
| |
Year
ended
7/31/21 (c) |
| |
Shares
|
Amount
|
| Shares
sold |
|
|
| Class
A |
17,976
|
$178,795
|
| Class
C |
5,101
|
50,968
|
| Class
I |
5,067
|
50,650
|
| Class
R1 |
5,000
|
50,000
|
| Class
R2 |
5,000
|
50,000
|
| Class
R3 |
5,000
|
50,000
|
| Class
R4 |
5,000
|
50,000
|
| Class
R6 |
175,000
|
1,750,000
|
| |
223,144
|
$2,230,413
|
| Shares
reacquired |
|
|
| Class
A |
(1)
|
$(13)
|
| Class
C |
(3)
|
(25)
|
| Class
I |
(10)
|
(94)
|
| |
(14)
|
$(132)
|
| Net
change |
|
|
| Class
A |
17,975
|
$178,782
|
| Class
C |
5,098
|
50,943
|
| Class
I |
5,057
|
50,556
|
| Class
R1 |
5,000
|
50,000
|
| Class
R2 |
5,000
|
50,000
|
| Class
R3 |
5,000
|
50,000
|
| Class
R4 |
5,000
|
50,000
|
| Class
R6 |
175,000
|
1,750,000
|
| |
223,130
|
$2,230,281
|
| (c)
|
For
the period from the commencement of the fund’s investment operations, February 23, 2021, through the stated period end. |
(6) Line of Credit
The fund and certain other funds managed by MFS participate in
a $1.25 billion unsecured committed line of credit of which $1 billion is reserved for use by the fund and certain other MFS U.S. funds. The line of credit is provided by a syndicate of banks under a credit agreement. Borrowings may be made for
temporary financing needs. Interest is charged to each fund, based on its borrowings, generally at a rate equal to the highest of one month LIBOR, the Federal Funds Effective Rate and the Overnight Bank Funding Rate, plus an agreed upon spread. A
commitment fee, based on the
Notes to Financial
Statements - continued
average daily, unused portion of the committed line of credit, is allocated
among the participating funds. In addition, the fund and other funds managed by MFS have established unsecured uncommitted borrowing arrangements with certain banks for temporary financing needs. Interest is charged to each fund, based on its
borrowings, at rates equal to customary reference rates plus an agreed upon spread. For the period ended July 31, 2021, the fund’s commitment fee and interest expense were $5 and $0, respectively, and are included in
“Miscellaneous” expense in the Statement of Operations.
(7) Investments in Affiliated Issuers
An affiliated issuer may be considered one in which the fund
owns 5% or more of the outstanding voting securities, or a company which is under common control. For the purposes of this report, the following were affiliated issuers:
| Affiliated
Issuers |
Beginning
Value |
Purchases
|
Sales
Proceeds |
Realized
Gain
(Loss) |
Change
in
Unrealized
Appreciation or
Depreciation |
Ending
Value |
| MFS
Institutional Money Market Portfolio |
$—
|
$303,834
|
$236,426
|
$—
|
$—
|
$67,408
|
| Affiliated
Issuers |
Dividend
Income |
Capital
Gain
Distributions |
| MFS
Institutional Money Market Portfolio |
$6
|
$—
|
(8) Impacts of COVID-19
The pandemic related to the global spread of novel coronavirus
disease (COVID-19), which was first detected in December 2019, has resulted in significant disruptions to global business activity and the global economy, as well as the economies of individual countries, the financial performance of individual
companies and sectors, and the securities and commodities markets in general. Multiple surges in cases globally, the availability and widespread adoption of vaccines, and the emergence of variant strains of the virus continue to create uncertainty
as to the future and long-term impacts resulting from the pandemic including impacts to the prices and liquidity of the fund's investments and the fund's performance.
Report of Independent
Registered Public Accounting Firm
To the Shareholders of
MFS Emerging Markets Equity Research Fund and the Board of Trustees of MFS Series Trust VII
Opinion on the Financial Statements
We have audited the accompanying statement of assets and
liabilities of MFS Emerging Markets Equity Research Fund (the “Fund”) (one of the funds constituting MFS Series Trust VII (the “Trust”)), including the portfolio of investments, as of July 31, 2021, and the related statement
of operations, changes in net assets and the financial highlights for the period from February 23, 2021 (commencement of operations) through July 31, 2021 and the related notes (collectively referred to as the “financial statements”). In
our opinion, the financial statements present fairly, in all material respects, the financial position of the Fund (one of the funds constituting MFS Series Trust VII) at July 31, 2021, the results of its operations, the changes in its net assets
and its financial highlights for the period from February 23, 2021 (commencement of operations) through July 31, 2021 in conformity with U.S generally accepted accounting principles.
Basis for Opinion
These financial statements are the responsibility of the
Trust’s management. Our responsibility is to express an opinion on the Fund’s financial statements based on our audit. We are a public accounting firm registered with the Public Company Accounting Oversight Board (United States)
(“PCAOB”) and are required to be independent with respect to the Trust in accordance with the U.S. federal securities laws and the applicable rules and regulations of the Securities and Exchange Commission and the PCAOB.
We conducted our audit in accordance with the standards of the
PCAOB. Those standards require that we plan and perform the audit to obtain reasonable assurance about whether the financial statements are free of material misstatement, whether due to error or fraud. The Trust is not required to have, nor were we
engaged to perform, an audit of the Trust’s internal control over financial reporting. As part of our audit we are required to obtain an understanding of internal control over financial reporting but not for the purpose of expressing an
opinion on the effectiveness of the Trust’s internal control over financial reporting. Accordingly, we express no such opinion.
Report of Independent
Registered Public Accounting Firm – continued
Our audit included performing procedures to assess the risks of
material misstatement of the financial statements, whether due to error or fraud, and performing procedures that respond to those risks. Such procedures included examining, on a test basis, evidence regarding the amounts and disclosures in the
financial statements. Our procedures included confirmation of securities owned as of July 31, 2021, by correspondence with the custodian and others. Our audit also included evaluating the accounting principles used and significant estimates made by
management, as well as evaluating the overall presentation of the financial statements. We believe that our audit provides a reasonable basis for our opinion.
We have served as
the auditor of one or more MFS investment companies since 1993.
Boston, Massachusetts
September 15, 2021
Trustees and
Officers — Identification and Background
The Trustees and Officers of the Trust, as of September 1,
2021, are listed below, together with their principal occupations during the past five years. (Their titles may have varied during that period.) The address of each Trustee and Officer is 111 Huntington Avenue, Boston, Massachusetts
02199-7618.
| Name,
Age |
|
Position(s)
Held with Fund |
|
Trustee/Officer
Since(h) |
|
Number
of MFS Funds overseen by the Trustee |
|
Principal
Occupations During
the Past Five Years |
|
Other
Directorships During
the Past Five Years (j) |
| INTERESTED
TRUSTEES |
|
|
Robert
J. Manning (k)
(age 57) |
|
Trustee
|
|
February
2004 |
|
136
|
|
Massachusetts
Financial Services Company, Non-Executive Chairman (since January 2021); Director; Chairman of the Board; Executive Chairman (January 2017-2020); Co-Chief Executive Officer (2015-2016) |
|
N/A
|
Michael
W. Roberge (k)
(age 54) |
|
Trustee
|
|
January
2021 |
|
136
|
|
Massachusetts
Financial Services Company, Chairman (since January 2021); Chief Executive Officer (since January 2017); Director; President (until December 2018); Chief Investment Officer (until December 2018); Co-Chief Executive Officer (until December 2016)
|
|
N/A
|
| INDEPENDENT
TRUSTEES |
|
|
John
P. Kavanaugh
(age 66) |
|
Trustee
and Chair of Trustees |
|
January
2009 |
|
136
|
|
Private
investor |
|
N/A
|
Steven
E. Buller
(age 70) |
|
Trustee
|
|
February
2014 |
|
136
|
|
Private
investor |
|
N/A
|
John
A. Caroselli
(age 67) |
|
Trustee
|
|
March
2017 |
|
136
|
|
Private
investor; JC Global Advisors, LLC (management consulting), President (since 2015) |
|
N/A
|
Maureen
R. Goldfarb
(age 66) |
|
Trustee
|
|
January
2009 |
|
136
|
|
Private
investor |
|
N/A
|
Peter
D. Jones
(age 66) |
|
Trustee
|
|
January
2019 |
|
136
|
|
Private
investor |
|
N/A
|
Trustees and Officers -
continued
| Name,
Age |
|
Position(s)
Held with Fund |
|
Trustee/Officer
Since(h) |
|
Number
of MFS Funds overseen by the Trustee |
|
Principal
Occupations During
the Past Five Years |
|
Other
Directorships During
the Past Five Years (j) |
James
W. Kilman, Jr.
(age 60) |
|
Trustee
|
|
January
2019 |
|
136
|
|
Burford
Capital Limited (finance and investment management), Senior Advisor (since May 3, 2021), Chief Financial Officer (2019 - May 2, 2021); KielStrand Capital LLC (family office), Chief Executive Officer (since 2016); Morgan Stanley & Co. (financial
services), Vice Chairman of Investment Banking, Co-Head of Diversified Financials Coverage – Financial Institutions Investment Banking Group (until 2016) |
|
Alpha-En
Corporation, Director (2016-2019) |
Clarence
Otis, Jr.
(age 65) |
|
Trustee
|
|
March
2017 |
|
136
|
|
Private
investor |
|
VF
Corporation, Director; Verizon Communications, Inc., Director; The Travelers Companies, Director |
Maryanne
L. Roepke
(age 65) |
|
Trustee
|
|
May
2014 |
|
136
|
|
Private
investor |
|
N/A
|
Laurie
J. Thomsen
(age 64) |
|
Trustee
|
|
March
2005 |
|
136
|
|
Private
investor |
|
The
Travelers Companies, Director; Dycom Industries, Inc., Director |
| Name,
Age |
|
Position(s)
Held with
Fund |
|
Trustee/Officer
Since(h) |
|
Number
of MFS Funds for which the Person is an Officer |
|
Principal
Occupations During
the Past Five Years |
| OFFICERS
|
|
|
|
|
|
|
|
|
Christopher
R. Bohane (k)
(age 47) |
|
Assistant
Secretary and Assistant Clerk |
|
July
2005 |
|
136
|
|
Massachusetts
Financial Services Company, Senior Vice President and Associate General Counsel |
Kino
Clark (k)
(age 53) |
|
Assistant
Treasurer |
|
January
2012 |
|
136
|
|
Massachusetts
Financial Services Company, Vice President |
Trustees and Officers -
continued
| Name,
Age |
|
Position(s)
Held with
Fund |
|
Trustee/Officer
Since(h) |
|
Number
of MFS Funds for which the Person is an Officer |
|
Principal
Occupations During
the Past Five Years |
John
W. Clark, Jr. (k)
(age 54) |
|
Assistant
Treasurer |
|
April
2017 |
|
136
|
|
Massachusetts
Financial Services Company, Vice President (since March 2017); Deutsche Bank (financial services), Department Head - Treasurer's Office (until February 2017) |
Thomas
H. Connors (k)
(age 61) |
|
Assistant
Secretary and Assistant Clerk |
|
September
2012 |
|
136
|
|
Massachusetts
Financial Services Company, Vice President and Senior Counsel |
David
L. DiLorenzo (k)
(age 53) |
|
President
|
|
July
2005 |
|
136
|
|
Massachusetts
Financial Services Company, Senior Vice President |
Heidi
W. Hardin (k)
(age 54) |
|
Secretary
and Clerk |
|
April
2017 |
|
136
|
|
Massachusetts
Financial Services Company, Executive Vice President and General Counsel (since March 2017); Harris Associates (investment management), General Counsel (until January 2017) |
Brian
E. Langenfeld (k)
(age 48) |
|
Assistant
Secretary and Assistant Clerk |
|
June
2006 |
|
136
|
|
Massachusetts
Financial Services Company, Vice President and Senior Counsel |
Amanda
S. Mooradian (k)
(age 42) |
|
Assistant
Secretary and Assistant Clerk |
|
September
2018 |
|
136
|
|
Massachusetts
Financial Services Company, Assistant Vice President and Senior Counsel |
Susan
A. Pereira (k)
(age 50) |
|
Assistant
Secretary and Assistant Clerk |
|
July
2005 |
|
136
|
|
Massachusetts
Financial Services Company, Vice President and Assistant General Counsel |
Kasey
L. Phillips (k)
(age 50) |
|
Assistant
Treasurer |
|
September
2012 |
|
136
|
|
Massachusetts
Financial Services Company, Vice President |
Matthew
A. Stowe (k)
(age 46) |
|
Assistant
Secretary and Assistant Clerk |
|
October
2014 |
|
136
|
|
Massachusetts
Financial Services Company, Vice President and Assistant General Counsel |
Martin
J. Wolin (k)
(age 53) |
|
Chief
Compliance Officer |
|
July
2015 |
|
136
|
|
Massachusetts
Financial Services Company, Senior Vice President and Chief Compliance Officer |
Trustees and Officers -
continued
| Name,
Age |
|
Position(s)
Held with
Fund |
|
Trustee/Officer
Since(h) |
|
Number
of MFS Funds for which the Person is an Officer |
|
Principal
Occupations During
the Past Five Years |
James
O. Yost (k)
(age 61) |
|
Treasurer
|
|
September
1990 |
|
136
|
|
Massachusetts
Financial Services Company, Senior Vice President |
| (h)
|
Date
first appointed to serve as Trustee/Officer of an MFS Fund. Each Trustee has served continuously since appointment unless indicated otherwise. For the period from December 15, 2004 until February 22, 2005, Mr. Manning served as Advisory Trustee.
From January 2012 through December 2016, Messrs. DiLorenzo and Yost served as Treasurer and Deputy Treasurer of the Funds, respectively. |
| (j)
|
Directorships
or trusteeships of companies required to report to the Securities and Exchange Commission (i.e., “public companies”). |
| (k)
|
“Interested
person” of the Trust within the meaning of the Investment Company Act of 1940 (referred to as the 1940 Act), which is the principal federal law governing investment companies like the fund, as a result of a position with MFS. The address of
MFS is 111 Huntington Avenue, Boston, Massachusetts 02199-7618. |
Each Trustee (other than Messrs. Jones, Kilman and Roberge) has
been elected by shareholders and each Trustee and Officer holds office until his or her successor is chosen and qualified or until his or her earlier death, resignation, retirement or removal. Mr. Roberge became a Trustee of the Funds on January 1,
2021 and Messrs. Jones and Kilman became Trustees of the Funds on January 1, 2019. The Trust does not hold annual meetings for the purpose of electing Trustees, and Trustees are not elected for fixed terms. Under the terms of the Board's retirement
policy, an Independent Trustee shall retire at the end of the calendar year in which he or she reaches the earlier of 75 years of age or 15 years of service on the Board (or, in the case of any Independent Trustee who joined the Board prior to 2015,
20 years of service on the Board).
Messrs. Buller, Kilman
and Otis and Ms. Roepke are members of the Trust’s Audit Committee.
Each of the Interested Trustees and certain Officers hold
comparable officer positions with certain affiliates of MFS.
Trustees and Officers -
continued
The Statement of Additional Information for a Fund includes
further information about the Trustees and is available without charge upon request by calling 1-800-225-2606.
| Investment
Adviser |
Custodian
|
Massachusetts
Financial Services Company
111 Huntington Avenue
Boston, MA 02199-7618 |
JPMorgan
Chase Bank, NA
4 Metrotech Center
New York, NY 11245 |
| Distributor
|
Independent
Registered Public Accounting Firm |
MFS Fund
Distributors, Inc.
111 Huntington Avenue
Boston, MA 02199-7618 |
Ernst &
Young LLP
200 Clarendon Street
Boston, MA 02116 |
| Portfolio
Manager(s) |
|
Sanjay
Natarajan
Deividas Seferis |
|
Board Approval of Investment
Advisory Agreement
MFS Emerging Markets Equity Research
Fund
The Investment Company Act of 1940 requires that
both the full Board of Trustees and a majority of the non-interested (“independent”) Trustees, voting separately, initially approve the Fund’s investment advisory agreement with MFS (the “Agreement”) and, beginning on
the second anniversary of the initial effective date of the Agreement, annually approve the continuation of the Agreement. In September and December 2020, the Board met by videoconference (in accordance with Securities and Exchange Commission
relief) to consider the initial approval of the Agreement (“the initial review meetings”). The independent Trustees were assisted in their evaluation of the Agreement by independent legal counsel, from whom they received separate legal
advice and with whom they met separately from MFS.
In
connection with their deliberations regarding the initial approval of the Agreement, the Trustees, including the independent Trustees, considered such information and factors as they believed, in light of the legal advice furnished to them and their
own business judgment, to be relevant. As described below, the Trustees considered the nature, quality, and extent of the various investment advisory, administrative, and shareholder services to be performed by MFS under the Agreement and other
arrangements with the Fund.
In connection with their
initial review meetings, the Trustees received and relied upon materials that included, among other items: (i) information provided by Broadridge Financial Solutions Inc. (“Broadridge”), an independent third party, on the Fund’s
proposed advisory fees and other expenses and the advisory fees and other expenses of comparable funds identified by Broadridge, as well as all other funds in the same investment classification/category (the “Broadridge expense group and
universe”), (ii) information provided by MFS on the advisory fees it charges to other registered funds managed in a similar style to the Fund, and (iii) information as to whether and to what extent applicable expense waivers, reimbursements or
fee “breakpoints” would be observed for the Fund. In addition, in connection with the independent Trustees’ meetings in May, June and July 2020 for the purpose of considering whether to approve the continuation of the investment
advisory agreements for the other investment companies that the Board oversees (the “MFS Funds”), the independent Trustees received: (i) information provided by MFS on the advisory fees of portfolios of other clients of MFS, including
institutional separate accounts and other clients, (ii) information regarding MFS’ financial results and financial condition, including MFS’ and certain of its affiliates’ estimated profitability from services performed for the MFS
Funds as a whole, and compared to MFS’ institutional business, (iii) MFS’ views regarding the outlook for the mutual fund industry and the strategic business plans of MFS, (iv) descriptions of various functions performed by MFS for the
Funds, such as compliance monitoring and portfolio trading practices, and (v) information regarding the overall organization of MFS, including information about MFS’ senior management and other personnel that would provide investment advisory,
administrative and other services to the Fund and the other MFS Funds. The comparative fee and expense information prepared and provided by Broadridge was not independently verified and the independent Trustees did not independently verify any
information provided to them by MFS.
Board Approval of Investment
Advisory Agreement - continued
The Trustees’ conclusion as to the initial approval of
the Agreement was based on a comprehensive consideration of all information provided to the Trustees and not the result of any single factor. Some of the factors that figured particularly in the Trustees’ deliberations are described below,
although individual Trustees may have evaluated the information presented differently from one another, giving different weights to various factors. Because the Fund is newly organized and had not yet commenced investment operations at the time of
the initial review meetings, the Fund had no investment performance for the Trustees to review.
In assessing the reasonableness of the Fund’s advisory
fee, the Trustees considered, among other information, the Fund’s proposed advisory fee and the estimated total expense ratio of the Fund’s Class A shares as a percentage of average daily net assets and the advisory fee and total expense
ratios of peer groups of funds based on information provided by Broadridge. The Trustees also considered that MFS will observe an expense limitation for the Fund, which may not be changed without the Trustees’ approval. The Trustees considered
that, according to the data provided by Broadridge (which takes into account any proposed fee reductions or expense limitations for the Fund), the Fund’s effective advisory fee rate and total expense ratio would each be lower than the
Broadridge expense group median.
The Trustees also
considered whether the Fund may benefit from any economies of scale in the management of the Fund in the event of growth in assets of the Fund and/or growth in assets of the MFS Funds as a whole. They noted that the Fund’s proposed advisory
fee rate schedule is subject to contractual breakpoints that reduce the Fund’s advisory fee rate on average daily net assets over $1 billion, $2.5 billion, and $5 billion. The Trustees also noted that MFS has agreed in writing to waive a
portion of the management fees of certain MFS Funds, including the Fund, if the total combined assets of certain funds within the MFS Funds’ complex increase above agreed upon thresholds (the “group fee waiver”), enabling the
Fund’s shareholders to share in the benefits from any economies of scale at the complex level. The group fee waiver is reviewed and renewed annually between the Board and MFS. The Trustees concluded that the proposed contractual breakpoints
and the group fee waiver were sufficient to allow the Fund to benefit from economies of scale as its assets and overall complex assets grow.
The Trustees did not consider MFS’ costs and profits with
respect to the Fund because the Fund had not yet commenced operations. The Trustees considered information prepared by MFS relating to MFS’ costs and profits with respect to the MFS Funds considered as a group, and other investment companies
and institutional accounts advised by MFS, as well as MFS’ methodologies used to determine and allocate its costs to the MFS Funds and other accounts and products for purposes of estimating profitability.
After reviewing these and other factors described herein, the
Trustees concluded, within the context of their overall conclusions regarding the Agreement, that the advisory fee to be charged to the Fund represents reasonable compensation in light of the services to be provided by MFS to the Fund.
In addition, the Trustees considered MFS’ resources and
related efforts to continue to retain, attract and motivate capable personnel to serve the Fund. The Trustees also considered current and developing conditions in the financial services industry, including the presence of large and well-capitalized
companies which are spending,
Board Approval of Investment
Advisory Agreement - continued
and appear to be prepared to continue to spend, substantial sums to engage
personnel and to provide services to competing investment companies. In this regard, the Trustees also considered the financial resources of MFS and its ultimate parent, Sun Life Financial Inc. The Trustees also considered the advantages and
possible disadvantages to the Fund of having an adviser that also serves other investment companies as well as other accounts.
The Trustees also considered the nature, quality, cost, and
extent of administrative, transfer agency, and distribution services to be provided to the Fund by MFS and its affiliates under agreements and plans other than the Agreement, including any 12b-1 fees the Fund will pay to MFS Fund Distributors, Inc.,
an affiliate of MFS. The Trustees also considered the nature, extent and quality of certain other services MFS may perform or arrange for on the Fund’s behalf, which may include securities lending programs, directed expense payment programs,
class action recovery programs, and MFS’ interaction with third-party service providers, principally custodians and sub-custodians. The Trustees concluded that the various non-advisory services to be provided by MFS and its affiliates on
behalf of the Fund were satisfactory.
The Trustees
considered so-called “fall-out benefits” to MFS such as reputational value derived from serving as investment manager to the MFS Funds. The Trustees also considered that MFS discontinued its historic practice of obtaining investment
research from portfolio brokerage commissions paid by certain MFS Funds effective January 2018, and directly pays or voluntarily reimburses a Fund, if applicable, for the costs of external research acquired through the use of the Fund’s
portfolio brokerage commissions.
Based on their
evaluation of factors that they deemed to be material, including those factors described above, the Board of Trustees, including the independent Trustees, concluded that the Fund’s Agreement with MFS should be approved for an initial two-year
period, commencing upon its effective date, as set forth in the Agreement.
Proxy
Voting Policies and Information
MFS votes proxies on
behalf of the fund pursuant to proxy voting policies and procedures that are available without charge, upon request, by calling 1-800-225-2606, by visiting mfs.com/proxyvoting, or by visiting the SEC’s
Web site at http://www.sec.gov.
Information regarding how the fund voted proxies relating to
portfolio securities during the most recent twelve-month period ended June 30 is available by August 31 of each year without charge by visiting mfs.com/proxyvoting, or by visiting the SEC’s Web site at http://www.sec.gov.
Quarterly Portfolio Disclosure
The fund files a complete schedule of portfolio holdings with
the SEC for the first and third quarters of each fiscal year as an exhibit to its reports on Form N-PORT. The fund's Form N-PORT reports are available on the SEC's Web site at http://www.sec.gov. A
shareholder can obtain the portfolio holdings report for the first and third quarters of the fund's fiscal year at mfs.com/openendfunds by choosing the fund's name and then scrolling to the
“Resources” section and clicking on the “Prospectus and Reports” tab.
Further Information
From time to time, MFS may post important information about the
fund or the MFS Funds on the MFS Web site (mfs.com). This information is available at https://www.mfs.com/announcements or at
mfs.com/openendfunds by choosing the fund’s name and then scrolling to the “Resources” section and clicking on the “Announcements” tab, if any.
Information About Fund Contracts and Legal Claims
The fund has entered into contractual arrangements with an
investment adviser, administrator, distributor, shareholder servicing agent, 529 program manager (if applicable), and custodian who each provide services to the fund. Unless expressly stated otherwise, shareholders are not parties to, or intended
beneficiaries of these contractual arrangements, and these contractual arrangements are not intended to create any shareholder right to enforce them against the service providers or to seek any remedy under them against the service providers, either
directly or on behalf of the fund.
Under the
Trust’s By-Laws and Declaration of Trust, any claims asserted against or on behalf of the MFS Funds, including claims against Trustees and Officers, must be brought in state and federal courts located within the Commonwealth of
Massachusetts.
Federal Tax Information (unaudited)
The
fund will notify shareholders of amounts for use in preparing 2021 income tax forms in January 2022. The following information is provided pursuant to provisions of the Internal Revenue Code.
The fund designates the maximum amount allowable as qualified
dividend income eligible to be taxed at the same rate as long-term capital gain.
Income derived from foreign sources was $22,813. The fund
intends to pass through foreign tax credits of $3,078 for the fiscal year.
| FACTS
|
WHAT
DOES MFS DO WITH YOUR PERSONAL INFORMATION? |
| Why?
|
Financial
companies choose how they share your personal information. Federal law gives consumers the right to limit some but not all sharing. Federal law also requires us to tell you how we collect, share, and protect your personal information. Please read
this notice carefully to understand what we do. |
| What?
|
The types of
personal information we collect and share depend on the product or service you have with us. This information can include: |
| • Social
Security number and account balances |
| • Account
transactions and transaction history |
| • Checking
account information and wire transfer instructions |
| When
you are no longer our customer, we continue to share your information as described in this notice. |
| How?
|
All
financial companies need to share customers' personal information to run their everyday business. In the section below, we list the reasons financial companies can share their customers' personal information; the reasons MFS chooses to share; and
whether you can limit this sharing. |
Reasons
we can share your
personal information |
Does
MFS share? |
Can
you limit
this sharing? |
For
our everyday business purposes –
such as to process your transactions, maintain your
account(s), respond to court orders and legal
investigations, or report to credit bureaus |
Yes
|
No
|
For
our marketing purposes –
to offer our products and services to you |
No
|
We
don't share |
For
joint marketing with other
financial companies |
No
|
We
don't share |
For
our affiliates' everyday business purposes –
information about your transactions and experiences |
No
|
We
don't share |
For
our affiliates' everyday business purposes –
information about your creditworthiness |
No
|
We
don't share |
| For
nonaffiliates to market to you |
No
|
We
don't share |
| Questions?
|
Call
800-225-2606 or go to mfs.com. |
| Who
we are |
| Who
is providing this notice? |
MFS
Funds, MFS Investment Management, MFS Institutional Advisors, Inc., and MFS Heritage Trust Company. |
| What
we do |
How
does MFS
protect my personal
information? |
To
protect your personal information from unauthorized access and use, we use security measures that comply with federal law. These measures include procedural, electronic, and physical safeguards for the protection of the personal information we
collect about you. |
How
does MFS
collect my personal
information? |
We
collect your personal information, for example, when you |
| • open
an account or provide account information |
| • direct
us to buy securities or direct us to sell your securities |
| • make
a wire transfer |
| We
also collect your personal information from others, such as credit bureaus, affiliates, or other companies. |
| Why
can't I limit all sharing? |
Federal
law gives you the right to limit only |
| • sharing
for affiliates' everyday business purposes – information about your creditworthiness |
| • affiliates
from using your information to market to you |
| • sharing
for nonaffiliates to market to you |
| State
laws and individual companies may give you additional rights to limit sharing. |
| Definitions
|
| Affiliates
|
Companies
related by common ownership or control. They can be financial and nonfinancial companies. |
| •
MFS does not share personal information with affiliates, except for everyday business purposes as described on page one of this notice. |
| Nonaffiliates
|
Companies
not related by common ownership or control. They can be financial and nonfinancial companies. |
| •
MFS does not share with nonaffiliates so they can market to you. |
| Joint
marketing |
A
formal agreement between nonaffiliated financial companies that together market financial products or services to you. |
| •
MFS doesn't jointly market. |
| Other
important information |
| If
you own an MFS product or receive an MFS service in the name of a third party such as a bank or broker-dealer, their privacy policy may apply to you instead of ours. |
Save paper with eDelivery.
MFS® will send you prospectuses, reports, and proxies directly via e-mail so you will get information faster with less mailbox clutter.
To sign up:
1. Go to mfs.com.
2. Log in via MFS® Access.
3. Select eDelivery.
If you own your MFS fund shares through a financial institution
or a retirement plan, MFS® TALK, MFS® Access,
or eDelivery may not be available to you.
CONTACT
WEB SITE
mfs.com
MFS TALK
1-800-637-8255
24 hours a day
ACCOUNT SERVICE AND LITERATURE
Shareholders
1-800-225-2606
Financial advisors
1-800-343-2829
Retirement plan services
1-800-637-1255
MAILING ADDRESS
MFS Service Center, Inc.
P.O. Box 219341
Kansas City, MO 64121-9341
OVERNIGHT MAIL
MFS Service Center, Inc.
Suite 219341
430 W 7th Street
Kansas City, MO 64105-1407
Item 1(b):
Not applicable
The Registrant has adopted a Code of Ethics (the “Code”) pursuant to Section 406 of the Sarbanes-Oxley Act and as defined in Form N-CSR that applies
to the Registrant’s principal executive officer and principal financial and accounting officer. During the period covered by this report, the Registrant has not amended any provision in its Code that relates to an element of the Code’s
definition enumerated in paragraph (b) of Item 2 of this Form N-CSR. During the period covered by this report, the Registrant did not grant a waiver, including an implicit waiver, from any provision of
the Code.
A copy of the Code of Ethics is filed as an exhibit to this Form N-CSR.
| ITEM 3. |
AUDIT COMMITTEE FINANCIAL EXPERT. |
Messrs. Steven E. Buller, James Kilman, and Clarence Otis, Jr. and Ms. Maryanne L. Roepke, members of the Audit Committee, have been determined by the Board of Trustees in their reasonable
business judgment to meet the definition of “audit committee financial expert” as such term is defined in Form N-CSR. In addition, Messrs. Buller, Kilman, and Otis and Ms. Roepke are
“independent” members of the Audit Committee (as such term has been defined by the Securities and Exchange Commission in regulations implementing Section 407 of the Sarbanes-Oxley Act of 2002). The Securities and Exchange Commission
has stated that the designation of a person as an audit committee financial expert pursuant to this Item 3 on the Form N-CSR does not impose on such a person any duties, obligations or liability that are
greater than the duties, obligations or liability imposed on such person as a member of the Audit Committee and the Board of Trustees in the absence of such designation or identification.
| ITEM 4. |
PRINCIPAL ACCOUNTANT FEES AND SERVICES. |
Items 4(a) through 4(d) and 4(g):
The Board of Trustees has appointed Ernst &
Young LLP (“E&Y”) to serve as independent accountants to the series of the Registrant (each a “Fund” and collectively the “Funds”). The tables below set forth the audit fees billed to each Fund as well as fees for non-audit services provided to each Fund and/or to each Fund’s investment adviser, Massachusetts Financial Services Company (“MFS”) and to various entities either controlling, controlled by, or under
common control with MFS that provide ongoing services to the Fund (“MFS Related Entities”).
For the fiscal years ended July 31, 2021 and 2020, audit fees billed to each Fund by E&Y were as
follows:
|
|
|
|
|
|
|
|
|
| |
|
Audit Fees |
|
| |
2021 |
|
|
2020 |
|
| Fees billed by E&Y: |
|
|
|
|
|
|
|
|
| MFS Emerging Markets Equity Research Fund** |
|
|
26,300 |
|
|
|
N/A |
** |
| MFS Equity Income Fund |
|
|
42,394 |
|
|
|
41,819 |
|
| Total |
|
|
68,694 |
|
|
|
41,819 |
|
For the fiscal years ended July 31, 2021 and 2020, fees billed by E&Y for audit-related, tax and other services
provided to each Fund and for audit-related, tax and other services provided to MFS and MFS Related Entities were as follows:
|
|
|
|
|
|
|
|
|
|
|
|
|
|
|
|
|
|
|
|
|
|
|
|
|
| |
|
Audit-Related
Fees1 |
|
|
Tax Fees2 |
|
|
All Other Fees3 |
|
| |
2021 |
|
|
2020 |
|
|
2021 |
|
|
2020 |
|
|
2021 |
|
|
2020 |
|
| Fees billed by E&Y: |
|
|
|
|
|
|
|
|
|
|
|
|
|
|
|
|
|
|
|
|
|
|
|
|
| To MFS Emerging Markets Equity Research Fund** |
|
|
0 |
|
|
|
N/A |
** |
|
|
9,800 |
|
|
|
N/A |
** |
|
|
1,000 |
|
|
|
N/A |
** |
| MFS Equity Income Fund |
|
|
0 |
|
|
|
0 |
|
|
|
9,340 |
|
|
|
9,213 |
|
|
|
1,050 |
|
|
|
1,055 |
|
| Total fees billed by E&Y To above Funds |
|
|
0 |
|
|
|
0 |
|
|
|
19,140 |
|
|
|
9,213 |
|
|
|
2,050 |
|
|
|
1,055 |
|
|
|
|
|
| |
|
Audit-Related Fees1 |
|
|
Tax Fees2 |
|
|
All Other Fees3 |
|
| |
|
2021 |
|
|
2020 |
|
|
2021 |
|
|
2020 |
|
|
2021 |
|
|
2020 |
|
| Fees billed by E&Y: |
|
|
|
|
|
|
|
|
|
|
|
|
|
|
|
|
|
|
|
|
|
|
|
|
| To MFS and MFS Related Entities of MFS Emerging Markets Equity Research Fund*** |
|
|
1,760,124 |
|
|
|
N/A |
** |
|
|
0 |
|
|
|
N/A |
** |
|
|
107,150 |
|
|
|
N/A |
** |
| To MFS and MFS Related Entities of MFS Equity Income Fund* |
|
|
1,760,124 |
|
|
|
1,785,703 |
|
|
|
0 |
|
|
|
0 |
|
|
|
107,150 |
|
|
|
104,750 |
|
|
|
|
|
|
|
|
|
|
| |
|
Aggregate fees for non-audit
services: |
|
| |
2021 |
|
|
2020 |
|
| Fees billed by E&Y: |
|
|
|
|
|
|
|
|
| To MFS Emerging Markets Equity Research Fund, MFS and MFS Related Entities#** |
|
|
2,144,504 |
|
|
|
N/A |
** |
| To MFS Equity Income Fund, MFS and MFS Related Entities# |
|
|
2,144,094 |
|
|
|
2,079,721 |
|
| ** |
MFS Emerging Markets Equity Research Fund commenced investment operations on February 23, 2021. |
| * |
This amount reflects the fees billed to MFS and MFS Related Entities for non-audit services relating directly
to the operations and financial reporting of the Funds (portions of which services also related to the operations and financial reporting of other funds within the MFS Funds complex). |
| # |
This amount reflects the aggregate fees billed by E&Y for non-audit services rendered to the Funds
and for non-audit services rendered to MFS and the MFS Related Entities. |
| 1 |
The fees included under “Audit-Related Fees” are fees related to assurance and related services that are reasonably related to the
performance of the audit or review of financial statements, but not reported under ‘‘Audit Fees,’’ including accounting consultations, agreed-upon procedure reports, attestation reports, comfort letters and internal control
reviews. |
| 2 |
The fees included under “Tax Fees” are fees associated with tax compliance, tax advice and tax planning, including services relating to the
filing or amendment of federal, state or local income tax returns, regulated investment company qualification reviews and tax distribution and analysis. |
| 3 |
The fees under “All Other Fees” are fees for products and services provided by E&Y other than those reported under “Audit
Fees,” “Audit-Related Fees” and “Tax Fees”, including fees for services related to reviews of internal controls and Rule 38a-1 compliance program. |
Item 4(e)(1):
Set forth below are the policies and procedures established by the Audit Committee of the Board of Trustees relating to the pre-approval of audit and non-audit related services:
To the extent required by applicable law,
pre-approval by the Audit Committee of the Board is needed for all audit and permissible non-audit services rendered to the Fund and all permissible non-audit services rendered to MFS or MFS Related Entities if the services relate directly to the operations and financial reporting of the Registrant. Pre-approval is
currently on an engagement-by-engagement basis. In the event pre-approval of such services is necessary between regular meetings
of the Audit Committee and it is not practical to wait to seek pre-approval at the next regular meeting of the Audit Committee, pre-approval of such services may be
referred to the Chair of the Audit Committee for approval; provided that the Chair may not pre-approve any individual engagement for such services exceeding $50,000 or multiple engagements for such services in
the aggregate exceeding $100,000 in each period between regular meetings of the Audit Committee. Any engagement pre-approved by the Chair between regular meetings of the Audit Committee shall be presented for
ratification by the entire Audit Committee at its next regularly scheduled meeting.
Item 4(e)(2):
None, or 0%, of the services relating to the Audit-Related Fees, Tax Fees and All Other Fees paid by the Fund and MFS and MFS Related Entities relating
directly to the operations and financial reporting of the Registrant disclosed above were approved by the audit committee pursuant to paragraphs (c)(7)(i)(C) of Rule 2-01 of Regulation S-X (which permits audit committee approval after the start of the engagement with respect to services other than audit, review or attest services, if certain conditions are satisfied).
Item 4(f):
Not
applicable.
Item 4(h):
The Registrant’s Audit Committee has considered whether the provision by a Registrant’s independent registered public accounting firm of non-audit
services to MFS and MFS Related Entities that were not pre-approved by the Committee (because such services did not relate directly to the operations and financial reporting of the Registrant) was compatible
with maintaining the independence of the independent registered public accounting firm as the Registrant’s principal auditors.
| ITEM 5. |
AUDIT COMMITTEE OF LISTED REGISTRANTS. |
Not applicable to the Registrant.
A schedule of investments for MFS Equity Income Fund and MFS Emerging Markets Equity Research Fund is included as part of the report to shareholders of
such series under Item 1(a) of this Form N-CSR.
| ITEM 7. |
DISCLOSURE OF PROXY VOTING POLICIES AND PROCEDURES FOR CLOSED-END MANAGEMENT INVESTMENT COMPANIES.
|
Not applicable to the Registrant.
| ITEM 8. |
PORTFOLIO MANAGERS OF CLOSED-END MANAGEMENT INVESTMENT COMPANIES. |
Not applicable to the Registrant.
| ITEM 9. |
PURCHASES OF EQUITY SECURITIES BY CLOSED-END MANAGEMENT INVESTMENT COMPANY AND AFFILIATED
PURCHASERS. |
Not applicable to the Registrant.
| ITEM 10. |
SUBMISSION OF MATTERS TO A VOTE OF SECURITY HOLDERS. |
There were no material changes to the procedures by which shareholders may send recommendations to the Board for nominees to the Registrant’s Board since the Registrant last provided disclosure as to
such procedures in response to the requirements of Item 407 (c)(2)(iv) of Regulation S-K or this Item.
| ITEM 11. |
CONTROLS AND PROCEDURES. |
| (a) |
Based upon their evaluation of the effectiveness of the registrant’s disclosure controls and procedures (as defined in Rule 30a-3(c) under the Investment Company Act of 1940 (the “Act”)) as conducted within 90 days of the filing date of this report on Form N-CSR, the registrant’s
principal financial officer and principal executive officer have concluded that those disclosure controls and procedures provide reasonable assurance that the material information required to be disclosed by the registrant on this report is
recorded, processed, summarized and reported within the time periods specified in the Securities and Exchange Commission’s rules and forms. |
| (b) |
There were no changes in the registrant’s internal controls over financial reporting (as defined in Rule
30a-3(d) under the Act) that occurred during the period covered by the report that have materially affected, or are reasonably likely to materially affect, the registrant’s internal control over financial
reporting. |
| ITEM 12. |
DISCLOSURE OF SECURITIES LENDING ACTIVITIES FOR CLOSED-END MANAGEMENT INVESTMENT COMPANIES.
|
Not applicable to the Registrant.
| a) (1) |
Any code of ethics, or amendment thereto, that is the subject of the disclosure required by Item 2, to the extent that the registrant intends
to satisfy the Item 2 requirements through filing of an exhibit: Attached hereto as EX-99.COE. |
| |
(2) |
A separate certification for each principal executive officer and principal financial officer of the registrant as required by Rule 30a-2(a) under the Act (17 CFR 270.30a-2): Attached hereto as EX-99.302CERT.
|
| |
(3) |
Any written solicitation to purchase securities under Rule 23c-1 under the Act (17 CFR 270.23c-1) sent or given during the period covered by the report by or on behalf of the registrant to 10 or more persons. Not applicable. |
| |
(4) |
Change in the registrant’s independent public accountant. Not applicable. |
| (b) |
If the report is filed under Section 13(a) or 15(d) of the Exchange Act, provide the certifications required by Rule 30a-2(b) under the Act (17 CFR 270.30a-2(b)), Rule 13a-14(b) or Rule 15d-14(b) under the
Exchange Act (17 CFR 240.13a-14(b) or 240.15d-14(b)) and Section 1350 of Chapter 63 of Title 18 of the United States Code (18 U.S.C. 1350) as an exhibit. A
certification furnished pursuant to this paragraph will not be deemed “filed” for the purposes of Section 18 of the Exchange Act (15 U.S.C. 78r), or otherwise subject to the liability of that section. Such certification will not be
deemed to be incorporated by reference into any filing under the Securities Act of 1933 or the Exchange Act, except to the extent that the registrant specifically incorporates it by reference. Attached hereto as EX-99.906CERT. |
Notice
A copy of the Amended and Restated Declaration of Trust, as amended, of the Registrant is on file with the Secretary of State of The Commonwealth of Massachusetts and notice is hereby given that this
instrument is executed on behalf of the Registrant by an officer of the Registrant as an officer and not individually and the obligations of or arising out of this instrument are not binding upon any of the Trustees or shareholders individually, but
are binding only upon the assets and property of the respective constituent series of the Registrant.
SIGNATURES
Pursuant to the requirements of the Securities Exchange Act of 1934 and the Investment Company Act of 1940, the registrant has duly caused this report to be signed on its behalf by the undersigned,
thereunto duly authorized.
(Registrant) MFS SERIES TRUST VII
|
|
|
| By (Signature and Title)* |
|
/S/ DAVID L. DILORENZO |
|
|
David L. DiLorenzo, President |
Date: September 15, 2021
Pursuant to the requirements of the Securities Exchange Act of 1934 and the Investment Company Act of 1940, this report has been signed below by the following persons on behalf of the registrant and in
the capacities and on the dates indicated.
|
|
|
| By (Signature and Title)* |
|
/S/ DAVID L. DILORENZO |
|
|
David L. DiLorenzo, President (Principal Executive Officer) |
Date: September 15, 2021
|
|
|
| By (Signature and Title)* |
|
/S/ JAMES O. YOST |
|
|
James O. Yost, Treasurer (Principal Financial Officer and Accounting Officer) |
Date: September 15, 2021
| * |
Print name and title of each signing officer under his or her signature. |
EX-99.COE

Code of Ethics for Principal Executive and Principal Financial Officers
Effective February 13, 2018
| I. |
Policy Purpose and Summary |
Section 406 of the Sarbanes-Oxley Act requires that each MFS Fund registered under the Investment Company Act of 1940 disclose whether or not it has adopted a code of ethics for senior financial
officers, applicable to its principal financial officer and principal accounting officer.
| |
A. |
Covered Officers/Purpose of the Code |
This code of ethics (this “Code”) has been adopted by the funds (collectively, “Funds” and each, “Fund”) under supervision of the MFS Funds Board (the “Board”) and
applies to the Funds’ Principal Executive Officer and Principal Financial Officer (the “Covered Officers” each of whom is set forth in Exhibit A) for the purpose of promoting:
| |
• |
|
honest and ethical conduct, including the ethical handling of actual or apparent conflicts of interest between personal and professional relationships;
|
| |
• |
|
full, fair, accurate, timely and understandable disclosure in reports and documents that the Funds file with, or submit to, the Securities and Exchange
Commission (“SEC”) and in other public communications made by the Funds; |
| |
• |
|
compliance by the Funds with applicable laws and governmental rules and regulations; |
| |
• |
|
the prompt internal reporting of violations of the Code to an appropriate person or persons identified in the Code; and |
| |
• |
|
accountability for adherence to the Code. |
Each Covered Officer should adhere to a high standard of business ethics and should be sensitive to situations that may give rise to actual as well as apparent conflicts of interest. In addition, each
Covered Officer should not place his or her personal interests ahead of the Funds’ interests and should endeavor to act honestly and ethically. In furtherance of the foregoing, each Covered Officer must:
| |
• |
|
not use his or her personal influence or personal relationships improperly to influence investment decisions or financial reporting for any Fund
whereby the Covered Officer would benefit personally to the detriment of the Fund; and |
| |
• |
|
not cause a Fund to take action, or fail to take action, for the individual personal benefit of the Covered Officer rather than the benefit the Fund.
|
The following activities, which could create the appearance of a conflict of interest, are permitted only
with the approval of the Funds’ Chief Legal Officer (“CLO”):
| |
• |
|
service as a director on the board of any “for profit” company other than the board of the Funds’ investment adviser or its subsidiaries
or board of a pooled investment vehicle sponsored by the Funds’ investment adviser or its subsidiaries; |
| |
• |
|
running for political office; |
| |
• |
|
the receipt of any Fund business-related gift or any entertainment from any company with which a Fund has current or prospective business dealings
unless such gift or entertainment is permitted by the gifts and entertainment policy of the Funds’ investment adviser; |
| |
• |
|
any material ownership interest in, or any consulting or employment relationship with, any Fund service providers (e.g., custodian banks, audit firms),
other than the Funds’ investment adviser, principal underwriter, administrator or any affiliated person thereof; |
| |
• |
|
a direct or indirect financial interest in commissions, transaction charges or spreads paid by a Fund for effecting portfolio transactions or for
selling or redeeming shares, other than an interest arising from the Covered Officer’s employment or securities ownership. |
| |
C. |
Disclosure and Compliance |
| |
• |
|
Each Covered Officer should familiarize himself or herself with the disclosure requirements generally applicable to the Funds;
|
| |
• |
|
each Covered Officer should not knowingly misrepresent, or cause others to misrepresent, facts about a Fund to others, whether within or outside the
Fund, including to the Fund’s trustees and auditors, and to governmental regulators and self-regulatory organizations; |
| |
• |
|
each Covered Officer should, to the extent appropriate within his or her area of Fund responsibility, consult with other officers and employees of the
Funds and the adviser with the goal of promoting full, fair, accurate, timely and understandable disclosure in the reports and documents the Funds file with, or submit to, the SEC and in other public communications made by the Funds; and
|
| |
• |
|
it is the responsibility of each Covered Officer to promote compliance within his or her area of Fund responsibility with the standards and
restrictions imposed by applicable laws, rules and regulations. |
| |
D. |
Reporting and Accountability |
Each Covered Officer must:
| |
• |
|
upon adoption of the Code (or thereafter as applicable, upon becoming a Covered Officer), affirm in writing to the Board that he or she has received,
read, and understands the Code; |
| |
• |
|
annually thereafter affirm to the Board that he or she has complied with the requirements of the Code; |
| |
• |
|
annually report to the CLO affiliations and relationships which are or may raise the appearance of a conflict of interest with the Covered
Officer’s duties to the Funds, as identified in the annual Trustee and Officer Questionnaire; |
| |
• |
|
not retaliate against any other Covered Officer or any officer or employee of the Funds or their affiliated persons for reports of potential violations
that are made in good faith; and |
| |
• |
|
notify the CLO promptly if he or she knows of any violation of this Code. Failure to do so is itself a violation of this Code.
|
The CLO is responsible for applying this Code to specific situations in which questions are presented under
it, granting waivers upon consultation with the Board or its designee, investigating violations, and has the authority to interpret this Code in any particular situation. The CLO will report requests for waivers to the Board (or a designee thereof)
promptly upon receipt of a waiver request and will periodically report to the Board any approvals granted since the last report.
The CLO will take all appropriate action to investigate any potential violations reported to him or her and to report any violations to the Board. If the Board concurs that a violation has occurred, it
will consider appropriate action, which may include review of, and appropriate modifications to, applicable policies and procedures; notification to appropriate personnel of the investment adviser or its board; or a recommendation to dismiss the
Covered Officer.
Any changes to or waivers of this Code will, to the extent required, be disclosed as provided by SEC rules.
All reports and records prepared or maintained pursuant to this Code and under the direction of the CLO will be considered confidential and shall be maintained and protected accordingly. Except as
otherwise required by law or this Code, such matters shall not be disclosed to anyone other than the Funds’ Board, its counsel, counsel to the Board’s independent trustees and senior management and the board of directors of the Fund’s
investment adviser and its counsel.
The Code is intended solely for the internal use by the Funds and does not constitute an admission, by or on behalf of any Fund, as to any fact, circumstance, or legal conclusion.
The Board of Trustees of the Funds, including a majority of the Trustees who are not “interested persons” (as defined in the 1940 Act) of the Funds, shall review no less frequently than
annually, a report from the CLO regarding the affirmations of the principal executive officer and the principal financial officer as to compliance with this Code.
| IV. |
Interpretation and Escalation |
Breaches of the Code are reviewed by the CLO and communicated to the Board of Trustees of the affected Fund(s). Interpretations of this Policy shall be made from time to time by the CLO, as needed, and
questions regarding the application of this Policy to a specific set of facts are escalated to the CLO.
Section 406 of the Sarbanes-Oxley Act.
Adherence to this policy is monitored by the CLO.
This Code shall be the sole code of ethics adopted by the Funds for purposes of Section 406 of the Sarbanes-Oxley Act and the rules and forms applicable to registered investment companies thereunder.
Insofar as other policies or procedures of the Funds, the Funds’ adviser, principal underwriter, or other service providers govern or purport to govern the behavior or activities of the Covered Officers who are subject to this Code, they are
superseded by this Code to the extent that they overlap or conflict with the provisions of this Code. The Funds’ and their investment adviser’s codes of ethics under Rule 17j-1 under the Investment
Company Act and any other codes or policies or procedures adopted by the Funds or their investment adviser or other service providers are separate requirements and are not part of this Code.
Any amendments to this Code, other than amendments to Exhibit A, must be approved or ratified by a majority vote of the Board, including a majority of independent trustees.
All required books, records and other documentation shall be retained in accordance with MFS’ related record retention policy.
Additional procedures may need to be implemented by departments to properly comply with this policy.
Exhibit A
As of January 1, 2017
Persons Covered by this Code of Ethics
Funds’ Principal Executive Officer: David L.
DiLorenzo
Funds’ Principal Financial Officer: James O. Yost
EX-99.302CERT
MFS SERIES TRUST VII
CERTIFICATION PURSUANT TO SECTION 302 OF THE SARBANES-OXLEY ACT
I, James O. Yost,
certify that:
| 1. |
I have reviewed this report on Form N-CSR of MFS Series Trust VII; |
| 2. |
Based on my knowledge, this report does not contain any untrue statement of a material fact or omit to state a material fact necessary to make
the statements made, in light of the circumstances under which such statements were made, not misleading with respect to the period covered by this report; |
| 3. |
Based on my knowledge, the financial statements, and other financial information included in this report, fairly present in all material
respects the financial condition, results of operations, changes in net assets, and cash flows (if the financial statements are required to include a statement of cash flows) of the registrant as of, and for, the periods presented in this report;
|
| 4. |
The registrant’s other certifying officer and I are responsible for establishing and maintaining disclosure controls and procedures (as
defined in Rule 30a-3(c) under the Investment Company Act of 1940) and internal control over financial reporting (as defined in Rule 30a-3(d) under the Investment
Company Act of 1940) for the registrant and have: |
| |
a. |
Designed such disclosure controls and procedures, or caused such disclosure controls and procedures to be designed under our supervision, to
ensure that material information relating to the registrant, including its consolidated subsidiaries, is made known to us by others within those entities, particularly during the period in which this report is being prepared;
|
| |
b. |
Designed such internal control over financial reporting, or caused such internal control over financial reporting to be designed under our
supervision, to provide reasonable assurance regarding the reliability of financial reporting and the preparation of financial statements for external purposes in accordance with generally accepted accounting principles;
|
| |
c. |
Evaluated the effectiveness of the registrant’s disclosure controls and procedures and presented in this report our conclusions about the
effectiveness of the disclosure controls and procedures as of a date within 90 days prior to the filing date of this report based on such evaluation; and |
| |
d. |
Disclosed in this report any change in the registrant’s internal control over financial reporting that occurred during the period covered
by the report that has materially affected, or is reasonably likely to materially affect, the registrant’s internal control over financial reporting; and |
| 5. |
The registrant’s other certifying officer and I have disclosed to the registrant’s auditors and the audit committee of the
registrant’s board of directors (or persons performing the equivalent functions): |
| |
a. |
All significant deficiencies and material weaknesses in the design or operation of internal control over financial reporting which are
reasonably likely to adversely affect the registrant’s ability to record, process, summarize, and report financial information; and |
| |
b. |
Any fraud, whether or not material, that involves management or other employees who have a significant role in the registrant’s internal
control over financial reporting. |
|
|
|
|
|
| Date: September 15, 2021 |
|
|
|
/S/ JAMES O. YOST |
|
|
|
|
James O. Yost |
|
|
|
|
Treasurer (Principal Financial Officer and Accounting Officer) |
EX-99.302CERT
MFS SERIES TRUST VII
CERTIFICATION PURSUANT TO SECTION 302 OF THE SARBANES-OXLEY ACT
I, David L.
DiLorenzo, certify that:
| 1. |
I have reviewed this report on Form N-CSR of MFS Series Trust VII; |
| 2. |
Based on my knowledge, this report does not contain any untrue statement of a material fact or omit to state a material fact necessary to make
the statements made, in light of the circumstances under which such statements were made, not misleading with respect to the period covered by this report; |
| 3. |
Based on my knowledge, the financial statements, and other financial information included in this report, fairly present in all material
respects the financial condition, results of operations, changes in net assets, and cash flows (if the financial statements are required to include a statement of cash flows) of the registrant as of, and for, the periods presented in this report;
|
| 4. |
The registrant’s other certifying officer and I are responsible for establishing and maintaining disclosure controls and procedures (as
defined in Rule 30a-3(c) under the Investment Company Act of 1940) and internal control over financial reporting (as defined in Rule 30a-3(d) under the Investment
Company Act of 1940) for the registrant and have: |
| |
a. |
Designed such disclosure controls and procedures, or caused such disclosure controls and procedures to be designed under our supervision, to
ensure that material information relating to the registrant, including its consolidated subsidiaries, is made known to us by others within those entities, particularly during the period in which this report is being prepared;
|
| |
b. |
Designed such internal control over financial reporting, or caused such internal control over financial reporting to be designed under our
supervision, to provide reasonable assurance regarding the reliability of financial reporting and the preparation of financial statements for external purposes in accordance with generally accepted accounting principles;
|
| |
c. |
Evaluated the effectiveness of the registrant’s disclosure controls and procedures and presented in this report our conclusions about the
effectiveness of the disclosure controls and procedures as of a date within 90 days prior to the filing date of this report based on such evaluation; and |
| |
d. |
Disclosed in this report any change in the registrant’s internal control over financial reporting that occurred during the period covered
by the report that has materially affected, or is reasonably likely to materially affect, the registrant’s internal control over financial reporting; and |
| 5. |
The registrant’s other certifying officer and I have disclosed to the registrant’s auditors and the audit committee of the
registrant’s board of directors (or persons performing the equivalent functions): |
| |
a. |
All significant deficiencies and material weaknesses in the design or operation of internal control over financial reporting which are
reasonably likely to adversely affect the registrant’s ability to record, process, summarize, and report financial information; and |
| |
b. |
Any fraud, whether or not material, that involves management or other employees who have a significant role in the registrant’s internal
control over financial reporting. |
|
|
|
|
|
| Date: September 15, 2021 |
|
|
|
/S/ DAVID L. DILORENZO |
|
|
|
|
David L. DiLorenzo |
|
|
|
|
President (Principal Executive Officer) |
EX-99.906CERT
MFS SERIES TRUST VII
CERTIFICATION PURSUANT TO SECTION 906 OF THE SARBANES-OXLEY ACT
I, James O. Yost,
certify that, to my knowledge:
| 1. |
The Form N-CSR (the “Report”) of MFS Series Trust VII (the “Registrant”) fully
complies for the period covered by the Report with the requirements of Section 13(a) or 15(d) of the Securities Exchange Act of 1934; and |
| 2. |
The information contained in the Report fairly presents, in all material respects, the financial condition and results of operations of the
Registrant. |
|
|
|
|
|
| Date: September 15, 2021 |
|
|
|
/S/ JAMES O. YOST |
|
|
|
|
James O. Yost |
|
|
|
|
Treasurer (Principal Financial Officer and Accounting Officer) |
A signed original of this written statement required by Section 906 has been provided to the Registrant and will
be retained by the Registrant and furnished to the Securities and Exchange Commission or its staff upon request.
EX-99.906CERT
MFS SERIES TRUST VII
CERTIFICATION PURSUANT TO SECTION 906 OF THE SARBANES-OXLEY ACT
I, David L.
DiLorenzo, certify that, to my knowledge:
| 1. |
The Form N-CSR (the “Report”) of MFS Series Trust VII (the “Registrant”) fully
complies for the period covered by the Report with the requirements of Section 13(a) or 15(d) of the Securities Exchange Act of 1934; and |
| 2. |
The information contained in the Report fairly presents, in all material respects, the financial condition and results of operations of the
Registrant. |
|
|
|
|
|
| Date: September 15, 2021 |
|
|
|
/S/ DAVID L. DILORENZO |
|
|
|
|
David L. DiLorenzo |
|
|
|
|
President (Principal Executive Officer) |
A signed original of this written statement required by Section 906 has been provided to the Registrant and will
be retained by the Registrant and furnished to the Securities and Exchange Commission or its staff upon request.


 Tweet
Tweet Share
Share