

Form N-CSR INTEGRITY FUNDS For: Jul 31
 Tweet
Tweet Share
ShareN-CSR
UNITED STATES
SECURITIES AND EXCHANGE COMMISSION
Washington, D.C. 20549
FORM N-CSR
CERTIFIED
SHAREHOLDER REPORT OF REGISTERED
MANAGEMENT INVESTMENT COMPANIES
Investment Company Act file number: 811-07322
The Integrity Funds
(Exact name of registrant as specified in charter)
|
1 Main Street North, Minot, ND |
|
58703 |
|
(Address of principal offices) |
|
(Zip code) |
Brent Wheeler and/or Kevin Flagstad, PO Box 500, Minot, ND 58702
(Name and address of agent for service)
Registrant’s telephone number, including area code: 701-852-5292
Date of fiscal year end: July 31st
Date of reporting period: July 31, 2022
Item 1. REPORTS TO STOCKHOLDERS.

THE INTEGRITY FUNDS
Integrity Dividend Harvest Fund
Integrity ESG Growth & Income Fund
Integrity High Income Fund
Integrity Mid-North American Resources Fund
Integrity Short Term Government Fund
Annual Report | July 31, 2022
|
Investment
Adviser |
Principal
Underwriter |
|
Transfer Agent |
Custodian |
|
Independent
Registered Public Accounting Firm Cleveland, OH 44115 |
|
*The Funds are distributed through Integrity Funds Distributor, LLC. Member FINRA
IMPORTANT NOTE: Beginning on January 1, 2021, as permitted by regulations adopted by the Securities and Exchange Commission, paper copies of the Integrity Viking Funds’ (the “Funds”) annual and semi-annual shareholder reports will no longer be sent by mail, unless you specifically request paper copies of the shareholder reports from the Funds or from your financial intermediary, such as a broker-dealer or bank. Instead, shareholder reports will be available on the Funds’ website (https://www.integrityvikingfunds.com/Documents), and you will be notified by mail each time a report is posted and provided with a website link to access the report.
If you hold Fund shares through a financial intermediary and you already elected to receive shareholder reports electronically through your financial intermediary, you will not be affected by this change and you need not take any action. You may elect to receive shareholder reports and other communications from the Funds electronically by notifying your financial intermediary.
You may elect to receive all future shareholder reports in paper free of charge. You can inform your financial intermediary that you wish to continue receiving paper copies of your shareholder reports, or if you are a direct investor, by calling the Funds at 800-601-5593. Your election to receive reports in paper will apply to all Funds you hold directly or through your financial intermediary, as applicable.
INTEGRITY DIVIDEND HARVEST FUND
DEAR SHAREHOLDERS:
Enclosed is the annual report for Integrity Dividend Harvest Fund (the “Fund”) for the year ended July 31, 2022 (“the period”). The Fund’s portfolio and related financial statements are presented within for your review.
The period saw the S&P 500 TR Index (“S&P 500”) return -4.64%. The S&P 500 tumbled over 20% in just the first six months of 2022, marking the worst first half in over 50 years. Growth stocks sold off the hardest as the Federal Reserve began raising interest rates to combat 40-year-high inflation. Investors also had to digest that the U.S. economy shrank for a second quarter in a row. Typically, two quarters of negative growth for the economy is considered a recession. Ongoing geopolitical conflicts throughout the period, such as Russia’s invasion of Ukraine, also weighed on investors. All of these factors have contributed to increasing fears of global economic slowdown. While equity markets did rise near the end of the period, we have yet to see if stocks have made a bottom in this bear market.
Per the U.S. Bureau of Labor Statistics, the period began with an unemployment rate of 5.4% and ended the period at 3.5%, matching the low just before the COVID pandemic started. The unemployment rate spiked to 14.8% in April 2020 due to COVID lockdowns, but has been steadily declining since then.
The Federal Reserve’s Federal Open Market Committee began raising interest rates in an attempt to slow inflation. They voted to raise the federal funds rate by 0.25% at the March meeting, 0.50% at the May meeting, and 0.75% at both the June and July meetings. As of the end of the period, the target range for the federal funds rate stood at 2.25% to 2.50%, with market participants expecting further rate increases.
During the period, the Energy sector was the stand-out best performer. Oil prices were already climbing due to tight supply and demand when the Russia and Ukraine conflict intensified. With Russia being one of the world’s largest oil producers, this conflict caused the price of oil to jump to highs not seen in years. A number of sectors had negative returns for the period. After a long trend upwards, growth stocks were hit harder than most. Rising interest rates generally have a more negative impact on growth stocks. The Communication Services, Consumer Discretionary, and Information Technology sectors were some of the worst performing. Value stocks came back in favor after lagging the market for years as investors sought relative safety.
The Fund’s total returns for Class A, C, and I shares were 11.41%*, 10.54%*, and 11.68%*, respectively, for the year ended July 31, 2022 while the S&P 500 returned -4.64%. The Fund is in the Morningstar Large Value category which returned -0.07% over the same time period. The Fund outperformed its Morningstar category and the S&P 500. The Fund’s outperformance relative to the S&P 500 was primarily driven by an overweight allocation to Energy, stock selection in Healthcare, and stock selection in Communication Services. Detracting from relative performance was stock selection in Utilities.
The Fund seeks to maximize total return by emphasizing high current income with long term appreciation as a secondary objective, consistent with preservation of capital. The Portfolio Management Team (“Team”) considers dividend yield, dividend growth rate, earnings growth, price-to-earnings multiples, and balance sheet strength. The Team emphasizes dividend yield in selecting stocks for the Fund because the Team believes that, over time, dividend income can contribute significantly to total return and is a more consistent source of investment return than appreciation.
If you would like more frequent updates, visit our website at www.integrityvikingfunds.com for daily prices along with pertinent Fund information.
Sincerely,
The Portfolio Management Team
The views expressed are those of The Portfolio Management Team of Viking Fund Management. The views are subject to change at any time in response to changing circumstances in the market and are not intended to predict or guarantee the future performance of any individual security, market sector, the markets generally, or any of the funds in the Integrity Viking family of funds.
*Performance does not include applicable front-end or contingent deferred sales charges, which would have reduced the performance.
Performance data quoted above is historical. Past performance is no guarantee of future results. Current performance may be higher or lower than the performance data quoted. The principal value and investment return of an investment will fluctuate so that your shares, when redeemed, may be worth more or less than the original cost. You can obtain performance data current to the most recent month end (available within seven business days of the most recent month end) by calling 800-276-1262.
You should consider the Fund’s investment objectives, risks, charges, and expenses carefully before investing. For this and other important information, please obtain a Fund prospectus at no cost from your financial adviser and read it carefully before investing.
INTEGRITY DIVIDEND HARVEST FUND
PERFORMANCE (unaudited)
 Comparison of change in value of a $10,000
investment
Comparison of change in value of a $10,000
investment
Average Annual Total Returns for the periods ended July 31, 2022
|
|
1 year |
3 year |
5 year |
10 year |
Since Inception* |
|
Class A Without sales charge |
11.41% |
10.21% |
9.06% |
10.40% |
10.45% |
|
Class A With sales charge (5.00%) |
5.81% |
8.34% |
7.95% |
9.83% |
9.90% |
|
Class C Without CDSC |
10.54% |
9.38% |
8.25% |
N/A |
9.09% |
|
Class C With CDSC (1.00%) |
9.54% |
9.38% |
8.25% |
N/A |
9.09% |
|
Class I Without sales charge |
11.68% |
10.48% |
9.33% |
N/A |
9.16% |
|
* May 1, 2012 for Class A; August 3, 2015 for Class C; August 1, 2016 for Class I |
|||||
The total annual fund operating expense ratio (before expense waivers and reimbursements and including acquired fund fees and expenses) as of the most recent fiscal year-end was 1.44%, 2.19%, and 1.19% for Class A, C, and I, respectively. The net annual fund operating expense ratio (after expense waivers and reimbursements and excluding acquired fund fees and expenses) as of the most recent fiscal year-end was 0.95%, 1.70%, and 0.70% for Class A, C, and I, respectively. The Fund’s investment adviser has contractually agreed to waive fees and reimburse expenses through November 29, 2022 so that total annual fund operating expenses after fee waivers and expense reimbursements (excluding taxes, brokerage fees, commissions, extraordinary and non-recurring expenses, and acquired fund fees and expenses) do not exceed 0.95%, 1.70%, and 0.70% for Class A, C, and I, respectively. This expense limitation agreement may only be terminated or modified prior to November 29, 2022 with the approval of the Fund’s Board of Trustees.
The table and graph above do not reflect the deduction of taxes that a shareholder would pay on Fund distributions and redemptions of Fund shares. The graph comparing the Fund’s performance to a benchmark index provides you with a general sense of how the Fund performed. To put this information in context, it may be helpful to understand the special differences between the two. The Fund’s total return for the period shown appears with and without sales charges and includes Fund expenses and management fees. A securities index measures the performance of a theoretical portfolio. Unlike a fund, the index is unmanaged; there are no expenses that affect the results. In addition, few investors could purchase all of the securities to match the index. If they could, transaction costs and other expenses would be incurred. All Fund and benchmark returns include reinvested dividends.
INTEGRITY ESG GROWTH & INCOME FUND
DEAR SHAREHOLDERS:
Enclosed is the annual report for Integrity ESG Growth & Income Fund, (the “Fund”) for the year ended July 31, 2022 (“the period”). The Fund’s portfolio and related financial statements are presented within for your review.
The period saw the S&P 500 TR Index (“S&P 500”) return -4.64%. The S&P 500 tumbled over 20% in just the first six months of 2022, marking the worst first half in over 50 years. Growth stocks sold off the hardest as the Federal Reserve began raising interest rates to combat 40-year-high inflation. Investors also had to digest that the U.S. economy shrank for a second quarter in row. Typically, two quarters of negative growth for the economy is considered a recession. Ongoing geopolitical conflicts throughout the period, such as Russia’s invasion of Ukraine, also weighed on investors. All of these factors have contributed to increasing fears of global economic slowdown. While equity markets did rise near the end of the period, we have yet to see if stocks have made a bottom in this bear market.
Per the U.S. Bureau of Labor Statistics, the period began with an unemployment rate of 5.4% and ended the period at 3.5%, matching the low just before the COVID pandemic started. The unemployment rate spiked to 14.8% in April 2020 due to COVID lockdowns, but has been steadily declining since then.
The Federal Reserve’s Federal Open Market Committee began raising interest rates in an attempt to slow inflation. They voted to raise the federal funds rate by 0.25% at the March meeting, 0.50% at the May meeting, and 0.75% at both the June and July meetings. As of the end of the period, the target range for the federal funds rate stood at 2.25% to 2.50%, with market participants expecting further rate increases.
During the period, the Energy sector was the stand-out best performer. Oil prices were already climbing due to tight supply and demand when the Russia and Ukraine conflict intensified. With Russia being one of the world’s largest oil producers, this conflict caused the price of oil to jump to highs not seen in years. A number of sectors had negative returns for the period. After a long trend upwards, growth stocks were hit harder than most. Rising interest rates generally have a more negative impact on growth stocks. The Communication Services, Consumer Discretionary, and Information Technology sectors were some of the worst performing. Value stocks came back in favor after lagging the market for years as investors sought relative safety.
The Fund’s total returns for Class A, C, and I shares were -8.37%*, -9.05%*, and -8.12%*, respectively, for the year ended July 31, 2022 while the S&P 500 returned -4.64%. The Fund is in the Morningstar Large Blend category which returned -6.36% over the same time period. The Fund underperformed its Morningstar category and the S&P 500. The Fund’s underperformance relative to the S&P 500 was primarily driven by an underweight allocation to Energy and stock selection in Consumer Discretionary and Financials. Aiding relative performance was stock selection in Healthcare.
The Fund is managed using a blended growth and income investment strategy. We seek to invest primarily in domestic common stocks, balancing investments between growth & dividend paying stocks, depending on where we see the best value. We also try to emphasize companies we believe offer both attractive investment opportunities and demonstrate a positive awareness of their impact on the society in which they operate.
If you would like more frequent updates, visit our website at www.integrityvikingfunds.com for daily prices along with pertinent Fund information.
Sincerely,
The Portfolio Management Team
The views expressed are those of The Portfolio Management Team of Viking Fund Management. The views are subject to change at any time in response to changing circumstances in the market and are not intended to predict or guarantee the future performance of any individual security, market sector, the markets generally, or any of the funds in the Integrity Viking family of funds.
*Performance does not include applicable front-end or contingent deferred sales charges, which would have reduced the performance.
Performance data quoted above is historical. Past performance is no guarantee of future results. Current performance may be higher or lower than the performance data quoted. The principal value and investment return of an investment will fluctuate so that your shares, when redeemed, may be worth more or less than the original cost. You can obtain performance data current to the most recent month end (available within seven business days of the most recent month end) by calling 800-276-1262.
You should consider the Fund’s investment objectives, risks, charges, and expenses carefully before investing. For this and other important information, please obtain a Fund prospectus at no cost from your financial adviser and read it carefully before investing.
INTEGRITY ESG GROWTH & INCOME FUND
PERFORMANCE (unaudited)
 Comparison of change in value of a $10,000
investment
Comparison of change in value of a $10,000
investment
Average Annual Total Returns for the periods ended July 31, 2022
|
|
1 year |
3 year |
5 year |
10 year |
Since Inception* |
|
Class A Without sales charge |
-8.37% |
11.05% |
12.24% |
11.92% |
9.10% |
|
Class A With sales charge (5.00%) |
-12.94% |
9.17% |
11.10% |
11.34% |
8.90% |
|
Class C Without CDSC |
-9.05% |
10.44% |
11.65% |
N/A |
9.57% |
|
Class C With CDSC (1.00%) |
-9.95% |
10.44% |
11.65% |
N/A |
9.57% |
|
Class I Without sales charge |
-8.12% |
11.32% |
12.52% |
N/A |
12.41% |
|
* January 3, 1995 for Class A; August 3, 2015 for Class C; August 1, 2016 for Class I |
|||||
The total annual fund operating expense ratio (before expense waivers and reimbursements and including acquired fund fees and expenses) as of the most recent fiscal year-end was 1.80%, 2.55%, and 1.54% for Class A, C, and I, respectively. The net annual fund operating expense ratio (after expense waivers and reimbursements and excluding acquired fund fees and expenses) as of the most recent fiscal year-end was 1.24%, 1.99%, and .99% for Class A, C, and I, respectively. The Fund’s investment adviser has contractually agreed to waive fees and reimburse expenses through November 29, 2022 so that total annual fund operating expenses after fee waivers and expense reimbursements (excluding taxes, brokerage fees, commissions, extraordinary and non-recurring expenses, and acquired fund fees and expenses) do not exceed 1.24%, 1.99%, and .99% for Class A, C, and I, respectively. This expense limitation agreement may only be terminated or modified prior to November 29, 2022 with the approval of the Fund’s Board of Trustees.
The table and graph above do not reflect the deduction of taxes that a shareholder would pay on Fund distributions and redemptions of Fund shares. The graph comparing the Fund’s performance to a benchmark index provides you with a general sense of how the Fund performed. To put this information in context, it may be helpful to understand the special differences between the two. The Fund’s total return for the period shown appears with and without sales charges and includes Fund expenses and management fees. A securities index measures the performance of a theoretical portfolio. Unlike a fund, the index is unmanaged; there are no expenses that affect the results. In addition, few investors could purchase all of the securities to match the index. If they could, transaction costs and other expenses would be incurred. All Fund and benchmark returns include reinvested dividends. The results prior to August 1, 2009 were achieved while the Fund was managed by a different investment adviser. The current investment adviser may produce different investment results than those achieved by the previous investment adviser.
INTEGRITY HIGH INCOME FUND
DEAR SHAREHOLDERS:
Enclosed is the annual report for the Integrity High Income Fund (the “High Income Fund” or the “Fund”) for the year ended July 31, 2022. The Fund’s portfolio and related financial statements are presented within for your review.
Market Environment
During August and September 2021, the market continued its sideways move with spreads modestly tighter while yields had begun to increase. October and November were the first back-to-back negative return months for the high yield market since February and March 2020. Despite being negative in October, there was no real driver to returns until Fed rhetoric became more hawkish in November, which was followed by the outbreak of the Omicron variant which sent returns materially lower, spreads wider and yields higher. This move was reversed in December as the short-lived weakness was seen as a buying opportunity, and high yield finished the year with a +5.3% return as spreads completely absorbed the increase in interest rates. January was the worst return month of the first quarter 2022 and the high yield market sold off as the US Treasury rates quickly began rising and spreads widened by more than 50bps. During February and March, despite Russia’s invasion of Ukraine, high yield spreads actually tightened modestly, mostly moving sideways, as yields climbed higher. Despite being the tenth worst return quarter in history, BBs led the declines given rate volatility was more significant than spread volatility. Once first quarter 2022 earnings began rolling through, inflation and supply chain rhetoric drove investor sentiment despite an otherwise impressive first quarter. The sell-off to end the month resulted in April’s return of -3.6%, and this weakness continued into May before a somewhat surprising late month rally that led to the only positive return month this year. The first 10 days of June experienced a similar reprieve, and while spreads widened modestly, new issue activity resumed, and the market felt orderly. Following the higher-than-expected inflation print and the subsequent hawkish rate hike from the Fed, however, the high yield market finished June down more than 6%, capping off the historically bad start to the year with one of the worst single-month returns on record. July then marked a stark reversal in which the market returned over 6%, reversing the pain from the first half of the year despite no distinct catalyst within risk assets.
The high yield market decreased -7.73% for the trailing twelve-month period ending July 31st (as measured by the ICE BofA US High Yield Constrained Index, HUC0) as spreads widened 153 bps to 500 bps as yields increased 4.03% to 7.74%. Despite the significant widening earlier in the year, spreads and yields are 94 bps tighter and 1.21% lower than they were at the end of June. Higher quality outperformed for the trailing 12-month period, particularly during the second quarter and subsequent rally in July 2022; BB’s returned -7.16%, single-Bs -7.12%, and CCCs -12.19%. Energy, transportation and insurance were the best performing sectors over the last twelve months while banking, retail and healthcare underperformed.
Year-to-date, gross issuance of $72.9bn and net of $38.5bn compares to $330.9bn and $111.8bn through the first 7 months in 2021 and $483.0bn and $192.3bn for the full year. Following the record issuance in 2020 and 2021, only 6% of the high yield market matures by the end of 2023, so issuers have not been forced to issue bonds in 2022. Entering the year, M&A activity was expected to drive issuance, but given the volatility, M&A activity has been muted relative to expectations. The first half of 2022 experienced a record six-month outflow of -$45.0bn before July posted a $4bn inflow. Full year 2021 mutual fund outflows of -$13.6bn compare to 2020’s record inflows of $44.8bn.
2021 marked the lowest annual default volume since 2007 with just $4.1bn of defaults. Year-to-date, six companies have defaulted totaling $11.2bn. The trailing 12-month par weighted default rate hit its all-time low in April, 0.23%, and has since risen to 0.76%, remaining well below the long- term average of 3.5%. With a -7.73% return for the trailing twelve-month period ended July 31, 2022, high yield (HUC0) outperformed all other major fixed income asset classes except for 5-year Treasuries (GA05), -7.46%. Underperforming asset classes included U.S. Aggregate (D0A0), -9.26%, high-grade credit (C0A0), -12.35%, and emerging markets (EMCB), -15.32%.
Portfolio Performance and Positioning
For the trailing twelve-month period ended July 31, 2022, the Integrity High Income Fund returned -6.14% (A Class Shares, net of fees), -6.82% (C Class Shares, net of fees) and -6.04% (I Class Shares, net of fees) compared to its benchmark, the Bloomberg Barclays U.S. High Yield Index, which returned -8.02%. The Fund’s A Class Shares outperformed the benchmark for the twelve-month period as a result of security selection in the independent energy, cable satellite and chemicals sectors. The largest contributions to performance resulted from relative weightings in Chord Energy, Reichhold Industries, VICI Properties, VEON Ltd. and Ligado Networks.
Alternatively, relative performance was hindered by our security selection in the pharmaceuticals sector in addition to our underweights to both the aerospace/defense and refining sectors. Specifically, relative weightings in Bausch Health Companies, MYT Holdings, Intelsat SA, iHeartmedia and TransDigm Group detracted from performance in the period.
Compared to the benchmark on July 31, 2022, the Fund was overweight in the cable satellite, healthcare and consumer products sectors due to our view of the relative value opportunities within those sectors. The Fund was underweight in the finance companies, aerospace/defense and P&C sectors because we have not found these sectors attractive due to challenging fundamental outlooks or rich valuations. Relative to the benchmark on July 31, 2022, the Fund’s yield, spread and duration were all lower than those of the benchmark.
Market Outlook
It is important to remember that the high yield market entered this period of stress from a position of strength. Issuer fundamentals peaked in late 2021 and remain in good shape currently, lowly levered with coverage ratios at all-time highs, revenue and EBITDA growth, although margin pressures have certainly impacted the income statement and will continue to do so. With only 6% of the high yield market maturing by the end of 2023, high yield issuers have the luxury of patience regarding the capital markets. Limited distressed debt points to a low default environment for the remainder of 2022, and the higher credit quality market should keep a lid on spreads in the event we enter a recession. Following July’s strong performance, the market now screens fair to other asset classes, but is pricing in a lower probability of recession, believing the Fed may be able to execute a soft landing.
If you would like more frequent updates, visit our website at www.integrityvikingfunds.com for daily prices along with pertinent Fund information.
Sincerely,
Robert L. Cook Thomas G. Hauser
Managing Director Managing Director
J.P. Morgan Investment Management, Inc. J.P. Morgan Investment Management, Inc.
The views expressed are those of Robert L. Cook, Senior Portfolio Manager and Managing Director, and Thomas G. Hauser, Vice President, J.P. Morgan Investment Management, Inc. (“JPMIM”), sub-adviser to the Fund. The views are subject to change at any time in response to changing circumstances in the market and are not intended to predict or guarantee the future performance of any individual security, market sector, the markets generally, or any of the funds in the Integrity Viking family of funds.
*Performance does not include applicable front-end or contingent deferred sales charges, which would have reduced the performance.
Performance data quoted above is historical. Past performance is no guarantee of future results. Current performance may be higher or lower than the performance data quoted. The principal value and investment return of an investment will fluctuate so that your shares, when redeemed, may be worth more or less than the original cost. You can obtain performance data current to the most recent month end (available within seven business days of the most recent month end) by calling 800-276-1262.
You should consider the Fund’s investment objectives, risks, charges, and expenses carefully before investing. For this and other important information, please obtain a Fund prospectus at no cost from your financial adviser and read it carefully before investing.
INTEGRITY HIGH INCOME FUND
PERFORMANCE (unaudited)
 Comparison of change in value of a $10,000
investment
Comparison of change in value of a $10,000
investment
Average Annual Total Returns for the periods ended July 31, 2022
|
|
1 year |
3 year |
5 year |
10 year |
Since Inception* |
|
Class A Without sales charge |
-6.14% |
2.39% |
3.26% |
4.49% |
4.89% |
|
Class A With sales charge (4.25%) |
-10.13% |
0.93% |
2.37% |
4.05% |
4.65% |
|
Class C Without CDSC |
-6.82% |
1.67% |
2.50% |
3.73% |
4.09% |
|
Class C With CDSC (1.00%) |
-7.72% |
1.67% |
2.50% |
3.73% |
4.09% |
|
Class I Without sales charge |
-6.04% |
2.64% |
3.49% |
N/A |
4.54% |
|
* April 30, 2004 for Class A and C; August 1, 2016 for Class I |
|||||
The total annual fund operating expense ratio (before expense waivers and reimbursements and including acquired fund fees and expenses) as of the most recent fiscal year-end was 1.63%, 2.38%, and 1.38% for Class A, C, and I, respectively. The net annual fund operating expense ratio (after expense waivers and reimbursements and excluding acquired fund fees and expenses) as of the most recent fiscal year-end was 0.99%, 1.74%, and 0.74% for Class A, C, and I, respectively. The Fund’s investment adviser has contractually agreed to waive fees and reimburse expenses through November 29, 2022 so that total annual fund operating expenses after fee waivers and expense reimbursements (excluding taxes, brokerage fees, commissions, extraordinary and non-recurring expenses, and acquired fund fees and expenses) do not exceed 0.99%, 1.74%, and 0.74% for Class A, C, and I, respectively. This expense limitation agreement may only be terminated or modified prior to November 29, 2022 with the approval of the Fund’s Board of Trustees.
The table and graph above do not reflect the deduction of taxes that a shareholder would pay on Fund distributions and redemptions of Fund shares. The graph comparing the Fund’s performance to a benchmark index provides you with a general sense of how the Fund performed. To put this information in context, it may be helpful to understand the special differences between the two. The Fund’s total return for the period shown appears with and without sales charges and includes Fund expenses and management fees. A securities index measures the performance of a theoretical portfolio. Unlike a fund, the index is unmanaged; there are no expenses that affect the results. In addition, few investors could purchase all of the securities to match the index. If they could, transaction costs and other expenses would be incurred. All Fund and benchmark returns include reinvested dividends. The results prior to August 1, 2009 were achieved while the Fund was managed by a different investment adviser. The current investment adviser may produce different investment results than those achieved by the previous investment adviser.
INTEGRITY MID-NORTH AMERICAN RESOURCES FUND
DEAR SHAREHOLDERS:
Enclosed is the annual report for the Integrity Mid-North American Resources Fund (the “Fund”) for the year ended July 31, 2022 (“the period”). The Fund’s portfolio and related financial statements are presented within for your review.
Market Review
The period saw the S&P 500 TR Index (“S&P 500”) return -4.64%. The S&P 500 tumbled over 20% in just the first six months of 2022, marking the worst first half in over 50 years. Growth stocks sold off the hardest as the Federal Reserve began raising interest rates to combat 40-year-high inflation. Investors also had to digest that the U.S. economy shrank for a second quarter in row. Typically, two quarters of negative growth for the economy is considered a recession. Ongoing geopolitical conflicts throughout the period, such as Russia’s invasion of Ukraine, also weighed on investors. All of these factors have contributed to increasing fears of global economic slowdown. While equity markets did rise near the end of the period, we have yet to see if stocks have made a bottom in this bear market.
Per the U.S. Bureau of Labor Statistics, the period began with an unemployment rate of 5.4% and ended the period at 3.5%, matching the low just before the COVID pandemic started. The unemployment rate spiked to 14.8% in April 2020 due to COVID lockdowns, but has been steadily declining since then.
The Federal Reserve’s Federal Open Market Committee began raising interest rates in an attempt to slow inflation. They voted to raise the federal funds rate by 0.25% at the March meeting, 0.50% at the May meeting, and 0.75% at both the June and July meetings. As of the end of the period, the target range for the federal funds rate stood at 2.25% to 2.50%, with market participants expecting further rate increases.
During the period, the Energy sector was the stand-out best performer. A number of sectors had negative returns for the period. After a long trend upwards, growth stocks were hit harder than most. Rising interest rates generally have a more negative impact on growth stocks. The Communication Services, Consumer Discretionary, and Information Technology sectors were some of the worst performing. Value stocks came back in favor after lagging the market for years as investors sought relative safety.
Energy Review
Crude oil and energy equities started off the third quarter of 2021 weak in what appeared to be a brief period of consolidation. Energy equities made a big move in September by trading up nearly 10%.Weaker than expected global supply and rising demand caused higher crude oil and natural gas prices, this was the main culprit behind the big move in energy equities. Higher commodity prices have further enhanced the energy sector’s ability to return cash to shareholders. Over the quarter, we saw continued commitment to capital discipline as well as further adoption of ESG principles within the energy sector. Renewable energy was the worst performing group within the portfolio, driven by continued supply disruptions and higher rates.
For the third quarter of 2021, the Fund (Class A shares) fell -1.68% compared to a loss of -1.46% for the S&P 1500 Energy Index and a loss of -1.98% for the Morningstar Equity Energy category. WTI crude oil increased 5.84% to end the quarter at $75.03 and Brent crude oil increased 8.21% to end the quarter at $78.31.
Crude oil and energy equities continued to rally after a strong September. Crude Oil traded up over 10% (QTD) by the end of October but gave up all of those gains and then some by the end of November. The Omicron variant and concerns over economic shutdowns threatened crude oil demand. Over the month of December, crude oil traded up nearly 15% as fears over the Omicron variant waned. Energy equities largely followed suit, but didn’t see a recovery until the December 20th trough. Energy equities traded up over 5% from the low set in December. Catalysts continued to build for the energy sector as demand remained resilient, despite Omicron fears. Additionally, incremental OPEC barrels being added on a monthly basis were being absorbed by consumers.
For the fourth quarter of 2021, the Fund (Class A shares) returned 3.80% compared to a gain of 7.00% for the S&P 1500 Energy Index and a gain of 2.17% for the Morningstar Equity Energy category. WTI crude oil increased 2.20% to end the quarter at $75.21 and Brent crude oil increased 2.26% to end the quarter at $77.78.
The energy sector entered 2022 with strong momentum fueled by a magnitude of tailwinds, but the main story of the first quarter of 2022 will be the Russian invasion of Ukraine. Leading up to the invasion, crude oil traded up over 20%, only to accelerate post-invasion to trade at one point over $130/barrel. Lockdowns within China over a resurgence of COVID and an announced coordinated release of Strategic Petroleum Reserves caused oil to back off of its highs to end the quarter slightly above $100/barrel. Outside of China, demand for crude oil was fundamentally strong. The supply side is the driving force for crude oil as underinvestment is not allowing supply to keep pace with demand. Additionally, sanctions on Russia could equate to barrels not reaching the market. This has not been the case as of yet, but self-sanctions should become more impactful in the second quarter of 2022 and beyond. Activity levels rose dramatically over the first quarter, but capital discipline at the producer level remained intact. Oilfield service was the leading sector over the first quarter as pricing power began to improve.
For the first quarter of 2022, the Fund (Class A shares) returned 24.35% compared to a gain of 39.10% for the S&P 1500 Energy Index, and a gain of 32.93% for the Morningstar Equity Energy category. WTI crude oil increased 35.62% to end the quarter at $100.28 and Brent crude oil increased 37.07% to end the quarter at $104.71.
Both crude oil and energy equities continued to march higher over the majority of the second quarter and both asset classes hit a wall on June 8th. Rising COVID-19 concerns in China and recessionary fears caused panic and crude oil and energy equities traded down more than 20% from their June 8th highs. There was a fight brewing between the energy’s physical market and the financial market and the financial market won during the commodity pullback over the second quarter. The amount of crude oil traded each day is twenty times the physical market. To put that into perspective, around 100 million barrels of crude oil are consumed per day, however, 2 billion barrels are traded per day. It is easy to see how the financial markets can push crude oil in a direction that doesn’t align with the global inventories and supply and demand imbalances. Financial markets will continue to dictate shorter-term fluctuations, but the physical market will dictate long-term prices. Energy markets tightened over the second half of 2021 as crude oil demand recovered from COVID-19 pandemic more quickly than anticipated and growth in supply lagged. While we recognize that high energy prices and rising interest rates have the potential to push the global economy into a recession, we don’t believe it will translate into materially lower energy prices given the structural supply deficits.
For the second quarter of 2022, the Fund (Class A shares) returned -9.47% compared to a loss of -5.86% for the S&P 1500 Energy Index, and a loss of -10.05% for the Morningstar Equity Energy category. WTI crude oil increased 11.23% to end the quarter at $105.76 and Brent crude oil increased 9.66% to end the quarter at $109.03.
In the month of July, WTI crude prices fell 3.51% to close the month at $96.75. The Fund gained 10.70% in July, 0.52% ahead of the S&P 1500 Energy Index and 1.15% ahead of the Morningstar Equity Energy category.
The Fund’s total returns for Class A, C, and I shares were 37.38%*, 36.90%*, and 38.17%*, respectively, for the year ended July 31, 2022, compared to returns of 66.32%, -4.74%, and 47.65% for the S&P 1500 Energy Index, the S&P 1500 Index, and the Morningstar Equity Energy Category, respectively. Detracting from the Fund’s performance relative to its Morningstar category was overweight allocation to renewable energy and selection within oilfield service. Aiding relative performance was selection within exploration & production.
If you would like more frequent updates, please visit the Fund’s website at www.integrityvikingfunds.com for daily prices along with pertinent Fund information.
Sincerely,
The Portfolio Management Team
The views expressed are those of The Portfolio Management Team of Viking Fund Management, LLC (“Viking Fund Management”, “VFM”, or the “Adviser”). The views are subject to change at any time in response to changing circumstances in the market and are not intended to predict or guarantee the future performance of any individual security, market sector, the markets generally, or any of the funds in the Integrity Viking family of funds.
*Performance does not include applicable front-end or contingent deferred sales charges, which would have reduced the performance.
Performance data quoted above is historical. Past performance is no guarantee of future results. Current performance may be higher or lower than the performance data quoted. The principal value and investment return of an investment will fluctuate so that your shares, when redeemed, may be worth more or less than the original cost. You can obtain performance data current to the most recent month end (available within seven business days of the most recent month end) by calling 800-276-1262.
You should consider the Fund’s investment objectives, risks, charges, and expenses carefully before investing. For this and other important information, please obtain a Fund prospectus at no cost from your financial adviser and read it carefully before investing.
INTEGRITY MID-NORTH AMERICAN RESOURCES FUND
PERFORMANCE (unaudited)
 Comparison of change in value of a $10,000
investment
Comparison of change in value of a $10,000
investment
Average Annual Total Returns for the periods ended July 31, 2022
|
|
1 year |
3 year |
5 year |
10 year |
Since Inception* |
|
Class A Without sales charge |
37.38% |
7.95% |
2.00% |
1.92% |
5.23% |
|
Class A With sales charge (5.00%) |
30.41% |
6.08% |
0.96% |
1.40% |
5.00% |
|
Class C Without CDSC |
36.90% |
7.45% |
1.51% |
N/A |
-3.62% |
|
Class C With CDSC (1.00%) |
35.90% |
7.45% |
1.51% |
N/A |
-3.62% |
|
Class I Without sales charge |
38.17% |
8.57% |
2.52% |
N/A |
2.84% |
|
* April 5, 1999 for Class A; May 1, 2014 for Class C; August 1, 2016 for Class I |
|||||
The total annual fund operating expense ratio (before expense waivers and reimbursements and including acquired fund fees and expenses) as of the most recent fiscal year-end was 1.50%, 2.00%, and 1.00% for Class A, C, and I, respectively. The net annual fund operating expense ratio (after expense waivers and reimbursements and excluding acquired fund fees and expenses) as of the most recent fiscal year-end was 1.50%, 2.00%, and 1.00% for Class A, C, and I, respectively. The Fund’s investment adviser has contractually agreed to waive fees and reimburse expenses through November 29, 2022 so that total annual fund operating expenses after fee waivers and expense reimbursements (excluding taxes, brokerage fees, commissions, extraordinary and non-recurring expenses, and acquired fund fees and expenses) do not exceed 1.50%, 2.00%, and 1.00% for Class A, C, and I, respectively. This expense limitation agreement may only be terminated or modified prior to November 29, 2022 with the approval of the Fund’s Board of Trustees.
The table and graph above do not reflect the deduction of taxes that a shareholder would pay on Fund distributions and redemptions of Fund shares. The graph comparing the Fund’s performance to a benchmark index provides you with a general sense of how the Fund performed. To put this information in context, it may be helpful to understand the special differences between the two. The Fund’s total return for the period shown appears with and without sales charges and includes Fund expenses and management fees. A securities index measures the performance of a theoretical portfolio. Unlike a fund, the index is unmanaged; there are no expenses that affect the results. In addition, few investors could purchase all of the securities to match the index. If they could, transaction costs and other expenses would be incurred. All Fund and benchmark returns include reinvested dividends. The results prior to August 1, 2009 were achieved while the Fund was managed by a different investment adviser. The current investment adviser may produce different investment results than those achieved by the previous investment adviser. The Fund’s performance prior to November 10, 2008 was achieved under the previous investment strategy, which may have produced different results than the current investment strategy.
INTEGRITY SHORT TERM GOVERNMENT FUND
DEAR SHAREHOLDERS:
Enclosed is the annual report for the Integrity Short Term Government Fund (the “Fund”) for the year ended July 31, 2022. The Fund’s portfolio and related financial statements are presented within for your review.
Market Environment
During the period, the market experienced a sharp spike in Treasury yields across the entire yield curve. Strong inflation momentum along with concerns that the Federal Reserve has been behind the curve were key drivers of the interest rate changes. The Treasury yield curve flattened significantly between the 2-year and 10-year maturities, with the 2-year Treasury yield higher by 2.70% and the 10-year yield higher by 1.43%, reflecting the market’s dramatic repricing of swift monetary policy normalization by the Fed. As a result, the Bloomberg U.S. Aggregate Bond Index, a broad market fixed income measure, declined -9.12% over the 12 months ending July 31, 2022.
With the emergence of the new COVID variant Omicron at the end of November and its potential impact on the sustainability of economic growth and monetary policy, the Federal Reserve signaled on its December 2021 dot plot that it intended to hike only 3 times in 2022. The market at that time focused mainly on the pace of balance sheet runoff. By the end of March, not only did the Federal Reserve increase the Fed Funds rates by 25bps for the first time since the pandemic began, the March dot plot indicated that the Fed intended to hike 7 times in 2022 to bring the Fed Funds rates to 2.75% by year end.
By June, for the first time since 1994, the Fed raised the policy rate by 75 basis points. Fed Chair Powell subsequently acknowledged that there’s certainly a possibility of a recession given the central bank’s commitment to regain control over inflation by raising policy rates. Treasuries rallied into quarter end amid rising concerns that economic growth will slow given the aggressive Fed hike schedule. Spreads of Agency MBS and corporate credit securities widened significantly year to date, as both sectors underperformed similar duration Treasuries.
The Fed policy pivot is unsurprising given the inflation surge. Inflation is currently a global phenomenon. Notwithstanding the US Q1 GDP contraction of -1.6%, the May US consumer price index (CPI) increased by 8.6% year over year, and in addition showed a broadening trend across the underlying components. As the Fed’s policy stance grew increasingly hawkish throughout this year, there is a clear shift of emphasis within its dual mandate from full employment to price stability. In turn, the June University of Michigan’s gauge of consumer sentiment recorded its lowest reading on record dating back to 1972. The market is currently pricing in a higher risk of economic recession and subsequent reversal of Fed policy (i.e., rate cuts) by early mid-2023.
Portfolio Performance and Positioning
The Fund’s total returns for Class I and A shares were -4.18% and -4.51%, respectively, for the twelve month period ended July 31, 2022, compared to a return of -3.13% for the Bloomberg U.S. Government 1-3 Year Index. The Fund’s performance was driven mainly by the spread widening of the overall fixed income market, offset by the relatively stable cash flow and high interest income of our Agency MBS portfolio.
In our view, interest rate volatility-adjusted valuations on Agency MBS have approached levels reached during previous Fed quantitative tightening cycles. As interest rates stabilize, we see upside for Agency MBS returns. At these levels, Agency MBS yields are attractive relative to similar duration corporate credit and can cushion further potential interest rate increases. Given the very flat yield curve, we prefer short/intermediate maturity securitized products such as Agency MBS. Historically, the Treasury yield curve steepens with longer maturity yields increasing more (or decreasing less) relative to shorter maturity yields as the Fed approaches the end of a hiking cycle. This technical dynamic further supports shorter duration fixed income securities such as Agency MBS.
We continue to look for stable bonds that provide predictable cashflows at attractive spreads relative to the rest of the Agency MBS market. The portfolio is titled towards Agency MBS originated prior to the pandemic (i.e., “seasoned” MBS) and 15-year loan term securities seeking to mitigate the risk of duration extension in the context of much higher level of overall interest rates. Notably, refinancing volume has dropped sharply given the higher mortgage rates. In addition, we believe Agency Commercial Mortgage-Backed Securities offer good relative value given the bullet cash flow structure of underlying mortgage loans.
If you would like more frequent updates, please visit the Fund’s website at www.integrityvikingfunds.com for daily prices along with pertinent Fund information.
Sincerely,
The Portfolio Management Team
M.D. Sass Investors Services, Inc.
The views expressed are those of M.D. Sass Investor Services, Inc., sub-adviser to the Fund. The views are subject to change at any time in response to changing circumstances in the market and are not intended to predict or guarantee the future performance of any individual security, market sector, the markets generally, or any of the funds in the Integrity Viking family of funds.
*Performance does not include applicable front-end or contingent deferred sales charges, which would have reduced the performance.
Performance data quoted above is historical. Past performance is no guarantee of future results. Current performance may be higher or lower than the performance data quoted. The principal value and investment return of an investment will fluctuate so that your shares, when redeemed, may be worth more or less than the original cost. You can obtain performance data current to the most recent month end (available within seven business days of the most recent month end) by calling 800-276-1262.
You should consider the Fund’s investment objectives, risks, charges, and expenses carefully before investing. For this and other important information, please obtain a Fund prospectus at no cost from your financial adviser and read it carefully before investing.
INTEGRITY SHORT TERM GOVERNMENT FUND
PERFORMANCE (unaudited)
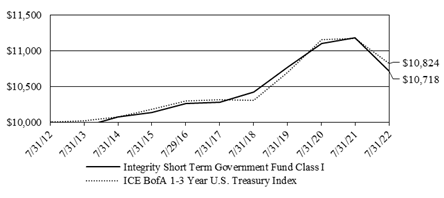
Comparison of change in value of a $10,000 investment
Average Annual Total Returns for the periods ended July 31, 2022
|
|
1 year |
3 year |
5 year |
10 year |
Since Inception* |
|
Class A Without sales charge |
-4.51% |
N/A |
N/A |
N/A |
1.64% |
|
Class A With sales charge (2.00%) |
-6.39% |
N/A |
N/A |
N/A |
-0.40% |
|
Class I Without sales charge |
-4.18% |
-0.18% |
0.84% |
0.70% |
0.92% |
|
* January 21, 2020 for Class A; June 30, 2011 for Class I |
|||||
The total annual fund operating expense ratio (before expense waivers and reimbursements and including acquired fund fees and expenses) for the year ended July 31, 2022 was 1.18% and 0.93% for Class A and Class I, respectively. The net annual fund operating expense ratio (after expense waivers and reimbursements and excluding acquired fund fees and expenses) for the year ended July 31, 2022 was 0.80% and 0.55% (annualized) for Class A and I, respectively. The Fund’s investment adviser has contractually agreed to waive fees and reimburse expenses through November 29, 2022 so that total annual fund operating expenses after fee waivers and expense reimbursements (excluding taxes, brokerage fees, commissions, extraordinary and non-recurring expenses, and acquired fund fees and expenses) do not exceed 0.80% and 0.55% for Class A and I, respectively. This expense limitation agreement may only be terminated or modified prior to November 29, 2022 with the approval of the Fund’s Board of Trustees.
The table and graph above do not reflect the deduction of taxes that a shareholder would pay on Fund distributions and redemptions of Fund shares. The graph comparing the Fund’s performance to a benchmark index provides you with a general sense of how the Fund performed. To put this information in context, it may be helpful to understand the special differences between the two. The Fund’s total return for the period shown appears with and without sales charges and includes Fund expenses and management fees. A securities index measures the performance of a theoretical portfolio. Unlike a fund, the index is unmanaged; there are no expenses that affect the results. In addition, few investors could purchase all of the securities to match the index. If they could, transaction costs and other expenses would be incurred. All Fund and benchmark returns include reinvested dividends.
INTEGRITY DIVIDEND HARVEST FUND
PORTFOLIO MARKET SECTORS July 31, 2022
|
Financials |
15.6% |
|
Consumer Staples |
15.4% |
|
Health Care |
14.2% |
|
Information Technology |
12.9% |
|
Utilities |
11.7% |
|
Energy |
10.4% |
|
Communication Services |
7.0% |
|
Consumer Discretionary |
4.1% |
|
Industrials |
4.0% |
|
Cash Equivalents and Other |
2.4% |
|
Materials |
2.3% |
|
|
100.0% |
Market sectors are breakdowns of the Fund’s portfolio holdings into specific investment classes.
These percentages are based on net assets.
SCHEDULE OF INVESTMENTS July 31, 2022
|
Fair |
||||
|
Shares |
|
Value |
||
|
COMMON STOCKS (97.6%) |
||||
|
Communication Services (7.0%) |
||||
|
AT&T Inc |
140,000 |
$ |
2,629,200 |
|
|
BCE Inc |
115,000 |
5,810,950 |
||
|
Verizon Communications Inc |
200,000 |
9,238,000 |
||
|
|
17,678,150 |
|||
|
Consumer Discretionary (4.1%) |
||||
|
Genuine Parts Co |
16,500 |
2,522,355 |
||
|
Home Depot Inc/The |
9,000 |
2,708,460 |
||
|
McDonald's Corp |
9,000 |
2,370,330 |
||
|
Whirlpool Corp |
16,000 |
2,765,920 |
||
|
|
10,367,065 |
|||
|
Consumer Staples (15.4%) |
||||
|
British American Tobacco PLC |
65,000 |
2,546,050 |
||
|
Altria Group Inc |
144,000 |
6,315,840 |
||
|
Coca Cola Co/The |
118,000 |
7,572,060 |
||
|
Kimberly Clark Corp |
54,000 |
7,116,660 |
||
|
PepsiCo Inc |
37,000 |
6,473,520 |
||
|
Philip Morris International Inc |
62,000 |
6,023,300 |
||
|
Procter & Gamble Co/The |
20,000 |
2,778,200 |
||
|
|
38,825,630 |
|||
|
Energy (10.4%) |
||||
|
Coterra EnerCoterra Energy Inc |
146,000 |
4,466,140 |
||
|
Devon Energy Corp |
26,000 |
1,634,100 |
||
|
Diamondback Energy Inc |
33,000 |
4,224,660 |
||
|
Enbridge Inc |
95,000 |
4,268,350 |
||
|
Exxon Mobil Corp |
54,000 |
5,234,220 |
||
|
Pioneer Natural Resources Co |
17,000 |
4,028,150 |
||
|
TransCanada Corp |
44,000 |
2,346,080 |
||
|
|
26,201,700 |
|||
|
Financials (15.6%) |
||||
|
Allstate Corp/The |
30,000 |
3,509,100 |
||
|
BlackRock Inc |
9,000 |
6,022,620 |
||
|
CME Group Inc |
10,000 |
1,994,800 |
||
|
JPMorgan Chase & Co |
68,000 |
7,844,480 |
||
|
Morgan Stanley |
60,000 |
5,058,000 |
||
|
Old Republic International Corp |
180,000 |
4,188,600 |
||
|
Prudential Financial Inc |
26,000 |
2,599,740 |
||
|
Truist Financial Corp |
73,000 |
3,684,310 |
||
|
US Bancorp |
90,000 |
4,248,000 |
||
|
|
39,149,650 |
|||
|
Health Care (14.2%) |
||||
|
AbbVie Inc |
110,000 |
15,786,100 |
||
|
Johnson & Johnson |
34,000 |
5,933,680 |
||
|
Merck & Co Inc |
72,000 |
6,432,480 |
||
|
Pfizer Inc |
148,000 |
7,475,480 |
||
|
|
35,627,740 |
|||
|
Industrials (4.0%) |
||||
|
Caterpillar Inc |
15,000 |
2,973,750 |
||
|
Illinois Tool Works Inc |
14,000 |
2,908,640 |
||
|
Lockheed Martin Corp |
5,700 |
2,358,717 |
||
|
3M Co |
13,000 |
1,862,120 |
||
|
|
10,103,227 |
|||
|
Information Technology (12.9%) |
||||
|
Broadcom Inc |
29,000 |
15,528,920 |
||
|
Cisco Systems Inc |
66,000 |
2,994,420 |
||
|
Intel Corp |
90,000 |
3,267,900 |
||
|
International Business Machines Corp |
19,000 |
2,485,010 |
||
|
QUALCOMM Inc |
22,000 |
3,191,320 |
||
|
Texas Instruments Inc |
27,000 |
4,830,030 |
||
|
|
32,297,600 |
|||
|
Materials (2.3%) |
|
|
||
|
Air Products & Chemicals Inc |
10,000 |
2,482,300 |
||
|
LyondellBasell Industries NV |
36,000 |
|
3,208,320 |
|
|
|
5,690,620 |
|||
|
Utilities (11.7%) |
||||
|
AES Corp/The |
160,000 |
3,555,200 |
||
|
American Electric Power Co Inc |
62,500 |
6,160,000 |
||
|
Dominion Resources Inc/VA |
44,000 |
3,607,120 |
||
|
Duke Energy Corp |
23,000 |
2,528,390 |
||
|
Entergy Corp |
34,000 |
3,914,420 |
||
|
NextEra Energy Inc |
85,000 |
7,181,650 |
||
|
Southern Co/The |
33,000 |
2,537,370 |
||
|
|
29,484,150 |
|||
|
TOTAL COMMON STOCKS (COST: $214,499,587) |
$ |
245,425,532 |
||
|
OTHER ASSETS LESS LIABILITIES (2.4%) |
$ |
6,107,390 |
||
|
NET ASSETS (100.0%) |
$ |
251,532,922 |
||
|
PLC - Public Limited Company |
||||
|
|
|
|
|
|
|
|
|
|
|
|
|
The accompanying notes are an integral part of these financial statements. |
||||
INTEGRITY ESG GROWTH & INCOME FUND
PORTFOLIO MARKET SECTORS July 31, 2022
|
Information Technology |
39.7% |
|
Consumer Discretionary |
11.7% |
|
Industrials |
11.3% |
|
Financials |
9.3% |
|
Health Care |
9.2% |
|
Communication Services |
6.9% |
|
Consumer Staples |
4.8% |
|
Cash Equivalents and Other |
3.0% |
|
Materials |
2.9% |
|
Utilities |
1.2% |
|
|
100.0% |
Market sectors are breakdowns of the Fund’s portfolio holdings into specific investment classes.
These percentages are based on net assets.
SCHEDULE OF INVESTMENTS July 31, 2022
|
Fair |
|||||
|
Shares |
|
Value |
|||
|
COMMON STOCKS (97.0%) |
|||||
|
Communication Services (6.9%) |
|||||
|
AT&T Inc |
65,000 |
$ |
1,220,700 |
||
|
Walt Disney Co/The |
22,000 |
2,334,200 |
|||
|
Verizon Communications Inc |
40,000 |
1,847,600 |
|||
|
|
5,402,500 |
||||
|
Consumer Discretionary (11.7%) |
|||||
|
Best Buy Co Inc |
10,000 |
769,900 |
|||
|
Home Depot Inc/The |
6,000 |
1,805,640 |
|||
|
Lowe's Cos Inc |
10,000 |
1,915,300 |
|||
|
Starbucks Corp |
26,000 |
2,204,280 |
|||
|
Target Corp |
15,000 |
2,450,700 |
|||
|
|
9,145,820 |
||||
|
Consumer Staples (4.8%) |
|||||
|
Kimberly Clark Corp |
14,000 |
1,845,060 |
|||
|
PepsiCo Inc |
11,000 |
1,924,560 |
|||
|
|
3,769,620 |
||||
|
Financials (9.3%) |
|||||
|
Bank of America Corp |
30,000 |
1,014,300 |
|||
|
BlackRock Inc |
3,000 |
2,007,540 |
|||
|
JPMorgan Chase & Co |
12,000 |
1,384,320 |
|||
|
PNC Financial Services Group Inc/The |
6,000 |
995,640 |
|||
|
S&P Global Inc |
5,000 |
1,884,650 |
|||
|
|
7,286,450 |
||||
|
Health Care (9.2%) |
|||||
|
*Edwards Lifesciences Corp |
20,000 |
2,010,800 |
|||
|
Thermo Fisher Scientific Inc |
5,000 |
2,992,050 |
|||
|
UnitedHealth Group Inc |
4,000 |
2,169,360 |
|||
|
|
7,172,210 |
||||
|
Industrials (11.3%) |
|||||
|
Caterpillar Inc |
5,500 |
1,090,375 |
|||
|
Deere & Co |
7,000 |
2,402,260 |
|||
|
FedEx Corp |
7,000 |
1,631,630 |
|||
|
Waste Management Inc |
13,000 |
2,139,280 |
|||
|
Trane Technologies PLC |
11,000 |
1,616,890 |
|||
|
|
8,880,435 |
||||
|
Information Technology (39.7%) |
|||||
|
*Advanced Micro Devices Inc |
17,000 |
1,605,990 |
|||
|
Apple Inc |
20,000 |
3,250,200 |
|||
|
Cisco Systems Inc |
35,000 |
1,587,950 |
|||
|
HP Inc |
38,000 |
1,268,820 |
|||
|
Intel Corp |
55,000 |
1,997,050 |
|||
|
Intuit Inc |
5,000 |
2,280,850 |
|||
|
KLA Tencor Corp |
6,000 |
2,301,240 |
|||
|
Lam Research Corp |
4,000 |
2,002,040 |
|||
|
Mastercard Inc |
7,000 |
2,476,530 |
|||
|
Microsoft Corp |
6,000 |
1,684,440 |
|||
|
NVIDIA Corp |
16,000 |
2,906,080 |
|||
|
QUALCOMM Inc |
20,000 |
2,901,200 |
|||
|
salesforce.com Inc |
9,000 |
1,656,180 |
|||
|
Visa Inc |
15,000 |
3,181,650 |
|||
|
|
31,100,220 |
||||
|
Materials (2.9%) |
|||||
|
Air Products & Chemicals Inc |
9,000 |
2,234,070 |
|||
|
|
|
||||
|
Utilities (1.2%) |
|||||
|
Exelon Corp |
21,000 |
|
976,290 |
||
|
TOTAL COMMON STOCKS (COST: $52,946,994) |
$ |
75,967,615 |
|||
|
OTHER ASSETS LESS LIABILITIES (3.0%) |
$ |
2,331,439 |
|||
|
NET ASSETS (100.0%) |
$ |
78,299,054 |
|||
|
* Non-income producing |
|||||
|
PLC - Public Limited Company |
|||||
|
|
|
|
|
|
|
|
|
|
|
|
|
|
|
The accompanying notes are an integral part of these financial statements. |
|
|
|
|
|
INTEGRITY HIGH INCOME FUND
PORTFOLIO MARKET SECTORS July 31, 2022
|
Consumer Discretionary |
25.0% |
|
Communication Services |
14.7% |
|
Industrials |
12.7% |
|
Health Care |
12.1% |
|
Energy |
11.3% |
|
Materials |
6.2% |
|
Information Technology |
6.1% |
|
Consumer Staples |
5.0% |
|
Cash Equivalents and Other |
3.0% |
|
Financials |
2.0% |
|
Utilities |
1.2% |
|
Real Estate |
0.7% |
|
|
100.0% |
Market sectors are breakdowns of the Fund’s portfolio holdings into specific investment classes.
These percentages are based on net assets.
SCHEDULE OF INVESTMENTS July 31, 2022
|
Principal |
Fair |
|||
|
Amount |
Value |
|||
|
CORPORATE BONDS (97.0%) |
||||
|
Communication Services (14.3%) |
||||
|
Altice France SA/France - 144A 8.125% 02/01/2027 Callable @ 104.063 08/01/2022 |
$ |
400,000 |
$ |
394,988 |
|
*(1)AMC Entertainment Holdings Inc - 144A 10.000% 06/15/2026 Callable @ 106.000 06/15/2023 |
27,692 |
21,925 |
||
|
Arches Buyer Inc - 144A 4.250% 06/01/2028 Callable @ 102.125 12/01/2023 |
70,000 |
59,868 |
||
|
Arches Buyer Inc - 144A 6.125% 12/01/2028 Callable @ 103.063 12/01/2023 |
17,000 |
13,940 |
||
|
Centerfield Media Parent Inc - 144A 6.625% 08/01/2026 Callable @ 103.313 08/01/2023 |
55,000 |
43,045 |
||
|
CenturyLink Inc - 144A 4.000% 02/15/2027 Callable @ 102.000 02/15/2023 |
315,000 |
290,588 |
||
|
Cinemark USA Inc - 144A 5.250% 07/15/2028 Callable @ 102.625 07/15/2024 |
45,000 |
40,163 |
||
|
Cinemark USA Inc - 144A 8.750% 05/01/2025 Callable @ 102.188 05/01/2023 |
28,000 |
28,889 |
||
|
CSC Holdings LLC - 144A 5.375% 02/01/2028 Callable @ 102.688 02/01/2023 |
200,000 |
190,000 |
||
|
CSC Holdings LLC - 144A 6.500% 02/01/2029 Callable @ 103.250 02/01/2024 |
400,000 |
387,796 |
||
|
Diamond Sports Group LLC / Diamond Sports Finance Co - 144A 5.375% 08/15/2026 Callable @ 102.688 08/15/2022 |
45,000 |
9,900 |
||
|
DIRECTV Holdings LLC / DIRECTV Financing Co Inc - 144A 5.875% 08/15/2027 Callable @ 104.406 08/15/2023 |
242,000 |
226,081 |
||
|
DISH Network Corp 3.375% 08/15/2026 |
73,000 |
51,943 |
||
|
Entercom Media Corp - 144A 6.500% 05/01/2027 Callable @ 103.250 05/01/2023 |
35,000 |
17,325 |
||
|
FRONTIER COMM HLDGS LLC 5.870% 11/01/2029 Callable @ 102.938 11/01/2024 |
14,737 |
12,379 |
||
|
Frontier Communications Corp - 144A 5.000% 05/01/2028 Callable @ 102.500 05/01/2024 |
183,000 |
171,972 |
||
|
Frontier Communications Corp - 144A 5.875% 10/15/2027 Callable @ 102.938 10/15/2023 |
47,000 |
46,302 |
||
|
Frontier Communications Corp - 144A 6.750% 05/01/2029 Callable @ 103.375 05/01/2024 |
9,000 |
8,007 |
||
|
Frontier Communications Holdings LLC - 144A 6.000% 01/15/2030 Callable @ 103.000 10/15/2024 |
27,000 |
22,682 |
||
|
Frontier Communications Holdings LLC - 144A 8.750% 05/15/2030 Callable @ 140.375 05/15/2025 |
8,000 |
8,526 |
||
|
Gannett Holdings LLC - 144A 6.000% 11/01/2026 Callable @ 103.000 11/01/2023 |
47,000 |
39,833 |
||
|
Gray Escrow II Inc - 144A 5.375% 11/15/2031 Callable @ 102.688 11/15/2026 |
84,000 |
74,130 |
||
|
Gray Escrow Inc - 144A 7.000% 05/15/2027 Callable @ 103.500 05/15/2023 |
72,000 |
72,133 |
||
|
Gray Television Inc - 144A 4.750% 10/15/2030 Callable @ 102.375 10/15/2025 |
118,000 |
101,407 |
||
|
iHeartCommunications Inc 6.375% 05/01/2026 Callable @ 101.594 05/01/2023 |
62,976 |
61,229 |
||
|
iHeartCommunications Inc 8.375% 05/01/2027 Callable @ 102.094 05/01/2023 |
164,489 |
148,501 |
||
|
iHeartCommunications Inc - 144A 4.750% 01/15/2028 Callable @ 102.375 01/15/2023 |
55,000 |
49,411 |
||
|
iHeartCommunications Inc - 144A 5.250% 08/15/2027 Callable @ 102.625 08/15/2022 |
210,000 |
191,289 |
||
|
+^(3)INTELSAT EMERGENCE SA ESCROW .000% 07/15/2025 |
90,000 |
9 |
||
|
+^(3)INTELSAT EMERGENCE SA ESCROW .000% 08/01/2023 |
146,000 |
15 |
||
|
+^(3)INTELSAT EMERGENCE SA ESCROW .000% 10/15/2024 |
172,000 |
17 |
||
|
Intelsat SA - 144A 6.500% 03/15/2030 Callable @ 100.000 03/15/2025 |
290,000 |
268,105 |
||
|
Level 3 Financing Inc 5.375% 05/01/2025 Callable @ 100.000 05/01/2023 |
60,000 |
60,081 |
||
|
Level 3 Financing Inc - 144A 3.625% 01/15/2029 Callable @ 101.813 01/15/2024 |
39,000 |
32,595 |
||
|
Level 3 Financing Inc - 144A 4.625% 09/15/2027 Callable @ 102.313 09/15/2022 |
140,000 |
127,966 |
||
|
Live Nation Entertainment Inc - 144A 3.750% 01/15/2028 Callable @ 102.813 01/15/2024 |
37,000 |
33,843 |
||
|
Live Nation Entertainment Inc - 144A 4.750% 10/15/2027 Callable @ 103.563 10/15/2022 |
185,000 |
176,213 |
||
|
Live Nation Entertainment Inc - 144A 5.625% 03/15/2026 Callable @ 101.406 03/15/2023 |
70,000 |
69,125 |
||
|
Live Nation Entertainment Inc - 144A 6.500% 05/15/2027 Callable @ 104.875 05/15/2023 |
273,000 |
280,166 |
||
|
Lumen Tech Inc 4.500% 01/15/2029 Callable @ 102.250 01/15/2024 |
40,000 |
31,700 |
||
|
Lumen Tech Inc 7.500% 04/01/2024 Callable @ 100.000 01/01/2024 |
118,000 |
121,257 |
||
|
Lumen Tech Inc - 144A 5.125% 12/15/2026 Callable @ 102.563 12/15/2022 |
182,000 |
166,075 |
||
|
Lumen Technologies Inc - 144A 5.375% 06/15/2029 Callable @ 102.688 06/15/2024 |
70,000 |
58,450 |
||
|
Mav Acquisition Corp - 144A 5.750% 08/01/2028 Callable @ 102.875 08/01/2024 |
75,000 |
67,423 |
||
|
Midas OpCo Holdings LLC - 144A 5.625% 08/15/2029 Callable @ 102.813 08/15/2024 |
93,000 |
78,097 |
||
|
Midcontinent Communications / Midcontinent Finance Corp - 144A 5.375% 08/15/2027 Callable @ 102.688 08/15/2022 |
60,000 |
56,700 |
||
|
National CineMedia LLC - 144A 5.875% 04/15/2028 Callable @ 102.938 04/15/2023 |
25,000 |
18,063 |
||
|
Netflix Inc 4.875% 04/15/2028 |
115,000 |
114,181 |
||
|
Netflix Inc 5.875% 11/15/2028 |
56,000 |
58,094 |
||
|
Netflix Inc - 144A 5.375% 11/15/2029 |
40,000 |
40,178 |
||
|
News Corp - 144A 3.875% 05/15/2029 Callable @ 100.000 05/15/2024 |
87,000 |
80,250 |
||
|
News Corp - 144A 5.125% 02/15/2032 Callable @ 102.563 02/15/2027 |
40,000 |
38,200 |
||
|
Nexstar Broadcasting Inc - 144A 4.750% 11/01/2028 Callable @ 102.375 11/01/2023 |
131,000 |
122,158 |
||
|
Nexstar Escrow Inc - 144A 5.625% 07/15/2027 Callable @ 102.813 07/15/2023 |
364,000 |
364,000 |
||
|
SBA Communications Corp 3.125% 02/01/2029 Callable @ 101.563 02/01/2024 |
58,000 |
50,750 |
||
|
Scripps Escrow II Inc - 144A 5.375% 01/15/2031 Callable @ 102.688 01/15/2026 |
15,000 |
12,563 |
||
|
Scripps Escrow Inc - 144A 5.875% 07/15/2027 Callable @ 102.938 07/15/2023 |
20,000 |
19,160 |
||
|
Sinclair Television Group Inc - 144A 4.125% 12/01/2030 Callable @ 102.063 12/01/2025 |
130,000 |
109,278 |
||
|
Sirius XM Radio Inc - 144A 3.875% 09/01/2031 Callable @ 101.938 09/01/2026 |
65,000 |
56,550 |
||
|
Sirius XM Radio Inc - 144A 4.000% 07/15/2028 Callable @ 102.000 07/15/2024 |
186,000 |
172,794 |
||
|
Sirius XM Radio Inc - 144A 4.125% 07/01/2030 Callable @ 102.063 07/01/2025 |
75,000 |
67,485 |
||
|
Sirius XM Radio Inc - 144A 5.500% 07/01/2029 Callable @ 102.750 07/01/2024 |
179,000 |
175,377 |
||
|
Sprint Capital Corp 6.875% 11/15/2028 |
175,000 |
196,438 |
||
|
*Sprint Capital Corp 8.750% 03/15/2032 |
316,000 |
409,220 |
||
|
*Sprint Corp 7.625% 02/15/2025 Callable @ 100.000 11/15/2024 |
174,000 |
185,281 |
||
|
Sprint Corp 7.625% 03/01/2026 Callable @ 100.000 11/01/2025 |
190,000 |
208,405 |
||
|
*T Mobile USA Inc 4.750% 02/01/2028 Callable @ 102.375 02/01/2023 |
310,000 |
309,423 |
||
|
Telecom Italia Capital SA 6.000% 09/30/2034 |
100,000 |
78,783 |
||
|
Telecom Italia Capital SA 6.375% 11/15/2033 |
12,000 |
10,007 |
||
|
TripAdvisor Inc - 144A 7.000% 07/15/2025 Callable @ 101.750 07/15/2023 |
9,000 |
8,978 |
||
|
United States Cellular Corp 6.700% 12/15/2033 |
105,000 |
104,336 |
||
|
Univision Communications Inc - 144A 4.500% 05/01/2029 Callable @ 102.250 05/01/2024 |
105,000 |
94,402 |
||
|
Univision Communications Inc - 144A 6.625% 06/01/2027 Callable @ 103.313 06/01/2023 |
15,000 |
15,038 |
||
|
Univision Communications Inc - 144A 7.375% 06/30/2030 Callable @ 103.688 06/30/2025 |
21,000 |
21,000 |
||
|
Zayo Group Holdings Inc - 144A 4.000% 03/01/2027 |
104,000 |
90,570 |
||
|
$ |
7,643,044 |
|||
|
Consumer Discretionary (23.7%) |
||||
|
1011778 BC ULC / New Red Finance Inc - 144A 3.500% 02/15/2029 Callable @ 101.750 02/15/2024 |
17,000 |
15,487 |
||
|
1011778 BC ULC / New Red Finance Inc - 144A 3.875% 01/15/2028 Callable @ 101.938 09/15/2022 |
73,000 |
68,638 |
||
|
1011778 BC ULC / New Red Finance Inc - 144A 4.000% 10/15/2030 Callable @ 102.000 10/15/2025 |
140,000 |
122,150 |
||
|
Allied Universal Holdco LLC / Allied Universal Finance Corp - 144A 6.625% 07/15/2026 Callable @ 101.656 07/15/2023 |
51,000 |
49,417 |
||
|
Allied Universal Holdco LLC / Allied Universal Finance Corp - 144A 9.750% 07/15/2027 Callable @ 102.438 07/15/2023 |
95,000 |
87,144 |
||
|
Allison Transmission Inc - 144A 5.875% 06/01/2029 Callable @ 102.938 06/01/2024 |
109,000 |
107,278 |
||
|
American Axle & Manufacturing Inc 5.000% 10/01/2029 Callable @ 102.500 10/01/2024 |
46,000 |
40,250 |
||
|
American Axle & Manufacturing Inc 6.250% 03/15/2026 Callable @ 100.000 03/15/2023 |
57,000 |
53,892 |
||
|
American Axle & Manufacturing Inc 6.500% 04/01/2027 Callable @ 102.167 04/01/2023 |
79,000 |
75,840 |
||
|
American Axle & Manufacturing Inc 6.875% 07/01/2028 |
171,000 |
161,688 |
||
|
Aramark Services Inc - 144A 5.000% 02/01/2028 Callable @ 102.500 02/01/2023 |
45,000 |
43,965 |
||
|
Asbury Automotive Group Inc 4.500% 03/01/2028 Callable @ 102.250 03/01/2023 |
77,000 |
70,459 |
||
|
Asbury Automotive Group Inc 4.750% 03/01/2030 Callable @ 102.375 03/01/2025 |
11,000 |
9,593 |
||
|
Asbury Automotive Group Inc - 144A 4.625% 11/15/2029 Callable @ 102.313 11/15/2024 |
138,000 |
121,802 |
||
|
Boyne USA Inc - 144A 4.750% 05/15/2029 Callable @ 102.375 05/15/2024 |
86,000 |
80,518 |
||
|
Caesars Entertainment Inc - 144A 4.625% 10/15/2029 Callable @ 102.313 10/15/2024 |
79,000 |
66,976 |
||
|
Caesars Entertainment Inc - 144A 8.125% 07/01/2027 Callable @ 104.063 07/01/2023 |
125,000 |
125,169 |
||
|
Carnival Corp - 144A 4.000% 08/01/2028 Callable @ 100.000 05/01/2028 |
64,000 |
55,840 |
||
|
Carnival Corp - 144A 5.750% 03/01/2027 Callable @ 100.000 12/01/2026 |
46,000 |
36,872 |
||
|
Carnival Corp - 144A 6.000% 05/01/2029 Callable @ 103.000 11/01/2024 |
59,000 |
45,307 |
||
|
Carnival Corp - 144A 10.500% 02/01/2026 Callable @ 105.250 08/01/2023 |
65,000 |
68,251 |
||
|
CCO Holdings LLC / CCO Holdings Capital Corp 4.250% 01/15/2034 Callable @ 102.125 01/15/2028 |
90,000 |
74,343 |
||
|
CCO Holdings LLC / CCO Holdings Capital Corp 4.500% 06/01/2033 Callable @ 102.250 06/01/2027 |
130,000 |
109,212 |
||
|
CCO Holdings LLC / CCO Holdings Capital Corp - 144A 4.250% 02/01/2031 Callable @ 102.125 07/01/2025 |
148,000 |
128,390 |
||
|
CCO Holdings LLC / CCO Holdings Capital Corp - 144A 4.500% 08/15/2030 Callable @ 102.250 02/15/2025 |
170,000 |
151,116 |
||
|
CCO Holdings LLC / CCO Holdings Capital Corp - 144A 4.750% 02/01/2032 Callable @ 102.375 02/01/2027 |
30,000 |
26,494 |
||
|
CCO Holdings LLC / CCO Holdings Capital Corp - 144A 4.750% 03/01/2030 Callable @ 102.375 09/01/2024 |
60,000 |
54,600 |
||
|
CCO Holdings LLC / CCO Holdings Capital Corp - 144A 5.000% 02/01/2028 Callable @ 102.500 08/01/2022 |
496,000 |
478,640 |
||
|
CCO Holdings LLC / CCO Holdings Capital Corp - 144A 5.125% 05/01/2027 |
524,000 |
513,937 |
||
|
CCO Holdings LLC / CCO Holdings Capital Corp - 144A 5.375% 06/01/2029 Callable @ 102.688 06/01/2024 |
240,000 |
228,708 |
||
|
CD&R Smokey Buyer Inc - 144A 6.750% 07/15/2025 Callable @ 101.688 07/15/2023 |
99,000 |
92,902 |
||
|
Cedar Fair LP 5.250% 07/15/2029 Callable @ 102.625 07/15/2024 |
40,000 |
38,259 |
||
|
Cedar Fair LP / Canada's Wonderland Co / Magnum Management Corp / Millennium Op - 144A 5.500% 05/01/2025 |
123,000 |
123,846 |
||
|
Clarios Global LP - 144A 6.750% 05/15/2025 |
45,000 |
45,356 |
||
|
Clarios Global LP / Clarios US Finance Co - 144A 8.500% 05/15/2027 Callable @ 102.125 05/15/2023 |
124,000 |
125,550 |
||
|
Clear Channel Outdoor Holdings Inc - 144A 7.500% 06/01/2029 Callable @ 103.750 06/01/2024 |
88,000 |
70,209 |
||
|
Clear Channel Outdoor Holdings Inc - 144A 7.750% 04/15/2028 Callable @ 103.875 04/15/2024 |
179,000 |
143,973 |
||
|
Clear Channel Worldwide Holdings Inc - 144A 5.125% 08/15/2027 Callable @ 102.563 08/15/2022 |
226,000 |
209,574 |
||
|
Constellation Merger Sub Inc - 144A 8.500% 09/15/2025 Callable @ 100.000 09/15/2022 |
45,000 |
39,555 |
||
|
Cooper Standard Automotive Inc -144A 5.625% 11/15/2026 Callable @ 101.875 11/15/2022 |
165,000 |
77,852 |
||
|
Cooper Standard Automotive Inc - 144A 13.000% 06/01/2024 |
130,000 |
138,450 |
||
|
Dana Inc 5.375% 11/15/2027 Callable @ 102.688 11/15/2022 |
20,000 |
18,800 |
||
|
Dana Inc 5.625% 06/15/2028 Callable @ 102.813 06/15/2023 |
67,000 |
62,293 |
||
|
DISH DBS Corp 5.000% 03/15/2023 |
161,000 |
157,981 |
||
|
*DISH DBS Corp 5.875% 11/15/2024 |
591,000 |
543,677 |
||
|
DISH DBS Corp 7.750% 07/01/2026 |
183,000 |
151,799 |
||
|
DISH DBS Corp - 144A 5.250% 12/01/2026 Callable @ 100.000 06/01/2026 |
330,000 |
285,450 |
||
|
DISH DBS Corp - 144A 5.750% 12/01/2028 Callable @ 100.000 12/01/2027 |
60,000 |
48,675 |
||
|
Dornoch Debt Merger Sub Inc - 144A 6.625% 10/15/2029 Callable @ 103.313 10/15/2024 |
110,000 |
82,258 |
||
|
Ford Motor Credit Co LLC 3.375% 11/13/2025 Callable @ 100.000 10/13/2025 |
200,000 |
189,535 |
||
|
*Ford Motor Credit Co LLC 4.271% 01/09/2027 |
200,000 |
191,440 |
||
|
Ford Motor Credit Co LLC 4.542% 08/01/2026 Callable @ 100.000 06/01/2026 |
200,000 |
194,199 |
||
|
Ford Motor Credit Co LLC 4.687% 06/09/2025 Callable @ 100.000 04/09/2025 |
670,000 |
665,196 |
||
|
*Ford Motor Credit Co LLC 5.125% 06/16/2025 Callable @ 100.000 05/16/2025 |
400,000 |
399,358 |
||
|
Gap Inc/The - 144A 3.625% 10/01/2029 Callable @ 101.813 10/01/2024 |
58,000 |
42,540 |
||
|
Gap Inc/The - 144A 3.875% 10/01/2031 Callable @ 101.938 10/01/2026 |
48,000 |
34,560 |
||
|
Garda World Security Corp 4.625% 02/15/2027 Callable @ 102.313 02/15/2023 |
30,000 |
27,065 |
||
|
Garda World Security Corp - 144A 6.000% 06/01/2029 Callable @ 103.000 06/01/2024 |
59,000 |
46,055 |
||
|
Garda World Security Corp - 144A 9.500% 11/01/2027 Callable @ 104.750 11/01/2022 |
80,000 |
74,848 |
||
|
GLP Capital LP / GLP Financing II Inc 5.250% 06/01/2025 |
17,000 |
16,851 |
||
|
Goodyear Tire & Rubber Co/The 5.000% 07/15/2029 Callable @ 100.000 04/15/2029 |
126,000 |
114,497 |
||
|
Goodyear Tire & Rubber Co/The 5.250% 04/30/2031 Callable @ 100.000 01/30/2031 |
41,000 |
36,798 |
||
|
Goodyear Tire & Rubber Co/The 5.250% 07/15/2031 Callable @ 100.000 04/15/2031 |
60,000 |
52,125 |
||
|
Hanesbrands Inc - 144A 4.875% 05/15/2026 |
35,000 |
34,066 |
||
|
Hilton Domestic Operating Co Inc 4.875% 01/15/2030 Callable @ 102.438 01/15/2025 |
54,000 |
52,448 |
||
|
Hilton Domestic Operating Co Inc - 144A 3.750% 05/01/2029 Callable @ 101.875 05/01/2024 |
18,000 |
16,299 |
||
|
Hilton Domestic Operating Co Inc - 144A 5.375% 05/01/2025 Callable @ 101.344 05/01/2023 |
12,000 |
12,000 |
||
|
Hilton Domestic Operating Co Inc - 144A 5.750% 05/01/2028 |
38,000 |
38,218 |
||
|
Hilton Worldwide Finance LLC / Hilton Worldwide Finance Corp 4.875% 04/01/2027 Callable @ 101.218 04/01/2023 |
68,000 |
66,810 |
||
|
Hughes Satellite Systems Corp 6.625% 08/01/2026 |
20,000 |
19,413 |
||
|
IRB Holding Corp - 144A 7.000% 06/15/2025 Callable @ 101.750 06/15/2023 |
50,000 |
51,150 |
||
|
L Brands Inc 6.750% 07/01/2036 |
35,000 |
31,763 |
||
|
L Brands Inc - 144A 9.375% 07/01/2025 |
3,000 |
3,136 |
||
|
Lithia Motors Inc 4.375% 01/15/2031 Callable @ 102.188 10/15/2025 |
36,000 |
32,670 |
||
|
Macy's Retail Holdings LLC - 144A 5.875% 03/15/2030 Callable @ 102.938 03/15/2025 |
15,000 |
12,859 |
||
|
Marriott Ownership Resorts Inc - 144A 4.500% 06/15/2029 Callable @ 102.250 06/15/2024 |
21,000 |
18,230 |
||
|
Marriott Ownership Resorts Inc - 144A 6.125% 09/15/2025 Callable @ 101.531 05/15/2023 |
21,000 |
21,105 |
||
|
Mattel Inc 3.750% 04/01/2029 Callable @ 101.875 04/01/2024 |
23,000 |
21,246 |
||
|
Mattel Inc - 144A 5.875% 12/15/2027 Callable @ 104.406 12/15/2022 |
68,000 |
69,530 |
||
|
MGM Growth Properties Operating Partnership LP / MGP Finance Co Issuer Inc 3.875% 02/15/2029 |
40,000 |
36,504 |
||
|
MGM Growth Properties Operating Partnership LP / MGP Finance Co Issuer Inc 4.500% 01/15/2028 Callable @ 100.000 10/15/2027 |
10,000 |
9,332 |
||
|
MGM Growth Properties Operating Partnership LP / MGP Finance Co Issuer Inc 4.500% 09/01/2026 Callable @ 100.000 06/01/2026 |
15,000 |
14,316 |
||
|
MGM Growth Properties Operating Partnership LP / MGP Finance Co Issuer Inc 4.625% 06/15/2025 Callable @ 100.000 03/15/2025 |
42,000 |
40,943 |
||
|
MGM Growth Properties Operating Partnership LP / MGP Finance Co Issuer Inc 5.625% 05/01/2024 Callable @ 100.000 02/01/2024 |
30,000 |
30,014 |
||
|
MGM Resorts International 5.500% 04/15/2027 Callable @ 100.000 01/15/2027 |
80,000 |
77,248 |
||
|
MGM Resorts International 5.750% 06/15/2025 Callable @ 100.000 03/15/2025 |
195,000 |
193,277 |
||
|
*MGM Resorts International 6.000% 03/15/2023 |
160,000 |
161,378 |
||
|
Newell Brands Inc 4.200% 04/01/2026 Callable @ 100.000 01/01/2026 |
31,000 |
30,602 |
||
|
Newell Brands Inc 5.375% 04/01/2036 Callable @ 100.000 10/01/2035 |
10,000 |
9,214 |
||
|
NMG Holding Co Inc / Neiman Marcus Group LLC - 144A 7.125% 04/01/2026 Callable @ 103.563 04/01/2023 |
140,000 |
137,470 |
||
|
Panther BF Aggregator 2 LP / Panther Finance Co Inc - 144A 6.250% 05/15/2026 Callable @ 101.563 05/15/2023 |
82,000 |
82,775 |
||
|
PetSmart Inc / PetSmart Finance Corp - 144A 4.750% 02/15/2028 Callable @ 102.375 02/15/2024 |
250,000 |
236,938 |
||
|
Photo Holdings Merger Sub Inc - 144A 8.500% 10/01/2026 Callable @ 104.250 10/01/2022 |
190,000 |
140,023 |
||
|
PM General Purchaser LLC - 144A 9.500% 10/01/2028 Callable @ 104.750 10/01/2023 |
72,000 |
62,640 |
||
|
Realogy Group LLC / Realogy Co- 144A Issuer Corp - 5.250% 04/15/2030 Callable @ 102.625 04/15/2025 |
107,000 |
85,343 |
||
|
Royal Caribbean Cruises Ltd - 144A 9.125% 06/15/2023 Callable @ 100.000 03/15/2023 |
9,000 |
9,136 |
||
|
Royal Caribbean Cruises Ltd - 144A 10.875% 06/01/2023 Callable @ 100.000 03/01/2023 |
26,000 |
26,585 |
||
|
Royal Caribbean Cruises Ltd - 144A 11.500% 06/01/2025 |
62,000 |
66,414 |
||
|
Ryman Hospitality Properties Inc 4.750% 10/15/2027 Callable @ 103.563 10/15/2022 |
170,000 |
164,050 |
||
|
Service Corp International/US 3.375% 08/15/2030 Callable @ 101.688 08/15/2025 |
37,000 |
32,884 |
||
|
Service Corp International/US 4.000% 05/15/2031 Callable @ 102.000 05/15/2026 |
12,000 |
11,041 |
||
|
Service Corp International/US 4.625% 12/15/2027 Callable @ 102.313 12/15/2022 |
40,000 |
39,448 |
||
|
Service Corp International/US 5.125% 06/01/2029 Callable @ 102.563 06/01/2024 |
38,000 |
38,000 |
||
|
Sirius XM Radio Inc - 144A 5.000% 08/01/2027 Callable @ 102.500 08/01/2022 |
226,000 |
224,140 |
||
|
Six Flags Entertainment Corp - 144A 4.875% 07/31/2024 Callable @ 100.000 07/31/2022 |
175,000 |
172,592 |
||
|
Six Flags Entertainment Corp - 144A 5.500% 04/15/2027 Callable @ 101.833 04/15/2023 |
30,000 |
28,376 |
||
|
Six Flags Theme Parks Inc - 144A 7.000% 07/01/2025 Callable @ 101.750 07/01/2023 |
63,000 |
64,790 |
||
|
Sonic Automotive Inc - 144A 4.625% 11/15/2029 Callable @ 102.313 11/15/2024 |
54,000 |
45,738 |
||
|
Staples Inc - 144A 7.500% 04/15/2026 Callable @ 101.875 04/15/2023 |
230,000 |
202,759 |
||
|
Staples Inc - 144A 10.750% 04/15/2027 Callable @ 102.688 04/15/2023 |
100,000 |
74,527 |
||
|
Station Casinos LLC - 144A 4.500% 02/15/2028 Callable @ 102.250 02/15/2023 |
140,000 |
125,651 |
||
|
Superior Plus LP / Superior General Partner Inc - 144A 4.500% 03/15/2029 Callable @ 102.250 03/15/2024 |
56,000 |
51,520 |
||
|
Tempur Sealy International Inc - 144A 3.875% 10/15/2031 Callable @ 101.938 10/15/2026 |
34,000 |
27,547 |
||
|
Tempur Sealy International Inc - 144A 4.000% 04/15/2029 Callable @ 102.000 04/15/2024 |
144,000 |
124,065 |
||
|
Tenneco Inc 5.000% 07/15/2026 |
53,000 |
52,073 |
||
|
Tenneco Inc 5.375% 12/15/2024 Callable @ 100.000 12/15/2022 |
20,000 |
19,533 |
||
|
Tenneco Inc - 144A 5.125% 04/15/2029 Callable @ 102.563 04/15/2024 |
65,000 |
63,890 |
||
|
Tenneco Inc - 144A 7.875% 01/15/2029 Callable @ 103.938 01/15/2024 |
24,000 |
23,701 |
||
|
US Foods Inc - 144A 4.625% 06/01/2030 Callable @ 102.313 06/01/2025 |
68,000 |
62,305 |
||
|
US Foods Inc - 144A 4.750% 02/15/2029 Callable @ 102.375 02/15/2024 |
15,000 |
14,001 |
||
|
Vail Resorts Inc - 144A 6.250% 05/15/2025 |
104,000 |
106,340 |
||
|
VICI Properties LP / VICI Note Co Inc 4.250% 12/01/2026 Callable @ 102.125 12/01/2022 |
113,000 |
106,104 |
||
|
VICI Properties LP / VICI Note Co Inc - 144A 3.750% 02/15/2027 |
75,000 |
68,712 |
||
|
VICI Properties LP / VICI Note Co Inc - 144A 4.125% 08/15/2030 Callable @ 102.063 02/15/2025 |
40,000 |
36,519 |
||
|
VICI Properties LP / VICI Note Co Inc - 144A 4.625% 12/01/2029 Callable @ 102.313 12/01/2024 |
118,000 |
112,450 |
||
|
Videotron Ltd - 144A 5.375% 06/15/2024 Callable @ 100.000 03/15/2024 |
45,000 |
45,169 |
||
|
Videotron Ltd / Videotron Ltee - 144A 5.125% 04/15/2027 Callable @ 101.708 04/15/2023 |
95,000 |
92,150 |
||
|
Vista Outdoor Inc - 144A 4.500% 03/15/2029 Callable @ 102.250 03/15/2024 |
149,000 |
113,240 |
||
|
Weekley Homes LLC / Weekley Finance Corp - 144A 4.875% 09/15/2028 Callable @ 102.438 09/15/2023 |
49,000 |
40,278 |
||
|
William Carter Co/The - 144A 5.625% 03/15/2027 Callable @ 101.406 03/15/2023 |
85,000 |
83,938 |
||
|
Wynn Las Vegas LLC / Wynn Las Vegas Capital Corp - 144A 5.250% 05/15/2027 Callable @ 100.000 02/15/2027 |
25,000 |
23,086 |
||
|
Wynn Las Vegas LLC / Wynn Las Vegas Capital Corp - 144A 5.500% 03/01/2025 Callable @ 100.000 12/01/2024 |
137,000 |
134,975 |
||
|
Wynn Resorts Finance LLC / Wynn Resorts Capital Corp - 144A 5.125% 10/01/2029 |
203,000 |
177,118 |
||
|
Yum! Brands Inc 3.625% 03/15/2031 Callable @ 100.000 12/15/2030 |
41,000 |
37,104 |
||
|
Yum! Brands Inc 4.625% 01/31/2032 Callable @ 102.313 10/01/2026 |
78,000 |
74,133 |
||
|
$ |
12,678,538 |
|||
|
Consumer Staples (5.0%) |
||||
|
Central Garden & Pet Co 5.125% 02/01/2028 Callable @ 102.563 01/01/2023 |
183,000 |
170,107 |
||
|
Central Garden & Pet Co 4.125% 10/15/2030 Callable @ 102.063 10/15/2025 |
49,000 |
42,453 |
||
|
TreeHouse Foods Inc 4.000% 09/01/2028 Callable @ 102.000 09/01/2023 |
21,000 |
18,270 |
||
|
Albertsons Cos Inc / Safeway Inc / New Albertsons LP / Albertsons LLC - 144A 5.875% 02/15/2028 Callable @ 104.406 08/15/2022 |
76,000 |
73,720 |
||
|
Albertsons Cos Inc / Safeway Inc / New Albertsons LP / Albertsons LLC - 144A 4.625% 01/15/2027 Callable @ 103.469 01/15/2023 |
265,000 |
250,277 |
||
|
Albertsons Cos Inc / Safeway Inc / New Albertsons LP / Albertsons LLC - 144A 4.875% 02/15/2030 |
15,000 |
13,725 |
||
|
Albertsons Cos Inc / Safeway Inc / New Albertsons LP / Albertsons LLC - 144A 3.250% 03/15/2026 Callable @ 101.625 09/15/2022 |
38,000 |
35,313 |
||
|
Albertsons Cos Inc / Safeway Inc / New Albertsons LP / Albertsons LLC - 144A 3.500% 03/15/2029 Callable @ 101.750 09/15/2023 |
117,000 |
102,453 |
||
|
Central Garden & Pet Co - 144A 4.125% 04/30/2031 Callable @ 102.063 04/30/2026 |
8,000 |
6,863 |
||
|
Coty Inc - 144A 5.000% 04/15/2026 Callable @ 102.500 04/15/2023 |
84,000 |
82,496 |
||
|
HFC Prestige Products Inc/HFC Prestige International US LLC - 144A 4.750% 01/15/2029 Callable @ 102.375 01/15/2025 |
60,000 |
54,463 |
||
|
Edgewell Personal Care Co - 144A 5.500% 06/01/2028 Callable @ 102.750 06/01/2023 |
130,000 |
127,472 |
||
|
Edgewell Personal Care Co - 144A 4.125% 04/01/2029 Callable @ 102.063 04/01/2024 |
25,000 |
22,442 |
||
|
Energizer Holdings Inc - 144A 4.750% 06/15/2028 Callable @ 102.375 06/15/2023 |
239,000 |
203,709 |
||
|
Energizer Holdings Inc - 144A 4.375% 03/31/2029 Callable @ 102.188 09/30/2023 |
78,000 |
64,582 |
||
|
Energizer Holdings Inc - 144A 6.500% 12/31/2027 Callable @ 103.250 08/31/2024 |
37,000 |
34,270 |
||
|
+^High Ridge Brands Co 8.875% 03/15/2025 |
60,000 |
0 |
||
|
Lamb Weston Holdings Inc - 144A 4.875% 05/15/2028 |
26,000 |
25,311 |
||
|
Lamb Weston Holdings Inc - 144A 4.125% 01/31/2030 Callable @ 102.063 01/31/2025 |
129,000 |
120,267 |
||
|
Lamb Weston Holdings Inc - 144A 4.375% 01/31/2032 Callable @ 102.188 01/31/2027 |
17,000 |
15,944 |
||
|
Performance Food Group Inc - 144A 5.500% 10/15/2027 Callable @ 102.750 10/15/2022 |
90,000 |
88,687 |
||
|
Performance Food Group Inc - 144A 6.875% 05/01/2025 |
90,000 |
91,350 |
||
|
Performance Food Group Inc 4.250% 08/01/2029 Callable @ 102.125 08/01/2024 |
80,000 |
70,800 |
||
|
Post Holdings Inc - 144A 5.750% 03/01/2027 Callable @ 101.917 03/01/2023 |
115,000 |
114,713 |
||
|
Post Holdings Inc - 144A 5.625% 01/15/2028 Callable @ 102.813 12/01/2022 |
125,000 |
123,125 |
||
|
Post Holdings Inc - 144A 5.500% 12/15/2029 Callable @ 102.750 12/15/2024 |
25,000 |
23,702 |
||
|
Post Holdings Inc - 144A 4.625% 04/15/2030 Callable @ 102.313 04/15/2025 |
65,000 |
58,289 |
||
|
Reynolds Group Issuer Inc / Reynolds Group Issuer LLC / Reynolds Group Issuer Lu - 144A 4.000% 10/15/2027 Callable @ 102.000 10/15/2023 |
203,000 |
178,857 |
||
|
Rite Aid Corp - 144A 7.500% 07/01/2025 Callable @ 101.875 07/01/2023 |
44,000 |
38,246 |
||
|
*Rite Aid Corp - 144A 8.000% 11/15/2026 Callable @ 104.000 01/15/2023 |
254,000 |
213,995 |
||
|
Spectrum Brands Inc - 144A 5.000% 10/01/2029 Callable @ 102.500 10/01/2024 |
138,000 |
123,855 |
||
|
Spectrum Brands Inc - 144A 5.500% 07/15/2030 Callable @ 102.750 07/15/2025 |
99,000 |
88,391 |
||
|
Spectrum Brands Inc - 144A 3.875% 03/15/2031 Callable @ 101.938 03/15/2026 |
19,000 |
15,580 |
||
|
$ |
2,693,727 |
|||
|
Energy (10.8%) |
||||
|
Buckeye Partners LP 3.950% 12/01/2026 Callable @ 100.000 09/01/2026 |
40,000 |
37,056 |
||
|
Buckeye Partners LP 4.125% 12/01/2027 Callable @ 100.000 09/01/2027 |
15,000 |
13,497 |
||
|
DCP Midstream Operating LP 5.375% 07/15/2025 Callable @ 100.000 04/15/2025 |
20,000 |
20,400 |
||
|
DCP Midstream Operating LP 5.625% 07/15/2027 Callable @ 100.000 04/15/2027 |
30,000 |
30,596 |
||
|
EQT Corp 5.000% 01/15/2029 |
18,000 |
17,793 |
||
|
EQM Midstream Partners LP 4.125% 12/01/2026 Callable @ 100.000 09/01/2026 |
47,000 |
43,326 |
||
|
EQM Midstream Partners LP 5.500% 07/15/2028 Callable @ 100.000 04/15/2028 |
5,000 |
4,725 |
||
|
EnLink Midstream LLC 5.375% 06/01/2029 Callable @ 100.000 03/01/2029 |
16,000 |
15,193 |
||
|
EnLink Midstream Partners LP 4.850% 07/15/2026 Callable @ 100.000 04/15/2026 |
25,000 |
24,737 |
||
|
Genesis Energy LP / Genesis Energy Finance Corp 6.250% 05/15/2026 Callable @ 101.563 02/15/2023 |
10,000 |
9,268 |
||
|
Genesis Energy LP / Genesis Energy Finance Corp 7.750% 02/01/2028 Callable @ 105.813 02/01/2023 |
41,000 |
39,557 |
||
|
Genesis Energy LP / Genesis Energy Finance Corp 8.000% 01/15/2027 Callable @ 104.000 10/15/2024 |
18,000 |
17,640 |
||
|
Gulfport Energy Corp 6.375% 01/15/2026 Callable @ 101.594 01/15/2023 |
- |
0 |
||
|
Gulfport Energy Corp 8.000% 05/17/2026 Callable @ 104.000 05/17/2024 |
25,000 |
25,121 |
||
|
NRG Energy Inc 5.750% 01/15/2028 Callable @ 102.875 01/15/2023 |
83,000 |
80,145 |
||
|
Nabors Industries Inc 5.750% 02/01/2025 Callable @ 100.000 11/01/2024 |
109,000 |
99,783 |
||
|
NuStar Logistics LP 5.625% 04/28/2027 |
30,000 |
28,691 |
||
|
NuStar Logistics LP 6.000% 06/01/2026 Callable @ 100.000 03/01/2026 |
50,000 |
49,151 |
||
|
NuStar Logistics LP 5.750% 10/01/2025 Callable @ 100.000 07/01/2025 |
21,000 |
20,311 |
||
|
NuStar Logistics LP 6.375% 10/01/2030 Callable @ 100.000 04/01/2030 |
71,000 |
65,458 |
||
|
Chord Energy Corp 6.875% 01/15/2023 |
- |
0 |
||
|
Occidental Petroleum Corp 8.000% 07/15/2025 Callable @ 100.000 04/15/2025 |
83,000 |
89,584 |
||
|
Occidental Petroleum Corp 8.500% 07/15/2027 Callable @ 100.000 01/15/2027 |
46,000 |
52,555 |
||
|
Occidental Petroleum Corp 8.875% 07/15/2030 Callable @ 100.000 01/15/2030 |
61,000 |
73,048 |
||
|
Occidental Petroleum Corp 6.375% 09/01/2028 Callable @ 100.000 03/01/2028 |
25,000 |
26,792 |
||
|
Occidental Petroleum Corp 6.625% 09/01/2030 Callable @ 100.000 03/01/2030 |
85,000 |
94,299 |
||
|
Occidental Petroleum Corp 6.125% 01/01/2031 Callable @ 100.000 07/01/2030 |
70,000 |
75,230 |
||
|
Range Resources Corp 4.875% 05/15/2025 Callable @ 100.000 02/15/2025 |
70,000 |
69,852 |
||
|
Range Resources Corp 8.250% 01/15/2029 Callable @ 104.125 01/15/2024 |
65,000 |
69,608 |
||
|
SM Energy Co 5.625% 06/01/2025 Callable @ 100.000 06/01/2023 |
30,000 |
29,513 |
||
|
SM Energy Co 6.750% 09/15/2026 Callable @ 102.250 09/15/2022 |
40,000 |
39,600 |
||
|
SM Energy Co 6.500% 07/15/2028 Callable @ 103.250 07/15/2024 |
31,000 |
30,547 |
||
|
Southwestern Energy Co 7.750% 10/01/2027 Callable @ 103.875 10/01/2022 |
37,000 |
38,587 |
||
|
Southwestern Energy Co 8.375% 09/15/2028 Callable @ 104.188 09/15/2023 |
25,000 |
26,875 |
||
|
Southwestern Energy Co 5.375% 03/15/2030 Callable @ 102.688 03/15/2025 |
112,000 |
110,201 |
||
|
Southwestern Energy Co 4.750% 02/01/2032 Callable @ 102.375 02/01/2027 |
17,000 |
15,853 |
||
|
Targa Resources Partners LP / Targa Resources Partners Finance Corp 5.000% 01/15/2028 Callable @ 102.500 01/15/2023 |
40,000 |
39,288 |
||
|
Targa Resources Partners LP / Targa Resources Partners Finance Corp 5.500% 03/01/2030 Callable @ 102.750 03/01/2025 |
15,000 |
14,832 |
||
|
Western Midstream Operating LP 4.650% 07/01/2026 Callable @ 100.000 04/01/2026 |
65,000 |
64,522 |
||
|
Western Midstream Operating LP 4.500% 03/01/2028 Callable @ 100.000 12/01/2027 |
8,000 |
7,720 |
||
|
Antero Resources Corp - 144A 8.375% 07/15/2026 Callable @ 104.188 01/15/2024 |
79,000 |
84,641 |
||
|
Antero Resources Corp - 144A 7.625% 02/01/2029 Callable @ 103.813 02/01/2024 |
46,000 |
48,928 |
||
|
Antero Resources Corp - 144A 5.375% 03/01/2030 Callable @ 102.688 03/01/2025 |
23,000 |
22,598 |
||
|
Antero Midstream Partners LP / Antero Midstream Finance Corp - 144A 5.750% 03/01/2027 Callable @ 101.917 03/01/2023 |
5,000 |
4,954 |
||
|
Antero Midstream Partners LP / Antero Midstream Finance Corp - 144A 5.750% 01/15/2028 Callable @ 102.875 01/15/2023 |
85,000 |
83,088 |
||
|
Antero Midstream Partners LP - 144A 5.375% 06/15/2029 Callable @ 102.688 06/15/2024 |
86,000 |
84,013 |
||
|
Antero Midstream Partners LP / Antero Midstream Finance Corp - 144A 7.875% 05/15/2026 Callable @ 103.938 05/15/2023 |
73,000 |
76,407 |
||
|
Archrock Partners LP / Archrock Partners Finance Corp - 144A 6.875% 04/01/2027 Callable @ 103.438 04/01/2023 |
35,000 |
32,682 |
||
|
Archrock Partners LP / Archrock Partners Finance Corp - 144A 6.250% 04/01/2028 Callable @ 103.125 04/01/2023 |
37,000 |
33,482 |
||
|
Baytex Energy Corp - 144A 8.750% 04/01/2027 Callable @ 106.563 04/01/2023 |
70,000 |
71,313 |
||
|
Blue Racer Midstream LLC / Blue Racer Finance Corp - 144A 6.625% 07/15/2026 Callable @ 101.656 07/15/2023 |
25,000 |
23,528 |
||
|
Blue Racer Midstream LLC / Blue Racer Finance Corp - 144A 7.625% 12/15/2025 Callable @ 103.812 12/15/2022 |
58,000 |
57,592 |
||
|
Buckeye Partners LP - 144A 4.125% 03/01/2025 Callable @ 100.000 02/01/2025 |
115,000 |
110,328 |
||
|
Buckeye Partners LP - 144A 4.500% 03/01/2028 Callable @ 100.000 12/01/2027 |
40,000 |
36,554 |
||
|
CNX Resources Corp - 144A 6.000% 01/15/2029 Callable @ 104.500 01/15/2024 |
31,000 |
30,148 |
||
|
CNX Midstream Partners LP - 144A 4.750% 04/15/2030 Callable @ 102.375 04/15/2025 |
16,000 |
13,792 |
||
|
California Resources Corp - 144A 7.125% 02/01/2026 Callable @ 103.565 02/01/2023 |
88,000 |
87,122 |
||
|
Cheniere Energy Partners LP 4.500% 10/01/2029 Callable @ 102.250 10/01/2024 |
176,000 |
170,515 |
||
|
Cheniere Energy Partners LP 3.250% 01/31/2032 Callable @ 101.625 01/31/2027 |
39,000 |
34,028 |
||
|
Cheniere Energy Inc 4.625% 10/15/2028 Callable @ 102.313 10/15/2023 |
90,000 |
87,629 |
||
|
Chesapeake Escrow Issuer LLC - 144A 5.500% 02/01/2026 Callable @ 102.750 02/05/2023 |
35,000 |
34,924 |
||
|
Chesapeake Energy Corp 5.500% 09/15/2026 |
15,000 |
291 |
||
|
Comstock Resources Inc - 144A 6.750% 03/01/2029 Callable @ 103.375 03/01/2024 |
141,000 |
139,590 |
||
|
Comstock Resources Inc 5.875% 01/15/2030 Callable @ 102.938 01/15/2025 |
43,000 |
40,316 |
||
|
Crestwood Midstream Partners LP / Crestwood Midstream Finance Corp - 144A 5.625% 05/01/2027 Callable @ 101.875 05/01/2023 |
35,000 |
33,600 |
||
|
DT Midstream Inc - 144A 4.125% 06/15/2029 Callable @ 102.063 06/15/2024 |
95,000 |
87,947 |
||
|
DT Midstream Inc - 144A 4.375% 06/15/2031 Callable @ 102.188 06/15/2026 |
36,000 |
32,310 |
||
|
EQT Corp - 144A 3.625% 05/15/2031 Callable @ 100.000 05/15/2030 |
21,000 |
19,224 |
||
|
EQM Midstream Partners LP - 144A 6.000% 07/01/2025 Callable @ 100.000 04/01/2025 |
15,000 |
14,963 |
||
|
EQM Midstream Partners LP - 144A 6.500% 07/01/2027 Callable @ 100.000 01/01/2027 |
25,000 |
25,052 |
||
|
EQM Midstream Partners LP - 144A 4.500% 01/15/2029 Callable @ 100.000 07/15/2028 |
44,000 |
39,380 |
||
|
EQM Midstream Partners LP - 144A 4.750% 01/15/2031 Callable @ 100.000 07/15/2030 |
54,000 |
48,784 |
||
|
EQM Midstream Partners LP - 144A 7.500% 06/01/2027 Callable @ 103.750 06/01/2024 |
45,000 |
45,788 |
||
|
EQM Midstream Partners LP - 144A 7.500% 06/01/2030 Callable @ 100.000 12/01/2029 |
36,000 |
37,049 |
||
|
Encino Acquisition Partners Holdings LLC - 144A 8.500% 05/01/2028 Callable @ 104.250 05/01/2024 |
115,000 |
112,390 |
||
|
FMG Resources August 2006 Pty Ltd - 144A 4.375% 04/01/2031 Callable @ 100.000 01/01/2031 |
28,000 |
24,360 |
||
|
GCI LLC - 144A 4.750% 10/15/2028 Callable @ 102.375 10/15/2023 |
133,000 |
121,216 |
||
|
Global Infrastructure Solutions Inc - 144A 5.625% 06/01/2029 Callable @ 102.813 06/01/2024 |
90,000 |
71,001 |
||
|
Global Infrastructure Solutions Inc - 144A 7.500% 04/15/2032 Callable @ 103.750 04/15/2027 |
50,000 |
38,563 |
||
|
Gulfport Energy Corp - 144A 8.000% 05/17/2026 Callable @ 104.000 05/17/2024 |
140,000 |
140,676 |
||
|
Hess Infrastructure Partners LP / Hess Infrastructure Partners Finance Corp 5.625% 02/15/2026 Callable @ 101.406 02/15/2023 |
25,000 |
24,940 |
||
|
Hess Midstream Operations LP 4.250% 02/15/2030 Callable @ 102.125 02/15/2025 |
47,000 |
41,869 |
||
|
Hess Midstream Operations LP - 144A 5.125% 06/15/2028 Callable @ 102.563 06/15/2023 |
55,000 |
53,404 |
||
|
Hilcorp Energy I LP / Hilcorp Finance Co - 144A 6.000% 04/15/2030 Callable @ 103.000 04/15/2025 |
29,000 |
26,318 |
||
|
Hilcorp Energy I LP / Hilcorp Finance Co - 144A 6.250% 04/15/2032 Callable @ 103.125 05/15/2027 |
23,000 |
20,687 |
||
|
Holly Energy Partners LP / Holly Energy Finance Corp - 144A 5.000% 02/01/2028 Callable @ 103.750 02/01/2023 |
35,000 |
32,272 |
||
|
Holly Energy Partners LP / Holly Energy Finance Corp - 144A 6.375% 04/15/2027 Callable @ 103.188 04/15/2024 |
48,000 |
47,314 |
||
|
Kinetik Holdings LP - 144A 5.875% 06/15/2030 Callable @ 102.938 06/15/2025 |
35,000 |
35,553 |
||
|
MEG Energy Corp - 144A 7.125% 02/01/2027 Callable @ 103.563 02/01/2023 |
92,000 |
94,990 |
||
|
NGL Energy Operating LLC / NGL Energy Finance Corp - 144A 7.500% 02/01/2026 Callable @ 103.750 02/01/2023 |
37,000 |
33,855 |
||
|
NRG Energy Inc - 144A 5.250% 06/15/2029 Callable @ 102.625 06/15/2024 |
79,000 |
74,063 |
||
|
NRG Energy Inc - 144A 3.875% 02/15/2032 Callable @ 101.938 02/15/2027 |
44,000 |
37,608 |
||
|
Chord Energy Corp - 144A 6.250% 05/01/2026 Callable @ 100.000 05/01/2023 |
- |
0 |
||
|
Chord Energy Corp - 144A 6.375% 06/01/2026 Callable @ 103.188 06/01/2023 |
56,000 |
55,160 |
||
|
Oasis Midstream Partners LP / OMP Finance Corp 8.000% 04/01/2029 Callable @ 104.000 04/01/2024 |
129,000 |
127,527 |
||
|
Precision Drilling Corp - 144A 7.125% 01/15/2026 Callable @ 101.781 11/15/2022 |
35,000 |
32,375 |
||
|
Precision Drilling Corp - 144A 6.875% 01/15/2029 Callable @ 103.438 01/15/2025 |
8,000 |
7,155 |
||
|
Range Resources Corp - 144A 4.750% 02/15/2030 Callable @ 102.375 02/15/2025 |
24,000 |
22,920 |
||
|
Rockcliff Energy II LLC - 144A 5.500% 10/15/2029 Callable @ 102.750 10/15/2024 |
28,000 |
27,047 |
||
|
Sunoco LP / Sunoco Finance Corp 4.500% 05/15/2029 Callable @ 102.250 05/15/2024 |
109,000 |
98,313 |
||
|
Sunoco LP / Sunoco Finance Corp 4.500% 04/30/2030 Callable @ 102.250 04/30/2025 |
60,000 |
52,808 |
||
|
Tallgrass Energy Partners LP / Tallgrass Energy Finance Corp - 144A 5.500% 01/15/2028 Callable @ 102.750 01/15/2023 |
65,000 |
59,209 |
||
|
Tallgrass Energy Partners LP / Tallgrass Energy Finance Corp - 144A 6.000% 03/01/2027 Callable @ 103.000 03/01/2023 |
40,000 |
37,160 |
||
|
Tallgrass Energy Partners LP / Tallgrass Energy Finance Corp - 144A 7.500% 10/01/2025 Callable @ 105.625 10/01/2022 |
98,000 |
98,203 |
||
|
Tallgrass Energy Partners LP / Tallgrass Energy Finance Corp - 144A 6.000% 12/31/2030 Callable @ 103.000 12/31/2025 |
55,000 |
49,382 |
||
|
Tallgrass Energy Partners LP / Tallgrass Energy Finance Corp - 144A 6.000% 09/01/2031 Callable @ 103.000 09/01/2026 |
70,000 |
63,070 |
||
|
Targa Resources Partners LP / Targa Resources Partners Finance Corp 6.500% 07/15/2027 Callable @ 103.250 07/15/2023 |
108,000 |
111,102 |
||
|
Targa Resources Partners LP / Targa Resources Partners Finance Corp 6.875% 01/15/2029 Callable @ 103.438 01/15/2024 |
38,000 |
39,214 |
||
|
Targa Resources Partners LP / Targa Resources Partners Finance Corp 4.875% 02/01/2031 Callable @ 102.438 02/01/2026 |
70,000 |
65,794 |
||
|
Targa Resources Partners LP / Targa Resources Partners Finance Corp 4.000% 01/15/2032 Callable @ 102.000 07/15/2026 |
62,000 |
55,334 |
||
|
Transocean Guardian Ltd - 144A 5.875% 01/15/2024 Callable @ 100.000 07/15/2023 |
20,626 |
19,698 |
||
|
Transocean Pontus Ltd - 144A 6.125% 08/01/2025 Callable @ 103.063 08/01/2022 |
28,290 |
26,451 |
||
|
Transocean Inc - 144A 11.500% 01/30/2027 Callable @ 105.750 07/30/2023 |
68,000 |
64,438 |
||
|
Vine Energy Holdings LLC 6.750% 04/15/2029 Callable @ 103.375 04/15/2024 |
218,000 |
224,856 |
||
|
$ |
5,771,797 |
|||
|
Financials (2.0%) |
||||
|
Ally Financial Inc 5.750% 11/20/2025 Callable @ 100.000 10/20/2025 |
100,000 |
101,264 |
||
|
(2)Citigroup Inc (LIBOR USD 3 Month +3.905%) Callable at 100 5/15/2025 |
10,000 |
9,740 |
||
|
OneMain Finance Corp 4.000% 09/15/2030 Callable @ 102.000 09/15/2025 |
18,000 |
14,130 |
||
|
OneMain Finance Corp 3.500% 01/15/2027 Callable @ 101.750 01/15/2024 |
20,000 |
17,009 |
||
|
Springleaf Finance Corp 6.625% 01/15/2028 Callable @ 100.000 07/15/2027 |
24,000 |
22,463 |
||
|
Springleaf Finance Corp 5.375% 11/15/2029 Callable @ 100.000 05/15/2029 |
130,000 |
110,518 |
||
|
Adient Global Holdings Ltd - 144A 4.875% 08/15/2026 |
240,000 |
224,446 |
||
|
Coinbase Global Inc - 144A 3.375% 10/01/2028 Callable @ 101.688 10/01/2024 |
20,000 |
12,866 |
||
|
Coinbase Global Inc - 144A 3.625% 10/01/2031 Callable @ 101.813 10/01/2026 |
20,000 |
11,851 |
||
|
LPL Holdings Inc - 144A 4.625% 11/15/2027 Callable @ 102.313 11/15/2022 |
30,000 |
29,379 |
||
|
LPL Holdings Inc - 144A 4.000% 03/15/2029 Callable @ 102.000 03/15/2024 |
55,000 |
51,150 |
||
|
Nationstar Mortgage Holdings Inc - 144A 6.000% 01/15/2027 Callable @ 101.500 01/15/2024 |
10,000 |
9,261 |
||
|
Nationstar Mortgage Holdings Inc - 144A 5.500% 08/15/2028 Callable @ 102.750 08/15/2023 |
93,000 |
81,724 |
||
|
Nationstar Mortgage Holdings Inc - 144A 5.125% 12/15/2030 Callable @ 102.563 12/15/2025 |
26,000 |
21,619 |
||
|
Nationstar Mortgage Holdings Inc - 144A 5.750% 11/15/2031 Callable @ 102.875 11/15/2026 |
80,000 |
66,900 |
||
|
Quicken Loans LLC / Quicken Loans Co- 144A Issuer Inc - 3.625% 03/01/2029 Callable @ 101.813 03/01/2023 |
71,000 |
60,705 |
||
|
Rocket Mortgage LLC / Rocket Mortgage Co- 144A Issuer Inc - 2.875% 10/15/2026 Callable @ 101.438 10/15/2023 |
54,000 |
47,790 |
||
|
Rocket Mortgage LLC / Rocket Mortgage Co- 144A Issuer Inc - 4.000% 10/15/2033 Callable @ 102.000 10/15/2027 |
9,000 |
7,272 |
||
|
WMG Acquisition Corp - 144A 3.875% 07/15/2030 Callable @ 101.938 07/15/2025 |
25,000 |
22,795 |
||
|
WMG Acquisition Corp - 144A 3.000% 02/15/2031 Callable @ 101.500 02/15/2026 |
63,000 |
54,717 |
||
|
WMG Acquisition Corp - 144A 3.750% 12/01/2029 Callable @ 101.875 12/01/2024 |
85,000 |
77,496 |
||
|
$ |
1,055,095 |
|||
|
Health Care (12.0%) |
||||
|
Encompass Health Corp 4.500% 02/01/2028 Callable @ 102.250 02/01/2023 |
174,000 |
160,985 |
||
|
Encompass Health Corp 4.750% 02/01/2030 Callable @ 102.375 02/01/2025 |
35,000 |
32,283 |
||
|
Encompass Health Corp 4.625% 04/01/2031 Callable @ 102.313 04/01/2026 |
35,000 |
31,422 |
||
|
*HCA Inc 5.875% 02/15/2026 Callable @ 100.000 08/15/2025 |
310,000 |
320,258 |
||
|
HCA Inc 3.500% 09/01/2030 Callable @ 102.500 03/01/2030 |
85,000 |
77,562 |
||
|
HCA Inc 5.375% 09/01/2026 Callable @ 100.000 03/01/2026 |
100,000 |
103,150 |
||
|
HCA Inc 5.625% 09/01/2028 Callable @ 100.000 03/01/2028 |
178,000 |
184,050 |
||
|
HealthSouth Corp 5.750% 09/15/2025 Callable @ 100.958 09/15/2022 |
55,000 |
55,129 |
||
|
Ardent Health Services Inc 5.750% 07/15/2029 Callable @ 102.875 07/15/2024 |
39,000 |
28,860 |
||
|
Acadia Healthcare Co Inc - 144A 5.500% 07/01/2028 Callable @ 102.750 07/01/2023 |
72,000 |
70,891 |
||
|
Acadia Healthcare Co Inc - 144A 5.000% 04/15/2029 Callable @ 102.500 10/15/2023 |
45,000 |
43,607 |
||
|
Avantor Funding Inc - 144A 4.625% 07/15/2028 Callable @ 102.313 07/15/2023 |
231,000 |
221,507 |
||
|
Avantor Funding Inc - 144A 3.875% 11/01/2029 Callable @ 101.938 11/01/2024 |
25,000 |
23,013 |
||
|
Bausch Health Cos Inc - 144A 7.000% 01/15/2028 Callable @ 103.500 01/15/2023 |
20,000 |
11,100 |
||
|
Bausch Health Cos Inc - 144A 5.000% 01/30/2028 Callable @ 102.500 01/30/2023 |
35,000 |
18,638 |
||
|
Bausch Health Cos Inc - 144A 5.250% 01/30/2030 Callable @ 102.625 01/30/2025 |
126,000 |
65,422 |
||
|
Bausch Health Cos Inc - 144A 6.250% 02/15/2029 Callable @ 103.125 02/15/2024 |
80,000 |
42,800 |
||
|
Bausch Health Cos Inc - 144A 5.250% 02/15/2031 Callable @ 102.625 02/15/2026 |
36,000 |
18,457 |
||
|
Bausch Health Cos Inc - 144A 5.000% 02/15/2029 Callable @ 102.500 02/15/2024 |
49,000 |
24,751 |
||
|
Bausch Health Cos Inc - 144A 4.875% 06/01/2028 Callable @ 102.438 06/01/2024 |
130,000 |
103,090 |
||
|
CHS/Community Health Systems Inc - 144A 8.000% 03/15/2026 Callable @ 102.000 03/15/2023 |
195,000 |
184,663 |
||
|
CHS/Community Health Systems Inc - 144A 5.625% 03/15/2027 Callable @ 102.813 12/15/2023 |
64,000 |
56,925 |
||
|
CHS/Community Health Systems Inc - 144A 6.000% 01/15/2029 Callable @ 103.000 01/15/2024 |
24,000 |
20,940 |
||
|
CHS/Community Health Systems Inc - 144A 4.750% 02/15/2031 Callable @ 102.375 02/15/2026 |
60,000 |
48,300 |
||
|
CHS/Community Health Systems Inc 6.125% 04/01/2030 Callable @ 103.063 04/01/2025 |
88,000 |
47,074 |
||
|
CHS/Community Health Systems Inc - 144A 5.250% 05/15/2030 Callable @ 102.625 05/15/2025 |
77,000 |
64,680 |
||
|
Catalent Pharma Solutions Inc - 144A 3.125% 02/15/2029 Callable @ 101.563 02/15/2024 |
12,000 |
10,635 |
||
|
Centene Corp 4.250% 12/15/2027 Callable @ 102.125 12/15/2022 |
109,000 |
107,229 |
||
|
*Centene Corp 4.625% 12/15/2029 Callable @ 102.313 12/15/2024 |
412,000 |
406,164 |
||
|
DaVita Inc - 144A 4.625% 06/01/2030 Callable @ 102.313 06/01/2025 |
211,000 |
173,020 |
||
|
DaVita Inc 3.750% 02/15/2031 Callable @ 101.875 02/15/2026 |
105,000 |
79,800 |
||
|
Emergent BioSolutions Inc - 144A 3.875% 08/15/2028 Callable @ 101.938 08/15/2023 |
82,000 |
62,126 |
||
|
Endo Luxembourg Finance Co I Sarl / Endo US Inc - 144A 6.125% 04/01/2029 Callable @ 104.594 04/01/2024 |
30,000 |
24,075 |
||
|
Enterprise Merger Sub Inc - 144A 8.750% 10/15/2026 Callable @ 102.188 10/15/2022 |
150,000 |
50,156 |
||
|
Global Medical Response Inc - 144A 6.500% 10/01/2025 Callable @ 101.625 10/01/2022 |
50,000 |
46,375 |
||
|
HealthEquity Inc - 144A 4.500% 10/01/2029 Callable @ 102.250 10/01/2024 |
22,000 |
20,489 |
||
|
Hologic Inc 4.625% 02/01/2028 Callable @ 102.312 02/01/2023 |
95,000 |
92,316 |
||
|
Hologic Inc - 144A 3.250% 02/15/2029 Callable @ 101.625 09/28/2023 |
142,000 |
128,893 |
||
|
*IQVIA Inc - 144A 5.000% 10/15/2026 Callable @ 101.667 10/15/2022 |
200,000 |
199,077 |
||
|
*Jazz Securities DAC - 144A 4.375% 01/15/2029 Callable @ 102.188 07/15/2024 |
200,000 |
192,570 |
||
|
Mallinckrodt International Finance SA / Mallinckrodt CB LLC 10.000% 06/15/2029 Callable @ 105.000 06/15/2026 |
25,000 |
15,250 |
||
|
MALLINCKRODT FIN 11.500% 12/01/2028 |
160,000 |
158,366 |
||
|
Mozart Debt Merger Sub Inc - 144A 3.875% 04/01/2029 Callable @ 101.938 10/01/2024 |
193,000 |
174,424 |
||
|
Mozart Debt Merger Sub Inc - 144A 5.250% 10/01/2029 Callable @ 102.625 10/01/2024 |
102,000 |
91,800 |
||
|
Organon Finance 1 LLC - 144A 4.125% 04/30/2028 Callable @ 102.063 04/30/2024 |
200,000 |
189,708 |
||
|
Owens & Minor Inc - 144A 4.500% 03/31/2029 Callable @ 102.250 03/31/2024 |
135,000 |
121,338 |
||
|
Owens & Minor Inc - 144A 6.625% 04/01/2030 Callable @ 103.313 04/01/2025 |
32,000 |
32,005 |
||
|
Par Pharmaceutical Inc - 144A 7.500% 04/01/2027 Callable @ 103.750 04/01/2023 |
75,000 |
60,119 |
||
|
Prestige Brands Inc - 144A 5.125% 01/15/2028 Callable @ 102.563 01/15/2023 |
60,000 |
57,900 |
||
|
Prestige Brands Inc - 144A 3.750% 04/01/2031 Callable @ 101.875 04/01/2026 |
15,000 |
12,900 |
||
|
RP Escrow Issuer LLC - 144A 5.250% 12/15/2025 Callable @ 102.625 12/15/2022 |
22,000 |
19,782 |
||
|
Radiology Partners Inc - 144A 9.250% 02/01/2028 Callable @ 104.625 02/01/2023 |
45,000 |
33,183 |
||
|
Syneos Health Inc - 144A 3.625% 01/15/2029 Callable @ 101.813 01/15/2024 |
40,000 |
35,801 |
||
|
Tenet Healthcare Corp - 144A 6.250% 02/01/2027 Callable @ 101.563 02/01/2023 |
122,000 |
123,424 |
||
|
Tenet Healthcare Corp 4.875% 01/01/2026 Callable @ 101.219 03/01/2023 |
486,000 |
481,903 |
||
|
Tenet Healthcare Corp 5.125% 11/01/2027 Callable @ 102.563 11/01/2022 |
295,000 |
290,575 |
||
|
Tenet Healthcare Corp 4.625% 06/15/2028 Callable @ 102.313 06/15/2023 |
26,000 |
24,531 |
||
|
Tenet Healthcare Corp 4.250% 06/01/2029 Callable @ 102.125 06/01/2024 |
55,000 |
51,150 |
||
|
Tenet Healthcare Corp - 144A 6.125% 06/15/2030 Callable @ 103.063 06/15/2025 |
77,000 |
77,779 |
||
|
Valeant Pharmaceuticals International Inc - 144A 5.500% 11/01/2025 Callable @ 100.000 11/01/2022 |
260,000 |
231,400 |
||
|
Valeant Pharmaceuticals International Inc - 144A 9.000% 12/15/2025 Callable @ 102.250 12/15/2022 |
404,000 |
291,890 |
||
|
Bausch Health Americas Inc - 144A 9.250% 04/01/2026 Callable @ 102.313 04/01/2023 |
250,000 |
173,878 |
||
|
Valeant Pharmaceuticals International Inc - 144A 8.500% 01/31/2027 Callable @ 104.250 07/31/2022 |
99,000 |
62,618 |
||
|
$ |
6,464,205 |
|||
|
Industrials (12.7%) |
||||
|
CoreCivic Inc 8.250% 04/15/2026 Callable @ 104.125 04/15/2024 |
64,000 |
63,700 |
||
|
EnPro Industries Inc 5.750% 10/15/2026 Callable @ 102.875 10/15/2022 |
66,000 |
65,175 |
||
|
HERTZ CORP 6.250% 10/15/2022 |
25,000 |
125 |
||
|
Manitowoc Foodservice Inc 9.500% 02/15/2024 |
30,000 |
30,012 |
||
|
Triumph Group Inc 7.750% 08/15/2025 Callable @ 101.938 08/15/2022 |
75,000 |
64,190 |
||
|
United Rentals North America Inc 3.875% 02/15/2031 Callable @ 101.938 08/15/2025 |
35,000 |
31,938 |
||
|
United Rentals North America Inc 5.500% 05/15/2027 Callable @ 101.833 05/15/2023 |
65,000 |
66,073 |
||
|
United Rentals North America Inc 4.875% 01/15/2028 Callable @ 102.438 01/15/2023 |
139,000 |
138,769 |
||
|
ACCO Brands Corp - 144A 4.250% 03/15/2029 Callable @ 102.125 03/15/2024 |
180,000 |
155,963 |
||
|
ADT Security Corp/The - 144A 4.125% 08/01/2029 Callable @ 100.000 08/01/2028 |
98,000 |
88,200 |
||
|
APi Escrow Corp - 144A 4.750% 10/15/2029 Callable @ 102.375 10/15/2024 |
37,000 |
31,173 |
||
|
APi Group DE Inc - 144A 4.125% 07/15/2029 Callable @ 102.063 07/15/2024 |
56,000 |
46,619 |
||
|
ATS Automation Tooling Systems Inc - 144A 4.125% 12/15/2028 Callable @ 102.063 12/15/2023 |
49,000 |
43,439 |
||
|
American Airlines Inc/AAdvantage Loyalty IP Ltd - 144A 5.500% 04/20/2026 |
232,084 |
229,123 |
||
|
American Airlines Inc/AAdvantage Loyalty IP Ltd - 144A 5.750% 04/20/2029 |
135,000 |
130,066 |
||
|
Advanced Drainage Systems Inc - 144A 5.000% 09/30/2027 Callable @ 102.500 09/30/2022 |
26,000 |
25,480 |
||
|
Allison Transmission Inc - 144A 4.750% 10/01/2027 Callable @ 102.375 10/01/2022 |
66,000 |
62,548 |
||
|
Allison Transmission Inc - 144A 3.750% 01/30/2031 Callable @ 101.875 01/30/2026 |
90,000 |
77,737 |
||
|
Arconic Rolled Products Corp - 144A 6.125% 02/15/2028 Callable @ 103.063 02/15/2023 |
153,000 |
152,913 |
||
|
Avis Budget Car Rental LLC / Avis Budget Finance Inc - 144A 5.750% 07/15/2027 Callable @ 101.438 07/15/2023 |
30,000 |
28,454 |
||
|
Avis Budget Car Rental LLC / Avis Budget Finance Inc - 144A 5.750% 07/15/2027 Callable @ 101.438 07/15/2023 |
35,000 |
33,214 |
||
|
Avis Budget Car Rental LLC / Avis Budget Finance Inc - 144A 5.375% 03/01/2029 Callable @ 102.688 03/01/2024 |
168,000 |
153,201 |
||
|
Avis Budget Car Rental LLC / Avis Budget Finance Inc - 144A 4.750% 04/01/2028 Callable @ 102.375 04/01/2024 |
70,000 |
63,102 |
||
|
BWX Technologies Inc - 144A 4.125% 06/30/2028 Callable @ 102.063 06/30/2023 |
44,000 |
41,690 |
||
|
BWX Technologies Inc - 144A 4.125% 04/15/2029 Callable @ 102.063 04/15/2024 |
63,000 |
59,163 |
||
|
Bombardier Inc - 144A 7.500% 03/15/2025 Callable @ 100.000 03/15/2023 |
78,000 |
76,050 |
||
|
Bombardier Inc - 144A 7.125% 06/15/2026 Callable @ 103.563 06/15/2023 |
22,000 |
20,460 |
||
|
Brink's Co/The - 144A 5.500% 07/15/2025 Callable @ 101.373 07/15/2023 |
40,000 |
40,210 |
||
|
Builders FirstSource Inc - 144A 4.250% 02/01/2032 Callable @ 102.125 08/01/2026 |
93,000 |
79,587 |
||
|
Builders FirstSource Inc - 144A 6.375% 06/15/2032 Callable @ 103.188 06/15/2027 |
64,000 |
63,571 |
||
|
CVR Partners LP / CVR Nitrogen Finance Corp - 144A 6.125% 06/15/2028 Callable @ 103.063 06/15/2024 |
52,000 |
47,320 |
||
|
Clean Harbors Inc - 144A 4.875% 07/15/2027 Callable @ 101.219 07/15/2023 |
20,000 |
19,769 |
||
|
Dun & Bradstreet Corp/The - 144A 5.000% 12/15/2029 Callable @ 102.500 12/15/2024 |
23,000 |
21,439 |
||
|
Dycom Industries Inc - 144A 4.500% 04/15/2029 Callable @ 102.250 04/15/2024 |
90,000 |
82,558 |
||
|
First Student Bidco Inc / First Transit Parent Inc 4.000% 07/31/2029 Callable @ 102.000 07/31/2024 |
102,000 |
89,280 |
||
|
GFL Environmental Inc - 144A 5.125% 12/15/2026 Callable @ 102.563 12/15/2022 |
70,000 |
70,456 |
||
|
GFL Environmental Inc - 144A 3.750% 08/01/2025 Callable @ 101.875 08/01/2022 |
34,000 |
33,001 |
||
|
GFL Environmental Inc - 144A 4.000% 08/01/2028 Callable @ 102.000 08/01/2023 |
69,000 |
62,250 |
||
|
GFL Environmental Inc - 144A 4.750% 06/15/2029 Callable @ 102.375 06/08/2024 |
45,000 |
41,063 |
||
|
GFL Environmental Inc 4.375% 08/15/2029 Callable @ 102.188 08/15/2024 |
39,000 |
34,506 |
||
|
GPC Merger Sub Inc - 144A 7.125% 08/15/2028 Callable @ 103.563 08/15/2023 |
74,000 |
62,235 |
||
|
Griffon Corp 5.750% 03/01/2028 Callable @ 102.875 03/01/2023 |
135,000 |
128,885 |
||
|
Herc Holdings Inc - 144A 5.500% 07/15/2027 Callable @ 101.833 07/15/2023 |
160,000 |
160,200 |
||
|
Hertz Corp/The - 144A 4.625% 12/01/2026 Callable @ 102.313 12/01/2023 |
33,000 |
29,370 |
||
|
Hertz Corp/The - 144A 5.000% 12/01/2029 Callable @ 102.500 12/01/2024 |
120,000 |
102,605 |
||
|
HERTZ CORP 5.500% 10/15/2024 |
148,000 |
740 |
||
|
HERTZ CORP 7.125% 08/01/2026 |
80,000 |
4,800 |
||
|
HERTZ CORP 6.000% 01/15/2028 |
20,000 |
1,200 |
||
|
Iron Mountain Inc - 144A 4.875% 09/15/2027 Callable @ 102.438 09/15/2022 |
62,000 |
58,929 |
||
|
Iron Mountain Inc 4.500% 02/15/2031 Callable @ 102.250 02/15/2026 |
44,000 |
38,610 |
||
|
Jeld Wen Inc - 144A 4.625% 12/15/2025 Callable @ 100.000 12/15/2022 |
75,000 |
69,188 |
||
|
Jeld Wen Inc - 144A 4.875% 12/15/2027 Callable @ 102.438 12/15/2022 |
20,000 |
16,490 |
||
|
Jeld Wen Inc - 144A 6.250% 05/15/2025 Callable @ 101.563 05/15/2023 |
45,000 |
44,671 |
||
|
MIWD Holdco II LLC / MIWD Finance Corp - 144A 5.500% 02/01/2030 Callable @ 102.750 02/01/2025 |
44,000 |
37,235 |
||
|
Madison IAQ LLC - 144A 4.125% 06/30/2028 Callable @ 102.063 06/30/2024 |
211,000 |
186,735 |
||
|
Madison IAQ LLC - 144A 5.875% 06/30/2029 Callable @ 102.938 06/30/2024 |
135,000 |
105,638 |
||
|
Masonite International Corp - 144A 5.375% 02/01/2028 Callable @ 102.688 02/01/2023 |
70,000 |
68,425 |
||
|
MasTec Inc - 144A 4.500% 08/15/2028 Callable @ 102.250 08/15/2023 |
124,000 |
114,909 |
||
|
Mileage Plus Holdings LLC / Mileage Plus Intellectual Property Assets Ltd - 144A 6.500% 06/20/2027 Callable @ 103.250 06/30/2023 |
105,000 |
106,049 |
||
|
Mueller Water Products Inc 4.000% 06/15/2029 Callable @ 100.000 06/15/2024 |
105,000 |
95,692 |
||
|
NESCO Holdings II Inc - 144A 5.500% 04/15/2029 Callable @ 102.750 04/15/2024 |
51,000 |
44,243 |
||
|
Nielsen Finance LLC / Nielsen Finance Co - 144A 5.625% 10/01/2028 Callable @ 102.813 10/01/2023 |
115,000 |
112,700 |
||
|
PGT Innovations Inc - 144A 4.375% 10/01/2029 Callable @ 102.188 08/01/2024 |
66,000 |
59,898 |
||
|
Pike Corp - 144A 5.500% 09/01/2028 Callable @ 102.750 09/01/2023 |
63,000 |
54,180 |
||
|
Prime Security Services Borrower LLC / Prime Finance Inc - 144A 5.750% 04/15/2026 |
5,000 |
5,081 |
||
|
Prime Security Services Borrower LLC / Prime Finance Inc 3.375% 08/31/2027 Callable @ 100.000 08/31/2026 |
197,000 |
179,668 |
||
|
ADT Security Corp/The - 144A 4.875% 07/15/2032 |
173,000 |
153,174 |
||
|
SRS Distribution Inc - 144A 4.625% 07/01/2028 Callable @ 102.313 07/01/2024 |
128,000 |
119,667 |
||
|
SRS Distribution Inc - 144A 6.125% 07/01/2029 Callable @ 103.063 07/01/2024 |
47,000 |
42,272 |
||
|
SRS Distribution Inc - 144A 6.000% 12/01/2029 Callable @ 103.000 12/01/2024 |
65,000 |
56,234 |
||
|
Sensata Technologies BV - 144A 4.875% 10/15/2023 |
180,000 |
180,004 |
||
|
Sensata Technologies BV - 144A 5.000% 10/01/2025 |
2,000 |
2,010 |
||
|
Sensata Technologies BV - 144A 4.000% 04/15/2029 Callable @ 102.000 04/15/2024 |
50,000 |
45,500 |
||
|
Sensata Technologies Inc - 144A 3.750% 02/15/2031 Callable @ 101.875 02/15/2026 |
18,000 |
15,640 |
||
|
Spirit AeroSystems Inc - 144A 7.500% 04/15/2025 Callable @ 101.875 04/15/2023 |
113,000 |
112,914 |
||
|
Spirit AeroSystems Inc - 144A 5.500% 01/15/2025 Callable @ 102.750 10/15/2022 |
25,000 |
24,987 |
||
|
Standard Industries Inc/NJ - 144A 5.000% 02/15/2027 |
90,000 |
86,568 |
||
|
Standard Industries Inc/NJ - 144A 4.750% 01/15/2028 Callable @ 102.375 01/15/2023 |
187,000 |
177,650 |
||
|
Standard Industries Inc/NJ - 144A 3.375% 01/15/2031 Callable @ 101.688 07/15/2025 |
44,000 |
35,779 |
||
|
Stericycle Inc - 144A 3.875% 01/15/2029 Callable @ 101.938 11/15/2023 |
120,000 |
109,720 |
||
|
Stevens Holding Co Inc - 144A 6.125% 10/01/2026 Callable @ 101.531 10/01/2023 |
40,000 |
39,200 |
||
|
Terex Corp - 144A 5.000% 05/15/2029 Callable @ 102.500 05/15/2024 |
88,000 |
78,540 |
||
|
TransDigm Inc - 144A 6.250% 03/15/2026 Callable @ 101.563 03/15/2023 |
75,000 |
75,563 |
||
|
TriMas Corp - 144A 4.125% 04/15/2029 Callable @ 102.063 04/15/2024 |
63,000 |
55,755 |
||
|
Triton Water Holdings Inc - 144A 6.250% 04/01/2029 Callable @ 103.125 04/01/2024 |
147,000 |
110,548 |
||
|
Triumph Group Inc - 144A 6.250% 09/15/2024 Callable @ 100.000 09/15/2022 |
10,000 |
9,575 |
||
|
Triumph Group Inc - 144A 8.875% 06/01/2024 Callable @ 104.438 02/01/2023 |
10,000 |
10,344 |
||
|
Uber Technologies Inc - 144A 7.500% 09/15/2027 Callable @ 105.625 09/15/2022 |
80,000 |
81,000 |
||
|
Uber Technologies Inc - 144A 4.500% 08/15/2029 Callable @ 102.250 08/15/2024 |
89,000 |
79,546 |
||
|
United Airlines Inc - 144A 4.375% 04/15/2026 Callable @ 100.000 10/15/2025 |
72,000 |
68,810 |
||
|
VistaJet Malta Finance PLC / XO Management Holding Inc - 144A 6.375% 02/01/2030 Callable @ 103.188 02/01/2025 |
71,000 |
61,948 |
||
|
Wabash National Corp 4.500% 10/15/2028 Callable @ 102.250 10/15/2024 |
68,000 |
55,760 |
||
|
WESCO Distribution Inc - 144A 7.125% 06/15/2025 |
65,000 |
67,184 |
||
|
WESCO Distribution Inc - 144A 7.250% 06/15/2028 Callable @ 103.625 06/15/2023 |
190,000 |
196,885 |
||
|
White Cap Buyer LLC - 144A 6.875% 10/15/2028 Callable @ 103.438 10/15/2023 |
19,000 |
16,055 |
||
|
Wolverine Escrow LLC - 144A 13.125% 11/15/2027 Callable @ 109.844 11/15/2022 |
20,000 |
6,300 |
||
|
Wolverine Escrow LLC - 144A 9.000% 11/15/2026 Callable @ 106.750 11/15/2022 |
109,000 |
64,855 |
||
|
Wolverine Escrow LLC - 144A 8.500% 11/15/2024 Callable @ 103.188 11/15/2022 |
5,000 |
2,500 |
||
|
$ |
6,794,447 |
|||
|
Information Technology (6.1%) |
||||
|
CDW LLC / CDW Finance Corp 4.250% 04/01/2028 Callable @ 102.125 10/01/2022 |
60,000 |
55,345 |
||
|
CDW LLC / CDW Finance Corp 3.250% 02/15/2029 Callable @ 101.625 02/15/2023 |
34,000 |
29,239 |
||
|
Twilio Inc 3.625% 03/15/2029 |
20,000 |
17,618 |
||
|
Twilio Inc 3.875% 03/15/2031 |
20,000 |
17,717 |
||
|
ACI Worldwide Inc - 144A 5.750% 08/15/2026 Callable @ 102.875 08/15/2022 |
64,000 |
62,560 |
||
|
Ahead DB Holdings LLC - 144A 6.625% 05/01/2028 Callable @ 103.313 05/01/2024 |
47,000 |
43,475 |
||
|
Black Knight InfoServ LLC - 144A 3.625% 09/01/2028 Callable @ 101.813 09/01/2023 |
70,000 |
64,750 |
||
|
Booz Allen Hamilton Inc - 144A 3.875% 09/01/2028 Callable @ 101.938 09/01/2023 |
94,000 |
89,155 |
||
|
Booz Allen Hamilton Inc - 144A 4.000% 07/01/2029 Callable @ 102.000 07/01/2024 |
52,000 |
49,606 |
||
|
Clarivate Science Holdings Corp - 144A 3.875% 06/30/2028 Callable @ 101.938 06/30/2024 |
40,000 |
36,400 |
||
|
Clarivate Science Holdings Corp - 144A 4.875% 06/30/2029 Callable @ 102.438 06/30/2024 |
79,000 |
69,915 |
||
|
CommScope Inc - 144A 4.750% 09/01/2029 Callable @ 102.375 09/01/2024 |
113,000 |
98,251 |
||
|
CommScope Technologies Finance LLC - 144A 6.000% 06/15/2025 Callable @ 100.000 06/15/2023 |
108,000 |
99,900 |
||
|
CommScope Finance LLC - 144A 8.250% 03/01/2027 Callable @ 102.063 03/01/2023 |
180,000 |
158,625 |
||
|
CommScope Finance LLC - 144A 6.000% 03/01/2026 Callable @ 101.500 03/01/2023 |
161,000 |
156,573 |
||
|
Conduent Business Services LLC / Conduent State & Local Solutions Inc - 144A 6.000% 11/01/2029 Callable @ 103.000 11/01/2024 |
90,000 |
75,825 |
||
|
Entegris Inc - 144A 4.375% 04/15/2028 Callable @ 102.188 04/15/2023 |
56,000 |
52,804 |
||
|
Entegris Inc - 144A 3.625% 05/01/2029 Callable @ 102.719 05/01/2024 |
64,000 |
56,785 |
||
|
Entegris Escrow Corp - 144A 4.750% 04/15/2029 Callable @ 100.000 01/15/2029 |
91,000 |
87,617 |
||
|
Gartner Inc - 144A 4.500% 07/01/2028 Callable @ 102.250 07/01/2023 |
215,000 |
206,521 |
||
|
Gartner Inc - 144A 3.625% 06/15/2029 Callable @ 101.813 06/15/2024 |
30,000 |
27,396 |
||
|
Imola Merger Corp - 144A 4.750% 05/15/2029 Callable @ 102.375 05/15/2024 |
299,000 |
278,228 |
||
|
Minerva Merger Sub Inc - 144A 6.500% 02/15/2030 Callable @ 103.250 02/15/2025 |
35,000 |
31,675 |
||
|
NCR Corp - 144A 5.750% 09/01/2027 Callable @ 102.875 09/01/2022 |
108,000 |
105,637 |
||
|
NCR Corp - 144A 6.125% 09/01/2029 Callable @ 103.063 09/01/2024 |
80,000 |
77,888 |
||
|
NCR Corp - 144A 5.000% 10/01/2028 Callable @ 102.500 10/01/2023 |
35,000 |
33,293 |
||
|
NCR Corp - 144A 5.125% 04/15/2029 Callable @ 102.563 04/15/2024 |
120,000 |
115,209 |
||
|
ON Semiconductor Corp - 144A 3.875% 09/01/2028 Callable @ 101.938 09/01/2023 |
118,000 |
109,242 |
||
|
Plantronics Inc - 144A 4.750% 03/01/2029 Callable @ 102.375 03/01/2024 |
130,000 |
130,975 |
||
|
Presidio Holdings Inc - 144A 4.875% 02/01/2027 Callable @ 102.438 02/01/2023 |
40,000 |
38,400 |
||
|
SS&C Technologies Inc - 144A 5.500% 09/30/2027 Callable @ 102.750 03/30/2023 |
210,000 |
206,854 |
||
|
Sabre GLBL Inc - 144A 9.250% 04/15/2025 |
25,000 |
25,435 |
||
|
Sabre GLBL Inc - 144A 7.375% 09/01/2025 Callable @ 103.688 09/01/2022 |
35,000 |
34,552 |
||
|
Sinclair Television Group Inc - 144A 5.125% 02/15/2027 Callable @ 101.708 08/15/2022 |
20,000 |
17,855 |
||
|
Square Inc 2.750% 06/01/2026 Callable @ 100.000 05/01/2026 |
80,000 |
74,600 |
||
|
Square Inc 3.500% 06/01/2031 Callable @ 100.000 03/01/2031 |
95,000 |
82,175 |
||
|
Switch Ltd - 144A 4.125% 06/15/2029 Callable @ 102.063 06/15/2024 |
23,000 |
23,274 |
||
|
Synaptics Inc 4.000% 06/15/2029 Callable @ 102.000 06/15/2024 |
22,000 |
19,199 |
||
|
II- 144A VI Inc - 5.000% 12/15/2029 Callable @ 102.500 12/14/2024 |
76,000 |
72,390 |
||
|
Vertical US Newco Inc 5.250% 07/15/2027 Callable @ 102.625 07/15/2023 |
200,000 |
192,000 |
||
|
ZoomInfo Technologies LLC/ZoomInfo Finance Corp - 144A 3.875% 02/01/2029 Callable @ 101.938 02/01/2024 |
52,000 |
46,699 |
||
|
$ |
3,271,658 |
|||
|
Materials (6.2%) |
||||
|
Allegheny Technologies Inc 5.875% 12/01/2027 Callable @ 102.938 12/01/2022 |
66,000 |
61,380 |
||
|
Allegheny Technologies Inc 4.875% 10/01/2029 Callable @ 102.438 10/01/2024 |
45,000 |
38,498 |
||
|
Allegheny Technologies Inc 5.125% 10/01/2031 Callable @ 102.563 10/01/2026 |
23,000 |
19,100 |
||
|
Carpenter Technology Corp 6.375% 07/15/2028 Callable @ 103.188 07/15/2023 |
50,000 |
46,572 |
||
|
Carpenter Technology Corp 7.625% 03/15/2030 Callable @ 103.813 03/15/2025 |
17,000 |
15,505 |
||
|
Freeport McMoRan Inc 5.450% 03/15/2043 Callable @ 100.000 09/15/2042 |
15,000 |
14,067 |
||
|
Scotts Miracle Gro Co/The 5.250% 12/15/2026 Callable @ 101.750 12/15/2022 |
135,000 |
128,863 |
||
|
Scotts Miracle Gro Co/The 4.500% 10/15/2029 Callable @ 102.250 10/15/2024 |
14,000 |
11,970 |
||
|
Scotts Miracle Gro Co/The 4.375% 02/01/2032 Callable @ 102.188 08/01/2026 |
56,000 |
45,920 |
||
|
United States Steel Corp 6.875% 03/01/2029 Callable @ 103.438 03/01/2024 |
47,000 |
45,003 |
||
|
Ardagh Packaging Finance PLC / Ardagh Holdings USA Inc - 144A 5.250% 08/15/2027 Callable @ 102.625 08/15/2022 |
200,000 |
152,057 |
||
|
#Avient Corp - 144A 7.125% 08/01/2030 Callable @ 103.563 08/01/2025 |
19,000 |
19,578 |
||
|
Axalta Coating Systems LLC / Axalta Coating Systems Dutch Holding B BV 4.750% 06/15/2027 Callable @ 102.375 06/15/2023 |
150,000 |
143,235 |
||
|
Berry Global Inc 4.500% 02/15/2026 Callable @ 100.000 02/15/2023 |
15,000 |
14,438 |
||
|
Berry Global Escrow Corp - 144A 4.875% 07/15/2026 Callable @ 101.219 07/15/2023 |
90,000 |
88,355 |
||
|
Big River Steel LLC / BRS Finance Corp - 144A 6.625% 01/31/2029 Callable @ 103.313 09/15/2023 |
77,000 |
78,523 |
||
|
Boise Cascade Co - 144A 4.875% 07/01/2030 Callable @ 102.438 07/01/2025 |
10,000 |
9,075 |
||
|
BWAY Holding Co - 144A 5.500% 04/15/2024 |
235,000 |
232,442 |
||
|
Mauser Packaging Solutions Holding Co - 144A 7.250% 04/15/2025 |
95,000 |
87,118 |
||
|
Chemours Co/The - 144A 5.750% 11/15/2028 Callable @ 102.875 11/15/2023 |
173,000 |
165,215 |
||
|
Chemours Co/The - 144A 4.625% 11/15/2029 Callable @ 102.313 11/15/2024 |
25,000 |
21,938 |
||
|
Cleveland- 144A Cliffs Inc - 4.625% 03/01/2029 Callable @ 102.313 03/01/2024 |
40,000 |
37,334 |
||
|
Cleveland- 144A Cliffs Inc - 4.875% 03/01/2031 Callable @ 102.438 03/01/2026 |
29,000 |
26,945 |
||
|
Element Solutions Inc - 144A 3.875% 09/01/2028 Callable @ 101.938 09/01/2023 |
100,000 |
92,323 |
||
|
GCP Applied Technologies Inc - 144A 5.500% 04/15/2026 Callable @ 100.000 04/15/2023 |
140,000 |
142,030 |
||
|
Glatfelter Corp - 144A 4.750% 11/15/2029 Callable @ 102.375 11/01/2024 |
42,000 |
28,613 |
||
|
Kaiser Aluminum Corp - 144A 4.625% 03/01/2028 Callable @ 102.313 03/01/2023 |
25,000 |
21,360 |
||
|
Kaiser Aluminum Corp - 144A 4.500% 06/01/2031 Callable @ 102.250 06/01/2026 |
30,000 |
24,174 |
||
|
LABL Escrow Issuer LLC - 144A 10.500% 07/15/2027 Callable @ 102.625 07/15/2023 |
60,000 |
57,000 |
||
|
LABL Escrow Issuer LLC - 144A 6.750% 07/15/2026 Callable @ 101.688 07/15/2023 |
125,000 |
121,156 |
||
|
NOVA Chemicals Corp - 144A 4.875% 06/01/2024 Callable @ 100.000 03/03/2024 |
30,000 |
29,247 |
||
|
NOVA Chemicals Corp - 144A 5.250% 06/01/2027 Callable @ 100.000 03/03/2027 |
150,000 |
143,850 |
||
|
NOVA Chemicals Corp - 144A 4.250% 05/15/2029 Callable @ 102.125 05/15/2024 |
106,000 |
92,086 |
||
|
Novelis Corp - 144A 4.750% 01/30/2030 Callable @ 102.375 01/30/2025 |
45,000 |
41,627 |
||
|
Novelis Corp - 144A 3.250% 11/15/2026 Callable @ 101.625 11/15/2023 |
43,000 |
40,014 |
||
|
Novelis Corp - 144A 3.875% 08/15/2031 Callable @ 101.938 08/15/2026 |
22,000 |
18,810 |
||
|
Owens- 144A Brockway Glass Container Inc - 6.625% 05/13/2027 |
63,000 |
60,595 |
||
|
Rain CII Carbon LLC / CII Carbon Corp - 144A 7.250% 04/01/2025 Callable @ 100.000 04/01/2023 |
75,000 |
70,875 |
||
|
Scotts Miracle Gro Co/The 4.000% 04/01/2031 Callable @ 102.000 04/01/2026 |
101,000 |
83,325 |
||
|
Summit Materials LLC / Summit Materials Finance Corp - 144A 5.250% 01/15/2029 Callable @ 102.650 07/15/2023 |
54,000 |
50,843 |
||
|
Summit Midstream Holdings LLC / Summit Midstream Finance Corp - 144A 8.500% 10/15/2026 Callable @ 104.250 10/15/2023 |
37,000 |
35,302 |
||
|
Trinseo Materials Operating SCA / Trinseo Materials Finance Inc - 144A 5.375% 09/01/2025 Callable @ 100.896 09/01/2022 |
120,000 |
103,500 |
||
|
Trinseo Materials Operating SCA / Trinseo Materials Finance Inc - 144A 5.125% 04/01/2029 Callable @ 102.563 04/01/2024 |
146,000 |
101,835 |
||
|
Trivium Packaging Finance BV - 144A 5.500% 08/15/2026 Callable @ 102.750 08/15/2022 |
200,000 |
196,000 |
||
|
Valvoline Inc - 144A 4.250% 02/15/2030 Callable @ 102.125 02/15/2025 |
35,000 |
31,758 |
||
|
Venator Finance Sarl / Venator Materials LLC - 144A 9.500% 07/01/2025 Callable @ 103.563 07/01/2023 |
40,000 |
39,000 |
||
|
Venator Finance S.a r.l. / Venator Materials Corp - 144A 5.750% 07/15/2025 Callable @ 100.000 07/15/2023 |
50,000 |
37,626 |
||
|
WR Grace Holdings LLC - 144A 5.625% 08/15/2029 Callable @ 102.813 08/15/2024 |
28,000 |
23,632 |
||
|
WR Grace & Co Conn 5.625% 10/01/2024 |
10,000 |
9,595 |
||
|
WR Grace & Co Conn 4.875% 06/15/2027 Callable @ 102.438 06/15/2023 |
114,000 |
109,275 |
||
|
$ |
3,308,580 |
|||
|
Real Estate (0.7%) |
||||
|
GEO Group Inc/The 5.875% 10/15/2024 Callable @ 100.000 10/15/2022 |
55,000 |
51,182 |
||
|
Kennedy Wilson Inc 4.750% 03/01/2029 Callable @ 102.375 03/01/2024 |
20,000 |
17,650 |
||
|
Kennedy Wilson Inc 5.000% 03/01/2031 Callable @ 102.500 03/01/2026 |
20,000 |
17,050 |
||
|
Iron Mountain Inc - 144A 5.250% 07/15/2030 Callable @ 102.625 07/15/2025 |
90,000 |
84,240 |
||
|
Outfront Media Capital LLC / Outfront Media Capital Corp - 144A 5.000% 08/15/2027 Callable @ 102.500 08/15/2022 |
40,000 |
37,787 |
||
|
RHP Hotel Properties LP / RHP Finance Corp - 144A 4.500% 02/15/2029 Callable @ 102.250 02/15/2024 |
123,000 |
113,161 |
||
|
MGM Growth Properties Operating Partnership LP / MGP Finance Co Issuer Inc 5.750% 02/01/2027 Callable @ 100.000 11/01/2026 |
44,000 |
43,814 |
||
|
$ |
364,884 |
|||
|
Utilities (1.2%) |
||||
|
AmeriGas Partners LP / AmeriGas Finance Corp 5.875% 08/20/2026 Callable @ 100.000 05/20/2026 |
75,000 |
75,981 |
||
|
NRG Energy Inc 6.625% 01/15/2027 Callable @ 101.104 07/15/2023 |
9,000 |
9,135 |
||
|
PG&E Corp 5.000% 07/01/2028 Callable @ 102.500 07/01/2023 |
40,000 |
36,593 |
||
|
PG&E Corp 5.250% 07/01/2030 Callable @ 102.625 07/01/2025 |
10,000 |
8,975 |
||
|
Calpine Corp - 144A 5.250% 06/01/2026 Callable @ 100.875 06/01/2023 |
7,000 |
7,062 |
||
|
Calpine Corp - 144A 4.625% 02/01/2029 Callable @ 102.313 02/01/2024 |
64,000 |
57,750 |
||
|
Calpine Corp - 144A 5.000% 02/01/2031 Callable @ 102.500 02/01/2026 |
30,000 |
26,669 |
||
|
NRG Energy Inc - 144A 3.375% 02/15/2029 Callable @ 101.688 02/15/2024 |
33,000 |
28,463 |
||
|
NRG Energy Inc - 144A 3.625% 02/15/2031 Callable @ 101.813 02/15/2026 |
18,000 |
15,077 |
||
|
(2)VISTRA CORP - 144A 7.000% 12/15/2026 Callable @ 100.000 12/15/2026 |
70,000 |
65,096 |
||
|
Vistra Operations Co LLC - 144A 5.625% 02/15/2027 Callable @ 101.406 02/15/2023 |
207,000 |
207,664 |
||
|
Vistra Operations Co LLC - 144A 5.000% 07/31/2027 Callable @ 102.500 07/31/2022 |
80,000 |
78,764 |
||
|
Vistra Operations Co LLC - 144A 4.375% 05/01/2029 Callable @ 102.188 05/01/2024 |
27,000 |
25,101 |
||
|
$ |
642,329 |
|||
|
TOTAL CORPORATE BONDS (COST: $55,467,706) |
$ |
50,688,304 |
||
|
COMMON STOCKS (1.9%) |
||||
|
Communication Services (0.4%) |
Shares |
|||
|
(3)Frontier Communications Parent Inc |
3,802 |
98,510 |
||
|
(3)iHeartMedia Inc |
1,902 |
14,227 |
||
|
+^(3)Intelsat Emergence SA |
3,881 |
106,728 |
||
|
$ |
219,464 |
|||
|
Consumer Discretionary (0.9%) |
||||
|
+^(3) Claire's Stores |
58 |
15,225 |
||
|
(3) Clear Channel Outdoor Holdings Inc |
4,640 |
7,192 |
||
|
+^(3) MyTheresa Series B Common Shares |
21,320 |
26,912 |
||
|
(3)NMG Equity Shares |
203 |
35,526 |
||
|
^(3)NMG Equity Shares (Restricted) |
37 |
6,475 |
||
|
VICI Properties, Inc |
11,314 |
386,826 |
||
|
$ |
478,156 |
|||
|
Energy (0.5%) |
||||
|
(3)Battalion Oil |
35 |
371 |
||
|
^(3)EP Energy Corp |
2,035 |
16,280 |
||
|
Chord Energy Corp |
2,035 |
260,968 |
||
|
$ |
277,619 |
|||
|
Health Care (0.1%) |
||||
|
+^(3)International Oncology Care Inc (Restricted) |
1,633 |
16,477 |
||
|
(3)Mallinckrodt Equity |
920 |
16,099 |
||
|
$ |
32,576 |
|||
|
TOTAL COMMON STOCK (COST: $1,146,742) |
$ |
1,007,816 |
||
|
CONVERTIBLE PREFERRED STOCKS (0.3%) |
||||
|
Consumer Discretionary (0.3%) |
Shares |
|||
|
+^Claire's Stores 14.000% |
39 |
96,525 |
||
|
+^MYT Holding Co 144A Series A |
53,840 |
|
58,955 |
|
|
|
155,480 |
|||
|
TOTAL CONVERTIBLE PREFERRED STOCK (COST: $75,999) |
$ |
155,480 |
||
|
WARRANTS (0.1%) |
||||
|
Communication Services (0.0%) |
Shares |
|||
|
+^(3)Intelsat Holdings SA Series A |
405 |
4 |
||
|
+^(3)Intelsat Holdings SA Series B |
405 |
|
4 |
|
|
$ |
8 |
|||
|
Consumer Discretionary (0.1%) |
||||
|
+^(3)NMG Warrants |
690 |
$ |
35,072 |
|
|
Energy (0.0%) |
||||
|
(3)Chesapeake Energy Corp |
14 |
$ |
935 |
|
|
TOTAL WARRANTS (COST: $1,797) |
$ |
36,015 |
||
|
TOTAL INVESTMENTS IN SECURITIES (COST: $56,692,244) (97.0%) |
$ |
51,887,615 |
||
|
OTHER ASSETS LESS LIABILITIES (3.0%) |
$ |
1,778,093 |
||
|
NET ASSETS (100%) |
$ |
53,665,708 |
||
|
(1) Interest or dividend is paid-in-kind, when applicable. Rate paid in-kind is shown in parenthesis. |
||||
|
(2) Security is perpetual and thus, does not have a predetermined maturity date. The coupon rate for this security is fixed for a period of time and may be structured to adjust thereafter. The date shown, if applicable, reflects the next call date. The coupon rate shown is the rate in effect as of July 31, 2022. |
||||
|
(3) Non-income producing security. |
||||
|
#When-issued purchase as of July 31, 2022. |
||||
|
+ The level 3 assets were a result of unavailable quoted prices from and active market or the unavailability of other significant observable inputs. See Note 3. |
||||
|
*Indicates all or a portion of bonds are segregated by the custodian to cover when-issued or delayed-delivery purchases when they occur. |
||||
|
^ Deemed by management to be illiquid security. See Note 2. Total fair value of illiquid securities amount to $378,699, representing 0.7% of net assets as of July 31, 2022. |
||||
|
144A - Security exempt from registration under Rule 144A of the Securities Act of 1933. These securities are deemed to be liquid under procedures approved by the Fund’s Board of Trustees and may normally be sold to qualified institutional buyers in transactions exempt from registration. Total fair value of Rule 144A Securities amounts to $34,944,079, representing 65.2% of net assets as of July 31, 2022. |
||||
|
PLC - Public Limited Company LIBOR USD 3 Month – 3 Month US Dollar LIBOR, rate disclosed at as of July 31, 2022, based on the last reset date of the security. |
||||
|
|
||||
|
|
||||
|
The accompanying notes are an integral part of these financial statements. |
||||
INTEGRITY MID-NORTH AMERICAN RESOURCES FUND
PORTFOLIO MARKET SECTORS July 31, 2022
|
Energy |
77.9% |
|
Industrials |
7.6% |
|
Utilities |
5.5% |
|
Materials |
4.1% |
|
Information Technologies |
3.3% |
|
Consumer Staples |
1.1% |
|
Cash Equivalents and Other |
0.5% |
|
|
100.0% |
Market sectors are breakdowns of the Fund’s portfolio holdings into specific investment classes.
These percentages are based on net assets.
SCHEDULE OF INVESTMENTS July 31, 2022
|
Fair |
||||
|
Shares |
|
Value |
||
|
COMMON STOCKS (99.5%) |
||||
|
Energy (77.9%) |
||||
|
BP PLC ADR |
74,000 |
$ |
2,174,120 |
|
|
Shell PLC |
46,000 |
2,455,480 |
||
|
*Antero Resources Corp |
90,000 |
3,567,600 |
||
|
*Archaea Energy Inc |
150,000 |
2,457,000 |
||
|
Baker Hughes a GE Co |
170,000 |
4,367,300 |
||
|
Coterra EnerCoterra Energy Inc |
100,000 |
3,059,000 |
||
|
Cactus Inc |
137,000 |
5,697,830 |
||
|
ChampionX Corp |
271,000 |
5,661,190 |
||
|
Cheniere Energy Inc |
82,000 |
12,265,560 |
||
|
ConocoPhillips |
26,000 |
2,533,180 |
||
|
Devon Energy Corp |
50,000 |
3,142,500 |
||
|
Diamondback Energy Inc |
70,000 |
8,961,400 |
||
|
Enbridge Inc |
109,000 |
4,897,370 |
||
|
Exxon Mobil Corp |
63,000 |
6,106,590 |
||
|
HollyFrontier Corp |
46,000 |
2,199,720 |
||
|
Halliburton Co |
85,000 |
2,490,500 |
||
|
Marathon Oil Corp |
190,000 |
4,712,000 |
||
|
New Fortress Energy Inc |
75,000 |
3,672,750 |
||
|
*NexTier Oilfield Solutions Inc |
670,000 |
6,679,900 |
||
|
Ovintiv Inc |
120,000 |
6,130,800 |
||
|
Patterson UTI Energy Inc |
130,000 |
2,151,500 |
||
|
Pembina Pipeline Corp |
40,000 |
1,527,200 |
||
|
Phillips 66 |
43,000 |
3,827,000 |
||
|
Pioneer Natural Resources Co |
17,000 |
4,028,150 |
||
|
*ProFrac Holding Corp |
60,000 |
1,102,800 |
||
|
*ProPetro Holding Corp |
80,000 |
841,600 |
||
|
Solaris Oilfield Infrastructure Inc |
240,000 |
2,661,600 |
||
|
TransCanada Corp |
26,000 |
1,386,320 |
||
|
Valero Energy Corp |
24,000 |
2,658,480 |
||
|
*National Energy Services Reunited Corp |
150,000 |
1,057,500 |
||
|
|
114,473,940 |
|||
|
Industrials (7.6%) |
||||
|
*Array Technologies Inc |
140,000 |
2,359,000 |
||
|
*Generac Holdings Inc |
9,000 |
2,414,700 |
||
|
*Plug Power Inc |
28,000 |
597,520 |
||
|
Quanta Services Inc |
16,000 |
2,219,680 |
||
|
*Shoals Technologies Group Inc |
36,000 |
850,680 |
||
|
*Sunrun Inc |
85,000 |
2,778,650 |
||
|
|
11,220,230 |
|||
|
Consumer Staples (1.1%) |
||||
|
*Darling Ingredients Inc |
23,000 |
|
1,593,440 |
|
|
Information Technologies (3.3%) |
||||
|
*Enphase Energy Inc |
7,000 |
1,989,260 |
||
|
*SolarEdge Technologies Inc |
8,000 |
2,881,040 |
||
|
|
4,870,300 |
|||
|
Materials (4.1%) |
||||
|
Celanese Corp |
11,000 |
1,292,610 |
||
|
Huntsman Corp |
30,000 |
868,800 |
||
|
Olin Corp |
74,000 |
3,867,980 |
||
|
|
6,029,390 |
|||
|
Utilities (5.5%) |
||||
|
Ameren Corp |
20,000 |
1,862,400 |
||
|
NextEra Energy Inc |
36,000 |
3,041,640 |
||
|
*Sunnova Energy International Inc |
122,000 |
3,174,440 |
||
|
|
8,078,480 |
|||
|
TOTAL COMMON STOCKS (COST: $112,319,123) |
$ |
146,265,780 |
||
|
OTHER ASSETS LESS LIABILITIES (0.5%) |
$ |
778,089 |
||
|
NET ASSETS (100.0%) |
$ |
147,043,869 |
||
|
* Non-income producing |
||||
|
PLC - Public Limited Company |
||||
|
ADR - American Depositary Receipt |
||||
|
|
|
|
|
|
|
|
|
|
|
|
|
The accompanying notes are an integral part of these financial statements. |
|
|
|
|
INTEGRITY SHORT TERM GOVERNMENT FUND
PORTFOLIO MARKET SECTORS July 31, 2022
|
Mortgage Backed Securities |
90.0% |
|
U.S. Government Note/Bonds |
5.6% |
|
Cash Equivalents and Other |
4.4% |
|
|
100.0% |
Market sectors are breakdowns of the Fund’s portfolio holdings into specific investment classes.
These percentages are based on net assets.
SCHEDULE OF INVESTMENTS July 31, 2022
|
Principal |
||||
|
Amount/ |
|
Fair |
||
|
MORTGAGE BACKED SECURITIES (90.0%) |
||||
|
Fannie Mae Pool (28.7%) |
||||
|
FN MA4076 3% 7/1/2035 |
$ |
207,622 |
206,833 |
|
|
FN 748375 3.463% 8/1/2033 |
643 |
643 |
||
|
FN BM3428 3.5% 1/1/2033 |
57,499 |
58,451 |
||
|
FN CA6065 3% 6/1/2050 |
143,321 |
137,288 |
||
|
FN MA3986 3.5% 4/1/2035 |
138,510 |
140,366 |
||
|
FN BP8780 3% 7/1/2050 |
255,176 |
249,692 |
||
|
FN MA4043 3% 6/1/2035 |
138,743 |
138,334 |
||
|
FN BM1257 2.5% 4/1/2037 |
185,113 |
176,147 |
||
|
FN MA3067 3.5% 7/1/2047 |
120,320 |
118,721 |
||
|
FN CB0573 2.5% 5/1/2046 |
274,476 |
258,023 |
||
|
FN MA3725 3.5% 7/1/2049 |
39,784 |
39,171 |
||
|
FN FS0600 3% 2/1/2050 |
129,258 |
126,138 |
||
|
FN AS8185 3% 10/1/2046 |
127,937 |
125,107 |
||
|
FN MA3101 4.5% 8/1/2047 |
83,068 |
85,750 |
||
|
FN BO4501 3% 9/1/2049 |
174,191 |
168,710 |
||
|
FN MA3071 4% 7/1/2037 |
79,214 |
82,051 |
||
|
FN FM2209 3.5% 1/1/2035 |
75,506 |
77,028 |
||
|
FN MA4400 3% 8/1/2051 |
245,308 |
237,301 |
||
|
FN 47935 4.863% 5/1/2027, (11th District Cost of Funds Index + 1.250%) (a) |
587 |
595 |
||
|
FN 252284 6.5% 1/1/2029 |
34,826 |
36,674 |
||
|
FN AS5093 2.5% 6/1/2030 |
332,060 |
327,854 |
||
|
FN MA2561 3% 3/1/2031 |
298,446 |
299,249 |
||
|
FN CA5979 3% 5/1/2050 |
84,950 |
81,374 |
||
|
FN BP6466 3% 7/1/2050 |
187,249 |
181,501 |
||
|
FN 555326 5.5% 4/1/2033 |
79,454 |
84,736 |
||
|
FN AL5259 3.5% 5/1/2029 |
109,891 |
111,461 |
||
|
FN AL9858 3% 3/1/2030 |
107,376 |
107,657 |
||
|
FN MA4094 2.5% 8/1/2040 |
226,012 |
215,568 |
||
|
FN AL7654 3% 9/1/2035 |
113,334 |
113,443 |
||
|
FN MA3928 2.5% 2/1/2030 |
300,410 |
298,821 |
||
|
FN 745751 5.5% 9/1/2035 |
17,840 |
19,121 |
||
|
FN BM1231 3.5% 11/1/2031 |
149,214 |
150,638 |
||
|
FN FM1487 4% 9/1/2039 |
29,773 |
30,400 |
||
|
FN 888073 5.5% 2/1/2035 |
13,335 |
14,243 |
||
|
FN 995865 4.5% 7/1/2024 |
10,263 |
10,564 |
||
|
FN MA4054 2.5% 6/1/2040 |
194,527 |
185,148 |
||
|
FN BM1244 3.5% 6/1/2032 |
147,033 |
149,955 |
||
|
FN FM6742 3% 8/1/2040 |
173,775 |
170,369 |
||
|
FN BJ0664 3% 3/1/2033 |
90,692 |
90,938 |
||
|
FN MA3689 4% 5/1/2029 |
106,115 |
108,358 |
||
|
FN CA1939 4% 6/1/2028 |
146,176 |
148,937 |
||
|
FN AS9698 3.5% 5/1/2032 |
212,633 |
216,660 |
||
|
FNCL 4% 9/25/2043 |
250,000 |
251,426 |
||
|
|
5,831,442 |
|||
|
Fannie Mae Remics (2.5%) |
||||
|
FNR 2007-54 EF 2.78371% 6/25/2037 |
517,066 |
512,860 |
||
|
Fannie Mae-Aces (2.5%) |
||||
|
FNA 2020-M10 X6 1.4985% 8/25/2028 (b)(c) |
3,541,089 |
251,527 |
||
|
FNA 2019-M32 X2 1.22062% 10/25/2029 (b)(c) |
4,267,046 |
264,617 |
||
|
|
516,144 |
|||
|
FHLMC-GNMA (0.1%) |
||||
|
FHG 23 FC 2.89371% 11/25/2023, (1 Month LIBOR USD + 0.450%) (a) |
9,492 |
9,492 |
||
|
|
|
|||
|
Freddie Mac Pool (11.6%) |
||||
|
FR SB8099 2.5% 4/1/2036 |
330,921 |
323,037 |
||
|
FR ZS8087 2.5% 4/1/2033 |
189,879 |
187,467 |
||
|
FR QN5456 2% 3/1/2036 |
349,017 |
333,199 |
||
|
FR ZT1348 3.5% 10/1/2038 |
68,865 |
69,389 |
||
|
FR ZS8670 3.5% 9/1/2032 |
171,335 |
174,782 |
||
|
FR RC2167 2% 7/1/2036 |
281,781 |
268,509 |
||
|
FR ZS8598 3% 2/1/2031 |
156,718 |
157,140 |
||
|
FR ZS8686 3% 2/1/2033 |
109,507 |
109,534 |
||
|
FR SD8184 3% 12/1/2051 |
290,037 |
280,273 |
||
|
FR ZA5250 4% 1/1/2048 |
255,415 |
261,440 |
||
|
FR RA5255 3.5% 5/1/2051 |
190,710 |
189,573 |
||
|
|
2,354,344 |
|||
|
Freddie Mac Gold Pool (8.5%) |
||||
|
FG G18605 3% 6/1/2031 |
118,450 |
118,864 |
||
|
FG G18524 3% 9/1/2029 |
135,057 |
135,527 |
||
|
FG G18596 3% 4/1/2031 |
450,693 |
451,163 |
||
|
FG G01584 5% 8/1/2033 |
32,646 |
34,545 |
||
|
FG G13390 6% 1/1/2024 |
823 |
827 |
||
|
FG G13610 5.5% 2/1/2024 |
1,474 |
1,478 |
||
|
FG G13692 5.5% 2/1/2024 |
711 |
713 |
||
|
FG G14160 6% 1/1/2024 |
59 |
59 |
||
|
FG G14441 4% 3/1/2027 |
74,737 |
76,310 |
||
|
FG G16406 3% 1/1/2028 |
70,960 |
71,638 |
||
|
FG G18601 3% 5/1/2031 |
179,085 |
179,710 |
||
|
FG C91993 3.5% 5/1/2038 |
144,114 |
145,352 |
||
|
FG NB0014 3.5% 4/1/2049 |
193,816 |
194,278 |
||
|
FG G16502 3.5% 5/1/2033 |
128,878 |
131,574 |
||
|
FG H09207 6.5% 8/1/2038 |
9,639 |
10,108 |
||
|
FG G18655 3% 8/1/2032 |
182,614 |
183,252 |
||
|
|
1,735,398 |
|||
|
Freddie Mac Multifamily Structured Pass Through Certificates (6.3%) |
||||
|
FHMS K736 X1 1.431297% 7/25/2026 (b)(c) |
6,366,752 |
253,352 |
||
|
FHMS K742 X1 0.868768% 3/25/2028 (b)(c) |
2,498,901 |
79,625 |
||
|
FHMS Q016 XPT1 0.981% 5/25/2026 (b) |
3,033,046 |
83,758 |
||
|
FHMS KJ28 A1 1.766% 2/25/2025 |
158,648 |
156,292 |
||
|
FHMS K724 X1 0.381702% 11/25/2023 (b)(c) |
4,226,830 |
11,176 |
||
|
FHMS Q004 A2H 2.851131% 1/25/2046 (b) |
120,926 |
120,446 |
||
|
FHMS Q007 APT1 3.306598% 10/25/2047 (b) |
44,072 |
44,112 |
||
|
FHMS KJ27 A1 2.092% 7/25/2024 |
5,646 |
5,595 |
||
|
FHMS K738 X1 1.627804% 1/25/2027 (b)(c) |
1,894,198 |
104,092 |
||
|
FHMS K078 XAM 0.146484% 6/25/2028 (b)(c) |
33,580,000 |
121,963 |
||
|
FHMS K111 X1 1.680191% 5/25/2030 (b)(c) |
3,067,281 |
300,118 |
||
|
|
1,280,529 |
|||
|
Freddie Mac REMICS (4.8%) |
||||
|
FHR 4818 BD 3.5% 3/15/2045 |
29,699 |
29,673 |
||
|
FHR 2344 ZD 6.5% 8/15/2031 |
9,957 |
10,768 |
||
|
FHR 3784 PD 4% 1/15/2026 |
3,999 |
3,997 |
||
|
FHR 5229 MD 4% 1/25/2046 |
443,662 |
454,525 |
||
|
FHR 4753 GT 3% 2/15/2045 |
419,175 |
416,322 |
||
|
FHR 4824 KQ 4% 6/15/2046 |
50,967 |
51,411 |
||
|
|
966,695 |
|||
|
Freddie Mac Structured Pass Through Certificates (0.1%) |
||||
|
FRESR 2017-SR01 A2 2.75% 11/25/2022 |
27,296 |
|
27,193 |
|
|
FRESB Mortgage Trust (3.7%) |
||||
|
FRESB 2019-SB60 A5H 3.07% 1/25/2039, (1 Month LIBOR USD + 0.700%) (a) |
235,918 |
234,873 |
||
|
FRESB 2016-SB13 A5H 3.06229% 1/25/2036, (1 Month LIBOR USD + 0.700%) (a) |
132,848 |
132,348 |
||
|
FRESB 2016-SB16 A5H 3.06229% 5/25/2036, (1 Month LIBOR USD + 0.700%) (a) |
103,092 |
102,874 |
||
|
FRESB 2015-SB7 A5 3.06229% 9/25/2035, (1 Month LIBOR USD + 0.700%) (a) |
195,188 |
195,230 |
||
|
FRESB 2015-SB2 A5 3.06229% 7/25/2035, (1 Month LIBOR USD + 0.700%) (a) |
81,907 |
81,783 |
||
|
FRESB 2015-SB3 A5 3.06229% 8/25/2042, (1 Month LIBOR USD + 0.700%) (a) |
3,389 |
3,377 |
||
|
|
750,485 |
|||
|
Ginnie Mae I Pool (0.3%) |
||||
|
GN 741854 4% 5/15/2025 |
26,623 |
27,190 |
||
|
GN 782618 4.5% 4/15/2024 |
34,857 |
35,859 |
||
|
|
63,049 |
|||
|
Ginnie Mae II Pool (2.6%) |
||||
|
G2 785316 3.05% 9/20/2070 |
102,159 |
104,183 |
||
|
G2 MA6932 3% 10/20/2050 |
161,115 |
158,252 |
||
|
G2 MA7707 3.5% 11/20/2051 |
238,108 |
237,549 |
||
|
G2 MA6402 4.5% 1/20/2050 |
22,616 |
22,707 |
||
|
|
522,691 |
|||
|
Government National Mortgage Association (15.8%) |
||||
|
GNR 2020-H12 IJ 2.16783% 7/20/2070 |
2,068,361 |
148,301 |
||
|
GNR 2020-H19 SI 0.60926% 10/20/2070 |
1,195,940 |
27,040 |
||
|
GNR 2014-138 IO 0.58004% 4/16/2056 (b)(c) |
462,585 |
11,173 |
||
|
GNR 2020-57 JI 1.80149% 1/16/2060 |
2,061,352 |
251,421 |
||
|
GNR 2020-H11 IO 1.77695% 6/20/2070 (b)(c) |
3,074,198 |
191,523 |
||
|
GNR 2015-97 A 2.4% 4/16/2043 |
221,912 |
217,530 |
||
|
GNR 2017-H22 IC 2.90334% 11/20/2067 |
1,124,148 |
58,343 |
||
|
GNR 2012-95 IO 0.25468% 2/16/2053 (b)(c) |
6,856,575 |
49,731 |
||
|
GNR 2014-120 IO 0.49452% 4/16/2056 (b)(c) |
1,022,834 |
12,726 |
||
|
GNR 2020-H04 IO 0.17079% 2/20/2070 (b)(c) |
600,714 |
34,421 |
||
|
GNR 2018-2 IO 0.70712% 12/16/2059 |
1,333,548 |
67,380 |
||
|
GNR 2020-132 IO 0.8568% 9/16/2062 (b)(c) |
1,600,016 |
113,099 |
||
|
GNR 2020-121 IO 0.91128% 8/16/2060 (b)(c) |
1,048,569 |
73,943 |
||
|
GNR 2018-119 IO 0.65994% 5/16/2060 (b)(c) |
718,956 |
43,426 |
||
|
GNR 2017-76 IO 0.81906% 12/16/2056 (b)(c) |
2,669,650 |
123,009 |
||
|
GNR 2021-36 IO 1.2623% 3/16/2063 (b)(c) |
2,187,332 |
199,310 |
||
|
GNR 2021-150 IO 1.03211% 11/16/2063 (b)(c) |
1,076,956 |
90,538 |
||
|
GNR 2020-H12 IG 1.06625% 7/20/2070 (b)(c) |
2,329,267 |
75,839 |
||
|
GNR 2018-137 AB 3.5% 10/20/2048 |
34,112 |
34,117 |
||
|
GNR 2021-5 IO 1.11057% 1/16/2061 (b)(c) |
2,849,824 |
235,632 |
||
|
GNR 2013-33 IO 0.28682% 4/16/2054 (b)(c) |
6,768,801 |
33,695 |
||
|
GNR 2017-28 IO 0.6591% 2/16/2057 (b)(c) |
2,394,224 |
96,300 |
||
|
GNR 2020-40 IO 0.87909% 1/16/2062 (b)(c) |
1,704,599 |
109,449 |
||
|
GNR 2016-158 IO 0.76191% 6/16/2058 (b)(c) |
2,381,038 |
92,341 |
||
|
GNR 2013-15 IO 0.5462% 8/16/2051 (b)(c) |
2,416,861 |
44,415 |
||
|
GNR 2013-17 IO 0.28159% 6/16/2054 (b)(c) |
3,203,648 |
26,610 |
||
|
GNR 2013-40 IO 0.41884% 6/16/2054 (b)(c) |
2,627,348 |
38,386 |
||
|
GNR 2013-105 IO 0.22465% 6/16/2054 (b)(c) |
4,531,611 |
15,131 |
||
|
GNR 2013-107 ID 0.19931% 11/16/2047 (b)(c) |
1,586,359 |
9,596 |
||
|
GNR 2013-101 IO 0.21995% 10/16/2054 (b)(c) |
2,106,979 |
28,952 |
||
|
GNR 2014-54 IO 0.32848% 9/16/2055 (b)(c) |
2,653,867 |
28,832 |
||
|
GNR 2014-73 IO 0.50126% 4/16/2056 (b)(c) |
3,773,045 |
62,791 |
||
|
GNR 2013-156 IO 0.28665% 6/16/2055 (b)(c) |
1,964,126 |
15,796 |
||
|
GNR 2014-1 IO 0.15848% 9/16/2055 (b)(c) |
2,522,155 |
15,612 |
||
|
GNR 2014-155 IB 0.63588% 8/16/2055 (b)(c) |
120,967 |
9,536 |
||
|
GNR 2015-130 IO 0.7161% 7/16/2057 (b)(c) |
1,463,388 |
41,231 |
||
|
GNR 2021-H08 VF 3.25765% 4/20/2071 |
238,970 |
243,471 |
||
|
GNR 2021-110 IO 0.87112% 11/16/2063 (b)(c) |
2,269,587 |
171,202 |
||
|
GNR 2018-108 IA 0.66558% 8/16/2060 |
906,884 |
64,681 |
||
|
|
3,206,527 |
|||
|
Seasoned Credit Risk Transfer Trust Series (1.7%) |
||||
|
SCRT 2021-1 TTU 2.5% 9/25/2060 |
201,219 |
193,951 |
||
|
SCRT 2020-3 M5TW 3% 5/25/2060 |
95,067 |
92,711 |
||
|
SCRT 2018-3 MA 3.5% 8/25/2057 |
60,257 |
|
59,957 |
|
|
|
346,619 |
|||
|
Seasoned Loans Structured Transaction Trust Series 2019-3 (0.8%) |
||||
|
SLST 2019-3 A1C 2.75% 11/25/2029 |
159,697 |
|
155,052 |
|
|
TOTAL MORTGAGE BACKED SECURITIES (Cost: $21,841,041) |
$ |
18,278,518 |
||
|
U.S. GOVERNMENT NOTES/BILLS (5.6%) |
||||
|
United States Treasury Note 1.00% 12/15/2024 |
575,000 |
550,473 |
||
|
United States Treasury Bill 0.00% 7/13/2023 |
600,000 |
583,512 |
||
|
TOTAL U.S. GOVERNMENT NOTES/BONDS (Cost $1,158,915) |
$ |
1,133,985 |
||
|
SHORT-TERM INVESTMENTS (7.1%) |
||||
|
Morgan Stanley Institutional Liquidity Fund, 0.140% (d) |
1,435,985 |
|
1,435,985 |
|
|
TOTAL SHORT-TERM INVESTMENTS (Cost $1,435.985) |
$ |
1,435,985 |
||
|
TOTAL INVESTMENTS (Cost $24,435,941) (102.6%) |
$ |
20,848,488 |
||
|
LIABILITIES IN EXCESS OF OTHER ASSETS (-2.6%) |
$ |
(535,663) |
||
|
NET ASSETS (100.0%) |
$ |
20,312,825 |
||
|
(a) Variable rate security; the rate shown represents the rate at July 31, 2022. Coupon may be fixed for a period of time. |
||||
|
(b) Variable rate security; the rate shown represents the rate at July 31, 2022. The coupon is based on an underlying pool of loans. |
||||
|
(c) Represents an interest-only security that entitles holders to receive only interest payments on underlying mortgages. |
||||
|
(d) Seven day yield as of July 31, 2022. |
||||
|
LIBOR - London InterBank Offered Rate. |
||||
|
1 Month LIBOR USD - 1 Month US Dollar LIBOR, rate disclosed as of July 31, 2022, based on the last reset date of the security. |
||||
|
|
||||
|
|
||||
|
The accompanying notes are an integral part of these financial statements. |
||||
FINANCIAL STATEMENTS
Statements of Assets and Liabilities | July 31, 2022
|
Dividend |
Growth |
||||
|
Harvest |
& Income |
||||
|
Fund |
Fund |
||||
|
ASSETS |
|||||
|
Investments in securities, at cost |
$ |
214,499,587 |
$ |
52,946,994 |
|
|
|
|||||
|
Investments in securities, at value |
$ |
245,425,532 |
$ |
75,967,615 |
|
|
Cash and cash equivalents |
4,979,330 |
2,195,392 |
|||
|
Receivable for Fund shares sold |
850,834 |
179,618 |
|||
|
Accrued dividends receivable |
648,922 |
107,658 |
|||
|
Accrued interest receivable |
43 |
32 |
|||
|
Receivable from affiliate |
98,943 |
41,050 |
|||
|
Prepaid expenses |
37,680 |
16,632 |
|||
|
Other assets |
2,785 |
- |
|||
|
Total assets |
$ |
252,044,069 |
$ |
78,507,997 |
|
|
|
|||||
|
LIABILITIES |
|||||
|
|
|
|
|
|
|
|
Payable for Fund shares redeemed |
210,550 |
76,479 |
|||
|
Trustees’ fees payable |
10,732 |
5,095 |
|||
|
Payable to affiliates |
261,705 |
109,697 |
|||
|
Accrued expenses |
28,160 |
17,672 |
|||
|
Total liabilities |
$ |
511,147 |
$ |
208,943 |
|
|
|
|||||
|
NET ASSETS |
$ |
251,532,922 |
$ |
78,299,054 |
|
|
|
|||||
|
NET ASSETS ARE REPRESENTED BY: |
|||||
|
Capital stock outstanding, $.001 par value, unlimited shares authorized |
$ |
224,151,221 |
$ |
54,527,220 |
|
|
Distributable earnings |
|
27,381,701 |
|
23,771,834 |
|
|
|
|||||
|
NET ASSETS |
$ |
251,532,922 |
$ |
78,299,054 |
|
|
|
|||||
|
Net Assets - Class A |
$ |
105,798,838 |
$ |
49,908,625 |
|
|
Net Assets - Class C |
$ |
22,462,826 |
$ |
5,655,052 |
|
|
Net Assets - Class I |
$ |
123,271,258 |
$ |
22,735,377 |
|
|
Shares outstanding - Class A |
6,478,661 |
677,031 |
|||
|
Shares outstanding - Class C |
1,387,122 |
79,185 |
|||
|
Shares outstanding - Class I |
7,541,965 |
307,875 |
|||
|
Net asset value per share - Class A* |
$16.33 |
$73.72 |
|||
|
Maximum sales charge - Class A |
5.00% |
5.00% |
|||
|
Public offering price per share - Class A |
$17.19 |
$77.60 |
|||
|
Net asset value per share - Class C* |
$16.19 |
$71.41 |
|||
|
Net asset value per share - Class I |
$16.34 |
$73.85 |
|||
|
|
|||||
|
* Redemption price per share is equal to net asset value less any applicable contingent deferred sales charge. |
|||||
|
|
|||||
|
The accompanying notes are an integral part of these financial statements. |
|||||
FINANCIAL STATEMENTS
Statements of Assets and Liabilities | July 31, 2022
|
High |
MNA |
Short Term |
||||||
|
Income |
Resources |
Government |
||||||
|
Fund |
Fund |
Fund |
||||||
|
ASSETS |
||||||||
|
Investments in securities, at cost |
$ |
56,692,244 |
$ |
112,319,123 |
$ |
24,435,941 |
||
|
|
||||||||
|
Investments in securities, at value |
$ |
51,887,615 |
$ |
146,265,780 |
$ |
20,848,488 |
||
|
Cash and cash equivalents |
1,043,635 |
644,103 |
- |
|||||
|
Security sales receivable |
78 |
1,194,986 |
228,714 |
|||||
|
Receivable for Fund shares sold |
12,267 |
177,400 |
- |
|||||
|
Accrued dividends receivable |
- |
13,002 |
- |
|||||
|
Accrued interest receivable |
860,928 |
8 |
108,800 |
|||||
|
Receivable from affiliate |
31,695 |
6,296 |
9,334 |
|||||
|
Prepaid expenses |
9,932 |
24,327 |
- |
|||||
|
Other assets |
2,002 |
- |
- |
|||||
|
Total assets |
$ |
53,848,152 |
$ |
148,325,902 |
$ |
21,195,336 |
||
|
|
||||||||
|
LIABILITIES |
||||||||
|
Payable for securities purchased |
$ |
45,654 |
$ |
925,134 |
$ |
829,930 |
||
|
Payable for Fund shares redeemed |
44,690 |
192,558 |
9,000 |
|||||
|
Distributions payable |
18,327 |
- |
- |
|||||
|
Trustees’ fees payable |
3,424 |
6,944 |
1,501 |
|||||
|
Payable to affiliates |
64,589 |
132,187 |
14,853 |
|||||
|
Accrued expenses |
15,760 |
25,210 |
27,227 |
|||||
|
Total liabilities |
$ |
192,444 |
$ |
1,282,033 |
$ |
882,511 |
||
|
|
||||||||
|
NET ASSETS |
$ |
53,655,708 |
$ |
147,043,869 |
$ |
20,312,825 |
||
|
|
||||||||
|
NET ASSETS ARE REPRESENTED BY: |
||||||||
|
Capital stock outstanding, $.001 par value, unlimited shares authorized |
$ |
58,879,669 |
$ |
321,084,568 |
$ |
29,960,881 |
||
|
Distributable earnings (accumulated losses) |
|
(5,223,961) |
|
(174,040,699) |
|
(9,648,056) |
||
|
|
||||||||
|
NET ASSETS |
$ |
53,655,708 |
$ |
147,043,869 |
$ |
20,312,825 |
||
|
|
||||||||
|
Net Assets - Class A |
$ |
25,736,103 |
$ |
95,210,505 |
$ |
703,445 |
||
|
Net Assets - Class C |
$ |
3,634,062 |
$ |
8,893,461 |
$ |
N/A |
||
|
Net Assets - Class I |
$ |
24,285,543 |
$ |
42,939,903 |
$ |
19,609,380 |
||
|
Shares outstanding - Class A |
3,511,278 |
18,775,593 |
83,411 |
|||||
|
Shares outstanding - Class C |
494,650 |
1,766,118 |
N/A |
|||||
|
Shares outstanding - Class I |
3,316,345 |
8,536,403 |
2,324,551 |
|||||
|
Net asset value per share - Class A* |
$7.33 |
$5.07 |
$8.43 |
|||||
|
Maximum sales charge - Class A |
4.25% |
5.00% |
2.00% |
|||||
|
Public offering price per share - Class A |
$7.66 |
$5.34 |
$8.60 |
|||||
|
Net asset value per share - Class C* |
$7.35 |
$5.04 |
N/A |
|||||
|
Net asset value per share - Class I |
$7.32 |
$5.03 |
$8.44 |
|||||
|
|
||||||||
|
* Redemption price per share is equal to net asset value less any applicable contingent deferred sales charge. |
||||||||
|
|
||||||||
|
The accompanying notes are an integral part of these financial statements. |
||||||||
FINANCIAL STATEMENTS
Statements of Operations | For the year ended July 31, 2022
|
Dividend |
Growth |
||||
|
Harvest |
& Income |
||||
|
Fund |
Fund |
||||
|
INVESTMENT INCOME |
|||||
|
Dividends (net of foreign withholding taxes of $111,665, and $0, respectively) |
$ |
8,134,652 |
$ |
1,236,581 |
|
|
Interest |
350 |
690 |
|||
|
Total investment income |
$ |
8,135,002 |
$ |
1,237,271 |
|
|
|
|||||
|
EXPENSES |
|||||
|
Investment advisory fees |
$ |
1,494,260 |
$ |
860,669 |
|
|
Distribution (12b-1) fees - Class A |
238,324 |
131,956 |
|||
|
Distribution (12b-1) fees - Class C |
185,118 |
56,713 |
|||
|
Transfer agent fees |
367,344 |
166,921 |
|||
|
Administrative service fees |
325,834 |
168,492 |
|||
|
Professional fees |
35,416 |
18,876 |
|||
|
Reports to shareholders |
4,967 |
5,059 |
|||
|
License, fees, and registrations |
40,527 |
46,227 |
|||
|
Audit fees |
29,724 |
13,970 |
|||
|
Trustees’ fees |
17,210 |
8,684 |
|||
|
Transfer agent out-of-pockets |
25,280 |
24,445 |
|||
|
Custodian fees |
18,417 |
9,089 |
|||
|
Legal fees |
15,282 |
7,133 |
|||
|
Insurance expense |
3,120 |
1,386 |
|||
|
Total expenses |
$ |
2,800,823 |
$ |
1,519,620 |
|
|
Less expenses waived or reimbursed (See Note 7) |
|
(980,581) |
|
(478,641) |
|
|
Total net expenses |
$ |
1,820,242 |
$ |
1,040,979 |
|
|
|
|
|
|
|
|
|
NET INVESTMENT INCOME (LOSS) |
$ |
6,314,760 |
$ |
196,292 |
|
|
|
|||||
|
REALIZED AND UNREALIZED GAIN (LOSS) ON INVESTMENTS |
|||||
|
Net realized gain (loss) from investment transactions |
$ |
9,230,591 |
$ |
572,871 |
|
|
Net change in unrealized appreciation (depreciation) of investments |
3,445,340 |
(8,893,507) |
|||
|
Net realized and unrealized gain (loss) on investments |
$ |
12,675,931 |
$ |
(8,320,636) |
|
|
|
|||||
|
NET INCREASE (DECREASE) IN NET ASSETS RESULTING FROM OPERATIONS |
$ |
18,990,691 |
$ |
(8,124,344) |
|
|
|
|||||
|
The accompanying notes are an integral part of these financial statements. |
|||||
FINANCIAL STATEMENTS
Statements of Operations | For the year ended July 31, 2022
|
High |
MNA |
Short Term |
||||||
|
Income |
Resources |
Government |
||||||
|
Fund |
Fund |
Fund |
||||||
|
INVESTMENT INCOME |
||||||||
|
Dividends (net of foreign withholding taxes of $0, $62,293, and $0, respectively) |
$ |
56,801 |
$ |
3,689,329 |
$ |
0 |
||
|
Interest |
2,788,071 |
452 |
448,136 |
|||||
|
Total investment income |
$ |
2,844,872 |
$ |
3,689,781 |
$ |
448,136 |
||
|
|
||||||||
|
EXPENSES |
||||||||
|
Investment advisory fees |
$ |
485,088 |
$ |
646,880 |
$ |
82,161 |
||
|
Distribution (12b-1) fees - Class A |
66,881 |
446,721 |
1,838 |
|||||
|
Distribution (12b-1) fees - Class C |
37,033 |
92,503 |
0 |
|||||
|
Transfer agent fees |
80,484 |
244,878 |
38,831 |
|||||
|
Administrative service fees |
127,896 |
229,125 |
74,225 |
|||||
|
Professional fees |
13,504 |
23,374 |
11,483 |
|||||
|
Reports to shareholders |
3,181 |
0 |
7,188 |
|||||
|
License, fees, and registrations |
29,507 |
46,139 |
11,325 |
|||||
|
Audit fees |
9,480 |
17,491 |
3,383 |
|||||
|
Trustees’ fees |
5,941 |
10,736 |
2,278 |
|||||
|
Transfer agent out-of-pockets |
12,838 |
49,009 |
6,329 |
|||||
|
Custodian fees |
15,945 |
13,112 |
11,965 |
|||||
|
Legal fees |
4,748 |
10,079 |
2,417 |
|||||
|
Insurance expense |
910 |
722 |
1,603 |
|||||
|
Total expenses |
$ |
893,436 |
$ |
1,830,769 |
$ |
255,026 |
||
|
Less expenses waived or reimbursed (See Note 7) |
|
(367,256) |
|
(2,135) |
|
(102,559) |
||
|
Total net expenses |
$ |
526,180 |
$ |
1,828,634 |
$ |
152,467 |
||
|
|
|
|
|
|
|
|
||
|
NET INVESTMENT INCOME (LOSS) |
$ |
2,318,692 |
$ |
1,861,147 |
$ |
295,669 |
||
|
|
||||||||
|
REALIZED AND UNREALIZED GAIN (LOSS) ON INVESTMENTS |
||||||||
|
Net realized gain (loss) from investment transactions |
$ |
382,980 |
$ |
25,379,879 |
$ |
(237,623) |
||
|
Net change in unrealized appreciation (depreciation) of investments |
(6,504,773) |
12,800,565 |
(1,334,779) |
|||||
|
Net realized and unrealized gain (loss) on investments |
$ |
(6,121,793) |
$ |
38,180,444 |
$ |
(1,572,402) |
||
|
|
||||||||
|
NET INCREASE (DECREASE) IN NET ASSETS RESULTING FROM OPERATIONS |
$ |
(3,803,101) |
$ |
40,041,591 |
$ |
(1,276,733) |
||
|
|
||||||||
|
The accompanying notes are an integral part of these financial statements. |
||||||||
FINANCIAL STATEMENTS
Statements of Changes in Net Assets | For the year ended July 31, 2022
|
Dividend |
ESG Growth |
||||
|
Harvest |
& Income |
||||
|
Fund |
Fund |
||||
|
INCREASE (DECREASE) IN NET ASSETS FROM OPERATIONS |
|||||
|
Net investment income (loss) |
$ |
6,314,760 |
$ |
196,292 |
|
|
Net realized gain (loss) from investment transactions |
9,230,591 |
572,871 |
|||
|
Net change in unrealized appreciation (depreciation) of investments |
3,445,340 |
(8,893,507) |
|||
|
Net increase (decrease) in net assets resulting from operations |
$ |
18,990,691 |
$ |
(8,124,344) |
|
|
|
|||||
|
DISTRIBUTIONS TO SHAREHOLDERS |
|||||
|
Distributions - Class A |
$ |
(2,959,093) |
$ |
(365,845) |
|
|
Distributions - Class C |
(445,278) |
(33,938) |
|||
|
Distributions - Class I |
(2,910,818) |
(278,380) |
|||
|
Total distributions |
$ |
(6,315,189) |
$ |
(678,163) |
|
|
|
|||||
|
CAPITAL SHARE TRANSACTIONS |
|||||
|
Proceeds from sale of shares - Class A |
$ |
20,445,610 |
$ |
7,249,256 |
|
|
Proceeds from sale of shares - Class C |
7,531,037 |
2,119,222 |
|||
|
Proceeds from sale of shares - Class I |
65,529,132 |
19,491,890 |
|||
|
Proceeds from reinvested dividends - Class A |
2,630,033 |
343,421 |
|||
|
Proceeds from reinvested dividends - Class C |
416,699 |
33,636 |
|||
|
Proceeds from reinvested dividends - Class I |
2,473,410 |
227,393 |
|||
|
Cost of shares redeemed - Class A |
(12,610,847) |
(5,231,276) |
|||
|
Cost of shares redeemed - Class C |
(2,422,784) |
(908,696) |
|||
|
Cost of shares redeemed - Class I |
(13,364,091) |
(18,723,586) |
|||
|
Net increase (decrease) in net assets resulting from capital share transactions |
$ |
70,628,199 |
$ |
4,601,260 |
|
|
|
|||||
|
TOTAL INCREASE (DECREASE) IN NET ASSETS |
$ |
83,303,701 |
$ |
(4,201,247) |
|
|
NET ASSETS, BEGINNING OF PERIOD |
168,229,221 |
82,500,301 |
|||
|
NET ASSETS, END OF PERIOD |
$ |
251,532,922 |
$ |
78,299,054 |
|
|
|
|
|
|||
|
|
|||||
|
The accompanying notes are an integral part of these financial statements. |
|||||
FINANCIAL STATEMENTS
Statements of Changes in Net Assets | For the year ended July 31, 2022
|
High |
MNA |
Short Term |
||||||
|
Income |
Resources |
Government |
||||||
|
Fund |
Fund |
Fund |
||||||
|
INCREASE (DECREASE) IN NET ASSETS FROM OPERATIONS |
||||||||
|
Net investment income (loss) |
$ |
2,318,692 |
$ |
1,861,147 |
$ |
295,669 |
||
|
Net realized gain (loss) from investment transactions |
382,980 |
25,379,879 |
(237,623) |
|||||
|
Net change in unrealized appreciation (depreciation) of investments |
(6,504,773) |
12,800,565 |
(1,334,779) |
|||||
|
Net increase (decrease) in net assets resulting from operations |
$ |
(3,803,101) |
$ |
40,041,591 |
$ |
(1,276,733) |
||
|
|
||||||||
|
DISTRIBUTIONS TO SHAREHOLDERS |
||||||||
|
Distributions - Class A |
$ |
(1,069,314) |
$ |
(1,174,231) |
$ |
(12,672) |
||
|
Distributions - Class C |
(120,709) |
(70,858) |
N/A |
|||||
|
Distributions - Class I |
(1,128,669) |
(577,871) |
(521,526) |
|||||
|
Total distributions |
$ |
(2,318,692) |
$ |
(1,822,960) |
$ |
(534,198) |
||
|
|
||||||||
|
CAPITAL SHARE TRANSACTIONS |
||||||||
|
Proceeds from sale of shares - Class A |
$ |
4,439,143 |
$ |
8,548,564 |
$ |
239,532 |
||
|
Proceeds from sale of shares - Class C |
1,285,470 |
609,839 |
N/A |
|||||
|
Proceeds from sale of shares - Class I |
14,443,443 |
20,354,863 |
2,119,881 |
|||||
|
Proceeds from reinvested dividends - Class A |
872,590 |
1,122,066 |
12,672 |
|||||
|
Proceeds from reinvested dividends - Class C |
90,057 |
66,929 |
N/A |
|||||
|
Proceeds from reinvested dividends - Class I |
777,436 |
439,535 |
453,336 |
|||||
|
Cost of shares redeemed - Class A |
(3,513,329) |
(21,321,329) |
(223,930) |
|||||
|
Cost of shares redeemed - Class C |
(1,136,599) |
(4,076,754) |
N/A |
|||||
|
Cost of shares redeemed - Class I |
(14,633,740) |
(6,298,602) |
(12,776,858) |
|||||
|
Net increase (decrease) in net assets resulting from capital share transactions |
$ |
2,624,471 |
$ |
(554,889) |
$ |
(10,175,367) |
||
|
|
||||||||
|
TOTAL INCREASE (DECREASE) IN NET ASSETS |
$ |
(3,497,322) |
$ |
37,663,742 |
$ |
(11,986,298) |
||
|
NET ASSETS, BEGINNING OF PERIOD |
57,153,030 |
109,380,127 |
32,299,123 |
|||||
|
NET ASSETS, END OF PERIOD |
$ |
53,655,708 |
$ |
147,043,869 |
$ |
20,312,825 |
||
|
|
|
|
||||||
|
|
||||||||
|
The accompanying notes are an integral part of these financial statements. |
||||||||
FINANCIAL STATEMENTS
Statements of Changes in Net Assets | For the year ended July 31, 2021
|
Dividend |
Growth |
|||||
|
Harvest |
& Income |
|||||
|
Fund |
Fund |
|||||
|
INCREASE (DECREASE) IN NET ASSETS FROM OPERATIONS |
||||||
|
Net investment income (loss) |
$ |
5,350,832 |
$ |
284,956 |
||
|
Net realized gain (loss) from investment transactions |
4,214,160 |
524,433 |
||||
|
Net change in unrealized appreciation (depreciation) of investments |
22,801,856 |
17,570,739 |
||||
|
Net increase (decrease) in net assets resulting from operations |
$ |
32,366,848 |
$ |
18,380,128 |
||
|
|
||||||
|
DISTRIBUTIONS TO SHAREHOLDERS |
||||||
|
Distributions - Class A |
$ |
(2,810,263) |
$ |
(272,423) |
||
|
Distributions - Class C |
(392,076) |
(21,036) |
||||
|
Distributions - Class I |
(2,148,841) |
(104,982) |
||||
|
Total distributions |
$ |
(5,351,180) |
$ |
(398,441) |
||
|
|
||||||
|
CAPITAL SHARE TRANSACTIONS |
||||||
|
Proceeds from sale of shares - Class A |
$ |
7,675,435 |
$ |
4,616,450 |
||
|
Proceeds from sale of shares - Class C |
2,494,842 |
3,312,881 |
||||
|
Proceeds from sale of shares - Class I |
20,316,477 |
16,808,995 |
||||
|
Proceeds from reinvested dividends - Class A |
2,510,040 |
258,007 |
||||
|
Proceeds from reinvested dividends - Class C |
367,461 |
19,728 |
||||
|
Proceeds from reinvested dividends - Class I |
1,809,304 |
92,356 |
||||
|
Cost of shares redeemed - Class A |
(16,825,117) |
(4,617,623) |
||||
|
Cost of shares redeemed - Class C |
(3,826,580) |
(164,320) |
||||
|
Cost of shares redeemed - Class I |
(20,562,292) |
(5,688,345) |
||||
|
Net increase (decrease) in net assets resulting from capital share transactions |
$ |
(6,040,430) |
$ |
14,638,129 |
||
|
|
||||||
|
TOTAL INCREASE (DECREASE) IN NET ASSETS |
$ |
20,975,238 |
$ |
32,619,816 |
||
|
NET ASSETS, BEGINNING OF PERIOD |
147,253,983 |
49,880,485 |
||||
|
NET ASSETS, END OF PERIOD |
$ |
168,229,221 |
$ |
82,500,301 |
||
|
|
|
|
||||
|
||||||
|
|
|
|||||
|
The accompanying notes are an integral part of these financial statements. |
|
|||||
FINANCIAL STATEMENTS
Statements of Changes in Net Assets | For the year ended July 31, 2021
|
High |
MNA |
Short Term |
||||||
|
Income |
Resources |
Government |
||||||
|
Fund |
Fund |
Fund |
||||||
|
INCREASE (DECREASE) IN NET ASSETS FROM OPERATIONS |
||||||||
|
Net investment income (loss) |
$ |
1,804,541 |
$ |
1,208,923 |
$ |
786,385 |
||
|
Net realized gain (loss) from investment transactions |
(76,273) |
3,419,079 |
(442,304) |
|||||
|
Net change in unrealized appreciation (depreciation) of investments |
2,699,885 |
32,167,389 |
(70,201) |
|||||
|
Net increase (decrease) in net assets resulting from operations |
$ |
4,428,153 |
$ |
36,795,391 |
$ |
273,880 |
||
|
|
||||||||
|
DISTRIBUTIONS TO SHAREHOLDERS |
||||||||
|
Distributions - Class A |
$ |
(1,046,347) |
$ |
(926,268) |
$ |
(7,834) |
||
|
Distributions - Class C |
(99,217) |
(85,174) |
N/A |
|||||
|
Distributions - Class I |
(659,674) |
(216,064) |
(1,126,580) |
|||||
|
Return of Capital - Class A |
0 |
(75,602) |
0 |
|||||
|
Return of Capital - Class C |
0 |
(6,952) |
0 |
|||||
|
Return of Capital - Class I |
0 |
(17,635) |
0 |
|||||
|
Total distributions |
$ |
(1,805,238) |
$ |
(1,327,695) |
$ |
(1,134,414) |
||
|
|
||||||||
|
CAPITAL SHARE TRANSACTIONS |
||||||||
|
Proceeds from sale of shares - Class A |
$ |
2,166,660 |
$ |
5,682,483 |
$ |
820,455 |
||
|
Proceeds from sale of shares - Class C |
1,038,149 |
2,118,145 |
N/A |
|||||
|
Proceeds from sale of shares - Class I |
17,908,258 |
12,159,860 |
18,109,021 |
|||||
|
Proceeds from reinvested dividends - Class A |
859,376 |
951,722 |
7,065 |
|||||
|
Proceeds from reinvested dividends - Class C |
69,349 |
87,613 |
N/A |
|||||
|
Proceeds from reinvested dividends - Class I |
478,421 |
182,710 |
793,351 |
|||||
|
Cost of shares redeemed - Class A |
(3,209,173) |
(23,517,371) |
(111,810) |
|||||
|
Cost of shares redeemed - Class C |
(268,726) |
(6,515,466) |
N/A |
|||||
|
Cost of shares redeemed - Class I |
(1,737,873) |
(5,720,858) |
(21,214,166) |
|||||
|
Net increase (decrease) in net assets resulting from capital share transactions |
$ |
17,304,441 |
$ |
(14,571,162) |
$ |
(1,596,084) |
||
|
|
||||||||
|
TOTAL INCREASE (DECREASE) IN NET ASSETS |
$ |
19,927,356 |
$ |
20,896,534 |
$ |
(2,456,618) |
||
|
NET ASSETS, BEGINNING OF PERIOD |
37,225,674 |
88,483,593 |
34,755,741 |
|||||
|
NET ASSETS, END OF PERIOD |
$ |
57,153,030 |
$ |
109,380,127 |
$ |
32,299,123 |
||
|
|
|
|
||||||
|
|
||||||||
|
The accompanying notes are an integral part of these financial statements. |
||||||||
NOTES TO FINANCIAL STATEMENTS
NOTE 1: Organization
The Integrity Funds (the “Trust”) was organized as a Delaware statutory trust on October 31, 1997 and commenced operations on October 31, 1997. The Trust is registered under the Investment Company Act of 1940 as an open-end management investment company, consisting of five series (the “Funds”).
Integrity Dividend Harvest Fund (the “Dividend Harvest Fund”), a diversified fund, seeks high current income with long term appreciation as a secondary objective. Integrity ESG Growth & Income Fund (the “Growth & Income Fund”), a diversified fund, seeks to provide long-term growth of capital with dividend income as a secondary objective. Integrity High Income Fund (the “High Income Fund”), a diversified fund, seeks a high level of current income with capital appreciation as a secondary objective. Integrity Mid-North American Resources Fund (the “MNA Resources Fund”), a diversified fund, seeks to provide long-term growth through capital appreciation. Integrity Short Term Government Fund (the “S-T Gov Fund”), a diversified fund, seeks to achieve a high and stable rate of total return, when and as opportunities are available in the context of preserving capital in adverse markets.
Each Fund in the Trust, except for S-T Gov Fund, currently offers Class A, C, and I shares. S-T Gov Fund offers Class A and I shares. The Class A shares of Dividend Harvest Fund, Growth & Income Fund, High Income Fund, MNA Resources Fund and S-T Gov Fund are sold with an initial sales charge of 5.00%, 5.00%, 4.25%, 5.00% and 2.00%, respectively, and a distribution fee of up to 0.25% on an annual basis. Class C shares are sold without a sales charge and are subject to a distribution fee of up to 1.00% on an annual basis. Class I shares are sold without a sales charge or distribution fee. The three classes of shares (two classes for S-T Gov Fund) represent interest in each Fund’s same portfolio of investments, have the same rights, and are generally identical in all respects except that each class bears its separate distribution and certain other class expenses and has exclusive voting rights with respect to any matter on which a separate vote of any class is required.
Under the Trust’s organizational documents, its officers and trustees are indemnified against certain liabilities arising out of the performance of their duties to the Funds. In addition, in the normal course of business, the Funds enter into contracts with their vendors and others that provide for general indemnifications. The Funds’ maximum exposure under these arrangements is unknown, as this would involve future claims that may be made against the Funds. However, based on experience, the Funds expect that risk of loss to be remote.
Each Fund is an investment company and, accordingly, follows the investment company accounting and reporting guidance of the Financial Accounting Standards Board (FASB) Accounting Standard Codification Topic 946, Financial Services – Investment Companies.
NOTE 2: Summary of Significant Accounting Policies
Investment security valuation—The Funds value their investments at fair value. Securities for which market quotations are available are valued as follows: (a) Listed securities are valued at the closing price obtained from the respective primary exchange on which the security is listed or, if there were no sales on that day, at its last reported current bid price; (b) Unlisted securities are valued at the last current bid price obtained from the National Association of Securities Dealers’ Automated Quotation System. The Funds’ administrative services agent, Integrity Fund Services, LLC (“Integrity Fund Services” or “IFS”) obtains all of these prices from services that collect and disseminate such market prices. Prices provided by an independent pricing service may be determined without exclusive reliance on quoted prices and may take into account appropriate factors such as: institutional-size trading in similar groups of securities, yield, quality, coupon rate, maturity, type of issue, trading characteristics, and other market data. In the absence of an ascertainable market value, assets are valued at their fair value as determined by IFS using methods and procedures reviewed and approved by the Board of Trustees. Refer to Note 3 for further disclosures related to the inputs used to value the Funds’ investments. Shares of a registered investment company, including money market funds, that are not traded on an exchange are valued at the investment company’s net asset value per share.
When-issued securities—The Funds may purchase securities on a when-issued basis. Payment and delivery may take place after the customary settlement period for that security. The price of the underlying securities and the date when the securities will be delivered and paid for are fixed at the time the transaction is negotiated. The values of the securities purchased on a when-issued basis are identified as such in each Fund’s Schedule of Investments. With respect to purchase commitments, the Fund identifies securities as segregated in its custodial records with a value at least equal to the amount of the commitment. Losses may arise due to changes in the value of the underlying securities, if the counterparty does not perform under the contract’s terms, or if the issuer does not issue the securities due to political, economic, or other factors.
Contingent deferred sales charge—Class A shares of $1 million or more may be subject to a 1.00% contingent deferred sales charge (“CDSC”) if redeemed within 24 months of purchase (excluding shares purchased with reinvested dividends and/or distributions). Investments in Class C shares (in any amount) may be subject to a 1.00% CDSC if redeemed within 12 months of purchase.
Federal and state income taxes—Each Fund is a separate taxpayer for federal income tax purposes. Each Fund’s policy is to comply with the requirements of the Internal Revenue Code that are applicable to regulated investment companies and to distribute substantially all of its net investment income and any net realized gain on investments to its shareholders; therefore, no provision for income taxes is required.
As of July 31, 2022, the Funds did not have a liability for any unrecognized tax benefits. The Funds recognize interest and penalties, if any, related to unrecognized tax benefits as income tax expense in the Statements of Operations. During the year ended July 31, 2022, the Funds did not incur any interest or penalties.
For all open tax years and all major taxing jurisdictions, management of the Funds has concluded that there are no significant uncertain tax positions that would require recognition in the financial statements. Open tax years, which include the current and prior three tax years, are open for examination by taxing authorities. Furthermore, management of the Funds is also not aware of any tax positions for which it is reasonably possible that the total amounts of unrecognized tax benefits will significantly change in the next twelve months.
Premiums and discounts—Premiums and discounts on debt securities are accreted and amortized into interest income using the effective yield method over the lives of the respective securities.
Cash and cash equivalents—The Funds consider investments in an FDIC insured interest bearing savings account to be cash. The Fund maintains balances, which, at times, may exceed federally insured limits. The Fund maintains these balances with a high quality financial institution.
Security transactions, investment income, expenses and distributions—Income and expenses are recorded on the accrual basis. Investment transactions are accounted for on the trade date. Realized gains and losses are reported on the specific identification basis. Interest income and estimated expenses are accrued daily. Dividend income is recognized on the ex-dividend date. Gains and losses on principal payments of mortgage-backed securities (paydown gains and losses) are included as an adjustment to interest income in the Statements of Operations. Withholding taxes on foreign dividends have been provided for in accordance with the Funds’ understanding of the applicable countries’ tax rules and regulations. Dividend Harvest Fund and S-T Gov Fund will declare and pay dividends from net investment income monthly. MNA Resources Fund will declare and pay dividends from net investment income quarterly. Growth & Income Fund will declare and pay dividends from net investment income at least annually. The High Income Fund declares dividends from net investment income daily and pays such dividends monthly. Dividends are reinvested in additional shares of the Funds at net asset value or paid in cash. Capital gains, when available, are distributed at least annually. Distributions to shareholders are recorded on the ex-dividend date. Income and capital gain distributions are determined in accordance with federal income tax regulations and may differ from net investment income and realized gains determined in accordance with accounting principles generally accepted in the United States of America (“GAAP”). These differences are primarily due to differing treatments for capital loss carryforwards and losses due to wash sales. In addition, other amounts have been reclassified within the composition of net assets to more appropriately conform financial accounting to tax basis treatment.
Permanent book and tax basis differences relating to shareholder distributions will result in reclassifications to paid-in capital. Temporary book and tax basis differences will reverse in a subsequent period. As of July 31, 2022, there were no permanent reclassifications to paid-in capital.
Use of estimates—The financial statements have been prepared in accordance with GAAP, which requires management to make estimates and assumptions that affect the reported amounts of assets and liabilities and disclosure of contingent assets and liabilities at the date of the financial statements and the reported amounts of increase (decrease) from operations during the reporting period. Actual results could differ from those estimates.
Common expenses—Common expenses of the Trust are allocated among the Funds within the Trust based on relative net assets of each Fund or the nature of the services performed and the relative applicability to each Fund.
Multiple class allocations—The High Income Fund simultaneously uses the settled shares method to allocate income and fund-wide expenses and uses the relative net assets method to allocate gains and losses. Dividend Harvest Fund, Growth & Income Fund, MNA Resources Fund and S-T Gov Fund use the relative net assets method to allocate income, fund-wide expenses, gains and losses. Class-specific expenses, distribution fees, and any other items that are specifically attributable to a particular class are charged directly to such class.
Illiquid securities—A security may be considered to be illiquid if it has a limited trading market. Securities are generally considered to be liquid if they can be sold or disposed of in the ordinary course of business within seven days at approximately the price at which the security is valued by the Funds. These securities are valued at fair value as described above. Each Fund intends to hold no more than 15% of its net assets in illiquid securities. Of the illiquid securities listed on the Schedules of Investments, the following securities are considered to be restricted as of July 31, 2022:
|
High Income Fund |
Shares/ Principal |
Dates Acquired |
Cost Basis |
Fair Value |
|
|
International Oncology Care Inc. |
1,633 |
2/22/18 |
66,476 |
16,477 |
|
|
NMG Equity Shares |
37 |
9/25/20 |
84 |
6,475 |
NOTE 3: Fair Value Measurements
Various inputs are used in determining the value of the Funds' investments. These inputs are summarized in three broad levels: Level 1 inputs are based on quoted prices in active markets for identical securities. Level 2 inputs are based on significant observable inputs (including quoted prices for similar securities, interest rates, prepayment speeds, credit risk, etc.). Level 3 inputs are based on significant unobservable inputs (including the Funds’ own assumptions in determining the fair value of investments). The following is a summary of the inputs used to value the Funds’ investments as of July 31, 2022:
|
Dividend Harvest Fund |
Level 1 |
Level 2 |
Level 3 |
Total |
||||||||
|
Common Stocks |
$ |
245,425,532 |
$ |
0 |
$ |
0 |
$ |
245,425,532 |
||||
|
Total |
$ |
245,425,532 |
$ |
0 |
$ |
0 |
$ |
245,425,532 |
||||
|
|
||||||||||||
|
Growth & Income Fund |
Level 1 |
Level 2 |
Level 3 |
Total |
||||||||
|
Common Stocks |
$ |
75,967,615 |
$ |
0 |
$ |
0 |
$ |
75,967,615 |
||||
|
Total |
$ |
75,967,615 |
$ |
0 |
$ |
0 |
$ |
75,967,615 |
||||
|
|
||||||||||||
|
High Income Fund |
Level 1 |
Level 2 |
Level 3 |
Total |
||||||||
|
Corporate Bonds |
$ |
0 |
$ |
50,688,263 |
$ |
41* |
$ |
50,688,304 |
||||
|
Common Stock |
819,719 |
22,755 |
165,342 |
1,007,816 |
||||||||
|
Convertible Preferred Stock |
0 |
0 |
155,480 |
155,480 |
||||||||
|
Warrants |
935 |
0 |
35,080 |
36,015 |
||||||||
|
Total |
$ |
820,654 |
$ |
50,711,018 |
$ |
355,943 |
$ |
51,887,615 |
||||
|
|
||||||||||||
|
MNA Resources Fund |
Level 1 |
Level 2 |
Level 3 |
Total |
||||||||
|
Common Stocks |
$ |
146,265,780 |
$ |
0 |
$ |
0 |
|
146,265,780 |
||||
|
Total |
$ |
146,265,780 |
$ |
0 |
$ |
0 |
$ |
146,265,780 |
||||
|
ST Gov Fund |
Level 1 |
Level 2 |
Level 3 |
Total |
||||||||
|
Mortgage Backed Securities |
$ |
0 |
$ |
18,278,518 |
$ |
0 |
$ |
18,278,518 |
||||
|
U.S Government Notes/Bills |
0 |
1,133,985 |
0 |
1,133,985 |
||||||||
|
Short Term Investments |
1,435,985 |
0 |
0 |
1,435,985 |
||||||||
|
Total |
$ |
1,435,985 |
$ |
19,412,503 |
$ |
0 |
$ |
20,848,488 |
||||
*Level 3 corporate bonds for High Income Fund includes a corporate bond valued at zero.
Please refer to the Schedules of Investments for sector classification.
A reconciliation of Level 3 investments, including certain disclosures related to significant inputs used in valuing Level 3 investments, are presented when a Fund has a significant amount of Level 3 investments at the beginning and/or end of the year in relation to net assets.
The changes of the fair value of investments during the year ended July 31, 2022, for which the Funds have used Level 3 inputs to determine the fair value are as followed:
|
|
Balance |
Realized |
Change in unrealized |
Balance |
||
|
High Income Fund |
7/31/2021 |
Purchases |
Sales |
Gain/(Loss) |
appreciation/depreciation |
7/31/2022 |
|
Common Stock |
$378,165 |
$400,762 |
($312,984) |
$192,423 |
($493,024) |
$165,342 |
|
Corporate Bonds |
$0 |
$0 |
$0 |
$0 |
$41 |
$41 |
|
Convertible Preferred Stock |
$140,430 |
$0 |
($7,882) |
$6,007 |
$16,925 |
$155,480 |
|
Warrants |
$13,455 |
$0 |
$0 |
$0 |
$21,625 |
$35,080 |
|
|
|
|
Valuation |
||||||
|
|
Fair Value at |
|
|
|
Unobservable |
|
|
from |
Weighted |
|
Asset Class |
July 31, 2022 |
|
Valuation Technique |
|
Inputs |
Range |
|
Input |
Average |
|
Common Stock |
$148,865 |
Market Comparable Transaction |
Broker Quote |
$1.26 - $262.50 |
Decrease |
$46.79 |
|||
|
Common Stock |
$16,477 |
Market Comparable Companies |
EBITDA Multiple |
5.00x |
Decrease |
N/A |
|||
|
Convertible Preferred Stock |
$155,480 |
Market Comparable Transaction |
Broker Quote |
$1.07 - $2,575.00 |
Decrease |
$1,536.94 |
|||
|
Warrants |
$35,080 |
Market Comparable Transaction |
Broker Quote |
$0.01 - $50.83 |
Increase |
$50.82 |
Unobservable inputs used in the fair value measurement of the Funds’ investments are listed above. Significant changes in any of the unobservable inputs may significantly impact the fair value measurement. Significant increases (decreases) in working capital may increase (decrease) the fair value measurement.
NOTE 4: Investment Transactions
Purchases and sales of investment securities (excluding short-term securities) for the year ended July 31, 2022, were as follows:
|
Dividend |
Growth & |
High |
MNA |
Short Term |
||||||
|
Harvest |
Income |
Income |
Resources |
Government |
||||||
|
Fund |
Fund |
Fund |
Fund |
Fund |
||||||
|
Purchases |
$95,692,242 |
$12,949,114 |
$16,893,916 |
$67,177,420 |
$13,345,734 |
|||||
|
Sales |
$29,113,953 |
$2,980,830 |
$11,329,425 |
$63,948,356 |
$21,968,722 |
NOTE 5: Capital Share Transactions
Transactions in capital shares were as follows:
|
Year Ended 7/31/2022: |
Dividend |
Growth & |
High |
MNA |
S-T |
|||||
|
|
Harvest |
Income |
Income |
Resources |
Gov |
|||||
|
Class A |
Fund |
Fund |
Fund |
Fund |
Fund |
|||||
|
Shares sold |
1,251,790 |
88,839 |
564,274 |
1,894,851 |
28,090 |
|||||
|
Shares issued from reinvestments |
163,355 |
3,867 |
113,606 |
255,482 |
1,459 |
|||||
|
Shares redeemed |
(783,964) |
(66,431) |
(452,666) |
(4,798,400) |
(26,678) |
|||||
|
Net increase (decrease) |
631,181 |
26,275 |
225,214 |
(2,648,067) |
2,871 |
|||||
|
|
||||||||||
|
Class C |
||||||||||
|
Shares sold |
461,695 |
26,844 |
163,188 |
133,950 |
N/A |
|||||
|
Shares issued from reinvestments |
26,067 |
389 |
11,726 |
15,578 |
N/A |
|||||
|
Shares redeemed |
(151,689) |
(11,899) |
(143,527) |
(930,805) |
N/A |
|||||
|
Net increase (decrease) |
336,073 |
15,334 |
31,387 |
(781,277) |
N/A |
|||||
|
|
||||||||||
|
Class I |
||||||||||
|
Shares sold |
3,984,127 |
237,761 |
1,865,616 |
4,461,895 |
240,726 |
|||||
|
Shares issued from reinvestments |
152,901 |
2,560 |
101,343 |
98,535 |
52,063 |
|||||
|
Shares redeemed |
(828,781) |
(238,193) |
(1,930,825) |
(1,371,287) |
(1,482,870) |
|||||
|
Net increase (decrease) |
3,308,247 |
2,128 |
36,134 |
3,189,143 |
(1,190,081) |
|||||
|
|
||||||||||
|
Year Ended 7/31/2021: |
Dividend |
Growth & |
High |
MNA |
S-T |
|||||
|
|
Harvest |
Income |
Income |
Resources |
Gov |
|||||
|
Class A |
Fund |
Fund |
Fund |
Fund |
Fund |
|||||
|
Shares sold |
544,794 |
63,512 |
272,639 |
1,595,584 |
90,552 |
|||||
|
Shares issued from reinvestments |
181,929 |
3,731 |
108,550 |
314,560 |
782 |
|||||
|
Shares redeemed |
(1,231,667) |
(65,560) |
(403,713) |
(7,358,452) |
(12,373) |
|||||
|
Net increase (decrease) |
(504,944) |
1,683 |
(22,524) |
(5,448,308) |
78,961 |
|||||
|
|
||||||||||
|
Class C |
||||||||||
|
Shares sold |
177,323 |
47,449 |
129,198 |
546,845 |
N/A |
|||||
|
Shares issued from reinvestments |
26,897 |
291 |
8,726 |
30,307 |
N/A |
|||||
|
Shares redeemed |
(278,396) |
(2,182) |
(33,809) |
(1,809,776) |
N/A |
|||||
|
Net increase (decrease) |
(74,176) |
45,558 |
104,115 |
(1,232,624) |
N/A |
|||||
|
|
||||||||||
|
Class I |
||||||||||
|
Shares sold |
1,461,955 |
236,030 |
2,240,045 |
3,473,825 |
1,995,148 |
|||||
|
Shares issued from reinvestments |
130,474 |
1,335 |
60,047 |
58,714 |
87,294 |
|||||
|
Shares redeemed |
(1,468,692) |
(85,669) |
(218,687) |
(1,708,812) |
(2,336,487) |
|||||
|
Net increase (decrease) |
123,737 |
151,696 |
2,081,405 |
1,823,727 |
(254,045) |
NOTE 6: Income Tax Information
At July 31, 2022, the unrealized appreciation (depreciation) based on the cost of investments for federal income tax purposes was as follows:
|
Dividend |
Growth & |
High |
MNA |
S-T |
||||||||||
|
Harvest |
Income |
Income |
Resources |
Gov |
||||||||||
|
Fund |
Fund |
Fund |
Fund |
Fund |
||||||||||
|
Investments at cost |
$ |
214,499,587 |
$ |
52,946,994 |
$ |
56,694,599 |
$ |
112,319,123 |
$ |
24,435,941 |
||||
|
Unrealized appreciation |
$ |
36,877,604 |
$ |
26,169,957 |
$ |
757,739 |
$ |
37,851,140 |
$ |
38,474 |
||||
|
Unrealized depreciation |
(5,951,659) |
(3,149,336) |
(5,564,723) |
(3,904,483) |
(3,625,927) |
|||||||||
|
Net unrealized app/dep* |
$ |
30,925,945 |
$ |
23,020,621 |
$ |
(4,806,984) |
$ |
33,946,657 |
$ |
(3,587,453) |
||||
*Differences between financial reporting-basis and tax-basis unrealized appreciation/ (depreciation) are due to tax deferral of losses on wash sales.
The tax character of distributions paid was as follows:
|
Dividend |
Growth & |
High |
MNA |
S-T |
|||||||||||
|
Harvest |
Income |
Income |
Resources |
Gov |
|||||||||||
|
Year ended July 31, 2022: |
Fund |
Fund |
Fund |
Fund |
Fund |
||||||||||
|
Ordinary Income |
$ |
6,314,760 |
$ |
173,028 |
$ |
2,343,467 |
$ |
1,822,960 |
$ |
534,198 |
|||||
|
Capital Gain |
429 |
505,135 |
0 |
0 |
0 |
||||||||||
|
|
|
|
|
|
|
|
|
|
|
|
|
|
|
|
|
|
$ |
6,315,189 |
$ |
678,163 |
$ |
2,343,467 |
$ |
1,822,960 |
$ |
534,198 |
||||||
|
Year ended July 31, 2021 |
|||||||||||||||
|
Ordinary Income |
$ |
5,351,180 |
$ |
388,286 |
$ |
1,805,238 |
$ |
1,227,506 |
$ |
1,134,414 |
|||||
|
Capital Gain |
0 |
10,155 |
0 |
0 |
0 |
||||||||||
|
Return of Capital |
|
0 |
|
0 |
|
0 |
|
100,189 |
|
0 |
|||||
|
$ |
5,351,180 |
$ |
398,441 |
$ |
1,805,238 |
$ |
1,327,695 |
$ |
1,134,414 |
||||||
As of July 31, 2022, the components of accumulated earnings/(deficit) on a tax basis were as follows:
|
Dividend |
Growth & |
High |
MNA |
S-T |
||||||||||
|
Harvest |
Income |
Income |
Resources |
Gov |
||||||||||
|
Fund |
Fund |
Fund |
Fund |
Fund |
||||||||||
|
Undistributed ordinary income |
$ |
0 |
$ |
178,343 |
$ |
15,860 |
$ |
38,187 |
$ |
4,140 |
||||
|
Distributions Payable |
0 |
0 |
(18,327) |
0 |
0 |
|||||||||
|
Undistributed capital gain |
2,455,014 |
572,870 |
0 |
0 |
0 |
|||||||||
|
Capital loss carryforward |
(5,999,258) |
0 |
(414,510) |
(208,025,543) |
(6,064,743) |
|||||||||
|
Unrealized appreciation/(depreciation) |
30,925,945 |
23,020,621 |
(4,806,984) |
33,946,657 |
(3,587,453) |
|||||||||
|
Total accumulated earnings/(deficit) |
$ |
27,381,701 |
$ |
23,771,834 |
$ |
(5,223,961) |
$ |
(174,040,699) |
$ |
(9,648,056) |
||||
|
|
||||||||||||||
The Funds’ capital loss carryforward amounts as of July 31, 2022 are as follows:
|
Dividend |
Growth & |
High |
MNA |
S-T |
||||||||||
|
Harvest |
Income |
Income |
Resources |
Gov |
||||||||||
|
Fund* |
Fund |
Fund |
Fund |
Fund |
||||||||||
|
Non-expiring S-T losses |
$ |
5,999,258 |
$ |
0 |
$ |
0 |
$ |
103,849,394 |
$ |
4,392,315 |
||||
|
Non-expiring L-T losses |
0 |
0 |
414,510 |
104,176,149 |
1,672,428 |
|||||||||
|
Total |
$ |
5,999,258 |
$ |
0 |
$ |
414,510 |
$ |
208,025,543 |
$ |
6,064,743 |
||||
|
|
||||||||||||||
|
Capital loss carryforward utilized |
$ |
6,775,148 |
$ |
0 |
$ |
382,979 |
$ |
24,932,389 |
$ |
0 |
||||
*Dividend Harvest Fund’s ability to use the capital loss carryforward of MD Sass Equity Fund may be limited by loss limitation rules under federal tax law.
NOTE 7: Investment Advisory Fees and Other Transactions with Affiliates
Viking Fund Management (“VFM”), the Funds’ investment adviser; Integrity Funds Distributor, LLC (“Integrity Funds Distributor” or “IFD”), the Funds’ underwriter and distributor; and Integrity Fund Services, the Funds’ transfer, accounting, and administrative services agent; are subsidiaries of Corridor Investors, LLC (“Corridor Investors” or “Corridor”), the Funds’ sponsor. For Integrity High Income Fund, JPMIM is the sub-adviser. For S-T Gov Fund, M.D. Sass Investor Services, Inc. is the sub-adviser. A Trustee of the Funds is also a Governor of Corridor.
VFM provides investment advisory and management services to the Funds. The Investment Advisory Agreement (the “Advisory Agreement”) provides for fees to be computed at an annual rate of each Fund’s average daily net assets. VFM has also contractually agreed to waive its management fee and to reimburse expenses that are not covered by the management fee, other than extraordinary or non-recurring expenses, taxes, brokerage fees, commissions and acquired fund fees and expenses, so that the net annual operating expenses do not exceed a certain rate. After November 29, 2022, the expense limitations may be terminated or revised for the Funds. Expense limitations as of July 31, 2022, are stated below.
|
|
|
|
Contractual Waiver % |
||||
|
|
Advisory Fee % |
|
Class A |
|
Class C |
|
Class I |
|
|
|
|
|
|
|
|
|
|
Dividend Harvest Fund |
0.75% |
|
0.95% |
|
1.70% |
|
0.70% |
|
Growth & Income Fund |
1.00% |
|
1.24% |
|
1.99% |
|
0.99% |
|
High Income Fund |
0.85% |
|
0.99% |
|
1.74% |
|
0.74% |
|
MNA Resources Fund |
0.50% |
|
1.50% |
|
2.00% |
|
1.00% |
|
S-T Gov Fund |
0.30% |
|
0.80% |
|
N/A |
|
0.55% |
VFM and affiliated service providers may also voluntarily waive fees or reimburse expenses not required under the advisory or other contracts from time to time. There were no voluntary waivers for the year ended July 31, 2022. An expense limitation lowers expense ratios and increases returns to investors. Certain Officers of the Funds are also Officers and Governors of VFM.
|
Twelve Months Ended 7/31/2022 |
Payable 7/31/2022 |
||||||||||||||||
|
Advisory |
|
Waived |
|
Reimb. |
Advisory |
|
Waived |
|
Reimb. |
||||||||
|
Dividend Harvest Fund |
$ |
1,494,260 |
$ |
980,581 |
$ |
0 |
$ |
152,000 |
$ |
98,943 |
$ |
0 |
|||||
|
Growth & Income Fund |
$ |
860,669 |
$ |
478,641 |
$ |
0 |
$ |
64,071 |
$ |
41,050 |
$ |
0 |
|||||
|
High Income Fund |
$ |
485,088 |
$ |
367,256 |
$ |
0 |
$ |
37,306 |
$ |
31,695 |
$ |
0 |
|||||
|
MNA Resources Fund |
$ |
646,880 |
$ |
2,135 |
$ |
0 |
$ |
56,335 |
$ |
6,296 |
$ |
0 |
|||||
|
S-T Gov Fund |
$ |
82,161 |
$ |
82,161 |
$ |
20,398 |
$ |
5,151 |
$ |
5,151 |
$ |
4,183 |
|||||
VFM is entitled to recoup such amounts waived or reimbursed for a period of up to three years from the date on which VFM waived fees or reimbursed expenses for each Fund. Each Fund will make repayments to the VFM only if such repayment does not cause the annual Fund operating expenses (after the repayment is taken into account) to exceed both (1) the expense limitation in place when such amounts were waived and (2) the Fund’s current expense limitation.
Amounts subject to recoupment and expiration dates are as follows:
|
July 31, 2024 |
July 31, 2025 |
|||
|
Dividend Harvest Fund |
$ |
833,118 |
$ |
980,581 |
|
Growth & Income Fund |
$ |
349,463 |
$ |
478,641 |
|
High Income Fund |
$ |
285,771 |
$ |
367,256 |
|
MNA Resources Fund |
$ |
110,668 |
$ |
2,135 |
|
S-T Gov Fund |
$ |
124,077 |
$ |
102,559 |
In addition, VFM is entitled to recoup $31,547 expiring May 31, 2023, and $29,300 expiring July 31, 2023, for S-T Gov Fund.
IFD serves as the principal underwriter and distributor for the Funds and receives sales charges deducted from Fund share sales proceeds and CDSC from applicable Fund share redemptions. Also, the Funds have adopted a distribution plan for each class of shares as allowed by Rule 12b-1 of the 1940 Act. Distribution plans permit the Funds to reimburse its principal underwriter for costs related to selling shares of the Funds and for various other services. These costs, which consist primarily of commissions and service fees to broker-dealers who sell shares of the Funds, are paid by shareholders through expenses called “Distribution Plan expenses.” The Funds currently pay an annual distribution fee and/or service fee of up to 0.25% (0.50% for MNA Resources Fund) for Class A and 1.00% for Class C of the average daily net assets. Class I shares do not have a 12b-1 plan in place. Certain Officers of the Funds are also Officers and Governors of IFD.
|
Twelve Months Ended 7/31/2022 |
Payable 7/31/2022 |
||||||||||
|
Sales Charges |
|
CDSC |
|
Distribution Fees |
Distribution Fees |
||||||
|
Dividend Harvest Fund - A |
$ |
429,055 |
$ |
0 |
$ |
238,324 |
$ |
21,426 |
|||
|
Dividend Harvest Fund - C |
$ |
0 |
$ |
803 |
$ |
185,118 |
$ |
18,429 |
|||
|
Growth & Income Fund - A |
$ |
106,654 |
$ |
0 |
$ |
131,956 |
$ |
10,115 |
|||
|
Growth & Income Fund - C |
$ |
0 |
$ |
704 |
$ |
56,713 |
$ |
4,566 |
|||
|
High Income Fund - A |
$ |
42,577 |
$ |
0 |
$ |
66,881 |
$ |
5,183 |
|||
|
High Income Fund - C |
$ |
0 |
$ |
384 |
$ |
37,033 |
$ |
3,000 |
|||
|
MNA Resources Fund - A |
$ |
184,997 |
$ |
0 |
$ |
446,721 |
$ |
36,510 |
|||
|
MNA Resources Fund - C |
$ |
0 |
$ |
176 |
$ |
92,503 |
$ |
6,932 |
|||
|
S-T Gov Fund - A |
$ |
399 |
$ |
0 |
$ |
1,838 |
$ |
147 |
|||
IFS acts as the transfer agent for High Income Fund and S-T Gov Fund at a monthly variable fee equal to 0.12% on the first $0 to $200 million and at a lower rate in excess of $200 million of the Funds’ average daily net assets on an annual basis and an additional fee of $500 per month for each additional share class plus reimbursement of out-of-pocket expenses and sub-transfer agent out-of-pocket expenses. IFS acts as the transfer agent for Dividend Harvest Fund, Growth & Income Fund, and MNA Resources Fund at a monthly variable fee equal to 0.18% on the first $0 to $200 million, 0.15% on the next $200 to $700 million and at a lower rate in excess of $700 million of the Funds’ average daily net assets on an annual basis and an additional fee of $500 per month for each additional share class plus reimbursement of out-of-pocket expenses and sub-transfer agent out-of-pocket expenses. Sub-transfer agent out-of-pocket expenses are included in the transfer agent fees below and in the transfer agent out-of-pocket balance on the Statements of Operations.
IFS also acts as the Funds’ administrative services agent for a monthly fee equal to the sum of a fixed fee of $2,000 and a variable fee equal to 0.14% on the first $0 to $200 million, 0.13% on the next $200 to $700 million and at a lower rate in excess of $700 million of the Funds’ average daily net assets on an annual basis and an additional fee of $1,000 per month for each additional share class plus reimbursement of out-of-pocket expenses. Certain Officers of the Funds are also Officers and Governors of IFS.
|
Twelve Months Ended 7/31/2022 |
Payable 7/31/2022 |
||||||||||
|
Transfer |
Admin. |
Transfer |
Admin. |
||||||||
|
Agency Fees |
Service Fees |
Agency Fees |
Service Fees |
||||||||
|
Dividend Harvest Fund |
$ |
392,624 |
$ |
325,834 |
$ |
37,728 |
$ |
32,122 |
|||
|
Growth & Income Fund |
$ |
191,366 |
$ |
168,492 |
$ |
17,899 |
$ |
13,046 |
|||
|
High Income Fund |
$ |
93,322 |
$ |
127,896 |
$ |
8,877 |
$ |
10,221 |
|||
|
MNA Resources Fund |
$ |
293,887 |
$ |
229,125 |
$ |
12,560 |
$ |
19,850 |
|||
|
S-T Gov Fund |
$ |
45,160 |
$ |
74,225 |
$ |
4,102 |
$ |
5,453 |
|||
NOTE 8: Principal Risks
The High Income Fund may be invested in lower-rated debt securities that have a higher risk of default or loss of value since these securities may be sensitive to economic changes, political changes or adverse developments specific to the issuer.
The MNA Resources Fund invests significantly in relatively few sectors, primarily the energy sector, and has more exposure to the price movement of this sector than funds that diversify their investments among many sectors.
NOTE 9: Beneficial Ownership
The beneficial ownership, either directly or indirectly, of more than 25% of the voting securities of a fund creates a presumption of control of the fund, under Section 2(a)(9) of the 1940 Act. At July 31, 2022, the following shareholder held over 25% of S-T Gov Class I’s shares outstanding:
Marc Brownstein 27.16%
NOTE 10: Subsequent Events
The Board of Trustees approved a change in the name of ESG Growth & Income Fund. Effective October 20, 2022, the Fund’s name is Integrity Growth & Income Fund.
The Funds are required to recognize in the financial statements the effects of all subsequent events that provide additional evidence about conditions that existed at the date of the Statements of Assets and Liabilities. For non-recognized subsequent events that must be disclosed to keep the financial statements from being misleading, the Funds are required to disclose the nature of the event as well as an estimate of its financial effect, or a statement that such an estimate cannot be made. Management has evaluated the impact of all subsequent events on the Funds through the issuance date of these financial statements and has noted no such events requiring disclosure.
INTEGRITY DIVIDEND HARVEST FUND CLASS A
FINANCIAL HIGHLIGHTS
Selected per share data and ratios for the periods indicated
|
Seven |
|||||||||||||||||
|
Year |
Year |
Year |
Year |
Months |
Year |
||||||||||||
|
Ended |
Ended |
Ended |
Ended |
Ended |
Ended |
||||||||||||
|
7/31/22 |
7/31/21 |
7/31/20 |
7/31/19 |
7/31/18 |
12/31/17 |
||||||||||||
|
NET ASSET VALUE, BEGINNING OF PERIOD |
$ |
15.12 |
|
$ |
12.71 |
$ |
14.06 |
$ |
14.24 |
$ |
14.68 |
$ |
14.33 |
||||
|
|
|
||||||||||||||||
|
Income (loss) from investment operations: |
|||||||||||||||||
|
Net investment income (loss) (1)) |
$ |
0.50 |
$ |
0.47 |
$ |
0.48 |
$ |
0.44 |
$ |
0.24 |
$ |
0.41 |
|||||
|
Net realized and unrealized gain (loss) on investments (2) |
1.21 |
2.41 |
(0.74) |
0.66 |
(0.45) |
1.16 |
|||||||||||
|
Total from investment operations |
$ |
1.71 |
$ |
2.88 |
$ |
(0.26) |
$ |
1.10 |
$ |
(0.21) |
$ |
1.57 |
|||||
|
|
|||||||||||||||||
|
Less Distributions: |
|||||||||||||||||
|
Dividends from net investment income |
$ |
(0.50) |
$ |
(0.47) |
$ |
(0.49) |
$ |
(0.43) |
$ |
(0.23) |
$ |
(0.41) |
|||||
|
Distributions from return of capital |
0.00 |
0.00 |
(0.01) |
0.00 |
0.00 |
0.00 |
|||||||||||
|
Distributions from net realized gains |
0.00 |
0.00 |
(0.59) |
(0.85) |
0.00 |
(0.81) |
|||||||||||
|
Total distributions |
$ |
(0.50) |
$ |
(0.47) |
$ |
(1.09) |
$ |
(1.28) |
$ |
(0.23) |
$ |
(1.22) |
|||||
|
|
|||||||||||||||||
|
NET ASSET VALUE, END OF PERIOD |
$ |
16.33 |
$ |
15.12 |
$ |
12.71 |
$ |
14.06 |
$ |
14.24 |
$ |
14.68 |
|||||
|
|
|
||||||||||||||||
|
Total Return (excludes any applicable sales charge) # |
11.41% |
23.09% |
(2.39%) |
8.75% |
(1.39%) |
11.10% |
|||||||||||
|
|
|||||||||||||||||
|
RATIOS/SUPPLEMENTAL DATA |
|||||||||||||||||
|
Net assets, end of period (in thousands) |
$105,799 |
$88,405 |
$80,762 |
$91,602 |
$95,340 |
$111,696 |
|||||||||||
|
Ratio of expenses to average net assets after waivers ^ (3) |
0.95% |
0.95% |
0.95% |
0.95% |
0.95% |
0.95% |
|||||||||||
|
Ratio of expenses to average net assets before waivers ^ |
1.44% |
1.48% |
1.50% |
1.51% |
1.53% |
1.49% |
|||||||||||
|
Ratio of net investment income to average net assets ^ (3) |
3.13% |
3.39% |
3.58% |
3.17% |
2.92% |
2.88% |
|||||||||||
|
Portfolio turnover rate # |
14.84% |
42.14% |
51.62% |
47.71% |
23.05% |
44.89% |
|||||||||||
|
Per share net investment income (loss) has been calculated using the average daily shares method. |
|||||||||||||||||
|
(1) |
Per share net investment income (loss) has been calculated using the average daily shares method. |
|
(2) |
Net realized and unrealized gain/(loss) per share are balancing amounts necessary to reconcile the change in net asset value per share for the period, and may not reconcile with the aggregate gains and losses in the statement of operations due to share transactions for the period. |
|
(3) |
This row reflects the impact, if any, of fee waivers or reimbursements by the Adviser and/or affiliated service providers. |
|
# |
Not annualized for periods less than one year. |
|
^ |
Annualized for periods less than one year. |
|
|
|
|
Total return represents the rate that an investor would have earned or lost on an investment in the Fund assuming reinvestment of all dividends and distributions. |
|
|
|
|
|
The accompanying notes are an integral part of these financial statements. |
|
INTEGRITY DIVIDEND HARVEST FUND CLASS C
FINANCIAL HIGHLIGHTS
Selected per share data and ratios for the periods indicated
|
Seven |
|||||||||||||||||
|
Year |
Year |
Year |
Year |
Months |
Year |
||||||||||||
|
Ended |
Ended |
Ended |
Ended |
Ended |
Ended |
||||||||||||
|
7/31/22 |
7/31/21 |
7/31/20 |
7/31/19 |
7/31/18 |
12/31/17 |
||||||||||||
|
NET ASSET VALUE, BEGINNING OF PERIOD |
$ |
15.00 |
$ |
12.61 |
$ |
13.96 |
$ |
14.15 |
$ |
14.59 |
$ |
14.26 |
|||||
|
|
|||||||||||||||||
|
Income (loss) from investment operations: |
|||||||||||||||||
|
Net investment income (loss) (1) |
$ |
0.38 |
$ |
0.37 |
$ |
0.38 |
$ |
0.34 |
$ |
0.17 |
$ |
0.31 |
|||||
|
Net realized and unrealized gain (loss) on investments (2) |
1.19 |
2.39 |
(0.74) |
0.65 |
(0.44) |
1.14 |
|||||||||||
|
Total from investment operations |
$ |
1.57 |
$ |
2.76 |
$ |
(0.36) |
$ |
0.99 |
$ |
(0.27) |
$ |
1.45 |
|||||
|
|
|
||||||||||||||||
|
Less Distributions: |
|||||||||||||||||
|
Dividends from net investment income |
$ |
(0.38) |
$ |
(0.37) |
$ |
(0.39) |
$ |
(0.33) |
$ |
(0.17) |
$ |
(0.31) |
|||||
|
Distributions from return of capital |
0.00 |
0.00 |
(0.01) |
0.00 |
0.00 |
0.00 |
|||||||||||
|
Distributions from net realized gains |
0.00 |
0.00 |
(0.59) |
(0.85) |
0.00 |
(0.81) |
|||||||||||
|
Total distributions |
$ |
(0.38) |
$ |
(0.37) |
$ |
(0.99) |
$ |
(1.18) |
$ |
(0.17) |
$ |
(1.12) |
|||||
|
|
|||||||||||||||||
|
NET ASSET VALUE, END OF PERIOD |
$ |
16.19 |
$ |
15.00 |
$ |
12.61 |
$ |
13.96 |
$ |
14.15 |
$ |
14.59 |
|||||
|
|
|
||||||||||||||||
|
Total Return (excludes any applicable sales charge) # |
10.54% |
22.19% |
(3.13%) |
7.92% |
(1.78%) |
10.26% |
|||||||||||
|
|
|||||||||||||||||
|
RATIOS/SUPPLEMENTAL DATA |
|||||||||||||||||
|
Net assets, end of period (in thousands) |
$22,463 |
$15,762 |
$14,194 |
$13,637 |
$14,014 |
$17,126 |
|||||||||||
|
Ratio of expenses to average net assets after waivers ^ (3) |
1.70% |
1.70% |
1.70% |
1.70% |
1.70% |
1.70% |
|||||||||||
|
Ratio of expenses to average net assets before waivers ^ |
2.19% |
2.23% |
2.25% |
2.26% |
2.28% |
2.24% |
|||||||||||
|
Ratio of net investment income to average net assets ^ (3) |
2.38% |
2.64% |
2.83% |
2.42% |
2.17% |
2.14% |
|||||||||||
|
Portfolio turnover rate # |
14.84% |
42.14% |
51.62% |
47.71% |
23.05% |
44.89% |
|||||||||||
|
(1) |
Per share net investment income (loss) has been calculated using the average daily shares method. |
|
(2) |
Net realized and unrealized gain/(loss) per share are balancing amounts necessary to reconcile the change in net asset value per share for the period, and may not reconcile with the aggregate gains and losses in the statement of operations due to share transactions for the period. |
|
(3) |
This row reflects the impact, if any, of fee waivers or reimbursements by the Adviser and/or affiliated service providers. |
|
# |
Not annualized for periods less than one year. |
|
^ |
Annualized for periods less than one year. |
|
|
|
|
Total return represents the rate that an investor would have earned or lost on an investment in the Fund assuming reinvestment of all dividends and distributions. |
|
|
|
|
|
The accompanying notes are an integral part of these financial statements. |
|
INTEGRITY DIVIDEND HARVEST FUND CLASS I
FINANCIAL HIGHLIGHTS
Selected per share data and ratios for the periods indicated
|
Seven |
|||||||||||||||||
|
Year |
Year |
Year |
Year |
Months |
Year |
||||||||||||
|
Ended |
Ended |
Ended |
Ended |
Ended |
Ended |
||||||||||||
|
7/31/22 |
7/31/21 |
7/31/20 |
7/31/19 |
7/31/18 |
12/31/17 |
||||||||||||
|
NET ASSET VALUE, BEGINNING OF PERIOD |
$ |
15.13 |
$ |
12.72 |
$ |
14.07 |
$ |
14.25 |
$ |
14.69 |
$ |
14.34 |
|||||
|
|
|||||||||||||||||
|
Income (loss) from investment operations: |
|||||||||||||||||
|
Net investment income (loss) (1) |
$ |
0.55 |
$ |
0.51 |
$ |
0.51 |
$ |
0.48 |
$ |
0.26 |
$ |
0.45 |
|||||
|
Net realized and unrealized gain (loss) on investments (2) |
1.20 |
2.41 |
(0.74) |
0.66 |
(0.46) |
1.16 |
|||||||||||
|
Total from investment operations |
$ |
1.75 |
$ |
2.92 |
$ |
(0.23) |
$ |
1.14 |
$ |
(0.20) |
$ |
1.61 |
|||||
|
|
|||||||||||||||||
|
Less Distributions: |
|||||||||||||||||
|
Dividends from net investment income |
$ |
(0.54) |
$ |
(0.51) |
$ |
(0.52) |
$ |
(0.47) |
$ |
(0.24) |
$ |
(0.45) |
|||||
|
Distributions from return of capital |
0.00 |
0.00 |
(0.01) |
0.00 |
0.00 |
0.00 |
|||||||||||
|
Distributions from net realized gains |
0.00 |
0.00 |
(0.59) |
(0.85) |
0.00 |
(0.81) |
|||||||||||
|
Total distributions |
$ |
(0.54) |
$ |
(0.51) |
$ |
(1.12) |
$ |
(1.32) |
$ |
(0.24) |
$ |
(1.26) |
|||||
|
|
|||||||||||||||||
|
NET ASSET VALUE, END OF PERIOD |
$ |
16.34 |
$ |
15.13 |
$ |
12.72 |
$ |
14.07 |
$ |
14.25 |
$ |
14.69 |
|||||
|
|
|||||||||||||||||
|
Total Return (excludes any applicable sales charge) # |
11.68% |
23.38% |
(2.14%) |
9.01% |
(1.26%) |
11.37% |
|||||||||||
|
|
|||||||||||||||||
|
RATIOS/SUPPLEMENTAL DATA |
|||||||||||||||||
|
Net assets, end of period (in thousands) |
$123,271 |
$64,062 |
$52,298 |
$30,794 |
$21,565 |
$21,252 |
|||||||||||
|
Ratio of expenses to average net assets after waivers ^ (3) |
0.70% |
0.70% |
0.70% |
0.70% |
0.70% |
0.70% |
|||||||||||
|
Ratio of expenses to average net assets before waivers ^ |
1.19% |
1.23% |
1.25% |
1.26% |
1.28% |
1.24% |
|||||||||||
|
Ratio of net investment income to average net assets ^ (3) |
3.38% |
3.64% |
3.83% |
3.42% |
3.18% |
3.14% |
|||||||||||
|
Portfolio turnover rate # |
14.84% |
42.14% |
51.62% |
47.71% |
23.05% |
44.89% |
|||||||||||
|
(1) |
Per share net investment income (loss) has been calculated using the average daily shares method. |
|
(2) |
Net realized and unrealized gain/(loss) per share are balancing amounts necessary to reconcile the change in net asset value per share for the period, and may not reconcile with the aggregate gains and losses in the statement of operations due to share transactions for the period. |
|
(3) |
This row reflects the impact, if any, of fee waivers or reimbursements by the Adviser and/or affiliated service providers. |
|
# |
Not annualized for periods less than one year. |
|
^ |
Annualized for periods less than one year. |
|
|
|
|
Total return represents the rate that an investor would have earned or lost on an investment in the Fund assuming reinvestment of all dividends and distributions. |
|
|
|
|
|
The accompanying notes are an integral part of these financial statements. |
|
INTEGRITY ESG GROWTH & INCOME FUND CLASS A
FINANCIAL HIGHLIGHTS
Selected per share data and ratios for the periods indicated
|
Seven |
|||||||||||||||||
|
Year |
Year |
Year |
Year |
Months |
Year |
||||||||||||
|
Ended |
Ended |
Ended |
Ended |
Ended |
Ended |
||||||||||||
|
7/31/22 |
7/31/21 |
7/31/20 |
7/31/19 |
7/31/18 |
12/31/17 |
||||||||||||
|
NET ASSET VALUE, BEGINNING OF PERIOD |
$ |
80.95 |
$ |
60.74 |
$ |
59.55 |
$ |
56.62 |
$ |
53.51 |
$ |
48.38 |
|||||
|
|
|||||||||||||||||
|
Income (loss) from investment operations: |
|||||||||||||||||
|
Net investment income (loss) (1) |
0.16 |
0.29 |
$ |
0.57 |
$ |
0.62 |
$ |
0.27 |
$ |
0.58 |
|||||||
|
Net realized and unrealized gain (loss) on investments (2) |
(6.83) |
20.35 |
6.17 |
5.57 |
2.84 |
8.46 |
|||||||||||
|
Total from investment operations |
$ |
(6.67) |
$ |
20.64 |
$ |
6.74 |
$ |
6.19 |
$ |
3.11 |
$ |
9.04 |
|||||
|
|
|||||||||||||||||
|
Less Distributions: |
|||||||||||||||||
|
Dividends from net investment income |
$ |
(0.08) |
$ |
(0.41) |
$ |
(0.83) |
$ |
(0.32) |
$ |
0.00 |
$ |
(0.58) |
|||||
|
Distributions from net realized gains |
(0.48) |
(0.02) |
(4.72) |
(2.94) |
0.00 |
(3.33) |
|||||||||||
|
Total distributions |
$ |
(0.56) |
$ |
(0.43) |
$ |
(5.55) |
$ |
(3.26) |
$ |
0.00 |
$ |
(3.91) |
|||||
|
|
|||||||||||||||||
|
NET ASSET VALUE, END OF PERIOD |
$ |
73.72 |
$ |
80.95 |
$ |
60.74 |
$ |
59.55 |
$ |
56.62 |
$ |
53.51 |
|||||
|
|
|||||||||||||||||
|
Total Return (excludes any applicable sales charge) # |
(8.37% ) |
34.11% |
11.42% |
12.21% |
5.81% |
18.68% |
|||||||||||
|
|
|||||||||||||||||
|
RATIOS/SUPPLEMENTAL DATA |
|||||||||||||||||
|
Net assets, end of period (in thousands) |
$49,909 |
$52,676 |
$39,422 |
$37,464 |
$34,948 |
$34,600 |
|||||||||||
|
Ratio of expenses to average net assets after waivers ^ (3) |
1.24% |
1.24% |
1.24% |
1.25% |
1.25% |
1.25% |
|||||||||||
|
Ratio of expenses to average net assets before waivers ^ |
1.80% |
1.80% |
1.87% |
1.93% |
1.93% |
1.95% |
|||||||||||
|
Ratio of net investment income to average net assets ^ (3) |
0.20% |
0.41% |
0.98% |
1.11% |
0.85% |
1.07% |
|||||||||||
|
Portfolio turnover rate # |
3.78% |
11.22% |
11.44% |
14.11% |
5.99% |
32.42% |
|||||||||||
|
(1) |
Per share net investment income (loss) has been calculated using the average daily shares method. |
|
(2) |
Net realized and unrealized gain/(loss) per share are balancing amounts necessary to reconcile the change in net asset value per share for the period, and may not reconcile with the aggregate gains and losses in the statement of operations due to share transactions for the period. |
|
(3) |
This row reflects the impact, if any, of fee waivers or reimbursements by the Adviser and/or affiliated service providers. |
|
# |
Not annualized for periods less than one year. |
|
^ |
Annualized for periods less than one year. |
|
|
|
|
Total return represents the rate that an investor would have earned or lost on an investment in the Fund assuming reinvestment of all dividends and distributions. |
|
|
|
|
|
The accompanying notes are an integral part of these financial statements. |
|
INTEGRITY ESG GROWTH & INCOME FUND CLASS C
FINANCIAL HIGHLIGHTS
Selected per share data and ratios for the periods indicated
|
Seven |
|||||||||||||||||
|
Year |
Year |
Year |
Year |
Months |
Year |
||||||||||||
|
Ended |
Ended |
Ended |
Ended |
Ended |
Ended |
||||||||||||
|
7/31/22 |
7/31/21 |
7/31/20 |
7/31/19 |
7/31/18 |
12/31/17 |
||||||||||||
|
NET ASSET VALUE, BEGINNING OF PERIOD |
$ |
78.94 |
$ |
59.67 |
$ |
58.95 |
$ |
56.45 |
$ |
53.49 |
$ |
48.38 |
|||||
|
|
|||||||||||||||||
|
Income (loss) from investment operations: |
|||||||||||||||||
|
Net investment income (loss) (1) |
$ |
(0.42) |
$ |
0.00 |
$ |
0.70 |
$ |
0.75 |
$ |
0.12 |
$ |
0.17 |
|||||
|
Net realized and unrealized gain (loss) on investments (2) |
(6.63) |
19.86 |
5.73 |
5.14 |
2.84 |
8.44 |
|||||||||||
|
Total from investment operations |
$ |
(7.05) |
$ |
19.86 |
$ |
6.43 |
$ |
5.89 |
$ |
2.96 |
$ |
8.61 |
|||||
|
|
|||||||||||||||||
|
Less Distributions: |
|||||||||||||||||
|
Dividends from net investment income |
$ |
0.00 |
$ |
(0.57) |
$ |
(0.99) |
$ |
(0.45) |
$ |
0.00 |
$ |
(0.17) |
|||||
|
Distributions from net realized gains |
(0.48) |
(0.02) |
(4.72) |
(2.94) |
0.00 |
(3.33) |
|||||||||||
|
Total distributions |
$ |
(0.48) |
$ |
(0.59) |
$ |
(5.71) |
$ |
(3.39) |
$ |
0.00 |
$ |
(3.50) |
|||||
|
|
|||||||||||||||||
|
NET ASSET VALUE, END OF PERIOD |
$ |
71.41 |
$ |
78.94 |
$ |
59.67 |
$ |
58.95 |
$ |
56.45 |
$ |
53.49 |
|||||
|
|
|||||||||||||||||
|
Total Return (excludes any applicable sales charge) # |
-9.05% |
33.44% |
10.97% |
11.74% |
5.53% |
17.79% |
|||||||||||
|
|
|||||||||||||||||
|
RATIOS/SUPPLEMENTAL DATA |
|||||||||||||||||
|
Net assets, end of period (in thousands) |
$5,655 |
$5,041 |
$1,092 |
$248 |
$195 |
$225 |
|||||||||||
|
Ratio of expenses to average net assets after waivers ^ (3) |
1.99% |
1.85% |
1.62% |
1.68% |
1.70% |
2.00% |
|||||||||||
|
Ratio of expenses to average net assets before waivers ^ |
2.55% |
2.20% |
1.62% |
1.68% |
1.74% |
2.70% |
|||||||||||
|
Ratio of net investment income (loss) to average net assets ^ (3) |
(0.55%) |
0.00% |
1.23% |
1.36% |
0.39% |
0.33% |
|||||||||||
|
Portfolio turnover rate # |
3.78% |
11.22% |
11.44% |
14.11% |
5.99% |
32.42% |
|||||||||||
|
(1) |
Per share net investment income (loss) has been calculated using the average daily shares method. |
|
(2) |
Net realized and unrealized gain/(loss) per share are balancing amounts necessary to reconcile the change in net asset value per share for the period, and may not reconcile with the aggregate gains and losses in the statement of operations due to share transactions for the period. |
|
(3) |
This row reflects the impact, if any, of fee waivers or reimbursements by the Adviser and/or affiliated service providers. |
|
# |
Not annualized for periods less than one year. |
|
^ |
Annualized for periods less than one year. |
|
|
|
|
Total return represents the rate that an investor would have earned or lost on an investment in the Fund assuming reinvestment of all dividends and distributions. |
|
|
|
|
|
The accompanying notes are an integral part of these financial statements. |
|
INTEGRITY ESG GROWTH & INCOME FUND CLASS I
FINANCIAL HIGHLIGHTS
Selected per share data and ratios for the periods indicated
|
Seven |
|||||||||||||||||
|
Year |
Year |
Year |
Year |
Months |
Year |
||||||||||||
|
Ended |
Ended |
Ended |
Ended |
Ended |
Ended |
||||||||||||
|
7/31/22 |
7/31/21 |
7/31/20 |
7/31/19 |
7/31/18 |
12/31/17 |
||||||||||||
|
NET ASSET VALUE, BEGINNING OF PERIOD |
$ |
81.06 |
$ |
60.80 |
$ |
59.61 |
$ |
56.68 |
$ |
53.49 |
$ |
48.36 |
|||||
|
|
|||||||||||||||||
|
Income (loss) from investment operations: |
|||||||||||||||||
|
Net investment income (loss) (1) |
$ |
0.35 |
$ |
0.48 |
$ |
0.71 |
$ |
0.76 |
$ |
0.34 |
$ |
0.72 |
|||||
|
Net realized and unrealized gain (loss) on investments (2) |
(6.81) |
20.37 |
6.19 |
5.58 |
2.85 |
8.46 |
|||||||||||
|
Total from investment operations |
$ |
(6.46) |
$ |
20.85 |
$ |
6.90 |
$ |
6.34 |
$ |
3.19 |
$ |
9.18 |
|||||
|
|
|||||||||||||||||
|
Less Distributions: |
|||||||||||||||||
|
Dividends from net investment income |
$ |
(0.27) |
$ |
(0.57) |
$ |
(0.99) |
$ |
(0.47) |
$ |
0.00 |
$ |
(0.72) |
|||||
|
Distributions from net realized gains |
(0.48) |
(0.02) |
(4.72) |
(2.94) |
0.00 |
(3.33) |
|||||||||||
|
Total distributions |
$ |
(0.75) |
$ |
(0.59) |
$ |
(5.71) |
$ |
(3.41) |
$ |
0.00 |
$ |
(4.05) |
|||||
|
|
|||||||||||||||||
|
NET ASSET VALUE, END OF PERIOD |
$ |
73.85 |
$ |
81.06 |
$ |
60.80 |
$ |
59.61 |
$ |
56.68 |
$ |
53.49 |
|||||
|
|
|||||||||||||||||
|
Total Return (excludes any applicable sales charge) # |
(8.12%) |
34.45% |
11.68% |
12.51% |
5.96% |
18.96% |
|||||||||||
|
|
|||||||||||||||||
|
RATIOS/SUPPLEMENTAL DATA |
|||||||||||||||||
|
Net assets, end of period (in thousands) |
$22,735 |
$24,784 |
$9,367 |
$1,544 |
$741 |
$690 |
|||||||||||
|
Ratio of expenses to average net assets after waivers ^ (3) |
0.99% |
0.99% |
0.99% |
1.00% |
1.00% |
1.00% |
|||||||||||
|
Ratio of expenses to average net assets before waivers ^ |
1.54% |
1.55% |
1.62% |
1.68% |
1.68% |
1.69% |
|||||||||||
|
Ratio of net investment income to average net assets ^ (3) |
0.45% |
0.66% |
1.23% |
1.36% |
1.08% |
1.30% |
|||||||||||
|
Portfolio turnover rate # |
3.78% |
11.22% |
11.44% |
14.11% |
5.99% |
32.42% |
|||||||||||
|
(1) |
Per share net investment income (loss) has been calculated using the average daily shares method. |
|
(2) |
Net realized and unrealized gain/(loss) per share are balancing amounts necessary to reconcile the change in net asset value per share for the period, and may not reconcile with the aggregate gains and losses in the statement of operations due to share transactions for the period. |
|
(3) |
This row reflects the impact, if any, of fee waivers or reimbursements by the Adviser and/or affiliated service providers. |
|
# |
Not annualized for periods less than one year. |
|
^ |
Annualized for periods less than one year. |
|
|
|
|
Total return represents the rate that an investor would have earned or lost on an investment in the Fund assuming reinvestment of all dividends and distributions. |
|
|
|
|
|
The accompanying notes are an integral part of these financial statements. |
|
INTEGRITY HIGH INCOME FUND CLASS A
FINANCIAL HIGHLIGHTS
Selected per share data and ratios for the periods indicated
|
Seven |
|||||||||||||||||
|
Year |
Year |
Year |
Year |
Months |
Year |
||||||||||||
|
Ended |
Ended |
Ended |
Ended |
Ended |
Ended |
||||||||||||
|
7/31/22 |
7/31/21 |
7/31/20 |
7/31/19 |
7/31/18 |
12/31/17 |
||||||||||||
|
NET ASSET VALUE, BEGINNING OF PERIOD |
$ |
8.13 |
$ |
7.65 |
$ |
7.77 |
$ |
7.66 |
$ |
7.80 |
$ |
7.66 |
|||||
|
|
|||||||||||||||||
|
Income (loss) from investment operations: |
|||||||||||||||||
|
Net investment income (loss) (1) |
$ |
0.31 |
$ |
0.32 |
$ |
0.37 |
$ |
0.39 |
$ |
0.23 |
$ |
0.37 |
|||||
|
Net realized and unrealized gain (loss) on investments (2) |
(0.80) |
0.48 |
(0.12) |
0.11 |
(0.14) |
0.14 |
|||||||||||
|
Total from investment operations |
$ |
(0.49) |
$ |
0.80 |
$ |
0.25 |
$ |
0.50 |
$ |
0.09 |
$ |
0.51 |
|||||
|
|
|||||||||||||||||
|
Less Distributions: |
|||||||||||||||||
|
Dividends from net investment income |
$ |
(0.31) |
$ |
(0.32) |
$ |
(0.37) |
$ |
(0.39) |
$ |
(0.23) |
$ |
(0.37) |
|||||
|
Total distributions |
$ |
(0.31) |
$ |
(0.32) |
$ |
(0.37) |
$ |
(0.39) |
$ |
(0.23) |
$ |
(0.37) |
|||||
|
|
|||||||||||||||||
|
NET ASSET VALUE, END OF PERIOD |
$ |
7.33 |
$ |
8.13 |
$ |
7.65 |
$ |
7.77 |
$ |
7.66 |
$ |
7.80 |
|||||
|
|
|||||||||||||||||
|
Total Return (excludes any applicable sales charge) # |
(6.14%) |
10.62% |
3.37% |
6.74% |
1.21% |
6.78% |
|||||||||||
|
|
|||||||||||||||||
|
RATIOS/SUPPLEMENTAL DATA |
|||||||||||||||||
|
Net assets, end of period (in thousands) |
$25,736 |
$26,725 |
$25,309 |
$24,704 |
$24,099 |
$24,628 |
|||||||||||
|
Ratio of expenses to average net assets after waivers ^ (3) |
0.99% |
0.99% |
0.95% |
0.89% |
0.89% |
1.13% |
|||||||||||
|
Ratio of expenses to average net assets before waivers ^ |
1.63% |
1.63% |
1.69% |
1.74% |
1.73% |
1.71% |
|||||||||||
|
Ratio of net investment income to average net assets ^ (3) |
3.99% |
3.99% |
4.86% |
5.10% |
5.18% |
4.80% |
|||||||||||
|
Portfolio turnover rate # |
21.04% |
35.74% |
35.02% |
28.24% |
16.50% |
29.22% |
|||||||||||
|
(1) |
Per share net investment income (loss) has been calculated using the average daily shares method. |
|
(2) |
Net realized and unrealized gain/(loss) per share are balancing amounts necessary to reconcile the change in net asset value per share for the period, and may not reconcile with the aggregate gains and losses in the statement of operations due to share transactions for the period. |
|
(3) |
This row reflects the impact, if any, of fee waivers or reimbursements by the Adviser and/or affiliated service providers. |
|
# |
Not annualized for periods less than one year. |
|
^ |
Annualized for periods less than one year. |
|
|
|
|
Total return represents the rate that an investor would have earned or lost on an investment in the Fund assuming reinvestment of all dividends and distributions. |
|
|
|
|
|
The accompanying notes are an integral part of these financial statements. |
|
INTEGRITY HIGH INCOME FUND CLASS C
FINANCIAL HIGHLIGHTS
Selected per share data and ratios for the periods indicated
|
Seven |
|||||||||||||||||
|
Year |
Year |
Year |
Year |
Months |
Year |
||||||||||||
|
Ended |
Ended |
Ended |
Ended |
Ended |
Ended |
||||||||||||
|
7/31/22 |
7/31/21 |
7/31/20 |
7/31/19 |
7/31/18 |
12/31/17 |
||||||||||||
|
NET ASSET VALUE, BEGINNING OF PERIOD |
$ |
8.15 |
$ |
7.67 |
$ |
7.78 |
$ |
7.68 |
$ |
7.82 |
$ |
7.68 |
|||||
|
|
|||||||||||||||||
|
Income (loss) from investment operations: |
|||||||||||||||||
|
Net investment income (loss) (1) |
$ |
0.25 |
$ |
0.26 |
$ |
0.31 |
$ |
0.33 |
$ |
0.20 |
$ |
0.31 |
|||||
|
Net realized and unrealized gain (loss) on investments (2) |
(0.80) |
0.48 |
(0.11) |
0.10 |
(0.14) |
0.14 |
|||||||||||
|
Total from investment operations |
$ |
(0.55) |
$ |
0.74 |
$ |
0.20 |
$ |
0.43 |
$ |
0.06 |
$ |
0.45 |
|||||
|
|
|||||||||||||||||
|
Less Distributions: |
|||||||||||||||||
|
Dividends from net investment income |
$ |
(0.25) |
$ |
(0.26) |
$ |
(0.31) |
$ |
(0.33) |
$ |
(0.20) |
$ |
(0.31) |
|||||
|
Total distributions |
$ |
(0.25) |
$ |
(0.26) |
$ |
(0.31) |
$ |
(0.33) |
$ |
(0.20) |
$ |
(0.31) |
|||||
|
|
|||||||||||||||||
|
NET ASSET VALUE, END OF PERIOD |
$ |
7.35 |
$ |
8.15 |
$ |
7.67 |
$ |
7.78 |
$ |
7.68 |
$ |
7.82 |
|||||
|
|
|||||||||||||||||
|
Total Return (excludes any applicable sales charge) # |
(6.82%) |
9.78% |
2.74% |
5.81% |
0.78% |
5.98% |
|||||||||||
|
|
|||||||||||||||||
|
RATIOS/SUPPLEMENTAL DATA |
|||||||||||||||||
|
Net assets, end of period (in thousands) |
$3,634 |
$3,776 |
$2,753 |
$4,329 |
$4,813 |
$5,397 |
|||||||||||
|
Ratio of expenses to average net assets after waivers ^ (3) |
1.74% |
1.74% |
1.70% |
1.64% |
1.64% |
1.88% |
|||||||||||
|
Ratio of expenses to average net assets before waivers ^ |
2.38% |
2.38% |
2.44% |
2.49% |
2.48% |
2.46% |
|||||||||||
|
Ratio of net investment income to average net assets ^ (3) |
3.24% |
3.24% |
4.11% |
4.35% |
4.43% |
4.03% |
|||||||||||
|
Portfolio turnover rate # |
21.04% |
35.74% |
35.02% |
28.24% |
16.50% |
29.22% |
|||||||||||
|
(1) |
Per share net investment income (loss) has been calculated using the average daily shares method. |
|
(2) |
Net realized and unrealized gain/(loss) per share are balancing amounts necessary to reconcile the change in net asset value per share for the period, and may not reconcile with the aggregate gains and losses in the statement of operations due to share transactions for the period. |
|
(3) |
This row reflects the impact, if any, of fee waivers or reimbursements by the Adviser and/or affiliated service providers. |
|
# |
Not annualized for periods less than one year. |
|
^ |
Annualized for periods less than one year. |
|
|
|
|
Total return represents the rate that an investor would have earned or lost on an investment in the Fund assuming reinvestment of all dividends and distributions. |
|
|
|
|
|
The accompanying notes are an integral part of these financial statements. |
|
INTEGRITY HIGH INCOME FUND CLASS I
FINANCIAL HIGHLIGHTS
Selected per share data and ratios for the periods indicated
|
Seven |
|||||||||||||||||
|
Year |
Year |
Year |
Year |
Months |
Year |
||||||||||||
|
Ended |
Ended |
Ended |
Ended |
Ended |
Ended |
||||||||||||
|
7/31/22 |
7/31/21 |
7/31/20 |
7/31/19 |
7/31/18 |
12/31/17 |
||||||||||||
|
NET ASSET VALUE, BEGINNING OF PERIOD |
$ |
8.13 |
$ |
7.64 |
$ |
7.76 |
$ |
7.66 |
$ |
7.80 |
$ |
7.65 |
|||||
|
|
|||||||||||||||||
|
Income (loss) from investment operations: |
|||||||||||||||||
|
Net investment income (loss) (1) |
$ |
0.33 |
$ |
0.34 |
$ |
0.39 |
$ |
0.41 |
$ |
0.24 |
$ |
0.39 |
|||||
|
Net realized and unrealized gain (loss) on investments (2) |
(0.81) |
0.49 |
(0.12) |
0.10 |
(0.14) |
0.15 |
|||||||||||
|
Total from investment operations |
$ |
(0.48) |
$ |
0.83 |
$ |
0.27 |
$ |
0.51 |
$ |
0.10 |
$ |
0.54 |
|||||
|
|
|||||||||||||||||
|
Less Distributions: |
|||||||||||||||||
|
Dividends from net investment income |
$ |
(0.33) |
$ |
(0.34) |
$ |
(0.39) |
$ |
(0.41) |
$ |
(0.24) |
$ |
(0.39) |
|||||
|
Total distributions |
$ |
(0.33) |
$ |
(0.34) |
$ |
(0.39) |
$ |
(0.41) |
$ |
(0.24) |
$ |
(0.39) |
|||||
|
|
|||||||||||||||||
|
NET ASSET VALUE, END OF PERIOD |
$ |
7.32 |
$ |
8.13 |
$ |
7.64 |
$ |
7.76 |
$ |
7.66 |
$ |
7.80 |
|||||
|
|
|||||||||||||||||
|
Total Return (excludes any applicable sales charge) # |
(6.04%) |
11.04% |
3.63% |
6.87% |
1.36% |
7.19% |
|||||||||||
|
|
|||||||||||||||||
|
RATIOS/SUPPLEMENTAL DATA |
|||||||||||||||||
|
Net assets, end of period (in thousands) |
$24,286 |
$26,652 |
$9,163 |
$9,023 |
$2,709 |
$2,598 |
|||||||||||
|
Ratio of expenses to average net assets after waivers ^ (3) |
0.74% |
0.74% |
0.70% |
0.64% |
0.64% |
0.87% |
|||||||||||
|
Ratio of expenses to average net assets before waivers ^ |
1.38% |
1.37% |
1.44% |
1.49% |
1.48% |
1.46% |
|||||||||||
|
Ratio of net investment income to average net assets ^ (3) |
4.24% |
4.24% |
5.11% |
5.35% |
5.43% |
5.04% |
|||||||||||
|
Portfolio turnover rate # |
21.04% |
35.74% |
35.02% |
28.24% |
16.50% |
29.22% |
|||||||||||
|
(1) |
Per share net investment income (loss) has been calculated using the average daily shares method. |
|
(2) |
Net realized and unrealized gain/(loss) per share are balancing amounts necessary to reconcile the change in net asset value per share for the period, and may not reconcile with the aggregate gains and losses in the statement of operations due to share transactions for the period. |
|
(3) |
This row reflects the impact, if any, of fee waivers or reimbursements by the Adviser and/or affiliated service providers. |
|
# |
Not annualized for periods less than one year. |
|
^ |
Annualized for periods less than one year. |
|
|
|
|
Total return represents the rate that an investor would have earned or lost on an investment in the Fund assuming reinvestment of all dividends and distributions. |
|
|
|
|
|
The accompanying notes are an integral part of these financial statements. |
|
INTEGRITY MID-NORTH AMERICAN RESOURCES FUND CLASS A
FINANCIAL HIGHLIGHTS
Selected per share data and ratios for the periods indicated
|
Seven |
|||||||||||||||||
|
Year |
Year |
Year |
Year |
Months |
Year |
||||||||||||
|
Ended |
Ended |
Ended |
Ended |
Ended |
Ended |
||||||||||||
|
7/31/22 |
7/31/21 |
7/31/20 |
7/31/19 |
7/31/18 |
12/31/17 |
||||||||||||
|
NET ASSET VALUE, BEGINNING OF PERIOD |
$ |
3.74 |
$ |
2.59 |
$ |
4.28 |
$ |
5.60 |
$ |
5.48 |
$ |
5.93 |
|||||
|
|
|||||||||||||||||
|
Income (loss) from investment operations: |
|||||||||||||||||
|
Net investment income (loss) (1) |
$ |
0.06 |
$ |
0.04 |
$ |
0.07 |
$ |
0.04 |
$ |
0.01 |
$ |
0.01 |
|||||
|
Net realized and unrealized gain (loss) on investments (2) |
1.33 |
1.15 |
(1.66) |
(1.34) |
0.11 |
(0.45) |
|||||||||||
|
Total from investment operations |
$ |
1.39 |
$ |
1.19 |
$ |
(1.59) |
$ |
(1.30) |
$ |
0.12 |
$ |
(0.44) |
|||||
|
|
|||||||||||||||||
|
Less Distributions: |
|||||||||||||||||
|
Dividends from net investment income |
$ |
(0.06) |
$ |
(0.04) |
$ |
(0.10) |
$ |
(0.02) |
$ |
0.00 |
$ |
(0.01) |
|||||
|
Distributions from return of capital |
0.00 |
0.00 |
** |
0.00 |
0.00 |
0.00 |
0.00 |
||||||||||
|
Total distributions |
$ |
(0.06) |
$ |
(0.04) |
$ |
(0.10) |
$ |
(0.02) |
$ |
0.00 |
$ |
(0.01) |
|||||
|
|
|||||||||||||||||
|
NET ASSET VALUE, END OF PERIOD |
$ |
5.07 |
$ |
3.74 |
$ |
2.59 |
$ |
4.28 |
$ |
5.60 |
$ |
5.48 |
|||||
|
|
|
|
|||||||||||||||
|
Total Return (excludes any applicable sales charge) # |
37.38% |
46.40% |
(37.47%) |
(23.11%) |
2.19% |
(7.48%) |
|||||||||||
|
|
|||||||||||||||||
|
RATIOS/SUPPLEMENTAL DATA |
|||||||||||||||||
|
Net assets, end of period (in thousands) |
$95,211 |
$80,091 |
$69,684 |
$158,438 |
$282,793 |
$339,385 |
|||||||||||
|
Ratio of expenses to average net assets after waivers ^ (3) |
1.50% |
1.50% |
1.50% |
1.50% |
1.49% |
1.47% |
|||||||||||
|
Ratio of expenses to average net assets before waivers ^ |
1.50% |
1.60% |
1.59% |
1.53% |
1.49% |
1.47% |
|||||||||||
|
Ratio of net investment income (loss) to average net assets ^ (3) |
1.36% |
1.18% |
2.09% |
0.79% |
0.19% |
0.15% |
|||||||||||
|
Portfolio turnover rate # |
51.12% |
71.19% |
79.67% |
70.73% |
43.01% |
41.31% |
|||||||||||
|
(1) |
Per share net investment income (loss) has been calculated using the average daily shares method. |
|
(2) |
Net realized and unrealized gain/(loss) per share are balancing amounts necessary to reconcile the change in net asset value per share for the period, and may not reconcile with the aggregate gains and losses in the statement of operations due to share transactions for the period. |
|
(3) |
This row reflects the impact, if any, of fee waivers or reimbursements by the Adviser and/or affiliated service providers. |
|
^ |
Annualized for periods less than one year. |
|
# |
Not annualized for periods less than one year. |
|
** |
Amount is less than $0.005. |
|
|
|
|
Total return represents the rate that an investor would have earned or lost on an investment in the Fund assuming reinvestment of all dividends and distributions. |
|
|
|
|
|
The accompanying notes are an integral part of these financial statements. |
|
INTEGRITY MID-NORTH AMERICAN RESOURCES FUND CLASS C
FINANCIAL HIGHLIGHTS
Selected per share data and ratios for the periods indicated
|
Seven |
|||||||||||||||||
|
Year |
Year |
Year |
Year |
Months |
Year |
||||||||||||
|
Ended |
Ended |
Ended |
Ended |
Ended |
Ended |
||||||||||||
|
7/31/22 |
7/31/21 |
7/31/20 |
7/31/19 |
7/31/18 |
12/31/17 |
||||||||||||
|
NET ASSET VALUE, BEGINNING OF PERIOD |
$ |
3.71 |
$ |
2.57 |
$ |
4.23 |
$ |
5.53 |
$ |
5.43 |
$ |
5.89 |
|||||
|
|
|||||||||||||||||
|
Income (loss) from investment operations: |
|||||||||||||||||
|
Net investment income (loss) (1) |
$ |
0.04 |
$ |
0.02 |
$ |
0.05 |
$ |
0.01 |
$ |
(0.01) |
$ |
(0.02) |
|||||
|
Net realized and unrealized gain (loss) on investments (2) |
1.32 |
1.14 |
(1.64) |
(1.31) |
0.11 |
(0.44) |
|||||||||||
|
Total from investment operations |
$ |
1.36 |
$ |
1.16 |
$ |
(1.59) |
$ |
(1.30) |
$ |
0.10 |
$ |
(0.46) |
|||||
|
|
|||||||||||||||||
|
Less Distributions: |
|||||||||||||||||
|
Dividends from net investment income |
$ |
(0.03) |
$ |
(0.02) |
$ |
(0.07) |
$ |
0.00 |
$ |
0.00 |
$ |
0.00 |
|||||
|
Distributions from return of capital |
0.00 |
0.00 |
** |
0.00 |
0.00 |
0.00 |
0.00 |
||||||||||
|
Total distributions |
$ |
(0.03) |
$ |
(0.02) |
$ |
(0.07) |
$ |
0.00 |
$ |
0.00 |
$ |
0.00 |
|||||
|
|
|||||||||||||||||
|
NET ASSET VALUE, END OF PERIOD |
$ |
5.04 |
$ |
3.71 |
$ |
2.57 |
$ |
4.23 |
$ |
5.53 |
$ |
5.43 |
|||||
|
|
|||||||||||||||||
|
Total Return (excludes any applicable sales charge) # |
36.90% |
45.65% |
(37.78%) |
(23.51%) |
1.84% |
(7.81%) |
|||||||||||
|
|
|||||||||||||||||
|
RATIOS/SUPPLEMENTAL DATA |
|||||||||||||||||
|
Net assets, end of period (in thousands) |
$8,893 |
$9,451 |
$9,730 |
$17,463 |
$31,899 |
$37,629 |
|||||||||||
|
Ratio of expenses to average net assets after waivers ^ (3) |
2.00% |
2.00% |
2.00% |
2.00% |
1.99% |
1.97% |
|||||||||||
|
Ratio of expenses to average net assets before waivers ^ |
2.00% |
2.10% |
2.09% |
2.03% |
1.99% |
1.97% |
|||||||||||
|
Ratio of net investment income (loss) to average net assets ^ (3) |
0.85% |
0.68% |
1.58% |
0.29% |
(0.32%) |
(0.34%) |
|||||||||||
|
Portfolio turnover rate # |
51.12% |
71.19% |
79.67% |
70.73% |
43.01% |
41.31% |
|||||||||||
|
(1) |
Per share net investment income (loss) has been calculated using the average daily shares method. |
|
(2) |
Net realized and unrealized gain/(loss) per share are balancing amounts necessary to reconcile the change in net asset value per share for the period, and may not reconcile with the aggregate gains and losses in the statement of operations due to share transactions for the period. |
|
(3) |
This row reflects the impact, if any, of fee waivers or reimbursements by the Adviser and/or affiliated service providers. |
|
^ |
Annualized for periods less than one year. |
|
# |
Not annualized for periods less than one year. |
|
** |
Amount is less than $0.005. |
|
|
|
|
Total return represents the rate that an investor would have earned or lost on an investment in the Fund assuming reinvestment of all dividends and distributions. |
|
|
|
|
|
The accompanying notes are an integral part of these financial statements. |
|
INTEGRITY MID-NORTH AMERICAN RESOURCES FUND CLASS I
FINANCIAL HIGHLIGHTS
Selected per share data and ratios for the periods indicated
|
Seven |
|||||||||||||||||
|
Year |
Year |
Year |
Year |
Months |
Year |
||||||||||||
|
Ended |
Ended |
Ended |
Ended |
Ended |
Ended |
||||||||||||
|
7/31/22 |
7/31/21 |
7/31/20 |
7/31/19 |
7/31/18 |
12/31/17 |
||||||||||||
|
NET ASSET VALUE, BEGINNING OF PERIOD |
$ |
3.71 |
$ |
2.57 |
$ |
4.26 |
$ |
5.60 |
$ |
5.47 |
$ |
5.92 |
|||||
|
|
|||||||||||||||||
|
Income (loss) from investment operations: |
|||||||||||||||||
|
Net investment income (loss) (1) |
$ |
0.08 |
$ |
0.06 |
$ |
0.09 |
$ |
0.06 |
$ |
0.02 |
$ |
0.04 |
|||||
|
Net realized and unrealized gain (loss) on investments (2) |
1.32 |
1.14 |
(1.64) |
(1.35) |
0.11 |
(0.45) |
|||||||||||
|
Total from investment operations |
$ |
1.40 |
$ |
1.20 |
$ |
(1.55) |
$ |
(1.29) |
$ |
0.13 |
$ |
(0.41) |
|||||
|
|
|||||||||||||||||
|
Less Distributions: |
|||||||||||||||||
|
Dividends from net investment income |
$ |
(0.08) |
$ |
(0.06) |
$ |
(0.14) |
$ |
(0.05) |
$ |
0.00 |
$ |
(0.04) |
|||||
|
|
|
|
|
|
|
|
|
|
|
|
|
|
|
|
|
|
|
|
Distributions from return of capital |
0.00 |
0.00 |
** |
0.00 |
0.00 |
0.00 |
0.00 |
||||||||||
|
Total distributions |
$ |
(0.08) |
$ |
(0.06) |
$ |
(0.14) |
$ |
(0.05) |
$ |
0.00 |
$ |
(0.04) |
|||||
|
|
|||||||||||||||||
|
NET ASSET VALUE, END OF PERIOD |
$ |
5.03 |
$ |
3.71 |
$ |
2.57 |
$ |
4.26 |
$ |
5.60 |
$ |
5.47 |
|||||
|
|
|||||||||||||||||
|
Total Return (excludes any applicable sales charge) # |
38.17% |
47.12% |
(37.04%) |
(22.84%) |
2.38% |
(6.92%) |
|||||||||||
|
|
|||||||||||||||||
|
RATIOS/SUPPLEMENTAL DATA |
|||||||||||||||||
|
Net assets, end of period (in thousands) |
$42,940 |
$19,839 |
$9,069 |
$20,898 |
$44,757 |
$60,562 |
|||||||||||
|
Ratio of expenses to average net assets after waivers ^ (3) |
1.00% |
1.00% |
1.00% |
1.00% |
0.99% |
0.97% |
|||||||||||
|
Ratio of expenses to average net assets before waivers ^ |
1.00% |
1.08% |
1.09% |
1.03% |
0.99% |
0.97% |
|||||||||||
|
Ratio of net investment income to average net assets ^ (3) |
1.86% |
1.68% |
2.59% |
1.29% |
0.69% |
0.71% |
|||||||||||
|
Portfolio turnover rate # |
51.12% |
71.19% |
79.67% |
70.73% |
43.01% |
41.31% |
|||||||||||
|
(1) |
Per share net investment income (loss) has been calculated using the average daily shares method. |
|
(2) |
Net realized and unrealized gain/(loss) per share are balancing amounts necessary to reconcile the change in net asset value per share for the period, and may not reconcile with the aggregate gains and losses in the statement of operations due to share transactions for the period. |
|
(3) |
This row reflects the impact, if any, of fee waivers or reimbursements by the Adviser and/or affiliated service providers. |
|
^ |
Annualized for periods less than one year. |
|
# |
Not annualized for periods less than one year. |
|
** |
Amount is less than $0.005. |
|
|
|
|
Total return represents the rate that an investor would have earned or lost on an investment in the Fund assuming reinvestment of all dividends and distributions. |
|
|
|
|
|
The accompanying notes are an integral part of these financial statements. |
|
INTEGRITY SHORT TERM GOVERNMENT FUND CLASS A
FINANCIAL HIGHLIGHTS
Selected per share data and ratios for the periods indicated
|
Two |
Period |
||||||||||
|
Year |
Year |
Months |
From |
||||||||
|
Ended |
Ended |
Ended |
1/21/20* to |
||||||||
|
7/31/22 |
7/31/21 |
7/31/20 |
5/31/20 |
||||||||
|
NET ASSET VALUE, BEGINNING OF PERIOD |
$ |
8.98 |
$ |
9.22 |
$ |
9.21 |
$ |
9.26 |
|||
|
|
|||||||||||
|
Income (loss) from investment operations: |
|||||||||||
|
Net investment income (loss) (1) |
$ |
0.07 |
$ |
0.19 |
$ |
0.02 |
$ |
0.09 |
|||
|
Net realized and unrealized gain (loss) on investments (2) |
(0.47) |
(0.14) |
0.02 |
0.02 |
|||||||
|
Total from investment operations |
$ |
(0.40) |
$ |
0.05 |
$ |
0.04 |
$ |
0.11 |
|||
|
|
|||||||||||
|
Less Distributions: |
|||||||||||
|
Dividends from net investment income |
$ |
(0.15) |
$ |
(0.29) |
$ |
(0.03) |
$ |
(0.16) |
|||
|
Total distributions |
$ |
(0.15) |
$ |
(0.29) |
$ |
(0.03) |
$ |
(0.16) |
|||
|
|
|||||||||||
|
NET ASSET VALUE, END OF PERIOD |
$ |
8.43 |
$ |
8.98 |
$ |
9.22 |
$ |
9.21 |
|||
|
|
|
|
|
|
|
|
|||||
|
Total Return (excludes any applicable sales charge) # |
(4.51%) |
0.50% |
0.41% |
1.22% |
|||||||
|
|
|||||||||||
|
RATIOS/SUPPLEMENTAL DATA |
|||||||||||
|
Net assets, end of period (in thousands) |
$703 |
$724 |
$15 |
$15 |
|||||||
|
Ratio of expenses to average net assets after waivers ^ (3) |
0.80% |
0.80% |
0.80% |
0.80% |
|||||||
|
Ratio of expenses to average net assets before waivers ^ |
1.18% |
1.17% |
1.33% |
1.28% |
|||||||
|
Ratio of net investment income (loss) to average net assets ^ (3) |
0.84% |
2.14% |
1.53% |
2.68% |
|||||||
|
Portfolio turnover rate # |
51.52% |
140.79% |
16.03% |
65.85% |
|||||||
|
(1) |
Per share net investment income (loss) has been calculated using the average daily shares method. |
|
(2) |
Net realized and unrealized gain/(loss) per share are balancing amounts necessary to reconcile the change in net asset value per share for the period, and may not reconcile with the aggregate gains and losses in the statement of operations due to share transactions for the period. |
|
(3) |
This row reflects the impact, if any, of fee waivers or reimbursements by the Adviser and/or affiliated service providers. |
|
^ |
Annualized for periods less than one year. |
|
# |
Not annualized for periods less than one year. |
|
* |
Commencement of operations. |
|
|
|
|
Total return represents the rate that an investor would have earned or lost on an investment in the Fund assuming reinvestment of all dividends and distributions. |
|
|
|
|
|
The accompanying notes are an integral part of these financial statements. |
|
INTEGRITY SHORT TERM GOVERNMENT FUND CLASS I
FINANCIAL HIGHLIGHTS
Selected per share data and ratios for the periods indicated
|
Two |
|||||||||||||||||
|
Year |
Year |
Months |
Year |
Year |
Year |
||||||||||||
|
Ended |
Ended |
Ended |
Ended |
Ended |
Ended |
||||||||||||
|
7/31/22 |
7/31/21 |
7/31/20 |
5/31/20 |
5/31/19 |
5/31/18 |
||||||||||||
|
NET ASSET VALUE, BEGINNING OF PERIOD |
$ |
8.98 |
$ |
9.22 |
$ |
9.21 |
$ |
9.30 |
$ |
9.36 |
$ |
9.51 |
|||||
|
|
|||||||||||||||||
|
Income (loss) from investment operations: |
|||||||||||||||||
|
Net investment income (loss) (1) |
$ |
0.09 |
$ |
0.22 |
$ |
0.03 |
$ |
0.36 |
$ |
0.29 |
$ |
0.26 |
|||||
|
Net realized and unrealized gain (loss) on investments (2) |
(0.46) |
(0.15) |
0.01 |
(0.05) |
(0.05) |
(0.11) |
|||||||||||
|
Total from investment operations |
$ |
(0.37) |
$ |
0.07 |
$ |
0.04 |
$ |
0.31 |
$ |
0.24 |
$ |
0.15 |
|||||
|
|
|||||||||||||||||
|
Less Distributions: |
|||||||||||||||||
|
Dividends from net investment income |
$ |
(0.17) |
$ |
(0.31) |
$ |
(0.03) |
$ |
(0.40) |
$ |
(0.30) |
$ |
(0.30) |
|||||
|
Total distributions |
$ |
(0.17) |
$ |
(0.31) |
$ |
(0.03) |
$ |
(0.40) |
$ |
(0.30) |
$ |
(0.30) |
|||||
|
|
|||||||||||||||||
|
NET ASSET VALUE, END OF PERIOD |
$ |
8.44 |
$ |
8.98 |
$ |
9.22 |
$ |
9.21 |
$ |
9.30 |
$ |
9.36 |
|||||
|
|
|
|
|||||||||||||||
|
Total Return (excludes any applicable sales charge) # |
(4.18%) |
0.75% |
0.46% |
3.25% |
2.66% |
1.60% |
|||||||||||
|
|
|||||||||||||||||
|
RATIOS/SUPPLEMENTAL DATA |
|||||||||||||||||
|
Net assets, end of period (in thousands) |
$19,609 |
$31,576 |
$34,741 |
$21,038 |
$17,418 |
$23,429 |
|||||||||||
|
Ratio of expenses to average net assets after waivers ^ (3) |
0.55% |
0.55% |
0.55% |
0.55% |
0.55% |
0.55% |
|||||||||||
|
Ratio of expenses to average net assets before waivers ^ |
0.93% |
0.93% |
1.08% |
1.21% |
1.24% |
0.90% |
|||||||||||
|
Ratio of net investment income (loss) to average net assets ^ (3) |
1.09% |
2.38% |
1.78% |
3.88% |
3.11% |
2.71% |
|||||||||||
|
Portfolio turnover rate # |
51.52% |
140.79% |
16.03% |
65.85% |
15.24% |
98.95% |
|||||||||||
|
(1) |
Per share net investment income (loss) has been calculated using the average daily shares method. |
|
(2) |
Net realized and unrealized gain/(loss) per share are balancing amounts necessary to reconcile the change in net asset value per share for the period, and may not reconcile with the aggregate gains and losses in the statement of operations due to share transactions for the period. |
|
(3) |
This row reflects the impact, if any, of fee waivers or reimbursements by the Adviser and/or affiliated service providers. |
|
^ |
Annualized for periods less than one year. |
|
# |
Not annualized for periods less than one year. |
|
|
|
|
Total return represents the rate that an investor would have earned or lost on an investment in the Fund assuming reinvestment of all dividends and distributions. |
|
|
|
|
|
The accompanying notes are an integral part of these financial statements. |
|
REPORT OF INDEPENDENT REGISTERED PUBLIC ACCOUNTING FIRM
To the Shareholders and Board of Trustees
The Integrity Funds
Opinion on the Financial Statements
We have audited the accompanying statements of assets and liabilities, including the schedules of investments, of The Integrity Funds comprising the funds listed below (the “Funds”) as of July 31, 2022, the related statements of operations and changes in net assets, the related notes, and the financial highlights for each of the periods indicated below, (collectively referred to as the “financial statements”). In our opinion, the financial statements present fairly, in all material respects, the financial position of each of the Funds as of July 31, 2022, the results of their operations, the changes in their net assets, and the financial highlights for each of the periods indicated below in conformity with accounting principles generally accepted in the United States of America.
|
Fund Name |
Statements of Operations |
Statements of Changes in Net Assets |
Financial Highlights |
|
Integrity Dividend Harvest Fund, Integrity ESG Growth & Income Fund, Integrity High Income Fund, and Integrity Mid-North American Resources Fund |
For the year ended July 31, 2022 |
For the years ended July 31, 2022 and 2021 |
For the years ended July 31, 2022, 2021, 2020 and 2019, the seven months ended July 31, 2018, and the year ended December 31, 2017 |
|
Integrity Short Term Government Fund |
For the year ended July 31, 2022 |
For the years ended July 31, 2022 and 2021 |
For the years ended July 31, 2022 and 2021, the two months ended July 31, 2020, and the years ended May 31, 2020, 2019 and 2018 |
Basis for Opinion
These financial statements are the responsibility of the Funds’ management. Our responsibility is to express an opinion on the Funds’ financial statements based on our audits. We are a public accounting firm registered with the Public Company Accounting Oversight Board (United States) (“PCAOB”) and are required to be independent with respect to the Funds in accordance with the U.S. federal securities laws and the applicable rules and regulations of the Securities and Exchange Commission and the PCAOB.
We conducted our audits in accordance with the standards of the PCAOB. Those standards require that we plan and perform the audit to obtain reasonable assurance about whether the financial statements are free of material misstatement whether due to error or fraud.
Our audits included performing procedures to assess the risks of material misstatement of the financial statements, whether due to error or fraud, and performing procedures that respond to those risks. Such procedures included examining, on a test basis, evidence regarding the amounts and disclosures in the financial statements. Our procedures included confirmation of securities owned as of July 31, 2022, by correspondence with the custodian, counterparties and brokers; when replies were not received from brokers, we performed other auditing procedures. Our audits also included evaluating the accounting principles used and significant estimates made by management, as well as evaluating the overall presentation of the financial statements. We believe that our audits provide a reasonable basis for our opinion.
We have served as the auditor of one or more investment companies advised by Viking Fund Management since 2009.
![]()
COHEN & COMPANY, LTD.
Cleveland, Ohio
September 29, 2022
EXPENSE EXAMPLE (unaudited)
As a shareholder of the Funds, you incur two types of costs: (1) transaction costs, including sales charges (loads), redemption fees and exchange fees; and (2) ongoing costs, including management fees, distribution (12b-1) fees and other Funds expenses. This example is intended to help you understand your ongoing costs (in dollars) of investing in the Fund and to compare these costs with the ongoing costs of investing in other mutual funds. The example is based on an investment of $1,000 invested at the beginning of the one-half year period shown below and held for the entire one-half year period.
The section in the table under the heading “Actual” provides information about actual account values and actual expenses. You may use the information in these columns together with the amount you invested to estimate the expenses that you paid over the period. Simply divide your account value by $1,000 (for example, an account value of $8,600 divided by $1,000 equals 8.6), then multiply the result by the number in the appropriate column for your share class in the column entitled “Expenses Paid During Period” to estimate the expenses you paid on your account during this period.
The section in the table under the heading “Hypothetical (5% return before expenses)” provides information about hypothetical account values and hypothetical expenses based on the Funds’ actual expense ratios and an assumed rate of return of 5% per year before expenses, which is not the Funds’ actual returns. The hypothetical account values and expenses may not be used to estimate the actual ending account balance or expenses you paid for the period. You may use this information to compare the ongoing costs of investing in the Funds and other funds. To do so, compare this 5% hypothetical example with the 5% hypothetical examples that appear in the shareholder reports of the other funds.
Please note that the expenses shown in the table are meant to highlight your ongoing costs only and do not reflect any transactional costs, such as sales charges (loads), redemption fees, or exchange fees. Therefore, the section in the table under the heading “Hypothetical (5% return before expenses)” is useful in comparing ongoing costs only, and will not help you determine the relative total costs of owning different funds. In addition, if these transactional costs were included, your costs would have been higher.
|
Beginning |
Ending |
Expenses |
||||
|
Account |
Account |
Paid |
Annualized |
|||
|
Value |
Value |
During |
Expense |
|||
|
|
|
1/31/22 |
7/31/22 |
Period* |
Ratio |
|
|
Integrity Dividend |
Actual - Class A |
$1,000.00 |
$1,001.90 |
$4.72 |
0.95% |
|
|
Actual - Class C |
$1,000.00 |
$998.20 |
$8.42 |
1.70% |
||
|
Actual - Class I |
$1,000.00 |
$1,003.10 |
$3.48 |
0.70% |
||
|
Hypothetical - Class A |
$1,000.00 |
$1,020.08 |
$4.76 |
0.95% |
||
|
Hypothetical - Class C |
$1,000.00 |
$1,016.36 |
$8.50 |
1.70% |
||
|
Hypothetical - Class I |
$1,000.00 |
$1,021.32 |
$3.51 |
0.70% |
||
|
Integrity Growth
& |
Actual - Class A |
$1,000.00 |
$893.10 |
$5.82 |
1.24% |
|
|
Actual - Class C |
$1,000.00 |
$889.80 |
$7.36 |
1.57% |
||
|
Actual - Class I |
$1,000.00 |
$894.20 |
$4.65 |
0.99% |
||
|
Hypothetical - Class A |
$1,000.00 |
$1,018.65 |
$6.21 |
1.24% |
||
|
Hypothetical - Class C |
$1,000.00 |
$1,017.01 |
$7.85 |
1.57% |
||
|
Hypothetical - Class I |
$1,000.00 |
$1,019.89 |
$4.96 |
0.99% |
||
|
Integrity High |
Actual - Class A |
$1,000.00 |
$954.50 |
$4.80 |
0.99% |
|
|
Actual - Class C |
$1,000.00 |
$951.20 |
$8.42 |
1.74% |
||
|
Actual - Class I |
$1,000.00 |
$954.40 |
$3.59 |
0.74% |
||
|
Hypothetical - Class A |
$1,000.00 |
$1,019.89 |
$4.96 |
0.99% |
||
|
Hypothetical - Class C |
$1,000.00 |
$1,016.17 |
$8.70 |
1.74% |
||
|
Hypothetical - Class I |
$1,000.00 |
$1,021.12 |
$3.71 |
0.74% |
||
|
Integrity Mid-North
American Resources |
Actual - Class A |
$1,000.00 |
$1,169.00 |
$8.07 |
1.50% |
|
|
Actual - Class C |
$1,000.00 |
$1,166.70 |
$10.74 |
2.00% |
||
|
Actual - Class I |
$1,000.00 |
$1,171.30 |
$5.38 |
1.00% |
||
|
Hypothetical - Class A |
$1,000.00 |
$1,017.36 |
$7.50 |
1.50% |
||
|
Hypothetical - Class C |
$1,000.00 |
$1,014.88 |
$9.99 |
2.00% |
||
|
Hypothetical - Class I |
$1,000.00 |
$1,019.84 |
$5.01 |
1.00% |
||
|
Integrity Short Term Government Fund |
Actual - Class A |
$1,000.00 |
$971.40 |
$3.91 |
0.80% |
|
|
Actual - Class I |
$1,000.00 |
$973.60 |
$2.69 |
0.55% |
||
|
Hypothetical - Class A |
$1,000.00 |
$1,020.83 |
$4.01 |
0.80% |
||
|
Hypothetical - Class I |
$1,000.00 |
$1,022.07 |
$2.76 |
0.55% |
||
|
*Expenses are equal to the annualized expense ratio, multiplied by the average account value over the period, multiplied 181 days in the one-half year period, and divided by 365 days in the fiscal year (to reflect the one-half year period). |
||||||
LIQUIDITY RISK MANAGEMENT PROGRAM (unaudited)
The Viking Funds have adopted and implemented a written liquidity risk management program (the "LRMP") as required by Rule 22e-4 under the Investment Company Act of 1940, as amended. The LRMP is reasonably designed to assess and manage each Fund's liquidity risk, taking into consideration each Fund's investment strategy and the liquidity of its portfolio investments during normal and reasonably foreseeable stressed market conditions; its short- and long-term cash flow projections; and its cash holdings and access to other liquidity management tools such as available funding sources. The Viking Funds' Board of Trustees approved the appointment of the Funds' investment adviser, Viking Fund Management Inc. ("Viking"), as the administrator of the LRMP.
Viking manages liquidity risks associated with the Funds' investments by monitoring, among other things, cash and cash equivalents, any use of derivatives, the concentration of investments, the appropriateness of each Fund's investment strategy, and by classifying every Fund investment as either highly liquid, moderately liquid, less liquid or illiquid on at least a monthly basis.
At a meeting held on May 6, 2022, Viking provided an oral and written report to the Trustees on the operation and effectiveness of the LRMP during the previous year. The report from Viking concluded that the Funds did not experience any significant liquidity challenges during the covered period, and the Funds' LRMP is reasonably designed to assess and manage its liquidity risk. The report also concluded that the LRMP continues to operate adequately and effectively to enable Viking to oversee and manage liquidity risk and ensure the Funds are able to meet redemption requests without significant dilution to the remaining investors' interest in the Funds. During the review period, the Funds' portfolio consisted primarily of highly liquid investments, which are defined as cash and any investments that the Funds reasonably expects to be converted to cash in current market conditions in three business days or less without significantly changing the market value of the investment. Therefore, the Funds have not adopted a highly liquid investment minimum. The Funds' investments were below the limitation on illiquid investments during the review period. Additionally, Viking indicated that no events occurred that would require the filing of Form N-LIQUID and recommended no material changes to the LRMP.
BOARD OF TRUSTEES AND OFFICERS (unaudited)
The Board of Trustees (“Board”) of the Funds consists of four Trustees (the “Trustees”). These same individuals, unless otherwise noted, also serve as trustees for the six series of Viking Mutual Funds. Three Trustees are not “interested persons” (75% of the total) as defined under the 1940 Act (the “Independent Trustees”). The remaining Trustee is “interested” (the “Interested Trustees”) by virtue of his affiliation with Viking Fund Management, LLC and its affiliates.”
For the purposes of this section, the “Fund Complex” consists of the five series of The Integrity Funds and the six series of Viking Mutual Funds.
Each Trustee serves a Fund until its termination; or until the Trustee’s retirement, resignation, or death; or otherwise as specified in the Funds’ organizational documents. Each Officer serves an annual term. The tables that follow show information for each Trustee and Officer of the Funds.
|
INDEPENDENT TRUSTEES |
|
|
Name, Date of Birth, Date Service Began, and Number of Funds Overseen in Fund Complex |
Principal
Occupations for Past Five Years |
|
Wade A. Dokken |
Principal occupation(s): Member, WealthVest Financial Partners (2009 to present); Co-President, WealthVest Marketing (2009 to present), Trustee: Integrity Managed Portfolios (2016 to 2018), The Integrity Funds (2016 to present), and Viking Mutual Funds (2016 to present) Other Directorships Held: Not Applicable |
|
R. James Maxson |
Principal occupation(s): Attorney: Maxson Law Office P.C. (2002 to 2019); Trustee: Integrity Managed Portfolios (1999 to 2018), The Integrity Funds (2003 to present), and Viking Mutual Funds (2009 to present) Other Directorships Held: Peoples State Bank of Velva |
|
Jerry M. Stai |
Principal occupation(s): Minot State University (1999 to present); Trustee: Integrity Managed Portfolios (2006 to 2018), The Integrity Funds (2006 to present), and Viking Mutual Funds (2009 to present) Other Directorships Held: Not Applicable |
The Statement of Additional Information (“SAI”) contains more information about the Funds’ Trustees and is available without charge upon request, by calling Integrity Funds Distributor at 800-276-1262.
|
INTERESTED TRUSTEE |
|
|
Name, Position with Trust, Date of Birth, Date Service Began, and Number of Funds Overseen in Fund Complex |
Principal
Occupations for Past Five Years |
|
Robert E. Walstad(1) |
Principal occupation(s): Governor (2009 to present): Corridor Investors, LLC; Trustee and Chairman: Integrity Managed Portfolios (1996 to 2018), The Integrity Funds (2003 to present), and Viking Mutual Funds (2009 to present) Other Directorships Held: Not Applicable |
(1) Trustee who is an “interested person” of the Funds as defined in the 1940 Act. Mr. Walstad is an interested person by virtue of being an Officer of the Funds and ownership in Corridor Investors, LLC the parent company of Viking Fund Management, Integrity Fund Services, and Integrity Fund Distributors.
The SAI contains more information about the Funds’ Trustees and is available without charge upon request, by calling Integrity Funds Distributor at 800-276-1262.
|
OTHER OFFICERS |
|
|
Name, Position with Trust, Date of Birth, and Date Service Began |
Principal
Occupations for Past Five Years |
|
Shannon
D. Radke |
Principal occupation(s): Governor, CEO, and President (2009 to present): Corridor Investors, LLC; Governor and President (1998 to present) and Senior Portfolio Manager (1999 to present): Viking Fund Management, LLC; Governor and President (2009 to present): Integrity Fund Services, LLC and Integrity Funds Distributor, LLC; President: Integrity Managed Portfolios (2009 to 2018), The Integrity Funds (2009 to present), and Viking Mutual Funds (1999 to present) Other Directorships Held: Minot Area Community Foundation |
|
Peter A. Quist |
Principal occupation(s): Governor (2009 to present): Corridor Investors, LLC; Attorney (inactive); Vice President: Integrity Managed Portfolios (1996 to 2018); The Integrity Funds (2003 to present); and Viking Mutual Funds (2009 to present) Other Directorships Held: Not Applicable |
|
Shelly Nahrstedt |
Principal occupation(s): Chief Operating Officer, Integrity Fund Services, LLC, and Treasurer, The Integrity Funds (2020 to present); Director of Financial Fund Administration, PNC Capital Advisors, LLC, and Treasurer, PNC Funds (2018-2019); Director, Cohen & Company (2003-2018).
Other Directorships Held: Not applicable |
|
Brent M. Wheeler MF CCO: October 2005 Secretary: October 2009 |
Principal occupation(s): Mutual Fund Chief Compliance Officer: Integrity Managed Portfolios (2005 to 2018), The Integrity Funds, (2005 to present), and Viking Mutual Funds (2009 to present); Secretary: Integrity Managed Portfolios (2009 to 2018), The Integrity Funds and Viking Mutual Funds (2009 to present) Other Directorships Held: Not Applicable |
The SAI contains more information about the Funds’ Trustees and is available without charge upon request, by calling Integrity Funds Distributor at 800-276-1262.
PRIVACY POLICY
Rev. 11/2017
|
FACTS |
WHAT DOES INTEGRITY VIKING FUNDS DO WITH YOUR PERSONAL INFORMATION? |
|
|
|
|
Why? |
Financial companies choose how they share your personal information. Federal law gives consumers the right to limit some but not all sharing. Federal law also requires us to tell you how we collect, share, and protect your personal information. Please read this notice carefully to understand what we do. |
|
What? |
The types of personal information we collect and share depend on the product or service you have with us. This information can include:
· Social Security number, name, address · Account balance, transaction history, account transactions · Investment experience, wire transfer instructions
When you are no longer our customer, we continue to share your information as described in this notice. |
|
How? |
All financial companies need to share customers’ personal information to run their everyday business. In the section below, we list the reasons financial companies can share their customers’ personal information; the reasons Integrity Viking Funds chooses to share; and whether you can limit this sharing. |
|
Reasons we can share your personal information |
Does Integrity Viking Funds share? |
Can you limit this sharing? |
|
For our everyday business purposes- such as to process your transactions, maintain your account(s), respond to court orders and legal investigations, or report to credit bureaus |
Yes |
No |
|
For our marketing purposes- to offer our products and services to you |
Yes |
No |
|
For joint marketing with other financial companies |
No |
We don’t share |
|
For our affiliates’ everyday business purposes- information about your transactions and experiences |
Yes |
No |
|
For our affiliates’ everyday business purposes- information about your creditworthiness |
No |
We don’t share |
|
For non-affiliates to market to you |
No |
We don’t share |
|
Questions? |
Call 1-800-601-5593 or go to www.integrityvikingfunds.com |
PRIVACY POLICY (Continued)
|
Page 2 |
|
Who we are |
|
|
Who is providing this notice? |
Integrity Viking Funds (a family of investment companies) |
|
What we do |
|
|
How does Integrity Viking Funds protect my personal information? |
To protect your personal information from unauthorized access and use, we use security measures that comply with federal law. These measures include computer safeguards and secured files and buildings. We · train employees on privacy, information security and protection of client information. · limit access to nonpublic personal information to those employees requiring such information in performing their job functions. |
|
How does Integrity Viking Funds collect my personal information?
|
We collect your personal information, for example, when you: · open an account or seek financial or tax advice · provide account information or give us your contact information · make a wire transfer We also collect your personal information from other companies. |
|
Why can’t I limit all sharing? |
Federal law gives you the right to limit only:
· sharing for affiliates’ everyday business purposes-information about your creditworthiness · affiliates from using your information to market to you · sharing for non-affiliates to market to you
State laws and individual companies may give you additional rights to limit sharing. |
|
Definitions |
|
|
Affiliates |
Companies related by common ownership or control. They can be financial and nonfinancial companies · The Integrity Funds · Viking Mutual Funds · Corridor Investors, LLC · Viking Fund Management, LLC · Integrity Funds Distributor, LLC · Integrity Fund Services, LLC |
|
Non-affiliates |
Companies not related by common ownership or control. They can be financial and nonfinancial companies.
Integrity Viking Funds does not share with non-affiliates so they can market to you. |
|
Joint marketing |
A formal agreement between non-affiliated financial companies that together market financial products or services to you.
Integrity Viking Funds doesn’t jointly market. |
Integrity Viking Funds includes:
- The Integrity Funds
- Viking Mutual Funds
PROXY VOTING OF FUND PORTFOLIO SECURITIES
A description of the policies and procedures that the Funds use to determine how to vote proxies relating to securities held in the Funds’ portfolios are available, without charge and upon request, by calling 800-276-1262. A report on Form N-PX of how the Funds voted any such proxies during the most recent 12-month period ended June 30 is available through the Funds’ website at www.integrityvikingfunds.com. The information is also available from the Electronic Data Gathering Analysis and Retrieval (“EDGAR”) database on the website of the Securities and Exchange Commission (“SEC”) at www.sec.gov.
QUARTERLY PORTFOLIO SCHEDULE
Within 60 days of the end of their second and fourth fiscal quarters, the Funds provide a complete schedule of portfolio holdings in their semi-annual and annual reports on the Form N-CSR(s). These reports are filed electronically with the SEC and are delivered to the shareholders of the Funds. The Funds also file their complete schedules of portfolio holdings with the SEC for the first and third quarters of each fiscal year on Form N-PORT. The Funds’ Forms N-PORT(s) and N-CSR(s) are available on the SEC’s website at www.sec.gov. The Funds’ Forms N-PORT(s) and N-CSR(s) may be reviewed and copied at the SEC’s Public Reference Room in Washington, D.C. Information on the operation of the Public Reference Room may be obtained by calling 202-551-8090. You may also access this information from the Funds’ website at www.integrityvikingfunds.com.
SHAREHOLDER INQUIRIES AND MAILINGS
|
Direct inquiries regarding the Funds to: Integrity Funds Distributor, LLC PO Box 500 Minot, ND 58702 Phone: 800-276-1262 |
Direct inquiries regarding account information to: Integrity Fund Services, LLC PO Box 759 Minot, ND 58702 Phone: 800-601-5593 |
To reduce their expenses, the Funds may mail only one copy of their prospectus and each annual and semi-annual report to those addresses shared by two or more accounts. If you wish to receive additional copies of these documents, please call Integrity Funds Distributor at 800-276-1262 or contact your financial institution. Integrity Funds Distributor will begin sending you individual copies 30 days after receiving your request.
Integrity Viking Funds are sold by prospectus only. An investor should consider the investment objectives, risks, and charges and expenses of the investment company carefully before investing. The prospectus contains this and other information about the investment company. You may obtain a prospectus at no cost from your financial adviser or at www.integrityvikingfunds.com. Please read the prospectus carefully before investing.
Equity Funds
Integrity Dividend Harvest Fund
Integrity ESG Growth & Income Fund
Integrity Mid-North American Resources Fund
Corporate Bond Fund
Integrity High Income Fund
State-Specific Tax-Exempt Bond Funds
Viking Tax-Free Fund for North Dakota
Viking Tax-Free Fund for Montana
Kansas Municipal Fund
Maine Municipal Fund
Nebraska Municipal Fund
Oklahoma Municipal Fund
Government Bond Fund
Integrity Short Term Government Fund
Item 2. CODE OF ETHICS.
At the end of the period covered by this report, the registrant has adopted a code of ethics as defined in Item 2 of Form N-CSR that applies to the registrant’s principal executive officer and principal financial officer (herein referred to as the “Code”). There were no amendments to the Code during the period covered by this report. The registrant did not grant any waivers, including implicit waivers, from any provisions of the Code during the period of this report. The Code is available on the Integrity Viking Funds website at http://www.integrityvikingfunds.com. A copy of the Code is also available, without charge, upon request by calling 800-601-5593. The Code is filed herewith pursuant to Item 12(a)(1) as EX-99.CODE ETH.
Item 3. AUDIT COMMITTEE FINANCIAL EXPERT.
The Board of Trustees has determined that Jerry Stai is an audit committee financial expert, as defined in Item 3 of Form N-CSR. Mr. Stai is “independent” for purposes of Item 3 of Form N-CSR.
Item 4. PRINCIPAL ACCOUNTANT FEES AND SERVICES.
|
|
(a) |
Audit Fees: The aggregate fees billed for each of the last two fiscal years for professional services rendered by Cohen Fund Audit Services, Ltd. (“Cohen”), the principal accountant for the audit of the registrant’s annual financial statements, for services that are normally provided by the accountant in connection with statutory and regulatory filings or engagements for those fiscal years were $74,048 for the year ended July 31, 2022 and $71,804 for the year ended July 31, 2021. |
||
|
|
|
|
||
|
|
(b) |
Audit-Related Fees: The aggregate fees billed in each of the last two fiscal years for assurance and related services by Cohen that are reasonably related to the performance of the audit of the registrant’s financial statements and are not reported under paragraph (a) of this Item were $0 for the year ended July 31, 2022 and $0 for the year ended July 31, 2021. |
||
|
|
|
|
||
|
|
(c) |
Tax Fees: The aggregate fees billed in each of the last two fiscal years for professional services rendered by Cohen for tax compliance, tax advice, and tax planning were $12,500 for the year ended July 31, 2022 and $15,500 for the year ended July 31, 2021. Such services included review of excise distribution calculations (if applicable), preparation of the Trust’s federal, state, and excise tax returns, tax services related to mergers, and routine counseling. |
||
|
|
|
|
||
|
|
(d) |
All Other Fees: The aggregate fees billed in each of the last two fiscal years for products and services provided by Cohen, other than the services reported in paragraphs (a) through (c) of this Item: None. |
||
|
|
|
|
||
|
|
(e) |
(1) |
Audit Committee Pre-Approval Policies and Procedures |
|
|
|
|
|
|
|
|
|
|
|
|
The registrant’s audit committee has adopted policies and procedures that require the audit committee to pre-approve all audit and non-audit services provided to the registrant by the principal accountant. |
|
|
|
|
|
|
|
|
|
(2) |
Percentage of services referred to in 4(b) through 4(d) that were approved by the audit committee pursuant to paragraph (c)(7)(i)(C) of Rule 2-01 of Regulation S-X |
|
|
|
|
|
|
|
|
|
|
|
|
0% of the services described in paragraphs (b) through (d) of Item 4 were not pre-approved by the audit committee. |
|
|
|
|
||
|
|
(f) |
All services performed on the engagement to audit the registrant’s financial statements for the most recent fiscal year-end were performed by Cohen’s full-time permanent employees. |
||
|
|
|
|
||
|
|
(g) |
Non-Audit Fees: None. |
||
|
|
|
|
||
|
|
(h) |
Principal Accountant’s Independence: The registrant’s auditor did not provide any non-audit services to the registrant’s investment adviser or any entity controlling, controlled by, or controlled with the registrant’s investment adviser that provides ongoing services to the registrant. |
||
Item 5. AUDIT COMMITTEE OF LISTED REGISTRANTS.
Not applicable
Item 6. INVESTMENTS.
The Schedule of Investments is included as part of the report to shareholders filed under Item 1 of this Form.
Item 7. DISCLOSURE OF PROXY VOTING POLICIES AND PROCEDURES FOR CLOSED-END MANAGEMENT INVESTMENT COMPANIES.
Not applicable
Item 8. PORTFOLIO MANAGERS OF CLOSED-END MANAGEMENT INVESTMENT COMPANIES.
Not applicable
Item 9. PURCHASES OF EQUITY SECURITIES BY CLOSED-END MANAGEMENT INVESTMENT COMPANY AND AFFILIATED PURCHASERS.
Not applicable
Item 10. SUBMISSION OF MATTERS TO A VOTE OF SECURITY HOLDERS.
There have been no material changes to the procedures by which shareholders may recommend nominees to the registrant’s board of trustees in the last fiscal half-year.
Item 11. CONTROLS AND PROCEDURES.
|
|
(a) |
Based on their evaluation of the registrant’s disclosure controls and procedures as of a date within 90 days of the filing date of this Form N-CSR (the “Report”), the registrant’s principal executive officer and principal financial officer believe that the disclosure controls and procedures (as defined in Rule 30a-3(c) under the Investment Company Act of 1940, as amended) are effectively designed to ensure that information required to be disclosed by the registrant in the Report is recorded, processed, summarized and reported by the filing date, including ensuring that information required to be disclosed in the Report is accumulated and communicated to the registrant’s principal executive officer and principal financial officer who are making certifications in the Report, as appropriate, to allow timely decisions regarding required disclosure. |
|
|
|
|
|
|
(b) |
There were no changes in the registrant’s internal control over financial reporting (as defined in Rule 30a-3(d) under the Investment Company Act of 1940) that occurred during the registrant’s most recent fiscal half-year that have materially affected, or are reasonably likely to materially affect, the registrant's internal control over financial reporting. |
Item 12. EXHIBITS.
|
|
(a) |
(1) |
Code of ethics pursuant to Item 2 of Form N-CSR is filed and attached hereto as EX-99. CODE ETH. |
|
|
|
|
|
|
|
|
(2) |
A separate certification for each principal executive officer and principal financial officer of the registrant as required by Rule 30a-2 under the 1940 Act (17 CFR 270.30a-2) is filed and attached hereto as EX-99. CERT. |
|
|
|
|
|
|
|
|
(3) |
Not applicable. |
|
|
|
|
|
|
|
(b) |
Certifications pursuant to Section 906 of the Sarbanes-Oxley Act of 2002 is filed and attached hereto. |
|
Pursuant to the requirements of the Securities Exchange Act of 1934 and the Investment Company Act of 1940, the registrant has duly caused this report to be signed on its behalf by the undersigned, thereunto duly authorized.
The Integrity Funds
By: /s/ Shannon D. Radke
Shannon D. Radke
President
October 3, 2022
Pursuant to the requirements of the Securities Exchange Act of 1934 and the Investment Company Act of 1940, this report has been signed below by the following persons on behalf of the registrant and in the capacities and on the dates indicated.
By: /s/ Shannon D. Radke
Shannon D. Radke
President
October 3, 2022
By: /s/ Shelly Nahrstedt
Shelly Nahrstedt
Treasurer
October 3, 2022
ATTACHMENTS / EXHIBITS
Serious News for Serious Traders! Try StreetInsider.com Premium Free!
You May Also Be Interested In
- Goodturn Tire & Auto Accelerates Growth and Positive Momentum, Officially Launches Platform with 24 Locations Across Florida, Michigan and North Carolina
- Compass Group Reinforces Commitment to Reduce Food Waste on 8th Annual Stop Food Waste Day
- Wearable Medical Devices Market Experiences 25.7% CAGR, Surpassing USD 210 Billion by 2031, Driven by Rising Chronic Diseases and Focus on Preventive Care
Create E-mail Alert Related Categories
SEC FilingsSign up for StreetInsider Free!
Receive full access to all new and archived articles, unlimited portfolio tracking, e-mail alerts, custom newswires and RSS feeds - and more!
