

Form N-CSR Goldman Sachs Real Estat For: Sep 30
 Tweet
Tweet Share
ShareUNITED STATES
SECURITIES AND EXCHANGE COMMISSION
Washington, D.C. 20549
FORM N-CSR
CERTIFIED SHAREHOLDER REPORT OF REGISTERED
MANAGEMENT INVESTMENT COMPANIES
Investment Company Act file number 811-23499
Goldman Sachs Real Estate Diversified Income Fund
(Exact name of registrant as specified in charter)
200 West Street, New York, New York 10282
(Address of principal executive offices) (Zip code)
| Caroline Kraus, Esq. | Copies to: | |
| Goldman Sachs & Co. LLC | Stephen H. Bier, Esq. | |
| 200 West Street | William J. Bielefeld, Esq. | |
| New York, New York 10282 | Dechert LLP | |
| 1095 Avenue of the Americas | ||
| New York, NY 10036 |
(Name and address of agents for service)
Registrant’s telephone number, including area code: (212) 902-1000
Date of fiscal year end: September 30
Date of reporting period: September 30, 2021
| ITEM 1. | REPORTS TO STOCKHOLDERS. |
| The Annual Report to Shareholders is filed herewith. |
Goldman Sachs Interval Fund
| Annual Report | September 30, 2021 | |||
| Real Estate Diversified Income Fund | ||||

Goldman Sachs Real Estate Diversified Income Fund
| 1 | ||||
| 9 | ||||
| 12 | ||||
| 16 | ||||
| 22 | ||||
| 37 | ||||
| 38 | ||||
| NOT FDIC-INSURED | May Lose Value | No Bank Guarantee | ||
PORTFOLIO RESULTS
Goldman Sachs Real Estate Diversified Income Fund
Investment Objective
The Fund seeks to produce income and achieve capital appreciation with low to moderate volatility and low to moderate correlation to the broader equity markets.
Portfolio Management Discussion and Analysis
Below, the Goldman Sachs Real Estate Securities Investment Team discusses the Goldman Sachs Real Estate Diversified Income Fund’s (the “Fund”) performance and positioning for the 12-month period ended September 30, 2021 (the “Reporting Period”).
| Q | How did the Fund perform during the Reporting Period? |
| A | During the Reporting Period, the Fund’s Class A, Class C, Class I, Class L and Class W Shares generated average annual total returns, without sales charges, of 18.24%, 17.37%, 18.59%, 17.93% and 18.28%, respectively. The Fund’s Class P Shares generated a cumulative total return, without sales charges, from their inception on June 29, 2021 through September 30, 2021 of 4.31%. |
| As of September 30, 2021, the Fund’s net asset value (“NAV”) for Class A, Class C, Class I, Class L, Class W and Class P Shares was $10.45, $10.45, $10.93, $10.46, $10.62, and $10.93, respectively. |
| Q | What distributions did the Fund make during the Reporting Period? |
| A | The Fund’s Class A Shares declared dividends totaling $0.60 per share. The Fund’s Class L Shares declared dividends totaling $0.57 per share. The Fund’s Class C Shares declared dividends totaling $0.52 per share. The Fund’s Class W Shares declared dividends totaling $0.60 per share. The Fund’s Class I Shares declared dividends totaling $0.63 per share. The Fund’s Class P Shares declared dividends totaling $0.16 per share. |
| Q | What economic and market factors most influenced the U.S. real estate securities market as a whole during the Reporting Period? |
| A | During the first half of the Reporting Period, U.S. real estate securities outperformed the broader U.S. equity market, as there was a noteworthy reversal of the trends observed in the wake of the pandemic as positive COVID-19 vaccine news and then the actual roll-out of the COVID-19 vaccines accelerated, spurring hope for a near-term end to the shutdowns. This trend reversal provided a boost to the property types that were hardest hit earlier in 2020 when the pandemic initially spread. For example, hotels and retail led the way during the first half of the Reporting Period, beginning to recover as travel and shopping were expected to increase in a post-vaccinated world. On the other hand, digital real estate, such as towers and data centers, which had been among the biggest beneficiaries of the COVID-19 backdrop, underperformed the broader real estate market. |
| U.S. real estate securities continued to outperform the broader U.S. equity market during the second half of 2021, benefiting from several key secular drivers, in our view. These included attractive yield, especially compared to bonds; improved growth prospects, with growth broadening from secular and pandemic-driven winners to select cyclical recovery beneficiaries; and being a relative beneficiary of rising inflation, since, unlike bonds, real estate cash flows tend to increase in this environment. U.S. real estate securities were also seen by many investors as a relative beneficiary of potential corporate tax increases, as real estate investment trusts (“REITs”) are exempt from corporate taxes and have favorable tax treatment on distributions. Heightened demand for real estate as COVID-19 vaccination rates increased and relatively inexpensive valuations relative to fixed income, equities and private market values also provided compelling upside potential, further supporting U.S. real estate securities during the second half of the Reporting Period. Those property types that had been impacted most by COVID-19 continued to lead the way, with retail and hotels & lodging among the best performing sub-sectors, both the direct beneficiaries of the economic reopening. As people emerged from extended lockdowns, the desire to get out of the house and visit stores or travel and take vacations created robust demand in these property types. The residential sub-sector also performed well during the second half of the Reporting Period. While no sub-sectors posted a negative return, the technology sub-sector, inclusive of towers and data centers, continued to lag. |
1
PORTFOLIO RESULTS
| Q | What key factors were responsible for the Fund’s performance during the Reporting Period? |
| A | Public equity investments contributed most positively to the Fund’s performance during the Reporting Period. The Fund’s investments in the public REIT market were focused on secular growth property types, most notably, self-storage, manufactured housing, single-family rental, life-science office, data centers and towers. During the earlier months of the Reporting Period, the ripple effects of the COVID-19 pandemic provided significant tailwinds to these secular growth sub-sectors, with many benefiting from the work-from-home environment and from the demographic shift away from urban centers. During the second half of the Reporting Period, the Fund was more focused on what we considered to be cyclical recovery beneficiaries, or those property types that would potentially benefit from the lifting of lockdowns and the economic reopenings. The approval and distribution of multiple COVID-19 vaccines was perhaps the most significant event that occurred during the Reporting Period, providing a path out of the pandemic as companies re-evaluated their need for physical space and considered to what extent they would mandate a return to office for their workforce. |
| Real estate preferred stocks contributed least to the Fund’s performance during the Reporting Period. Given the rise in equities — both private and public, the more bond-like nature of preferred securities, while additive on an absolute basis, did not contribute to the Fund’s total return to the same degree the Fund’s private and public equity investments did. However, with the goal of providing investors a level of investment stability and yield sustainability, preferred stocks continued to play an important role in the portfolio, providing comparatively higher yields and lower volatility, and thus helping the portfolio management team deliver on the Fund’s investment objective. |
| Q | What were some of the Fund’s best-performing individual holdings during the Reporting Period? |
| A | The top individual contributors to the Fund’s performance during the Reporting Period were Nuveen U.S. Core-Plus Real Estate Debt Fund, L.P.; Prologis Targeted US Logistics Holdings II, LP; and Ares US Real Estate Fund IX, LP. |
| Nuveen U.S. Core-Plus Real Estate Debt Fund, L.P. is a private credit fund that seeks attractive risk-adjusted returns by building a portfolio of real estate mortgage loans secured by commercial real estate assets in the U.S. Its investment strategy incorporates an emphasis on diversification across markets, property sub-sectors and loan types. It may also utilize strategies designed to enhance asset-level returns on loans by applying structural and financial leverage on the underlying assets. During the Reporting Period, the fund successfully took advantage of improving real estate market conditions and increased transaction flow as the economic reopening took hold in the U.S. to originate new lending. Further, the fund’s existing loan assets seasoned, and there was an effort to proactively pursue a range of extensions to keep quality assets in its portfolio, all with an eye to provide compelling risk-adjusted returns. |
| Prologis Targeted US Logistics Holdings II, LP is a private equity fund that seeks to provide attractive current income with long-term capital growth by investing in and operating logistics real estate assets in key markets in the U.S. The fund targets core stabilized assets where there may also be an opportunity to enhance returns by actively managing, repositioning and renovating the assets. During the Reporting Period, the fund’s portfolio significantly benefited from growth in market rents and ongoing capital flow into the sector, driving up asset values and compressing capitalization rates. (The capitalization rate (also known as cap rate) is used in the world of real estate to indicate the rate of return that is expected to be generated on a real estate investment property. This measure is computed based on the net income which the property is expected to generate and is calculated by dividing net operating income by property asset value and is expressed as a percentage. It is used to estimate the investor’s potential return on their investment in the real estate market.) |
| Ares US Real Estate Fund IX, LP is a private equity fund focused on building a diversified portfolio of real estate assets in major property sub-sectors in the U.S. where there is an opportunity to improve cash flow and generate attractive current yields. During the Reporting Period, the fund benefited from surging demand in the commercial property market, with specific improvements in vacancy rates and rents across multi-family, industrial and niche sub-sectors exceeding consensus projections. |
| Q | Which positions detracted significantly from the Fund’s performance during the Reporting Period? |
| A | The position that detracted most from the Fund’s performance during the Reporting Period was Americold Realty Trust. There were no other significant detractors during the Reporting Period, but positions in Clarion Ventures 4, LP and Equinix dampened results more modestly. |
| Detracting most was Americold Realty Trust, a publicly-listed leader in providing temperature-controlled food distribution and storage services. The broad industry was weighed on during the Reporting Period by supply-chain bottleneck issues impacting inventory levels and labor cost pressures, both of which we viewed as transitory. At the end of the Reporting Period, we continued to like the long-term prospects for the company. |
2
PORTFOLIO RESULTS
| Clarion Ventures 4, LP is a private equity fund that seeks to make opportunistic real estate investments in the U.S., primarily targeting investments that involve repositioning underperforming properties, redeveloping underutilized properties and developing new properties in both wholly-owned and joint venture interests. It may also fund mezzanine loans or preferred equity investments in office, retail, multi-family, industrial, hotel, for-sale residential and mixed-used sub-sectors. (A real estate mezzanine loan is a type of financing that investors take on to fuel acquisitions or development projects. Mezzanine loans are subordinate to senior debt within the capital stack but receive priority over both preferred and common equity.) The fund’s remaining net asset value is concentrated in both for-sale residential and office assets. During the Reporting Period, its residential assets held up well, but its office assets experienced some moderate weakness. |
| Equinix, a publicly-listed owner and operator of data centers, was also a minor detractor from the Fund’s returns, mostly reflecting, in our view, a “cooling off” period in September 2021 following the stock’s strong performance from the depths of the COVID-19 pandemic through the end of August 2021. The stock’s performance was also muted toward the end of the Reporting Period by the market’s shift in focus from COVID-19 “winners” to more economic reopening-oriented stocks, such as leisure hotel and retail names. |
| Q | How did the Fund use derivatives and similar instruments during the Reporting Period? |
| A | During the Reporting Period, the Fund used equity index options to gain short-term broad-based exposure to the publicly-traded real estate market as well as to hedge potential near-term downside in the portfolio. The use of these derivatives had a neutral effect on the Fund’s results during the Reporting Period. |
| Q | Did the Fund make any significant purchases or sales during the Reporting Period? |
| A | During the Reporting Period, among those positions established or re-initiated were Ryman Hospitality Properties, a hotel REIT; RLJ Lodging Trust, a hotel REIT, subsequently sold by the end of the Reporting Period; Public Storage, a self-storage REIT; PennyMac Mortgage Investment Trust, a specialty finance company; and Sun Communities, a manufactured housing REIT. |
| Among those Fund positions eliminated during the Reporting Period were three in the industrial sub-sector, sold after each generated significant gains—Terreno Realty, Prologis and Duke Realty. We also exited the Fund’s positions in Starwood Property Trust, a commercial mortgage REIT sold in favor of what we viewed as better risk/reward opportunities elsewhere, and CyrusOne, an owner and operator of data center properties sold as we pivoted from secular growth investments toward potential cyclical recovery beneficiaries. |
| Q | Were there any changes made in the Fund’s investment strategy during the Reporting Period? |
| A | Early in the Reporting Period, we sought to take advantage of discounted valuations in the public real estate securities market by adding to multi-family and manufactured housing names that we believed were trading at excessive discounts to their NAV. As the fourth quarter of 2020 progressed, we shifted some of the Fund’s exposures into listed gaming and hotel stocks to position the portfolio to potentially benefit in a post-COVID-19 vaccine world. On the private side, we allocated incremental capital to the credit portfolio where managers were putting fresh capital to work at attractive pricing and terms, in our view. These purchases were funded by trimming some of the fund’s industrial holdings. While we continued to like the industrial sub-sector’s long-term fundamentals, NAV premiums in the listed market had grown substantially, leading us to reallocate capital to what we saw as better risk/reward opportunities. |
| After increasing the Fund’s exposure to potential cyclical beneficiaries in the fourth quarter of 2020, we saw significant price appreciation in a short period of time and sought to take advantage of this dynamic to reduce the Fund’s cyclical exposure slightly during the first quarter of 2021 and reallocate toward secular growth sub-sectors that had underperformed during the market rotation from growth to value styles. More specifically, we trimmed some multi-family and lodging names and reinvested that capital into the industrial, tower, data center, laboratory office and cold storage property types. In addition, we sold out of public mortgage REITs that had performed quite well and were trading in excess of book value, and we reallocated to a private credit fund. |
| During the second quarter of 2021, we harvested matured positions within both the public and private portions of the Fund’s portfolio and reallocated almost entirely within the listed portion of the portfolio. Specifically, we realized gains in listed industrial and self-storage names where premiums to NAV had risen significantly. Additionally, we redeemed interests in private investments on both the equity and credit fronts where we saw full values and believed there were better opportunities for the capital in the listed market. We deployed this capital within the public portion of the portfolio, adding to what we viewed as both secular growth and recovery holdings. Within the secular growth areas, we sought to take advantage of weakness early in the second calendar quarter by adding to Fund positions in the tower, laboratory office, cold storage, single-family rental and manufactured housing |
3
PORTFOLIO RESULTS
| property segments. On the cyclical recovery side, we added to the Fund’s gaming and leisure-focused lodging positions, as our conviction in the size and length of the recovery in each of these sub-sectors increased. Additionally, we increased the Fund’s listed preferred portfolio exposure to the mortgage REIT sector, where we found current yields particularly attractive. |
| After an active second calendar quarter harvesting gains and redeploying almost entirely on the public side of the portfolio, in the third quarter of 2021 we increased exposure to select multi-family and mortgage REIT positions within the Fund’s public sleeve. With the recovery in multi-family housing broadening and accelerating, we added to the Fund’s existing holdings where, in our view, valuations had yet to reflect the strong fundamentals we were seeing. We also increased Fund exposure to listed mortgage REITs, as a number of these stocks continued to trade, in our opinion, at meaningful discounts to book value and offer both attractive yields and valuation upside. Further, we added new funds on the private side for the first time since we assumed management of the Fund in May 2020. More specifically, we made substantial commitments to new open-end funds that have significant exposures to multi-family and industrial, two property types we viewed favorably, with the latter benefiting from e-commerce and heightened efforts to domesticate supply chains to enhance control and minimize disruptions. Conversely, we trimmed some of the Fund’s publicly-listed self-storage, tower and life science office exposures, as valuations reached levels where we felt the risk/reward balance was more attractive elsewhere. |
| Q | Were there any changes to the Fund’s portfolio management team during the Reporting Period? |
| A | Effective April 8, 2021, Nora Creedon no longer served as a portfolio manager for the Fund. In addition, effective the same date, Kristin Kuney began serving as a portfolio manager for the Fund, joining Timothy Ryan, Collin Bell and Sean Brenan, who continue to serve as portfolio managers for the Fund. Ms. Kuney joined Goldman Sachs Asset Management, L.P. in 2000. By design, all investment decisions for the Fund are performed within a co-lead or team structure, with multiple subject matter experts. This strategic decision making has been a cornerstone of our approach and helps to ensure continuity in the Fund. |
| Q | How was the Fund positioned at the end of the Reporting Period? |
| A | At the end of the Reporting Period, the Fund was invested with approximately 29.8% of its total net assets in private equity, approximately 19.6% of its total net assets in private credit, approximately 26.3% of its total net assets in public equity, approximately 4.9% of its total net assets in public credit, approximately 6.8% of its total net assets in preferred securities, and approximately 12.5% of its total net assets in cash and cash equivalents. |
| Approximately two-thirds of Fund assets was invested in property types that we believe benefit from strong demographic tailwinds or revenues protected by long-term lease obligations. Approximately one-third of assets was invested in credit instruments diversified across property types and focused on seeking relatively consistent and reliable stream of cash flows and low loan-to-value ratios. (Loan-to-value (“LTV”) ratio equals the mortgage amount divided by the purchase price or appraised property value. The LTV ratio is one way lenders and financial institutions can assess lending risk before approving a mortgage. Generally, loans that have high LTV ratios are considered more risky and as a result carry higher interest rates — and vice versa.) Even though higher on the capital structure, we believed the Fund’s credit sleeve could generate equity-like returns with lower volatility. The private portion of the Fund was diversified at the end of the Reporting Period across institutional General Partners and strategies. |
| Within the Fund’s equity sleeve, nearly 85% of assets was invested in higher growth property types benefiting from near-term secular trends, including industrials, towers/digital storage, life science-focused offices, single-family housing, manufactured housing, self-storage and lodging/resorts. To highlight just a few sub-sectors that we particularly favored at the end of the Reporting Period, approximately 25% of Fund assets was invested in multi-family properties, as we believed valuations, long-term demand, demographic shifts and basic necessity were supportive of the sub-sector. While we maintained a preference for low tax, business friendly, Sunbelt states, we saw apartment demand increase across the U.S. during the Reporting Period despite concerns around the COVID-19 Delta variant. What were low-rent opportunities early in the Reporting Period became market rents surpassing pre-COVID-19 levels in major metropolitan areas by the end of the Reporting Period. Approximately 15% of Fund assets was invested in office properties at the end of the Reporting Period. While we acknowledged the headwinds facing the sub-sector from work-from-home trends, we believed there were areas of opportunity and relative winners — specifically in “innovation cities” and in low tax states where job growth was likely to outperform national averages. (An “innovation city” is one where leading-edge anchor institutions and companies cluster and connect with start-ups, business incubators and accelerators.) Additionally, the Fund’s exposure had quite limited near-term lease maturities. More than half of the Fund’s office exposure at the end of the Reporting Period was in a portfolio of triple-net assets that were 98% leased with more than seven years of lease terms remaining to credit tenants. Approximately 10% of Fund |
4
PORTFOLIO RESULTS
| assets within the equity sleeve was invested in the lodging/resorts sub-sector. In our view, Las Vegas and other leisure-focused markets, such as South Florida, California and Hawaii, were seeing demand well in excess of pre-COVID-19 levels by the end of the Reporting Period, and forward-looking consensus expectations were for continued growth in this property type, supported by secular demand for experiences over material things. The equity portion of the Fund had a notably limited exposure — less than 1.5% of Fund assets — to retail, with our focus on necessity-based tenants. For example, approximately 40% of the Fund’s exposure within the retail sub-sector was in grocery-anchored centers, which we believed were better insulated from obsolescence than many other retail property types. |
| Q | How did the Fund use leverage during the Reporting Period? |
| A | The lines of credit established by the Fund under our management are bilateral, fully committed, revolving credit facilities. (A revolving credit facility is a line of credit arranged between a bank and a business. It comes with an established maximum amount, and the business can access the funds at any time when needed.) |
| The Fund is permitted to obtain leverage using financial leverage instruments, including through funds borrowed from banks or other financial institutions (i.e., a credit facility), margin facilities, or notes issued by the Fund and the leverage attributable to similar transactions entered into by the Fund, and it reserves the right to obtain leverage to the extent permitted by the Investment Company Act of 1940. |
| During the Reporting Period, the Fund did not use leverage habitually, meaning the Fund did not maintain a balance on any credit facility on a recurring basis. The intent of the credit agreements maintained by the Fund was primarily for short term cash flow management, typically utilized during quarterly repurchase periods. The secondary purpose was to exploit what we saw as attractive valuation opportunities in the public market when other sources of capital were not immediately available. Using leverage in this way enabled quick market entry to ensure those opportunities were not otherwise missed. |
| Underlying private real estate funds use leverage in acquiring assets as is typical, however, the average leverage level of these funds during the Reporting Period was below industry average, at about 33% loan-to-value. (The loan-to-value ratio is an assessment of lending risk that financial institutions and other lenders examine before approving a mortgage.) |
| We believe this under-use of leverage can not only create more sustainable long-term returns but may also result in better positioning of the Fund in times of market corrections as we seek to take advantage of what we view as attractive investment opportunities given the availability of capacity for leverage at that time. |
| Q | What is the Fund’s tactical view and strategy for the months ahead? |
| A | At the end of the Reporting Period, we had a constructive view ahead for the real estate sector. First, we believed the sector was offering relatively attractive yield, especially compared with traditional bonds. Indeed, it is well worth noting that the Fund delivered a 5.8% annualized yield as of its most recent quarterly distribution on September 29, 2021. Second, we believed real estate was offering attractive growth potential, with both strengthening and widening from secular beneficiaries (like towers, digital storage, industrial and life-science office property types) to cyclical recovery beneficiaries (like leisure hotels and multi-family housing property types). The return of leisure travel was especially meaningful. Airplanes were filling up; resort hotels were booked; and many Americans were striving to return to normal. These reopening trends were particularly notable in the cities, as many companies encouraged or required employees to return to in-person work, a positive sign for many property types, including multi-family housing and select offices. Third, several economic and fiscal factors supported our view on the sector for the months ahead. Unlike bonds, real estate can be a beneficiary of inflation, serving as a hedge against rising levels, due to the ability for owners to re-set rents and due to the potentially positive impact of rising costs on incumbent asset values. Also, unlike equities, real estate may be a relative beneficiary of rising taxes, should those be enacted by the U.S. Congress, because REITs do not pay corporate taxes. Real estate may also be a beneficiary of the sizable planned fiscal spending by the U.S. government, especially for digitally-focused property types, such as data centers and towers. |
| Finally, we believed the real estate sector was attractively valued at the end of the Reporting Period, especially compared to bonds, offering attractive upside potential, with the real estate capitalization rate spread, or differential, versus corporate credit well above the long-term average in September. This reflects our belief that the sector was misunderstood on two levels. First, investors were not sufficiently delineating between housing and commercial real estate, with many housing markets trading at near-record high valuations. Also, we believed investors were assuming that what was happening in the retail and office sub-sectors —with retail still on the “wrong” side of e-commerce trends and office still on the “wrong” side of work-from-home trends —was indicative of the rest of commercial real estate. In our view, this assumption was not only false but the exact opposite, as with the exception of these two sub-sectors, the |
5
PORTFOLIO RESULTS
| remaining property types saw meaningful demand growth as the Reporting Period progressed. |
| All that said, given the fluid backdrop and accelerated disruption trends resulting in a wide dispersion of returns within the real estate sector, we maintained our view that the best way to manage the Fund going forward is via a highly active approach — one that requires casting a wide net across both private and public real estate investments and across equity and credit asset classes — to best take advantage of the opportunities in the full real estate investment universe. We also maintained our belief that an integrated approach can help garner the complementary aspects of public and private markets, specifically the ability to gain both more diversified and complementary property type exposures and exploit short-term pricing dislocations between public and private real estate. |
| As we move forward, we intend to maintain our active and integrated approach that aims to balance the need for attractive income and capital appreciation with low to moderate volatility relative to equity and public real estate markets by investing primarily in income-producing real estate equity and debt securities. Through this actively managed closed-end interval fund, we will continue seeking to provide access to both private and public real estate diversified across property types, geography and asset class (equity and debt). |
| Sector, sub-sector and property type designations throughout this shareholder report are defined by Goldman Sachs Asset Management and may differ from sector, sub-sector and property type allocations used within the Schedule of Investments. |
6
FUND BASICS
Real Estate Diversified Income Fund
as of September 30, 2021
| TOP TEN HOLDINGS AS OF 9/30/211 | ||||||||
| Holding | % of Net Assets |
Asset Class | ||||||
| Carlyle Property Investors, LP |
5.9 | % | Private REIT & Private Investment Funds | |||||
| Heitman Core Real Estate Debt Income Trust, LP |
4.8 | % | Private REIT & Private Investment Funds | |||||
| Menlo Equities Absolute Return Fund, LP |
4.7 | % | Private REIT & Private Investment Funds | |||||
| Brookfield Premier Real Estate Partners, LP |
4.5 | % | Private REIT & Private Investment Funds | |||||
| Prologis Targeted U.S. Logistics Holdings II, LP |
4.1 | % | Private REIT & Private Investment Funds | |||||
| Ares US Real Estate Fund IX, LP |
3.9 | % | Private REIT & Private Investment Funds | |||||
| Brookfield Real Estate Finance Fund V, LP |
3.7 | % | Private REIT & Private Investment Funds | |||||
| MGM Growth Properties LLC, Class A |
3.4 | % | Real Estate Investment Trust (REIT) | |||||
| Clarion Ventures 4, LP |
3.3 | % | Private REIT & Private Investment Funds | |||||
| Sculptor Real Estate Credit Fund, LP |
3.3 | % | Private REIT & Private Investment Funds | |||||
| 1 | The top 10 holdings may not be representative of the Fund’s future investments. |
| ASSET CLASS ALLOCATION2 |

| 2 | The Fund is actively managed and, as such, its composition may differ over time. Consequently, the Fund’s overall allocations may differ from percentages contained in the graph above. Figures in the above graph may not sum to 100% due to the exclusion of other assets and liabilities. |
For more information about your Fund, please refer to www.GSAMFUNDS.com. There, you can learn more about your Fund’s investment strategies, holdings, and performance.
7
GOLDMAN SACHS REAL ESTATE DIVERSIFIED INCOME FUND
Performance Summary
September 30, 2021
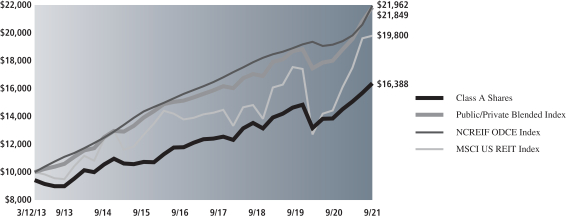
The following graph shows the value, as of September 30, 2021, of a $10,000 investment made on March 12, 2013 in Class A Shares at NAV (with a maximum sales charge of 5.75%). For comparative purposes, the performance of a private/public blended Index (70% NCREIF ODCE Index & 30% MSCI US REIT Index, with dividends reinvested), is shown. Performance reflects applicable fee waivers and/or expense limitations in effect during the periods shown and in their absence, performance would be reduced. Returns do not reflect the deduction of taxes that a shareholder would pay on Fund distributions or the redemption of Fund shares. The returns set forth below represent past performance. Past performance does not guarantee future results. The Fund’s investment return and principal value will fluctuate so that an investor’s shares, when repurchased, may be worth more or less than their original cost. Current performance may be lower or higher than the performance quoted below. Please visit our web site at www.GSAMFUNDS.com to obtain the most recent month-end returns.
| Real Estate Diversified Income Fund’s Lifetime Performance |
Performance of a $10,000 Investment, including any applicable sales charges, with distributions reinvested, from March 12, 2013 through September 30, 2021.
| Average Annual Total Return through September 30, 2021*,** | One Year | Five Years | Since Inception | |||||||
| Class A (Commenced March 12, 2013) |
||||||||||
| Excluding sales charges |
18.24% | 6.86% | 6.84% | |||||||
| Including sales charges |
10.97% | 5.61% | 6.10% | |||||||
|
| ||||||||||
| Class C (Commenced August 1, 2014) |
||||||||||
| Excluding sales charges |
17.37% | 6.05% | 6.18% | |||||||
| Including sales charges |
16.32% | 6.05% | 6.18% | |||||||
|
| ||||||||||
| Class l (Commenced August 1, 2014) |
18.59% | 6.96% | 6.89% | |||||||
|
| ||||||||||
| Class L (Commenced July 10, 2017) |
||||||||||
| Excluding sales charges |
17.93% | N/A | 6.73% | |||||||
| Including sales charges |
12.88% | N/A | 5.65% | |||||||
|
| ||||||||||
| Class W (Commenced November 21, 2014) |
18.28% | 6.82% | 6.72% | |||||||
|
| ||||||||||
| Class P (Commenced June 29, 2021) |
N/A | N/A | 4.31% | |||||||
|
| ||||||||||
| * | These returns assume reinvestment of all distributions at NAV and reflect a maximum initial sales charge of 5.75% for Class A and 4.25% for Class L and the assumed contingent deferred sales charge for Class A and C Shares (0.5% and 1%, respectively, if repurchased within 12 months of purchase). Because Class I, Class W and Class P Shares do not involve a sales charge, such a charge is not applied to their Average Annual Total Return. Total returns for periods less than one full year are not annualized. |
| ** | After the close of business on May 15, 2020, the Predecessor Fund was reorganized into the Fund. The Fund has assumed the historical performance of the Predecessor Fund, which was managed by another investment adviser. Therefore, the performance information reported above for the Fund is the combined performance of the Fund and the Predecessor Fund. The performance information shown in this report for periods through May 15, 2020 reflects the performance of the Predecessor Fund. As a result, the Fund’s performance may differ substantially from what is shown for periods through May 15, 2020. |
For more information about the Fund, please refer to www.GSAMFUNDS.com. There, you can learn more about the Fund’s investment strategies, holdings, and performance.
8
GOLDMAN SACHS REAL ESTATE DIVERSIFIED INCOME FUND
Consolidated Schedule of Investments
September 30, 2021
| Description | Value |
|||||||
| Private Real Estate Investment Trusts & Private Investment Funds – 51.1%(a) |
||||||||
| ACRES Capital Debt Opportunity Fund, LP | $ | 335,126 | ||||||
| Ares Real Estate Enhanced Income Fund, LP | 7,039,698 | |||||||
| Ares US Real Estate Fund IX, LP | 13,627,771 | |||||||
| Bain Capital Real Estate Fund I-B, LP | 8,266,507 | |||||||
| Brookfield Premier Real Estate Partners, LP | 15,910,721 | |||||||
| Brookfield Real Estate Finance Fund V, LP | 12,822,798 | |||||||
| Carlyle Property Investors, LP | 20,581,827 | |||||||
| Clarion Lion Properties Fund, LP | 3,994,744 | |||||||
| Clarion Partners Debt Investment Fund, LP | 7,042,190 | |||||||
| Clarion Ventures 4, LP | 11,740,973 | |||||||
| Heitman Core Real Estate Debt Income Trust, LP | 16,827,539 | |||||||
| Menlo Equities Absolute Return Fund, LP | 16,462,019 | |||||||
| Nuveen U.S. Core-Plus Real Estate Debt Fund, LP | 7,058,265 | |||||||
| Prologis Targeted U.S. Logistics Holdings II, LP | 14,265,653 | |||||||
| Sculptor Real Estate Credit Fund, LP | 11,491,772 | |||||||
| The Trumbull Property Fund, LP | 6,192,977 | |||||||
| Truman 2016 SC5, LLC | 249,893 | |||||||
| Voya Commercial Mortgage Lending Fund, LP | 5,438,452 | |||||||
|
|
|
|||||||
| TOTAL PRIVATE REAL ESTATE INVESTMENT |
||||||||
| TRUSTS & PRIVATE INVESTMENT FUNDS |
||||||||
| (Cost $161,767,686) |
$ | 179,348,925 | ||||||
|
|
|
|||||||
| Shares | Description | Value | ||||||
| Common Stocks – 30.1% | ||||||||
| Equity Real Estate Investment Trusts (REITs) – 25.7% | ||||||||
| 44,800 | Alexandria Real Estate Equities, Inc. REIT | $ | 8,559,936 | |||||
| 16,158 | American Tower Corp. REIT | 4,288,495 | ||||||
| 332,445 | Americold Realty Trust REIT | 9,657,527 | ||||||
| 38,627 | AvalonBay Communities, Inc. REIT | 8,561,288 | ||||||
| 46,489 | Camden Property Trust REIT | 6,855,733 | ||||||
| 24,743 | CoreSite Realty Corp. REIT | 3,427,895 | ||||||
| 4,342 | Equinix, Inc. REIT | 3,430,744 | ||||||
| 43,789 | Equity LifeStyle Properties, Inc. REIT | 3,419,921 | ||||||
| 21,393 | Essex Property Trust, Inc. REIT | 6,840,198 | ||||||
| 195,069 | Invitation Homes, Inc. REIT | 7,476,995 | ||||||
| 314,272 | MGM Growth Properties LLC, Class A REIT | 12,036,618 | ||||||
| 18,555 | Public Storage REIT | 5,512,691 | ||||||
| 82,821 | Ryman Hospitality Properties, Inc. REIT* | 6,932,118 | ||||||
| 18,531 | Sun Communities, Inc. REIT | 3,430,088 | ||||||
|
|
|
|||||||
| 90,430,247 | ||||||||
|
|
|
|||||||
| Mortgage Real Estate Investment Trusts (REITs) – 4.4% | ||||||||
| 167,572 | Angel Oak Mortgage, Inc. REIT | 2,836,994 | ||||||
| 347,285 | Ladder Capital Corp. REIT | 3,837,499 | ||||||
| 193,226 | PennyMac Mortgage Investment Trust REIT | 3,804,620 | ||||||
| 395,137 | TPG RE Finance Trust, Inc. REIT | 4,891,796 | ||||||
|
|
|
|||||||
| 15,370,909 | ||||||||
|
|
|
|||||||
| TOTAL COMMON STOCKS | ||||||||
| (Cost $105,427,829) | $ | 105,801,156 | ||||||
|
|
|
|||||||
| Shares | Description | Dividend Rate |
Value | |||||||||
| Preferred Stocks – 6.8% | ||||||||||||
| Equity Real Estate Investment Trusts (REITs) – 1.2% | ||||||||||||
| 59,455 | |
DigitalBridge Group, Inc., Series I |
|
7.15 | % | $ | 1,531,561 | |||||
| 57,144 | |
DigitalBridge Group, Inc., Series J |
|
7.13 | 1,494,887 | |||||||
| 54,165 | |
National Storage Affiliates Trust, Series A |
|
6.00 | 1,419,665 | |||||||
|
|
|
|||||||||||
| 4,446,113 | ||||||||||||
|
|
||||||||||||
| Mortgage Real Estate Investment Trusts (REITs) – 5.6% | ||||||||||||
| 73,988 | |
AGNC Investment Corp., Series E |
|
6.50 | 1,897,792 | |||||||
| 72,971 | |
Annaly Capital Management, Inc., Series F |
|
6.95 | 1,885,571 | |||||||
| 81,652 | |
MFA Financial, Inc., Series C |
|
6.50 | 2,007,006 | |||||||
| 81,155 | |
New Residential Investment Corp., Series B |
|
7.13 | 2,044,294 | |||||||
| 76,231 | |
New Residential Investment Corp., Series A |
|
7.50 | 1,947,702 | |||||||
| 77,122 | |
PennyMac Mortgage Investment Trust, Series B |
|
8.00 | 2,071,497 | |||||||
| 72,142 | |
PennyMac Mortgage Investment Trust, Series A |
|
8.13 | 1,910,320 | |||||||
| 79,349 | |
Two Harbors Investment Corp., Series B |
|
7.63 | 2,055,933 | |||||||
| 131,094 | |
Two Harbors Investment Corp., Series A |
|
8.13 | 3,531,672 | |||||||
|
|
|
|||||||||||
| 19,351,787 | ||||||||||||
|
|
||||||||||||
| TOTAL PREFERRED STOCKS |
| |||||||||||
| (Cost $23,209,254) |
|
$ | 23,797,900 | |||||||||
|
|
||||||||||||
| Shares | Description | Value | ||||||||||
| Public Non-Traded Real Estate Investment Trusts – 0.6%(a)(b) | ||||||||||||
| 44,684 | InvenTrust Properties Corp. | $ | 1,332,022 | |||||||||
| 168,566 | |
NorthStar Healthcare Income, Inc. |
|
655,721 | ||||||||
|
|
||||||||||||
| TOTAL PUBLIC NON-TRADED REAL ESTATE INVESTMENT TRUSTS |
| |||||||||||
| (Cost $3,021,726) |
|
$ | 1,987,743 | |||||||||
|
|
||||||||||||
| Shares | Dividend Rate |
Value | ||||||
| Investment Company – 11.5%(c) | ||||||||
| |
Goldman Sachs Financial Square Government Fund – |
| ||||||
| 40,544,769 | 0.026% | $ | 40,544,769 | |||||
| (Cost $40,544,769) | ||||||||
|
|
|
|||||||
| TOTAL INVESTMENTS – 100.1% | ||||||||
| (Cost $333,971,264) | $ | 351,480,493 | ||||||
|
|
|
|||||||
| |
LIABILITIES IN EXCESS OF OTHER ASSETS – (0.1)% |
(300,969 | ) | |||||
|
|
|
|||||||
| NET ASSETS – 100.0% | $ | 351,179,524 | ||||||
|
|
|
|||||||
| The accompanying notes are an integral part of these consolidated financial statements. | 9 |
GOLDMAN SACHS REAL ESTATE DIVERSIFIED INCOME FUND
Consolidated Schedule of Investments (continued)
September 30, 2021
| The percentage shown for each investment category reflects the value of investments in that category as a percentage of net assets. | ||
| * |
Non-income producing security. | |
| (a) |
Restricted securities are not registered under the Securities Act of 1933 and are subject to legal restrictions on sale. These securities generally may be resold in transactions exempt from registration or to the public if the securities are subsequently registered and the registration statement is effective. Disposal of these securities may involve time consuming negotiations and prompt sale at an acceptable price may be difficult. Total market value of restricted securities amounts to $181,336,668, which represents approximately 50.0% of net assets as of September 30, 2021. See additional details below: | |
| Security | Date(s) of Purchase |
Cost | ||||||||
| ACRES Capital Debt Opportunity Fund, LP |
08/16/18-7/11/19 | $ 226,925 | ||||||||
| Ares Real Estate Enhanced Income Fund, LP |
10/31/19-11/24/20 | 7,019,053 | ||||||||
| Ares US Real Estate Fund IX, LP |
09/19/19-05/27/21 | 10,573,592 | ||||||||
| Bain Capital Real Estate Fund I-B, LP |
12/18/19-09/10/21 | 6,740,379 | ||||||||
| Brookfield Premier Real Estate Partners, LP |
10/01/19-09/29/21 | 15,000,000 | ||||||||
| Brookfield Real Estate Finance Fund V, LP |
10/03/19-09/22/21 | 13,510,661 | ||||||||
| Carlyle Property Investors, LP |
10/01/19-04/01/20 | 16,987,157 | ||||||||
| Clarion Lion Properties Fund, LP |
01/01/14-05/31/19 | 2,647,616 | ||||||||
| Clarion Partners Debt Investment Fund, LP |
02/14/17-09/30/21 | 7,085,329 | ||||||||
| Clarion Ventures 4, LP |
07/01/16-07/10/19 | 9,793,571 | ||||||||
| Heitman Core Real Estate Debt Income Trust, LP |
07/27/17-11/13/17 | 16,702,937 | ||||||||
| InvenTrust Properties Corp. |
02/06/15 | 1,429,240 | ||||||||
| Menlo Equities Absolute Return Fund, LP |
06/28/19 | 16,000,000 | ||||||||
| NorthStar Healthcare Income, Inc. |
11/27/13-03/12/15 | 1,592,486 | ||||||||
| Nuveen U.S. Core-Plus Real Estate Debt Fund, LP |
10/01/19-04/21/21 | 7,092,080 | ||||||||
| Prologis Targeted U.S. Logistics Holdings II, LP |
01/03/20-07/15/20 | 10,096,699 | ||||||||
| Sculptor Real Estate Credit Fund, LP |
01/21/20-09/14/21 | 11,851,756 | ||||||||
| The Trumbull Property Fund, LP |
01/04/16-10/01/18 | 6,307,561 | ||||||||
| Truman 2016 SC5, LLC |
10/21/19 | — | ||||||||
| Voya Commercial Mortgage Lending Fund, LP |
10/11/19-12/30/19 | 5,397,607 | ||||||||
| Total | $166,054,649 | |||||||||
| (b) |
Significant unobservable inputs were used in the valuation of this portfolio security; i.e. Level 3. | |
| (c) |
Represents an affiliated issuer. | |
|
| ||||
| Investment Abbreviations: | ||||
| LP |
— Limited Partnership | |||
| REIT |
— Real Estate Investment Trust | |||
|
| ||||
| 10 | The accompanying notes are an integral part of these consolidated financial statements. |
GOLDMAN SACHS REAL ESTATE DIVERSIFIED INCOME FUND
Additional information on investments in private real estate investment funds:
| Security | Value | Redemption Frequency |
Redemption (Days) |
Unfunded as of September 30, 2021 |
||||||||||||
| ACRES Capital Debt Opportunity Fund, LP |
$ | 335,126 | N/R | N/R | $ | — | ||||||||||
| Ares Real Estate Enhanced Income Fund, LP |
7,039,698 | Quarterly | 90 | — | ||||||||||||
| Ares US Real Estate Fund IX, LP |
13,627,771 | N/R | N/R | 1,926,408 | ||||||||||||
| Bain Capital Real Estate Fund I-B, LP |
8,266,507 | N/R | N/R | 3,461,476 | ||||||||||||
| Brookfield Premier Real Estate Partners, LP(a) |
15,910,721 | Quarterly | 90 | 2,000,000 | ||||||||||||
| Brookfield Real Estate Finance Fund V, LP |
12,822,798 | N/R | N/R | 10,258,634 | ||||||||||||
| Carlyle Property Investors, LP |
20,581,827 | Quarterly | 90 | — | ||||||||||||
| Clarion Lion Properties Fund, LP |
3,994,744 | Quarterly | 90 | — | ||||||||||||
| Clarion Partners Debt Investment Fund, LP |
7,042,190 | N/R | N/R | 4,941,864 | ||||||||||||
| Clarion Ventures 4, LP |
11,740,973 | N/R | N/R | 963,242 | ||||||||||||
| Heitman Core Real Estate Debt Income Trust, LP |
16,827,539 | Quarterly | 90 | — | ||||||||||||
| InvenTrust Properties Corp. |
1,332,022 | N/R | N/R | — | ||||||||||||
| Menlo Equities Absolute Return Fund, LP |
16,462,019 | Annually | 30 | — | ||||||||||||
| NorthStar Healthcare Income, Inc. |
655,721 | N/R | N/R | — | ||||||||||||
| Nuveen U.S. Core-Plus Real Estate Debt Fund, LP |
7,058,265 | Quarterly | 45 | 2,907,920 | ||||||||||||
| Prologis Targeted U.S. Logistics Holdings II, LP |
14,265,653 | Quarterly | 90 | — | ||||||||||||
| Sculptor Real Estate Credit Fund, LP |
11,491,772 | N/R | N/R | 6,353,264 | ||||||||||||
| The Trumbull Property Fund, LP |
6,192,977 | Quarterly | 60 | — | ||||||||||||
| Truman 2016 SC5, LLC |
249,893 | N/R | N/R | — | ||||||||||||
| Voya Commercial Mortgage Lending Fund, LP |
5,438,452 | Quarterly | 90 | — | ||||||||||||
| N/R | - Not Redeemable |
| (a) | Redemptions are subject to a two-year holding period from the underlying fund’s initial capital call on October 1, 2019. |
| The accompanying notes are an integral part of these consolidated financial statements. | 11 |
GOLDMAN SACHS REAL ESTATE DIVERSIFIED INCOME FUND
Consolidated Statement of Assets and Liabilities
September 30, 2021
| Real Estate Diversified Income Fund(a) |
||||||
| Assets: |
| |||||
| Investments in unaffiliated issuers, at value (cost $293,426,495) |
$ | 310,935,724 | ||||
| Investments in affiliated issuers, at value (cost $40,544,769) |
40,544,769 | |||||
| Cash |
3,650,841 | |||||
| Receivables: |
||||||
| Investments sold |
14,385,711 | |||||
| Dividends |
1,895,842 | |||||
| Fund shares sold |
420,324 | |||||
| Reimbursement from investment adviser |
267,005 | |||||
| Other assets |
1,602 | |||||
| Total assets | 372,101,818 | |||||
| Liabilities: | ||||||
| Payables: |
||||||
| Investments purchased |
20,268,044 | |||||
| Management fees |
369,525 | |||||
| Distribution and Service fees and Transfer Agency fees |
185,108 | |||||
| Accrued expenses |
99,617 | |||||
| Total liabilities | 20,922,294 | |||||
| Net Assets: | ||||||
| Paid-in capital |
323,947,723 | |||||
| Total distributable earnings |
27,231,801 | |||||
| NET ASSETS | $ | 351,179,524 | ||||
| Net Assets: |
||||||
| Class A |
$ | 83,054,292 | ||||
| Class C |
69,359,686 | |||||
| Class I |
98,017,698 | |||||
| Class L |
5,919,152 | |||||
| Class W |
40,617,195 | |||||
| Class P |
54,211,501 | |||||
| Total Net Assets |
$ | 351,179,524 | ||||
| Shares Outstanding $0.001 par value (unlimited number of shares authorized): |
||||||
| Class A |
7,944,995 | |||||
| Class C |
6,635,176 | |||||
| Class I |
8,965,099 | |||||
| Class L |
565,685 | |||||
| Class W |
3,823,289 | |||||
| Class P |
4,957,648 | |||||
| Net asset value and offering price per share:(b) |
||||||
| Class A |
$10.45 | |||||
| Class C |
10.45 | |||||
| Class I |
10.93 | |||||
| Class L |
10.46 | |||||
| Class W |
10.62 | |||||
| Class P |
10.93 | |||||
| (a) | Statement of Assets and Liabilities for the Fund is consolidated and includes the balances of wholly owned subsidiaries DIF Investments LLC, DIF Investments II LLC, and DIF Investments III LLC. Accordingly, all interfund balances and transactions have been eliminated. |
| (b) | Maximum public offering price per share for Class A Shares is $11.09 and for Class L is $10.91. Upon repurchase, Class C Shares may be subject to a contingent deferred sales charge, assessed on the amount equal to the lesser of the current net asset value (“NAV”) or the original purchase price of the shares. |
| 12 | The accompanying notes are an integral part of these consolidated financial statements. |
GOLDMAN SACHS REAL ESTATE DIVERSIFIED INCOME FUND
Consolidated Statement of Operations
For the Fiscal Year Ended September 30, 2021
| Real Estate Diversified Income Fund(a) |
||||||
| Investment income: |
| |||||
| Dividends — unaffiliated issuers |
$ | 11,746,879 | ||||
| Dividends — affiliated issuers |
4,333 | |||||
| Total investment income | 11,751,212 | |||||
| Expenses: |
| |||||
| Management fees |
3,537,395 | |||||
| Professional fees |
1,102,777 | |||||
| Distribution and/or Service (12b-1) fees(b) |
703,041 | |||||
| Transfer Agency fees |
396,186 | |||||
| Shareholder Services fees(b) |
350,595 | |||||
| Interest on borrowing |
302,284 | |||||
| Printing and mailing costs |
282,696 | |||||
| Custody, accounting and administrative services |
181,621 | |||||
| Registration fees |
70,600 | |||||
| Trustee fees |
58,319 | |||||
| Other |
114,762 | |||||
| Total expenses | 7,100,276 | |||||
| Less — expense reductions |
(745,449 | ) | ||||
| Net expenses | 6,354,827 | |||||
| NET INVESTMENT INCOME | 5,396,385 | |||||
| Realized and unrealized gain (loss): |
| |||||
| Net realized gain (loss) from: |
||||||
| Investments — unaffiliated issuers |
23,627,163 | |||||
| Purchased options |
(488,467 | ) | ||||
| Written options |
757,089 | |||||
| Net change in unrealized gain (loss) on: |
||||||
| Investments — unaffiliated issuers |
17,329,194 | |||||
| Net realized and unrealized gain | 41,224,979 | |||||
| NET INCREASE IN NET ASSETS RESULTING FROM OPERATIONS | $ | 46,621,364 | ||||
| (a) | Statement of Operations for the Fund is consolidated and includes the balances of wholly owned subsidiaries DIF Investments LLC, DIF Investments II LLC, and DIF Investments III LLC. Accordingly, all interfund balances and transactions have been eliminated. |
| (b) | Class specific Distribution Service and Shareholder Services fees were as follows: |
| Distribution Service Fees | Shareholder Services Fees | |||||||||||||||||||||||||||||
| Class A |
Class C |
Class W |
Class L |
Class A |
Class C |
Class W |
Class L |
|||||||||||||||||||||||
| $ | 106,364 | $ | 528,669 | $ | 53,472 | $ | 14,536 | $ | 106,364 | $ | 176,223 | $ | 53,472 | $ | 14,536 | |||||||||||||||
| The accompanying notes are an integral part of these consolidated financial statements. | 13 |
GOLDMAN SACHS REAL ESTATE DIVERSIFIED INCOME FUND
Consolidated Statements of Changes in Net Assets
| Real Estate Diversified Income Fund(a) | ||||||||||
| For the Fiscal Year Ended |
For the Fiscal Year Ended |
|||||||||
| From operations: |
| |||||||||
| Net investment income |
$ | 5,396,385 | $ | 9,016,087 | ||||||
| Net realized gain (loss) |
23,895,785 | (2,364,095 | ) | |||||||
| Net change in unrealized gain (loss) |
17,329,194 | (27,274,906 | ) | |||||||
| Net increase (decrease) in net assets resulting from operations | 46,621,364 | (20,622,914 | ) | |||||||
| Distributions to shareholders: |
| |||||||||
| From distributable earnings: |
||||||||||
| Class A Shares |
(5,083,770 | ) | (5,429,382 | ) | ||||||
| Class C Shares |
(3,687,066 | ) | (3,663,199 | ) | ||||||
| Class I Shares |
(4,677,645 | ) | (4,472,302 | ) | ||||||
| Class L Shares |
(328,823 | ) | (283,683 | ) | ||||||
| Class W Shares |
(2,502,130 | ) | (3,165,247 | ) | ||||||
| Class P Shares |
(758,935 | ) | — | |||||||
| Class U Shares(b) |
— | (62 | ) | |||||||
| Class T Shares(c) |
— | (327 | ) | |||||||
| Class D Shares(c) |
— | (787 | ) | |||||||
| From return of capital: |
||||||||||
| Class A Shares |
— | (1,741,207 | ) | |||||||
| Class C Shares |
— | (1,378,419 | ) | |||||||
| Class I Shares |
— | (1,278,114 | ) | |||||||
| Class L Shares |
— | (122,826 | ) | |||||||
| Class W Shares |
— | (1,167,461 | ) | |||||||
| Total distributions to shareholders | (17,038,369 | ) | (22,703,016 | ) | ||||||
| From share transactions: |
| |||||||||
| Proceeds from sales of shares |
95,004,152 | 96,310,426 | ||||||||
| Reinvestment of distributions |
7,645,452 | 10,456,342 | ||||||||
| Cost of shares repurchased |
(68,865,886 | ) | (126,528,978 | ) | ||||||
| Net increase (decrease) in net assets resulting from share transactions | 33,783,718 | (19,762,210 | ) | |||||||
| TOTAL INCREASE (DECREASE) | 63,366,713 | (63,088,140 | ) | |||||||
| Net assets: | ||||||||||
| Beginning of year |
287,812,811 | 350,900,951 | ||||||||
| End of year |
$ | 351,179,524 | $ | 287,812,811 | ||||||
| (a) | Statements of Changes in Net Assets for the Fund are consolidated and include the balances of wholly owned subsidiaries DIF Investments LLC, DIF Investments II LLC, and DIF Investments III LLC. Accordingly, all interfund balances and transactions have been eliminated. |
| (b) | Effective as of January 15, 2020, the Fund terminated operations of its Class U Shares. |
| (c) | Effective as of February 3, 2020, the Fund terminated operations of its Class D and Class T shares. |
| 14 | The accompanying notes are an integral part of these consolidated financial statements. |
GOLDMAN SACHS REAL ESTATE DIVERSIFIED INCOME FUND
Consolidated Statement of Cash Flows(a)
For the Fiscal Year Ended September 30, 2021
| Increase/(Decrease) in cash – Cash flows used in operating activities: |
||||||
| Net increase in net assets resulting from operations |
$ | 46,621,364 | ||||
| Adjustments to reconcile net increase in net assets from operations to net cash provided by/(used in) operating activities: |
||||||
| Payments for purchases of investments |
(196,977,196 | ) | ||||
| Proceeds from sales of investments |
206,316,780 | |||||
| Payment for purchases of option contracts |
(57,892,591 | ) | ||||
| Proceeds from sale of option contracts |
57,404,124 | |||||
| Premiums received from written options transactions |
57,699,351 | |||||
| Premiums paid from closing written options transactions |
(56,942,262 | ) | ||||
| Net (purchase) proceeds from short-term investment securities |
(30,551,442 | ) | ||||
| (Increase) Decrease in Assets: |
||||||
| Receivable for dividends |
2,868,047 | |||||
| Reimbursement from investment adviser |
(267,005 | ) | ||||
| Other assets |
2,060 | |||||
| Increase (Decrease) in Liabilities: |
||||||
| Interest on borrowings |
(17,139 | ) | ||||
| Management fees |
3,147 | |||||
| Distribution, Service and Transfer Agency fees |
13,298 | |||||
| Accrued expenses |
(194,029 | ) | ||||
| Net realized (gain) loss on: |
||||||
| Investments |
(23,627,163 | ) | ||||
| Purchased options |
488,467 | |||||
| Written Options |
(757,089 | ) | ||||
| Net change in unrealized (gain) loss on: |
||||||
| Investments |
(17,329,194 | ) | ||||
| Net cash used in operating activities | (13,138,472 | ) | ||||
| Cash flows provided by financing activities: | ||||||
| Proceeds from sale of shares |
94,659,656 | |||||
| Cost of shares repurchased |
(68,865,886 | ) | ||||
| Distributions paid |
(9,392,917 | ) | ||||
| Drawdowns from line of credit |
37,500,000 | |||||
| Repayment of line of credit |
(37,500,000 | ) | ||||
| Net cash provided by financing activities | 16,400,853 | |||||
| NET INCREASE IN CASH | $ | 3,262,381 | ||||
| Cash (restricted and unrestricted): | ||||||
| Beginning of year |
$ | 388,460 | ||||
| End of year |
$ | 3,650,841 | ||||
| Supplemental disclosure: |
||||||
| Cash paid for interest and related fees |
$ | 302,284 | ||||
| Reinvestment of distributions |
7,645,452 | |||||
| (a) | Statement of Cash Flows for the Fund is consolidated and includes the balances of wholly owned subsidiaries DIF Investments LLC, DIF Investments II LLC, and DIF Investments III LLC. Accordingly, all interfund balances and transactions have been eliminated. |
| The accompanying notes are an integral part of these consolidated financial statements. | 15 |
GOLDMAN SACHS REAL ESTATE DIVERSIFIED INCOME FUND
Consolidated Financial Highlights
Selected Share Data for a Share Outstanding Throughout Each Year
| Goldman Sachs Real Estate Diversified Income Fund | ||||||||||||||||||||||
| Class A Shares | ||||||||||||||||||||||
| Year Ended September 30, | ||||||||||||||||||||||
| 2021 | 2020 | 2019 | 2018 | 2017 | ||||||||||||||||||
| Per Share Data | ||||||||||||||||||||||
| Net asset value, beginning of year |
$ | 9.38 | $ | 10.69 | $ | 10.47 | $ | 10.19 | $ | 10.26 | ||||||||||||
| Net investment income(a) |
0.20 | 0.29 | 0.40 | 0.30 | 0.39 | |||||||||||||||||
| Net realized and unrealized gain (loss) |
1.47 | (0.89 | ) | 0.42 | 0.58 | 0.17 | ||||||||||||||||
| Total from investment operations |
1.67 | (0.60 | ) | 0.82 | 0.88 | 0.56 | ||||||||||||||||
| Distributions to shareholders from net investment income |
(0.34 | ) | (0.23 | ) | (0.26 | ) | (0.24 | ) | (0.31 | ) | ||||||||||||
| Distributions to shareholders from net realized gains |
(0.26 | ) | (0.30 | ) | (0.21 | ) | (0.15 | ) | (0.12 | ) | ||||||||||||
| Distributions to shareholders from return of capital |
— | (0.18 | ) | (0.13 | ) | (0.21 | ) | (0.20 | ) | |||||||||||||
| Total distributions |
(0.60 | ) | (0.71 | ) | (0.60 | ) | (0.60 | ) | (0.63 | ) | ||||||||||||
| Net asset value, end of year |
$ | 10.45 | $ | 9.38 | $ | 10.69 | $ | 10.47 | $ | 10.19 | ||||||||||||
| Total Return(b) | 18.24 | % | (5.20 | )% | 8.17 | % | 9.00 | % | 5.67 | % | ||||||||||||
| Net assets, end of year (in 000’s) |
$ | 83,054 | $ | 87,520 | $ | 96,114 | $ | 86,965 | $ | 84,231 | ||||||||||||
| Ratio of net expenses to average net assets before interest expense |
1.99 | % | 1.99 | % | 1.99 | % | 1.99 | % | 1.99 | % | ||||||||||||
| Ratio of net expenses to average net assets after interest expense |
2.10 | % | 2.19 | % | 2.83 | % | 2.76 | % | 2.69 | % | ||||||||||||
| Ratio of total expenses to average net assets after interest expense |
2.34 | % | 2.28 | % | 2.90 | % | 2.97 | % | 2.90 | % | ||||||||||||
| Ratio of net investment income to average net assets |
2.02 | % | 2.88 | % | 3.83 | % | 2.97 | % | 3.81 | % | ||||||||||||
| Portfolio turnover rate(c) |
73 | % | 53 | % | 65 | % | 78 | % | 11 | % | ||||||||||||
| (a) | Calculated based on the average shares outstanding methodology. |
| (b) | Assumes investment at the NAV at the beginning of the year, reinvestment of all dividends and distributions, a complete repurchase of the investment at the NAV at the end of the year and no sales or repurchase charges (if any). Total returns would be reduced if a sales or repurchase charge was taken into account. Returns do not reflect the impact of taxes to shareholders relating to Fund distributions or the repurchase of Fund shares. |
| (c) | The Fund’s portfolio turnover rate is calculated in accordance with regulatory requirements, without regard to transactions involving short term investments and certain derivatives. If such transactions were included, the Fund’s portfolio turnover rate may be higher. |
| 16 | The accompanying notes are an integral part of these consolidated financial statements. |
GOLDMAN SACHS REAL ESTATE DIVERSIFIED INCOME FUND
Consolidated Financial Highlights (continued)
Selected Share Data for a Share Outstanding Throughout Each Year
| Goldman Sachs Real Estate Diversified Income Fund | ||||||||||||||||||||||
| Class C Shares | ||||||||||||||||||||||
| Year Ended September 30, | ||||||||||||||||||||||
| 2021 | 2020 | 2019 | 2018 | 2017 | ||||||||||||||||||
| Per Share Data | ||||||||||||||||||||||
| Net asset value, beginning of year |
$ | 9.38 | $ | 10.68 | $ | 10.47 | $ | 10.19 | $ | 10.25 | ||||||||||||
| Net investment income(a) |
0.13 | 0.20 | 0.32 | 0.23 | 0.32 | |||||||||||||||||
| Net realized and unrealized gain (loss) |
1.46 | (0.87 | ) | 0.41 | 0.57 | 0.18 | ||||||||||||||||
| Total from investment operations |
1.59 | (0.67 | ) | 0.73 | 0.80 | 0.50 | ||||||||||||||||
| Distributions to shareholders from net investment income |
(0.26 | ) | (0.16 | ) | (0.22 | ) | (0.20 | ) | (0.27 | ) | ||||||||||||
| Distributions to shareholders from net realized gains |
(0.26 | ) | (0.29 | ) | (0.18 | ) | (0.14 | ) | (0.12 | ) | ||||||||||||
| Distributions to shareholders from return of capital |
— | (0.18 | ) | (0.12 | ) | (0.18 | ) | (0.17 | ) | |||||||||||||
| Total distributions |
(0.52 | ) | (0.63 | ) | (0.52 | ) | (0.52 | ) | (0.56 | ) | ||||||||||||
| Net asset value, end of year |
$ | 10.45 | $ | 9.38 | $ | 10.68 | $ | 10.47 | $ | 10.19 | ||||||||||||
| Total Return(b) | 17.37 | % | (5.94 | )% | 7.24 | % | 8.17 | % | 4.97 | % | ||||||||||||
| Net assets, end of year (in 000’s) |
$ | 69,360 | $ | 72,826 | $ | 74,609 | $ | 62,367 | $ | 57,559 | ||||||||||||
| Ratio of net expenses to average net assets before interest expense |
2.74 | % | 2.74 | % | 2.74 | % | 2.74 | % | 2.74 | % | ||||||||||||
| Ratio of net expenses to average net assets after interest expense |
2.84 | % | 2.94 | % | 3.58 | % | 3.51 | % | 3.47 | % | ||||||||||||
| Ratio of total expenses to average net assets after interest expense |
3.09 | % | 3.04 | % | 3.64 | % | 3.73 | % | 3.71 | % | ||||||||||||
| Ratio of net investment income to average net assets |
1.27 | % | 2.04 | % | 3.08 | % | 2.24 | % | 3.11 | % | ||||||||||||
| Portfolio turnover rate(c) |
73 | % | 53 | % | 65 | % | 78 | % | 11 | % | ||||||||||||
| (a) | Calculated based on the average shares outstanding methodology. |
| (b) | Assumes investment at the NAV at the beginning of the year, reinvestment of all dividends and distributions, a complete repurchase of the investment at the NAV at the end of the year and no sales or repurchase charges (if any). Total returns would be reduced if a sales or repurchase charge was taken into account. Returns do not reflect the impact of taxes to shareholders relating to Fund distributions or the repurchase of Fund shares. |
| (c) | The Fund’s portfolio turnover rate is calculated in accordance with regulatory requirements, without regard to transactions involving short term investments and certain derivatives. If such transactions were included, the Fund’s portfolio turnover rate may be higher. |
| The accompanying notes are an integral part of these consolidated financial statements. | 17 |
GOLDMAN SACHS REAL ESTATE DIVERSIFIED INCOME FUND
Consolidated Financial Highlights (continued)
Selected Share Data for a Share Outstanding Throughout Each Year
| Goldman Sachs Real Estate Diversified Income Fund | ||||||||||||||||||||||
| Class I Shares | ||||||||||||||||||||||
| Year Ended September 30, | ||||||||||||||||||||||
| 2021 | 2020 | 2019 | 2018 | 2017 | ||||||||||||||||||
| Per Share Data | ||||||||||||||||||||||
| Net asset value, beginning of year |
$ | 9.78 | $ | 11.13 | $ | 10.91 | $ | 10.62 | $ | 10.74 | ||||||||||||
| Net investment income(a) |
0.24 | 0.33 | 0.45 | 0.36 | 0.48 | |||||||||||||||||
| Net realized and unrealized gain (loss) |
1.54 | (0.93 | ) | 0.42 | 0.59 | 0.09 | ||||||||||||||||
| Total from investment operations |
1.78 | (0.60 | ) | 0.87 | 0.95 | 0.57 | ||||||||||||||||
| Distributions to shareholders from net investment income |
(0.37 | ) | (0.26 | ) | (0.27 | ) | (0.26 | ) | (0.34 | ) | ||||||||||||
| Distributions to shareholders from net realized gains |
(0.26 | ) | (0.31 | ) | (0.23 | ) | (0.16 | ) | (0.12 | ) | ||||||||||||
| Distributions to shareholders from return of capital |
— | (0.18 | ) | (0.15 | ) | (0.24 | ) | (0.23 | ) | |||||||||||||
| Total distributions |
(0.63 | ) | (0.75 | ) | (0.65 | ) | (0.66 | ) | (0.69 | ) | ||||||||||||
| Net asset value, end of year |
$ | 10.93 | $ | 9.78 | $ | 11.13 | $ | 10.91 | $ | 10.62 | ||||||||||||
| Total Return(b) | 18.59 | % | (5.05 | )% | 8.35 | % | 9.25 | % | 5.45 | % | ||||||||||||
| Net assets, end of year (in 000’s) |
$ | 98,018 | $ | 74,220 | $ | 55,138 | $ | 22,273 | $ | 8,385 | ||||||||||||
| Ratio of net expenses to average net assets before interest expense |
1.74 | % | 1.74 | % | 1.74 | % | 1.74 | % | 1.74 | % | ||||||||||||
| Ratio of net expenses to average net assets after interest expense |
1.84 | % | 1.94 | % | 2.63 | % | 2.49 | % | 2.56 | % | ||||||||||||
| Ratio of total expenses to average net assets after interest expense |
2.12 | % | 2.03 | % | 2.68 | % | 2.75 | % | 3.23 | % | ||||||||||||
| Ratio of net investment income to average net assets |
2.33 | % | 3.16 | % | 4.10 | % | 3.35 | % | 4.48 | % | ||||||||||||
| Portfolio turnover rate(c) |
73 | % | 53 | % | 65 | % | 78 | % | 11 | % | ||||||||||||
| (a) | Calculated based on the average shares outstanding methodology. |
| (b) | Assumes investment at the NAV at the beginning of the year, reinvestment of all dividends and distributions, a complete repurchase of the investment at the NAV at the end of the year and no sales or repurchase charges (if any). Total returns would be reduced if a sales or repurchase charge was taken into account. Returns do not reflect the impact of taxes to shareholders relating to Fund distributions or the repurchase of Fund shares. |
| (c) | The Fund’s portfolio turnover rate is calculated in accordance with regulatory requirements, without regard to transactions involving short term investments and certain derivatives. If such transactions were included, the Fund’s portfolio turnover rate may be higher. |
| 18 | The accompanying notes are an integral part of these consolidated financial statements. |
GOLDMAN SACHS REAL ESTATE DIVERSIFIED INCOME FUND
Consolidated Financial Highlights (continued)
Selected Share Data for a Share Outstanding Throughout Each Period
| Goldman Sachs Real Estate Diversified Income Fund | ||||||||||||||||||||||
| Class L Shares | ||||||||||||||||||||||
| Year Ended September 30, | Period Ended September 30, 2017(a) |
|||||||||||||||||||||
| 2021 | 2020 | 2019 | 2018 | |||||||||||||||||||
| Per Share Data | ||||||||||||||||||||||
| Net asset value, beginning of period |
$ | 9.39 | $ | 10.69 | $ | 10.48 | $ | 10.20 | $ | 10.22 | ||||||||||||
| Net investment income(b) |
0.18 | 0.27 | 0.38 | 0.30 | 0.26 | |||||||||||||||||
| Net realized and unrealized gain (loss) |
1.46 | (0.89 | ) | 0.40 | 0.55 | (0.14 | )(c) | |||||||||||||||
| Total from investment operations |
1.64 | (0.62 | ) | 0.78 | 0.85 | 0.12 | ||||||||||||||||
| Distributions to shareholders from net investment income |
(0.31 | ) | (0.20 | ) | (0.24 | ) | (0.22 | ) | (0.05 | ) | ||||||||||||
| Distributions to shareholders from net realized gains |
(0.26 | ) | (0.30 | ) | (0.20 | ) | (0.15 | ) | (0.02 | ) | ||||||||||||
| Distributions to shareholders from return of capital |
— | (0.18 | ) | (0.13 | ) | (0.20 | ) | (0.07 | ) | |||||||||||||
| Total distributions |
(0.57 | ) | (0.68 | ) | (0.57 | ) | (0.57 | ) | (0.14 | ) | ||||||||||||
| Net asset value, end of period |
$ | 10.46 | $ | 9.39 | $ | 10.69 | $ | 10.48 | $ | 10.20 | ||||||||||||
| Total Return(d) | 17.93 | % | (5.46 | )% | 7.79 | % | 8.72 | % | 1.22 | % | ||||||||||||
| Net assets, end of period (in 000’s) |
$ | 5,919 | $ | 5,538 | $ | 10,402 | $ | 4,613 | $ | 836 | ||||||||||||
| Ratio of net expenses to average net assets before interest expense |
2.24 | % | 2.24 | % | 2.24 | % | 2.24 | % | 2.24 | %(e) | ||||||||||||
| Ratio of net expenses to average net assets after interest expense |
2.34 | % | 2.44 | % | 3.13 | % | 2.99 | % | 3.07 | %(e) | ||||||||||||
| Ratio of total expenses to average net assets after interest expense |
2.59 | % | 2.54 | % | 3.17 | % | 3.22 | % | 3.83 | %(e) | ||||||||||||
| Ratio of net investment income to average net assets |
1.76 | % | 2.71 | % | 3.60 | % | 2.91 | % | 11.62 | %(e) | ||||||||||||
| Portfolio turnover rate(f) |
73 | % | 53 | % | 65 | % | 78 | % | 11 | % | ||||||||||||
| (a) | The Fund’s Class L commenced operations on July 10, 2017. |
| (b) | Calculated based on the average shares outstanding methodology. |
| (c) | Realized and unrealized losses per share do not correlate to the aggregate of the net realized and unrealized gains on the Statement of Operations for the period ended September 30, 2017, primarily due to the timing of sales and repurchases of the Fund’s shares in relation to fluctuating market values for the Fund’s portfolio. |
| (d) | Assumes investment at the NAV at the beginning of the period, reinvestment of all dividends and distributions, a complete repurchase of the investment at the NAV at the end of the period and no sales or repurchase charges (if any). Total returns would be reduced if a sales or repurchase charge was taken into account. Returns do not reflect the impact of taxes to shareholders relating to Fund distributions or the repurchase of Fund shares. Total returns for periods less than one full year are not annualized. |
| (e) | Annualized. |
| (f) | The Fund’s portfolio turnover rate is calculated in accordance with regulatory requirements, without regard to transactions involving short term investments and certain derivatives. If such transactions were included, the Fund’s portfolio turnover rate may be higher. |
| The accompanying notes are an integral part of these consolidated financial statements. | 19 |
GOLDMAN SACHS REAL ESTATE DIVERSIFIED INCOME FUND
Consolidated Financial Highlights (continued)
Selected Share Data for a Share Outstanding Throughout Each Year
| Goldman Sachs Real Estate Diversified Income Fund | ||||||||||||||||||||||
| Class W Shares | ||||||||||||||||||||||
| Year Ended September 30, | ||||||||||||||||||||||
| 2021 | 2020 | 2019 | 2018 | 2017 | ||||||||||||||||||
| Per Share Data | ||||||||||||||||||||||
| Net asset value, beginning of year |
$ | 9.52 | $ | 10.85 | $ | 10.63 | $ | 10.35 | $ | 10.41 | ||||||||||||
| Net investment income(a) |
0.21 | 0.31 | 0.41 | 0.31 | 0.39 | |||||||||||||||||
| Net realized and unrealized gain (loss) |
1.49 | (1.92 | ) | 0.42 | 0.58 | 0.17 | ||||||||||||||||
| Total from investment operations |
1.70 | (0.61 | ) | 0.83 | 0.89 | 0.56 | ||||||||||||||||
| Distributions to shareholders from net investment income |
(0.34 | ) | (0.24 | ) | (0.26 | ) | (0.23 | ) | (0.30 | ) | ||||||||||||
| Distributions to shareholders from net realized gains |
(0.26 | ) | (0.30 | ) | (0.21 | ) | (0.16 | ) | (0.12 | ) | ||||||||||||
| Distributions to shareholders from return of capital |
— | (0.18 | ) | (0.14 | ) | (0.22 | ) | (0.20 | ) | |||||||||||||
| Total distributions |
(0.60 | ) | (0.72 | ) | (0.61 | ) | (0.61 | ) | (0.62 | ) | ||||||||||||
| Net asset value, end of year |
$ | 10.62 | $ | 9.52 | $ | 10.85 | $ | 10.63 | $ | 10.35 | ||||||||||||
| Total Return(b) | 18.28 | % | (5.31 | )% | 8.13 | % | 8.95 | % | 5.64 | % | ||||||||||||
| Net assets, end of year (in 000’s) |
$ | 40,617 | $ | 47,709 | $ | 92,006 | $ | 69,400 | $ | 56,427 | ||||||||||||
| Ratio of net expenses to average net assets before interest expense |
1.99 | % | 1.99 | % | 1.99 | % | 1.99 | % | 2.09 | %(c) | ||||||||||||
| Ratio of net expenses to average net assets after interest expense |
2.10 | % | 2.19 | % | 2.84 | % | 2.76 | % | 2.83 | % | ||||||||||||
| Ratio of total expenses to average net assets after interest expense |
2.33 | % | 2.23 | % | 2.88 | % | 2.96 | % | 3.06 | % | ||||||||||||
| Ratio of net investment income to average net assets |
2.02 | % | 2.99 | % | 3.85 | % | 3.01 | % | 3.79 | % | ||||||||||||
| Portfolio turnover rate(d) |
73 | % | 53 | % | 65 | % | 78 | % | 11 | % | ||||||||||||
| (a) | Calculated based on the average shares outstanding methodology. |
| (b) | Assumes investment at the NAV at the beginning of the year, reinvestment of all dividends and distributions, a complete repurchase of the investment at the NAV at the end of the year and no sales or repurchase charges (if any). Total returns would be reduced if a sales or repurchase charge was taken into account. Returns do not reflect the impact of taxes to shareholders relating to Fund distributions or the repurchase of Fund shares. |
| (c) | Effective January 5, 2017, the annual expense limitation changed from 2.49% to 1.99%. |
| (d) | The Fund’s portfolio turnover rate is calculated in accordance with regulatory requirements, without regard to transactions involving short term investments and certain derivatives. If such transactions were included, the Fund’s portfolio turnover rate may be higher. |
| 20 | The accompanying notes are an integral part of these consolidated financial statements. |
GOLDMAN SACHS REAL ESTATE DIVERSIFIED INCOME FUND
Consolidated Financial Highlights (continued)
Selected Share Data for a Share Outstanding Throughout the Period
| Goldman Sachs Real Estate Diversified Income Fund |
||||||
| Class P Shares | ||||||
| Period Ended September 30, 2021(a) |
||||||
| Per Share Data | ||||||
| Net asset value, beginning of period |
$ | 10.63 | ||||
| Net investment income(b) |
0.05 | |||||
| Net realized and unrealized gain |
0.41 | |||||
| Total from investment operations |
0.46 | |||||
| Distributions to shareholders from net investment income |
(0.09 | ) | ||||
| Distributions to shareholders from net realized gains |
(0.07 | ) | ||||
| Total distributions |
(0.16 | ) | ||||
| Net asset value, end of period |
$ | 10.93 | ||||
| Total Return(c) | 4.31 | % | ||||
| Net assets, end of period (in 000’s) |
$ | 54,212 | ||||
| Ratio of net expenses to average net assets before interest expense |
1.74 | %(d) | ||||
| Ratio of net expenses to average net assets after interest expense |
1.81 | %(d) | ||||
| Ratio of total expenses to average net assets after interest expense |
2.61 | %(d) | ||||
| Ratio of net investment income to average net assets |
1.81 | %(d) | ||||
| Portfolio turnover rate(e) |
73 | % | ||||
| (a) | The Fund’s Class P Shares commenced operations on June 29, 2021. |
| (b) | Calculated based on the average shares outstanding methodology. |
| (c) | Assumes investment at the NAV at the beginning of the period, reinvestment of all dividends and distributions, a complete repurchase of the investment at the NAV at the end of the period and no sales or repurchase charges (if any). Total returns would be reduced if a sales or repurchase charge was taken into account. Returns do not reflect the impact of taxes to shareholders relating to Fund distributions or the repurchase of Fund shares. Total returns for periods less than one full year are not annualized. |
| (d) | Annualized. |
| (e) | The Fund’s portfolio turnover rate is calculated in accordance with regulatory requirements, without regard to transactions involving short term investments and certain derivatives. If such transactions were included, the Fund’s portfolio turnover rate may be higher. |
| The accompanying notes are an integral part of these consolidated financial statements. | 21 |
GOLDMAN SACHS REAL ESTATE DIVERSIFIED INCOME FUND
Consolidated Notes to Financial Statements
September 30, 2021
| 1. ORGANIZATION |
Goldman Sachs Real Estate Diversified Income Fund (the “Fund”), is a Delaware statutory trust registered under the Investment Company Act of 1940 (the “Act”), as amended, as a diversified, closed-end management investment company and is structured as an “interval fund,” a type of fund which, in order to provide some liquidity to shareholders, makes quarterly offers to repurchase a percentage of its outstanding shares at NAV, pursuant to Rule 23c-3 under the Act. The Fund was organized as a Delaware statutory trust on December 2, 2019. The Fund offers six classes of shares: Class A, Class C, Class I, Class L, Class W, and Class P Shares.
Class A and Class L Shares are sold with front-end sales charges of up to 5.75% and 4.25%, respectively. Class A and Class C Shares are sold with contingent deferred sales charges (“CDSC”) of 0.50% and 1.00%, respectively, which are imposed on repurchases made within 12 months of purchase. Class I, Class W, and Class P Shares are not subject to a sales charge.
Goldman Sachs Asset Management, L.P. (“GSAM”), an affiliate of Goldman Sachs & Co. LLC, serves as investment adviser to the Fund pursuant to a management agreement (the “Agreement”) with the Fund.
Pursuant to an Agreement and Plan of Reorganization (the “Reorganization Agreement”) approved by the Fund’s Board of Trustees, all of the assets of the Resource Real Estate Diversified Income Fund (“Predecessor Fund”) were transferred to the Fund in exchange for the assumption of the Predecessor Fund’s stated liabilities by the Fund and shares of beneficial interest of the Fund as of the close of business on May 15, 2020 (the “Reorganization”). Holders of Class A, Class C, Class I, Class L, and Class W Shares of the Predecessor Fund received Class A, Class C, Class I, Class L, and Class W Shares of the Fund. The exchange was a tax-free event to shareholders. The Predecessor Fund was the accounting survivor in the Reorganization, and, as such, the financial statements and financial highlights reflect the financial information of the Predecessor Fund through May 15, 2020. Class D, Class T and Class U Shares of the Predecessor Fund were liquidated prior to the Reorganization.
| 2. SIGNIFICANT ACCOUNTING POLICIES |
The financial statements have been prepared in accordance with accounting principles generally accepted in the United States of America (“GAAP”) and require management to make estimates and assumptions that may affect the reported amounts and disclosures. Actual results may differ from those estimates and assumptions. The Fund is an investment company under GAAP and follows the accounting and reporting guidance applicable to investment companies.
A. Basis of Consolidation for the Fund — DIF Investments LLC, DIF Investments II LLC, and DIF Investments III LLC (each a “Subsidiary” and collectively, the “Subsidiaries”), limited liability companies, were incorporated on February 3, 2020, March 12, 2020, and June 30, 2021, respectively, and are currently wholly-owned subsidiaries of the Fund. The Subsidiaries act as investment vehicles for the Fund to enable the Fund to gain exposure to certain types of private real estate investments. Under the Amended and Restated Limited Liability Company Agreement of each Subsidiary, shares issued by the Subsidiary confer upon its member the right to participate in the profits or assets of the Subsidiary. All inter-fund balances and transactions have been eliminated in consolidation. As of September 30, 2021, the Fund’s net assets were $351,179,524, of which, $91,239,447, or 26%, are represented by DIF Investments LLC’s net assets; $78,748,639, or 22%, are represented by DIF Investments II LLC’s net assets; and $11,664,714, or 3%, are represented by DIF Investments III LLC’s net assets.
B. Investment Valuation — The Fund’s valuation policy is to value investments at fair value.
C. Investment Income and Investments — Investment income includes interest income, dividend income, net of any foreign withholding taxes, and less any amounts reclaimable. Interest income is accrued daily and adjusted for amortization of premiums and accretion of discounts. Dividend income is recognized on ex-dividend date or, for certain foreign securities, as soon as such information is obtained subsequent to the ex-dividend date. Non-cash dividends, if any, are recorded at the fair market value of the securities received. Investment transactions are reflected on trade date with the exception of capital calls, which are recorded on due date. Realized gains and losses are calculated using identified cost. Investment transactions are recorded on the following business day for daily net asset value (“NAV”) calculations. Distributions received from the Fund’s investments in United States (“U.S.”) real estate investment trusts (“REITs”) may be characterized as ordinary income, net capital gain and/or a return of capital. A return of capital is recorded by the Fund as a reduction to the cost basis of the REIT.
22
GOLDMAN SACHS REAL ESTATE DIVERSIFIED INCOME FUND
| 2. SIGNIFICANT ACCOUNTING POLICIES (continued) |
D. Class Allocations and Expenses — Expenses incurred by the Fund, which may not specifically relate to the Fund, may be shared with other registered investment companies having management agreements with GSAM or its affiliates, as appropriate. These expenses are allocated to the Fund on a straight-line and/or pro-rata basis depending upon the nature of the expenses and are accrued daily. Class specific expenses, where applicable, are borne by the respective share classes and include Distribution, Service and Transfer Agency fees.
E. Federal Taxes and Distributions to Shareholders — It is the Fund’s policy to comply with the requirements of the Internal Revenue Code of 1986, as amended (the “Code”), applicable to regulated investment companies and to distribute each year substantially all of its investment company taxable income and capital gains to its shareholders. Accordingly, the Fund is not required to make any provisions for the payment of federal income tax. Distributions to shareholders are recorded on the ex- dividend date. The Fund currently intends to make regular quarterly cash distributions of all or a portion of its net investment income to shareholders. The Fund will pay shareholders at least annually all or substantially all of its net investment income after the payment of interest, fees or dividends, if any, owed with respect to any forms of leverage used by the Fund. The Fund intends to pay any capital gains distributions at least annually. In order to permit the Fund to maintain more stable quarterly distributions, the distributions paid by the Fund may be more or less than the amount of net distributable earnings actually earned by the Fund. These distributions could include a return of a shareholder’s invested capital which would reduce the Fund’s NAV. The Fund estimates that only a portion of the distributions paid to shareholders will be treated as dividend income. The remaining portion of the Fund’s distribution, which may be significant, is expected to be a return of capital. These estimates are based on the Fund’s operating results during the period, and their final federal income tax characterization that may differ. The characterization of distributions to shareholders for financial reporting purposes is determined in accordance with federal income tax rules, which may differ from GAAP.
Certain of the Fund’s consolidated subsidiaries are subject to U.S. federal and state corporate level income taxes. Income tax expense, if any, is included under Other expenses in the Consolidated Statement of Operations.
| 3. INVESTMENTS AND FAIR VALUE MEASUREMENTS |
U.S. GAAP defines the fair value of a financial instrument as the amount that would be received to sell an asset or paid to transfer a liability in an orderly transaction between market participants at the measurement date (i.e., the exit price); the Fund’s policy is to use the market approach. GAAP establishes a fair value hierarchy that prioritizes the inputs to valuation techniques used to measure fair value. The hierarchy gives the highest priority to unadjusted quoted prices in active markets for identical assets or liabilities (Level 1 measurements) and the lowest priority to unobservable inputs (Level 3 measurements). The level in the fair value hierarchy within which the fair value measurement in its entirety falls shall be determined based on the lowest level input that is significant to the fair value measurement in its entirety. The levels used for classifying investments are not necessarily an indication of the risk associated with investing in these investments. The three levels of the fair value hierarchy are described below:
Level 1 — Unadjusted quoted prices in active markets that are accessible at the measurement date for identical, unrestricted assets or liabilities;
Level 2 — Quoted prices in markets that are not active or financial instruments for which significant inputs are observable (including, but not limited to, quoted prices for similar investments, interest rates, foreign exchange rates, volatility and credit spreads), either directly or indirectly;
Level 3 — Prices or valuations that require significant unobservable inputs (including GSAM’s assumptions in determining fair value measurement).
The Board of Trustees (“Trustees”) has approved Valuation Procedures that govern the valuation of the portfolio investments held by the Fund, including investments for which market quotations are not readily available. The Trustees have delegated to GSAM day-to-day responsibility for implementing and maintaining internal controls and procedures related to the valuation of the Fund’s investments. To assess the continuing appropriateness of pricing sources and methodologies, GSAM regularly performs price
23
GOLDMAN SACHS REAL ESTATE DIVERSIFIED INCOME FUND
Consolidated Notes to Financial Statements (continued)
September 30, 2021
| 3. INVESTMENTS AND FAIR VALUE MEASUREMENTS (continued) |
verification procedures and issues challenges as necessary to third party pricing vendors or brokers, and any differences are reviewed in accordance with the Valuation Procedures.
A. Level 1 and Level 2 Fair Value Investments — The valuation techniques and significant inputs used in determining the fair values for investments classified as Level 1 and Level 2 are as follows:
Equity Securities — Equity securities traded on a United States (“U.S.”) securities exchange or the NASDAQ system, or those located on certain foreign exchanges, including but not limited to the Americas, are valued daily at their last sale price or official closing price on the principal exchange or system on which they are traded. If there is no sale or official closing price or such price is believed by GSAM to not represent fair value, equity securities will be valued at the valid closing bid price for long positions and at the valid closing ask price for short positions (i.e. where there is sufficient volume, during normal exchange trading hours). If no valid bid/ask price is available, the equity security will be valued pursuant to the Valuation Procedures approved by the Trustees and consistent with applicable regulatory guidance. To the extent these investments are actively traded, they are classified as Level 1 of the fair value hierarchy, otherwise they are generally classified as Level 2. Certain equity securities containing unique attributes may be classified as Level 2.
Unlisted equity securities for which market quotations are available are valued at the last sale price on the valuation date, or if no sale occurs, at the last bid price for long positions or the last ask price for short positions, and are generally classified as Level 2.
Money Market Funds — Investments in the Goldman Sachs Financial Square Government Fund (“Underlying Fund”) are valued at the NAV on the day of valuation. These investments are generally classified as Level 1 of the fair value hierarchy. For information regarding an Underlying Fund’s accounting policies and investment holdings, please see the Underlying Fund’s shareholder report.
Derivative Contracts — A derivative is an instrument whose value is derived from underlying assets, indices, reference rates or a combination of these factors. The Fund enters into derivative transactions to hedge against changes in interest rates, securities prices, and/or currency exchange rates, to increase total return, or to gain access to certain markets or attain exposure to other underliers. For financial reporting purposes, cash collateral that has been pledged to cover obligations of the Fund and cash collateral received, if any, is reported separately on the Statement(s) of Assets and Liabilities as receivables/payables for collateral on certain derivatives contracts. Non-cash collateral pledged by the Fund, if any, is noted in the Consolidated Schedule of Investments.
Exchange-traded derivatives, including futures and options contracts, are generally valued at the last sale or settlement price on the exchange where they are principally traded. Exchange-traded options without settlement prices are generally valued at the midpoint of the bid and ask prices on the exchange where they are principally traded (or, in the absence of two-way trading, at the last bid price for long positions and the last ask price for short positions). Exchange-traded derivatives typically fall within Level 1 of the fair value hierarchy. Over-the-counter (“OTC”) and centrally cleared derivatives are valued using market transactions and other market evidence, including market-based inputs to models, calibration to market-clearing transactions, broker or dealer quotations, or other alternative pricing sources. Where models are used, the selection of a particular model to value OTC and centrally cleared derivatives depends upon the contractual terms of, and specific risks inherent in, the instrument, as well as the availability of pricing information in the market. Valuation models require a variety of inputs, including contractual terms, market prices, yield curves, credit curves, measures of volatility, voluntary and involuntary prepayment rates, loss severity rates and correlations of such inputs. For OTC and centrally cleared derivatives that trade in liquid markets, model inputs can generally be verified and model selection does not involve significant management judgment. OTC and centrally cleared derivatives are classified within Level 2 of the fair value hierarchy when significant inputs are corroborated by market evidence.
i. Options Contracts — When the Fund writes call or put options contracts, an amount equal to the premium received is recorded as a liability and is subsequently marked-to-market to reflect the current value of the option written. Swaptions are options on swap contracts.
Upon the purchase of a call or put option by the Fund, the premium paid is recorded as an investment and subsequently marked-to-market to reflect the current value of the option. Certain options may be purchased with premiums to be determined on a future date. The premiums for these options are based upon implied volatility parameters at specified terms.
24
GOLDMAN SACHS REAL ESTATE DIVERSIFIED INCOME FUND
| 3. INVESTMENTS AND FAIR VALUE MEASUREMENTS (continued) |
B. Level 3 Fair Value Investments — To the extent that significant inputs to valuation models and other alternative pricing sources are unobservable, or if quotations are not readily available, or if GSAM believes that such quotations do not accurately reflect fair value, the fair value of the Fund’s investments may be determined under Valuation Procedures approved by the Trustees. GSAM, consistent with its procedures and applicable regulatory guidance, may make an adjustment to the most recent valuation prices of either domestic or foreign securities in light of significant events to reflect what it believes to be the fair value of the securities at the time of determining the Fund’s NAV. To the extent investments are valued using single source broker quotations obtained directly from the broker or passed through from third party pricing vendors, such investments are classified as Level 3 investments. The valuation techniques and significant inputs used in determining the fair values for investments classified as Level 3 are as follows:
Public Non-Traded REITs — Public Non-Traded Real Estate Investment Trusts (“Public Non-Traded REITs”) do not report NAVs on a timely basis and therefore cannot be valued using the practical expedient methodology. GSAM determines the fair value of Public Non-Traded REITs by adjusting the most recent NAV for each Public Non-Traded REIT, as necessary, by the change in a relevant proxy that the Valuation Committee has deemed to be representative of the market.
C. Other Fair Valuation Investments — Prices or valuations that require significant unobservable inputs (including assumptions in determining fair value measurement).
The fair valuation technique depends on the investment characteristics and the availability of observable inputs. Investments are classified within the level of the lowest significant input considered in determining fair value. GSAM uses NAV as its measure of fair values for investments in LP/LLC interests when (i) the investment does not have a readily determinable fair value and (ii) the NAV of the investment is calculated in a manner consistent with the measurement principles of investment company accounting, including measurement of the underlying investments at fair value. In evaluating the level at which the investments have been classified, GSAM has assessed factors including, but not limited to, price transparency. An investment in LP/LLC interests using NAV as its measure of fair value is excluded from the fair value hierarchy.
The fair value technique and type of valuation input varies by investment type as follows:
Private REITs — Private Real Estate Investment Trusts (“Private REITs”) report their investment assets at fair value, and typically report a NAV per share on a calendar quarter basis. In accordance with Accounting Standards Codification (“ASC”) 820-10, the Fund has elected to apply the practical expedient methodology and to value its investments in Private REITs at their respective NAVs typically at each quarter. For non-calendar quarter days, GSAM estimates the fair value of each Private REIT by adjusting the most recent NAV for each Private REIT, as necessary, by the change in a relevant proxy that the Valuation Committee has deemed to be representative of the market.
Private Investment Funds — Private investment funds (“Private Investment Funds”) measure their investment assets at fair value, and typically report a NAV per share on a calendar quarterly basis. In accordance with ASC 820-10, the Fund has elected to apply the practical expedient methodology and to value its investments in Private Investment Funds at their respective NAVs typically at each quarter. For non-calendar quarter days, GSAM determines the fair value of each Private Investment Fund by adjusting the most recent NAV for each Private Investment Fund, as necessary, by the change in a relevant proxy that the Valuation Committee has deemed to be representative of the market.
25
GOLDMAN SACHS REAL ESTATE DIVERSIFIED INCOME FUND
Consolidated Notes to Financial Statements (continued)
September 30, 2021
| 3. INVESTMENTS AND FAIR VALUE MEASUREMENTS (continued) |
D. Fair Value Hierarchy — The following is a summary of the Fund’s investments classified in the fair value hierarchy as of September 30, 2021:
| REAL ESTATE DIVERSIFIED INCOME FUND | ||||||||||||||||
| Investment Type | Level 1 | Level 2 | Level 3 | Total | ||||||||||||
| Assets | ||||||||||||||||
| Common Stock and/or Other Equity Investments(a) |
||||||||||||||||
| North America |
$ | 105,801,156 | $ | 23,797,900 | $ | 1,987,743 | $ | 131,586,799 | ||||||||
| Investment Company |
40,544,769 | — | — | 40,544,769 | ||||||||||||
| Subtotal | $ | 146,345,925 | $ | 23,797,900 | $ | 1,987,743 | $ | 172,131,568 | ||||||||
| Investments measured at NAV |
179,348,925 | |||||||||||||||
| Total | $ | 351,480,493 | ||||||||||||||
| (a) | Amounts are disclosed by continent to highlight the impact of time zone differences between local market close and the calculation of net asset value. Security valuations are based on the principal exchange or system on which they are traded, which may differ from country of domicile. |
The following is a reconciliation of Level 3 investments for the fiscal year ended September 30, 2021:
| Public Non-Traded Real Estate Investment Trusts |
||||
| Beginning Balance as of October 1, 2020 |
$ | 1,521,516 | ||
| Realized gain (loss) |
— | |||
| Net change in unrealized gain (loss) relating to instruments still held at reporting date |
466,227 | |||
| Purchases |
— | |||
| Sales |
— | |||
| Transfers in (out) of Level 3 |
— | |||
| Ending Balance as of September 30, 2021 | $ | 1,987,743 | ||
Significant unobservable valuation inputs for material Level 3 investments as of September 30, 2021 are as follows:
| Fair Value at 9/30/2021 |
Valuation Techniques |
Unobservable Input |
Range(%) | Weighted Average(%)* | ||||||
| Public Non-Traded Real Estate Investment Trusts |
$1,987,743 | Net Asset Value | Relevant Proxy | 0.61-43.63 | 29.44 |
| * | Average was calculated using a weighted average based on investment fair values. |
A change to the unobservable input may result in a significant change to the value of the investments as follows:
| Unobservable Input |
Impact to Value if Input Increases | Impact to Value if Input Decreases | ||
| Relevant Proxy |
Increase |
Decrease |
The relevant proxies are comprised of comparable real estate investments and/or related metrics. For further information regarding security characteristics, see the Consolidated Schedule of Investments.
| 4. INVESTMENTS IN DERIVATIVES |
The following tables set forth, by certain risk types, the Fund’s gains (losses) related to these derivatives and their indicative volumes for the fiscal year ended September 30, 2021. These gains (losses) should be considered in the context that these derivative contracts may have been executed to create investment opportunities and/or economically hedge certain investments,
26
GOLDMAN SACHS REAL ESTATE DIVERSIFIED INCOME FUND
| 4. INVESTMENTS IN DERIVATIVES (continued) |
and accordingly, certain gains (losses) on such derivative contracts may offset certain (losses) gains attributable to investments. These gains (losses) are included in “Net realized gain (loss)” or “Net change in unrealized gain (loss)” on the Consolidated Statement of Operations:
| REAL ESTATE DIVERSIFIED INCOME FUND | ||||||
| Risk | Consolidated Statement of Operations | Net Realized Gain (Loss) |
||||
| Equity |
Net realized gain (loss) from purchased options | $ | (488,467 | ) | ||
| Equity |
Net realized gain (loss) from written options | $ | 757,089 | |||
In order to better define its contractual rights and to secure rights that will help the Fund mitigate its counterparty risk, the Fund may enter into an International Swaps and Derivatives Association, Inc. Master Agreement (“ISDA Master Agreement”) or similar agreement with its derivatives counterparties. An ISDA Master Agreement is a bilateral agreement between the Fund and a counterparty that governs OTC derivatives (including forward foreign currency exchange contracts, and certain options and swaps), and typically contains, among other things, collateral posting terms and netting provisions in the event of a default and/or termination event. The provisions of the ISDA Master Agreement typically permit a single net payment in the event of a default (close-out netting) or similar event, including the bankruptcy or insolvency of the counterparty.
Collateral and margin requirements differ between exchange traded derivatives and OTC derivatives. Margin requirements are established by the broker or clearing house for exchange-traded and centrally cleared derivatives (financial futures contracts, options and centrally cleared swaps) pursuant to governing agreements for those instrument types. Brokers can ask for margin in excess of the minimum in certain circumstances. Collateral terms are contract-specific for OTC derivatives. For derivatives traded under an ISDA Master Agreement, the collateral requirements are typically calculated by netting the marked to market amount for each transaction under such agreement and comparing that amount to the value of any collateral currently pledged by the Fund and the counterparty. Additionally, the Fund may be required to post initial margin to the counterparty, the terms of which would be outlined in the confirmation of the OTC transaction.
Generally, the amount of collateral due from or to a counterparty must exceed a minimum transfer amount threshold before a transfer is required to be made. To the extent amounts due to the Fund from its counterparties are not fully collateralized, contractually or otherwise, the Fund bears the risk of loss from counterparty nonperformance. The Fund attempts to mitigate counterparty risk by only entering into agreements with counterparties that the Investment Adviser believes to be of good standing and by monitoring the financial stability of those counterparties.
Additionally, the netting of assets and liabilities and the offsetting of collateral pledged or received are based on contractual netting/set-off provisions in the ISDA Master Agreement or similar agreements. However, in the event of a default or insolvency of a counterparty, a court could determine that such rights are not enforceable due to the restrictions or prohibitions against the right of setoff that may be imposed in accordance with a particular jurisdiction’s bankruptcy or insolvency laws.
For the fiscal year ended September 30, 2021, the relevant values for each derivative type was as follows:
| Average Notional Amounts(1) | ||||||||
| Fund | Purchased Options |
Written Options |
||||||
|
Real Estate Diversified Income Fund |
$2,431,610 | $ | 2,231,231 | |||||
| (1) | Amounts disclosed represent average notional amounts for purchased options and written options, based on absolute values, which is indicative of volume of this derivative type, for the months that the Fund held such derivatives during the fiscal year ended September 30, 2021. |
| 5. AGREEMENTS AND AFFILIATED TRANSACTIONS |
A. Management Agreement — Under the Agreement, GSAM manages the Fund, subject to the general supervision of the Trustees.
27
GOLDMAN SACHS REAL ESTATE DIVERSIFIED INCOME FUND
Consolidated Notes to Financial Statements (continued)
September 30, 2021
| 5. AGREEMENTS AND AFFILIATED TRANSACTIONS (continued) |
As compensation for the services rendered pursuant to the Agreement, the assumption of the expenses related thereto and administration of the Fund’s business affairs, including providing facilities, GSAM is entitled to a management fee, accrued daily and paid monthly, equal to an annual percentage rate of 1.25% of the Fund’s average daily net assets. The effective net management rate was 1.24% of the Fund’s average daily net assets.
The Fund invests in Institutional Shares of the Goldman Sachs Financial Square Government Fund, which is an affiliated Underlying Fund. GSAM has agreed to waive a portion of its management fee payable by the Fund in an amount equal to the management fee it earns as an investment adviser to the affiliated Underlying Fund in which the Fund invests. For the fiscal year ended September 30, 2021, GSAM waived $21,486 of the Fund’s management fee.
B. Distribution and Service (12b-1) Plan — The Fund, on behalf of its Class A, Class C, Class L and Class W Shares of the Fund, has adopted a Distribution and Service Plan subject to Rule 12b-1 under the Act. Under the Distribution and Service Plan, Goldman Sachs & Co. LLC, which serves as distributor (the “Distributor”), is entitled to a fee accrued daily and paid monthly, for distribution services and personal and account maintenance services, which may then be paid by the Distributor to authorized dealers. These fees are equal to an annual percentage rate of the average daily net assets attributable to Class A, Class C, Class L and Class W Shares of the Fund, as set forth below:
| Share Class | Distribution Services |
Shareholder Services |
Maximum Distribution- Related and Shareholder Services |
|||||||||||
| Class A |
0.25 | % | 0.25 | % | 0.25 | % | ||||||||
| Class C |
0.75 | % | 0.25 | % | 1.00 | % | ||||||||
| Class L |
0.25 | % | 0.25 | % | 0.50 | % | ||||||||
| Class W |
0.25 | % | 0.25 | % | 0.25 | % | ||||||||
C. Distribution Agreement — Goldman Sachs, as Distributor of the shares of the Fund pursuant to a Distribution Agreement, may retain a portion of the Class A and Class L Shares’ front end sales charge and Class A and Class C Shares’ CDSC. During the fiscal year ended September 30, 2021, Goldman Sachs retained $588 for Class A Shares and did not retain any portion of the CDSC for Class C Shares for this Fund.
D. Transfer Agency Agreement — Goldman Sachs also serves as the transfer agent of the Fund for a fee pursuant to the Transfer Agency Agreement. The fees charged for such transfer agency and dividend disbursing services are accrued daily and paid monthly at an annual rate of 0.14% of the Fund’s average daily net assets.
E. Other Expense Agreements and Affiliated Transactions — GSAM has agreed to reduce or limit certain “Other Expenses” of the Fund (excluding acquired fund fees and expenses, transfer agency fees and expenses, distribution and service fees, as applicable, taxes, interest, credit facility commitment fees, brokerage fees, expenses of shareholder meetings, litigation and indemnification and extraordinary expenses) to the extent such expenses exceed, on an annual basis, a percentage rate of the average daily net assets of the Fund. Such Other Expense reimbursements, if any, are accrued daily and paid monthly. In addition, the Fund is not obligated to reimburse GSAM for prior fiscal year expense reimbursements, if any. The Other Expense limitations as an annual percentage rate of average daily net assets for the Fund is 0.354%. These Other Expense limitations will remain in place through at least June 29, 2022 for Class P Shares and January 27, 2022 for the other share classes, and prior to such dates GSAM may not terminate the arrangements without the approval of the Trustees. In addition, the Fund has entered into certain offset arrangements with the transfer agent, which may result in a reduction of the Fund’s expenses and are received irrespective of the application of the “Other Expense” limitations described above. Such Other Expense reimbursements, if any, are accrued daily and paid monthly and are disclosed in the Consolidated Statement of Operations.
28
GOLDMAN SACHS REAL ESTATE DIVERSIFIED INCOME FUND
| 5. AGREEMENTS AND AFFILIATED TRANSACTIONS (continued) |
For the fiscal year ended September 30, 2021 these expense reductions, including any fee waivers and Other Expense reimbursements, were as follows:
| Management Fee Waiver |
Other Expense Reimbursements |
Total Expense Reductions |
||||||||
| $ | 21,486 | $ | 723,963 | $ | 745,449 | |||||
F. Other Transactions with Affiliates — For the fiscal year ended September 30, 2021, Goldman Sachs earned $2,717 in brokerage commissions from portfolio transactions, on behalf of the Fund.
The following table provides information about the Fund’s investments in the Underlying Fund as of and for the fiscal year ended September 30, 2021:
| Underlying Fund | Beginning Value as of September 30, 2020 |
Purchases at Cost |
Proceeds from Sales |
Ending Value as of September 30, 2021 |
Shares as of September 30, 2021 |
Dividend Income |
||||||||||||||||
|
Goldman Sachs Financial Square Government Fund — Institutional Shares |
$9,993,327 | $ | 253,660,519 | $ | (223,109,077 | ) | $ | 40,544,769 | 40,544,769 | $ | 4,333 | |||||||||||
G. Financing Agreement — The Fund has entered into secured revolving bank line of credit facilities (each a “Credit Facility” and collectively the “Credit Facilities”) with major U.S. financial institutions for the purpose of investment purchases subject to the limitations of the Act for borrowings. The Credit Facilities provide for borrowings in an aggregate amount up to $55,000,000 for the Fund. Borrowings under the Credit Facilities, which are secured by certain assets of the Fund, bear interest. The interest rates are based on variable rates (i.e., LIBOR) plus market spreads. The Fund currently pays unused commitment fees of 0.20% - 0.75% per annum. Interest is accrued daily and paid quarterly.
The Fund had an average outstanding balance and weighted average annual interest rate for the period of $2,013,699 and 1.21%, respectively. As of September 30, 2021, there were no outstanding borrowings under the Credit Facilities. Prior to January 8, 2021, the Credit Facilities provided for borrowings in an aggregate amount up to $35,000,000.
| 6. PORTFOLIO SECURITIES TRANSACTIONS AND UNFUNDED COMMITMENTS |
The cost of purchases and proceeds from sales and maturities of long-term securities for the fiscal year ended September 30, 2021, were $215,544,756 and $197,250,049, respectively.
As of September 30, 2021, other than the unfunded commitments for investments currently held as of the reporting date that are disclosed in the Consolidated Schedule of Investments footnote disclosures, the Fund also had an unfunded commitment of $15,000,000 relating to the TA Realty Core Property Fund, LP, a Private Investment Fund. The value of unfunded commitments for investments currently held as of September 30, 2021 approximates fair value.
| 7. TAX INFORMATION |
The tax character of distributions paid during the fiscal years ended September 30, 2021 and 2020 was as follows:
| 2021 | 2020 | |||||||||
| Distributions paid from: |
||||||||||
| Ordinary Income |
$ | 9,482,563 | $ | 7,555,464 | ||||||
|
Net long-term capital gains |
7,555,806 | 9,459,525 | ||||||||
| Total taxable distributions |
$ | 17,038,369 | $ | 17,014,989 | ||||||
| Tax return of capital |
$ | — | $ | 5,688,027 | ||||||
29
GOLDMAN SACHS REAL ESTATE DIVERSIFIED INCOME FUND
Consolidated Notes to Financial Statements (continued)
September 30, 2021
| 7. TAX INFORMATION (continued) |
As of September 30, 2021, the components of accumulated earnings (losses) on a tax-basis were as follows:
| Real Estate Diversified Income Fund |
||||
| Timing differences (Qualified Late Year Ordinary Loss Deferral) |
||||
| Late Year Ordinary Loss Deferral |
$ | (2,245,420 | ) | |
| Unrealized gains (losses) — net |
29,477,221 | |||
| Total accumulated earnings (losses) net |
$ | 27,231,801 | ||
As of September 30, 2021, the Fund’s aggregate security unrealized gains and losses based on cost for U.S. federal income tax purposes were as follows:
| Tax Cost |
$ | 322,249,593 | ||
| Gross unrealized gain |
33,995,163 | |||
| Gross unrealized loss |
(4,517,942 | ) | ||
| Net unrealized gains (losses) on securities |
$ | 29,477,221 |
The difference between GAAP-basis and tax basis unrealized gains (losses) is attributable primarily to wash sales and differences in the tax treatment of partnership investments.
The Fund reclassed $849,530 from paid in capital to distributable earnings for the fiscal year ending September 30, 2021. In order to present certain components of the Fund’s capital accounts on a tax-basis, certain reclassifications have been recorded to the Fund’s accounts. These reclassifications have no impact on the net asset value of the Fund and result primarily from return of capital distributions and differences in the tax treatment of underlying fund investments.
GSAM has reviewed the Fund’s tax positions for all open tax years (the current and prior three years, as applicable) and has concluded that no provision for income tax is required in the Fund’s financial statements. Such open tax years remain subject to examination and adjustment by tax authorities.
| 8. REPURCHASE OFFERS |
The Fund has adopted the following fundamental policies, which cannot be changed without the vote of a majority of Fund shareholders, in order to repurchase its Shares:
| ∎ | On a quarterly basis, in the months of March, June, September and December, the Fund will make an offer to repurchase a designated percentage of the outstanding shares from shareholders (a “Repurchase Offer”), pursuant to Rule 23c-3 under the Act, as it may be amended from time to time. |
| ∎ | The Fund will repurchase only shares that are tendered by the deadline for such repurchase request (“Repurchase Request Deadline”). The Board will establish the Repurchase Request Deadline for each Repurchase Offer, but such date may be revised by the Fund’s officers, in their sole discretion, based on factors such as market conditions, the level of the Fund’s assets and shareholder servicing considerations provided that the Board is notified of this change and the reasons for it. |
| ∎ | There will be a maximum 14 calendar day period (or the next business day if the 14th calendar day is not a business day) between the Repurchase Request Deadline and the day on which shares eligible for repurchase are priced. |
The Fund may also make discretionary repurchase offers in addition to the quarterly Repurchase Offer period once every two years.
30
GOLDMAN SACHS REAL ESTATE DIVERSIFIED INCOME FUND
| 8. REPURCHASE OFFERS (continued) |
Repurchase Offer Amounts. Each quarter, the Fund’s Board, in its sole discretion, will determine the number of shares that the Fund will offer to repurchase (the “Repurchase Offer Amount”) for a particular Repurchase Offer. The Repurchase Offer Amount will be at least 5% but not more than 25% of the total number of shares outstanding on the Repurchase Request Deadline. In connection with any given Repurchase Offer, it is possible that the Fund may offer to repurchase only the minimum amount of 5% of its outstanding Shares on the Repurchase Request Deadline. If shareholders tender more than the Repurchase Offer Amount for a particular Repurchase Offer, the Board may determine to increase the Repurchase Offer Amount by up to an additional 2% of the Shares outstanding on the Repurchase Request Deadline.
During the fiscal year ended September 30, 2021, the Fund completed four quarterly repurchase offers. In these offers, the Fund offered to repurchase up to 5% of the number of its outstanding shares (up to 7% at the discretion of the officers of the Fund) as of the Repurchase Pricing Dates, except for the repurchase offer commencing on June 17, 2021 in which the Fund offered to repurchase up to 7% of the number of its outstanding shares (up to 9% at the discretion of the officers of the Fund). The shareholder repurchase requests received by the Fund in good order by the October 14, 2020, January 13, 2021 and April 14, 2021 Repurchase Request Deadlines exceeded the number of shares of the Fund subject to the repurchase offer; therefore, the Fund repurchased shares on a pro rata basis. Accordingly, the Fund repurchased approximately 34%, 63%, 91% and 100%, respectively, of the total number of shares tendered for repurchase. The result of those repurchase offers were as follows:
| Repurchase Offer #1 | Repurchase Offer #2 | Repurchase Offer #3 | Repurchase Offer #4 | |||||||||||||
| Commencement Date |
September 14, 2020 | December 14, 2020 | March 12, 2021 | June 17, 2021 | ||||||||||||
| Repurchase Request Deadline |
October 14, 2020 | January 13, 2021 | April 14, 2021 | July 14, 2021 | ||||||||||||
| Repurchase Pricing Date |
October 14, 2020 | January 13, 2021 | April 14, 2021 | July 14, 2021 | ||||||||||||
| Shares Tendered for Repurchase |
4,526,351 | 3,359,664 | 2,128,666 | 1,279,365 | ||||||||||||
| Shares Repurchased |
1,539,082 | 2,122,668 | 1,934,426 | 1,279,365 | ||||||||||||
| 9. OTHER RISKS |
The Fund’s risks include, but are not limited to, the following:
Derivatives Risk — The Fund’s use of derivatives may result in loss. Derivative instruments, which may pose risks in addition to and greater than those associated with investing directly in securities, currencies or other instruments, may be illiquid or less liquid, volatile, difficult to price and leveraged so that small changes in the value of the underlying instruments may produce disproportionate losses to the Fund. Derivatives are also subject to counterparty risk, which is the risk that the other party in the transaction will not fulfill its contractual obligation. The use of derivatives is a highly specialized activity that involves investment techniques and risks different from those associated with investments in more traditional securities and instruments. Losses from derivatives can also result from a lack of correlation between changes in the value of derivative instruments and the portfolio assets (if any) being hedged.
Dividend-Paying Investments Risk — The Fund’s investments in dividend-paying securities could cause the Fund to underperform other funds that invest in similar asset classes but employ a different investment style. Securities that pay dividends, as a group, can fall out of favor with the market, causing such securities to underperform securities that do not pay dividends. Depending upon market conditions and political and legislative responses to such conditions, dividend-paying securities that meet the Fund’s investment criteria may not be widely available and/or may be highly concentrated in only a few market sectors. For example, in response to the outbreak of a novel strain of coronavirus (known as COVID-19), the U.S. Government passed the Coronavirus Aid, Relief and Economic Security Act in March 2020, which established loan programs for certain issuers impacted by COVID-19. Among other conditions, borrowers under these loan programs are generally restricted from paying dividends. The adoption of new legislation could further limit or restrict the ability of issuers to pay dividends. To the extent that dividend-paying
31
GOLDMAN SACHS REAL ESTATE DIVERSIFIED INCOME FUND
Consolidated Notes to Financial Statements (continued)
September 30, 2021
| 9. OTHER RISKS (continued) |
securities are concentrated in only a few market sectors, the Fund may be subject to the risks of volatile economic cycles and/or conditions or developments that may be particular to a sector to a greater extent than if its investments were diversified across different sectors. In addition, issuers that have paid regular dividends or distributions to shareholders may not continue to do so at the same level or at all in the future. A sharp rise in interest rates or an economic downturn could cause an issuer to abruptly reduce or eliminate its dividend. This may limit the ability of the Fund to produce current income.
Industry Concentration Risk — The Fund concentrates its investments in the real estate industry, which has historically experienced substantial price volatility. Concentrating Fund investments in a limited number of issuers conducting business in the same industry will subject the Fund to a greater risk of loss as a result of adverse economic, business, political, environmental or other developments than if their investments were diversified across different industries. The value of companies engaged in the real estate industry is affected by (i) changes in general economic and market conditions; (ii) changes in the value of real estate properties; (iii) risks related to local economic conditions, overbuilding and increased competition; (iv) increases in property taxes and operating expenses; (v) changes in zoning laws; (vi) casualty and condemnation losses; (vii) variations in rental income, neighborhood values or the appeal of property to tenants; (viii) the availability of financing and (ix) changes in interest rates and leverage. There are also special risks associated with particular subindustries, or real estate operations generally.
Investments in Other Investment Companies Risk — As a shareholder of another investment company, the Fund will indirectly bear its proportionate share of any net management fees and other expenses paid by such other investment companies, in addition to the fees and expenses regularly borne by the Fund.
Leverage Risk — The Fund may use leverage to seek to achieve its investment objectives. The use of leverage creates an opportunity for increased net investment income dividends, but also creates risks for the investors. There is no assurance that the Fund’s intended leveraging strategy will be successful. Leverage involves risks and special considerations, including the likelihood of greater volatility of NAV, market price and dividend rate than a comparable portfolio without leverage; the risk that fluctuations in interest rates on borrowings and short-term debt or in the interest or dividend rates on any leverage that the Fund must pay will reduce the Fund’s return; the effect of leverage in a declining market, which is likely to cause a greater decline in the NAV than if the Fund were not leveraged, which may result in a greater decline in the market price; and that leverage may increase operating costs, which may reduce total return.
Liquidity Risk — The Fund may make investments that are illiquid or that may become less liquid in response to market developments or adverse investor perceptions. Illiquid investments may be more difficult to value.
Market and Credit Risks — In the normal course of business, the Fund trades financial instruments and enters into financial transactions where risk of potential loss exists due to changes in the market (market risk). The value of the securities in which the Fund invests may go up or down in response to the prospects of individual companies, particular sectors or governments and/or general economic conditions throughout the world due to increasingly interconnected global economies and financial markets. Events such as war, acts of terrorism, social unrest, natural disasters, the spread of infectious illness or other public health threats could also significantly impact the Fund and its investments. The Fund may utilize leverage, which magnifies the market risk. Additionally, the Fund may also be exposed to credit risk in the event that an issuer or guarantor fails to perform or that an institution or entity with which the Fund has unsettled or open transactions defaults.
Option Writing Risk — Writing (selling) call options limits the opportunity to profit from an increase in the market value of securities in exchange for up-front cash at the time of selling the call option. When the Fund writes (sells) call options on securities, it receives cash but limits its opportunity to profit from an increase in the market value of the applicable security beyond the exercise price (plus the premium received) of the option. In a rising market, the Fund could significantly underperform the market. Such underperformance may be more pronounced to the extent that the call option’s underlying security sharply increases prior to the expiration of the option. The Fund’s option strategies may not fully protect it against declines in the value of the market. Cash received from premiums will enhance return in declining markets, but the Fund will continue to bear the risk of a decline in the value of the securities held in its portfolio. The benefit from writing a call option is limited to the amount of premium received. In a period of a sharply falling equity market, the Fund will likely also experience sharp declines in its NAV.
32
GOLDMAN SACHS REAL ESTATE DIVERSIFIED INCOME FUND
| 9. OTHER RISKS (continued) |
Private Real Estate Investment Funds Risk — The Fund’s performance depends in part upon the performance of the applicable private real estate investment fund managers and selected strategies, the adherence by such private real estate investment fund managers to such selected strategies, the instruments used by such private real estate investment fund managers and the Investment Adviser’s ability to select private real estate investment fund managers and strategies and effectively allocate Fund assets among them. Fund shareholders will bear two layers of fees and expenses: asset-based fees and expenses at the Fund level, and asset-based fees, incentive allocations or fees and expenses at the private real estate investment fund level.
The Fund’s investments in certain private real estate investment funds may be subject to lock-up periods, during which the Fund may not withdraw its investment. Many of the Fund’s assets will be priced in the absence of a readily available market and may be priced based on determinations of fair value, which may prove to be inaccurate. The Fund, upon its redemption of all or a portion of its interest in a private real estate investment fund, may receive an in-kind distribution of securities that are illiquid or difficult to value and difficult to dispose of. Private real estate investment funds are not publicly traded and therefore are not liquid investments. Private real estate investment funds may make significant use of leverage, which has the potential to magnify losses versus funds that do not employ leverage.
Private REIT Risk — In addition to the risks described in “Private Real Estate Investment Fund Risk” and “REIT Risk,” Private REITs are typically smaller and financially less stable than Public REITs. Private REITs are unlisted, making them hard to value and trade. Moreover, private REITs generally are exempt from Securities Act registration and, as such, are not subject to the same disclosure requirements as Public REITs, which makes private REITs more difficult to evaluate from an investment perspective.
REIT Risk — Investing in REITs involves certain unique risks in addition to those risks associated with investing in the real estate industry in general. REITs whose underlying properties are concentrated in a particular industry or geographic region are also subject to risks affecting such industries and regions. The securities of REITs involve greater risks than those associated with larger, more established companies and may be subject to more abrupt or erratic price movements because of interest rate changes, economic conditions and other factors. REITs may also fail to qualify for tax free pass-through of income or may fail to maintain their exemptions from investment company registration. Securities of such issuers may lack sufficient market liquidity to enable the Fund to effect sales at an advantageous time or without a substantial drop in price.
Repurchase Offers Risk — The Fund operates as an “interval fund,” and, in order to provide some liquidity to shareholders, will make quarterly offers to repurchase a percentage of its outstanding shares at NAV, pursuant to Rule 23c-3 under the Act. The repurchase of shares by the Fund would decrease the assets of the Fund and, therefore, may have the effect of increasing the Fund’s expense ratio. Repurchase offers and the need to fund repurchase obligations may also affect the ability of the Fund to be fully invested or force the Fund to maintain a higher percentage of its assets in liquid investments, which may harm the Fund’s investment performance. In addition, the Fund may be required to sell portfolio securities (including at inopportune times) to satisfy repurchase requests, resulting in increased transaction costs that must be borne by the Fund and its shareholders. This may result in higher short-term capital gains for taxable shareholders.
If a repurchase offer is oversubscribed and the Fund determines not to repurchase additional shares beyond the repurchase offer amount, or if shareholders tender an amount of shares greater than that which the Fund is entitled to purchase, the Fund will repurchase the shares tendered on a pro rata basis, and shareholders will have to wait until the next repurchase offer to make another repurchase request. Shareholders will be subject to the risk of NAV fluctuations during that period. Thus, there is also a risk that some shareholders, in anticipation of proration, may tender more shares than they wish to have repurchased in a particular quarter, thereby increasing the likelihood that proration will occur.
Short Position Risk — The Fund may enter into a short position through a futures contract, an option or swap agreement or through short sales of any instrument that the Fund may purchase for investment. Taking short positions involves leverage of the Fund’s assets and presents various risks, including counterparty risk. If the value of the underlying instrument or market in which the Fund has taken a short position increases, then the Fund will incur a loss equal to the increase in value from the time that the short position was entered into plus any related interest payments or other fees. Taking short positions involves the risk that losses may be disproportionate, may exceed the amount invested, and may be unlimited. To the extent that the Fund uses the proceeds it receives from a short position to take additional long positions, the risks associated with the short position, including leverage
33
GOLDMAN SACHS REAL ESTATE DIVERSIFIED INCOME FUND
Consolidated Notes to Financial Statements (continued)
September 30, 2021
| 9. OTHER RISKS (continued) |
risks, may be heightened, because doing so increases the exposure of the Fund to the markets and therefore could magnify changes to the Fund’s NAV.
| 10. INDEMNIFICATIONS |
Under the Fund’s organizational documents, its Trustees, officers, employees and agents are indemnified, to the extent permitted by the Act and state law, against certain liabilities that may arise out of performance of their duties to the Fund. Additionally, in the course of business, the Fund enters into contracts that contain a variety of indemnification clauses. The Fund’s maximum exposure under these arrangements is unknown, as this would involve future claims that may be made against the Fund that have not yet occurred. However, GSAM believes the risk of loss under these arrangements to be remote.
34
GOLDMAN SACHS REAL ESTATE DIVERSIFIED INCOME FUND
| 11. SUMMARY OF SHARE TRANSACTIONS |
Share activity is as follows:
| For the Fiscal Year Ended September 30, 2021 |
For the Fiscal Year Ended September 30, 2020 |
|||||||||||||||
|
|
|
|||||||||||||||
| Shares | Dollars | Shares | Dollars | |||||||||||||
|
|
|
|||||||||||||||
| Class A Shares | ||||||||||||||||
| Shares sold |
138,671 | $ | 1,398,484 | 1,998,339 | $ | 21,191,071 | ||||||||||
| Reinvestment of distributions |
208,954 | 2,087,397 | 308,912 | 3,000,565 | ||||||||||||
| Shares repurchased |
(1,733,384 | ) | (17,172,984 | ) | (1,971,176 | ) | (19,394,216 | ) | ||||||||
| (1,385,759 | ) | (13,687,103 | ) | 336,075 | 4,797,420 | |||||||||||
| Class C Shares | ||||||||||||||||
| Shares sold |
146,615 | 1,462,176 | 1,464,768 | 15,464,687 | ||||||||||||
| Reinvestment of distributions |
181,042 | 1,808,639 | 280,963 | 2,731,301 | ||||||||||||
| Shares repurchased |
(1,456,335 | ) | (14,371,481 | ) | (965,849 | ) | (9,498,393 | ) | ||||||||
| (1,128,678 | ) | (11,100,666 | ) | 779,882 | 8,697,595 | |||||||||||
| Class I Shares | ||||||||||||||||
| Shares sold |
3,506,951 | 37,904,547 | 4,808,202 | 52,340,446 | ||||||||||||
| Reinvestment of distributions |
149,890 | 1,571,956 | 201,852 | 2,055,770 | ||||||||||||
| Shares repurchased |
(2,278,307 | ) | (23,301,997 | ) | (2,375,599 | ) | (24,677,952 | ) | ||||||||
| 1,378,534 | 16,174,506 | 2,634,455 | 29,718,264 | |||||||||||||
| Class U Shares(a) | ||||||||||||||||
| Reinvestment of distributions |
— | — | 79 | 842 | ||||||||||||
| Shares repurchased |
— | — | (876,681 | ) | (9,379,989 | ) | ||||||||||
| — | — | (876,602 | ) | (9,379,147 | ) | |||||||||||
| Class T Shares(b) | ||||||||||||||||
| Reinvestment of distributions |
— | — | 92 | 976 | ||||||||||||
| Shares repurchased |
— | — | (663,839 | ) | (7,076,446 | ) | ||||||||||
| — | — | (663,747 | ) | (7,075,470 | ) | |||||||||||
| Class D Shares(b) | ||||||||||||||||
| Shares repurchased |
— | — | (569,179 | ) | (6,175,406 | ) | ||||||||||
| — | — | (569,179 | ) | (6,175,406 | ) | |||||||||||
| Class P Shares(c) | ||||||||||||||||
| Shares sold |
4,900,131 | 53,811,335 | — | — | ||||||||||||
| Reinvestment of distributions |
57,517 | 621,180 | — | — | ||||||||||||
| Shares repurchased |
— | — | — | — | ||||||||||||
| 4,957,648 | 54,432,515 | — | — | |||||||||||||
| Class L Shares | ||||||||||||||||
| Shares sold |
1,187 | 596 | 141,148 | 1,506,835 | ||||||||||||
| Reinvestment of distributions |
15,265 | 152,818 | 20,074 | 195,096 | ||||||||||||
| Shares repurchased |
(40,868 | ) | (403,950 | ) | (544,494 | ) | (5,782,122 | ) | ||||||||
| (24,416 | ) | (250,536 | ) | (383,272 | ) | (4,080,191 | ) | |||||||||
| Class W Shares | ||||||||||||||||
| Shares sold |
42,242 | 427,014 | 543,209 | 5,807,103 | ||||||||||||
| Reinvestment of distributions |
138,356 | 1,403,462 | 249,890 | 2,471,792 | ||||||||||||
| Shares repurchased |
(1,366,647 | ) | (13,615,474 | ) | (4,264,877 | ) | (44,544,454 | ) | ||||||||
| (1,186,049 | ) | (11,784,998 | ) | (3,471,778 | ) | (36,265,559 | ) | |||||||||
| NET INCREASE (DECREASE) |
2,611,280 | $ | 33,783,718 | (2,214,166 | ) | $ | (19,762,494 | ) | ||||||||
| (a) | Effective as of January 15, 2020, the Fund terminated operations of its Class U Shares. |
| (b) | Effective as of February 3, 2020, the Fund terminated operations of its Class D and Class T shares. |
| (c) | Class P Shares commenced operations on June 29, 2021. |
35
GOLDMAN SACHS REAL ESTATE DIVERSIFIED INCOME FUND
Consolidated Notes to Financial Statements (continued)
September 30, 2021
| 12. OTHER MATTERS |
Pursuant to an effort to consolidate the membership of the Board of Trustees of the Fund (the “Board”) with the Board of Trustees of each of Goldman Sachs Trust II, Goldman Sachs ETF Trust and Goldman Sachs MLP and Energy Renaissance Fund, at a meeting held on July 22, 2021, the Board voted to nominate Cheryl K. Beebe, Lawrence Hughes, John F. Killian and Steven D. Krichmar (the “Nominees”) for election as Trustees of the Fund at a virtual special joint meeting of shareholders to be held on December 3, 2021. Each of Nominees currently serves as a Trustee of Goldman Sachs Trust II. If elected, the Nominees will serve as Trustees alongside the current Trustees of the Fund. The Fund will bear a portion of the proxy solicitation, shareholder meeting and other related costs and GSAM has agreed to reimburse the Fund if such expenses increase the Fund’s total expense ratio by more than a specified percentage. This annual report is not a proxy statement. Information regarding the election of the Nominees is contained in the proxy materials filed with the SEC. The proxy statement has been mailed to shareholders of record, and shareholders can also access the proxy statement, and any other relevant documents, on the SEC’s website.
| 13. SUBSEQUENT EVENTS |
The Fund completed a quarterly repurchase offer on October 13, 2021, which resulted in 927,304 Fund Shares being repurchased for $9,761,566. There were 927,304 Fund Shares tendered for repurchase for this repurchase offer. Accordingly, the Fund repurchased 100% of the total number of shares tendered for repurchase.
Other than noted above, subsequent events after the Consolidated Statement of Assets and Liabilities date have been evaluated, and GSAM has concluded that there is no impact requiring adjustment or disclosure in the financial statements.
36
Report of Independent Registered Public
Accounting Firm
To the Board of Trustees and Shareholders of Goldman Sachs Real Estate Diversified Income Fund
Opinion on the Financial Statements
We have audited the accompanying consolidated statement of assets and liabilities, including the consolidated schedule of investments, of Goldman Sachs Real Estate Diversified Income Fund (the “Fund”) as of September 30, 2021, the related consolidated statements of operations and cash flows for the year ended September 30, 2021, the statement of changes in net assets for each of the two years in the period September 30, 2021, including the related notes, and the financial highlights for each of the two years in the period ended September 30, 2021 (collectively referred to as the “consolidated financial statements”). In our opinion, the consolidated financial statements present fairly, in all material respects, the financial position of the Fund as of September 30, 2021, the results of its operations and its cash flows for the year then ended, the changes in its net assets for each of the two years in the period ended September 30, 2021 and the financial highlights for each of the two years in the period ended September 30, 2021 in conformity with accounting principles generally accepted in the United States of America.
The consolidated financial statements of the Fund as of and for the year ended September 30, 2019 and the financial highlights for each of the periods ended on or prior to September 30, 2019 (not presented herein, other than the financial highlights) were audited by other auditors whose report dated November 29, 2019 expressed an unqualified opinion on those consolidated financial statements and financial highlights.
Basis for Opinion
These consolidated financial statements are the responsibility of the Fund’s management. Our responsibility is to express an opinion on the Fund’s consolidated financial statements based on our audits. We are a public accounting firm registered with the Public Company Accounting Oversight Board (United States) (PCAOB) and are required to be independent with respect to the Fund in accordance with the U.S. federal securities laws and the applicable rules and regulations of the Securities and Exchange Commission and the PCAOB.
We conducted our audits of these consolidated financial statements in accordance with the standards of the PCAOB. Those standards require that we plan and perform the audit to obtain reasonable assurance about whether the consolidated financial statements are free of material misstatement, whether due to error or fraud.
Our audits included performing procedures to assess the risks of material misstatement of the consolidated financial statements, whether due to error or fraud, and performing procedures that respond to those risks. Such procedures included examining, on a test basis, evidence regarding the amounts and disclosures in the consolidated financial statements. Our audits also included evaluating the accounting principles used and significant estimates made by management, as well as evaluating the overall presentation of the consolidated financial statements. Our procedures included confirmation of securities owned as of September 30, 2021 by correspondence with the custodian, transfer agent, broker, real estate investment trusts, and private investment funds; when replies were not received, we performed other auditing procedures. We believe that our audits provide a reasonable basis for our opinion.
/s/ PricewaterhouseCoopers LLP
Boston, Massachusetts
November 23, 2021
We have served as the auditor of one or more investment companies in the Goldman Sachs fund complex since 2000.
37
GOLDMAN SACHS REAL ESTATE DIVERSIFIED INCOME FUND
Statement Regarding Basis for Approval of Management Agreement (Unaudited)
Background
The Goldman Sachs Real Estate Diversified Income Fund (the “Fund”) is a closed-end interval fund that commenced investment operations on May 15, 2020. The Board of Trustees (the “Board” or the “Trustees”) oversees the management of the Fund and reviews the investment performance and expenses of the Fund at regularly scheduled meetings held throughout the year. In addition, the Board determines annually whether to approve the continuance of the Fund’s investment management agreement (the “Management Agreement”) with Goldman Sachs Asset Management, L.P. (the “Investment Adviser”).
The Management Agreement was most recently approved for continuation until September 30, 2022 by the Board, including those Trustees who are not parties to the Management Agreement or “interested persons” (as defined in the Investment Company Act of 1940, as amended) of any party thereto (the “Independent Trustees”), at a meeting held on September 13, 2021 (the “Annual Meeting”).
The review process undertaken by the Trustees spans the course of the year and culminates with the Annual Meeting. To assist the Trustees in their deliberations, the Trustees have established a Contract Review Committee (the “Committee”), comprised of the Independent Trustees. The Committee held three meetings over the course of the period since the Management Agreement was initially approved in December 2019. At the Committee meetings, regularly scheduled Board or other committee meetings, and/or the Annual Meeting, matters relevant to the renewal of the Management Agreement were considered by the Board, or the Independent Trustees, as applicable. The matters considered by the Board included:
| (a) | the nature and quality of the advisory, administrative, and other services provided to the Fund by the Investment Adviser and its affiliates, including information about: |
| (i) | the structure, staff, and capabilities of the Investment Adviser and its portfolio management team; |
| (ii) | the groups within the Investment Adviser and its affiliates that support the portfolio management team or provide other types of necessary services, including fund services groups (e.g., accounting and financial reporting, tax, shareholder services, and operations); controls and risk management groups (e.g., legal, compliance, valuation oversight, credit risk management, internal audit, compliance testing, market risk analysis, and finance); and others (e.g., information technology and training); |
| (iii) | trends in employee headcount; |
| (iv) | the Investment Adviser’s financial resources and ability to hire and retain talented personnel and strengthen its operations; and |
| (v) | the parent company’s support of the Investment Adviser and its registered fund business, as expressed by the firm’s senior management; |
| (b) | information on the investment performance of the Fund including comparisons to the performance of a group of similar closed-end interval real estate funds (the “Peer Group Funds”) prepared by a third-party data provider (the “Outside Data Provider”) and a blended benchmark performance index, and general investment outlooks in the markets in which the Fund invests; |
| (c) | the terms of the Management Agreement and other agreements with service providers entered into by the Fund; |
| (d) | fee and expense information for the Fund, including the relative management fee and expense levels of the Fund as compared to those of comparable funds managed by other advisers, as provided by the Outside Data Provider; |
| (e) | information relating to the profitability of the Management Agreement of the Fund to the Investment Adviser and its affiliates; |
| (f) | with respect to the investment performance and expense comparison data provided by the Outside Data Provider, its processes in producing that data for the Fund; |
| (g) | whether the Fund’s existing management fee schedule adequately addressed any economies of scale; |
| (h) | a summary of the “fall-out” benefits derived by the Investment Adviser and its affiliates from their relationships with the Fund, including the portfolio trading services; |
| (i) | a summary of potential benefits derived by the Fund as a result of its relationship with the Investment Adviser; |
| (j) | information regarding commissions paid by the Fund and broker oversight, other information regarding portfolio trading, and how the Investment Adviser carries out its duty to seek best execution; |
| (k) | portfolio manager ownership of Fund shares; the manner in which portfolio manager compensation is determined; and the number and types of accounts managed by the portfolio managers; |
| (l) | the nature and quality of the services provided to the Fund by its unaffiliated service providers, and the Investment Adviser’s general oversight and evaluation (including reports on due diligence) of those service providers as part of the administrative services provided under the Management Agreement; and (m) the Investment Adviser’s processes and policies addressing various types of potential conflicts of interest; its approach to risk management; the annual review of the effectiveness of the Fund’s compliance program; and periodic compliance reports. |
38
GOLDMAN SACHS REAL ESTATE DIVERSIFIED INCOME FUND
Statement Regarding Basis for Approval of Management Agreement (Unaudited) (continued)
In evaluating the Management Agreement at the Annual Meeting, the Trustees relied upon their knowledge, resulting from their meetings and other interactions throughout the year, of the Investment Adviser and its affiliates, their services, the Fund, and the other investment companies for which the Trustees have responsibility. In conjunction with these meetings, the Trustees received written materials and oral presentations on the topics covered and were advised by their independent legal counsel regarding their responsibilities and other regulatory requirements related to the approval and continuation of investment management agreements under applicable law. In addition, the Investment Adviser and its affiliates provided the Independent Trustees with a written response to a formal request for information sent on behalf of the Independent Trustees by their independent legal counsel. During the course of their deliberations, the Independent Trustees met in executive sessions with their independent legal counsel, without representatives of the Investment Adviser or its affiliates present.
Nature, Extent, and Quality of the Services Provided Under the Management Agreement
As part of their review, the Trustees considered the nature, extent, and quality of the services provided to the Fund by the Investment Adviser. In this regard, they considered both the investment advisory services and non-advisory services that are provided to the Fund by the Investment Adviser and its affiliates. The Trustees also considered the Investment Adviser’s ongoing recruitment efforts aimed at bringing high quality investment talent to the firm. They also noted the significant resources that the Investment Adviser devotes to risk management and the control environment in which the Fund operates, as well as the Investment Adviser’s commitment to maintaining high quality systems and expending substantial resources to respond to ongoing changes to the market, regulatory and control environment in which the Fund and its service providers operate, including changes associated with the COVID-19 pandemic, as well as the efforts of the Investment Adviser and its affiliates to combat cyber security risks. The Trustees also considered information regarding the Investment Adviser’s business continuity planning and remote operations in the current environment. They concluded that the Investment Adviser continued to commit substantial financial and operational resources to the Fund and expressed confidence that the Investment Adviser would continue to do so in the future. The Trustees also recognized that the Investment Adviser had made significant commitments to address regulatory compliance requirements applicable to the Fund and the Investment Adviser.
Investment Performance
The Trustees considered the investment performance of the Fund in light of its investment objective and market conditions for real estate investments. They also compared the performance of the Fund to the performance of the Peer Group Funds using information provided by the Outside Data Provider as of March 31, 2021. The information on the Fund’s investment performance was provided for the one-, three-, and five-year periods ended on March 31, 2021. The Trustees also noted that performance information had been provided by the Investment Adviser for the Fund for the one-year and year-to-date periods ended June 30, 2021. They also compared the Fund’s performance to the performance of a blended benchmark performance index. The Trustees noted that the Fund’s investment performance was consistent with the investment objective of seeking to produce income and achieve capital appreciation with low to moderate volatility and low to moderate correlation to the broader equity markets. They also recalled that the Fund’s predecessor had commenced operations in 2004 and had been reorganized into the Fund in May 2020.
Costs of Services Provided and Competitive Information
The Trustees considered the contractual terms of the Management Agreement and the fee rate payable by the Fund thereunder. In this regard, they considered information on the services rendered by the Investment Adviser to the Fund, which included both advisory and administrative services that were directed to the needs and operations of the Fund as a closed-end interval fund.
In particular, the Trustees reviewed information on the Fund’s total operating expense ratio and management fee rate and those were compared to similar information for the Peer Group Funds. The comparisons of the Fund’s management fee and total operating expense ratio were based on analyses prepared by the Outside Data Provider as of March 31, 2021.
The Trustees noted the competitive nature of the fund marketplace, and that many of the Fund’s shareholders would be investing in the Fund in part because of the Fund’s relationship with the Investment Adviser.
Profitability
The Trustees reviewed the Fund’s contribution to the Investment Adviser’s revenues and pre-tax profit margins. In this regard, they noted that they had received, among other things, profitability analyses and summaries, revenue and expense schedules for the Fund and by function (e.g., investment management and distribution and service), and information on the Investment Adviser’s expense allocation methodology. The Trustees observed that the profitability and expense figures are substantially similar to those used by the Investment Adviser for many internal purposes, including compensation decisions among
39
GOLDMAN SACHS REAL ESTATE DIVERSIFIED INCOME FUND
Statement Regarding Basis for Approval of Management Agreement (Unaudited) (continued)
various business groups, and are thus subject to a vigorous internal debate about how certain profits and expenses should be allocated. They also noted that the internal audit group within the Goldman Sachs organization periodically audits the expense allocation methodology and that the internal audit group was satisfied with the reasonableness, consistency, and accuracy of the Investment Adviser’s expense allocation methodology. Profitability data for the Fund was provided for 2020. The Trustees considered this information in relation to the Investment Adviser’s overall profitability.
Economies of Scale
The Trustees noted that the Fund does not have management fee breakpoints. They considered the Fund’s asset levels and information comparing the contractual management fee rate charged by the Investment Adviser with fee rates charged by other advisers to the Peer Group Funds. The Trustees recognized that if the assets of the Fund increase over time, the Fund and its shareholders could realize economies of scale as certain Fund expenses become a smaller percentage of overall assets. They further noted the Investment Adviser’s assertion that future economies of scale (among several factors) had been taken into consideration in determining the Fund’s management fee rate. They also considered the Investment Adviser’s undertaking to limit certain expenses of the Fund that exceed a specified level of the Fund’s net assets.
Other Benefits to the Investment Adviser and Its Affiliates
The Trustees also considered the other benefits derived by the Investment Adviser and its affiliates from their relationships with the Fund, including: (a) transfer agency fees received by Goldman Sachs & Co. LLC (“Goldman Sachs”); (b) brokerage and futures commissions earned by Goldman Sachs for executing securities and futures transactions on behalf of the Fund; (c) research received by the Investment Adviser from broker-dealers in exchange for executing certain transactions on behalf of the Fund; (d) trading efficiencies resulting from aggregation of orders of the Fund with those for other funds or accounts managed by the Investment Adviser; (e) the Investment Adviser’s ability to leverage the infrastructure designed to service the Fund on behalf of its other clients; (f) the Investment Adviser’s ability to cross-market other products and services to Fund shareholders; (g) Goldman Sachs’ retention of certain fees as the Fund’s distributor; (h) the Investment Adviser’s ability to negotiate better pricing with custodians on behalf of its other clients, as a result of the relationship with the Fund; and (i) the possibility that the working relationship between the Investment Adviser and the Fund’s third-party service providers may cause those service providers to be more likely to do business with other areas of Goldman Sachs. In the course of considering the foregoing, the Independent Trustees requested and received further information quantifying certain of these fall-out benefits.
Other Benefits to the Fund and Its Shareholders
The Trustees also noted that the Fund receives certain other potential benefits as a result of its relationship with the Investment Adviser, including: (a) trading efficiencies resulting from aggregation of orders of the Fund with those of other funds or accounts managed by the Investment Adviser; (b) enhanced servicing from vendors due to the volume of business generated by the Investment Adviser and its affiliates; (c) enhanced servicing from broker-dealers due to the volume of business generated by the Investment Adviser and its affiliates; (d) the Investment Adviser’s ability to negotiate favorable terms with derivatives counterparties on behalf of the Fund as a result of the size and reputation of the Goldman Sachs organization; (e) the advantages received from the Investment Adviser’s knowledge and experience gained from managing other accounts and products; (f) the Investment Adviser’s ability to hire and retain qualified personnel to provide services to the Fund because of the reputation of the Goldman Sachs organization; and (g) the Fund’s access, through the Investment Adviser, to certain firm-wide resources (e.g., proprietary risk management systems and databases), subject to certain restrictions. The Trustees noted the competitive nature of the closed-end interval fund marketplace and considered that many of the Fund’s shareholders invested in the Fund in part because of the Fund’s relationship with the Investment Adviser and that those shareholders have a general expectation that the relationship will continue.
Conclusion
In connection with their consideration of the Management Agreement, the Trustees gave weight to each of the factors described above but did not identify any one particular factor as controlling their decision. After deliberation and consideration of all of the information provided, including the factors described above, the Trustees concluded, in the exercise of their business judgment, that the management fees paid by the Fund were reasonable in light of the services provided to it by the Investment Adviser, the Investment Adviser’s costs and the Fund’s current and reasonably foreseeable asset levels. At the Annual Meeting, the Trustees unanimously concluded that the Investment Adviser’s continued management would likely benefit the Fund and its shareholders and that the Management Agreement should be approved and continued with respect to the Fund until September 30, 2022.
40
GOLDMAN SACHS REAL ESTATE DIVERSIFIED INCOME FUND
Trustees and Officers (Unaudited)
Independent Trustees
| Name, Address and Age1 |
Position(s) Held with the Fund |
Term of Length of |
Principal Occupation(s) During Past 5 Years |
Number of Portfolios in Fund Complex Overseen by Trustee3 |
Other Directorships Held by Trustee4 | |||||
| Lawrence W. Stranghoener Age: 67 |
Chairman of the Board of Trustees | Trustee and Chairman Since 2019 | Mr. Stranghoener is retired. He is Chairman, Kennametal, Inc. (a global manufacturer and distributor of tooling and industrial materials) (2003-Present); and was formerly Director, Aleris Corporation and Aleris International, Inc. (a producer of aluminum rolled products) (2011-2020); Interim Chief Executive Officer (2014); and Executive Vice President and Chief Financial Officer (2004-2014), Mosaic Company (a fertilizer manufacturing company).
Chairman of the Board of Trustees — Goldman Sachs ETF Trust; Goldman Sachs MLP and Energy Renaissance Fund; Goldman Sachs Credit Income Fund; and Goldman Sachs Real Estate Diversified Income Fund. |
41 | Kennametal, Inc. (a global manufacturer and distributor of tooling and industrial materials) | |||||
| Linda A. Lang Age: 63 |
Trustee | Since 2019 | Ms. Lang is retired. She was formerly Chair of the Board of Directors (2016-2019); and Member of the Board of Directors, WD-40 Company (a global consumer products company) (2004-2019); Chairman and Chief Executive Officer (2005-2014); and Director, President and Chief Operating Officer, Jack in the Box, Inc. (a restaurant company) (2003-2005). Previously, Ms. Lang served as an Advisory Board Member of Goldman Sachs MLP and Energy Renaissance Fund (February 2016-March 2016).
Trustee — Goldman Sachs ETF Trust; Goldman Sachs MLP and Energy Renaissance Fund; Goldman Sachs Credit Income Fund; and Goldman Sachs Real Estate Diversified Income Fund. |
41 | None | |||||
| Michael Latham Age: 56 |
Trustee | Since 2019 | Mr. Latham is retired. He currently serves as Chief Operating Officer and Director of FinTech Evolution Acquisition Group (a special purpose acquisition company) (2021-Present). Formerly, Mr. Latham held senior management positions with the iShares exchange-traded fund business, including Chairman (2011-2014); Global Head (2010-2011); U.S. Head (2007-2010); and Chief Operating Officer (2003-2007).
Trustee — Goldman Sachs ETF Trust; Goldman Sachs MLP and Energy Renaissance Fund; Goldman Sachs Credit Income Fund; and Goldman Sachs Real Estate Diversified Income Fund. |
41 | FinTech Evolution Acquisition Group (a special purpose acquisition company) | |||||
41
GOLDMAN SACHS REAL ESTATE DIVERSIFIED INCOME FUND
Trustees and Officers (Unaudited) (continued)
Interested Trustee*
| Name, Address and Age1 |
Position(s) Held with the Fund |
Term of Office and Length of Time Served2 |
Principal Occupation(s) During Past 5 Years |
Number of Portfolios in Fund Complex Overseen by Trustee3 |
Other Directorships Held by Trustee4 | |||||
| James A. McNamara Age: 58 |
President and Trustee | Since 2019 | Advisory Director, Goldman Sachs (January 2018-Present); Managing Director, Goldman Sachs (January 2000-December 2017); Director of Institutional Fund Sales, GSAM (April 1998-December 2000); and Senior Vice President and Manager, Dreyfus Institutional Service Corporation (January 1993-April 1998).
President and Trustee — Goldman Sachs ETF Trust; Goldman Sachs Trust; Goldman Sachs Variable Insurance Trust; Goldman Sachs Trust II; Goldman Sachs MLP and Energy Renaissance Fund; Goldman Sachs Credit Income Fund; and Goldman Sachs Real Estate Diversified Income Fund |
168 | None | |||||
| * | Mr. McNamara is considered to be an “Interested Trustee” because he holds a position with Goldman Sachs and owns securities issued by The Goldman Sachs Group, Inc. The Interested Trustee holds comparable positions with certain other companies of which Goldman Sachs, GSAM or an affiliate thereof is the investment adviser, administrator and/or distributor. |
| 1 | Each Trustee may be contacted by writing to the Trustee, c/o Goldman Sachs, 200 West Street, New York, New York, 10282, Attn: Caroline L. Kraus. Information is provided as of September 30, 2021. |
| 2 | Each Trustee holds office for an indefinite term, until the earliest of: (a) the election of his or her successor; (b) the date the Trustee resigns or is removed by the Board or shareholders, in accordance with the Trust’s Declaration of Trust; or (c) the termination of the Trust. The Board has adopted policies which provide that each Independent Trustee shall retire as of December 31st of the calendar year in which he or she reaches (a) his or her 74th birthday or (b) the 15th anniversary of the date he or she became a Trustee, whichever is earlier, unless a waiver of such requirements shall have been adopted by a majority of the other Trustees. These policies may be changed by the Trustees without shareholder approval. |
| 3 | The Goldman Sachs Fund Complex includes certain other companies listed above for each respective Trustee. As of September 30, 2021, Goldman Sachs ETF Trust consisted of 38 portfolios (21 of which offered shares to the public); Goldman Sachs Trust consisted of 92 portfolios (90 of which offered shares to the public); Goldman Sachs Variable Insurance Trust consisted of 17 portfolios (13 of which offered shares to the public); Goldman Sachs Trust II consisted of 18 portfolios (16 of which offered shares to the public); and Goldman Sachs MLP and Energy Renaissance Fund, Goldman Sachs Credit Income Fund and Goldman Sachs Real Estate Diversified Income Fund each consisted of one portfolio. Goldman Sachs Credit Income Fund did not offer shares to the public. |
| 4 | This column includes only directorships of companies required to report to the Securities and Exchange Commission under the Securities Exchange Act of 1934 (i.e., “public companies”) or other investment companies registered under the Act. |
Additional information about the Trustees is available in the Fund’s Statement of Additional Information, which can be obtained from Goldman Sachs free of charge by calling this toll-free number (in the United States of America): 1-800-526-7384.
42
GOLDMAN SACHS REAL ESTATE DIVERSIFIED INCOME FUND
Trustees and Officers (Unaudited) (continued)
Officers of the Fund*
| Name, Address and Age1 | Positions Held with the Fund |
Term of Office and Length of Time Served2 |
Principal Occupation(s) During Past 5 Years | |||
| James A. McNamara 200 West Street New York, NY 10282 Age: 58 |
Trustee and President | Since 2019 | Advisory Director, Goldman Sachs (January 2018-Present); Managing Director, Goldman Sachs (January 2000-December 2017); Director of Institutional Fund Sales, GSAM (April 1998-December 2000); and Senior Vice President and Manager, Dreyfus Institutional Service Corporation (January 1993-April 1998).
President and Trustee — Goldman Sachs ETF Trust. Goldman Sachs Trust; Goldman Sachs Variable Insurance Trust; Goldman Sachs Trust II; Goldman Sachs MLP and Energy Renaissance Fund; Goldman Sachs Credit Income Fund; and Goldman Sachs Real Estate Diversified Income Fund. | |||
| Caroline L. Kraus 200 West Street New York, NY 10282 Age: 44 |
Secretary | Since 2019 | Managing Director, Goldman Sachs (January 2016-Present); Vice President, Goldman Sachs (August 2006-December 2015); Senior Counsel, Goldman Sachs (January 2020-Present); Associate General Counsel, Goldman Sachs (2012-December 2019); Assistant General Counsel, Goldman Sachs (August 2006-December 2011); and Associate, Weil, Gotshal & Manges, LLP (2002-2006).
Secretary — Goldman Sachs ETF Trust; Goldman Sachs Trust (previously Assistant Secretary (2012)); Goldman Sachs Variable Insurance Trust (previously Assistant Secretary (2012)); Goldman Sachs Trust II; Goldman Sachs BDC, Inc.; Goldman Sachs Private Middle Market Credit LLC; Goldman Sachs Private Middle Market Credit II LLC; Goldman Sachs Middle Market Lending Corp.; Goldman Sachs MLP and Energy Renaissance Fund; Goldman Sachs Credit Income Fund; and Goldman Sachs Real Estate Diversified Income Fund. | |||
| Joseph F. DiMaria 30 Hudson Street Jersey City, NJ 07302 Age: 53 |
Treasurer, Principal Financial Officer and Principal Accounting Officer |
Since 2019 (Treasurer and Principal Financial Officer since 2019) | Managing Director, Goldman Sachs (November 2015-Present) and Vice President — Mutual Fund Administration, Columbia Management Investment Advisers, LLC (May 2010- October 2015).
Treasurer, Principal Financial Officer and Principal Accounting Officer — Goldman Sachs ETF Trust (previously Assistant Treasurer (2017));Goldman Sachs Trust (previously Assistant Treasurer (2016)); Goldman Sachs Variable Insurance Trust (previously Assistant Treasurer (2016)); Goldman Sachs Trust II (previously Assistant Treasurer (2017)); Goldman Sachs MLP and Energy Renaissance Fund (previously Assistant Treasurer (2017)); Goldman Sachs Credit Income Fund; and Goldman Sachs Real Estate Diversified Income Fund. | |||
| * | Represents a partial list of officers of the Fund. Additional information about all the officers is available in the Fund’s Statement of Additional Information, which can be obtained from Goldman Sachs free of charge by calling this toll-free number (in the United States): 1-800-621-2550. |
| 1 | Information is provided as of September 30, 2021. |
| 2 | Officers hold office at the pleasure of the Board of Trustees or until their successors are duly elected and qualified. Each officer holds comparable positions with certain other companies of which Goldman Sachs, GSAM or an affiliate thereof is the investment adviser, administrator and/or distributor. |
Goldman Sachs Real Estate Diversified Income Fund — Tax Information (Unaudited)
For the fiscal year ended September 30, 2021, 100% of the dividends paid from net investment company taxable income by the Real Estate Diversified Income Fund qualify as section 199A dividends.
Pursuant to Section 852 of the Internal Revenue Code, the Real Estate Diversified Income Fund designated $7,555,806, or if different, the maximum amount allowable, as capital gain dividends paid during the fiscal year ended September 30, 2021.
During the fiscal year ended September 30, 2021, the Real Estate Diversified Income Fund designated $7,482,360, as short-term capital gain dividends pursuant to Section 871(k) of the Internal Revenue Code.
43
FUNDS PROFILE
Goldman Sachs Funds
Goldman Sachs is a premier financial services firm, known since 1869 for creating thoughtful and customized investment solutions in complex global markets.
Today, the Asset Management Division of Goldman Sachs serves a diverse set of clients worldwide, including private institutions, public entities and individuals. With approximately $2.14 trillion in assets under supervision as of September 30, 2021, Goldman Sachs Asset Management (“GSAM”) has portfolio management teams located around the world and our investment professionals bring firsthand knowledge of local markets to every investment decision. Assets under supervision includes assets under management and other client assets for which Goldman Sachs does not have full discretion. GSAM leverages the resources of Goldman Sachs & Co. LLC subject to legal, internal and regulatory restrictions.
Money Market
Financial Square FundsSM
| ∎ | Financial Square Treasury Solutions Fund1 |
| ∎ | Financial Square Government Fund1 |
| ∎ | Financial Square Money Market Fund2 |
| ∎ | Financial Square Prime Obligations Fund2 |
| ∎ | Financial Square Treasury Instruments Fund1 |
| ∎ | Financial Square Treasury Obligations Fund1 |
| ∎ | Financial Square Federal Instruments Fund1 |
Investor FundsSM
| ∎ | Investor Money Market Fund3 |
| ∎ | Investor Tax-Exempt Money Market Fund3 |
Fixed Income
Short Duration and Government
| ∎ | Enhanced Income Fund |
| ∎ | High Quality Floating Rate Fund |
| ∎ | Short-Term Conservative Income Fund |
| ∎ | Short Duration Government Fund |
| ∎ | Short Duration Bond Fund4 |
| ∎ | Government Income Fund |
| ∎ | Inflation Protected Securities Fund |
Multi-Sector
| ∎ | Bond Fund |
| ∎ | Core Fixed Income Fund |
| ∎ | Global Core Fixed Income Fund |
| ∎ | Strategic Income Fund |
| ∎ | Income Fund |
Municipal and Tax-Free
| ∎ | High Yield Municipal Fund |
| ∎ | Dynamic Municipal Income Fund |
| ∎ | Short Duration Tax-Free Fund |
| ∎ | Municipal Income Completion Fund |
Single Sector
| ∎ | Investment Grade Credit Fund |
| ∎ | U.S. Mortgages Fund |
| ∎ | High Yield Fund |
| ∎ | High Yield Floating Rate Fund |
| ∎ | Emerging Markets Debt Fund |
| ∎ | Local Emerging Markets Debt Fund |
Fixed Income Alternatives
| ∎ | Long Short Credit Strategies Fund |
Fundamental Equity
| ∎ | Equity Income Fund |
| ∎ | Small Cap Growth Fund |
| ∎ | Small Cap Value Fund |
| ∎ | Small/Mid Cap Value Fund |
| ∎ | Mid Cap Value Fund |
| ∎ | Large Cap Value Fund |
| ∎ | Focused Value Fund |
| ∎ | Capital Growth Fund |
| ∎ | Strategic Growth Fund |
| ∎ | Small/Mid Cap Growth Fund |
| ∎ | Flexible Cap Fund |
| ∎ | Concentrated Growth Fund |
| ∎ | Technology Opportunities Fund |
| ∎ | Growth Opportunities Fund |
| ∎ | Rising Dividend Growth Fund |
| ∎ | U.S. Equity ESG Fund |
| ∎ | Income Builder Fund |
Tax-Advantaged Equity
| ∎ | U.S. Tax-Managed Equity Fund |
| ∎ | International Tax-Managed Equity Fund |
| ∎ | U.S. Equity Dividend and Premium Fund |
| ∎ | International Equity Dividend and Premium Fund |
Equity Insights
| ∎ | Small Cap Equity Insights Fund |
| ∎ | U.S. Equity Insights Fund |
| ∎ | Small Cap Growth Insights Fund |
| ∎ | Large Cap Growth Insights Fund |
| ∎ | Large Cap Value Insights Fund |
| ∎ | Small Cap Value Insights Fund |
| ∎ | International Small Cap Insights Fund |
| ∎ | International Equity Insights Fund |
| ∎ | Emerging Markets Equity Insights Fund |
Fundamental Equity International
| ∎ | International Equity Income Fund |
| ∎ | International Equity ESG Fund |
| ∎ | China Equity Fund |
| ∎ | Emerging Markets Equity Fund |
| ∎ | ESG Emerging Markets Equity Fund |
Alternative
| ∎ | Real Estate Securities Fund |
| ∎ | International Real Estate Securities Fund |
| ∎ | Commodity Strategy Fund |
| ∎ | Global Real Estate Securities Fund |
| ∎ | Alternative Premia Fund |
| ∎ | Absolute Return Tracker Fund |
| ∎ | Managed Futures Strategy Fund |
| ∎ | MLP Energy Infrastructure Fund |
| ∎ | Energy Infrastructure Fund |
| ∎ | Multi-Manager Alternatives Fund |
| ∎ | Global Infrastructure Fund |
| ∎ | Clean Energy Income Fund |
| ∎ | Defensive Equity Fund |
Total Portfolio Solutions
| ∎ | Global Managed Beta Fund |
| ∎ | Multi-Manager Non-Core Fixed Income Fund |
| ∎ | Multi-Manager Global Equity Fund |
| ∎ | Multi-Manager International Equity Fund |
| ∎ | Tactical Tilt Overlay Fund |
| ∎ | Balanced Strategy Portfolio |
| ∎ | Multi-Manager U.S. Small Cap Equity Fund |
| ∎ | Multi-Manager Real Assets Strategy Fund |
| ∎ | Growth and Income Strategy Portfolio |
| ∎ | Growth Strategy Portfolio |
| ∎ | Dynamic Global Equity Fund |
| ∎ | Satellite Strategies Portfolio |
| ∎ | Enhanced Dividend Global Equity Portfolio |
| ∎ | Tax-Advantaged Global Equity Portfolio |
| ∎ | Strategic Factor Allocation Fund |
| ∎ | Strategic Volatility Premium Fund |
| ∎ | Target Date Retirement Portfolio |
| ∎ | Target Date 2025 Portfolio |
| ∎ | Target Date 2030 Portfolio |
| ∎ | Target Date 2035 Portfolio |
| ∎ | Target Date 2040 Portfolio |
| ∎ | Target Date 2045 Portfolio |
| ∎ | Target Date 2050 Portfolio |
| ∎ | Target Date 2055 Portfolio |
| ∎ | Target Date 2060 Portfolio |
| ∎ | GQG Partners International Opportunities Fund |
| 1 | You could lose money by investing in the Fund. Although the Fund seeks to preserve the value of your investment at $1.00 per share, it cannot guarantee it will do so. An investment in the Fund is not a deposit of a bank and is not insured or guaranteed by the Federal Deposit Insurance Corporation or any other government agency. The Fund’s sponsor has no legal obligation to provide financial support to the Fund, and you should not expect that the sponsor will provide financial support to the Fund at any time. |
| 2 | You could lose money by investing in the Fund. Because the share price of the Fund will fluctuate, when you sell your shares they may be worth more or less than what you originally paid for them. The Fund may impose a fee upon sale of your shares or may temporarily suspend your ability to sell shares if the Fund’s liquidity falls below required minimums because of market conditions or other factors. An investment in the Fund is not a deposit of a bank and is not insured or guaranteed by the Federal Deposit Insurance Corporation or any other government agency. The Fund’s sponsor has no legal obligation to provide financial support to the Fund, and you should not expect that the sponsor will provide financial support to the Fund at any time. |
| 3 | You could lose money by investing in the Fund. Although the Fund seeks to preserve the value of your investment at $1.00 per share, it cannot guarantee it will do so. The Fund may impose a fee upon sale of your shares or may temporarily suspend your ability to sell shares if the Fund’s liquidity falls below required minimums because of market conditions or other factors. An investment in the Fund is not a deposit of a bank and is not insured or guaranteed by the Federal Deposit Insurance Corporation or any other government agency. The Fund’s sponsor has no legal obligation to provide financial support to the Fund, and you should not expect that the sponsor will provide financial support to the Fund at any time. |
| 4 | Effective after the close of business on July 29, 2021, the Goldman Sachs Short Duration Income Fund was renamed the Goldman Sachs Short Duration Bond Fund. |
| Financial Square FundsSM and Investor FundsSM are registered service marks of Goldman Sachs & Co. LLC. |
| * | This list covers open-end funds only. Please visit our website at www.GSAMFUNDS.com to learn about our closed-end funds and exchange-traded funds. |
| TRUSTEES Lawrence W. Stranghoener, Chairman Linda A. Lang Michael Latham James A. McNamara |
OFFICERS James A. McNamara, President Joseph F. DiMaria, Principal Financial Officer, Caroline L. Kraus, Secretary | |
| GOLDMAN SACHS & CO. LLC Distributor and Transfer Agent |
GOLDMAN SACHS ASSET MANAGEMENT, L.P. Investment Adviser | |
Visit our web site at www.GSAMFUNDS.com to obtain the most recent month-end returns.
Goldman Sachs Asset Management, L.P. 200 West Street, New York, New York 10282
Economic and market forecasts presented herein reflect our judgment as of the date of this presentation and are subject to change without notice. These forecasts do not take into account the specific investment objectives, restrictions, tax and financial situation or other needs of any specific client. Actual data will vary and may not be reflected here. These forecasts are subject to high levels of uncertainty that may affect actual performance. Accordingly, these forecasts should be viewed as merely representative of a broad range of possible outcomes. These forecasts are estimated, based on assumptions, and are subject to significant revision and may change materially as economic and market conditions change. Goldman Sachs has no obligation to provide updates or changes to these forecasts. Case studies and examples are for illustrative purposes only.
The portfolio risk management process includes an effort to monitor and manage risk, but does not imply low risk.
The reports concerning the Fund included in this shareholder report may contain certain forward-looking statements about the factors that may affect the performance of the Fund in the future. These statements are based on Fund management’s predictions and expectations concerning certain future events and their expected impact on the Fund, such as performance of the economy as a whole and of specific industry sectors, changes in the levels of interest rates, the impact of developing world events, and other factors that may influence the future performance of the Fund. Management believes these forward-looking statements to be reasonable, although they are inherently uncertain and difficult to predict. Actual events may cause adjustments in portfolio management strategies from those currently expected to be employed.
A description of the policies and procedures that the Fund uses to determine how to vote proxies relating to portfolio securities and information regarding how the Fund voted proxies relating to portfolio securities during the most recent 12-month period ended June 30 is available (i) without charge, upon request by calling 1-800-526-7384 (for Retail Shareholders) or 1-800-621-2550 (for Institutional Shareholders); and (ii) on the Securities and Exchange Commission (“SEC”) web site at http://www.sec.gov.
The Global Industry Classification Standard (GICS) was developed by and is the exclusive property and a service mark of Morgan Stanley Capital International Inc. (MSCI) and Standard & Poor’s, a division of The McGraw-Hill Companies, Inc. (S&P) and is licensed for use by Goldman Sachs. Neither MSCI, S&P nor any other party involved in making or compiling the GICS or any GICS classifications makes any express or implied warranties or representations with respect to such standard or classification (or the results to be obtained by the use thereof), and all such parties hereby expressly disclaim all warranties of originality, accuracy, completeness, merchantability or fitness for a particular purpose with respect to any of such standard or classification. Without limiting any of the foregoing, in no event shall MSCI, S&P, any of their affiliates or any third party involved in making or compiling the GICS or any GICS classifications have any liability for any direct, indirect, special, punitive, consequential or any other damages (including lost profits) even if notified of the possibility of such damages.
The Fund will file portfolio holdings information for each month in a fiscal quarter within 60 days after the end of the relevant fiscal quarter on Form N-PORT. Portfolio holdings information for the third month of each fiscal quarter will be made available on the SEC’s web site at http://www.sec.gov. Portfolio holdings information may be obtained upon request and without charge by calling 1-800-526-7384 (for Retail Shareholders) or 1-800-621-2550 (for Institutional Shareholders).
Holdings and allocations shown are as of September 30, 2021 and may not be representative of future investments. Fund holdings should not be relied on in making investment decisions and should not be construed as research or investment advice regarding particular securities. Current and future holdings are subject to risk.
This material is not authorized for distribution to prospective investors unless preceded or accompanied by a current prospectus or summary prospectus, if applicable. Investors should consider a Fund’s objective, risks, and charges and expenses, and read the summary prospectus, if available, and/or the prospectus carefully before investing or sending money. The summary prospectus, if available, and the prospectus contain this and other information about a Fund and may be obtained from your authorized dealer or from Goldman Sachs & Co. LLC by calling (retail – 1-800-526-7384) (institutional – 1-800-621-2550).
© 2021 Goldman Sachs. All rights reserved. 259618-OTU-1511512 RLDVINCAR-21
| ITEM 2. | CODE OF ETHICS. |
(a) As of the end of the period covered by this report, the registrant has adopted a code of ethics that applies to the registrant’s principal executive officer, principal financial officer, principal accounting officer or controller, or persons performing similar functions, regardless of whether these individuals are employed by the registrant or a third party (the “Code of Ethics”).
(b) Not applicable.
(c) During the period covered by this report, no amendments were made to the provisions of the Code of Ethics.
(d) During the period covered by this report, the registrant did not grant any waivers, including an implicit waiver, from any provision of the Code of Ethics.
(e) Not applicable.
(f) A copy of the Code of Ethics is available as provided in Item 13(a)(1) of this report.
| ITEM 3. | AUDIT COMMITTEE FINANCIAL EXPERT. |
The registrant’s board of trustees has determined that the registrant has at least one “audit committee financial expert” (as defined in Item 3 of Form N-CSR) serving on its audit committee. Michael Latham is the “audit committee financial expert” and is “independent” (as each term is defined in Item 3 of Form N-CSR).
| ITEM 4. | PRINCIPAL ACCOUNTANT FEES AND SERVICES. |
Table 1 — Items 4(a) - 4(d). The accountant fees below reflect the aggregate fees billed by the Goldman Sachs Real Estate Diversified Income Fund
| 2021 | 2020 |
Description of Services Rendered | ||||||||
| Audit Fees: |
||||||||||
| • PricewaterhouseCoopers LLP (“PwC”) |
$92,000 | $155,000 | Financial Statement audits. | |||||||
| Audit-Related Fees: |
||||||||||
| • PwC |
$14,031 | $20,000 | Other attest services. | |||||||
| Tax Fees: |
||||||||||
| • PwC |
$ — | $0 | Tax compliance services provided in connection with the preparation and review of registrant’s tax returns and certain other tax-related services. | |||||||
Table 2 — Items 4(b)(c) & (d). Non-Audit Services to the Goldman Sachs Real Estate Diversified Income Fund’s service affiliates * that were pre-approved by the Audit Committee of the Goldman Sachs Real Estate Diversified Income Fund pursuant to Rule 2-01(c)(7)(ii) of Regulation S-X.
| 2021 | 2020 | Description of Services Rendered | ||||||||
| Audit-Related Fees: |
||||||||||
| • PwC |
$1,669,547 | $1,561,351 | Internal control review performed in accordance with Statement on Standards for Attestation Engagements No. 16 and Semi-Annual Updates related to withholding tax accrual for non-US Jurisdictions. These fees are borne by the Fund’s Adviser. | |||||||
| * | These include the advisor (excluding sub-advisors) and any entity controlling, controlled by or under common control with the advisor that provides ongoing services to the registrant (hereinafter referred to as “service affiliates”). |
Item 4(e)(1) — Audit Committee Pre-Approval Policies and Procedures
Pre-Approval of Audit and Non-Audit Services Provided to the Funds of the Goldman Sachs Real Estate Diversified Income Fund. The Audit and Non-Audit Services Pre-Approval Policy (the “Policy”) adopted by the Audit Committee of Goldman Sachs Real Estate Diversified Income Fund (the “Fund”) sets forth the procedures and the conditions pursuant to which services performed by an independent auditor for the Fund may be pre-approved. Services may be pre-approved specifically by the Audit Committee as a whole or, in certain circumstances, by the Audit Committee Chairman or the person designated as the Audit Committee Financial Expert. In addition, subject to specified cost limitations, certain services may be pre-approved under the provisions of the Policy. The Policy provides that the Audit Committee will consider whether the services provided by an independent auditor are consistent with the Securities and Exchange Commission’s rules on auditor independence. The Policy provides for periodic review and pre-approval by the Audit Committee of the services that may be provided by the independent auditor.
De Minimis Waiver. The pre-approval requirements of the Policy may be waived with respect to the provision of non-audit services that are permissible for an independent auditor to perform, provided (1) the aggregate amount of all such services provided constitutes no more than five percent of the total amount of revenues subject to pre-approval that was paid to the independent auditors during the fiscal year in which the services are provided; (2) such services were not recognized by the Fund at the time of the engagement to be non-audit services; and (3) such services are promptly brought to the attention of the Audit Committee and approved prior to the completion of the audit by the Audit Committee or by one or more members of the Audit Committee to whom authority to grant such approvals has been delegated by the Audit Committee, pursuant to the pre-approval provisions of the Policy.
Pre-Approval of Non-Audit Services Provided to the Fund’s Investment Advisers. The Policy provides that, in addition to requiring pre-approval of audit and non-audit services provided to the Fund, the Audit Committee will pre-approve those non-audit services provided to the Fund’s investment advisers (and entities controlling, controlled by or under common control with the investment advisers that provide ongoing services to the Fund) where the engagement relates directly to the operations or financial reporting of the Fund.
Item 4(e)(2) – 0% of the audit-related fees, tax fees and other fees listed in Table 1 were approved by the Fund’s Audit Committee pursuant to the “de minimis” exception of Rule 2-01(c)(7)(i)(C) of Regulation S-X. In addition, 0% of the non-audit services to the Fund’s service affiliates listed in Table 2 were approved by the Fund’s Audit Committee pursuant to the “de minimis” exception of Rule 2-01(c)(7)(i)(C) of Regulation S-X.
Item 4(f) – Not applicable.
Item 4(g) Aggregate Non-Audit Fees Disclosure
The aggregate non-audit fees billed to the Fund by PwC for the twelve months ended September 30, 2021 and September 30, 2020 were approximately $14,031 and $20,000, respectively. The aggregate non-audit fees billed to the Fund’s adviser and service affiliates by PwC for non-audit services for the twelve months ended December 31, 2020 and December 31, 2019 were approximately $14.5 million and $14.7 million, respectively. With regard to the aggregate non-audit fees billed to the Fund’s adviser and service affiliates, the 2020 and 2019 amounts include fees for non-audit services required to be pre-approved [see Table 2] and fees for non-audit services that did not require pre-approval since they did not directly relate to the Fund’s operations or financial reporting.
Item 4(h) — The Fund’s Audit Committee has considered whether the provision of non-audit services to the Fund’s investment adviser and service affiliates that did not require pre-approval pursuant to paragraph (c)(7)(ii) of Rule 2-01 of Regulation S-X is compatible with maintaining the auditors’ independence.
| ITEM 5. | AUDIT COMMITTEE OF LISTED REGISTRANTS. |
| Not applicable. |
| ITEM 6. | SCHEDULE OF INVESTMENTS. |
| Schedule of Investments is included as part of the Report to Shareholders filed under Item 1. |
| ITEM 7. | DISCLOSURE OF PROXY VOTING POLICIES AND PROCEDURES FOR CLOSED-END MANAGEMENT INVESTMENT COMPANIES. |
The Fund has delegated the voting of portfolio securities to Goldman Sachs Asset Management L.P. (the “Investment Adviser”). For client accounts for which the Investment Adviser has voting discretion, the Investment Adviser has adopted policies and procedures (the “Proxy Voting Policy”) for the voting of proxies. Under the Proxy Voting Policy, the Investment Adviser’s guiding principles in performing proxy voting are to make decisions that favor proposals that in the Investment Adviser’s view tend to maximize a company’s shareholder value and are not influenced by conflicts of interest. To implement these guiding principles for investments in publicly-traded equities, the Investment Adviser has developed customized proxy voting guidelines (the “Guidelines”) that it generally applies when voting on behalf of client accounts. These Guidelines address a wide variety of individual topics, including, among other matters, shareholder voting rights, anti-takeover defenses, board structures, the election of directors, executive and director compensation, reorganizations, mergers, issues of corporate social responsibility and various shareholder proposals. The Guidelines embody the positions and factors the Investment Adviser generally considers important in casting proxy votes.
The Proxy Voting Policy, including the Guidelines, is reviewed periodically to ensure that it continues to be consistent with the Investment Adviser’s guiding principles.
The Investment Adviser has retained a third-party proxy voting service (“Proxy Service”), currently Institutional Shareholder Services, to assist in the implementation and administration of certain proxy voting-related functions, including, without limitation, operational, recordkeeping and reporting services. The Proxy Service also prepares a written analysis and recommendation (a “Recommendation”) of each proxy vote that reflects the Proxy Service’s application of the Guidelines to particular proxy issues. While it is the Investment Adviser’s policy generally to follow the Guidelines and Recommendations from the Proxy Service, the Investment Adviser’s portfolio management teams (“Portfolio Management Teams”) may on certain proxy votes seek approval to diverge from the Guidelines or a Recommendation by following an “override” process. Such decisions are subject to a review and approval process, including a determination that the decision is not influenced by any conflict of interest. A Portfolio Management Team that receives approval through the override process to cast a proxy vote that diverges from the Guidelines and/or a Recommendation may vote differently than other Portfolio Management Teams that did not seek to override that vote. In forming their views on particular matters, the Portfolio Management Teams are also permitted to consider applicable regional rules and practices, including codes of conduct and other guides, regarding proxy voting, in addition to the Guidelines and Recommendations. The Investment Adviser may hire other service providers to replace or supplement the Proxy Service with respect to any of the services the Investment Adviser currently receives from the Proxy Service.
The Investment Adviser conducts periodic due diligence meetings with the Proxy Service which include, but are not limited to, a review of the Proxy Service’s general organizational structure, new developments with respect to research and technology, work flow improvements and internal due diligence with respect to conflicts of interest.
From time to time, the Investment Adviser may face regulatory, compliance, legal or logistical limits with respect to voting securities that it may purchase or hold for client accounts, which can affect the Investment Adviser’s ability to vote such proxies, as well as the desirability of voting such proxies. Among other limits, federal, state and foreign regulatory restrictions or company specific ownership limits, as well as legal matters related to consolidated groups, may restrict the total percentage of an issuer’s voting securities that the Investment Adviser can hold for clients and the nature of the Investment Adviser’s voting in such securities. The Investment Adviser’s ability to vote proxies may also be affected by, among other things: (i) late receipt of meeting notices; (ii) requirements to vote proxies in person: (iii) restrictions on a foreigner’s ability to exercise votes; (iv) potential difficulties in translating the proxy; (v) requirements to provide local agents with unrestricted powers of attorney to facilitate voting instructions; and (vi) requirements that investors who exercise their voting rights surrender the right to dispose of their holdings for some specified period in proximity to the shareholder meeting.
The Investment Adviser has adopted policies and procedures designed to prevent conflicts of interest from influencing its proxy voting decisions that the Investment Adviser makes on behalf of a client account. These policies and procedures include the Investment Adviser’s use of the Guidelines and Recommendations from the Proxy Service, the override approval process previously discussed, and the establishment of information barriers between the Investment Adviser and other businesses within The Goldman Sachs Group, Inc. Notwithstanding such proxy voting policies and procedures, actual proxy voting decisions of the Investment Adviser may have the effect of benefitting the interests of other clients or businesses of other divisions or units of GS&Co. and/or its affiliates.
Voting decisions with respect to fixed income securities and the securities of privately held issuers generally will be made by the Fund’s portfolio managers based on their assessment of the particular transactions or other matters at issue.
Information regarding how the Fund voted proxies relating to portfolio securities during the most recent 12-month period ended June 30, 2021 is available on or through the Fund’s website at https://www.gsam.com/content/gsam/us/en/advisors/resources/client-service/proxy-voting.html without charge and on the SEC’s website at www.sec.gov.
| ITEM 8. | PORTFOLIO MANAGERS OF CLOSED-END MANAGEMENT INVESTMENT COMPANIES. |
Item 8(a)(1)
| Name |
Title |
Length of Time Served |
Principal Occupation(s) During Past 5 Years | |||
| Kristin Kuney, CFA | Managing Director | Since 2021 | Ms. Kuney joined the Investment Adviser in 2000. | |||
| Timothy Ryan, CFA | Managing Director | Since 2020 | Mr. Ryan joined the Investment Adviser in 2010. | |||
| Sean Brenan | Managing Director | Since 2020 | Mr. Brenan joined the Investment Adviser in 2010. | |||
| Collin Bell | Managing Director | Since 2020 | Mr. Bell joined the Investment Adviser in 1997. | |||
Item 8(a)(2)
The following tables disclose other accounts within each type of category listed below for which the portfolio managers are jointly and primarily responsible for day to day portfolio management, as of September 30, 2021, unless otherwise noted.
| Number of Other Accounts Managed and Total Assets1 by Account Type |
Number of Accounts and Total Assets1 for Which Advisory Fee is Performance-Based |
|||||||||||||||||||||||||||||||||||||||||||||||
| Registered Investment Companies |
Other Pooled Investment Vehicles2 |
Other Accounts3 |
Registered Investment Companies |
Other Pooled Investment Vehicles2 |
Other Accounts3 |
|||||||||||||||||||||||||||||||||||||||||||
| Number of Accounts |
Assets Managed |
Number of Accounts |
Assets Managed |
Number of Accounts |
Assets Managed |
Number of Accounts |
Assets Managed |
Number of Accounts |
Assets Managed |
Number of Accounts |
Assets Managed |
|||||||||||||||||||||||||||||||||||||
| Portfolio Management Team |
||||||||||||||||||||||||||||||||||||||||||||||||
| Kristin Kuney, CFA |
4 | $ | 926.9 | 7 | $ | 1,201.5 | 19 | $ | 892.3 | 0 | $ | 0 | 0 | $ | 0 | 0 | $ | 0 | ||||||||||||||||||||||||||||||
| Timothy Ryan, CFA |
2 | $ | 499.7 | 1 | $ | 839.2 | 10 | $ | 272.7 | 0 | $ | 0 | 0 | $ | 0 | 0 | $ | 0 | ||||||||||||||||||||||||||||||
| Sean Brenan |
0 | $ | 0.0 | 20 | $ | 7,108.9 | 1 | $ | 1,570.9 | 0 | $ | 0 | 13 | $ | 5,152.6 | 0 | $ | 0 | ||||||||||||||||||||||||||||||
| Collin Bell |
2 | $ | 2,649.6 | 0 | $ | 0 | 0 | $ | 0 | 0 | $ | 0 | 0 | $ | 0 | 0 | $ | 0 | ||||||||||||||||||||||||||||||
| † | Footnotes: |
| 1. | Asset information is in USD millions unless otherwise specified. |
| 2. | “Other Pooled Investment Vehicles” includes private investment funds and SICAVs. |
| 3. | “Other Accounts” includes a separately managed account platform, advisory mutual fund platform, advisory relationships and others. For purposes of the above, a platform is included as a single account. |
Item 8(a)(3) —
Compensation for portfolio managers of the Investment Adviser is comprised of a base salary and year-end discretionary variable compensation. The base salary is fixed from year to year. Year-end discretionary variable compensation is primarily a function of each portfolio manager’s individual performance and his or her contribution to overall team performance; the performance of GSAM and Goldman Sachs; the team’s net revenues for the past year which is primarily derived from advisory fees; and anticipated compensation levels among competitor firms. Portfolio managers are rewarded, in part, for their delivery of investment performance, which is reasonably expected to meet or exceed the expectations of clients and fund shareholders in terms of: excess return over an applicable benchmark, peer group ranking, risk management and factors specific to the funds such as yield or regional focus. Performance is judged over 1-, 3- and 5-year time horizons.
The discretionary variable compensation for portfolio managers is also significantly influenced by various factors, including: (1) effective participation in team discussions and process; and (2) management of risk in alignment with the targeted risk parameters and investment objective of the Fund. Other factors may also be considered including: (1) general client/investor orientation and (2) teamwork and leadership.
As part of their year-end discretionary variable compensation and subject to certain eligibility requirements, portfolio managers may receive deferred equity-based and similar awards, in the form of: (1) shares of The Goldman Sachs Group, Inc. (restricted stock units); and, (2) for certain portfolio managers, performance-tracking (or “phantom”) shares of the Fund or multiple funds. Performance-tracking shares are designed to provide a rate of return (net of fees) equal to that of the Fund(s) that a portfolio manager manages, or one or more other eligible funds, as determined by senior management, thereby aligning portfolio manager compensation with fund shareholder interests. The awards are subject to vesting requirements, deferred payment and clawback and forfeiture provisions. GSAM, Goldman Sachs or their affiliates expect, but are not required to, hedge the exposure of the performance-tracking shares of a Fund by, among other things, purchasing shares of the relevant Fund(s).
Other Compensation — In addition to base salary and year-end discretionary variable compensation, the Investment Adviser has a number of additional benefits in place including (1) a 401(k) program that enables employees to direct a percentage of their base salary and bonus income into a tax-qualified retirement plan; and (2) investment opportunity programs in which certain professionals may participate subject to certain eligibility requirements.
Item 8(a)(4)
The following table shows the portfolio managers’ ownership of securities, including those beneficially owned as well as those owned pursuant to the deferred compensation plan discussed above, in the Fund as of September 30, 2021, unless otherwise noted:
| Name of Portfolio Manager |
Dollar Range of Equity Securities Beneficially Owned by Portfolio Manager | |
| Kristin Kuney, CFA |
$100,001-$500,000 | |
| Timothy Ryan, CFA |
None | |
| Sean Brenan |
None | |
| Collin Bell |
None |
| ITEM 9. | PURCHASES OF EQUITY SECURITIES BY CLOSED-END MANAGEMENT INVESTMENT COMPANY AND AFFILIATED PURCHASERS. |
| Not applicable. |
| ITEM 10. | SUBMISSION OF MATTERS TO A VOTE OF SECURITY HOLDERS. |
| There have been no material changes to the procedures by which shareholders may recommend nominees to the registrant’s board of trustees. |
| ITEM 11. | CONTROLS AND PROCEDURES. |
| (a) | The registrant’s principal executive and principal financial officers, or persons performing similar functions have concluded that the registrant’s disclosure controls and procedures (as defined in Rule 30a-3(c) under the Investment Company Act of 1940, as amended (the “1940 Act”)) are effective as of a date within 90 days of the filing of this report that includes the disclosure required by this paragraph, based on the evaluation of these controls and procedures required by Rule 30a-3(b) under the 1940 Act and 15d-15(b) under the Securities Exchange Act of 1934, as amended. |
| (b) | There were no changes in the registrant’s internal control over financial reporting (as defined in Rule 30a-3(d) under the 1940 Act) that occurred during the period covered by this report that have materially affected, or are reasonably likely to materially affect, the registrant’s internal control over financial reporting. |
| ITEM 12. | DISCLOSURE OF SECURITIES LENDING ACTIVITIES FOR CLOSED-END MANAGEMENT INVESTMENT COMPANIES |
| The registrant did not engage in securities lending activities during the fiscal period reported on this Form N-CSR. |
| ITEM 13. | EXHIBITS. |
| (a)(1) | Goldman Sachs Real Estate Diversified Income Fund’s Code of Ethics for Principal Executive and Senior Financial Officers is filed herewith. | |||
| (a)(2) | Exhibit 99.CERT | Certifications pursuant to Section 302 of the Sarbanes-Oxley Act of 2002 filed herewith. | ||
| (a)(3) | None. | |||
| (a)(4) | Not Applicable. | |||
| (b) | Exhibit 99.906CERT | Certifications pursuant to Section 906 of the Sarbanes-Oxley Act of 2002 filed herewith. | ||
SIGNATURES
Pursuant to the requirements of the Securities Exchange Act of 1934 and the Investment Company Act of 1940, the registrant has duly caused this report to be signed on its behalf by the undersigned, thereunto duly authorized.
| Goldman Sachs Real Estate Diversified Income Fund | ||
| By: | /s/ James A. McNamara | |
| James A. McNamara | ||
| President/Chief Executive Officer | ||
| Goldman Sachs Real Estate Diversified Income Fund | ||
| Date: | December 2, 2021 | |
Pursuant to the requirements of the Securities Exchange Act of 1934 and the Investment Company Act of 1940, this report has been signed below by the following persons on behalf of the registrant and in the capacities and on the dates indicated.
| By: | /s/ James A. McNamara | |
| James A. McNamara | ||
| President/Chief Executive Officer | ||
| Goldman Sachs Real Estate Diversified Income Fund | ||
| Date: | December 2, 2021 | |
| By: | /s/ Joseph F. DiMaria | |
| Joseph F. DiMaria | ||
| Principal Financial Officer | ||
| Goldman Sachs Real Estate Diversified Income Fund | ||
| Date: | December 2, 2021 | |
POLICY ON CODE OF ETHICS FOR PRINCIPAL
EXECUTIVE AND SENIOR FINANCIAL OFFICERS
Applicability: All GSAM
This policy is applicable to GST, GS VIT, GST II, CEFs, ETFs, CEIF
| A. | Preamble |
Pursuant to Section 406 of the Sarbanes-Oxley Act of 2002, the Securities and Exchange Commission (the “SEC”) has adopted rules requiring annual disclosure of an investment company’s code of ethics applicable to its principal executive, principal financial and principal accounting officers. Goldman Sachs Trust, Goldman Sachs Variable Insurance Trust, Goldman Sachs Trust II, Goldman Sachs ETF Trust (together, the “Trusts”), Goldman Sachs Real Estate Diversified Income Fund (a “Closed-End Interval Fund”), and Goldman Sachs Closed-End Funds1 (the “Closed-End Funds” and together with the Trusts and Closed-End Interval Fund, the “Registrants”) have adopted this Code of Ethics (the “Code”)
pursuant to these rules.
| B. | Covered Officers/Purpose of Code |
This Code applies to the Principal Executive Officer and Principal Financial Officer/Principal Accounting Officer (the “Covered Officers”) of the Registrants for the purpose of promoting:
| • | honest and ethical conduct, including the ethical handling of actual or apparent conflicts of interest between personal and professional relationships; |
| • | full, fair, accurate, timely and understandable disclosure in reports and documents that the Registrants files with, or submits to, the SEC and in other public communications made by the Registrants; |
| • | compliance with applicable laws and governmental rules and regulations; |
| • | the prompt internal reporting of violations of this Code to an appropriate person or persons identified herein; and |
| • | accountability for adherence to this Code. |
Each Covered Officer owes a duty to the Registrants to adhere to a high standard of business ethics and should be sensitive to situations that may give rise to both actual and apparent conflicts of interest. Each Covered Officer should encourage his or her colleagues who provide services to the Registrants, whether directly or indirectly, to do the same.
| 1 | This Code shall apply to any closed-end management investment company managed by Goldman Sachs Asset Management, L.P. (“GSAM”) or an affiliated person of GSAM, as listed in Schedule A of this Code. |
| Effective Date: April 16, 2018 | For Internal Use Only | Page 1 of 8 |
POLICY ON CODE OF ETHICS FOR PRINCIPAL EXECUTIVE AND SENIOR FINANCIAL OFFICERS
| C. | Covered Officers Should Handle Actual and Apparent Conflicts of Interest Ethically |
A “conflict of interest” occurs when a Covered Officer’s private interest interferes with the interests of, or his or her service to, a Registrant. For example, a conflict of interest would arise if a Covered Officer, or a member of his or her family, received improper personal benefits as a result of his or her position with the Registrant.
Certain conflicts of interest covered by this Code arise out of the relationships between Covered Officers and a Registrant and already are subject to conflict of interest provisions in the Investment Company Act of 1940, as amended (the “1940” Act), and the Investment Advisers Act of 1940, as amended (the “Advisers Act”). For example, Covered Officers may not individually engage in certain transactions (such as the purchase or sale of securities or other property) with the Registrant. The compliance programs and procedures of the Registrants and their investment advisers and distributor (as applicable) are designed to prevent or identify and correct violations of these provisions. This Code does not, and is not intended to, repeat or replace these programs and procedures.
Although they typically do not present an opportunity for improper personal benefit, conflicts arise from, or as a result of, the contractual relationship between the Registrants and their investment advisers and distributor (as applicable), of which the Covered Officers are also officers or employees. As a result, this Code recognizes that the Covered Officers will, in the normal course of their duties, be involved in establishing policies and implementing decisions which will have different effects on the investment advisers, the distributor (as applicable) and the Registrants. The participation of the Covered Officers in such activities is inherent in these contractual relationships and is consistent with the performance by the Covered Officers of their duties as officers of the Registrants and, if addressed in conformity with the provisions of the 1940 Act and the Advisers Act, will be deemed to have been handled ethically.
Other conflicts of interest are covered by this Code, even if such conflicts of interest are not subject to provisions in the 1940 Act and the Advisers Act. Covered Officers should keep in mind that the following list of prohibitions does not cover every possible situation. The overarching principle – that the personal interest of a Covered Officer should not be placed improperly before the interest of the Registrants – should be the guiding principle in all circumstances.
Each Covered Officer must:
| • | not use his or her personal influence or personal relationships improperly to influence investment decisions or financial reporting by the Registrants whereby the Covered Officer would benefit personally to the detriment of the Registrants; |
| • | not cause the Registrants to take action, or fail to take action, for the individual personal benefit of the Covered Officer rather than the benefit of the Registrants; |
| • | not use material non-public knowledge of portfolio transactions made or contemplated for the Registrants to profit personally or cause others to profit by the market effect of such transactions; and |
| Effective Date: April 16, 2018 | For Internal Use Only | Page 2 of 8 |
POLICY ON CODE OF ETHICS FOR PRINCIPAL EXECUTIVE AND SENIOR FINANCIAL OFFICERS
| • | report at least annually his or her affiliations and other relationships as requested in the Registrant’s annual Trustees and Officers Questionnaire. |
There are some conflict of interest situations that may be material and should be discussed with the Secretary of a Registrant. Examples of these include:
| • | any outside business activity that detracts from the ability of a Covered Officer to devote appropriate time and attention to his or her responsibilities as a Covered Officer of the Registrant; |
| • | the receipt of any non-nominal gifts related to the business of the Registrant that may be inconsistent with any policy on gifts established by the Registrant’s investment advisers and distributor (as applicable) from time to time; and |
| • | a direct or indirect personal financial interest in commissions, transaction charges or spreads paid by the Registrant for effecting portfolio transactions or for selling or redeeming shares other than an interest arising from the Covered Officer’s employment, such as compensation or equity ownership. |
| D. | Disclosure |
Each Covered Officer:
| • | must familiarize himself or herself with the disclosure requirements applicable to a Registrant and its disclosure controls and procedures; |
| • | must not knowingly misrepresent, or cause others to misrepresent, facts about the Registrant to others, whether within or outside the Registrant, including to the Registrant’s trustees and auditors and governmental regulators and self-regulatory organizations; |
| • | should, to the extent appropriate within his or her area of responsibility, consult with other officers and employees of the Registrant and its investment advisers and distributor and take other appropriate steps with the goal of promoting full, fair, accurate and timely disclosure in the reports and documents the Registrant files with, or submits to, the SEC and that are signed or certified by him or her; and |
| • | must cooperate with the Registrant’s independent accountants, regulatory agencies and internal auditors in their review or inspection of the Registrant and its operations. |
| E. | Compliance |
It is the responsibility of each Covered Officer to otherwise promote adherence with the standards and restrictions imposed by applicable laws, rules and regulations.
| F. | Reporting and Accountability |
Each Covered Officer must:
| Effective Date: April 16, 2018 | For Internal Use Only | Page 3 of 8 |
POLICY ON CODE OF ETHICS FOR PRINCIPAL EXECUTIVE AND SENIOR FINANCIAL OFFICERS
| • | upon adoption of this Code, affirm in writing that he or she has received and read this Code and understands it; |
| • | annually thereafter affirm that he or she has complied with the requirements of this Code; |
| • | not retaliate against any person for reports of potential violations that are made in good faith; and |
| • | notify the Secretary of a Registrant promptly if he or she knows of any violation of this Code. Failure to do so is itself a violation of this Code. |
The Secretary of the Registrant or the Chief Legal Officer of the Registrant is responsible for applying this Code to specific situations in the event questions are presented under it and has the authority to interpret this Code in any particular situation.
| G. | Investigations and Enforcements |
The Registrants will follow these procedures in investigating and enforcing this Code:
| • | the Secretary of the Registrant or the Chief Legal Officer of the Registrant will take all appropriate action to investigate any violations and potential violations reported to him or her; |
| • | violations will be reported to the Board of Trustees (or Board of Managers, as applicable) of the Registrant (the “Board”) after such investigation; |
| • | if the Board determines that a violation has occurred, it will consider appropriate action, which may, without limitation, include review of, and appropriate modifications to, applicable policies and procedures; notification to appropriate personnel of the investment advisers, distributor or their respective boards; or recommendation of the dismissal of the Covered Officer; |
| • | the Board will be responsible for granting waivers, as appropriate; and |
| • | any changes to or waivers of this Code will, to the extent required, be disclosed as required by SEC rules. |
| H. | Other Policies and Procedures |
The Registrants’ and their investment advisers’ and distributor’s (as applicable) codes of ethics under Rule 17j-1 under the 1940 Act are separate requirements applying to the Covered Officers and others and are not part of this Code.
| I. | Amendments |
This Code may not be amended except in written form, which is specifically approved or ratified by the Board.
| Effective Date: April 16, 2018 | For Internal Use Only | Page 4 of 8 |
POLICY ON CODE OF ETHICS FOR PRINCIPAL EXECUTIVE AND SENIOR FINANCIAL OFFICERS
| J. | Confidentiality |
All reports and records prepared or maintained pursuant to this Code will be considered confidential and will be maintained and protected accordingly. Except as otherwise required by law or this Code, such matters will not be disclosed to anyone other than the Board, the Registrants’ investment advisers and distributor (as applicable), and their respective counsel.
| K. | Internal Use |
This Code is intended solely for the internal use by the Registrants. This Code is a statement of certain fundamental principles, policies and procedures that govern the Covered Officers in the conduct of the Registrants’ business. It is not intended to and does not create any rights in any employee, investor, supplier, competitor, shareholder or any other person.
| Effective Date: April 16, 2018 | For Internal Use Only | Page 5 of 8 |
POLICY ON CODE OF ETHICS FOR PRINCIPAL EXECUTIVE AND SENIOR FINANCIAL OFFICERS
Schedule A
Goldman Sachs Closed-End Funds
Goldman Sachs MLP and Energy Renaissance Fund
Goldman Sachs Real Estate Diversified Income Fund
| Effective Date: April 16, 2018 | For Internal Use Only | Page 6 of 8 |
POLICY ON CODE OF ETHICS FOR PRINCIPAL EXECUTIVE AND SENIOR FINANCIAL OFFICERS
Additional Revision History2
| • | December 18, 2019 (Addition of Goldman Sachs Credit Income Fund and Goldman Sachs Real Estate Diversified Income Fund and removal of Goldman Sachs Private Markets Fund 2018 LLC, Goldman Sachs Private Markets Fund 2018 (A) LLC and Goldman Sachs Private Markets Fund 2018 (B) LLC) |
| • | December 7, 2017 (Addition of Goldman Sachs Private Markets Fund 2018 LLC, Goldman Sachs Private Markets Fund 2018 (A) LLC and Goldman Sachs Private Markets Fund 2018 (B) LLC) |
| • | April 16, 2015 (Addition of Goldman Sachs ETF Trust) |
| • | August 14, 2014 (Addition of Goldman Sachs MLP and Energy Renaissance Fund) |
| • | October 17, 2013 (Addition of Goldman Sachs MLP Income Opportunities Fund) |
| • | April 16, 2013 (GST II - Initial Approval) |
| • | July 31, 2003 (GST - First web posting |
| 2 | Due to system limitations the revision history in this section was not migrated from PLS to GS DOCS. The revision history in this section is in addition to the Revision History at the end of this policy/procedure. |
| Effective Date: April 16, 2018 | For Internal Use Only | Page 7 of 8 |
POLICY ON CODE OF ETHICS FOR PRINCIPAL EXECUTIVE AND SENIOR FINANCIAL OFFICERS
REVISION HISTORY
| 1. | Version 5.5, April 16, 2021 (Current version: Routine review cycle; Added Goldman Sachs Real Estate Diversified Income Fund, removed Goldman Sachs MLP Income Opportunities Fund from Appendix A, and made typographical changes.) |
| 2. | Version 5.4, June 30, 2020 (Other; Removing GS Credit Income Fund) |
| 3. | Version 5.3, April 09, 2020 (Other; Reformatting the revision history) |
| 4. | Version 5.2, April 07, 2020 (Other; Reformatting, adding a footnote in the additional revision history section of the policy.) |
| 5. | Version 5.1, April 02, 2020 (Onboard to new application/document format) |
| 6. | Version 5.0, June 02, 2018 (Revised to combine the policy for GST and GSVIT with GST II, CEF, and ETF) |
| 7. | Version 4.0, April 01, 2016 (GST - Revised to delete GS Credit Strategies Fund) |
| 8. | Version 3.0, September 17, 2013 (Adding revision history; GST - Reviewed and re-approved without change) |
| 9. | Version 2.0, June 28, 2013 (Reviewed and reapproved without change) |
| 10. | Version 1.0, March 10, 2012 (New Document) |
| Effective Date: April 16, 2018 | For Internal Use Only | Page 8 of 8 |
CERTIFICATIONS
(Section 302)
I, James A. McNamara, certify that:
1. I have reviewed this report on Form N-CSR of the Goldman Sachs Real Estate Diversified Income Fund;
2. Based on my knowledge, this report does not contain any untrue statement of a material fact or omit to state a material fact necessary to make the statements made, in light of the circumstances under which such statements were made, not misleading with respect to the period covered by this report;
3. Based on my knowledge, the financial statements, and other financial information included in this report, fairly present in all material respects the financial condition, results of operations, changes in net assets, and cash flows (if the financial statements are required to include a statement of cash flows) of the registrant as of, and for, the periods presented in this report;
4. The registrant’s other certifying officer(s) and I are responsible for establishing and maintaining disclosure controls and procedures (as defined in Rule 30a-3(c) under the Investment Company Act of 1940) and internal control over financial reporting (as defined in Rule 30a-3(d) under the Investment Company Act of 1940) for the registrant and have:
(a) Designed such disclosure controls and procedures, or caused such disclosure controls and procedures to be designed under our supervision, to ensure that material information relating to the registrant, including its consolidated subsidiaries, is made known to us by others within those entities, particularly during the period in which this report is being prepared;
(b) Designed such internal control over financial reporting, or caused such internal control over financial reporting to be designed under our supervision, to provide reasonable assurance regarding the reliability of financial reporting and the preparation of financial statements for external purposes in accordance with generally accepted accounting principles;
(c) Evaluated the effectiveness of the registrant’s disclosure controls and procedures and presented in this report our conclusions about the effectiveness of the disclosure controls and procedures, as of a date within 90 days prior to the filing date of this report based on such evaluation; and
(d) Disclosed in this report any change in the registrant’s internal control over financial reporting that occurred during the period covered by this report that has materially affected, or is reasonably likely to materially affect, the registrant’s internal control over financial reporting; and
5. The registrant’s other certifying officer(s) and I have disclosed to the registrant’s auditors and the audit committee of the registrant’s board of directors (or persons performing the equivalent functions):
(a) All significant deficiencies and material weaknesses in the design or operation of internal control over financial reporting which are reasonably likely to adversely affect the registrant’s ability to record, process, summarize, and report financial information; and
(b) Any fraud, whether or not material, that involves management or other employees who have a significant role in the registrant’s internal control over financial reporting.
Dated: December 2, 2021
| /s/ James A. McNamara |
| James A. McNamara |
| President/Chief Executive Officer |
CERTIFICATIONS
(Section 302)
I, Joseph F. DiMaria, certify that:
1. I have reviewed this report on Form N-CSR of the Goldman Sachs Real Estate Diversified Income Fund;
2. Based on my knowledge, this report does not contain any untrue statement of a material fact or omit to state a material fact necessary to make the statements made, in light of the circumstances under which such statements were made, not misleading with respect to the period covered by this report;
3. Based on my knowledge, the financial statements, and other financial information included in this report, fairly present in all material respects the financial condition, results of operations, changes in net assets, and cash flows (if the financial statements are required to include a statement of cash flows) of the registrant as of, and for, the periods presented in this report;
4. The registrant’s other certifying officer(s) and I are responsible for establishing and maintaining disclosure controls and procedures (as defined in Rule 30a-3(c) under the Investment Company Act of 1940) and internal control over financial reporting (as defined in Rule 30a-3(d) under the Investment Company Act of 1940) for the registrant and have:
(a) Designed such disclosure controls and procedures, or caused such disclosure controls and procedures to be designed under our supervision, to ensure that material information relating to the registrant, including its consolidated subsidiaries, is made known to us by others within those entities, particularly during the period in which this report is being prepared;
(b) Designed such internal control over financial reporting, or caused such internal control over financial reporting to be designed under our supervision, to provide reasonable assurance regarding the reliability of financial reporting and the preparation of financial statements for external purposes in accordance with generally accepted accounting principles;
(c) Evaluated the effectiveness of the registrant’s disclosure controls and procedures and presented in this report our conclusions about the effectiveness of the disclosure controls and procedures, as of a date within 90 days prior to the filing date of this report based on such evaluation; and
(d) Disclosed in this report any change in the registrant’s internal control over financial reporting that occurred during the period covered by this report that has materially affected, or is reasonably likely to materially affect, the registrant’s internal control over financial reporting; and
5. The registrant’s other certifying officer(s) and I have disclosed to the registrant’s auditors and the audit committee of the registrant’s board of directors (or persons performing the equivalent functions):
(a) All significant deficiencies and material weaknesses in the design or operation of internal control over financial reporting which are reasonably likely to adversely affect the registrant’s ability to record, process, summarize, and report financial information; and
(b) Any fraud, whether or not material, that involves management or other employees who have a significant role in the registrant’s internal control over financial reporting.
Dated: December 2, 2021
| /s/ Joseph F. DiMaria |
| Joseph F. DiMaria |
| Principal Financial Officer |
EX-99.906CERT
Certification Under Section 906
of the Sarbanes-Oxley Act of 2002
James A. McNamara, President/Chief Executive Officer, and Joseph F. DiMaria, Principal Financial Officer of the Goldman Sachs Real Estate Diversified Income Fund (the “Registrant”), each certify to the best of his or her knowledge that:
| 1. | The Registrant’s periodic report on Form N-CSR for the period ended September 30, 2021 (the “Form N-CSR”) fully complies with the requirements of section 15(d) of the Securities Exchange Act of 1934, as amended; and |
| 2. | The information contained in the Form N-CSR fairly presents, in all material respects, the financial condition and results of operations of the Registrant. |
| President/Chief Executive Officer | Principal Financial Officer | |||||
| Goldman Sachs Real Estate Diversified Income Fund | Goldman Sachs Real Estate Diversified Income Fund | |||||
| /s/ James A. McNamara |
/s/ Joseph F. DiMaria | |||||
| James A. McNamara | Joseph F. DiMaria | |||||
| December 2, 2021 |
December 2, 2021 | |||||
This certification is being furnished to the Securities and Exchange Commission pursuant to Rule 30a-2(b) under the Investment Company Act of 1940, as amended, and 18 U.S.C. § 1350 and is not being filed as part of the Form N-CSR with the Securities and Exchange Commission.
Serious News for Serious Traders! Try StreetInsider.com Premium Free!
You May Also Be Interested In
- Eversource Energy (ES) to Sell 50% Stake in Sunrise Wind to Orsted
- Infosys Technologies (INFY) PT Lowered to $19.90 at Goldman Sachs
Create E-mail Alert Related Categories
SEC FilingsRelated Entities
Goldman SachsSign up for StreetInsider Free!
Receive full access to all new and archived articles, unlimited portfolio tracking, e-mail alerts, custom newswires and RSS feeds - and more!
