

Form N-CSR Fidelity Rutland Square For: May 31
 Tweet
Tweet Share
ShareUNITED STATES
SECURITIES AND EXCHANGE COMMISSION
Washington, D.C. 20549
FORM N-CSR
CERTIFIED SHAREHOLDER REPORT OF REGISTERED
MANAGEMENT INVESTMENT COMPANIES
Investment Company Act file number 811-21991
Fidelity Rutland Square Trust II
(Exact name of registrant as specified in charter)
245 Summer St., Boston, Massachusetts 02210
(Address of principal executive offices) (Zip code)
Christina H. Lee, Secretary
245 Summer St.
Boston, Massachusetts 02210
(Name and address of agent for service)
Registrant's telephone number, including area code:
617-563-7000
Date of fiscal year end: | May 31 |
Date of reporting period: | May 31, 2021 |
Item 1.
Reports to Stockholders
Strategic Advisers® Short Duration Fund
Offered exclusively to certain managed account clients of Strategic Advisers LLC or its affiliates - not available for sale to the general public
May 31, 2021

Contents
To view a fund's proxy voting record for the 12-month period ended June 30, visit http://www.fidelity.com/proxyvotingresults or visit the Securities and Exchange Commission's (SEC) web site at http://www.sec.gov.
You may also call 1-800-544-3455 to request a free copy of the proxy voting guidelines.
Standard & Poor's, S&P and S&P 500 are registered service marks of The McGraw-Hill Companies, Inc. and have been licensed for use by Fidelity Distributors Corporation.
Other third-party marks appearing herein are the property of their respective owners.
All other marks appearing herein are registered or unregistered trademarks or service marks of FMR LLC or an affiliated company. © 2021 FMR LLC. All rights reserved.
This report and the financial statements contained herein are submitted for the general information of the shareholders of the Fund. This report is not authorized for distribution to prospective investors in the Fund unless preceded or accompanied by an effective prospectus.
A fund files its complete schedule of portfolio holdings with the SEC for the first and third quarters of each fiscal year on Form N-PORT. Forms N-PORT are available on the SEC’s web site at http://www.sec.gov. A fund's Forms N-PORT may be reviewed and copied at the SEC’s Public Reference Room in Washington, DC. Information regarding the operation of the SEC's Public Reference Room may be obtained by calling 1-800-SEC-0330.
For a complete list of a fund's portfolio holdings, view the most recent holdings listing, semiannual report, or annual report on Fidelity's web site at http://www.fidelity.com, http://www.institutional.fidelity.com, or http://www.401k.com, as applicable.
NOT FDIC INSURED •MAY LOSE VALUE •NO BANK GUARANTEE
Neither the Fund nor Fidelity Distributors Corporation is a bank.
Note to Shareholders:
Early in 2020, the outbreak and spread of a new coronavirus emerged as a public health emergency that had a major influence on financial markets, primarily based on its impact on the global economy and the outlook for corporate earnings. The virus causes a respiratory disease known as COVID-19. On March 11, 2020 the World Health Organization declared the COVID-19 outbreak a pandemic, citing sustained risk of further global spread.
In the weeks following, as the crisis worsened, we witnessed an escalating human tragedy with wide-scale social and economic consequences from coronavirus-containment measures. The outbreak of COVID-19 prompted a number of measures to limit the spread, including travel and border restrictions, quarantines, and restrictions on large gatherings. In turn, these resulted in lower consumer activity, diminished demand for a wide range of products and services, disruption in manufacturing and supply chains, and – given the wide variability in outcomes regarding the outbreak – significant market uncertainty and volatility. Amid the turmoil, global governments and central banks took unprecedented action to help support consumers, businesses, and the broader economies, and to limit disruption to financial systems.
The situation continues to unfold, and the extent and duration of its impact on financial markets and the economy remain highly uncertain. Extreme events such as the coronavirus crisis are “exogenous shocks” that can have significant adverse effects on mutual funds and their investments. Although multiple asset classes may be affected by market disruption, the duration and impact may not be the same for all types of assets.
Fidelity is committed to helping you stay informed amid news about COVID-19 and during increased market volatility, and we’re taking extra steps to be responsive to customer needs. We encourage you to visit our websites, where we offer ongoing updates, commentary, and analysis on the markets and our funds.
Performance: The Bottom Line
Average annual total return reflects the change in the value of an investment, assuming reinvestment of distributions from dividend income and capital gains (the profits earned upon the sale of securities that have grown in value, if any) and assuming a constant rate of performance each year. The hypothetical investment and the average annual total returns do not reflect the deduction of taxes that a shareholder would pay on fund distributions or the redemption of fund shares. During periods of reimbursement by Fidelity, a fund’s total return will be greater than it would be had the reimbursement not occurred. How a fund did yesterday is no guarantee of how it will do tomorrow.
Average Annual Total Returns
| For the periods ended May 31, 2021 | Past 1 year | Past 5 years | Life of fundA |
| Strategic Advisers® Short Duration Fund | 1.86% | 2.04% | 1.54% |
A From December 20, 2011
$10,000 Over Life of Fund
Let's say hypothetically that $10,000 was invested in Strategic Advisers® Short Duration Fund on December 20, 2011, when the fund started.
The chart shows how the value of your investment would have changed, and also shows how the FTSE 6-Month U.S. Treasury Bill Index performed over the same period.

| Period Ending Values | ||
|
| $11,558 | Strategic Advisers® Short Duration Fund |
|
| $10,695 | FTSE 6-Month U.S. Treasury Bill Index |
Management's Discussion of Fund Performance
Market Recap: U.S. taxable investment-grade bonds posted a modest decline for the 12 months ending May 31, 2021, hampered by rising long-term market rates amid faster economic expansion in a risk-on market environment. The Bloomberg Barclays U.S. Aggregate Bond Index returned -0.40% for the period. Aggressive intervention by the U.S. Federal Reserve boosted market liquidity and led to a broad rally for fixed-income assets from the start of the period through July 2020. Long-term yields reached a historic low in August 2020, and spreads widened modestly amid healthy issuance of new corporate bonds. Spreads then narrowed and yields rose through the early spring, before each moderated slightly beginning in April through the end of May. In February 2021, yields rose the most because a $1.9 trillion COVID-relief bill offered hopes for a broad economic recovery but led to rising inflation expectations, which persisted through period end. Within the Bloomberg Barclays index, corporate bonds advanced 3.64% for the 12 months, significantly topping the -3.75% return of U.S. Treasuries. Securitized sectors, meanwhile, roughly broke even. Outside the index, U.S. corporate high-yield bonds added 14.96% and Treasury Inflation-Protected Securities (TIPS) rose 7.05%. Comments from Lead Portfolio Manager Jonathan Duggan: For the fiscal year ending May 31, 2021, the Fund gained 1.86%, outpacing the 0.22% increase in the benchmark FTSE® 6-Month U.S. Treasury Bill Index. Within the Fund, after increasing credit risk following the market turmoil of March 2020, I reduced risk late in 2020 and into early 2021. I did this by adjusting underlying manager allocations. Versus the benchmark, PIMCO Short-Term Fund (+2.6%), along with sub-advisers T. Rowe Price (+3.6%) and FIAM® (+1.4%), added the most value. All three benefited from strong security selection among investment-grade corporate bonds. They also had underweighted exposure to short-term U.S. Treasuries, which trailed the benchmark. In the case of T. Rowe Price, modifying its portfolio duration also helped this manager's performance. More specifically, it shifted from having a duration that was longer than the broader Fund's benchmark during the fourth quarter of 2020, to shorter-than-benchmark positioning in early 2021. Additionally, holdings of asset-backed securities (ABS) and commercial mortgage-backed securities aided this manager’s performance. The majority of FIAM’s portfolio was invested in higher-quality, floating-rate corporate bonds, many of which were issued by financial institutions. It also had a substantial allocation to ABS. The higher yields offered by this combination of holdings helped this strategy outperform. BlackRock Low Duration Fund (+3.5%) was another key contributor, benefiting from corporate bonds in groups that rallied amid positive sentiment about the economy reopening, such as energy and travel & leisure. I’m pleased to report that there were no notable detractors during the period. We organize the Fund's investments into three categories: money market/low volatility; low duration (averaging less than one year); and short-term (an average duration of one to two years). Given the extended valuation of investment-grade credit, we reduced credit risk in the portfolio during the second half of the period by cutting exposure to short-term managers. As of May 31, roughly three-quarters of the portfolio was allocated to money market and low-duration strategies.The views expressed above reflect those of the portfolio manager(s) only through the end of the period as stated on the cover of this report and do not necessarily represent the views of Fidelity or any other person in the Fidelity organization. Any such views are subject to change at any time based upon market or other conditions and Fidelity disclaims any responsibility to update such views. These views may not be relied on as investment advice and, because investment decisions for a Fidelity fund are based on numerous factors, may not be relied on as an indication of trading intent on behalf of any Fidelity fund.
Investment Summary (Unaudited)
The information in the following tables is based on the direct investments of the Fund.Top Ten Holdings as of May 31, 2021
| (excluding cash equivalents) | % of fund's net assets |
| PIMCO Short-Term Fund Institutional Class | 13.6 |
| Baird Ultra Short Bond Fund Institutional Class | 6.3 |
| PIMCO Enhanced Short Maturity Active ETF | 5.2 |
| Fidelity SAI Short-Term Bond Fund | 4.6 |
| BlackRock Low Duration Bond Portfolio Investor A Shares | 4.5 |
| T. Rowe Price Ultra Short-Term Bond Fund | 3.7 |
| iShares Short Maturity Bond ETF | 3.4 |
| Metropolitan West Low Duration Bond Fund - Class M | 3.4 |
| JPMorgan Ultra-Short Income ETF | 3.3 |
| Baird Short-Term Bond Fund - Institutional Class | 2.8 |
Asset Allocation (% of fund's net assets)
| As of May 31, 2021 | ||
| Corporate Bonds | 22.9% | |
| U.S. Government and U.S. Government Agency Obligations | 3.0% | |
| Asset-Backed Securities | 6.8% | |
| CMOs and Other Mortgage Related Securities | 2.2% | |
| Municipal Securities | 0.1% | |
| Other Investments | 0.2% | |
| Short-Term Funds | 56.1% | |
| Short-Term Investments and Net Other Assets (Liabilities) | 8.7% | |

Asset allocations of funds in the pie chart reflect the categorizations of assets as defined by Morningstar as of the reporting date.
Schedule of Investments May 31, 2021
Showing Percentage of Net Assets
| Nonconvertible Bonds - 22.9% | |||
| Principal Amount | Value | ||
| COMMUNICATION SERVICES - 1.0% | |||
| Diversified Telecommunication Services - 0.5% | |||
| AT&T, Inc. 0.9% 3/25/24 | $2,145,000 | $2,150,852 | |
| NBN Co. Ltd. 1.45% 5/5/26 (a) | 1,765,000 | 1,762,784 | |
| NTT Finance Corp.: | |||
| 0.373% 3/3/23 (a) | 5,265,000 | 5,269,475 | |
| 0.583% 3/1/24 (a) | 2,184,000 | 2,187,178 | |
| SBA Tower Trust 3.448% 3/15/48 (a) | 880,000 | 926,468 | |
| Verizon Communications, Inc.: | |||
| 3 month U.S. LIBOR + 1.000% 1.1895% 3/16/22 (b)(c) | 15,233,000 | 15,346,491 | |
| U.S. Secured Overnight Finl Rate (SOFR) Indx + 0.500% 0.51% 3/22/24 (b)(c) | 2,563,000 | 2,581,018 | |
| 0.75% 3/22/24 | 715,000 | 720,925 | |
| 0.85% 11/20/25 | 710,000 | 703,015 | |
| 1.45% 3/20/26 | 1,155,000 | 1,166,256 | |
| 32,814,462 | |||
| Entertainment - 0.1% | |||
| The Walt Disney Co. 3% 9/15/22 | 4,273,000 | 4,426,317 | |
| Interactive Media & Services - 0.0% | |||
| Baidu.com, Inc. 3.5% 11/28/22 | 780,000 | 810,615 | |
| Media - 0.2% | |||
| Charter Communications Operating LLC/Charter Communications Operating Capital Corp.: | |||
| 4.464% 7/23/22 | 3,670,000 | 3,813,966 | |
| 4.908% 7/23/25 | 2,145,000 | 2,439,174 | |
| Comcast Corp. 3.1% 4/1/25 | 355,000 | 384,910 | |
| COX Communications, Inc.: | |||
| 2.95% 6/30/23 (a) | 690,000 | 723,074 | |
| 3.15% 8/15/24 (a) | 1,600,000 | 1,717,396 | |
| Fox Corp. 3.666% 1/25/22 | 260,000 | 265,733 | |
| RELX Capital, Inc. 3.5% 3/16/23 | 575,000 | 604,648 | |
| TWDC Enterprises 18 Corp. 3 month U.S. LIBOR + 0.390% 0.5734% 3/4/22 (b)(c) | 5,000,000 | 5,012,494 | |
| WPP Finance 2010 3.625% 9/7/22 | 310,000 | 322,163 | |
| 15,283,558 | |||
| Wireless Telecommunication Services - 0.2% | |||
| CC Holdings GS V LLC/Crown Castle GS III Corp. 3.849% 4/15/23 | 2,615,000 | 2,778,186 | |
| Rogers Communications, Inc. 3 month U.S. LIBOR + 0.600% 0.7866% 3/22/22 (b)(c) | 5,520,000 | 5,537,957 | |
| T-Mobile U.S.A., Inc. 3.5% 4/15/25 | 1,005,000 | 1,090,681 | |
| 9,406,824 | |||
| TOTAL COMMUNICATION SERVICES | 62,741,776 | ||
| CONSUMER DISCRETIONARY - 1.3% | |||
| Automobiles - 1.0% | |||
| American Honda Finance Corp.: | |||
| 3 month U.S. LIBOR + 0.150% 0.3001% 2/22/23 (b)(c) | 3,342,000 | 3,343,692 | |
| 3 month U.S. LIBOR + 0.290% 0.4725% 12/10/21 (b)(c) | 5,000,000 | 5,007,036 | |
| 0.4% 10/21/22 | 2,775,000 | 2,779,645 | |
| BMW U.S. Capital LLC: | |||
| 3 month U.S. LIBOR + 0.500% 0.6603% 8/13/21 (a)(b)(c) | 830,000 | 830,858 | |
| U.S. Secured Overnight Finl Rate (SOFR) Indx + 0.530% 0.54% 4/1/24 (a)(b)(c) | 5,925,000 | 5,965,586 | |
| Daimler Finance North America LLC: | |||
| 3 month U.S. LIBOR + 0.840% 1.0156% 5/4/23 (a)(b)(c) | 3,240,000 | 3,275,515 | |
| 3 month U.S. LIBOR + 0.900% 1.0559% 2/15/22 (a)(b)(c) | 5,000,000 | 5,025,546 | |
| 1.75% 3/10/23 (a) | 1,800,000 | 1,841,152 | |
| General Motors Co.: | |||
| 4.875% 10/2/23 | 730,000 | 798,321 | |
| 5.4% 10/2/23 | 1,130,000 | 1,249,871 | |
| General Motors Financial Co., Inc.: | |||
| U.S. Secured Overnight Finl Rate (SOFR) Indx + 0.760% 0.77% 3/8/24 (b)(c) | 4,061,000 | 4,090,686 | |
| U.S. Secured Overnight Finl Rate (SOFR) Indx + 1.200% 1.21% 11/17/23 (b)(c) | 5,000,000 | 5,093,450 | |
| 2.9% 2/26/25 | 1,880,000 | 1,988,364 | |
| 3.2% 7/6/21 | 510,000 | 510,161 | |
| 4.2% 11/6/21 | 370,000 | 376,129 | |
| Harley-Davidson Financial Services, Inc.: | |||
| 2.55% 6/9/22 (a) | 375,000 | 380,977 | |
| 4.05% 2/4/22 (a) | 1,210,000 | 1,239,566 | |
| Nissan Motor Acceptance Corp.: | |||
| 2.6% 9/28/22 (a) | 1,365,000 | 1,396,560 | |
| 2.65% 7/13/22 (a) | 200,000 | 203,715 | |
| 3.65% 9/21/21 (a) | 580,000 | 585,293 | |
| Nissan Motor Co. Ltd. 3.043% 9/15/23 (a) | 985,000 | 1,030,695 | |
| Volkswagen Group of America Finance LLC: | |||
| 0.75% 11/23/22 (a) | 10,620,000 | 10,671,084 | |
| 0.875% 11/22/23 (a) | 590,000 | 592,934 | |
| 2.5% 9/24/21 (a) | 280,000 | 281,980 | |
| 2.7% 9/26/22 (a) | 650,000 | 669,335 | |
| 2.9% 5/13/22 (a) | 2,663,000 | 2,726,778 | |
| 3.125% 5/12/23 (a) | 355,000 | 373,476 | |
| 62,328,405 | |||
| Hotels, Restaurants & Leisure - 0.1% | |||
| Expedia, Inc. 3.6% 12/15/23 (a) | 1,270,000 | 1,357,107 | |
| Marriott International, Inc.: | |||
| 2.3% 1/15/22 | 90,000 | 90,834 | |
| 3.125% 2/15/23 | 290,000 | 298,981 | |
| 3.6% 4/15/24 | 700,000 | 747,915 | |
| Starbucks Corp. 2.7% 6/15/22 | 435,000 | 444,197 | |
| 2,939,034 | |||
| Household Durables - 0.0% | |||
| Panasonic Corp. 2.536% 7/19/22 (a) | 785,000 | 801,578 | |
| Internet & Direct Marketing Retail - 0.0% | |||
| QVC, Inc. 4.375% 3/15/23 | 1,170,000 | 1,227,962 | |
| Leisure Products - 0.0% | |||
| Hasbro, Inc.: | |||
| 2.6% 11/19/22 | 885,000 | 911,660 | |
| 3% 11/19/24 | 1,190,000 | 1,269,885 | |
| 2,181,545 | |||
| Multiline Retail - 0.0% | |||
| Nordstrom, Inc. 2.3% 4/8/24 (a) | 150,000 | 150,541 | |
| Specialty Retail - 0.1% | |||
| AutoZone, Inc. 3.625% 4/15/25 | 485,000 | 531,071 | |
| O'Reilly Automotive, Inc. 3.8% 9/1/22 | 385,000 | 398,015 | |
| Ross Stores, Inc.: | |||
| 0.875% 4/15/26 | 450,000 | 441,232 | |
| 4.6% 4/15/25 | 2,310,000 | 2,614,728 | |
| TJX Companies, Inc. 3.5% 4/15/25 | 770,000 | 843,012 | |
| 4,828,058 | |||
| Textiles, Apparel & Luxury Goods - 0.1% | |||
| Ralph Lauren Corp. 1.7% 6/15/22 | 225,000 | 228,414 | |
| VF Corp. 2.05% 4/23/22 | 6,772,000 | 6,878,323 | |
| 7,106,737 | |||
| TOTAL CONSUMER DISCRETIONARY | 81,563,860 | ||
| CONSUMER STAPLES - 0.6% | |||
| Beverages - 0.1% | |||
| Coca-Cola European Partners PLC 0.8% 5/3/24 (a) | 2,005,000 | 2,006,412 | |
| Diageo Capital PLC 1.375% 9/29/25 | 680,000 | 692,622 | |
| Molson Coors Beverage Co. 3.5% 5/1/22 | 3,209,000 | 3,302,545 | |
| 6,001,579 | |||
| Food & Staples Retailing - 0.1% | |||
| 7-Eleven, Inc.: | |||
| 3 month U.S. LIBOR + 0.450% 0.612% 8/10/22 (a)(b)(c) | 300,000 | 300,255 | |
| 0.625% 2/10/23 (a) | 1,072,000 | 1,073,240 | |
| 0.8% 2/10/24 (a) | 1,448,000 | 1,446,659 | |
| Prosperous Ray Ltd. 4.625% 11/12/23 (Reg. S) | 1,200,000 | 1,293,975 | |
| 4,114,129 | |||
| Food Products - 0.2% | |||
| Archer Daniels Midland Co. 2.75% 3/27/25 | 285,000 | 304,892 | |
| Bunge Ltd. Finance Corp.: | |||
| 3% 9/25/22 | 3,375,000 | 3,476,569 | |
| 4.35% 3/15/24 | 130,000 | 142,246 | |
| Cargill, Inc. 1.375% 7/23/23 (a) | 630,000 | 643,127 | |
| China Mengniu Dairy Co. Ltd. 1.875% 6/17/25 (Reg. S) | 2,004,000 | 1,994,962 | |
| Mondelez International, Inc. 0.625% 7/1/22 | 6,350,000 | 6,374,645 | |
| 12,936,441 | |||
| Tobacco - 0.2% | |||
| BAT International Finance PLC 1.668% 3/25/26 | 885,000 | 883,158 | |
| Imperial Tobacco Finance PLC: | |||
| 3.125% 7/26/24 (a) | 235,000 | 247,903 | |
| 3.5% 2/11/23 (a) | 1,755,000 | 1,819,369 | |
| 3.75% 7/21/22 (a) | 3,390,000 | 3,487,838 | |
| Philip Morris International, Inc. 1.125% 5/1/23 | 9,481,000 | 9,639,364 | |
| 16,077,632 | |||
| TOTAL CONSUMER STAPLES | 39,129,781 | ||
| ENERGY - 1.2% | |||
| Energy Equipment & Services - 0.0% | |||
| Schlumberger Finance Canada Ltd. 1.4% 9/17/25 | 290,000 | 295,453 | |
| Schlumberger Holdings Corp.: | |||
| 3.75% 5/1/24 (a) | 1,515,000 | 1,636,608 | |
| 4% 12/21/25 (a) | 375,000 | 418,309 | |
| 2,350,370 | |||
| Oil, Gas & Consumable Fuels - 1.2% | |||
| Aker BP ASA: | |||
| 3% 1/15/25 (a) | 995,000 | 1,038,608 | |
| 4.75% 6/15/24 (a) | 980,000 | 1,004,022 | |
| Canadian Natural Resources Ltd. 2.05% 7/15/25 | 1,430,000 | 1,467,023 | |
| Cenovus Energy, Inc.: | |||
| 3% 8/15/22 | 1,725,000 | 1,763,159 | |
| 3.8% 9/15/23 | 505,000 | 533,396 | |
| Cheniere Corpus Christi Holdings LLC: | |||
| 5.875% 3/31/25 | 1,470,000 | 1,688,905 | |
| 7% 6/30/24 | 1,625,000 | 1,867,371 | |
| Chevron Corp.: | |||
| 3 month U.S. LIBOR + 0.480% 0.6643% 3/3/22 (b)(c) | 4,700,000 | 4,715,195 | |
| 1.141% 5/11/23 | 4,174,000 | 4,243,859 | |
| Diamondback Energy, Inc.: | |||
| 2.875% 12/1/24 | 2,720,000 | 2,892,408 | |
| 4.75% 5/31/25 | 1,080,000 | 1,222,691 | |
| Enbridge, Inc.: | |||
| U.S. Secured Overnight Finl Rate (SOFR) Indx + 0.400% 0.41% 2/17/23 (b)(c) | 1,892,000 | 1,894,325 | |
| 2.5% 1/15/25 | 985,000 | 1,034,117 | |
| 4% 10/1/23 | 1,605,000 | 1,716,937 | |
| Energy Transfer LP: | |||
| 2.9% 5/15/25 | 255,000 | 268,571 | |
| 3.45% 1/15/23 | 110,000 | 113,931 | |
| 4.2% 9/15/23 | 280,000 | 300,057 | |
| 4.25% 3/15/23 | 1,425,000 | 1,500,311 | |
| 4.25% 4/1/24 | 70,000 | 75,829 | |
| 4.9% 2/1/24 | 245,000 | 267,628 | |
| 5.875% 1/15/24 | 2,375,000 | 2,642,323 | |
| Eni SpA 4% 9/12/23 (a) | 1,325,000 | 1,421,018 | |
| Enterprise Products Operating LP 3.5% 2/1/22 | 1,050,000 | 1,072,949 | |
| EOG Resources, Inc. 2.625% 3/15/23 | 291,000 | 301,229 | |
| EQT Corp. 3% 10/1/22 | 2,275,000 | 2,324,595 | |
| Gray Oak Pipeline LLC: | |||
| 2% 9/15/23 (a) | 205,000 | 209,255 | |
| 2.6% 10/15/25 (a) | 385,000 | 396,685 | |
| Kinder Morgan Energy Partners LP 3.95% 9/1/22 | 135,000 | 139,859 | |
| MPLX LP 3 month U.S. LIBOR + 1.100% 1.2854% 9/9/22 (b)(c) | 1,683,000 | 1,684,027 | |
| Occidental Petroleum Corp. 2.6% 8/13/21 | 990,000 | 992,475 | |
| Phillips 66 Co. 3 month U.S. LIBOR + 0.620% 0.7759% 2/15/24 (b)(c) | 10,000,000 | 10,015,210 | |
| Pioneer Natural Resources Co.: | |||
| 0.55% 5/15/23 | 3,792,000 | 3,804,438 | |
| 0.75% 1/15/24 | 610,000 | 610,704 | |
| Plains All American Pipeline LP/PAA Finance Corp. 2.85% 1/31/23 | 1,275,000 | 1,310,401 | |
| Reliance Industries Ltd. 5.4% 2/14/22 (Reg. S) | 1,700,000 | 1,753,839 | |
| Sabine Pass Liquefaction LLC: | |||
| 5.625% 4/15/23 (b) | 1,345,000 | 1,451,050 | |
| 6.25% 3/15/22 | 2,495,000 | 2,570,794 | |
| Saudi Arabian Oil Co. 2.75% 4/16/22 (a) | 1,815,000 | 1,848,804 | |
| Suncor Energy, Inc. 2.8% 5/15/23 | 975,000 | 1,016,913 | |
| The Williams Companies, Inc.: | |||
| 3.35% 8/15/22 | 200,000 | 205,666 | |
| 3.7% 1/15/23 | 2,205,000 | 2,297,641 | |
| 4.3% 3/4/24 | 305,000 | 333,532 | |
| Valero Energy Corp.: | |||
| 1.2% 3/15/24 | 715,000 | 723,129 | |
| 2.7% 4/15/23 | 1,430,000 | 1,487,324 | |
| 3.65% 3/15/25 | 245,000 | 266,570 | |
| Western Gas Partners LP 4% 7/1/22 | 1,800,000 | 1,842,660 | |
| 72,331,433 | |||
| TOTAL ENERGY | 74,681,803 | ||
| FINANCIALS - 13.2% | |||
| Banks - 7.2% | |||
| Abbey National PLC 2.1% 1/13/23 | 990,000 | 1,018,251 | |
| ABN AMRO Bank NV 3 month U.S. LIBOR + 0.570% 0.7085% 8/27/21 (a)(b)(c) | 10,813,000 | 10,826,327 | |
| Banco Bilbao Vizcaya Argentaria SA 0.875% 9/18/23 | 1,800,000 | 1,814,289 | |
| Banco del Estado de Chile 2.704% 1/9/25 (a) | 665,000 | 691,517 | |
| Banco Santander Mexico SA 4.125% 11/9/22 (Reg. S) | 1,750,000 | 1,824,156 | |
| Bank Ireland Group PLC 4.5% 11/25/23 (a) | 2,455,000 | 2,659,346 | |
| Bank of America Corp.: | |||
| 3 month U.S. LIBOR + 0.650% 0.8506% 6/25/22 (b)(c) | 10,000,000 | 10,004,550 | |
| U.S. Secured Overnight Finl Rate (SOFR) Indx + 0.690% 0.7% 4/22/25 (b)(c) | 10,000,000 | 10,083,836 | |
| 0.81% 10/24/24 (b) | 755,000 | 759,265 | |
| 0.976% 4/22/25 (b) | 1,050,000 | 1,056,311 | |
| 3.124% 1/20/23 (b) | 20,000,000 | 20,360,614 | |
| Bank of Montreal: | |||
| 3 month U.S. LIBOR + 0.400% 0.5825% 9/10/21 (b)(c) | 5,000,000 | 5,005,661 | |
| 3 month U.S. LIBOR + 0.570% 0.7651% 3/26/22 (b)(c) | 5,000,000 | 5,022,461 | |
| U.S. Secured Overnight Finl Rate (SOFR) Indx + 0.270% 0.28% 4/14/23 (b)(c) | 8,000,000 | 8,003,040 | |
| Bank of Nova Scotia U.S. Secured Overnight Finl Rate (SOFR) Indx + 0.440% 0.455% 4/15/24 (b)(c) | 10,000,000 | 10,022,409 | |
| Banque Federative du Credit Mutuel SA: | |||
| 0.65% 2/27/24 (a) | 860,000 | 861,557 | |
| 1.96% 7/21/21 (a) | 5,000,000 | 5,012,106 | |
| 2.125% 11/21/22 (a) | 1,415,000 | 1,451,720 | |
| Barclays Bank PLC 1.7% 5/12/22 | 650,000 | 658,487 | |
| Barclays PLC: | |||
| 4.338% 5/16/24 (b) | 660,000 | 706,325 | |
| 4.61% 2/15/23 (b) | 15,000,000 | 15,440,029 | |
| BNP Paribas SA: | |||
| 3 month U.S. LIBOR + 0.390% 0.5599% 8/7/21 (a)(b)(c) | 5,000,000 | 5,003,869 | |
| 3.5% 3/1/23 (a) | 10,000,000 | 10,530,550 | |
| BPCE SA: | |||
| 3 month U.S. LIBOR + 0.300% 0.4858% 1/14/22 (a)(b)(c) | 5,000,000 | 5,006,477 | |
| 3 month U.S. LIBOR + 1.220% 1.3701% 5/22/22 (a)(b)(c) | 1,605,000 | 1,620,920 | |
| 5.7% 10/22/23 (a) | 1,960,000 | 2,182,264 | |
| Canadian Imperial Bank of Commerce 0.95% 6/23/23 | 7,200,000 | 7,279,886 | |
| Capital One Bank NA 2.014% 1/27/23 (b) | 7,000,000 | 7,073,854 | |
| Citigroup, Inc.: | |||
| 3 month U.S. LIBOR + 1.190% 1.3656% 8/2/21 (b)(c) | 9,500,000 | 9,519,110 | |
| 0.981% 5/1/25 (b) | 880,000 | 885,397 | |
| 2.312% 11/4/22 (b) | 16,290,000 | 16,431,836 | |
| 2.9% 12/8/21 | 1,495,000 | 1,512,580 | |
| Credit Agricole SA 3 month U.S. LIBOR + 1.020% 1.1958% 4/24/23 (a)(b)(c) | 675,000 | 685,496 | |
| Credit Suisse Group Funding Guernsey Ltd. 3.8% 9/15/22 | 5,000,000 | 5,215,189 | |
| Danske Bank A/S: | |||
| 1.226% 6/22/24 (a) | 1,610,000 | 1,629,925 | |
| 3.001% 9/20/22 (a)(b) | 1,475,000 | 1,485,360 | |
| 5% 1/12/22 (a) | 1,050,000 | 1,078,428 | |
| Federation des caisses Desjardin U.S. Secured Overnight Finl Rate (SOFR) Indx + 0.430% 0.44% 5/21/24 (a)(b)(c) | 5,316,000 | 5,325,516 | |
| Fifth Third Bancorp 1.625% 5/5/23 | 10,625,000 | 10,860,769 | |
| First Niagara Financial Group, Inc. 7.25% 12/15/21 | 515,000 | 533,414 | |
| HSBC Holdings PLC: | |||
| 0.976% 5/24/25 (b) | 245,000 | 246,032 | |
| 1.645% 4/18/26 (b) | 850,000 | 863,881 | |
| 2.099% 6/4/26 (b) | 1,840,000 | 1,892,555 | |
| 3.262% 3/13/23 (b) | 15,300,000 | 15,652,110 | |
| 3.803% 3/11/25 (b) | 425,000 | 459,699 | |
| ING Groep NV 3 month U.S. LIBOR + 1.150% 1.343% 3/29/22 (b)(c) | 735,000 | 741,097 | |
| Intesa Sanpaolo SpA 3.125% 7/14/22 (a) | 4,500,000 | 4,627,366 | |
| JPMorgan Chase & Co.: | |||
| U.S. Secured Overnight Finl Rate (SOFR) Indx + 0.530% 0% 6/1/25 (b)(c) | 10,000,000 | 10,010,564 | |
| U.S. Secured Overnight Finl Rate (SOFR) Indx + 0.580% 0.59% 3/16/24 (b)(c) | 5,000,000 | 5,036,450 | |
| U.S. Secured Overnight Finl Rate (SOFR) Indx + 0.880% 0.895% 4/22/27 (b)(c) | 380,000 | 383,051 | |
| 0.824% 6/1/25 (b) | 965,000 | 966,290 | |
| 2.083% 4/22/26 (b) | 1,870,000 | 1,942,675 | |
| 2.776% 4/25/23 (b) | 5,200,000 | 5,316,019 | |
| 3.514% 6/18/22 (b) | 5,000,000 | 5,007,509 | |
| KeyBank NA: | |||
| 3 month U.S. LIBOR + 0.660% 0.8356% 2/1/22 (b)(c) | 8,128,000 | 8,162,766 | |
| U.S. Secured Overnight Finl Rate (SOFR) Indx + 0.340% 0.35% 1/3/24 (b)(c) | 6,000,000 | 6,002,956 | |
| Lloyds Banking Group PLC: | |||
| 0.695% 5/11/24 (b) | 2,698,000 | 2,706,689 | |
| 1.326% 6/15/23 (b) | 1,803,000 | 1,819,904 | |
| 3% 1/11/22 | 5,000,000 | 5,084,796 | |
| 4.5% 11/4/24 | 480,000 | 534,602 | |
| Mitsubishi UFJ Financial Group, Inc.: | |||
| 3 month U.S. LIBOR + 0.650% 0.8258% 7/26/21 (b)(c) | 6,519,000 | 6,525,304 | |
| 3 month U.S. LIBOR + 0.700% 0.8755% 3/7/22 (b)(c) | 10,000,000 | 10,045,800 | |
| 3 month U.S. LIBOR + 0.740% 0.9284% 3/2/23 (b)(c) | 1,623,000 | 1,635,971 | |
| 3 month U.S. LIBOR + 0.920% 1.0701% 2/22/22 (b)(c) | 840,000 | 844,914 | |
| 3.218% 3/7/22 | 1,090,000 | 1,114,935 | |
| Mizuho Financial Group Cayman 2 Ltd. 4.2% 7/18/22 (Reg. S) | 1,625,000 | 1,687,904 | |
| Mizuho Financial Group, Inc.: | |||
| 3 month U.S. LIBOR + 0.940% 1.075% 2/28/22 (b)(c) | 5,000,000 | 5,031,361 | |
| 3 month U.S. LIBOR + 1.140% 1.3239% 9/13/21 (b)(c) | 17,000,000 | 17,053,775 | |
| National Bank of Canada 0.9% 8/15/23 (b) | 7,000,000 | 7,046,512 | |
| NatWest Markets PLC: | |||
| U.S. Secured Overnight Finl Rate (SOFR) Indx + 0.530% 0.54% 8/12/24 (a)(b)(c) | 5,905,000 | 5,923,306 | |
| 0.8% 8/12/24 (a) | 370,000 | 370,480 | |
| 2.375% 5/21/23 (a) | 1,525,000 | 1,583,304 | |
| PNC Bank NA: | |||
| 1.743% 2/24/23 (b) | 4,078,000 | 4,122,104 | |
| 2.028% 12/9/22 (b) | 7,000,000 | 7,062,945 | |
| QNB Finance Ltd.: | |||
| 2.625% 5/12/25 (Reg. S) | 500,000 | 520,625 | |
| 3.5% 3/28/24 (Reg. S) | 1,000,000 | 1,068,313 | |
| Rabobank Nederland 3.95% 11/9/22 | 1,630,000 | 1,711,843 | |
| Rabobank Nederland New York Branch 3 month U.S. LIBOR + 0.830% 1.0178% 1/10/22 (b)(c) | 5,000,000 | 5,025,081 | |
| Royal Bank of Canada U.S. Secured Overnight Finl Rate (SOFR) Indx + 0.450% 0.46% 10/26/23 (b)(c) | 15,000,000 | 15,076,506 | |
| Royal Bank of Scotland Group PLC 3.875% 9/12/23 | 1,085,000 | 1,164,878 | |
| Santander Holdings U.S.A., Inc. 4.45% 12/3/21 | 7,000,000 | 7,121,367 | |
| Societe Generale 2.625% 10/16/24 (a) | 365,000 | 383,688 | |
| Standard Chartered PLC: | |||
| 3 month U.S. LIBOR + 1.150% 1.3383% 1/20/23 (a)(b)(c) | 910,000 | 915,071 | |
| 3 month U.S. LIBOR + 1.200% 1.3825% 9/10/22 (a)(b)(c) | 4,500,000 | 4,512,604 | |
| 0.991% 1/12/25 (a)(b) | 375,000 | 374,685 | |
| 1.214% 3/23/25 (a)(b) | 200,000 | 201,453 | |
| 1.319% 10/14/23 (a)(b) | 200,000 | 201,638 | |
| 2.744% 9/10/22 (a)(b) | 1,495,000 | 1,504,453 | |
| 3.885% 3/15/24 (a)(b) | 365,000 | 384,720 | |
| 3.95% 1/11/23 (a) | 405,000 | 424,095 | |
| Sumitomo Mitsui Financial Group, Inc. 3 month U.S. LIBOR + 1.140% 1.3298% 10/19/21 (b)(c) | 6,500,000 | 6,527,264 | |
| Swedbank AB: | |||
| 0.6% 9/25/23 (a) | 500,000 | 500,675 | |
| 1.3% 6/2/23 (a) | 1,150,000 | 1,168,894 | |
| Synchrony Bank 3% 6/15/22 | 10,395,000 | 10,657,026 | |
| Synovus Bank 2.289% 2/10/23 (b) | 1,237,000 | 1,247,715 | |
| The Toronto-Dominion Bank: | |||
| 3 month U.S. LIBOR + 0.530% 0.7205% 12/1/22 (b)(c) | 5,000,000 | 5,036,692 | |
| U.S. Secured Overnight Finl Rate (SOFR) Indx + 0.480% 0.49% 1/27/23 (b)(c) | 5,000,000 | 5,024,884 | |
| 0.25% 1/6/23 | 4,000,000 | 3,999,765 | |
| 0.55% 3/4/24 | 1,790,000 | 1,794,943 | |
| U.S. Bancorp 3% 3/15/22 | 1,530,000 | 1,561,468 | |
| Wells Fargo & Co.: | |||
| 1.654% 6/2/24 (b) | 5,935,000 | 6,083,367 | |
| 2.188% 4/30/26 (b) | 840,000 | 875,862 | |
| 3.5% 3/8/22 | 123,000 | 126,120 | |
| Wells Fargo Bank NA 2.082% 9/9/22 (b) | 1,105,000 | 1,110,648 | |
| Zions Bancorp NA 3.5% 8/27/21 | 5,000,000 | 5,037,603 | |
| 445,992,669 | |||
| Capital Markets - 2.8% | |||
| Charles Schwab Corp. 0.75% 3/18/24 | 1,205,000 | 1,214,123 | |
| Credit Suisse AG: | |||
| U.S. Secured Overnight Finl Rate (SOFR) Indx + 0.450% 0.46% 2/4/22 (b)(c) | 5,310,000 | 5,317,222 | |
| 0.495% 2/2/24 | 810,000 | 808,145 | |
| 1% 5/5/23 | 6,590,000 | 6,664,978 | |
| 2.1% 11/12/21 | 8,156,000 | 8,225,126 | |
| 2.8% 4/8/22 | 2,340,000 | 2,392,096 | |
| Credit Suisse Group AG: | |||
| 2.997% 12/14/23 (a)(b) | 250,000 | 258,754 | |
| 3.574% 1/9/23 (a) | 650,000 | 661,657 | |
| Deutsche Bank AG New York Branch: | |||
| 3.3% 11/16/22 | 7,072,000 | 7,344,681 | |
| 4.25% 10/14/21 | 7,005,000 | 7,103,720 | |
| 5% 2/14/22 | 10,000,000 | 10,315,685 | |
| E*TRADE Financial Corp. 2.95% 8/24/22 | 2,362,000 | 2,432,728 | |
| Goldman Sachs Group, Inc.: | |||
| U.S. Secured Overnight Finl Rate (SOFR) Indx + 0.540% 0.55% 11/17/23 (b)(c) | 10,000,000 | 9,998,824 | |
| 0.523% 3/8/23 | 3,300,000 | 3,305,237 | |
| 0.673% 3/8/24 (b) | 1,180,000 | 1,183,360 | |
| 2.876% 10/31/22 (b) | 520,000 | 525,424 | |
| 2.905% 7/24/23 (b) | 10,000,000 | 10,282,317 | |
| 3.5% 4/1/25 | 1,005,000 | 1,095,718 | |
| 5.75% 1/24/22 | 1,800,000 | 1,864,248 | |
| Morgan Stanley: | |||
| 3 month U.S. LIBOR + 0.930% 1.1138% 7/22/22 (b)(c) | 4,040,000 | 4,044,962 | |
| U.S. Secured Overnight Finl Rate (SOFR) Indx + 0.700% 0.71% 1/20/23 (b)(c) | 5,000,000 | 5,011,950 | |
| U.S. Secured Overnight Finl Rate (SOFR) Indx + 0.830% 0.8401% 6/10/22 (b)(c) | 5,000,000 | 5,000,766 | |
| 0.529% 1/25/24 (b) | 3,994,000 | 4,002,573 | |
| 0.56% 11/10/23 (b) | 6,170,000 | 6,183,455 | |
| 0.731% 4/5/24 (b) | 985,000 | 988,660 | |
| 2.625% 11/17/21 | 15,989,000 | 16,166,689 | |
| 2.75% 5/19/22 | 1,095,000 | 1,121,929 | |
| 4.1% 5/22/23 | 275,000 | 294,221 | |
| 4.875% 11/1/22 | 660,000 | 700,861 | |
| 5.5% 7/28/21 | 10,000,000 | 10,081,651 | |
| NASDAQ, Inc. 0.445% 12/21/22 | 2,417,000 | 2,417,901 | |
| State Street Corp. 2.825% 3/30/23 (b) | 603,000 | 615,928 | |
| TD Ameritrade Holding Corp. 3 month U.S. LIBOR + 0.430% 0.6056% 11/1/21 (b)(c) | 7,500,000 | 7,511,625 | |
| UBS AG London Branch: | |||
| U.S. Secured Overnight Finl Rate (SOFR) Indx + 0.360% 0.37% 2/9/24 (a)(b)(c) | 10,000,000 | 10,015,200 | |
| 1.75% 4/21/22 (a) | 7,000,000 | 7,088,371 | |
| UBS Group AG: | |||
| 3 month U.S. LIBOR + 1.220% 1.3701% 5/23/23 (a)(b)(c) | 880,000 | 889,013 | |
| 1.008% 7/30/24 (a)(b) | 7,118,000 | 7,181,179 | |
| 3.491% 5/23/23 (a) | 5,000,000 | 5,150,470 | |
| 175,461,447 | |||
| Consumer Finance - 1.1% | |||
| AerCap Ireland Capital Ltd./AerCap Global Aviation Trust: | |||
| 3.95% 2/1/22 | 1,070,000 | 1,090,566 | |
| 4.125% 7/3/23 | 1,025,000 | 1,086,718 | |
| 4.45% 12/16/21 | 1,395,000 | 1,420,045 | |
| 4.5% 9/15/23 | 1,095,000 | 1,176,366 | |
| 4.875% 1/16/24 | 490,000 | 534,626 | |
| American Express Co.: | |||
| 3 month U.S. LIBOR + 0.600% 0.7764% 11/5/21 (b)(c) | 6,750,000 | 6,763,838 | |
| 2.65% 12/2/22 | 9,500,000 | 9,845,217 | |
| 2.75% 5/20/22 | 5,000,000 | 5,112,901 | |
| Capital One Financial Corp.: | |||
| 3.2% 1/30/23 | 8,016,000 | 8,376,753 | |
| 3.5% 6/15/23 | 555,000 | 589,504 | |
| 3.9% 1/29/24 | 505,000 | 547,257 | |
| Ford Motor Credit Co. LLC: | |||
| 3.813% 10/12/21 | 495,000 | 500,111 | |
| 5.875% 8/2/21 | 290,000 | 291,450 | |
| Hyundai Capital America: | |||
| 0.8% 1/8/24 (a) | 660,000 | 658,668 | |
| 2.375% 2/10/23 (a) | 1,925,000 | 1,978,474 | |
| 2.45% 6/15/21 (a) | 755,000 | 755,604 | |
| 2.85% 11/1/22 (a) | 511,000 | 526,846 | |
| 3% 6/20/22 (a) | 1,060,000 | 1,086,077 | |
| 3.95% 2/1/22 (a) | 1,315,000 | 1,344,746 | |
| John Deere Capital Corp. 3 month U.S. LIBOR + 0.260% 0.4425% 9/10/21 (b)(c) | 5,000,000 | 5,003,050 | |
| Synchrony Financial: | |||
| 2.85% 7/25/22 | 3,758,000 | 3,848,477 | |
| 4.25% 8/15/24 | 895,000 | 980,704 | |
| Toyota Motor Credit Corp.: | |||
| U.S. Secured Overnight Finl Rate (SOFR) Indx + 0.300% 0.31% 6/13/22 (b)(c) | 5,450,000 | 5,459,039 | |
| 0.45% 7/22/22 | 7,207,000 | 7,230,693 | |
| 66,207,730 | |||
| Diversified Financial Services - 0.4% | |||
| AIG Global Funding: | |||
| 3 month U.S. LIBOR + 0.460% 0.6606% 6/25/21 (a)(b)(c) | 4,293,000 | 4,294,205 | |
| 2.3% 7/1/22 (a) | 1,528,000 | 1,560,877 | |
| 3.35% 6/25/21 (a) | 770,000 | 771,667 | |
| Athene Global Funding: | |||
| U.S. Secured Overnight Finl Rate (SOFR) Indx + 0.700% 0.71% 5/24/24 (a)(b)(c) | 8,000,000 | 8,017,120 | |
| 0.95% 1/8/24 (a) | 3,469,000 | 3,485,414 | |
| BP Capital Markets America, Inc. 2.937% 4/6/23 | 700,000 | 733,171 | |
| Brixmor Operating Partnership LP 3.25% 9/15/23 | 1,410,000 | 1,486,314 | |
| CNH Industrial Capital LLC 3.875% 10/15/21 | 1,325,000 | 1,341,323 | |
| LSEGA Financing PLC 0.65% 4/6/24 (a) | 1,355,000 | 1,354,225 | |
| Park Aerospace Holdings Ltd.: | |||
| 4.5% 3/15/23 (a) | 435,000 | 456,447 | |
| 5.25% 8/15/22 (a) | 880,000 | 925,178 | |
| 24,425,941 | |||
| Insurance - 1.7% | |||
| AIA Group Ltd. 3 month U.S. LIBOR + 0.520% 0.7066% 9/20/21 (a)(b)(c) | 6,046,000 | 6,050,353 | |
| American International Group, Inc.: | |||
| 2.5% 6/30/25 | 1,000,000 | 1,057,323 | |
| 4.875% 6/1/22 | 675,000 | 705,819 | |
| Aon Corp. 2.2% 11/15/22 | 1,592,000 | 1,634,831 | |
| Brighthouse Financial Global Funding 1% 4/12/24 (a) | 855,000 | 858,760 | |
| Equitable Financial Life Global Funding: | |||
| U.S. Secured Overnight Finl Rate (SOFR) Indx + 0.390% 0.4% 4/6/23 (a)(b)(c) | 10,000,000 | 10,016,911 | |
| 0.5% 4/6/23 (a) | 2,010,000 | 2,014,021 | |
| 0.5% 11/17/23 (a) | 5,000,000 | 5,003,270 | |
| Health Care Service Corp. 1.5% 6/1/25 (a) | 1,375,000 | 1,401,243 | |
| Lincoln National Corp. 4% 9/1/23 | 270,000 | 290,651 | |
| MassMutual Global Funding II 0.85% 6/9/23 (a) | 10,000,000 | 10,107,790 | |
| Metropolitan Life Global Funding I: | |||
| U.S. Secured Overnight Finl Rate (SOFR) Indx + 0.570% 0.58% 1/13/23 (a)(b)(c) | 6,940,000 | 6,987,962 | |
| 0.9% 6/8/23 (a) | 4,918,000 | 4,971,009 | |
| Metropolitan Tower Global Funding: | |||
| U.S. Secured Overnight Finl Rate (SOFR) Indx + 0.550% 0.56% 1/17/23 (a)(b)(c) | 5,000,000 | 5,026,558 | |
| 0.55% 7/13/22 (a) | 6,000,000 | 6,019,098 | |
| New York Life Global Funding: | |||
| 3 month U.S. LIBOR + 0.280% 0.4678% 1/10/23 (a)(b)(c) | 6,945,000 | 6,969,488 | |
| 3 month U.S. LIBOR + 0.320% 0.4954% 8/6/21 (a)(b)(c) | 4,942,000 | 4,945,309 | |
| U.S. Secured Overnight Finl Rate (SOFR) Indx + 0.220% 0.23% 2/2/23 (a)(b)(c) | 10,000,000 | 10,006,800 | |
| 1.1% 5/5/23 (a) | 725,000 | 736,151 | |
| Northwestern Mutual Global Funding U.S. Secured Overnight Finl Rate (SOFR) Indx + 0.330% 0.34% 3/25/24 (a)(b)(c) | 4,063,000 | 4,068,867 | |
| Pacific Life Global Funding II U.S. Secured Overnight Finl Rate (SOFR) Indx + 0.380% 0.39% 4/12/24 (a)(b)(c) | 10,000,000 | 10,021,762 | |
| Principal Life Global Funding II: | |||
| U.S. Secured Overnight Finl Rate (SOFR) Indx + 0.450% 0.46% 4/12/24 (a)(b)(c) | 1,763,000 | 1,766,635 | |
| 0.75% 4/12/24 (a) | 930,000 | 933,115 | |
| Protective Life Global Funding 3 month U.S. LIBOR + 0.520% 0.713% 6/28/21 (a)(b)(c) | 2,000,000 | 2,000,870 | |
| Trinity Acquisition PLC 3.5% 9/15/21 | 650,000 | 653,984 | |
| 104,248,580 | |||
| Thrifts & Mortgage Finance - 0.0% | |||
| Crown Castle Towers LLC/Crown Atlantic Holdings Sub LLC/Crown Communication, Inc. 3.72% 7/15/43 (a) | 370,000 | 382,894 | |
| Nationwide Building Society: | |||
| 3.622% 4/26/23 (a)(b) | 1,035,000 | 1,065,085 | |
| 3.766% 3/8/24 (a)(b) | 500,000 | 527,396 | |
| 1,975,375 | |||
| TOTAL FINANCIALS | 818,311,742 | ||
| HEALTH CARE - 1.6% | |||
| Biotechnology - 0.4% | |||
| AbbVie, Inc.: | |||
| 3 month U.S. LIBOR + 0.650% 0.7993% 11/21/22 (b)(c) | 7,100,000 | 7,149,668 | |
| 2.15% 11/19/21 | 11,244,000 | 11,348,583 | |
| 2.6% 11/21/24 | 3,500,000 | 3,707,331 | |
| 3.2% 11/6/22 | 170,000 | 176,270 | |
| 3.25% 10/1/22 | 850,000 | 876,600 | |
| 3.45% 3/15/22 | 615,000 | 627,193 | |
| Baxalta, Inc. 3.6% 6/23/22 | 265,000 | 272,468 | |
| Gilead Sciences, Inc. 0.75% 9/29/23 | 2,070,000 | 2,072,420 | |
| 26,230,533 | |||
| Health Care Equipment & Supplies - 0.1% | |||
| Becton, Dickinson & Co.: | |||
| 2.894% 6/6/22 | 5,464,000 | 5,596,917 | |
| 3.363% 6/6/24 | 1,215,000 | 1,307,378 | |
| 3.734% 12/15/24 | 285,000 | 311,923 | |
| Stryker Corp. 0.6% 12/1/23 | 325,000 | 325,348 | |
| 7,541,566 | |||
| Health Care Providers & Services - 0.4% | |||
| Aetna, Inc. 2.8% 6/15/23 | 885,000 | 923,967 | |
| AmerisourceBergen Corp. 0.737% 3/15/23 | 1,855,000 | 1,861,414 | |
| Anthem, Inc.: | |||
| 0.45% 3/15/23 | 4,094,000 | 4,106,010 | |
| 2.375% 1/15/25 | 410,000 | 430,838 | |
| Cardinal Health, Inc.: | |||
| 2.616% 6/15/22 | 115,000 | 117,373 | |
| 3.079% 6/15/24 | 695,000 | 740,291 | |
| 3.2% 3/15/23 | 875,000 | 916,827 | |
| 3.5% 11/15/24 | 1,180,000 | 1,279,409 | |
| Cigna Corp.: | |||
| 0.613% 3/15/24 | 6,302,000 | 6,309,501 | |
| 3% 7/15/23 | 715,000 | 750,759 | |
| 3.75% 7/15/23 | 401,000 | 428,307 | |
| CommonSpirit Health 1.547% 10/1/25 | 670,000 | 677,672 | |
| CVS Health Corp.: | |||
| 2.625% 8/15/24 | 335,000 | 355,683 | |
| 3.7% 3/9/23 | 369,000 | 390,097 | |
| Humana, Inc.: | |||
| 2.9% 12/15/22 | 160,000 | 165,691 | |
| 3.15% 12/1/22 | 315,000 | 325,694 | |
| 3.85% 10/1/24 | 745,000 | 812,272 | |
| 4.5% 4/1/25 | 1,205,000 | 1,355,514 | |
| PeaceHealth Obligated Group 1.375% 11/15/25 | 190,000 | 191,927 | |
| 22,139,246 | |||
| Life Sciences Tools & Services - 0.0% | |||
| Thermo Fisher Scientific, Inc. 4.133% 3/25/25 | 385,000 | 429,119 | |
| Pharmaceuticals - 0.7% | |||
| AstraZeneca Finance LLC: | |||
| 0.7% 5/28/24 | 995,000 | 995,469 | |
| 1.2% 5/28/26 | 1,390,000 | 1,391,488 | |
| AstraZeneca PLC: | |||
| 0.3% 5/26/23 | 1,425,000 | 1,424,401 | |
| 3.5% 8/17/23 | 365,000 | 389,222 | |
| Bayer U.S. Finance II LLC 3 month U.S. LIBOR + 0.630% 0.8306% 6/25/21 (a)(b)(c) | 17,180,000 | 17,187,176 | |
| Bristol-Myers Squibb Co.: | |||
| 3.25% 2/20/23 | 178,000 | 186,650 | |
| 3.55% 8/15/22 | 600,000 | 624,193 | |
| EMD Finance LLC 2.95% 3/19/22 (a) | 430,000 | 437,227 | |
| Perrigo Finance PLC 3.9% 12/15/24 | 3,840,000 | 4,138,973 | |
| Royalty Pharma PLC 0.75% 9/2/23 (a) | 870,000 | 870,421 | |
| Shire Acquisitions Investments Ireland DAC 2.875% 9/23/23 | 1,845,000 | 1,937,167 | |
| Viatris, Inc. 1.125% 6/22/22 (a) | 3,114,000 | 3,134,992 | |
| Zoetis, Inc. 3 month U.S. LIBOR + 0.440% 0.5953% 8/20/21 (b)(c) | 10,000,000 | 10,008,501 | |
| 42,725,880 | |||
| TOTAL HEALTH CARE | 99,066,344 | ||
| INDUSTRIALS - 1.5% | |||
| Aerospace & Defense - 0.1% | |||
| The Boeing Co. 1.167% 2/4/23 | 2,790,000 | 2,803,049 | |
| Airlines - 0.0% | |||
| American Airlines 2017-2 Class B Pass Through Trust equipment trust certificate 3.7% 4/15/27 | 543,412 | 513,547 | |
| United Airlines 2019-2 Class B Pass Through Trust equipment trust certificate 3.5% 11/1/29 | 367,272 | 360,898 | |
| 874,445 | |||
| Building Products - 0.0% | |||
| Carrier Global Corp. 2.242% 2/15/25 | 1,860,000 | 1,944,654 | |
| Commercial Services & Supplies - 0.0% | |||
| Republic Services, Inc. 2.5% 8/15/24 | 880,000 | 928,460 | |
| Construction & Engineering - 0.0% | |||
| Yongda Investment Ltd. 2.25% 6/16/25 (Reg. S) | 1,384,000 | 1,386,034 | |
| Electrical Equipment - 0.0% | |||
| Shanghai Electric Group Global Investment Ltd. 2.65% 11/21/24 | 610,000 | 633,219 | |
| Industrial Conglomerates - 0.4% | |||
| General Electric Co. 3.45% 5/15/24 | 530,000 | 572,479 | |
| Honeywell International, Inc. 3 month U.S. LIBOR + 0.370% 0.532% 8/8/22 (b)(c) | 9,078,000 | 9,112,406 | |
| Roper Technologies, Inc.: | |||
| 0.45% 8/15/22 | 706,000 | 707,089 | |
| 1% 9/15/25 | 235,000 | 234,401 | |
| 2.35% 9/15/24 | 365,000 | 384,215 | |
| 3.125% 11/15/22 | 1,505,000 | 1,554,877 | |
| 3.65% 9/15/23 | 270,000 | 288,810 | |
| Siemens Financieringsmaatschappij NV: | |||
| U.S. Secured Overnight Finl Rate (SOFR) Indx + 0.430% 0.44% 3/11/24 (a)(b)(c) | 10,290,000 | 10,353,345 | |
| 0.4% 3/11/23 (a) | 885,000 | 887,293 | |
| 0.65% 3/11/24 (a) | 690,000 | 692,453 | |
| 24,787,368 | |||
| Machinery - 0.5% | |||
| Caterpillar Financial Services Corp.: | |||
| 3 month U.S. LIBOR + 0.200% 0.3675% 11/12/21 (b)(c) | 5,000,000 | 5,006,400 | |
| 3 month U.S. LIBOR + 0.280% 0.4555% 9/7/21 (b)(c) | 6,190,000 | 6,194,968 | |
| U.S. Secured Overnight Finl Rate (SOFR) Indx + 0.150% 0.16% 11/17/22 (b)(c) | 5,000,000 | 5,005,900 | |
| 0.25% 3/1/23 | 10,000,000 | 10,006,218 | |
| Otis Worldwide Corp. 3 month U.S. LIBOR + 0.450% 0.6443% 4/5/23 (b)(c) | 3,299,000 | 3,299,173 | |
| 29,512,659 | |||
| Professional Services - 0.1% | |||
| Equifax, Inc.: | |||
| 3 month U.S. LIBOR + 0.870% 1.0259% 8/15/21 (b)(c) | 610,000 | 610,858 | |
| 3.95% 6/15/23 | 1,090,000 | 1,162,970 | |
| IHS Markit Ltd. 3.625% 5/1/24 | 415,000 | 446,416 | |
| 2,220,244 | |||
| Road & Rail - 0.2% | |||
| Aviation Capital Group LLC: | |||
| 3 month U.S. LIBOR + 0.670% 0.8555% 7/30/21 (a)(b)(c) | 1,427,000 | 1,426,627 | |
| 3 month U.S. LIBOR + 0.950% 1.1405% 6/1/21 (a)(b)(c) | 4,307,000 | 4,307,000 | |
| Eastern Creation II Investment Holdings Ltd. 1% 9/10/23 (Reg. S) | 1,670,000 | 1,664,907 | |
| Guangzhou Metro Investment Finance (BVI) Ltd. 1.507% 9/17/25 (Reg. S) | 1,300,000 | 1,265,078 | |
| SMBC Aviation Capital Finance: | |||
| 3.55% 4/15/24 (a) | 325,000 | 345,349 | |
| 4.125% 7/15/23 (a) | 200,000 | 212,601 | |
| 9,221,562 | |||
| Trading Companies & Distributors - 0.1% | |||
| Air Lease Corp.: | |||
| 2.25% 1/15/23 | 810,000 | 831,766 | |
| 3.5% 1/15/22 | 5,560,000 | 5,666,063 | |
| GATX Corp. 3.9% 3/30/23 | 545,000 | 577,049 | |
| 7,074,878 | |||
| Transportation Infrastructure - 0.1% | |||
| Avolon Holdings Funding Ltd.: | |||
| 2.125% 2/21/26 (a) | 1,035,000 | 1,023,128 | |
| 2.875% 2/15/25 (a) | 980,000 | 1,009,002 | |
| 3.625% 5/1/22 (a) | 1,560,000 | 1,598,246 | |
| 3.95% 7/1/24 (a) | 265,000 | 282,173 | |
| Heathrow Funding Ltd. 4.875% 7/15/23 (a) | 1,340,000 | 1,346,464 | |
| HPHT Finance 17 Ltd. 2.75% 9/11/22 (Reg. S) | 1,235,000 | 1,263,112 | |
| Sydney Airport Finance Co. Property Ltd. 3.9% 3/22/23 (a) | 1,133,000 | 1,195,101 | |
| 7,717,226 | |||
| TOTAL INDUSTRIALS | 89,103,798 | ||
| INFORMATION TECHNOLOGY - 0.6% | |||
| Electronic Equipment & Components - 0.0% | |||
| Amphenol Corp. 2.05% 3/1/25 | 910,000 | 947,032 | |
| Avnet, Inc. 4.875% 12/1/22 | 325,000 | 344,817 | |
| 1,291,849 | |||
| IT Services - 0.3% | |||
| Fidelity National Information Services, Inc.: | |||
| 0.375% 3/1/23 | 1,160,000 | 1,158,198 | |
| 0.6% 3/1/24 | 555,000 | 554,994 | |
| Global Payments, Inc. 2.65% 2/15/25 | 800,000 | 844,076 | |
| HCL America, Inc. 1.375% 3/10/26 (a) | 1,800,000 | 1,776,713 | |
| IBM Corp. 2.85% 5/13/22 | 10,000,000 | 10,254,161 | |
| PayPal Holdings, Inc. 1.35% 6/1/23 | 2,224,000 | 2,268,947 | |
| The Western Union Co. 2.85% 1/10/25 | 1,280,000 | 1,356,314 | |
| 18,213,403 | |||
| Semiconductors & Semiconductor Equipment - 0.2% | |||
| Analog Devices, Inc. 2.95% 4/1/25 | 295,000 | 316,850 | |
| Microchip Technology, Inc.: | |||
| 0.972% 2/15/24 (a) | 1,165,000 | 1,167,168 | |
| 0.983% 9/1/24 (a) | 970,000 | 970,825 | |
| 2.67% 9/1/23 (a) | 1,110,000 | 1,156,966 | |
| 3.922% 6/1/21 | 2,185,000 | 2,185,000 | |
| Micron Technology, Inc.: | |||
| 2.497% 4/24/23 | 2,585,000 | 2,679,445 | |
| 4.64% 2/6/24 | 690,000 | 759,773 | |
| NXP BV/NXP Funding LLC: | |||
| 3.875% 9/1/22 (a) | 1,355,000 | 1,409,195 | |
| 4.625% 6/1/23 (a) | 1,175,000 | 1,268,770 | |
| 4.875% 3/1/24 (a) | 195,000 | 215,949 | |
| NXP BV/NXP Funding LLC/NXP U.S.A., Inc. 2.7% 5/1/25 (a) | 205,000 | 216,661 | |
| Skyworks Solutions, Inc. 0.9% 6/1/23 | 305,000 | 306,083 | |
| 12,652,685 | |||
| Software - 0.1% | |||
| Fortinet, Inc. 1% 3/15/26 | 675,000 | 667,420 | |
| Oracle Corp. 2.4% 9/15/23 | 1,280,000 | 1,333,608 | |
| 2,001,028 | |||
| TOTAL INFORMATION TECHNOLOGY | 34,158,965 | ||
| MATERIALS - 0.1% | |||
| Chemicals - 0.0% | |||
| International Flavors & Fragrances, Inc. 0.697% 9/15/22 (a) | 582,000 | 583,246 | |
| LYB International Finance III LLC 1.25% 10/1/25 | 705,000 | 707,342 | |
| 1,290,588 | |||
| Construction Materials - 0.0% | |||
| Boral Finance Pty Ltd. 3% 11/1/22 (a) | 135,000 | 138,712 | |
| Metals & Mining - 0.1% | |||
| Nucor Corp. 2% 6/1/25 | 350,000 | 363,931 | |
| POSCO 2.375% 1/17/23 (a) | 1,870,000 | 1,915,478 | |
| 2,279,409 | |||
| TOTAL MATERIALS | 3,708,709 | ||
| REAL ESTATE - 0.1% | |||
| Equity Real Estate Investment Trusts (REITs) - 0.1% | |||
| American Campus Communities Operating Partnership LP 3.75% 4/15/23 | 910,000 | 955,939 | |
| Crown Castle International Corp. 1.05% 7/15/26 | 1,005,000 | 984,444 | |
| Highwoods/Forsyth LP 3.625% 1/15/23 | 1,620,000 | 1,678,779 | |
| Public Storage U.S. Secured Overnight Finl Rate (SOFR) Indx + 0.470% 0.48% 4/23/24 (b)(c) | 495,000 | 495,406 | |
| Simon Property Group LP: | |||
| 2% 9/13/24 | 380,000 | 395,659 | |
| 3.375% 10/1/24 | 985,000 | 1,062,075 | |
| 5,572,302 | |||
| UTILITIES - 1.7% | |||
| Electric Utilities - 1.1% | |||
| American Electric Power Co., Inc. 3.65% 12/1/21 | 180,000 | 183,041 | |
| Duke Energy Corp. 3.55% 9/15/21 | 330,000 | 330,399 | |
| Edison International: | |||
| 2.95% 3/15/23 | 455,000 | 470,796 | |
| 3.125% 11/15/22 | 650,000 | 670,620 | |
| ENEL Finance International NV: | |||
| 2.65% 9/10/24 (a) | 200,000 | 210,509 | |
| 2.75% 4/6/23 (a) | 605,000 | 628,740 | |
| 2.875% 5/25/22 (a) | 1,660,000 | 1,699,969 | |
| 4.25% 9/14/23 (a) | 1,305,000 | 1,409,600 | |
| FirstEnergy Corp. 3.35% 7/15/22 (b) | 885,000 | 904,806 | |
| Florida Power & Light Co.: | |||
| 3 month U.S. LIBOR + 0.380% 0.564% 7/28/23 (b)(c) | 5,358,000 | 5,358,268 | |
| U.S. Secured Overnight Finl Rate (SOFR) Indx + 0.250% 0.2763% 5/10/23 (b)(c) | 3,574,000 | 3,575,930 | |
| Israel Electric Corp. Ltd. 5% 11/12/24 (Reg. S) (a) | 1,365,000 | 1,529,619 | |
| Korea Hydro & Nuclear Power Co. Ltd. 1.25% 4/27/26 (a) | 1,421,000 | 1,416,268 | |
| NextEra Energy Capital Holdings, Inc.: | |||
| 3 month U.S. LIBOR + 0.270% 0.4201% 2/22/23 (b)(c) | 10,000,000 | 10,002,671 | |
| U.S. Secured Overnight Finl Rate (SOFR) Indx + 0.540% 0.55% 3/1/23 (b)(c) | 3,472,000 | 3,482,992 | |
| 2.403% 9/1/21 | 11,475,000 | 11,537,607 | |
| NRG Energy, Inc. 3.75% 6/15/24 (a) | 535,000 | 571,582 | |
| Pacific Gas & Electric Co.: | |||
| 3 month U.S. LIBOR + 1.370% 1.5096% 11/15/21 (b)(c) | 1,755,000 | 1,759,124 | |
| 1.75% 6/16/22 | 3,820,000 | 3,820,246 | |
| PPL Electric Utilities Corp. 3 month U.S. LIBOR + 0.250% 0.443% 9/28/23 (b)(c) | 1,780,000 | 1,780,842 | |
| Sinosing Services Pte Ltd. 2.25% 2/20/25 (Reg. S) | 2,200,000 | 2,218,410 | |
| Southern California Edison Co.: | |||
| 3 month U.S. LIBOR + 0.270% 0.4543% 12/3/21 (b)(c) | 2,687,000 | 2,687,907 | |
| U.S. Secured Overnight Finl Rate (SOFR) Indx + 0.640% 0.65% 4/3/23 (b)(c) | 5,000,000 | 5,011,996 | |
| Southern Co. 0.6% 2/26/24 | 2,230,000 | 2,235,468 | |
| Vistra Operations Co. LLC 3.55% 7/15/24 (a) | 3,025,000 | 3,180,150 | |
| 66,677,560 | |||
| Gas Utilities - 0.2% | |||
| Atmos Energy Corp. 3 month U.S. LIBOR + 0.380% 0.5654% 3/9/23 (b)(c) | 2,617,000 | 2,617,693 | |
| CenterPoint Energy Resources Corp. 3 month U.S. LIBOR + 0.500% 0.6843% 3/2/23 (b)(c) | 3,494,000 | 3,495,162 | |
| ONE Gas, Inc. 3 month U.S. LIBOR + 0.610% 0.7873% 3/11/23 (b)(c) | 5,000,000 | 5,002,775 | |
| Southern California Gas Co. 3 month U.S. LIBOR + 0.350% 0.5339% 9/14/23 (b)(c) | 902,000 | 902,150 | |
| 12,017,780 | |||
| Independent Power and Renewable Electricity Producers - 0.0% | |||
| Hero Asia Investment Ltd. 1.5% 11/18/23 (Reg. S) | 1,650,000 | 1,653,838 | |
| The AES Corp. 3.3% 7/15/25 (a) | 820,000 | 874,751 | |
| 2,528,589 | |||
| Multi-Utilities - 0.4% | |||
| CenterPoint Energy, Inc. U.S. Secured Overnight Finl Rate (SOFR) Indx + 0.650% 0.66% 5/13/24 (b)(c) | 2,893,000 | 2,896,211 | |
| Consolidated Edison Co. of New York, Inc. 3 month U.S. LIBOR + 0.400% 0.6006% 6/25/21 (b)(c) | 11,500,000 | 11,503,280 | |
| Dominion Energy, Inc.: | |||
| 3 month U.S. LIBOR + 0.530% 0.7139% 9/15/23 (b)(c) | 2,327,000 | 2,328,022 | |
| 2.715% 8/15/21 | 3,153,000 | 3,168,510 | |
| DTE Energy Co. 0.55% 11/1/22 | 5,000,000 | 5,013,581 | |
| San Diego Gas & Electric Co. 1.914% 2/1/22 | 68,575 | 68,940 | |
| Sempra Energy 2.875% 10/1/22 | 535,000 | 548,800 | |
| 25,527,344 | |||
| TOTAL UTILITIES | 106,751,273 | ||
| TOTAL NONCONVERTIBLE BONDS | |||
| (Cost $1,402,368,877) | 1,414,790,353 | ||
| U.S. Government and Government Agency Obligations - 2.4% | |||
| U.S. Government Agency Obligations - 0.3% | |||
| Fannie Mae U.S. Secured Overnight Finl Rate (SOFR) Indx + 0.180% 0.19% 7/8/22 (b)(c) | 20,000,000 | 20,034,395 | |
| U.S. Treasury Obligations - 2.1% | |||
| U.S. Treasury Notes: | |||
| 0.125% 9/30/22 | $6,565,000 | $6,566,795 | |
| 0.125% 10/31/22 | 13,245,000 | 13,248,622 | |
| 0.125% 11/30/22 | 16,210,000 | 16,214,432 | |
| 0.125% 1/31/23 | 28,300,000 | 28,300,000 | |
| 0.125% 4/30/23 (d) | 30,830,000 | 30,820,366 | |
| 0.375% 3/31/22 | 30,000,000 | 30,076,172 | |
| 2.25% 4/15/22 | 550,000 | 560,527 | |
| TOTAL U.S. TREASURY OBLIGATIONS | 125,786,914 | ||
| TOTAL U.S. GOVERNMENT AND GOVERNMENT AGENCY OBLIGATIONS | |||
| (Cost $145,721,922) | 145,821,309 | ||
| U.S. Government Agency - Mortgage Securities - 0.4% | |||
| Fannie Mae - 0.2% | |||
| 12 month U.S. LIBOR + 1.590% 2.043% 12/1/35 (b)(c) | 5,385 | 5,667 | |
| 12 month U.S. LIBOR + 1.610% 2.375% 7/1/35 (b)(c) | 4,350 | 4,579 | |
| 12 month U.S. LIBOR + 1.650% 2.62% 8/1/37 (b)(c) | 1,589 | 1,676 | |
| 12 month U.S. LIBOR + 1.690% 2.415% 5/1/38 (b)(c) | 22,035 | 23,241 | |
| 12 month U.S. LIBOR + 1.780% 2.163% 5/1/38 (b)(c) | 5,971 | 6,283 | |
| 12 month U.S. LIBOR + 1.830% 2.097% 4/1/38 (b)(c) | 14,433 | 15,230 | |
| 12 month U.S. LIBOR + 1.850% 2.69% 8/1/38 (b)(c) | 7,708 | 8,177 | |
| 12 month U.S. LIBOR + 1.880% 2.149% 5/1/38 (b)(c) | 9,804 | 10,332 | |
| 12 month U.S. LIBOR + 2.040% 2.415% 12/1/36 (b)(c) | 1,285 | 1,365 | |
| 6 month U.S. LIBOR + 1.360% 1.616% 10/1/33 (b)(c) | 28,519 | 29,530 | |
| 2% 5/1/51 (e) | 139,589 | 141,144 | |
| 2.5% 11/1/50 | 253,348 | 262,494 | |
| 3% 9/1/28 to 7/1/50 | 2,271,797 | 2,403,972 | |
| 3.5% 11/1/26 to 7/1/50 | 1,325,976 | 1,403,412 | |
| 4% 1/1/47 to 12/1/49 | 579,119 | 623,537 | |
| 4.5% 8/1/24 to 1/1/50 | 2,747,513 | 2,981,438 | |
| 5% 10/1/21 to 7/1/45 | 1,211,567 | 1,371,895 | |
| 5.5% 5/1/22 to 5/1/40 | 1,593,071 | 1,849,477 | |
| 6% to 6% 1/1/22 to 2/1/49 | 1,530,943 | 1,809,813 | |
| 6.5% 7/1/32 to 12/1/32 | 73,139 | 85,005 | |
| TOTAL FANNIE MAE | 13,038,267 | ||
| Freddie Mac - 0.1% | |||
| 12 month U.S. LIBOR + 1.590% 2.216% 9/1/35 (b)(c) | 2,826 | 2,975 | |
| 12 month U.S. LIBOR + 1.620% 2.32% 6/1/38 (b)(c) | 15,779 | 16,609 | |
| 12 month U.S. LIBOR + 1.620% 2.504% 7/1/38 (b)(c) | 22,663 | 23,834 | |
| 12 month U.S. LIBOR + 1.720% 2.719% 7/1/35 (b)(c) | 7,336 | 7,728 | |
| 12 month U.S. LIBOR + 1.730% 2.108% 2/1/37 (b)(c) | 3,126 | 3,308 | |
| 12 month U.S. LIBOR + 1.730% 2.11% 2/1/37 (b)(c) | 4,257 | 4,505 | |
| 12 month U.S. LIBOR + 1.730% 2.552% 10/1/36 (b)(c) | 18,056 | 19,059 | |
| 12 month U.S. LIBOR + 1.740% 2.349% 5/1/38(b)(c) | 6,683 | 7,066 | |
| 12 month U.S. LIBOR + 1.770% 2.154% 5/1/37 (b)(c) | 4,498 | 4,760 | |
| 12 month U.S. LIBOR + 1.920% 2.315% 12/1/36 (b)(c) | 5,072 | 5,368 | |
| 12 month U.S. LIBOR + 2.020% 2.449% 11/1/36 (b)(c) | 2,844 | 3,007 | |
| 12 month U.S. LIBOR + 2.080% 2.457% 2/1/38 (b)(c) | 17,384 | 18,515 | |
| 12 month U.S. LIBOR + 2.190% 2.566% 2/1/37 (b)(c) | 6,446 | 6,856 | |
| U.S. TREASURY 1 YEAR INDEX + 2.340% 2.472% 11/1/34 (b)(c) | 10,167 | 10,745 | |
| 2% 1/1/36 | 1,014,029 | 1,048,716 | |
| 3% 11/1/34 | 342,718 | 366,573 | |
| 3.5% 12/1/47 | 1,125,790 | 1,189,777 | |
| 4% 12/1/49 | 218,521 | 236,495 | |
| 4.5% 5/1/50 | 254,135 | 274,285 | |
| 5% 10/1/22 to 12/1/41 | 492,087 | 554,120 | |
| 5.5% 11/1/21 to 10/1/38 | 10,155 | 10,849 | |
| 6% 7/1/21 to 1/1/38 | 99,371 | 116,723 | |
| 7% 3/1/39 | 144,889 | 171,347 | |
| 7.5% 6/1/38 | 144,289 | 168,758 | |
| TOTAL FREDDIE MAC | 4,271,978 | ||
| Freddie Mac STACR REMIC Trust - 0.0% | |||
| U.S. 30-Day Avg. Secured Overnight Fin. Rate (SOFR) Indx + 0.650% 0.66% 1/25/51 (a)(b)(c) | 380,000 | 380,000 | |
| Ginnie Mae - 0.1% | |||
| 6% 7/15/36 | 178,459 | 207,336 | |
| 2% 5/20/51 (e) | 140,000 | 142,585 | |
| 3.5% 8/20/44 to 3/20/50 (e) | 713,674 | 760,328 | |
| 4% 3/20/48 to 6/20/50 | 1,103,673 | 1,187,494 | |
| 4.5% 9/20/40 to 8/20/47 | 390,107 | 426,591 | |
| 5% 12/20/34 to 5/20/48 | 961,194 | 1,067,362 | |
| 5.5% 9/15/45 to 2/20/49 | 732,579 | 829,855 | |
| TOTAL GINNIE MAE | 4,621,551 | ||
| TOTAL U.S. GOVERNMENT AGENCY - MORTGAGE SECURITIES | |||
| (Cost $21,792,192) | 22,311,796 | ||
| Asset-Backed Securities - 6.8% | |||
| Aimco Series 2021-BA Class AR, 3 month U.S. LIBOR + 1.100% 1.2659% 1/15/32 (a)(b)(c) | $4,342,000 | $4,342,274 | |
| Ally Auto Receivables Trust Series 2019-3 Class A4, 1.96% 12/16/24 | 600,000 | 616,713 | |
| American Express Credit Account Master Trust Series 2019-3 Class B, 2.2% 4/15/25 | 740,000 | 757,566 | |
| AmeriCredit Automobile Receivables Trust: | |||
| Series 2017-1: | |||
| Class C, 2.71% 8/18/22 | 31,872 | 31,929 | |
| Class D, 3.13% 1/18/23 | 1,330,000 | 1,341,939 | |
| Series 2017-3: | |||
| Class C, 2.69% 6/19/23 | 303,542 | 305,834 | |
| Class D, 3.18% 7/18/23 | 1,355,000 | 1,387,181 | |
| Series 2018-1 Class D, 3.82% 3/18/24 | 1,645,000 | 1,715,153 | |
| Series 2019-3 Class B, 2.13% 7/18/25 | 985,000 | 1,007,594 | |
| Series 2020-1: | |||
| Class C, 1.59% 10/20/25 | 705,000 | 718,674 | |
| Class D, 1.8% 12/18/25 | 690,000 | 706,545 | |
| Series 2020-3 Class C, 1.06% 8/18/26 | 420,000 | 423,663 | |
| Series 2021-1: | |||
| Class C, 0.89% 10/19/26 | 755,000 | 756,294 | |
| Class D, 1.21% 12/18/26 | 470,000 | 470,314 | |
| Applebee's/IHOP Funding LLC Series 2019-1A Class A2I, 4.194% 6/7/49 (a) | 1,432,800 | 1,474,151 | |
| Ares LVII CLO Ltd. / Ares LVII CLO LLC Series 2020-57A Class A, 3 month U.S. LIBOR + 1.320% 1.4958% 10/25/31 (a)(b)(c) | 895,000 | 898,134 | |
| ARI Fleet Lease Trust Series 2020-A Class B, 2.06% 11/15/28 (a) | 770,000 | 788,119 | |
| Avis Budget Rental Car Funding (AESOP) LLC: | |||
| Series 2016-1A Class A, 2.99% 6/20/22 (a) | 101,667 | 101,821 | |
| Series 2017-1A Class B, 3.41% 9/20/23 (a) | 540,000 | 554,412 | |
| Series 2017-2A Class A, 2.97% 3/20/24 (a) | 905,000 | 942,509 | |
| Series 2018-2A Class C, 4.95% 3/20/25 (a) | 430,000 | 466,557 | |
| Series 2019-1A Class B, 3.7% 3/20/23 (a) | 245,000 | 249,389 | |
| Series 2019-2A Class A, 3.35% 9/22/25 (a) | 650,000 | 700,193 | |
| Series 2020-1A Class A, 2.33% 8/20/26 (a) | 540,000 | 567,187 | |
| Babson CLO Ltd. Series 2013-IA Class AR, 3 month U.S. LIBOR + 0.800% 0.9883% 1/20/28 (a)(b)(c) | 936,758 | 937,260 | |
| Bank of America Credit Card Master Trust Series 2020-A1 Class A1, 0.34% 5/15/26 | 4,768,000 | 4,762,460 | |
| Bayview Opportunity Master Fund Trust: | |||
| Series 2017-RT3 Class A, 3.5% 1/28/58 (a)(b) | 803,711 | 813,001 | |
| Series 2017-SPL4 Class A, 3.5% 1/28/55 (a) | 235,247 | 241,461 | |
| Bayview Opportunity Master Funding Trust Series 2017-SPL5 Class A, 3.5% 6/28/57 (a) | 692,322 | 708,954 | |
| BlueMountain CLO Ltd. Series 2015-2A Class A1R, 3 month U.S. LIBOR + 0.930% 1.1198% 7/18/27 (a)(b)(c) | 803,924 | 804,485 | |
| BMW Vehicle Owner Trust Series 2020-A Class A2, 0.39% 2/27/23 | 2,729,009 | 2,730,847 | |
| BRE Grand Islander Timeshare Issuer Series 2019-A Class A, 3.28% 9/26/33 (a) | 227,384 | 238,604 | |
| Capital Auto Receivables Asset Trust: | |||
| Series 2017-1 Class C, 2.7% 9/20/22 (a) | 235,000 | 235,605 | |
| Series 2018-1 Class B, 3.09% 8/22/22 (a) | 680,903 | 683,419 | |
| Series 2018-2 Class C, 3.69% 12/20/23 (a) | 348,868 | 350,306 | |
| Carlyle Global Market Strategies Series 2015-3A Class A1R, 3 month U.S. LIBOR + 1.000% 1.184% 7/28/28 (a)(b)(c) | 480,653 | 480,854 | |
| CarMax Auto Owner Trust: | |||
| Series 2017-4 Class C, 2.7% 10/16/23 | 205,000 | 207,489 | |
| Series 2019-2 Class B, 3.01% 12/16/24 | 1,935,000 | 2,022,428 | |
| Series 2019-4 Class A2A, 2.01% 3/15/23 | 267,896 | 268,656 | |
| Series 2020-1 Class A2, 1.87% 4/17/23 | 1,237,651 | 1,243,011 | |
| Series 2020-3 Class A2A, 0.49% 6/15/23 | 5,238,367 | 5,244,114 | |
| Series 2020-4: | |||
| Class A2, 0.31% 1/16/24 | 6,600,161 | 6,605,991 | |
| Class D, 1.75% 4/15/27 | 540,000 | 547,723 | |
| Series 2021-1 Class A3, 0.34% 12/15/25 | 2,373,000 | 2,373,434 | |
| Series 2021-2 Class C, 1.34% 2/16/27 | 545,000 | 547,232 | |
| Cayuga Park CLO, Ltd. Series 2020-1A, Class A, 3 month U.S. LIBOR + 1.600% 1.7898% 7/17/31 (a)(b)(c) | 1,020,000 | 1,020,795 | |
| Cedar Funding Ltd. Series 2021-14A Class A, 3 month U.S. LIBOR + 1.100% 1.1% 7/15/33 (a)(b)(c)(e) | 5,722,000 | 5,722,572 | |
| Cent CLO LP Series 2021-21A Class A1R3, 3 month U.S. LIBOR + 0.970% 1.1514% 7/27/30 (a)(b)(c) | 4,090,000 | 4,088,969 | |
| Chesapeake Funding II LLC: | |||
| Series 2018-3A Class A2, 1 month U.S. LIBOR + 0.480% 0.5809% 1/15/31 (a)(b)(c) | 1,167,508 | 1,168,296 | |
| Series 2019-1A Class A1, 2.94% 4/15/31 (a) | 1,712,698 | 1,739,408 | |
| Series 2020-1A Class A1, 0.87% 8/16/32 (a) | 3,085,666 | 3,105,272 | |
| Series 2021-1A Class A2, 1 month U.S. LIBOR + 0.230% 0.3309% 4/15/33 (a)(b)(c) | 3,703,807 | 3,703,807 | |
| CIFC Funding Ltd. / CIFC Funding LLC Series 2021-4A Class A, 3 month U.S. LIBOR + 1.050% 0% 7/15/33 (a)(b)(c)(e) | 1,360,000 | 1,360,000 | |
| CIFC Funding Ltd./CIFC Funding LLC Series 2020-1A Class A1, 3 month U.S. LIBOR + 1.700% 1.8838% 7/15/32 (a)(b)(c) | 1,480,000 | 1,484,145 | |
| CIM Trust Series 2020-INV1 Class A2, 2.5% 4/25/50 (a) | 338,097 | 343,525 | |
| CNH Equipment Trust: | |||
| Series 2018-A Class B, 3.47% 10/15/25 | 380,000 | 388,979 | |
| Series 2019-C Class A2, 1.99% 3/15/23 | 208,183 | 208,510 | |
| Series 2020-A Class A4, 1.51% 4/15/27 | 590,000 | 605,905 | |
| Daimler Trucks Retail Trust Series 2020-1 Class A4, 1.37% 6/15/27 | 1,820,000 | 1,836,056 | |
| Dell Equipment Finance Trust: | |||
| Series 2019-2: | |||
| Class A2, 1.95% 12/22/21 (a) | 807,588 | 809,727 | |
| Class A3, 1.91% 10/22/24 (a) | 1,714,000 | 1,731,728 | |
| Series 2020-2: | |||
| Class A2, 0.47% 10/24/22 (a) | 1,568,000 | 1,570,210 | |
| Class A3, 0.57% 10/23/23 (a) | 1,915,000 | 1,924,307 | |
| Series 2021-1 Class A3, 0.43% 5/22/26 (a) | 1,601,000 | 1,604,149 | |
| DLL Securitization Trust Series 2019-MT3 Class A3, 2.08% 2/21/23 (a) | 1,531,637 | 1,543,857 | |
| Donlen Fleet Lease Funding Series 2021-2 Class A1, 1 month U.S. LIBOR + 0.330% 0.4251% 12/11/34 (a)(b)(c) | 4,058,000 | 4,061,272 | |
| Drive Auto Receivables Trust Series 2021-1 Class D, 1.45% 1/16/29 | 630,000 | 634,261 | |
| Dryden CLO, Ltd. / Dryden CLO, LLC Series 2020-86A Class A, 3 month U.S. LIBOR + 1.650% 1.8398% 7/17/30 (a)(b)(c) | 1,220,000 | 1,221,986 | |
| DT Auto Owner Trust Series 2019-4A Class A, 2.17% 5/15/23 (a) | 180,170 | 180,342 | |
| Eaton Vance CLO, Ltd. Series 2021-1A Class AR, 3 month U.S. LIBOR + 1.100% 1.2226% 4/15/31 (a)(b)(c) | 3,935,000 | 3,935,346 | |
| Elara HGV Timeshare Issuer LLC: | |||
| Series 2014-A Class A, 2.53% 2/25/27 (a) | 20,847 | 20,866 | |
| Series 2017-A Class A, 2.69% 3/25/30 (a) | 579,900 | 597,883 | |
| Ellington Financial Mortgage Trust Series 2019-2 Class A1, 2.739% 11/25/59 (a) | 389,257 | 396,173 | |
| Enterprise Fleet Financing LLC: | |||
| Series 2018-2 Class A2, 3.14% 2/20/24 (a) | 53,335 | 53,519 | |
| Series 2019-1 Class A2, 2.98% 10/20/24 (a) | 1,206,786 | 1,218,913 | |
| Series 2019-3 Class A2, 2.06% 5/20/25 (a) | 546,045 | 554,199 | |
| Series 2020-1 Class A2, 1.78% 12/22/25 (a) | 5,662,688 | 5,741,865 | |
| Series 2020-2 Class A2, 0.61% 7/20/26 (a) | 3,960,000 | 3,975,353 | |
| Series 2021-1 Class A2, 0.44% 12/21/26 (a) | 1,410,000 | 1,411,032 | |
| Exeter Automobile Receivables Trust Series 2021-2A Class A2, 0.27% 1/16/24 | 6,586,000 | 6,586,032 | |
| Ford Credit Auto Lease Trust: | |||
| Series 2020-A Class A2, 1.8% 7/15/22 | 1,527,553 | 1,529,125 | |
| Series 2020-B Class A3, 0.62% 8/15/23 | 4,531,000 | 4,550,687 | |
| Ford Credit Auto Owner Trust: | |||
| Series 2020-2 Class C, 1.74% 4/15/33 (a) | 570,000 | 575,110 | |
| Series 2020-B Class C, 2.04% 12/15/26 | 1,270,000 | 1,316,797 | |
| Ford Credit Floorplan Master Owner Trust Series 2020-1 Class A1, 0.7% 9/15/25 | 5,274,000 | 5,312,903 | |
| Freddie Mac STACR REMIC Trust Series 2020-DNA5 Class M1, U.S. 30-Day Avg. Secured Overnight Fin. Rate (SOFR) Indx + 1.300% 1.31% 10/25/50 (a)(b)(c) | 64,210 | 64,223 | |
| GM Financial Automobile Leasing Trust: | |||
| Series 2019-1 Class C, 3.56% 12/20/22 | 835,000 | 840,104 | |
| Series 2020-1 Class A2A, 1.67% 4/20/22 | 2,252,519 | 2,255,960 | |
| Series 2020-2 Class C, 2.56% 7/22/24 | 445,000 | 460,383 | |
| Series 2020-3 Class A2A, 0.35% 11/21/22 | 7,816,212 | 7,821,913 | |
| Series 2021-2 Class A2, 0.22% 7/20/23 | 4,138,000 | 4,139,120 | |
| GM Financial Consumer Automobile Receivables Trust: | |||
| Series 2020-1 Class A2, 1.83% 1/17/23 | 334,766 | 335,074 | |
| Series 2020-2 Class A3, 1.49% 12/16/24 | 335,000 | 339,684 | |
| Series 2020-3 Class A2, 0.35% 7/17/23 | 2,952,542 | 2,955,054 | |
| Series 2020-4: | |||
| Class A2, 0.26% 11/16/23 | 7,872,397 | 7,876,844 | |
| Class C, 1.05% 5/18/26 | 420,000 | 422,090 | |
| GM Financial Securitized Auto Receivables Trust Series 2017-3A Class C, 2.52% 3/16/23 (a) | 245,000 | 245,789 | |
| GMF Floorplan Owner Revolving Trust: | |||
| Series 2019-1 Class A, 2.7% 4/15/24 (a) | 710,000 | 725,429 | |
| Series 2020-1 Class A, 0.68% 8/15/25 (a) | 1,480,000 | 1,488,770 | |
| Series 2020-2 Class A, 0.69% 10/15/25 (a) | 3,238,000 | 3,258,480 | |
| Golub Capital Partners CLO 39B LLC Series 2018-39A Class A1, 3 month U.S. LIBOR + 1.150% 1.3383% 10/20/28 (a)(b)(c) | 606,558 | 606,850 | |
| Hardee's Funding LLC / Carl's Jr. Funding LLC Series 2018-1A Class A2II, 4.959% 6/20/48 (a) | 214,500 | 228,479 | |
| Hilton Grand Vacations Trust: | |||
| Series 2017-AA: | |||
| Class A, 2.66% 12/26/28 (a) | 178,024 | 182,553 | |
| Class B, 2.96% 12/26/28 (a) | 271,519 | 277,482 | |
| Series 2020-AA Class A, 2.74% 2/25/39 (a) | 482,286 | 502,359 | |
| HPEFS Equipment Trust: | |||
| Series 2020-1A Class A2, 1.73% 2/20/30 (a) | 1,839,082 | 1,846,972 | |
| Series 2020-2A Class A2, 0.65% 7/22/30 (a) | 4,012,663 | 4,018,661 | |
| Hyundai Auto Lease Securitization Trust: | |||
| Series 2020-A: | |||
| Class A2, 1.9% 5/16/22 (a) | 1,107,094 | 1,108,660 | |
| Class A3, 1.95% 7/17/23 (a) | 2,740,000 | 2,767,767 | |
| Series 2021-A Class A2, 0.25% 4/17/23 (a) | 8,587,000 | 8,590,417 | |
| Hyundai Auto Receivables Trust: | |||
| Series 2019-A Class B, 2.94% 5/15/25 | 635,000 | 659,939 | |
| Series 2020-A Class A3, 1.41% 11/15/24 | 735,000 | 747,181 | |
| Series 2020-C Class A2, 0.26% 9/15/23 | 8,275,849 | 8,280,496 | |
| John Deere Owner Trust: | |||
| Series 2020-A Class A2, 1.01% 1/17/23 | 971,757 | 973,175 | |
| Series 2020-B Class A2, 0.41% 3/15/23 | 4,817,016 | 4,820,291 | |
| KKR CLO Ltd. / KKR CLO LLC Series 2021-29A Class A, 3 month U.S. LIBOR + 1.200% 1.341% 1/15/32 (a)(b)(c) | 1,250,000 | 1,249,680 | |
| KKR Finanical CLO Ltd. Series 13 Class A1R, 3 month U.S. LIBOR + 0.800% 0.9836% 1/16/28 (a)(b)(c) | 1,165,388 | 1,162,044 | |
| KKR Industrial Portfolio Trust Series 2021-KDIP Class C, 1 month U.S. LIBOR + 1.000% 1.1009% 12/15/37 (a)(b)(c) | 1,415,000 | 1,414,111 | |
| Kubota Credit Owner Trust Series 2020-1A Class A3, 1.96% 3/15/24 (a) | 380,000 | 388,277 | |
| Lanark Master Issuer PLC Series 2020-1A Class 1A, 2.277% 12/22/69 (a)(b) | 1,768,000 | 1,812,593 | |
| Madison Park Funding Ltd. Series 2015-18A Class A1R, 3 month U.S. LIBOR + 1.190% 1.376% 10/21/30 (a)(b)(c) | 1,165,000 | 1,166,990 | |
| Madison Park Funding XXXII, Ltd. / Madison Park Funding XXXII LLC Series 2021-32A Class A1R, 3 month U.S. LIBOR + 1.000% 1.1879% 1/22/31 (a)(b)(c) | 3,229,000 | 3,226,481 | |
| Madison Park Funding XXXV Ltd. / Madison Park Funding XXXV LLC Series 2021-35A Class A1R, 3 month U.S. LIBOR + 0.990% 1.1783% 4/20/32 (a)(b)(c) | 1,650,000 | 1,650,591 | |
| Magnetite XVI, Ltd. / Magnetite XVI, LLC Series 2015-16A Class AR, 3 month U.S. LIBOR + 0.800% 0.9898% 1/18/28 (a)(b)(c) | 1,979,938 | 1,973,117 | |
| Mercedes-Benz Auto Lease Trust: | |||
| Series 2019-B Class A3, 2% 10/17/22 | 7,134,851 | 7,195,212 | |
| Series 2020-A Class A2, 1.82% 3/15/22 | 790,592 | 791,384 | |
| Series 2020-B Class A2, 0.31% 2/15/23 | 4,173,246 | 4,175,468 | |
| Mercedes-Benz Auto Receivables Trust Series 2020-1 Class A2, 0.46% 3/15/23 | 3,362,120 | 3,365,368 | |
| MFRA Trust Series 2021-INV1 Class A1, 0.852% 1/25/56 (a)(b) | 581,147 | 580,016 | |
| MMAF Equipment Finance LLC Series 2019-B Class A2, 2.07% 10/12/22 (a) | 1,174,129 | 1,180,634 | |
| MVW Owner Trust: | |||
| Series 2014-1A Class A, 2.25% 9/22/31 (a) | 54,518 | 54,577 | |
| Series 2015-1A Class A, 2.52% 12/20/32 (a) | 137,214 | 137,351 | |
| Series 2017-1A: | |||
| Class A, 2.42% 12/20/34 (a) | 425,450 | 435,258 | |
| Class B, 2.75% 12/20/34 (a) | 25,026 | 25,548 | |
| Class C, 2.99% 12/20/34 (a) | 60,064 | 61,028 | |
| Series 2021-1WA Class C, 1.94% 1/22/41 (a) | 335,000 | 336,857 | |
| Navient Private Education Loan Trust: | |||
| Series 2019-D Class A2A, 3.01% 12/15/59 (a) | 485,713 | 508,779 | |
| Series 2020-A Class A2A, 2.46% 11/15/68 (a) | 840,000 | 871,574 | |
| Series 2020-CA Class A2A, 2.15% 11/15/68 (a) | 2,610,000 | 2,693,379 | |
| Series 2020-IA Class A1A, 1.33% 4/15/69 (a) | 688,407 | 689,280 | |
| Navient Private Education Refi Loan Trust: | |||
| Series 2019-A Class A2A, 3.42% 1/15/43 (a) | 1,954,520 | 2,007,413 | |
| Series 2019-GA Class A, 2.4% 10/15/68 (a) | 529,614 | 544,496 | |
| Series 2020-DA Class A, 1.69% 5/15/69 (a) | 784,954 | 794,145 | |
| Navient Student Loan Trust: | |||
| Series 2017-3A Class A2, 1 month U.S. LIBOR + 0.600% 0.6916% 7/26/66 (a)(b)(c) | 4,014,121 | 4,022,846 | |
| Series 2017-A Class A2A, 2.88% 12/16/58 (a) | 1,063,687 | 1,080,012 | |
| Series 2019-2A Class A1, 1 month U.S. LIBOR + 0.270% 0.3616% 2/27/68 (a)(b)(c) | 97,969 | 97,969 | |
| Series 2019-EA Class A2A, 2.64% 5/15/68 (a) | 1,416,700 | 1,450,668 | |
| Nelnet Student Loan Trust: | |||
| Series 2005-4 Class A4, 3 month U.S. LIBOR + 0.180% 0.3666% 3/22/32 (b)(c) | 652,860 | 632,096 | |
| Series 2020-1A Class A, 1 month U.S. LIBOR + 0.740% 0.8316% 3/26/68 (a)(b)(c) | 360,212 | 359,379 | |
| Neuberger Berman Loan Advisers CLO 32 Ltd. Series 2021-32A Class AR, 3 month U.S. LIBOR + 0.990% 1.1798% 1/20/32 (a)(b)(c) | 1,570,000 | 1,571,415 | |
| Neuberger Berman Loan Advisers CLO 40, Ltd. / Neuberger Berman Loan Advisers CLO 40 LLC Series 2021-40A Class A, 3 month U.S. LIBOR + 1.060% 1.2479% 4/16/33 (a)(b)(c) | 455,000 | 456,180 | |
| New Residential Mortgage Loan Trust Series 2019-NQM3: | |||
| Class A1, 2.8018% 7/25/49 (a) | 602,859 | 606,440 | |
| Class A3, 3.0864% 7/25/49 (a) | 390,725 | 391,641 | |
| Nissan Auto Receivables Trust Series 2020-A Class A3, 1.38% 12/16/24 | 425,000 | 431,361 | |
| Nissan Master Owner Trust Receivables Series 2019-A Class A, 1 month U.S. LIBOR + 0.560% 0.6609% 2/15/24 (b)(c) | 1,350,000 | 1,355,222 | |
| OCP CLO Ltd. Series 2014-7A Class A1RR, 3 month U.S. LIBOR + 1.120% 1.3083% 7/20/29 (a)(b)(c) | 2,530,000 | 2,529,360 | |
| OZLM Ltd. Series 2014-8A Class RR, 3 month U.S. LIBOR + 1.170% 1.3598% 10/17/29 (a)(b)(c) | 610,198 | 610,432 | |
| Palmer Square CLO Ltd. / Palmer Square CLO LLC Series 2020-2A Class A1A, 3 month U.S. LIBOR + 1.700% 1.8838% 7/15/31 (a)(b)(c) | 860,000 | 860,500 | |
| Palmer Square Loan Funding, Ltd. Series 2021-2A Class A1, 3 month U.S. LIBOR + 0.800% 0.9456% 5/20/29 (a)(b)(c) | 4,315,000 | 4,315,725 | |
| Reese Park CLO Ltd. / Reese Park CLO LLC Series 2020-1A Class A1, 3 month U.S. LIBOR + 1.320% 1.5038% 10/15/32 (a)(b)(c) | 830,000 | 831,281 | |
| Santander Consumer Auto Receivables Trust Series 2021-AA Class A2, 0.23% 11/15/23 (a) | 7,768,000 | 7,768,970 | |
| Santander Drive Auto Receivables Trust: | |||
| Series 2018-2 Class C, 3.35% 7/17/23 | 58,963 | 59,116 | |
| Series 2019-2 Class B, 2.79% 1/16/24 | 231,595 | 232,516 | |
| Series 2020-4 Class C, 1.01% 1/15/26 | 675,000 | 680,104 | |
| Series 2021-2 Class A2, 0.28% 4/15/24 | 8,000,000 | 8,001,478 | |
| Santander Retail Auto Lease Trust: | |||
| Series 2019-A Class B, 3.01% 5/22/23 (a) | 700,000 | 710,561 | |
| Series 2019-B: | |||
| Class A2A, 2.29% 4/20/22 (a) | 223,496 | 223,771 | |
| Class C, 2.77% 8/21/23 (a) | 690,000 | 705,866 | |
| Series 2019-C: | |||
| Class A2A, 1.89% 9/20/22 (a) | 1,533,987 | 1,538,332 | |
| Class B, 2.17% 11/20/23 (a) | 495,000 | 505,796 | |
| Class C, 2.39% 11/20/23 (a) | 830,000 | 848,734 | |
| Class D, 2.88% 6/20/24 (a) | 870,000 | 896,591 | |
| Series 2020-A: | |||
| Class A2, 1.69% 1/20/23 (a) | 6,037,586 | 6,080,910 | |
| Class D, 2.52% 11/20/24 (a) | 720,000 | 741,334 | |
| Series 2020-B Class A2, 0.42% 11/20/23 (a) | 8,261,772 | 8,278,796 | |
| Series 2021-A: | |||
| Class A2, 0.32% 2/20/24 (a) | 5,447,000 | 5,450,771 | |
| Class C, 1.14% 3/20/26 (a) | 1,815,000 | 1,817,455 | |
| SBA Tower Trust: | |||
| Series 2019, 2.836% 1/15/50 (a) | 990,000 | 1,044,973 | |
| 1.631% 11/15/26 (a) | 495,000 | 498,029 | |
| 1.884% 7/15/50 (a) | 365,000 | 371,957 | |
| SG Residential Mortgage Trust Series 2019-3 Class A2, 2.877% 9/25/59 (a) | 824,192 | 835,047 | |
| Sierra Receivables Funding Co. LLC: | |||
| Series 2019-1A Class A, 3.2% 1/20/36 (a) | 199,289 | 206,660 | |
| Series 2019-2A Class A, 2.59% 5/20/36 (a) | 1,238,817 | 1,275,568 | |
| Sierra Timeshare Receivables Funding Co. LLC Series 2017-1A Class A, 2.91% 3/20/34 (a) | 283,995 | 287,710 | |
| Sierra Timeshare Receivables Funding LLC: | |||
| Series 2019-3A Class A, 2.34% 8/20/36 (a) | 308,469 | 318,051 | |
| Series 2020-2A Class C, 3.51% 7/20/37 (a) | 417,265 | 432,580 | |
| Series 2021-1A Class B, 1.34% 11/20/37 (a) | 457,328 | 459,641 | |
| SLM Student Loan Trust: | |||
| Series 2003-10A Class A3, 3 month U.S. LIBOR + 0.470% 0.6539% 12/15/27 (a)(b)(c) | 1,553,671 | 1,553,863 | |
| Series 2003-11 Class A6, 3 month U.S. LIBOR + 0.550% 0.7339% 12/15/25 (a)(b)(c) | 1,013,585 | 1,013,472 | |
| Series 2007-7 Class A4, 3 month U.S. LIBOR + 0.330% 0.5058% 1/25/22 (b)(c) | 535,526 | 521,414 | |
| Series 2008-1 Class A4, 3 month U.S. LIBOR + 0.650% 0.8258% 1/25/22 (b)(c) | 1,267,314 | 1,227,941 | |
| Series 2010-1 Class A, 1 month U.S. LIBOR + 0.400% 0.4916% 3/25/25 (b)(c) | 759,843 | 747,094 | |
| SMB Private Education Loan Trust: | |||
| Series 2014-A Class A3, 1 month U.S. LIBOR + 1.500% 1.6009% 4/15/32 (a)(b)(c) | 1,400,000 | 1,413,823 | |
| Series 2015-A Class A2B, 1 month U.S. LIBOR + 1.000% 1.1009% 6/15/27 (a)(b)(c) | 90,882 | 91,092 | |
| Series 2016-C Class A2B, 1 month U.S. LIBOR + 1.100% 1.2146% 9/15/34 (a)(b)(c) | 766,480 | 773,281 | |
| Series 2018-B Class A2B, 1 month U.S. LIBOR + 0.720% 0.8346% 1/15/37 (a)(b)(c) | 1,415,997 | 1,416,314 | |
| Series 2020-BA Class A1A, 1.29% 7/15/53 (a) | 464,871 | 467,791 | |
| Series 2020-PTB Class A2A, 1.6% 9/15/54 (a) | 2,750,000 | 2,787,698 | |
| Series 2021-B Class A, 1.31% 7/17/51 (a) | 1,755,000 | 1,756,381 | |
| SoFi Consumer Loan Program Trust Series 2019-4 Class A, 2.45% 8/25/28 (a) | 851,239 | 857,228 | |
| Symphony CLO XXVI Ltd. / Symphony CLO XXVI LLC Series 2021-26A Class AR, 3 month U.S. LIBOR + 1.080% 1.1892% 4/20/33 (a)(b)(c) | 465,000 | 464,412 | |
| TCI-Flatiron CLO Ltd. / LLC Series 2021-1A Class AR, 3 month U.S. LIBOR + 0.960% 1.1159% 11/18/30 (a)(b)(c) | 4,292,000 | 4,290,923 | |
| Tesla Series 2020-A: | |||
| Class A2, 0.55% 5/22/23 (a) | 1,584,525 | 1,587,262 | |
| Class A3, 0.68% 12/20/23 (a) | 2,527,000 | 2,540,442 | |
| Tesla Auto Lease Trust: | |||
| Series 2019-A Class A2, 2.13% 4/20/22 (a) | 2,918,977 | 2,933,958 | |
| Series 2021-A Class A2, 0.36% 3/20/25 (a) | 5,000,000 | 5,009,056 | |
| Towd Point Mortgage Trust: | |||
| Series 2017-1 Class A1, 2.75% 10/25/56 (a)(b) | 337,629 | 342,706 | |
| Series 2017-4 Class A1, 2.75% 6/25/57 (a) | 203,512 | 210,051 | |
| Series 2019-1 Class A1, 3.7395% 3/25/58 (a)(b) | 795,371 | 842,464 | |
| Toyota Auto Receivables Owner Trust Series 2020-C Class A3, 0.44% 10/15/24 | 9,912,000 | 9,940,710 | |
| Verizon Owner Trust: | |||
| Series 2018-1A Class C, 3.2% 9/20/22 (a) | 970,000 | 974,170 | |
| Series 2018-A: | |||
| Class A1A, 3.23% 4/20/23 | 1,833,874 | 1,851,567 | |
| Class A1B, 1 month U.S. LIBOR + 0.240% 0.3393% 4/20/23 (b)(c) | 1,429,364 | 1,430,396 | |
| Series 2020-A Class A1A, 1.85% 7/22/24 | 4,951,000 | 5,044,963 | |
| Volkswagen Auto Lease Trust: | |||
| Series 2019-A: | |||
| Class A2A, 2% 3/21/22 | 786,501 | 787,351 | |
| Class A3, 1.99% 11/21/22 | 2,795,000 | 2,817,850 | |
| Series 2020-A Class A2, 0.27% 4/20/23 | 10,000,000 | 10,009,753 | |
| Volkswagen Auto Loan Enhanced Trust Series 2020-1 Class A4, 1.26% 8/20/26 | 545,000 | 555,477 | |
| Volvo Financial Equipment LLC Series 2019-2A Class A3, 2.04% 11/15/23 (a) | 2,435,000 | 2,468,806 | |
| Volvo Financial Equipment Master Owner Trust Series 2018-A Class A, 1 month U.S. LIBOR + 0.520% 0.6209% 7/17/23 (a)(b)(c) | 5,080,000 | 5,083,429 | |
| Voya CLO Ltd. Series 2021-1A Class A1R, 3 month U.S. LIBOR + 0.950% 0.95% 4/17/30 (a)(b)(c) | 4,486,000 | 4,486,458 | |
| Wheels SPV LLC Series 2021-1A Class A, 1 month U.S. LIBOR + 0.450% 0.3793% 8/20/29 (a)(b)(c) | 3,867,925 | 3,867,925 | |
| World Omni Auto Receivables Trust: | |||
| Series 2019-C Class C, 2.4% 6/15/26 | 895,000 | 923,721 | |
| Series 2020-A: | |||
| Class A2A, 1.02% 6/15/23 | 1,535,713 | 1,538,931 | |
| Class C, 1.64% 8/17/26 | 480,000 | 488,989 | |
| Series 2020-C Class A2, 0.35% 12/15/23 | 3,915,546 | 3,919,490 | |
| World Omni Automobile Lease Securitization Trust: | |||
| Series 2019-A Class A3, 2.94% 5/16/22 | 728,837 | 731,419 | |
| Series 2019-B Class A3, 2.03% 11/15/22 | 2,615,000 | 2,641,938 | |
| Series 2020-A Class A2, 1.71% 11/15/22 | 5,782,496 | 5,817,239 | |
| Series 2020-B Class A2, 0.32% 9/15/23 | 3,796,494 | 3,801,392 | |
| World Omni Select Auto Trust: | |||
| Series 2019-A Class A2A, 2.06% 8/15/23 | 456,027 | 456,679 | |
| Series 2020-A: | |||
| Class B, 0.84% 6/15/26 | 510,000 | 511,686 | |
| Class C, 1.25% 10/15/26 | 585,000 | 590,910 | |
| TOTAL ASSET-BACKED SECURITIES | |||
| (Cost $416,049,801) | 418,000,969 | ||
| Collateralized Mortgage Obligations - 1.1% | |||
| Private Sponsor - 0.9% | |||
| Angel Oak Mortgage Trust: | |||
| sequential payer: | |||
| Series 2019-4 Class A3, 3.301% 7/26/49 (a) | 543,054 | 548,585 | |
| Series 2020-6 Class A1, 1.261% 5/25/65 (a) | 588,513 | 592,591 | |
| Series 2021-1: | |||
| Class A1, 0.909% 1/25/66 (a) | 1,487,543 | 1,476,795 | |
| Class A2, 1.115% 1/25/66 (a) | 435,028 | 431,367 | |
| Series 2021-2 Class A1, 0.985% 4/25/66 (a) | 1,080,000 | 1,080,299 | |
| Series 2019-2 Class M1, 4.065% 3/25/49 (a) | 545,000 | 553,773 | |
| Angel Oak Mortgage Trust LLC: | |||
| sequential payer Series 2020-3 Class A1, 1.691% 4/25/65 (a) | 880,270 | 891,071 | |
| Series 2020-3 Class A3, 2.872% 4/25/65 (a)(b) | 1,427,554 | 1,457,870 | |
| Brass PLC Series 2021-10A Class A1, 0.669% 4/16/69 (a)(b) | 1,005,312 | 1,006,608 | |
| Citigroup Mortgage Loan Trust Series 2020-EXP2 Class A3, 2.5% 8/25/50 (a) | 408,848 | 416,435 | |
| COLT Mortgage Loan Trust sequential payer Series 2020-3 Class A1, 1.506% 4/27/65 (a) | 342,177 | 345,861 | |
| Deephaven Residential Mortgage Trust: | |||
| sequential payer Series 2020-2 Class A1, 1.692% 5/25/65 (a) | 582,789 | 585,701 | |
| Series 2017-1A Class A3, 3.485% 12/26/46 (a)(b) | 10,725 | 10,725 | |
| Series 2021-1 Class A2, 0.973% 5/25/65 (a) | 310,375 | 309,561 | |
| Ellington Financial Mortgage Trust: | |||
| Series 2019-2 Class A3, 3.046% 11/25/59 (a) | 250,033 | 254,155 | |
| Series 2020-1 Class A1, 2.006% 5/25/65 (a) | 791,655 | 802,588 | |
| Series 2020-2 Class A1, 1.178% 10/25/65 (a) | 777,239 | 778,731 | |
| Series 2021-1: | |||
| Class A1, 0.797% 2/25/66 (a) | 293,783 | 293,845 | |
| Class A3, 1.106% 2/25/66 (a) | 244,819 | 244,867 | |
| Flagstar Mortgage Trust floater sequential payer Series 2020-1INV Class A11, 1 month U.S. LIBOR + 0.850% 0.9416% 3/25/50 (a)(b)(c) | 447,460 | 448,598 | |
| Freddie Mac STACR REMIC Trust floater: | |||
| Series 2020-DNA2 Class M1, 1 month U.S. LIBOR + 0.750% 0.8416% 2/25/50 (a)(b)(c) | 147,349 | 147,380 | |
| Series 2020-DNA6 Class M1, U.S. 30-Day Avg. Secured Overnight Fin. Rate (SOFR) Indx + 0.900% 0.91% 12/25/50 (a)(b)(c) | 243,599 | 243,736 | |
| Series 2020-HQA2 Class M1, 1 month U.S. LIBOR + 1.100% 1.1916% 3/25/50 (a)(b)(c) | 150,569 | 150,613 | |
| Series 2020-HQA5 Class M1, U.S. 30-Day Avg. Secured Overnight Fin. Rate (SOFR) Indx + 1.100% 1.11% 11/25/50 (a)(b)(c) | 283,435 | 283,637 | |
| Series 2021-DNA2 Class M1, U.S. 30-Day Avg. Secured Overnight Fin. Rate (SOFR) Indx + 0.800% 0.81% 8/25/33 (a)(b)(c) | 850,000 | 850,513 | |
| Series 2021-DNA3 Class M2, U.S. 30-Day Avg. Secured Overnight Fin. Rate (SOFR) Indx + 2.100% 2.11% 10/25/33 (a)(b)(c) | 690,000 | 700,979 | |
| Series 2021-HQA1 Class M1, U.S. 30-Day Avg. Secured Overnight Fin. Rate (SOFR) Indx + 0.700% 0.71% 8/25/33 (a)(b)(c) | 1,250,000 | 1,248,519 | |
| Freddie Mac STACR Trust floater: | |||
| Series 2018-DNA2: | |||
| Class M1, 1 month U.S. LIBOR + 0.800% 0.8916% 12/25/30 (a)(b)(c) | 232,179 | 232,224 | |
| Class M2A/S, 1 month U.S. LIBOR + 0.950% 1.0416% 12/25/30 (a)(b)(c) | 450,000 | 449,250 | |
| Series 2018-HRP2 Class M2, 1 month U.S. LIBOR + 1.250% 1.3416% 2/25/47 (a)(b)(c) | 466,141 | 466,540 | |
| Series 2019-HRP1 Class M2, 1 month U.S. LIBOR + 1.400% 1.4916% 2/25/49 (a)(b)(c) | 628,406 | 624,102 | |
| FWD Securitization Trust sequential payer Series 2020-INV1 Class A1, 2.24% 1/25/50 (a) | 1,182,020 | 1,203,725 | |
| Galton Funding Mortgage Trust: | |||
| sequential payer: | |||
| Series 2019-H1 Class M1, 3.339% 10/25/59 (a) | 600,000 | 620,932 | |
| Series 2020-H1 Class M1, 2.832% 1/25/60 (a) | 625,000 | 637,226 | |
| Series 2019-1: | |||
| Class A21, 4.5% 2/25/59 (a) | 295,750 | 303,548 | |
| Class A32, 4% 2/25/59 (a) | 178,226 | 181,171 | |
| Series 2020-H1 Class A1, 2.31% 1/25/60 (a) | 1,134,861 | 1,152,704 | |
| GMRF Mortgage Acquisition Co., LLC: | |||
| Series 2018-1 Class A33, 3.5% 11/25/57 (a) | 239,894 | 243,217 | |
| Series 2019-2 Class A42, 3.5% 6/25/59 (a) | 122,227 | 122,676 | |
| Gosforth Funding PLC floater Series 2018-1A Class A1, 3 month U.S. LIBOR + 0.450% 0.597% 8/25/60 (a)(b)(c) | 840,980 | 841,744 | |
| GS Mortgage Securities Trust sequential payer Series 2021-NQM1 Class A1, 1.017% 7/25/61 (a) | 620,000 | 618,115 | |
| GS Mortgage-Backed Securites Trust Series 2014-EB1A Class 2A1, 1.7437% 7/25/44 (a)(b) | 16,220 | 16,192 | |
| GS Mortgage-Backed Securities Trust Series 2021-PJ5 Class A8, 2.5% 10/25/51 (a)(b) | 1,520,000 | 1,555,811 | |
| Homeward Opportunities Fund I Trust sequential payer Series 2019-3 Class A1, 2.675% 11/25/59 (a) | 359,708 | 364,936 | |
| Homeward Opportunities Fund Trust sequential payer Series 2020-2 Class A1, 1.657% 5/25/65 (a)(b) | 473,062 | 476,243 | |
| Hundred Acre Wood Trust Series 2021-INV1 Class A9, 2.5% 7/25/51 (b) | 1,015,000 | 1,043,547 | |
| J.P. Morgan Mortgage Trust: | |||
| sequential payer Series 2020-LTV1 Class A4, 3.5% 6/25/50 (a) | 415,899 | 418,804 | |
| Series 2020-INV1 Class A15, 3.5% 8/25/50 (a) | 394,414 | 402,533 | |
| Lanark Master Issuer PLC floater Series 2019-1A Class 1A1, 3 month U.S. LIBOR + 0.770% 0.9201% 12/22/69 (a)(b)(c) | 646,967 | 647,801 | |
| Metlife Securitization Trust Series 2017-1A Class A, 3% 4/25/55 (a) | 273,408 | 280,537 | |
| Mill City Mortgage Loan Trust: | |||
| Series 2016-1 Class A1, 2.5% 4/25/57 (a) | 36,118 | 36,419 | |
| Series 2017-2 Class A1, 2.75% 7/25/59 (a) | 276,754 | 281,659 | |
| New Residential Mortgage Loan Trust sequential payer: | |||
| Series 2019-NQM5 Class A1, 2.7099% 11/25/59 (a) | 787,100 | 814,336 | |
| Series 2020-NQM1 Class A1, 2.4641% 1/26/60 (a) | 448,219 | 459,905 | |
| Series 2021-NQ1R Class A1, 0.9426% 7/25/55 (a) | 1,157,716 | 1,162,099 | |
| OBX Trust: | |||
| floater Series 2020-EXP1 Class 2A2, 1 month U.S. LIBOR + 0.950% 1.0416% 2/25/60 (a)(b)(c) | 645,855 | 646,961 | |
| Series 2020-EXP1 Class 1A8, 3.5% 2/25/60 (a)(b) | 653,434 | 669,468 | |
| Series 2020-EXP2: | |||
| Class A8, 3% 5/25/60 (a) | 983,701 | 1,006,894 | |
| Class A9, 3% 5/25/60 (a) | 241,997 | 247,339 | |
| Series 2020-INV1 Class A5, 3.5% 12/25/49 (a) | 237,655 | 241,857 | |
| Onslow Bay Financial LLC: | |||
| floater Series 2019-EXP2 Class 2A2, 1 month U.S. LIBOR + 1.200% 1.2916% 6/25/59 (a)(b)(c) | 631,247 | 634,423 | |
| floater sequential payer Series 2019-EXP2 Class 2A1A, 1 month U.S. LIBOR + 0.900% 0.9916% 6/25/59 (a)(b)(c) | 252,588 | 252,837 | |
| sequential payer: | |||
| Series 2021-J1 Class A4, 2.5% 5/25/51 (a) | 1,166,716 | 1,196,069 | |
| Series 2021-NQM1: | |||
| Class A1, 1.072% 2/25/66 (a) | 1,241,184 | 1,247,578 | |
| Class A2, 1.175% 2/25/66 (a) | 660,707 | 663,386 | |
| Permanent Master Issuer PLC floater Series-1A Class 1A1, 3 month U.S. LIBOR + 0.550% 0.7338% 7/15/58 (a)(b)(c) | 896,000 | 896,653 | |
| PSMC Trust sequential payer Series 2021-1 Class A11, 2.5% 3/25/51 (a)(b) | 1,751,751 | 1,799,943 | |
| Sequoia Mortgage Trust: | |||
| sequential payer: | |||
| Series 2018-CH1 Class A11, 3.5% 2/25/48 (a) | 29,228 | 29,249 | |
| Series 2018-CH2 Class A3, 4% 6/25/48 (a) | 395,918 | 401,751 | |
| Series 2018-CH2 Class A21, 4% 6/25/48 (a) | 176,673 | 180,035 | |
| Series 2018-CH3 Class A19, 4.5% 8/25/48 (a) | 87,052 | 89,013 | |
| Series 2018-CH4 Class A2, 4% 10/25/48 (a) | 124,999 | 126,699 | |
| Silverstone Master Issuer PLC floater Series 2019-1A Class 1A, 3 month U.S. LIBOR + 0.570% 0.756% 1/21/70 (a)(b)(c) | 3,184,525 | 3,188,534 | |
| Starwood Mortgage Residential Trust: | |||
| sequential payer Series 2019-INV1: | |||
| Class A1, 2.61% 9/27/49 (a) | 87,082 | 88,261 | |
| Class A3, 2.916% 9/27/49 (a) | 388,376 | 396,164 | |
| Series 2019-1: | |||
| Class A1, 2.941% 6/25/49 (a) | 429,755 | 434,361 | |
| Class A3, 3.299% 6/25/49 (a) | 555,402 | 558,581 | |
| Series 2020-1 Class A2, 2.408% 2/25/50 (a) | 467,069 | 471,611 | |
| Series 2021-2 Class A1, 0.943% 5/25/65 (a) | 795,000 | 791,512 | |
| Towd Point Mortgage Trust: | |||
| Series 2015-5 Class A1B, 2.75% 5/25/55 (a) | 10,324 | 10,349 | |
| Series 2016-1: | |||
| Class A1B, 2.75% 2/25/55 (a) | 31,422 | 31,502 | |
| Class A3B, 3% 2/25/55 (a) | 95,461 | 96,347 | |
| Series 2016-2 Class A1A, 2.75% 8/25/55 (a) | 87,596 | 89,237 | |
| Series 2016-3 Class A1, 2.25% 4/25/56 (a) | 16,042 | 16,129 | |
| Series 2017-2 Class A1, 2.75% 4/25/57 (a)(b) | 212,766 | 216,045 | |
| Series 2017-3 Class A1, 2.75% 7/25/57 (a)(b) | 512,460 | 521,760 | |
| Verus Securitization Trust: | |||
| sequential payer: | |||
| Series 2019-INV3 Class A3, 3.1% 11/25/59 (a) | 706,301 | 723,869 | |
| Series 2020-1 Class A3, 2.724% 1/25/60 (a) | 669,609 | 678,877 | |
| Series 2020-2 Class A1, 2.226% 5/25/60 (a) | 1,394,274 | 1,407,981 | |
| Series 2020-INV1 Class A1, 1.977% 3/25/60 (a) | 175,057 | 176,669 | |
| Series 2019-3 Class A3, 3.04% 7/25/59 (a) | 1,132,737 | 1,140,911 | |
| Series 2019-4 Class A3, 3% 11/25/59 (a) | 352,039 | 357,463 | |
| Series 2019-INV1: | |||
| Class A1, 3.402% 12/25/59 (a)(b) | 309,497 | 311,526 | |
| Class M1, 4.034% 12/25/59 (a) | 195,000 | 199,728 | |
| Series 2019-INV2 Class A2, 3.117% 7/25/59 (a) | 854,285 | 867,109 | |
| Series 2020-5 Class A3, 1.733% 5/25/65 (a) | 348,177 | 347,990 | |
| Series 2021-1: | |||
| Class A2, 1.052% 1/25/66 (a) | 493,691 | 494,670 | |
| Class A3, 1.155% 1/25/66 (a) | 291,727 | 291,402 | |
| Series 2021-2 Class A1, 1.031% 2/25/66 (a) | 644,441 | 645,431 | |
| Series 2021-R1 Class A2, 1.057% 10/25/63 (a) | 319,115 | 318,351 | |
| Series 2021-R2 Class A1, 0.918% 2/25/64 (a) | 810,495 | 808,218 | |
| Vista Point Securitization Trust sequential payer Series 2020-2 Class A3, 2.496% 4/25/65 (a) | 344,620 | 351,890 | |
| TOTAL PRIVATE SPONSOR | 58,176,032 | ||
| U.S. Government Agency - 0.2% | |||
| Fannie Mae: | |||
| Series 2017-90 Class KA, 3% 11/25/47 | 697,106 | 745,287 | |
| Series 2018-44 Class PC, 4% 6/25/44 | 280,502 | 282,551 | |
| Fannie Mae Connecticut Avenue Securities floater: | |||
| Series 2017-C02 Class 2ED3, 1 month U.S. LIBOR + 1.350% 1.4416% 9/25/29 (b)(c) | 911,149 | 914,531 | |
| Series 2017-C04 Class 2ED2, 1 month U.S. LIBOR + 1.100% 1.1916% 11/25/29 (b)(c) | 1,335,083 | 1,304,777 | |
| Series 2017-C05 Class 1ED3, 1 month U.S. LIBOR + 1.200% 1.2916% 1/25/30 (b)(c) | 560,486 | 551,653 | |
| Series 2018-C01 Class 1ED2, 1 month U.S. LIBOR + 0.850% 0.9416% 7/25/30 (b)(c) | 891,504 | 875,878 | |
| FHLMC Structured Agency Credit Risk Debt Notes floater: | |||
| Series 2014-DN3 Class M3, 1 month U.S. LIBOR + 4.000% 4.0916% 8/25/24 (b)(c) | 262,228 | 267,733 | |
| Series 2015-DNA3 Class M3, 1 month U.S. LIBOR + 4.700% 4.7916% 4/25/28 (b)(c) | 1,286,918 | 1,330,356 | |
| Series 2016-DNA2 Class M3, 1 month U.S. LIBOR + 4.650% 4.7416% 10/25/28 (b)(c) | 736,524 | 770,244 | |
| Series 2017-DNA2 Class M1, 1 month U.S. LIBOR + 1.200% 1.2916% 10/25/29 (b)(c) | 205,004 | 205,360 | |
| Series 2017-DNA3 Class M1, 1 month U.S. LIBOR + 0.750% 0.8416% 3/25/30 (b)(c) | 91,007 | 91,016 | |
| Freddie Mac planned amortization class Series 3713 Class PA, 2% 2/15/40 | 370,003 | 376,716 | |
| Freddie Mac STACR Trust floater: | |||
| Series 18-HQA2 Class M1, 1 month U.S. LIBOR + 0.750% 0.8416% 10/25/48 (a)(b)(c) | 64,207 | 64,207 | |
| Series 2018-DNA3: | |||
| Class M1, 1 month U.S. LIBOR + 0.750% 0.8416% 9/25/48 (a)(b)(c) | 1,831 | 1,830 | |
| Class M2A/S, 1 month U.S. LIBOR + 0.900% 0.9916% 9/25/48 (a)(b)(c) | 600,000 | 598,713 | |
| Freddie Mac Whole Loan Securities Trust: | |||
| Series 2016-SC02 Class M1, 3.626% 10/25/46 (b) | 505,639 | 502,401 | |
| Series 2017-SC02 Class M1, 3.8501% 5/25/47 (a)(b) | 70,647 | 70,480 | |
| TOTAL U.S. GOVERNMENT AGENCY | 8,953,733 | ||
| TOTAL COLLATERALIZED MORTGAGE OBLIGATIONS | |||
| (Cost $66,866,832) | 67,129,765 | ||
| Commercial Mortgage Securities - 1.3% | |||
| ALEN Mortgage Trust floater Series 2021-ACEN Class A, 1 month U.S. LIBOR + 1.150% 1.251% 4/15/34 (a)(b)(c) | 595,000 | 595,000 | |
| Americold Realty Trust floater Series 2020-ICE5 Class B, 1 month U.S. LIBOR + 1.300% 1.4009% 11/15/37 (a)(b)(c) | 1,705,489 | 1,714,412 | |
| Atrium Hotel Portfolio Trust floater Series 2017-ATRM Class A 1 month U.S. LIBOR + 0.930% 1.031% 12/15/36 (a)(b)(c) | 1,395,000 | 1,394,974 | |
| Austin Fairmont Hotel Trust floater Series 2019-FAIR Class A, 1 month U.S. LIBOR + 1.050% 1.151% 9/15/32 (a)(b)(c) | 615,000 | 615,000 | |
| Banc of America Merrill Lynch Large Loan, Inc. floater Series 2018-DSNY Class A, 1 month U.S. LIBOR + 0.850% 0.951% 9/15/34 (a)(b)(c) | 970,000 | 970,283 | |
| BANK Series 2019-BN19 Class A1, 2.263% 8/15/61 | 391,914 | 401,821 | |
| BX Commercial Mortgage Trust: | |||
| floater: | |||
| Series 2020-BXLP: | |||
| Class C, 1 month U.S. LIBOR + 1.120% 1.221% 12/15/36 (a)(b)(c) | 779,076 | 779,076 | |
| Class D, 1 month U.S. LIBOR + 1.250% 1.351% 12/15/36 (a)(b)(c) | 744,777 | 744,777 | |
| Series 2021-VINO Class A, 1 month U.S. LIBOR + 0.650% 0.7623% 5/15/38 (a)(b)(c) | 1,600,000 | 1,598,558 | |
| floater sequential payer Series 2020-BXLP Class A, 1 month U.S. LIBOR + 0.800% 0.901% 12/15/36 (a)(b)(c) | 2,286,271 | 2,289,133 | |
| BX Trust: | |||
| floater Series 2019-XL Class B, 1 month U.S. LIBOR + 1.080% 1.181% 10/15/36 (a)(b)(c) | 421,563 | 422,158 | |
| floater, sequential payer: | |||
| Series 2019-IMC Class A, 1 month U.S. LIBOR + 1.000% 1.101% 4/15/34 (a)(b)(c) | 2,135,000 | 2,130,927 | |
| Series 2019-XL Class A, 1 month U.S. LIBOR + 0.920% 1.021% 10/15/36 (a)(b)(c) | 5,681,738 | 5,688,014 | |
| CGDB Commercial Mortgage Trust floater Series 2019-MOB: | |||
| Class A, 1 month U.S. LIBOR + 0.950% 1.0509% 11/15/36 (a)(b)(c) | 1,033,000 | 1,033,312 | |
| Class D, 1 month U.S. LIBOR + 1.650% 1.7509% 11/15/36 (a)(b)(c) | 1,545,000 | 1,542,056 | |
| CHC Commercial Mortgage Trust floater Series 2019-CHC Class A, 1 month U.S. LIBOR + 1.120% 1.221% 6/15/34 (a)(b)(c) | 3,720,923 | 3,722,048 | |
| Citigroup Commercial Mortgage Trust: | |||
| sequential payer Series 2012-GC8 Class A/S, 3.683% 9/10/45 (a) | 2,157,000 | 2,218,135 | |
| Series 2013-375P Class C, 3.5176% 5/10/35 (a)(b) | 560,000 | 572,874 | |
| COMM Mortgage Trust: | |||
| sequential payer Series 2013-300P Class A1, 4.353% 8/10/30 (a) | 620,000 | 659,456 | |
| Series 2014-CR15 Class B, 4.6683% 2/10/47 (b) | 920,000 | 1,004,425 | |
| Series 2014-UBS2 Class B, 4.701% 3/10/47 | 915,000 | 991,076 | |
| Series 2015-CR22 Class B, 3.926% 3/10/48 (b) | 405,000 | 439,100 | |
| Series 2020-CMB Class D, 3.6327% 2/10/37 (a)(b) | 560,000 | 546,872 | |
| Credit Suisse Mortgage Trust: | |||
| floater Series 2019-ICE4: | |||
| Class A, 1 month U.S. LIBOR + 0.980% 1.081% 5/15/36 (a)(b)(c) | 5,485,000 | 5,496,648 | |
| Class C, 1 month U.S. LIBOR + 1.430% 1.531% 5/15/36 (a)(b)(c) | 1,015,000 | 1,016,222 | |
| Class D, 1 month U.S. LIBOR + 1.600% 1.701% 5/15/36 (a)(b)(c) | 780,000 | 781,253 | |
| sequential payer Series 2020-NET Class A, 2.2569% 8/15/37 (a) | 455,000 | 470,117 | |
| Series 2020-NET Class D, 3.7042% 8/15/37 (a)(b) | 985,000 | 1,016,312 | |
| CSAIL Commercial Mortgage Trust: | |||
| sequential payer Series 2015-C3 Class A4, 3.7182% 8/15/48 | 670,000 | 735,898 | |
| Series 2019-C16 Class A1, 2.3595% 6/15/52 | 462,426 | 473,542 | |
| CSMC Trust Series 2017-CHOP Class A, 1 month U.S. LIBOR + 0.750% 0.851% 7/15/32 (a)(b)(c) | 4,189,000 | 4,136,056 | |
| GCT Commercial Mortgage Trust floater Series 2021-GCT Class A, 1 month U.S. LIBOR + 0.800% 0.901% 2/15/38 (a)(b)(c) | 555,000 | 555,697 | |
| Great Wolf Trust floater Series 2019-WOLF: | |||
| Class A, 1 month U.S. LIBOR + 1.030% 1.135% 12/15/36 (a)(b)(c) | 1,906,000 | 1,908,383 | |
| Class C, 1 month U.S. LIBOR + 1.630% 1.734% 12/15/36 (a)(b)(c) | 600,000 | 597,708 | |
| GS Mortgage Securities Corp. Trust floater Series 2021-ROSS Class B, 1 month U.S. LIBOR + 1.600% 1.75% 5/15/26 (a)(b)(c) | 685,000 | 685,204 | |
| Intown Hotel Portfolio Trust Series 2018-STAY: | |||
| Class A, 1 month U.S. LIBOR + 0.950% 1.051% 1/15/33 (a)(b)(c) | 245,000 | 245,650 | |
| Class C, 1 month U.S. LIBOR + 1.500% 1.601% 1/15/33 (a)(b)(c) | 205,000 | 205,473 | |
| J.P. Morgan Chase Commercial Mortgage Securities Trust floater Series 2020-609M: | |||
| Class B, 1 month U.S. LIBOR + 1.770% 1.871% 10/15/33 (a)(b)(c) | 995,000 | 997,777 | |
| Class C, 1 month U.S. LIBOR + 2.170% 2.271% 10/15/33 (a)(b)(c) | 805,000 | 807,489 | |
| JPMorgan Chase Commercial Mortgage Securities Trust: | |||
| floater: | |||
| Series 2018-GW Class A, 1 month U.S. LIBOR + 0.800% 0.901% 5/15/35 (a)(b)(c) | 2,440,000 | 2,442,254 | |
| Series 2019-BKWD: | |||
| Class A, 1 month U.S. LIBOR + 1.000% 1.101% 9/15/29 (a)(b)(c) | 1,911,000 | 1,913,750 | |
| Class B, 1 month U.S. LIBOR + 1.350% 1.451% 9/15/29 (a)(b)(c) | 1,830,000 | 1,828,287 | |
| Class C, 1 month U.S. LIBOR + 1.600% 1.701% 9/15/29 (a)(b)(c) | 575,000 | 573,885 | |
| sequential payer Series 2014-C20 Class A3A1, 3.4718% 7/15/47 | 2,400 | 2,400 | |
| Series 2013-C13 Class A4, 3.9936% 1/15/46 (b) | 1,148,703 | 1,221,961 | |
| KKR Industrial Portfolio Trust floater Series 2021-KDIP Class D, 1 month U.S. LIBOR + 1.250% 1.3509% 12/15/37 (a)(b)(c) | 265,000 | 264,668 | |
| LIFE Mortgage Trust floater Series 2021-BMR Class A, 1 month U.S. LIBOR + 0.700% 0.801% 3/15/38 (a)(b)(c) | 1,660,000 | 1,661,042 | |
| Merit floater Series 2020-HILL: | |||
| Class A, 1 month U.S. LIBOR + 1.150% 1.251% 8/15/37 (a)(b)(c) | 576,000 | 578,488 | |
| Class B, 1 month U.S. LIBOR + 1.400% 1.501% 8/15/37 (a)(b)(c) | 825,000 | 828,392 | |
| Class C, 1 month U.S. LIBOR + 1.700% 1.801% 8/15/37 (a)(b)(c) | 410,000 | 411,809 | |
| Class D, 1 month U.S. LIBOR + 2.350% 2.451% 8/15/37 (a)(b)(c) | 550,000 | 552,758 | |
| MHC Commercial Mortgage Trust floater Series 2021-MHC Class B, 1 month U.S. LIBOR + 1.100% 1.2018% 4/15/38 (a)(b)(c) | 710,000 | 710,215 | |
| MHC Trust floater Series 2021-MHC2 Class B, 1 month U.S. LIBOR + 1.100% 1.201% 5/15/23 (a)(b)(c) | 660,000 | 660,414 | |
| Morgan Stanley BAML Trust: | |||
| Series 2014-C18 Class A/S, 4.11% 10/15/47 | 370,000 | 400,900 | |
| Series 2016-C30 Class A1, 1.389% 9/15/49 | 13,635 | 13,635 | |
| Morgan Stanley Capital I Trust: | |||
| floater: | |||
| Series 2018-BOP Class A, 1 month U.S. LIBOR + 0.850% 0.951% 8/15/33 (a)(b)(c) | 5,578,279 | 5,567,743 | |
| Series 2019-NUGS Class D, 1 month U.S. LIBOR + 1.800% 3.3% 12/15/36 (a)(b)(c) | 510,000 | 513,029 | |
| sequential payer Series 2014-150E Class A, 3.912% 9/9/32 (a) | 1,325,000 | 1,431,507 | |
| Series 2011-C3 Class AJ, 5.2155% 7/15/49 (a)(b) | 1,340,479 | 1,344,452 | |
| Series 2019-MEAD Class D, 3.1771% 11/10/36 (a)(b) | 1,150,000 | 1,144,153 | |
| New Orleans Hotel Trust floater Series 2019-HNLA Class B, 1 month U.S. LIBOR + 1.289% 1.3897% 4/15/32 (a)(b)(c) | 1,585,000 | 1,571,082 | |
| RLGH Trust floater Series 2021-TROT Class A, 1 month U.S. LIBOR + 0.800% 0.91% 4/15/36 (a)(b)(c) | 650,000 | 650,193 | |
| Slide floater Series 2018-FUN Class D, 1 month U.S. LIBOR + 1.850% 1.951% 6/15/31 (a)(b)(c) | 771,601 | 760,417 | |
| UBS-Barclays Commercial Mortgage Trust floater Series 2013-C6 Class A3, 1 month U.S. LIBOR + 0.790% 0.8881% 4/10/46 (a)(b)(c) | 3,020,457 | 3,011,979 | |
| Vista Point Securitization Trust sequential payer Series 2020-1 Class A1, 1.763% 3/25/65 (a) | 387,706 | 391,784 | |
| Wells Fargo Commercial Mortgage Trust Series 2015-NXS2 Class A2, 3.02% 7/15/58 | 332,927 | 340,242 | |
| WF-RBS Commercial Mortgage Trust Series 2012-C6 Class B, 4.697% 4/15/45 | 760,000 | 776,370 | |
| TOTAL COMMERCIAL MORTGAGE SECURITIES | |||
| (Cost $83,580,622) | 83,770,725 | ||
| Municipal Securities - 0.1% | |||
| Chicago Transit Auth. Series 2020 B: | |||
| 1.708% 12/1/22 | $40,000 | $40,589 | |
| 1.838% 12/1/23 | 35,000 | 35,796 | |
| 2.064% 12/1/24 | 105,000 | 108,443 | |
| Connecticut Gen. Oblig. Series A: | |||
| 1.998% 7/1/24 | 285,000 | 298,077 | |
| 2% 7/1/23 | 115,000 | 119,065 | |
| 2.098% 7/1/25 | 190,000 | 199,656 | |
| Dallas Fort Worth Int'l. Arpt. Rev. Series 2020 C, 1.329% 11/1/25 | 245,000 | 248,604 | |
| Houston Arpt. Sys. Rev. Series 2020 C: | |||
| 0.883% 7/1/22 | 70,000 | 70,435 | |
| 1.054% 7/1/23 | 120,000 | 121,487 | |
| 1.272% 7/1/24 | 400,000 | 407,634 | |
| Illinois Gen. Oblig. Series 2020 A, 2.25% 10/1/22 | 1,640,000 | 1,651,189 | |
| Long Island Pwr. Auth. Elec. Sys. Rev. Series 2020 C, 0.764% 3/1/23 | 360,000 | 361,774 | |
| Port Auth. of New York & New Jersey Series AAA, 1.086% 7/1/23 | 1,405,000 | 1,423,346 | |
| TOTAL MUNICIPAL SECURITIES | |||
| (Cost $5,010,472) | 5,086,095 | ||
| Bank Notes - 0.2% | |||
| Capital One NA 2.15% 9/6/22 | 1,370,000 | 1,400,045 | |
| Discover Bank 3.2% 8/9/21 | 1,050,000 | 1,053,260 | |
| First Republic Bank 1.912% 2/12/24 (b) | 2,031,000 | 2,077,064 | |
| KeyBank NA 2.3% 9/14/22 | 355,000 | 364,168 | |
| PNC Bank NA 2.95% 1/30/23 | 695,000 | 723,742 | |
| RBS Citizens NA 3.25% 2/14/22 | 1,015,000 | 1,033,852 | |
| Truist Bank 1.25% 3/9/23 | 9,000,000 | 9,154,399 | |
| TOTAL BANK NOTES | |||
| (Cost $15,529,258) | 15,806,530 | ||
| Commercial Paper - 0.6% | |||
| AT&T, Inc. 0% 12/14/21 | 2,185,000 | 2,182,451 | |
| HSBC U.S.A., Inc. yankee: | |||
| 0.4% 10/5/21 | 10,000,000 | 9,990,719 | |
| 0.4% 2/9/22 | 10,000,000 | 9,975,442 | |
| NatWest Markets PLC yankee 0.35% 4/19/22 | 10,000,000 | 9,975,097 | |
| Svenska Handelsbanken AB 3 month U.S. LIBOR + 0.090% 0.2783% 7/20/21 (b)(c) | 8,000,000 | 8,001,066 | |
| TOTAL COMMERCIAL PAPER | |||
| (Cost $40,106,825) | 40,124,775 | ||
| Shares | Value | ||
| Short-Term Funds - 56.1% | |||
| Short-Term Funds - 56.1% | |||
| Baird Short-Term Bond Fund - Institutional Class | 17,677,188 | $174,827,385 | |
| Baird Ultra Short Bond Fund Institutional Class | 38,686,749 | 389,575,560 | |
| BlackRock Low Duration Bond Portfolio Investor A Shares | 28,194,673 | 275,461,955 | |
| Fidelity SAI Short-Term Bond Fund (f) | 28,473,615 | 285,020,885 | |
| iShares Short Maturity Bond ETF (g) | 4,226,791 | 212,184,908 | |
| iShares Short Treasury Bond ETF (g) | 1,120,350 | 123,809,879 | |
| iShares Ultra Short-Term Bond ETF | 2,140,810 | 108,153,721 | |
| JPMorgan Ultra-Short Income ETF (g) | 4,010,821 | 203,629,382 | |
| Metropolitan West Low Duration Bond Fund - Class M | 23,665,118 | 210,619,551 | |
| PIMCO Enhanced Low Duration Active ETF (g) | 747,550 | 76,197,772 | |
| PIMCO Enhanced Short Maturity Active ETF | 3,163,695 | 322,728,527 | |
| PIMCO Short-Term Fund Institutional Class | 85,486,764 | 841,189,729 | |
| Prudential Short-Term Corporate Bond Fund, Inc. Class A | 1,810,755 | 20,533,957 | |
| T. Rowe Price Ultra Short-Term Bond Fund | 44,359,168 | 225,788,163 | |
| TOTAL SHORT-TERM FUNDS | |||
| (Cost $3,434,751,210) | 3,469,721,374 | ||
| Money Market Funds - 9.7% | |||
| Fidelity Cash Central Fund 0.03%(h) | 140,590,238 | 140,618,356 | |
| Fidelity Investments Money Market Government Portfolio Institutional Class 0.01% (f)(i) | 367,658,318 | 367,658,318 | |
| Fidelity Securities Lending Cash Central Fund 0.03%(h)(j) | 83,329,481 | 83,337,814 | |
| State Street Institutional U.S. Government Money Market Fund Premier Class 0.03% (i) | 8,475,018 | 8,475,018 | |
| TOTAL MONEY MARKET FUNDS | |||
| (Cost $600,084,532) | 600,089,506 | ||
| TOTAL INVESTMENT IN SECURITIES - 101.6% | |||
| (Cost $6,231,862,543) | 6,282,653,197 | ||
| NET OTHER ASSETS (LIABILITIES) - (1.6)% | (101,864,963) | ||
| NET ASSETS - 100% | $6,180,788,234 |
| Futures Contracts | |||||
| Number of contracts | Expiration Date | Notional Amount | Value | Unrealized Appreciation/(Depreciation) | |
| Purchased | |||||
| Treasury Contracts | |||||
| CBOT 2-Year U.S. Treasury Note Contracts (United States) | 406 | Sept. 2021 | $89,618,156 | $40,658 | $40,658 |
| Sold | |||||
| Treasury Contracts | |||||
| CBOT 10-Year U.S. Treasury Note Contracts (United States) | 152 | Sept. 2021 | 20,054,500 | (31,091) | (31,091) |
| CBOT 5-Year U.S. Treasury Note Contracts (United States) | 203 | Sept. 2021 | 25,141,867 | (49,451) | (49,451) |
| CBOT Ultra 10-Year U.S. Treasury Note Contracts (United States) | 26 | Sept. 2021 | 3,768,781 | 6,648 | 6,648 |
| Total Sold | $(73,894) | ||||
| TOTAL FUTURES CONTRACTS | $(33,236) |
The notional amount of futures purchased as a percentage of Net Assets is 1.4%
The notional amount of futures sold as a percentage of Net Assets is 0.8%
Security Type Abbreviations
ETF – Exchange-Traded Fund
Legend
(a) Security exempt from registration under Rule 144A of the Securities Act of 1933. These securities may be resold in transactions exempt from registration, normally to qualified institutional buyers. At the end of the period, the value of these securities amounted to $746,356,038 or 12.1% of net assets.
(b) Coupon rates for floating and adjustable rate securities reflect the rates in effect at period end.
(c) Coupon is indexed to a floating interest rate which may be multiplied by a specified factor and/or subject to caps or floors.
(d) Security or a portion of the security was pledged to cover margin requirements for futures contracts. At period end, the value of securities pledged amounted to $373,478.
(e) Security or a portion of the security purchased on a delayed delivery or when-issued basis.
(f) Affiliated Fund
(g) Security or a portion of the security is on loan at period end.
(h) Affiliated fund that is generally available only to investment companies and other accounts managed by Fidelity Investments. The rate quoted is the annualized seven-day yield of the fund at period end. A complete unaudited listing of the fund's holdings as of its most recent quarter end is available upon request. In addition, each Fidelity Central Fund's financial statements, which are not covered by the Fund's Report of Independent Registered Public Accounting Firm, are available on the SEC's website or upon request.
(i) The rate quoted is the annualized seven-day yield of the fund at period end.
(j) Investment made with cash collateral received from securities on loan.
Affiliated Central Funds
Information regarding fiscal year to date income earned by the Fund from investments in Fidelity Central Funds is as follows:
| Fund | Income earned |
| Fidelity Cash Central Fund | $123,711 |
| Fidelity Securities Lending Cash Central Fund | 185,239 |
| Total | $308,950 |
Amounts in the income column in the above table include any capital gain distributions from underlying funds, which are presented in the corresponding line-item in the Statement of Operations, if applicable. Amount for Fidelity Securities Lending Cash Central Fund represents the income earned on investing cash collateral, less rebates paid to borrowers and any lending agent fees associated with the loan, plus any premium payments received for lending certain types of securities.
Affiliated Underlying Funds
Fiscal year to date information regarding the Fund's investments in affiliated Underlying Funds, excluding any Money Market Central Funds, is presented below. Exchanges between classes of the same affiliated Underlying Funds may occur.
| Affiliate | Value, beginning of period | Purchases(a) | Sales Proceeds(a) | Dividend Income | Realized Gain (loss) | Change in Unrealized appreciation (depreciation) | Value, end of period |
| Fidelity Conservative Income Bond Fund Institutional Class | $38,648,696 | $49,958 | $38,814,165 | $53,671 | $127,290 | $(11,779) | $-- |
| Fidelity Floating Rate High Income Fund | 58,035,797 | 283,180 | 58,957,982 | 283,495 | (3,777,578) | 4,416,583 | -- |
| Fidelity Investments Money Market Government Portfolio Institutional Class 0.01% | 82,618,947 | 3,309,093,232 | 3,024,053,861 | 101,008 | -- | -- | 367,658,318 |
| Fidelity SAI Short-Term Bond Fund | -- | 309,577,661 | 25,000,000 | 900,936 | 25,000 | 418,224 | 285,020,885 |
| Fidelity Short-Term Bond Fund | 419,380,785 | 2,691,803 | 424,000,435 | 2,968,008 | 15,690,781 | (13,762,934) | -- |
| Total | $598,684,225 | $3,621,695,834 | $3,570,826,443 | $4,307,118 | $12,065,493 | $(8,939,906) | $652,679,203 |
(a) Includes the value of shares purchased or redeemed through in-kind transactions, if applicable.
Amounts in the income column in the above table include any capital gain distributions from underlying funds, which are presented in the corresponding line-item in the Statement of Operations, if applicable.
Investment Valuation
The following is a summary of the inputs used, as of May 31, 2021, involving the Fund's assets and liabilities carried at fair value. The inputs or methodology used for valuing securities may not be an indication of the risk associated with investing in those securities. For more information on valuation inputs, and their aggregation into the levels used below, please refer to the Investment Valuation section in the accompanying Notes to Financial Statements.
| Valuation Inputs at Reporting Date: | ||||
| Description | Total | Level 1 | Level 2 | Level 3 |
| Investments in Securities: | ||||
| Corporate Bonds | $1,414,790,353 | $-- | $1,414,790,353 | $-- |
| U.S. Government and Government Agency Obligations | 145,821,309 | -- | 145,821,309 | -- |
| U.S. Government Agency - Mortgage Securities | 22,311,796 | -- | 22,311,796 | -- |
| Asset-Backed Securities | 418,000,969 | -- | 418,000,969 | -- |
| Collateralized Mortgage Obligations | 67,129,765 | -- | 67,129,765 | -- |
| Commercial Mortgage Securities | 83,770,725 | -- | 83,770,725 | -- |
| Municipal Securities | 5,086,095 | -- | 5,086,095 | -- |
| Bank Notes | 15,806,530 | -- | 15,806,530 | -- |
| Commercial Paper | 40,124,775 | -- | 40,124,775 | -- |
| Short-Term Funds | 3,469,721,374 | 3,469,721,374 | -- | -- |
| Money Market Funds | 600,089,506 | 600,089,506 | -- | -- |
| Total Investments in Securities: | $6,282,653,197 | $4,069,810,880 | $2,212,842,317 | $-- |
| Derivative Instruments: | ||||
| Assets | ||||
| Futures Contracts | $47,306 | $47,306 | $-- | $-- |
| Total Assets | $47,306 | $47,306 | $-- | $-- |
| Liabilities | ||||
| Futures Contracts | $(80,542) | $(80,542) | $-- | $-- |
| Total Liabilities | $(80,542) | $(80,542) | $-- | $-- |
| Total Derivative Instruments: | $(33,236) | $(33,236) | $-- | $-- |
Value of Derivative Instruments
The following table is a summary of the Fund's value of derivative instruments by primary risk exposure as of May 31, 2021. For additional information on derivative instruments, please refer to the Derivative Instruments section in the accompanying Notes to Financial Statements.
| Primary Risk Exposure / Derivative Type | Value | |
| Asset | Liability | |
| Interest Rate Risk | ||
| Futures Contracts(a) | $47,306 | $(80,542) |
| Total Interest Rate Risk | 47,306 | (80,542) |
| Total Value of Derivatives | $47,306 | $(80,542) |
(a) Reflects gross cumulative appreciation (depreciation) on futures contracts as presented in the Schedule of Investments. In the Statement of Assets and Liabilities, the period end daily variation margin is included in receivable or payable for daily variation margin on futures contracts, and the net cumulative appreciation (depreciation) is included in Total accumulated earnings (loss).
See accompanying notes which are an integral part of the financial statements.
Financial Statements
Statement of Assets and Liabilities
| May 31, 2021 | ||
| Assets | ||
| Investment in securities, at value (including securities loaned of $81,655,101) — See accompanying schedule: Unaffiliated issuers (cost $5,355,650,369) | $5,406,017,824 | |
| Fidelity Central Funds (cost $223,951,195) | 223,956,170 | |
| Other affiliated issuers (cost $652,260,979) | 652,679,203 | |
| Total Investment in Securities (cost $6,231,862,543) | $6,282,653,197 | |
| Cash | 287,711 | |
| Receivable for investments sold | 4,983,614 | |
| Receivable for fund shares sold | 3,401,786 | |
| Interest receivable | 6,484,213 | |
| Distributions receivable from Fidelity Central Funds | 14,111 | |
| Receivable for daily variation margin on futures contracts | 22,294 | |
| Prepaid expenses | 15,628 | |
| Other receivables | 134,142 | |
| Total assets | 6,297,996,696 | |
| Liabilities | ||
| Payable for investments purchased | ||
| Regular delivery | $18,942,569 | |
| Delayed delivery | 7,501,867 | |
| Payable for fund shares redeemed | 6,460,098 | |
| Distributions payable | 577,350 | |
| Accrued management fee | 214,026 | |
| Other payables and accrued expenses | 197,277 | |
| Collateral on securities loaned | 83,315,275 | |
| Total liabilities | 117,208,462 | |
| Net Assets | $6,180,788,234 | |
| Net Assets consist of: | ||
| Paid in capital | $6,130,243,944 | |
| Total accumulated earnings (loss) | 50,544,290 | |
| Net Assets | $6,180,788,234 | |
| Net Asset Value, offering price and redemption price per share ($6,180,788,234 ÷ 609,904,356 shares) | $10.13 |
See accompanying notes which are an integral part of the financial statements.
Statement of Operations
| Year ended May 31, 2021 | ||
| Investment Income | ||
| Dividends: | ||
| Unaffiliated issuers | $33,070,095 | |
| Affiliated issuers | 3,140,587 | |
| Interest | 32,250,299 | |
| Income from Fidelity Central Funds (including $185,239 from security lending) | 308,950 | |
| Total income | 68,769,931 | |
| Expenses | ||
| Management fee | $18,350,655 | |
| Custodian fees and expenses | 47,623 | |
| Independent trustees' fees and expenses | 61,200 | |
| Registration fees | 148,174 | |
| Audit | 69,851 | |
| Legal | 19,172 | |
| Miscellaneous | 112,645 | |
| Total expenses before reductions | 18,809,320 | |
| Expense reductions | (15,672,388) | |
| Total expenses after reductions | 3,136,932 | |
| Net investment income (loss) | 65,632,999 | |
| Realized and Unrealized Gain (Loss) | ||
| Net realized gain (loss) on: | ||
| Investment securities: | ||
| Unaffiliated issuers | 24,735,196 | |
| Fidelity Central Funds | 17,457 | |
| Other affiliated issuers | 12,065,493 | |
| Futures contracts | 719,545 | |
| Capital gain distributions from underlying funds: | ||
| Unaffiliated issuers | 1,576,254 | |
| Affiliated issuers | 1,166,531 | |
| Total net realized gain (loss) | 40,280,476 | |
| Change in net unrealized appreciation (depreciation) on: | ||
| Investment securities: | ||
| Unaffiliated issuers | 32,997,605 | |
| Fidelity Central Funds | 1 | |
| Other affiliated issuers | (8,939,906) | |
| Futures contracts | (9,727) | |
| Total change in net unrealized appreciation (depreciation) | 24,047,973 | |
| Net gain (loss) | 64,328,449 | |
| Net increase (decrease) in net assets resulting from operations | $129,961,448 |
See accompanying notes which are an integral part of the financial statements.
Statement of Changes in Net Assets
| Year ended May 31, 2021 | Year ended May 31, 2020 | |
| Increase (Decrease) in Net Assets | ||
| Operations | ||
| Net investment income (loss) | $65,632,999 | $169,307,872 |
| Net realized gain (loss) | 40,280,476 | 13,007,378 |
| Change in net unrealized appreciation (depreciation) | 24,047,973 | 9,847,421 |
| Net increase (decrease) in net assets resulting from operations | 129,961,448 | 192,162,671 |
| Distributions to shareholders | (70,450,374) | (168,201,353) |
| Share transactions | ||
| Proceeds from sales of shares | 3,198,769,089 | 2,771,783,132 |
| Reinvestment of distributions | 56,384,302 | 153,886,892 |
| Cost of shares redeemed | (5,182,916,407) | (2,045,344,183) |
| Net increase (decrease) in net assets resulting from share transactions | (1,927,763,016) | 880,325,841 |
| Total increase (decrease) in net assets | (1,868,251,942) | 904,287,159 |
| Net Assets | ||
| Beginning of period | 8,049,040,176 | 7,144,753,017 |
| End of period | $6,180,788,234 | $8,049,040,176 |
| Other Information | ||
| Shares | ||
| Sold | 315,709,701 | 277,408,378 |
| Issued in reinvestment of distributions | 5,562,128 | 15,320,138 |
| Redeemed | (511,257,803) | (204,536,004) |
| Net increase (decrease) | (189,985,974) | 88,192,512 |
See accompanying notes which are an integral part of the financial statements.
Financial Highlights
Strategic Advisers Short Duration Fund
| Years ended May 31, | 2021 | 2020 | 2019 | 2018 | 2017 |
| Selected Per–Share Data | |||||
| Net asset value, beginning of period | $10.06 | $10.04 | $10.03 | $10.05 | $10.01 |
| Income from Investment Operations | |||||
| Net investment income (loss)A | .106 | .229 | .254 | .168 | .136 |
| Net realized and unrealized gain (loss) | .081 | .020 | .018 | (.028) | .033 |
| Total from investment operations | .187 | .249 | .272 | .140 | .169 |
| Distributions from net investment income | (.112) | (.229) | (.259) | (.160) | (.129) |
| Distributions from net realized gain | (.005) | – | (.003) | – | – |
| Total distributions | (.117) | (.229) | (.262) | (.160) | (.129) |
| Net asset value, end of period | $10.13 | $10.06 | $10.04 | $10.03 | $10.05 |
| Total ReturnB | 1.86% | 2.51% | 2.75% | 1.40% | 1.69% |
| Ratios to Average Net AssetsC,D,E | |||||
| Expenses before reductions | .30% | .30% | .32% | .35% | .36% |
| Expenses net of fee waivers, if any | .05% | .05% | .07% | .10% | .10% |
| Expenses net of all reductions | .05% | .05% | .07% | .10% | .10% |
| Net investment income (loss) | 1.05% | 2.28% | 2.54% | 1.67% | 1.36% |
| Supplemental Data | |||||
| Net assets, end of period (000 omitted) | $6,180,788 | $8,049,040 | $7,144,753 | $8,841,193 | $9,920,937 |
| Portfolio turnover rateE | 102% | 58% | 33% | 25% | 26% |
A Calculated based on average shares outstanding during the period.
B Total returns would have been lower if certain expenses had not been reduced during the applicable periods shown.
C Fees and expenses of any underlying mutual funds or exchange-traded funds (ETFs) are not included in the Fund's expense ratio. The Fund indirectly bears its proportionate share of these expenses. For additional expense information related to investments in Fidelity Central Funds, please refer to the "Investments in Fidelity Central Funds" note found in the Notes to Financial Statements section of the most recent Annual or Semi-Annual report.
D Expense ratios reflect operating expenses of the class. Expenses before reductions do not reflect amounts reimbursed, waived, or reduced through arrangements with the investment advisor, brokerage services, or other offset arrangements, if applicable, and do not represent the amount paid by the class during periods when reimbursements, waivers or reductions occur.
E Amount does not include the portfolio activity of any underlying mutual funds or exchange-traded funds (ETFs).
See accompanying notes which are an integral part of the financial statements.
Notes to Financial Statements
For the period ended May 31, 2021
1. Organization.
Strategic Advisers Short Duration Fund (the Fund) is a fund of Fidelity Rutland Square Trust II (the Trust), and is authorized to issue an unlimited number of shares. The Trust is registered under the Investment Company Act of 1940, as amended (the 1940 Act), as an open-end management investment company organized as a Delaware statutory trust. The Fund is offered exclusively to certain managed account clients of Strategic Advisers LLC (Strategic Advisers), an affiliate of Fidelity Management & Research Company LLC (FMR).
2. Significant Accounting Policies.
The Fund is an investment company and applies the accounting and reporting guidance of the Financial Accounting Standards Board (FASB) Accounting Standards Codification Topic 946 Financial Services - Investment Companies. The financial statements have been prepared in conformity with accounting principles generally accepted in the United States of America (GAAP), which require management to make certain estimates and assumptions at the date of the financial statements. Actual results could differ from those estimates. Subsequent events, if any, through the date that the financial statements were issued have been evaluated in the preparation of the financial statements. The Fund's Schedule of Investments lists any underlying mutual funds or exchange-traded funds (ETFs) but does not include the underlying holdings of these funds. The following summarizes the significant accounting policies of the Fund:
Investment Valuation. Investments are valued as of 4:00 p.m. Eastern time on the last calendar day of the period. The Board of Trustees (the Board) has delegated the day to day responsibility for the valuation of the Fund's investments to the Fair Value Committee (the Committee) established by the Fund's investment adviser. In accordance with valuation policies and procedures approved by the Board, the Fund attempts to obtain prices from one or more third party pricing vendors or brokers to value its investments. When current market prices, quotations or currency exchange rates are not readily available or reliable, investments will be fair valued in good faith by the Committee, in accordance with procedures adopted by the Board. Factors used in determining fair value vary by investment type and may include market or investment specific events, changes in interest rates and credit quality. The frequency with which these procedures are used cannot be predicted and they may be utilized to a significant extent. The Committee oversees the Fund's valuation policies and procedures and reports to the Board on the Committee's activities and fair value determinations. The Board monitors the appropriateness of the procedures used in valuing the Fund's investments and ratifies the fair value determinations of the Committee.
The Fund categorizes the inputs to valuation techniques used to value its investments into a disclosure hierarchy consisting of three levels as shown below:
- Level 1 – quoted prices in active markets for identical investments
- Level 2 – other significant observable inputs (including quoted prices for similar investments, interest rates, prepayment speeds, etc.)
- Level 3 – unobservable inputs (including the Fund's own assumptions based on the best information available)
Valuation techniques used to value the Fund's investments by major category are as follows:
Debt securities, including restricted securities, are valued based on evaluated prices received from third party pricing vendors or from brokers who make markets in such securities. Corporate bonds, bank notes, municipal securities, U.S. government and government agency obligations, commercial paper and certificates of deposit are valued by pricing vendors who utilize matrix pricing which considers yield or price of bonds of comparable quality, coupon, maturity and type or by broker-supplied prices. Asset backed securities, collateralized mortgage obligations, commercial mortgage securities and U.S. government agency mortgage securities are valued by pricing vendors who utilize matrix pricing which considers prepayment speed assumptions, attributes of the collateral, yield or price of bonds of comparable quality, coupon, maturity and type or by broker-supplied prices. When independent prices are unavailable or unreliable, debt securities may be valued utilizing pricing methodologies which consider similar factors that would be used by third party pricing vendors. Debt securities are generally categorized as Level 2 in the hierarchy but may be Level 3 depending on the circumstances.
Exchange-Traded Funds (ETFs) are valued at their last sale price or official closing price as reported by a third party pricing vendor on the primary market or exchange on which they are traded and are categorized as Level 1 in the hierarchy. In the event there were no sales during the day but the exchange reports a closing bid level, ETFs are valued at the closing bid and would be categorized as Level 1 in the hierarchy. In the event there was no closing bid, ETFs may be valued by another method that the Board believes reflects fair value in accordance with the Board's fair value pricing policies and may be categorized as Level 2 in the hierarchy.
Futures contracts are valued at the settlement price established each day by the board of trade or exchange on which they are traded and are categorized as Level 1 in the hierarchy. Investments in open-end mutual funds, including the Fidelity Central Funds, are valued at their closing net asset value (NAV) each business day and are categorized as Level 1 in the hierarchy. If an unaffiliated open-end mutual fund's NAV is unavailable, shares of that fund may be valued by another method that the Board believes reflects fair value in accordance with the Board's fair value pricing policies and is categorized as Level 2 in the hierarchy.
Changes in valuation techniques may result in transfers in or out of an assigned level within the disclosure hierarchy. The aggregate value of investments by input level as of May 31, 2021 is included at the end of the Fund's Schedule of Investments.
Investment Transactions and Income. For financial reporting purposes, the Fund's investment holdings and NAV include trades executed through the end of the last business day of the period. The NAV per share for processing shareholder transactions is calculated as of the close of business of the New York Stock Exchange (NYSE), normally 4:00 p.m. Eastern time and includes trades executed through the end of the prior business day. Gains and losses on securities sold are determined on the basis of identified cost. Dividend income is recorded on the ex-dividend date, except for certain dividends from foreign securities where the ex-dividend date may have passed, which are recorded as soon as the Fund is informed of the ex-dividend date. Non-cash dividends included in dividend income, if any, are recorded at the fair market value of the securities received. Income and capital gain distributions from Fidelity Central Funds, if any, are recorded on the ex-dividend date. Income and capital gain distributions from any underlying mutual funds or exchange-traded funds (ETFs) are recorded on the ex-dividend date. Certain distributions received by the Fund represent a return of capital or capital gain. The Fund determines the components of these distributions subsequent to the ex-dividend date, based upon receipt of tax filings or other correspondence relating to the underlying investment. These distributions are recorded as a reduction of cost of investments and/or as a realized gain. Interest income is accrued as earned and includes coupon interest and amortization of premium and accretion of discount on debt securities as applicable. Debt obligations may be placed on non-accrual status and related interest income may be reduced by ceasing current accruals and writing off interest receivables when the collection of all or a portion of interest has become doubtful based on consistently applied procedures. A debt obligation is removed from non-accrual status when the issuer resumes interest payments or when collectability of interest is reasonably assured.
Expenses. Expenses directly attributable to a fund are charged to that fund. Expenses attributable to more than one fund are allocated among the respective funds on the basis of relative net assets or other appropriate methods. Expenses included in the accompanying financial statements reflect the expenses of that fund and do not include any expenses associated with any underlying mutual funds or exchange-traded funds. Although not included in a fund's expenses, a fund indirectly bears its proportionate share of these expenses through the net asset value of each underlying mutual fund or exchange-traded fund. Expense estimates are accrued in the period to which they relate and adjustments are made when actual amounts are known.
Deferred Trustee Compensation. Under a Deferred Compensation Plan (the Plan) for certain Funds, certain independent Trustees have elected to defer receipt of a portion of their annual compensation. Deferred amounts are invested in affiliated mutual funds, are marked-to-market and remain in a fund until distributed in accordance with the Plan. The investment of deferred amounts and the offsetting payable to the Trustees presented below are included in the accompanying Statement of Assets and Liabilities in other receivables and other payables and accrued expenses, as applicable.
| Strategic Advisers Short Duration Fund | $134,138 |
Income Tax Information and Distributions to Shareholders. Each year, the Fund intends to qualify as a regulated investment company under Subchapter M of the Internal Revenue Code, including distributing substantially all of its taxable income and realized gains. As a result, no provision for U.S. Federal income taxes is required. As of May 31, 2021, the Fund did not have any unrecognized tax benefits in the financial statements; nor is the Fund aware of any tax positions for which it is reasonably possible that the total amounts of unrecognized tax benefits will significantly change in the next twelve months. The Fund files a U.S. federal tax return, in addition to state and local tax returns as required. The Fund's federal income tax returns are subject to examination by the Internal Revenue Service (IRS) for a period of three fiscal years after they are filed. State and local tax returns may be subject to examination for an additional fiscal year depending on the jurisdiction.
Distributions are declared and recorded daily and paid monthly from net investment income. Distributions from realized gains, if any, are declared and recorded on the ex-dividend date. Income and capital gain distributions are determined in accordance with income tax regulations, which may differ from GAAP.
Capital accounts within the financial statements are adjusted for permanent book-tax differences. These adjustments have no impact on net assets or the results of operations. Capital accounts are not adjusted for temporary book-tax differences which will reverse in a subsequent period.
Book-tax differences are primarily due to market discount, capital loss carryforwards, futures contracts, short-term gain distributions from the Underlying Funds, deferred trustees compensation and losses deferred due to wash sales.
As of period end, the cost and unrealized appreciation (depreciation) in securities, and derivatives if applicable, for federal income tax purposes were as follows:
| Gross unrealized appreciation | $52,657,574 |
| Gross unrealized depreciation | (1,474,162) |
| Net unrealized appreciation (depreciation) | $51,183,412 |
| Tax Cost | $6,231,469,785 |
The tax-based components of distributable earnings as of period end were as follows:
| Undistributed ordinary income | $5,665,308 |
| Capital loss carryforward | $(6,304,429) |
| Net unrealized appreciation (depreciation) on securities and other investments | $51,183,412 |
Capital loss carryforwards are only available to offset future capital gains of the Fund to the extent provided by regulations and may be limited. The capital loss carryforward information presented below, including any applicable limitation, is estimated as of fiscal period end and is subject to adjustment.
| No expiration | |
| Long-term | $(6,304,429) |
The tax character of distributions paid was as follows:
| May 31, 2021 | May 31, 2020 | |
| Ordinary Income | $70,450,374 | $ 168,201,353 |
Delayed Delivery Transactions and When-Issued Securities. During the period, certain Funds transacted in securities on a delayed delivery or when-issued basis. Payment and delivery may take place after the customary settlement period for that security. The price of the underlying securities and the date when the securities will be delivered and paid for are fixed at the time the transaction is negotiated. Securities purchased on a delayed delivery or when-issued basis are identified as such in the Schedule of Investments. Compensation for interest forgone in the purchase of a delayed delivery or when-issued debt security may be received. With respect to purchase commitments, each applicable Fund identifies securities as segregated in its records with a value at least equal to the amount of the commitment. Payables and receivables associated with the purchases and sales of delayed delivery securities having the same coupon, settlement date and broker are offset. Delayed delivery or when-issued securities that have been purchased from and sold to different brokers are reflected as both payables and receivables in the Statement of Assets and Liabilities under the caption "Delayed delivery", as applicable. Losses may arise due to changes in the value of the underlying securities or if the counterparty does not perform under the contract's terms, or if the issuer does not issue the securities due to political, economic, or other factors.
Restricted Securities (including Private Placements). Funds may invest in securities that are subject to legal or contractual restrictions on resale. These securities generally may be resold in transactions exempt from registration or to the public if the securities are registered. Disposal of these securities may involve time-consuming negotiations and expense, and prompt sale at an acceptable price may be difficult. Information regarding restricted securities held at period end is included at the end of the Schedule of Investments, if applicable.
3. Derivative Instruments.
Risk Exposures and the Use of Derivative Instruments. The Fund's investment objective allows the Fund to enter into various types of derivative contracts, including futures contracts. Derivatives are investments whose value is primarily derived from underlying assets, indices or reference rates and may be transacted on an exchange or over-the-counter (OTC). Derivatives may involve a future commitment to buy or sell a specified asset based on specified terms, to exchange future cash flows at periodic intervals based on a notional principal amount, or for one party to make one or more payments upon the occurrence of specified events in exchange for periodic payments from the other party.
The Fund used derivatives to increase returns and to manage exposure to certain risks as defined below. The success of any strategy involving derivatives depends on analysis of numerous economic factors, and if the strategies for investment do not work as intended, the Fund may not achieve its objectives.
The Fund's use of derivatives increased or decreased its exposure to the following risk:
| Interest Rate Risk | Interest rate risk relates to the fluctuations in the value of interest-bearing securities due to changes in the prevailing levels of market interest rates. |
The Fund is also exposed to additional risks from investing in derivatives, such as liquidity risk and counterparty credit risk. Liquidity risk is the risk that the Fund will be unable to close out the derivative in the open market in a timely manner. Counterparty credit risk is the risk that the counterparty will not be able to fulfill its obligation to the Fund. Counterparty credit risk related to exchange-traded futures contracts may be mitigated by the protection provided by the exchange on which they trade.
Investing in derivatives may involve greater risks than investing in the underlying assets directly and, to varying degrees, may involve risk of loss in excess of any initial investment and collateral received and amounts recognized in the Statement of Assets and Liabilities. In addition, there may be the risk that the change in value of the derivative contract does not correspond to the change in value of the underlying instrument.
Futures Contracts. A futures contract is an agreement between two parties to buy or sell a specified underlying instrument for a fixed price at a specified future date. The Fund used futures contracts to manage its exposure to the bond market and fluctuations in interest rates.
Upon entering into a futures contract, a fund is required to deposit either cash or securities (initial margin) with a clearing broker in an amount equal to a certain percentage of the face value of the contract. Futures contracts are marked-to-market daily and subsequent daily payments (variation margin) are made or received by a fund depending on the daily fluctuations in the value of the futures contracts and are recorded as unrealized appreciation or (depreciation). This receivable and/or payable, if any, is included in daily variation margin on futures contracts in the Statement of Assets and Liabilities. Realized gain or (loss) is recorded upon the expiration or closing of a futures contract. The net realized gain (loss) and change in net unrealized appreciation (depreciation) on futures contracts during the period is presented in the Statement of Operations.
Any open futures contracts at period end are presented in the Schedule of Investments under the caption "Futures Contracts". The notional amount at value reflects each contract's exposure to the underlying instrument or index at period end and is representative of volume of activity during the period. Securities deposited to meet initial margin requirements are identified in the Schedule of Investments.
4. Purchases and Sales of Investments.
Purchases and sales of securities, other than short-term securities and U.S. government securities, are noted in the table below.
| Purchases ($) | Sales ($) | |
| Strategic Advisers Short Duration Fund | 5,569,096,354 | 7,111,772,213 |
5. Fees and Other Transactions with Affiliates.
Management Fee. Strategic Advisers (the investment adviser) provides the Fund with investment management related services. For these services, the Fund pays a monthly management fee to the investment adviser. The management fee is calculated by adding the annual management fee rate of .25% of the Fund's average net assets throughout the month to the aggregate of the fee rates, payable monthly by the investment adviser, to the Fund's sub-advisers. The Fund's maximum aggregate management fee will not exceed .55% of the Fund's average net assets. For the reporting period, the total annual management fee rate was .29% of the Fund's average net assets.
During the period, the investment adviser waived a portion of its management fee as described in the Expense Reductions note.
Sub-Advisers. FIAM LLC (an affiliate of the investment adviser) and T. Rowe Price Associates, Inc. each served as a sub-adviser for the Fund during the period. Sub-advisers provide discretionary investment advisory services for their allocated portion of the Fund's assets and are paid as described in the Management Fee note.
Brokerage Commissions. A portion of portfolio transactions were placed with brokerage firms which are affiliates of the investment adviser. Brokerage commissions are included in net realized gain (loss) and change in net unrealized appreciation (depreciation) in the Statement of Operations. The commissions paid to these affiliated firms were as follows:
| Amount | |
| Strategic Advisers Short Duration Fund | $740 |
Interfund Trades. Funds may purchase from or sell securities to other funds affiliated with each sub-adviser under procedures adopted by the Board. The procedures have been designed to ensure these interfund trades are executed in accordance with Rule 17a-7 of the 1940 Act. Any interfund trades are included within the respective purchases and sales amounts shown in the Purchases and Sales of Investments note.
Reallocation of Underlying Fund Investments. During the period, the investment adviser reallocated investments of the Fund. This involved a taxable redemption of the Fund's interest in Fidelity Short-Term Bond Fund in exchange for shares Fidelity SAI Short-Term Bond Fund. The Fund redeemed 29,295,214 shares of Fidelity Short-Term Bond Fund in exchange for 25,893,567 shares of Fidelity SAI Short-Term Bond Fund with a value of $258,676,739. The net realized gains of $9,260,000 on the Fund's redemptions of Fidelity Short Term Bond Fund shares is included in "Net realized gain (loss) on Other affiliated issuers." in the accompanying Statement of Operations. The Fund recognized net gains on the exchanges for federal income tax purposes.
6. Investments in Fidelity Central Funds.
Funds may invest in Fidelity Central Funds, which are open-end investment companies generally available only to other investment companies and accounts managed by the investment adviser and its affiliates. The Schedule of Investments lists any Fidelity Central Funds held as an investment as of period end, but does not include the underlying holdings of each Fidelity Central Fund. An investing fund indirectly bears its proportionate share of the expenses of the underlying Fidelity Central Funds.
Based on its investment objective, each Fidelity Central Fund may invest or participate in various investment vehicles or strategies that are similar to those of the investing fund. These strategies are consistent with the investment objectives of the investing fund and may involve certain economic risks which may cause a decline in value of each of the Fidelity Central Funds and thus a decline in the value of the investing fund.
A complete unaudited list of holdings for each Fidelity Central Fund is available upon request or at the Securities and Exchange Commission website at www.sec.gov. In addition, the financial statements of the Fidelity Central Funds, which are not covered by the Report of Independent Registered Public Accounting Firm, are available on the Securities and Exchange Commission website or upon request.
| Fidelity Central Fund | Investment Manager | Investment Objective | Investment Practices | Expense Ratio(a) |
| Fidelity Money Market Central Funds | Fidelity Management & Research Company LLC (FMR) | Each fund seeks to obtain a high level of current income consistent with the preservation of capital and liquidity. | Short-term Investments | Less than .005% to .01% |
(a) Expenses expressed as a percentage of average net assets and are as of each underlying Central Fund's most recent annual or semi-annual shareholder report.
7. Committed Line of Credit.
Certain Funds participate with other funds managed by the investment adviser or an affiliate in a $4.25 billion credit facility (the "line of credit") to be utilized for temporary or emergency purposes to fund shareholder redemptions or for other short-term liquidity purposes. The participating funds have agreed to pay commitment fees on their pro-rata portion of the line of credit, which are reflected in Miscellaneous expenses on the Statement of Operations, and are listed below. During the period, there were no borrowings on this line of credit.
| Amount | |
| Strategic Advisers Short Duration Fund | $14,004 |
8. Security Lending.
Funds lend portfolio securities through a lending agent from time to time in order to earn additional income. On the settlement date of the loan, a fund receives collateral (in the form of U.S. Treasury obligations, letters of credit and/or cash) against the loaned securities and maintains collateral in an amount not less than 100% of the market value of the loaned securities during the period of the loan. The market value of the loaned securities is determined at the close of business of a fund and any additional required collateral is delivered to a fund on the next business day. A fund or borrower may terminate the loan at any time, and if the borrower defaults on its obligation to return the securities loaned because of insolvency or other reasons, a fund may apply collateral received from the borrower against the obligation. A fund may experience delays and costs in recovering the securities loaned. Any cash collateral received is invested in the Fidelity Securities Lending Cash Central Fund. Any loaned securities are identified as such in the Schedule of Investments, and the value of loaned securities and cash collateral at period end, as applicable, are presented in the Statement of Assets and Liabilities. Security lending income represents the income earned on investing cash collateral, less rebates paid to borrowers and any lending agent fees associated with the loan, plus any premium payments received for lending certain types of securities. Security lending income is presented in the Statement of Operations as a component of income from Fidelity Central Funds.
9. Expense Reductions.
The investment adviser has contractually agreed to waive the Fund's management fee in an amount equal to .25% of the Fund's average net assets until September 30, 2023. During the period, this waiver reduced the Fund's management fee by $ 15,644,961.
In addition, through arrangements with the Fund's custodian, credits realized as a result of certain uninvested cash balances were used to reduce the Fund's expenses by $27,427.
10. Other.
Fund's organizational documents provide former and current trustees and officers with a limited indemnification against liabilities arising in connection with the performance of their duties to the fund. In the normal course of business, the fund may also enter into contracts that provide general indemnifications. The fund's maximum exposure under these arrangements is unknown as this would be dependent on future claims that may be made against the fund. The risk of material loss from such claims is considered remote.
Funds do not invest in underlying mutual funds for the purpose of exercising management or control; however, investments by funds within their principal investment strategies may represent a significant portion of the underlying mutual fund's net assets. At the end of the period, certain Funds were the owners of record of 10% or more of the total outstanding shares of the following underlying mutual funds as shown below.
| Fund | Strategic Advisers Short Duration Fund |
| Fidelity SAI Short-Term Bond Fund | 16% |
11. Coronavirus (COVID-19) Pandemic.
An outbreak of COVID-19 first detected in China during December 2019 has since spread globally and was declared a pandemic by the World Health Organization during March 2020. Developments that disrupt global economies and financial markets, such as the COVID-19 pandemic, may magnify factors that affect the Fund's performance.
Report of Independent Registered Public Accounting Firm
To the Board of Trustees of Fidelity Rutland Square Trust II and Shareholders of Strategic Advisers Short Duration Fund
Opinion on the Financial Statements
We have audited the accompanying statement of assets and liabilities, including the schedule of investments, of Strategic Advisers Short Duration Fund (one of the funds constituting Fidelity Rutland Square Trust II, referred to hereafter as the “Fund”) as of May 31, 2021, the related statement of operations for the year ended May 31, 2021, the statement of changes in net assets for each of the two years in the period ended May 31, 2021, including the related notes, and the financial highlights for each of the five years in the period ended May 31, 2021 (collectively referred to as the “financial statements”). In our opinion, the financial statements present fairly, in all material respects, the financial position of the Fund as of May 31, 2021, the results of its operations for the year then ended, the changes in its net assets for each of the two years in the period ended May 31, 2021 and the financial highlights for each of the five years in the period ended May 31, 2021 in conformity with accounting principles generally accepted in the United States of America.
Basis for Opinion
These financial statements are the responsibility of the Fund’s management. Our responsibility is to express an opinion on the Fund’s financial statements based on our audits. We are a public accounting firm registered with the Public Company Accounting Oversight Board (United States) (PCAOB) and are required to be independent with respect to the Fund in accordance with the U.S. federal securities laws and the applicable rules and regulations of the Securities and Exchange Commission and the PCAOB.
We conducted our audits of these financial statements in accordance with the standards of the PCAOB. Those standards require that we plan and perform the audit to obtain reasonable assurance about whether the financial statements are free of material misstatement, whether due to error or fraud.
Our audits included performing procedures to assess the risks of material misstatement of the financial statements, whether due to error or fraud, and performing procedures that respond to those risks. Such procedures included examining, on a test basis, evidence regarding the amounts and disclosures in the financial statements. Our audits also included evaluating the accounting principles used and significant estimates made by management, as well as evaluating the overall presentation of the financial statements. Our procedures included confirmation of securities owned as of May 31, 2021 by correspondence with the custodian and brokers; when replies were not received from brokers, we performed other auditing procedures. We believe that our audits provide a reasonable basis for our opinion.
/s/ PricewaterhouseCoopers LLP
Boston, Massachusetts
July 13, 2021
We have served as the auditor of one or more investment companies in the Fidelity group of funds since 1932.
Trustees and Officers
The Trustees, Members of the Advisory Board (if any), and officers of the trust and fund, as applicable, are listed below. The Board of Trustees governs the fund and is responsible for protecting the interests of shareholders. The Trustees are experienced executives who meet periodically throughout the year to oversee the fund's activities, review contractual arrangements with companies that provide services to the fund, oversee management of the risks associated with such activities and contractual arrangements, and review the fund's performance. If the interests of the fund and an underlying Fidelity® fund were to diverge, a conflict of interest could arise and affect how the Trustees and Members of the Advisory Board fulfill their fiduciary duties to the affected funds. Strategic Advisers has structured the fund to avoid these potential conflicts, although there may be situations where a conflict of interest is unavoidable. In such instances, Strategic Advisers, the Trustees, and Members of the Advisory Board would take reasonable steps to minimize and, if possible, eliminate the conflict. Each of the Trustees oversees 12 funds.
The Trustees hold office without limit in time except that (a) any Trustee may resign; (b) any Trustee may be removed by written instrument, signed by at least two-thirds of the number of Trustees prior to such removal; (c) any Trustee who requests to be retired or who has become incapacitated by illness or injury may be retired by written instrument signed by a majority of the other Trustees; and (d) any Trustee may be removed at any special meeting of shareholders by a two-thirds vote of the outstanding voting securities of the trust. Each Independent Trustee shall retire not later than the last day of the calendar year in which his or her 75th birthday occurs. The Independent Trustees may waive this mandatory retirement age policy with respect to individual Trustees. Officers and Advisory Board Members hold office without limit in time, except that any officer or Advisory Board Member may resign or may be removed by a vote of a majority of the Trustees at any regular meeting or any special meeting of the Trustees. Except as indicated, each individual has held the office shown or other offices in the same company for the past five years.
Each Trustee who is not an interested person (as defined in the 1940 Act) of the trust and the fund is referred to herein as an Independent Trustee.
The fund’s Statement of Additional Information (SAI) includes more information about the Trustees. To request a free copy, call Fidelity at 1-800-544-3455.
Experience, Skills, Attributes, and Qualifications of the Trustees. The Governance and Nominating Committee has adopted a statement of policy that describes the experience, qualifications, attributes, and skills that are necessary and desirable for potential Independent Trustee candidates (Statement of Policy). The Board believes that each Trustee satisfied at the time he or she was initially elected or appointed a Trustee, and continues to satisfy, the standards contemplated by the Statement of Policy. The Governance and Nominating Committee may also engage professional search firms to help identify potential Independent Trustee candidates with experience, qualifications, attributes, and skills consistent with the Statement of Policy. Additional criteria based on the composition and skills of the current Independent Trustees, as well as experience or skills that may be appropriate in light of future changes to board composition, business conditions, and regulatory or other developments, may be considered by the professional search firms and the Governance and Nominating Committee. In addition, the Board takes into account the Trustees' commitment and participation in Board and committee meetings, as well as their leadership of standing and ad hoc committees throughout their tenure.
In determining that a particular Trustee was and continues to be qualified to serve as a Trustee, the Board has considered a variety of criteria, none of which, in isolation, was controlling. The Board believes that, collectively, the Trustees have balanced and diverse experience, qualifications, attributes, and skills, which allow the Board to operate effectively in governing the fund and protecting the interests of shareholders. Information about the specific experience, skills, attributes, and qualifications of each Trustee, which in each case led to the Board's conclusion that the Trustee should serve (or continue to serve) as a trustee of the fund, is provided below.
Board Structure and Oversight Function. Robert A. Lawrence is an interested person and currently serves as Chairman. The Trustees have determined that an interested Chairman is appropriate and benefits shareholders because an interested Chairman has a personal and professional stake in the quality and continuity of services provided to the fund. Independent Trustees exercise their informed business judgment to appoint an individual of their choosing to serve as Chairman, regardless of whether the Trustee happens to be independent or a member of management. The Independent Trustees have determined that they can act independently and effectively without having an Independent Trustee serve as Chairman and that a key structural component for assuring that they are in a position to do so is for the Independent Trustees to constitute a substantial majority for the Board. The Independent Trustees also regularly meet in executive session. Mary C. Farrell serves as the lead Independent Trustee and as such (i) acts as a liaison between the Independent Trustees and management with respect to matters important to the Independent Trustees and (ii) with management prepares agendas for Board meetings.
Fidelity® funds are overseen by different Boards of Trustees. The fund's Board oversees asset allocation funds. Other Boards oversee Fidelity's investment-grade bond, money market, and asset allocation funds, and Fidelity's equity and high income funds. The fund may invest in Fidelity® funds overseen by such other Boards. The use of separate Boards, each with its own committee structure, allows the Trustees of each group of Fidelity® funds to focus on the unique issues of the funds they oversee, including common research, investment, and operational issues.
The Trustees primarily operate as a full Board, but also operate in committees, to facilitate the timely and efficient consideration of all matters of importance to the Trustees, the fund, and fund shareholders and to facilitate compliance with legal and regulatory requirements and oversight of the fund's activities and associated risks. The Board has charged Strategic Advisers and its affiliates with (i) identifying events or circumstances the occurrence of which could have demonstrably adverse effects on the fund's business and/or reputation; (ii) implementing processes and controls to lessen the possibility that such events or circumstances occur or to mitigate the effects of such events or circumstances if they do occur; and (iii) creating and maintaining a system designed to evaluate continuously business and market conditions in order to facilitate the identification and implementation processes described in (i) and (ii) above. Because the day-to-day operations and activities of the fund are carried out by or through Strategic Advisers, its affiliates and other service providers, the fund's exposure to risks is mitigated but not eliminated by the processes overseen by the Trustees. Board oversight of different aspects of the fund's activities is exercised primarily through the full Board, but also through the Audit and Compliance Committee. Appropriate personnel, including but not limited to the fund's Chief Compliance Officer (CCO), FMR's internal auditor, the independent accountants, the fund's Treasurer and portfolio management personnel, make periodic reports to the Board's committees, as appropriate. The responsibilities of each standing committee, including their oversight responsibilities, are described further under "Standing Committees of the Trustees."
Interested Trustees*:
Correspondence intended for a Trustee who is an interested person may be sent to Fidelity Investments, 245 Summer Street, Boston, Massachusetts 02210.
Name, Year of Birth; Principal Occupations and Other Relevant Experience+
Robert A. Lawrence (1952)
Year of Election or Appointment: 2016
Trustee
Chairman of the Board of Trustees
Mr. Lawrence also serves as Trustee of other funds. Previously, Mr. Lawrence served as a Member of the Advisory Board of certain funds. Prior to his retirement in 2008, Mr. Lawrence served as Vice President of certain Fidelity® funds (2006-2008), Senior Vice President, Head of High Income Division of Fidelity Management & Research Company (investment adviser firm, 2006-2008), and President of Fidelity Strategic Investments (investment adviser firm, 2002-2005).
Charles S. Morrison (1960)
Year of Election or Appointment: 2020
Trustee
Mr. Morrison also serves as Trustee of other funds. Previously, Mr. Morrison served as President (2017-2018) and Director (2014-2018) of Fidelity SelectCo, LLC (investment adviser firm), President of Fidelity Management & Research Company (FMR) (investment adviser firm, 2016-2018), a Director of Fidelity Investments Money Management, Inc. (investment adviser firm, 2014-2018), President, Asset Management (2014-2018), Trustee of the Fidelity Equity and High Income Funds (283 funds as of December 2018) (2014-2018), and was an employee of Fidelity Investments. Mr. Morrison also previously served as Vice President of Fidelity's Fixed Income and Asset Allocation Funds (2012-2014), President, Fixed Income (2011-2014), Vice President of Fidelity's Money Market Funds (2005-2009), President, Money Market Group Leader of FMR (2009), and Senior Vice President, Money Market Group of FMR (2004-2009). Mr. Morrison also served as Vice President of Fidelity's Bond Funds (2002-2005), certain Balanced Funds (2002-2005), and certain Asset Allocation Funds (2002-2007), and as Senior Vice President (2002-2005) of Fidelity's Bond Division.
* Determined to be an "Interested Trustee" by virtue of, among other things, his or her affiliation with the trust or various entities under common control with Strategic Advisers.
+ The information includes the Trustee's principal occupation during the last five years and other information relating to the experience, attributes, and skills relevant to the Trustee's qualifications to serve as a Trustee, which led to the conclusion that the Trustee should serve as a Trustee for the fund.
Independent Trustees:
Correspondence intended for an Independent Trustee may be sent to Fidelity Investments, P.O. Box 55235, Boston, Massachusetts 02205-5235.
Name, Year of Birth; Principal Occupations and Other Relevant Experience+
Peter C. Aldrich (1944)
Year of Election or Appointment: 2006
Trustee
Mr. Aldrich also serves as Trustee of other funds. Mr. Aldrich is a Director of the U.S. Core Property Fund (and, previously, other funds) of BlackRock Realty Group (2006-present). Previously, Mr. Aldrich served as a Managing Member of Poseidon, LLC (foreign private investment, 1998-2004), and Chairman and Managing Member of AEGIS, LLC (foreign private investment, 1997-2004). Mr. Aldrich previously was a founder, Chief Executive Officer, and Chairman of AEW Capital Management, L.P. (then “Aldrich, Eastman and Waltch, L.P.”). Mr. Aldrich also served as a Director of LivelyHood, Inc. (private corporation, 2013-2020), a Trustee for the Fidelity Rutland Square Trust (2005-2010), a Director of Zipcar, Inc. (car sharing services, 2001-2009) and as Faculty Chairman of The Research Council on Global Investment of The Conference Board (business and professional education non-profit, 1999-2004). Mr. Aldrich is a Member Emeritus of the Board of Directors of the National Bureau of Economic Research and the Board of Trustees of the Museum of Fine Arts Boston.
Mary C. Farrell (1949)
Year of Election or Appointment: 2013
Trustee
Ms. Farrell also serves as Trustee of other funds. Ms. Farrell is a Director of the W.R. Berkley Corporation (insurance provider) and President (2009-present) and Director (2006-present) of the Howard Gilman Foundation (charitable organization). Previously, Ms. Farrell was Managing Director and Chief Investment Strategist at UBS Wealth Management USA and Co-Head of UBS Wealth Management Investment Strategy & Research Group (2003-2005). Ms. Farrell also served as Investment Strategist at PaineWebber (1982-2000) and UBS PaineWebber (2000-2002). Ms. Farrell serves as Chairman of the Board of Trustees of Yale-New Haven Hospital and Vice Chairman of the Yale New Haven Health System Board and previously served as Trustee on the Board of Overseers of the New York University Stern School of Business.
Karen Kaplan (1960)
Year of Election or Appointment: 2006
Trustee
Ms. Kaplan also serves as Trustee of other funds. Ms. Kaplan is Chairman (2014-present) and Chief Executive Officer (2013-present) of Hill Holliday (advertising and specialized marketing). Ms. Kaplan is a Director of The Michaels Companies, Inc. (specialty retailer, 2015-present), Member of the Board of Governors of the Chief Executives’ Club of Boston (2010-present), Member of the Executive Committee of the Greater Boston Chamber of Commerce (2006-present), Advisory Board Member of the National Association of Corporate Directors Chapter (2012-present), Member of the Board of Trustees of the Post Office Square Trust (2012-present), Trustee of the Brigham and Women’s Hospital (2016-present), Overseer of the Boston Symphony Orchestra (2014-present), Member of the Board of Directors of The Advertising Council, Inc. (2016-present), Member of the Ron Burton Training Village Executive Board of Advisors (2018-present), Member of the Executive Committee of The Ad Council, Inc. (2019-present), and Member of the Board of Directors of The Ad Club of Boston (2020-present). Previously, Ms. Kaplan served as an Advisory Board Member of Fidelity Rutland Square Trust (2006-2010), a member of the Clinton Global Initiative (2010-2015), Director of DSM (dba Delta Dental and DentaQuest) (2004-2014), Formal Appointee of the 2015 Baker-Polito Economic Development Council, Director of Vera Bradley Inc. (designer of women’s accessories, 2012-2015), Member of the Board of Directors of the Massachusetts Conference for Women (2008-2015), Member of the Board of Directors of Jobs for Massachusetts (2012-2015), President of the Massachusetts Women’s Forum (2008-2010), Treasurer of the Massachusetts Women’s Forum (2002-2006), and Vice Chair of the Board of the Massachusetts Society for the Prevention of Cruelty to Children (2003-2010).
Christine Marcks (1955)
Year of Election or Appointment: 2020
Trustee
Ms. Marcks also serves as Trustee of other Funds. Prior to her retirement, Ms. Marcks served as Chief Executive Officer and President – Prudential Retirement (2007-2017) and Vice President for Rollover and Retirement Income Strategies (2005-2007), Prudential Financial, Inc. (financial services). Previously, Ms. Marcks served as a Member of the Advisory Board of certain Fidelity® funds (2019-2020), was Senior Vice President and Head of Financial Horizons (2002-2004) and Vice President, Strategic Marketing (2000-2002) of Voya Financial (formerly ING U.S.) (financial services), held numerous positions at Aetna Financial Services (financial services, 1987-2000) and served as an International Economist for the United States Department of the Treasury (1980-1987). Ms. Marcks also serves as a member of the Board of Trustees, Audit Committee and Benefits & Operations Committee of the YMCA Retirement Fund (2018-present), a non-profit organization providing retirement plan benefits to YMCA staff members, and as a member of the Board of Trustees of Assumption College (2019-present).
Heidi L. Steiger (1953)
Year of Election or Appointment: 2017
Trustee
Ms. Steiger also serves as Trustee of other funds. Ms. Steiger serves as Managing Partner of Topridge Associates, LLC (consulting, 2005-present) and a member of the Board of Directors (2013-present) and member of the Membership and Executive Committee (2017-present) of Business Executives for National Security (nonprofit). Previously, Ms. Steiger served as a member of the Board of Directors Chair of the Remuneration Committee of Imagine Intelligent Materials Limited (2019-2021) (technology company), a member of the Advisory Board of the joint degree program in Global Luxury Management at North Carolina State University (Raleigh, NC) and Skema (Paris) (2018-2021), a Non-Executive Director of CrowdBureau Corporation (financial technology company and index provider, 2018-2021), a member of the Global Advisory Board and Of Counsel to Signum Global Advisors (international policy and strategy, 2018-2020), Eastern Region President of The Private Client Reserve of U.S. Bancorp (banking and financial services, 2010-2015), Advisory Director of Berkshire Capital Securities, LLC (financial services, 2009-2010), President and Senior Advisor of Lowenhaupt Global Advisors, LLC (financial services, 2005-2007), and President and Contributing Editor of Worth Magazine (2004-2005) and held a variety of positions at Neuberger Berman Group, LLC (financial services, 1986-2004), including Partner and Executive Vice President and Global Head of Private Asset Management at Neuberger Berman (1999-2004). Ms. Steiger also served as a member of the Board of Directors of Nuclear Electric Insurance Ltd (insurer of nuclear utilities, 2006-2017), a member of the Board of Trustees and Audit Committee of the Eaton Vance Funds (2007-2010), a member of the Board of Directors of Aviva USA (formerly AmerUs) (insurance, 2004-2014), and a member of the Board of Trustees and Audit Committee and Chair of the Investment Committee of CIFG (financial guaranty insurance, 2009-2012), and a member of the Board of Directors of Kin Group Plc (formerly, Fitbug Holdings) (health and technology, 2016-2017).
+ The information includes the Trustee's principal occupation during the last five years and other information relating to the experience, attributes, and skills relevant to the Trustee's qualifications to serve as a Trustee, which led to the conclusion that the Trustee should serve as a Trustee for the fund.
Advisory Board Members and Officers:
Correspondence intended for a Member of the Advisory Board (if any) may be sent to Fidelity Investments, P.O. Box 55235, Boston, Massachusetts 02205-5235. Correspondence intended for an officer or Howard E. Cox, Jr. may be sent to Fidelity Investments, 245 Summer Street, Boston, Massachusetts 02210. Officers appear below in alphabetical order.
Name, Year of Birth; Principal Occupation
Ralph F. Cox (1932)
Year of Election or Appointment: 2020
Member of the Advisory Board
Mr. Cox also serves as a Member of the Advisory Board of other funds. Mr. Cox is President of RABAR Enterprises (management consulting for the petroleum industry). Mr. Cox is a Director of Abraxas Petroleum (exploration and production, 1999-present). Mr. Cox is a member of the Advisory Boards of the Business and Engineering Schools of Texas A&M University and the Engineering School of University of Texas at Austin. Previously, Mr. Cox served as Trustee of other funds (2006-2020), a Trustee for the Fidelity Rutland Square Trust (2005-2010) and as an Advisory Director of CH2M Hill Companies (engineering, 1981-2011). Mr. Ralph F. Cox and Mr. Howard E. Cox, Jr. are not related.
Howard E. Cox, Jr. (1944)
Year of Election or Appointment: 2009
Member of the Advisory Board
Mr. Cox also serves as a Member of the Advisory Board of other funds. Mr. Cox is a Partner of Greylock (venture capital, 1971-present) and a Director of Stryker Corporation (medical products and services, 1974-present). Previously, Mr. Cox served as an Advisory Board Member of Fidelity Rutland Square Trust (2006-2010). Mr. Cox also serves as a Member of the Secretary of Defense's Business Board of Directors (2008-present), a Director of Business Executives for National Security (1997-present), a Director of the Brookings Institution (2010-present), a Director of the World Economic Forum’s Young Global Leaders Foundation (2009-present), and is a Member of the Harvard Medical School Board of Fellows (2002-present). Mr. Howard E. Cox, Jr. and Mr. Ralph F. Cox are not related.
Craig S. Brown (1977)
Year of Election or Appointment: 2019
Assistant Treasurer
Mr. Brown also serves as Assistant Treasurer of other funds. Mr. Brown is an employee of Fidelity Investments (2013-present).
John J. Burke III (1964)
Year of Election or Appointment: 2018
Chief Financial Officer
Mr. Burke also serves as Chief Financial Officer of other funds. Mr. Burke serves as Head of Investment Operations for Fidelity Fund and Investment Operations (2018-present) and is an employee of Fidelity Investments (1998-present). Previously Mr. Burke served as head of Asset Management Investment Operations (2012-2018).
Jonathan Davis (1968)
Year of Election or Appointment: 2010
Assistant Treasurer
Mr. Davis also serves as Assistant Treasurer of other funds. Mr. Davis serves as Assistant Treasurer of FMR Capital, Inc. (2017-present) and is an employee of Fidelity Investments. Previously, Mr. Davis served as Vice President and Associate General Counsel of FMR LLC (diversified financial services company, 2003-2010).
Laura M. Del Prato (1964)
Year of Election or Appointment: 2018
Assistant Treasurer
Ms. Del Prato also serves as an officer of other funds. Ms. Del Prato is an employee of Fidelity Investments (2017-present). Previously, Ms. Del Prato served as President and Treasurer of The North Carolina Capital Management Trust: Cash Portfolio and Term Portfolio (2018-2020). Prior to joining Fidelity Investments, Ms. Del Prato served as a Managing Director and Treasurer of the JPMorgan Mutual Funds (2014-2017). Prior to JPMorgan, Ms. Del Prato served as a partner at Cohen Fund Audit Services (accounting firm, 2012-2013) and KPMG LLP (accounting firm, 2004-2012).
James D. Gryglewicz (1972)
Year of Election or Appointment: 2015
Chief Compliance Officer
Mr. Gryglewicz also serves as Chief Compliance Officer of other funds. Mr. Gryglewicz serves as Compliance Officer of Strategic Advisers LLC (investment adviser firm, 2015-present), Senior Vice President of Asset Management Compliance (2009-present), and is an employee of Fidelity Investments (2004-present). Previously, Mr. Gryglewicz served as Compliance Officer of Fidelity SelectCo, LLC (investment adviser firm, 2014-2019), and as Chief Compliance Officer of certain Fidelity® funds (2014-2018).
Colm A. Hogan (1973)
Year of Election or Appointment: 2016
Assistant Treasurer
Mr. Hogan also serves as an officer of other funds. Mr. Hogan serves as Assistant Treasurer of FMR Capital, Inc. (2017-present) and is an employee of Fidelity Investments (2005-present). Previously, Mr. Hogan served as Deputy Treasurer of certain Fidelity® funds (2016-2020) and Assistant Treasurer of certain Fidelity® funds (2016-2018).
Christina H. Lee (1975)
Year of Election or Appointment: 2020
Secretary and Chief Legal Officer
Ms. Lee also serves as Secretary and CLO of other funds. Ms. Lee serves as Vice President, Associate General Counsel (2014-present) and is an employee of Fidelity Investments (2007-present). Previously, Ms. Lee served as Assistant Secretary of certain funds (2018-2019).
Cynthia Lo Bessette (1969)
Year of Election or Appointment: 2020
Assistant Secretary
Ms. Lo Bessette also serves as an officer of other funds. Ms. Lo Bessette serves as CLO, Secretary, and Senior Vice President of Fidelity Management & Research Company LLC (investment adviser firm, 2019-present); and CLO of Fidelity Management & Research (Hong Kong) Limited, FMR Investment Management (UK) Limited, and Fidelity Management & Research (Japan) Limited (investment adviser firms, 2019-present). She is a Senior Vice President and Deputy General Counsel of FMR LLC (diversified financial services company, 2019-present), and is an employee of Fidelity Investments. Previously, Ms. Lo Bessette served as CLO, Secretary, and Senior Vice President of FMR Co., Inc. (investment adviser firm, 2019); Secretary of Fidelity SelectCo, LLC and Fidelity Investments Money Management, Inc. (investment adviser firms, 2019). Prior to joining Fidelity Investments, Ms. Lo Bessette was Executive Vice President, General Counsel (2016-2019) and Senior Vice President, Deputy General Counsel (2015-2016) of OppenheimerFunds (investment management company) and Deputy Chief Legal Officer (2013-2015) of Jennison Associates LLC (investment adviser firm).
Chris Maher (1972)
Year of Election or Appointment: 2016
Assistant Treasurer
Mr. Maher also serves as an officer of other funds. Mr. Maher serves as Assistant Treasurer of FMR Capital, Inc. (2017-present), and is an employee of Fidelity Investments (2008-present). Previously, Mr. Maher served as Assistant Treasurer of certain funds (2013-2020); Vice President of Asset Management Compliance (2013), Vice President of the Program Management Group of FMR (investment adviser firm, 2010-2013), and Vice President of Valuation Oversight (2008-2010).
Brett Segaloff (1972)
Year of Election or Appointment: 2021
Anti-Money Laundering (AML) Officer
Mr. Segaloff also serves as an AML Officer of other funds and other related entities. He is Director, Anti-Money Laundering (2007-present) of FMR LLC (diversified financial services company) and is an employee of Fidelity Investments (1996-present).
Stacie M. Smith (1974)
Year of Election or Appointment: 2020
President and Treasurer
Ms. Smith also serves as an officer of other funds. Ms. Smith serves as Assistant Treasurer of FMR Capital, Inc. (2017-present), is an employee of Fidelity Investments (2009-present), and has served in other fund officer roles. Prior to joining Fidelity Investments, Ms. Smith served as Senior Audit Manager of Ernst & Young LLP (accounting firm, 1996-2009). Previously, Ms. Smith served as Assistant Treasurer (2013-2019) and Deputy Treasurer (2013-2016) of certain Fidelity® funds.
Marc L. Spector (1972)
Year of Election or Appointment: 2016
Assistant Treasurer
Mr. Spector also serves as an officer of other funds. Mr. Spector serves as Assistant Treasurer of FMR Capital, Inc. (2017-present) and is an employee of Fidelity Investments (2016-present). Prior to joining Fidelity Investments, Mr. Spector served as Director at the Siegfried Group (accounting firm, 2013-2016), and prior to Siegfried Group as audit senior manager at Deloitte & Touche LLP (accounting firm, 2005-2013).
Jim Wegmann (1979)
Year of Election or Appointment: 2019
Assistant Treasurer
Mr. Wegmann also serves as Assistant Treasurer of other funds. Mr. Wegmann is an employee of Fidelity Investments (2011-present).
Shareholder Expense Example
As a shareholder, you incur two types of costs: (1) transaction costs, which may include sales charges (loads) on purchase payments or redemption proceeds, as applicable and (2) ongoing costs, which generally include management fees, distribution and/or service (12b-1) fees and other Fund expenses. This Example is intended to help you understand your ongoing costs (in dollars) of investing in a fund and to compare these costs with the ongoing costs of investing in other mutual funds.
The Example is based on an investment of $1,000 invested at the beginning of the period and held for the entire period (December 1, 2020 to May 31, 2021).
Actual Expenses
The first line of the accompanying table provides information about actual account values and actual expenses. You may use the information in this line, together with the amount you invested, to estimate the expenses that you paid over the period. Simply divide your account value by $1,000.00 (for example, an $8,600 account value divided by $1,000.00 = 8.6), then multiply the result by the number in the first line for a class/Fund under the heading entitled "Expenses Paid During Period" to estimate the expenses you paid on your account during this period. If any fund is a shareholder of any underlying mutual funds or exchange-traded funds (ETFs) (the Underlying Funds), such fund indirectly bears its proportional share of the expenses of the Underlying Funds in addition to the direct expenses incurred presented in the table. These fees and expenses are not included in the annualized expense ratio used to calculate the expense estimate in the table below.
Hypothetical Example for Comparison Purposes
The second line of the accompanying table provides information about hypothetical account values and hypothetical expenses based on the actual expense ratio and an assumed rate of return of 5% per year before expenses, which is not the actual return. The hypothetical account values and expenses may not be used to estimate the actual ending account balance or expenses you paid for the period. You may use this information to compare the ongoing costs of investing in the Fund and other funds. To do so, compare this 5% hypothetical example with the 5% hypothetical examples that appear in the shareholder reports of the other funds. If any fund is a shareholder of any Underlying Funds, such fund indirectly bears its proportional share of the expenses of the Underlying Funds in addition to the direct expenses as presented in the table. These fees and expenses are not included in the annualized expense ratio used to calculate the expense estimate in the table below.
Please note that the expenses shown in the table are meant to highlight your ongoing costs only and do not reflect any transaction costs. Therefore, the second line of the table is useful in comparing ongoing costs only, and will not help you determine the relative total costs of owning different funds.
| Annualized Expense Ratio-A | Beginning Account Value December 1, 2020 | Ending Account Value May 31, 2021 | Expenses Paid During Period-B December 1, 2020 to May 31, 2021 |
|
| Strategic Advisers Short Duration Fund | .05% | |||
| Actual | $1,000.00 | $1,003.90 | $.25 | |
| Hypothetical-C | $1,000.00 | $1,024.68 | $.25 |
A Annualized expense ratio reflects expenses net of applicable fee waivers.
B Expenses are equal to the annualized expense ratio, multiplied by the average account value over the period, multiplied by 182/ 365 (to reflect the one-half year period). The fees and expenses of any Underlying Funds are not included in each annualized expense ratio.
C 5% return per year before expenses
Distributions (Unaudited)
A total of 3.80% of the dividends distributed during the fiscal year was derived from interest on U.S. Government securities which is generally exempt from state income tax.
The fund designates $49,872,714 of distributions paid in the calendar year 2020 as qualifying to be taxed as section 163(j) interest dividends.
The fund will notify shareholders in January 2022 of amounts for use in preparing 2021 income tax returns.
Liquidity Risk Management Program
The Securities and Exchange Commission adopted Rule 22e-4 under the Investment Company Act of 1940 (the Liquidity Rule) to promote effective liquidity risk management throughout the open-end investment company industry, thereby reducing the risk that funds will be unable to meet their redemption obligations and mitigating dilution of the interests of fund shareholders.
The Fund has adopted and implemented a liquidity risk management program (the Program) reasonably designed to assess and manage the Fund’s liquidity risk and to comply with the requirements of the Liquidity Rule. The Fund’s Board of Trustees (the Board) has designated the Fund’s investment adviser as administrator of the Program. Strategic Advisers has established a Liquidity Risk Management Committee (the LRM Committee) to manage the Program for each of the Funds. The LRM Committee monitors the adequacy and effectiveness of implementation of the Program and on a periodic basis assesses each Fund’s liquidity risk based on a variety of factors including (1) the Fund’s investment strategy, (2) portfolio liquidity and cash flow projections during normal and reasonably foreseeable stressed conditions, (3) shareholder redemptions and (4) borrowings and other funding sources, as applicable.
In accordance with the Program, each of the Fund’s portfolio investments is classified into one of four liquidity categories described below based on a determination of a reasonable expectation for how long it would take to convert the investment to cash (or sell or dispose of the investment) without significantly changing its market value.
- Highly liquid investments – cash or convertible to cash within three business days or less
- Moderately liquid investments – convertible to cash in three to seven calendar days
- Less liquid investments – can be sold or disposed of, but not settled, within seven calendar days
- Illiquid investments – cannot be sold or disposed of within seven calendar days
Liquidity classification determinations take into account a variety of factors including various market, trading and investment-specific considerations, as well as market depth, and generally utilize analysis from a third-party liquidity metrics service.
The Liquidity Rule places a 15% limit on a fund’s illiquid investments and requires funds that do not primarily hold assets that are highly liquid investments to determine and maintain a minimum percentage of the fund’s net assets to be invested in highly liquid investments (highly liquid investment minimum or HLIM). The Program includes provisions reasonably designed to comply with the 15% limit on illiquid investments and for determining, periodically reviewing and complying with the HLIM requirement as applicable.
At a recent meeting of the Fund’s Board of Trustees, the LRM Committee provided a written report to the Board pertaining to the operation, adequacy, and effectiveness of implementation of the Program for the annual period from December 1, 2019 through November 30, 2020. The report concluded that the Program has been implemented and is operating effectively and is reasonably designed to assess and manage the Fund’s liquidity risk.
Proxy Voting Results
A special meeting of shareholders was held on November 2, 2020. The results of votes taken among shareholders on the proposals before them are reported below. Each vote reported represents one dollar of net asset value held on the record date for the meeting.
PROPOSAL 1
To elect a Board of Trustees.
| # of Votes | % of Votes |
|
| ROBERT A. LAWRENCE | ||
| Affirmative | 204,250,982,594.51 | 96.530 |
| Withheld | 7,343,512,146.85 | 3.470 |
| TOTAL | 211,594,494,741.36 | 100.000 |
| CHARLES S. MORRISON | ||
| Affirmative | 204,349,460,488.43 | 96.576 |
| Withheld | 7,245,034,252.93 | 3.424 |
| TOTAL | 211,594,494,741.36 | 100.000 |
| PETER C. ALDRICH | ||
| Affirmative | 203,499,803,652.67 | 96.175 |
| Withheld | 8,094,691,088.69 | 3.825 |
| TOTAL | 211,594,494,741.36 | 100.000 |
| MARY C. FARRELL | ||
| Affirmative | 204,011,925,737.22 | 96.417 |
| Withheld | 7,582,569,004.14 | 3.583 |
| TOTAL | 211,594,494,741.36 | 100.00 |
| KAREN KAPLAN | ||
| Affirmative | 204,297,547,550.53 | 96.552 |
| Withheld | 7,296,947,190.83 | 3.448 |
| TOTAL | 211,594,494,741.36 | 100.000 |
| CHRISTINE MARCKS | ||
| Affirmative | 204,700,871,317.72 | 96.743 |
| Withheld | 6,893,623,423.64 | 3.257 |
| TOTAL | 211,594,494,741.36 | 100.000 |
| HEIDI L. STEIGER | ||
| Affirmative | 204,406,589,957.28 | 96.603 |
| Withheld | 7,187,904,784.08 | 3.397 |
| TOTAL | 211,594,494,741.36 | 100.000 |
PROPOSAL 2
To approve the conversion of a fundamental investment policy to a non-fundamental investment policy.
| # of Votes | % of Votes |
|
| Affirmative | 5,104,820,048.35 | 86.600 |
| Against | 329,800,777.16 | 5.594 |
| Abstain | 460,156,413.94 | 7.806 |
| Broker Non-Vote | 0.00 | 0.000 |
| TOTAL | 5,894,777,239.45 | 100.000 |
PROPOSAL 5
To approve a sub-subadvisory agreement between FIAM LLC (FIAM) and FMR Investment Management (UK) Limited (FMR UK).
| # of Votes | % of Votes |
|
| Affirmative | 5,271,166,307.76 | 89.421 |
| Against | 225,238,983.44 | 3.821 |
| Abstain | 398,371,948.25 | 6.758 |
| Broker Non-Vote | 0.00 | 0.000 |
| TOTAL | 5,894,777,239.45 | 100.000 |
PROPOSAL 6
To approve a sub-subadvisory agreement between FIAM and Fidelity Management & Research (Hong Kong) Limited (FMR H.K.).
| # of Votes | % of Votes |
|
| Affirmative | 5,195,633,592.20 | 88.140 |
| Against | 278,351,890.70 | 4.722 |
| Abstain | 420,791,756.55 | 7.138 |
| Broker Non-Vote | 0.00 | 0.000 |
| TOTAL | 5,894,777,239.45 | 100.000 |
PROPOSAL 7
To approve a sub-subadvisory agreement between FIAM and Fidelity Management & Research (Japan) Limited (FMR Japan).
| # of Votes | % of Votes |
|
| Affirmative | 5,265,653,754.88 | 89.328 |
| Against | 229,669,288.91 | 3.896 |
| Abstain | 399,454,195.66 | 6.776 |
| Broker Non-Vote | 0.00 | 0.000 |
| TOTAL | 5,894,777,239.45 | 100.000 |
| Proposal 1 reflects trust wide proposal and voting results. |
![]()
ASD-ANN-0721
1.934458.109
Strategic Advisers® Tax-Sensitive Short Duration Fund
Offered exclusively to certain managed account clients of Strategic Advisers LLC or its affiliates - not available for sale to the general public
May 31, 2021
Contents
To view a fund's proxy voting record for the 12-month period ended June 30, visit http://www.fidelity.com/proxyvotingresults or visit the Securities and Exchange Commission's (SEC) web site at http://www.sec.gov.
You may also call 1-800-544-3455 to request a free copy of the proxy voting guidelines.
Standard & Poor's, S&P and S&P 500 are registered service marks of The McGraw-Hill Companies, Inc. and have been licensed for use by Fidelity Distributors Corporation.
Other third-party marks appearing herein are the property of their respective owners.
All other marks appearing herein are registered or unregistered trademarks or service marks of FMR LLC or an affiliated company. © 2021 FMR LLC. All rights reserved.
This report and the financial statements contained herein are submitted for the general information of the shareholders of the Fund. This report is not authorized for distribution to prospective investors in the Fund unless preceded or accompanied by an effective prospectus.
A fund files its complete schedule of portfolio holdings with the SEC for the first and third quarters of each fiscal year on Form N-PORT. Forms N-PORT are available on the SEC’s web site at http://www.sec.gov. A fund's Forms N-PORT may be reviewed and copied at the SEC’s Public Reference Room in Washington, DC. Information regarding the operation of the SEC's Public Reference Room may be obtained by calling 1-800-SEC-0330.
For a complete list of a fund's portfolio holdings, view the most recent holdings listing, semiannual report, or annual report on Fidelity's web site at http://www.fidelity.com, http://www.institutional.fidelity.com, or http://www.401k.com, as applicable.
NOT FDIC INSURED •MAY LOSE VALUE •NO BANK GUARANTEE
Neither the Fund nor Fidelity Distributors Corporation is a bank.
Note to Shareholders:
Early in 2020, the outbreak and spread of a new coronavirus emerged as a public health emergency that had a major influence on financial markets, primarily based on its impact on the global economy and the outlook for corporate earnings. The virus causes a respiratory disease known as COVID-19. On March 11, 2020 the World Health Organization declared the COVID-19 outbreak a pandemic, citing sustained risk of further global spread.
In the weeks following, as the crisis worsened, we witnessed an escalating human tragedy with wide-scale social and economic consequences from coronavirus-containment measures. The outbreak of COVID-19 prompted a number of measures to limit the spread, including travel and border restrictions, quarantines, and restrictions on large gatherings. In turn, these resulted in lower consumer activity, diminished demand for a wide range of products and services, disruption in manufacturing and supply chains, and – given the wide variability in outcomes regarding the outbreak – significant market uncertainty and volatility. Amid the turmoil, global governments and central banks took unprecedented action to help support consumers, businesses, and the broader economies, and to limit disruption to financial systems.
The situation continues to unfold, and the extent and duration of its impact on financial markets and the economy remain highly uncertain. Extreme events such as the coronavirus crisis are “exogenous shocks” that can have significant adverse effects on mutual funds and their investments. Although multiple asset classes may be affected by market disruption, the duration and impact may not be the same for all types of assets.
Fidelity is committed to helping you stay informed amid news about COVID-19 and during increased market volatility, and we’re taking extra steps to be responsive to customer needs. We encourage you to visit our websites, where we offer ongoing updates, commentary, and analysis on the markets and our funds.
Performance: The Bottom Line
Average annual total return reflects the change in the value of an investment, assuming reinvestment of distributions from dividend income and capital gains (the profits earned upon the sale of securities that have grown in value, if any) and assuming a constant rate of performance each year. The hypothetical investment and the average annual total returns do not reflect the deduction of taxes that a shareholder would pay on fund distributions or the redemption of fund shares. During periods of reimbursement by Fidelity, a fund’s total return will be greater than it would be had the reimbursement not occurred. How a fund did yesterday is no guarantee of how it will do tomorrow.
Average Annual Total Returns
| For the periods ended May 31, 2021 | Past 1 year | Life of fundA |
| Strategic Advisers® Tax-Sensitive Short Duration Fund | 1.01% | 1.50% |
A From December 28, 2017
$10,000 Over Life of Fund
Let's say hypothetically that $10,000 was invested in Strategic Advisers® Tax-Sensitive Short Duration Fund on December 28, 2017, when the fund started.
The chart shows how the value of your investment would have changed, and also shows how the Bloomberg Barclays Municipal Bond 1 Year (1-2 Y) Index performed over the same period.
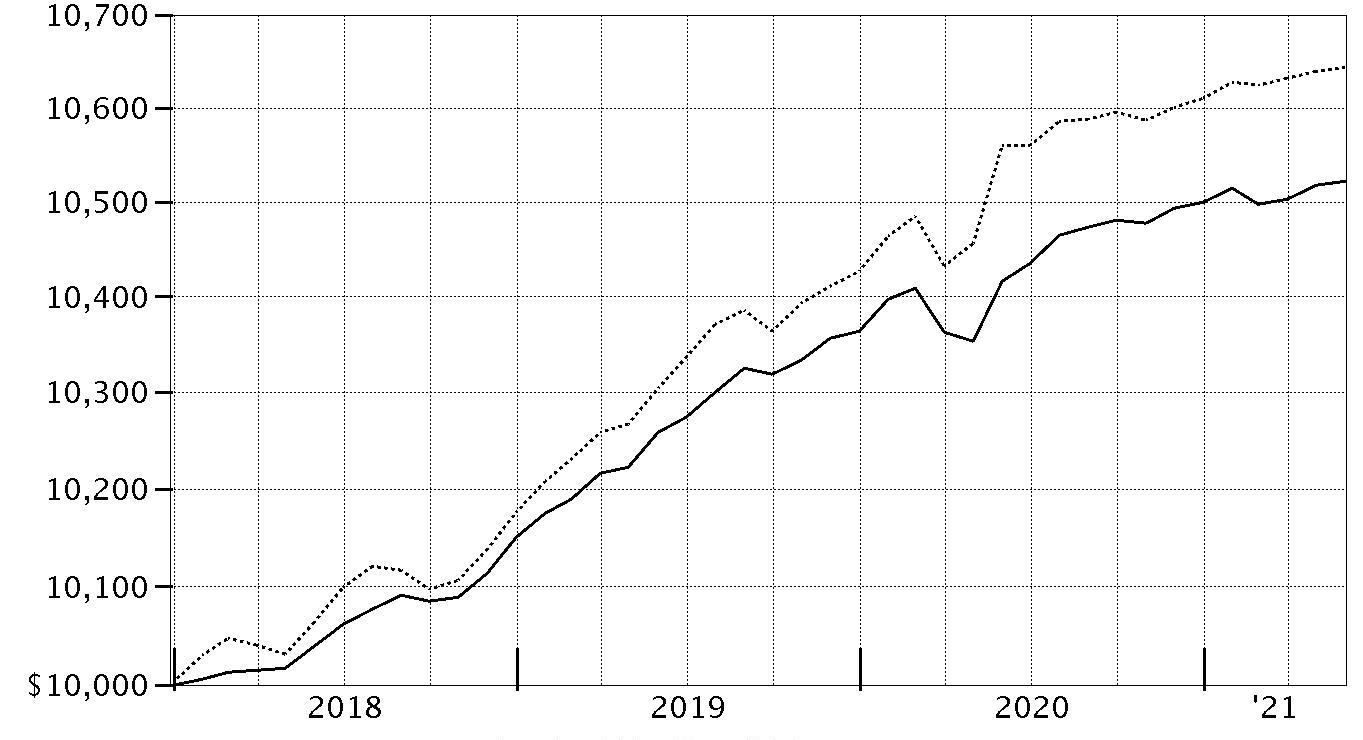
| Period Ending Values | ||
|
| $10,521 | Strategic Advisers® Tax-Sensitive Short Duration Fund |
|
| $10,643 | Bloomberg Barclays Municipal Bond 1 Year (1-2 Y) Index |
Management's Discussion of Fund Performance
Market Recap: Tax-exempt municipal bonds posted a solid gain for the 12 months ending May 31, 2021, supported by successive federal stimulus programs and better-than-expected fiscal performance from many state and local governments that fueled robust demand for tax-exempt investments. The Bloomberg Barclays Municipal Bond Index rose 4.74% for the period. Munis staged a sharp rebound in June and July 2020 as the market attracted significant shareholder inflows amid an easing of credit concerns that had been triggered by the economic shutdowns caused by COVID-19. Tax collections took less of a hit than originally feared and historic aid from Congress for muni issuers helped fill budget gaps. Muni bond gains were somewhat more muted in the late summer and early fall, partly reflecting investor concerns that potential stimulus-induced inflation could rise and diminish real bond returns. After the U.S. elections in November and through January 2021, the muni market rally accelerated along with the expanding reopening of the economy and the rollout of effective COVID-19 vaccination programs. Investor demand for tax-exempt munis increased in response to the Biden administration’s plan to push for higher taxes to fund health care, education and infrastructure programs. For the remainder of the period, muni market gains were somewhat subdued by resurgent inflation worries and concerns that the Federal Reserve might start tapering its monthly purchases of bonds sooner than expected. Comments from Lead Portfolio Manager Chris Heavey: For the fiscal year May 31, 2021, the Fund gained 1.01%, outpacing the 0.37% increase in the benchmark Strategic Advisers® Tax-Sensitive Short-Duration Composite Index. During the period, credit fundamentals largely improved for municipal issuers, aided by $350 billion of support from the federal government to state and local governments. Within this environment, bond spreads tightened, providing a boost to prices. State and local governments issued a substantial amount of bonds in the taxable rather than tax-free market, helping to create a favorable supply-and-demand backdrop for the municipal market. Within the Fund, all of our sub-advised strategies contributed versus the benchmark, led by two from FIAM® – Limited Term Municipal Income (+2.7%) and Conservative Income Municipal Bond (+1.3%) – along with the Ultra-Short Fixed Income mandate from Wells Capital (+1.3%). FIAM Limited Term benefited from overall interest-rate positioning, FIAM Conservative Income added value via holdings of municipal bonds with BBB credit ratings, and Wells provided a boost by having slightly greater interest-rate exposure than the benchmark. On the downside, cash marginally detracted from the Fund’s relative result. In terms of portfolio changes, during the fourth quarter of 2020, we increased the diversification of the Fund’s manager lineup by adding Vanguard Short-Term Tax-Exempt Bond Fund and Federated Hermes Municipal Ultrashort Fund. Looking ahead, I believe the tax-rate increases proposed by the Biden administration should enhance the value proposition of municipal bonds. Though we continue to like bonds rated BBB, due to tight credit spreads, the current range of attractive investment opportunities is limited, especially among longer-dated maturities within our investment universe. We plan to maintain the Fund’s exposure to this area of the market for the comparative yield advantage it provides and are closely monitoring new-issuance trends.The views expressed above reflect those of the portfolio manager(s) only through the end of the period as stated on the cover of this report and do not necessarily represent the views of Fidelity or any other person in the Fidelity organization. Any such views are subject to change at any time based upon market or other conditions and Fidelity disclaims any responsibility to update such views. These views may not be relied on as investment advice and, because investment decisions for a Fidelity fund are based on numerous factors, may not be relied on as an indication of trading intent on behalf of any Fidelity fund.
Investment Summary (Unaudited)
The information in the following tables is based on the direct investments of the Fund.Top Ten Holdings as of May 31, 2021
| (excluding cash equivalents) | % of fund's net assets |
| JPMorgan Ultra-Short Municipal Fund Class I | 11.5 |
| Vanguard Mun Bd Fund, Inc. | 3.4 |
| New York Metropolitan Transportation Authority Rev. | 1.6 |
| Texas General Obligation | 1.2 |
| New York City Gen. Oblig. | 0.9 |
| Denver City & County Airport Rev. | 0.8 |
| New Jersey Transportation Trust Fund Auth. | 0.8 |
| Federated Hermes Municipal Ultrashort Fund Institutional Shares | 0.8 |
| Port Arthur Navigation Dist. Environmental Facilities Rev. | 0.7 |
| Illinois Gen. Oblig. | 0.7 |
Top Five Sectors as of May 31, 2021
| % of fund's net assets | |
| General Obligations | 17.3 |
| Transportation | 9.8 |
| Health Care | 6.5 |
| Synthetics | 6.5 |
| Electric Utilities | 4.9 |
Quality Diversification (% of fund's net assets)
| As of May 31, 2021 | ||
| AAA,AA,A | 38.0% | |
| BBB | 5.5% | |
| Not Rated | 1.4% | |
| Equities | 15.8% | |
| Short-Term Investments and Net Other Assets | 39.3% | |

We have used ratings from Moody's Investors Service, Inc. Where Moody's® ratings are not available, we have used S&P® ratings. All ratings are as of the date indicated and do not reflect subsequent changes.
Asset Allocation (% of fund's net assets)
| As of May 31, 2021 | ||
| Municipal Bonds | 24.6% | |
| Short-Term Funds | 15.5% | |
| Investment Companies | 0.1% | |
| Short-Term Investments and Net Other Assets (Liabilities) | 59.8% | |

Schedule of Investments May 31, 2021
Showing Percentage of Net Assets
| Municipal Bonds - 45.1% | |||
| Principal Amount | Value | ||
| Alabama - 0.5% | |||
| Alabama Pub. School & College Auth. Rev. Series 2020 A: | |||
| 5% 11/1/22 | $1,500,000 | $1,603,801 | |
| 5% 11/1/24 | 1,500,000 | 1,738,427 | |
| Alabama Spl. Care Facilities Fing. Auth. Birmingham Rev. Bonds Series 2006 C1, 1.85%, tender 11/1/22 (a) | 1,025,000 | 1,049,601 | |
| Birmingham Arpt. Auth. Arpt. Series 2020: | |||
| 5% 7/1/24 (Build America Mutual Assurance Insured) | 325,000 | 371,239 | |
| 5% 7/1/25 (Build America Mutual Assurance Insured) | 325,000 | 383,585 | |
| Black Belt Energy Gas District: | |||
| (Proj. No. 4) Series 2019 A: | |||
| 4% 6/1/21 | 1,250,000 | 1,250,000 | |
| 4% 6/1/23 | 1,750,000 | 1,876,822 | |
| Bonds Series 2017 A, 4%, tender 7/1/22 (a) | 4,750,000 | 4,924,555 | |
| Series 2021 A: | |||
| 4% 12/1/21 | 435,000 | 443,072 | |
| 4% 6/1/22 | 340,000 | 352,469 | |
| 4% 12/1/22 | 470,000 | 495,928 | |
| 4% 6/1/23 | 400,000 | 429,154 | |
| 4% 12/1/23 | 435,000 | 474,233 | |
| Chatom Indl. Dev. Board Gulf Opportunity Zone Series 2020, 5% 8/1/23 (FSA Insured) | 1,350,000 | 1,482,022 | |
| Health Care Auth. for Baptist Health Series 2006 B, 0.35%, tender 11/15/37 (a) | 1,150,000 | 1,150,000 | |
| Lower Alabama Gas District (No. 2 Proj.) Series 2020, 4% 12/1/21 | 100,000 | 101,840 | |
| Mobile County Board of School Commissioners: | |||
| Series 2016 A: | |||
| 5% 3/1/22 | 15,000 | 15,535 | |
| 5% 3/1/23 | 20,000 | 21,591 | |
| 5% 3/1/24 | 25,000 | 28,165 | |
| 5% 3/1/25 | 25,000 | 29,183 | |
| Series 2016 B: | |||
| 5% 3/1/22 | 80,000 | 82,851 | |
| 5% 3/1/23 | 405,000 | 437,220 | |
| 5% 3/1/24 | 45,000 | 50,696 | |
| Mobile Indl. Dev. Board Poll. Cont. Rev. Bonds Series 2009 E, 1%, tender 6/26/25 (a) | 600,000 | 608,232 | |
| Montgomery Med. Clinic Facilities Series 2015, 5% 3/1/22 | 70,000 | 72,028 | |
| Southeast Alabama Gas Supply District Bonds Series 2018 A, 4%, tender 4/1/24 (a) | 4,000,000 | 4,362,403 | |
| Southeast Energy Auth. Rev. Bonds (Proj. No. 1) Series 2021 A: | |||
| 4% 10/1/22 | 355,000 | 372,489 | |
| 4% 10/1/23 | 425,000 | 460,137 | |
| Univ. of South Alabama Univ. Rev. Series 2021, 4% 4/1/26 | 500,000 | 578,044 | |
| TOTAL ALABAMA | 25,245,322 | ||
| Alaska - 0.2% | |||
| Alaska Gen. Oblig. Series 2013 B, 5% 8/1/21 | 300,000 | 302,406 | |
| Alaska Hsg. Fin. Corp. Series 2021 A: | |||
| 3% 12/1/23 | 450,000 | 480,923 | |
| 3% 6/1/24 | 400,000 | 431,931 | |
| Alaska Hsg. Fin. Corp. Mtg. Rev. Series 2020 A: | |||
| 0.3% 12/1/21 | 665,000 | 665,419 | |
| 0.35% 6/1/22 | 660,000 | 661,027 | |
| 0.4% 12/1/22 | 750,000 | 751,520 | |
| Alaska Int'l. Arpts. Revs. Series 2016 C: | |||
| 5% 10/1/22 (b) | 1,105,000 | 1,173,029 | |
| 5% 10/1/23 (b) | 425,000 | 470,086 | |
| Alaska Muni. Bond Bank: | |||
| Series 1, 5% 12/1/21 | 1,000,000 | 1,024,132 | |
| Series 2021 1, 5% 12/1/22 (c) | 2,190,000 | 2,343,523 | |
| Anchorage Gen. Oblig.: | |||
| Series B, 5% 9/1/22 | 30,000 | 31,818 | |
| Series C, 5% 9/1/22 | 20,000 | 21,212 | |
| TOTAL ALASKA | 8,357,026 | ||
| Arizona - 1.4% | |||
| Arizona Board of Regents Arizona State Univ. Rev.: | |||
| Series 2015 B, 5% 7/1/26 | 790,000 | 931,354 | |
| Series 2021: | |||
| 5% 8/1/24 | 1,000,000 | 1,148,466 | |
| 5% 8/1/25 | 700,000 | 831,637 | |
| Arizona Board of Regents Ctfs. of Prtn. Series 2015 A, 5% 6/1/22 | 150,000 | 157,194 | |
| Arizona Ctfs. of Prtn. Series 2019 A: | |||
| 5% 10/1/24 | 195,000 | 225,037 | |
| 5% 10/1/25 | 570,000 | 680,695 | |
| Arizona Health Facilities Auth. Rev.: | |||
| (Scottsdale Lincoln Hospitals Proj.) Series 2014 A: | |||
| 5% 12/1/21 | 25,000 | 25,603 | |
| 5% 12/1/22 | 15,000 | 16,084 | |
| 5% 12/1/23 | 20,000 | 22,370 | |
| 5% 12/1/24 | 45,000 | 52,257 | |
| Bonds Series 2013 A3, SIFMA Municipal Swap Index + 1.850% 1.9%, tender 2/1/23 (a)(d) | 2,000,000 | 2,026,319 | |
| Series 2015 A, 5% 1/1/23 | 160,000 | 172,199 | |
| Arizona Indl. Dev. Auth. Hosp. Rev. Series 2020 A: | |||
| 5% 2/1/24 | 600,000 | 674,148 | |
| 5% 2/1/26 | 750,000 | 901,551 | |
| Arizona State Univ. Revs. Series 2019 A, 5% 7/1/21 | 225,000 | 225,895 | |
| Chandler Indl. Dev. Auth. Indl. Dev. Rev. Bonds (Intel Corp. Proj.): | |||
| Series 2005, 2.4%, tender 8/14/23 (a) | 5,100,000 | 5,324,667 | |
| Series 2007, 2.7%, tender 8/14/23 (a)(b) | 6,820,000 | 7,152,909 | |
| Series 2019, 5%, tender 6/3/24 (a)(b) | 5,610,000 | 6,351,983 | |
| Coconino County Poll. Cont. Corp. Rev. Bonds: | |||
| Series 2017 A, 1.875%, tender 3/31/23 (a)(b) | 1,145,000 | 1,174,073 | |
| Series 2017 B, 1.65%, tender 3/31/23 (a) | 1,020,000 | 1,044,199 | |
| Glendale Union School District 205 Series A: | |||
| 5% 7/1/24 (FSA Insured) | 225,000 | 256,639 | |
| 5% 7/1/25 (FSA Insured) | 225,000 | 265,559 | |
| Glendale Gen. Oblig.: | |||
| Series 2015, 5% 7/1/22 (FSA Insured) | 20,000 | 21,054 | |
| Series 2017, 5% 7/1/22 | 75,000 | 78,953 | |
| Glendale Trans. Excise Tax Rev. Series 2015: | |||
| 5% 7/1/21 (FSA Insured) | 15,000 | 15,059 | |
| 5% 7/1/22 (FSA Insured) | 25,000 | 26,318 | |
| 5% 7/1/23 (FSA Insured) | 30,000 | 32,992 | |
| Maricopa County Indl. Dev. Auth. Series 2019 A, 5% 9/1/23 | 365,000 | 404,159 | |
| Maricopa County Rev.: | |||
| Bonds: | |||
| Series 2019 B, SIFMA Municipal Swap Index + 0.380% 0.43%, tender 10/18/22 (a)(d) | 4,065,000 | 4,059,053 | |
| Series B, 5%, tender 10/18/22 (a) | 2,980,000 | 3,171,991 | |
| Series 2016 A, 5% 1/1/25 | 105,000 | 122,086 | |
| Maricopa County Spl. Health Care District Gen. Oblig. Series 2021 D, 5% 7/1/25 (c) | 1,000,000 | 1,181,502 | |
| Maricopa County Unified School District #48 Scottsdale Series D, 4% 7/1/23 | 500,000 | 539,927 | |
| Mesa Util. Sys. Rev.: | |||
| Series 2016, 5% 7/1/25 | 1,015,000 | 1,202,032 | |
| Series 2020, 5% 7/1/24 | 635,000 | 726,819 | |
| Phoenix Civic Impt. Board Arpt. Rev.: | |||
| Series 2013, 5% 7/1/21 (b) | 2,750,000 | 2,760,638 | |
| Series 2017 A, 5% 7/1/22 (b) | 715,000 | 752,047 | |
| Series 2017 D: | |||
| 5% 7/1/22 | 840,000 | 883,524 | |
| 5% 7/1/24 | 250,000 | 285,568 | |
| Series 2018, 5% 7/1/23 (b) | 1,100,000 | 1,208,498 | |
| Series 2019 B: | |||
| 5% 7/1/22 (b) | 725,000 | 761,754 | |
| 5% 7/1/23 (b) | 1,000,000 | 1,095,338 | |
| Phoenix Civic Impt. Corp. Wtr. Sys. Rev. Series 2014 B, 5% 7/1/21 | 200,000 | 200,797 | |
| Phoenix Indl. Solid Waste Disp. Rev. Bonds (Republic Svc., Inc. Proj.) Series 2013, 0.2%, tender 12/1/35 (a)(b) | 23,880,000 | 23,880,795 | |
| Pima County Ctfs. of Prtn. Series 2014: | |||
| 5% 12/1/21 | 50,000 | 51,212 | |
| 5% 12/1/22 | 130,000 | 139,417 | |
| 5% 12/1/23 | 75,000 | 83,687 | |
| Pima County Swr. Sys. Rev. Series 2020 A, 5% 7/1/23 | 270,000 | 297,048 | |
| Tucson Ctfs. of Prtn.: | |||
| Series 2015: | |||
| 5% 7/1/22 (FSA Insured) | 290,000 | 304,929 | |
| 5% 7/1/23 (FSA Insured) | 200,000 | 218,848 | |
| Series 2016, 4% 7/1/21 (FSA Insured) | 260,000 | 260,790 | |
| Western Maricopa Ed. Ctr. District Series 2019 B, 4% 7/1/21 | 1,365,000 | 1,369,249 | |
| Yavapai County Indl. Dev. Auth.: | |||
| Series 2016, 5% 8/1/23 | 275,000 | 302,333 | |
| Series 2019: | |||
| 5% 8/1/21 | 225,000 | 226,771 | |
| 5% 8/1/22 | 425,000 | 448,700 | |
| 5% 8/1/23 | 355,000 | 390,285 | |
| Yuma Pledged Rev. Series 2021: | |||
| 4% 7/1/24 | 300,000 | 332,619 | |
| 4% 7/1/25 | 505,000 | 573,481 | |
| TOTAL ARIZONA | 78,071,111 | ||
| Arkansas - 0.1% | |||
| Arkansas Dev. Fin. Auth. Multi-family Hsg. Rev. (NLR Rad Family Homes Proj.) Series 2020, 1.2%, tender 9/1/22 (a) | 5,000,000 | 5,056,347 | |
| Arkansas Dev. Fin. Auth. Pub. Safety Charges (Arkansas Division of Emergency Mgmt. Proj.) Series 2020, 5% 6/1/24 | 565,000 | 641,782 | |
| Batesville Pub. Facilities Board Series 2020: | |||
| 5% 6/1/22 | 590,000 | 611,896 | |
| 5% 6/1/23 | 790,000 | 835,133 | |
| TOTAL ARKANSAS | 7,145,158 | ||
| California - 2.9% | |||
| ABAG Fin. Auth. for Nonprofit Corps. Rev. (Sharp HealthCare Proj.) Series 2012 A, 4% 8/1/21 | 250,000 | 251,583 | |
| Bay Area Toll Auth. San Francisco Bay Toll Bridge Rev. Bonds: | |||
| Series 2017 G, 2%, tender 4/1/24 (a) | 1,120,000 | 1,161,242 | |
| Series 2021 B, 0.280% x SIFMA Municipal Swap Index 0.33%, tender 4/1/24 (a)(d) | 2,500,000 | 2,493,635 | |
| Series A, 2.95%, tender 4/1/26 (a) | 115,000 | 126,354 | |
| Series B, 2.85%, tender 4/1/25 (a) | 95,000 | 102,744 | |
| Burbank Glendale Pasadena Arpt. Auth. Rev. Series B, 5% 7/1/23 (b) | 1,290,000 | 1,414,401 | |
| California Gen. Oblig.: | |||
| Bonds Series 2013, SIFMA Municipal Swap Index + 0.380% 0.43%, tender 12/1/22 (a)(d) | 3,270,000 | 3,272,547 | |
| Series 2011: | |||
| 5% 10/1/21 | 250,000 | 254,070 | |
| 5.25% 9/1/22 | 35,000 | 37,253 | |
| Series 2015, 5% 3/1/23 | 310,000 | 336,370 | |
| Series 2020: | |||
| 5% 3/1/22 | 3,180,000 | 3,297,254 | |
| 5% 11/1/24 | 500,000 | 580,217 | |
| Series 2021: | |||
| 4% 12/1/22 | 4,150,000 | 4,393,097 | |
| 5% 12/1/22 | 4,000,000 | 4,294,148 | |
| 5% 9/1/23 (c) | 1,000,000 | 1,096,011 | |
| 5% 12/1/23 | 2,000,000 | 2,239,103 | |
| 5% 12/1/24 | 565,000 | 657,618 | |
| California Health Facilities Fing. Auth. Rev.: | |||
| Bonds: | |||
| (Stanford Hosp. & Clinics Proj.) Series 2008 B2, 0.12%, tender 6/15/21 (a) | 4,000,000 | 4,000,000 | |
| Series 2009 C, 5%, tender 10/18/22 (a) | 835,000 | 890,236 | |
| Series 2017 A, 5%, tender 11/1/22 (a) | 210,000 | 224,486 | |
| Series 2017 C, 5%, tender 11/1/22 (a) | 400,000 | 427,592 | |
| Series 2021 A, 3%, tender 8/15/25 (a) | 2,000,000 | 2,212,821 | |
| Series 2011, 5% 8/15/21 | 200,000 | 202,006 | |
| Series 2014 A, 5% 10/1/21 | 325,000 | 330,258 | |
| Series 2015, 5% 11/15/23 | 200,000 | 223,771 | |
| Series 2016 A, 5% 8/15/21 | 245,000 | 247,457 | |
| Series 2018 A, 5% 11/15/22 | 195,000 | 208,534 | |
| Series A, 4% 11/15/21 | 405,000 | 411,974 | |
| California Infrastructure and Econ. Dev. Bank Rev. Bonds: | |||
| (Brightline West Passenger Rail Proj.) Series 2020 A, 0.45%, tender 7/1/21 (a)(b)(e) | 4,000,000 | 4,000,223 | |
| Series 2018 A, 1 month U.S. LIBOR + 0.380% 0.444%, tender 6/3/21 (a)(d) | 400,000 | 400,030 | |
| Series 2018 C, 1 month U.S. LIBOR + 0.380% 0.444%, tender 6/3/21 (a)(d) | 4,765,000 | 4,765,360 | |
| Series 2018 D, 1 month U.S. LIBOR + 0.380% 0.444%, tender 6/2/21 (a)(d) | 7,600,000 | 7,600,575 | |
| California Muni. Fin. Auth. Solid Waste Disp. Rev. Bonds (Waste Mgmt., Inc. Proj.): | |||
| Series 2017 A, 0.7%, tender 12/1/23 (a)(b) | 1,600,000 | 1,620,319 | |
| Series 2020, 0.2%, tender 6/1/21 (a)(b) | 4,200,000 | 4,200,000 | |
| California Muni. Fin. Auth. Solid Waste Rev. Bonds (Republic Svcs., Inc. Proj.) Series 2010, 0.15%, tender 7/1/21 (a) | 3,300,000 | 3,300,026 | |
| California Muni. Fin. Auth. Student Hsg. (CHF Davis II, L.L.C. Orchard Park Student Hsg. Proj.) Series 2021, 5% 5/15/24 (Build America Mutual Assurance Insured) | 500,000 | 568,604 | |
| California Poll. Cont. Fing. Auth. Solid Waste Disp. Rev. Bonds (Republic Svcs., Inc. Proj.): | |||
| Series 2017 A1, 0.18%, tender 7/15/21 (a)(b)(e) | 3,800,000 | 3,799,954 | |
| Series 2017 A2, 0.18%, tender 7/15/21 (a)(b)(e) | 5,600,000 | 5,599,933 | |
| California Pub. Fin. Auth. Rev. Series 2021 A: | |||
| 4% 10/15/23 | 285,000 | 306,816 | |
| 4% 10/15/24 | 380,000 | 419,546 | |
| California Pub. Works Board Lease Rev. (Various Cap. Projs.) Series 2021 B, 5% 5/1/24 | 1,095,000 | 1,245,824 | |
| California School Cash Reserve Prog. Auth. Series 2021 L, 2% 1/31/22 | 7,000,000 | 7,087,147 | |
| California Statewide Cmntys. Dev. Auth. Rev. Series 2007: | |||
| 0.13%, tender 7/1/41 (FSA Insured) (a) | 4,475,000 | 4,475,000 | |
| 0.23%, tender 7/1/40 (FSA Insured) (a) | 4,275,000 | 4,275,000 | |
| Cathedral City Redev. Agcy. (Merged Redev. Proj.) Series 2021 C: | |||
| 4% 8/1/21 | 250,000 | 251,379 | |
| 4% 8/1/22 | 200,000 | 207,610 | |
| 4% 8/1/23 | 225,000 | 241,153 | |
| Golden State Tobacco Securitization Corp. Tobacco Settlement Rev.: | |||
| Series 2013 A, 4% 6/1/21 | 450,000 | 450,000 | |
| Series 2015 A, 5% 6/1/21 | 200,000 | 200,000 | |
| Series 2017 A1: | |||
| 5% 6/1/21 | 270,000 | 270,000 | |
| 5% 6/1/22 | 40,000 | 41,875 | |
| 5% 6/1/23 | 45,000 | 49,153 | |
| 5% 6/1/24 | 25,000 | 28,363 | |
| Series A, 0% 6/1/24 (AMBAC Insured) | 75,000 | 73,838 | |
| Long Beach Hbr. Rev.: | |||
| Series 2020 B, 5% 5/15/24 (b) | 750,000 | 847,454 | |
| Series 2020 C, 4% 7/15/21 | 2,500,000 | 2,511,692 | |
| Los Angeles Dept. Arpt. Rev.: | |||
| Series 2016 A, 5% 5/15/22 (b) | 250,000 | 261,432 | |
| Series 2017 A, 5% 5/15/24 (b) | 305,000 | 346,269 | |
| Series 2017 B, 5% 5/15/23 (b) | 800,000 | 874,253 | |
| Series 2019 F, 5% 5/15/24 (b) | 2,610,000 | 2,963,150 | |
| Series 2020 C, 5% 5/15/24 (b) | 250,000 | 283,827 | |
| Series F, 5% 5/15/22 (b) | 1,700,000 | 1,777,739 | |
| Los Angeles Dept. of Wtr. & Pwr. Rev. Series 2018 B, 4% 1/1/22 | 200,000 | 203,904 | |
| Los Angeles Dept. of Wtr. & Pwr. Wtrwks. Rev. Series A, 4% 7/1/21 | 200,000 | 200,632 | |
| Los Angeles Hbr. Dept. Rev. Series 2019 A, 5% 8/1/22 (b) | 1,175,000 | 1,239,244 | |
| Los Angeles Reg'l. Arpts. Impt. Rev. Series 2012, 4.5% 1/1/27 (b) | 375,000 | 383,921 | |
| Los Angeles Unified School District: | |||
| Series 2014 D, 5% 7/1/21 | 250,000 | 250,988 | |
| Series 2018 B1, 5% 7/1/21 | 340,000 | 341,343 | |
| Series 2020 C, 5% 7/1/23 | 1,200,000 | 1,320,742 | |
| Series 2020 RYQ, 5% 7/1/21 | 365,000 | 366,442 | |
| Metropolitan Wtr. District of Southern California Wtr. Rev. Bonds Series 2017 C, SIFMA Municipal Swap Index + 0.140% 0.3%, tender 6/3/21 (a)(d) | 1,000,000 | 1,000,002 | |
| Northern California Pwr. Agcy. Rev.: | |||
| Series 2018 A, 5% 7/1/21 | 425,000 | 426,662 | |
| Series 2019 E, 5% 7/1/21 | 200,000 | 200,782 | |
| Oakland Unified School District Alameda County Series 2013, 5.5% 8/1/23 | 20,000 | 21,725 | |
| Palomar Pomerado Health Care Dis: | |||
| Series 2006 A, 0.77%, tender 11/1/36 (FSA Insured) (a) | 4,900,000 | 4,900,000 | |
| Series 2006 B, 0.68%, tender 11/1/36 (FSA Insured) (a) | 4,700,000 | 4,700,000 | |
| Series 2006 C, 0.68%, tender 11/1/36 (FSA Insured) (a) | 2,300,000 | 2,300,000 | |
| Port of Oakland Rev.: | |||
| Series 2012 P, 5% 5/1/23 (Pre-Refunded to 5/1/22 @ 100) (b) | 335,000 | 349,801 | |
| Series 2017 D: | |||
| 5% 11/1/23 (b) | 500,000 | 553,412 | |
| 5% 11/1/24 (b) | 100,000 | 114,607 | |
| Series H: | |||
| 5% 5/1/22 (b) | 2,750,000 | 2,863,112 | |
| 5% 5/1/23 (b) | 5,515,000 | 5,982,525 | |
| 5% 5/1/24 (b) | 930,000 | 1,047,946 | |
| Riverside County Teeter Plan Series A, 0.5% 10/21/21 | 590,000 | 590,902 | |
| San Diego County Reg'l. Arpt. Auth. Arpt. Rev.: | |||
| Series 2013 A: | |||
| 5% 7/1/21 | 375,000 | 376,482 | |
| 5% 7/1/22 | 200,000 | 210,587 | |
| Series 2013 B: | |||
| 5% 7/1/21 (b) | 1,145,000 | 1,149,392 | |
| 5% 7/1/22 (b) | 1,800,000 | 1,892,460 | |
| Series 2019 B, 5% 7/1/22 (b) | 250,000 | 262,702 | |
| Series 2020 C: | |||
| 5% 7/1/22 (b) | 1,475,000 | 1,549,940 | |
| 5% 7/1/23 (b) | 545,000 | 597,557 | |
| San Diego County Reg'l. Trans. Commission Sales Tax Rev. Series A, 5% 10/1/22 | 4,050,000 | 4,313,945 | |
| San Diego Pub. Facilities Fing. Auth. Lease Rev. Series 2016, 5% 10/15/22 | 1,940,000 | 2,070,080 | |
| San Diego Pub. Facilities Fing. Auth. Wtr. Rev. Series 2020 A: | |||
| 5% 8/1/21 | 250,000 | 252,026 | |
| 5% 8/1/22 | 250,000 | 264,365 | |
| San Francisco City & County Arpts. Commission Int'l. Arpt. Rev.: | |||
| Series 2013 A, 5% 5/1/22 (Escrowed to Maturity) (b) | 500,000 | 521,854 | |
| Series 2016 A: | |||
| 5% 5/1/22 (Escrowed to Maturity) | 1,000,000 | 1,044,654 | |
| 5% 5/1/23 | 225,000 | 245,795 | |
| Series 2019 A: | |||
| 5% 1/1/22 (b) | 3,025,000 | 3,108,962 | |
| 5% 1/1/24 (b) | 655,000 | 732,323 | |
| 5% 1/1/25 (b) | 575,000 | 665,228 | |
| Series 2019 H, 5% 5/1/23 (b) | 2,000,000 | 2,180,001 | |
| San Jose Int. Arpt. Rev.: | |||
| Series 2014 A, 5% 3/1/23 (Escrowed to Maturity) (b) | 1,400,000 | 1,516,374 | |
| Series 2017 B, 5% 3/1/23 (Escrowed to Maturity) | 200,000 | 216,993 | |
| Series 2021 A, 5% 3/1/24 (b) | 1,000,000 | 1,125,113 | |
| Series 2021 B, 5% 3/1/24 | 500,000 | 565,056 | |
| San Pablo Redev. Agcy. Series 2014 A, 5% 6/15/24 (FSA Insured) | 30,000 | 34,046 | |
| Washington Township Health Care District Rev. Series A: | |||
| 5% 7/1/21 | 350,000 | 351,233 | |
| 5% 7/1/22 | 200,000 | 209,313 | |
| 5% 7/1/23 | 200,000 | 217,452 | |
| TOTAL CALIFORNIA | 155,762,951 | ||
| Colorado - 0.8% | |||
| Colorado Bridge Enterprise Rev. Series 2017, 4% 6/30/24 (b) | 1,330,000 | 1,447,569 | |
| Colorado Ctfs. of Prtn. Series 2020 A, 5% 12/15/21 | 2,000,000 | 2,052,805 | |
| Colorado Health Facilities Auth.: | |||
| Bonds: | |||
| (Valley View Hosp. Assoc. Proj.) Series 2018, 2.8%, tender 5/15/23 (a) | 480,000 | 496,558 | |
| Series 2019 B: | |||
| 5%, tender 8/1/25 (a) | 300,000 | 348,816 | |
| 5%, tender 8/1/26 (a) | 340,000 | 407,638 | |
| 5%, tender 11/19/26 (a) | 1,590,000 | 1,955,001 | |
| Series 2019 A: | |||
| 5% 11/1/21 | 400,000 | 407,950 | |
| 5% 1/1/23 | 870,000 | 936,331 | |
| Colorado Health Facilities Auth. Retirement Hsg. Rev. (Liberty Heights Proj.) Series 1991 A, 0% 7/15/22 (Escrowed to Maturity) | 620,000 | 618,407 | |
| Colorado Health Facilities Auth. Rev. Bonds: | |||
| Series 2008 D3, 5%, tender 11/12/21 (a) | 115,000 | 117,378 | |
| Series 2016 C, 5%, tender 11/15/23 (a) | 355,000 | 396,542 | |
| Colorado Hsg. & Fin. Auth.: | |||
| Series 2019 F, 4.25% 11/1/49 | 180,000 | 201,837 | |
| Series 2019 H, 4.25% 11/1/49 | 100,000 | 112,215 | |
| Colorado Reg'l. Trans. District (Denver Transit Partners Eagle P3 Proj.) Series 2020: | |||
| 5% 1/15/24 | 750,000 | 835,395 | |
| 5% 1/15/25 | 650,000 | 747,656 | |
| Colorado Reg'l. Trans. District Ctfs. of Prtn.: | |||
| Series 2013 A, 5% 6/1/23 | 250,000 | 272,931 | |
| Series 2014 A, 5% 6/1/23 | 85,000 | 92,796 | |
| Colorado Univ. Co. Hosp. Auth. Rev. Bonds Series 2017C-2, 5%, tender 3/1/22 (a) | 1,120,000 | 1,133,305 | |
| Denver City & County Arpt. Rev.: | |||
| (Sub Lien Proj.) Series 2013 A, 5% 11/15/21(b) | 900,000 | 919,694 | |
| Series 2011 A, 5.25% 11/15/22 (b) | 1,750,000 | 1,789,466 | |
| Series 2012 A: | |||
| 5% 11/15/22 (b) | 520,000 | 555,696 | |
| 5% 11/15/23 (b) | 250,000 | 267,351 | |
| Series 2012 B: | |||
| 5% 11/15/21 | 400,000 | 408,808 | |
| 5% 11/15/22 | 250,000 | 267,579 | |
| Series 2013 A, 5% 11/15/22 (b) | 500,000 | 534,323 | |
| Series 2013 B, 5% 11/15/21 | 360,000 | 367,928 | |
| Series 2016 A, 5% 11/15/23 | 300,000 | 334,949 | |
| Series 2017 A: | |||
| 5% 11/15/21 (b) | 1,065,000 | 1,088,304 | |
| 5% 11/15/22 (b) | 3,455,000 | 3,692,174 | |
| Series 2018 A: | |||
| 5% 12/1/21 (b) | 1,000,000 | 1,024,030 | |
| 5% 12/1/23 (b) | 250,000 | 278,226 | |
| 5% 12/1/29 (b) | 185,000 | 234,122 | |
| Series 2020 A1, 5% 11/15/22 | 3,200,000 | 3,425,013 | |
| Series 2020 B1: | |||
| 5% 11/15/21 (b) | 3,855,000 | 3,939,355 | |
| 5% 11/15/22 (b) | 4,045,000 | 4,322,676 | |
| 5% 11/15/23 (b) | 935,000 | 1,040,019 | |
| E-470 Pub. Hwy. Auth. Rev.: | |||
| Bonds: | |||
| Series 2019 A, 1 month U.S. LIBOR + 0.420% 0.482%, tender 6/3/21 (a)(d) | 2,250,000 | 2,250,013 | |
| Series 2021 B, U.S. Secured Overnight Finl Rate (SOFR) Indx + 0.350% 0%, tender 9/1/24 (a)(d) | 3,250,000 | 3,250,001 | |
| Series 2020 A: | |||
| 5% 9/1/23 | 275,000 | 303,520 | |
| 5% 9/1/24 | 450,000 | 514,769 | |
| 5% 9/1/25 | 300,000 | 354,631 | |
| Series B, 0% 9/1/21 (Nat'l. Pub. Fin. Guarantee Corp. Insured) | 830,000 | 829,133 | |
| Vauxmont Metropolitan District Series 2019: | |||
| 5% 12/15/22 (FSA Insured) | 100,000 | 106,889 | |
| 5% 12/15/23 (FSA Insured) | 120,000 | 133,269 | |
| TOTAL COLORADO | 44,813,068 | ||
| Connecticut - 1.7% | |||
| Bridgeport Gen. Oblig. Series 2020, 1.5% 12/9/21 | 1,500,000 | 1,506,871 | |
| City of New Haven Series A, 5% 8/1/22 | 1,000,000 | 1,048,063 | |
| Connecticut Gen. Oblig.: | |||
| Series 2011 D, 5% 11/1/22 | 185,000 | 188,734 | |
| Series 2012 C, 5% 6/1/21 | 1,290,000 | 1,290,000 | |
| Series 2013 A, 1.04% 3/1/25 (a) | 510,000 | 521,341 | |
| Series 2014 A, 4% 3/1/22 | 450,000 | 463,128 | |
| Series 2014 H, 5% 11/15/21 | 925,000 | 945,670 | |
| Series 2015 A: | |||
| 4% 3/15/23 | 250,000 | 267,226 | |
| 5% 3/15/22 | 1,260,000 | 1,308,569 | |
| 5% 3/15/23 | 280,000 | 304,286 | |
| Series 2015 B, 5% 6/15/21 | 670,000 | 671,195 | |
| Series 2015 C: | |||
| SIFMA Municipal Swap Index + 0.900% 0.95% 6/15/21 (a)(d) | 2,500,000 | 2,500,562 | |
| 5% 6/15/22 | 400,000 | 420,268 | |
| Series 2015, 4% 11/15/21 | 290,000 | 295,168 | |
| Series 2016 A: | |||
| 5% 3/15/24 | 380,000 | 430,091 | |
| 5% 3/15/26 | 70,000 | 84,794 | |
| Series 2016 B: | |||
| 5% 5/15/22 | 575,000 | 601,861 | |
| 5% 5/15/24 | 575,000 | 654,991 | |
| Series 2016 D, 5% 8/15/21 | 505,000 | 510,054 | |
| Series 2016 E, 5% 10/15/23 | 240,000 | 267,126 | |
| Series 2016 G, 5% 11/1/21 | 1,200,000 | 1,224,512 | |
| Series 2017 B, 3% 4/15/22 | 500,000 | 512,627 | |
| Series 2018 B, 5% 4/15/22 | 810,000 | 844,532 | |
| Series 2018 F: | |||
| 5% 9/15/21 | 665,000 | 674,390 | |
| 5% 9/15/22 | 225,000 | 239,119 | |
| Series 2019 A: | |||
| 5% 4/15/22 | 670,000 | 698,563 | |
| 5% 4/15/23 | 1,000,000 | 1,090,709 | |
| Series 2020 A, 5% 1/15/23 | 1,740,000 | 1,877,056 | |
| Series 2021 D: | |||
| 5% 7/15/24 (c) | 300,000 | 340,834 | |
| 5% 7/15/25 (c) | 495,000 | 580,891 | |
| Series A: | |||
| 3% 1/15/22 | 1,725,000 | 1,756,042 | |
| 4% 1/15/25 | 3,500,000 | 3,950,718 | |
| 5% 10/15/21 | 1,450,000 | 1,476,438 | |
| 5% 3/15/23 | 690,000 | 749,848 | |
| Series B: | |||
| 4% 6/15/21 | 250,000 | 250,356 | |
| 4% 6/15/22 | 250,000 | 260,080 | |
| Series C: | |||
| 4% 6/1/24 | 1,050,000 | 1,166,448 | |
| 5% 6/15/21 | 1,350,000 | 1,352,407 | |
| 5% 6/1/24 | 300,000 | 314,303 | |
| Series E, 4% 9/15/21 | 750,000 | 758,445 | |
| Series H, 5% 11/15/22 | 390,000 | 417,601 | |
| Connecticut Health & Edl. Facilities Auth. Rev.: | |||
| (Quinnipiac Univ., Ct Proj.) Series 2016 M, 5% 7/1/21 | 400,000 | 401,574 | |
| Bonds: | |||
| Series 2014 A, 1.1%, tender 2/7/23 (a) | 5,350,000 | 5,431,645 | |
| Series 2014 B, 1.8%, tender 7/1/24 (a) | 545,000 | 565,323 | |
| Series 2015 A, 2.05%, tender 7/12/21 (a) | 5,000,000 | 5,010,604 | |
| Series 2017 B, 0.55%, tender 7/3/23 (a) | 10,425,000 | 10,471,542 | |
| Series U1, 2%, tender 2/8/22 (a) | 975,000 | 987,381 | |
| Series U2, 2%, tender 2/8/22 (a) | 200,000 | 202,540 | |
| Series X2, 0.25%, tender 2/9/24 (a) | 7,965,000 | 7,946,104 | |
| Series 2013 N, 5% 7/1/24 | 100,000 | 109,974 | |
| Series 2017 I1, 5% 7/1/22 | 275,000 | 289,126 | |
| Series 2019 A, 5% 7/1/26 | 260,000 | 313,043 | |
| Series 2020 K: | |||
| 5% 7/1/22 | 250,000 | 262,842 | |
| 5% 7/1/23 | 250,000 | 273,615 | |
| Series A, 5% 7/1/21 (Escrowed to Maturity) | 800,000 | 803,176 | |
| Series L, 5% 7/1/21 | 225,000 | 225,885 | |
| Series L1: | |||
| 3% 7/1/21 | 150,000 | 150,336 | |
| 4% 7/1/22 | 800,000 | 831,754 | |
| 4% 7/1/23 | 225,000 | 241,696 | |
| 4% 7/1/25 | 600,000 | 678,770 | |
| Series N: | |||
| 5% 7/1/21 | 610,000 | 612,340 | |
| 5% 7/1/22 | 780,000 | 815,629 | |
| 5% 7/1/23 | 830,000 | 900,984 | |
| 5% 7/1/24 | 375,000 | 420,483 | |
| Connecticut Higher Ed. Supplemental Ln. Auth. Rev.: | |||
| (Chesla Ln. Prog.) Series 2017 A, 5% 11/15/22 (b) | 300,000 | 319,913 | |
| (Chesla Loan Prog.) Series B: | |||
| 5% 11/15/22 (b) | 115,000 | 122,199 | |
| 5% 11/15/23 (b) | 425,000 | 466,261 | |
| Series 2017 B: | |||
| 5% 11/15/21 (b) | 655,000 | 668,938 | |
| 5% 11/15/23 (b) | 125,000 | 138,261 | |
| Connecticut Hsg. Fin. Auth.: | |||
| Bonds Series 2019 E, 1.625%, tender 11/15/22 (a) | 2,795,000 | 2,797,644 | |
| Series 2013 B2, 4% 11/15/32 | 20,000 | 20,426 | |
| Series 2021, 0.45% 11/15/25 | 700,000 | 691,793 | |
| Series A2: | |||
| 0.15% 11/15/21 (b) | 550,000 | 550,067 | |
| 0.2% 5/15/22 (b) | 700,000 | 700,243 | |
| 0.25% 11/15/22 (b) | 1,175,000 | 1,175,467 | |
| 0.35% 5/15/23 (b) | 825,000 | 825,268 | |
| 0.4% 11/15/23 (b) | 300,000 | 299,825 | |
| Series C: | |||
| 5% 5/15/23 (b) | 205,000 | 222,554 | |
| 5% 11/15/23 (b) | 710,000 | 784,407 | |
| Connecticut Muni. Elec. Energy Coop. Pwr. Supply Sys. Rev. Series 2012 A, 5% 1/1/23 | 395,000 | 406,047 | |
| Connecticut Spl. Tax Oblig. Trans. Infrastructure Rev.: | |||
| Series 2012 A: | |||
| 5% 1/1/23 | 480,000 | 516,915 | |
| 5% 1/1/24 | 200,000 | 215,083 | |
| Series 2014 B, 5% 9/1/22 | 600,000 | 636,682 | |
| Series 2015 A, 5% 8/1/23 | 460,000 | 507,618 | |
| Series 2016 A, 5% 9/1/21 | 700,000 | 708,541 | |
| Series 2021 C: | |||
| 5% 1/1/23 (c) | 795,000 | 839,446 | |
| 5% 1/1/24 (c) | 215,000 | 236,354 | |
| 5% 1/1/25 (c) | 535,000 | 609,374 | |
| Series A: | |||
| 4% 1/1/23 | 315,000 | 334,253 | |
| 5% 8/1/21 | 300,000 | 302,427 | |
| 5% 1/1/22 | 355,000 | 365,128 | |
| 5% 5/1/22 | 1,480,000 | 1,546,459 | |
| 5% 12/1/23 | 575,000 | 588,944 | |
| Series B: | |||
| 5% 9/1/21 | 200,000 | 202,440 | |
| 5% 10/1/21 | 1,205,000 | 1,224,658 | |
| New Haven Gen. Oblig.: | |||
| Series 2016 A: | |||
| 5% 8/15/21 (Escrowed to Maturity) | 435,000 | 439,347 | |
| 5% 8/15/25 (FSA Insured) | 20,000 | 23,654 | |
| Series B, 5% 2/1/22 | 350,000 | 359,655 | |
| Univ. of Connecticut Gen. Oblig.: | |||
| Series 2016 A, 5% 3/15/22 | 190,000 | 197,247 | |
| Series 2019 A, 5% 11/1/25 | 225,000 | 268,128 | |
| TOTAL CONNECTICUT | 93,073,949 | ||
| Delaware - 0.1% | |||
| Delaware Econ. Dev. Auth. Rev. Bonds (Delmarva Pwr. & Lt. Co. Proj.) Series A, 1.05%, tender 7/1/25 (a) | 565,000 | 576,475 | |
| Delaware Trans. Auth. Grant Series 2020: | |||
| 5% 9/1/22 | 1,250,000 | 1,326,096 | |
| 5% 9/1/23 | 1,400,000 | 1,547,859 | |
| TOTAL DELAWARE | 3,450,430 | ||
| District Of Columbia - 0.6% | |||
| District of Columbia Gen. Oblig. Series 2013 A, 5% 6/1/21 | 200,000 | 200,000 | |
| District of Columbia Hsg. Fin. Agcy. Multi-family Hsg. Rev. Bonds: | |||
| (218 Vine St. Apts. Proj.) Series 2020, 0.3%, tender 7/1/23 (a) | 5,000,000 | 5,014,098 | |
| (Liberty Place Apts. Proj.) Series 2018, 0.5%, tender 12/1/21 (a) | 5,000,000 | 5,005,382 | |
| (Park Southern Apts. Proj.) Series 2020, 0.7%, tender 6/1/23 (a) | 9,000,000 | 9,034,954 | |
| District of Columbia Income Tax Rev.: | |||
| Series 2012 C, 5% 12/1/21 | 275,000 | 281,762 | |
| Series 2017 A T, 5% 10/1/21 | 200,000 | 203,270 | |
| Metropolitan Washington DC Arpts. Auth. Sys. Rev.: | |||
| Series 2010 F1, 5% 10/1/21 | 450,000 | 457,250 | |
| Series 2011 C: | |||
| 5% 10/1/21 (b) | 365,000 | 370,794 | |
| 5% 10/1/22 (b) | 430,000 | 436,805 | |
| 5% 10/1/23 (b) | 140,000 | 142,241 | |
| 5% 10/1/24 (b) | 115,000 | 116,825 | |
| Series 2012 A: | |||
| 5% 10/1/22 (b) | 140,000 | 148,910 | |
| 5% 10/1/23 (b) | 500,000 | 531,752 | |
| Series 2014 A: | |||
| 5% 10/1/21 (b) | 400,000 | 406,349 | |
| 5% 10/1/23 (b) | 110,000 | 122,023 | |
| Series 2017 A: | |||
| 5% 10/1/24 (b) | 115,000 | 132,259 | |
| 5% 10/1/26 (b) | 145,000 | 177,452 | |
| Series 2018 A, 5% 10/1/26 (b) | 325,000 | 397,737 | |
| Series 2019 A: | |||
| 5% 10/1/21 (b) | 130,000 | 132,064 | |
| 5% 10/1/22 (b) | 290,000 | 308,457 | |
| 5% 10/1/23 (b) | 50,000 | 55,465 | |
| 5% 10/1/25 (b) | 155,000 | 184,074 | |
| Series 2020 A: | |||
| 5% 10/1/21 (b) | 1,200,000 | 1,219,048 | |
| 5% 10/1/22 (b) | 1,750,000 | 1,861,376 | |
| 5% 10/1/23 (b) | 925,000 | 1,026,101 | |
| 5% 10/1/24 (b) | 2,575,000 | 2,961,450 | |
| 5% 10/1/25 (b) | 530,000 | 629,414 | |
| Washington D.C. Metropolitan Transit Auth. Rev. Series 2017 A1, 5% 7/1/24 | 1,120,000 | 1,279,346 | |
| TOTAL DISTRICT OF COLUMBIA | 32,836,658 | ||
| Florida - 1.9% | |||
| Brevard County Hsg. Fin. Auth. Bonds Series 2021, 0.25%, tender 12/1/22 (a) | 2,000,000 | 1,998,073 | |
| Brevard County School Board Ctfs. of Prtn.: | |||
| Series 2014, 5% 7/1/21 | 60,000 | 60,236 | |
| Series 2015 C: | |||
| 5% 7/1/21 | 15,000 | 15,059 | |
| 5% 7/1/22 | 80,000 | 84,199 | |
| 5% 7/1/23 | 65,000 | 71,111 | |
| Broward County Arpt. Sys. Rev.: | |||
| Series 2012 P-1, 5% 10/1/22 (b) | 300,000 | 319,010 | |
| Series 2012 P1: | |||
| 5% 10/1/23 (b) | 235,000 | 249,924 | |
| 5% 10/1/25 (b) | 1,000,000 | 1,063,505 | |
| 5% 10/1/26 (Pre-Refunded to 10/1/22 @ 100) (b) | 350,000 | 372,311 | |
| Series 2012 P2, 5% 10/1/22 | 415,000 | 441,585 | |
| Series 2012 Q, 5% 10/1/21 (b) | 320,000 | 325,058 | |
| series 2012 Q1, 5% 10/1/22 | 200,000 | 212,812 | |
| Series 2012 Q2, 5% 10/1/30 (Pre-Refunded to 10/1/22 @ 100) (b) | 200,000 | 212,749 | |
| Series 2013 A: | |||
| 5% 10/1/23 (b) | 300,000 | 331,825 | |
| 5.125% 10/1/38 (Pre-Refunded to 10/1/23 @ 100) (b) | 310,000 | 344,787 | |
| Series 2013 C: | |||
| 5% 10/1/21 | 450,000 | 457,189 | |
| 5.25% 10/1/25 | 575,000 | 641,612 | |
| Series 2015 C, 5% 10/1/24 (b) | 245,000 | 281,067 | |
| Series 2017, 5% 10/1/25 (b) | 500,000 | 591,433 | |
| Series 2019 A, 5% 10/1/21 (b) | 2,185,000 | 2,219,536 | |
| Series 2019 B: | |||
| 5% 10/1/21 (b) | 1,665,000 | 1,691,317 | |
| 5% 10/1/23 (b) | 700,000 | 774,259 | |
| Series A: | |||
| 5% 10/1/22 (b) | 75,000 | 79,752 | |
| 5% 10/1/23 (b) | 90,000 | 99,548 | |
| Broward County Fin. Auth. Multi-family Hsg. Rev. Bonds Series 2019 B, 1.2%, tender 8/1/21 (a) | 4,000,000 | 4,006,594 | |
| Broward County Port Facilities Rev.: | |||
| Series 2011 B: | |||
| 4.625% 9/1/27 (Pre-Refunded to 9/1/21 @ 100) (b) | 475,000 | 480,107 | |
| 5% 9/1/21 (b) | 415,000 | 419,308 | |
| 5% 9/1/21 (Escrowed to Maturity) (b) | 240,000 | 242,803 | |
| Series 2019 D, 5% 9/1/22 (b) | 850,000 | 893,725 | |
| Broward County School Board Ctfs. of Prtn.: | |||
| (Broward County School District Proj.) Series 2017 C, 5% 7/1/22 | 70,000 | 73,706 | |
| Series 2011 A, 5% 7/1/21 | 400,000 | 401,587 | |
| Series 2015 A: | |||
| 5% 7/1/21 | 100,000 | 100,397 | |
| 5% 7/1/22 | 345,000 | 363,263 | |
| 5% 7/1/23 | 180,000 | 197,398 | |
| 5% 7/1/24 | 30,000 | 34,179 | |
| Series 2015 B: | |||
| 5% 7/1/22 | 100,000 | 105,294 | |
| 5% 7/1/23 | 85,000 | 93,216 | |
| 5% 7/1/24 | 25,000 | 28,482 | |
| Series 2016, 5% 7/1/21 | 460,000 | 461,825 | |
| Central Florida Expressway Auth. Sr. Lien Rev.: | |||
| Series 2016 B, 4% 7/1/22 | 215,000 | 223,845 | |
| Series 2019 A, 5% 7/1/21 | 625,000 | 627,423 | |
| Series 2019 B, 5% 7/1/21 | 1,000,000 | 1,003,877 | |
| Series 2021, 5% 7/1/24 (FSA Insured) | 885,000 | 1,010,032 | |
| Citizens Property Ins. Corp. Series 2012 A1: | |||
| 5% 6/1/21 | 2,915,000 | 2,915,000 | |
| 5% 6/1/22 | 1,145,000 | 1,200,981 | |
| Escambia County Poll. Cont. Rev. (Gulf Pwr. Co. Proj.) Series 2003, 2.6% 6/1/23 | 2,500,000 | 2,609,027 | |
| Florida Board of Ed. Lottery Rev.: | |||
| Series 2014 A, 5% 7/1/24 | 200,000 | 220,168 | |
| Series 2019 A, 5% 7/1/21 | 270,000 | 271,069 | |
| Florida Dev. Fin. Corp. Edl. Facilities (Nova Southeastern Univ. Proj.) Series 2020 A: | |||
| 5% 4/1/23 | 350,000 | 378,742 | |
| 5% 4/1/24 | 360,000 | 403,591 | |
| 5% 4/1/25 | 200,000 | 231,389 | |
| Florida Gen. Oblig. Series 2011 A, 5% 7/1/21 | 200,000 | 200,787 | |
| Florida Governmental Util. Auth. Rev. Series 2019, 4% 10/1/21 | 400,000 | 404,948 | |
| Florida Higher Edl. Facilities Fing. Auth. Series 2019, 5% 10/1/21 | 450,000 | 456,307 | |
| Florida Hsg. Fin. Corp. Multi-family Mtg. Rev. Series 2019 A, 2% 8/1/21 | 2,500,000 | 2,507,975 | |
| Florida Hsg. Fin. Corp. Rev. Series 2017: | |||
| 2% 7/1/21 | 195,000 | 195,252 | |
| 2.05% 1/1/22 | 150,000 | 151,352 | |
| Florida Mid-Bay Bridge Auth. Rev. Series 2015 A: | |||
| 5% 10/1/21 | 20,000 | 20,280 | |
| 5% 10/1/22 | 45,000 | 47,522 | |
| 5% 10/1/23 | 55,000 | 60,550 | |
| 5% 10/1/24 | 45,000 | 51,288 | |
| 5% 10/1/25 | 40,000 | 46,996 | |
| 5% 10/1/26 | 45,000 | 52,748 | |
| Florida Muni. Pwr. Agcy. Rev.: | |||
| Series 2015 B, 5% 10/1/21 | 365,000 | 370,732 | |
| Series 2016 A: | |||
| 5% 10/1/21 | 840,000 | 853,192 | |
| 5% 10/1/22 | 325,000 | 345,459 | |
| 5% 10/1/24 | 350,000 | 403,282 | |
| Greater Orlando Aviation Auth. Arpt. Facilities Rev.: | |||
| Series 2011 B, 4% 10/1/22 (b) | 500,000 | 506,312 | |
| Series 2011 C, 5% 10/1/21 | 320,000 | 325,199 | |
| Series 2015 A: | |||
| 4% 10/1/22 (b) | 430,000 | 451,834 | |
| 5% 10/1/23 (b) | 200,000 | 221,860 | |
| Series 2016, 5% 10/1/24 (b) | 285,000 | 326,955 | |
| Series 2017 A: | |||
| 5% 10/1/25 (b) | 85,000 | 100,544 | |
| 5% 10/1/26 (b) | 45,000 | 54,755 | |
| Series 2019 A: | |||
| 5% 10/1/22 (b) | 2,415,000 | 2,569,705 | |
| 5% 10/1/23 (b) | 700,000 | 776,509 | |
| Halifax Hosp. Med. Ctr. Rev. Series 2015, 5% 6/1/23 | 30,000 | 32,701 | |
| Hillsborough Co. Sldwst and Resource Receivables Series 2016 A, 5% 9/1/21 (b) | 195,000 | 197,271 | |
| Hillsborough County Aviation Auth. Rev.: | |||
| Series 2013 A, 5.5% 10/1/24 (b) | 500,000 | 559,704 | |
| Series A: | |||
| 5% 10/1/21 (b) | 990,000 | 1,005,648 | |
| 5% 10/1/25 (b) | 705,000 | 780,312 | |
| Hillsborough County School Board Ctfs. of Prtn. Series 2015 A, 5% 7/1/26 | 230,000 | 271,052 | |
| Hillsborough County School District Sales Tax Rev. Series 2015 B, 5% 10/1/22 (FSA Insured) | 45,000 | 47,820 | |
| Indian River County School Board Ctfs. of Prtn. Series 2014: | |||
| 5% 7/1/22 | 85,000 | 89,328 | |
| 5% 7/1/23 | 175,000 | 190,804 | |
| Jacksonville Elec. Auth. Elec. Sys. Rev.: | |||
| Series 2013 A: | |||
| 5% 10/1/21 | 320,000 | 325,123 | |
| 5% 10/1/21 | 500,000 | 508,005 | |
| Series 2013 B, 5% 10/1/21 | 1,020,000 | 1,036,329 | |
| Series 2013 C, 5% 10/1/22 (Escrowed to Maturity) | 535,000 | 569,476 | |
| Series 2014 A, 5% 10/1/21 | 1,380,000 | 1,402,093 | |
| Lee County School Board Ctfs. Series 2019 A, 5% 8/1/21 | 680,000 | 685,409 | |
| Manatee County Rev. Series 2013, 5% 10/1/22 | 20,000 | 21,301 | |
| Manatee County School District Series 2017: | |||
| 5% 10/1/21 (FSA Insured) | 405,000 | 411,580 | |
| 5% 10/1/24 (FSA Insured) | 30,000 | 34,459 | |
| Miami Dade County Hsg. Multifamily Hsg. Rev. Bonds: | |||
| Series 2020, 1.4%, tender 4/1/22 (a) | 4,000,000 | 4,014,343 | |
| Series 2021, 0.25%, tender 12/1/22 (a) | 3,000,000 | 3,000,768 | |
| Miami-Dade County Aviation Rev.: | |||
| Series 2012 A: | |||
| 5% 10/1/21 (b) | 335,000 | 340,295 | |
| 5% 10/1/22 (b) | 250,000 | 265,842 | |
| 5% 10/1/24 (b) | 200,000 | 212,451 | |
| 5% 10/1/29 (Pre-Refunded to 10/1/22 @ 100) (b) | 210,000 | 223,241 | |
| Series 2014, 5% 10/1/22 (b) | 485,000 | 515,733 | |
| Series 2015 A, 5% 10/1/21 (b) | 255,000 | 259,031 | |
| Series 2016 A, 5% 10/1/23 | 335,000 | 371,615 | |
| Series 2020 A: | |||
| 5% 10/1/23 | 2,435,000 | 2,701,142 | |
| 5% 10/1/25 | 1,255,000 | 1,491,590 | |
| Miami-Dade County Expressway Auth.: | |||
| (Waste Mgmt., Inc. of Florida Proj.) Series 2013 A: | |||
| 5% 7/1/21 | 345,000 | 346,329 | |
| 5% 7/1/22 | 45,000 | 47,286 | |
| 5% 7/1/23 | 45,000 | 47,342 | |
| Series 2014 A, 5% 7/1/21 | 750,000 | 752,889 | |
| Series 2014 B: | |||
| 5% 7/1/22 | 35,000 | 36,778 | |
| 5% 7/1/23 | 70,000 | 76,597 | |
| Miami-Dade County Health Facilities Auth. Hosp. Rev.: | |||
| (Miami Children's Hosp. Proj.) Series 2013, 5% 8/1/21 | 400,000 | 403,121 | |
| Series 2010, 5.25% 8/1/21 | 45,000 | 45,163 | |
| Miami-Dade County Indl. Dev. Auth. Solid Waste Disp. Rev. Bonds: | |||
| (Waste Mgmt. of Florida Proj.) Series 2018, 2.85%, tender 8/2/21 (a)(b) | 3,960,000 | 3,977,204 | |
| Series 2011, 0.55%, tender 11/1/21 (a)(b) | 2,900,000 | 2,903,716 | |
| Miami-Dade County School Board Ctfs. of Prtn.: | |||
| Series 2006 C, 5% 10/1/21 | 630,000 | 640,256 | |
| Series 2014 D: | |||
| 5% 11/1/21 | 560,000 | 571,415 | |
| 5% 11/1/22 | 120,000 | 128,304 | |
| 5% 11/1/23 | 200,000 | 222,132 | |
| Series 2015 A: | |||
| 5% 5/1/22 | 1,210,000 | 1,264,221 | |
| 5% 5/1/23 | 1,075,000 | 1,170,451 | |
| Series 2015 D: | |||
| 5% 2/1/22 | 410,000 | 423,376 | |
| 5% 2/1/23 | 830,000 | 897,144 | |
| Orange County Health Facilities Auth. Series B: | |||
| 5% 10/1/21 | 1,330,000 | 1,350,887 | |
| 5% 10/1/22 | 1,295,000 | 1,376,521 | |
| Orlando & Orange County Expressway Auth. Rev. Series 2012, 5% 7/1/22 | 530,000 | 557,759 | |
| Orlando Utils. Commission Util. Sys. Rev.: | |||
| Series 2011 C, 4% 10/1/21 | 250,000 | 253,235 | |
| Series 2013 A: | |||
| 5% 10/1/21 | 200,000 | 203,249 | |
| 5% 10/1/24 | 250,000 | 288,689 | |
| Palm Beach County Health Facilities Auth. Hosp. Rev.: | |||
| Series 2014: | |||
| 5% 12/1/21 (Escrowed to Maturity) | 35,000 | 35,840 | |
| 5% 12/1/23 (Escrowed to Maturity) | 5,000 | 5,590 | |
| 5% 12/1/24 (Escrowed to Maturity) | 10,000 | 11,611 | |
| Series 2019, 5% 8/15/21 | 425,000 | 429,139 | |
| Palm Beach County School Board Ctfs. of Prtn.: | |||
| (Palm Beach County School District Proj.): | |||
| Series 2018 A, 5% 8/1/21 | 2,000,000 | 2,016,009 | |
| Series 2018 B, 5% 8/1/21 | 1,100,000 | 1,108,805 | |
| Series 2014 B: | |||
| 4% 8/1/21 | 90,000 | 90,573 | |
| 5% 8/1/21 | 115,000 | 115,921 | |
| 5% 8/1/22 | 40,000 | 42,264 | |
| Series 2015 B, 5% 8/1/21 | 205,000 | 206,641 | |
| Series 2018 A, 5% 8/1/23 | 100,000 | 110,260 | |
| Pasco County School Board Ctfs. of Prtn. Bonds Series 2020 B, SIFMA Municipal Swap Index + 0.750% 0.8%, tender 8/2/23 (a)(d) | 5,000,000 | 5,004,601 | |
| Pasco County School District Sales Tax Rev. Series 2013: | |||
| 5% 10/1/21 | 120,000 | 121,909 | |
| 5% 10/1/22 | 20,000 | 21,276 | |
| Pinellas County Hsg. Fin. Auth. Bonds (Lutheran Apts. Proj.) Series 2019 B, 1.25%, tender 8/1/21 (a) | 1,625,000 | 1,627,705 | |
| Seminole County School Board Ctfs. of Prtn.: | |||
| Series 2012 A, 5% 7/1/23 | 120,000 | 131,572 | |
| Series 2016 C: | |||
| 5% 7/1/25 | 20,000 | 23,552 | |
| 5% 7/1/26 | 25,000 | 30,378 | |
| Tallahassee Health Facilities Rev. (Tallahassee Memorial Healthcare, Inc. Proj.) Series 2016 A, 5% 12/1/21 | 65,000 | 66,437 | |
| Tampa Bay Wtr. Reg'l. Wtr. Supply Auth. Util. Sys. Rev. Series 2005, 5.5% 10/1/22 (FGIC Insured) | 30,000 | 32,155 | |
| Tampa Hosp. Rev. (H. Lee Moffitt Cancer Ctr. Proj.) Series 2020 B: | |||
| 5% 7/1/23 | 90,000 | 98,719 | |
| 5% 7/1/24 | 75,000 | 85,447 | |
| 5% 7/1/25 | 100,000 | 117,760 | |
| 5% 7/1/26 | 175,000 | 212,352 | |
| 5% 7/1/27 | 150,000 | 186,807 | |
| Volusia County Edl. Facilities Auth. Rev. (Embry-Riddle Aeronautical Univ., Inc. Proj.) Series 2020 A: | |||
| 4% 10/15/21 | 390,000 | 395,055 | |
| 4% 10/15/22 | 300,000 | 314,357 | |
| 5% 10/15/23 | 590,000 | 652,826 | |
| 5% 10/15/24 | 1,000,000 | 1,146,918 | |
| 5% 10/15/25 | 1,000,000 | 1,184,283 | |
| 5% 10/15/26 | 750,000 | 912,225 | |
| 5% 10/15/27 | 165,000 | 205,796 | |
| TOTAL FLORIDA | 99,730,641 | ||
| Georgia - 1.7% | |||
| Atlanta Arpt. Rev.: | |||
| Series 2012 B, 5% 1/1/23 | 615,000 | 632,310 | |
| Series 2014 B, 5% 1/1/22 | 30,000 | 30,854 | |
| Series 2019 B, 5% 7/1/22 (b) | 845,000 | 887,932 | |
| Series 2019 E, 5% 7/1/21 | 1,415,000 | 1,420,579 | |
| Atlanta Urban Residential Fin. Auth. Bonds (Herndon Square Sr. Apts. Proj.) Series 2019, 1.36%, tender 12/1/21 (a) | 3,195,000 | 3,215,275 | |
| Atlanta Urban Residential Fin. Auth. Multi-family Hsg. Rev. Bonds (Parkside Proj.) Series 2019 B, 1.38%, tender 1/1/22 (a) | 4,685,000 | 4,714,782 | |
| Bartow County Dev. Auth. Poll. Cont. Rev. Bonds (Georgia Pwr. Co. Plant Bowen Proj.): | |||
| Series 2009 1st, 2.75%, tender 3/15/23 (a) | 2,800,000 | 2,918,516 | |
| Series 2013, 1.55%, tender 8/19/22 (a) | 2,370,000 | 2,406,156 | |
| Brookhaven Dev. Auth. Rev. Series 2019 A: | |||
| 5% 7/1/22 | 1,000,000 | 1,052,712 | |
| 5% 7/1/25 | 100,000 | 118,382 | |
| Burke County Indl. Dev. Auth. Poll. Cont. Rev. Bonds: | |||
| (Georgia Pwr. Co. Plant Vogtle Proj.): | |||
| Series 1994, 2.25%, tender 5/25/23 (a) | 1,700,000 | 1,761,126 | |
| Series 1995 5, 2.05%, tender 11/19/21 (a) | 375,000 | 378,057 | |
| Series 2008, 1.65%, tender 6/18/21 (a) | 1,140,000 | 1,140,688 | |
| Series 2012 1st, 1.55%, tender 8/19/22 (a) | 2,000,000 | 2,030,511 | |
| Series 2013 1st, 2.925%, tender 3/12/24 (a) | 990,000 | 1,055,905 | |
| (Oglethorpe Pwr. Corp. Vogtle Proj.) Series 2017 E, 3.25%, tender 2/3/25 (a) | 100,000 | 108,734 | |
| Cobb County Kennestone Hosp. Auth. Rev. (WellStar Health Sys., Inc. Proj.): | |||
| Series 2020 A: | |||
| 5% 4/1/22 | 150,000 | 155,916 | |
| 5% 4/1/23 | 150,000 | 162,923 | |
| Series 2020 B, 5% 4/1/22 | 1,120,000 | 1,164,172 | |
| Fayette County Hosp. Auth. Rev. Bonds (Piedmont Healthcare, Inc. Proj.) Series 2019 A, 5%, tender 7/1/24 (a) | 750,000 | 837,303 | |
| Fulton County Dev. Auth. Rev. Series 2019 C: | |||
| 5% 7/1/21 | 1,000,000 | 1,003,934 | |
| 5% 7/1/22 | 1,000,000 | 1,052,712 | |
| 5% 7/1/23 | 1,300,000 | 1,429,657 | |
| Georgia Gen. Oblig.: | |||
| Series 2014 A, 5% 2/1/22 | 200,000 | 206,539 | |
| Series 2017 C, 5% 7/1/21 | 200,000 | 200,795 | |
| Georgia Muni. Elec. Auth. Pwr. Rev.: | |||
| Series 2012 A, 5% 11/1/21 | 435,000 | 443,609 | |
| Series 2016 A: | |||
| 5% 1/1/22 | 595,000 | 611,338 | |
| 5% 1/1/23 | 410,000 | 439,903 | |
| Series 2019 A, 5% 1/1/22 | 1,620,000 | 1,664,482 | |
| Series 2020 A: | |||
| 3% 11/1/21 | 1,300,000 | 1,314,978 | |
| 3% 11/1/22 | 1,045,000 | 1,085,066 | |
| 4% 11/1/23 | 2,780,000 | 3,025,830 | |
| 4% 11/1/24 | 200,000 | 223,700 | |
| 4% 11/1/25 | 800,000 | 916,661 | |
| 5% 1/1/22 | 1,905,000 | 1,957,308 | |
| 5% 1/1/23 | 5,625,000 | 6,035,252 | |
| 5% 1/1/24 | 2,105,000 | 2,348,877 | |
| 5% 1/1/24 | 1,250,000 | 1,394,820 | |
| 5% 11/1/26 | 870,000 | 1,065,645 | |
| Series C, 5% 1/1/22 | 1,200,000 | 1,232,950 | |
| Georgia Muni. Gas Auth. Rev. (Gas Portfolio III Proj.): | |||
| Series 2014 U: | |||
| 5% 10/1/22 | 20,000 | 21,273 | |
| 5% 10/1/23 | 55,000 | 61,052 | |
| Series R, 5% 10/1/21 | 110,000 | 111,746 | |
| Georgia Road & Thruway Auth. Rev. Series 2020, 5% 6/1/24 | 2,000,000 | 2,280,810 | |
| Main Street Natural Gas, Inc.: | |||
| Bonds: | |||
| Series 2018 A, 4%, tender 9/1/23 (a) | 1,000,000 | 1,077,797 | |
| Series 2018 B, 1 month U.S. LIBOR + 0.750% 0.824%, tender 9/1/23 (a)(d) | 12,200,000 | 12,265,812 | |
| Series 2018 C, 4%, tender 12/1/23 (a) | 3,055,000 | 3,315,630 | |
| Series 2018 E, SIFMA Municipal Swap Index + 0.570% 0.62%, tender 12/1/23 (a)(d) | 12,500,000 | 12,551,055 | |
| Series 2019 B, 4%, tender 12/2/24 (a) | 1,210,000 | 1,351,707 | |
| Series 2018 A, 4% 3/1/23 | 200,000 | 213,268 | |
| Series 2019 A: | |||
| 5% 5/15/22 | 1,000,000 | 1,044,646 | |
| 5% 5/15/23 | 1,750,000 | 1,907,026 | |
| Series 2019 C, 5% 9/1/21 | 285,000 | 288,275 | |
| Monroe County Dev. Auth. Poll. Cont. Rev.: | |||
| (Georgia Pwr. Co. Plant Scherer Proj.) Series 1995, 2.25% 7/1/25 | 435,000 | 447,651 | |
| Bonds: | |||
| (Georgia Pwr. Co. Plant Scherer Proj.) Series 2009 1, 2.05%, tender 11/19/21 (a) | 825,000 | 831,726 | |
| (Oglethorpe Pwr. Corp. Scherer Proj.) Series 2013 A, 1.5%, tender 2/3/25 (a) | 1,500,000 | 1,536,330 | |
| TOTAL GEORGIA | 93,152,693 | ||
| Hawaii - 0.2% | |||
| Hawaii Dept. of Budget & Fin. Spl. Purp. Rev. (Queens Health Sys. Proj.) Series 2015 B, SIFMA Municipal Swap Index + 0.140% 0.5%, tender 7/1/39 (a)(d) | 545,000 | 545,000 | |
| Hawaii Gen. Oblig.: | |||
| Series 2012 EE, 5% 11/1/21 | 410,000 | 418,340 | |
| Series 2015 EY, 5% 10/1/21 | 200,000 | 203,249 | |
| Series 2017 FN, 5% 10/1/21 | 305,000 | 309,955 | |
| Series 2020 A: | |||
| 5% 7/1/24 (b) | 250,000 | 283,094 | |
| 5% 7/1/25 (b) | 350,000 | 409,226 | |
| Series FE, 5% 10/1/21 | 400,000 | 406,498 | |
| Series GA, 5% 10/1/21 | 5,000,000 | 5,081,231 | |
| Honolulu City & County Gen. Oblig. Series 2015 B, 5% 10/1/21 | 200,000 | 203,249 | |
| State of Hawaii Dept. of Trans. Series 2013: | |||
| 5% 8/1/21 (b) | 10,000 | 10,069 | |
| 5% 8/1/21 (FSA Insured) (b) | 300,000 | 302,140 | |
| 5% 8/1/22 (b) | 45,000 | 47,163 | |
| 5% 8/1/23 (b) | 30,000 | 32,968 | |
| 5.25% 8/1/24 (b) | 890,000 | 981,211 | |
| TOTAL HAWAII | 9,233,393 | ||
| Idaho - 0.0% | |||
| Idaho Health Facilities Auth. Rev. Series 2015 ID, 5% 12/1/21 | 250,000 | 256,058 | |
| Idaho Hsg. & Fin. Assoc. Single Family Mtg.: | |||
| (Idaho St Garvee Proj.) Series 2017 A, 5% 7/15/21 | 230,000 | 231,322 | |
| Series 2019 A, 4% 1/1/50 | 50,000 | 55,497 | |
| TOTAL IDAHO | 542,877 | ||
| Illinois - 3.0% | |||
| Chicago Board of Ed.: | |||
| Series 1999, 0% 12/1/22 (Berkshire Hathaway Assurance Corp. Insured) (FGIC Insured) | 560,000 | 556,541 | |
| Series 2019 A, 5% 12/1/23 | 1,000,000 | 1,100,253 | |
| Series 2021 B, 5% 12/1/21 | 400,000 | 409,155 | |
| Chicago Gen. Oblig. Series 2020 A, 5% 1/1/25 | 1,500,000 | 1,712,117 | |
| Chicago Midway Arpt. Rev.: | |||
| Series 2013 B: | |||
| 5% 1/1/22 | 1,010,000 | 1,038,154 | |
| 5% 1/1/23 | 205,000 | 220,358 | |
| Series 2014 A: | |||
| 5% 1/1/22 (b) | 2,865,000 | 2,944,009 | |
| 5% 1/1/24 (b) | 1,000,000 | 1,115,308 | |
| 5% 1/1/26 (b) | 525,000 | 584,101 | |
| Series 2014 B, 5% 1/1/23 | 225,000 | 241,856 | |
| Series 2016 A, 5% 1/1/24 (b) | 1,000,000 | 1,115,308 | |
| Chicago Motor Fuel Tax Rev. Series 2013: | |||
| 5% 1/1/22 | 5,000 | 5,064 | |
| 5% 1/1/23 | 10,000 | 10,403 | |
| Chicago O'Hare Int'l. Arpt. Rev.: | |||
| Series 2012 A: | |||
| 5% 1/1/23 (Pre-Refunded to 1/1/22 @ 100) (b) | 1,000,000 | 1,027,418 | |
| 5% 1/1/25 (Pre-Refunded to 1/1/22 @ 100) (b) | 500,000 | 513,709 | |
| Series 2012 B: | |||
| 5% 1/1/22 (b) | 1,875,000 | 1,926,707 | |
| 5% 1/1/22 (Escrowed to Maturity) (b) | 1,000,000 | 1,027,418 | |
| Series 2013 A: | |||
| 5% 1/1/22 (Escrowed to Maturity) (b) | 1,400,000 | 1,438,385 | |
| 5% 1/1/23 (b) | 1,440,000 | 1,546,690 | |
| Series 2013 B: | |||
| 5% 1/1/22 (Escrowed to Maturity) | 135,000 | 138,822 | |
| 5% 1/1/23 | 1,020,000 | 1,096,416 | |
| Series 2013 C, 5% 1/1/22 (Escrowed to Maturity) (b) | 700,000 | 719,193 | |
| Series 2013 D, 5% 1/1/22 (Escrowed to Maturity) | 70,000 | 71,982 | |
| Series 2015 B, 5% 1/1/23 | 475,000 | 510,586 | |
| Series 2015 D, 5% 1/1/22 (Escrowed to Maturity) | 510,000 | 524,439 | |
| Series 2016 A: | |||
| 5% 1/1/23 (b) | 250,000 | 268,523 | |
| 5% 1/1/24 (b) | 305,000 | 340,169 | |
| Series 2016 D, 5% 1/1/22 | 300,000 | 308,363 | |
| Series 2017 C, 5% 1/1/22 | 110,000 | 113,066 | |
| Series 2017 D: | |||
| 5% 1/1/24 (b) | 1,000,000 | 1,115,308 | |
| 5% 1/1/27 (b) | 85,000 | 103,966 | |
| Chicago Transit Auth. Cap. Grant Receipts Rev. Series 2017: | |||
| 5% 6/1/21 | 635,000 | 635,000 | |
| 5% 6/1/25 | 25,000 | 29,209 | |
| Chicago Wastewtr. Transmission Rev. Series 2012, 5% 1/1/23 | 25,000 | 25,686 | |
| Cook County Cmnty. Consolidated School District No. 59 Series 2020, 4% 3/1/22 | 480,000 | 493,966 | |
| Cook County Gen. Oblig.: | |||
| Series 2011 A, 5.25% 11/15/22 | 20,000 | 20,460 | |
| Series 2012 C: | |||
| 5% 11/15/21 | 120,000 | 122,631 | |
| 5% 11/15/22 | 590,000 | 631,397 | |
| 5% 11/15/23 | 385,000 | 411,363 | |
| Series 2014 A: | |||
| 5% 11/15/21 | 35,000 | 35,767 | |
| 5% 11/15/22 | 375,000 | 401,312 | |
| Series 2016 A, 5% 11/15/21 | 2,250,000 | 2,299,339 | |
| Series 2021 A: | |||
| 3% 11/15/21 | 1,000,000 | 1,012,880 | |
| 5% 11/15/22 | 10,200,000 | 10,915,679 | |
| 5% 11/15/23 | 4,550,000 | 5,070,546 | |
| 5% 11/15/24 | 50,000 | 57,673 | |
| 5% 11/15/25 | 50,000 | 59,414 | |
| Illinois Dev. Fin. Auth. Retirement Hsg. Regency Park Rev. Series 1991 A, 0% 7/15/23 (Escrowed to Maturity) | 300,000 | 297,785 | |
| Illinois Dev. Fin. Auth. Solid Waste Disp. Rev. Bonds (Waste Mgmt., Inc. Proj.) Series 2019, 0.55%, tender 11/1/21 (a)(b) | 6,000,000 | 6,007,688 | |
| Illinois Fin. Auth.: | |||
| Bonds Series 2020 B, 5%, tender 11/15/24 (a) | 1,450,000 | 1,641,154 | |
| Series 2013 A: | |||
| 5% 6/1/23 | 540,000 | 591,920 | |
| 5% 6/1/23 (Escrowed to Maturity) | 55,000 | 60,225 | |
| Series 2020 A: | |||
| 5% 8/15/21 | 1,000,000 | 1,009,862 | |
| 5% 8/15/22 | 750,000 | 793,766 | |
| Series 2021 A, 5% 10/1/25 (c) | 2,000,000 | 2,367,067 | |
| Illinois Fin. Auth. Rev.: | |||
| (Bradley Univ. Proj.) Series 2017 C, 5% 8/1/26 | 35,000 | 40,867 | |
| (Edward-Elmhurst Healthcare) Series 2017 A, 5% 1/1/25 | 100,000 | 115,153 | |
| Bonds: | |||
| Series 2017 B, 5%, tender 12/15/22 (a) | 265,000 | 284,457 | |
| Series E, 2.25%, tender 4/29/22 (a) | 770,000 | 784,743 | |
| Series 2011 IL, 5% 12/1/22 (Pre-Refunded to 12/1/21 @ 100) | 25,000 | 25,613 | |
| Series 2012 A: | |||
| 5% 10/1/21 | 200,000 | 203,195 | |
| 5% 5/15/22 | 250,000 | 261,309 | |
| 5% 5/15/23 (Pre-Refunded to 5/15/22 @ 100) | 30,000 | 31,391 | |
| Series 2012: | |||
| 5% 9/1/21 | 45,000 | 45,545 | |
| 5% 9/1/22 | 75,000 | 79,566 | |
| Series 2014 A, 5.25% 7/1/44 (Pre-Refunded to 7/1/23 @ 100) | 3,000,000 | 3,311,735 | |
| Series 2014, 5% 8/1/22 | 1,000,000 | 1,056,611 | |
| Series 2015 A: | |||
| 5% 11/15/22 | 10,000 | 10,694 | |
| 5% 11/15/22 | 1,000,000 | 1,068,647 | |
| 5% 11/15/24 | 35,000 | 40,410 | |
| 5% 11/15/25 | 45,000 | 53,669 | |
| 5% 11/15/26 | 45,000 | 53,234 | |
| Series 2015 B, 5% 11/15/24 | 45,000 | 51,822 | |
| Series 2016 A: | |||
| 5% 8/15/21 (Escrowed to Maturity) | 15,000 | 15,147 | |
| 5% 2/15/23 | 20,000 | 21,641 | |
| 5% 8/15/23 (Escrowed to Maturity) | 35,000 | 38,658 | |
| 5% 8/15/24 (Escrowed to Maturity) | 50,000 | 57,381 | |
| 5% 7/1/25 | 250,000 | 296,067 | |
| Series 2016 C: | |||
| 5% 2/15/22 | 225,000 | 232,754 | |
| 5% 2/15/23 | 700,000 | 757,926 | |
| 5% 2/15/24 | 115,000 | 129,803 | |
| Series 2016: | |||
| 5% 12/1/21 | 5,000,000 | 5,116,845 | |
| 5% 7/1/22 | 65,000 | 68,434 | |
| 5% 11/15/23 | 235,000 | 261,456 | |
| 5% 5/15/25 | 10,000 | 11,736 | |
| 5% 12/1/25 | 325,000 | 386,726 | |
| 5% 5/15/26 | 20,000 | 24,200 | |
| 5% 5/15/27 | 25,000 | 30,135 | |
| Series 2017 A, 5% 7/15/21 | 700,000 | 704,092 | |
| Series 2017: | |||
| 5% 1/1/23 | 35,000 | 37,692 | |
| 5% 1/1/25 | 50,000 | 58,253 | |
| Series 2018 A, 5% 5/15/24 | 250,000 | 283,589 | |
| Series 2019: | |||
| 5% 9/1/22 | 225,000 | 237,862 | |
| 5% 4/1/26 | 1,000,000 | 1,198,228 | |
| Illinois Gen. Oblig.: | |||
| Series 2006, 5% 6/1/21 | 405,000 | 405,000 | |
| Series 2012 A, 4% 1/1/23 | 30,000 | 30,623 | |
| Series 2012: | |||
| 4% 9/1/22 | 200,000 | 208,999 | |
| 5% 8/1/21 | 55,000 | 55,429 | |
| 5% 3/1/22 | 400,000 | 413,958 | |
| 5% 8/1/22 | 1,760,000 | 1,854,543 | |
| 5% 8/1/22 (FSA Insured) | 2,800,000 | 2,952,842 | |
| Series 2013 A, 5% 4/1/24 | 795,000 | 862,062 | |
| Series 2013: | |||
| 5% 7/1/21 | 3,270,000 | 3,282,550 | |
| 5% 7/1/22 | 375,000 | 393,747 | |
| 5.5% 7/1/24 | 835,000 | 920,944 | |
| Series 2014: | |||
| 5% 2/1/22 | 65,000 | 67,020 | |
| 5% 4/1/23 | 50,000 | 54,163 | |
| 5% 2/1/25 | 50,000 | 55,749 | |
| Series 2016: | |||
| 5% 11/1/21 | 1,505,000 | 1,534,423 | |
| 5% 1/1/22 | 1,650,000 | 1,694,945 | |
| 5% 2/1/24 | 450,000 | 503,460 | |
| 5% 1/1/26 | 300,000 | 355,937 | |
| 5% 2/1/26 | 1,235,000 | 1,467,593 | |
| Series 2017 A: | |||
| 5% 12/1/22 | 5,000,000 | 5,342,600 | |
| 5% 12/1/23 | 750,000 | 833,901 | |
| Series 2017 D, 5% 11/1/21 | 2,180,000 | 2,222,527 | |
| Series 2018 A: | |||
| 5% 10/1/21 | 1,500,000 | 1,523,471 | |
| 5% 10/1/26 | 1,340,000 | 1,614,450 | |
| 5.25% 5/1/22 | 1,660,000 | 1,734,303 | |
| Series 2018 B, 5% 10/1/21 | 700,000 | 710,953 | |
| Series 2020 May, 5.125% 5/1/22 | 275,000 | 286,996 | |
| Series 2021 A: | |||
| 5% 3/1/22 | 1,655,000 | 1,712,752 | |
| 5% 3/1/23 | 380,000 | 410,228 | |
| 5% 3/1/24 | 2,000,000 | 2,244,483 | |
| Series 2021 B: | |||
| 5% 3/1/22 | 1,860,000 | 1,924,905 | |
| 5% 3/1/23 | 670,000 | 723,299 | |
| Illinois Health Facilities Auth. Rev. Series 2003, 1.6% 11/15/22 | 315,000 | 318,481 | |
| Illinois Hsg. Dev. Auth. Multi-family Hsg. Rev. Bonds Series 2020, 0.325%, tender 8/1/22 (a) | 12,250,000 | 12,269,128 | |
| Illinois Muni. Elec. Agcy. Pwr. Supply Series 2015 A: | |||
| 5% 2/1/22 | 1,270,000 | 1,309,178 | |
| 5% 2/1/23 | 25,000 | 26,909 | |
| Illinois Reg'l. Trans. Auth.: | |||
| Series 1999, 5.75% 6/1/21 (FSA Insured) | 650,000 | 650,000 | |
| Series 2002 A, 6% 7/1/21 | 460,000 | 462,161 | |
| Series 2017 A, 5% 7/1/21 | 210,000 | 210,818 | |
| Illinois Sales Tax Rev.: | |||
| Series 2013, 5% 6/15/24 | 400,000 | 434,286 | |
| Series 2016 D, 5% 6/15/23 | 1,500,000 | 1,620,727 | |
| Illinois State Univ. Revs. Series 2018 A, 5% 4/1/23 (FSA Insured) | 290,000 | 314,372 | |
| Illinois Toll Hwy. Auth. Toll Hwy. Rev.: | |||
| Series 2014 A: | |||
| 5% 12/1/21 | 1,165,000 | 1,192,876 | |
| 5% 12/1/22 | 1,090,000 | 1,168,276 | |
| Series 2018 A, 5% 1/1/25 | 485,000 | 562,605 | |
| Kane County School District #129, Aurora West Side Series 2014 A, 2.75% 2/1/22 | 1,000,000 | 1,014,063 | |
| Kane County School District No. 131: | |||
| Series 2020 A: | |||
| 3% 12/1/21 (FSA Insured) | 355,000 | 359,432 | |
| 4% 12/1/22 (FSA Insured) | 235,000 | 246,840 | |
| 5% 12/1/23 (FSA Insured) | 290,000 | 320,905 | |
| Series 2020 B: | |||
| 3% 12/1/21 (FSA Insured) | 510,000 | 516,367 | |
| 4% 12/1/22 (FSA Insured) | 435,000 | 456,916 | |
| Kane, Cook, DuPage, McHenry & DeKalb Counties Cmnty. College District #509 Elgin Series 2021 B: | |||
| 4% 12/15/23 | 155,000 | 169,674 | |
| 4% 12/15/24 | 450,000 | 506,807 | |
| Kendall, Kane & Will Counties Cmnty. Unit School District #308: | |||
| Series 2008, 0% 2/1/22 (FSA Insured) | 265,000 | 264,012 | |
| Series 2011, 5.5% 2/1/23 | 550,000 | 593,675 | |
| Lake County Cmnty. Consolidated School District Series 2020, 4% 2/1/22 (FSA Insured) | 310,000 | 317,615 | |
| McHenry County Cmnty. School District #200 Series 2006 B: | |||
| 0% 1/15/24 (Pre-Refunded to 1/15/24 @ 100) | 105,000 | 102,582 | |
| 0% 1/15/25 | 110,000 | 105,673 | |
| 0% 1/15/26 | 80,000 | 75,437 | |
| McHenry County Conservation District Gen. Oblig. Series 2014, 5% 2/1/23 | 65,000 | 70,031 | |
| Metropolitan Pier & Exposition: | |||
| (McCormick Place Expansion Proj.) Series 1996 A, 0% 6/15/23 (Nat'l. Pub. Fin. Guarantee Corp. Insured) | 150,000 | 147,193 | |
| Series 1994, 0% 6/15/21 (Escrowed to Maturity) | 470,000 | 469,946 | |
| Series 2012 B, 5% 12/15/22 | 1,655,000 | 1,764,288 | |
| Northern Illinois Univ. Revs. Series 2020 B, 5% 4/1/22 (Build America Mutual Assurance Insured) | 250,000 | 259,774 | |
| Peoria County Gen. Oblig. Series 2021 A: | |||
| 4% 1/1/22 | 150,000 | 153,285 | |
| 4% 1/1/24 | 1,000,000 | 1,092,133 | |
| Railsplitter Tobacco Settlement Auth. Rev.: | |||
| Series 2010: | |||
| 5.25% 6/1/21 | 500,000 | 500,000 | |
| 5.375% 6/1/21 | 310,000 | 310,000 | |
| Series 2017: | |||
| 5% 6/1/22 | 2,320,000 | 2,428,403 | |
| 5% 6/1/23 | 2,470,000 | 2,698,113 | |
| Skokie Pk District Series 2003, 0% 12/1/22 | 1,830,000 | 1,809,758 | |
| Southern Illinois Univ. Rev. Series 2021 A, 4% 4/1/22 (c) | 650,000 | 670,025 | |
| Univ. of Illinois Board of Trustees Ctfs. of Prtn. Series 2014 C, 5% 3/15/23 | 265,000 | 286,989 | |
| Univ. of Illinois Rev.: | |||
| Series 2011, 5% 4/1/22 | 350,000 | 351,193 | |
| Series 2016 A, 5% 4/1/22 | 245,000 | 254,600 | |
| Series 2018 A, 5% 4/1/22 | 1,000,000 | 1,039,182 | |
| Series 2018 B, 5% 4/1/23 (FSA Insured) | 270,000 | 292,950 | |
| Series 2019 A, 5% 4/1/22 | 485,000 | 504,003 | |
| Village of Westchester Gen. Oblig. Series 2021, 4% 12/1/22 | 500,000 | 527,583 | |
| Waukegan Gen. Oblig.: | |||
| Series 2018 A: | |||
| 4% 12/30/21 (FSA Insured) | 410,000 | 418,766 | |
| 4% 12/30/22 (FSA Insured) | 425,000 | 448,640 | |
| Series 2018 B, 4% 12/30/22 (FSA Insured) | 400,000 | 422,249 | |
| Western Illinois Univ. Board Rev. Series 2020, 4% 4/1/22 | 1,200,000 | 1,236,969 | |
| Whiteside & Lee Counties Cmnty. Unit School District Series 2018 A, 4% 12/1/21 | 1,325,000 | 1,349,117 | |
| TOTAL ILLINOIS | 159,816,722 | ||
| Indiana - 0.8% | |||
| Fort Wayne Cmnty. Schools Bldg. Corp. Series 2021: | |||
| 4% 7/15/22 (c) | 575,000 | 598,961 | |
| 4% 1/15/23 (c) | 625,000 | 662,532 | |
| Hammond Loc Pub. Impt. Bd Bank Series 2021 A, 2% 12/31/21 | 1,170,000 | 1,178,220 | |
| Indiana Dev. Fin. Auth. Solid Waste Disp. Rev. Bonds (Waste Mgmt., Inc. Proj.) Series 2001, 2.95%, tender 10/1/21 (a)(b) | 500,000 | 504,474 | |
| Indiana Fin. Auth. Health Sys. Rev. Bonds Series 2019 B, 2.25%, tender 7/1/25 (a) | 710,000 | 752,841 | |
| Indiana Fin. Auth. Hosp. Rev.: | |||
| (Cmnty. Health Network Proj.) Series 2012 A, 5% 5/1/42 (Pre-Refunded to 5/1/23 @ 100) | 2,000,000 | 2,186,523 | |
| Bonds: | |||
| Series 2011 H, 1.65%, tender 7/1/22 (a) | 3,300,000 | 3,329,099 | |
| Series 2011 L: | |||
| SIFMA Municipal Swap Index + 0.280% 0.33%, tender 6/3/21 (a)(d) | 3,300,000 | 3,300,008 | |
| SIFMA Municipal Swap Index + 0.280% 0.33%, tender 6/3/21 (a)(d) | 3,500,000 | 3,500,009 | |
| Series 2015 B, 1.65%, tender 7/2/22 (a) | 1,290,000 | 1,301,375 | |
| Series 2013: | |||
| 5% 8/15/22 | 15,000 | 15,873 | |
| 5% 8/15/23 | 20,000 | 22,073 | |
| Series 2016 A, 5% 12/1/21 | 200,000 | 204,847 | |
| Indiana Fin. Auth. Rev.: | |||
| (Butler Univ. Proj.) Series 2019: | |||
| 3% 2/1/22 | 210,000 | 213,512 | |
| 3% 2/1/23 | 225,000 | 234,151 | |
| 4% 2/1/24 | 200,000 | 217,354 | |
| 4% 2/1/25 | 275,000 | 306,421 | |
| (Citizens Energy Group Proj.) Series 2016 A, 4% 10/1/21 | 305,000 | 308,947 | |
| (DePauw Univ. Proj.) Series 2019: | |||
| 5% 7/1/21 | 565,000 | 567,050 | |
| 5% 7/1/22 | 600,000 | 629,143 | |
| Series 2016, 5% 9/1/26 | 205,000 | 249,228 | |
| Indiana Fin. Auth. Wastewtr. Util. Rev.: | |||
| (CWA Auth. Proj.): | |||
| Series 2011 A, 5.25% 10/1/22 | 215,000 | 218,667 | |
| Series 2012 A, 5% 10/1/22 | 35,000 | 37,286 | |
| Series 2014 A: | |||
| 5% 10/1/21 | 10,000 | 10,162 | |
| 5% 10/1/22 | 15,000 | 15,973 | |
| Series 2015 A: | |||
| 5% 10/1/24 | 35,000 | 40,442 | |
| 5% 10/1/25 | 35,000 | 40,378 | |
| Series 2021 A, 3% 10/1/21 | 285,000 | 287,756 | |
| Indiana Health Facility Fing. Auth. Rev. Bonds Series 2001 A2, 2%, tender 2/1/23 (a) | 155,000 | 159,288 | |
| Indiana Muni. Pwr. Agcy. Pwr. Supply Sys. Rev. Series 2017 A, 5% 1/1/25 | 705,000 | 816,989 | |
| Indiana Univ. Student Fee Revs. Series Z1, 3% 8/1/21 | 1,895,000 | 1,904,087 | |
| Indianapolis Local Pub. Impt.: | |||
| (Indianapolis Arpt. Auth. Proj.): | |||
| Series 2016 A1: | |||
| 5% 1/1/23 (b) | 45,000 | 48,252 | |
| 5% 1/1/24 (b) | 60,000 | 67,001 | |
| 5% 1/1/25 (b) | 65,000 | 75,200 | |
| Series 2019 D, 5% 1/1/24 (b) | 150,000 | 167,502 | |
| Series 2021 A: | |||
| 5% 6/1/22 | 1,265,000 | 1,325,020 | |
| 5% 6/1/23 | 255,000 | 278,765 | |
| Indianapolis Multifamily Hsg. Rev. Bonds Series A, 1.4%, tender 9/1/21 (a) | 4,000,000 | 4,012,022 | |
| Lake Central Multi-District School Bldg. Corp. Series 2012 B, 5% 7/15/21 | 20,000 | 20,113 | |
| Marion High School Bldg. Corp.: | |||
| Series 2021 A: | |||
| 4% 1/15/24 | 240,000 | 262,151 | |
| 4% 1/15/25 | 250,000 | 280,466 | |
| 4% 7/15/25 | 255,000 | 289,634 | |
| Series 2021 B, 4% 1/15/23 | 205,000 | 217,143 | |
| Purdue Univ. Rev.: | |||
| Series 2012 AA, 5% 7/1/27 | 255,000 | 267,785 | |
| Series CC, 5% 7/1/21 | 850,000 | 853,365 | |
| Vinton Tecumseh School Bldg. Corp. Series 2021: | |||
| 3% 1/15/24 | 490,000 | 522,215 | |
| 3% 7/15/25 | 515,000 | 564,270 | |
| Warrick County Envir. Impt. Rev. Bonds (Southern Indiana Gas and Elec. Co.) Series 2015, 0.875%, tender 9/1/23 (a)(b) | 2,800,000 | 2,802,677 | |
| Whiting Envir. Facilities Rev. Bonds (BP Products North America, Inc. Proj.): | |||
| Series 2015, 5%, tender 11/1/22 (a)(b) | 1,780,000 | 1,900,043 | |
| Series 2016 A, 5%, tender 3/1/23 (a)(b) | 3,400,000 | 3,677,004 | |
| Series 2019 A, 5%, tender 6/5/26 (a)(b) | 1,645,000 | 1,993,431 | |
| TOTAL INDIANA | 43,437,728 | ||
| Iowa - 0.1% | |||
| Iowa Fin. Auth. Rev. Series 2018 B: | |||
| 5% 2/15/22 | 540,000 | 558,336 | |
| 5% 2/15/24 | 200,000 | 224,933 | |
| Iowa Fin. Auth. Solid Waste Facilities Bonds (Gevo NW Iowa RNG, LLC Renewable Natural Gas Proj.) Series 2021, 1.5%, tender 4/1/24, LOC Citibank NA (a)(b) | 1,500,000 | 1,516,722 | |
| Iowa Higher Ed. Ln. Auth. Rev. (Grinnell College Proj.) Series 2017, 4% 12/1/24 | 250,000 | 281,170 | |
| Iowa Student Ln. Liquidity Corp. Student Ln. Rev.: | |||
| Series 2015 A, 5% 12/1/21 (b) | 1,000,000 | 1,023,471 | |
| Series 2018 A: | |||
| 5% 12/1/21 (b) | 500,000 | 511,481 | |
| 5% 12/1/22 (b) | 725,000 | 773,668 | |
| Series 2019 B, 5% 12/1/23 (b) | 600,000 | 667,107 | |
| TOTAL IOWA | 5,556,888 | ||
| Kansas - 0.1% | |||
| Desoto Unified School District # 232 Series 2015 A, 5% 9/1/22 | 35,000 | 37,131 | |
| Kansas Dept. of Trans. Hwy. Rev. Series 2004 C1, 1 month U.S. LIBOR + 0.300% 0.377% 9/1/21 (a)(d) | 5,000,000 | 5,003,703 | |
| Wyandotte County/Kansas City Unified Govt. Util. Sys. Rev. Series 2016 A: | |||
| 5% 9/1/22 | 10,000 | 10,582 | |
| 5% 9/1/23 | 15,000 | 16,541 | |
| 5% 9/1/25 | 15,000 | 17,732 | |
| TOTAL KANSAS | 5,085,689 | ||
| Kentucky - 1.3% | |||
| Ashland Med. Ctr. Rev.: | |||
| (Ashland Hosp. Corp. D/B/A King's Daughters Med. Ctr. Proj.) Series 2016 A: | |||
| 5% 2/1/24 | 30,000 | 32,768 | |
| 5% 2/1/25 | 20,000 | 22,405 | |
| Series 2019, 5% 2/1/22 | 500,000 | 512,203 | |
| Carroll County Envir. Facilities Rev. Bonds (Kentucky Utils. Co. Proj.) Series 2008 A, 1.2%, tender 6/1/21 (a)(b) | 1,025,000 | 1,025,000 | |
| Kenton County Arpt. Board Arpt. Rev. Series 2016, 5% 1/1/22 | 285,000 | 292,809 | |
| Kentucky Asset/Liability Commission Agcy. Fund Rev. Series A, 5% 9/1/22 | 2,000,000 | 2,118,634 | |
| Kentucky Asset/Liability Commission Gen. Fund Rev. Series 2021 A, 5% 11/1/24 | 435,000 | 499,179 | |
| Kentucky Bond Dev. Corp. (Lexington Ctr. Corp. Proj.) Series 2018 A, 5% 9/1/21 (Escrowed to Maturity) | 435,000 | 440,245 | |
| Kentucky Bond Dev. Corp. Edl. Facilities: | |||
| (Transylvania Univ. Proj.) Series 2021 A, 2% 3/1/23 | 320,000 | 326,566 | |
| (Transylvania Univ. Proj.) Series 2021 A, 4% 3/1/25 | 340,000 | 376,650 | |
| Kentucky Econ. Dev. Fin. Auth. Bonds Series 2009 B, 2.7%, tender 11/10/21 (a) | 720,000 | 727,445 | |
| Kentucky Econ. Dev. Fin. Auth. Hosp. Rev. Series 2017 A, 5% 6/1/21 | 230,000 | 230,000 | |
| Kentucky Econ. Dev. Fin. Auth. Solid Waste Disp. Rev. Bonds (Republic Svcs., Inc. Proj.) Series A, 0.2%, tender 6/1/21 (a)(b) | 2,420,000 | 2,420,000 | |
| Kentucky Higher Ed. Student Ln. Corp. Rev.: | |||
| Series 2019 A1 5% 6/1/23 (b) | 250,000 | 271,360 | |
| Series 2019 A1, 5% 6/1/22 (b) | 200,000 | 208,852 | |
| Kentucky Hsg. Corp. Multi-family Rev. Bonds (City View Park Proj.) Series 2020, 1.16%, tender 8/1/22 (a) | 4,000,000 | 4,027,509 | |
| Kentucky Rural Wtr. Fin. Corp. Series 2020 E, 0.425% 12/1/21 | 3,000,000 | 3,000,242 | |
| Kentucky State Property & Buildings Commission Rev.: | |||
| (Kentucky St Proj.) Series 2005 5% 8/1/21 (Nat'l. Pub. Fin. Guarantee Corp. Insured) | 3,050,000 | 3,074,311 | |
| Series 2002, 5.5% 8/1/21 (AMBAC Insured) | 770,000 | 776,768 | |
| Series 2005, 5% 8/1/22 (Nat'l. Pub. Fin. Guarantee Corp. Insured) | 250,000 | 264,122 | |
| Series 2016 B, 5% 11/1/23 | 2,580,000 | 2,872,783 | |
| Series 2016: | |||
| 3% 2/1/24 | 350,000 | 373,066 | |
| 5% 11/1/23 | 810,000 | 901,920 | |
| 5% 2/1/24 | 275,000 | 308,828 | |
| 5% 10/1/24 | 325,000 | 374,009 | |
| Series 2017: | |||
| 5% 4/1/22 | 400,000 | 416,153 | |
| 5% 4/1/23 | 600,000 | 652,967 | |
| 5% 4/1/24 | 900,000 | 1,017,120 | |
| Series 2018: | |||
| 5% 5/1/22 | 385,000 | 402,106 | |
| 5% 5/1/23 | 1,415,000 | 1,545,494 | |
| Series A: | |||
| 5% 8/1/21 | 1,025,000 | 1,033,170 | |
| 5% 10/1/21 | 765,000 | 777,299 | |
| 5% 11/1/21 | 350,000 | 357,045 | |
| 5% 2/1/22 | 350,000 | 361,299 | |
| 5% 8/1/22 | 905,000 | 912,202 | |
| 5% 11/1/22 | 610,000 | 651,761 | |
| 5% 11/1/25 | 350,000 | 416,751 | |
| Series B: | |||
| 5% 11/1/21 | 975,000 | 994,626 | |
| 5% 8/1/22 | 4,660,000 | 4,923,242 | |
| 5% 8/1/23 | 2,945,000 | 3,246,481 | |
| Series C, 5% 11/1/21 | 2,875,000 | 2,932,873 | |
| Kentucky, Inc. Pub. Energy: | |||
| Bonds Series 2019 A1, 4%, tender 6/1/25 (a) | 1,000,000 | 1,124,354 | |
| Series 2018 B, 4% 7/1/21 | 1,350,000 | 1,354,036 | |
| Series A: | |||
| 4% 6/1/21 | 270,000 | 270,000 | |
| 4% 12/1/22 | 350,000 | 369,145 | |
| Louisville & Jefferson County: | |||
| Bonds: | |||
| Series 2020 B, 5%, tender 10/1/23 (a) | 840,000 | 929,963 | |
| Series 2020 C, 5%, tender 10/1/26 (a) | 2,015,000 | 2,459,138 | |
| Series 2016 A, 5% 10/1/22 | 200,000 | 212,618 | |
| Louisville & Jefferson County Gen. Oblig. Series 2020 A, 5% 10/1/24 | 2,005,000 | 2,315,284 | |
| Louisville Reg'l. Arpt. Auth. Sys. Rev. Series 2014 A: | |||
| 5% 7/1/21 (b) | 1,250,000 | 1,254,485 | |
| 5% 7/1/23 (b) | 1,750,000 | 1,914,923 | |
| 5% 7/1/24 (b) | 155,000 | 176,028 | |
| Louisville/Jefferson County Metropolitan Gov. Series 2012 A: | |||
| 5% 12/1/28 (Pre-Refunded to 6/1/22 @ 100) | 55,000 | 57,634 | |
| 5% 12/1/29 (Pre-Refunded to 6/1/22 @ 100) | 230,000 | 241,017 | |
| Louisville/Jefferson County Metropolitan Govt. Poll. Cont. Rev. Bonds (Louisville Gas and Elec. Co. Proj.): | |||
| Series 2007 A, 1.65%, tender 6/1/21 (a) | 7,250,000 | 7,250,000 | |
| Series 2007 B, 1.65%, tender 6/1/21 (a) | 2,000,000 | 2,000,000 | |
| Paducah Elec. Plant Board Rev. Series 2019, 5% 10/1/22 | 2,005,000 | 2,124,559 | |
| Trimble County Poll. Cont. Rev. Bonds (Louisville Gas and Elec. Co. Proj.) Series 2001 A, 2.3%, tender 9/1/21 (a) | 600,000 | 603,082 | |
| Univ. Louisville Revs. Series 2016 C, 3% 9/1/21 | 780,000 | 785,309 | |
| TOTAL KENTUCKY | 71,559,838 | ||
| Louisiana - 0.3% | |||
| Louisiana Citizens Property Ins. Corp. Assessment Rev. Series 2015: | |||
| 5% 6/1/21 (FSA Insured) | 1,770,000 | 1,770,000 | |
| 5% 6/1/22 (FSA Insured) | 900,000 | 944,002 | |
| Louisiana Gen. Oblig.: | |||
| Series 2012 C, 5% 7/15/21 | 240,000 | 241,400 | |
| Series 2015 A, 5% 5/1/24 | 350,000 | 397,989 | |
| Series 2016 D, 5% 9/1/24 | 155,000 | 178,448 | |
| Louisiana Local Govt. Envir. Facilities and Cmnty. Dev. Auth. Bonds (East Baton Rouge Sewerage Commission Proj.) Series 2020 B, 0.875%, tender 2/1/25 (a) | 4,000,000 | 4,006,796 | |
| Louisiana Offshore Term. Auth. Deepwater Port Rev. Bonds Series 2010 B-1A, 2%, tender 10/1/22 (a) | 815,000 | 821,636 | |
| Louisiana Pub. Facilities Auth. Rev. Series 2018 D, 5% 7/1/21 | 200,000 | 200,774 | |
| Louisiana Stadium and Exposition District Series 2013 A: | |||
| 5% 7/1/21 | 35,000 | 35,131 | |
| 5% 7/1/22 | 20,000 | 21,000 | |
| New Orleans Aviation Board Rev.: | |||
| (North Term. Proj.): | |||
| Series 2015 B, 5% 1/1/25 (b) | 150,000 | 172,960 | |
| Series 2017 B: | |||
| 5% 1/1/22 (b) | 280,000 | 287,255 | |
| 5% 1/1/23 (b) | 1,070,000 | 1,144,337 | |
| 5% 1/1/24 (b) | 20,000 | 22,306 | |
| 5% 1/1/25 (b) | 5,000 | 5,765 | |
| 5% 1/1/26 (b) | 15,000 | 17,842 | |
| Series 2017 D2: | |||
| 5% 1/1/22 (b) | 345,000 | 353,940 | |
| 5% 1/1/23 (b) | 10,000 | 10,695 | |
| 5% 1/1/24 (b) | 15,000 | 16,730 | |
| 5% 1/1/25 (b) | 115,000 | 132,603 | |
| St. John Baptist Parish Rev. Bonds (Marathon Oil Corp.) Series 2017, 2%, tender 4/1/23 (a) | 4,780,000 | 4,884,887 | |
| St. Tammany Parish Hosp. Svc. (St. Tammany Parish Hosp. Proj.) Series 2011, 4.5% 7/1/21 (Escrowed to Maturity) | 600,000 | 602,066 | |
| State of Louisiana Grant Anticipation Rev. Series 2021: | |||
| 5% 9/1/23 (c) | 865,000 | 958,214 | |
| 5% 9/1/24 (c) | 785,000 | 903,754 | |
| Tobacco Settlement Fing. Corp. Series 2013 A, 5% 5/15/23 | 110,000 | 120,353 | |
| TOTAL LOUISIANA | 18,250,883 | ||
| Maine - 0.0% | |||
| Maine Fin. Auth. Student Ln. Rev. Series 2019 A, 5% 12/1/23 (FSA Insured) (b) | 500,000 | 553,943 | |
| Maine Health & Higher Edl. Facilities Auth. Rev.: | |||
| Series 2017 B, 4% 7/1/21 | 85,000 | 85,258 | |
| Series 2020 A, 4% 7/1/22 | 425,000 | 442,247 | |
| Maine Tpk. Auth. Tpk. Rev. Series 2015: | |||
| 5% 7/1/21 | 50,000 | 50,196 | |
| 5% 7/1/22 | 40,000 | 42,104 | |
| 5% 7/1/24 | 630,000 | 719,632 | |
| 5% 7/1/26 | 250,000 | 295,399 | |
| TOTAL MAINE | 2,188,779 | ||
| Maryland - 0.5% | |||
| Baltimore County Gen. Oblig. Series 2020, 4% 1/1/22 | 830,000 | 846,556 | |
| Baltimore Proj. Rev.: | |||
| (Wtr. Proj.) Series 2020 A: | |||
| 5% 7/1/23 | 400,000 | 439,983 | |
| 5% 7/1/24 | 635,000 | 726,608 | |
| Series 2017 D: | |||
| 5% 7/1/24 | 70,000 | 80,099 | |
| 5% 7/1/25 | 75,000 | 88,787 | |
| Howard County Gen. Oblig. Series A: | |||
| 5% 8/15/21 | 100,000 | 100,997 | |
| 5% 8/15/22 | 1,000,000 | 1,058,856 | |
| Maryland Cmnty. Dev. Admin Dept. Hsg. & Cmnty. Dev.: | |||
| Series 2019 B, 4% 9/1/49 | 245,000 | 271,655 | |
| Series 2020 C, 0.625% 7/1/22 | 500,000 | 500,950 | |
| Series 2021 A, 0.83% 5/1/23 (e) | 4,000,000 | 3,999,890 | |
| Series A: | |||
| 0.2% 3/1/23 | 1,015,000 | 1,013,682 | |
| 0.25% 9/1/23 | 775,000 | 773,061 | |
| Maryland Health & Higher Edl.: | |||
| Bonds Series 2020, 5%, tender 7/1/25 (a) | 1,000,000 | 1,152,683 | |
| Series 2020: | |||
| 4% 7/1/21 | 1,065,000 | 1,067,843 | |
| 4% 1/1/22 | 200,000 | 203,848 | |
| Maryland Health & Higher Edl. Facilities Auth. Rev.: | |||
| Series 2012 B, 5% 7/1/21 | 240,000 | 240,948 | |
| Series 2015: | |||
| 5% 7/1/22 | 20,000 | 21,018 | |
| 5% 7/1/23 | 20,000 | 21,937 | |
| 5% 7/1/24 | 45,000 | 51,283 | |
| 5% 7/1/25 | 40,000 | 47,157 | |
| 5% 7/1/25 (Pre-Refunded to 7/1/24 @ 100) | 1,145,000 | 1,309,890 | |
| Series 2019 A, 5% 10/1/21 | 380,000 | 385,916 | |
| Series 2020 A: | |||
| 3% 7/1/21 | 210,000 | 210,457 | |
| 4% 7/1/22 | 100,000 | 103,992 | |
| Series 2020 B, 5% 4/15/23 | 675,000 | 735,962 | |
| Maryland Trans. Auth. Trans. Facility Projs. Rev.: | |||
| Series 2020, 5% 7/1/22 | 1,500,000 | 1,580,246 | |
| Series 2021 A, 5% 7/1/24 | 1,250,000 | 1,431,163 | |
| Montgomery County Gen. Oblig. Bonds Series 2013 MD, 0.1%, tender 6/1/21 (a) | 8,200,000 | 8,200,000 | |
| TOTAL MARYLAND | 26,665,467 | ||
| Massachusetts - 1.1% | |||
| Boston Hsg. Auth. Cap. Prog. Series 2020 B: | |||
| 5% 4/1/23 | 450,000 | 489,725 | |
| 5% 4/1/24 | 475,000 | 537,389 | |
| Massachusetts Bay Trans. Auth. Sales Tax Rev.: | |||
| Series 2016 A, 0% 7/1/23 | 355,000 | 352,762 | |
| Series B: | |||
| 5% 7/1/21 | 780,000 | 783,082 | |
| 5% 7/1/22 | 900,000 | 947,642 | |
| Massachusetts Dept. of Trans. Metropolitan Hwy. Sys. Rev. Bonds Series 2019 A, 5%, tender 1/1/23 (a) | 3,130,000 | 3,366,964 | |
| Massachusetts Dev. Fin. Agcy. Rev.: | |||
| Bonds Series S3, SIFMA Municipal Swap Index + 0.500% 0.55%, tender 1/26/23 (a)(d) | 3,400,000 | 3,413,261 | |
| Series 2015 C, 5% 10/1/22 | 200,000 | 212,479 | |
| Series 2015 H1, 5% 7/1/22 | 250,000 | 262,898 | |
| Series 2016 A, 5% 7/15/22 | 30,000 | 31,662 | |
| Series 2016 I: | |||
| 5% 7/1/21 | 10,000 | 10,037 | |
| 5% 7/1/22 | 410,000 | 430,418 | |
| 5% 7/1/23 | 15,000 | 16,384 | |
| 5% 7/1/24 | 25,000 | 28,326 | |
| 5% 7/1/25 | 20,000 | 23,402 | |
| 5% 7/1/26 | 20,000 | 24,102 | |
| Series 2019 A: | |||
| 5% 7/1/21 | 200,000 | 200,744 | |
| 5% 7/1/22 | 450,000 | 472,410 | |
| 5% 7/1/24 | 155,000 | 175,620 | |
| Series 2019 O: | |||
| 5% 12/1/23 | 130,000 | 144,746 | |
| 5% 12/1/24 | 100,000 | 115,296 | |
| Series 2021 T, 5% 7/1/21 | 695,000 | 697,746 | |
| Series C: | |||
| 5% 10/1/21 (FSA Insured) | 250,000 | 253,892 | |
| 5% 10/1/22 (FSA Insured) | 275,000 | 292,159 | |
| 5% 10/1/23 (FSA Insured) | 350,000 | 385,665 | |
| 5% 10/1/24 (FSA Insured) | 325,000 | 370,641 | |
| Series Q, 5% 7/1/22 | 250,000 | 263,262 | |
| Series U, 5% 7/1/21 | 345,000 | 346,366 | |
| Massachusetts Edl. Fing. Auth. Rev.: | |||
| Series 2011 J, 5.125% 7/1/22 (b) | 2,080,000 | 2,088,145 | |
| Series 2014: | |||
| 5% 1/1/23 (b) | 3,000,000 | 3,221,279 | |
| 5% 1/1/24 (b) | 5,000,000 | 5,580,651 | |
| Series 2015 A: | |||
| 5% 1/1/22 (b) | 600,000 | 616,761 | |
| 5% 1/1/23 (b) | 9,000,000 | 9,663,836 | |
| 5% 1/1/24 (b) | 8,250,000 | 9,208,073 | |
| Series 2016 J: | |||
| 5% 7/1/21 (b) | 1,465,000 | 1,470,583 | |
| 5% 7/1/22 (b) | 1,475,000 | 1,551,427 | |
| 5% 7/1/23 (b) | 725,000 | 794,120 | |
| Series 2016, 5% 7/1/24 (b) | 350,000 | 397,829 | |
| Series 2020 C, 5% 7/1/23 (b) | 375,000 | 410,752 | |
| Massachusetts Gen. Oblig. Bonds Series D2, 1.7%, tender 8/1/22 (a) | 530,000 | 538,614 | |
| Massachusetts Health & Edl. Facilities Auth. Rev.: | |||
| (Partners Healthcare Sys., Inc. Proj.) Series 2007 G2, 0.18%, tender 6/4/21 (FSA Insured) (a) | 4,050,000 | 4,050,000 | |
| Bonds Series I, 0.7%, tender 7/1/25 (a) | 395,000 | 396,725 | |
| Series 2010 A, 5% 10/1/21 | 250,000 | 253,994 | |
| Massachusetts Port Auth. Rev.: | |||
| Series 2015 A, 5% 7/1/21 (Escrowed to Maturity) | 365,000 | 366,434 | |
| Series 2017 A: | |||
| 5% 7/1/21 (Escrowed to Maturity) (b) | 1,800,000 | 1,806,923 | |
| 5% 7/1/24 (b) | 65,000 | 74,076 | |
| 5% 7/1/25 (b) | 25,000 | 29,462 | |
| Series 2019 C, 5% 7/1/24 (b) | 345,000 | 393,170 | |
| Series 2021 E, 5% 7/1/23 (b) | 500,000 | 548,767 | |
| Massachusetts Wtr. Resources Auth. Wtr. & Swr. Rev.: | |||
| Series 2002, 5.5% 8/1/21 | 200,000 | 201,775 | |
| Series 2014 F, 5% 8/1/21 | 330,000 | 332,658 | |
| TOTAL MASSACHUSETTS | 58,645,134 | ||
| Michigan - 1.2% | |||
| Armada Area Schools Series 2014, 4% 5/1/22 | 305,000 | 315,767 | |
| Brandon School District Series A, 5% 5/1/23 | 430,000 | 468,787 | |
| Carman-Ainsworth Cmnty. School District Series 2021, 4% 5/1/24 | 1,335,000 | 1,467,438 | |
| Chippewa Valley Schools Series 2016 B, 5% 5/1/24 | 200,000 | 227,360 | |
| Clarkston Cmnty. Schools Series 2015, 5% 5/1/22 | 35,000 | 36,522 | |
| Dearborn School District Series 2017, 5% 5/1/22 | 250,000 | 261,226 | |
| Detroit Downtown Dev. Auth. Tax: | |||
| Series 1, 5% 7/1/22 (FSA Insured) | 500,000 | 525,683 | |
| Series A, 5% 7/1/25 (FSA Insured) | 550,000 | 622,808 | |
| Grand Blanc Cmnty. Schools Series 2013, 5% 5/1/22 | 40,000 | 41,781 | |
| Grand Rapids Pub. Schools Series 2017, 5% 5/1/23 (FSA Insured) | 30,000 | 32,712 | |
| Grosse Ile Township School District Unltd. Tax Gen. Oblig. Series 2016, 2% 5/1/24 | 125,000 | 130,408 | |
| Huron School District Series 2019, 5% 5/1/24 | 205,000 | 232,723 | |
| Kalamazoo Hosp. Fin. Auth. Hosp. Facilities Rev. Series 2016: | |||
| 5% 5/15/22 | 20,000 | 20,905 | |
| 5% 5/15/24 | 10,000 | 11,359 | |
| 5% 5/15/25 | 15,000 | 17,629 | |
| 5% 5/15/26 | 15,000 | 18,183 | |
| Kent City Cmnty. Schools Series 2020, 4% 5/1/23 | 205,000 | 219,458 | |
| Kent Hosp. Fin. Auth. Hosp. Facilities Rev. (Spectrum Health Sys. Proj.) Series 2015 A, SIFMA Municipal Swap Index + 0.250% 0.3%, tender 12/24/21 (a)(d) | 1,000,000 | 1,000,000 | |
| Lake Superior State Univ. Series 2021, 4% 11/15/22 (FSA Insured) (c) | 305,000 | 319,035 | |
| Michigan Bldg. Auth. Rev. (Facilities Prog.) Series 2016 I, 5% 4/15/24 | 60,000 | 68,091 | |
| Michigan Fin. Auth. Rev.: | |||
| (Detroit Wtr. and Sewage Dept. Wtr. Supply Sys. Rev. Rfdg. Local Proj.): | |||
| Series 2014 C3, 5% 7/1/22 (FSA Insured) | 1,155,000 | 1,215,105 | |
| Series 2014 D1, 5% 7/1/22 (FSA Insured) | 2,845,000 | 2,993,050 | |
| (Trinity Health Proj.) Series 2017, 5% 12/1/23 | 250,000 | 279,288 | |
| Bonds: | |||
| Series 2013 M1, 0.1%, tender 6/1/21 (a) | 7,500,000 | 7,500,000 | |
| Series 2016 E1, 4%, tender 8/15/24 (a) | 275,000 | 306,956 | |
| Series 2016 MI2, SIFMA Municipal Swap Index + 0.480% 0.53%, tender 6/3/21 (a)(d) | 5,000,000 | 5,002,129 | |
| Series 2019 B, 3.5%, tender 11/15/22 (a) | 5,750,000 | 5,995,098 | |
| Series 2019 MI2, 5%, tender 2/1/25 (a) | 1,605,000 | 1,865,781 | |
| Series 2012: | |||
| 4% 11/15/21 | 400,000 | 406,888 | |
| 5% 11/1/22 | 350,000 | 373,651 | |
| Series 2015 A: | |||
| 5% 8/1/22 | 1,380,000 | 1,456,954 | |
| 5% 8/1/23 | 530,000 | 583,770 | |
| Series 2015 D1: | |||
| 0.25% 10/15/22 | 500,000 | 500,279 | |
| 0.4% 10/15/23 | 650,000 | 649,464 | |
| 0.55% 10/15/24 | 300,000 | 299,704 | |
| 0.75% 10/15/25 | 250,000 | 250,331 | |
| Series 2015 MI: | |||
| 5% 12/1/22 | 600,000 | 643,558 | |
| 5% 12/1/24 | 100,000 | 115,899 | |
| Series 2015, 5% 11/15/21 | 585,000 | 597,720 | |
| Series 2016: | |||
| 5% 11/15/22 | 715,000 | 764,516 | |
| 5% 11/15/23 | 225,000 | 250,859 | |
| Series 2020 A: | |||
| 4% 6/1/22 | 1,000,000 | 1,036,980 | |
| 5% 6/1/24 | 1,000,000 | 1,139,340 | |
| Michigan Gen. Oblig. Series 2016: | |||
| 5% 3/15/22 | 50,000 | 51,879 | |
| 5% 3/15/23 | 85,000 | 92,149 | |
| Michigan Hosp. Fin. Auth. Rev.: | |||
| Bonds: | |||
| (Ascension Health Cr. Group Proj.) Series F5, 2.4%, tender 3/15/23 (a) | 80,000 | 83,119 | |
| Series 2010 F1, 4%, tender 6/1/23 (a) | 200,000 | 215,307 | |
| Series 2005 A4, 5% 11/1/21 | 3,805,000 | 3,881,594 | |
| Series 2008 C, 5% 12/1/21 | 500,000 | 512,117 | |
| Michigan State Univ. Revs.: | |||
| Series 2015 A, 5% 8/15/21 | 380,000 | 383,756 | |
| Series 2020 A, 5% 8/15/21 | 200,000 | 201,977 | |
| Michigan Strategic Fund Ltd. Oblig. Rev.: | |||
| Bonds: | |||
| Series 2008 ET2, 1.45%, tender 9/1/21 (a) | 2,700,000 | 2,708,200 | |
| Series CC, 1.45%, tender 9/1/21 (a) | 380,000 | 381,154 | |
| Series 2019, 4% 11/15/22 | 730,000 | 754,948 | |
| Michigan Trunk Line Fund Rev.: | |||
| Series 2005, 5.5% 11/1/21 (FSA Insured) | 465,000 | 475,441 | |
| Series 2020 A, 5% 11/15/21 | 1,500,000 | 1,533,449 | |
| Northern Michigan Univ. Revs. Series 2018 A, 5% 12/1/22 | 700,000 | 750,050 | |
| Novi Cmnty. School District Series I, 4% 5/1/23 | 550,000 | 590,108 | |
| Oakland Univ. Rev. Series 2016, 5% 3/1/22 | 385,000 | 398,810 | |
| Portage Pub. Schools Series 2016: | |||
| 5% 5/1/23 | 45,000 | 48,779 | |
| 5% 11/1/23 | 30,000 | 33,151 | |
| 5% 5/1/24 | 40,000 | 44,999 | |
| 5% 11/1/24 | 45,000 | 51,475 | |
| 5% 5/1/25 | 25,000 | 29,049 | |
| 5% 11/1/25 | 25,000 | 29,493 | |
| 5% 11/1/28 | 20,000 | 24,237 | |
| Rockford Pub. Schools Gen. Oblig. Series 2019 I, 4% 5/1/22 | 285,000 | 295,061 | |
| Roseville Cmnty. Schools Series 2014, 5% 5/1/23 | 300,000 | 326,758 | |
| Royal Oak Hosp. Fin. Auth. Hosp. Rev. Series 2014 D: | |||
| 5% 9/1/21 | 285,000 | 288,384 | |
| 5% 9/1/23 | 10,000 | 11,051 | |
| Saginaw Hosp. Fin. Auth. Hosp. Rev. Series 2020 J: | |||
| 5% 7/1/21 | 285,000 | 286,102 | |
| 5% 7/1/22 | 455,000 | 478,576 | |
| 5% 7/1/23 | 250,000 | 273,889 | |
| Warren Consolidated School District Series 2019, 4% 5/1/23 | 230,000 | 246,451 | |
| Wayne County Arpt. Auth. Rev.: | |||
| Series 2011 A: | |||
| 4.125% 12/1/22 (FSA Insured) (b) | 530,000 | 539,946 | |
| 5% 12/1/21 (b) | 8,505,000 | 8,705,049 | |
| 5% 12/1/22 (b) | 250,000 | 255,777 | |
| Series 2012 B, 5% 12/1/22 (b) | 485,000 | 518,692 | |
| Series 2017 B, 5% 12/1/21 (b) | 300,000 | 306,874 | |
| Wayne State Univ. Revs. Series 2015 A, 5% 11/15/21 | 310,000 | 316,812 | |
| Wayne-Westland Cmnty. Schools Series 2019, 5% 11/1/24 | 335,000 | 387,258 | |
| TOTAL MICHIGAN | 66,777,116 | ||
| Minnesota - 0.3% | |||
| Maple Grove Health Care Sys. Rev. Series 2017: | |||
| 4% 5/1/22 | 110,000 | 113,615 | |
| 5% 5/1/23 | 110,000 | 119,568 | |
| Minneapolis & Saint Paul Hsg. & Redev. Auth. Health Care Sys. Rev.: | |||
| (Allina Health Sys. Proj.) Series 2017 A, 5% 11/15/23 | 355,000 | 396,078 | |
| Series 2017 A, 5% 11/15/21 | 325,000 | 332,142 | |
| Minneapolis & Saint Paul Metropolitan Arpts. Commission Arpt. Rev.: | |||
| Series 2014 A: | |||
| 5% 1/1/22 | 20,000 | 20,555 | |
| 5% 1/1/23 | 20,000 | 21,492 | |
| Series 2014 B: | |||
| 5% 1/1/22 (b) | 45,000 | 46,225 | |
| 5% 1/1/23 (b) | 20,000 | 21,462 | |
| Series 2016 B: | |||
| 4% 1/1/23 | 300,000 | 317,648 | |
| 5% 1/1/22 | 985,000 | 1,012,340 | |
| Series 2016 C, 5% 1/1/22 | 485,000 | 498,635 | |
| Series 2016, 5% 1/1/25 | 620,000 | 719,926 | |
| Series 2019 B, 5% 1/1/22 (b) | 3,000,000 | 3,081,660 | |
| Series 2019 C, 5% 1/1/26 | 380,000 | 454,458 | |
| Minneapolis Multi-family Rev. Bonds Series 2019, 1.55%, tender 11/1/21 (a) | 4,050,000 | 4,072,047 | |
| Minnesota Hsg. Fin. Agcy.: | |||
| Bonds Series 2018 D, SIFMA Municipal Swap Index + 0.430% 0.48%, tender 7/3/23 (a)(d) | 3,000,000 | 3,008,001 | |
| Series 2021 A: | |||
| 0.25% 1/1/22 (b) | 200,000 | 200,019 | |
| 0.3% 7/1/22 (b) | 200,000 | 200,071 | |
| 0.4% 1/1/23 (b) | 200,000 | 200,165 | |
| 0.5% 7/1/23 (b) | 200,000 | 200,314 | |
| 0.625% 1/1/24 (b) | 400,000 | 400,796 | |
| Series H: | |||
| 0.55% 1/1/23 (b) | 195,000 | 195,529 | |
| 0.65% 1/1/24 (b) | 200,000 | 200,629 | |
| Moorhead Edl. Facilities Rev. (The Concordia College Corp. Proj.) Series 2016, 5% 12/1/25 | 65,000 | 72,884 | |
| Northern Muni. Pwr. Agcy. Elec. Sys. Rev. Series 2017: | |||
| 5% 1/1/22 | 25,000 | 25,688 | |
| 5% 1/1/23 | 250,000 | 268,481 | |
| 5% 1/1/24 | 35,000 | 39,113 | |
| Rochester Health Care Facilities Rev. Bonds (Mayo Foundation Proj.) Series C, 4.5%, tender 11/15/21 (a) | 1,905,000 | 1,941,424 | |
| Southern Minnesota Muni. Pwr. Agcy. Pwr. Supply Sys. Rev. Series 1994 A, 0% 1/1/24 (Nat'l. Pub. Fin. Guarantee Corp. Insured) | 290,000 | 284,545 | |
| Western Minnesota Muni. Pwr. Agcy. Pwr. Supply Rev. Series 2014 A: | |||
| 5% 1/1/22 | 20,000 | 20,565 | |
| 5% 1/1/23 | 65,000 | 69,891 | |
| 5% 1/1/24 | 20,000 | 22,416 | |
| TOTAL MINNESOTA | 18,578,382 | ||
| Mississippi - 0.1% | |||
| Jackson Gen. Oblig. Series 2021: | |||
| 5% 3/1/22 | 325,000 | 336,258 | |
| 5% 3/1/23 | 325,000 | 350,678 | |
| 5% 3/1/24 | 500,000 | 563,290 | |
| Mississippi Bus. Fin. Corp. Solid Waste Disp. Rev. Bonds (Waste Mgmt., Inc. Proj.) Series 2004, 0.55%, tender 9/1/21 (a)(b) | 1,700,000 | 1,701,301 | |
| Mississippi Dev. Bank Spl. Obl (Jackson Mississippi Sales Tax Rev. Infrastructure Proj.) Series 2020, 5% 9/1/24 | 740,000 | 840,090 | |
| Mississippi Hosp. Equip. & Facilities Auth.: | |||
| (Forrest County Gen. Hosp. Rfdg. Proj.) Series 2019 B, 5% 1/1/22 | 350,000 | 359,652 | |
| Bonds Series 2020 A2, 0.65%, tender 9/1/21 (a) | 300,000 | 300,066 | |
| Series I, 5% 10/1/22 | 420,000 | 446,730 | |
| TOTAL MISSISSIPPI | 4,898,065 | ||
| Missouri - 0.5% | |||
| Cape Girardeau County Indl. Dev. Auth. (Southeast Hosp. Proj.) Series 2017 A: | |||
| 5% 3/1/22 | 15,000 | 15,480 | |
| 5% 3/1/23 | 20,000 | 21,474 | |
| 5% 3/1/24 | 15,000 | 16,693 | |
| 5% 3/1/25 | 15,000 | 17,226 | |
| 5% 3/1/26 | 20,000 | 23,630 | |
| Missouri Health & Edl. Facilities Rev.: | |||
| Bonds Series 2021 B, 4%, tender 5/1/26 (a) | 9,000,000 | 10,467,104 | |
| Series 2014 A, 5% 6/1/24 | 710,000 | 806,716 | |
| Series 2020: | |||
| 5% 11/15/21 | 520,000 | 531,306 | |
| 5% 11/15/22 | 660,000 | 705,808 | |
| 5% 11/15/23 | 815,000 | 907,390 | |
| Missouri Hsg. Dev. Commission Single Family Mtg. Rev. Series 2019, 4% 5/1/50 | 65,000 | 72,419 | |
| Missouri State Pub. Util. Commn Rev. Series 2020, 0.5% 3/1/22 | 5,000,000 | 5,004,777 | |
| Ozarks Technical Cmnty. College Series 2021: | |||
| 5% 3/1/23 | 225,000 | 243,395 | |
| 5% 3/1/25 | 225,000 | 261,646 | |
| Saint Louis Arpt. Rev.: | |||
| Series 2017 A: | |||
| 5% 7/1/22 (FSA Insured) | 920,000 | 967,772 | |
| 5% 7/1/23 (FSA Insured) | 1,160,000 | 1,274,416 | |
| Series 2017 B: | |||
| 5% 7/1/21 (FSA Insured) (b) | 400,000 | 401,501 | |
| 5% 7/1/22 (FSA Insured) (b) | 500,000 | 525,124 | |
| Series 2019 B: | |||
| 5% 7/1/21 (b) | 350,000 | 351,285 | |
| 5% 7/1/22 (b) | 365,000 | 382,932 | |
| 5% 7/1/23 (b) | 385,000 | 421,283 | |
| 5% 7/1/24 (b) | 400,000 | 454,266 | |
| 5% 7/1/25 (b) | 420,000 | 491,994 | |
| Series 2019 C, 5% 7/1/25 | 660,000 | 778,094 | |
| Saint Louis Muni. Fin. Corp. Leasehold Rev. Series 2017 B, 4% 6/1/21 (FSA Insured) | 320,000 | 320,000 | |
| TOTAL MISSOURI | 25,463,731 | ||
| Montana - 0.0% | |||
| Montana Board Hsg. Single Family: | |||
| Series 2019 B, 4% 6/1/50 | 30,000 | 34,029 | |
| Series A1, 3.5% 6/1/50 | 465,000 | 512,845 | |
| Montana Facility Fin. Auth. Rev. Series 2019 A, 5% 1/1/22 | 430,000 | 442,114 | |
| TOTAL MONTANA | 988,988 | ||
| Nebraska - 0.3% | |||
| Central Plains Energy Proj. Gas Supply: | |||
| Bonds Series 2019, 4%, tender 8/1/25 (a) | 1,170,000 | 1,330,968 | |
| Series 2019: | |||
| 4% 8/1/21 | 1,500,000 | 1,509,349 | |
| 4% 2/1/22 | 1,465,000 | 1,501,880 | |
| 4% 8/1/23 | 580,000 | 626,604 | |
| Douglas County Hosp. Auth. #2 Health Facilities Rev. Series 2020: | |||
| 5% 11/15/21 | 100,000 | 102,174 | |
| 5% 11/15/22 | 130,000 | 139,023 | |
| Gretna Ctfs. Prtn. Series 2021, 4% 12/15/25 | 2,620,000 | 2,941,344 | |
| Nebraska Invt. Fin. Auth. Single Family Hsg. Rev. Series 2019 B, 4% 9/1/49 (b) | 150,000 | 164,646 | |
| Nebraska Pub. Pwr. District Rev.: | |||
| Bonds Series 2020 A, 0.6%, tender 7/1/23 (a) | 5,000,000 | 5,025,919 | |
| Series 2012 A, 4% 1/1/22 | 200,000 | 204,380 | |
| Series 2014, 5% 7/1/21 | 430,000 | 431,663 | |
| Series 2016 C, 5% 1/1/25 | 200,000 | 232,157 | |
| Series B, 5% 1/1/23 | 250,000 | 268,605 | |
| Omaha Pub. Pwr. District Elec. Rev. Series A, 5% 2/1/25 | 200,000 | 233,370 | |
| TOTAL NEBRASKA | 14,712,082 | ||
| Nevada - 1.3% | |||
| Clark County Arpt. Rev.: | |||
| (Sub Lien Proj.) Series 2017 A-1: | |||
| 5% 7/1/21 (b) | 2,045,000 | 2,052,877 | |
| 5% 7/1/22 (b) | 360,000 | 378,492 | |
| Series 2017 C, 5% 7/1/21 (b) | 11,625,000 | 11,670,450 | |
| Series 2018 A, 5% 7/1/21 | 1,920,000 | 1,927,507 | |
| Series 2019 A, 5% 7/1/23 | 200,000 | 219,771 | |
| Series 2019 D: | |||
| 5% 7/1/21 | 6,495,000 | 6,520,286 | |
| 5% 7/1/22 | 10,000,000 | 10,520,387 | |
| Clark County McCarran Int'l. Arpt. Passenger Facility Charge Rev.: | |||
| (Clark County Arpt. Rev. Proj.) Series 2017 B: | |||
| 5% 7/1/21 (b) | 800,000 | 803,082 | |
| 5% 7/1/22 (b) | 300,000 | 315,410 | |
| Series 2019 E: | |||
| 5% 7/1/22 | 480,000 | 504,979 | |
| 5% 7/1/24 | 350,000 | 399,912 | |
| Clark County School District: | |||
| Series 2012 A, 5% 6/15/21 | 1,010,000 | 1,011,752 | |
| Series 2015 B, 5% 6/15/21 | 370,000 | 370,642 | |
| Series 2015 C, 5% 6/15/22 | 500,000 | 524,852 | |
| Series 2016 A: | |||
| 5% 6/15/21 | 365,000 | 365,633 | |
| 5% 6/15/23 | 255,000 | 279,366 | |
| 5% 6/15/24 | 685,000 | 780,062 | |
| Series 2017 A, 5% 6/15/22 | 2,510,000 | 2,634,759 | |
| Series 2017 C, 5% 6/15/22 | 300,000 | 314,911 | |
| Series 2017 D, 5% 6/15/24 | 400,000 | 428,624 | |
| Series 2018 A: | |||
| 5% 6/15/23 | 435,000 | 476,566 | |
| 5% 6/15/24 | 290,000 | 330,245 | |
| Series 2019 C, 5% 6/15/21 | 370,000 | 370,642 | |
| Series 2020 A: | |||
| 3% 6/15/22 | 500,000 | 514,507 | |
| 3% 6/15/23 (FSA Insured) | 450,000 | 475,214 | |
| Las Vegas Valley Wtr. District Wtr. Impt. Gen. Oblig. Series 2015 B, 5% 12/1/21 | 600,000 | 614,601 | |
| Nevada Dept. of Bus. & Industry Bonds (Republic Svcs., Inc. Proj.) Series 2001, 0.3%, tender 6/1/21 (a)(b)(e) | 6,800,000 | 6,800,000 | |
| Nevada Gen. Oblig.: | |||
| Series 2013 D1, 5% 3/1/24 | 60,000 | 65,027 | |
| Series 2013 F1, 5% 3/1/25 | 250,000 | 270,668 | |
| Series 2015 A, 5% 8/1/21 | 200,000 | 201,611 | |
| Nevada Hsg. Division Bonds Series 2020, 0.3%, tender 10/1/22 (a) | 4,220,000 | 4,224,640 | |
| Washoe County Gas & Wtr. Facilities Bonds (Sierra Pacific Pwr. Co. Proj.) Series 2016 B, 3%, tender 6/1/22 (a) | 1,460,000 | 1,499,667 | |
| Washoe County Gas Facilities Rev. Bonds: | |||
| (Sierra Pacific Pwr. Co. Proj.) Series 2016 C, 0.625%, tender 4/15/22 (a)(b) | 1,590,000 | 1,594,206 | |
| Series 2016 F, 2.05%, tender 4/15/22 (a)(b) | 8,400,000 | 8,526,058 | |
| Series 2016, 2.05%, tender 4/15/22 (a)(b) | 1,210,000 | 1,228,158 | |
| TOTAL NEVADA | 69,215,564 | ||
| New Hampshire - 0.3% | |||
| Nat'l. Fin. Auth. Solid Bonds: | |||
| (Waste Mgmt., Inc. Proj.): | |||
| Series 2019 A2, 2.15%, tender 7/1/24 (a)(b) | 555,000 | 582,335 | |
| Series 2020 A3, 0.2%, tender 6/1/21 (a)(b) | 12,000,000 | 12,000,000 | |
| Series 2020 A2, 0.2%, tender 6/1/21 (a)(b) | 2,300,000 | 2,300,000 | |
| New Hampshire Bus. Fin. Auth. Wtr. Facility (Pennichuck Wtr. Works, Inc. Proj.) Series 2014 A, 5% 1/1/24 (Escrowed to Maturity) (b) | 260,000 | 290,245 | |
| New Hampshire Health & Ed. Facilities Auth. Rev.: | |||
| (Southern NH Med. Ctr. Proj.) Series 2016, 3% 10/1/21 | 225,000 | 227,055 | |
| Series 2012, 4% 7/1/21 | 35,000 | 35,094 | |
| Series 2016: | |||
| 5% 10/1/21 | 25,000 | 25,393 | |
| 5% 10/1/23 | 425,000 | 469,772 | |
| TOTAL NEW HAMPSHIRE | 15,929,894 | ||
| New Jersey - 3.1% | |||
| Burlington County Bridge Commission Lease Rev. (Governmental Leasing Prog.) Series 2021: | |||
| 4% 4/1/23 | 715,000 | 764,783 | |
| 4% 4/1/24 | 425,000 | 469,495 | |
| Camden County Impt. Auth. Health Care Redev. Rev. Series 2014 A: | |||
| 5% 2/15/22 | 55,000 | 56,756 | |
| 5% 2/15/23 | 70,000 | 75,330 | |
| Garden State Preservation Trust Open Space & Farmland Preservation: | |||
| Series 2005 C, 5.25% 11/1/21 (FSA Insured) | 1,000,000 | 1,021,121 | |
| Series B, 0% 11/1/22 (FSA Insured) | 680,000 | 674,256 | |
| Gloucester County Impt. Auth. Rev. Series 2021, 0.6% 3/1/24 | 2,400,000 | 2,401,161 | |
| Hudson County Impt. Auth. (Hudson County Courthouse Proj.) Series 2020, 4% 10/1/22 | 225,000 | 236,363 | |
| Hudson County Impt. Auth. Rev. Series 2020 C1A, 1.5% 9/2/21 | 1,750,000 | 1,755,923 | |
| Monmouth County Impt. Auth. Rev. Series 2020 A, 2% 7/12/21 | 1,250,000 | 1,252,704 | |
| New Brunswick Parking Auth. Rev. Series 2020 B: | |||
| 5% 9/1/23 | 675,000 | 742,598 | |
| 5% 9/1/25 | 850,000 | 1,003,613 | |
| New Jersey Econ. Dev. Auth. Series QQQ: | |||
| 5% 6/15/22 | 400,000 | 419,667 | |
| 5% 6/15/23 | 420,000 | 460,584 | |
| 5% 6/15/24 | 300,000 | 341,701 | |
| 5% 6/15/25 | 385,000 | 452,420 | |
| 5% 6/15/26 | 555,000 | 669,970 | |
| New Jersey Econ. Dev. Auth. Rev.: | |||
| (New Jersey Gen. Oblig. Proj.) Series 2017 B, 5% 11/1/24 | 115,000 | 132,782 | |
| (New Jersey Transit Corp. Proj.) Series 2017 B, 5% 11/1/22 | 1,900,000 | 2,027,270 | |
| (New Jersey Transit Corp. Projs.) Series 2017 B, 5% 11/1/21 | 385,000 | 392,571 | |
| (Provident Montclair Proj.) Series 2017: | |||
| 4% 6/1/22 (FSA Insured) | 20,000 | 20,581 | |
| 5% 6/1/23 (FSA Insured) | 25,000 | 27,319 | |
| 5% 6/1/24 (FSA Insured) | 20,000 | 22,712 | |
| (The Goethals Bridge Replacement Proj.) Series 2013, 5% 1/1/24 (b) | 350,000 | 392,433 | |
| Series 2005 N1, 5.5% 9/1/23 (Nat'l. Pub. Fin. Guarantee Corp. Insured) | 100,000 | 111,886 | |
| Series 2005, 5.25% 12/15/21 | 1,720,000 | 1,766,108 | |
| Series 2012 II: | |||
| 5% 3/1/22 | 135,000 | 139,801 | |
| 5% 3/1/23 | 835,000 | 864,301 | |
| Series 2012, 5% 6/15/22 (Assured Guaranty Corp. Insured) | 900,000 | 943,576 | |
| Series 2013: | |||
| 5% 3/1/23 | 4,920,000 | 5,323,138 | |
| 5% 3/1/24 | 480,000 | 519,444 | |
| 5% 3/1/25 | 355,000 | 383,974 | |
| Series 2014 UU, 5% 6/15/24 | 400,000 | 455,601 | |
| Series 2015 XX: | |||
| 4% 6/15/24 | 545,000 | 604,324 | |
| 5% 6/15/21 | 500,000 | 500,858 | |
| 5% 6/15/23 | 75,000 | 82,247 | |
| Series 2016 BBB, 5% 6/15/21 | 1,340,000 | 1,342,300 | |
| Series 2017 DDD, 5% 6/15/22 | 220,000 | 230,817 | |
| Series 2019: | |||
| 5.25% 9/1/22 (e) | 5,550,000 | 5,882,066 | |
| 5.25% 9/1/23 (e) | 5,000,000 | 5,551,062 | |
| 5.25% 9/1/24 (e) | 2,100,000 | 2,417,274 | |
| Series UU, 3.1% 6/15/23 | 410,000 | 433,805 | |
| New Jersey Econ. Dev. Auth. Wtr. Facilities Rev.: | |||
| (New Jersey-American Wtr. Co., Inc. Proj.) Series 2020 C, 1.15% 6/1/23 (b) | 2,500,000 | 2,534,989 | |
| (NJ American Wtr. Co., Inc. Proj.) Series 2020 E, 0.85% 12/1/25 (b) | 1,600,000 | 1,588,607 | |
| Bonds (New Jersey-American Wtr. Co., Inc.) Series 2020, 1.2%, tender 6/1/23 (a)(b) | 2,000,000 | 2,024,731 | |
| New Jersey Edl. Facility: | |||
| Series 2014, 5% 6/15/21 | 240,000 | 240,412 | |
| Series 2015 B, 5% 7/1/21 (FSA Insured) | 405,000 | 406,503 | |
| Series 2016 A: | |||
| 5% 7/1/21 | 50,000 | 50,175 | |
| 5% 7/1/22 | 140,000 | 146,566 | |
| 5% 7/1/23 | 75,000 | 81,822 | |
| 5% 7/1/24 | 175,000 | 197,879 | |
| Series 2016 C, 5% 7/1/21 (FSA Insured) | 410,000 | 411,586 | |
| Series 2016 E, 5% 7/1/22 | 625,000 | 655,706 | |
| New Jersey Gen. Oblig.: | |||
| Series 2013, 5% 6/1/23 | 430,000 | 470,799 | |
| Series 2014, 5% 6/1/22 | 400,000 | 419,185 | |
| Series 2016, 5% 6/1/21 | 500,000 | 500,000 | |
| Series 2020 A: | |||
| 4% 6/1/23 | 24,320,000 | 26,133,080 | |
| 5% 6/1/24 | 1,530,000 | 1,740,383 | |
| 5% 6/1/25 | 2,330,000 | 2,740,392 | |
| New Jersey Health Care Facilities Fing. Auth. Rev.: | |||
| Series 2012 A, 5% 7/1/24 | 1,310,000 | 1,377,290 | |
| Series 2013, 5% 7/1/22 | 325,000 | 342,058 | |
| Series 2016 A: | |||
| 2% 7/1/22 | 250,000 | 254,726 | |
| 5% 7/1/21 | 2,000,000 | 2,007,242 | |
| 5% 7/1/22 | 5,000 | 5,242 | |
| 5% 7/1/22 | 300,000 | 315,679 | |
| 5% 7/1/23 | 15,000 | 16,351 | |
| 5% 7/1/24 | 20,000 | 22,595 | |
| 5% 7/1/24 | 10,000 | 11,298 | |
| 5% 7/1/24 | 25,000 | 28,565 | |
| 5% 7/1/25 | 10,000 | 11,657 | |
| 5% 7/1/26 | 5,000 | 5,998 | |
| 5% 7/1/27 | 5,000 | 5,977 | |
| Series 2016, 5% 7/1/21 | 220,000 | 220,815 | |
| Series 2019, 4% 7/1/21 | 395,000 | 396,197 | |
| New Jersey Higher Ed. Student Assistance Auth. Student Ln. Rev.: | |||
| Series 2012 1, 5% 12/1/22 (b) | 500,000 | 534,578 | |
| Series 2013, 5% 12/1/21 (b) | 1,500,000 | 1,534,977 | |
| Series 2015 1A: | |||
| 5% 12/1/21 (b) | 4,650,000 | 4,758,429 | |
| 5% 12/1/22 (b) | 200,000 | 213,831 | |
| Series 2016 1A: | |||
| 5% 12/1/22 (b) | 1,400,000 | 1,496,817 | |
| 5% 12/1/23 (b) | 1,400,000 | 1,558,437 | |
| Series 2017 1A: | |||
| 5% 12/1/22 (b) | 215,000 | 229,868 | |
| 5% 12/1/23 (b) | 4,195,000 | 4,669,745 | |
| Series 2017 1B, 5% 12/1/21 (b) | 190,000 | 194,430 | |
| Series 2018 B, 5% 12/1/21 (b) | 835,000 | 854,471 | |
| Series 2019 A: | |||
| 5% 12/1/22 | 245,000 | 262,326 | |
| 5% 12/1/23 | 4,260,000 | 4,751,143 | |
| 5% 12/1/24 | 260,000 | 299,964 | |
| Series 2020 A, 5% 12/1/23 (b) | 1,500,000 | 1,668,562 | |
| Series 2020: | |||
| 5% 12/1/22 (b) | 1,600,000 | 1,710,648 | |
| 5% 12/1/22 (b) | 1,360,000 | 1,454,051 | |
| 5% 12/1/23 (b) | 945,000 | 1,051,194 | |
| 5% 12/1/24 (b) | 675,000 | 776,724 | |
| Series 2021 A: | |||
| 5% 12/1/23 (b) | 200,000 | 222,369 | |
| 5% 12/1/24 (b) | 330,000 | 379,237 | |
| 5% 12/1/25 (b) | 700,000 | 827,152 | |
| Series 2021 B, 5% 12/1/24 (b) | 570,000 | 655,046 | |
| New Jersey Hsg. & Mtg. Fin. Agcy. Bonds Series 2020 A, 0.75%, tender 6/1/22 (a) | 2,000,000 | 2,009,279 | |
| New Jersey Hsg. & Mtg. Fin. Agcy. Rev. Series 2019 D: | |||
| 4% 10/1/22 (b) | 1,340,000 | 1,399,229 | |
| 4% 4/1/23 (b) | 115,000 | 121,721 | |
| 4% 10/1/23 (b) | 125,000 | 133,854 | |
| 4% 4/1/25 (b) | 150,000 | 165,387 | |
| New Jersey Tobacco Settlement Fing. Corp. Series 2018 A: | |||
| 5% 6/1/21 | 2,185,000 | 2,185,000 | |
| 5% 6/1/22 | 2,580,000 | 2,702,975 | |
| 5% 6/1/23 | 1,080,000 | 1,181,579 | |
| New Jersey Tpk. Auth. Tpk. Rev. Series 2012 B, 5% 1/1/22 (Escrowed to Maturity) | 350,000 | 360,014 | |
| New Jersey Trans. Trust Fund Auth.: | |||
| Series 2005 B: | |||
| 5.25% 12/15/22 (AMBAC Insured) | 5,000,000 | 5,383,373 | |
| 5.25% 12/15/23 | 370,000 | 416,926 | |
| Series 2006 A: | |||
| 5.25% 12/15/21 | 2,000,000 | 2,053,614 | |
| 5.25% 12/15/21 (FSA Insured) | 395,000 | 405,741 | |
| 5.25% 12/15/22 | 200,000 | 215,335 | |
| 5.25% 12/15/23 (FSA Insured) | 500,000 | 563,017 | |
| 5.5% 12/15/21 | 1,900,000 | 1,953,476 | |
| Series 2006, 5.25% 12/15/21 (Nat'l. Pub. Fin. Guarantee Corp. Insured) | 465,000 | 477,465 | |
| Series 2010 D, 5.25% 12/15/23 | 555,000 | 624,674 | |
| Series 2011 B, 5% 6/15/21 | 1,250,000 | 1,252,146 | |
| Series 2013 AA: | |||
| 5% 6/15/22 | 215,000 | 225,571 | |
| 5% 6/15/23 | 785,000 | 860,853 | |
| Series 2016 A: | |||
| 5% 6/15/21 | 1,700,000 | 1,702,987 | |
| 5% 6/15/22 | 2,720,000 | 2,854,321 | |
| 5% 6/15/27 | 90,000 | 108,249 | |
| Series 2016 A-2, 5% 6/15/23 | 1,205,000 | 1,318,588 | |
| Series 2018 A: | |||
| 5% 6/15/21 | 3,995,000 | 4,002,020 | |
| 5% 6/15/22 | 4,475,000 | 4,695,988 | |
| 5% 6/15/23 | 445,000 | 486,947 | |
| 5% 6/15/24 | 405,000 | 460,018 | |
| Series 2022 AA: | |||
| 5% 6/15/23 (c) | 150,000 | 157,005 | |
| 5% 6/15/24 (c) | 330,000 | 357,935 | |
| 5% 6/15/25 (c) | 2,000,000 | 2,238,299 | |
| Series A: | |||
| 5% 6/15/21 | 265,000 | 265,455 | |
| 5% 12/15/23 | 365,000 | 408,517 | |
| 5% 12/15/24 | 210,000 | 243,513 | |
| 5% 12/15/25 | 200,000 | 238,800 | |
| Series D, 5% 12/15/23 | 480,000 | 537,228 | |
| New Jersey Transit Corp. Ctfs. of Prtn. Series 2014 A, 5% 9/15/21 | 860,000 | 870,835 | |
| Newark Gen. Oblig. Series 2020: | |||
| 5% 10/1/21 | 250,000 | 253,563 | |
| 5% 10/1/21 | 100,000 | 101,398 | |
| 5% 10/1/22 | 900,000 | 948,716 | |
| 5% 10/1/22 | 650,000 | 685,184 | |
| Rutgers State Univ. Rev. Series Q: | |||
| 5% 5/1/22 | 80,000 | 83,517 | |
| 5% 5/1/23 | 65,000 | 70,758 | |
| Union County Gen. Oblig. Series 2020, 0.5% 3/1/22 | 1,700,000 | 1,705,290 | |
| TOTAL NEW JERSEY | 168,321,559 | ||
| New Mexico - 0.1% | |||
| New Mexico Mtg. Fin. Auth. Series 2019 C, 4% 1/1/50 | 485,000 | 538,229 | |
| New Mexico Muni. Energy Acquisition Auth. Gas Supply Rev.: | |||
| Bonds Series 2019 A, 5%, tender 5/1/25 (a) | 1,000,000 | 1,168,874 | |
| Series 2019 A: | |||
| 4% 5/1/22 | 140,000 | 144,850 | |
| 4% 5/1/23 | 680,000 | 728,366 | |
| 4% 11/1/23 | 245,000 | 266,665 | |
| 4% 11/1/24 | 250,000 | 280,167 | |
| 4% 5/1/25 | 960,000 | 1,086,772 | |
| New Mexico Severance Tax Rev.: | |||
| Series 2015 B, 5% 7/1/21 | 1,495,000 | 1,500,894 | |
| Series 2016 A, 5% 7/1/21 | 500,000 | 501,971 | |
| Santa Fe Pub. School District Gen. Oblig. Series 2021: | |||
| 4% 8/1/22 (c) | 500,000 | 521,514 | |
| 4% 8/1/23 (c) | 450,000 | 485,964 | |
| TOTAL NEW MEXICO | 7,224,266 | ||
| New York - 3.4% | |||
| Albany County Arpt. Auth. Arpt. Rev. Series 2020 B, 5% 12/15/21 (b) | 500,000 | 512,076 | |
| Dorm. Auth. New York Univ. Rev.: | |||
| Series 2016 A: | |||
| 5% 7/1/22 | 10,000 | 10,513 | |
| 5% 7/1/24 | 40,000 | 45,559 | |
| Series 2017 1, 5% 7/1/21 | 400,000 | 401,584 | |
| East Ramapo Central School District Series 2021, 1.25% 5/5/22 | 1,250,000 | 1,260,411 | |
| Genessee Valley Central School District Series 2012, 5% 6/15/21 (FSA Insured) | 435,000 | 435,714 | |
| Hempstead Local Dev. Corp. Rev. (Adelphi Univ. Proj.) Series 2021: | |||
| 5% 6/1/22 | 200,000 | 209,160 | |
| 5% 6/1/23 | 400,000 | 435,598 | |
| 5% 6/1/24 | 940,000 | 1,060,229 | |
| Hudson Yards Infrastructure Corp. New York Rev. Series 2017 A: | |||
| 5% 2/15/24 | 1,280,000 | 1,439,942 | |
| 5% 2/15/25 | 655,000 | 762,918 | |
| 5% 2/15/26 | 1,545,000 | 1,856,998 | |
| Long Island Pwr. Auth. Elec. Sys. Rev.: | |||
| Bonds: | |||
| Series 2019 B, 1.65%, tender 9/1/24 (a) | 1,055,000 | 1,089,968 | |
| Series 2020 B, 0.85%, tender 9/1/25 (a) | 11,000,000 | 11,012,947 | |
| Series 2017, 5% 9/1/21 (Escrowed to Maturity) | 390,000 | 394,762 | |
| Monroe County Indl. Dev. Corp.: | |||
| (The Rochester Gen. Hosp. Proj.) Series 2017, 5% 12/1/26 | 350,000 | 427,161 | |
| (Univ. of Rochester, Proj.) Series 2017 A, 5% 7/1/21 | 275,000 | 276,087 | |
| Series 2020 A, 5% 7/1/23 | 300,000 | 330,119 | |
| New York City Edl. Construction Fund Series 2021 A, 5% 4/1/22 | 1,080,000 | 1,123,242 | |
| New York City Gen. Oblig.: | |||
| Bonds Series D, 5%, tender 2/1/24 (a) | 900,000 | 986,229 | |
| Series 1, 5% 8/1/23 | 405,000 | 446,925 | |
| Series 2006, 0.25%, tender 6/1/36 (FSA Insured) (a) | 1,000,000 | 1,000,000 | |
| Series 2007 C-4, 0.24%, tender 1/1/32 (FSA Insured) (a) | 225,000 | 225,000 | |
| Series 2007, 0.07%, tender 6/1/21 (FSA Insured) (a) | 4,200,000 | 4,200,000 | |
| Series 2008 A-3, 0.01%, tender 8/1/26 (FSA Insured) (a) | 3,775,000 | 3,775,000 | |
| Series 2008 C-4, 0.24%, tender 10/1/27 (a) | 1,475,000 | 1,475,000 | |
| Series 2008 J3, 5% 8/1/22 | 550,000 | 581,340 | |
| Series 2012 A, 5% 8/1/21 | 400,000 | 403,231 | |
| Series 2012 D1, 5% 10/1/26 | 440,000 | 447,133 | |
| Series 2012 E, 5% 8/1/24 | 365,000 | 376,883 | |
| Series 2013 D, 5% 8/1/23 | 1,605,000 | 1,733,153 | |
| Series 2013 I, 5% 8/1/23 | 200,000 | 220,704 | |
| Series 2013 J, 5% 8/1/21 | 1,280,000 | 1,290,338 | |
| Series 2015 A, 5% 8/1/23 | 570,000 | 629,005 | |
| Series 2016 B, 5% 8/1/22 | 300,000 | 317,095 | |
| Series 2016 E, 5% 8/1/24 | 840,000 | 963,276 | |
| Series 2016, 5% 8/1/22 | 1,405,000 | 1,485,059 | |
| Series 2017 A, 4% 8/1/21 | 660,000 | 664,249 | |
| Series 2017 C, 5% 8/1/23 | 120,000 | 132,422 | |
| Series 2017: | |||
| 5% 8/1/21 | 890,000 | 897,188 | |
| 5% 8/1/23 | 1,105,000 | 1,219,388 | |
| Series 2018 A: | |||
| 5% 8/1/23 | 200,000 | 220,704 | |
| 5% 8/1/24 | 150,000 | 172,014 | |
| Series 2018, 5% 8/1/22 | 440,000 | 465,072 | |
| Series 2019 A, 5% 8/1/21 | 250,000 | 252,019 | |
| Series 2019 B, 5% 8/1/21 | 200,000 | 201,615 | |
| Series 2021 F1, 5% 3/1/23 | 85,000 | 92,066 | |
| Series A: | |||
| 4% 8/1/23 | 995,000 | 1,076,529 | |
| 5% 8/1/21 | 660,000 | 665,331 | |
| 5% 8/1/22 | 440,000 | 465,072 | |
| 5% 8/1/23 | 100,000 | 110,352 | |
| 5% 8/1/25 | 570,000 | 650,934 | |
| Series A1, 5% 10/1/22 | 200,000 | 212,972 | |
| Series B: | |||
| 5% 8/1/21 | 250,000 | 252,019 | |
| 5% 8/1/21 | 360,000 | 362,908 | |
| 5% 8/1/21 (Escrowed to Maturity) | 100,000 | 100,801 | |
| Series C: | |||
| 3% 8/1/21 | 250,000 | 251,200 | |
| 5% 8/1/23 | 300,000 | 331,055 | |
| 5% 8/1/23 | 5,040,000 | 5,561,732 | |
| 5% 8/1/26 | 220,000 | 269,596 | |
| Series D, 5% 8/1/25 | 710,000 | 765,699 | |
| Series D1, 5% 10/1/21 | 250,000 | 254,073 | |
| Series E: | |||
| 5% 8/1/21 | 520,000 | 524,200 | |
| 5% 8/1/21 | 1,085,000 | 1,093,763 | |
| 5% 8/1/22 | 400,000 | 422,793 | |
| Series F1: | |||
| 5% 3/1/27 | 325,000 | 351,451 | |
| 5% 3/1/37 (Pre-Refunded to 3/1/23 @ 100) | 405,000 | 439,261 | |
| Series H3, 5% 8/1/23 | 475,000 | 524,171 | |
| Series I, 5% 8/1/21 | 665,000 | 670,371 | |
| Series J4, 5% 8/1/24 | 2,100,000 | 2,408,191 | |
| New York City Health & Hosp. Corp. Rev. Series A, 4% 2/15/25 | 1,440,000 | 1,623,363 | |
| New York City Hsg. Dev. Corp.: | |||
| Bonds Series 2017 G-2, 2%, tender 12/31/21 (a) | 2,225,000 | 2,226,227 | |
| Series G1, 2.35% 11/1/23 | 450,000 | 469,622 | |
| New York City Hsg. Dev. Corp. Multifamily Hsg.: | |||
| Bonds: | |||
| Series 2021 C2, 0.7%, tender 7/1/25 (a) | 2,710,000 | 2,707,968 | |
| Series A3, 1.125%, tender 11/1/24 (a) | 2,000,000 | 2,012,386 | |
| Series 2017 C3A, 0.2% 5/1/22 | 2,390,000 | 2,388,984 | |
| New York City Indl. Dev. Agcy. Rev. Series 2021 A, 5% 1/1/25 (FSA Insured) | 1,000,000 | 1,161,947 | |
| New York City Muni. Wtr. Fin. Auth. Wtr. & Swr. Sys. Rev.: | |||
| Series 2011 HH, 5% 6/15/26 | 250,000 | 250,446 | |
| Series AA, 4% 6/15/24 | 845,000 | 940,593 | |
| Series CC1, 4% 6/15/21 (Escrowed to Maturity) | 465,000 | 465,661 | |
| Series FF, 5% 6/15/21 (Escrowed to Maturity) | 300,000 | 300,535 | |
| New York City Transitional Fin. Auth. Bldg. Aid Rev.: | |||
| Series 2018 S1, 5% 7/15/25 | 370,000 | 438,989 | |
| Series S1: | |||
| 5% 7/15/21 | 350,000 | 352,033 | |
| 5% 7/15/23 | 600,000 | 661,227 | |
| 5% 7/15/24 | 375,000 | 429,779 | |
| New York City Transitional Fin. Auth. Rev.: | |||
| Series 1: | |||
| 5% 11/1/22 | 400,000 | 427,621 | |
| 5% 11/1/22 | 215,000 | 229,846 | |
| Series 2012 D1, 5% 11/1/22 | 740,000 | 754,966 | |
| Series 2014 D1, 5% 2/1/27 | 350,000 | 393,452 | |
| Series 2014, 5% 11/1/26 | 750,000 | 851,424 | |
| Series 2015 C: | |||
| 5% 11/1/21 | 225,000 | 229,567 | |
| 5% 11/1/22 | 370,000 | 395,549 | |
| Series 2020 1, 5% 11/1/21 | 310,000 | 316,293 | |
| Series A1: | |||
| 5% 5/1/23 | 300,000 | 327,909 | |
| 5% 8/1/24 | 250,000 | 286,946 | |
| Series A3, 5% 8/1/23 | 1,045,000 | 1,153,657 | |
| Series B1: | |||
| 5% 8/1/22 | 350,000 | 369,941 | |
| 5% 8/1/24 | 545,000 | 625,541 | |
| Series C, 5% 11/1/21 | 430,000 | 438,729 | |
| Series C1, 3% 5/1/22 | 320,000 | 328,494 | |
| Series D1, 5% 11/1/24 | 615,000 | 627,354 | |
| New York Dorm. Auth. Personal Income Tax Rev.: | |||
| Series 2012 A, 4% 12/15/22 (Escrowed to Maturity) | 325,000 | 344,502 | |
| Series 2014 A: | |||
| 5% 2/15/22 | 695,000 | 719,002 | |
| 5% 2/15/26 | 645,000 | 726,528 | |
| Series 2014 E, 5% 2/15/26 | 300,000 | 350,513 | |
| Series 2015 E, 5% 3/15/23 | 300,000 | 326,134 | |
| Series 2016 D: | |||
| 5% 2/15/23 | 665,000 | 720,268 | |
| 5% 2/15/25 | 405,000 | 473,449 | |
| New York Dorm. Auth. Rev.: | |||
| Bonds Series 2019 B1, 5%, tender 5/1/22 (a) | 675,000 | 688,168 | |
| Series 1: | |||
| 4% 7/1/21 | 125,000 | 125,394 | |
| 5% 7/1/22 (Pre-Refunded to 1/1/22 @ 100) | 400,000 | 411,349 | |
| Series 2011 A, 5.25% 7/1/25 (Pre-Refunded to 7/1/21 @ 100) | 480,000 | 481,986 | |
| Series 2012 A, 5% 10/1/21 | 245,000 | 249,013 | |
| Series 2012, 5% 7/1/21 | 325,000 | 326,284 | |
| Series 2015 A: | |||
| 5% 7/1/21 | 405,000 | 406,603 | |
| 5% 5/1/23 | 410,000 | 446,487 | |
| 5% 7/1/24 | 275,000 | 314,490 | |
| Series 2015, 5% 12/1/22 (e) | 700,000 | 745,249 | |
| Series 2016, 5% 10/1/21 | 225,000 | 228,686 | |
| Series 2021 A: | |||
| 4% 10/1/22 (c) | 2,875,000 | 3,017,488 | |
| 5% 7/1/24 | 1,410,000 | 1,611,073 | |
| New York Dorm. Auth. Sales Tax Rev.: | |||
| Series 2015 A: | |||
| 5% 3/15/23 | 1,130,000 | 1,228,437 | |
| 5% 3/15/24 | 250,000 | 282,987 | |
| Series 2017 A, 5% 3/15/24 | 445,000 | 503,717 | |
| Series 2018 C, 5% 3/15/24 | 600,000 | 679,169 | |
| New York Metropolitan Trans. Auth. Dedicated Tax Fund Rev.: | |||
| Bonds Series 2008 A, SIFMA Municipal Swap Index + 0.450% 0.5%, tender 6/3/21 (a)(d) | 1,370,000 | 1,369,905 | |
| Series 2012 A: | |||
| 5% 11/15/21 | 1,050,000 | 1,072,992 | |
| 5% 11/15/22 | 225,000 | 240,821 | |
| Series 2016 A, 5% 11/15/22 | 400,000 | 427,852 | |
| Series 2016 B1, 5% 11/15/21 | 190,000 | 194,160 | |
| Series 2017 B2: | |||
| 5% 11/15/23 | 1,000,000 | 1,115,584 | |
| 5% 11/15/24 | 365,000 | 422,618 | |
| Series 2019 A, 5% 3/1/22 | 1,240,000 | 1,284,320 | |
| Series 2021 B1, 3% 11/1/22 | 3,000,000 | 3,118,537 | |
| New York Metropolitan Trans. Auth. Rev.: | |||
| Bonds Series 2011 B, 1 month U.S. LIBOR + 0.550% 0.624%, tender 11/1/22 (a)(d) | 1,745,000 | 1,744,606 | |
| Series 2005 B, 5.25% 11/15/21 (Nat'l. Pub. Fin. Guarantee Corp. Insured) | 275,000 | 281,256 | |
| Series 2008 B2, 5% 11/15/21 | 1,340,000 | 1,368,845 | |
| Series 2012 B, 5% 11/15/22 | 45,000 | 48,080 | |
| Series 2012 D, 5% 11/15/21 | 645,000 | 658,884 | |
| Series 2012 E, 5% 11/15/21 | 55,000 | 56,184 | |
| Series 2012 F: | |||
| 5% 11/15/21 | 765,000 | 781,468 | |
| 5% 11/15/22 | 1,000,000 | 1,068,428 | |
| Series 2014 C, 5% 11/15/21 | 60,000 | 61,291 | |
| Series 2016 B, 5% 11/15/21 | 50,000 | 51,076 | |
| Series 2017 B: | |||
| 4% 11/15/21 | 260,000 | 264,421 | |
| 5% 11/15/22 | 525,000 | 560,928 | |
| Series 2020 A: | |||
| 4% 2/1/22 | 5,400,000 | 5,533,911 | |
| 5% 2/1/23 | 4,510,000 | 4,857,623 | |
| New York St Mtg. Agcy. Homeowner: | |||
| Series 186, 3.4% 4/1/22 (b) | 1,160,000 | 1,187,907 | |
| Series 198, 1.65% 10/1/21 (b) | 2,245,000 | 2,254,307 | |
| Series 2014 189: | |||
| 2.5% 10/1/21 (b) | 1,640,000 | 1,651,398 | |
| 2.85% 10/1/22 (b) | 500,000 | 515,375 | |
| Series 212: | |||
| 2.4% 4/1/22 (b) | 1,130,000 | 1,147,832 | |
| 2.5% 10/1/22 (b) | 1,160,000 | 1,190,294 | |
| Series 214, 2.9% 10/1/22 (b) | 805,000 | 829,416 | |
| New York State Dorm. Auth.: | |||
| Series 2012 A: | |||
| 5% 12/15/21 | 540,000 | 554,228 | |
| 5% 12/15/23 | 415,000 | 445,898 | |
| 5% 12/15/23 (Pre-Refunded to 12/15/22 @ 100) | 345,000 | 370,719 | |
| Series 2017 A: | |||
| 5% 2/15/22 | 935,000 | 967,290 | |
| 5% 2/15/23 | 2,480,000 | 2,686,113 | |
| 5% 2/15/25 | 635,000 | 742,321 | |
| Series 2017 B, 5% 2/15/23 | 665,000 | 720,268 | |
| Series 2018 A, 5% 3/15/25 | 200,000 | 234,469 | |
| Series 2019 D, 5% 2/15/23 | 390,000 | 422,413 | |
| Series 2020 A, 5% 3/15/23 | 250,000 | 271,778 | |
| New York State Energy Research & Dev. Auth. Poll. Cont. Rev. Series 1999, 1.5%, tender 6/4/21 (AMBAC Insured) (a) | 300,000 | 300,000 | |
| New York State Hsg. Fin. Agcy. Rev.: | |||
| Bonds Series 2019 F, 1.875%, tender 11/1/21 (a) | 650,000 | 650,485 | |
| Series J, 0.75% 5/1/25 | 360,000 | 360,544 | |
| New York State Mtg. Agcy. Homeowner Mtg.: | |||
| Series 2021 232, 5% 4/1/24 (b) | 1,110,000 | 1,250,754 | |
| Series 221, 3.5% 10/1/32 (b) | 65,000 | 70,740 | |
| New York Trans. Dev. Corp.: | |||
| (Delta Air Lines, Inc. Laguardia Arpt. Terminals C&D Redev. Proj.) Series 2018, 5% 1/1/22 (b) | 1,500,000 | 1,538,987 | |
| (Term. 4 JFK Int'l. Arpt. Proj.): | |||
| Series 2020 A: | |||
| 5% 12/1/22 (b) | 250,000 | 266,938 | |
| 5% 12/1/23 (b) | 175,000 | 194,388 | |
| 5% 12/1/25 (b) | 1,100,000 | 1,305,695 | |
| Series 2020 C: | |||
| 5% 12/1/22 | 2,355,000 | 2,520,067 | |
| 5% 12/1/23 | 1,000,000 | 1,113,700 | |
| New York Urban Dev. Corp. Rev.: | |||
| Series 2013 A1, 4% 3/15/23 | 250,000 | 267,319 | |
| Series 2013 D, 5% 3/15/24 | 355,000 | 385,524 | |
| Series 2015 A, 5% 3/15/24 | 590,000 | 667,143 | |
| Series 2016 A: | |||
| 5% 3/15/22 | 310,000 | 321,975 | |
| 5% 3/15/23 | 390,000 | 423,974 | |
| Series 2017 A, 5% 3/15/23 | 200,000 | 217,422 | |
| Niagara Frontier Trans. Auth. Arpt. Rev. Series 2019 A: | |||
| 5% 4/1/22 (b) | 700,000 | 726,230 | |
| 5% 4/1/23 (b) | 2,575,000 | 2,783,994 | |
| 5% 4/1/24 (b) | 1,720,000 | 1,936,030 | |
| Onondaga County Ind. Dev. Agcy. Swr. Facilities Rev. (Bristol-Meyers Squibb Co. Proj.) Series 1994, 5.75% 3/1/24 (b) | 945,000 | 1,077,261 | |
| Poughkeepsie Gen. Oblig. Series 2021, 4% 4/15/23 | 270,000 | 283,727 | |
| Rockland County Gen. Oblig. Series 2014 A: | |||
| 5% 3/1/22 (FSA Insured) | 925,000 | 958,465 | |
| 5% 3/1/23 (FSA Insured) | 275,000 | 297,887 | |
| Saratoga County Cap. Resources Rev. Series A, 5% 7/1/21 | 200,000 | 200,790 | |
| Schenectady County Cap. Resources Corp. Rev. (Union College Proj.) Series 2017, 5% 1/1/22 | 275,000 | 282,830 | |
| Suffolk County Gen. Oblig. Series B, 5% 10/15/21 (FSA Insured) | 200,000 | 203,435 | |
| Triborough Bridge & Tunnel Auth. Revs.: | |||
| Bonds Series 2005 B 4A, U.S. Secured Overnight Finl Rate (SOFR) Indx + 0.380% 0.387%, tender 2/1/24 (a)(d) | 2,000,000 | 1,998,791 | |
| Series 2002 E, 5.5% 11/15/21 | 285,000 | 291,921 | |
| Series 2013 A, 5% 11/15/26 | 400,000 | 435,071 | |
| Series 2013 B, 4% 11/15/21 | 405,000 | 412,198 | |
| Series 2016 A, 5% 11/15/23 | 400,000 | 446,599 | |
| Triborough Bridge and Tunnel Auth. Bonds Series 2021 A2: | |||
| 2%, tender 5/15/24 (a) | 6,000,000 | 6,303,814 | |
| 2%, tender 5/15/26 (a) | 1,285,000 | 1,373,287 | |
| Westchester County Healthcare Series 2000 A, 5% 11/1/22 (Pre-Refunded to 11/1/21 @ 100) | 475,000 | 484,608 | |
| Yonkers Gen. Oblig.: | |||
| Series 2016 C, 4% 11/15/21 (FSA Insured) | 225,000 | 228,937 | |
| Series 2017 C, 5% 10/1/22 (Build America Mutual Assurance Insured) | 55,000 | 58,508 | |
| Series 2021 A: | |||
| 4% 2/15/24 | 250,000 | 273,384 | |
| 5% 2/15/26 (FSA Insured) | 400,000 | 479,748 | |
| Series 2021 B: | |||
| 4% 2/15/24 | 290,000 | 317,208 | |
| 5% 2/15/26 | 320,000 | 383,963 | |
| TOTAL NEW YORK | 182,185,752 | ||
| New York And New Jersey - 0.4% | |||
| Port Auth. of New York & New Jersey: | |||
| Series 173, 4% 12/1/21 | 675,000 | 687,969 | |
| Series 185, 5% 9/1/21 (b) | 1,000,000 | 1,011,872 | |
| Series 188, 5% 5/1/23 (b) | 200,000 | 217,960 | |
| Series 189, 5% 5/1/23 | 200,000 | 218,323 | |
| Series 194, 5% 10/15/21 | 555,000 | 564,972 | |
| Series 197, 5% 11/15/21 (b) | 585,000 | 597,720 | |
| Series 2013: | |||
| 5% 12/1/22 | 275,000 | 294,921 | |
| 5% 12/1/23 | 725,000 | 810,322 | |
| 5% 12/1/24 (b) | 250,000 | 278,359 | |
| Series 2015 188, 5% 5/1/22 (b) | 370,000 | 386,230 | |
| Series 2018, 5% 9/15/22 (b) | 4,105,000 | 4,357,635 | |
| Series 202, 5% 10/15/22 (b) | 4,435,000 | 4,725,395 | |
| Series 2020 221, 5% 7/15/24 (b) | 230,000 | 262,322 | |
| Series 207: | |||
| 5% 9/15/23 (b) | 1,095,000 | 1,211,727 | |
| 5% 9/15/24 (b) | 430,000 | 493,303 | |
| Series 209, 5% 7/15/21 | 275,000 | 276,598 | |
| Series 223: | |||
| 5% 7/15/22 (b) | 2,500,000 | 2,634,144 | |
| 5% 7/15/23 (b) | 925,000 | 1,016,811 | |
| 5% 7/15/24 (b) | 1,250,000 | 1,425,663 | |
| TOTAL NEW YORK AND NEW JERSEY | 21,472,246 | ||
| North Carolina - 0.4% | |||
| Charlotte Int'l. Arpt. Rev.: | |||
| Series 2014 A, 5% 7/1/25 | 560,000 | 639,859 | |
| Series 2017 B, 5% 7/1/25 (b) | 100,000 | 117,893 | |
| Series 2019 A, 5% 7/1/21 | 325,000 | 326,287 | |
| Series 2019 B, 5% 7/1/22 (b) | 400,000 | 420,815 | |
| Series 2021 B: | |||
| 5% 7/1/22 (b) | 270,000 | 284,050 | |
| 5% 7/1/24 (b) | 1,000,000 | 1,139,955 | |
| 5% 7/1/25 (b) | 1,345,000 | 1,585,660 | |
| Charlotte-Mecklenburg Hosp. Auth. Health Care Sys. Rev.: | |||
| Bonds Series 2021 B, 5%, tender 12/2/24 (a) | 1,000,000 | 1,161,368 | |
| Series 2016 A, 5% 1/15/22 | 1,650,000 | 1,699,808 | |
| Columbus County Indl. Facilities And Poll. Cont. Fing. Auth. Rev. Bonds Series 2019 C, 2.1%, tender 10/1/24 (a)(b) | 2,000,000 | 2,101,483 | |
| New Hanover County Hosp. Rev. Series 2017, 5% 10/1/26 (Escrowed to Maturity) | 290,000 | 354,622 | |
| North Carolina Cap. Facilities Fin. Agcy. Edl. Facilities Rev. Series 2021, 3% 5/1/22 | 225,000 | 230,574 | |
| North Carolina Eastern Muni. Pwr. Agcy. Pwr. Sys. Rev. Series 1993 B, 6% 1/1/22 (Escrowed to Maturity) | 1,750,000 | 1,810,013 | |
| North Carolina Grant Anticipation Rev.: | |||
| Series 2017: | |||
| 5% 3/1/22 | 80,000 | 82,937 | |
| 5% 3/1/23 | 450,000 | 487,120 | |
| Series 2019, 5% 3/1/25 | 335,000 | 392,146 | |
| North Carolina Hsg. Fin. Agcy. Home Ownership Rev. Series 43, 4% 7/1/50 | 2,705,000 | 3,018,892 | |
| North Carolina Med. Care Commission Health Care Facilities Rev.: | |||
| Bonds Series 2019 B, 2.2%, tender 12/1/22 (a) | 1,420,000 | 1,446,845 | |
| Series 2012 B, 4% 12/1/21 | 200,000 | 203,752 | |
| North Carolina Muni. Pwr. Agcy. #1 Catawba Elec. Rev.: | |||
| Series 2015 B, 5% 1/1/23 | 300,000 | 320,349 | |
| Series 2015 E: | |||
| 5% 1/1/22 | 110,000 | 113,060 | |
| 5% 1/1/23 | 35,000 | 37,374 | |
| North Carolina Tpk. Auth. Triangle Expressway Sys. Series 2017, 5% 1/1/22 | 1,100,000 | 1,130,335 | |
| Raleigh Durham Arpt. Auth. Arpt. Rev.: | |||
| Series 2015 B, 5% 5/1/22 (b) | 750,000 | 782,687 | |
| Series 2017 A: | |||
| 5% 5/1/22 (b) | 400,000 | 417,433 | |
| 5% 5/1/23 (b) | 235,000 | 256,292 | |
| Series 2020 A, 5% 5/1/23 (b) | 340,000 | 370,806 | |
| TOTAL NORTH CAROLINA | 20,932,415 | ||
| North Dakota - 0.1% | |||
| North Dakota Hsg. Fin. Agcy. Bonds (Home Mtg. Fin. Prog.) Series 2019 B, SIFMA Municipal Swap Index + 0.400% 0.45%, tender 6/3/21 (a)(d) | 4,000,000 | 4,001,558 | |
| Ohio - 0.7% | |||
| Akron Bath Copley Hosp. District Rev.: | |||
| Series 2012, 5% 11/15/24 | 830,000 | 866,485 | |
| Series 2016, 5% 11/15/24 | 45,000 | 51,506 | |
| Akron Gen. Oblig. Series 2020, 2% 12/1/21 | 850,000 | 857,203 | |
| Allen County Hosp. Facilities Rev.: | |||
| Bonds (Mercy Health) Series 2017 B, 5%, tender 5/5/22 (a) | 985,000 | 1,027,353 | |
| Series 2017 A: | |||
| 5% 8/1/21 | 780,000 | 786,139 | |
| 5% 8/1/22 | 5,300,000 | 5,595,548 | |
| Series 2020 A: | |||
| 5% 12/1/21 | 1,000,000 | 1,023,877 | |
| 5% 12/1/22 | 1,550,000 | 1,660,824 | |
| 5% 12/1/23 | 1,000,000 | 1,116,355 | |
| American Muni. Pwr., Inc. Rev. Bonds: | |||
| Series 2019 A, 2.3%, tender 2/15/22 (a) | 1,800,000 | 1,807,423 | |
| Series 2021 A2, 1%, tender 8/15/24 (a) | 325,000 | 330,174 | |
| Cleveland Arpt. Sys. Rev.: | |||
| Series 2016 A: | |||
| 5% 1/1/24 (FSA Insured) | 25,000 | 28,020 | |
| 5% 1/1/25 (FSA Insured) | 395,000 | 458,510 | |
| 5% 1/1/26 (FSA Insured) | 10,000 | 11,550 | |
| Series 2018 A, 5% 1/1/26 (b) | 290,000 | 344,944 | |
| Series 2019 B: | |||
| 5% 1/1/22 (b) | 650,000 | 666,843 | |
| 5% 1/1/27 (b) | 350,000 | 428,093 | |
| Cleveland Pub. Pwr. Sys. Rev.: | |||
| Series 2016, 5% 11/15/21 (FSA Insured) | 1,180,000 | 1,205,165 | |
| Series 2018, 5% 11/15/21 (FSA Insured) | 320,000 | 326,824 | |
| Fairfield County Hosp. Facilities Rev. (Fairfield Med. Ctr. Proj.) Series 2013: | |||
| 5% 6/15/22 | 45,000 | 46,715 | |
| 5% 6/15/23 | 40,000 | 42,897 | |
| Franklin County Hosp. Facilities Rev.: | |||
| Bonds: | |||
| (Ohio Health Corp.) Series 2018 B, SIFMA Municipal Swap Index + 0.430% 0.48%, tender 6/3/21 (a)(d) | 3,800,000 | 3,800,191 | |
| (U.S. Health Corp. of Columbus Proj.) Series 2011 B, 5%, tender 5/15/23 (a) | 1,410,000 | 1,537,395 | |
| Series 2016 C, 5% 11/1/23 | 60,000 | 66,778 | |
| Gahanna-Jefferson City School District (School Facilities Proj.) Series 2021: | |||
| 2% 12/1/22 | 425,000 | 436,791 | |
| 2% 12/1/23 | 355,000 | 370,561 | |
| Gahanna-Jefferson School District Series 2021, 2% 12/1/21 (FSA Insured) | 800,000 | 807,461 | |
| Hamilton County Convention Facilities Auth. Rev. Series 2014, 5% 12/1/21 | 45,000 | 45,758 | |
| Hamilton County HealthCare Facilities Rev. Series 2012: | |||
| 5% 6/1/21 | 400,000 | 400,000 | |
| 5.25% 6/1/26 | 115,000 | 119,751 | |
| Miami County Hosp. Facilities Rev. (Kettering Health Network Obligated Group Proj.) Series 2019: | |||
| 5% 8/1/24 | 770,000 | 881,952 | |
| 5% 8/1/25 | 310,000 | 367,167 | |
| 5% 8/1/26 | 535,000 | 653,167 | |
| Miami Univ.: | |||
| Series 2011, 5% 9/1/31 | 200,000 | 202,411 | |
| Series 2014, 5% 9/1/21 | 250,000 | 253,038 | |
| Series 2017, 5% 9/1/21 | 200,000 | 202,430 | |
| Series 2020 A: | |||
| 5% 9/1/21 | 500,000 | 506,075 | |
| 5% 9/1/22 | 340,000 | 360,786 | |
| Montgomery County Hosp. Rev. (Kettering Health Network Obligated Group Proj.) Series 2021, 5% 8/1/23 | 485,000 | 534,650 | |
| Ohio Higher Edl. Facility Commission Rev.: | |||
| (Case Western Reserve Univ. Proj.) Series 2016, 5% 12/1/22 | 585,000 | 627,102 | |
| (Xavier Univ. 2020 Proj.) Series 2020, 5% 5/1/24 | 490,000 | 552,448 | |
| Ohio Hosp. Facilities Rev. Series 2017 A: | |||
| 5% 1/1/22 | 35,000 | 35,994 | |
| 5% 1/1/23 | 45,000 | 48,446 | |
| 5% 1/1/24 | 40,000 | 44,865 | |
| 5% 1/1/25 | 45,000 | 52,375 | |
| Ohio Hsg. Fin. Agcy. Residential Mtg. Rev. (Mtg. Backed Securities Prog.) Series 2019 B, 4.5% 3/1/50 | 45,000 | 50,668 | |
| Ohio Spl. Oblig. Series 2020 A, 5% 2/1/22 | 185,000 | 191,036 | |
| Scioto County Hosp. Facilities Rev.: | |||
| Series 2016: | |||
| 5% 2/15/22 | 25,000 | 25,825 | |
| 5% 2/15/23 | 45,000 | 48,571 | |
| 5% 2/15/24 | 35,000 | 39,232 | |
| 5% 2/15/25 | 35,000 | 40,613 | |
| 5% 2/15/26 | 405,000 | 484,913 | |
| Series 2019, 5% 2/15/29 | 900,000 | 1,058,950 | |
| Toledo Gen. Oblig. Series 2020: | |||
| 3% 12/1/24 | 510,000 | 545,772 | |
| 3% 12/1/24 | 425,000 | 454,810 | |
| Univ. of Akron Gen. Receipts Series 2019 A: | |||
| 5% 1/1/24 | 300,000 | 335,415 | |
| 5% 1/1/25 | 400,000 | 462,767 | |
| Univ. of Toledo Gen. Receipts Series 2013 C, 5% 6/1/22 | 260,000 | 271,935 | |
| TOTAL OHIO | 35,600,547 | ||
| Oklahoma - 0.1% | |||
| Beckham Independent School District#6 Elk City Series 2019, 2% 7/1/21 | 1,405,000 | 1,407,043 | |
| Oklahoma County Fin. Auth. Edl. Facilities: | |||
| (Jones Pub. Schools Proj.) Series 2020: | |||
| 4% 9/1/21 | 200,000 | 201,634 | |
| 4% 9/1/22 | 305,000 | 317,498 | |
| (Midwest City- Del City School Dis Proj.) Series 2018, 5% 10/1/21 | 240,000 | 243,777 | |
| Oklahoma County Independent School District No. 9 Series 2018, 2.5% 6/1/21 | 1,535,000 | 1,535,000 | |
| Oklahoma Dev. Fin. Auth. Health Sys. Rev. Series 2020 C, 0.15% 8/15/31 (a) | 1,000,000 | 1,000,000 | |
| Oklahoma Dev. Fin. Auth. Rev.: | |||
| (Oklahoma City Univ. Proj.) Series 2019, 5% 8/1/23 | 560,000 | 606,528 | |
| Series 2004 A, 2.375% 12/1/21 (a) | 30,000 | 30,316 | |
| Oklahoma Hsg. Fin. Agcy. Collateralized Bonds Series 2019, 1.6%, tender 1/1/22 | 185,000 | 186,563 | |
| Oklahoma Tpk. Auth. Tpk. Rev. Series 2017 D, 5% 1/1/25 | 205,000 | 238,597 | |
| Tulsa County Indl. Auth. Edl. Facilities Lease Rev. (Berryhill Pub. School Proj.) Series 2020: | |||
| 4% 9/1/24 | 445,000 | 487,339 | |
| 4% 9/1/25 | 690,000 | 769,874 | |
| Univ. of Oklahoma Gen. Rev. Series 2020 B, 4% 7/1/24 | 490,000 | 543,119 | |
| TOTAL OKLAHOMA | 7,567,288 | ||
| Oregon - 0.3% | |||
| Oregon Bus. Dev. Commission Bonds Series 250, 5%, tender 3/1/22 (a)(b) | 2,970,000 | 3,072,041 | |
| Oregon Bus. Dev. Commission Recovery Zone Facility Bonds (Intel Corp. Proj.) Series 232, 2.4%, tender 8/14/23 (a) | 770,000 | 803,401 | |
| Oregon Facilities Auth. Rev. Series 2011 C, 5% 10/1/21 | 550,000 | 558,898 | |
| Oregon Gen. Oblig. Series 2021 A, 5% 5/1/24 | 1,500,000 | 1,707,549 | |
| Port of Morrow Full Faith and Cr. Obligations Series 2021 D: | |||
| 4% 12/1/22 | 135,000 | 142,155 | |
| 4% 12/1/23 | 110,000 | 119,289 | |
| 4% 12/1/24 | 150,000 | 166,764 | |
| 4% 12/1/25 | 150,000 | 170,291 | |
| Port of Portland Arpt. Rev.: | |||
| Series 2015 23, 5% 7/1/23 | 275,000 | 302,124 | |
| Series 26 C: | |||
| 5% 7/1/21 (b) | 1,815,000 | 1,821,767 | |
| 5% 7/1/22 (b) | 1,300,000 | 1,364,886 | |
| 5% 7/1/23 (b) | 2,000,000 | 2,188,483 | |
| 5% 7/1/24 (b) | 1,000,000 | 1,135,665 | |
| TOTAL OREGON | 13,553,313 | ||
| Pennsylvania - 2.6% | |||
| Albert Gallatin Area School District Series 2020 A, 4% 9/1/21 | 400,000 | 403,569 | |
| Allegheny County Hosp. Dev. Auth. Rev.: | |||
| Series 2019 A, 5% 7/15/21 | 350,000 | 352,046 | |
| Series 2021 B: | |||
| 5% 10/15/23 (c) | 950,000 | 1,047,621 | |
| 5% 10/15/24 (c) | 705,000 | 805,897 | |
| 5% 10/15/25 (c) | 740,000 | 873,541 | |
| Allegheny County Sanitation Auth. Swr. Rev. Series 2020 A, 4% 6/1/24 | 300,000 | 332,035 | |
| Bethlehem Area School District Auth. Bonds (School District Rfdg. Proj.) Series 2018 A, 1 month U.S. LIBOR + 0.480% 0.543%, tender 6/3/21 (a)(d) | 3,985,000 | 3,984,794 | |
| Butler Area School District Series 2018, 5% 10/1/22 | 1,250,000 | 1,330,075 | |
| Chester County Health & Ed. Auth. Rev. Series 2017, 5% 11/1/21 | 160,000 | 160,627 | |
| Chester County Health & Ed. Facilities Auth. Health Sys. Rev. Series C, 3% 9/1/23 | 245,000 | 260,648 | |
| Coatesville Area School District Series 2017, 5% 8/1/23 (FSA Insured) | 710,000 | 780,732 | |
| Commonwealth Fing. Auth. Rev.: | |||
| Series 2019 B, 5% 6/1/24 | 275,000 | 311,402 | |
| Series 2020 A, 5% 6/1/23 | 350,000 | 381,735 | |
| Commonwealth Fing. Auth. Tobacco Series 2018, 5% 6/1/21 | 1,000,000 | 1,000,000 | |
| Cumberland County Muni. Auth. Rev. Bonds Series 2014 T1, 3.75%, tender 4/30/22 (a) | 1,000,000 | 1,004,906 | |
| Delaware County Auth. Rev. Series 2015, 5% 8/1/22 | 475,000 | 501,258 | |
| Delaware County Auth. Univ. Rev. Series 2020: | |||
| 4% 10/1/22 | 190,000 | 198,269 | |
| 5% 10/1/23 | 240,000 | 261,936 | |
| Delaware Valley Reg'l. Fin. Auth. Local Govt. Rev. Bonds Series 2018 B, SIFMA Municipal Swap Index + 0.420% 0.47%, tender 9/1/22 (a)(d) | 5,000,000 | 4,991,766 | |
| Easton Area School District Series 2013 A, 5% 4/1/23 | 705,000 | 716,203 | |
| Geisinger Auth. Health Sys. Rev.: | |||
| Series 2020 A, 5% 4/1/22 | 6,075,000 | 6,320,323 | |
| Series A1, 5% 6/1/22 | 225,000 | 225,000 | |
| Hollidaysburg Area School District Series 2020, 4% 7/15/22 | 500,000 | 520,895 | |
| Lancaster County Hosp. Auth. Health Ctr. Rev. Series 2016 A, 4% 8/15/22 | 470,000 | 492,073 | |
| Laurel Highlands School District Series 2021: | |||
| 4% 2/1/24 | 635,000 | 689,922 | |
| 4% 2/1/25 | 345,000 | 384,287 | |
| Lehigh County Gen. Purp. Hosp. Rev. Series 2019 A, 5% 7/1/21 | 1,000,000 | 1,003,910 | |
| Lehigh County Indl. Dev. Auth. Poll. Cont. Rev. Bonds: | |||
| (PPL Elec. Utils. Corp. Proj.) Series 2016 A, 1.8%, tender 9/1/22 (a) | 2,405,000 | 2,448,962 | |
| Series B, 1.8%, tender 8/15/22 (a) | 1,595,000 | 1,623,119 | |
| Monroeville Fin. Auth. UPMC Rev. Series 2012: | |||
| 3% 2/15/23 | 340,000 | 351,627 | |
| 5% 2/15/22 | 290,000 | 299,973 | |
| Montgomery County Higher Ed. & Health Auth. Hosp. Rev. Series 2012 A, 5% 6/1/21 | 400,000 | 400,000 | |
| Montgomery County Higher Ed. & Health Auth. Rev.: | |||
| Series 2014 A, 5% 10/1/23 | 5,000 | 5,417 | |
| Series 2017, 3% 12/1/21 | 155,000 | 156,572 | |
| Series 2019: | |||
| 5% 9/1/23 | 500,000 | 550,191 | |
| 5% 9/1/26 | 1,250,000 | 1,514,663 | |
| Neshannock Township School District Gen. Oblig. Series 2021 B: | |||
| 2% 9/1/22 (c) | 115,000 | 117,382 | |
| 2% 9/1/23 (c) | 325,000 | 336,814 | |
| New Kensington-Arnold School District Series 2019 A, 4% 5/15/22 | 975,000 | 1,007,930 | |
| Octorara Area School District Chester and Lancaster Counties Series 2020, 4% 4/1/23 | 700,000 | 746,073 | |
| Parkland School District Series 2021 A, 3% 2/1/24 | 225,000 | 240,385 | |
| Pennsylvania Econ. Dev. Fing. Auth.: | |||
| (Philadelphia Biosolids Facility Proj.) Series 2020, 3% 1/1/22 | 360,000 | 364,107 | |
| Series 2017 A, 5% 11/15/23 | 225,000 | 250,976 | |
| Series 2020 A, 5% 4/15/22 | 500,000 | 521,271 | |
| Series 2021 A, 4% 10/15/23 | 425,000 | 462,469 | |
| Pennsylvania Econ. Dev. Fing. Auth. Indl. Dev. Rev. (The Pennsylvania Rapid Bridge Replacement Proj.) Series 2015, 5% 6/30/22 (b) | 1,495,000 | 1,569,094 | |
| Pennsylvania Econ. Dev. Fing. Auth. Solid Waste Disp. Rev. Bonds: | |||
| (Republic Svcs., Inc. Proj.) Series 2019 A, 0.18%, tender 7/15/21 (a)(b) | 900,000 | 899,989 | |
| (Republic Svcs., Inc. Proj.) Series 2014, 0.22%, tender 7/1/21 (a)(b) | 3,000,000 | 3,000,072 | |
| (Waste Mgmt., Inc. Proj.) Series 2013, 0.2%, tender 8/2/21 (a)(b) | 7,000,000 | 7,000,116 | |
| (Waste Mgmt., Inc. Proj.): | |||
| Series 2004 A, 2.625%, tender 11/1/21 (a)(b) | 600,000 | 605,707 | |
| Series 2009, 2.8%, tender 12/1/21 (a) | 600,000 | 607,870 | |
| Series 2017 A, 0.7%, tender 8/2/21 (a)(b) | 500,000 | 500,383 | |
| Series 2021 A, SIFMA Municipal Swap Index + 0.400% 0.45%, tender 6/3/24 (a)(b)(d) | 1,365,000 | 1,365,001 | |
| Series 2011, 2.15%, tender 7/1/24 (a)(b) | 775,000 | 816,481 | |
| Pennsylvania Gen. Oblig.: | |||
| Series 2011: | |||
| 5% 7/1/21 | 300,000 | 301,168 | |
| 5% 11/15/21 | 225,000 | 229,923 | |
| Series 2012 1, 5% 6/1/22 (Escrowed to Maturity) | 355,000 | 372,370 | |
| Series 2015 1: | |||
| 5% 8/15/23 | 780,000 | 861,567 | |
| 5% 3/15/25 | 425,000 | 497,980 | |
| Series 2016: | |||
| 5% 9/15/21 | 750,000 | 760,371 | |
| 5% 9/15/21 | 250,000 | 253,457 | |
| 5% 1/15/22 | 290,000 | 298,680 | |
| Pennsylvania Higher Edl. Facilities Auth. Rev.: | |||
| Bonds: | |||
| (AICUP Fing. Prog. Mount Aloysius College Proj.) Series 2011 R1, 1%, tender 11/1/41 (a) | 1,450,000 | 1,450,201 | |
| (Aicup Fing. Prog.-York College of Pennsylvania Proj.) Series 2014 T3, 3%, tender 4/30/22 (a) | 1,470,000 | 1,493,834 | |
| Series 2012 A, 5% 8/15/21 | 335,000 | 338,339 | |
| Series 2014: | |||
| 5% 12/1/21 | 5,000 | 5,122 | |
| 5% 12/1/22 | 20,000 | 21,461 | |
| Series 2015: | |||
| 5% 8/15/21 | 850,000 | 858,471 | |
| 5% 8/15/22 | 435,000 | 460,657 | |
| Pennsylvania Hsg. Fin. Agcy.: | |||
| Bonds: | |||
| Series 2018 127C, 0.633%, tender 10/1/23 (a)(d) | 4,000,000 | 4,018,552 | |
| Series 2019, 1.4%, tender 1/1/23 (a) | 4,500,000 | 4,570,274 | |
| Series 2021 134 B, 5% 10/1/23 (b) | 1,000,000 | 1,104,852 | |
| Series 2021 135 B: | |||
| 5% 4/1/22 (b)(c) | 390,000 | 403,811 | |
| 5% 10/1/22 (b)(c) | 660,000 | 698,857 | |
| 5% 4/1/23 (b)(c) | 660,000 | 713,455 | |
| 5% 10/1/23 (b)(c) | 1,025,000 | 1,129,835 | |
| 5% 4/1/24 (b)(c) | 600,000 | 672,862 | |
| 5% 10/1/24 (b)(c) | 805,000 | 918,497 | |
| 5% 4/1/25 (b)(c) | 180,000 | 208,501 | |
| Pennsylvania Hsg. Fin. Agcy. Multifamily Hsg. Dev. Rev. Bonds Series 2018, 2.45%, tender 7/1/21 (a) | 2,000,000 | 2,003,649 | |
| Pennsylvania Hsg. Fin. Agcy. Single Family Mtg. Rev. Series 114A, 2.9% 10/1/21 (b) | 585,000 | 590,072 | |
| Pennsylvania Indl. Dev. Auth. Rev. Series 2012, 5% 7/1/21 | 335,000 | 336,299 | |
| Pennsylvania Pub. School Bldg. Auth. School Rev. (The School District of The City of Harrisburg Proj.) Series 2016 A: | |||
| 5% 12/1/21 | 90,000 | 92,062 | |
| 5% 12/1/21 (Escrowed to Maturity) | 20,000 | 20,485 | |
| Pennsylvania Tpk. Commission Tpk. Rev.: | |||
| Series 2018 A1, SIFMA Municipal Swap Index + 0.430% 0.48% 12/1/21 (a)(d) | 3,500,000 | 3,500,834 | |
| Series 2018 B, SIFMA Municipal Swap Index + 0.500% 0.55% 12/1/21 (a)(d) | 3,460,000 | 3,460,999 | |
| Philadelphia Arpt. Rev.: | |||
| Series 2011 A: | |||
| 5% 6/15/21 (b) | 1,725,000 | 1,727,980 | |
| 5% 6/15/22 (b) | 1,400,000 | 1,404,832 | |
| 5% 6/15/23 (b) | 470,000 | 472,680 | |
| Series 2015 A, 5% 6/15/24 (b) | 1,315,000 | 1,491,078 | |
| Series 2017 A, 5% 7/1/24 | 40,000 | 45,691 | |
| Series 2017 B: | |||
| 5% 7/1/21 (b) | 2,800,000 | 2,810,785 | |
| 5% 7/1/22 (b) | 2,440,000 | 2,565,881 | |
| 5% 7/1/24 (b) | 660,000 | 750,626 | |
| 5% 7/1/25 (b) | 440,000 | 517,365 | |
| Series 2020 C: | |||
| 5% 7/1/21 (b) | 7,500,000 | 7,528,889 | |
| 5% 7/1/22 (b) | 2,750,000 | 2,891,874 | |
| 5% 7/1/23 (b) | 8,930,000 | 9,771,577 | |
| Philadelphia Auth. for Indl. Dev. Series 2020 C, 4% 11/1/24 | 535,000 | 593,588 | |
| Philadelphia Auth. Indl. Dev. Lease Rev. Series 2019, 5% 10/1/21 | 500,000 | 507,683 | |
| Philadelphia Gas Works Rev.: | |||
| Series 14, 5% 10/1/22 | 390,000 | 414,821 | |
| Series 15, 5% 8/1/21 | 25,000 | 25,197 | |
| Series 2015 13, 5% 8/1/21 | 1,350,000 | 1,360,625 | |
| Series 2017 15, 5% 8/1/22 | 480,000 | 506,767 | |
| Philadelphia Gen. Oblig. Series 2019 A, 5% 8/1/21 | 250,000 | 251,989 | |
| Philadelphia School District Series 2019 A: | |||
| 5% 9/1/21 | 115,000 | 116,354 | |
| 5% 9/1/23 | 185,000 | 203,089 | |
| Phoenixville Area School District Gen. Oblig. Series 2016 B, 4% 8/15/21 | 500,000 | 503,856 | |
| Pittsburgh & Allegheny County Sports & Exhibition Auth. Series 2020, 4% 2/1/23 (FSA Insured) | 1,775,000 | 1,883,575 | |
| Pittsburgh Wtr. & Swr. Auth. Wtr. & Swr. Sys. Rev.: | |||
| Bonds Series 2017 C, 1 month U.S. LIBOR + 0.640% 0.7%, tender 12/1/23 (FSA Insured) (a)(d) | 4,000,000 | 4,038,120 | |
| Series 2019 A: | |||
| 5% 9/1/23 | 270,000 | 298,130 | |
| 5% 9/1/26 (FSA Insured) | 625,000 | 763,079 | |
| Quakertown Gen. Auth. Health Facilities Series 2017 A, 3.125% 7/1/21 | 705,000 | 704,636 | |
| Reading School District Series 2017: | |||
| 5% 3/1/25 (FSA Insured) | 5,000 | 5,796 | |
| 5% 3/1/26 (FSA Insured) | 5,000 | 5,977 | |
| 5% 3/1/27 (FSA Insured) | 5,000 | 6,142 | |
| 5% 3/1/28 (FSA Insured) | 5,000 | 6,152 | |
| Southcentral Pennsylvania Gen. Auth. Rev. Series 2021 TT2: | |||
| 5% 5/1/24 | 210,000 | 235,594 | |
| 5% 5/1/25 | 340,000 | 392,645 | |
| 5% 5/1/26 | 320,000 | 378,928 | |
| Southeastern Pennsylvania Trans. Auth. Rev. Series 2020: | |||
| 5% 6/1/21 | 500,000 | 500,000 | |
| 5% 6/1/22 | 1,000,000 | 1,048,892 | |
| 5% 6/1/23 | 750,000 | 821,636 | |
| Township of East Vincent Gen. Oblig. Series 2021: | |||
| 3% 12/1/23 | 200,000 | 213,226 | |
| 3% 12/1/24 | 250,000 | 272,042 | |
| Westmoreland County Indl. Dev. Auth. (Excela Health Proj.) Series 2020 A: | |||
| 4% 7/1/23 | 350,000 | 375,669 | |
| 4% 7/1/24 | 450,000 | 496,886 | |
| TOTAL PENNSYLVANIA | 138,655,963 | ||
| Rhode Island - 0.1% | |||
| Rhode Is Comm Corp. Spl. Facilities Rev. Series 2018, 5% 7/1/21 | 685,000 | 687,373 | |
| Rhode Island Comm Corp. Rev. Series 2016 A: | |||
| 5% 6/15/21 | 350,000 | 350,612 | |
| 5% 6/15/24 | 1,010,000 | 1,151,153 | |
| Rhode Island Health & Edl. Bldg. Corp. Higher Ed. Facilities Rev. Series 2016: | |||
| 5% 5/15/22 | 295,000 | 307,649 | |
| 5% 5/15/23 | 25,000 | 27,049 | |
| 5% 5/15/24 | 160,000 | 179,287 | |
| 5% 5/15/25 | 120,000 | 138,737 | |
| Rhode Island Health & Edl. Bldg. Corp. Pub. Schools Rev. Series 2015, 5% 5/15/25 (FSA Insured) | 130,000 | 153,123 | |
| Rhode Island Health and Edl. Bldg. Corp. Higher Ed. Facility Rev. Series 2012 B, 5% 11/1/21 | 440,000 | 448,671 | |
| Rhode Island Hsg. & Mtg. Fin. Corp. Series 2019 70, 4% 10/1/49 | 100,000 | 110,691 | |
| Rhode Island Student Ln. Auth. Student Ln. Rev.: | |||
| Series 2019 A, 5% 12/1/28 (b) | 490,000 | 615,926 | |
| Series A, 4% 12/1/26 (b) | 540,000 | 593,724 | |
| Tobacco Settlement Fing. Corp. Series 2015 A: | |||
| 5% 6/1/21 | 555,000 | 555,000 | |
| 5% 6/1/26 | 75,000 | 88,664 | |
| 5% 6/1/27 | 20,000 | 23,540 | |
| TOTAL RHODE ISLAND | 5,431,199 | ||
| South Carolina - 0.4% | |||
| Charleston County Arpt. District Series 2013 A, 5.25% 7/1/22 (b) | 1,235,000 | 1,301,352 | |
| Lancaster County School District ( South Carolina Gen. Oblig. Proj.) Series 2017, 5% 3/1/22 | 45,000 | 46,649 | |
| Laurens County Wtr. & Swr. Cmnty. Wtrwks. Series 2020, 1.375% 2/1/22 (Pre-Refunded to 7/1/21 @ 100) | 3,000,000 | 3,002,642 | |
| Patriots Energy Group Fing. Agcy. Bonds Series 2018 A, 4%, tender 2/1/24 (a) | 9,000,000 | 9,809,441 | |
| Richland County School District #2 Gen. Oblig. (South Carolina Gen. Oblig. Proj.) Series 2015 A, 5% 2/1/23 | 85,000 | 91,802 | |
| Scago Edl. Facilities Corp. for Colleton School District (School District of Colleton County Proj.) Series 2015: | |||
| 5% 12/1/23 | 95,000 | 105,877 | |
| 5% 12/1/26 | 25,000 | 29,141 | |
| South Carolina Hsg. Fin. & Dev. Auth. Mtg. Rev. Series 2019 A, 4% 1/1/50 | 125,000 | 140,303 | |
| South Carolina Ports Auth. Ports Rev.: | |||
| Series 2015, 5.25% 7/1/55 (Pre-Refunded to 7/1/25 @ 100) (b) | 175,000 | 208,143 | |
| Series 2019 B: | |||
| 5% 7/1/22 (b) | 310,000 | 325,230 | |
| 5% 7/1/26 (b) | 185,000 | 222,844 | |
| South Carolina Pub. Svc. Auth. Rev.: | |||
| Series 2011 B, 5% 12/1/21 (Escrowed to Maturity) | 910,000 | 932,067 | |
| Series 2014 C: | |||
| 5% 12/1/22 | 25,000 | 26,776 | |
| 5% 12/1/23 | 110,000 | 122,741 | |
| Series 2015 A, 5% 12/1/21 (Escrowed to Maturity) | 225,000 | 230,456 | |
| Series 2015 C: | |||
| 5% 12/1/21 | 890,000 | 911,070 | |
| 5% 12/1/22 | 560,000 | 599,777 | |
| Series A: | |||
| 5% 12/1/21 | 530,000 | 542,547 | |
| 5% 12/1/21 | 350,000 | 358,286 | |
| 5% 12/1/22 | 750,000 | 803,273 | |
| 5% 12/1/23 | 620,000 | 691,810 | |
| 5% 12/1/23 | 1,015,000 | 1,132,560 | |
| 5% 12/1/24 | 365,000 | 422,481 | |
| TOTAL SOUTH CAROLINA | 22,057,268 | ||
| South Dakota - 0.1% | |||
| South Dakota Board of Regents Hsg. and Auxiliary Facilities Series 2021: | |||
| 3% 4/1/22 | 250,000 | 255,862 | |
| 3% 4/1/23 | 275,000 | 288,451 | |
| 3% 4/1/24 | 425,000 | 455,275 | |
| 3% 4/1/25 | 500,000 | 544,802 | |
| South Dakota Health & Edl. Facilities Auth. Rev.: | |||
| Series 2014 B: | |||
| 4% 11/1/21 | 10,000 | 10,158 | |
| 5% 11/1/22 | 10,000 | 10,677 | |
| Series 2020 A: | |||
| 5% 9/1/21 | 190,000 | 192,270 | |
| 5% 9/1/22 | 140,000 | 148,414 | |
| 5% 9/1/23 | 335,000 | 370,780 | |
| South Dakota Hsg. Dev. Auth. Series 2017 D, 4% 11/1/47 | 895,000 | 972,884 | |
| TOTAL SOUTH DAKOTA | 3,249,573 | ||
| Tennessee - 1.1% | |||
| Greeneville Health & Edl. Facilities Board Series 2018 A, 5% 7/1/22 | 1,500,000 | 1,576,042 | |
| Lewisburg Indl. Dev. Board Bonds (Waste Mgmt. Tennessee Proj.) Series 2012, 0.2%, tender 8/2/21 (a)(b) | 5,000,000 | 5,000,083 | |
| Memphis Health, Edl. & Hsg. Facilities Board Bonds Series 2020, 0.25%, tender 12/1/22 (a) | 1,250,000 | 1,252,537 | |
| Memphis-Shelby County Arpt. Auth. Arpt. Rev.: | |||
| Series 2021 B, 5% 7/1/22 (b) | 400,000 | 420,367 | |
| Series 2021 C: | |||
| 5% 7/1/22 (b) | 400,000 | 420,367 | |
| 5% 7/1/23 (b) | 1,750,000 | 1,918,377 | |
| 5% 7/1/24 (b) | 1,850,000 | 2,103,418 | |
| Metropolitan Nashville Arpt. Auth. Rev.: | |||
| Series 2015 B, 5% 7/1/21 (b) | 300,000 | 301,141 | |
| Series 2019 B, 5% 7/1/25 (b) | 1,810,000 | 2,120,261 | |
| Tennergy Corp. Gas Rev.: | |||
| Bonds Series 2019 A, 5%, tender 10/1/24 (a) | 10,650,000 | 12,191,723 | |
| Series 2021 A: | |||
| 4% 9/1/22 | 335,000 | 350,486 | |
| 4% 3/1/23 | 350,000 | 372,266 | |
| 4% 9/1/23 | 275,000 | 297,241 | |
| 4% 3/1/24 | 300,000 | 328,742 | |
| Tennessee Energy Acquisition Corp.: | |||
| Bonds (Gas Rev. Proj.) Series A, 4%, tender 5/1/23 (a) | 10,000,000 | 10,649,949 | |
| Series 2006 A, 5.25% 9/1/21 | 20,725,000 | 20,981,217 | |
| Series 2018, 5% 11/1/22 | 1,500,000 | 1,598,265 | |
| TOTAL TENNESSEE | 61,882,482 | ||
| Texas - 4.9% | |||
| Alamito Pub. Facilities Corp. Bonds: | |||
| (Cramer Three Apts. Proj.) Series 2018, 0.25%, tender 11/1/21 (a) | 10,000,000 | 9,999,452 | |
| Series 2019, 1.51%, tender 5/1/22 (a) | 6,000,000 | 6,026,923 | |
| Aledo Independent School District Series 2015, 0% 2/15/24 | 25,000 | 24,738 | |
| Atascosa County Indl. Dev. Corp. Poll. Cont. Rev. Series 2020: | |||
| 5% 12/15/21 | 975,000 | 997,375 | |
| 5% 12/15/23 | 450,000 | 493,860 | |
| 5% 12/15/24 | 550,000 | 619,881 | |
| Austin Affordable Pfc, Inc. Multifamily Hsg. Rev. Bonds Series 2019, 1.46%, tender 6/1/22 (a) | 700,000 | 708,897 | |
| Austin Arpt. Sys. Rev.: | |||
| Series 2014, 5% 11/15/26 (b) | 715,000 | 820,744 | |
| Series 2019 B, 5% 11/15/22 (b) | 600,000 | 640,551 | |
| Series 2019: | |||
| 5% 11/15/21 (b) | 2,505,000 | 2,557,958 | |
| 5% 11/15/22 (b) | 585,000 | 624,538 | |
| 5% 11/15/23 (b) | 500,000 | 556,030 | |
| 5% 11/15/24 (b) | 515,000 | 593,265 | |
| Austin Elec. Util. Sys. Rev. Series 2015 A, 5% 11/15/21 | 500,000 | 511,103 | |
| Austin Gen. Oblig. Series 2019, 5% 5/1/25 | 780,000 | 919,216 | |
| Austin-Bergstrom Landhost Ente Series 2017, 5% 10/1/21 | 280,000 | 283,708 | |
| Burleson Independent School District Bonds Series 2018, 2.5%, tender 8/1/22 (a) | 5,000,000 | 5,138,361 | |
| Cap. Area Hsg. Fin. Corp. Multi-family Hsg. Rev. Bonds Series 2019, 2.1%, tender 9/1/22 (a) | 2,800,000 | 2,807,626 | |
| Central Reg'l. Mobility Auth.: | |||
| Series 2016: | |||
| 5% 1/1/22 | 35,000 | 35,949 | |
| 5% 1/1/23 | 55,000 | 59,002 | |
| 5% 1/1/24 | 75,000 | 83,689 | |
| 5% 1/1/26 | 75,000 | 89,396 | |
| Series 2020 B: | |||
| 5% 1/1/22 | 155,000 | 159,201 | |
| 5% 1/1/23 | 220,000 | 236,009 | |
| 5% 1/1/25 | 125,000 | 144,374 | |
| 5% 1/1/26 | 125,000 | 148,994 | |
| Series 2020 F, 5% 1/1/25 | 2,000,000 | 2,273,684 | |
| Clear Creek Independent School District Series 2019, 5% 2/15/25 | 500,000 | 584,792 | |
| Coastal Bend Health Facilities Dev. Corp. Series 2005 B2, 0.25%, tender 7/1/31 (FSA Insured) (a) | 4,675,000 | 4,675,000 | |
| Corpus Christi Gen. Oblig. Series 2015, 5% 3/1/24 | 1,955,000 | 2,208,793 | |
| Cypress-Fairbanks Independent School District: | |||
| Bonds: | |||
| Series 2015 B2, 2.125%, tender 8/16/21 (a) | 4,000,000 | 4,015,811 | |
| Series 2017 A-2, 1.25%, tender 8/15/22 (a) | 3,000,000 | 3,038,184 | |
| Series 2017 A1, 2.125%, tender 8/16/21 (a) | 7,030,000 | 7,057,787 | |
| Series 2020 A, 5% 2/15/25 | 200,000 | 233,997 | |
| Dallas Fort Worth Int'l. Arpt. Rev.: | |||
| Series 2012 C, 5% 11/1/21 | 305,000 | 311,101 | |
| Series 2013 A, 5% 11/1/28 (b) | 1,000,000 | 1,065,216 | |
| Series 2013 F: | |||
| 5% 11/1/21 | 75,000 | 76,500 | |
| 5% 11/1/22 | 240,000 | 256,324 | |
| Series 2014 A: | |||
| 4% 11/1/23 (b) | 200,000 | 216,877 | |
| 5.25% 11/1/26 (b) | 400,000 | 446,356 | |
| Series 2014 B: | |||
| 5% 11/1/22 (b) | 100,000 | 106,713 | |
| 5% 11/1/29 (b) | 515,000 | 548,586 | |
| Series 2014 C: | |||
| 5% 11/1/21 | 250,000 | 255,001 | |
| 5% 11/1/22 | 550,000 | 587,410 | |
| Series 2014 D, 5% 11/1/21 (b) | 2,515,000 | 2,564,667 | |
| Series 2014 E, 5% 11/1/21 | 1,105,000 | 1,127,103 | |
| Series 2020 A: | |||
| 5% 11/1/23 | 2,250,000 | 2,505,334 | |
| 5% 11/1/24 | 225,000 | 260,098 | |
| Series 2020 B: | |||
| 5% 11/1/21 | 4,605,000 | 4,697,112 | |
| 5% 11/1/22 | 3,000,000 | 3,204,053 | |
| Dallas Gen. Oblig. Series 2020 A: | |||
| 5% 2/15/23 | 2,020,000 | 2,186,072 | |
| 5% 2/15/24 | 1,000,000 | 1,126,979 | |
| Dallas Independent School District Bonds: | |||
| Series 2016, 5%, tender 2/15/22 (a) | 5,000 | 5,171 | |
| Series B6: | |||
| 5%, tender 2/15/22 (a) | 100,000 | 103,420 | |
| 5%, tender 2/15/22 (a) | 100,000 | 103,463 | |
| Denton Independent School District Series 2016, 0% 8/15/25 | 35,000 | 34,170 | |
| El Paso Independent School District Bonds Series 2020, 2.5%, tender 8/1/21 (a) | 2,500,000 | 2,509,828 | |
| Fort Bend County Muni. Util. District Series 2021, 2% 4/1/24 | 750,000 | 782,578 | |
| Fort Bend Independent School District Bonds: | |||
| Series 2019 A, 1.95%, tender 8/1/22 (a) | 5,585,000 | 5,703,834 | |
| Series 2020 B, 0.875%, tender 8/1/25 (a) | 3,965,000 | 3,995,475 | |
| Series D, 1.5%, tender 8/1/21(a) | 70,000 | 70,161 | |
| Fort Worth Gen. Oblig.: | |||
| Series 2015 A, 5% 3/1/23 | 35,000 | 37,951 | |
| Series 2016, 5% 3/1/25 | 120,000 | 140,324 | |
| Series 2019, 5% 3/1/24 | 4,520,000 | 5,101,447 | |
| Fort Worth Independent School District Series 2015, 5% 2/15/22 | 35,000 | 36,214 | |
| Goose Creek Consolidated Independent School District Bonds Series 2019 B, 0.27%, tender 10/1/21 (a) | 3,000,000 | 3,001,685 | |
| Grand Parkway Trans. Corp. Bonds Series 2018 B, 5%, tender 10/1/23 (a) | 1,755,000 | 1,938,582 | |
| Harris County Cultural Ed. Facilities Fin. Corp. Med. Facilities Rev.: | |||
| (Baylor College of Medicine Proj.) Series 2012 A, 5% 11/15/37 (Pre-Refunded to 11/15/22 @ 100) | 435,000 | 465,605 | |
| Series 2012 A: | |||
| 5% 11/15/21 (Escrowed to Maturity) | 200,000 | 204,416 | |
| 5% 11/15/22 (Escrowed to Maturity) | 245,000 | 262,237 | |
| Series 2016, 5% 11/15/21 | 995,000 | 1,015,759 | |
| Harris County Cultural Ed. Facilities Fin. Corp. Rev.: | |||
| Bonds: | |||
| Series 2019 B, 5%, tender 12/1/22 (a) | 5,000,000 | 5,343,541 | |
| Series 2019 C, SIFMA Municipal Swap Index + 0.420% 0.47%, tender 12/1/22 (a)(d) | 3,250,000 | 3,240,808 | |
| Series 2020 A, 0.9%, tender 5/15/25 (a) | 1,770,000 | 1,770,621 | |
| Series 2020 C, 5%, tender 12/1/22 (a) | 6,710,000 | 7,189,507 | |
| Series 2013 A, 5% 12/1/21 | 450,000 | 460,928 | |
| Series 2013 B, SIFMA Municipal Swap Index + 0.900% 0.95% 6/1/22 (a)(d) | 600,000 | 601,926 | |
| Series 2014 A, 5% 12/1/26 | 120,000 | 137,859 | |
| Series 2019 A, 5% 12/1/21 | 2,310,000 | 2,366,097 | |
| Series 2020, 5% 6/1/22 | 1,000,000 | 1,048,685 | |
| Harris County Gen. Oblig.: | |||
| Series 2011 A, 5% 10/1/22 (Pre-Refunded to 10/1/21 @ 100) | 275,000 | 279,387 | |
| Series 2012 B, 1.45% 8/15/21 (a) | 4,075,000 | 4,086,207 | |
| Harris County Health Facilities Dev. Corp. Rev.: | |||
| Series 2005 A4, 0.12%, tender 7/1/31 (FSA Insured) (a) | 1,150,000 | 1,150,000 | |
| Series A3, 0.25%, tender 7/1/31 (FSA Insured) (a) | 4,025,000 | 4,025,000 | |
| Houston Arpt. Sys. Rev.: | |||
| Series 2011 A, 5% 7/1/22 (Pre-Refunded to 7/1/21 @ 100) (b) | 410,000 | 411,560 | |
| Series 2012 A: | |||
| 5% 7/1/21 (b) | 300,000 | 301,128 | |
| 5% 7/1/23 (Pre-Refunded to 7/1/22 @ 100) (b) | 235,000 | 246,906 | |
| 5% 7/1/31 (Pre-Refunded to 7/1/22 @ 100) (b) | 630,000 | 661,918 | |
| Series 2012 B: | |||
| 5% 7/1/21 | 755,000 | 757,933 | |
| 5% 7/1/27 (Pre-Refunded to 7/1/22 @ 100) | 4,000,000 | 4,209,374 | |
| Series 2018 A: | |||
| 5% 7/1/21 (b) | 275,000 | 276,034 | |
| 5% 7/1/22 (b) | 860,000 | 903,309 | |
| Series 2018 B, 5% 7/1/22 | 720,000 | 757,468 | |
| Series 2018 C, 5% 7/1/21 (b) | 635,000 | 637,388 | |
| Series 2020 A, 5% 7/1/23 (b) | 1,000,000 | 1,095,338 | |
| Series A: | |||
| 5% 7/1/21 (b) | 475,000 | 476,787 | |
| 5% 7/1/21 (Escrowed to Maturity) (b) | 200,000 | 200,753 | |
| Houston Independent School District Bonds: | |||
| Series 2012: | |||
| 2.4%, tender 6/1/21 (a) | 2,985,000 | 2,985,000 | |
| 4%, tender 6/1/23 (a) | 1,000,000 | 1,074,936 | |
| Series 2013 B, 2.4%, tender 6/1/21 (a) | 3,100,000 | 3,100,000 | |
| Houston Util. Sys. Rev.: | |||
| Bonds Series 2018 C, 1 month U.S. LIBOR + 0.360% 0.423%, tender 6/3/21 (a)(d) | 8,245,000 | 8,246,316 | |
| Series 2018 D, 5% 11/15/21 | 290,000 | 296,467 | |
| Irving Hosp. Auth. Hosp. Rev. Series 2017 A, 5% 10/15/21 | 65,000 | 66,134 | |
| Jacksonville Independent School District Series 2020, 5% 2/15/24 | 1,915,000 | 2,157,056 | |
| Katy Independent School District Bonds Series 2015 C, 1 month U.S. LIBOR + 0.280% 0.348%, tender 6/15/21 (a)(d) | 4,800,000 | 4,800,239 | |
| Klein Independent School District Series 2015 A, 5% 8/1/24 | 225,000 | 258,328 | |
| Leander Independent School District Series 2013 A: | |||
| 0% 8/15/21 | 550,000 | 549,829 | |
| 0% 8/15/23 | 1,000,000 | 993,696 | |
| Love Field Arpt. Modernization Rev.: | |||
| Series 2015, 5% 11/1/23 (b) | 375,000 | 416,113 | |
| Series 2017: | |||
| 5% 11/1/23 (b) | 100,000 | 110,964 | |
| 5% 11/1/24 (b) | 750,000 | 862,852 | |
| Lower Colorado River Auth. Rev.: | |||
| (Lcra Transmission Svcs. Corp. Proj.) Series 2018, 5% 5/15/23 | 265,000 | 289,542 | |
| (LCRA Transmission Svcs. Corp. Proj.): | |||
| Series 2019: | |||
| 5% 5/15/23 | 1,070,000 | 1,169,092 | |
| 5% 5/15/24 | 300,000 | 340,687 | |
| Series 2020: | |||
| 5% 5/15/22 | 1,000,000 | 1,045,828 | |
| 5% 5/15/23 | 215,000 | 234,911 | |
| 5% 5/15/24 | 550,000 | 624,593 | |
| Mansfield Independent School District Series 2016, 5% 2/15/24 | 110,000 | 123,745 | |
| Midland County Pub. Facilities Corp. Bonds Series 2020, 0.35%, tender 6/1/23 (a) | 2,000,000 | 2,004,322 | |
| Mission Econ. Dev. Corp. Solid Waste Disp. Rev. Bonds: | |||
| (Republic Svcs., Inc. Proj.) Series 2008 A, 0.2%, tender 8/2/21 (a)(b) | 17,000,000 | 17,000,282 | |
| (Waste Mgmt., Inc. Proj.) Series 2020 B, 0.2%, tender 6/1/21 (a)(b) | 11,000,000 | 11,000,000 | |
| New Caney Independent School District Bonds Series 2018, 3%, tender 8/15/21 (a) | 1,090,000 | 1,096,407 | |
| Newark Higher Ed. Fin. Corp. (Abilene Christian Univ. Proj.) Series 2016 A, 5% 4/1/26 | 55,000 | 65,471 | |
| North East Texas Independent School District Bonds Series 2013 B, 1.42%, tender 8/1/21 (a) | 460,000 | 460,995 | |
| North Harris County Reg'l. Wtr. Auth. Series 2013, 4% 12/15/22 | 35,000 | 37,013 | |
| North Texas Tollway Auth. Rev.: | |||
| Series 2014 A, 5% 1/1/22 (Escrowed to Maturity) | 400,000 | 411,325 | |
| Series 2015 A, 5% 1/1/22 | 200,000 | 205,623 | |
| Series 2015 B, 5% 1/1/23 | 200,000 | 215,215 | |
| Series 2016 A: | |||
| 5% 1/1/22 | 200,000 | 205,623 | |
| 5% 1/1/23 | 470,000 | 505,756 | |
| Series 2017 A: | |||
| 5% 1/1/22 | 400,000 | 411,245 | |
| 5% 1/1/24 | 605,000 | 651,127 | |
| 5% 1/1/26 | 405,000 | 435,610 | |
| Series 2019 A: | |||
| 5% 1/1/22 | 285,000 | 293,012 | |
| 5% 1/1/23 | 325,000 | 349,725 | |
| Series 2019 B, 5% 1/1/25 | 325,000 | 378,516 | |
| Northside Independent School District Bonds: | |||
| Series 2016, 2%, tender 6/1/21 (a) | 3,205,000 | 3,205,000 | |
| Series 2020, 0.7%, tender 6/1/25 (a) | 5,000,000 | 5,017,759 | |
| Odessa Hsg. Fin. Corp. Multifamily Hsg. Rev. Bonds Series 2020, 0.35%, tender 3/1/23 (a) | 2,500,000 | 2,503,903 | |
| Pearland Gen. Oblig. Series 2020, 5% 3/1/24 | 295,000 | 333,383 | |
| Pflugerville Independent School District Bonds Series 2019 B, 2.5%, tender 8/15/23 (a) | 610,000 | 638,789 | |
| Port Arthur Series 2021: | |||
| 5% 2/15/22 (c) | 185,000 | 190,884 | |
| 5% 2/15/24 (c) | 240,000 | 269,188 | |
| 5% 2/15/24 (c) | 195,000 | 218,716 | |
| Prosper Independent School District: | |||
| Bonds Series 2019 B, 2%, tender 8/15/23 (a) | 1,000,000 | 1,037,130 | |
| Series 2015, 5% 2/15/24 | 250,000 | 281,962 | |
| Round Rock Independent School District Series 2019 A, 5% 8/1/21 | 370,000 | 372,993 | |
| San Antonio Arpt. Sys. Rev. Series 2019 A: | |||
| 5% 7/1/21 (b) | 640,000 | 642,407 | |
| 5% 7/1/21 (b) | 1,330,000 | 1,335,002 | |
| 5% 7/1/22 (b) | 275,000 | 288,849 | |
| 5% 7/1/22 (b) | 265,000 | 278,345 | |
| 5% 7/1/23 (b) | 195,000 | 213,377 | |
| 5% 7/1/25 (b) | 400,000 | 468,566 | |
| 5% 7/1/26 (b) | 500,000 | 604,219 | |
| San Antonio Elec. & Gas Sys. Rev.: | |||
| Bonds Series 2015 B, 2%, tender 12/1/21 (a) | 3,700,000 | 3,704,643 | |
| Series 2012, 5% 2/1/22 | 1,230,000 | 1,270,128 | |
| Series 2016, 5% 2/1/25 (Escrowed to Maturity) | 330,000 | 384,631 | |
| San Antonio Hsg. Trust Fin. Corp. Bonds Series 2019, 1.4%, tender 1/1/22 (a) | 5,000,000 | 5,028,574 | |
| San Antonio Independent School District Series 2015, 5% 2/15/24 | 315,000 | 355,637 | |
| San Antonio Pub. Facilities Corp. and Rfdg. Lease (Convention Ctr. Proj.) Series 2012: | |||
| 5% 9/15/21 | 20,000 | 20,267 | |
| 5% 9/15/22 | 75,000 | 79,475 | |
| San Antonio Wtr. Sys. Rev. Bonds: | |||
| Series 2013 F, 2%, tender 11/1/21 (a) | 1,000,000 | 1,007,192 | |
| Series 2014 B, 2%, tender 11/1/22 (a) | 520,000 | 532,388 | |
| Splendora Independent School District Series 2016 A, 5% 2/15/25 | 200,000 | 232,792 | |
| Tarrant County Cultural Ed. Facilities Fin. Corp. Hosp. Rev. (Scott & White Healthcare Proj.) Series 2013 A: | |||
| 5% 8/15/21 (Escrowed to Maturity) | 15,000 | 15,148 | |
| 5% 8/15/23 (Escrowed to Maturity) | 20,000 | 22,114 | |
| 5% 8/15/28 (Pre-Refunded to 8/15/23 @ 100) | 50,000 | 55,284 | |
| Tarrant County Cultural Ed. Facilities Fin. Corp. Rev.: | |||
| Series 2016 A: | |||
| 5% 2/15/25 | 880,000 | 1,026,401 | |
| 5% 2/15/26 | 35,000 | 42,140 | |
| Series 2017 A, 5% 2/15/24 | 195,000 | 219,535 | |
| Texas A&M Univ. Rev. Series 2021 A: | |||
| 5% 5/15/24 | 1,350,000 | 1,538,663 | |
| 5% 5/15/26 | 725,000 | 883,594 | |
| Texas Gen. Oblig.: | |||
| Bonds Series 2019 C2, 1.85%, tender 8/1/22 (a) | 115,000 | 115,093 | |
| Series 2014 A, 5% 10/1/21 | 200,000 | 203,256 | |
| Texas Muni. Gas Acquisition And Supply Corp. Series 2021: | |||
| 5% 12/15/21 | 1,520,000 | 1,558,295 | |
| 5% 12/15/22 | 1,250,000 | 1,338,848 | |
| 5% 12/15/23 | 3,450,000 | 3,844,219 | |
| Texas State Univ. Sys. Fing. Rev. Series 2019 A, 5% 3/15/24 | 250,000 | 282,731 | |
| Tomball Independent School District Bonds Series 2014 B2, 2.125%, tender 8/15/21 (a) | 1,000,000 | 1,004,160 | |
| Trinity River Auth. Reg'l. Wastewtr. Sys. Rev. Series 2016, 5% 8/1/23 | 35,000 | 38,647 | |
| Tyler Independent School District Series 2017, 5% 2/15/25 | 215,000 | 251,028 | |
| Univ. of Texas Board of Regents Sys. Rev.: | |||
| Series 2010 B, 5% 8/15/21 | 350,000 | 353,495 | |
| Series 2017 C, 5% 8/15/21 | 1,945,000 | 1,964,425 | |
| Weatherford Util. Sys. Rev. Series 2015, 5% 9/1/21 (FSA Insured) | 350,000 | 354,182 | |
| Wichita Falls Independent School District Series 2021, 3% 2/1/23 | 1,400,000 | 1,466,492 | |
| TOTAL TEXAS | 261,626,716 | ||
| Utah - 0.0% | |||
| Intermountain Pwr. Agcy. Pwr. Supply Rev. Series 2018 A, 5% 7/1/21 | 700,000 | 702,748 | |
| Salt Lake City Arpt. Rev. Series 2018 A, 5% 7/1/23 (b) | 250,000 | 273,560 | |
| Utah County Hosp. Rev.: | |||
| Bonds Series 2018 B2, 5%, tender 8/1/24 (a) | 135,000 | 151,683 | |
| Series 2016 B, 5% 5/15/22 | 250,000 | 261,654 | |
| Utah Infrastructure Agcy. Series 2021, 3% 10/15/24 | 500,000 | 538,755 | |
| TOTAL UTAH | 1,928,400 | ||
| Vermont - 0.0% | |||
| Vermont Student Assistant Corp. Ed. Ln. Rev.: | |||
| Series 2017 A, 5% 6/15/23 (b) | 700,000 | 761,792 | |
| Series 2020 A, 5% 6/15/27 (b) | 665,000 | 800,728 | |
| TOTAL VERMONT | 1,562,520 | ||
| Virginia - 1.1% | |||
| Arlington County IDA Hosp. Facilities Series 2020: | |||
| 5% 7/1/23 | 340,000 | 373,311 | |
| 5% 7/1/24 | 425,000 | 485,044 | |
| Charles City County Econ. Dev. Auth. Solid Waste Disp. Rev. Bonds (Waste Mgmt., Inc. Proj.) Series 2003 A, 2.4%, tender 5/2/22 (a)(b) | 1,750,000 | 1,784,752 | |
| Chesapeake Bay Bridge and Tunnel District Gen. Resolution Rev. Series 2019, 5% 11/1/23 | 2,400,000 | 2,660,669 | |
| Chesapeake Trans. Sys. Toll Road Rev. Series 2012 A, 5% 7/15/21 | 10,000 | 10,053 | |
| Fairfax County Indl. Dev. Auth. Bonds (Inova Health Sys. Proj.) Series 2018 B, 5%, tender 5/15/23 (a) | 1,425,000 | 1,556,977 | |
| Fredericksburg Econ. Dev. Auth. Rev. Series 2014, 5% 6/15/24 | 50,000 | 56,890 | |
| Halifax County Indl. Dev. Auth. Bonds (Virginia Elec. and Pwr. Co. Proj.) Series 2010 A, 0.45%, tender 4/1/22 (a) | 6,185,000 | 6,192,688 | |
| Hampton Roads Trans. Accountability Commission Series 2019 A, 5% 7/1/22 | 14,500,000 | 15,259,439 | |
| King George County Indl. Dev. Auth. Solid Waste Disp. Fac. Rev. (King George Landfill, Inc. Proj.) Series 2003 A, 2.5% 6/1/23 (a)(b) | 735,000 | 767,024 | |
| Louisa Indl. Dev. Auth. Poll. Cont. Rev. Bonds (Virginia Elec. and Pwr. Co. Proj.): | |||
| Series 2008 A, 1.9%, tender 6/1/23 (a) | 2,500,000 | 2,575,080 | |
| Series 2008 B, 0.75%, tender 9/2/25 (a) | 4,000,000 | 4,011,538 | |
| Series 2008 C, 1.8%, tender 4/1/22 (a) | 1,600,000 | 1,619,891 | |
| Spotsylvania County Econ. Dev. Bonds (Palmers Creek Apt. Proj.) Series 2019, 1.45%, tender 11/26/21 (a) | 5,000,000 | 5,038,659 | |
| Stafford County Econ. Dev. Auth. Hosp. Facilities Rev. Series 2016: | |||
| 5% 6/15/24 | 25,000 | 28,445 | |
| 5% 6/15/25 | 20,000 | 23,456 | |
| 5% 6/15/26 | 35,000 | 42,319 | |
| Sussex County Indl. Dev. Auth. Solid Waste Disp. Rev. Bonds Series 2003 A, 2.4%, tender 5/2/22 (a)(b) | 1,205,000 | 1,228,929 | |
| Virginia Hsg. Dev. Auth. Series 2021, 1.55% 11/1/21 | 420,000 | 422,199 | |
| Virginia Pub. Bldg. Auth. Pub. Facilities Rev.: | |||
| Series 2019 B, 5% 8/1/23 (b) | 410,000 | 452,254 | |
| Series 2020 A, 5% 8/1/22 | 1,940,000 | 2,050,295 | |
| Series 2020 B, 5% 8/1/21 | 2,625,000 | 2,646,056 | |
| Virginia Small Bus. Fing. Auth. Series 2020 A: | |||
| 5% 1/1/22 | 900,000 | 924,016 | |
| 5% 1/1/23 | 400,000 | 428,184 | |
| Virginia Small Bus. Fing. Auth. Health Care Facilities Rev. Series 2020, 4% 11/1/21 | 300,000 | 304,811 | |
| Wise County Indl. Dev. Auth. Waste & Sewage Rev. Bonds (Virginia Elec. and Pwr. Co. Proj.): | |||
| Series 2009 A, 0.75%, tender 9/2/25 (a) | 7,000,000 | 7,054,957 | |
| Series 2010 A, 1.2%, tender 5/31/24 (a) | 2,075,000 | 2,122,177 | |
| York County Econ. Dev. Auth. Poll. Cont. Rev. Bonds (Virginia Elec. and Pwr. Co. Proj.) Series 2009 A, 1.9%, tender 6/1/23 (a) | 300,000 | 307,761 | |
| TOTAL VIRGINIA | 60,427,874 | ||
| Washington - 1.5% | |||
| Central Puget Sound Reg'l. Trans. Auth. Sales & Use Tax Rev. Bonds Series 2015 S2A, SIFMA Municipal Swap Index + 0.300% 0.35%, tender 6/3/21 (a)(d) | 20,000,000 | 20,000,970 | |
| Energy Northwest Elec. Rev.: | |||
| Series 2011 A, 5% 7/1/22 | 550,000 | 552,161 | |
| Series 2014 A: | |||
| 4% 7/1/21 (Escrowed to Maturity) | 200,000 | 200,625 | |
| 5% 7/1/21 (Escrowed to Maturity) | 300,000 | 301,179 | |
| Series 2018 A, 3% 7/1/21 (Escrowed to Maturity) | 360,000 | 360,829 | |
| Series 2020 A, 5% 7/1/21 (Escrowed to Maturity) | 350,000 | 351,375 | |
| King County Hsg. Auth. Rev.: | |||
| Series 2019: | |||
| 3% 11/1/23 | 1,175,000 | 1,248,913 | |
| 4% 11/1/24 | 135,000 | 151,290 | |
| Series 2020: | |||
| 3% 6/1/21 | 400,000 | 400,000 | |
| 3% 6/1/22 | 250,000 | 256,732 | |
| 3% 6/1/23 | 400,000 | 420,378 | |
| 3% 6/1/25 | 275,000 | 299,095 | |
| King County Swr. Rev.: | |||
| Bonds Series 2020 B, 0.875%, tender 1/1/26 (a) | 2,105,000 | 2,109,457 | |
| Series B, 5% 7/1/25 | 1,885,000 | 2,154,436 | |
| Port of Seattle Gen. Oblig. Series 2011, 5.25% 12/1/21 (b) | 300,000 | 300,682 | |
| Port of Seattle Rev.: | |||
| Series 2012 A, 5% 8/1/22 | 400,000 | 422,354 | |
| Series 2012 B: | |||
| 5% 8/1/21 (b) | 500,000 | 503,818 | |
| 5% 8/1/23 (b) | 1,345,000 | 1,417,240 | |
| Series 2016 B: | |||
| 5% 10/1/21 (b) | 60,000 | 60,924 | |
| 5% 10/1/22 (b) | 70,000 | 74,319 | |
| 5% 10/1/23 (b) | 65,000 | 71,815 | |
| Series 2017 C, 5% 5/1/22 (b) | 5,540,000 | 5,775,695 | |
| Series 2018 A, 5% 5/1/22 (b) | 11,475,000 | 11,963,196 | |
| Series 2019: | |||
| 5% 4/1/22 (b) | 790,000 | 820,616 | |
| 5% 4/1/23 (b) | 615,000 | 664,562 | |
| Port of Seattle Spl. Facility Rev. Series 2013, 5% 6/1/22 (b) | 500,000 | 523,363 | |
| Seattle Hsg. Auth. Rev. (Northgate Plaza Proj.) Series 2021, 1% 6/1/26 | 1,740,000 | 1,738,740 | |
| Seattle Muni. Lt. & Pwr. Rev. Bonds Series 2018 B2, SIFMA Municipal Swap Index + 0.290% 0.34%, tender 6/3/21 (a)(d) | 10,000,000 | 10,000,517 | |
| Tacoma Elec. Sys. Rev. Series 2017: | |||
| 5% 1/1/22 | 15,000 | 15,429 | |
| 5% 1/1/25 | 25,000 | 29,088 | |
| 5% 1/1/26 | 35,000 | 42,104 | |
| Tobacco Settlement Auth. Rev. Series 2018, 5% 6/1/22 | 525,000 | 550,867 | |
| Washington Gen. Oblig.: | |||
| (SR 520 Corridor Prog.) Series 2012 C, 5% 6/1/24 | 200,000 | 200,000 | |
| Series 2004 C, 0% 6/1/21 | 505,000 | 505,000 | |
| Series R 2017 A, 5% 8/1/21 | 300,000 | 302,422 | |
| Series R 2020 A, 5% 1/1/25 | 250,000 | 291,458 | |
| Series R 2020 C: | |||
| 5% 7/1/21 | 1,000,000 | 1,003,968 | |
| 5% 7/1/22 | 2,500,000 | 2,632,902 | |
| Washington Health Care Facilities Auth. Rev.: | |||
| (Providence Health Systems Proj.) Series 2012 A, 5% 10/1/24 | 250,000 | 266,397 | |
| (Virginia Mason Med. Ctr. Proj.) Series 2017: | |||
| 5% 8/15/25 | 205,000 | 237,730 | |
| 5% 8/15/26 | 115,000 | 136,919 | |
| 5% 8/15/27 | 50,000 | 60,905 | |
| Bonds: | |||
| Series 2012 B, 5%, tender 10/1/21 (a) | 450,000 | 457,133 | |
| Series 2019 B, 5%, tender 8/1/24 (a) | 1,095,000 | 1,229,537 | |
| Series 2011 B, 3.5% 10/1/21 | 475,000 | 480,331 | |
| Series 2012 A, 5% 10/1/22 | 445,000 | 473,878 | |
| Series 2012 B, 5% 10/1/24 (Pre-Refunded to 10/1/22 @ 100) | 280,000 | 298,044 | |
| Series 2014, 5% 3/1/22 | 200,000 | 207,159 | |
| Series 2015 B, 5% 8/15/23 | 600,000 | 663,024 | |
| Series 2015, 5% 7/1/24 | 1,250,000 | 1,420,405 | |
| Series 2018 B, 5% 10/1/25 | 1,220,000 | 1,451,145 | |
| Washington Hsg. Fin. Commission Multi-family Hsg. Rev. (Columbia Park Apts. Proj.) Series 2019, 1.39%, tender 7/1/21 (a) | 5,000,000 | 5,004,857 | |
| TOTAL WASHINGTON | 81,105,983 | ||
| West Virginia - 0.4% | |||
| Harrison County Commission Solid Waste Disp. Rev. Bonds (Monongahela Pwr. Co. Proj.) Series 2018 A, 3%, tender 10/15/21 (a)(b) | 6,900,000 | 6,952,379 | |
| Hsg. Auth. of Everett Bonds Series 2021, 0.3%, tender 9/1/23 (a) | 1,500,000 | 1,498,260 | |
| Mason Co. Poll. Cont. Rev. (Appalachian Pwr. Co. Proj.) Series 2003 L, 2.75% 10/1/22 | 3,245,000 | 3,350,157 | |
| West Virginia Econ. Dev. Auth. Solid Waste Disp. Facilities Rev. Bonds: | |||
| (Appalachian Pwr. Co. - Amos Proj.) Series 2015 A, 2.55%, tender 4/1/24 (a) | 225,000 | 237,978 | |
| (Appalachian Pwr. Co. Amos Proj.) Series 2010 A, 0.625%, tender 12/15/25 (a) | 2,000,000 | 1,997,660 | |
| West Virginia Hosp. Fin. Auth. Hosp. Rev. Series 2016 A: | |||
| 5% 6/1/22 | 2,195,000 | 2,298,919 | |
| 5% 6/1/24 | 1,490,000 | 1,693,445 | |
| West Virginia Hsg. Dev. Fund Series 2017 A, 2.4% 11/1/22 (b) | 960,000 | 982,084 | |
| TOTAL WEST VIRGINIA | 19,010,882 | ||
| Wisconsin - 0.9% | |||
| Crosse Resources Recovery Rev. Series 1996, 6% 11/1/21 (b) | 1,500,000 | 1,535,441 | |
| Clayton Town Series 2021 B, 2% 6/1/26 (c) | 2,000,000 | 2,044,848 | |
| Milwaukee County Arpt. Rev.: | |||
| Series 2013 A: | |||
| 5% 12/1/22 (b) | 30,000 | 32,056 | |
| 5.25% 12/1/23 (b) | 35,000 | 39,178 | |
| Series 2016 A, 5% 12/1/22 (b) | 1,000,000 | 1,068,531 | |
| Series 2021, 5% 12/1/21 | 300,000 | 307,087 | |
| Milwaukee Gen. Oblig. Series 2020 N4, 5% 4/1/22 | 2,125,000 | 2,210,084 | |
| Pub. Fin. Auth. Series 2020 A, 5% 1/1/25 | 300,000 | 346,497 | |
| Pub. Fin. Auth. Hosp. Rev. Series 2020 A: | |||
| 5% 6/1/23 | 345,000 | 377,152 | |
| 5% 6/1/24 | 675,000 | 767,165 | |
| 5% 6/1/25 | 375,000 | 440,887 | |
| 5% 6/1/26 | 300,000 | 363,654 | |
| Pub. Fin. Auth. Solid Waste Bonds (Waste Mgmt., Inc. Proj.): | |||
| Series 2017 A-1, 0.2%, tender 8/2/21 (a)(b) | 9,500,000 | 9,500,158 | |
| Series 2017 A-2, 0.2%, tender 8/2/21 (a)(b) | 3,170,000 | 3,170,053 | |
| Racine Unified School District Series 2021: | |||
| 2% 4/1/22 | 175,000 | 177,652 | |
| 2% 4/1/23 | 225,000 | 232,237 | |
| 2% 4/1/24 | 475,000 | 496,729 | |
| 2% 4/1/25 | 600,000 | 633,430 | |
| Waukesha Gen. Oblig. Series 2021 A, 2% 7/1/22 | 1,500,000 | 1,525,327 | |
| Wisconsin Gen. Oblig. Series 2014 4, 5% 5/1/25 | 90,000 | 104,206 | |
| Wisconsin Health & Edl. Facilities: | |||
| (Agnesian Healthcare Proj.) Series 2017, 5% 7/1/21 | 100,000 | 100,387 | |
| Bonds: | |||
| (Ascension Health Cr. Group Proj.) Series 2013 B, 5%, tender 6/1/21 (a) | 2,205,000 | 2,205,000 | |
| Series 2018 B: | |||
| 5%, tender 1/26/22 (a) | 5,710,000 | 5,881,640 | |
| 5%, tender 1/29/25 (a) | 355,000 | 412,604 | |
| Series 2018 C, SIFMA Municipal Swap Index + 0.450% 0.5%, tender 7/27/22 (a)(d) | 3,885,000 | 3,890,999 | |
| Series 2018 C3, SIFMA Municipal Swap Index + 0.550% 0.6%, tender 7/26/23 (a)(d) | 4,000,000 | 4,012,650 | |
| Series 2014 A, 5% 11/15/21 | 325,000 | 332,066 | |
| Series 2016 A, 5% 11/15/21 | 480,000 | 490,637 | |
| Series 2018, 5% 4/1/26 | 195,000 | 236,232 | |
| Series 2019 A: | |||
| 5% 11/15/22 | 325,000 | 348,001 | |
| 5% 12/1/23 | 35,000 | 38,970 | |
| 5% 12/1/24 | 100,000 | 115,033 | |
| 5% 12/1/25 | 125,000 | 148,374 | |
| 5% 12/1/26 | 200,000 | 243,612 | |
| Series 2019, 5% 10/1/21 | 400,000 | 406,092 | |
| Series 2020, 4% 7/1/21 | 820,000 | 822,479 | |
| Wisconsin Health & Edl. Facilities Auth. Series 2014 A, 5% 12/1/24 | 775,000 | 895,608 | |
| Wisconsin Health & Edl. Facilities Auth. Rev.: | |||
| Series 2012 A, 5% 7/15/21 (Escrowed to Maturity) | 335,000 | 336,972 | |
| Series 2012, 5% 10/1/21 | 30,000 | 30,457 | |
| TOTAL WISCONSIN | 46,320,185 | ||
| Wyoming - 0.1% | |||
| Laramie County Hosp. Rev. (Cheyenne Reg'l. Med. Ctr. Proj.) Series 2021: | |||
| 4% 5/1/22 | 775,000 | 802,286 | |
| 4% 5/1/23 | 250,000 | 267,831 | |
| 4% 5/1/25 | 260,000 | 294,258 | |
| Wyoming Cmnty. Dev. Auth. Hsg. Rev. Series 2020 3: | |||
| 5% 12/1/21 (b) | 565,000 | 578,203 | |
| 5% 6/1/22 (b) | 280,000 | 292,795 | |
| 5% 6/1/23 (b) | 955,000 | 1,036,994 | |
| TOTAL WYOMING | 3,272,367 | ||
| TOTAL MUNICIPAL BONDS | |||
| (Cost $2,409,833,098) | 2,426,576,583 | ||
| Municipal Notes - 22.2% | |||
| Alabama - 0.3% | |||
| East Alabama Health Care Auth. Series 2012 B, 0.12% 6/4/21, VRDN (a) | 5,000,000 | $5,000,000 | |
| Health Care Auth. for Baptist Health Series 2013 B, 0.21% 6/4/21, VRDN (a) | 6,705,000 | 6,705,000 | |
| Huntsville Health Care Auth. Participating VRDN Series XG 03 01, 0.09% 6/4/21 (Liquidity Facility Bank of America NA) (a)(f)(g) | 5,000,000 | 5,000,000 | |
| TOTAL ALABAMA | 16,705,000 | ||
| Alaska - 0.1% | |||
| Anchorage Gen. Oblig. TAN Series 2021, 1.5% 12/15/21 | 6,000,000 | 6,046,219 | |
| Arizona - 0.3% | |||
| Arizona St Indl. Dev. Auth. Multi Participating VRDN Series XF 10 91, 0.35% 6/4/21 (Liquidity Facility Deutsche Bank AG New York Branch) (a)(b)(f)(g) | 950,000 | 950,000 | |
| Maricopa County Indl. Dev. Auth. Participating VRDN Series 2021 XG 03 09, 0.15% 6/4/21 (Liquidity Facility JPMorgan Chase Bank) (a)(f)(g) | 6,145,000 | 6,145,000 | |
| Maricopa County Poll. Cont. Rev. Series 2010 B, 0.11% 6/4/21, VRDN (a) | 2,000,000 | 2,000,000 | |
| Maricopa County Rev. Participating VRDN Series Floaters YX 10 32, 0.08% 6/4/21 (Liquidity Facility Barclays Bank PLC) (a)(f)(g) | 4,835,000 | 4,835,000 | |
| Phoenix Civic Impt. Board Arpt. Rev. Participating VRDN Series XM 08 23, 0.21% 6/4/21 (Liquidity Facility Morgan Stanley Bank, West Valley City Utah) (a)(f)(g) | 1,300,000 | 1,300,000 | |
| Pima County Indl. Dev. Auth. Multi-family Hsg. Rev. Participating VRDN Series XF 10 96, 0.35% 6/4/21 (Liquidity Facility Deutsche Bank AG New York Branch) (a)(f)(g) | 200,000 | 200,000 | |
| TOTAL ARIZONA | 15,430,000 | ||
| California - 2.4% | |||
| California Health Facilities Fing. Auth. Rev. Participating VRDN Series Floaters XG 01 75, 0.2% 6/4/21 (Liquidity Facility Bank of America NA) (a)(f)(g) | 4,825,000 | 4,825,000 | |
| California Muni. Fin. Auth. Participating VRDN Series DBE 80 61, 0.55% 6/4/21 (Liquidity Facility Deutsche Bank AG) (a)(f)(g) | 2,500,000 | 2,500,000 | |
| California School Fin. Auth. Rev. TRAN Series 2021 A1, 3% 12/30/21 | 2,500,000 | 2,541,772 | |
| California Statewide Cmntys. Dev. Auth. Rev.: | |||
| Series 2004 E, 0.17% tender 12/9/21, CP mode | 6,000,000 | 6,000,320 | |
| Series 2008 B, 0.11% tender 7/8/21, CP mode | 4,100,000 | 4,100,000 | |
| Contra Costa County Schools TRAN Series A, 2% 12/1/21 | 2,000,000 | 2,015,968 | |
| Los Angeles County Gen. Oblig. TRAN Series A, 4% 6/30/21 | 15,000,000 | 15,047,471 | |
| Los Angeles County Schools Pooled Fing. Prog. Ctfs. of Prtn. TRAN Series B: | |||
| 2% 12/30/21 | 2,500,000 | 2,527,268 | |
| 2% 12/30/21 | 2,915,000 | 2,946,794 | |
| Los Angeles Gen. Oblig. TRAN Series 2020, 4% 6/24/21 | 15,000,000 | 15,037,649 | |
| River Islands Pub. Fing. Auth. Participating VRDN Series MIZ 90 26, 0.35% 7/2/21 (Liquidity Facility Mizuho Cap. Markets Llc) (a)(f)(g)(h) | 4,300,000 | 4,300,000 | |
| Riverside County Gen. Oblig. TRAN Series 2020, 4% 6/30/21 | 5,000,000 | 5,015,783 | |
| Riverside County Ind. Dev. Auth. Ind. Dev. Rev. Series 1999, 0.11% 6/4/21, LOC JPMorgan Chase Bank, VRDN (a)(b) | 1,000,000 | 1,000,000 | |
| Riverside County Office of Ed. TRAN Series 2021, 2% 12/31/21 | 10,000,000 | 10,108,413 | |
| Sacramento Gen. Oblig. Participating VRDN Series XG 00 67, 0.12% 6/4/21 (Liquidity Facility Deutsche Bank AG New York Branch) (a)(f)(g) | 1,500,000 | 1,500,000 | |
| San Diego Pub. Facilities Fing. Auth. Wtr. Rev. Series B, 0.12% 8/3/21, LOC Bank of America NA, CP | 2,500,000 | 2,500,046 | |
| San Diego Unified School District TRAN Series 2020, 5% 6/30/21 | 3,280,000 | 3,293,076 | |
| San Francisco City & County Series A1, 0.11% 6/23/21, LOC Bank of America NA, CP | 2,750,000 | 2,750,020 | |
| San Francisco City & County Arpts. Commission Int'l. Arpt. Rev.: | |||
| Participating VRDN: | |||
| Series Floaters XM 06 75, 0.21% 6/4/21 (Liquidity Facility Morgan Stanley Bank, West Valley City Utah) (a)(b)(f)(g) | 1,850,000 | 1,850,000 | |
| Series XM 09 16, 0.19% 6/4/21 (Liquidity Facility JPMorgan Chase Bank) (a)(b)(f)(g) | 2,200,000 | 2,200,000 | |
| Series 2010 A1, 0.07% 6/4/21, LOC Bank of America NA, VRDN (a)(b) | 1,740,000 | 1,740,000 | |
| Series 2021 A4, 0.14% 9/9/21, LOC U.S. Bank NA, Cincinnati, CP (b) | 5,000,000 | 5,000,143 | |
| San Francisco City & County Multi-family Hsg. Rev. Participating VRDN Series MIZ 90 63, 0.3% 7/2/21 (Liquidity Facility Mizuho Cap. Markets Llc) (a)(f)(g) | 16,325,000 | 16,325,000 | |
| San Jose Int. Arpt. Rev. Series 2021 B, 0.15% 8/10/21, LOC Bank of America NA, CP (b) | 5,912,000 | 5,912,119 | |
| Transbay Joint Powers Auth. Participating VRDN Series YX 11 42, 0.13% 6/4/21 (Liquidity Facility Barclays Bank PLC) (a)(f)(g) | 500,000 | 500,000 | |
| Univ. of California Revs. Participating VRDN Series Floaters XM 04 34, 0.07% 6/4/21 (Liquidity Facility Barclays Bank PLC) (a)(f)(g) | 5,800,000 | 5,800,000 | |
| TOTAL CALIFORNIA | 127,336,842 | ||
| Colorado - 1.2% | |||
| Colorado Ed. Ln. Prog. TRAN Series 2020 A: | |||
| 3% 6/29/21 | 8,000,000 | 8,018,098 | |
| 4% 6/29/21 | 12,000,000 | 12,036,476 | |
| Colorado Edl. & Cultural Facilities Auth. Rev. (Mesivta of Greater Los Angeles Proj.) Series 2005, 0.4% 6/4/21, LOC Deutsche Bank AG, VRDN (a) | 675,000 | 675,000 | |
| Colorado Gen. Fdg. Rev. TRAN Series 2020, 4% 6/25/21 | 20,000,000 | 20,052,110 | |
| Colorado Hsg. & Fin. Auth. Multi-family Hsg. Rev. Participating VRDN Series Floater 2021 MIZ 90 68, 0.3% 7/2/21 (Liquidity Facility Mizuho Cap. Markets Llc) (a)(f)(g) | 100,000 | 100,000 | |
| Denver City & County Arpt. Rev. Participating VRDN: | |||
| Series Floaters XL 00 90, 0.21% 6/4/21 (Liquidity Facility Morgan Stanley Bank, West Valley City Utah) (a)(b)(f)(g) | 23,100,000 | 23,100,000 | |
| Series Floaters XM 07 15, 0.21% 6/4/21 (Liquidity Facility Morgan Stanley Bank, West Valley City Utah) (a)(b)(f)(g) | 1,240,000 | 1,240,000 | |
| TOTAL COLORADO | 65,221,684 | ||
| Connecticut - 0.1% | |||
| Connecticut Health & Edl. Facilities Auth. Rev.: | |||
| Participating VRDN Series Floaters XG 02 04, 0.08% 6/4/21 (Liquidity Facility Barclays Bank PLC) (a)(f)(g) | 1,200,000 | 1,200,000 | |
| Series 2003 A, 0.11% 6/4/21, LOC RBS Citizens NA, VRDN (a) | 1,600,000 | 1,600,000 | |
| Windsor Gen. Oblig. BAN Series 2020, 2% 6/24/21 | 3,000,000 | 3,003,311 | |
| TOTAL CONNECTICUT | 5,803,311 | ||
| Delaware - 0.1% | |||
| Delaware Econ. Dev. Auth. Rev. (Delmarva Pwr. & Lt. Co. Proj.) Series 1994, 0.1% 6/1/21, VRDN (a)(b) | 5,880,000 | 5,880,000 | |
| District Of Columbia - 0.0% | |||
| Washington D.C. Metropolitan Transit Auth. Rev. Participating VRDN Series ZM 06 10, 0.15% 6/4/21 (Liquidity Facility Morgan Stanley Bank, West Valley City Utah) (a)(f)(g) | 900,000 | 900,000 | |
| Florida - 1.7% | |||
| Bay County Indl. Rev. Dev. (Gulf Pwr. Co. Proj.) Series 2020, 0.06% 6/1/21, VRDN (a)(b) | 7,490,000 | 7,490,000 | |
| Broward County Arpt. Sys. Rev. Participating VRDN: | |||
| Series XL 01 36, 0.21% 6/4/21 (Liquidity Facility JPMorgan Chase Bank) (a)(b)(f)(g) | 3,000,000 | 3,000,000 | |
| Series XM 08 95, 0.21% 6/4/21 (Liquidity Facility JPMorgan Chase Bank) (a)(b)(f)(g) | 840,000 | 840,000 | |
| Broward County School District TAN Series 2020, 2% 6/30/21 | 15,000,000 | 15,023,069 | |
| Greater Orlando Aviation Auth. Arpt. Facilities Rev. Participating VRDN Series XM 08 91, 0.21% 6/4/21 (Liquidity Facility JPMorgan Chase Bank) (a)(b)(f)(g) | 1,100,000 | 1,100,000 | |
| Jacksonville Health Care Series 2021, 0.17% 8/3/21, CP | 2,000,000 | 2,000,036 | |
| Lee Memorial Health Sys. Hosp. Rev. Series 2019 B, 0.13% 6/4/21, VRDN (a) | 14,500,000 | 14,500,000 | |
| Miami-Dade County Aviation Rev. Participating VRDN Series XM 08 70, 0.21% 6/4/21 (Liquidity Facility JPMorgan Chase Bank) (a)(b)(f)(g) | 2,100,000 | 2,100,000 | |
| Miami-Dade County Edl. Facilities Rev. Participating VRDN Series 2018 XM 06 76, 0.17% 6/4/21 (a)(f)(g) | 3,000,000 | 3,000,000 | |
| Miami-Dade County Expressway Auth. Participating VRDN Series XG 00 99, 0.12% 6/4/21 (Liquidity Facility Deutsche Bank AG New York Branch) (a)(f)(g) | 400,000 | 400,000 | |
| Miami-Dade County Indl. Dev. Auth. Rev. (Florida Pwr. & Lt. Co. Proj.) Series 2021, 0.04% 6/1/21, VRDN (a)(b) | 5,000,000 | 5,000,000 | |
| Miami-Dade County Wtr. & Swr. Rev. Participating VRDN: | |||
| Series 2021 XF 11 01, 0.12% 6/4/21 (Liquidity Facility Deutsche Bank AG New York Branch) (a)(f)(g) | 1,200,000 | 1,200,000 | |
| Series 2021 XM 09 42, 0.09% 6/4/21 (Liquidity Facility Bank of America NA) (a)(f)(g) | 3,475,000 | 3,475,000 | |
| South Miami Health Facilities Auth. Hosp. Rev. Participating VRDN: | |||
| Series Floaters XF 25 30, 0.12% 6/4/21 (Liquidity Facility Citibank NA) (a)(f)(g) | 10,500,000 | 10,500,000 | |
| Series XF 25 23, 0.15% 6/4/21 (Liquidity Facility Barclays Bank PLC) (a)(f)(g) | 10,000,000 | 10,000,000 | |
| Series ZM 05 71, 0.15% 6/4/21 (Liquidity Facility Morgan Stanley Bank, West Valley City Utah) (a)(f)(g) | 5,230,000 | 5,230,000 | |
| Tampa Hosp. Rev. Participating VRDN Series XM 08 85, 0.2% 6/4/21 (Liquidity Facility JPMorgan Chase Bank) (a)(f)(g) | 3,300,000 | 3,300,000 | |
| TOTAL FLORIDA | 88,158,105 | ||
| Georgia - 0.3% | |||
| Atlanta Arpt. Rev. Series J2, 0.14% 8/4/21, LOC Bank of America NA, CP (b) | 4,454,000 | 4,454,082 | |
| Brookhaven Dev. Auth. Rev. Participating VRDN Series XX 11 22, 0.08% 6/4/21 (Liquidity Facility Barclays Bank PLC) (a)(f)(g) | 1,050,000 | 1,050,000 | |
| Griffin-Spalding County Hosp. Participating VRDN Series Floaters XL 00 76, 0.27% 6/4/21 (Liquidity Facility JPMorgan Chase Bank) (a)(f)(g) | 400,000 | 400,000 | |
| Heard County Dev. Auth. Poll. Cont. Rev. Series 2007, 0.07% 6/1/21, VRDN (a)(b) | 7,900,000 | 7,900,000 | |
| Monroe County Dev. Auth. Rev. (Florida Pwr. & Lt. Co. Proj.) Series 2019, 0.06% 6/1/21, VRDN (a)(b) | 2,600,000 | 2,600,000 | |
| TOTAL GEORGIA | 16,404,082 | ||
| Hawaii - 0.1% | |||
| Hawaii Arpts. Sys. Rev. Participating VRDN Series XF 07 65, 0.17% 6/4/21 (Liquidity Facility JPMorgan Chase Bank) (a)(b)(f)(g) | 2,900,000 | 2,900,000 | |
| Idaho - 0.0% | |||
| Idaho Hsg. & Fin. Assoc. Single Family Mtg. Series A, 0.17% 6/4/21 (Liquidity Facility Fannie Mae) (Liquidity Facility Freddie Mac), VRDN (a) | 1,115,000 | 1,115,000 | |
| Illinois - 0.7% | |||
| Chicago Midway Arpt. Rev. Series 2021 A, 0.14% 6/15/21, LOC JPMorgan Chase Bank, CP (b) | 4,010,000 | 4,010,039 | |
| Chicago O'Hare Int'l. Arpt. Rev. Participating VRDN: | |||
| Series Floaters XL 00 49, 0.2% 6/3/21 (Liquidity Facility Barclays Bank PLC) (a)(b)(f)(g) | 750,000 | 750,000 | |
| Series XM 08 79, 0.2% 6/4/21 (Liquidity Facility JPMorgan Chase Bank) (a)(f)(g) | 2,500,000 | 2,500,000 | |
| Series XM 08 84, 0.21% 6/4/21 (Liquidity Facility JPMorgan Chase Bank) (a)(b)(f)(g) | 2,500,000 | 2,500,000 | |
| Series XM 09 18, 0.2% 6/4/21 (Liquidity Facility JPMorgan Chase Bank) (a)(f)(g) | 700,000 | 700,000 | |
| Chicago Transit Auth. Participating VRDN: | |||
| Series 20 XF 28 97, 0.17% 6/4/21 (Liquidity Facility Barclays Bank PLC) (a)(f)(g) | 900,000 | 900,000 | |
| Series XM 09 03, 0.23% 6/4/21 (Liquidity Facility JPMorgan Chase Bank) (a)(f)(g) | 300,000 | 300,000 | |
| Series XM 09 05, 0.23% 6/4/21 (Liquidity Facility JPMorgan Chase Bank) (a)(f)(g) | 1,100,000 | 1,100,000 | |
| Cook County Gen. Oblig. Participating VRDN Series 2015 XF0124, 0.23% 6/4/21 (Liquidity Facility JPMorgan Chase Bank) (a)(f)(g) | 1,280,000 | 1,280,000 | |
| Illinois Fin. Auth. Participating VRDN Series 2021 XL 01 72, 0.12% 6/4/21 (Liquidity Facility Deutsche Bank AG New York Branch) (a)(f)(g) | 900,000 | 900,000 | |
| Illinois Fin. Auth. Rev. Participating VRDN Series Floaters XF 25 35, 0.08% 6/4/21 (Liquidity Facility Barclays Bank PLC) (a)(f)(g) | 700,000 | 700,000 | |
| Illinois Hsg. Dev. Auth. Multi-family Hsg. Rev. Series 2007, 0.1% 6/4/21, LOC U.S. Bank NA, Cincinnati, VRDN (a)(b) | 700,000 | 700,000 | |
| Metropolitan Pier & Exposition Participating VRDN Series XF 09 65, 0.23% 6/4/21 (Liquidity Facility JPMorgan Chase Bank) (a)(f)(g) | 3,800,000 | 3,800,000 | |
| Reg'l. Transn Auth. Extend Series 2005 B, 0.55% 6/4/21, VRDN (a) | 1,690,000 | 1,690,000 | |
| Sales Tax Securitization Corp. Participating VRDN Series XF 06 03, 0.19% 6/4/21 (Liquidity Facility Royal Bank of Canada) (a)(f)(g) | 13,615,000 | 13,615,000 | |
| TOTAL ILLINOIS | 35,445,039 | ||
| Indiana - 0.0% | |||
| Crawfordsville Indl. Dev. Rev. (Nat'l. Svc. Inds., Inc. Proj.) Series 1991, 0.15% 6/1/21, LOC Wells Fargo Bank NA, VRDN (a) | 250,000 | 250,000 | |
| Indianapolis Local Pub. Impt. Participating VRDN Series XM 09 27, 0.12% 6/4/21 (Liquidity Facility JPMorgan Chase Bank) (a)(f)(g) | 800,000 | 800,000 | |
| Jeffersonville Ind. Econ. Dev. Rev. Series 2003, 0.1% 6/4/21, LOC PNC Bank NA, VRDN (a)(b) | 535,000 | 535,000 | |
| TOTAL INDIANA | 1,585,000 | ||
| Iowa - 0.3% | |||
| Iowa Fin. Auth. Sewage And Solid Waste Disp. Facilities Rev. Series 2021, 0.11% 6/4/21, VRDN (a)(b) | 2,000,000 | 2,000,000 | |
| Iowa Fin. Auth. Single Family Mtg. (Mtg. Backed Securities Prog.) Series 2019 B, 0.04% 6/4/21 (Liquidity Facility U.S. Bank NA, Cincinnati), VRDN (a) | 14,000,000 | 14,000,000 | |
| Iowa Fin. Auth. Solid Waste Facilities (Mid-American Energy Co. Proj.) Series 2017, 0.1% 6/4/21, VRDN (a)(b) | 500,000 | 500,000 | |
| TOTAL IOWA | 16,500,000 | ||
| Kentucky - 0.8% | |||
| Kentucky Econ. Dev. Fin. Auth. Hosp. Rev. Participating VRDN Series XM 09 19, 0.2% 6/4/21 (Liquidity Facility JPMorgan Chase Bank) (a)(f)(g) | 1,100,000 | 1,100,000 | |
| Kentucky Hsg. Corp. Hsg. Rev. Participating VRDN Series XF 10 93, 0.35% 6/4/21 (Liquidity Facility Deutsche Bank AG New York Branch) (a)(f)(g) | 1,000,000 | 1,000,000 | |
| Kentucky Tpk. Auth. Econ. Dev. Road Rev. Participating VRDN Series XF 24 84, 0.15% 6/4/21 (Liquidity Facility Morgan Stanley Bank, West Valley City Utah) (a)(f)(g) | 1,780,000 | 1,780,000 | |
| Louisville & Jefferson County Metropolitan Swr. District Swr. & Drain Sys. Rev. BAN Series 2020, 5% 10/20/21 | 20,000,000 | 20,376,618 | |
| Louisville & Jefferson County Reg'l. Arpt. Auth. Spl. Facilities Rev. (UPS Worldwide Forwarding, Inc. Proj.): | |||
| Series 1999 B, 0.02% 6/1/21, VRDN (a)(b) | 2,300,000 | 2,300,000 | |
| Series 1999 C, 0.04% 6/1/21, VRDN (a)(b) | 1,600,000 | 1,600,000 | |
| Maysville Indl. Bldg. Rev. Series 1996, 0.1% 6/3/21, LOC MUFG Union Bank NA, VRDN (a)(b) | 5,340,000 | 5,340,000 | |
| Meade County Indl. Bldg. Rev. (Nucor Steel Brandenburg Proj.): | |||
| Series 2020 A1, 0.1% 6/1/21, VRDN (a)(b) | 1,400,000 | 1,400,000 | |
| Series 2020 B1, 0.1% 6/1/21, VRDN (a)(b) | 7,320,000 | 7,320,000 | |
| TOTAL KENTUCKY | 42,216,618 | ||
| Louisiana - 0.3% | |||
| Calcasieu Parish Pub. Trust Auth. Solid Waste Disp. Rev. Series 1997, 0.09% 6/4/21, LOC Bank of America NA, VRDN (a)(b) | 1,885,000 | 1,885,000 | |
| Louisiana Hsg. Corp. Multifamily Hsg. Rev. Participating VRDN Series MIZ 90 53, 0.35% 7/2/21 (Liquidity Facility Mizuho Cap. Markets Llc) (a)(f)(g) | 585,000 | 585,000 | |
| Saint Charles Parish Poll. Cont. Rev. (Shell Oil Co. Proj.) Series 1992 A, 0.04% 6/1/21, VRDN (a)(b) | 1,900,000 | 1,900,000 | |
| Saint James Parish Gen. Oblig. (Nucor Steel Louisiana LLC Proj.) Series 2010 A1, 0.13% 6/4/21, VRDN (a) | 10,930,000 | 10,930,000 | |
| TOTAL LOUISIANA | 15,300,000 | ||
| Maryland - 0.6% | |||
| Baltimore County Gen. Oblig.: | |||
| BAN Series 2021, 4% 3/23/22 | 10,000,000 | 10,316,114 | |
| Participating VRDN Series Floaters XF 06 42, 0.08% 6/4/21 (Liquidity Facility JPMorgan Chase Bank) (a)(f)(g) | 300,000 | 300,000 | |
| Baltimore Proj. Rev. Bonds Series Floaters G 42, 0.25%, tender 1/3/22 (Liquidity Facility Royal Bank of Canada) (a)(f)(g)(h) | 4,500,000 | 4,500,000 | |
| Maryland Econ. Dev. Corp. Student Hsg. Rev. Participating VRDN Series XF 28 32, 0.25% 6/4/21 (a)(f)(g) | 14,985,000 | 14,985,000 | |
| Maryland Gen. Oblig. Participating VRDN Series DB 807, 0.12% 6/4/21 (Liquidity Facility Deutsche Bank AG New York Branch) (a)(f)(g) | 1,300,000 | 1,300,000 | |
| Maryland Health & Higher Edl. Facilities Auth. Rev. Series B, 0.1% 6/8/21, CP | 2,500,000 | 2,500,030 | |
| TOTAL MARYLAND | 33,901,144 | ||
| Massachusetts - 0.3% | |||
| Massachusetts Edl. Fing. Auth. Rev. Participating VRDN Series Floaters XF 23 06, 0.35% 6/4/21 (Liquidity Facility Morgan Stanley Bank, West Valley City Utah) (a)(b)(f)(g) | 1,745,000 | 1,745,000 | |
| Middleborough Gen. Oblig. BAN Series 2020, 2% 10/1/21 | 13,000,000 | 13,079,231 | |
| TOTAL MASSACHUSETTS | 14,824,231 | ||
| Michigan - 0.3% | |||
| Grand Rapids Indl. Dev. Rev. Series 2007, 0.13% 6/4/21, LOC Bank of America NA, VRDN (a)(b) | 5,400,000 | 5,400,000 | |
| Michigan Fin. Auth. Rev. RAN Series 2020 A2, 4% 8/20/21, LOC JPMorgan Chase Bank | 12,500,000 | 12,605,526 | |
| TOTAL MICHIGAN | 18,005,526 | ||
| Minnesota - 0.0% | |||
| Minneapolis Health Care Sys. Rev. Participating VRDN Series XM 08 72, 0.23% 6/4/21 (Liquidity Facility JPMorgan Chase Bank) (a)(f)(g) | 1,000,000 | 1,000,000 | |
| Mississippi - 0.2% | |||
| Mississippi Bus. Fin. Corp. Solid Waste Disp. Rev. (Gulf Pwr. Co. Proj.) Series 2012, 0.06% 6/1/21, VRDN (a)(b) | 12,030,000 | 12,030,000 | |
| Missouri - 0.2% | |||
| Kansas City Indl. Dev. Auth. Participating VRDN Series XM 09 21, 0.21% 6/4/21 (Liquidity Facility Morgan Stanley Bank, West Valley City Utah) (a)(b)(f)(g) | 6,150,000 | 6,150,000 | |
| Lees Summit Indl. Dev. Auth. Multi-family Hsg. Rev. Participating VRDN Series MIZ 90 55, 0.35% 7/2/21 (Liquidity Facility Mizuho Cap. Markets Llc) (a)(f)(g) | 200,000 | 200,000 | |
| Mercy Health Participating VRDN Series Floaters XL 00 80, 0.15% 6/4/21 (Liquidity Facility JPMorgan Chase Bank) (a)(f)(g) | 1,200,000 | 1,200,000 | |
| Missouri Health & Edl. Facilities Auth. Edl. Facilities Rev. Participating VRDN Series XG 01 76, 0.18% 6/4/21 (Liquidity Facility Royal Bank of Canada) (a)(f)(g) | 3,200,000 | 3,200,000 | |
| TOTAL MISSOURI | 10,750,000 | ||
| Montana - 0.0% | |||
| Montana Board of Hsg. Participating VRDN Series Floater MIZ 90 61, 0.3% 7/2/21 (Liquidity Facility Mizuho Cap. Markets Llc) (a)(f)(g) | 500,000 | 500,000 | |
| New Jersey - 0.8% | |||
| Borough of Mountainside Gen. Oblig. BAN Series 2021, 2% 4/29/22 | 1,100,000 | 1,117,102 | |
| Borough of Oceanport BAN Series 2021, 2% 2/24/22 | 1,100,000 | 1,114,202 | |
| Brick Township Gen. Oblig. BAN Series 2020, 2% 6/22/21 | 2,005,000 | 2,007,032 | |
| Burlington County Bridge Commission Lease Rev. BAN (Governmental Leasing Prog.) Series 2021 A, 1% 4/14/22 | 13,000,000 | 13,095,970 | |
| Hudson County Impt. Auth. Rev. BAN (Local Unit Ln. Prog.) Series 2021 A1, 1.5% 2/8/22 | 2,774,000 | 2,800,053 | |
| Jersey City Gen. Oblig. BAN Series 2020, 2% 6/17/21 | 2,000,000 | 2,001,661 | |
| Mercer County Gen. Oblig. BAN Series 2020, 2% 6/10/21 | 5,000,000 | 5,002,425 | |
| New Jersey Tpk. Auth. Tpk. Rev. Participating VRDN Series XM 09 11, 0.23% 6/4/21 (Liquidity Facility JPMorgan Chase Bank) (a)(f)(g) | 1,305,000 | 1,305,000 | |
| New Jersey Trans. Trust Fund Auth. Participating VRDN: | |||
| Series Floaters XG 02 05, 0.08% 6/4/21 (Liquidity Facility Barclays Bank PLC) (a)(f)(g) | 6,140,000 | 6,140,000 | |
| Series XF 09 75, 0.27% 6/4/21 (Liquidity Facility JPMorgan Chase Bank) (a)(f)(g) | 800,000 | 800,000 | |
| Series XM 09 29, 0.2% 6/4/21 (Liquidity Facility JPMorgan Chase Bank) (a)(f)(g) | 400,000 | 400,000 | |
| Newark Gen. Oblig. BAN Series 2020 C, 2% 10/5/21 | 2,000,000 | 2,011,693 | |
| Ramsey Borough Gen. Oblig. BAN Series 2021, 1.25% 1/7/22 | 2,000,000 | 2,011,621 | |
| Summit Gen. Oblig. BAN Series 2020, 2.5% 10/22/21 | 2,800,000 | 2,824,865 | |
| Union County Gen. Oblig. BAN Series 2020, 4% 6/18/21 | 2,000,000 | 2,003,691 | |
| TOTAL NEW JERSEY | 44,635,315 | ||
| New Mexico - 0.1% | |||
| Farmington Poll. Cont. Rev. (Pub. Svc. Co. of New Mexico Proj.) Series 2010 A, 0.11% 6/4/21, VRDN (a) | 5,100,000 | 5,100,000 | |
| New York - 4.1% | |||
| Broome County Gen. Oblig. BAN Series 2021 A, 1.5% 4/29/22 | 20,000,000 | 20,236,544 | |
| Connetquot Central School District TAN Series 2020, 1.75% 6/25/21 | 5,000,000 | 5,005,094 | |
| Cortland Enlarged City School District RAN Series 2020, 1.5% 7/30/21 | 1,000,000 | 1,001,518 | |
| East Rochester Hsg. Auth. Rev. (Home Good Sheperd Proj.) Series A, 0.19% 6/4/21, LOC RBS Citizens NA, VRDN (a) | 300,000 | 300,000 | |
| Erie County Gen. Oblig. RAN Series 2020, 3% 6/24/21 | 2,000,000 | 2,003,756 | |
| Hempstead Indl. Dev. Auth. Participating VRDN Series DBE 80 63, 0.55% 6/4/21, LOC Deutsche Bank AG, (Liquidity Facility Deutsche Bank AG) (a)(b)(f)(g) | 8,560,000 | 8,560,000 | |
| Longwood Central School District TAN Series 2020, 2% 6/25/21 | 9,000,000 | 9,010,425 | |
| Middletown BAN Series 2020, 1.5% 8/26/21 | 1,932,434 | 1,938,313 | |
| New York City Gen. Oblig.: | |||
| Series 2006, 0.25% 6/4/21 (FSA Insured), VRDN (a) | 4,000,000 | 4,000,000 | |
| Series 2018 E, 0.02% 6/1/21 (Liquidity Facility TD Banknorth, NA), VRDN (a) | 2,000,000 | 2,000,000 | |
| Series 2021 3, 0.2% 6/7/21, VRDN (a) | 5,000,000 | 5,000,000 | |
| New York Metropolitan Trans. Auth. Dedicated Tax Fund Rev. Participating VRDN Series ZM 06 00, 0.35% 6/4/21 (Liquidity Facility Wells Fargo Bank NA) (a)(f)(g) | 2,100,000 | 2,100,000 | |
| New York Metropolitan Trans. Auth. Rev.: | |||
| BAN: | |||
| Series 2018 C, 5% 9/1/21 | 4,225,000 | 4,275,132 | |
| Series 2019 B, 5% 5/15/22 | 15,310,000 | 15,998,971 | |
| Series 2019 D1, 5% 9/1/22 | 19,500,000 | 20,642,526 | |
| Participating VRDN: | |||
| Series XF 05 20, 0.27% 6/4/21 (Liquidity Facility Royal Bank of Canada) (a)(f)(g) | 1,425,000 | 1,425,000 | |
| Series XG 02 90, 0.09% 6/4/21 (Liquidity Facility Barclays Bank PLC) (a)(f)(g) | 15,000,000 | 15,000,000 | |
| Series XM 09 35, 0.3% 6/4/21 (Liquidity Facility JPMorgan Chase Bank) (a)(f)(g) | 300,000 | 300,000 | |
| Series ZF 02 18, 0.3% 6/4/21 (Liquidity Facility JPMorgan Chase Bank) (a)(f)(g) | 4,200,000 | 4,200,000 | |
| New York Pwr. Auth.: | |||
| Series 1, 0.29% 7/13/21, CP | 8,000,000 | 8,001,308 | |
| Series 2021 2, 0.12% 6/17/21, CP | 1,100,000 | 1,100,012 | |
| New York Thruway Auth. Gen. Rev. Participating VRDN: | |||
| Series XF 09 18, 0.15% 6/4/21 (Liquidity Facility JPMorgan Chase Bank) (a)(f)(g) | 1,600,000 | 1,600,000 | |
| Series XM 08 30, 0.2% 6/4/21 (Liquidity Facility JPMorgan Chase Bank) (a)(f)(g) | 1,700,000 | 1,700,000 | |
| Series XM 08 31, 0.23% 6/4/21 (Liquidity Facility Morgan Stanley Bank, West Valley City Utah) (a)(f)(g) | 2,000,000 | 2,000,000 | |
| Series XM 08 80, 0.2% 6/4/21 (Liquidity Facility JPMorgan Chase Bank) (a)(f)(g) | 1,500,000 | 1,500,000 | |
| New York Trans. Dev. Corp.: | |||
| Participating VRDN Series XL 01 68, 0.17% 6/4/21 (Liquidity Facility Barclays Bank PLC) (a)(b)(f)(g) | 200,000 | 200,000 | |
| RAN (Term. 4 JFK Int'l. Arpt. Proj.) Series 2020 C, 5% 12/1/21 | 2,100,000 | 2,149,181 | |
| Oyster Bay Gen. Oblig. BAN Series C, 4% 8/27/21 | 9,500,000 | 9,584,069 | |
| Port Washington Union Free School District BAN Series 2020, 1.5% 8/5/21 | 5,410,000 | 5,422,393 | |
| Putnam County Indl. Dev. Agcy. Rev. Series 2006 A, 0.27% 6/4/21, LOC RBS Citizens NA, VRDN (a) | 1,100,000 | 1,100,000 | |
| Riverhead Central School District TAN Series 2020 B, 1.5% 6/25/21 | 5,000,000 | 5,004,060 | |
| Sewanhaka Central High School District Gen. Oblig. TAN Series 2020, 1.5% 6/21/21 | 5,000,000 | 5,003,467 | |
| Suffolk County Gen. Oblig. TAN: | |||
| Series 2020 I, 3% 9/24/21 | 14,000,000 | 14,117,575 | |
| Series I, 2% 7/22/21 | 5,000,000 | 5,012,522 | |
| Syosset Central School District TAN Series 2020, 2% 6/25/21 | 5,000,000 | 5,005,859 | |
| Village of Garden City BAN Series 2021, 1% 2/18/22 | 2,000,000 | 2,012,698 | |
| Westchester County: | |||
| BAN: | |||
| Series 2021 A, 1% 12/17/21 | 9,000,000 | 9,042,600 | |
| Series 2021 B, 1.5% 12/17/21 | 3,316,861 | 3,340,675 | |
| TAN Series B, 2% 10/18/21 | 13,135,000 | 13,231,438 | |
| TOTAL NEW YORK | 219,125,136 | ||
| New York And New Jersey - 0.2% | |||
| Port Auth. of New York & New Jersey Series 2021: | |||
| 0.14% 9/3/21, CP (b) | 4,010,000 | 4,010,215 | |
| 0.16% 10/1/21, CP (b) | 5,000,000 | 5,000,345 | |
| TOTAL NEW YORK AND NEW JERSEY | 9,010,560 | ||
| Ohio - 0.3% | |||
| American Muni. Pwr. BAN (Village of Grafton Proj.) Series 2021, 1% 4/14/22 | 1,235,000 | 1,243,362 | |
| Lorain County Gen. Oblig. BAN: | |||
| (North Ridge Road Proj.) Series 2020 D, 1% 12/17/21 | 2,190,000 | 2,198,930 | |
| Series 2021 A, 1.5% 5/4/22 | 2,900,000 | 2,933,470 | |
| Mahoning County BAN Series 2020, 1% 9/13/21 | 1,735,000 | 1,738,780 | |
| Mahoning County Sales Tax TAN Series 2020, 1% 9/13/21 | 1,025,000 | 1,027,088 | |
| Ohio Hsg. Fin. Agcy. Multi-family Hsg. Rev. Participating VRDN: | |||
| Series MIZ 90 50, 0.35% 7/2/21 (Liquidity Facility Mizuho Cap. Markets Llc) (a)(f)(g) | 1,400,000 | 1,400,000 | |
| Series XF 10 92, 0.35% 6/4/21 (Liquidity Facility Deutsche Bank AG New York Branch) (a)(f)(g) | 5,100,000 | 5,100,000 | |
| Ohio Tpk. Commission Tpk. Rev. Participating VRDN Series Floaters XL 00 57, 0.12% 6/4/21 (Liquidity Facility Cr. Suisse AG) (a)(f)(g) | 800,000 | 800,000 | |
| TOTAL OHIO | 16,441,630 | ||
| Oklahoma - 0.2% | |||
| Oklahoma Dev. Fin. Auth. Health Sys. Rev. Series 2020 B, 0.14% 6/4/21, VRDN (a) | 10,760,000 | 10,760,000 | |
| Pennsylvania - 0.9% | |||
| Pennsylvania Econ. Dev. Fing. Auth. Exempt Facilities Rev. Series 2009 B, 0.1% 6/4/21, LOC MUFG Bank Ltd., VRDN (a) | 5,000,000 | 5,000,000 | |
| Pennsylvania Hsg. Fin. Agcy. Multifamily Hsg. Dev. Rev. Participating VRDN Series XF 10 95, 0.35% 6/4/21 (Liquidity Facility Deutsche Bank AG New York Branch) (a)(f)(g) | 2,660,000 | 2,660,000 | |
| Philadelphia Auth. Indl. Mrf Participating VRDN Series MIZ 90 51, 0.35% 7/2/21 (Liquidity Facility Mizuho Cap. Markets Llc) (a)(f)(g) | 1,000,000 | 1,000,000 | |
| Philadelphia Auth. for Indl. Dev. Series 2017 B, 0.14% 6/3/24, VRDN (a) | 12,565,000 | 12,565,000 | |
| Philadelphia Gen. Oblig. TRAN Series 2020 A, 4% 6/30/21 | 10,185,000 | 10,217,232 | |
| Philadelphia School District TRAN Series 2020 A, 4% 6/30/21 | 17,645,000 | 17,699,971 | |
| TOTAL PENNSYLVANIA | 49,142,203 | ||
| South Carolina - 0.6% | |||
| County Square Redev. Corp. BAN (Greenville County, South Carolina Proj.) Series 2021, 2% 3/3/22 | 6,945,000 | 7,043,040 | |
| Greenville Hosp. Sys. Facilities Rev. Participating VRDN Series XF 01 45, 0.29% 6/4/21 (Liquidity Facility Toronto-Dominion Bank) (a)(f)(g) | 1,600,000 | 1,600,000 | |
| South Carolina Jobs-Econ. Dev. Auth. Series 2018 C, 0.14% 6/3/24, VRDN (a) | 10,000,000 | 10,000,000 | |
| South Carolina Pub. Svc. Auth. Rev.: | |||
| Participating VRDN: | |||
| Series Floaters XM 03 84, 0.2% 6/4/21 (Liquidity Facility JPMorgan Chase Bank) (a)(f)(g) | 9,800,000 | 9,800,000 | |
| Series YX 11 57, 0.17% 6/4/21 (Liquidity Facility Barclays Bank PLC) (a)(f)(g) | 2,110,000 | 2,110,000 | |
| Series 2020 A, 0.14% 7/1/21, LOC Barclays Bank PLC, CP | 1,495,000 | 1,495,028 | |
| South Carolina St. Pub. Svc. Auth. Rev. Participating VRDN Series XG 0046, 0.1% 6/4/21 (Liquidity Facility Toronto-Dominion Bank) (a)(f)(g) | 265,000 | 265,000 | |
| TOTAL SOUTH CAROLINA | 32,313,068 | ||
| South Dakota - 0.0% | |||
| South Dakota Health & Edl. Facilities Auth. Rev. Participating VRDN Series XG 03 02, 0.15% 6/4/21 (Liquidity Facility Barclays Bank PLC) (a)(f)(g) | 600,000 | 600,000 | |
| Tennessee - 0.2% | |||
| Greeneville Health & Edl. Facilities Board Series 2018 B, 0.05% 6/4/21, LOC U.S. Bank NA, Cincinnati, VRDN (a) | 800,000 | 800,000 | |
| Tender Option Bond Trust Receipts Participating VRDN Series XF 10 97, 0.35% 6/4/21 (Liquidity Facility Deutsche Bank AG New York Branch) (a)(f)(g) | 1,290,000 | 1,290,000 | |
| Tennessee Gen. Oblig.: | |||
| Series 2021 A, 0.12% 6/23/21 (Liquidity Facility Tennessee Consldatd Retire Sys.), CP | 1,784,000 | 1,784,013 | |
| Series A: | |||
| 0.13% 7/13/21 (Liquidity Facility Tennessee Consldatd Retire Sys.), CP | 5,000,000 | 5,000,126 | |
| 0.15% 7/20/21 (Liquidity Facility Tennessee Consldatd Retire Sys.), CP | 3,000,000 | 3,000,044 | |
| TOTAL TENNESSEE | 11,874,183 | ||
| Texas - 3.1% | |||
| Dallas Fort Worth Int'l. Arpt. Rev. Participating VRDN Series Floaters XF 10 61, 0.2% 6/4/21 (Liquidity Facility Deutsche Bank AG New York Branch) (a)(b)(f)(g) | 8,000,000 | 8,000,000 | |
| Dallas/Fort Worth Int'l. Arpt. Facility Impt. Corp. Rev. (United Parcel Svc., Inc. Proj.) Series 2002, 0.04% 6/1/21, VRDN (a)(b) | 1,420,000 | 1,420,000 | |
| Deutsche Spears/Lifers Trust Participating VRDN Series Floaters XG 00 58, 0.12% 6/4/21 (Liquidity Facility Deutsche Bank AG) (a)(f)(g) | 1,085,000 | 1,085,000 | |
| Garland Util. Sys. Rev. Series 2018, 0.11% 6/8/21, LOC Bank of America NA, CP | 4,000,000 | 4,000,048 | |
| Grand Parkway Trans. Corp. Participating VRDN Series XF 20 34, 0.08% 6/4/21 (Liquidity Facility Morgan Stanley Bank, West Valley City Utah) (a)(f)(g) | 1,400,000 | 1,400,000 | |
| Gulf Coast Waste Disp. Auth. Envir. Facilities Rev. (ExxonMobil Proj.) Series 2001 A, 0.03% 6/1/21, VRDN (a)(b) | 1,100,000 | 1,100,000 | |
| Harris County Cultural Ed. Facilities Fin. Corp. Rev. Series 2016 B3. 0.15% tender 6/3/21, CP mode | 4,000,000 | 4,000,000 | |
| Houston Arpt. Sys. Rev. Series 2021 A: | |||
| 0.13% 6/22/21, LOC Sumitomo Mitsui Banking Corp., CP (b) | 3,000,000 | 3,000,000 | |
| 0.13% 6/22/21, LOC Sumitomo Mitsui Banking Corp., CP (b) | 2,000,000 | 2,000,000 | |
| Houston Gen. Oblig. TRAN Series 2020: | |||
| 4% 6/30/21 | 5,000,000 | 5,015,618 | |
| 5% 6/30/21 | 11,000,000 | 11,043,489 | |
| Houston Util. Sys. Rev. Series B3, 0.11% 6/24/21, LOC Sumitomo Mitsui Banking Corp., CP | 1,400,000 | 1,400,010 | |
| Hurst Participating VRDN Series XF 10 94, 0.35% 6/4/21 (Liquidity Facility Deutsche Bank AG New York Branch) (a)(f)(g) | 1,600,000 | 1,600,000 | |
| Lower Colorado River Auth. Rev. Series B, 0.13% 6/4/21, LOC State Street Bank & Trust Co., Boston, CP | 1,000,000 | 1,000,022 | |
| North Cent Tex Hsg. Fin. Corp. Mu Participating VRDN Series XF 10 99, 0.35% 6/4/21 (Liquidity Facility Deutsche Bank AG New York Branch) (a)(f)(g) | 400,000 | 400,000 | |
| North Texas Tollway Auth. Rev. Participating VRDN: | |||
| Series 2021 XF 12 25, 0.15% 6/4/21 (Liquidity Facility JPMorgan Chase Bank) (a)(f)(g) | 300,000 | 300,000 | |
| Series XF 12 21, 0.15% 6/4/21 (Liquidity Facility JPMorgan Chase Bank) (a)(f)(g) | 6,760,000 | 6,760,000 | |
| Series XM0085, 0.17% 6/4/21 (Liquidity Facility Barclays Bank PLC) (a)(f)(g) | 400,000 | 400,000 | |
| Port Arthur Navigation District Envir. Facilities Rev. (Motiva Enterprises LLC Proj.): | |||
| Series 2004, 0.22% 6/4/21, VRDN (a)(b) | 33,015,000 | 33,015,000 | |
| Series 2010 D, 0.1% 6/4/21, VRDN (a) | 6,500,000 | 6,500,000 | |
| Texas Dept. of Hsg. & Cmnty. Affairs Residential Mtg. Rev. Participating VRDN Series XF 10 98, 0.35% 6/4/21 (Liquidity Facility Deutsche Bank AG New York Branch) (a)(f)(g) | 1,100,000 | 1,100,000 | |
| Texas Gen. Oblig.: | |||
| Participating VRDN Series DB 80 79, 0.12% 6/3/21 (Liquidity Facility Deutsche Bank AG New York Branch) (a)(f)(g) | 1,500,000 | 1,500,000 | |
| Series 2018, 0.08% 6/4/21, LOC Fed. Home Ln. Bank of Dallas, VRDN (a) | 1,400,000 | 1,400,000 | |
| TRAN Series 2020, 4% 8/26/21 | 65,000,000 | 65,602,934 | |
| Texas Private Activity Bond Surface Trans. Corp. Participating VRDN Series XM 07 56, 0.27% 6/4/21 (Liquidity Facility Deutsche Bank AG New York Branch) (a)(b)(f)(g) | 1,800,000 | 1,800,000 | |
| Trinity Riv Pub. Facilities Corp. Tex M Participating VRDN Series XF 10 83, 0.35% 6/4/21 (Liquidity Facility Deutsche Bank AG New York Branch) (a)(f)(g) | 1,600,000 | 1,600,000 | |
| TOTAL TEXAS | 166,442,121 | ||
| Utah - 0.3% | |||
| Salt Lake City Arpt. Rev. Participating VRDN: | |||
| Series 17 XM 0493, 0.21% 6/4/21 (Liquidity Facility Morgan Stanley Bank, West Valley City Utah) (a)(b)(f)(g) | 500,000 | 500,000 | |
| Series Floaters XM 06 99, 0.35% 6/4/21 (Liquidity Facility Cr. Suisse AG) (a)(b)(f)(g) | 11,030,000 | 11,030,000 | |
| Series XM 08 82, 0.21% 6/4/21 (Liquidity Facility JPMorgan Chase Bank) (a)(b)(f)(g) | 1,400,000 | 1,400,000 | |
| Utah Hsg. Corp. Multi-family Hsg. Rev. Participating VRDN Series 2021 XF 11 00, 0.35% 6/4/21 (Liquidity Facility Deutsche Bank AG New York Branch) (a)(f)(g) | 2,500,000 | 2,500,000 | |
| TOTAL UTAH | 15,430,000 | ||
| Virginia - 0.5% | |||
| Arlington County Indl. Dev. Auth. Multi-family Hsg. Rev. (Gates of Ballston Apts.) Series 2005, 0.11% 6/4/21, LOC PNC Bank NA, VRDN (a)(b) | 7,700,000 | 7,700,000 | |
| Suffolk Econ. Dev. Auth. Hosp. Facilities Rev. Participating VRDN Series MIZ 90 25, 0.13% 6/4/21 (Liquidity Facility Mizuho Cap. Markets Llc) (a)(f)(g) | 14,490,000 | 14,490,000 | |
| Virginia Commonwealth Trans. Board Rev. Participating VRDN Series DB 80 80, 0.12% 6/4/21 (Liquidity Facility Deutsche Bank AG New York Branch) (a)(f)(g) | 2,300,000 | 2,300,000 | |
| TOTAL VIRGINIA | 24,490,000 | ||
| Washington - 0.3% | |||
| Port of Seattle Rev. Series 2021 B1, 0.1% 7/7/21, LOC Bank of America NA, CP (b) | 2,000,000 | 2,000,000 | |
| Washington Convention Ctr. Pub. Facilities Participating VRDN Series XG 02 96, 0.09% 6/4/21 (Liquidity Facility Barclays Bank PLC) (a)(f)(g) | 7,985,000 | 7,985,000 | |
| Washington Econ. Dev. Fin. Auth. Rev. Participating VRDN Series Floaters 005, 0.35% 7/9/21 (Liquidity Facility Barclays Bank PLC) (a)(b)(f)(g) | 5,000,000 | 5,000,000 | |
| Washington Health Care Facilities Auth. Rev. Participating VRDN Series XM 08 83, 0.2% 6/4/21 (Liquidity Facility JPMorgan Chase Bank) (a)(f)(g) | 1,500,000 | 1,500,000 | |
| TOTAL WASHINGTON | 16,485,000 | ||
| Wisconsin - 0.3% | |||
| JPMorgan Chase Participating VRDN Series Floaters XF 01 27, 0.09% 6/4/21 (a)(f)(g) | 1,060,000 | 1,060,000 | |
| Milwaukee School District RAN Series 2020 M8, 2% 7/1/21 | 10,000,000 | 10,015,657 | |
| Wisconsin Ctr. District Tax Rev. Participating VRDN Series 2021 XF 12 22, 0.2% 6/4/21 (Liquidity Facility JPMorgan Chase Bank) (a)(f)(g) | 200,000 | 200,000 | |
| Wisconsin Health & Edl. Facilities Series 2020 C, 0.15% 6/4/21, VRDN (a) | 6,750,000 | 6,750,000 | |
| TOTAL WISCONSIN | 18,025,657 | ||
| TOTAL MUNICIPAL NOTES | |||
| (Cost $1,193,171,508) | 1,193,832,674 | ||
| Shares | Value | ||
| Short-Term Funds - 15.5% | |||
| Federated Hermes Municipal Ultrashort Fund Institutional Shares | 3,990,976 | 40,109,305 | |
| JPMorgan Ultra-Short Municipal Fund Class I | 61,760,239 | 621,925,579 | |
| Vanguard Short-Term Tax-Exempt Fund Admiral Shares | 11,318,408 | 180,415,430 | |
| TOTAL SHORT-TERM FUNDS | |||
| (Cost $842,017,503) | 842,450,314 | ||
| Municipal Bond Funds - 0.1% | |||
| Nuveen NY AMT-Free Quality Municipal Income Fund Preferred Shares 0.38%(a)(e)(i) | |||
| (Cost $6,800,000) | 6,800,000 | 6,800,000 | |
| Money Market Funds - 17.8% | |||
| Fidelity Investments Money Market Government Portfolio Institutional Class 0.01% (j)(k) | 483,241,223 | 483,241,223 | |
| Fidelity Municipal Cash Central Fund 0.06% (l)(m) | 10,606,461 | 10,608,583 | |
| Fidelity SAI Municipal Money Market Fund .01% (j)(k) | 454,850,573 | 455,032,513 | |
| State Street Institutional U.S. Government Money Market Fund Premier Class 0.04% (j) | 7,596,271 | 7,596,271 | |
| TOTAL MONEY MARKET FUNDS | |||
| (Cost $956,421,054) | 956,478,590 | ||
| TOTAL INVESTMENT IN SECURITIES - 100.7% | |||
| (Cost $5,408,243,163) | 5,426,138,161 | ||
| NET OTHER ASSETS (LIABILITIES) - (0.7)% | (36,580,266) | ||
| NET ASSETS - 100% | $5,389,557,895 |
Security Type Abbreviations
BAN – BOND ANTICIPATION NOTE
CP – COMMERCIAL PAPER
RAN – REVENUE ANTICIPATION NOTE
TAN – TAX ANTICIPATION NOTE
TRAN – TAX AND REVENUE ANTICIPATION NOTE
VRDN – VARIABLE RATE DEMAND NOTE (A debt instrument that is payable upon demand, either daily, weekly or monthly)
Legend
(a) Coupon rates for floating and adjustable rate securities reflect the rates in effect at period end.
(b) Private activity obligations whose interest is subject to the federal alternative minimum tax for individuals.
(c) Security or a portion of the security purchased on a delayed delivery or when-issued basis.
(d) Coupon is indexed to a floating interest rate which may be multiplied by a specified factor and/or subject to caps or floors.
(e) Security exempt from registration under Rule 144A of the Securities Act of 1933. These securities may be resold in transactions exempt from registration, normally to qualified institutional buyers. At the end of the period, the value of these securities amounted to $45,595,651 or 0.8% of net assets.
(f) Provides evidence of ownership in one or more underlying municipal bonds.
(g) Coupon rates are determined by re-marketing agents based on current market conditions.
(h) Restricted securities (including private placements) - Investment in securities not registered under the Securities Act of 1933 (excluding 144A issues). At the end of the period, the value of restricted securities (excluding 144A issues) amounted to $8,800,000 or 0.2% of net assets.
(i) Non-income producing
(j) The rate quoted is the annualized seven-day yield of the fund at period end.
(k) Affiliated Fund
(l) Information in this report regarding holdings by state and security types does not reflect the holdings of the Fidelity Municipal Cash Central Fund.
(m) Affiliated fund that is available only to investment companies and other accounts managed by Fidelity Investments. The rate quoted is the annualized seven-day yield of the fund at period end. A complete unaudited listing of the fund's holdings as of its most recent quarter end is available upon request. In addition, each Fidelity Central Fund's financial statements, which are not covered by the Fund's Report of Independent Registered Public Accounting Firm, are available on the SEC's website or upon request.
Additional information on each restricted holding is as follows:
| Security | Acquisition Date | Acquisition Cost |
| Baltimore Proj. Rev. Bonds Series Floaters G 42, 0.25%, tender 1/3/22 (Liquidity Facility Royal Bank of Canada) | 1/4/21 | $4,500,000 |
| River Islands Pub. Fing. Auth. Participating VRDN Series MIZ 90 26, 0.35% 7/2/21 (Liquidity Facility Mizuho Cap. Markets Llc) | 8/14/20 | $4,300,000 |
Affiliated Central Funds
Information regarding fiscal year to date income earned by the Fund from investments in Fidelity Central Funds is as follows:
| Fund | Income earned |
| Fidelity Municipal Cash Central Fund | $44,852 |
| Total | $44,852 |
Amounts in the income column in the above table include any capital gain distributions from underlying funds, which are presented in the corresponding line-item in the Statement of Operations, if applicable.
Affiliated Underlying Funds
Fiscal year to date information regarding the Fund's investments in affiliated Underlying Funds, excluding any Money Market Central Funds, is presented below. Exchanges between classes of the same affiliated Underlying Funds may occur.
| Affiliate | Value, beginning of period | Purchases | Sales Proceeds | Dividend Income | Realized Gain (loss) | Change in Unrealized appreciation (depreciation) | Value, end of period |
| Fidelity Investments Money Market Government Portfolio Institutional Class 0.01% | $249,972,338 | $1,817,701,786 | $1,584,432,901 | $78,950 | $-- | $-- | $483,241,223 |
| Fidelity SAI Municipal Money Market Fund .01% | 190,501,215 | 292,440,613 | 27,888,139 | 165,933 | (156) | (21,020) | 455,032,513 |
| Total | $440,473,553 | $2,110,142,399 | $1,612,321,040 | $244,883 | $(156) | $(21,020) | $938,273,736 |
Amounts in the income column in the above table include any capital gain distributions from underlying funds, which are presented in the corresponding line-item in the Statement of Operations, if applicable.
Investment Valuation
The following is a summary of the inputs used, as of May 31, 2021, involving the Fund's assets and liabilities carried at fair value. The inputs or methodology used for valuing securities may not be an indication of the risk associated with investing in those securities. For more information on valuation inputs, and their aggregation into the levels used below, please refer to the Investment Valuation section in the accompanying Notes to Financial Statements.
| Valuation Inputs at Reporting Date: | ||||
| Description | Total | Level 1 | Level 2 | Level 3 |
| Investments in Securities: | ||||
| Municipal Securities | $3,620,409,257 | $-- | $3,620,409,257 | $-- |
| Money Market Funds | 956,478,590 | 956,478,590 | -- | -- |
| Investment Companies | 6,800,000 | -- | 6,800,000 | -- |
| Short-Term Funds | 842,450,314 | 842,450,314 | -- | -- |
| Total Investments in Securities: | $5,426,138,161 | $1,798,928,904 | $3,627,209,257 | $-- |
See accompanying notes which are an integral part of the financial statements.
Financial Statements
Statement of Assets and Liabilities
| May 31, 2021 | ||
| Assets | ||
| Investment in securities, at value — See accompanying schedule: Unaffiliated issuers (cost $4,459,418,379) | $4,477,255,842 | |
| Fidelity Central Funds (cost $10,607,522) | 10,608,583 | |
| Other affiliated issuers (cost $938,217,262) | 938,273,736 | |
| Total Investment in Securities (cost $5,408,243,163) | $5,426,138,161 | |
| Cash | 677,397 | |
| Receivable for investments sold | 3,436,717 | |
| Receivable for fund shares sold | 4,406,510 | |
| Dividends receivable | 127,958 | |
| Interest receivable | 32,663,007 | |
| Distributions receivable from Fidelity Central Funds | 1,677 | |
| Prepaid expenses | 13,689 | |
| Other receivables | 5,669 | |
| Total assets | 5,467,470,785 | |
| Liabilities | ||
| Payable for investments purchased | ||
| Regular delivery | $38,762,311 | |
| Delayed delivery | 31,087,074 | |
| Payable for fund shares redeemed | 5,400,077 | |
| Distributions payable | 2,152,240 | |
| Accrued management fee | 281,802 | |
| Other payables and accrued expenses | 229,386 | |
| Total liabilities | 77,912,890 | |
| Net Assets | $5,389,557,895 | |
| Net Assets consist of: | ||
| Paid in capital | $5,372,399,879 | |
| Total accumulated earnings (loss) | 17,158,016 | |
| Net Assets | $5,389,557,895 | |
| Net Asset Value, offering price and redemption price per share ($5,389,557,895 ÷ 536,355,288 shares) | $10.05 |
See accompanying notes which are an integral part of the financial statements.
Statement of Operations
| Year ended May 31, 2021 | ||
| Investment Income | ||
| Dividends: | ||
| Unaffiliated issuers | $1,987,076 | |
| Affiliated issuers | 217,646 | |
| Interest | 30,034,563 | |
| Income from Fidelity Central Funds | 43,586 | |
| Total income | 32,282,871 | |
| Expenses | ||
| Management fee | $13,933,311 | |
| Custodian fees and expenses | 40,684 | |
| Independent trustees' fees and expenses | 38,308 | |
| Registration fees | 208,767 | |
| Audit | 68,560 | |
| Legal | 10,407 | |
| Miscellaneous | 41,101 | |
| Total expenses before reductions | 14,341,138 | |
| Expense reductions | (10,860,554) | |
| Total expenses after reductions | 3,480,584 | |
| Net investment income (loss) | 28,802,287 | |
| Realized and Unrealized Gain (Loss) | ||
| Net realized gain (loss) on: | ||
| Investment securities: | ||
| Unaffiliated issuers | 424,973 | |
| Fidelity Central Funds | 2,338 | |
| Other affiliated issuers | (156) | |
| Capital gain distributions from underlying funds: | ||
| Affiliated issuers | 28,503 | |
| Total net realized gain (loss) | 455,658 | |
| Change in net unrealized appreciation (depreciation) on: | ||
| Investment securities: | ||
| Unaffiliated issuers | 10,961,626 | |
| Fidelity Central Funds | 1,061 | |
| Other affiliated issuers | (21,020) | |
| Total change in net unrealized appreciation (depreciation) | 10,941,667 | |
| Net gain (loss) | 11,397,325 | |
| Net increase (decrease) in net assets resulting from operations | $40,199,612 |
See accompanying notes which are an integral part of the financial statements.
Statement of Changes in Net Assets
| Year ended May 31, 2021 | Year ended May 31, 2020 | |
| Increase (Decrease) in Net Assets | ||
| Operations | ||
| Net investment income (loss) | $28,802,287 | $53,942,535 |
| Net realized gain (loss) | 455,658 | 413,520 |
| Change in net unrealized appreciation (depreciation) | 10,941,667 | (2,002,641) |
| Net increase (decrease) in net assets resulting from operations | 40,199,612 | 52,353,414 |
| Distributions to shareholders | (29,155,326) | (55,246,709) |
| Share transactions | ||
| Proceeds from sales of shares | 3,198,122,199 | 1,047,372,777 |
| Reinvestment of distributions | 11,827 | 3,699,668 |
| Cost of shares redeemed | (1,188,111,043) | (1,095,565,154) |
| Net increase (decrease) in net assets resulting from share transactions | 2,010,022,983 | (44,492,709) |
| Total increase (decrease) in net assets | 2,021,067,269 | (47,386,004) |
| Net Assets | ||
| Beginning of period | 3,368,490,626 | 3,415,876,630 |
| End of period | $5,389,557,895 | $3,368,490,626 |
| Other Information | ||
| Shares | ||
| Sold | 318,386,661 | 104,544,855 |
| Issued in reinvestment of distributions | 1,177 | 368,964 |
| Redeemed | (118,260,585) | (109,355,545) |
| Net increase (decrease) | 200,127,253 | (4,441,726) |
See accompanying notes which are an integral part of the financial statements.
Financial Highlights
Strategic Advisers Tax-Sensitive Short Duration Fund
| Years ended May 31, | 2021 | 2020 | 2019 | 2018 A |
| Selected Per–Share Data | ||||
| Net asset value, beginning of period | $10.02 | $10.03 | $9.99 | $10.00 |
| Income from Investment Operations | ||||
| Net investment income (loss)B | .067 | .159 | .174 | .053 |
| Net realized and unrealized gain (loss) | .034 | (.006) | .042 | (.014) |
| Total from investment operations | .101 | .153 | .216 | .039 |
| Distributions from net investment income | (.070) | (.159) | (.173) | (.049) |
| Distributions from net realized gain | (.001) | (.004) | (.003) | – |
| Total distributions | (.071) | (.163) | (.176) | (.049) |
| Net asset value, end of period | $10.05 | $10.02 | $10.03 | $9.99 |
| Total ReturnC,D | 1.01% | 1.53% | 2.19% | .39% |
| Ratios to Average Net AssetsE,F | ||||
| Expenses before reductions | .33% | .34% | .37% | .52%G |
| Expenses net of fee waivers, if any | .08% | .09% | .12% | .26%G,H |
| Expenses net of all reductions | .08% | .09% | .12% | .26%G,H |
| Net investment income (loss) | .66% | 1.59% | 1.74% | 1.28%G |
| Supplemental Data | ||||
| Net assets, end of period (000 omitted) | $5,389,558 | $3,368,491 | $3,415,877 | $3,219,118 |
| Portfolio turnover rateI | 86% | 81% | 57% | 180%J |
A For the period December 28, 2017 (commencement of operations) to May 31, 2018.
B Calculated based on average shares outstanding during the period.
C Total returns for periods of less than one year are not annualized.
D Total returns would have been lower if certain expenses had not been reduced during the applicable periods shown.
E Fees and expenses of any underlying mutual funds or exchange-traded funds (ETFs) are not included in the Fund's expense ratio. The Fund indirectly bears its proportionate share of these expenses. For additional expense information related to investments in Fidelity Central Funds, please refer to the "Investments in Fidelity Central Funds" note found in the Notes to Financial Statements section of the most recent Annual or Semi-Annual report.
F Expense ratios reflect operating expenses of the class. Expenses before reductions do not reflect amounts reimbursed, waived, or reduced through arrangements with the investment advisor, brokerage services, or other offset arrangements, if applicable, and do not represent the amount paid by the class during periods when reimbursements, waivers or reductions occur.
G Annualized
H Audit fees are not annualized.
I Amount does not include the portfolio activity of any underlying mutual funds or exchange-traded funds (ETFs).
J Amount not annualized.
See accompanying notes which are an integral part of the financial statements.
Notes to Financial Statements
For the period ended May 31, 2021
1. Organization.
Strategic Advisers Tax-Sensitive Short Duration Fund (the Fund) is a fund of Fidelity Rutland Square Trust II (the Trust), and is authorized to issue an unlimited number of shares. The Trust is registered under the Investment Company Act of 1940, as amended (the 1940 Act), as an open-end management investment company organized as a Delaware statutory trust. The Fund is offered exclusively to certain managed account clients of Strategic Advisers LLC (Strategic Advisers), an affiliate of Fidelity Management & Research Company LLC (FMR).
2. Significant Accounting Policies.
The Fund is an investment company and applies the accounting and reporting guidance of the Financial Accounting Standards Board (FASB) Accounting Standards Codification Topic 946 Financial Services - Investment Companies. The financial statements have been prepared in conformity with accounting principles generally accepted in the United States of America (GAAP), which require management to make certain estimates and assumptions at the date of the financial statements. Actual results could differ from those estimates. Subsequent events, if any, through the date that the financial statements were issued have been evaluated in the preparation of the financial statements. The Fund's Schedule of Investments lists any underlying mutual funds or exchange-traded funds (ETFs) but does not include the underlying holdings of these funds. The following summarizes the significant accounting policies of the Fund:
Investment Valuation. Investments are valued as of 4:00 p.m. Eastern time on the last calendar day of the period. The Board of Trustees (the Board) has delegated the day to day responsibility for the valuation of the Fund's investments to the Fair Value Committee (the Committee) established by the Fund's investment adviser. In accordance with valuation policies and procedures approved by the Board, the Fund attempts to obtain prices from one or more third party pricing vendors or brokers to value its investments. When current market prices, quotations or currency exchange rates are not readily available or reliable, investments will be fair valued in good faith by the Committee, in accordance with procedures adopted by the Board. Factors used in determining fair value vary by investment type and may include market or investment specific events, changes in interest rates and credit quality. The frequency with which these procedures are used cannot be predicted and they may be utilized to a significant extent. The Committee oversees the Fund's valuation policies and procedures and reports to the Board on the Committee's activities and fair value determinations. The Board monitors the appropriateness of the procedures used in valuing the Fund's investments and ratifies the fair value determinations of the Committee.
The Fund categorizes the inputs to valuation techniques used to value its investments into a disclosure hierarchy consisting of three levels as shown below:
- Level 1 – quoted prices in active markets for identical investments
- Level 2 – other significant observable inputs (including quoted prices for similar investments, interest rates, prepayment speeds, etc.)
- Level 3 – unobservable inputs (including the Fund's own assumptions based on the best information available)
Valuation techniques used to value the Fund's investments by major category are as follows:
Debt securities, including restricted securities, are valued based on evaluated prices received from third party pricing vendors or from brokers who make markets in such securities. Municipal securities are valued by pricing vendors who utilize matrix pricing which considers yield or price of bonds of comparable quality, coupon, maturity and type or by broker-supplied prices. When independent prices are unavailable or unreliable, debt securities may be valued utilizing pricing methodologies which consider similar factors that would be used by third party pricing vendors. Debt securities are generally categorized as Level 2 in the hierarchy but may be Level 3 depending on the circumstances.
Investments in open-end mutual funds, including the Fidelity Central Funds, are valued at their closing net asset value (NAV) each business day and are categorized as Level 1 in the hierarchy. If an unaffiliated open-end mutual fund's NAV is unavailable, shares of that fund may be valued by another method that the Board believes reflects fair value in accordance with the Board's fair value pricing policies and is categorized as Level 2 in the hierarchy.
Changes in valuation techniques may result in transfers in or out of an assigned level within the disclosure hierarchy. The aggregate value of investments by input level as of May 31, 2021 is included at the end of the Fund's Schedule of Investments.
Investment Transactions and Income. For financial reporting purposes, the Fund's investment holdings and NAV include trades executed through the end of the last business day of the period. The NAV per share for processing shareholder transactions is calculated as of the close of business of the New York Stock Exchange (NYSE), normally 4:00 p.m. Eastern time and includes trades executed through the end of the prior business day. Gains and losses on securities sold are determined on the basis of identified cost. Dividend income is recorded on the ex-dividend date, except for certain dividends from foreign securities where the ex-dividend date may have passed, which are recorded as soon as the Fund is informed of the ex-dividend date. Non-cash dividends included in dividend income, if any, are recorded at the fair market value of the securities received. Income and capital gain distributions from Fidelity Central Funds, if any, are recorded on the ex-dividend date. Income and capital gain distributions from any underlying mutual funds or exchange-traded funds (ETFs) are recorded on the ex-dividend date. Interest income is accrued as earned and includes coupon interest and amortization of premium and accretion of discount on debt securities as applicable. Debt obligations may be placed on non-accrual status and related interest income may be reduced by ceasing current accruals and writing off interest receivables when the collection of all or a portion of interest has become doubtful based on consistently applied procedures. A debt obligation is removed from non-accrual status when the issuer resumes interest payments or when collectability of interest is reasonably assured.
Expenses. Expenses directly attributable to a fund are charged to that fund. Expenses attributable to more than one fund are allocated among the respective funds on the basis of relative net assets or other appropriate methods. Expenses included in the accompanying financial statements reflect the expenses of that fund and do not include any expenses associated with any underlying mutual funds or exchange-traded funds. Although not included in a fund's expenses, a fund indirectly bears its proportionate share of these expenses through the net asset value of each underlying mutual fund or exchange-traded fund. Expense estimates are accrued in the period to which they relate and adjustments are made when actual amounts are known.
Deferred Trustee Compensation. Under a Deferred Compensation Plan (the Plan) for certain Funds, certain independent Trustees have elected to defer receipt of a portion of their annual compensation. Deferred amounts are invested in affiliated mutual funds, are marked-to-market and remain in a fund until distributed in accordance with the Plan. The investment of deferred amounts and the offsetting payable to the Trustees presented below are included in the accompanying Statement of Assets and Liabilities in other receivables and other payables and accrued expenses, as applicable.
| Strategic Advisers Tax-Sensitive Short Duration Fund | $5,669 |
Income Tax Information and Distributions to Shareholders. Each year, the Fund intends to qualify as a regulated investment company under Subchapter M of the Internal Revenue Code, including distributing substantially all of its taxable income and realized gains. As a result, no provision for U.S. Federal income taxes is required. As of May 31, 2021, the Fund did not have any unrecognized tax benefits in the financial statements; nor is the Fund aware of any tax positions for which it is reasonably possible that the total amounts of unrecognized tax benefits will significantly change in the next twelve months. The Fund files a U.S. federal tax return, in addition to state and local tax returns as required. The Fund's federal income tax returns are subject to examination by the Internal Revenue Service (IRS) for a period of three fiscal years after they are filed. State and local tax returns may be subject to examination for an additional fiscal year depending on the jurisdiction.
Distributions are declared and recorded daily and paid monthly from net investment income. Distributions from realized gains, if any, are declared and recorded on the ex-dividend date. Income and capital gain distributions are determined in accordance with income tax regulations, which may differ from GAAP.
Capital accounts within the financial statements are adjusted for permanent book-tax differences. These adjustments have no impact on net assets or the results of operations. Capital accounts are not adjusted for temporary book-tax differences which will reverse in a subsequent period.
Book-tax differences are primarily due to market discount, deferred trustees compensation and losses deferred due to wash sales and excise tax regulations.
As of period end, the cost and unrealized appreciation (depreciation) in securities, and derivatives if applicable, for federal income tax purposes were as follows:
| Gross unrealized appreciation | $18,247,759 |
| Gross unrealized depreciation | (799,152) |
| Net unrealized appreciation (depreciation) | $17,448,607 |
| Tax Cost | $5,408,689,554 |
The tax-based components of distributable earnings as of period end were as follows:
| Net unrealized appreciation (depreciation) on securities and other investments | $17,448,607 |
The tax character of distributions paid was as follows:
| May 31, 2021 | May 31, 2020 | |
| Tax-exempt Income | $28,634,634 | $50,555,391 |
| Ordinary Income | 57,416 | 4,008,479 |
| Long-term Capital Gains | 463,276 | 682,839 |
| Total | $29,155,326 | $ 55,246,709 |
Delayed Delivery Transactions and When-Issued Securities. During the period, certain Funds transacted in securities on a delayed delivery or when-issued basis. Payment and delivery may take place after the customary settlement period for that security. The price of the underlying securities and the date when the securities will be delivered and paid for are fixed at the time the transaction is negotiated. Securities purchased on a delayed delivery or when-issued basis are identified as such in the Schedule of Investments. Compensation for interest forgone in the purchase of a delayed delivery or when-issued debt security may be received. With respect to purchase commitments, each applicable Fund identifies securities as segregated in its records with a value at least equal to the amount of the commitment. Payables and receivables associated with the purchases and sales of delayed delivery securities having the same coupon, settlement date and broker are offset. Delayed delivery or when-issued securities that have been purchased from and sold to different brokers are reflected as both payables and receivables in the Statement of Assets and Liabilities under the caption "Delayed delivery", as applicable. Losses may arise due to changes in the value of the underlying securities or if the counterparty does not perform under the contract's terms, or if the issuer does not issue the securities due to political, economic, or other factors.
Restricted Securities (including Private Placements). Funds may invest in securities that are subject to legal or contractual restrictions on resale. These securities generally may be resold in transactions exempt from registration or to the public if the securities are registered. Disposal of these securities may involve time-consuming negotiations and expense, and prompt sale at an acceptable price may be difficult. Information regarding restricted securities held at period end is included at the end of the Schedule of Investments, if applicable.
3. Purchases and Sales of Investments.
Purchases and sales of securities, other than short-term securities, are noted in the table below.
| Purchases ($) | Sales ($) | |
| Strategic Advisers Tax-Sensitive Short Duration Fund | 4,630,653,408 | 2,940,373,483 |
4. Fees and Other Transactions with Affiliates.
Management Fee. Strategic Advisers (the investment adviser) provides the Fund with investment management related services. For these services, the Fund pays a monthly management fee to the investment adviser. The management fee is calculated by adding the annual management fee rate of .25% of the Fund's average net assets throughout the month to the aggregate of the fee rates, payable monthly by the investment adviser, to the Fund's sub-advisers. The Fund's maximum aggregate management fee will not exceed .55% of the Fund's average net assets. For the reporting period, the total annual management fee rate was .32% of the Fund's average net assets.
During the period, the investment adviser waived a portion of its management fee as described in the Expense Reductions note.
Sub-Advisers. FIAM LLC (an affiliate of the investment adviser), T. Rowe Price Associates, Inc. and Wells Capital Management, Inc. each served as a sub-adviser for the Fund during the period. Sub-advisers provide discretionary investment advisory services for their allocated portion of the Fund's assets and are paid as described in the Management Fee note.
Interfund Trades. Funds may purchase from or sell securities to other funds affiliated with each sub-adviser under procedures adopted by the Board. The procedures have been designed to ensure these interfund trades are executed in accordance with Rule 17a-7 of the 1940 Act. Any interfund trades are included within the respective purchases and sales amounts shown in the Purchases and Sales of Investments note and are noted in the table below.
| Purchases ($) | Sales ($) | |
| Strategic Advisers Tax-Sensitive Short Duration Fund | 39,869,400 | 97,925,000 |
5. Investments in Fidelity Central Funds.
Funds may invest in Fidelity Central Funds, which are open-end investment companies generally available only to other investment companies and accounts managed by the investment adviser and its affiliates. The Schedule of Investments lists any Fidelity Central Funds held as an investment as of period end, but does not include the underlying holdings of each Fidelity Central Fund. An investing fund indirectly bears its proportionate share of the expenses of the underlying Fidelity Central Funds.
Based on its investment objective, each Fidelity Central Fund may invest or participate in various investment vehicles or strategies that are similar to those of the investing fund. These strategies are consistent with the investment objectives of the investing fund and may involve certain economic risks which may cause a decline in value of each of the Fidelity Central Funds and thus a decline in the value of the investing fund.
A complete unaudited list of holdings for each Fidelity Central Fund is available upon request or at the Securities and Exchange Commission website at www.sec.gov. In addition, the financial statements of the Fidelity Central Funds, which are not covered by the Report of Independent Registered Public Accounting Firm, are available on the Securities and Exchange Commission website or upon request.
| Fidelity Central Fund | Investment Manager | Investment Objective | Investment Practices | Expense Ratio(a) |
| Fidelity Money Market Central Funds | Fidelity Management & Research Company LLC (FMR) | Each fund seeks to obtain a high level of current income consistent with the preservation of capital and liquidity. | Short-term Investments | Less than .005% to .01% |
(a) Expenses expressed as a percentage of average net assets and are as of each underlying Central Fund's most recent annual or semi-annual shareholder report.
6. Committed Line of Credit.
Certain Funds participate with other funds managed by the investment adviser or an affiliate in a $4.25 billion credit facility (the "line of credit") to be utilized for temporary or emergency purposes to fund shareholder redemptions or for other short-term liquidity purposes. The participating funds have agreed to pay commitment fees on their pro-rata portion of the line of credit, which are reflected in Miscellaneous expenses on the Statement of Operations, and are listed below. During the period, there were no borrowings on this line of credit.
| Amount | |
| Strategic Advisers Tax-Sensitive Short Duration Fund | $8,422 |
7. Expense Reductions.
The investment adviser has contractually agreed to waive the Fund's management fee in an amount equal to .25% of the Fund's average net assets until September 30, 2023. During the period, this waiver reduced the Fund's management fee by $10,860,554.
8. Other.
Fund's organizational documents provide former and current trustees and officers with a limited indemnification against liabilities arising in connection with the performance of their duties to the fund. In the normal course of business, the fund may also enter into contracts that provide general indemnifications. The fund's maximum exposure under these arrangements is unknown as this would be dependent on future claims that may be made against the fund. The risk of material loss from such claims is considered remote.
Funds do not invest in underlying mutual funds for the purpose of exercising management or control; however, investments by funds within their principal investment strategies may represent a significant portion of the underlying mutual fund's net assets. At the end of the period, certain Funds were the owners of record of 10% or more of the total outstanding shares of the following underlying mutual funds as shown below.
| Fund | Strategic Advisers Tax-Sensitive Short Duration Fund |
| Fidelity SAI Municipal Money Market Fund | 100% |
9. Coronavirus (COVID-19) Pandemic.
An outbreak of COVID-19 first detected in China during December 2019 has since spread globally and was declared a pandemic by the World Health Organization during March 2020. Developments that disrupt global economies and financial markets, such as the COVID-19 pandemic, may magnify factors that affect the Fund's performance.
Report of Independent Registered Public Accounting Firm
To the Board of Trustees of Fidelity Rutland Square Trust II and Shareholders of Strategic Advisers Tax-Sensitive Short Duration Fund
Opinion on the Financial Statements
We have audited the accompanying statement of assets and liabilities, including the schedule of investments, of Strategic Advisers Tax-Sensitive Short Duration Fund (one of the funds constituting Fidelity Rutland Square Trust II, referred to hereafter as the “Fund”) as of May 31, 2021, the related statement of operations for the year ended May 31, 2021, the statement of changes in net assets for each of the two years in the period ended May 31, 2021, including the related notes, and the financial highlights for each of the three years in the period ended May 31, 2021 and for the period December 28, 2017 (commencement of operations) to May 31, 2018 (collectively referred to as the “financial statements”). In our opinion, the financial statements present fairly, in all material respects, the financial position of the Fund as of May 31, 2021, the results of its operations for the year then ended, the changes in its net assets for each of the two years in the period ended May 31, 2021 and the financial highlights for each of the three years in the period ended May 31, 2021 and for the period December 28, 2017 (commencement of operations) to May 31, 2018 in conformity with accounting principles generally accepted in the United States of America.
Basis for Opinion
These financial statements are the responsibility of the Fund’s management. Our responsibility is to express an opinion on the Fund’s financial statements based on our audits. We are a public accounting firm registered with the Public Company Accounting Oversight Board (United States) (PCAOB) and are required to be independent with respect to the Fund in accordance with the U.S. federal securities laws and the applicable rules and regulations of the Securities and Exchange Commission and the PCAOB.
We conducted our audits of these financial statements in accordance with the standards of the PCAOB. Those standards require that we plan and perform the audit to obtain reasonable assurance about whether the financial statements are free of material misstatement, whether due to error or fraud.
Our audits included performing procedures to assess the risks of material misstatement of the financial statements, whether due to error or fraud, and performing procedures that respond to those risks. Such procedures included examining, on a test basis, evidence regarding the amounts and disclosures in the financial statements. Our audits also included evaluating the accounting principles used and significant estimates made by management, as well as evaluating the overall presentation of the financial statements. Our procedures included confirmation of securities owned as of May 31, 2021 by correspondence with the custodian and brokers; when replies were not received from brokers, we performed other auditing procedures. We believe that our audits provide a reasonable basis for our opinion.
/s/ PricewaterhouseCoopers LLP
Boston, Massachusetts
July 13, 2021
We have served as the auditor of one or more investment companies in the Fidelity group of funds since 1932.
Trustees and Officers
The Trustees, Members of the Advisory Board (if any), and officers of the trust and fund, as applicable, are listed below. The Board of Trustees governs the fund and is responsible for protecting the interests of shareholders. The Trustees are experienced executives who meet periodically throughout the year to oversee the fund's activities, review contractual arrangements with companies that provide services to the fund, oversee management of the risks associated with such activities and contractual arrangements, and review the fund's performance. If the interests of the fund and an underlying Fidelity® fund were to diverge, a conflict of interest could arise and affect how the Trustees and Members of the Advisory Board fulfill their fiduciary duties to the affected funds. Strategic Advisers has structured the fund to avoid these potential conflicts, although there may be situations where a conflict of interest is unavoidable. In such instances, Strategic Advisers, the Trustees, and Members of the Advisory Board would take reasonable steps to minimize and, if possible, eliminate the conflict. Each of the Trustees oversees 12 funds.
The Trustees hold office without limit in time except that (a) any Trustee may resign; (b) any Trustee may be removed by written instrument, signed by at least two-thirds of the number of Trustees prior to such removal; (c) any Trustee who requests to be retired or who has become incapacitated by illness or injury may be retired by written instrument signed by a majority of the other Trustees; and (d) any Trustee may be removed at any special meeting of shareholders by a two-thirds vote of the outstanding voting securities of the trust. Each Independent Trustee shall retire not later than the last day of the calendar year in which his or her 75th birthday occurs. The Independent Trustees may waive this mandatory retirement age policy with respect to individual Trustees. Officers and Advisory Board Members hold office without limit in time, except that any officer or Advisory Board Member may resign or may be removed by a vote of a majority of the Trustees at any regular meeting or any special meeting of the Trustees. Except as indicated, each individual has held the office shown or other offices in the same company for the past five years.
Each Trustee who is not an interested person (as defined in the 1940 Act) of the trust and the fund is referred to herein as an Independent Trustee.
The fund’s Statement of Additional Information (SAI) includes more information about the Trustees. To request a free copy, call Fidelity at 1-800-544-3455.
Experience, Skills, Attributes, and Qualifications of the Trustees. The Governance and Nominating Committee has adopted a statement of policy that describes the experience, qualifications, attributes, and skills that are necessary and desirable for potential Independent Trustee candidates (Statement of Policy). The Board believes that each Trustee satisfied at the time he or she was initially elected or appointed a Trustee, and continues to satisfy, the standards contemplated by the Statement of Policy. The Governance and Nominating Committee may also engage professional search firms to help identify potential Independent Trustee candidates with experience, qualifications, attributes, and skills consistent with the Statement of Policy. Additional criteria based on the composition and skills of the current Independent Trustees, as well as experience or skills that may be appropriate in light of future changes to board composition, business conditions, and regulatory or other developments, may be considered by the professional search firms and the Governance and Nominating Committee. In addition, the Board takes into account the Trustees' commitment and participation in Board and committee meetings, as well as their leadership of standing and ad hoc committees throughout their tenure.
In determining that a particular Trustee was and continues to be qualified to serve as a Trustee, the Board has considered a variety of criteria, none of which, in isolation, was controlling. The Board believes that, collectively, the Trustees have balanced and diverse experience, qualifications, attributes, and skills, which allow the Board to operate effectively in governing the fund and protecting the interests of shareholders. Information about the specific experience, skills, attributes, and qualifications of each Trustee, which in each case led to the Board's conclusion that the Trustee should serve (or continue to serve) as a trustee of the fund, is provided below.
Board Structure and Oversight Function. Robert A. Lawrence is an interested person and currently serves as Chairman. The Trustees have determined that an interested Chairman is appropriate and benefits shareholders because an interested Chairman has a personal and professional stake in the quality and continuity of services provided to the fund. Independent Trustees exercise their informed business judgment to appoint an individual of their choosing to serve as Chairman, regardless of whether the Trustee happens to be independent or a member of management. The Independent Trustees have determined that they can act independently and effectively without having an Independent Trustee serve as Chairman and that a key structural component for assuring that they are in a position to do so is for the Independent Trustees to constitute a substantial majority for the Board. The Independent Trustees also regularly meet in executive session. Mary C. Farrell serves as the lead Independent Trustee and as such (i) acts as a liaison between the Independent Trustees and management with respect to matters important to the Independent Trustees and (ii) with management prepares agendas for Board meetings.
Fidelity® funds are overseen by different Boards of Trustees. The fund's Board oversees asset allocation funds. Other Boards oversee Fidelity's investment-grade bond, money market, and asset allocation funds, and Fidelity's equity and high income funds. The fund may invest in Fidelity® funds overseen by such other Boards. The use of separate Boards, each with its own committee structure, allows the Trustees of each group of Fidelity® funds to focus on the unique issues of the funds they oversee, including common research, investment, and operational issues.
The Trustees primarily operate as a full Board, but also operate in committees, to facilitate the timely and efficient consideration of all matters of importance to the Trustees, the fund, and fund shareholders and to facilitate compliance with legal and regulatory requirements and oversight of the fund's activities and associated risks. The Board has charged Strategic Advisers and its affiliates with (i) identifying events or circumstances the occurrence of which could have demonstrably adverse effects on the fund's business and/or reputation; (ii) implementing processes and controls to lessen the possibility that such events or circumstances occur or to mitigate the effects of such events or circumstances if they do occur; and (iii) creating and maintaining a system designed to evaluate continuously business and market conditions in order to facilitate the identification and implementation processes described in (i) and (ii) above. Because the day-to-day operations and activities of the fund are carried out by or through Strategic Advisers, its affiliates and other service providers, the fund's exposure to risks is mitigated but not eliminated by the processes overseen by the Trustees. Board oversight of different aspects of the fund's activities is exercised primarily through the full Board, but also through the Audit and Compliance Committee. Appropriate personnel, including but not limited to the fund's Chief Compliance Officer (CCO), FMR's internal auditor, the independent accountants, the fund's Treasurer and portfolio management personnel, make periodic reports to the Board's committees, as appropriate. The responsibilities of each standing committee, including their oversight responsibilities, are described further under "Standing Committees of the Trustees."
Interested Trustees*:
Correspondence intended for a Trustee who is an interested person may be sent to Fidelity Investments, 245 Summer Street, Boston, Massachusetts 02210.
Name, Year of Birth; Principal Occupations and Other Relevant Experience+
Robert A. Lawrence (1952)
Year of Election or Appointment: 2016
Trustee
Chairman of the Board of Trustees
Mr. Lawrence also serves as Trustee of other funds. Previously, Mr. Lawrence served as a Member of the Advisory Board of certain funds. Prior to his retirement in 2008, Mr. Lawrence served as Vice President of certain Fidelity® funds (2006-2008), Senior Vice President, Head of High Income Division of Fidelity Management & Research Company (investment adviser firm, 2006-2008), and President of Fidelity Strategic Investments (investment adviser firm, 2002-2005).
Charles S. Morrison (1960)
Year of Election or Appointment: 2020
Trustee
Mr. Morrison also serves as Trustee of other funds. Previously, Mr. Morrison served as President (2017-2018) and Director (2014-2018) of Fidelity SelectCo, LLC (investment adviser firm), President of Fidelity Management & Research Company (FMR) (investment adviser firm, 2016-2018), a Director of Fidelity Investments Money Management, Inc. (investment adviser firm, 2014-2018), President, Asset Management (2014-2018), Trustee of the Fidelity Equity and High Income Funds (283 funds as of December 2018) (2014-2018), and was an employee of Fidelity Investments. Mr. Morrison also previously served as Vice President of Fidelity's Fixed Income and Asset Allocation Funds (2012-2014), President, Fixed Income (2011-2014), Vice President of Fidelity's Money Market Funds (2005-2009), President, Money Market Group Leader of FMR (2009), and Senior Vice President, Money Market Group of FMR (2004-2009). Mr. Morrison also served as Vice President of Fidelity's Bond Funds (2002-2005), certain Balanced Funds (2002-2005), and certain Asset Allocation Funds (2002-2007), and as Senior Vice President (2002-2005) of Fidelity's Bond Division.
* Determined to be an "Interested Trustee" by virtue of, among other things, his or her affiliation with the trust or various entities under common control with Strategic Advisers.
+ The information includes the Trustee's principal occupation during the last five years and other information relating to the experience, attributes, and skills relevant to the Trustee's qualifications to serve as a Trustee, which led to the conclusion that the Trustee should serve as a Trustee for the fund.
Independent Trustees:
Correspondence intended for an Independent Trustee may be sent to Fidelity Investments, P.O. Box 55235, Boston, Massachusetts 02205-5235.
Name, Year of Birth; Principal Occupations and Other Relevant Experience+
Peter C. Aldrich (1944)
Year of Election or Appointment: 2006
Trustee
Mr. Aldrich also serves as Trustee of other funds. Mr. Aldrich is a Director of the U.S. Core Property Fund (and, previously, other funds) of BlackRock Realty Group (2006-present). Previously, Mr. Aldrich served as a Managing Member of Poseidon, LLC (foreign private investment, 1998-2004), and Chairman and Managing Member of AEGIS, LLC (foreign private investment, 1997-2004). Mr. Aldrich previously was a founder, Chief Executive Officer, and Chairman of AEW Capital Management, L.P. (then “Aldrich, Eastman and Waltch, L.P.”). Mr. Aldrich also served as a Director of LivelyHood, Inc. (private corporation, 2013-2020), a Trustee for the Fidelity Rutland Square Trust (2005-2010), a Director of Zipcar, Inc. (car sharing services, 2001-2009) and as Faculty Chairman of The Research Council on Global Investment of The Conference Board (business and professional education non-profit, 1999-2004). Mr. Aldrich is a Member Emeritus of the Board of Directors of the National Bureau of Economic Research and the Board of Trustees of the Museum of Fine Arts Boston.
Mary C. Farrell (1949)
Year of Election or Appointment: 2013
Trustee
Ms. Farrell also serves as Trustee of other funds. Ms. Farrell is a Director of the W.R. Berkley Corporation (insurance provider) and President (2009-present) and Director (2006-present) of the Howard Gilman Foundation (charitable organization). Previously, Ms. Farrell was Managing Director and Chief Investment Strategist at UBS Wealth Management USA and Co-Head of UBS Wealth Management Investment Strategy & Research Group (2003-2005). Ms. Farrell also served as Investment Strategist at PaineWebber (1982-2000) and UBS PaineWebber (2000-2002). Ms. Farrell serves as Chairman of the Board of Trustees of Yale-New Haven Hospital and Vice Chairman of the Yale New Haven Health System Board and previously served as Trustee on the Board of Overseers of the New York University Stern School of Business.
Karen Kaplan (1960)
Year of Election or Appointment: 2006
Trustee
Ms. Kaplan also serves as Trustee of other funds. Ms. Kaplan is Chairman (2014-present) and Chief Executive Officer (2013-present) of Hill Holliday (advertising and specialized marketing). Ms. Kaplan is a Director of The Michaels Companies, Inc. (specialty retailer, 2015-present), Member of the Board of Governors of the Chief Executives’ Club of Boston (2010-present), Member of the Executive Committee of the Greater Boston Chamber of Commerce (2006-present), Advisory Board Member of the National Association of Corporate Directors Chapter (2012-present), Member of the Board of Trustees of the Post Office Square Trust (2012-present), Trustee of the Brigham and Women’s Hospital (2016-present), Overseer of the Boston Symphony Orchestra (2014-present), Member of the Board of Directors of The Advertising Council, Inc. (2016-present), Member of the Ron Burton Training Village Executive Board of Advisors (2018-present), Member of the Executive Committee of The Ad Council, Inc. (2019-present), and Member of the Board of Directors of The Ad Club of Boston (2020-present). Previously, Ms. Kaplan served as an Advisory Board Member of Fidelity Rutland Square Trust (2006-2010), a member of the Clinton Global Initiative (2010-2015), Director of DSM (dba Delta Dental and DentaQuest) (2004-2014), Formal Appointee of the 2015 Baker-Polito Economic Development Council, Director of Vera Bradley Inc. (designer of women’s accessories, 2012-2015), Member of the Board of Directors of the Massachusetts Conference for Women (2008-2015), Member of the Board of Directors of Jobs for Massachusetts (2012-2015), President of the Massachusetts Women’s Forum (2008-2010), Treasurer of the Massachusetts Women’s Forum (2002-2006), and Vice Chair of the Board of the Massachusetts Society for the Prevention of Cruelty to Children (2003-2010).
Christine Marcks (1955)
Year of Election or Appointment: 2020
Trustee
Ms. Marcks also serves as Trustee of other Funds. Prior to her retirement, Ms. Marcks served as Chief Executive Officer and President – Prudential Retirement (2007-2017) and Vice President for Rollover and Retirement Income Strategies (2005-2007), Prudential Financial, Inc. (financial services). Previously, Ms. Marcks served as a Member of the Advisory Board of certain Fidelity® funds (2019-2020), was Senior Vice President and Head of Financial Horizons (2002-2004) and Vice President, Strategic Marketing (2000-2002) of Voya Financial (formerly ING U.S.) (financial services), held numerous positions at Aetna Financial Services (financial services, 1987-2000) and served as an International Economist for the United States Department of the Treasury (1980-1987). Ms. Marcks also serves as a member of the Board of Trustees, Audit Committee and Benefits & Operations Committee of the YMCA Retirement Fund (2018-present), a non-profit organization providing retirement plan benefits to YMCA staff members, and as a member of the Board of Trustees of Assumption College (2019-present).
Heidi L. Steiger (1953)
Year of Election or Appointment: 2017
Trustee
Ms. Steiger also serves as Trustee of other funds. Ms. Steiger serves as Managing Partner of Topridge Associates, LLC (consulting, 2005-present) and a member of the Board of Directors (2013-present) and member of the Membership and Executive Committee (2017-present) of Business Executives for National Security (nonprofit). Previously, Ms. Steiger served as a member of the Board of Directors Chair of the Remuneration Committee of Imagine Intelligent Materials Limited (2019-2021) (technology company), a member of the Advisory Board of the joint degree program in Global Luxury Management at North Carolina State University (Raleigh, NC) and Skema (Paris) (2018-2021), a Non-Executive Director of CrowdBureau Corporation (financial technology company and index provider, 2018-2021), a member of the Global Advisory Board and Of Counsel to Signum Global Advisors (international policy and strategy, 2018-2020), Eastern Region President of The Private Client Reserve of U.S. Bancorp (banking and financial services, 2010-2015), Advisory Director of Berkshire Capital Securities, LLC (financial services, 2009-2010), President and Senior Advisor of Lowenhaupt Global Advisors, LLC (financial services, 2005-2007), and President and Contributing Editor of Worth Magazine (2004-2005) and held a variety of positions at Neuberger Berman Group, LLC (financial services, 1986-2004), including Partner and Executive Vice President and Global Head of Private Asset Management at Neuberger Berman (1999-2004). Ms. Steiger also served as a member of the Board of Directors of Nuclear Electric Insurance Ltd (insurer of nuclear utilities, 2006-2017), a member of the Board of Trustees and Audit Committee of the Eaton Vance Funds (2007-2010), a member of the Board of Directors of Aviva USA (formerly AmerUs) (insurance, 2004-2014), and a member of the Board of Trustees and Audit Committee and Chair of the Investment Committee of CIFG (financial guaranty insurance, 2009-2012), and a member of the Board of Directors of Kin Group Plc (formerly, Fitbug Holdings) (health and technology, 2016-2017).
+ The information includes the Trustee's principal occupation during the last five years and other information relating to the experience, attributes, and skills relevant to the Trustee's qualifications to serve as a Trustee, which led to the conclusion that the Trustee should serve as a Trustee for the fund.
Advisory Board Members and Officers:
Correspondence intended for a Member of the Advisory Board (if any) may be sent to Fidelity Investments, P.O. Box 55235, Boston, Massachusetts 02205-5235. Correspondence intended for an officer or Howard E. Cox, Jr. may be sent to Fidelity Investments, 245 Summer Street, Boston, Massachusetts 02210. Officers appear below in alphabetical order.
Name, Year of Birth; Principal Occupation
Ralph F. Cox (1932)
Year of Election or Appointment: 2020
Member of the Advisory Board
Mr. Cox also serves as a Member of the Advisory Board of other funds. Mr. Cox is President of RABAR Enterprises (management consulting for the petroleum industry). Mr. Cox is a Director of Abraxas Petroleum (exploration and production, 1999-present). Mr. Cox is a member of the Advisory Boards of the Business and Engineering Schools of Texas A&M University and the Engineering School of University of Texas at Austin. Previously, Mr. Cox served as Trustee of other funds (2006-2020), a Trustee for the Fidelity Rutland Square Trust (2005-2010) and as an Advisory Director of CH2M Hill Companies (engineering, 1981-2011). Mr. Ralph F. Cox and Mr. Howard E. Cox, Jr. are not related.
Howard E. Cox, Jr. (1944)
Year of Election or Appointment: 2009
Member of the Advisory Board
Mr. Cox also serves as a Member of the Advisory Board of other funds. Mr. Cox is a Partner of Greylock (venture capital, 1971-present) and a Director of Stryker Corporation (medical products and services, 1974-present). Previously, Mr. Cox served as an Advisory Board Member of Fidelity Rutland Square Trust (2006-2010). Mr. Cox also serves as a Member of the Secretary of Defense's Business Board of Directors (2008-present), a Director of Business Executives for National Security (1997-present), a Director of the Brookings Institution (2010-present), a Director of the World Economic Forum’s Young Global Leaders Foundation (2009-present), and is a Member of the Harvard Medical School Board of Fellows (2002-present). Mr. Howard E. Cox, Jr. and Mr. Ralph F. Cox are not related.
Craig S. Brown (1977)
Year of Election or Appointment: 2019
Assistant Treasurer
Mr. Brown also serves as Assistant Treasurer of other funds. Mr. Brown is an employee of Fidelity Investments (2013-present).
John J. Burke III (1964)
Year of Election or Appointment: 2018
Chief Financial Officer
Mr. Burke also serves as Chief Financial Officer of other funds. Mr. Burke serves as Head of Investment Operations for Fidelity Fund and Investment Operations (2018-present) and is an employee of Fidelity Investments (1998-present). Previously Mr. Burke served as head of Asset Management Investment Operations (2012-2018).
Jonathan Davis (1968)
Year of Election or Appointment: 2010
Assistant Treasurer
Mr. Davis also serves as Assistant Treasurer of other funds. Mr. Davis serves as Assistant Treasurer of FMR Capital, Inc. (2017-present) and is an employee of Fidelity Investments. Previously, Mr. Davis served as Vice President and Associate General Counsel of FMR LLC (diversified financial services company, 2003-2010).
Laura M. Del Prato (1964)
Year of Election or Appointment: 2018
Assistant Treasurer
Ms. Del Prato also serves as an officer of other funds. Ms. Del Prato is an employee of Fidelity Investments (2017-present). Previously, Ms. Del Prato served as President and Treasurer of The North Carolina Capital Management Trust: Cash Portfolio and Term Portfolio (2018-2020). Prior to joining Fidelity Investments, Ms. Del Prato served as a Managing Director and Treasurer of the JPMorgan Mutual Funds (2014-2017). Prior to JPMorgan, Ms. Del Prato served as a partner at Cohen Fund Audit Services (accounting firm, 2012-2013) and KPMG LLP (accounting firm, 2004-2012).
James D. Gryglewicz (1972)
Year of Election or Appointment: 2015
Chief Compliance Officer
Mr. Gryglewicz also serves as Chief Compliance Officer of other funds. Mr. Gryglewicz serves as Compliance Officer of Strategic Advisers LLC (investment adviser firm, 2015-present), Senior Vice President of Asset Management Compliance (2009-present), and is an employee of Fidelity Investments (2004-present). Previously, Mr. Gryglewicz served as Compliance Officer of Fidelity SelectCo, LLC (investment adviser firm, 2014-2019), and as Chief Compliance Officer of certain Fidelity® funds (2014-2018).
Colm A. Hogan (1973)
Year of Election or Appointment: 2016
Assistant Treasurer
Mr. Hogan also serves as an officer of other funds. Mr. Hogan serves as Assistant Treasurer of FMR Capital, Inc. (2017-present) and is an employee of Fidelity Investments (2005-present). Previously, Mr. Hogan served as Deputy Treasurer of certain Fidelity® funds (2016-2020) and Assistant Treasurer of certain Fidelity® funds (2016-2018).
Christina H. Lee (1975)
Year of Election or Appointment: 2020
Secretary and Chief Legal Officer
Ms. Lee also serves as Secretary and CLO of other funds. Ms. Lee serves as Vice President, Associate General Counsel (2014-present) and is an employee of Fidelity Investments (2007-present). Previously, Ms. Lee served as Assistant Secretary of certain funds (2018-2019).
Cynthia Lo Bessette (1969)
Year of Election or Appointment: 2020
Assistant Secretary
Ms. Lo Bessette also serves as an officer of other funds. Ms. Lo Bessette serves as CLO, Secretary, and Senior Vice President of Fidelity Management & Research Company LLC (investment adviser firm, 2019-present); and CLO of Fidelity Management & Research (Hong Kong) Limited, FMR Investment Management (UK) Limited, and Fidelity Management & Research (Japan) Limited (investment adviser firms, 2019-present). She is a Senior Vice President and Deputy General Counsel of FMR LLC (diversified financial services company, 2019-present), and is an employee of Fidelity Investments. Previously, Ms. Lo Bessette served as CLO, Secretary, and Senior Vice President of FMR Co., Inc. (investment adviser firm, 2019); Secretary of Fidelity SelectCo, LLC and Fidelity Investments Money Management, Inc. (investment adviser firms, 2019). Prior to joining Fidelity Investments, Ms. Lo Bessette was Executive Vice President, General Counsel (2016-2019) and Senior Vice President, Deputy General Counsel (2015-2016) of OppenheimerFunds (investment management company) and Deputy Chief Legal Officer (2013-2015) of Jennison Associates LLC (investment adviser firm).
Chris Maher (1972)
Year of Election or Appointment: 2016
Assistant Treasurer
Mr. Maher also serves as an officer of other funds. Mr. Maher serves as Assistant Treasurer of FMR Capital, Inc. (2017-present), and is an employee of Fidelity Investments (2008-present). Previously, Mr. Maher served as Assistant Treasurer of certain funds (2013-2020); Vice President of Asset Management Compliance (2013), Vice President of the Program Management Group of FMR (investment adviser firm, 2010-2013), and Vice President of Valuation Oversight (2008-2010).
Brett Segaloff (1972)
Year of Election or Appointment: 2021
Anti-Money Laundering (AML) Officer
Mr. Segaloff also serves as an AML Officer of other funds and other related entities. He is Director, Anti-Money Laundering (2007-present) of FMR LLC (diversified financial services company) and is an employee of Fidelity Investments (1996-present).
Stacie M. Smith (1974)
Year of Election or Appointment: 2020
President and Treasurer
Ms. Smith also serves as an officer of other funds. Ms. Smith serves as Assistant Treasurer of FMR Capital, Inc. (2017-present), is an employee of Fidelity Investments (2009-present), and has served in other fund officer roles. Prior to joining Fidelity Investments, Ms. Smith served as Senior Audit Manager of Ernst & Young LLP (accounting firm, 1996-2009). Previously, Ms. Smith served as Assistant Treasurer (2013-2019) and Deputy Treasurer (2013-2016) of certain Fidelity® funds.
Marc L. Spector (1972)
Year of Election or Appointment: 2016
Assistant Treasurer
Mr. Spector also serves as an officer of other funds. Mr. Spector serves as Assistant Treasurer of FMR Capital, Inc. (2017-present) and is an employee of Fidelity Investments (2016-present). Prior to joining Fidelity Investments, Mr. Spector served as Director at the Siegfried Group (accounting firm, 2013-2016), and prior to Siegfried Group as audit senior manager at Deloitte & Touche LLP (accounting firm, 2005-2013).
Jim Wegmann (1979)
Year of Election or Appointment: 2019
Assistant Treasurer
Mr. Wegmann also serves as Assistant Treasurer of other funds. Mr. Wegmann is an employee of Fidelity Investments (2011-present).
Shareholder Expense Example
As a shareholder, you incur two types of costs: (1) transaction costs, which may include sales charges (loads) on purchase payments or redemption proceeds, as applicable and (2) ongoing costs, which generally include management fees, distribution and/or service (12b-1) fees and other Fund expenses. This Example is intended to help you understand your ongoing costs (in dollars) of investing in a fund and to compare these costs with the ongoing costs of investing in other mutual funds.
The Example is based on an investment of $1,000 invested at the beginning of the period and held for the entire period (December 1, 2020 to May 31, 2021).
Actual Expenses
The first line of the accompanying table provides information about actual account values and actual expenses. You may use the information in this line, together with the amount you invested, to estimate the expenses that you paid over the period. Simply divide your account value by $1,000.00 (for example, an $8,600 account value divided by $1,000.00 = 8.6), then multiply the result by the number in the first line for a class/Fund under the heading entitled "Expenses Paid During Period" to estimate the expenses you paid on your account during this period. If any fund is a shareholder of any underlying mutual funds or exchange-traded funds (ETFs) (the Underlying Funds), such fund indirectly bears its proportional share of the expenses of the Underlying Funds in addition to the direct expenses incurred presented in the table. These fees and expenses are not included in the annualized expense ratio used to calculate the expense estimate in the table below.
Hypothetical Example for Comparison Purposes
The second line of the accompanying table provides information about hypothetical account values and hypothetical expenses based on the actual expense ratio and an assumed rate of return of 5% per year before expenses, which is not the actual return. The hypothetical account values and expenses may not be used to estimate the actual ending account balance or expenses you paid for the period. You may use this information to compare the ongoing costs of investing in the Fund and other funds. To do so, compare this 5% hypothetical example with the 5% hypothetical examples that appear in the shareholder reports of the other funds. If any fund is a shareholder of any Underlying Funds, such fund indirectly bears its proportional share of the expenses of the Underlying Funds in addition to the direct expenses as presented in the table. These fees and expenses are not included in the annualized expense ratio used to calculate the expense estimate in the table below.
Please note that the expenses shown in the table are meant to highlight your ongoing costs only and do not reflect any transaction costs. Therefore, the second line of the table is useful in comparing ongoing costs only, and will not help you determine the relative total costs of owning different funds.
| Annualized Expense Ratio-A | Beginning Account Value December 1, 2020 | Ending Account Value May 31, 2021 | Expenses Paid During Period-B December 1, 2020 to May 31, 2021 |
|
| Strategic Advisers Tax-Sensitive Short Duration Fund | .07% | |||
| Actual | $1,000.00 | $1,002.70 | $.35 | |
| Hypothetical-C | $1,000.00 | $1,024.58 | $.35 |
A Annualized expense ratio reflects expenses net of applicable fee waivers.
B Expenses are equal to the annualized expense ratio, multiplied by the average account value over the period, multiplied by 182/ 365 (to reflect the one-half year period). The fees and expenses of any Underlying Funds are not included in each annualized expense ratio.
C 5% return per year before expenses
Distributions (Unaudited)
The fund hereby designates as a capital gain dividend with respect to the taxable year ended May 31, 2021, $218,985, or, if subsequently determined to be different, the net capital gain of such year.
A total of 69.63% of the dividends distributed during the fiscal year was derived from interest on U.S. Government securities which is generally exempt from state income tax.
During fiscal year ended 2021, 99.74% of the fund's income dividends was free from federal income tax, and 22.96% of the fund's income dividends was subject to the federal alternative minimum tax.
The fund will notify shareholders in January 2022 of amounts for use in preparing 2021 income tax returns.
Board Approval of Amended Sub-Advisory Agreements
Strategic Advisers Tax-Sensitive Short Duration Fund
In December 2020, the Board of Trustees, including the Independent Trustees (together, the Board) voted to approve an amendment to the fee schedules for certain investment mandates in the existing sub-advisory agreement among Strategic Advisers LLC (Strategic Advisers), FIAM LLC (FIAM), and Fidelity Rutland Square Trust II (Trust) on behalf of the fund (Amended Sub-Advisory Agreement). The Board noted that the updated fee schedules in the Amended Sub-Advisory Agreement will result in the same or lower fees at all asset levels. The Board also noted that no other material contract terms are impacted by the Amended Sub-Advisory Agreement. The Board, assisted by the advice of fund counsel and Independent Trustees' counsel, considered a broad range of information.In considering whether to approve the Amended Sub-Advisory Agreement, the Board reached a determination, with the assistance of fund counsel and Independent Trustees' counsel and through the exercise of its business judgment, that the approval of the Amended Sub-Advisory Agreement is in the best interests of the fund and its shareholders and that the approval of such agreement does not involve a conflict of interest from which Strategic Advisers or its affiliates derive an inappropriate advantage. Also, the Board found that the fees to be charged under the Amended Sub-Advisory Agreement bear a reasonable relationship to the services to be rendered and will be based on services provided that will be in addition to, rather than duplicative of services provided under the advisory contract of any underlying fund in which the fund may invest. The Board's decision to approve the Amended Sub-Advisory Agreement was not based on any single factor, but rather was based on a comprehensive consideration of all the information provided to the Board. In addition, individual Trustees did not necessarily attribute the same weight or importance to each factor. Nature, Extent, and Quality of Services Provided. The Board considered the backgrounds of the investment personnel that will provide services to the fund, and also considered the fund's investment objective, strategies and related investment philosophy and current sub-adviser line-up, as well as the structures of the investment personnel compensation programs and whether such structures provide appropriate incentives to act in the best interests of the fund, at its September 2020 meeting. The Board considered the detailed information provided by Strategic Advisers and FIAM in the June 2020 annual contract renewal materials.The Board noted that it had approved the existing sub-advisory agreement with FIAM at its September 2020 meeting and that the Amended Sub-Advisory Agreement will not result in any changes to: (i) the nature, extent and quality of the sub-advisory services provided; (ii) the investment process or strategies employed in the management of the fund's assets; or (iii) the day-to-day management of the fund or the persons primarily responsible for such management. Investment Performance. The Board did not consider performance to be a material factor in its decision to approve the Amended Sub-Advisory Agreement because the approval of the Amended Sub-Advisory Agreement will not result in any changes (i) to the fund's investment processes or strategies; or (ii) in the persons primarily responsible for the day-to-day management of the fund.Based on its review, the Board concluded that the nature, extent, and quality of services that will be provided to the fund under the Amended Sub-Advisory Agreement will continue to benefit the fund's shareholders.Competitiveness of Management Fee and Total Fund Expenses.
The Board noted that the Amended Sub-Advisory Agreement will not result in changes to the maximum aggregate annual management fee payable by the fund or Strategic Advisers' portion of the management fee. The Board considered Strategic Advisers' contractual agreement to waive its portion of the fund's management fee. The Board considered that the Amended Sub-Advisory Agreement is expected to result in a decrease in the total management fee rate of the fund. Based on its review, the Board concluded that the fund's management fee structure and any changes to projected total expenses bear a reasonable relationship to the services that the fund and its shareholders will receive and the other factors considered.Because the Amended Sub-Advisory Agreement was negotiated at arm's length and will have no impact on the maximum management fees payable by the fund, the Board did not consider the costs of services and profitability of the relationship with the fund to Strategic Advisers to be significant factors in its decision to approve the Amended Sub-Advisory Agreement. Potential Fall-Out Benefits. The Board considered that it reviews information regarding the potential of direct and indirect benefits to Strategic Advisers and its affiliates from their relationships with the fund, including non-advisory fee compensation paid to affiliates of Strategic Advisers, if any, as well as information regarding potential fall-out benefits accruing to each sub-adviser, if any, as a result of its relationship with the fund, during its annual renewal of the fund's management contract, sub-advisory agreements, and sub-subadvisory agreements. The Board considered Strategic Advisers' representation that it does not anticipate that the approval of the Amended Sub-Advisory Agreement will have a significant impact on the profitability of, or potential fall-out benefits to, Strategic Advisers or its affiliates. Possible Economies of Scale. The Board considered that it reviews whether there have been economies of scale in connection with the management of the fund during its annual renewal of the fund's management contract, sub-advisory agreements, and sub-subadvisory agreements. The Board noted that the Amended Sub-Advisory Agreement will provide for breakpoints that have the potential to reduce sub-advisory fees paid to the sub-adviser as assets allocated to the sub-adviser grow. The Board also noted that it did not consider the possible realization of economies of scale to be a significant factor in its decision to approve the Amended Sub-Advisory Agreement because the fund will not bear any additional management fees or expenses under the Amended Sub-Advisory Agreement. Conclusion. Based on its evaluation of all of the conclusions noted above, and after considering all factors it believed relevant, the Board concluded that the Amended Sub-Advisory Agreement's fee structure bears a reasonable relationship to the services to be rendered and that the Amended Sub-Advisory Agreement is in the best interests of the fund and its shareholders and should be approved. The Board also concluded that the sub-advisory fees to be charged under the Amended Sub-Advisory Agreement will be based on services provided that will be in addition to, rather than duplicative of, services provided under the advisory contract of any underlying fund in which the fund may invest. In addition, the Board concluded that the approval of the Amended Sub-Advisory Agreement does not involve a conflict of interest from which Strategic Advisers or its affiliates derive an inappropriate advantage.Liquidity Risk Management Program
The Securities and Exchange Commission adopted Rule 22e-4 under the Investment Company Act of 1940 (the Liquidity Rule) to promote effective liquidity risk management throughout the open-end investment company industry, thereby reducing the risk that funds will be unable to meet their redemption obligations and mitigating dilution of the interests of fund shareholders.
The Fund has adopted and implemented a liquidity risk management program (the Program) reasonably designed to assess and manage the Fund’s liquidity risk and to comply with the requirements of the Liquidity Rule. The Fund’s Board of Trustees (the Board) has designated the Fund’s investment adviser as administrator of the Program. Strategic Advisers has established a Liquidity Risk Management Committee (the LRM Committee) to manage the Program for each of the Funds. The LRM Committee monitors the adequacy and effectiveness of implementation of the Program and on a periodic basis assesses each Fund’s liquidity risk based on a variety of factors including (1) the Fund’s investment strategy, (2) portfolio liquidity and cash flow projections during normal and reasonably foreseeable stressed conditions, (3) shareholder redemptions and (4) borrowings and other funding sources, as applicable.
In accordance with the Program, each of the Fund’s portfolio investments is classified into one of four liquidity categories described below based on a determination of a reasonable expectation for how long it would take to convert the investment to cash (or sell or dispose of the investment) without significantly changing its market value.
- Highly liquid investments – cash or convertible to cash within three business days or less
- Moderately liquid investments – convertible to cash in three to seven calendar days
- Less liquid investments – can be sold or disposed of, but not settled, within seven calendar days
- Illiquid investments – cannot be sold or disposed of within seven calendar days
Liquidity classification determinations take into account a variety of factors including various market, trading and investment-specific considerations, as well as market depth, and generally utilize analysis from a third-party liquidity metrics service.
The Liquidity Rule places a 15% limit on a fund’s illiquid investments and requires funds that do not primarily hold assets that are highly liquid investments to determine and maintain a minimum percentage of the fund’s net assets to be invested in highly liquid investments (highly liquid investment minimum or HLIM). The Program includes provisions reasonably designed to comply with the 15% limit on illiquid investments and for determining, periodically reviewing and complying with the HLIM requirement as applicable.
At a recent meeting of the Fund’s Board of Trustees, the LRM Committee provided a written report to the Board pertaining to the operation, adequacy, and effectiveness of implementation of the Program for the annual period from December 1, 2019 through November 30, 2020. The report concluded that the Program has been implemented and is operating effectively and is reasonably designed to assess and manage the Fund’s liquidity risk.
Proxy Voting Results
A special meeting of shareholders was held on November 2, 2020. The results of votes taken among shareholders on the proposals before them are reported below. Each vote reported represents one dollar of net asset value held on the record date for the meeting.
PROPOSAL 1
To elect a Board of Trustees.
| # of Votes | % of Votes |
|
| ROBERT A. LAWRENCE | ||
| Affirmative | 204,250,982,594.51 | 96.530 |
| Withheld | 7,343,512,146.85 | 3.470 |
| TOTAL | 211,594,494,741.36 | 100.000 |
| CHARLES S. MORRISON | ||
| Affirmative | 204,349,460,488.43 | 96.576 |
| Withheld | 7,245,034,252.93 | 3.424 |
| TOTAL | 211,594,494,741.36 | 100.000 |
| PETER C. ALDRICH | ||
| Affirmative | 203,499,803,652.67 | 96.175 |
| Withheld | 8,094,691,088.69 | 3.825 |
| TOTAL | 211,594,494,741.36 | 100.000 |
| MARY C. FARRELL | ||
| Affirmative | 204,011,925,737.22 | 96.417 |
| Withheld | 7,582,569,004.14 | 3.583 |
| TOTAL | 211,594,494,741.36 | 100.00 |
| KAREN KAPLAN | ||
| Affirmative | 204,297,547,550.53 | 96.552 |
| Withheld | 7,296,947,190.83 | 3.448 |
| TOTAL | 211,594,494,741.36 | 100.000 |
| CHRISTINE MARCKS | ||
| Affirmative | 204,700,871,317.72 | 96.743 |
| Withheld | 6,893,623,423.64 | 3.257 |
| TOTAL | 211,594,494,741.36 | 100.000 |
| HEIDI L. STEIGER | ||
| Affirmative | 204,406,589,957.28 | 96.603 |
| Withheld | 7,187,904,784.08 | 3.397 |
| TOTAL | 211,594,494,741.36 | 100.000 |
PROPOSAL 2
To approve the conversion of a fundamental investment policy to a non-fundamental investment policy.
| # of Votes | % of Votes |
|
| Affirmative | 2,144,720,745.71 | 79.830 |
| Against | 185,985,124.90 | 6.923 |
| Abstain | 355,906,306.35 | 13.247 |
| Broker Non-Vote | 0.00 | 0.000 |
| TOTAL | 2,686,612,176.96 | 100.000 |
| Proposal 1 reflects trust wide proposal and voting results. |
![]()
TSS-ANN-0721
1.9885904.103
Strategic Advisers® Fidelity® U.S. Total Stock Fund
Offered exclusively to certain managed account clients of Strategic Advisers LLC or its affiliates - not available for sale to the general public
May 31, 2021
Contents
To view a fund's proxy voting record for the 12-month period ended June 30, visit http://www.fidelity.com/proxyvotingresults or visit the Securities and Exchange Commission's (SEC) web site at http://www.sec.gov.
You may also call 1-800-544-3455 to request a free copy of the proxy voting guidelines.
Standard & Poor's, S&P and S&P 500 are registered service marks of The McGraw-Hill Companies, Inc. and have been licensed for use by Fidelity Distributors Corporation.
Other third-party marks appearing herein are the property of their respective owners.
All other marks appearing herein are registered or unregistered trademarks or service marks of FMR LLC or an affiliated company. © 2021 FMR LLC. All rights reserved.
This report and the financial statements contained herein are submitted for the general information of the shareholders of the Fund. This report is not authorized for distribution to prospective investors in the Fund unless preceded or accompanied by an effective prospectus.
A fund files its complete schedule of portfolio holdings with the SEC for the first and third quarters of each fiscal year on Form N-PORT. Forms N-PORT are available on the SEC’s web site at http://www.sec.gov. A fund's Forms N-PORT may be reviewed and copied at the SEC’s Public Reference Room in Washington, DC. Information regarding the operation of the SEC's Public Reference Room may be obtained by calling 1-800-SEC-0330.
For a complete list of a fund's portfolio holdings, view the most recent holdings listing, semiannual report, or annual report on Fidelity's web site at http://www.fidelity.com, http://www.institutional.fidelity.com, or http://www.401k.com, as applicable.
NOT FDIC INSURED •MAY LOSE VALUE •NO BANK GUARANTEE
Neither the Fund nor Fidelity Distributors Corporation is a bank.
Note to Shareholders:
Early in 2020, the outbreak and spread of a new coronavirus emerged as a public health emergency that had a major influence on financial markets, primarily based on its impact on the global economy and the outlook for corporate earnings. The virus causes a respiratory disease known as COVID-19. On March 11, 2020 the World Health Organization declared the COVID-19 outbreak a pandemic, citing sustained risk of further global spread.
In the weeks following, as the crisis worsened, we witnessed an escalating human tragedy with wide-scale social and economic consequences from coronavirus-containment measures. The outbreak of COVID-19 prompted a number of measures to limit the spread, including travel and border restrictions, quarantines, and restrictions on large gatherings. In turn, these resulted in lower consumer activity, diminished demand for a wide range of products and services, disruption in manufacturing and supply chains, and – given the wide variability in outcomes regarding the outbreak – significant market uncertainty and volatility. Amid the turmoil, global governments and central banks took unprecedented action to help support consumers, businesses, and the broader economies, and to limit disruption to financial systems.
The situation continues to unfold, and the extent and duration of its impact on financial markets and the economy remain highly uncertain. Extreme events such as the coronavirus crisis are “exogenous shocks” that can have significant adverse effects on mutual funds and their investments. Although multiple asset classes may be affected by market disruption, the duration and impact may not be the same for all types of assets.
Fidelity is committed to helping you stay informed amid news about COVID-19 and during increased market volatility, and we’re taking extra steps to be responsive to customer needs. We encourage you to visit our websites, where we offer ongoing updates, commentary, and analysis on the markets and our funds.
Performance: The Bottom Line
Average annual total return reflects the change in the value of an investment, assuming reinvestment of distributions from dividend income and capital gains (the profits earned upon the sale of securities that have grown in value, if any) and assuming a constant rate of performance each year. The hypothetical investment and the average annual total returns do not reflect the deduction of taxes that a shareholder would pay on fund distributions or the redemption of fund shares. During periods of reimbursement by Fidelity, a fund’s total return will be greater than it would be had the reimbursement not occurred. How a fund did yesterday is no guarantee of how it will do tomorrow.
Average Annual Total Returns
| For the periods ended May 31, 2021 | Past 1 year | Life of fundA |
| Strategic Advisers® Fidelity® U.S. Total Stock Fund | 46.63% | 16.56% |
A From March 20, 2018
$10,000 Over Life of Fund
Let's say hypothetically that $10,000 was invested in Strategic Advisers® Fidelity® U.S. Total Stock Fund on March 20, 2018, when the fund started.
The chart shows how the value of your investment would have changed, and also shows how the Dow Jones U.S. Total Stock Market Index℠ performed over the same period.
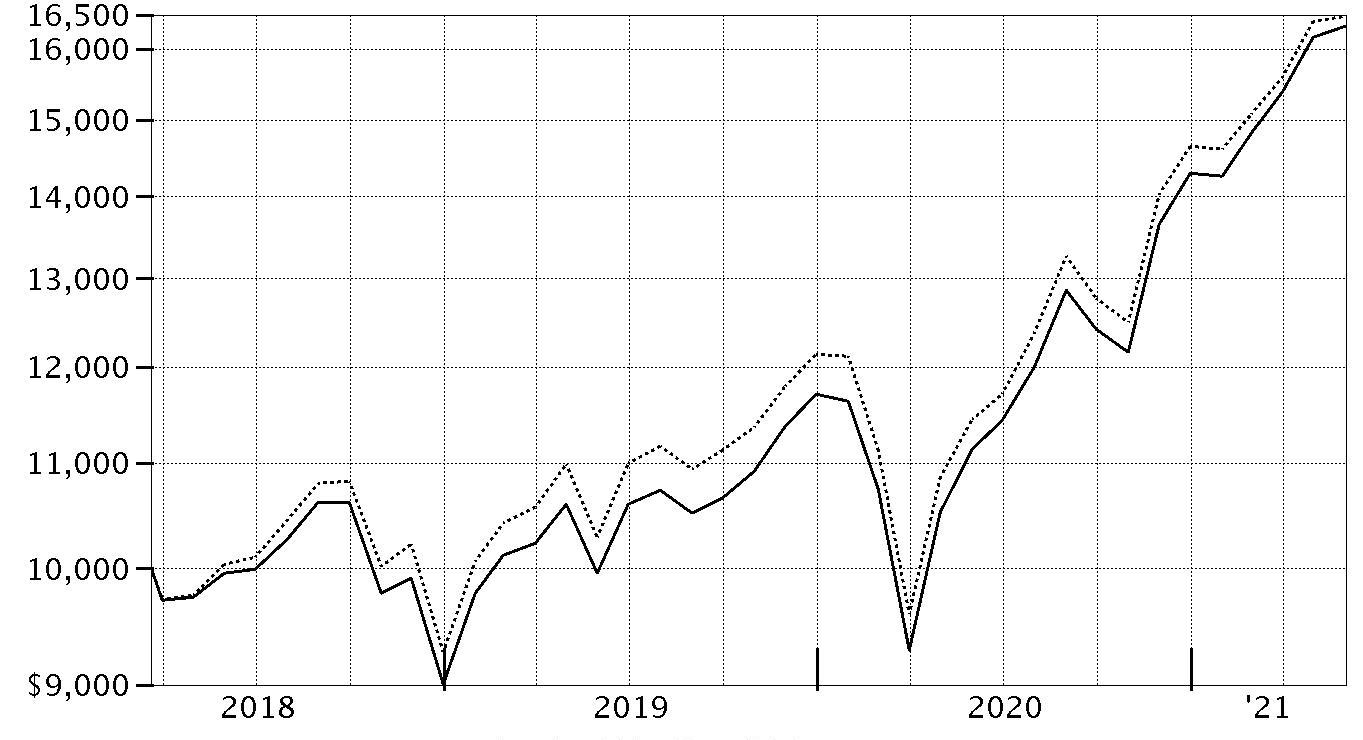
| Period Ending Values | ||
|
| $16,328 | Strategic Advisers® Fidelity® U.S. Total Stock Fund |
|
| $16,478 | Dow Jones U.S. Total Stock Market Index℠ |
Management's Discussion of Fund Performance
Market Recap: The S&P 500® index gained 40.32% for the 12 months ending May 31, 2021, as U.S. equities staged a historic rebound following a steep but brief decline due to the early-2020 outbreak and spread of COVID-19. A confluence of powerful forces propelled risk assets, returning the stock market to pre-pandemic highs by late August. The rally slowed in September, when stocks began a two-month retreat amid Congress’s inability to reach a deal on additional fiscal stimulus, as well as uncertainty about the election. But as the calendar turned, investors grew hopeful. The rollout of two COVID-19 vaccines was underway, the U.S. Federal Reserve pledged to hold interest rates near zero until the economy recovered, and the federal government planned to deploy trillions of dollars to boost consumers and the economy. A flattish May reflected concerns about inflation and jobs. This backdrop fueled a sharp rotation, with small-cap value usurping leadership from large growth. As part of the “reopening” trade, investors moved out of tech-driven mega-caps that had thrived due to the work-from-home trend in favor of cheap smaller companies that stood to benefit from a broad cyclical recovery. Reflecting this shift, financials (+66%) led for the full period, riding momentum among banks (+80%), whose profit outlook improved amid rising long-term interest rates and a steeper yield curve. Materials (+60%) and industrials (+58%) closely followed. Conversely, “laggards” included the utilities (+13%), health care (+22%) and consumer staples (+23%) sectors. Comments from Portfolio Manager Barry Golden: For the fiscal year May 31, 2021, the Fund advanced 46.63%, outpacing the 43.97% gain of the benchmark Dow Jones U.S. Total Stock Market Index. During the fourth quarter of 2020, U.S. market leadership rotated from higher-quality growth stocks and growth-driven investment strategies to value stocks. Small- and mid-cap stocks outperformed their large cap counterparts, with small-cap value equities generating the best performance for the period as a whole. Within the Fund, Fidelity® Growth Company Fund (+57%), which follows an aggressive-growth approach, was the top contributor versus the benchmark, although most of its outperformance occurred during the first half of the period. Stock picks in the information technology and consumer discretionary sectors fueled its strong result. Three strategies from sub-adviser FIAM® contributed roughly equally this period: U.S. Equity (+53%), Intrinsic Opportunities (+65%) and Sector Managed (+49%). Combining a value orientation with exposure to economically sensitive stocks drove the performance of FIAM U.S. Equity. A cyclical, value-oriented approach also helped FIAM Intrinsic Opportunities outperform, as did its smaller-cap bias and exposure to non-U.S. stocks. FIAM Sector Managed features sector-focused managers managing individual subportfolios that correspond to each of the major economic sectors within the S&P 500. Strong investment choices across several sectors, including industrials and technology, drove its contribution. On the downside, Fidelity® SAI U.S. Quality Index Fund (+31%) was the biggest relative detractor. This fund tracks a custom index comprised of companies with stable earnings that are typically less volatile than the broader market. It struggled amid the shift away from defensive areas of the market to more economically sensitive sectors. Fidelity Magellan Fund (+31%) also dampened relative performance, as its emphasis on growth, quality and momentum factors was out of favor during the period's second half. Looking ahead, I plan to maintain my emphasis on managers with substantial exposure to value-oriented and economically sensitive stocks. I have reduced the Fund’s small-cap exposure, and will continue to underweight defensive, low-volatility approaches.The views expressed above reflect those of the portfolio manager(s) only through the end of the period as stated on the cover of this report and do not necessarily represent the views of Fidelity or any other person in the Fidelity organization. Any such views are subject to change at any time based upon market or other conditions and Fidelity disclaims any responsibility to update such views. These views may not be relied on as investment advice and, because investment decisions for a Fidelity fund are based on numerous factors, may not be relied on as an indication of trading intent on behalf of any Fidelity fund.
Investment Summary (Unaudited)
The information in the following tables is based on the direct investments of the Fund.Top Ten Holdings as of May 31, 2021
| (excluding cash equivalents) | % of fund's net assets |
| Fidelity SAI U.S. Quality Index Fund | 10.8 |
| Fidelity Growth Company Fund | 9.5 |
| Fidelity Contrafund | 5.6 |
| Fidelity Large Cap Value Enhanced Index Fund | 5.2 |
| Fidelity Magellan Fund | 4.6 |
| Fidelity SAI U.S. Value Index Fund | 4.0 |
| Fidelity SAI U.S. Low Volatility Index Fund | 3.5 |
| Fidelity Small Cap Index Fund | 3.3 |
| Fidelity SAI U.S. Momentum Index Fund | 2.6 |
| Fidelity SAI U.S. Large Cap Index Fund | 2.1 |
| 51.2 |
Asset Allocation (% of fund's net assets)
| As of May 31, 2021 | ||
| Common Stocks | 46.1% | |
| Preferred Stocks | 0.2% | |
| Large Blend Funds | 5.6% | |
| Large Growth Funds | 33.1% | |
| Large Value Funds | 9.2% | |
| Small Blend Funds | 4.1% | |
| Small Growth Funds | 0.9% | |
| Short-Term Investments and Net Other Assets (Liabilities) | 0.8% | |

Asset allocations of funds in the pie chart reflect the categorizations of assets as defined by Morningstar as of the reporting date.
Schedule of Investments May 31, 2021
Showing Percentage of Net Assets
| Common Stocks - 46.1% | |||
| Shares | Value | ||
| COMMUNICATION SERVICES - 4.0% | |||
| Diversified Telecommunication Services - 0.3% | |||
| AT&T, Inc. | 1,220,900 | $35,931,087 | |
| Liberty Global PLC Class C (a) | 401,100 | 10,917,942 | |
| Verizon Communications, Inc. | 2,158,609 | 121,939,822 | |
| 168,788,851 | |||
| Entertainment - 0.7% | |||
| Activision Blizzard, Inc. | 555,644 | 54,036,379 | |
| Cinemark Holdings, Inc. (a) | 329,900 | 7,475,534 | |
| IMAX Corp. (a) | 788,600 | 17,041,646 | |
| Lions Gate Entertainment Corp. Class B (a) | 1,243,900 | 21,618,982 | |
| Netflix, Inc. (a) | 89,400 | 44,951,214 | |
| Nihon Falcom Corp. | 5,000 | 68,499 | |
| Nintendo Co. Ltd. ADR | 310,183 | 23,983,350 | |
| Take-Two Interactive Software, Inc. (a) | 157,398 | 29,206,773 | |
| The Walt Disney Co. (a) | 831,095 | 148,475,122 | |
| Vivendi SA | 1,264,883 | 45,969,772 | |
| 392,827,271 | |||
| Interactive Media & Services - 1.5% | |||
| Alphabet, Inc.: | |||
| Class A (a) | 196,663 | 463,505,192 | |
| Class C (a) | 49,036 | 118,253,256 | |
| Dip Corp. | 320,000 | 9,454,745 | |
| Facebook, Inc. Class A (a) | 919,300 | 302,201,489 | |
| Match Group, Inc. (a) | 122,076 | 17,503,257 | |
| Snap, Inc. Class A (a) | 88,400 | 5,491,408 | |
| Tongdao Liepin Group (a) | 1,265,703 | 3,783,354 | |
| ZIGExN Co. Ltd. | 1,500,000 | 5,466,253 | |
| Zoominfo Technologies, Inc. | 71,800 | 3,146,994 | |
| 928,805,948 | |||
| Media - 1.4% | |||
| AMC Networks, Inc. Class A (a) | 20,000 | 1,073,600 | |
| Cogeco Communications, Inc. | 20,000 | 1,922,452 | |
| Comcast Corp. Class A | 9,346,633 | 535,935,936 | |
| Corus Entertainment, Inc. Class B (non-vtg.) | 95,400 | 493,993 | |
| Discovery Communications, Inc.: | |||
| Class A (a)(b) | 200,000 | 6,422,000 | |
| Class C (non-vtg.) (a) | 750,000 | 22,537,500 | |
| eBook Initiative Japan Co. Ltd. (a) | 5,000 | 118,732 | |
| F@N Communications, Inc. | 26,900 | 94,343 | |
| Fox Corp. Class A | 474,333 | 17,716,338 | |
| Hyundai HCN | 486,513 | 2,019,036 | |
| iHeartMedia, Inc. (a) | 531,700 | 12,340,757 | |
| Intage Holdings, Inc. | 5,000 | 70,737 | |
| Interpublic Group of Companies, Inc. | 4,350,014 | 146,551,972 | |
| Liberty Broadband Corp. Class C (a) | 166,400 | 27,670,656 | |
| News Corp. Class A | 1,009,500 | 27,246,405 | |
| Nippon Television Network Corp. | 70,700 | 843,957 | |
| Pico Far East Holdings Ltd. | 1,000,000 | 179,090 | |
| Sinclair Broadcast Group, Inc. Class A | 25,000 | 842,250 | |
| TechTarget, Inc. (a) | 226,300 | 15,911,153 | |
| Trenders, Inc. | 150,000 | 894,602 | |
| ViacomCBS, Inc. Class B | 350,000 | 14,847,000 | |
| WOWOW INC. | 100,000 | 2,123,482 | |
| WPP PLC | 2,582,900 | 35,718,098 | |
| 873,574,089 | |||
| Wireless Telecommunication Services - 0.1% | |||
| Okinawa Cellular Telephone Co. | 33,400 | 1,525,253 | |
| T-Mobile U.S., Inc. | 348,275 | 49,263,499 | |
| 50,788,752 | |||
| TOTAL COMMUNICATION SERVICES | 2,414,784,911 | ||
| CONSUMER DISCRETIONARY - 4.7% | |||
| Auto Components - 0.5% | |||
| Adient PLC (a) | 260,000 | 13,015,600 | |
| Aptiv PLC (a) | 297,700 | 44,780,034 | |
| BorgWarner, Inc. | 1,666,405 | 85,469,912 | |
| Cooper-Standard Holding, Inc. (a) | 35,000 | 1,041,600 | |
| DaikyoNishikawa Corp. | 529,000 | 3,667,102 | |
| DTR Automotive Corp. | 15,029 | 519,303 | |
| Eagle Industry Co. Ltd. | 71,400 | 731,020 | |
| G-Tekt Corp. | 650,000 | 8,904,923 | |
| Gentex Corp. | 64,000 | 2,272,000 | |
| Hi-Lex Corp. | 200,300 | 3,195,946 | |
| Hyundai Mobis | 70,000 | 17,682,668 | |
| IJTT Co. Ltd. | 450,000 | 3,078,363 | |
| Lear Corp. | 540,700 | 104,549,752 | |
| Linamar Corp. | 260,000 | 17,254,350 | |
| Murakami Corp. | 70,000 | 1,991,506 | |
| Plastic Omnium SA | 60,000 | 2,057,323 | |
| Strattec Security Corp. (a) | 16,610 | 833,822 | |
| Topre Corp. | 300,000 | 4,499,041 | |
| TPR Co. Ltd. | 500,000 | 6,649,009 | |
| 322,193,274 | |||
| Automobiles - 0.3% | |||
| Daimler AG (Germany) | 494,800 | 46,087,891 | |
| General Motors Co. (a) | 815,417 | 48,362,382 | |
| Renault SA | 60,000 | 2,482,508 | |
| Tesla, Inc. (a) | 110,500 | 69,086,810 | |
| 166,019,591 | |||
| Distributors - 0.0% | |||
| Arata Corp. | 25,000 | 965,842 | |
| Harima-Kyowa Co. Ltd. | 39,600 | 646,678 | |
| LKQ Corp. (a) | 12,600 | 642,096 | |
| Uni-Select, Inc. (a) | 50,000 | 634,217 | |
| Yagi & Co. Ltd. | 60,045 | 786,963 | |
| 3,675,796 | |||
| Diversified Consumer Services - 0.1% | |||
| Heian Ceremony Service Co. Ltd. | 175,000 | 1,396,931 | |
| MegaStudy Co. Ltd. | 79,794 | 1,069,026 | |
| Multicampus Co. Ltd. | 33,128 | 1,161,122 | |
| Service Corp. International | 752,042 | 39,873,267 | |
| Terminix Global Holdings, Inc. (a) | 683,800 | 33,738,692 | |
| 77,239,038 | |||
| Hotels, Restaurants & Leisure - 0.7% | |||
| Caesars Entertainment, Inc. (a) | 315,861 | 33,939,264 | |
| Churchill Downs, Inc. | 158,500 | 31,625,505 | |
| Elior SA (a)(c) | 552,900 | 4,371,075 | |
| Expedia, Inc. (a) | 128,366 | 22,714,364 | |
| Las Vegas Sands Corp. (a) | 869,600 | 50,219,400 | |
| Marriott International, Inc. Class A (a) | 404,500 | 58,078,110 | |
| Marriott Vacations Worldwide Corp. (a) | 216,200 | 37,249,098 | |
| Starbucks Corp. | 64,102 | 7,299,936 | |
| The Booking Holdings, Inc. (a) | 48,176 | 113,770,033 | |
| The Restaurant Group PLC (a) | 1,271,237 | 2,192,540 | |
| Tosho Co. Ltd. | 5,000 | 82,428 | |
| Wendy's Co. | 1,514,850 | 35,174,817 | |
| 396,716,570 | |||
| Household Durables - 0.6% | |||
| Cuckoo Holdings Co. Ltd. | 22,347 | 2,812,452 | |
| ES-Con Japan Ltd. | 25,000 | 174,673 | |
| FJ Next Co. Ltd. | 600,000 | 5,600,511 | |
| GoPro, Inc. Class A (a) | 471,800 | 5,293,596 | |
| Gree Electric Appliances, Inc. of Zhuhai (A Shares) | 500,013 | 4,419,302 | |
| Helen of Troy Ltd. (a) | 178,100 | 37,486,488 | |
| Iida Group Holdings Co. Ltd. | 68,900 | 1,834,984 | |
| Lennar Corp. Class A | 392,100 | 38,821,821 | |
| Mohawk Industries, Inc. (a) | 603,465 | 127,138,006 | |
| Newell Brands, Inc. | 657,800 | 18,872,282 | |
| Open House Co. Ltd. | 5,000 | 232,441 | |
| Portmeirion Group PLC (a) | 23,413 | 226,187 | |
| Pressance Corp. | 700,100 | 10,665,511 | |
| PulteGroup, Inc. | 712,400 | 41,169,596 | |
| Sony Group Corp. sponsored ADR | 103,900 | 10,349,479 | |
| Token Corp. | 5,000 | 435,656 | |
| Whirlpool Corp. | 285,040 | 67,580,134 | |
| 373,113,119 | |||
| Internet & Direct Marketing Retail - 0.7% | |||
| Alibaba Group Holding Ltd. sponsored ADR (a) | 180,200 | 38,555,592 | |
| Amazon.com, Inc. (a) | 112,400 | 362,273,068 | |
| Global-e Online Ltd. (a)(b) | 52,300 | 1,718,578 | |
| Hyundai Home Shopping Network Corp. | 4,861 | 411,358 | |
| Moneysupermarket.com Group PLC | 400,000 | 1,535,493 | |
| NS Shopping Co. Ltd. | 21,105 | 265,614 | |
| Ocado Group PLC (a) | 30,400 | 815,846 | |
| Papyless Co. Ltd. | 100,000 | 1,549,000 | |
| Porch Group, Inc. Class A (a) | 431,700 | 7,390,704 | |
| Syuppin Co. Ltd. | 5,000 | 41,511 | |
| 414,556,764 | |||
| Leisure Products - 0.1% | |||
| Brunswick Corp. | 330,092 | 33,745,305 | |
| Multiline Retail - 0.1% | |||
| Dollar General Corp. | 263,400 | 53,459,664 | |
| Dollar Tree, Inc. (a) | 358,400 | 34,944,000 | |
| Europris ASA (c) | 5,000 | 33,942 | |
| Macy's, Inc. (a) | 50,000 | 914,000 | |
| Max Stock Ltd. | 250,000 | 820,492 | |
| Ryohin Keikaku Co. Ltd. | 10,000 | 189,880 | |
| 90,361,978 | |||
| Specialty Retail - 1.1% | |||
| Arcland Sakamoto Co. Ltd. | 100,000 | 1,338,935 | |
| AT-Group Co. Ltd. | 225,000 | 3,164,673 | |
| Auto1 Group SE (c) | 109,200 | 5,863,531 | |
| Bed Bath & Beyond, Inc. (a)(b) | 350,000 | 9,796,500 | |
| Best Buy Co., Inc. | 847,300 | 98,490,152 | |
| Burlington Stores, Inc. (a) | 239,445 | 77,429,330 | |
| Dunelm Group PLC | 200,000 | 4,171,175 | |
| Foot Locker, Inc. | 950,000 | 60,125,500 | |
| Gap, Inc. | 5,000 | 167,250 | |
| Genesco, Inc. (a) | 75,000 | 4,125,000 | |
| Hour Glass Ltd. | 1,871,200 | 1,741,903 | |
| JB Hi-Fi Ltd. | 5,000 | 187,864 | |
| JD Sports Fashion PLC | 875,000 | 11,749,899 | |
| Kid ASA (c) | 25,000 | 356,559 | |
| Ku Holdings Co. Ltd. | 100,000 | 864,919 | |
| Lookers PLC (a) | 828,728 | 800,614 | |
| Lowe's Companies, Inc. | 545,756 | 106,329,641 | |
| Mandarake, Inc. | 43,600 | 228,971 | |
| Sally Beauty Holdings, Inc. (a) | 1,038,800 | 22,656,228 | |
| Samse SA | 4,000 | 944,040 | |
| The Buckle, Inc. | 25,000 | 1,053,000 | |
| The Cato Corp. Class A (sub. vtg.) | 25,000 | 386,500 | |
| The Home Depot, Inc. | 372,200 | 118,698,302 | |
| TJX Companies, Inc. | 829,800 | 56,044,692 | |
| Tokatsu Holdings Co. Ltd. | 18,700 | 73,782 | |
| Ulta Beauty, Inc. (a) | 155,300 | 53,634,408 | |
| Urban Outfitters, Inc. (a) | 325,000 | 12,727,000 | |
| Williams-Sonoma, Inc. | 75,000 | 12,715,500 | |
| 665,865,868 | |||
| Textiles, Apparel & Luxury Goods - 0.5% | |||
| Capri Holdings Ltd. (a) | 125,000 | 7,088,750 | |
| Columbia Sportswear Co. | 340,400 | 34,969,292 | |
| Deckers Outdoor Corp. (a) | 90,700 | 30,424,408 | |
| Embry Holdings Ltd. | 280,000 | 50,867 | |
| Fossil Group, Inc. (a) | 30,000 | 423,600 | |
| G-III Apparel Group Ltd. (a) | 250,000 | 8,260,000 | |
| Hagihara Industries, Inc. | 25,000 | 326,742 | |
| Levi Strauss & Co. Class A | 1,289,100 | 34,496,316 | |
| NIKE, Inc. Class B | 631,800 | 86,215,428 | |
| PVH Corp. (a) | 502,100 | 57,651,122 | |
| Sitoy Group Holdings Ltd. | 2,613,000 | 222,198 | |
| Tapestry, Inc. (a) | 970,700 | 43,574,723 | |
| Ted Baker PLC (a)(b) | 418,192 | 1,063,484 | |
| 304,766,930 | |||
| TOTAL CONSUMER DISCRETIONARY | 2,848,254,233 | ||
| CONSUMER STAPLES - 2.7% | |||
| Beverages - 0.6% | |||
| Anheuser-Busch InBev SA NV ADR | 31,700 | 2,401,909 | |
| Asahi Group Holdings | 50,000 | 2,383,323 | |
| Boston Beer Co., Inc. Class A (a) | 12,700 | 13,438,632 | |
| Britvic PLC | 588,000 | 7,622,766 | |
| C&C Group PLC: | |||
| (United Kingdom) (a) | 5,441,700 | 18,662,690 | |
| rights (a) | 1,419,570 | 1,129,399 | |
| Constellation Brands, Inc. Class A (sub. vtg.) | 289,100 | 69,303,052 | |
| Diageo PLC sponsored ADR | 171,577 | 33,157,255 | |
| Keurig Dr. Pepper, Inc. | 230,600 | 8,522,976 | |
| Monster Beverage Corp. (a) | 640,900 | 60,417,643 | |
| The Coca-Cola Co. | 3,071,353 | 169,815,107 | |
| Yantai Changyu Pioneer Wine Co. Ltd. (B Shares) | 690,621 | 1,393,441 | |
| 388,248,193 | |||
| Food & Staples Retailing - 0.7% | |||
| Alimentation Couche-Tard, Inc. Class A (multi-vtg.) | 300,000 | 10,854,184 | |
| Amsterdam Commodities NV | 40,700 | 1,072,543 | |
| Belc Co. Ltd. | 5,000 | 251,621 | |
| Costco Wholesale Corp. | 225,200 | 85,186,404 | |
| Daiichi Co. Ltd. | 10,000 | 78,181 | |
| G-7 Holdings, Inc. | 200,000 | 5,425,153 | |
| Halows Co. Ltd. | 25,068 | 632,367 | |
| Kroger Co. | 1,610,400 | 59,552,592 | |
| Nihon Chouzai Co. Ltd. | 13,400 | 195,572 | |
| Oatly Group AB ADR (a) | 30,000 | 711,300 | |
| OM2 Network Co. Ltd. | 70,900 | 812,672 | |
| Performance Food Group Co. (a) | 864,799 | 43,352,374 | |
| Qol Holdings Co. Ltd. | 425,000 | 5,756,462 | |
| Retail Partners Co. Ltd. | 154,400 | 1,603,368 | |
| Sapporo Clinical Laboratory | 15,000 | 219,198 | |
| Satoh & Co. Ltd. (b) | 12,300 | 168,621 | |
| Sprouts Farmers Market LLC (a) | 20,000 | 532,000 | |
| Sundrug Co. Ltd. | 1,000 | 33,519 | |
| Sysco Corp. | 1,132,329 | 91,718,649 | |
| U.S. Foods Holding Corp. (a) | 1,581,700 | 61,591,398 | |
| Walgreens Boots Alliance, Inc. | 1,300,000 | 68,458,000 | |
| YAKUODO Holdings Co. Ltd. | 78,300 | 1,700,588 | |
| Yaoko Co. Ltd. | 1,000 | 57,266 | |
| 439,964,032 | |||
| Food Products - 0.4% | |||
| Armanino Foods of Distinction | 10,000 | 32,150 | |
| Axyz Co. Ltd. | 30,000 | 935,702 | |
| Delsole Corp. (b) | 65,000 | 294,456 | |
| Freshpet, Inc. (a) | 139,600 | 24,684,072 | |
| Ingredion, Inc. | 175,000 | 16,612,750 | |
| Kaneko Seeds Co. Ltd. | 88,900 | 1,198,433 | |
| Lamb Weston Holdings, Inc. | 418,700 | 34,538,563 | |
| LDC SA | 10,059 | 1,248,516 | |
| Lotte Samkang Co. Ltd. | 1,500 | 637,388 | |
| Mondelez International, Inc. | 1,303,900 | 82,836,767 | |
| Origin Enterprises PLC | 179,000 | 820,838 | |
| Pickles Corp. | 50,000 | 1,417,938 | |
| Prima Meat Packers Ltd. | 20,000 | 548,909 | |
| S Foods, Inc. | 100,000 | 2,936,341 | |
| Shinobu Food Products Co. Ltd. | 50,000 | 274,454 | |
| Sunjuice Holdings Co. Ltd. | 50,000 | 856,096 | |
| Toyo Sugar Refining Co. Ltd. | 39,400 | 427,502 | |
| Tyson Foods, Inc. Class A | 479,700 | 38,136,150 | |
| 208,437,025 | |||
| Household Products - 0.5% | |||
| Colgate-Palmolive Co. | 11,200 | 938,336 | |
| Procter & Gamble Co. | 1,667,800 | 224,902,830 | |
| Reckitt Benckiser Group PLC | 531,000 | 47,947,725 | |
| Spectrum Brands Holdings, Inc. | 217,213 | 19,308,064 | |
| Transaction Co. Ltd. | 75,000 | 935,017 | |
| 294,031,972 | |||
| Personal Products - 0.2% | |||
| Estee Lauder Companies, Inc. Class A | 250,900 | 76,905,868 | |
| Hengan International Group Co. Ltd. | 355,000 | 2,380,709 | |
| Herbalife Nutrition Ltd. (a) | 292,700 | 15,387,239 | |
| 94,673,816 | |||
| Tobacco - 0.3% | |||
| Altria Group, Inc. | 3,457,989 | 170,202,219 | |
| British American Tobacco PLC sponsored ADR (b) | 674,970 | 26,101,090 | |
| KT&G Corp. | 23,699 | 1,802,392 | |
| Scandinavian Tobacco Group A/S (c) | 32,565 | 686,999 | |
| Swedish Match Co. AB | 709,000 | 6,577,129 | |
| 205,369,829 | |||
| TOTAL CONSUMER STAPLES | 1,630,724,867 | ||
| ENERGY - 1.9% | |||
| Energy Equipment & Services - 0.1% | |||
| Baker Hughes Co. Class A | 375,300 | 9,157,320 | |
| Geospace Technologies Corp. (a) | 25,000 | 204,000 | |
| Halliburton Co. | 159,400 | 3,578,530 | |
| High Arctic Energy Services, Inc. (a) | 362,600 | 396,547 | |
| Hoegh LNG Partners LP (b) | 455,400 | 7,596,072 | |
| Liberty Oilfield Services, Inc. Class A (a) | 220,009 | 3,291,335 | |
| NOV, Inc. (a) | 78,500 | 1,265,420 | |
| Oceaneering International, Inc. (a) | 246,108 | 3,511,961 | |
| SBM Offshore NV | 115,500 | 1,996,416 | |
| Subsea 7 SA | 1,533,500 | 14,952,160 | |
| 45,949,761 | |||
| Oil, Gas & Consumable Fuels - 1.8% | |||
| Africa Oil Corp. (a)(b) | 3,014,700 | 3,022,193 | |
| APA Corp. | 1,091,300 | 22,699,040 | |
| ARC Resources Ltd. | 5,540 | 42,640 | |
| Baytex Energy Corp. (a) | 2,463,500 | 4,082,022 | |
| Bonterra Energy Corp. (a) | 218,300 | 850,050 | |
| Canadian Natural Resources Ltd. | 732,100 | 25,693,253 | |
| Cenovus Energy, Inc.: | |||
| warrants 1/1/26 (a) | 117,180 | 500,952 | |
| (Canada) | 7,200,493 | 60,193,019 | |
| Cheniere Energy, Inc. (a) | 38,100 | 3,234,690 | |
| Chevron Corp. | 77,800 | 8,074,862 | |
| China Petroleum & Chemical Corp.: | |||
| (H Shares) | 29,000,100 | 15,431,448 | |
| sponsored ADR (H Shares) | 9,600 | 518,400 | |
| CNX Resources Corp. (a) | 175,000 | 2,383,500 | |
| Delek U.S. Holdings, Inc. | 550,000 | 12,259,500 | |
| Diamondback Energy, Inc. | 461,600 | 36,960,312 | |
| Enterprise Products Partners LP | 218,000 | 5,146,980 | |
| EQT Corp. (a) | 1,300,000 | 27,144,000 | |
| Extraction Oil & Gas, Inc. (a) | 35,000 | 1,719,200 | |
| Exxon Mobil Corp. | 6,137,646 | 358,254,397 | |
| Frontline Ltd. (NY Shares) | 10,000 | 85,200 | |
| Harbour Energy PLC (a) | 11,365,200 | 3,318,114 | |
| Hess Corp. | 1,621,571 | 135,920,081 | |
| HollyFrontier Corp. | 121,700 | 3,951,599 | |
| Imperial Oil Ltd. (b) | 861,600 | 28,988,878 | |
| Iwatani Corp. | 25,000 | 1,475,021 | |
| Kosmos Energy Ltd. (a) | 8,282,200 | 26,337,396 | |
| Magellan Midstream Partners LP | 178,700 | 8,808,123 | |
| Magnolia Oil & Gas Corp. Class A (a) | 1,363,600 | 17,617,712 | |
| Marathon Oil Corp. | 422,000 | 5,110,420 | |
| Marathon Petroleum Corp. | 55,300 | 3,417,540 | |
| MEG Energy Corp. (a) | 2,178,525 | 15,143,185 | |
| Motor Oil (HELLAS) Corinth Refineries SA | 111,300 | 1,845,559 | |
| Murphy Oil Corp. | 532,500 | 11,549,925 | |
| NuVista Energy Ltd. (a) | 5,000 | 12,676 | |
| Oil & Natural Gas Corp. Ltd. | 16,500,000 | 25,858,574 | |
| Oil India Ltd. | 1,100,000 | 2,009,832 | |
| Parex Resources, Inc. (a) | 1,872,400 | 32,763,122 | |
| Phillips 66 Co. | 585,568 | 49,316,537 | |
| Range Resources Corp. (a) | 1,279,600 | 17,351,376 | |
| Reliance Industries Ltd. | 309,200 | 9,210,957 | |
| Renewable Energy Group, Inc. (a) | 206,700 | 12,623,169 | |
| Sinopec Kantons Holdings Ltd. | 5,064,000 | 1,996,514 | |
| Southwestern Energy Co. (a) | 6,250,084 | 32,312,934 | |
| Star Petroleum Refining PCL (a) | 2,366,800 | 738,678 | |
| Teekay LNG Partners LP | 1,648,800 | 25,655,328 | |
| Thai Oil PCL (For. Reg.) | 468,100 | 884,056 | |
| Total SA sponsored ADR | 550,000 | 25,679,500 | |
| Tsakos Energy Navigation Ltd. | 10,000 | 90,600 | |
| Unit Corp. warrants 9/3/27 (a)(b)(d) | 55,938 | 65,468 | |
| Valero Energy Corp. | 186,300 | 14,978,520 | |
| Whiting Petroleum Corp. (a) | 220,311 | 10,088,041 | |
| Whiting Petroleum Corp.: | |||
| warrants 9/1/24 (a) | 1,220 | 6,149 | |
| warrants 9/1/25 (a) | 610 | 2,446 | |
| World Fuel Services Corp. | 100,000 | 3,073,000 | |
| 1,116,496,688 | |||
| TOTAL ENERGY | 1,162,446,449 | ||
| FINANCIALS - 7.6% | |||
| Banks - 3.4% | |||
| Arrow Financial Corp. | 5,000 | 185,500 | |
| Associated Banc-Corp. | 2,187,600 | 50,292,924 | |
| Bank of America Corp. | 11,709,990 | 496,386,476 | |
| BankUnited, Inc. | 807,798 | 38,604,666 | |
| BNP Paribas SA (b) | 106,600 | 7,280,372 | |
| Chesapeake Financial Shares, Inc. | 5,000 | 130,000 | |
| Citigroup, Inc. | 337,700 | 26,580,367 | |
| Citizens Financial Group, Inc. | 357,200 | 17,824,280 | |
| Citizens Financial Services, Inc. | 883 | 53,863 | |
| Comerica, Inc. | 127,900 | 10,038,871 | |
| Credit Agricole Atlantique Vendee | 7,800 | 1,088,312 | |
| Cullen/Frost Bankers, Inc. | 134,600 | 16,247,566 | |
| East West Bancorp, Inc. | 5,000 | 373,900 | |
| EFG Eurobank Ergasias SA (a) | 9,179,700 | 8,616,614 | |
| Embassy Bancorp, Inc. | 5,000 | 99,900 | |
| Enterprise Bancorp, Inc. | 5,000 | 172,300 | |
| First Horizon National Corp. | 2,991,070 | 57,039,705 | |
| FNB Corp., Pennsylvania | 56,100 | 752,301 | |
| Great Southern Bancorp, Inc. | 5,000 | 282,450 | |
| Gunma Bank Ltd. | 468,400 | 1,505,862 | |
| Hirogin Holdings, Inc. | 65,700 | 351,632 | |
| JPMorgan Chase & Co. | 1,826,328 | 299,956,111 | |
| M&T Bank Corp. | 529,398 | 85,068,965 | |
| NatWest Group PLC | 1,066,600 | 3,136,710 | |
| NIBC Holding NV (b)(c) | 660,726 | 5,655,782 | |
| Northrim Bancorp, Inc. | 5,000 | 217,750 | |
| Ogaki Kyoritsu Bank Ltd. | 51,400 | 875,523 | |
| PacWest Bancorp | 1,412,259 | 63,791,739 | |
| Piraeus Financial Holdings SA (a) | 3,013,900 | 5,631,517 | |
| Plumas Bancorp | 3,660 | 111,374 | |
| PNC Financial Services Group, Inc. | 1,062,350 | 206,818,298 | |
| Sbanken ASA (c) | 149,998 | 1,854,321 | |
| Shinsei Bank Ltd. | 82,500 | 1,280,939 | |
| Signature Bank | 28,200 | 7,042,950 | |
| Societe Generale Series A | 473,600 | 15,176,410 | |
| Standard Chartered PLC (United Kingdom) | 1,096,300 | 7,909,053 | |
| Sumitomo Mitsui Financial Group, Inc. | 1,700,000 | 61,345,328 | |
| Texas Capital Bancshares, Inc. (a) | 150,000 | 10,332,000 | |
| The Bank of Princeton | 5,000 | 147,150 | |
| The Keiyo Bank Ltd. | 148,400 | 557,059 | |
| The San-In Godo Bank Ltd. | 142,300 | 681,023 | |
| Truist Financial Corp. | 961,541 | 59,404,003 | |
| U.S. Bancorp | 834,952 | 50,748,383 | |
| Unicaja Banco SA (c) | 2,100,000 | 2,339,434 | |
| UniCredit SpA | 547,800 | 7,033,711 | |
| Van Lanschot NV (Bearer) | 5,800 | 168,802 | |
| Washington Trust Bancorp, Inc. | 22,656 | 1,245,853 | |
| Wells Fargo & Co. | 9,132,385 | 426,665,027 | |
| Yamaguchi Financial Group, Inc. | 127,800 | 745,860 | |
| 2,059,848,936 | |||
| Capital Markets - 1.2% | |||
| Affiliated Managers Group, Inc. | 274,600 | 45,034,400 | |
| Bank of New York Mellon Corp. | 1,324,600 | 68,985,168 | |
| BlackRock, Inc. Class A | 80,500 | 70,601,720 | |
| Cboe Global Markets, Inc. | 85,400 | 9,505,020 | |
| CI Financial Corp. | 1,950,000 | 36,221,210 | |
| Coinbase Global, Inc. (a)(b) | 5,300 | 1,253,662 | |
| Daou Data Corp. | 1,000 | 13,488 | |
| Goldman Sachs Group, Inc. | 55,700 | 20,721,514 | |
| Intercontinental Exchange, Inc. | 73,500 | 8,296,680 | |
| Invesco Ltd. | 764,300 | 21,805,479 | |
| KKR & Co. LP | 528,409 | 29,427,097 | |
| Lazard Ltd. Class A | 974,063 | 45,956,292 | |
| Morgan Stanley | 1,079,270 | 98,159,607 | |
| Northern Trust Corp. | 641,947 | 77,797,557 | |
| Raymond James Financial, Inc. | 138,773 | 18,399,912 | |
| State Street Corp. | 1,284,290 | 111,707,544 | |
| StepStone Group, Inc. Class A | 283,100 | 8,974,270 | |
| The Beauty Health Co. (a)(b) | 340,000 | 4,841,600 | |
| Virtu Financial, Inc. Class A | 541,089 | 16,476,160 | |
| 694,178,380 | |||
| Consumer Finance - 1.1% | |||
| 360 DigiTech, Inc. ADR (a) | 168,000 | 4,715,760 | |
| Aeon Credit Service (Asia) Co. Ltd. | 5,000,000 | 3,343,447 | |
| Ally Financial, Inc. | 956,200 | 52,313,702 | |
| American Express Co. | 329,000 | 52,682,770 | |
| Capital One Financial Corp. | 1,085,900 | 174,591,002 | |
| Discover Financial Services | 1,736,113 | 203,576,610 | |
| First Cash Financial Services, Inc. | 244,510 | 19,492,337 | |
| LendingTree, Inc. (a) | 31,100 | 6,383,275 | |
| Navient Corp. | 160,000 | 2,923,200 | |
| OneMain Holdings, Inc. | 1,404,759 | 81,251,261 | |
| Santander Consumer U.S.A. Holdings, Inc. | 175,000 | 6,632,500 | |
| Shriram Transport Finance Co. Ltd. | 188,146 | 3,709,552 | |
| Synchrony Financial | 1,300,000 | 61,633,000 | |
| 673,248,416 | |||
| Diversified Financial Services - 0.6% | |||
| Berkshire Hathaway, Inc.: | |||
| Class A (a) | 2 | 872,000 | |
| Class B (a) | 1,023,800 | 296,328,672 | |
| BFF Bank SpA (c) | 693,800 | 6,524,298 | |
| Fuyo General Lease Co. Ltd. | 100,000 | 6,630,743 | |
| Jaws Acquisition Corp. (a)(b) | 800,000 | 11,608,000 | |
| Ricoh Leasing Co. Ltd. | 114,000 | 3,524,431 | |
| Voya Financial, Inc. | 696,610 | 45,641,887 | |
| Zenkoku Hosho Co. Ltd. | 25,000 | 1,028,633 | |
| 372,158,664 | |||
| Insurance - 1.0% | |||
| AFLAC, Inc. | 1,100,000 | 62,348,000 | |
| AIA Group Ltd. | 540,200 | 6,904,359 | |
| Allstate Corp. | 137,100 | 18,729,231 | |
| American International Group, Inc. | 997,171 | 52,690,516 | |
| Arthur J. Gallagher & Co. | 111,800 | 16,390,998 | |
| ASR Nederland NV | 100,000 | 4,305,655 | |
| Assurant, Inc. | 224,130 | 36,118,550 | |
| BRP Group, Inc. (a) | 572,700 | 14,076,966 | |
| Chubb Ltd. | 535,366 | 91,006,866 | |
| Db Insurance Co. Ltd. | 531,800 | 24,324,730 | |
| Fairfax Financial Holdings Ltd. (sub. vtg.) | 12,400 | 5,792,557 | |
| Genworth Financial, Inc. Class A (a) | 324,100 | 1,361,220 | |
| Hartford Financial Services Group, Inc. | 456,200 | 29,812,670 | |
| Hyundai Fire & Marine Insurance Co. Ltd. | 425,000 | 9,355,575 | |
| Investors Title Co. | 3,000 | 533,520 | |
| Lincoln National Corp. | 56,000 | 3,908,240 | |
| MetLife, Inc. | 500,000 | 32,680,000 | |
| NN Group NV | 150,203 | 7,628,053 | |
| NN Group NV rights (a)(b)(e) | 150,203 | 270,003 | |
| Primerica, Inc. | 5,000 | 811,050 | |
| Prudential Financial, Inc. | 85,000 | 9,092,450 | |
| Reinsurance Group of America, Inc. | 149,600 | 18,854,088 | |
| Sul America SA unit | 10,803 | 71,502 | |
| The Travelers Companies, Inc. | 830,200 | 132,582,940 | |
| Willis Towers Watson PLC | 67,200 | 17,563,392 | |
| 597,213,131 | |||
| Mortgage Real Estate Investment Trusts - 0.1% | |||
| New Residential Investment Corp. | 3,078,527 | 32,570,816 | |
| Thrifts & Mortgage Finance - 0.2% | |||
| ASAX Co. Ltd. | 188,500 | 1,174,144 | |
| Essent Group Ltd. | 1,012,030 | 48,415,515 | |
| Federal Agricultural Mortgage Corp. Class C (non-vtg.) | 20,000 | 2,029,200 | |
| Genworth Mortgage Insurance Ltd. (a) | 600,000 | 1,272,292 | |
| Greene County Bancorp, Inc. (b) | 64,000 | 1,834,240 | |
| MGIC Investment Corp. | 3,104,599 | 45,699,697 | |
| Radian Group, Inc. | 738,202 | 17,237,017 | |
| Sangsangin Co. Ltd. (a) | 10,000 | 70,821 | |
| Southern Missouri Bancorp, Inc. | 30,000 | 1,326,000 | |
| 119,058,926 | |||
| TOTAL FINANCIALS | 4,548,277,269 | ||
| HEALTH CARE - 6.8% | |||
| Biotechnology - 1.1% | |||
| AbbVie, Inc. | 71,307 | 8,071,952 | |
| ADC Therapeutics SA (a)(b) | 234,900 | 5,085,585 | |
| Agios Pharmaceuticals, Inc. (a) | 142,000 | 7,920,760 | |
| Alexion Pharmaceuticals, Inc. (a) | 684,400 | 120,830,820 | |
| Alnylam Pharmaceuticals, Inc. (a) | 137,619 | 19,540,522 | |
| Amgen, Inc. | 320,600 | 76,283,564 | |
| Arcutis Biotherapeutics, Inc. (a) | 176,000 | 4,637,600 | |
| Argenx SE ADR (a) | 88,000 | 24,551,120 | |
| Ascendis Pharma A/S sponsored ADR (a) | 124,568 | 16,739,448 | |
| Avid Bioservices, Inc. (a) | 320,000 | 6,809,600 | |
| BioAtla, Inc. (b) | 100,000 | 4,305,000 | |
| Blueprint Medicines Corp. (a) | 434,198 | 39,663,987 | |
| Cell Biotech Co. Ltd. | 75,959 | 1,367,143 | |
| Crinetics Pharmaceuticals, Inc. (a) | 86,700 | 1,521,585 | |
| Cytokinetics, Inc. (a) | 218,000 | 4,758,940 | |
| Essex Bio-Technology Ltd. | 500,000 | 342,719 | |
| Exelixis, Inc. (a) | 228,000 | 5,141,400 | |
| Generation Bio Co. | 128,000 | 4,385,280 | |
| Gilead Sciences, Inc. | 325,000 | 21,485,750 | |
| Gritstone Bio, Inc. (a)(b) | 138,500 | 1,274,200 | |
| Heron Therapeutics, Inc. (a) | 29,900 | 396,773 | |
| ImmunoGen, Inc. (a) | 3,610,600 | 22,313,508 | |
| Innovent Biologics, Inc. (a)(c) | 820,000 | 9,925,851 | |
| Insmed, Inc. (a) | 221,600 | 5,451,360 | |
| Intercept Pharmaceuticals, Inc. (a) | 367,582 | 6,112,889 | |
| Mirati Therapeutics, Inc. (a) | 47,500 | 7,512,125 | |
| Natera, Inc. (a) | 230,100 | 21,661,614 | |
| Novavax, Inc. (a)(b) | 30,000 | 4,428,600 | |
| Prelude Therapeutics, Inc. (b) | 100,000 | 3,476,000 | |
| PTC Therapeutics, Inc. (a) | 597,500 | 23,463,825 | |
| Regeneron Pharmaceuticals, Inc. (a) | 185,600 | 93,251,008 | |
| Sarepta Therapeutics, Inc. (a) | 80,000 | 6,052,000 | |
| Shattuck Labs, Inc. | 152,000 | 4,125,280 | |
| TG Therapeutics, Inc. (a) | 245,000 | 8,543,150 | |
| Turning Point Therapeutics, Inc. (a) | 309,100 | 20,456,238 | |
| United Therapeutics Corp. (a) | 75,000 | 13,942,500 | |
| Vaxcyte, Inc. (b) | 90,900 | 1,915,263 | |
| Vertex Pharmaceuticals, Inc. (a) | 16,000 | 3,338,080 | |
| Xencor, Inc. (a) | 160,000 | 6,153,600 | |
| Zentalis Pharmaceuticals, Inc. (a) | 128,000 | 7,148,800 | |
| Zymeworks, Inc. (a) | 128,000 | 3,993,600 | |
| 648,379,039 | |||
| Health Care Equipment & Supplies - 0.8% | |||
| Axonics Modulation Technologies, Inc. (a) | 541,300 | 31,227,597 | |
| Becton, Dickinson & Co. | 69,725 | 16,865,780 | |
| Boston Scientific Corp. (a) | 3,848,863 | 163,769,121 | |
| Danaher Corp. | 334,800 | 85,755,672 | |
| DexCom, Inc. (a) | 10,800 | 3,989,412 | |
| Envista Holdings Corp. (a) | 260,200 | 11,355,128 | |
| Fukuda Denshi Co. Ltd. | 110,000 | 8,609,919 | |
| Hologic, Inc. (a) | 280,000 | 17,656,800 | |
| InBody Co. Ltd. | 215,000 | 5,789,946 | |
| Insulet Corp. (a) | 109,800 | 29,609,766 | |
| Intuitive Surgical, Inc. (a) | 9,200 | 7,748,056 | |
| iRhythm Technologies, Inc. (a) | 1,909 | 144,053 | |
| Masimo Corp. (a) | 30,000 | 6,468,000 | |
| Meridian Bioscience, Inc. (a) | 15,000 | 311,400 | |
| Penumbra, Inc. (a) | 126,000 | 31,387,860 | |
| Tandem Diabetes Care, Inc. (a) | 369,500 | 31,551,605 | |
| Value Added Technology Co. Ltd. | 145,000 | 4,401,947 | |
| Vieworks Co. Ltd. | 375,000 | 12,602,284 | |
| ViewRay, Inc. (a) | 5,019,600 | 29,515,248 | |
| 498,759,594 | |||
| Health Care Providers & Services - 2.9% | |||
| 1Life Healthcare, Inc. (a) | 228,000 | 8,436,000 | |
| Alignment Healthcare, Inc. (a)(b) | 385,000 | 9,713,550 | |
| AmerisourceBergen Corp. | 48,800 | 5,599,312 | |
| Anthem, Inc. | 435,800 | 173,544,276 | |
| Cardinal Health, Inc. | 544,827 | 30,548,450 | |
| Centene Corp. (a) | 2,472,500 | 181,976,000 | |
| Cigna Corp. | 1,285,610 | 332,780,149 | |
| Covetrus, Inc. (a) | 139,200 | 3,861,408 | |
| CVS Health Corp. | 2,026,108 | 175,136,776 | |
| HCA Holdings, Inc. | 135,000 | 28,996,650 | |
| Humana, Inc. | 292,200 | 127,895,940 | |
| Laboratory Corp. of America Holdings (a) | 50,000 | 13,724,000 | |
| LHC Group, Inc. (a) | 156,300 | 30,767,655 | |
| McKesson Corp. | 348,726 | 67,091,395 | |
| MEDNAX, Inc. (a) | 1,149,400 | 36,757,812 | |
| Option Care Health, Inc. (a) | 300,000 | 5,502,000 | |
| Progyny, Inc. (a) | 589,100 | 37,725,964 | |
| Quest Diagnostics, Inc. | 3,700 | 487,179 | |
| Rede D'Oregon Sao Luiz SA (c) | 740,000 | 9,917,133 | |
| Sinopharm Group Co. Ltd. (H Shares) | 600,000 | 2,040,856 | |
| Surgery Partners, Inc. (a) | 200,000 | 11,706,000 | |
| Tokai Corp. | 150,000 | 3,290,711 | |
| UnitedHealth Group, Inc. | 950,903 | 391,695,964 | |
| Universal Health Services, Inc. Class B | 265,000 | 42,301,950 | |
| 1,731,497,130 | |||
| Health Care Technology - 0.0% | |||
| agilon health, Inc. (a)(b) | 200,000 | 7,188,000 | |
| Phreesia, Inc. (a) | 686,700 | 33,991,650 | |
| 41,179,650 | |||
| Life Sciences Tools & Services - 0.4% | |||
| 10X Genomics, Inc. (a) | 35,000 | 6,300,000 | |
| Avantor, Inc. (a) | 1,551,000 | 49,864,650 | |
| Bio-Rad Laboratories, Inc. Class A (a) | 32,400 | 19,516,788 | |
| Bruker Corp. | 653,950 | 45,410,288 | |
| EPS Co. Ltd. | 25,000 | 410,540 | |
| ICON PLC (a) | 5,200 | 1,163,552 | |
| Lonza Group AG | 21,800 | 14,042,610 | |
| PRA Health Sciences, Inc. (a) | 253,600 | 43,345,312 | |
| Sartorius Stedim Biotech | 22,800 | 9,881,019 | |
| Thermo Fisher Scientific, Inc. | 76,500 | 35,916,750 | |
| 225,851,509 | |||
| Pharmaceuticals - 1.6% | |||
| Arvinas Holding Co. LLC (a) | 504,900 | 36,726,426 | |
| AstraZeneca PLC (United Kingdom) | 300,000 | 34,229,435 | |
| Atea Pharmaceuticals, Inc. | 70,000 | 1,429,400 | |
| Bayer AG | 990,915 | 62,380,396 | |
| Bristol-Myers Squibb Co. | 4,814,199 | 316,389,158 | |
| Dai Han Pharmaceutical Co. Ltd. | 25,000 | 790,533 | |
| Daito Pharmaceutical Co. Ltd. | 40,000 | 1,198,283 | |
| Dawnrays Pharmaceutical Holdings Ltd. | 8,622,000 | 2,077,336 | |
| Eli Lilly & Co. | 423,200 | 84,529,968 | |
| Fuji Pharma Co. Ltd. | 5,000 | 51,831 | |
| Genomma Lab Internacional SA de CV (a) | 1,000,000 | 1,050,994 | |
| GlaxoSmithKline PLC sponsored ADR (b) | 1,764,454 | 68,407,882 | |
| Huons Co. Ltd. | 10,000 | 570,176 | |
| Intra-Cellular Therapies, Inc. (a) | 44,700 | 1,761,627 | |
| Jazz Pharmaceuticals PLC (a) | 75,000 | 13,359,750 | |
| Johnson & Johnson | 527,049 | 89,203,043 | |
| Korea United Pharm, Inc. | 75,000 | 3,674,116 | |
| Nektar Therapeutics (a) | 210,000 | 3,794,700 | |
| Nippon Chemiphar Co. Ltd. | 40,100 | 852,249 | |
| Pliant Therapeutics, Inc. (b) | 176,500 | 5,305,590 | |
| Reata Pharmaceuticals, Inc. (a) | 194,800 | 26,636,952 | |
| Roche Holding AG (participation certificate) | 303,576 | 105,610,742 | |
| Royalty Pharma PLC | 415,000 | 16,649,800 | |
| Sanofi SA sponsored ADR | 1,357,750 | 72,544,583 | |
| Taro Pharmaceutical Industries Ltd. (a) | 11,200 | 795,424 | |
| Theravance Biopharma, Inc. (a) | 181,800 | 3,141,504 | |
| UCB SA | 76,000 | 7,111,509 | |
| Viatris, Inc. | 263,300 | 4,012,692 | |
| 964,286,099 | |||
| TOTAL HEALTH CARE | 4,109,953,021 | ||
| INDUSTRIALS - 6.0% | |||
| Aerospace & Defense - 0.8% | |||
| Airbus Group NV (a) | 209,245 | 27,291,654 | |
| Axon Enterprise, Inc. (a) | 25,500 | 3,585,045 | |
| General Dynamics Corp. | 78,927 | 14,989,027 | |
| HEICO Corp. Class A | 303,646 | 40,220,949 | |
| Huntington Ingalls Industries, Inc. | 59,231 | 12,806,335 | |
| L3Harris Technologies, Inc. | 279,400 | 60,925,964 | |
| Lockheed Martin Corp. | 151,100 | 57,750,420 | |
| Magellan Aerospace Corp. | 50,000 | 434,548 | |
| Maxar Technologies, Inc. | 29,500 | 917,450 | |
| MTU Aero Engines AG | 27,400 | 7,069,785 | |
| Northrop Grumman Corp. | 201,300 | 73,649,631 | |
| Raytheon Technologies Corp. | 79,568 | 7,058,477 | |
| Rolls-Royce Holdings PLC | 7,185,100 | 10,899,086 | |
| Safran SA | 31,700 | 4,743,205 | |
| The Boeing Co. (a) | 623,826 | 154,097,499 | |
| The Lisi Group | 5,000 | 177,619 | |
| Vectrus, Inc. (a) | 29,964 | 1,528,763 | |
| 478,145,457 | |||
| Air Freight & Logistics - 0.4% | |||
| Air Transport Services Group, Inc. (a) | 850,800 | 21,133,872 | |
| Deutsche Post AG | 502,100 | 34,260,808 | |
| FedEx Corp. | 135,418 | 42,630,941 | |
| Onelogix Group Ltd. (a) | 574,686 | 88,630 | |
| Sinotrans Ltd. (H Shares) | 1,000,000 | 463,831 | |
| United Parcel Service, Inc. Class B | 637,522 | 136,812,221 | |
| 235,390,303 | |||
| Airlines - 0.1% | |||
| Copa Holdings SA Class A (a) | 4,206 | 345,986 | |
| Delta Air Lines, Inc. (a) | 586,800 | 27,978,624 | |
| Hawaiian Holdings, Inc. (a) | 2,000 | 51,600 | |
| JetBlue Airways Corp. (a) | 2,074,700 | 41,701,470 | |
| Ryanair Holdings PLC sponsored ADR (a) | 46,700 | 5,452,225 | |
| 75,529,905 | |||
| Building Products - 0.7% | |||
| Apogee Enterprises, Inc. | 50,000 | 1,900,500 | |
| Fortune Brands Home & Security, Inc. | 1,290,129 | 133,089,708 | |
| Johnson Controls International PLC | 685,093 | 45,586,088 | |
| KVK Corp. | 10,000 | 184,035 | |
| Nihon Dengi Co. Ltd. | 164,500 | 5,709,197 | |
| Nihon Flush Co. Ltd. | 275,078 | 3,163,058 | |
| Owens Corning | 590,500 | 62,976,825 | |
| Trane Technologies PLC | 910,000 | 169,624,000 | |
| 422,233,411 | |||
| Commercial Services & Supplies - 0.0% | |||
| CoreCivic, Inc. (a) | 100,000 | 783,000 | |
| CTS Co. Ltd. | 5,000 | 39,775 | |
| gremz, Inc. | 5,000 | 83,021 | |
| Mitie Group PLC (a) | 400,000 | 385,862 | |
| VSE Corp. | 20,054 | 953,969 | |
| 2,245,627 | |||
| Construction & Engineering - 0.0% | |||
| Boustead Projs. Pte Ltd. | 2,180,500 | 1,963,820 | |
| Dai-Ichi Cutter Kogyo KK | 25,000 | 310,531 | |
| Kawasaki Setsubi Kogyo Co. Ltd. | 35,000 | 138,414 | |
| Meisei Industrial Co. Ltd. | 500,200 | 3,385,224 | |
| Raiznext Corp. | 550,800 | 5,830,461 | |
| Seikitokyu Kogyo Co. Ltd. | 200,000 | 1,536,213 | |
| Shinnihon Corp. | 25,000 | 194,767 | |
| Totetsu Kogyo Co. Ltd. | 350,000 | 7,534,478 | |
| Watanabe Sato Co. Ltd. | 20,000 | 556,215 | |
| 21,450,123 | |||
| Electrical Equipment - 0.7% | |||
| Acuity Brands, Inc. | 132,052 | 24,528,659 | |
| Aichi Electric Co. Ltd. | 231,450 | 5,897,758 | |
| AMETEK, Inc. | 745,300 | 100,690,030 | |
| AQ Group AB (a) | 1,000 | 40,352 | |
| Array Technologies, Inc. | 747,772 | 12,188,684 | |
| BizLink Holding, Inc. | 50,000 | 441,651 | |
| Emerson Electric Co. | 630,400 | 60,322,976 | |
| Gerard Perrier Industrie SA (b) | 5,000 | 474,466 | |
| Hubbell, Inc. Class B | 78,060 | 14,881,358 | |
| Iwabuchi Corp. | 8,700 | 464,042 | |
| Plug Power, Inc. (a) | 316,300 | 9,710,410 | |
| Regal Beloit Corp. | 251,800 | 35,813,514 | |
| Shoals Technologies Group, Inc. | 177,850 | 4,908,660 | |
| Sunrun, Inc. (a) | 1,370,710 | 61,298,151 | |
| Terasaki Electric Co. Ltd. | 33,600 | 366,105 | |
| Vertiv Holdings Co. | 893,609 | 22,179,375 | |
| Vertiv Holdings LLC (a)(f) | 600,000 | 14,892,000 | |
| Vestas Wind Systems A/S | 479,000 | 18,650,728 | |
| 387,748,919 | |||
| Industrial Conglomerates - 1.1% | |||
| 3M Co. | 467,203 | 94,860,897 | |
| Carlisle Companies, Inc. | 254,320 | 48,910,822 | |
| General Electric Co. | 32,315,141 | 454,350,882 | |
| Mytilineos SA | 239,500 | 4,504,380 | |
| Reunert Ltd. | 56,900 | 219,052 | |
| Siemens AG | 417,900 | 67,782,888 | |
| 670,628,921 | |||
| Machinery - 1.3% | |||
| AGCO Corp. | 432,900 | 59,900,373 | |
| Caterpillar, Inc. | 378,000 | 91,128,240 | |
| Chart Industries, Inc. (a) | 228,700 | 33,376,478 | |
| Clean & Science Co. Ltd. | 5,000 | 105,104 | |
| Colfax Corp. (a) | 925,100 | 40,889,420 | |
| Conrad Industries, Inc. (a) | 5,400 | 79,650 | |
| Crane Co. | 5,000 | 477,450 | |
| Cummins, Inc. | 29,942 | 7,703,478 | |
| Danieli & C. Officine Meccaniche SpA (b) | 25,000 | 674,096 | |
| Ebara Jitsugyo Co. Ltd. | 25,000 | 1,454,471 | |
| Epiroc AB | 236,600 | 85,482 | |
| Epiroc AB (A Shares) | 236,600 | 5,357,261 | |
| Estic Corp. | 14,900 | 607,622 | |
| Flowserve Corp. | 1,374,231 | 58,253,652 | |
| Fortive Corp. | 1,112,624 | 80,687,492 | |
| Fukushima Industries Corp. | 10,000 | 385,423 | |
| Haitian International Holdings Ltd. | 900,000 | 3,142,454 | |
| Hy-Lok Corp. | 14,316 | 237,001 | |
| IDEX Corp. | 155,727 | 34,674,174 | |
| ITT, Inc. | 985,100 | 92,500,890 | |
| Koike Sanso Kogyo Co. Ltd. | 2,200 | 45,833 | |
| Mitsui Engineering & Shipbuilding Co. (a) | 250,000 | 1,127,957 | |
| Nakanishi Manufacturing Co. Ltd. | 30,000 | 301,123 | |
| Nansin Co. Ltd. | 32,900 | 173,379 | |
| Oshkosh Corp. | 622,200 | 81,781,968 | |
| Otis Worldwide Corp. | 1,023,804 | 80,194,567 | |
| Pentair PLC | 611,200 | 42,154,464 | |
| Sakura Rubber Co. Ltd. | 20,800 | 739,940 | |
| Semperit AG Holding | 25,000 | 1,111,265 | |
| Shinwa Co. Ltd. | 25,000 | 480,409 | |
| Stanley Black & Decker, Inc. | 232,332 | 50,369,578 | |
| Takamatsu Machinery Co. Ltd. | 25,000 | 161,202 | |
| The Hanshin Diesel Works Ltd. | 4,500 | 75,048 | |
| Trinity Industrial Corp. | 10,000 | 77,633 | |
| Westinghouse Air Brake Co. | 177,614 | 14,699,335 | |
| Yamada Corp. | 25,000 | 546,854 | |
| 785,760,766 | |||
| Marine - 0.0% | |||
| Japan Transcity Corp. | 280,300 | 1,313,306 | |
| Professional Services - 0.1% | |||
| ABIST Co. Ltd. | 57,385 | 1,525,165 | |
| Altech Corp. | 70,000 | 1,246,689 | |
| Bertrandt AG | 55,000 | 3,564,608 | |
| Career Design Center Co. Ltd. | 110,000 | 1,103,114 | |
| Creek & River Co. Ltd. | 45,000 | 608,686 | |
| Dun & Bradstreet Holdings, Inc. (a)(b) | 307,800 | 6,608,466 | |
| en-japan, Inc. | 5,000 | 175,130 | |
| Equifax, Inc. | 33,400 | 7,850,336 | |
| Gakujo Co. Ltd. (b) | 250,000 | 3,260,572 | |
| Mastech Digital, Inc. (a) | 20,000 | 315,200 | |
| McMillan Shakespeare Ltd. | 46,017 | 412,393 | |
| Outsourcing, Inc. | 125,000 | 2,307,288 | |
| Quick Co. Ltd. | 275,000 | 3,079,277 | |
| Robert Half International, Inc. | 5,000 | 443,950 | |
| SaraminHR Co. Ltd. | 112,438 | 3,880,041 | |
| SHL-JAPAN Ltd. | 41,600 | 1,284,209 | |
| WDB Holdings Co. Ltd. | 60,000 | 1,397,388 | |
| Will Group, Inc. | 112,700 | 981,969 | |
| World Holdings Co. Ltd. | 61,800 | 1,465,838 | |
| 41,510,319 | |||
| Road & Rail - 0.6% | |||
| Autohellas SA | 51,600 | 456,837 | |
| CSX Corp. | 990,600 | 99,178,872 | |
| Daqin Railway Co. Ltd. (A Shares) | 2,952,141 | 3,174,619 | |
| Knight-Swift Transportation Holdings, Inc. Class A | 680,174 | 32,464,705 | |
| Landstar System, Inc. | 131,420 | 22,407,110 | |
| Lyft, Inc. (a) | 651,483 | 37,193,164 | |
| Meitetsu Transport Co. Ltd. | 32,200 | 709,053 | |
| NANSO Transport Co. Ltd. | 90,000 | 918,166 | |
| Nikkon Holdings Co. Ltd. | 150,000 | 3,192,072 | |
| Old Dominion Freight Lines, Inc. | 313,400 | 83,192,030 | |
| Patriot Transportation Holding, Inc. | 5,000 | 55,550 | |
| Ryder System, Inc. | 183,064 | 14,972,805 | |
| Sakai Moving Service Co. Ltd. | 10,000 | 509,636 | |
| Schneider National, Inc. Class B | 1,033,600 | 25,312,864 | |
| STEF-TFE Group | 85,258 | 9,456,177 | |
| Tohbu Network Co. Ltd. | 42,500 | 374,189 | |
| Uber Technologies, Inc. (a) | 129,072 | 6,560,730 | |
| Utoc Corp. | 136,300 | 621,186 | |
| 340,749,765 | |||
| Trading Companies & Distributors - 0.2% | |||
| AerCap Holdings NV (a) | 50,000 | 2,950,000 | |
| Air Lease Corp. Class A | 1,056,400 | 49,714,184 | |
| Alconix Corp. | 2,500 | 34,958 | |
| Beijer Ref AB (B Shares) | 86,700 | 1,502,933 | |
| Canox Corp. | 81,539 | 681,416 | |
| Daiichi Jitsugyo Co. Ltd. | 5,900 | 230,633 | |
| Green Cross Co. Ltd. | 81,100 | 711,819 | |
| Howden Joinery Group PLC | 26,900 | 304,588 | |
| Itochu Corp. | 1,850,200 | 54,902,729 | |
| Kamei Corp. | 300,000 | 3,159,193 | |
| Mitani Shoji Co. Ltd. | 56,600 | 3,572,069 | |
| Mitsubishi Corp. | 400,000 | 10,901,452 | |
| Narasaki Sangyo Co. Ltd. | 25,000 | 486,117 | |
| Nishikawa Keisoku Co. Ltd. | 15,000 | 643,894 | |
| Rasa Corp. | 25,000 | 209,608 | |
| Sam Yung Trading Co. Ltd. | 7,856 | 118,007 | |
| Shinsho Corp. | 274,300 | 5,827,215 | |
| Totech Corp. | 50,000 | 1,267,696 | |
| Triton International Ltd. | 5,000 | 271,250 | |
| 137,489,761 | |||
| Transportation Infrastructure - 0.0% | |||
| Isewan Terminal Service Co. Ltd. | 200,400 | 1,295,855 | |
| Meiko Transportation Co. Ltd. | 25,000 | 269,659 | |
| Qingdao Port International Co. Ltd. (H Shares) (c) | 4,884,814 | 2,806,985 | |
| 4,372,499 | |||
| TOTAL INDUSTRIALS | 3,604,569,082 | ||
| INFORMATION TECHNOLOGY - 7.9% | |||
| Communications Equipment - 0.2% | |||
| Cisco Systems, Inc. | 2,180,600 | 115,353,740 | |
| Juniper Networks, Inc. | 50,000 | 1,316,500 | |
| 116,670,240 | |||
| Electronic Equipment & Components - 0.7% | |||
| Ai Holdings Corp. | 5,000 | 99,004 | |
| Avnet, Inc. | 747,300 | 32,926,038 | |
| CDW Corp. | 42,800 | 7,079,976 | |
| Cognex Corp. | 276,100 | 21,919,579 | |
| Corning, Inc. | 133,300 | 5,815,879 | |
| Daido Signal Co. Ltd. | 155,000 | 931,501 | |
| Daiwabo Holdings Co. Ltd. | 200,000 | 3,121,746 | |
| Elematec Corp. | 177,000 | 1,985,168 | |
| Flex Ltd. (a) | 2,855,893 | 52,177,165 | |
| FLEXium Interconnect, Inc. | 101,316 | 437,356 | |
| Hagiwara Electric Holdings Co. Ltd. | 60,080 | 1,315,845 | |
| Hon Hai Precision Industry Co. Ltd. (Foxconn) | 3,224,000 | 13,273,987 | |
| Insight Enterprises, Inc. (a) | 77,048 | 8,049,975 | |
| Jabil, Inc. | 1,922,897 | 108,547,536 | |
| Kingboard Chemical Holdings Ltd. | 1,500,000 | 7,981,756 | |
| Kitron ASA | 250,000 | 656,898 | |
| Makus, Inc. (g) | 1,300,684 | 8,085,051 | |
| Methode Electronics, Inc. Class A | 150,000 | 7,257,000 | |
| New Cosmos Electric Co. Ltd. | 20,000 | 405,882 | |
| PAX Global Technology Ltd. | 9,000,000 | 11,236,303 | |
| Redington India Ltd. (a) | 517,144 | 1,872,653 | |
| Riken Kieki Co. Ltd. | 110,000 | 2,767,833 | |
| ScanSource, Inc. (a) | 119,631 | 3,652,334 | |
| Solid State PLC | 15,000 | 191,795 | |
| TE Connectivity Ltd. | 540,900 | 73,389,312 | |
| Thinking Electronic Industries Co. Ltd. | 400,000 | 2,372,402 | |
| Vontier Corp. | 415,629 | 14,580,265 | |
| 392,130,239 | |||
| IT Services - 1.7% | |||
| Amadeus IT Holding SA Class A (a) | 224,200 | 16,926,822 | |
| Amdocs Ltd. | 672,700 | 52,537,870 | |
| Asahi Intelligence Service Co. | 25,000 | 279,934 | |
| Avant Corp. | 300,000 | 4,112,704 | |
| Capgemini SA | 255,500 | 47,693,687 | |
| Cielo SA | 625,000 | 502,176 | |
| Cognizant Technology Solutions Corp. Class A | 953,500 | 68,232,460 | |
| CSE Global Ltd. | 1,349,925 | 551,699 | |
| Data Applications Co. Ltd. | 20,000 | 285,323 | |
| DTS Corp. | 175,000 | 4,064,526 | |
| E-Credible Co. Ltd. | 127,100 | 2,505,467 | |
| Edenred SA | 307,459 | 16,719,663 | |
| Edenred SA rights (a)(b)(e) | 307,459 | 281,982 | |
| Enea Data AB (a) | 67,600 | 1,830,741 | |
| FDM Group Holdings PLC | 5,000 | 70,609 | |
| Fidelity National Information Services, Inc. | 415,428 | 61,890,463 | |
| Fiserv, Inc. (a) | 55,500 | 6,393,600 | |
| Future Corp. | 35,000 | 647,319 | |
| Gartner, Inc. (a) | 163,500 | 37,905,840 | |
| Genpact Ltd. | 479,601 | 21,936,950 | |
| Global Payments, Inc. | 88,432 | 17,130,163 | |
| GoDaddy, Inc. (a) | 540,704 | 43,775,396 | |
| Hexaware Technologies Ltd. | 100,000 | 655,005 | |
| IBM Corp. | 58,082 | 8,348,707 | |
| IFIS Japan Ltd. | 30,000 | 197,004 | |
| Information Planning Co. Ltd. | 5,000 | 128,916 | |
| Kgmobilians Co. Ltd. | 5,000 | 46,688 | |
| Korea Information & Communication Co. Ltd. (a) | 250,407 | 2,060,312 | |
| Liveramp Holdings, Inc. (a) | 114,200 | 5,737,408 | |
| MasterCard, Inc. Class A | 557,386 | 200,982,244 | |
| MongoDB, Inc. Class A (a) | 113,700 | 33,193,578 | |
| Nice Information & Telecom, Inc. | 6,500 | 209,057 | |
| PayPal Holdings, Inc. (a) | 367,238 | 95,489,225 | |
| Sabre Corp. (a) | 572,000 | 7,922,200 | |
| Snowflake Computing, Inc. | 6,000 | 1,428,180 | |
| Sysage Technology Co. Ltd. | 50,000 | 75,634 | |
| TDC Soft, Inc. | 200,000 | 1,859,531 | |
| Tech Mahindra Ltd. | 50,000 | 704,406 | |
| Techmatrix Corp. | 1,000 | 15,892 | |
| Tessi SA | 107 | 16,094 | |
| Twilio, Inc. Class A (a) | 7,700 | 2,587,200 | |
| ULS Group, Inc. | 25,000 | 940,725 | |
| Unisys Corp. (a) | 547,300 | 14,071,083 | |
| Visa, Inc. Class A | 1,006,001 | 228,664,027 | |
| WEX, Inc. (a) | 104,900 | 20,550,959 | |
| Wix.com Ltd. (a) | 48,200 | 12,525,252 | |
| 1,044,684,721 | |||
| Semiconductors & Semiconductor Equipment - 1.2% | |||
| Advanced Micro Devices, Inc. (a) | 52,695 | 4,219,816 | |
| Analog Devices, Inc. (b) | 60,726 | 9,995,500 | |
| Applied Materials, Inc. | 430,418 | 59,453,638 | |
| Cirrus Logic, Inc. (a) | 284,595 | 22,218,332 | |
| eMemory Technology, Inc. | 99,000 | 3,382,958 | |
| Intel Corp. | 569,700 | 32,541,264 | |
| Lam Research Corp. | 74,400 | 48,348,840 | |
| Marvell Technology, Inc. | 722,811 | 34,911,771 | |
| Micron Technology, Inc. (a) | 701,950 | 59,062,073 | |
| Miraial Co. Ltd. | 51,000 | 629,290 | |
| NVIDIA Corp. | 201,509 | 130,936,518 | |
| NXP Semiconductors NV | 504,342 | 106,627,986 | |
| ON Semiconductor Corp. (a) | 1,185,811 | 47,479,872 | |
| Phison Electronics Corp. | 300,000 | 5,310,698 | |
| Qualcomm, Inc. | 1,024,766 | 137,872,018 | |
| Semtech Corp. (a) | 71,400 | 4,498,200 | |
| SiTime Corp. (a) | 40,600 | 3,992,198 | |
| Sitronix Technology Corp. | 100,000 | 1,046,541 | |
| SolarEdge Technologies, Inc. (a) | 81,600 | 21,053,616 | |
| Systems Technology, Inc. | 100,000 | 1,682,560 | |
| Topco Scientific Co. Ltd. | 341,000 | 1,632,822 | |
| Universal Display Corp. | 5,900 | 1,273,574 | |
| Xilinx, Inc. | 62,071 | 7,883,017 | |
| 746,053,102 | |||
| Software - 2.9% | |||
| Adobe, Inc. (a) | 2,800 | 1,412,824 | |
| Anaplan, Inc. (a) | 972,300 | 50,083,173 | |
| Asiainfo Technologies Ltd. (c) | 400,000 | 660,701 | |
| Autodesk, Inc. (a) | 217,528 | 62,182,554 | |
| Blackbaud, Inc. (a) | 374,133 | 26,447,462 | |
| CENIT AG | 20,000 | 343,621 | |
| Ceridian HCM Holding, Inc. (a) | 505,300 | 45,204,138 | |
| Cloudflare, Inc. (a) | 16,900 | 1,386,814 | |
| Cognyte Software Ltd. (a) | 636,419 | 16,381,425 | |
| Cresco Ltd. | 350,000 | 5,367,157 | |
| Cyient Ltd. | 1,250,000 | 14,200,687 | |
| Digital Turbine, Inc. (a) | 124,700 | 8,251,399 | |
| Dynatrace, Inc. (a) | 167,202 | 8,651,031 | |
| Elastic NV (a) | 407,086 | 48,121,636 | |
| Encourage Technologies Co. Ltd. | 25,000 | 145,447 | |
| Envestnet, Inc. (a) | 100 | 7,197 | |
| Everbridge, Inc. (a) | 18,500 | 2,173,750 | |
| HubSpot, Inc. (a) | 45,500 | 22,949,290 | |
| Intuit, Inc. | 26,700 | 11,723,703 | |
| Microsoft Corp. | 3,639,167 | 908,627,217 | |
| NortonLifeLock, Inc. | 2,827,683 | 78,213,712 | |
| Nucleus Software Exports Ltd. (a) | 16,048 | 134,404 | |
| Proofpoint, Inc. (a) | 326,520 | 56,425,921 | |
| PTC, Inc. (a) | 385,843 | 51,756,980 | |
| Salesforce.com, Inc. (a) | 331,270 | 78,875,387 | |
| SAP SE sponsored ADR | 412,191 | 57,677,887 | |
| Scala, Inc. | 25,000 | 182,893 | |
| ServiceNow, Inc. (a) | 20,300 | 9,619,764 | |
| Sinosoft Tech Group Ltd. | 23,000,000 | 4,622,848 | |
| SVMK, Inc. (a) | 2,039,453 | 39,667,361 | |
| System Information Co. Ltd. | 75,000 | 625,400 | |
| System Research Co. Ltd. | 175,000 | 3,286,145 | |
| Tenable Holdings, Inc. (a) | 721,378 | 30,153,600 | |
| Toho System Science Co. Ltd. | 12,100 | 102,224 | |
| Verint Systems, Inc. (a) | 217,700 | 10,038,147 | |
| Workday, Inc. Class A (a) | 127,423 | 29,144,189 | |
| Workiva, Inc. (a) | 186,200 | 17,670,380 | |
| Yext, Inc. (a) | 1,371,788 | 19,849,772 | |
| Zendesk, Inc. (a) | 69,667 | 9,520,692 | |
| Zensar Technologies Ltd. | 25,000 | 98,527 | |
| 1,731,987,459 | |||
| Technology Hardware, Storage & Peripherals - 1.2% | |||
| ABKO Co. Ltd. (a) | 1,000 | 20,434 | |
| Apple, Inc. | 4,560,266 | 568,254,746 | |
| Dell Technologies, Inc. (a) | 75,000 | 7,398,000 | |
| Elecom Co. Ltd. | 105,000 | 2,002,375 | |
| HP, Inc. | 1,143,698 | 33,430,293 | |
| MCJ Co. Ltd. | 1,750,000 | 17,693,397 | |
| NetApp, Inc. | 100,000 | 7,737,000 | |
| Samsung Electronics Co. Ltd. | 101,720 | 7,387,440 | |
| Seagate Technology Holdings PLC | 110,000 | 10,532,500 | |
| TSC Auto ID Technology Corp. | 172,000 | 1,332,100 | |
| Western Digital Corp. (a) | 404,821 | 30,454,684 | |
| 686,242,969 | |||
| TOTAL INFORMATION TECHNOLOGY | 4,717,768,730 | ||
| MATERIALS - 1.6% | |||
| Chemicals - 0.5% | |||
| Amyris, Inc. (a)(b) | 52,361 | 745,097 | |
| Balchem Corp. | 79,100 | 10,362,100 | |
| C. Uyemura & Co. Ltd. | 75,000 | 5,952,598 | |
| Cabot Corp. | 10,000 | 635,800 | |
| CF Industries Holdings, Inc. | 30,000 | 1,595,100 | |
| Ciner Resources LP | 25,000 | 318,750 | |
| DuPont de Nemours, Inc. | 1,152,681 | 97,505,286 | |
| EcoGreen International Group Ltd. | 300,000 | 76,532 | |
| Element Solutions, Inc. | 1,167,900 | 27,317,181 | |
| Innospec, Inc. | 150,411 | 15,208,056 | |
| International Flavors & Fragrances, Inc. | 242,021 | 34,287,115 | |
| Isamu Paint Co. Ltd. | 5,000 | 152,982 | |
| K+S AG | 200,000 | 2,775,870 | |
| Kaneka Corp. | 10,000 | 407,800 | |
| KPX Holdings Corp. | 7,154 | 465,991 | |
| Linde PLC | 136,600 | 41,061,960 | |
| Livent Corp. (a) | 64,700 | 1,262,297 | |
| NOF Corp. | 21,600 | 1,118,568 | |
| Olin Corp. | 1,038,000 | 50,747,820 | |
| PPG Industries, Inc. | 55,748 | 10,019,031 | |
| Scientex Bhd | 1,771,200 | 1,769,268 | |
| Scientex Bhd warrants 1/14/26 (a) | 118,080 | 34,927 | |
| SK Kaken Co. Ltd. | 5,000 | 1,817,517 | |
| Toho Acetylene Co. Ltd. | 125,000 | 1,372,271 | |
| Tokuyama Corp. | 14,280 | 299,190 | |
| Yara International ASA | 50,300 | 2,693,563 | |
| Yip's Chemical Holdings Ltd. | 450,000 | 251,628 | |
| 310,254,298 | |||
| Construction Materials - 0.2% | |||
| Kunimine Industries Co. Ltd. | 5,000 | 53,338 | |
| Mitani Sekisan Co. Ltd. | 16,400 | 595,397 | |
| Summit Materials, Inc. (a) | 2,402,400 | 83,651,568 | |
| The Vicat Group | 2,000 | 106,021 | |
| Vertex Corp. | 20,000 | 526,441 | |
| Vulcan Materials Co. | 224,700 | 41,192,004 | |
| 126,124,769 | |||
| Containers & Packaging - 0.1% | |||
| Crown Holdings, Inc. | 454,530 | 46,925,677 | |
| Mayr-Melnhof Karton AG | 11,200 | 2,251,609 | |
| Silgan Holdings, Inc. | 18,100 | 762,553 | |
| Vidrala SA | 5,000 | 575,962 | |
| 50,515,801 | |||
| Metals & Mining - 0.8% | |||
| ArcelorMittal SA Class A unit (a)(b) | 101,800 | 3,317,662 | |
| BHP Group Ltd. sponsored ADR (b) | 458,270 | 33,962,390 | |
| Chubu Steel Plate Co. Ltd. | 169,800 | 1,256,170 | |
| CI Resources Ltd. | 136,202 | 107,515 | |
| CK-SAN-ETSU Co. Ltd. | 55,000 | 1,813,408 | |
| Commercial Metals Co. | 956,100 | 30,088,467 | |
| Compania de Minas Buenaventura SA sponsored ADR (a) | 168,400 | 1,939,968 | |
| First Quantum Minerals Ltd. | 529,300 | 13,024,201 | |
| Freeport-McMoRan, Inc. | 3,460,944 | 147,851,528 | |
| Fresnillo PLC | 10,000 | 127,522 | |
| Labrador Iron Ore Royalty Corp. | 4,700 | 176,902 | |
| Lundin Mining Corp. | 4,379,100 | 46,548,345 | |
| Mount Gibson Iron Ltd. | 21,500,000 | 14,309,411 | |
| Newmont Corp. | 1,749,300 | 128,538,564 | |
| Pacific Metals Co. Ltd. (b) | 58,300 | 1,034,054 | |
| Perenti Global Ltd. | 2,708,411 | 1,404,346 | |
| Rio Tinto PLC sponsored ADR (b) | 15,000 | 1,311,450 | |
| Sandfire Resources NL | 400,000 | 2,197,876 | |
| St Barbara Ltd. | 681,138 | 1,004,188 | |
| Teck Resources Ltd. Class B (sub. vtg.) | 225,000 | 5,473,074 | |
| Yamato Kogyo Co. Ltd. | 10,000 | 326,971 | |
| 435,814,012 | |||
| Paper & Forest Products - 0.0% | |||
| Louisiana-Pacific Corp. | 165,300 | 11,109,813 | |
| TOTAL MATERIALS | 933,818,693 | ||
| REAL ESTATE - 1.4% | |||
| Equity Real Estate Investment Trusts (REITs) - 1.0% | |||
| Alexandria Real Estate Equities, Inc. | 67,200 | 11,979,072 | |
| American Tower Corp. | 477,699 | 122,032,987 | |
| CoreSite Realty Corp. | 309,642 | 37,544,093 | |
| Corporate Office Properties Trust (SBI) | 85,800 | 2,368,080 | |
| CubeSmart | 376,800 | 16,500,072 | |
| CyrusOne, Inc. | 416,000 | 30,680,000 | |
| Digital Realty Trust, Inc. | 102,100 | 15,474,276 | |
| Douglas Emmett, Inc. | 120,600 | 4,187,232 | |
| Equinix, Inc. | 13,795 | 10,163,052 | |
| Equity Lifestyle Properties, Inc. | 254,000 | 17,998,440 | |
| Invitation Homes, Inc. | 511,400 | 18,548,478 | |
| Kilroy Realty Corp. | 115,800 | 8,130,318 | |
| Lexington Corporate Properties Trust | 3,446,300 | 42,665,194 | |
| Mid-America Apartment Communities, Inc. | 126,400 | 20,312,480 | |
| Outfront Media, Inc. (a) | 1,137,040 | 27,220,738 | |
| Plymouth Industrial REIT, Inc. | 1,181,200 | 22,608,168 | |
| Potlatch Corp. | 271,800 | 16,362,360 | |
| Prologis (REIT), Inc. | 273,200 | 32,193,888 | |
| SBA Communications Corp. Class A | 32,000 | 9,539,840 | |
| Simon Property Group, Inc. | 555,394 | 71,362,575 | |
| Uniti Group, Inc. | 1,750,800 | 19,013,688 | |
| Ventas, Inc. | 155,000 | 8,594,750 | |
| VICI Properties, Inc. | 87,900 | 2,736,327 | |
| Weyerhaeuser Co. | 96,200 | 3,651,752 | |
| 571,867,860 | |||
| Real Estate Management & Development - 0.4% | |||
| Arealink Co. Ltd. | 100,000 | 1,285,962 | |
| CBRE Group, Inc. (a) | 1,375,000 | 120,697,500 | |
| Cushman & Wakefield PLC (a) | 1,908,400 | 36,278,684 | |
| Howard Hughes Corp. (a) | 323,700 | 34,257,171 | |
| Jones Lang LaSalle, Inc. (a) | 43,900 | 8,878,775 | |
| Newmark Group, Inc. | 2,588,600 | 33,392,940 | |
| Nihon Housing Co. Ltd. | 11,500 | 403,325 | |
| Nisshin Group Holdings Co. | 64,700 | 273,006 | |
| Sun Frontier Fudousan Co. Ltd. | 50,000 | 421,043 | |
| 235,888,406 | |||
| TOTAL REAL ESTATE | 807,756,266 | ||
| UTILITIES - 1.5% | |||
| Electric Utilities - 1.0% | |||
| American Electric Power Co., Inc. | 140,600 | 12,091,600 | |
| Companhia Paranaense de Energia-COPEL unit (a) | 81,200 | 483,199 | |
| Duke Energy Corp. | 674,600 | 67,608,412 | |
| Edison International | 257,500 | 14,386,525 | |
| Entergy Corp. | 141,200 | 14,862,712 | |
| Evergy, Inc. | 1,112,564 | 68,967,842 | |
| Exelon Corp. | 2,001,566 | 90,310,658 | |
| FirstEnergy Corp. | 382,900 | 14,515,739 | |
| Fjordkraft Holding ASA (c) | 1,000 | 6,650 | |
| NextEra Energy, Inc. | 452,200 | 33,110,084 | |
| NRG Energy, Inc. | 14,500 | 466,175 | |
| PG&E Corp. (a) | 7,750,346 | 78,588,508 | |
| Portland General Electric Co. | 699,300 | 33,524,442 | |
| PPL Corp. | 2,734,300 | 79,595,473 | |
| Southern Co. | 1,863,466 | 119,112,747 | |
| 627,630,766 | |||
| Gas Utilities - 0.1% | |||
| Busan City Gas Co. Ltd. | 60,816 | 3,401,741 | |
| China Resource Gas Group Ltd. | 764,000 | 4,769,186 | |
| Enagas SA | 56,000 | 1,316,520 | |
| Hokuriku Gas Co. | 6,200 | 177,240 | |
| Keiyo Gas Co. Ltd. | 3,000 | 87,816 | |
| Seoul City Gas Co. Ltd. | 13,199 | 1,518,249 | |
| South Jersey Industries, Inc. | 1,163,400 | 31,016,244 | |
| YESCO Co. Ltd. | 25,028 | 872,705 | |
| 43,159,701 | |||
| Independent Power and Renewable Electricity Producers - 0.1% | |||
| Brookfield Renewable Corp. (b) | 379,400 | 16,207,968 | |
| FTC Solar, Inc. (a) | 200,300 | 2,155,228 | |
| NextEra Energy Partners LP (b) | 12,798 | 874,999 | |
| Sunnova Energy International, Inc. (a) | 394,500 | 11,519,400 | |
| The AES Corp. | 554,900 | 14,100,009 | |
| 44,857,604 | |||
| Multi-Utilities - 0.3% | |||
| CenterPoint Energy, Inc. | 721,144 | 18,244,943 | |
| Dominion Energy, Inc. | 1,411,417 | 107,465,290 | |
| MDU Resources Group, Inc. | 978,100 | 32,922,846 | |
| NiSource, Inc. | 337,500 | 8,606,250 | |
| Sempra Energy | 168,900 | 22,884,261 | |
| 190,123,590 | |||
| TOTAL UTILITIES | 905,771,661 | ||
| TOTAL COMMON STOCKS | |||
| (Cost $19,975,592,037) | 27,684,125,182 | ||
| Nonconvertible Preferred Stocks - 0.2% | |||
| CONSUMER DISCRETIONARY - 0.0% | |||
| Automobiles - 0.0% | |||
| Porsche Automobil Holding SE (Germany) | 180,000 | 20,360,452 | |
| INDUSTRIALS - 0.0% | |||
| Aerospace & Defense - 0.0% | |||
| Embraer SA sponsored ADR (a) | 534,300 | 7,154,277 | |
| INFORMATION TECHNOLOGY - 0.2% | |||
| Technology Hardware, Storage & Peripherals - 0.2% | |||
| Samsung Electronics Co. Ltd. | 1,512,580 | 99,616,882 | |
| TOTAL NONCONVERTIBLE PREFERRED STOCKS | |||
| (Cost $86,448,768) | 127,131,611 | ||
| Equity Funds - 52.9% | |||
| Large Blend Funds - 5.6% | |||
| Fidelity SAI U.S. Large Cap Index Fund (h) | 57,847,722 | 1,279,013,129 | |
| Fidelity SAI U.S. Low Volatility Index Fund (h) | 118,507,177 | 2,108,242,671 | |
| TOTAL LARGE BLEND FUNDS | 3,387,255,800 | ||
| Large Growth Funds - 33.1% | |||
| Fidelity Contrafund (h) | 186,147,090 | 3,354,370,561 | |
| Fidelity Growth Company Fund (h) | 161,453,607 | 5,718,686,749 | |
| Fidelity Magellan Fund (h) | 210,661,747 | 2,787,054,916 | |
| Fidelity SAI U.S. Momentum Index Fund (h) | 85,634,848 | 1,526,869,335 | |
| Fidelity SAI U.S. Quality Index Fund (h) | 368,870,171 | 6,488,426,308 | |
| TOTAL LARGE GROWTH FUNDS | 19,875,407,869 | ||
| Large Value Funds - 9.2% | |||
| Fidelity Large Cap Value Enhanced Index Fund (h) | 183,630,797 | 3,116,214,629 | |
| Fidelity SAI U.S. Value Index Fund (h) | 194,890,747 | 2,410,798,537 | |
| TOTAL LARGE VALUE FUNDS | 5,527,013,166 | ||
| Small Blend Funds - 4.1% | |||
| Fidelity Small Cap Discovery Fund (h) | 15,423,084 | 466,394,048 | |
| Fidelity Small Cap Index Fund (h) | 69,676,481 | 2,007,379,429 | |
| TOTAL SMALL BLEND FUNDS | 2,473,773,477 | ||
| Small Growth Funds - 0.9% | |||
| Fidelity Small Cap Growth Fund (h) | 15,196,795 | 546,324,788 | |
| TOTAL EQUITY FUNDS | |||
| (Cost $24,030,840,438) | 31,809,775,100 | ||
| Other - 0.0% | |||
| Commodity Funds - Broad Basket - 0.0% | |||
| Fidelity SAI Inflation-Focused Fund (h) | |||
| (Cost $6,768,588) | 858,825 | 10,795,429 | |
| Money Market Funds - 1.1% | |||
| Fidelity Cash Central Fund 0.03% (i) | 469,554,168 | 469,648,079 | |
| Fidelity Securities Lending Cash Central Fund 0.03% (i)(j) | 173,666,012 | 173,683,379 | |
| TOTAL MONEY MARKET FUNDS | |||
| (Cost $643,327,696) | 643,331,458 | ||
| TOTAL INVESTMENT IN SECURITIES - 100.3% | |||
| (Cost $44,742,977,527) | 60,275,158,780 | ||
| NET OTHER ASSETS (LIABILITIES) - (0.3)% | (161,412,207) | ||
| NET ASSETS - 100% | $60,113,746,573 |
Legend
(a) Non-income producing
(b) Security or a portion of the security is on loan at period end.
(c) Security exempt from registration under Rule 144A of the Securities Act of 1933. These securities may be resold in transactions exempt from registration, normally to qualified institutional buyers. At the end of the period, the value of these securities amounted to $51,003,261 or 0.1% of net assets.
(d) Level 3 security
(e) Security or a portion of the security purchased on a delayed delivery or when-issued basis.
(f) Restricted securities (including private placements) - Investment in securities not registered under the Securities Act of 1933 (excluding 144A issues). At the end of the period, the value of restricted securities (excluding 144A issues) amounted to $14,892,000 or 0.0% of net assets.
(g) Affiliated company
(h) Affiliated Fund
(i) Affiliated fund that is generally available only to investment companies and other accounts managed by Fidelity Investments. The rate quoted is the annualized seven-day yield of the fund at period end. A complete unaudited listing of the fund's holdings as of its most recent quarter end is available upon request. In addition, each Fidelity Central Fund's financial statements, which are not covered by the Fund's Report of Independent Registered Public Accounting Firm, are available on the SEC's website or upon request.
(j) Investment made with cash collateral received from securities on loan.
Additional information on each restricted holding is as follows:
| Security | Acquisition Date | Acquisition Cost |
| Vertiv Holdings LLC | 2/6/20 | $6,000,000 |
Affiliated Central Funds
Information regarding fiscal year to date income earned by the Fund from investments in Fidelity Central Funds is as follows:
| Fund | Income earned |
| Fidelity Cash Central Fund | $289,751 |
| Fidelity Securities Lending Cash Central Fund | 1,872,071 |
| Total | $2,161,822 |
Amounts in the income column in the above table include any capital gain distributions from underlying funds, which are presented in the corresponding line-item in the Statement of Operations, if applicable. Amount for Fidelity Securities Lending Cash Central Fund represents the income earned on investing cash collateral, less rebates paid to borrowers and any lending agent fees associated with the loan, plus any premium payments received for lending certain types of securities.
Affiliated Underlying Funds
Fiscal year to date information regarding the Fund's investments in affiliated Underlying Funds, excluding any Money Market Central Funds, is presented below. Exchanges between classes of the same affiliated Underlying Funds may occur.
| Affiliate | Value, beginning of period | Purchases | Sales Proceeds | Dividend Income | Realized Gain (loss) | Change in Unrealized appreciation (depreciation) | Value, end of period |
| Fidelity Contrafund | $2,344,964,212 | $627,773,587 | $243,690,171 | $250,215,184 | $58,353,191 | $566,969,742 | $3,354,370,561 |
| Fidelity Growth Company Fund | 3,188,414,591 | 1,127,671,272 | 78,000,000 | 381,671,273 | 11,514,890 | 1,469,085,996 | 5,718,686,749 |
| Fidelity Large Cap Value Enhanced Index Fund | 1,962,505,180 | 192,077,588 | -- | 42,077,589 | -- | 961,631,861 | 3,116,214,629 |
| Fidelity Magellan Fund | 1,734,440,075 | 696,575,902 | 62,000,000 | 134,075,901 | 6,267,862 | 411,771,077 | 2,787,054,916 |
| Fidelity SAI Inflation-Focused Fund | 7,015,345 | 268,588 | -- | 268,588 | -- | 3,511,496 | 10,795,429 |
| Fidelity SAI U.S. Large Cap Index Fund | 2,085,384,411 | 8,742,645,094 | 10,433,110,643 | 78,542,160 | 718,010,960 | 166,083,307 | 1,279,013,129 |
| Fidelity SAI U.S. Low Volatility Index Fund | 615,258,296 | 1,261,100,258 | -- | 16,449,718 | -- | 231,884,117 | 2,108,242,671 |
| Fidelity SAI U.S. Momentum Index Fund | 654,081,230 | 779,689,510 | 120,000,000 | 89,689,510 | (5,963,340) | 219,061,935 | 1,526,869,335 |
| Fidelity SAI U.S. Quality Index Fund | 3,701,607,976 | 1,939,727,917 | -- | 436,976,744 | -- | 847,090,415 | 6,488,426,308 |
| Fidelity SAI U.S. Value Index Fund | 1,201,926,152 | 594,431,110 | -- | 41,931,109 | -- | 614,441,275 | 2,410,798,537 |
| Fidelity Small Cap Discovery Fund | 183,429,936 | 120,082,015 | -- | 10,082,016 | -- | 162,882,097 | 466,394,048 |
| Fidelity Small Cap Growth Fund | 173,905,565 | 286,750,566 | -- | 26,750,566 | -- | 85,668,657 | 546,324,788 |
| Fidelity Small Cap Index Fund | 962,441,329 | 431,398,609 | 150,000,000 | 16,398,610 | 36,946,621 | 726,592,870 | 2,007,379,429 |
| Total | $18,815,374,298 | $16,800,192,016 | $11,086,800,814 | $1,525,128,968 | $825,130,184 | $6,466,674,845 | $31,820,570,529 |
Amounts in the income column in the above table include any capital gain distributions from underlying funds, which are presented in the corresponding line-item in the Statement of Operations, if applicable.
Other Affiliated Issuers
An affiliated company is a company in which the Fund has ownership of at least 5% of the voting securities. Fiscal year to date transactions with companies which are or were affiliates are as follows:
| Affiliate | Value, beginning of period | Purchases | Sales Proceeds | Dividend Income | Realized Gain (loss) | Change in Unrealized appreciation (depreciation) | Value, end of period |
| Makus, Inc. | $1,881,048 | $2,455,713 | $-- | $99,410 | $-- | $3,748,290 | $8,085,051 |
| Total | $1,881,048 | $2,455,713 | $-- | $99,410 | $-- | $3,748,290 | $8,085,051 |
Investment Valuation
The following is a summary of the inputs used, as of May 31, 2021, involving the Fund's assets and liabilities carried at fair value. The inputs or methodology used for valuing securities may not be an indication of the risk associated with investing in those securities. For more information on valuation inputs, and their aggregation into the levels used below, please refer to the Investment Valuation section in the accompanying Notes to Financial Statements.
| Valuation Inputs at Reporting Date: | ||||
| Description | Total | Level 1 | Level 2 | Level 3 |
| Investments in Securities: | ||||
| Equities: | ||||
| Communication Services | $2,414,784,911 | $2,379,066,813 | $35,718,098 | $-- |
| Consumer Discretionary | 2,868,614,685 | 2,868,614,685 | -- | -- |
| Consumer Staples | 1,630,724,867 | 1,582,777,142 | 47,947,725 | -- |
| Energy | 1,162,446,449 | 1,162,380,981 | -- | 65,468 |
| Financials | 4,548,277,269 | 4,548,007,266 | 270,003 | -- |
| Health Care | 4,109,953,021 | 4,075,723,586 | 34,229,435 | -- |
| Industrials | 3,611,723,359 | 3,600,824,273 | 10,899,086 | -- |
| Information Technology | 4,817,385,612 | 4,817,103,630 | 281,982 | -- |
| Materials | 933,818,693 | 933,818,693 | -- | -- |
| Real Estate | 807,756,266 | 807,756,266 | -- | -- |
| Utilities | 905,771,661 | 905,771,661 | -- | -- |
| Equity Funds | 31,809,775,100 | 31,809,775,100 | -- | -- |
| Other | 10,795,429 | 10,795,429 | -- | -- |
| Money Market Funds | 643,331,458 | 643,331,458 | -- | -- |
| Total Investments in Securities: | $60,275,158,780 | $60,145,746,983 | $129,346,329 | $65,468 |
| Net unrealized appreciation on unfunded commitments | $1,801,679 | $-- | $1,801,679 | $-- |
See accompanying notes which are an integral part of the financial statements.
Financial Statements
Statement of Assets and Liabilities
| May 31, 2021 | ||
| Assets | ||
| Investment in securities, at value (including securities loaned of $169,933,959) — See accompanying schedule: Unaffiliated issuers (cost $20,056,894,222) | $27,803,171,742 | |
| Fidelity Central Funds (cost $643,327,696) | 643,331,458 | |
| Other affiliated issuers (cost $24,042,755,609) | 31,828,655,580 | |
| Total Investment in Securities (cost $44,742,977,527) | $60,275,158,780 | |
| Cash | 2,313,947 | |
| Foreign currency held at value (cost $506,684) | 506,848 | |
| Receivable for investments sold | 47,040,681 | |
| Receivable for fund shares sold | 85,044,967 | |
| Dividends receivable | 42,460,563 | |
| Distributions receivable from Fidelity Central Funds | 86,975 | |
| Prepaid expenses | 135,316 | |
| Net unrealized appreciation on unfunded commitments | 2,125,424 | |
| Other receivables | 208,369 | |
| Total assets | 60,455,081,870 | |
| Liabilities | ||
| Payable for investments purchased | ||
| Regular delivery | $140,049,525 | |
| Delayed delivery | 550,451 | |
| Payable for fund shares redeemed | 16,609,939 | |
| Accrued management fee | 6,244,284 | |
| Net unrealized depreciation on unfunded commitments | 323,745 | |
| Other payables and accrued expenses | 3,877,602 | |
| Collateral on securities loaned | 173,679,751 | |
| Total liabilities | 341,335,297 | |
| Net Assets | $60,113,746,573 | |
| Net Assets consist of: | ||
| Paid in capital | $42,319,918,244 | |
| Total accumulated earnings (loss) | 17,793,828,329 | |
| Net Assets | $60,113,746,573 | |
| Net Asset Value, offering price and redemption price per share ($60,113,746,573 ÷ 3,989,258,626 shares) | $15.07 |
See accompanying notes which are an integral part of the financial statements.
Statement of Operations
| Year ended May 31, 2021 | ||
| Investment Income | ||
| Dividends: | ||
| Unaffiliated issuers | $332,185,943 | |
| Affiliated issuers | 238,042,163 | |
| Income from Fidelity Central Funds (including $1,872,071 from security lending) | 2,161,822 | |
| Total income | 572,389,928 | |
| Expenses | ||
| Management fee | $172,432,403 | |
| Custodian fees and expenses | 407,081 | |
| Independent trustees' fees and expenses | 401,493 | |
| Registration fees | 2,852,565 | |
| Audit | 87,301 | |
| Legal | 108,049 | |
| Miscellaneous | 267,378 | |
| Total expenses before reductions | 176,556,270 | |
| Expense reductions | (116,881,834) | |
| Total expenses after reductions | 59,674,436 | |
| Net investment income (loss) | 512,715,492 | |
| Realized and Unrealized Gain (Loss) | ||
| Net realized gain (loss) on: | ||
| Investment securities: | ||
| Unaffiliated issuers (net of foreign taxes of $502) | 1,338,106,984 | |
| Fidelity Central Funds | 1,516 | |
| Other affiliated issuers | 825,130,184 | |
| Foreign currency transactions | (749,097) | |
| Written options | 1,695,828 | |
| Capital gain distributions from underlying funds: | ||
| Affiliated issuers | 1,287,186,215 | |
| Total net realized gain (loss) | 3,451,371,630 | |
| Change in net unrealized appreciation (depreciation) on: | ||
| Investment securities: | ||
| Unaffiliated issuers (net of increase in deferred foreign taxes of $2,548,077) | 6,893,351,633 | |
| Affiliated issuers | 6,470,423,135 | |
| Unfunded commitments | 1,801,679 | |
| Assets and liabilities in foreign currencies | 175,386 | |
| Written options | 178,456 | |
| Total change in net unrealized appreciation (depreciation) | 13,365,930,289 | |
| Net gain (loss) | 16,817,301,919 | |
| Net increase (decrease) in net assets resulting from operations | $17,330,017,411 |
See accompanying notes which are an integral part of the financial statements.
Statement of Changes in Net Assets
| Year ended May 31, 2021 | Year ended May 31, 2020 | |
| Increase (Decrease) in Net Assets | ||
| Operations | ||
| Net investment income (loss) | $512,715,492 | $427,691,671 |
| Net realized gain (loss) | 3,451,371,630 | 210,400,149 |
| Change in net unrealized appreciation (depreciation) | 13,365,930,289 | 2,317,613,529 |
| Net increase (decrease) in net assets resulting from operations | 17,330,017,411 | 2,955,705,349 |
| Distributions to shareholders | (1,284,354,099) | (835,651,420) |
| Share transactions | ||
| Proceeds from sales of shares | 20,227,797,679 | 15,476,810,855 |
| Reinvestment of distributions | 1,253,181,860 | 788,436,934 |
| Cost of shares redeemed | (10,842,890,026) | (7,367,011,490) |
| Net increase (decrease) in net assets resulting from share transactions | 10,638,089,513 | 8,898,236,299 |
| Total increase (decrease) in net assets | 26,683,752,825 | 11,018,290,228 |
| Net Assets | ||
| Beginning of period | 33,429,993,748 | 22,411,703,520 |
| End of period | $60,113,746,573 | $33,429,993,748 |
| Other Information | ||
| Shares | ||
| Sold | 1,563,776,896 | 1,518,664,437 |
| Issued in reinvestment of distributions | 95,299,001 | 71,866,316 |
| Redeemed | (835,812,779) | (730,138,079) |
| Net increase (decrease) | 823,263,118 | 860,392,674 |
See accompanying notes which are an integral part of the financial statements.
Financial Highlights
Strategic Advisers Fidelity U.S. Total Stock Fund
| Years ended May 31, | 2021 | 2020 | 2019 | 2018 A |
| Selected Per–Share Data | ||||
| Net asset value, beginning of period | $10.56 | $9.72 | $9.96 | $10.00 |
| Income from Investment Operations | ||||
| Net investment income (loss)B | .14 | .16 | .18 | .01 |
| Net realized and unrealized gain (loss) | 4.73 | 1.00 | (.20) | (.05) |
| Total from investment operations | 4.87 | 1.16 | (.02) | (.04) |
| Distributions from net investment income | (.18) | (.17) | (.09)C | – |
| Distributions from net realized gain | (.19) | (.16) | (.13)C | – |
| Total distributions | (.36)D | (.32)D | (.22) | – |
| Net asset value, end of period | $15.07 | $10.56 | $9.72 | $9.96 |
| Total ReturnE,F | 46.63% | 11.84% | (.04)% | (.40)% |
| Ratios to Average Net AssetsG,H | ||||
| Expenses before reductions | .38% | .39% | .42% | .54%I |
| Expenses net of fee waivers, if any | .13% | .14% | .17% | .29%I,J |
| Expenses net of all reductions | .13% | .14% | .17% | .29%I,J |
| Net investment income (loss) | 1.11% | 1.55% | 1.81% | .55%I |
| Supplemental Data | ||||
| Net assets, end of period (000 omitted) | $60,113,747 | $33,429,994 | $22,411,704 | $16,637,411 |
| Portfolio turnover rateK | 46% | 52% | 61% | 126%L,M |
A For the period March 20, 2018 (commencement of operations) to May 31, 2018.
B Calculated based on average shares outstanding during the period.
C The amounts shown reflect certain reclassifications related to book to tax differences that were made in the year shown.
D Total distributions per share do not sum due to rounding.
E Total returns for periods of less than one year are not annualized.
F Total returns would have been lower if certain expenses had not been reduced during the applicable periods shown.
G Fees and expenses of any underlying mutual funds or exchange-traded funds (ETFs) are not included in the Fund's expense ratio. The Fund indirectly bears its proportionate share of these expenses. For additional expense information related to investments in Fidelity Central Funds, please refer to the "Investments in Fidelity Central Funds" note found in the Notes to Financial Statements section of the most recent Annual or Semi-Annual report.
H Expense ratios reflect operating expenses of the class. Expenses before reductions do not reflect amounts reimbursed, waived, or reduced through arrangements with the investment advisor, brokerage services, or other offset arrangements, if applicable, and do not represent the amount paid by the class during periods when reimbursements, waivers or reductions occur.
I Annualized
J Audit fees are not annualized.
K Amount does not include the portfolio activity of any underlying mutual funds or exchange-traded funds (ETFs).
L Portfolio turnover rate excludes securities received or delivered in-kind.
M Amount not annualized.
See accompanying notes which are an integral part of the financial statements.
Notes to Financial Statements
For the period ended May 31, 2021
1. Organization.
Strategic Advisers Fidelity U.S. Total Stock Fund (the Fund) is a fund of Fidelity Rutland Square Trust II (the Trust), and is authorized to issue an unlimited number of shares. The Trust is registered under the Investment Company Act of 1940, as amended (the 1940 Act), as an open-end management investment company organized as a Delaware statutory trust. The Fund is offered exclusively to certain managed account clients of Strategic Advisers LLC (Strategic Advisers), an affiliate of Fidelity Management & Research Company LLC (FMR).
2. Significant Accounting Policies.
The Fund is an investment company and applies the accounting and reporting guidance of the Financial Accounting Standards Board (FASB) Accounting Standards Codification Topic 946 Financial Services - Investment Companies. The financial statements have been prepared in conformity with accounting principles generally accepted in the United States of America (GAAP), which require management to make certain estimates and assumptions at the date of the financial statements. Actual results could differ from those estimates. Subsequent events, if any, through the date that the financial statements were issued have been evaluated in the preparation of the financial statements. The Fund's Schedule of Investments lists any underlying mutual funds or exchange-traded funds (ETFs) but does not include the underlying holdings of these funds. The following summarizes the significant accounting policies of the Fund:
Investment Valuation. Investments are valued as of 4:00 p.m. Eastern time on the last calendar day of the period. The Board of Trustees (the Board) has delegated the day to day responsibility for the valuation of the Fund's investments to the Fair Value Committee (the Committee) established by the Fund's investment adviser. In accordance with valuation policies and procedures approved by the Board, the Fund attempts to obtain prices from one or more third party pricing vendors or brokers to value its investments. When current market prices, quotations or currency exchange rates are not readily available or reliable, investments will be fair valued in good faith by the Committee, in accordance with procedures adopted by the Board. Factors used in determining fair value vary by investment type and may include market or investment specific events. The frequency with which these procedures are used cannot be predicted and they may be utilized to a significant extent. The Committee oversees the Fund's valuation policies and procedures and reports to the Board on the Committee's activities and fair value determinations. The Board monitors the appropriateness of the procedures used in valuing the Fund's investments and ratifies the fair value determinations of the Committee.
The Fund categorizes the inputs to valuation techniques used to value its investments into a disclosure hierarchy consisting of three levels as shown below:
- Level 1 – quoted prices in active markets for identical investments
- Level 2 – other significant observable inputs (including quoted prices for similar investments, interest rates, prepayment speeds, etc.)
- Level 3 – unobservable inputs (including the Fund's own assumptions based on the best information available)
Valuation techniques used to value the Fund's investments by major category are as follows:
Equity securities, including restricted securities, for which market quotations are readily available, are valued at the last reported sale price or official closing price as reported by a third party pricing vendor on the primary market or exchange on which they are traded and are categorized as Level 1 in the hierarchy. In the event there were no sales during the day or closing prices are not available, securities are valued at the last quoted bid price or may be valued using the last available price and are generally categorized as Level 2 in the hierarchy. For foreign equity securities, when market or security specific events arise, comparisons to the valuation of American Depositary Receipts (ADRs), futures contracts, Exchange-Traded Funds (ETFs) and certain indexes as well as quoted prices for similar securities may be used and would be categorized as Level 2 in the hierarchy. For equity securities, including restricted securities, where observable inputs are limited, assumptions about market activity and risk are used and these securities may be categorized as Level 3 in the hierarchy.
Investments in open-end mutual funds, including the Fidelity Central Funds, are valued at their closing net asset value (NAV) each business day and are categorized as Level 1 in the hierarchy.
Changes in valuation techniques may result in transfers in or out of an assigned level within the disclosure hierarchy. The aggregate value of investments by input level as of May 31, 2021 is included at the end of the Fund's Schedule of Investments.
Foreign Currency. Certain Funds may use foreign currency contracts to facilitate transactions in foreign-denominated securities. Gains and losses from these transactions may arise from changes in the value of the foreign currency or if the counterparties do not perform under the contracts' terms.
Foreign-denominated assets, including investment securities, and liabilities are translated into U.S. dollars at the exchange rates at period end. Purchases and sales of investment securities, income and dividends received, and expenses denominated in foreign currencies are translated into U.S. dollars at the exchange rate in effect on the transaction date.
The effects of exchange rate fluctuations on investments are included with the net realized and unrealized gain (loss) on investment securities. Other foreign currency transactions resulting in realized and unrealized gain (loss) are disclosed separately.
Investment Transactions and Income. For financial reporting purposes, the Fund's investment holdings and NAV include trades executed through the end of the last business day of the period. The NAV per share for processing shareholder transactions is calculated as of the close of business of the New York Stock Exchange (NYSE), normally 4:00 p.m. Eastern time and includes trades executed through the end of the prior business day. Gains and losses on securities sold are determined on the basis of identified cost. Dividend income is recorded on the ex-dividend date, except for certain dividends from foreign securities where the ex-dividend date may have passed, which are recorded as soon as the Fund is informed of the ex-dividend date. Non-cash dividends included in dividend income, if any, are recorded at the fair market value of the securities received. Income and capital gain distributions from Fidelity Central Funds, if any, are recorded on the ex-dividend date. Income and capital gain distributions from any underlying mutual funds or exchange-traded funds (ETFs) are recorded on the ex-dividend date. Certain distributions received by the Fund represent a return of capital or capital gain. The Fund determines the components of these distributions subsequent to the ex-dividend date, based upon receipt of tax filings or other correspondence relating to the underlying investment. These distributions are recorded as a reduction of cost of investments and/or as a realized gain. Investment income is recorded net of foreign taxes withheld where recovery of such taxes is uncertain.
For the year-ended May 31, 2020, Dividend income presented on the Statement of Operations included capital gain distributions from certain underlying funds totaling $164,390,465 which have been reclassified this year in the Statement of Changes in Net Assets and the Financial Highlights. For the year-ended May 31, 2020, Net investment income (loss) has been reduced by $164,390,465 with a corresponding increase to Net realized gain (loss) in the Statement of Changes in Net Assets. In the Financial Highlights, Net investment income per share has been reduced by $.06 with a corresponding increase to Net realized and unrealized gain (loss) per share, and the Ratio of net investment income (loss) to Average Net Assets changed from 2.14% to 1.55% to reflect the impact of the above reclassification. This misclassification had no impact on the total net assets or total return of the Fund.
Expenses. Expenses directly attributable to a fund are charged to that fund. Expenses attributable to more than one fund are allocated among the respective funds on the basis of relative net assets or other appropriate methods. Expenses included in the accompanying financial statements reflect the expenses of that fund and do not include any expenses associated with any underlying mutual funds or exchange-traded funds. Although not included in a fund's expenses, a fund indirectly bears its proportionate share of these expenses through the net asset value of each underlying mutual fund or exchange-traded fund. Expense estimates are accrued in the period to which they relate and adjustments are made when actual amounts are known.
Deferred Trustee Compensation. Under a Deferred Compensation Plan (the Plan) for certain Funds, certain independent Trustees have elected to defer receipt of a portion of their annual compensation. Deferred amounts are invested in affiliated mutual funds, are marked-to-market and remain in a fund until distributed in accordance with the Plan. The investment of deferred amounts and the offsetting payable to the Trustees presented below are included in the accompanying Statement of Assets and Liabilities in other receivables and other payables and accrued expenses, as applicable.
| Strategic Advisers Fidelity U.S. Total Stock Fund | $22,571 |
Income Tax Information and Distributions to Shareholders. Each year, the Fund intends to qualify as a regulated investment company under Subchapter M of the Internal Revenue Code, including distributing substantially all of its taxable income and realized gains. As a result, no provision for U.S. Federal income taxes is required. As of May 31, 2021, the Fund did not have any unrecognized tax benefits in the financial statements; nor is the Fund aware of any tax positions for which it is reasonably possible that the total amounts of unrecognized tax benefits will significantly change in the next twelve months. The Fund files a U.S. federal tax return, in addition to state and local tax returns as required. The Fund's federal income tax returns are subject to examination by the Internal Revenue Service (IRS) for a period of three fiscal years after they are filed. State and local tax returns may be subject to examination for an additional fiscal year depending on the jurisdiction. Foreign taxes are provided for based on the Fund's understanding of the tax rules and rates that exist in the foreign markets in which it invests. The Fund is subject to a tax imposed on capital gains by certain countries in which it invests. An estimated deferred tax liability for net unrealized appreciation on the applicable securities is included in Other payables and accrued expenses on the Statement of Assets & Liabilities.
Distributions are declared and recorded on the ex-dividend date. Income and capital gain distributions are determined in accordance with income tax regulations, which may differ from GAAP. In addition, the Fund claimed a portion of the payment made to redeeming shareholders as a distribution for income tax purposes.
Capital accounts within the financial statements are adjusted for permanent book-tax differences. These adjustments have no impact on net assets or the results of operations. Capital accounts are not adjusted for temporary book-tax differences which will reverse in a subsequent period.
Book-tax differences are primarily due the short-term gain distributions from the Underlying Funds, foreign currency transactions, passive foreign investment companies (PFIC), certain foreign taxes, partnerships, deferred trustees compensation and losses deferred due to wash sales and excise tax regulations.
As of period end, the cost and unrealized appreciation (depreciation) in securities, and derivatives if applicable, for federal income tax purposes were as follows:
| Gross unrealized appreciation | $15,767,770,708 |
| Gross unrealized depreciation | (391,117,329) |
| Net unrealized appreciation (depreciation) | $15,376,653,379 |
| Tax Cost | $44,900,307,080 |
The tax-based components of distributable earnings as of period end were as follows:
| Undistributed ordinary income | $723,966,355 |
| Undistributed long-term capital gain | $1,695,562,647 |
| Net unrealized appreciation (depreciation) on securities and other investments | $15,376,847,404 |
The tax character of distributions paid was as follows:
| May 31, 2021 | May 31, 2020 | |
| Ordinary Income | $736,457,893 | $ 518,460,093 |
| Long-term Capital Gains | 547,896,206 | 317,191,327 |
| Total | $1,284,354,099 | $ 835,651,420 |
Delayed Delivery Transactions and When-Issued Securities. During the period, certain Funds transacted in securities on a delayed delivery or when-issued basis. Payment and delivery may take place after the customary settlement period for that security. The price of the underlying securities and the date when the securities will be delivered and paid for are fixed at the time the transaction is negotiated. Securities purchased on a delayed delivery or when-issued basis are identified as such in the Schedule of Investments. Compensation for interest forgone in the purchase of a delayed delivery or when-issued debt security may be received. With respect to purchase commitments, each applicable Fund identifies securities as segregated in its records with a value at least equal to the amount of the commitment. Payables and receivables associated with the purchases and sales of delayed delivery securities having the same coupon, settlement date and broker are offset. Delayed delivery or when-issued securities that have been purchased from and sold to different brokers are reflected as both payables and receivables in the Statement of Assets and Liabilities under the caption "Delayed delivery", as applicable. Losses may arise due to changes in the value of the underlying securities or if the counterparty does not perform under the contract's terms, or if the issuer does not issue the securities due to political, economic, or other factors.
Restricted Securities (including Private Placements). Funds may invest in securities that are subject to legal or contractual restrictions on resale. These securities generally may be resold in transactions exempt from registration or to the public if the securities are registered. Disposal of these securities may involve time-consuming negotiations and expense, and prompt sale at an acceptable price may be difficult. Information regarding restricted securities held at period end is included at the end of the Schedule of Investments, if applicable.
Special Purpose Acquisition Companies. Funds may invest in stock, warrants, and other securities of special purpose acquisition companies (SPACs) or similar special purpose entities. A SPAC is a publicly traded company that raises investment capital via an initial public offering (IPO) for the purpose of acquiring the equity securities of one or more existing companies via merger, business combination, acquisition or other similar transactions within a designated time frame.
Private Investment in Public Equity. Funds may acquire equity securities of an issuer through a private investment in a public equity (PIPE) transaction, including through commitments to purchase securities on a when-issued basis. A PIPE typically involves the purchase of securities directly from a publicly traded company in a private placement transaction. Securities purchased through PIPE transactions will be restricted from trading and considered illiquid until a resale registration statement for the shares is filed and declared effective.
At period end, the Fund had commitments to purchase when-issued securities through PIPE transactions with SPACs. The commitments are contingent upon the SPACs acquiring the securities of target companies. Unrealized appreciation (depreciation) on these commitments is separately presented in the Statements of Assets and Liabilities as Unrealized appreciation (depreciation) on unfunded commitments, and in the Statement of Operations as Change in unrealized appreciation (depreciation) on unfunded commitments.
3. Derivative Instruments.
Risk Exposures and the Use of Derivative Instruments. The Fund's investment objective allows the Fund to enter into various types of derivative contracts, including options. Derivatives are investments whose value is primarily derived from underlying assets, indices or reference rates and may be transacted on an exchange or over-the-counter (OTC). Derivatives may involve a future commitment to buy or sell a specified asset based on specified terms, to exchange future cash flows at periodic intervals based on a notional principal amount, or for one party to make one or more payments upon the occurrence of specified events in exchange for periodic payments from the other party.
The Fund used derivatives to increase returns and to manage exposure to certain risks as defined below. The success of any strategy involving derivatives depends on analysis of numerous economic factors, and if the strategies for investment do not work as intended, the Fund may not achieve its objectives.
The Fund's use of derivatives increased or decreased its exposure to the following risk:
| Equity Risk | Equity risk relates to the fluctuations in the value of financial instruments as a result of changes in market prices (other than those arising from interest rate risk or foreign exchange risk), whether caused by factors specific to an individual investment, its issuer, or all factors affecting all instruments traded in a market or market segment. |
The Fund is also exposed to additional risks from investing in derivatives, such as liquidity risk and counterparty credit risk. Liquidity risk is the risk that the Fund will be unable to close out the derivative in the open market in a timely manner. Counterparty credit risk is the risk that the counterparty will not be able to fulfill its obligation to the Fund. Counterparty credit risk related to exchange-traded options may be mitigated by the protection provided by the exchange on which they trade.
Investing in derivatives may involve greater risks than investing in the underlying assets directly and, to varying degrees, may involve risk of loss in excess of any initial investment and collateral received and amounts recognized in the Statement of Assets and Liabilities. In addition, there may be the risk that the change in value of the derivative contract does not correspond to the change in value of the underlying instrument.
Options. Options give the purchaser the right, but not the obligation, to buy (call) or sell (put) an underlying security or financial instrument at an agreed exercise or strike price between or on certain dates. Options obligate the seller (writer) to buy (put) or sell (call) an underlying instrument at the exercise or strike price or cash settle an underlying derivative instrument if the holder exercises the option on or before the expiration date.
The Fund used exchange-traded written covered call options to manage its exposure to the market. When the Fund writes a covered call option, the Fund holds the underlying instrument which must be delivered to the holder upon the exercise of the option.
Upon entering into a written options contract, the Fund will receive a premium. Premiums received are reflected as a liability on the Statement of Assets and Liabilities. Options are valued daily and any unrealized appreciation (depreciation) is reflected on the Statement of Assets and Liabilities. When a written option is exercised, the premium is added to the proceeds from the sale of the underlying instrument in determining the gain or loss realized on that investment. When an option is closed the Fund will realize a gain or loss depending on whether the proceeds or amount paid for the closing sale transaction are greater or less than the premium received. When an option expires, gains and losses are realized to the extent of premiums received. The net realized gain (loss) on closed and expired written options and the change in net unrealized appreciation (depreciation) on written options are presented in the Statement of Operations.
Writing call options tends to decrease exposure to the underlying instrument and risk of loss is the change in value in excess of the premium received.
Any open options at period end are presented in the Schedule of Investments under the caption "Written Options".
4. Purchases and Sales of Investments.
Purchases and sales of securities, other than short-term securities, are noted in the table below.
| Purchases ($) | Sales ($) | |
| Strategic Advisers Fidelity U.S. Total Stock Fund | 31,983,307,656 | 20,932,000,638 |
5. Fees and Other Transactions with Affiliates.
Management Fee. Strategic Advisers (the investment adviser) provides the Fund with investment management related services. For these services, the Fund pays a monthly management fee to the investment adviser. The management fee is calculated by adding the annual management fee rate of .25% of the Fund's average net assets throughout the month to the aggregate of the fee rates, payable monthly by the investment adviser, to the Fund's sub-advisers. The Fund's maximum aggregate management fee will not exceed 1.00% of the Fund's average net assets. For the reporting period, the total annual management fee rate was .37% of the Fund's average net assets.
During the period, the investment adviser waived a portion of its management fee as described in the Expense Reductions note.
Sub-Advisers. FIAM LLC (an affiliate of the investment adviser) served as a sub-adviser for the Fund during the period. Sub-advisers provide discretionary investment advisory services for their allocated portion of the Fund's assets and are paid as described in the Management Fee note.
FIL Investment Advisors and Geode Capital Management, LLC (Geode) have been retained to serve as a sub-adviser for the Fund. As of the date of this report, however, these sub-advisers have not been allocated any portion of the Fund's assets. These sub-advisers in the future may provide discretionary investment advisory services for an allocated portion of the Fund's assets and will be paid by the investment adviser for providing these services.
Brokerage Commissions. A portion of portfolio transactions were placed with brokerage firms which are affiliates of the investment adviser. Brokerage commissions are included in net realized gain (loss) and change in net unrealized appreciation (depreciation) in the Statement of Operations. The commissions paid to these affiliated firms were as follows:
| Amount | |
| Strategic Advisers Fidelity U.S. Total Stock Fund | $247,206 |
Interfund Trades. Funds may purchase from or sell securities to other funds affiliated with each sub-adviser under procedures adopted by the Board. The procedures have been designed to ensure these interfund trades are executed in accordance with Rule 17a-7 of the 1940 Act. Any interfund trades are included within the respective purchases and sales amounts shown in the Purchases and Sales of Investments note and are noted in the table below.
| Purchases ($) | Sales ($) | |
| Strategic Advisers Fidelity U.S. Total Stock Fund | 1,539,129,403 | 728,490,703 |
Other. During the period, the investment adviser reimbursed the Fund for certain losses as follows:
| Amount ($) | |
| Strategic Advisers Fidelity U.S. Total Stock Fund | 294,244 |
6. Investments in Fidelity Central Funds.
Funds may invest in Fidelity Central Funds, which are open-end investment companies generally available only to other investment companies and accounts managed by the investment adviser and its affiliates. The Schedule of Investments lists any Fidelity Central Funds held as an investment as of period end, but does not include the underlying holdings of each Fidelity Central Fund. An investing fund indirectly bears its proportionate share of the expenses of the underlying Fidelity Central Funds.
Based on its investment objective, each Fidelity Central Fund may invest or participate in various investment vehicles or strategies that are similar to those of the investing fund. These strategies are consistent with the investment objectives of the investing fund and may involve certain economic risks which may cause a decline in value of each of the Fidelity Central Funds and thus a decline in the value of the investing fund.
A complete unaudited list of holdings for each Fidelity Central Fund is available upon request or at the Securities and Exchange Commission website at www.sec.gov. In addition, the financial statements of the Fidelity Central Funds, which are not covered by the Report of Independent Registered Public Accounting Firm, are available on the Securities and Exchange Commission website or upon request.
| Fidelity Central Fund | Investment Manager | Investment Objective | Investment Practices | Expense Ratio(a) |
| Fidelity Money Market Central Funds | Fidelity Management & Research Company LLC (FMR) | Each fund seeks to obtain a high level of current income consistent with the preservation of capital and liquidity. | Short-term Investments | Less than .005% to .01% |
(a) Expenses expressed as a percentage of average net assets and are as of each underlying Central Fund's most recent annual or semi-annual shareholder report.
7. Committed Line of Credit.
Certain Funds participate with other funds managed by the investment adviser or an affiliate in a $4.25 billion credit facility (the "line of credit") to be utilized for temporary or emergency purposes to fund shareholder redemptions or for other short-term liquidity purposes. The participating funds have agreed to pay commitment fees on their pro-rata portion of the line of credit, which are reflected in Miscellaneous expenses on the Statement of Operations, and are listed below. During the period, there were no borrowings on this line of credit.
| Amount | |
| Strategic Advisers Fidelity U.S. Total Stock Fund | $86,912 |
8. Security Lending.
Funds lend portfolio securities through a lending agent from time to time in order to earn additional income. On the settlement date of the loan, a fund receives collateral (in the form of U.S. Treasury obligations, letters of credit and/or cash) against the loaned securities and maintains collateral in an amount not less than 100% of the market value of the loaned securities during the period of the loan. The market value of the loaned securities is determined at the close of business of a fund and any additional required collateral is delivered to a fund on the next business day. A fund or borrower may terminate the loan at any time, and if the borrower defaults on its obligation to return the securities loaned because of insolvency or other reasons, a fund may apply collateral received from the borrower against the obligation. A fund may experience delays and costs in recovering the securities loaned. Any cash collateral received is invested in the Fidelity Securities Lending Cash Central Fund. Any loaned securities are identified as such in the Schedule of Investments, and the value of loaned securities and cash collateral at period end, as applicable, are presented in the Statement of Assets and Liabilities. Security lending income represents the income earned on investing cash collateral, less rebates paid to borrowers and any lending agent fees associated with the loan, plus any premium payments received for lending certain types of securities. Security lending income is presented in the Statement of Operations as a component of income from Fidelity Central Funds.
9. Expense Reductions.
The investment adviser has contractually agreed to waive the Fund's management fee in an amount equal to .25% of the Fund's average net assets until September 30, 2023. During the period, this waiver reduced the Fund's management fee by $115,391,452.
Commissions paid to certain brokers with whom the investment adviser, or its affiliates, places trades on behalf of the Fund include an amount in addition to trade execution, which may be rebated back to the Fund to offset expenses. This amount totaled $1,489,929 for the period.
In addition, through arrangements with the Fund's custodian, credits realized as a result of certain uninvested cash balances were used to reduce the Fund's expenses by $453.
10. Other.
Fund's organizational documents provide former and current trustees and officers with a limited indemnification against liabilities arising in connection with the performance of their duties to the fund. In the normal course of business, the fund may also enter into contracts that provide general indemnifications. The fund's maximum exposure under these arrangements is unknown as this would be dependent on future claims that may be made against the fund. The risk of material loss from such claims is considered remote.
Funds do not invest in underlying mutual funds for the purpose of exercising management or control; however, investments by funds within their principal investment strategies may represent a significant portion of the underlying mutual fund's net assets. At the end of the period, certain Funds were the owners of record of 10% or more of the total outstanding shares of the following underlying mutual funds as shown below.
| Fund | Strategic Advisers Fidelity U.S. Total Stock Fund |
| Fidelity Large Cap Value Enhanced Index Fund | 53% |
| Fidelity Magellan Fund | 10% |
| Fidelity SAI U.S. Low Volatility Index Fund | 26% |
| Fidelity SAI U.S. Momentum Index Fund | 61% |
| Fidelity SAI U.S. Quality Index Fund | 75% |
| Fidelity SAI U.S. Value Index Fund | 75% |
| Fidelity Small Cap Discovery Fund | 14% |
11. Coronavirus (COVID-19) Pandemic.
An outbreak of COVID-19 first detected in China during December 2019 has since spread globally and was declared a pandemic by the World Health Organization during March 2020. Developments that disrupt global economies and financial markets, such as the COVID-19 pandemic, may magnify factors that affect the Fund's performance.
Report of Independent Registered Public Accounting Firm
To the Board of Trustees of Fidelity Rutland Square Trust II and Shareholders of Strategic Advisers Fidelity U.S. Total Stock Fund
Opinion on the Financial Statements
We have audited the accompanying statement of assets and liabilities, including the schedule of investments, of Strategic Advisers Fidelity U.S. Total Stock Fund (one of the funds constituting Fidelity Rutland Square Trust II, referred to hereafter as the “Fund”) as of May 31, 2021, the related statement of operations for the year ended May 31, 2021, the statement of changes in net assets for each of the two years in the period ended May 31, 2021, including the related notes, and the financial highlights for each of the three years in the period ended May 31, 2021 and for the period March 20, 2018 (commencement of operations) to May 31, 2018 (collectively referred to as the “financial statements”). In our opinion, the financial statements present fairly, in all material respects, the financial position of the Fund as of May 31, 2021, the results of its operations for the year then ended, the changes in its net assets for each of the two years in the period ended May 31, 2021 and the financial highlights for each of the three years in the period ended May 31, 2021 and for the period March 20, 2018 (commencement of operations) to May 31, 2018 in conformity with accounting principles generally accepted in the United States of America.
Basis for Opinion
These financial statements are the responsibility of the Fund’s management. Our responsibility is to express an opinion on the Fund’s financial statements based on our audits. We are a public accounting firm registered with the Public Company Accounting Oversight Board (United States) (PCAOB) and are required to be independent with respect to the Fund in accordance with the U.S. federal securities laws and the applicable rules and regulations of the Securities and Exchange Commission and the PCAOB.
We conducted our audits of these financial statements in accordance with the standards of the PCAOB. Those standards require that we plan and perform the audit to obtain reasonable assurance about whether the financial statements are free of material misstatement, whether due to error or fraud.
Our audits included performing procedures to assess the risks of material misstatement of the financial statements, whether due to error or fraud, and performing procedures that respond to those risks. Such procedures included examining, on a test basis, evidence regarding the amounts and disclosures in the financial statements. Our audits also included evaluating the accounting principles used and significant estimates made by management, as well as evaluating the overall presentation of the financial statements. Our procedures included confirmation of securities owned as of May 31, 2021 by correspondence with the custodian, issuers of privately offered securities and brokers; when replies were not received from brokers, we performed other auditing procedures. We believe that our audits provide a reasonable basis for our opinion.
/s/ PricewaterhouseCoopers LLP
Boston, Massachusetts
July 13, 2021
We have served as the auditor of one or more investment companies in the Fidelity group of funds since 1932.
Trustees and Officers
The Trustees, Members of the Advisory Board (if any), and officers of the trust and fund, as applicable, are listed below. The Board of Trustees governs the fund and is responsible for protecting the interests of shareholders. The Trustees are experienced executives who meet periodically throughout the year to oversee the fund's activities, review contractual arrangements with companies that provide services to the fund, oversee management of the risks associated with such activities and contractual arrangements, and review the fund's performance. If the interests of the fund and an underlying Fidelity® fund were to diverge, a conflict of interest could arise and affect how the Trustees and Members of the Advisory Board fulfill their fiduciary duties to the affected funds. Strategic Advisers has structured the fund to avoid these potential conflicts, although there may be situations where a conflict of interest is unavoidable. In such instances, Strategic Advisers, the Trustees, and Members of the Advisory Board would take reasonable steps to minimize and, if possible, eliminate the conflict. Each of the Trustees oversees 12 funds.
The Trustees hold office without limit in time except that (a) any Trustee may resign; (b) any Trustee may be removed by written instrument, signed by at least two-thirds of the number of Trustees prior to such removal; (c) any Trustee who requests to be retired or who has become incapacitated by illness or injury may be retired by written instrument signed by a majority of the other Trustees; and (d) any Trustee may be removed at any special meeting of shareholders by a two-thirds vote of the outstanding voting securities of the trust. Each Independent Trustee shall retire not later than the last day of the calendar year in which his or her 75th birthday occurs. The Independent Trustees may waive this mandatory retirement age policy with respect to individual Trustees. Officers and Advisory Board Members hold office without limit in time, except that any officer or Advisory Board Member may resign or may be removed by a vote of a majority of the Trustees at any regular meeting or any special meeting of the Trustees. Except as indicated, each individual has held the office shown or other offices in the same company for the past five years.
Each Trustee who is not an interested person (as defined in the 1940 Act) of the trust and the fund is referred to herein as an Independent Trustee.
The fund’s Statement of Additional Information (SAI) includes more information about the Trustees. To request a free copy, call Fidelity at 1-800-544-3455.
Experience, Skills, Attributes, and Qualifications of the Trustees. The Governance and Nominating Committee has adopted a statement of policy that describes the experience, qualifications, attributes, and skills that are necessary and desirable for potential Independent Trustee candidates (Statement of Policy). The Board believes that each Trustee satisfied at the time he or she was initially elected or appointed a Trustee, and continues to satisfy, the standards contemplated by the Statement of Policy. The Governance and Nominating Committee may also engage professional search firms to help identify potential Independent Trustee candidates with experience, qualifications, attributes, and skills consistent with the Statement of Policy. Additional criteria based on the composition and skills of the current Independent Trustees, as well as experience or skills that may be appropriate in light of future changes to board composition, business conditions, and regulatory or other developments, may be considered by the professional search firms and the Governance and Nominating Committee. In addition, the Board takes into account the Trustees' commitment and participation in Board and committee meetings, as well as their leadership of standing and ad hoc committees throughout their tenure.
In determining that a particular Trustee was and continues to be qualified to serve as a Trustee, the Board has considered a variety of criteria, none of which, in isolation, was controlling. The Board believes that, collectively, the Trustees have balanced and diverse experience, qualifications, attributes, and skills, which allow the Board to operate effectively in governing the fund and protecting the interests of shareholders. Information about the specific experience, skills, attributes, and qualifications of each Trustee, which in each case led to the Board's conclusion that the Trustee should serve (or continue to serve) as a trustee of the fund, is provided below.
Board Structure and Oversight Function. Robert A. Lawrence is an interested person and currently serves as Chairman. The Trustees have determined that an interested Chairman is appropriate and benefits shareholders because an interested Chairman has a personal and professional stake in the quality and continuity of services provided to the fund. Independent Trustees exercise their informed business judgment to appoint an individual of their choosing to serve as Chairman, regardless of whether the Trustee happens to be independent or a member of management. The Independent Trustees have determined that they can act independently and effectively without having an Independent Trustee serve as Chairman and that a key structural component for assuring that they are in a position to do so is for the Independent Trustees to constitute a substantial majority for the Board. The Independent Trustees also regularly meet in executive session. Mary C. Farrell serves as the lead Independent Trustee and as such (i) acts as a liaison between the Independent Trustees and management with respect to matters important to the Independent Trustees and (ii) with management prepares agendas for Board meetings.
Fidelity® funds are overseen by different Boards of Trustees. The fund's Board oversees asset allocation funds. Other Boards oversee Fidelity's investment-grade bond, money market, and asset allocation funds, and Fidelity's equity and high income funds. The fund may invest in Fidelity® funds overseen by such other Boards. The use of separate Boards, each with its own committee structure, allows the Trustees of each group of Fidelity® funds to focus on the unique issues of the funds they oversee, including common research, investment, and operational issues.
The Trustees primarily operate as a full Board, but also operate in committees, to facilitate the timely and efficient consideration of all matters of importance to the Trustees, the fund, and fund shareholders and to facilitate compliance with legal and regulatory requirements and oversight of the fund's activities and associated risks. The Board has charged Strategic Advisers and its affiliates with (i) identifying events or circumstances the occurrence of which could have demonstrably adverse effects on the fund's business and/or reputation; (ii) implementing processes and controls to lessen the possibility that such events or circumstances occur or to mitigate the effects of such events or circumstances if they do occur; and (iii) creating and maintaining a system designed to evaluate continuously business and market conditions in order to facilitate the identification and implementation processes described in (i) and (ii) above. Because the day-to-day operations and activities of the fund are carried out by or through Strategic Advisers, its affiliates and other service providers, the fund's exposure to risks is mitigated but not eliminated by the processes overseen by the Trustees. Board oversight of different aspects of the fund's activities is exercised primarily through the full Board, but also through the Audit and Compliance Committee. Appropriate personnel, including but not limited to the fund's Chief Compliance Officer (CCO), FMR's internal auditor, the independent accountants, the fund's Treasurer and portfolio management personnel, make periodic reports to the Board's committees, as appropriate. The responsibilities of each standing committee, including their oversight responsibilities, are described further under "Standing Committees of the Trustees."
Interested Trustees*:
Correspondence intended for a Trustee who is an interested person may be sent to Fidelity Investments, 245 Summer Street, Boston, Massachusetts 02210.
Name, Year of Birth; Principal Occupations and Other Relevant Experience+
Robert A. Lawrence (1952)
Year of Election or Appointment: 2016
Trustee
Chairman of the Board of Trustees
Mr. Lawrence also serves as Trustee of other funds. Previously, Mr. Lawrence served as a Member of the Advisory Board of certain funds. Prior to his retirement in 2008, Mr. Lawrence served as Vice President of certain Fidelity® funds (2006-2008), Senior Vice President, Head of High Income Division of Fidelity Management & Research Company (investment adviser firm, 2006-2008), and President of Fidelity Strategic Investments (investment adviser firm, 2002-2005).
Charles S. Morrison (1960)
Year of Election or Appointment: 2020
Trustee
Mr. Morrison also serves as Trustee of other funds. Previously, Mr. Morrison served as President (2017-2018) and Director (2014-2018) of Fidelity SelectCo, LLC (investment adviser firm), President of Fidelity Management & Research Company (FMR) (investment adviser firm, 2016-2018), a Director of Fidelity Investments Money Management, Inc. (investment adviser firm, 2014-2018), President, Asset Management (2014-2018), Trustee of the Fidelity Equity and High Income Funds (283 funds as of December 2018) (2014-2018), and was an employee of Fidelity Investments. Mr. Morrison also previously served as Vice President of Fidelity's Fixed Income and Asset Allocation Funds (2012-2014), President, Fixed Income (2011-2014), Vice President of Fidelity's Money Market Funds (2005-2009), President, Money Market Group Leader of FMR (2009), and Senior Vice President, Money Market Group of FMR (2004-2009). Mr. Morrison also served as Vice President of Fidelity's Bond Funds (2002-2005), certain Balanced Funds (2002-2005), and certain Asset Allocation Funds (2002-2007), and as Senior Vice President (2002-2005) of Fidelity's Bond Division.
* Determined to be an "Interested Trustee" by virtue of, among other things, his or her affiliation with the trust or various entities under common control with Strategic Advisers.
+ The information includes the Trustee's principal occupation during the last five years and other information relating to the experience, attributes, and skills relevant to the Trustee's qualifications to serve as a Trustee, which led to the conclusion that the Trustee should serve as a Trustee for the fund.
Independent Trustees:
Correspondence intended for an Independent Trustee may be sent to Fidelity Investments, P.O. Box 55235, Boston, Massachusetts 02205-5235.
Name, Year of Birth; Principal Occupations and Other Relevant Experience+
Peter C. Aldrich (1944)
Year of Election or Appointment: 2006
Trustee
Mr. Aldrich also serves as Trustee of other funds. Mr. Aldrich is a Director of the U.S. Core Property Fund (and, previously, other funds) of BlackRock Realty Group (2006-present). Previously, Mr. Aldrich served as a Managing Member of Poseidon, LLC (foreign private investment, 1998-2004), and Chairman and Managing Member of AEGIS, LLC (foreign private investment, 1997-2004). Mr. Aldrich previously was a founder, Chief Executive Officer, and Chairman of AEW Capital Management, L.P. (then “Aldrich, Eastman and Waltch, L.P.”). Mr. Aldrich also served as a Director of LivelyHood, Inc. (private corporation, 2013-2020), a Trustee for the Fidelity Rutland Square Trust (2005-2010), a Director of Zipcar, Inc. (car sharing services, 2001-2009) and as Faculty Chairman of The Research Council on Global Investment of The Conference Board (business and professional education non-profit, 1999-2004). Mr. Aldrich is a Member Emeritus of the Board of Directors of the National Bureau of Economic Research and the Board of Trustees of the Museum of Fine Arts Boston.
Mary C. Farrell (1949)
Year of Election or Appointment: 2013
Trustee
Ms. Farrell also serves as Trustee of other funds. Ms. Farrell is a Director of the W.R. Berkley Corporation (insurance provider) and President (2009-present) and Director (2006-present) of the Howard Gilman Foundation (charitable organization). Previously, Ms. Farrell was Managing Director and Chief Investment Strategist at UBS Wealth Management USA and Co-Head of UBS Wealth Management Investment Strategy & Research Group (2003-2005). Ms. Farrell also served as Investment Strategist at PaineWebber (1982-2000) and UBS PaineWebber (2000-2002). Ms. Farrell serves as Chairman of the Board of Trustees of Yale-New Haven Hospital and Vice Chairman of the Yale New Haven Health System Board and previously served as Trustee on the Board of Overseers of the New York University Stern School of Business.
Karen Kaplan (1960)
Year of Election or Appointment: 2006
Trustee
Ms. Kaplan also serves as Trustee of other funds. Ms. Kaplan is Chairman (2014-present) and Chief Executive Officer (2013-present) of Hill Holliday (advertising and specialized marketing). Ms. Kaplan is a Director of The Michaels Companies, Inc. (specialty retailer, 2015-present), Member of the Board of Governors of the Chief Executives’ Club of Boston (2010-present), Member of the Executive Committee of the Greater Boston Chamber of Commerce (2006-present), Advisory Board Member of the National Association of Corporate Directors Chapter (2012-present), Member of the Board of Trustees of the Post Office Square Trust (2012-present), Trustee of the Brigham and Women’s Hospital (2016-present), Overseer of the Boston Symphony Orchestra (2014-present), Member of the Board of Directors of The Advertising Council, Inc. (2016-present), Member of the Ron Burton Training Village Executive Board of Advisors (2018-present), Member of the Executive Committee of The Ad Council, Inc. (2019-present), and Member of the Board of Directors of The Ad Club of Boston (2020-present). Previously, Ms. Kaplan served as an Advisory Board Member of Fidelity Rutland Square Trust (2006-2010), a member of the Clinton Global Initiative (2010-2015), Director of DSM (dba Delta Dental and DentaQuest) (2004-2014), Formal Appointee of the 2015 Baker-Polito Economic Development Council, Director of Vera Bradley Inc. (designer of women’s accessories, 2012-2015), Member of the Board of Directors of the Massachusetts Conference for Women (2008-2015), Member of the Board of Directors of Jobs for Massachusetts (2012-2015), President of the Massachusetts Women’s Forum (2008-2010), Treasurer of the Massachusetts Women’s Forum (2002-2006), and Vice Chair of the Board of the Massachusetts Society for the Prevention of Cruelty to Children (2003-2010).
Christine Marcks (1955)
Year of Election or Appointment: 2020
Trustee
Ms. Marcks also serves as Trustee of other Funds. Prior to her retirement, Ms. Marcks served as Chief Executive Officer and President – Prudential Retirement (2007-2017) and Vice President for Rollover and Retirement Income Strategies (2005-2007), Prudential Financial, Inc. (financial services). Previously, Ms. Marcks served as a Member of the Advisory Board of certain Fidelity® funds (2019-2020), was Senior Vice President and Head of Financial Horizons (2002-2004) and Vice President, Strategic Marketing (2000-2002) of Voya Financial (formerly ING U.S.) (financial services), held numerous positions at Aetna Financial Services (financial services, 1987-2000) and served as an International Economist for the United States Department of the Treasury (1980-1987). Ms. Marcks also serves as a member of the Board of Trustees, Audit Committee and Benefits & Operations Committee of the YMCA Retirement Fund (2018-present), a non-profit organization providing retirement plan benefits to YMCA staff members, and as a member of the Board of Trustees of Assumption College (2019-present).
Heidi L. Steiger (1953)
Year of Election or Appointment: 2017
Trustee
Ms. Steiger also serves as Trustee of other funds. Ms. Steiger serves as Managing Partner of Topridge Associates, LLC (consulting, 2005-present) and a member of the Board of Directors (2013-present) and member of the Membership and Executive Committee (2017-present) of Business Executives for National Security (nonprofit). Previously, Ms. Steiger served as a member of the Board of Directors Chair of the Remuneration Committee of Imagine Intelligent Materials Limited (2019-2021) (technology company), a member of the Advisory Board of the joint degree program in Global Luxury Management at North Carolina State University (Raleigh, NC) and Skema (Paris) (2018-2021), a Non-Executive Director of CrowdBureau Corporation (financial technology company and index provider, 2018-2021), a member of the Global Advisory Board and Of Counsel to Signum Global Advisors (international policy and strategy, 2018-2020), Eastern Region President of The Private Client Reserve of U.S. Bancorp (banking and financial services, 2010-2015), Advisory Director of Berkshire Capital Securities, LLC (financial services, 2009-2010), President and Senior Advisor of Lowenhaupt Global Advisors, LLC (financial services, 2005-2007), and President and Contributing Editor of Worth Magazine (2004-2005) and held a variety of positions at Neuberger Berman Group, LLC (financial services, 1986-2004), including Partner and Executive Vice President and Global Head of Private Asset Management at Neuberger Berman (1999-2004). Ms. Steiger also served as a member of the Board of Directors of Nuclear Electric Insurance Ltd (insurer of nuclear utilities, 2006-2017), a member of the Board of Trustees and Audit Committee of the Eaton Vance Funds (2007-2010), a member of the Board of Directors of Aviva USA (formerly AmerUs) (insurance, 2004-2014), and a member of the Board of Trustees and Audit Committee and Chair of the Investment Committee of CIFG (financial guaranty insurance, 2009-2012), and a member of the Board of Directors of Kin Group Plc (formerly, Fitbug Holdings) (health and technology, 2016-2017).
+ The information includes the Trustee's principal occupation during the last five years and other information relating to the experience, attributes, and skills relevant to the Trustee's qualifications to serve as a Trustee, which led to the conclusion that the Trustee should serve as a Trustee for the fund.
Advisory Board Members and Officers:
Correspondence intended for a Member of the Advisory Board (if any) may be sent to Fidelity Investments, P.O. Box 55235, Boston, Massachusetts 02205-5235. Correspondence intended for an officer or Howard E. Cox, Jr. may be sent to Fidelity Investments, 245 Summer Street, Boston, Massachusetts 02210. Officers appear below in alphabetical order.
Name, Year of Birth; Principal Occupation
Ralph F. Cox (1932)
Year of Election or Appointment: 2020
Member of the Advisory Board
Mr. Cox also serves as a Member of the Advisory Board of other funds. Mr. Cox is President of RABAR Enterprises (management consulting for the petroleum industry). Mr. Cox is a Director of Abraxas Petroleum (exploration and production, 1999-present). Mr. Cox is a member of the Advisory Boards of the Business and Engineering Schools of Texas A&M University and the Engineering School of University of Texas at Austin. Previously, Mr. Cox served as Trustee of other funds (2006-2020), a Trustee for the Fidelity Rutland Square Trust (2005-2010) and as an Advisory Director of CH2M Hill Companies (engineering, 1981-2011). Mr. Ralph F. Cox and Mr. Howard E. Cox, Jr. are not related.
Howard E. Cox, Jr. (1944)
Year of Election or Appointment: 2009
Member of the Advisory Board
Mr. Cox also serves as a Member of the Advisory Board of other funds. Mr. Cox is a Partner of Greylock (venture capital, 1971-present) and a Director of Stryker Corporation (medical products and services, 1974-present). Previously, Mr. Cox served as an Advisory Board Member of Fidelity Rutland Square Trust (2006-2010). Mr. Cox also serves as a Member of the Secretary of Defense's Business Board of Directors (2008-present), a Director of Business Executives for National Security (1997-present), a Director of the Brookings Institution (2010-present), a Director of the World Economic Forum’s Young Global Leaders Foundation (2009-present), and is a Member of the Harvard Medical School Board of Fellows (2002-present). Mr. Howard E. Cox, Jr. and Mr. Ralph F. Cox are not related.
Craig S. Brown (1977)
Year of Election or Appointment: 2019
Assistant Treasurer
Mr. Brown also serves as Assistant Treasurer of other funds. Mr. Brown is an employee of Fidelity Investments (2013-present).
John J. Burke III (1964)
Year of Election or Appointment: 2018
Chief Financial Officer
Mr. Burke also serves as Chief Financial Officer of other funds. Mr. Burke serves as Head of Investment Operations for Fidelity Fund and Investment Operations (2018-present) and is an employee of Fidelity Investments (1998-present). Previously Mr. Burke served as head of Asset Management Investment Operations (2012-2018).
Jonathan Davis (1968)
Year of Election or Appointment: 2010
Assistant Treasurer
Mr. Davis also serves as Assistant Treasurer of other funds. Mr. Davis serves as Assistant Treasurer of FMR Capital, Inc. (2017-present) and is an employee of Fidelity Investments. Previously, Mr. Davis served as Vice President and Associate General Counsel of FMR LLC (diversified financial services company, 2003-2010).
Laura M. Del Prato (1964)
Year of Election or Appointment: 2018
Assistant Treasurer
Ms. Del Prato also serves as an officer of other funds. Ms. Del Prato is an employee of Fidelity Investments (2017-present). Previously, Ms. Del Prato served as President and Treasurer of The North Carolina Capital Management Trust: Cash Portfolio and Term Portfolio (2018-2020). Prior to joining Fidelity Investments, Ms. Del Prato served as a Managing Director and Treasurer of the JPMorgan Mutual Funds (2014-2017). Prior to JPMorgan, Ms. Del Prato served as a partner at Cohen Fund Audit Services (accounting firm, 2012-2013) and KPMG LLP (accounting firm, 2004-2012).
James D. Gryglewicz (1972)
Year of Election or Appointment: 2015
Chief Compliance Officer
Mr. Gryglewicz also serves as Chief Compliance Officer of other funds. Mr. Gryglewicz serves as Compliance Officer of Strategic Advisers LLC (investment adviser firm, 2015-present), Senior Vice President of Asset Management Compliance (2009-present), and is an employee of Fidelity Investments (2004-present). Previously, Mr. Gryglewicz served as Compliance Officer of Fidelity SelectCo, LLC (investment adviser firm, 2014-2019), and as Chief Compliance Officer of certain Fidelity® funds (2014-2018).
Colm A. Hogan (1973)
Year of Election or Appointment: 2016
Assistant Treasurer
Mr. Hogan also serves as an officer of other funds. Mr. Hogan serves as Assistant Treasurer of FMR Capital, Inc. (2017-present) and is an employee of Fidelity Investments (2005-present). Previously, Mr. Hogan served as Deputy Treasurer of certain Fidelity® funds (2016-2020) and Assistant Treasurer of certain Fidelity® funds (2016-2018).
Christina H. Lee (1975)
Year of Election or Appointment: 2020
Secretary and Chief Legal Officer
Ms. Lee also serves as Secretary and CLO of other funds. Ms. Lee serves as Vice President, Associate General Counsel (2014-present) and is an employee of Fidelity Investments (2007-present). Previously, Ms. Lee served as Assistant Secretary of certain funds (2018-2019).
Cynthia Lo Bessette (1969)
Year of Election or Appointment: 2020
Assistant Secretary
Ms. Lo Bessette also serves as an officer of other funds. Ms. Lo Bessette serves as CLO, Secretary, and Senior Vice President of Fidelity Management & Research Company LLC (investment adviser firm, 2019-present); and CLO of Fidelity Management & Research (Hong Kong) Limited, FMR Investment Management (UK) Limited, and Fidelity Management & Research (Japan) Limited (investment adviser firms, 2019-present). She is a Senior Vice President and Deputy General Counsel of FMR LLC (diversified financial services company, 2019-present), and is an employee of Fidelity Investments. Previously, Ms. Lo Bessette served as CLO, Secretary, and Senior Vice President of FMR Co., Inc. (investment adviser firm, 2019); Secretary of Fidelity SelectCo, LLC and Fidelity Investments Money Management, Inc. (investment adviser firms, 2019). Prior to joining Fidelity Investments, Ms. Lo Bessette was Executive Vice President, General Counsel (2016-2019) and Senior Vice President, Deputy General Counsel (2015-2016) of OppenheimerFunds (investment management company) and Deputy Chief Legal Officer (2013-2015) of Jennison Associates LLC (investment adviser firm).
Chris Maher (1972)
Year of Election or Appointment: 2016
Assistant Treasurer
Mr. Maher also serves as an officer of other funds. Mr. Maher serves as Assistant Treasurer of FMR Capital, Inc. (2017-present), and is an employee of Fidelity Investments (2008-present). Previously, Mr. Maher served as Assistant Treasurer of certain funds (2013-2020); Vice President of Asset Management Compliance (2013), Vice President of the Program Management Group of FMR (investment adviser firm, 2010-2013), and Vice President of Valuation Oversight (2008-2010).
Brett Segaloff (1972)
Year of Election or Appointment: 2021
Anti-Money Laundering (AML) Officer
Mr. Segaloff also serves as an AML Officer of other funds and other related entities. He is Director, Anti-Money Laundering (2007-present) of FMR LLC (diversified financial services company) and is an employee of Fidelity Investments (1996-present).
Stacie M. Smith (1974)
Year of Election or Appointment: 2020
President and Treasurer
Ms. Smith also serves as an officer of other funds. Ms. Smith serves as Assistant Treasurer of FMR Capital, Inc. (2017-present), is an employee of Fidelity Investments (2009-present), and has served in other fund officer roles. Prior to joining Fidelity Investments, Ms. Smith served as Senior Audit Manager of Ernst & Young LLP (accounting firm, 1996-2009). Previously, Ms. Smith served as Assistant Treasurer (2013-2019) and Deputy Treasurer (2013-2016) of certain Fidelity® funds.
Marc L. Spector (1972)
Year of Election or Appointment: 2016
Assistant Treasurer
Mr. Spector also serves as an officer of other funds. Mr. Spector serves as Assistant Treasurer of FMR Capital, Inc. (2017-present) and is an employee of Fidelity Investments (2016-present). Prior to joining Fidelity Investments, Mr. Spector served as Director at the Siegfried Group (accounting firm, 2013-2016), and prior to Siegfried Group as audit senior manager at Deloitte & Touche LLP (accounting firm, 2005-2013).
Jim Wegmann (1979)
Year of Election or Appointment: 2019
Assistant Treasurer
Mr. Wegmann also serves as Assistant Treasurer of other funds. Mr. Wegmann is an employee of Fidelity Investments (2011-present).
Shareholder Expense Example
As a shareholder, you incur two types of costs: (1) transaction costs, which may include sales charges (loads) on purchase payments or redemption proceeds, as applicable and (2) ongoing costs, which generally include management fees, distribution and/or service (12b-1) fees and other Fund expenses. This Example is intended to help you understand your ongoing costs (in dollars) of investing in a fund and to compare these costs with the ongoing costs of investing in other mutual funds.
The Example is based on an investment of $1,000 invested at the beginning of the period and held for the entire period (December 1, 2020 to May 31, 2021).
Actual Expenses
The first line of the accompanying table provides information about actual account values and actual expenses. You may use the information in this line, together with the amount you invested, to estimate the expenses that you paid over the period. Simply divide your account value by $1,000.00 (for example, an $8,600 account value divided by $1,000.00 = 8.6), then multiply the result by the number in the first line for a class/Fund under the heading entitled "Expenses Paid During Period" to estimate the expenses you paid on your account during this period. If any fund is a shareholder of any underlying mutual funds or exchange-traded funds (ETFs) (the Underlying Funds), such fund indirectly bears its proportional share of the expenses of the Underlying Funds in addition to the direct expenses incurred presented in the table. These fees and expenses are not included in the annualized expense ratio used to calculate the expense estimate in the table below.
Hypothetical Example for Comparison Purposes
The second line of the accompanying table provides information about hypothetical account values and hypothetical expenses based on the actual expense ratio and an assumed rate of return of 5% per year before expenses, which is not the actual return. The hypothetical account values and expenses may not be used to estimate the actual ending account balance or expenses you paid for the period. You may use this information to compare the ongoing costs of investing in the Fund and other funds. To do so, compare this 5% hypothetical example with the 5% hypothetical examples that appear in the shareholder reports of the other funds. If any fund is a shareholder of any Underlying Funds, such fund indirectly bears its proportional share of the expenses of the Underlying Funds in addition to the direct expenses as presented in the table. These fees and expenses are not included in the annualized expense ratio used to calculate the expense estimate in the table below.
Please note that the expenses shown in the table are meant to highlight your ongoing costs only and do not reflect any transaction costs. Therefore, the second line of the table is useful in comparing ongoing costs only, and will not help you determine the relative total costs of owning different funds.
| Annualized Expense Ratio-A | Beginning Account Value December 1, 2020 | Ending Account Value May 31, 2021 | Expenses Paid During Period-B December 1, 2020 to May 31, 2021 |
|
| Strategic Advisers Fidelity U.S. Total Stock Fund | .13% | |||
| Actual | $1,000.00 | $1,195.70 | $.71 | |
| Hypothetical-C | $1,000.00 | $1,024.28 | $.66 |
A Annualized expense ratio reflects expenses net of applicable fee waivers.
B Expenses are equal to the annualized expense ratio, multiplied by the average account value over the period, multiplied by 182/ 365 (to reflect the one-half year period). The fees and expenses of any Underlying Funds are not included in each annualized expense ratio.
C 5% return per year before expenses
Distributions (Unaudited)
The Board of Trustees of Strategic Advisers® Fidelity U.S. Total Stock Fund voted to pay on July 12, 2021, to shareholders of record at the opening of business on July 9, 2021, a distribution of $0.595 per share derived from capital gains realized from sales of portfolio securities and a dividend of $0.005 per share from net investment income.
The fund hereby designates as a capital gain dividend with respect to the taxable year ended May 31, 2021, $2,151,170,852, or, if subsequently determined to be different, the net capital gain of such year.
The fund designates 75% of the dividend distributed during the fiscal year as qualifying for the dividends–received deduction for corporate shareholders.
The fund designates 81% of the dividend distributed during the fiscal year as amounts which may be taken into account as a dividend for the purposes of the maximum rate under section 1(h)(11) of the Internal Revenue Code.
The fund designates 6% of the dividend distributed during the fiscal year as a section 199A dividend.
The fund will notify shareholders in January 2022 of amounts for use in preparing 2021 income tax returns.
Board Approval of Amended Sub-Advisory Agreements
Strategic Advisers Fidelity U.S. Total Stock Fund
In December 2020, the Board of Trustees, including the Independent Trustees (together, the Board) voted to approve an amendment to the fee schedules for certain investment mandates in the existing sub-advisory agreement among Strategic Advisers LLC (Strategic Advisers), FIAM LLC (FIAM), and Fidelity Rutland Square Trust II (Trust) on behalf of the fund (Amended Sub-Advisory Agreement). The Board noted that the updated fee schedules in the Amended Sub-Advisory Agreement will result in the same or lower fees at all asset levels. The Board also noted that no other material contract terms are impacted by the Amended Sub-Advisory Agreement. The Board, assisted by the advice of fund counsel and Independent Trustees' counsel, considered a broad range of information.In considering whether to approve the Amended Sub-Advisory Agreement, the Board reached a determination, with the assistance of fund counsel and Independent Trustees' counsel and through the exercise of its business judgment, that the approval of the Amended Sub-Advisory Agreement is in the best interests of the fund and its shareholders and that the approval of such agreement does not involve a conflict of interest from which Strategic Advisers or its affiliates derive an inappropriate advantage. Also, the Board found that the fees to be charged under the Amended Sub-Advisory Agreement bear a reasonable relationship to the services to be rendered and will be based on services provided that will be in addition to, rather than duplicative of services provided under the advisory contract of any underlying fund in which the fund may invest. The Board's decision to approve the Amended Sub-Advisory Agreement was not based on any single factor, but rather was based on a comprehensive consideration of all the information provided to the Board. In addition, individual Trustees did not necessarily attribute the same weight or importance to each factor. Nature, Extent, and Quality of Services Provided. The Board considered the backgrounds of the investment personnel that will provide services to the fund, and also considered the fund's investment objective, strategies and related investment philosophy and current sub-adviser line-up, as well as the structures of the investment personnel compensation programs and whether such structures provide appropriate incentives to act in the best interests of the fund, at its September 2020 meeting. The Board considered the detailed information provided by Strategic Advisers and FIAM in the June 2020 annual contract renewal materials.The Board noted that it had approved the existing sub-advisory agreement with FIAM at its September 2020 meeting and that the Amended Sub-Advisory Agreement will not result in any changes to: (i) the nature, extent and quality of the sub-advisory services provided; (ii) the investment process or strategies employed in the management of the fund's assets; or (iii) the day-to-day management of the fund or the persons primarily responsible for such management. Investment Performance. The Board did not consider performance to be a material factor in its decision to approve the Amended Sub-Advisory Agreement because the approval of the Amended Sub-Advisory Agreement will not result in any changes (i) to the fund's investment processes or strategies; or (ii) in the persons primarily responsible for the day-to-day management of the fund.Based on its review, the Board concluded that the nature, extent, and quality of services that will be provided to the fund under the Amended Sub-Advisory Agreement will continue to benefit the fund's shareholders.Competitiveness of Management Fee and Total Fund Expenses.
The Board noted that the Amended Sub-Advisory Agreement will not result in changes to the maximum aggregate annual management fee payable by the fund or Strategic Advisers' portion of the management fee. The Board considered Strategic Advisers' contractual agreement to waive its portion of the fund's management fee. The Board considered that the Amended Sub-Advisory Agreement is expected to result in a decrease in the total management fee rate of the fund. Based on its review, the Board concluded that the fund's management fee structure and any changes to projected total expenses bear a reasonable relationship to the services that the fund and its shareholders will receive and the other factors considered.Because the Amended Sub-Advisory Agreement was negotiated at arm's length and will have no impact on the maximum management fees payable by the fund, the Board did not consider the costs of services and profitability of the relationship with the fund to Strategic Advisers to be significant factors in its decision to approve the Amended Sub-Advisory Agreement. Potential Fall-Out Benefits. The Board considered that it reviews information regarding the potential of direct and indirect benefits to Strategic Advisers and its affiliates from their relationships with the fund, including non-advisory fee compensation paid to affiliates of Strategic Advisers, if any, as well as information regarding potential fall-out benefits accruing to each sub-adviser, if any, as a result of its relationship with the fund, during its annual renewal of the fund's management contract, sub-advisory agreements, and sub-subadvisory agreements. The Board considered Strategic Advisers' representation that it does not anticipate that the approval of the Amended Sub-Advisory Agreement will have a significant impact on the profitability of, or potential fall-out benefits to, Strategic Advisers or its affiliates. Possible Economies of Scale. The Board considered that it reviews whether there have been economies of scale in connection with the management of the fund during its annual renewal of the fund's management contract, sub-advisory agreements, and sub-subadvisory agreements. The Board also noted that it did not consider the possible realization of economies of scale to be a significant factor in its decision to approve the Amended Sub-Advisory Agreement because the fund will not bear any additional management fees or expenses under the Amended Sub-Advisory Agreement. Conclusion. Based on its evaluation of all of the conclusions noted above, and after considering all factors it believed relevant, the Board concluded that the Amended Sub-Advisory Agreement's fee structure bears a reasonable relationship to the services to be rendered and that the Amended Sub-Advisory Agreement is in the best interests of the fund and its shareholders and should be approved. The Board also concluded that the sub-advisory fees to be charged under the Amended Sub-Advisory Agreement will be based on services provided that will be in addition to, rather than duplicative of, services provided under the advisory contract of any underlying fund in which the fund may invest. In addition, the Board concluded that the approval of the Amended Sub-Advisory Agreement does not involve a conflict of interest from which Strategic Advisers or its affiliates derive an inappropriate advantage.Liquidity Risk Management Program
The Securities and Exchange Commission adopted Rule 22e-4 under the Investment Company Act of 1940 (the Liquidity Rule) to promote effective liquidity risk management throughout the open-end investment company industry, thereby reducing the risk that funds will be unable to meet their redemption obligations and mitigating dilution of the interests of fund shareholders.
The Fund has adopted and implemented a liquidity risk management program (the Program) reasonably designed to assess and manage the Fund’s liquidity risk and to comply with the requirements of the Liquidity Rule. The Fund’s Board of Trustees (the Board) has designated the Fund’s investment adviser as administrator of the Program. Strategic Advisers has established a Liquidity Risk Management Committee (the LRM Committee) to manage the Program for each of the Funds. The LRM Committee monitors the adequacy and effectiveness of implementation of the Program and on a periodic basis assesses each Fund’s liquidity risk based on a variety of factors including (1) the Fund’s investment strategy, (2) portfolio liquidity and cash flow projections during normal and reasonably foreseeable stressed conditions, (3) shareholder redemptions and (4) borrowings and other funding sources, as applicable.
In accordance with the Program, each of the Fund’s portfolio investments is classified into one of four liquidity categories described below based on a determination of a reasonable expectation for how long it would take to convert the investment to cash (or sell or dispose of the investment) without significantly changing its market value.
- Highly liquid investments – cash or convertible to cash within three business days or less
- Moderately liquid investments – convertible to cash in three to seven calendar days
- Less liquid investments – can be sold or disposed of, but not settled, within seven calendar days
- Illiquid investments – cannot be sold or disposed of within seven calendar days
Liquidity classification determinations take into account a variety of factors including various market, trading and investment-specific considerations, as well as market depth, and generally utilize analysis from a third-party liquidity metrics service.
The Liquidity Rule places a 15% limit on a fund’s illiquid investments and requires funds that do not primarily hold assets that are highly liquid investments to determine and maintain a minimum percentage of the fund’s net assets to be invested in highly liquid investments (highly liquid investment minimum or HLIM). The Program includes provisions reasonably designed to comply with the 15% limit on illiquid investments and for determining, periodically reviewing and complying with the HLIM requirement as applicable.
At a recent meeting of the Fund’s Board of Trustees, the LRM Committee provided a written report to the Board pertaining to the operation, adequacy, and effectiveness of implementation of the Program for the annual period from December 1, 2019 through November 30, 2020. The report concluded that the Program has been implemented and is operating effectively and is reasonably designed to assess and manage the Fund’s liquidity risk.
Proxy Voting Results
A special meeting of shareholders was held on November 2, 2020. The results of votes taken among shareholders on the proposals before them are reported below. Each vote reported represents one dollar of net asset value held on the record date for the meeting.
PROPOSAL 1
To elect a Board of Trustees.
| # of Votes | % of Votes |
|
| ROBERT A. LAWRENCE | ||
| Affirmative | 204,250,982,594.51 | 96.530 |
| Withheld | 7,343,512,146.85 | 3.470 |
| TOTAL | 211,594,494,741.36 | 100.000 |
| CHARLES S. MORRISON | ||
| Affirmative | 204,349,460,488.43 | 96.576 |
| Withheld | 7,245,034,252.93 | 3.424 |
| TOTAL | 211,594,494,741.36 | 100.000 |
| PETER C. ALDRICH | ||
| Affirmative | 203,499,803,652.67 | 96.175 |
| Withheld | 8,094,691,088.69 | 3.825 |
| TOTAL | 211,594,494,741.36 | 100.000 |
| MARY C. FARRELL | ||
| Affirmative | 204,011,925,737.22 | 96.417 |
| Withheld | 7,582,569,004.14 | 3.583 |
| TOTAL | 211,594,494,741.36 | 100.00 |
| KAREN KAPLAN | ||
| Affirmative | 204,297,547,550.53 | 96.552 |
| Withheld | 7,296,947,190.83 | 3.448 |
| TOTAL | 211,594,494,741.36 | 100.000 |
| CHRISTINE MARCKS | ||
| Affirmative | 204,700,871,317.72 | 96.743 |
| Withheld | 6,893,623,423.64 | 3.257 |
| TOTAL | 211,594,494,741.36 | 100.000 |
| HEIDI L. STEIGER | ||
| Affirmative | 204,406,589,957.28 | 96.603 |
| Withheld | 7,187,904,784.08 | 3.397 |
| TOTAL | 211,594,494,741.36 | 100.000 |
PROPOSAL 3
To approve a sub-advisory agreement among Strategic Advisers LLC (Strategic Advisers), FIL Investment Advisors (FIA), and Fidelity Rutland Square Trust II (the trust) and a sub-subadvisory agreement between FIA and FIL Investment Advisors (UK) Limited (FIA (UK)).
| # of Votes | % of Votes |
|
| Affirmative | 34,447,794,812.20 | 90.254 |
| Against | 1,646,630,202.93 | 4.314 |
| Abstain | 2,073,399,277.79 | 5.432 |
| Broker Non-Vote | 0.00 | 0.000 |
| TOTAL | 38,167,824,292.92 | 100.000 |
| Proposal 1 reflects trust wide proposal and voting results. |
![]()
TSF-ANN-0721
1.9887487.103
Strategic Advisers® Fidelity® Core Income Fund
Offered exclusively to certain managed account clients of Strategic Advisers LLC or its affiliates - not available for sale to the general public
May 31, 2021
Contents
To view a fund's proxy voting record for the 12-month period ended June 30, visit http://www.fidelity.com/proxyvotingresults or visit the Securities and Exchange Commission's (SEC) web site at http://www.sec.gov.
You may also call 1-800-544-3455 to request a free copy of the proxy voting guidelines.
Standard & Poor's, S&P and S&P 500 are registered service marks of The McGraw-Hill Companies, Inc. and have been licensed for use by Fidelity Distributors Corporation.
Other third-party marks appearing herein are the property of their respective owners.
All other marks appearing herein are registered or unregistered trademarks or service marks of FMR LLC or an affiliated company. © 2021 FMR LLC. All rights reserved.
This report and the financial statements contained herein are submitted for the general information of the shareholders of the Fund. This report is not authorized for distribution to prospective investors in the Fund unless preceded or accompanied by an effective prospectus.
A fund files its complete schedule of portfolio holdings with the SEC for the first and third quarters of each fiscal year on Form N-PORT. Forms N-PORT are available on the SEC’s web site at http://www.sec.gov. A fund's Forms N-PORT may be reviewed and copied at the SEC’s Public Reference Room in Washington, DC. Information regarding the operation of the SEC's Public Reference Room may be obtained by calling 1-800-SEC-0330.
For a complete list of a fund's portfolio holdings, view the most recent holdings listing, semiannual report, or annual report on Fidelity's web site at http://www.fidelity.com, http://www.institutional.fidelity.com, or http://www.401k.com, as applicable.
NOT FDIC INSURED •MAY LOSE VALUE •NO BANK GUARANTEE
Neither the Fund nor Fidelity Distributors Corporation is a bank.
Note to Shareholders:
Early in 2020, the outbreak and spread of a new coronavirus emerged as a public health emergency that had a major influence on financial markets, primarily based on its impact on the global economy and the outlook for corporate earnings. The virus causes a respiratory disease known as COVID-19. On March 11, 2020 the World Health Organization declared the COVID-19 outbreak a pandemic, citing sustained risk of further global spread.
In the weeks following, as the crisis worsened, we witnessed an escalating human tragedy with wide-scale social and economic consequences from coronavirus-containment measures. The outbreak of COVID-19 prompted a number of measures to limit the spread, including travel and border restrictions, quarantines, and restrictions on large gatherings. In turn, these resulted in lower consumer activity, diminished demand for a wide range of products and services, disruption in manufacturing and supply chains, and – given the wide variability in outcomes regarding the outbreak – significant market uncertainty and volatility. Amid the turmoil, global governments and central banks took unprecedented action to help support consumers, businesses, and the broader economies, and to limit disruption to financial systems.
The situation continues to unfold, and the extent and duration of its impact on financial markets and the economy remain highly uncertain. Extreme events such as the coronavirus crisis are “exogenous shocks” that can have significant adverse effects on mutual funds and their investments. Although multiple asset classes may be affected by market disruption, the duration and impact may not be the same for all types of assets.
Fidelity is committed to helping you stay informed amid news about COVID-19 and during increased market volatility, and we’re taking extra steps to be responsive to customer needs. We encourage you to visit our websites, where we offer ongoing updates, commentary, and analysis on the markets and our funds.
Performance: The Bottom Line
Average annual total return reflects the change in the value of an investment, assuming reinvestment of distributions from dividend income and capital gains (the profits earned upon the sale of securities that have grown in value, if any) and assuming a constant rate of performance each year. The hypothetical investment and the average annual total returns do not reflect the deduction of taxes that a shareholder would pay on fund distributions or the redemption of fund shares. During periods of reimbursement by Fidelity, a fund’s total return will be greater than it would be had the reimbursement not occurred. How a fund did yesterday is no guarantee of how it will do tomorrow.
Average Annual Total Returns
| For the periods ended May 31, 2021 | Past 1 year | Life of fundA |
| Strategic Advisers® Fidelity® Core Income Fund | 3.10% | 7.10% |
A From October 16, 2018
The chart shows how the value of your investment would have changed, and also shows how the Bloomberg Barclays U.S. Aggregate Bond Index performed over the same period.

| Period Ending Values | ||
|
| $11,973 | Strategic Advisers® Fidelity® Core Income Fund |
|
| $11,674 | Bloomberg Barclays U.S. Aggregate Bond Index |
Management's Discussion of Fund Performance
Market Recap: U.S. taxable investment-grade bonds posted a modest decline for the 12 months ending May 31, 2021, hampered by rising long-term market rates amid faster economic expansion in a risk-on market environment. The Bloomberg Barclays U.S. Aggregate Bond Index returned -0.40% for the period. Aggressive intervention by the U.S. Federal Reserve boosted market liquidity and led to a broad rally for fixed-income assets from the start of the period through July 2020. Long-term yields reached a historic low in August 2020, and spreads widened modestly amid healthy issuance of new corporate bonds. Spreads then narrowed and yields rose through the early spring, before each moderated slightly beginning in April through the end of May. In February 2021, yields rose the most because a $1.9 trillion COVID-relief bill offered hopes for a broad economic recovery but led to rising inflation expectations, which persisted through period end. Within the Bloomberg Barclays index, corporate bonds advanced 3.64% for the 12 months, significantly topping the -3.75% return of U.S. Treasuries. Securitized sectors, meanwhile, roughly broke even. Outside the index, U.S. corporate high-yield bonds added 14.96% and Treasury Inflation-Protected Securities (TIPS) rose 7.05%. Comments from Portfolio Manager Jonathan Duggan: For the fiscal year ending May 31, 2021, the Fund gained 3.10%, handily outpacing the -0.40% return of the benchmark Bloomberg Barclays U.S. Aggregate Bond Index. As risk sentiment improved late in 2020, continuing through the remainder of the period, high-yield and investment-grade (IG) corporate credit, commercial mortgage-backed bonds and non-agency mortgage-backed securities (MBS) performed well. Conversely, rising bond yields hampered longer-term U.S. Treasuries. Within the Fund, Fidelity® SAI Total Bond Fund (+4%) was the top relative contributor, aided by a sizable overweighting in IG corporate bonds during the early months of the period. This fund also benefited from having lower interest-rate sensitivity than the broader Fund’s benchmark. The Core Investment Grade Strategy from sub-adviser FIAM® (+4%) also added value versus the benchmark. An overweighted allocation to IG corporate bonds – particularly those with BBB credit ratings – along with favorable interest-rate positioning, helped this manager outperform. Elsewhere, small positions in Fidelity® Real Estate Income Fund (+36%) – a new addition during the period – and Fidelity New Markets Income Fund (+11%), which focuses on emerging-markets debt, each provided a notable boost on a relative basis. On the downside, Fidelity SAI Long-Term Treasury Fund (-14%) was the primary relative detractor. That said, I hold U.S. Treasury investments for liquidity purposes and to help hedge the portfolio during periods of market volatility. As of May 31, the portfolio was positioned with the expectation that economic growth will strengthen in the months ahead. Given the extended valuation of investment-grade credit, I do not plan to add risk in that area. However, I increased our position in the Fixed Income Securitized strategy managed by FIAM. I also slightly added to our U.S. Treasury funds allocation as interest rates rose in order to have more liquidity to invest should we see a market correction.The views expressed above reflect those of the portfolio manager(s) only through the end of the period as stated on the cover of this report and do not necessarily represent the views of Fidelity or any other person in the Fidelity organization. Any such views are subject to change at any time based upon market or other conditions and Fidelity disclaims any responsibility to update such views. These views may not be relied on as investment advice and, because investment decisions for a Fidelity fund are based on numerous factors, may not be relied on as an indication of trading intent on behalf of any Fidelity fund.
Investment Summary (Unaudited)
The information in the following tables is based on the direct investments of the Fund.Top Ten Holdings as of May 31, 2021
| (by issuer, excluding cash equivalents) | % of fund's net assets |
| Fidelity SAI Total Bond Fund | 29.8 |
| U.S. Treasury Obligations | 7.5 |
| Fidelity SAI U.S. Treasury Bond Index Fund | 6.6 |
| Ginnie Mae | 5.2 |
| Fannie Mae | 3.9 |
| Freddie Mac | 3.4 |
| Fidelity SAI Long-Term Treasury Bond Index Fund | 3.2 |
| Fidelity U.S. Bond Index Fund | 2.9 |
| Uniform Mortgage Backed Securities | 2.8 |
| Fidelity Corporate Bond Fund | 2.3 |
Asset Allocation (% of fund's net assets)
| As of May 31, 2021 | ||
| Corporate Bonds | 11.8% | |
| U.S. Government and U.S. Government Agency Obligations | 27.1% | |
| Asset-Backed Securities | 2.2% | |
| CMOs and Other Mortgage Related Securities | 3.1% | |
| Municipal Securities | 0.1% | |
| Bank Loan Funds | 2.2% | |
| High Yield Fixed-Income Funds | 2.8% | |
| Intermediate-Term Bond Funds | 34.4% | |
| Investment Grade Fixed-Income Funds | 2.3% | |
| Long Government Bond Funds | 3.2% | |
| Sector Funds | 1.8% | |
| Other Investments | 0.9% | |
| Short-Term Investments and Net Other Assets (Liabilities) | 1.5% | |
| Intermediate Government Funds | 6.6% | |

Asset allocations of funds in the pie chart reflect the categorizations of assets as defined by Morningstar as of the reporting date.
Percentages in the above tables are adjusted for the effect of TBA Sale Commitments.
Percentages are adjusted for the effect of futures contracts and swaps, if applicable.
Schedule of Investments May 31, 2021
Showing Percentage of Net Assets
| Nonconvertible Bonds - 11.8% | |||
| Principal Amount | Value | ||
| COMMUNICATION SERVICES - 1.3% | |||
| Diversified Telecommunication Services - 0.4% | |||
| Altice France SA: | |||
| 5.125% 1/15/29 (a) | $720,000 | $712,800 | |
| 7.375% 5/1/26 (a) | 547,000 | 568,836 | |
| 8.125% 2/1/27 (a) | 325,000 | 354,250 | |
| AT&T, Inc.: | |||
| 2.55% 12/1/33 (a) | 2,825,000 | 2,728,493 | |
| 3.8% 12/1/57 (a) | 39,772,000 | 39,165,437 | |
| 4.3% 2/15/30 | 3,992,000 | 4,544,478 | |
| 4.75% 5/15/46 | 41,310,000 | 48,261,670 | |
| 4.9% 6/15/42 | 6,909,000 | 8,172,028 | |
| 5.55% 8/15/41 | 12,537,000 | 16,038,932 | |
| 6.2% 3/15/40 | 2,303,000 | 3,043,213 | |
| C&W Senior Financing Designated Activity Co.: | |||
| 6.875% 9/15/27 (a) | 1,246,000 | 1,326,990 | |
| 7.5% 10/15/26 (a) | 1,565,000 | 1,643,250 | |
| Frontier Communications Corp. 5.875% 10/15/27 (a) | 235,000 | 249,688 | |
| Level 3 Financing, Inc.: | |||
| 3.625% 1/15/29 (a) | 85,000 | 81,706 | |
| 4.25% 7/1/28 (a) | 2,240,000 | 2,244,816 | |
| Lumen Technologies, Inc.: | |||
| 5.125% 12/15/26 (a) | 2,190,000 | 2,268,703 | |
| 5.625% 4/1/25 | 415,000 | 445,195 | |
| 6.875% 1/15/28 | 40,000 | 44,500 | |
| Sable International Finance Ltd. 5.75% 9/7/27 (a) | 2,595,000 | 2,734,352 | |
| Sprint Capital Corp.: | |||
| 6.875% 11/15/28 | 5,880,000 | 7,356,233 | |
| 8.75% 3/15/32 | 1,315,000 | 1,949,488 | |
| Telecom Italia Capital SA: | |||
| 6% 9/30/34 | 286,000 | 316,030 | |
| 7.2% 7/18/36 | 1,635,000 | 2,025,871 | |
| Telenet Finance Luxembourg Notes SARL 5.5% 3/1/28 (a) | 800,000 | 842,400 | |
| Verizon Communications, Inc.: | |||
| 2.987% 10/30/56 | 1,378,000 | 1,227,668 | |
| 4.329% 9/21/28 | 10,293,000 | 11,830,323 | |
| 5.012% 4/15/49 | 129,000 | 163,234 | |
| Virgin Media Finance PLC 5% 7/15/30 (a) | 636,000 | 633,324 | |
| 160,973,908 | |||
| Entertainment - 0.1% | |||
| The Walt Disney Co.: | |||
| 2.2% 1/13/28 | 10,316,000 | 10,610,104 | |
| 2.65% 1/13/31 | 13,000,000 | 13,416,692 | |
| 24,026,796 | |||
| Interactive Media & Services - 0.0% | |||
| Twitter, Inc. 3.875% 12/15/27 (a) | 510,000 | 538,050 | |
| Media - 0.7% | |||
| Altice Financing SA: | |||
| 5% 1/15/28 (a) | 225,000 | 223,283 | |
| 7.5% 5/15/26 (a) | 819,000 | 851,504 | |
| CCO Holdings LLC/CCO Holdings Capital Corp.: | |||
| 4.25% 2/1/31 (a) | 940,000 | 938,120 | |
| 4.5% 8/15/30 (a) | 435,000 | 443,278 | |
| 4.5% 5/1/32 | 2,380,000 | 2,401,063 | |
| 4.5% 6/1/33 (a) | 500,000 | 498,895 | |
| 5% 2/1/28 (a) | 2,401,000 | 2,512,046 | |
| Charter Communications Operating LLC/Charter Communications Operating Capital Corp.: | |||
| 2.8% 4/1/31 | 25,100,000 | 25,049,804 | |
| 3.7% 4/1/51 | 20,100,000 | 18,876,856 | |
| 4.464% 7/23/22 | 5,986,000 | 6,220,817 | |
| 4.8% 3/1/50 | 10,000,000 | 10,975,220 | |
| 4.908% 7/23/25 | 4,642,000 | 5,278,622 | |
| 5.375% 5/1/47 | 41,310,000 | 48,215,558 | |
| 5.75% 4/1/48 | 18,275,000 | 22,332,497 | |
| Comcast Corp.: | |||
| 3.75% 4/1/40 | 1,000,000 | 1,097,421 | |
| 4.65% 7/15/42 | 2,578,000 | 3,143,877 | |
| CSC Holdings LLC: | |||
| 4.125% 12/1/30 (a) | 510,000 | 498,423 | |
| 4.625% 12/1/30 (a) | 410,000 | 397,249 | |
| 5.5% 4/15/27 (a) | 564,000 | 592,200 | |
| 5.75% 1/15/30 (a) | 875,000 | 913,325 | |
| Diamond Sports Group LLC/Diamond Sports Finance Co. 5.375% 8/15/26 (a) | 475,000 | 351,495 | |
| Discovery Communications LLC: | |||
| 3.625% 5/15/30 | 6,407,000 | 6,847,114 | |
| 4.65% 5/15/50 | 17,335,000 | 19,252,267 | |
| Fox Corp.: | |||
| 5.476% 1/25/39 | 2,264,000 | 2,821,569 | |
| 5.576% 1/25/49 | 1,502,000 | 1,918,978 | |
| Gray Television, Inc. 4.75% 10/15/30 (a) | 245,000 | 240,668 | |
| Lamar Media Corp. 3.625% 1/15/31 (a) | 515,000 | 495,646 | |
| Meredith Corp. 6.5% 7/1/25 (a) | 615,000 | 662,509 | |
| Scripps Escrow II, Inc. 3.875% 1/15/29 (a) | 225,000 | 218,813 | |
| Sirius XM Radio, Inc.: | |||
| 4.125% 7/1/30 (a) | 155,000 | 155,388 | |
| 5% 8/1/27 (a) | 375,000 | 391,875 | |
| 5.5% 7/1/29 (a) | 2,890,000 | 3,128,425 | |
| Tegna, Inc.: | |||
| 4.625% 3/15/28 | 915,000 | 934,444 | |
| 5% 9/15/29 | 115,000 | 117,731 | |
| Time Warner Cable LLC: | |||
| 4% 9/1/21 | 12,819,000 | 12,852,525 | |
| 4.5% 9/15/42 | 886,000 | 956,542 | |
| 5.5% 9/1/41 | 1,530,000 | 1,840,171 | |
| 5.875% 11/15/40 | 8,089,000 | 10,150,905 | |
| 6.55% 5/1/37 | 5,846,000 | 7,755,081 | |
| 6.75% 6/15/39 | 4,614,000 | 6,302,997 | |
| 7.3% 7/1/38 | 3,785,000 | 5,358,758 | |
| Virgin Media Secured Finance PLC: | |||
| 4.5% 8/15/30 (a) | 585,000 | 583,538 | |
| 5.5% 5/15/29 (a) | 415,000 | 444,050 | |
| Ziggo Bond Co. BV 5.125% 2/28/30 (a) | 540,000 | 548,100 | |
| Ziggo BV: | |||
| 4.875% 1/15/30 (a) | 550,000 | 563,613 | |
| 5.5% 1/15/27 (a) | 1,083,000 | 1,122,259 | |
| 237,475,519 | |||
| Wireless Telecommunication Services - 0.1% | |||
| Millicom International Cellular SA: | |||
| 4.5% 4/27/31 (a) | 200,000 | 208,610 | |
| 5.125% 1/15/28 (a) | 540,000 | 568,114 | |
| 6.625% 10/15/26 (a) | 665,436 | 706,943 | |
| T-Mobile U.S.A., Inc.: | |||
| 2.875% 2/15/31 | 695,000 | 670,216 | |
| 3.75% 4/15/27 | 10,840,000 | 11,916,520 | |
| 3.875% 4/15/30 | 22,877,000 | 25,074,565 | |
| 4.5% 4/15/50 | 4,597,000 | 5,202,241 | |
| 44,347,209 | |||
| TOTAL COMMUNICATION SERVICES | 467,361,482 | ||
| CONSUMER DISCRETIONARY - 0.6% | |||
| Auto Components - 0.0% | |||
| Allison Transmission, Inc. 3.75% 1/30/31 (a) | 615,000 | 590,400 | |
| Automobiles - 0.2% | |||
| General Motors Co. 5.4% 10/2/23 | 18,263,000 | 20,200,356 | |
| General Motors Financial Co., Inc.: | |||
| 3.7% 5/9/23 | 8,751,000 | 9,217,191 | |
| 4.25% 5/15/23 | 1,359,000 | 1,451,414 | |
| 4.375% 9/25/21 | 5,310,000 | 5,377,443 | |
| 5.2% 3/20/23 | 11,203,000 | 12,112,106 | |
| Volkswagen Group of America Finance LLC: | |||
| 2.9% 5/13/22 (a) | 10,524,000 | 10,776,047 | |
| 3.125% 5/12/23 (a) | 9,168,000 | 9,645,137 | |
| 3.35% 5/13/25 (a) | 14,765,000 | 15,992,758 | |
| 84,772,452 | |||
| Diversified Consumer Services - 0.0% | |||
| Adtalem Global Education, Inc. 5.5% 3/1/28 (a) | 825,000 | 824,126 | |
| GEMS MENASA Cayman Ltd. 7.125% 7/31/26 (a) | 765,000 | 801,338 | |
| Service Corp. International 5.125% 6/1/29 | 970,000 | 1,049,928 | |
| 2,675,392 | |||
| Hotels, Restaurants & Leisure - 0.1% | |||
| Aramark Services, Inc.: | |||
| 4.75% 6/1/26 | 843,000 | 863,021 | |
| 5% 2/1/28 (a) | 3,530,000 | 3,643,622 | |
| 6.375% 5/1/25 (a) | 1,890,000 | 2,008,125 | |
| Carnival Corp. 10.5% 2/1/26 (a) | 1,105,000 | 1,303,215 | |
| Hilton Domestic Operating Co., Inc.: | |||
| 3.625% 2/15/32 (a) | 660,000 | 645,860 | |
| 4% 5/1/31 (a) | 1,535,000 | 1,548,032 | |
| Hilton Worldwide Finance LLC/Hilton Worldwide Finance Corp. 4.875% 4/1/27 | 164,000 | 170,836 | |
| MCE Finance Ltd.: | |||
| 4.875% 6/6/25 (a) | 750,000 | 769,223 | |
| 5.375% 12/4/29 (a) | 260,000 | 277,420 | |
| 5.75% 7/21/28 (a) | 390,000 | 415,545 | |
| MGM Resorts International 5.75% 6/15/25 | 820,000 | 900,975 | |
| Royal Caribbean Cruises Ltd.: | |||
| 5.5% 4/1/28 (a) | 755,000 | 794,638 | |
| 9.125% 6/15/23 (a) | 130,000 | 143,806 | |
| 11.5% 6/1/25 (a) | 545,000 | 630,838 | |
| Starbucks Corp. 1.3% 5/7/22 | 5,502,000 | 5,558,043 | |
| Wyndham Hotels & Resorts, Inc. 4.375% 8/15/28 (a) | 290,000 | 296,525 | |
| Wynn Las Vegas LLC/Wynn Las Vegas Capital Corp. 5.5% 3/1/25 (a) | 645,000 | 687,731 | |
| Wynn Macau Ltd.: | |||
| 4.875% 10/1/24 (a) | 497,000 | 505,480 | |
| 5.5% 10/1/27 (a) | 425,000 | 444,125 | |
| 21,607,060 | |||
| Household Durables - 0.2% | |||
| Lennar Corp.: | |||
| 4.75% 11/29/27 | 9,429,000 | 10,904,120 | |
| 5% 6/15/27 | 12,243,000 | 14,188,413 | |
| 5.25% 6/1/26 | 2,965,000 | 3,424,575 | |
| Newell Brands, Inc.: | |||
| 5.875% 4/1/36 | 270,000 | 335,186 | |
| 6% 4/1/46 | 1,185,000 | 1,501,988 | |
| Toll Brothers Finance Corp.: | |||
| 4.35% 2/15/28 | 14,431,000 | 15,699,341 | |
| 4.875% 11/15/25 | 45,000 | 50,529 | |
| 4.875% 3/15/27 | 15,464,000 | 17,480,970 | |
| 63,585,122 | |||
| Internet & Direct Marketing Retail - 0.0% | |||
| Alibaba Group Holding Ltd.: | |||
| 2.125% 2/9/31 | 2,350,000 | 2,281,662 | |
| 2.7% 2/9/41 | 12,255,000 | 11,330,973 | |
| Match Group Holdings II LLC 4.125% 8/1/30 (a) | 170,000 | 169,091 | |
| 13,781,726 | |||
| Leisure Products - 0.0% | |||
| Hasbro, Inc.: | |||
| 2.6% 11/19/22 | 2,845,000 | 2,930,703 | |
| 3% 11/19/24 | 6,474,000 | 6,908,602 | |
| Mattel, Inc.: | |||
| 3.75% 4/1/29 (a) | 430,000 | 440,200 | |
| 5.45% 11/1/41 | 70,000 | 79,188 | |
| 6.2% 10/1/40 | 531,000 | 646,493 | |
| 11,005,186 | |||
| Multiline Retail - 0.0% | |||
| Nordstrom, Inc. 4.375% 4/1/30 | 510,000 | 523,387 | |
| Specialty Retail - 0.1% | |||
| AutoNation, Inc. 4.75% 6/1/30 | 1,430,000 | 1,682,500 | |
| AutoZone, Inc. 4% 4/15/30 | 19,121,000 | 21,424,644 | |
| 23,107,144 | |||
| Textiles, Apparel & Luxury Goods - 0.0% | |||
| Hanesbrands, Inc. 4.875% 5/15/26 (a) | 615,000 | 658,696 | |
| Levi Strauss & Co. 3.5% 3/1/31 (a) | 355,000 | 349,583 | |
| The William Carter Co. 5.625% 3/15/27 (a) | 446,000 | 467,185 | |
| Wolverine World Wide, Inc. 6.375% 5/15/25 (a) | 645,000 | 686,119 | |
| 2,161,583 | |||
| TOTAL CONSUMER DISCRETIONARY | 223,809,452 | ||
| CONSUMER STAPLES - 1.0% | |||
| Beverages - 0.4% | |||
| Anheuser-Busch InBev Finance, Inc.: | |||
| 4.7% 2/1/36 | 6,600,000 | 7,856,587 | |
| 4.9% 2/1/46 | 14,391,000 | 17,181,812 | |
| Anheuser-Busch InBev Worldwide, Inc.: | |||
| 3.5% 6/1/30 | 10,375,000 | 11,357,761 | |
| 4.35% 6/1/40 | 6,274,000 | 7,161,311 | |
| 4.5% 6/1/50 | 11,500,000 | 13,193,851 | |
| 4.6% 6/1/60 | 18,803,000 | 21,617,464 | |
| 4.75% 1/23/29 | 11,220,000 | 13,228,774 | |
| 4.75% 4/15/58 | 5,641,000 | 6,587,826 | |
| 5.45% 1/23/39 | 5,480,000 | 6,939,708 | |
| 5.55% 1/23/49 | 13,389,000 | 17,501,855 | |
| 5.8% 1/23/59 (Reg. S) | 14,304,000 | 19,428,150 | |
| Constellation Brands, Inc. 4.75% 11/15/24 | 3,799,000 | 4,299,939 | |
| PepsiCo, Inc.: | |||
| 2.625% 3/19/27 | 1,114,000 | 1,201,514 | |
| 2.75% 3/19/30 | 5,700,000 | 6,075,114 | |
| 153,631,666 | |||
| Food & Staples Retailing - 0.2% | |||
| Albertsons Companies LLC/Safeway, Inc./New Albertson's, Inc./Albertson's LLC: | |||
| 3.5% 3/15/29 (a) | 2,020,000 | 1,937,180 | |
| 4.625% 1/15/27 (a) | 125,000 | 129,375 | |
| 4.875% 2/15/30 (a) | 330,000 | 343,926 | |
| Sysco Corp. 6.6% 4/1/50 | 53,060,000 | 79,749,857 | |
| U.S. Foods, Inc. 6.25% 4/15/25 (a) | 445,000 | 471,495 | |
| Walgreens Boots Alliance, Inc. 3.3% 11/18/21 | 1,926,000 | 1,942,462 | |
| 84,574,295 | |||
| Food Products - 0.4% | |||
| Darling Ingredients, Inc. 5.25% 4/15/27 (a) | 615,000 | 642,675 | |
| General Mills, Inc. 2.875% 4/15/30 | 1,277,000 | 1,335,980 | |
| JBS U.S.A. LLC/JBS U.S.A. Finance, Inc. 6.75% 2/15/28 (a) | 269,000 | 294,219 | |
| JBS U.S.A. Lux SA / JBS Food Co.: | |||
| 5.5% 1/15/30 (a) | 23,280,000 | 25,608,233 | |
| 6.5% 4/15/29 (a) | 32,201,000 | 36,105,371 | |
| Kraft Heinz Foods Co.: | |||
| 3.875% 5/15/27 | 560,000 | 612,995 | |
| 4.25% 3/1/31 | 525,000 | 583,772 | |
| 4.375% 6/1/46 | 11,995,000 | 12,862,813 | |
| 4.625% 1/30/29 | 10,000,000 | 11,308,800 | |
| 4.875% 10/1/49 | 10,000,000 | 11,492,027 | |
| 5% 7/15/35 | 2,215,000 | 2,615,150 | |
| 5.2% 7/15/45 | 6,203,000 | 7,324,780 | |
| 7.125% 8/1/39 (a) | 9,489,000 | 13,408,542 | |
| Lamb Weston Holdings, Inc. 4.875% 5/15/28 (a) | 825,000 | 906,469 | |
| Post Holdings, Inc. 4.625% 4/15/30 (a) | 905,000 | 910,168 | |
| TreeHouse Foods, Inc. 4% 9/1/28 | 390,000 | 387,820 | |
| 126,399,814 | |||
| Personal Products - 0.0% | |||
| Prestige Brands, Inc. 3.75% 4/1/31 (a) | 340,000 | 326,400 | |
| TOTAL CONSUMER STAPLES | 364,932,175 | ||
| ENERGY - 1.0% | |||
| Oil, Gas & Consumable Fuels - 1.0% | |||
| Apache Corp.: | |||
| 4.25% 1/15/30 | 120,000 | 120,900 | |
| 4.75% 4/15/43 | 805,000 | 796,105 | |
| 5.1% 9/1/40 | 330,000 | 340,550 | |
| 5.25% 2/1/42 | 495,000 | 513,761 | |
| 5.35% 7/1/49 | 80,000 | 82,023 | |
| Canadian Natural Resources Ltd. 3.45% 11/15/21 | 2,648,000 | 2,665,127 | |
| Cheniere Energy Partners LP: | |||
| 4% 3/1/31 (a) | 925,000 | 954,785 | |
| 5.625% 10/1/26 | 1,835,000 | 1,910,694 | |
| Cheniere Energy, Inc. 4.625% 10/15/28 (a) | 595,000 | 624,750 | |
| Citgo Petroleum Corp. 6.375% 6/15/26 (a) | 660,000 | 676,500 | |
| Columbia Pipeline Group, Inc. 4.5% 6/1/25 | 852,000 | 961,046 | |
| Continental Resources, Inc. 5.75% 1/15/31 (a) | 895,000 | 1,050,309 | |
| Crestwood Midstream Partners LP/Crestwood Midstream Finance Corp.: | |||
| 5.625% 5/1/27 (a) | 1,653,000 | 1,702,590 | |
| 5.75% 4/1/25 | 2,038,000 | 2,088,339 | |
| 6% 2/1/29 (a) | 1,420,000 | 1,469,700 | |
| CVR Energy, Inc.: | |||
| 5.25% 2/15/25 (a) | 790,000 | 790,000 | |
| 5.75% 2/15/28 (a) | 105,000 | 105,263 | |
| DCP Midstream Operating LP: | |||
| 3.875% 3/15/23 | 3,116,000 | 3,234,408 | |
| 4.75% 9/30/21 (a) | 2,233,000 | 2,238,583 | |
| 5.125% 5/15/29 | 1,740,000 | 1,875,546 | |
| 5.375% 7/15/25 | 540,000 | 591,516 | |
| 5.6% 4/1/44 | 2,748,000 | 2,872,265 | |
| 5.625% 7/15/27 | 620,000 | 682,000 | |
| 5.85% 5/21/43 (a)(b) | 4,466,000 | 4,086,390 | |
| 6.45% 11/3/36 (a) | 210,000 | 239,312 | |
| 8.125% 8/16/30 | 15,000 | 19,533 | |
| EG Global Finance PLC 6.75% 2/7/25 (a) | 530,000 | 541,501 | |
| Enable Midstream Partners LP 3.9% 5/15/24 (b) | 869,000 | 929,839 | |
| Enbridge Energy Partners LP 4.2% 9/15/21 | 2,622,000 | 2,625,700 | |
| Enbridge, Inc.: | |||
| 4% 10/1/23 | 3,854,000 | 4,122,789 | |
| 4.25% 12/1/26 | 1,461,000 | 1,645,430 | |
| Endeavor Energy Resources LP/EER Finance, Inc.: | |||
| 5.5% 1/30/26 (a) | 45,000 | 46,463 | |
| 5.75% 1/30/28 (a) | 435,000 | 460,047 | |
| 6.625% 7/15/25 (a) | 110,000 | 116,617 | |
| Energy Transfer LP: | |||
| 3.75% 5/15/30 | 3,643,000 | 3,877,589 | |
| 4.2% 9/15/23 | 1,203,000 | 1,289,173 | |
| 4.25% 3/15/23 | 1,393,000 | 1,466,620 | |
| 4.5% 4/15/24 | 1,576,000 | 1,726,935 | |
| 4.95% 6/15/28 | 4,103,000 | 4,696,561 | |
| 5% 5/15/50 | 7,800,000 | 8,614,869 | |
| 5.25% 4/15/29 | 2,564,000 | 2,986,817 | |
| 5.4% 10/1/47 | 1,732,000 | 1,965,426 | |
| 5.8% 6/15/38 | 2,288,000 | 2,725,477 | |
| 6% 6/15/48 | 1,490,000 | 1,803,067 | |
| 6.25% 4/15/49 | 1,761,000 | 2,197,869 | |
| EnLink Midstream LLC 5.625% 1/15/28 (a) | 105,000 | 109,300 | |
| EnLink Midstream Partners LP: | |||
| 5.05% 4/1/45 | 140,000 | 118,300 | |
| 5.45% 6/1/47 | 290,000 | 254,359 | |
| 5.6% 4/1/44 | 490,000 | 438,197 | |
| EQM Midstream Partners LP: | |||
| 4.75% 1/15/31 (a) | 550,000 | 553,438 | |
| 5.5% 7/15/28 | 440,000 | 469,762 | |
| 6.5% 7/1/27 (a) | 465,000 | 511,105 | |
| 6.5% 7/15/48 | 265,000 | 281,351 | |
| EQT Corp. 3.9% 10/1/27 | 405,000 | 432,500 | |
| Global Partners LP/GLP Finance Corp. 7% 8/1/27 | 1,200,000 | 1,269,000 | |
| Hess Corp.: | |||
| 4.3% 4/1/27 | 1,341,000 | 1,492,737 | |
| 5.6% 2/15/41 | 2,100,000 | 2,530,496 | |
| 5.8% 4/1/47 | 5,019,000 | 6,280,183 | |
| 7.125% 3/15/33 | 1,403,000 | 1,874,059 | |
| 7.3% 8/15/31 | 1,709,000 | 2,273,062 | |
| 7.875% 10/1/29 | 4,789,000 | 6,452,333 | |
| Hess Midstream Partners LP: | |||
| 5.125% 6/15/28 (a) | 780,000 | 818,376 | |
| 5.625% 2/15/26 (a) | 1,503,000 | 1,558,100 | |
| Hilcorp Energy I LP/Hilcorp Finance Co. 6.25% 11/1/28 (a) | 185,000 | 194,250 | |
| Holly Energy Partners LP/Holly Energy Finance Corp. 5% 2/1/28 (a) | 910,000 | 932,750 | |
| Kinder Morgan Energy Partners LP 5% 10/1/21 | 1,456,000 | 1,461,581 | |
| MPLX LP: | |||
| 3 month U.S. LIBOR + 1.100% 1.2854% 9/9/22 (b)(c) | 3,392,000 | 3,394,069 | |
| 4.8% 2/15/29 | 1,376,000 | 1,595,083 | |
| 4.875% 12/1/24 | 1,974,000 | 2,226,921 | |
| 5.5% 2/15/49 | 4,129,000 | 5,099,832 | |
| Murphy Oil U.S.A., Inc. 3.75% 2/15/31 (a) | 110,000 | 106,929 | |
| New Fortress Energy, Inc. 6.5% 9/30/26 (a) | 650,000 | 654,063 | |
| Occidental Petroleum Corp.: | |||
| 2.9% 8/15/24 | 6,978,000 | 6,960,555 | |
| 3.2% 8/15/26 | 865,000 | 833,644 | |
| 3.4% 4/15/26 | 310,000 | 302,250 | |
| 3.5% 8/15/29 | 3,191,000 | 2,991,563 | |
| 4.2% 3/15/48 | 310,000 | 254,592 | |
| 4.3% 8/15/39 | 562,000 | 480,510 | |
| 4.4% 4/15/46 | 480,000 | 412,234 | |
| 4.4% 8/15/49 | 3,942,000 | 3,311,280 | |
| 5.55% 3/15/26 | 5,734,000 | 6,121,045 | |
| 6.125% 1/1/31 | 365,000 | 404,840 | |
| 6.2% 3/15/40 | 160,000 | 168,800 | |
| 6.45% 9/15/36 | 5,135,000 | 5,784,167 | |
| 6.6% 3/15/46 | 4,886,000 | 5,344,258 | |
| 7.5% 5/1/31 | 7,400,000 | 8,801,634 | |
| 7.875% 9/15/31 | 100,000 | 121,554 | |
| 8.875% 7/15/30 | 345,000 | 442,256 | |
| Ovintiv, Inc.: | |||
| 5.15% 11/15/41 | 3,000,000 | 3,198,311 | |
| 8.125% 9/15/30 | 5,649,000 | 7,689,197 | |
| PBF Holding Co. LLC/PBF Finance Corp. 9.25% 5/15/25 (a) | 1,500,000 | 1,537,500 | |
| Petroleos Mexicanos: | |||
| 6.35% 2/12/48 | 1,560,000 | 1,314,105 | |
| 6.49% 1/23/27 | 3,630,000 | 3,875,570 | |
| 6.5% 3/13/27 | 4,256,000 | 4,544,174 | |
| 6.75% 9/21/47 | 22,490,000 | 19,874,413 | |
| 6.84% 1/23/30 | 15,264,000 | 15,781,297 | |
| 6.95% 1/28/60 | 7,166,000 | 6,295,331 | |
| 7.69% 1/23/50 | 73,606,000 | 70,882,578 | |
| Plains All American Pipeline LP/PAA Finance Corp.: | |||
| 3.55% 12/15/29 | 1,968,000 | 2,042,489 | |
| 3.6% 11/1/24 | 1,903,000 | 2,047,057 | |
| 3.65% 6/1/22 | 3,779,000 | 3,863,096 | |
| Rattler Midstream LP 5.625% 7/15/25 (a) | 1,110,000 | 1,154,400 | |
| Regency Energy Partners LP/Regency Energy Finance Corp. 5.875% 3/1/22 | 2,000,000 | 2,053,097 | |
| Rockies Express Pipeline LLC: | |||
| 4.8% 5/15/30 (a) | 735,000 | 733,163 | |
| 4.95% 7/15/29 (a) | 276,000 | 283,182 | |
| 6.875% 4/15/40 (a) | 105,000 | 113,006 | |
| Sabine Pass Liquefaction LLC 4.5% 5/15/30 | 14,626,000 | 16,579,229 | |
| Sunoco LP/Sunoco Finance Corp.: | |||
| 4.5% 5/15/29 (a) | 635,000 | 630,898 | |
| 5.875% 3/15/28 | 135,000 | 141,750 | |
| 6% 4/15/27 | 15,000 | 15,675 | |
| Tallgrass Energy Partners LP / Tallgrass Energy Finance Corp.: | |||
| 5.5% 1/15/28 (a) | 125,000 | 125,938 | |
| 6% 3/1/27 (a) | 545,000 | 557,669 | |
| 6% 12/31/30 (a) | 655,000 | 668,100 | |
| Targa Resources Partners LP/Targa Resources Partners Finance Corp.: | |||
| 4% 1/15/32 (a) | 1,200,000 | 1,189,908 | |
| 4.875% 2/1/31 (a) | 1,705,000 | 1,781,725 | |
| 5.375% 2/1/27 | 128,000 | 133,120 | |
| 5.5% 3/1/30 | 135,000 | 145,854 | |
| 5.875% 4/15/26 | 881,000 | 922,848 | |
| The Williams Companies, Inc.: | |||
| 3.5% 11/15/30 | 15,742,000 | 16,870,539 | |
| 3.7% 1/15/23 | 808,000 | 841,947 | |
| 5.1% 9/15/45 | 9,765,000 | 11,489,656 | |
| Viper Energy Partners LP 5.375% 11/1/27 (a) | 600,000 | 624,000 | |
| Western Gas Partners LP: | |||
| 3.95% 6/1/25 | 1,395,000 | 1,447,313 | |
| 4.35% 2/1/25 | 475,000 | 495,188 | |
| 4.65% 7/1/26 | 2,820,000 | 3,006,910 | |
| 4.75% 8/15/28 | 1,236,000 | 1,324,139 | |
| 5.3% 2/1/30 | 1,420,000 | 1,565,550 | |
| 370,488,024 | |||
| FINANCIALS - 5.2% | |||
| Banks - 2.5% | |||
| Bank of America Corp.: | |||
| 3.004% 12/20/23 (b) | 10,687,000 | 11,119,904 | |
| 3.3% 1/11/23 | 2,658,000 | 2,787,387 | |
| 3.419% 12/20/28 (b) | 5,193,000 | 5,673,460 | |
| 3.5% 4/19/26 | 6,078,000 | 6,741,108 | |
| 3.95% 4/21/25 | 37,660,000 | 41,573,320 | |
| 4% 1/22/25 | 26,856,000 | 29,626,950 | |
| 4.1% 7/24/23 | 1,426,000 | 1,540,353 | |
| 4.183% 11/25/27 | 6,909,000 | 7,769,589 | |
| 4.2% 8/26/24 | 8,311,000 | 9,188,568 | |
| 4.25% 10/22/26 | 38,178,000 | 43,487,801 | |
| 4.45% 3/3/26 | 6,522,000 | 7,437,178 | |
| Banque Federative du Credit Mutuel SA 3 month U.S. LIBOR + 0.730% 0.9183% 7/20/22 (a)(b)(c) | 8,158,000 | 8,220,965 | |
| Barclays Bank PLC: | |||
| 1.7% 5/12/22 | 5,246,000 | 5,314,498 | |
| 10.179% 6/12/21 (a) | 1,750,000 | 1,754,708 | |
| Barclays PLC: | |||
| 2.852% 5/7/26 (b) | 14,944,000 | 15,836,052 | |
| 4.375% 1/12/26 | 4,468,000 | 5,029,986 | |
| 4.836% 5/9/28 | 6,102,000 | 6,845,408 | |
| 5.088% 6/20/30 (b) | 29,218,000 | 33,659,632 | |
| 5.2% 5/12/26 | 1,556,000 | 1,778,135 | |
| BNP Paribas SA 2.219% 6/9/26 (a)(b) | 13,752,000 | 14,224,862 | |
| BPCE SA 4.875% 4/1/26 (a) | 7,383,000 | 8,374,689 | |
| CIT Group, Inc.: | |||
| 3.929% 6/19/24 (b) | 1,900,000 | 2,012,575 | |
| 4.75% 2/16/24 | 2,520,000 | 2,742,075 | |
| 6.125% 3/9/28 | 4,920,000 | 5,953,200 | |
| Citigroup, Inc.: | |||
| 4.075% 4/23/29 (b) | 4,606,000 | 5,191,148 | |
| 4.125% 7/25/28 | 6,909,000 | 7,773,564 | |
| 4.3% 11/20/26 | 1,766,000 | 2,001,852 | |
| 4.4% 6/10/25 | 19,341,000 | 21,692,007 | |
| 4.412% 3/31/31 (b) | 34,201,000 | 39,327,018 | |
| 4.45% 9/29/27 | 21,445,000 | 24,545,216 | |
| 4.6% 3/9/26 | 17,445,000 | 20,015,108 | |
| 5.3% 5/6/44 | 9,501,000 | 12,301,611 | |
| 5.5% 9/13/25 | 7,738,000 | 9,099,929 | |
| Citizens Financial Group, Inc. 2.638% 9/30/32 (a) | 7,305,000 | 7,227,286 | |
| Commonwealth Bank of Australia 3.61% 9/12/34 (a)(b) | 3,723,000 | 3,889,557 | |
| DNB Bank ASA 1.535% 5/25/27 (a)(b) | 48,309,000 | 48,495,892 | |
| HSBC Holdings PLC: | |||
| 4.25% 3/14/24 | 1,433,000 | 1,564,574 | |
| 4.95% 3/31/30 | 2,548,000 | 3,019,398 | |
| 5.25% 3/14/44 | 1,039,000 | 1,305,919 | |
| Intesa Sanpaolo SpA: | |||
| 4.198% 6/1/32 (a) | 17,320,000 | 17,538,936 | |
| 5.017% 6/26/24 (a) | 10,324,000 | 11,257,826 | |
| 5.71% 1/15/26 (a) | 75,840,000 | 85,812,805 | |
| JPMorgan Chase & Co.: | |||
| 2.956% 5/13/31 (b) | 7,934,000 | 8,232,861 | |
| 4.125% 12/15/26 | 15,380,000 | 17,452,028 | |
| NatWest Markets PLC 2.375% 5/21/23 (a) | 15,700,000 | 16,300,242 | |
| Rabobank Nederland 4.375% 8/4/25 | 4,789,000 | 5,343,132 | |
| Royal Bank of Scotland Group PLC: | |||
| 3.073% 5/22/28 (b) | 8,707,000 | 9,175,679 | |
| 4.8% 4/5/26 | 19,815,000 | 22,785,308 | |
| 5.125% 5/28/24 | 35,958,000 | 40,250,319 | |
| 6% 12/19/23 | 43,478,000 | 48,985,373 | |
| 6.1% 6/10/23 | 19,857,000 | 21,910,567 | |
| 6.125% 12/15/22 | 21,905,000 | 23,683,447 | |
| Societe Generale: | |||
| 1.488% 12/14/26 (a)(b) | 16,638,000 | 16,548,255 | |
| 4.25% 4/14/25 (a) | 7,110,000 | 7,757,413 | |
| Synchrony Bank 3% 6/15/22 | 3,984,000 | 4,084,425 | |
| UniCredit SpA 6.572% 1/14/22 (a) | 6,953,000 | 7,202,010 | |
| Wells Fargo & Co.: | |||
| 2.406% 10/30/25 (b) | 7,739,000 | 8,139,088 | |
| 4.3% 7/22/27 | 25,328,000 | 28,956,745 | |
| 4.478% 4/4/31 (b) | 19,300,000 | 22,474,219 | |
| Westpac Banking Corp. 4.11% 7/24/34 (b) | 5,171,000 | 5,618,085 | |
| 915,651,245 | |||
| Capital Markets - 1.4% | |||
| Affiliated Managers Group, Inc. 4.25% 2/15/24 | 1,396,000 | 1,526,066 | |
| Ares Capital Corp.: | |||
| 3.25% 7/15/25 | 42,000,000 | 44,294,184 | |
| 3.875% 1/15/26 | 22,188,000 | 23,759,999 | |
| 4.2% 6/10/24 | 15,463,000 | 16,657,875 | |
| Credit Suisse Group AG: | |||
| 2.593% 9/11/25 (a)(b) | 14,306,000 | 14,954,133 | |
| 3.75% 3/26/25 | 9,717,000 | 10,557,174 | |
| 4.194% 4/1/31 (a)(b) | 37,158,000 | 41,326,269 | |
| 4.55% 4/17/26 | 3,126,000 | 3,543,865 | |
| Deutsche Bank AG 4.5% 4/1/25 | 29,219,000 | 31,709,133 | |
| Deutsche Bank AG New York Branch: | |||
| 3.3% 11/16/22 | 7,369,000 | 7,653,132 | |
| 3.729% 1/14/32 (b) | 10,000,000 | 10,016,956 | |
| 4.1% 1/13/26 | 8,332,000 | 9,179,397 | |
| 5% 2/14/22 | 11,778,000 | 12,149,813 | |
| Goldman Sachs Group, Inc.: | |||
| 2.876% 10/31/22 (b) | 10,640,000 | 10,750,991 | |
| 3.272% 9/29/25 (b) | 35,921,000 | 38,739,737 | |
| 4.25% 10/21/25 | 12,215,000 | 13,735,091 | |
| 6.75% 10/1/37 | 59,592,000 | 84,991,758 | |
| Intercontinental Exchange, Inc. 3.75% 12/1/25 | 2,038,000 | 2,265,383 | |
| Morgan Stanley: | |||
| 3 month U.S. LIBOR + 0.930% 1.1138% 7/22/22 (b)(c) | 3,745,000 | 3,749,600 | |
| 3.125% 7/27/26 | 14,775,000 | 16,085,432 | |
| 3.622% 4/1/31 (b) | 17,370,000 | 19,127,643 | |
| 3.625% 1/20/27 | 16,594,000 | 18,481,594 | |
| 3.7% 10/23/24 | 4,754,000 | 5,218,808 | |
| 3.875% 4/29/24 | 4,377,000 | 4,777,132 | |
| 4.875% 11/1/22 | 9,955,000 | 10,571,325 | |
| 5% 11/24/25 | 21,351,000 | 24,766,484 | |
| MSCI, Inc. 5.375% 5/15/27 (a) | 1,242,000 | 1,323,016 | |
| State Street Corp.: | |||
| 2.825% 3/30/23 (b) | 1,216,000 | 1,242,071 | |
| 2.901% 3/30/26 (b) | 1,141,000 | 1,223,769 | |
| 484,377,830 | |||
| Consumer Finance - 0.8% | |||
| AerCap Ireland Capital Ltd./AerCap Global Aviation Trust: | |||
| 1.75% 1/30/26 | 14,780,000 | 14,554,273 | |
| 2.875% 8/14/24 | 8,576,000 | 8,970,962 | |
| 3.5% 5/26/22 | 293,000 | 300,610 | |
| 4.125% 7/3/23 | 4,250,000 | 4,505,904 | |
| 4.45% 4/3/26 | 4,254,000 | 4,670,925 | |
| 4.875% 1/16/24 | 6,629,000 | 7,232,725 | |
| 6.5% 7/15/25 | 6,613,000 | 7,747,080 | |
| Ally Financial, Inc.: | |||
| 1.45% 10/2/23 | 3,893,000 | 3,954,617 | |
| 3.05% 6/5/23 | 17,631,000 | 18,435,503 | |
| 3.875% 5/21/24 | 8,893,000 | 9,639,389 | |
| 4.625% 3/30/25 | 3,595,000 | 4,046,125 | |
| 5.125% 9/30/24 | 3,534,000 | 3,999,478 | |
| 5.75% 11/20/25 | 1,188,000 | 1,366,376 | |
| 5.8% 5/1/25 | 9,417,000 | 11,003,745 | |
| 8% 11/1/31 | 5,827,000 | 8,230,890 | |
| 8% 11/1/31 | 222,000 | 306,047 | |
| Capital One Financial Corp.: | |||
| 3.65% 5/11/27 | 21,700,000 | 24,127,999 | |
| 3.8% 1/31/28 | 10,723,000 | 12,017,390 | |
| Discover Financial Services: | |||
| 3.95% 11/6/24 | 1,874,000 | 2,056,488 | |
| 4.1% 2/9/27 | 13,375,000 | 15,014,080 | |
| 4.5% 1/30/26 | 5,913,000 | 6,706,544 | |
| Ford Motor Credit Co. LLC: | |||
| 4% 11/13/30 | 830,000 | 846,550 | |
| 4.063% 11/1/24 | 46,639,000 | 49,307,684 | |
| 4.687% 6/9/25 | 430,000 | 462,276 | |
| 5.113% 5/3/29 | 1,320,000 | 1,447,340 | |
| 5.125% 6/16/25 | 320,000 | 350,200 | |
| 5.584% 3/18/24 | 8,520,000 | 9,303,073 | |
| 5.596% 1/7/22 | 7,576,000 | 7,762,711 | |
| Synchrony Financial: | |||
| 2.85% 7/25/22 | 2,154,000 | 2,205,859 | |
| 3.75% 8/15/21 | 1,457,000 | 1,458,794 | |
| 3.95% 12/1/27 | 8,239,000 | 9,102,618 | |
| 4.25% 8/15/24 | 8,335,000 | 9,133,152 | |
| 4.375% 3/19/24 | 8,694,000 | 9,528,809 | |
| 5.15% 3/19/29 | 18,424,000 | 21,390,323 | |
| 291,186,539 | |||
| Diversified Financial Services - 0.2% | |||
| Brixmor Operating Partnership LP: | |||
| 4.05% 7/1/30 | 9,134,000 | 10,056,317 | |
| 4.125% 6/15/26 | 5,362,000 | 5,994,416 | |
| 4.125% 5/15/29 | 19,691,000 | 21,782,935 | |
| Equitable Holdings, Inc. 3.9% 4/20/23 | 674,000 | 714,661 | |
| Icahn Enterprises LP/Icahn Enterprises Finance Corp.: | |||
| 4.75% 9/15/24 | 740,000 | 771,191 | |
| 5.25% 5/15/27 (a) | 335,000 | 343,375 | |
| 5.25% 5/15/27 | 3,095,000 | 3,172,375 | |
| 6.25% 5/15/26 | 1,691,000 | 1,787,590 | |
| Park Aerospace Holdings Ltd. 5.5% 2/15/24 (a) | 7,300,000 | 8,024,016 | |
| Pine Street Trust I 4.572% 2/15/29 (a) | 7,749,000 | 8,775,735 | |
| Pine Street Trust II 5.568% 2/15/49 (a) | 7,700,000 | 9,689,150 | |
| VMED O2 UK Financing I PLC 4.25% 1/31/31 (a) | 1,805,000 | 1,748,052 | |
| Voya Financial, Inc. 3.125% 7/15/24 | 2,503,000 | 2,677,561 | |
| 75,537,374 | |||
| Insurance - 0.3% | |||
| Arthur J. Gallagher & Co. 2.5% 5/20/31 | 10,862,000 | 10,833,652 | |
| Five Corners Funding Trust II 2.85% 5/15/30 (a) | 15,870,000 | 16,475,179 | |
| Liberty Mutual Group, Inc. 3.95% 5/15/60 (a) | 12,820,000 | 13,211,293 | |
| Lincoln National Corp. 3.4% 1/15/31 | 14,811,000 | 15,976,795 | |
| New York Life Insurance Co. 3.75% 5/15/50 (a) | 3,182,000 | 3,391,968 | |
| Pacific LifeCorp 5.125% 1/30/43 (a) | 2,623,000 | 3,197,601 | |
| Pricoa Global Funding I 5.375% 5/15/45 (b) | 3,148,000 | 3,483,202 | |
| Prudential Financial, Inc. 4.5% 11/16/21 | 1,288,000 | 1,312,993 | |
| Swiss Re Finance Luxembourg SA 5% 4/2/49 (a)(b) | 3,000,000 | 3,385,350 | |
| Teachers Insurance & Annuity Association of America 3.3% 5/15/50 (a) | 7,316,000 | 7,215,987 | |
| Unum Group: | |||
| 4% 6/15/29 | 6,130,000 | 6,759,234 | |
| 4.5% 3/15/25 | 12,980,000 | 14,561,299 | |
| 5.75% 8/15/42 | 1,622,000 | 1,959,819 | |
| 101,764,372 | |||
| Thrifts & Mortgage Finance - 0.0% | |||
| Quicken Loans LLC 5.25% 1/15/28 (a) | 722,000 | 754,938 | |
| Quicken Loans LLC/Quicken Loans Co-Issuer, Inc. 3.625% 3/1/29 (a) | 655,000 | 638,396 | |
| 1,393,334 | |||
| TOTAL FINANCIALS | 1,869,910,694 | ||
| HEALTH CARE - 0.4% | |||
| Biotechnology - 0.0% | |||
| AbbVie, Inc. 3.2% 11/21/29 | 4,900,000 | 5,255,743 | |
| Health Care Equipment & Supplies - 0.0% | |||
| Hologic, Inc.: | |||
| 3.25% 2/15/29 (a) | 545,000 | 531,375 | |
| 4.625% 2/1/28 (a) | 65,000 | 67,569 | |
| Teleflex, Inc. 4.25% 6/1/28 (a) | 145,000 | 149,531 | |
| 748,475 | |||
| Health Care Providers & Services - 0.2% | |||
| Anthem, Inc. 3.3% 1/15/23 | 4,322,000 | 4,525,061 | |
| Centene Corp.: | |||
| 2.5% 3/1/31 | 945,000 | 905,310 | |
| 3.375% 2/15/30 | 7,725,000 | 7,802,250 | |
| 4.25% 12/15/27 | 6,215,000 | 6,525,750 | |
| 4.625% 12/15/29 | 8,795,000 | 9,493,587 | |
| 5.375% 6/1/26 (a) | 805,000 | 838,569 | |
| 5.375% 8/15/26 (a) | 2,486,000 | 2,600,978 | |
| Cigna Corp. 4.375% 10/15/28 | 6,630,000 | 7,649,747 | |
| CVS Health Corp. 3.625% 4/1/27 | 3,208,000 | 3,557,762 | |
| DaVita HealthCare Partners, Inc. 4.625% 6/1/30 (a) | 1,405,000 | 1,432,945 | |
| HCA Holdings, Inc. 4.75% 5/1/23 | 138,000 | 148,790 | |
| Molina Healthcare, Inc. 3.875% 11/15/30 (a) | 850,000 | 865,938 | |
| Owens & Minor, Inc. 4.5% 3/31/29 (a) | 160,000 | 161,179 | |
| Tenet Healthcare Corp.: | |||
| 4.625% 6/15/28 (a) | 2,765,000 | 2,820,300 | |
| 4.875% 1/1/26 (a) | 385,000 | 397,513 | |
| 5.125% 5/1/25 | 669,000 | 678,165 | |
| 5.125% 11/1/27 (a) | 1,000,000 | 1,043,770 | |
| Toledo Hospital 5.325% 11/15/28 | 2,395,000 | 2,771,475 | |
| 54,219,089 | |||
| Health Care Technology - 0.0% | |||
| IQVIA, Inc. 5% 5/15/27 (a) | 630,000 | 659,673 | |
| Life Sciences Tools & Services - 0.0% | |||
| Charles River Laboratories International, Inc.: | |||
| 3.75% 3/15/29 (a) | 180,000 | 179,325 | |
| 4.25% 5/1/28 (a) | 70,000 | 71,838 | |
| 251,163 | |||
| Pharmaceuticals - 0.2% | |||
| Bayer U.S. Finance II LLC 4.25% 12/15/25 (a) | 50,548,000 | 56,639,626 | |
| Elanco Animal Health, Inc.: | |||
| 4.912% 8/27/21 (b) | 1,077,000 | 1,084,453 | |
| 5.272% 8/28/23 (b) | 3,402,000 | 3,675,385 | |
| 5.9% 8/28/28 (b) | 1,432,000 | 1,646,800 | |
| Jazz Securities DAC 4.375% 1/15/29 (a) | 225,000 | 231,408 | |
| Organon Finance 1 LLC 4.125% 4/30/28 (a) | 530,000 | 535,300 | |
| Teva Pharmaceutical Finance Netherlands III BV 2.2% 7/21/21 | 748,000 | 746,130 | |
| Utah Acquisition Sub, Inc. 3.95% 6/15/26 | 2,065,000 | 2,284,322 | |
| Viatris, Inc.: | |||
| 1.65% 6/22/25 (a) | 1,773,000 | 1,800,215 | |
| 2.7% 6/22/30 (a) | 9,017,000 | 8,992,092 | |
| 3.85% 6/22/40(a) | 3,928,000 | 4,056,407 | |
| 4% 6/22/50 (a) | 6,783,000 | 6,872,802 | |
| Zoetis, Inc. 3.25% 2/1/23 | 1,210,000 | 1,259,155 | |
| 89,824,095 | |||
| TOTAL HEALTH CARE | 150,958,238 | ||
| INDUSTRIALS - 0.5% | |||
| Aerospace & Defense - 0.1% | |||
| BAE Systems PLC 3.4% 4/15/30 (a) | 4,094,000 | 4,387,064 | |
| BBA U.S. Holdings, Inc. 5.375% 5/1/26 (a) | 641,000 | 658,227 | |
| BWX Technologies, Inc.: | |||
| 4.125% 6/30/28 (a) | 480,000 | 482,400 | |
| 5.375% 7/15/26 (a) | 1,748,000 | 1,801,489 | |
| Howmet Aerospace, Inc.: | |||
| 5.95% 2/1/37 | 25,000 | 29,000 | |
| 6.75% 1/15/28 | 365,000 | 435,719 | |
| Moog, Inc. 4.25% 12/15/27 (a) | 980,000 | 1,004,500 | |
| Rolls-Royce PLC 5.75% 10/15/27 (a) | 615,000 | 661,402 | |
| The Boeing Co.: | |||
| 5.04% 5/1/27 | 6,070,000 | 6,997,589 | |
| 5.15% 5/1/30 | 6,070,000 | 7,105,234 | |
| 5.805% 5/1/50 | 6,070,000 | 7,806,893 | |
| 5.93% 5/1/60 | 6,070,000 | 7,891,250 | |
| TransDigm, Inc.: | |||
| 6.25% 3/15/26 (a) | 2,552,000 | 2,690,012 | |
| 7.5% 3/15/27 | 95,000 | 101,327 | |
| 8% 12/15/25 (a) | 1,120,000 | 1,211,403 | |
| 43,263,509 | |||
| Air Freight & Logistics - 0.0% | |||
| XPO Logistics, Inc. 6.25% 5/1/25 (a) | 1,705,000 | 1,823,191 | |
| Building Products - 0.0% | |||
| Advanced Drain Systems, Inc. 5% 9/30/27 (a) | 965,000 | 1,005,723 | |
| Standard Industries, Inc. 4.375% 7/15/30 (a) | 715,000 | 722,786 | |
| 1,728,509 | |||
| Commercial Services & Supplies - 0.0% | |||
| LBC Tank Terminals Holding Netherlands BV 6.875% 5/15/23 (a) | 915,000 | 915,000 | |
| Nielsen Finance LLC/Nielsen Finance Co.: | |||
| 5.625% 10/1/28 (a) | 495,000 | 523,463 | |
| 5.875% 10/1/30 (a) | 490,000 | 529,200 | |
| Prime Securities Services Borrower LLC/Prime Finance, Inc. 3.375% 8/31/27 (a) | 1,230,000 | 1,180,493 | |
| Stericycle, Inc. 3.875% 1/15/29 (a) | 450,000 | 448,875 | |
| 3,597,031 | |||
| Construction & Engineering - 0.0% | |||
| AECOM 5.125% 3/15/27 | 1,077,000 | 1,191,431 | |
| Electrical Equipment - 0.0% | |||
| Sensata Technologies BV 4% 4/15/29 (a) | 275,000 | 275,495 | |
| Industrial Conglomerates - 0.2% | |||
| General Electric Co.: | |||
| 3.45% 5/1/27 | 2,582,000 | 2,843,459 | |
| 3.625% 5/1/30 | 6,002,000 | 6,592,238 | |
| 4.25% 5/1/40 | 18,800,000 | 21,249,359 | |
| 4.35% 5/1/50 | 21,476,000 | 24,472,109 | |
| Ladder Capital Finance Holdings LLLP/Ladder Capital Finance Corp. 4.25% 2/1/27 (a) | 500,000 | 488,750 | |
| 55,645,915 | |||
| Machinery - 0.0% | |||
| Vertical U.S. Newco, Inc. 5.25% 7/15/27 (a) | 1,065,000 | 1,107,600 | |
| Professional Services - 0.0% | |||
| ASGN, Inc. 4.625% 5/15/28 (a) | 1,470,000 | 1,528,800 | |
| Booz Allen Hamilton, Inc. 3.875% 9/1/28 (a) | 765,000 | 765,511 | |
| TriNet Group, Inc. 3.5% 3/1/29 (a) | 405,000 | 393,863 | |
| 2,688,174 | |||
| Trading Companies & Distributors - 0.1% | |||
| Air Lease Corp.: | |||
| 0.7% 2/15/24 | 10,742,000 | 10,698,191 | |
| 2.25% 1/15/23 | 1,863,000 | 1,913,061 | |
| 3% 9/15/23 | 583,000 | 610,409 | |
| 3.375% 6/1/21 | 1,957,000 | 1,957,000 | |
| 3.375% 7/1/25 | 11,630,000 | 12,486,088 | |
| 3.75% 2/1/22 | 2,924,000 | 2,971,825 | |
| 3.75% 6/1/26 | 5,000,000 | 5,410,840 | |
| 4.25% 2/1/24 | 7,180,000 | 7,800,272 | |
| 4.25% 9/15/24 | 2,331,000 | 2,550,464 | |
| 46,398,150 | |||
| Transportation Infrastructure - 0.1% | |||
| Avolon Holdings Funding Ltd.: | |||
| 3.25% 2/15/27 (a) | 10,726,000 | 11,004,742 | |
| 3.625% 5/1/22 (a) | 2,141,000 | 2,193,490 | |
| 3.95% 7/1/24 (a) | 2,844,000 | 3,028,301 | |
| 4.375% 5/1/26 (a) | 7,394,000 | 7,970,649 | |
| 5.25% 5/15/24 (a) | 4,186,000 | 4,596,471 | |
| 28,793,653 | |||
| TOTAL INDUSTRIALS | 186,512,658 | ||
| INFORMATION TECHNOLOGY - 0.4% | |||
| Electronic Equipment & Components - 0.1% | |||
| Diamond 1 Finance Corp./Diamond 2 Finance Corp.: | |||
| 5.45% 6/15/23 (a) | 5,600,000 | 6,094,485 | |
| 6.02% 6/15/26 (a) | 1,948,000 | 2,322,318 | |
| Sensata Technologies, Inc. 3.75% 2/15/31 (a) | 1,410,000 | 1,376,513 | |
| TTM Technologies, Inc. 4% 3/1/29 (a) | 315,000 | 311,456 | |
| 10,104,772 | |||
| IT Services - 0.0% | |||
| Gartner, Inc.: | |||
| 3.75% 10/1/30 (a) | 255,000 | 255,969 | |
| 4.5% 7/1/28 (a) | 395,000 | 415,738 | |
| Square, Inc. 2.75% 6/1/26 (a) | 265,000 | 267,147 | |
| Twilio, Inc. 3.875% 3/15/31 | 200,000 | 203,222 | |
| 1,142,076 | |||
| Semiconductors & Semiconductor Equipment - 0.2% | |||
| Broadcom, Inc.: | |||
| 1.95% 2/15/28 (a) | 2,879,000 | 2,852,812 | |
| 2.45% 2/15/31 (a) | 19,432,000 | 18,661,607 | |
| 2.6% 2/15/33 (a) | 19,432,000 | 18,501,781 | |
| 3.5% 2/15/41 (a) | 19,430,000 | 18,790,702 | |
| 3.75% 2/15/51 (a) | 9,284,000 | 9,021,175 | |
| Entegris, Inc. 4.375% 4/15/28 (a) | 755,000 | 787,088 | |
| ON Semiconductor Corp. 3.875% 9/1/28 (a) | 300,000 | 304,500 | |
| Qorvo, Inc. 3.375% 4/1/31 (a) | 615,000 | 626,999 | |
| 69,546,664 | |||
| Software - 0.1% | |||
| CDK Global, Inc. 5.25% 5/15/29 (a) | 1,132,000 | 1,221,270 | |
| Crowdstrike Holdings, Inc. 3% 2/15/29 | 295,000 | 289,469 | |
| Fair Isaac Corp. 5.25% 5/15/26 (a) | 793,000 | 888,160 | |
| Nuance Communications, Inc. 5.625% 12/15/26 | 1,382,000 | 1,453,864 | |
| Open Text Corp. 3.875% 2/15/28 (a) | 420,000 | 419,887 | |
| Oracle Corp.: | |||
| 2.5% 4/1/25 | 8,253,000 | 8,698,882 | |
| 2.8% 4/1/27 | 8,253,000 | 8,770,625 | |
| 2.95% 4/1/30 | 8,300,000 | 8,641,522 | |
| 3.85% 4/1/60 | 8,300,000 | 8,291,903 | |
| 38,675,582 | |||
| Technology Hardware, Storage & Peripherals - 0.0% | |||
| Hewlett Packard Enterprise Co. 4.4% 10/15/22 (b) | 3,173,000 | 3,323,451 | |
| TOTAL INFORMATION TECHNOLOGY | 122,792,545 | ||
| MATERIALS - 0.1% | |||
| Chemicals - 0.1% | |||
| Axalta Coating Systems/Dutch Holding BV 4.75% 6/15/27 (a) | 585,000 | 612,788 | |
| CF Industries Holdings, Inc.: | |||
| 4.95% 6/1/43 | 5,000 | 5,658 | |
| 5.15% 3/15/34 | 1,617,000 | 1,907,575 | |
| 5.375% 3/15/44 | 255,000 | 297,713 | |
| Consolidated Energy Finance SA: | |||
| 3 month U.S. LIBOR + 3.750% 3.9339% 6/15/22 (a)(b)(c) | 1,326,000 | 1,309,634 | |
| 6.875% 6/15/25 (a) | 115,000 | 115,687 | |
| Methanex Corp.: | |||
| 5.125% 10/15/27 | 765,000 | 799,425 | |
| 5.25% 12/15/29 | 90,000 | 94,444 | |
| 5.65% 12/1/44 | 581,000 | 588,931 | |
| NOVA Chemicals Corp. 5.25% 6/1/27 (a) | 949,000 | 1,015,430 | |
| Olin Corp.: | |||
| 5% 2/1/30 | 1,715,000 | 1,817,900 | |
| 5.125% 9/15/27 | 975,000 | 1,018,017 | |
| 5.625% 8/1/29 | 465,000 | 505,799 | |
| The Chemours Co. LLC: | |||
| 5.375% 5/15/27 | 1,115,000 | 1,198,848 | |
| 5.75% 11/15/28 (a) | 275,000 | 293,937 | |
| Valvoline, Inc. 4.25% 2/15/30 (a) | 165,000 | 168,300 | |
| W. R. Grace & Co.-Conn.: | |||
| 4.875% 6/15/27 (a) | 305,000 | 321,013 | |
| 5.625% 10/1/24 (a) | 1,254,000 | 1,379,400 | |
| 13,450,499 | |||
| Containers & Packaging - 0.0% | |||
| Ardagh Packaging Finance PLC/Ardagh MP Holdings U.S.A., Inc. 4.125% 8/15/26 (a) | 25,000 | 25,594 | |
| Trivium Packaging Finance BV: | |||
| 5.5% 8/15/26 (a) | 485,000 | 505,613 | |
| 8.5% 8/15/27 (a) | 140,000 | 150,445 | |
| 681,652 | |||
| Metals & Mining - 0.0% | |||
| FMG Resources (August 2006) Pty Ltd. 4.5% 9/15/27 (a) | 10,000 | 10,858 | |
| HudBay Minerals, Inc. 4.5% 4/1/26 (a) | 135,000 | 133,650 | |
| Kaiser Aluminum Corp. 4.625% 3/1/28 (a) | 1,005,000 | 1,026,708 | |
| 1,171,216 | |||
| TOTAL MATERIALS | 15,303,367 | ||
| REAL ESTATE - 0.8% | |||
| Equity Real Estate Investment Trusts (REITs) - 0.6% | |||
| Alexandria Real Estate Equities, Inc.: | |||
| 2% 5/18/32 | 8,258,000 | 7,858,958 | |
| 4.9% 12/15/30 | 7,224,000 | 8,666,844 | |
| Boston Properties, Inc. 4.5% 12/1/28 | 4,766,000 | 5,484,840 | |
| Corporate Office Properties LP: | |||
| 2.25% 3/15/26 | 2,969,000 | 3,049,324 | |
| 2.75% 4/15/31 | 2,188,000 | 2,149,496 | |
| 5% 7/1/25 | 2,273,000 | 2,570,592 | |
| CTR Partnership LP/CareTrust Capital Corp. 5.25% 6/1/25 | 720,000 | 738,000 | |
| Duke Realty LP: | |||
| 3.25% 6/30/26 | 589,000 | 639,468 | |
| 3.625% 4/15/23 | 1,544,000 | 1,617,392 | |
| Healthcare Trust of America Holdings LP: | |||
| 3.1% 2/15/30 | 1,868,000 | 1,949,002 | |
| 3.5% 8/1/26 | 1,945,000 | 2,144,497 | |
| Hudson Pacific Properties LP 4.65% 4/1/29 | 10,668,000 | 12,121,020 | |
| Iron Mountain, Inc. 4.875% 9/15/29 (a) | 615,000 | 630,375 | |
| Lexington Corporate Properties Trust: | |||
| 2.7% 9/15/30 | 1,445,000 | 1,443,466 | |
| 4.4% 6/15/24 | 948,000 | 1,029,422 | |
| MGM Growth Properties Operating Partnership LP: | |||
| 4.5% 9/1/26 | 1,508,000 | 1,594,725 | |
| 4.5% 1/15/28 | 637,000 | 667,735 | |
| 4.625% 6/15/25 (a) | 150,000 | 159,000 | |
| 5.75% 2/1/27 | 256,000 | 283,441 | |
| Omega Healthcare Investors, Inc.: | |||
| 3.25% 4/15/33 | 9,457,000 | 9,240,525 | |
| 3.375% 2/1/31 | 5,854,000 | 5,908,863 | |
| 3.625% 10/1/29 | 8,376,000 | 8,758,638 | |
| 4.375% 8/1/23 | 1,006,000 | 1,076,156 | |
| 4.5% 1/15/25 | 2,013,000 | 2,201,061 | |
| 4.5% 4/1/27 | 716,000 | 794,539 | |
| 4.75% 1/15/28 | 11,294,000 | 12,624,366 | |
| 4.95% 4/1/24 | 882,000 | 961,592 | |
| 5.25% 1/15/26 | 3,755,000 | 4,288,757 | |
| Realty Income Corp. 3.25% 1/15/31 | 1,828,000 | 1,954,225 | |
| Retail Opportunity Investments Partnership LP: | |||
| 4% 12/15/24 | 641,000 | 690,008 | |
| 5% 12/15/23 | 494,000 | 534,099 | |
| Retail Properties America, Inc.: | |||
| 4% 3/15/25 | 10,791,000 | 11,510,952 | |
| 4.75% 9/15/30 | 17,486,000 | 19,042,259 | |
| SBA Communications Corp. 3.875% 2/15/27 | 515,000 | 526,588 | |
| Service Properties Trust: | |||
| 3.95% 1/15/28 | 40,000 | 35,800 | |
| 4.375% 2/15/30 | 415,000 | 373,500 | |
| 4.95% 2/15/27 | 600,000 | 574,500 | |
| 4.95% 10/1/29 | 245,000 | 228,463 | |
| 5.5% 12/15/27 | 230,000 | 236,708 | |
| Simon Property Group LP: | |||
| 2.45% 9/13/29 | 3,008,000 | 3,054,311 | |
| 3.375% 12/1/27 | 6,125,000 | 6,667,095 | |
| SITE Centers Corp.: | |||
| 3.625% 2/1/25 | 1,532,000 | 1,609,773 | |
| 4.25% 2/1/26 | 2,753,000 | 2,980,703 | |
| Store Capital Corp.: | |||
| 2.75% 11/18/30 | 3,456,000 | 3,424,143 | |
| 4.625% 3/15/29 | 2,374,000 | 2,678,713 | |
| The GEO Group, Inc. 6% 4/15/26 | 305,000 | 183,355 | |
| Uniti Group, Inc. 7.875% 2/15/25 (a) | 1,050,000 | 1,124,813 | |
| Ventas Realty LP: | |||
| 3% 1/15/30 | 11,060,000 | 11,444,355 | |
| 3.125% 6/15/23 | 1,033,000 | 1,078,808 | |
| 4% 3/1/28 | 2,150,000 | 2,396,839 | |
| 4.125% 1/15/26 | 999,000 | 1,119,057 | |
| 4.75% 11/15/30 | 16,500,000 | 19,396,771 | |
| VEREIT Operating Partnership LP: | |||
| 2.2% 6/15/28 | 1,380,000 | 1,386,376 | |
| 2.85% 12/15/32 | 1,698,000 | 1,729,714 | |
| 3.4% 1/15/28 | 2,874,000 | 3,104,393 | |
| VICI Properties, Inc.: | |||
| 4.25% 12/1/26 (a) | 1,640,000 | 1,687,150 | |
| 4.625% 12/1/29 (a) | 595,000 | 619,008 | |
| Vornado Realty LP: | |||
| 2.15% 6/1/26 | 3,558,000 | 3,588,730 | |
| 3.4% 6/1/31 | 12,870,000 | 12,970,107 | |
| Weingarten Realty Investors 3.375% 10/15/22 | 456,000 | 470,595 | |
| WP Carey, Inc.: | |||
| 3.85% 7/15/29 | 1,773,000 | 1,937,686 | |
| 4% 2/1/25 | 3,423,000 | 3,728,371 | |
| 4.6% 4/1/24 | 5,327,000 | 5,845,806 | |
| 230,585,868 | |||
| Real Estate Management & Development - 0.2% | |||
| Brandywine Operating Partnership LP: | |||
| 3.95% 2/15/23 | 7,832,000 | 8,197,853 | |
| 3.95% 11/15/27 | 4,382,000 | 4,747,984 | |
| 4.1% 10/1/24 | 3,961,000 | 4,306,341 | |
| 4.55% 10/1/29 | 1,896,000 | 2,090,648 | |
| CBRE Group, Inc.: | |||
| 2.5% 4/1/31 | 10,225,000 | 10,152,743 | |
| 4.875% 3/1/26 | 7,844,000 | 9,099,699 | |
| Essex Portfolio LP 3.875% 5/1/24 | 1,923,000 | 2,083,398 | |
| Howard Hughes Corp. 4.375% 2/1/31 (a) | 395,000 | 391,544 | |
| Mack-Cali Realty LP: | |||
| 3.15% 5/15/23 | 3,573,000 | 3,741,120 | |
| 4.5% 4/18/22 | 678,000 | 694,773 | |
| Mid-America Apartments LP 4% 11/15/25 | 828,000 | 919,985 | |
| Post Apartment Homes LP 3.375% 12/1/22 | 502,000 | 519,980 | |
| Tanger Properties LP: | |||
| 3.125% 9/1/26 | 2,628,000 | 2,743,838 | |
| 3.75% 12/1/24 | 2,635,000 | 2,826,326 | |
| 3.875% 12/1/23 | 475,000 | 503,734 | |
| 3.875% 7/15/27 | 11,191,000 | 11,949,634 | |
| 64,969,600 | |||
| TOTAL REAL ESTATE | 295,555,468 | ||
| UTILITIES - 0.5% | |||
| Electric Utilities - 0.2% | |||
| Clearway Energy Operating LLC: | |||
| 3.75% 2/15/31 (a) | 925,000 | 894,938 | |
| 4.75% 3/15/28 (a) | 140,000 | 144,725 | |
| 5% 9/15/26 | 925,000 | 952,750 | |
| Cleco Corporate Holdings LLC 3.375% 9/15/29 | 4,843,000 | 4,953,401 | |
| DPL, Inc. 4.35% 4/15/29 | 7,785,000 | 8,446,725 | |
| Duquesne Light Holdings, Inc.: | |||
| 2.532% 10/1/30 (a) | 2,328,000 | 2,256,695 | |
| 5.9% 12/1/21 (a) | 3,889,000 | 3,986,368 | |
| FirstEnergy Corp.: | |||
| 4.75% 3/15/23 | 4,502,000 | 4,752,761 | |
| 7.375% 11/15/31 | 5,738,000 | 7,642,327 | |
| InterGen NV 7% 6/30/23 (a) | 964,000 | 950,292 | |
| IPALCO Enterprises, Inc. 3.7% 9/1/24 | 1,963,000 | 2,119,976 | |
| NextEra Energy Partners LP 4.25% 9/15/24 (a) | 56,000 | 59,004 | |
| NRG Energy, Inc.: | |||
| 3.625% 2/15/31 (a) | 1,785,000 | 1,711,369 | |
| 5.25% 6/15/29 (a) | 484,000 | 508,200 | |
| 5.75% 1/15/28 | 581,000 | 615,802 | |
| 6.625% 1/15/27 | 185,000 | 191,991 | |
| NSG Holdings II LLC/NSG Holdings, Inc. 7.75% 12/15/25 (a) | 1,349,547 | 1,444,016 | |
| PG&E Corp.: | |||
| 5% 7/1/28 | 3,765,000 | 3,746,175 | |
| 5.25% 7/1/30 | 1,155,000 | 1,167,994 | |
| Vistra Operations Co. LLC: | |||
| 5% 7/31/27 (a) | 2,293,000 | 2,341,726 | |
| 5.5% 9/1/26 (a) | 3,498,000 | 3,611,483 | |
| 5.625% 2/15/27 (a) | 665,000 | 689,938 | |
| 53,188,656 | |||
| Gas Utilities - 0.0% | |||
| Nakilat, Inc. 6.067% 12/31/33 (a) | 1,213,000 | 1,475,539 | |
| Superior Plus LP / Superior General Partner, Inc. 4.5% 3/15/29 (a) | 185,000 | 188,156 | |
| 1,663,695 | |||
| Independent Power and Renewable Electricity Producers - 0.1% | |||
| TerraForm Power Operating LLC: | |||
| 4.75% 1/15/30 (a) | 75,000 | 76,671 | |
| 5% 1/31/28 (a) | 656,000 | 689,269 | |
| The AES Corp.: | |||
| 2.45% 1/15/31 (a) | 4,011,000 | 3,889,019 | |
| 3.3% 7/15/25 (a) | 15,965,000 | 17,030,983 | |
| 3.95% 7/15/30 (a) | 13,922,000 | 15,031,583 | |
| 36,717,525 | |||
| Multi-Utilities - 0.2% | |||
| Berkshire Hathaway Energy Co.: | |||
| 3.7% 7/15/30 | 1,758,000 | 1,967,540 | |
| 4.05% 4/15/25 | 21,459,000 | 23,912,812 | |
| Consolidated Edison Co. of New York, Inc. 3.95% 4/1/50 | 2,477,000 | 2,735,531 | |
| NiSource, Inc.: | |||
| 2.95% 9/1/29 | 12,206,000 | 12,779,624 | |
| 3.49% 5/15/27 | 13,900,000 | 15,320,747 | |
| 5.95% 6/15/41 | 1,737,000 | 2,333,948 | |
| Puget Energy, Inc.: | |||
| 4.1% 6/15/30 | 6,250,000 | 6,893,906 | |
| 5.625% 7/15/22 | 3,305,000 | 3,457,863 | |
| 6% 9/1/21 | 3,185,000 | 3,229,194 | |
| Sempra Energy 6% 10/15/39 | 2,744,000 | 3,739,121 | |
| WEC Energy Group, Inc. 3 month U.S. LIBOR + 2.110% 2.2684% 5/15/67 (b)(c) | 1,843,000 | 1,709,312 | |
| 78,079,598 | |||
| TOTAL UTILITIES | 169,649,474 | ||
| TOTAL NONCONVERTIBLE BONDS | |||
| (Cost $3,900,475,497) | 4,237,273,577 | ||
| U.S. Treasury Obligations - 7.5% | |||
| U.S. Treasury Bonds 2.375% 5/15/51 | 674,726,000 | 687,798,816 | |
| U.S. Treasury Notes: | |||
| 0.125% 6/30/22 | $455,500,000 | $455,660,136 | |
| 0.5% 5/31/27 | 520,000,000 | 503,018,750 | |
| 0.875% 11/15/30 | 428,909,000 | 402,504,290 | |
| 1.125% 2/28/22 | 199,000,000 | 200,601,329 | |
| 1.125% 2/15/31 | 160,064,000 | 153,236,270 | |
| 1.25% 4/30/28 | 250,000,000 | 249,921,875 | |
| 3.125% 11/15/28 | 51,642,000 | 58,206,183 | |
| TOTAL U.S. TREASURY OBLIGATIONS | |||
| (Cost $2,705,999,568) | 2,710,947,649 | ||
| U.S. Government Agency - Mortgage Securities - 17.0% | |||
| Fannie Mae - 3.7% | |||
| 12 month U.S. LIBOR + 1.440% 1.779% 4/1/37 (b)(c) | 11,088 | 11,632 | |
| 12 month U.S. LIBOR + 1.460% 2.017% 1/1/35 (b)(c) | 8,401 | 8,796 | |
| 12 month U.S. LIBOR + 1.480% 2.423% 7/1/34 (b)(c) | 2,052 | 2,145 | |
| 12 month U.S. LIBOR + 1.530% 1.91% 3/1/36 (b)(c) | 1,782 | 1,873 | |
| 12 month U.S. LIBOR + 1.550% 2.553% 6/1/36 (b)(c) | 10,321 | 10,861 | |
| 12 month U.S. LIBOR + 1.560% 1.94% 3/1/37 (b)(c) | 6,498 | 6,849 | |
| 12 month U.S. LIBOR + 1.620% 2.108% 3/1/33 (b)(c) | 9,496 | 9,920 | |
| 12 month U.S. LIBOR + 1.620% 2.383% 5/1/36 (b)(c) | 24,508 | 25,773 | |
| 12 month U.S. LIBOR + 1.630% 2.156% 9/1/36 (b)(c) | 8,236 | 8,675 | |
| 12 month U.S. LIBOR + 1.630% 2.283% 5/1/35 (b)(c) | 19,212 | 20,145 | |
| 12 month U.S. LIBOR + 1.640% 2.096% 6/1/47 (b)(c) | 13,908 | 14,794 | |
| 12 month U.S. LIBOR + 1.670% 2.223% 11/1/36 (b)(c) | 5,485 | 5,770 | |
| 12 month U.S. LIBOR + 1.670% 2.235% 7/1/43 (b)(c) | 166,354 | 174,445 | |
| 12 month U.S. LIBOR + 1.680% 1.935% 4/1/36 (b)(c) | 3,926 | 4,134 | |
| 12 month U.S. LIBOR + 1.700% 2.284% 6/1/42 (b)(c) | 13,080 | 13,711 | |
| 12 month U.S. LIBOR + 1.710% 2.377% 8/1/35 (b)(c) | 5,908 | 6,229 | |
| 12 month U.S. LIBOR + 1.730% 2.126% 3/1/40 (b)(c) | 17,919 | 18,908 | |
| 12 month U.S. LIBOR + 1.730% 2.408% 5/1/36 (b)(c) | 10,570 | 11,153 | |
| 12 month U.S. LIBOR + 1.750% 2.241% 7/1/35 (b)(c) | 4,822 | 5,075 | |
| 12 month U.S. LIBOR + 1.750% 2.411% 8/1/41 (b)(c) | 18,974 | 20,012 | |
| 12 month U.S. LIBOR + 1.800% 2.175% 1/1/42 (b)(c) | 31,783 | 33,476 | |
| 12 month U.S. LIBOR + 1.800% 2.385% 12/1/40 (b)(c) | 497,139 | 526,278 | |
| 12 month U.S. LIBOR + 1.800% 2.702% 7/1/41 (b)(c) | 11,018 | 11,601 | |
| 12 month U.S. LIBOR + 1.810% 2.185% 12/1/39 (b)(c) | 9,841 | 10,403 | |
| 12 month U.S. LIBOR + 1.810% 2.193% 2/1/42 (b)(c) | 26,970 | 28,468 | |
| 12 month U.S. LIBOR + 1.810% 2.321% 9/1/41 (b)(c) | 7,318 | 7,741 | |
| 12 month U.S. LIBOR + 1.810% 2.7% 7/1/41 (b)(c) | 11,101 | 11,736 | |
| 12 month U.S. LIBOR + 1.820% 2.2% 2/1/35 (b)(c) | 33,966 | 35,921 | |
| 12 month U.S. LIBOR + 1.830% 2.33% 10/1/41 (b)(c) | 3,997 | 4,121 | |
| 12 month U.S. LIBOR + 1.950% 2.806% 7/1/37 (b)(c) | 19,119 | 20,352 | |
| 6 month U.S. LIBOR + 1.500% 1.755% 1/1/35 (b)(c) | 20,175 | 21,003 | |
| 6 month U.S. LIBOR + 1.530% 1.785% 12/1/34 (b)(c) | 3,750 | 3,906 | |
| 6 month U.S. LIBOR + 1.530% 1.785% 3/1/35 (b)(c) | 3,742 | 3,901 | |
| 6 month U.S. LIBOR + 1.550% 1.8% 10/1/33 (b)(c) | 1,393 | 1,450 | |
| 6 month U.S. LIBOR + 1.560% 1.815% 7/1/35 (b)(c) | 2,412 | 2,519 | |
| 6 month U.S. LIBOR + 1.740% 1.99% 12/1/34 (b)(c) | 364 | 381 | |
| 6 month U.S. LIBOR + 1.960% 2.21% 9/1/35 (b)(c) | 4,377 | 4,621 | |
| U.S. TREASURY 1 YEAR INDEX + 2.200% 2.333% 3/1/35 (b)(c) | 4,129 | 4,368 | |
| U.S. TREASURY 1 YEAR INDEX + 2.270% 2.395% 6/1/36 (b)(c) | 23,012 | 24,254 | |
| U.S. TREASURY 1 YEAR INDEX + 2.280% 2.417% 10/1/33 (b)(c) | 10,191 | 10,727 | |
| U.S. TREASURY 1 YEAR INDEX + 2.460% 2.697% 7/1/34 (b)(c) | 23,637 | 24,897 | |
| 2.5% 5/1/31 to 10/1/50 (d) | 128,903,081 | 134,671,682 | |
| 3% 7/1/27 to 4/1/51 (d)(e)(f)(g) | 564,514,847 | 596,426,001 | |
| 3.25% 12/1/41 | 6,677 | 7,174 | |
| 3.4% 7/1/42 to 9/1/42 | 116,976 | 125,708 | |
| 3.5% 7/1/32 to 5/1/50 | 384,201,147 | 409,371,256 | |
| 3.525% 5/1/42 | 3,888 | 4,238 | |
| 3.65% 5/1/42 to 8/1/42 | 36,809 | 39,942 | |
| 3.9% 4/1/42 | 10,280 | 11,305 | |
| 4% 11/1/31 to 11/1/49 | 78,616,066 | 85,891,460 | |
| 4.25% 11/1/41 | 29,908 | 32,967 | |
| 4.5% to 4.5% 12/1/23 to 9/1/49 (e) | 65,029,087 | 71,177,886 | |
| 5% 1/1/22 to 2/1/49 | 12,003,496 | 13,577,793 | |
| 5.26% 8/1/41 (b) | 354,125 | 401,514 | |
| 5.5% 10/1/21 to 9/1/24 | 13,123 | 13,313 | |
| 6% to 6% 11/1/21 to 1/1/42 | 1,713,730 | 2,024,601 | |
| 6.5% 3/1/22 to 5/1/38 | 248,273 | 283,520 | |
| 6.594% 2/1/39 (b) | 273,486 | 303,920 | |
| 7% to 7% 12/1/22 to 7/1/37 | 177,505 | 204,060 | |
| 7.5% to 7.5% 9/1/22 to 9/1/32 | 89,116 | 102,232 | |
| 8% 3/1/37 | 3,112 | 3,797 | |
| 8.5% 2/1/22 to 9/1/22 | 129 | 134 | |
| 9% 10/1/30 | 3,837 | 4,558 | |
| TOTAL FANNIE MAE | 1,315,852,085 | ||
| Freddie Mac - 2.2% | |||
| 12 month U.S. LIBOR + 1.320% 1.7% 1/1/36 (b)(c) | 6,911 | 7,198 | |
| 12 month U.S. LIBOR + 1.370% 1.812% 3/1/36 (b)(c) | 26,360 | 27,546 | |
| 12 month U.S. LIBOR + 1.500% 1.91% 3/1/36 (b)(c) | 26,491 | 27,806 | |
| 12 month U.S. LIBOR + 1.510% 2.015% 11/1/35 (b)(c) | 6,253 | 6,558 | |
| 12 month U.S. LIBOR + 1.750% 2.179% 12/1/40 (b)(c) | 233,166 | 246,216 | |
| 12 month U.S. LIBOR + 1.750% 2.328% 9/1/41 (b)(c) | 84,416 | 89,037 | |
| 12 month U.S. LIBOR + 1.750% 2.597% 7/1/41 (b)(c) | 55,504 | 58,531 | |
| 12 month U.S. LIBOR + 1.790% 2.168% 4/1/37 (b)(c) | 2,553 | 2,703 | |
| 12 month U.S. LIBOR + 1.860% 2.114% 4/1/36 (b)(c) | 9,386 | 9,930 | |
| 12 month U.S. LIBOR + 1.880% 2.178% 4/1/41 (b)(c) | 4,726 | 4,996 | |
| 12 month U.S. LIBOR + 1.880% 2.481% 9/1/41 (b)(c) | 8,879 | 9,366 | |
| 12 month U.S. LIBOR + 1.890% 2.536% 10/1/42 (b)(c) | 31,416 | 33,308 | |
| 12 month U.S. LIBOR + 1.910% 2.466% 5/1/41 (b)(c) | 16,313 | 17,274 | |
| 12 month U.S. LIBOR + 1.910% 2.64% 5/1/41 (b)(c) | 13,704 | 14,511 | |
| 12 month U.S. LIBOR + 1.910% 2.761% 6/1/41 (b)(c) | 17,354 | 18,376 | |
| 12 month U.S. LIBOR + 1.910% 2.91% 6/1/41 (b)(c) | 4,454 | 4,718 | |
| 12 month U.S. LIBOR + 1.920% 2.92% 6/1/36 (b)(c) | 5,207 | 5,528 | |
| 12 month U.S. LIBOR + 1.960% 2.851% 6/1/33 (b)(c) | 12,727 | 13,447 | |
| 12 month U.S. LIBOR + 2.020% 2.32% 4/1/38 (b)(c) | 14,334 | 15,126 | |
| 12 month U.S. LIBOR + 2.030% 2.567% 3/1/33 (b)(c) | 307 | 323 | |
| 12 month U.S. LIBOR + 2.040% 2.97% 7/1/36 (b)(c) | 16,448 | 17,446 | |
| 12 month U.S. LIBOR + 2.200% 2.575% 12/1/36 (b)(c) | 23,437 | 24,910 | |
| 6 month U.S. LIBOR + 1.120% 1.375% 8/1/37 (b)(c) | 8,623 | 8,872 | |
| 6 month U.S. LIBOR + 1.580% 1.83% 12/1/35 (b)(c) | 999 | 1,044 | |
| 6 month U.S. LIBOR + 1.720% 1.97% 8/1/37 (b)(c) | 3,643 | 3,831 | |
| 6 month U.S. LIBOR + 1.840% 2.095% 2/1/37 (b)(c) | 4,423 | 4,665 | |
| 6 month U.S. LIBOR + 1.880% 2.136% 10/1/36 (b)(c) | 30,402 | 31,937 | |
| 6 month U.S. LIBOR + 1.990% 2.248% 10/1/35 (b)(c) | 11,203 | 11,793 | |
| 6 month U.S. LIBOR + 2.020% 2.269% 6/1/37 (b)(c) | 22,133 | 23,346 | |
| 6 month U.S. LIBOR + 2.680% 2.932% 10/1/35 (b)(c) | 10,993 | 11,628 | |
| U.S. TREASURY 1 YEAR INDEX + 2.030% 2.313% 6/1/33 (b)(c) | 23,627 | 24,855 | |
| U.S. TREASURY 1 YEAR INDEX + 2.260% 2.653% 6/1/33 (b)(c) | 40,614 | 42,652 | |
| U.S. TREASURY 1 YEAR INDEX + 2.430% 2.655% 3/1/35 (b)(c) | 82,230 | 86,803 | |
| 2.5% 6/1/31 to 11/1/50 | 103,752,387 | 108,186,354 | |
| 3% 6/1/31 to 8/1/50 | 295,246,153 | 311,940,702 | |
| 3.5% 6/1/27 to 4/1/50 (d)(f)(h) | 203,171,299 | 217,162,350 | |
| 3.5% 8/1/47 | 3,588,487 | 3,834,218 | |
| 4% 6/1/33 to 1/1/49 (e) | 116,494,986 | 126,462,253 | |
| 4% 4/1/48 | 30,188 | 32,323 | |
| 4.5% 6/1/25 to 12/1/48 | 16,000,097 | 17,612,875 | |
| 5% 7/1/33 to 7/1/41 | 3,487,219 | 3,977,051 | |
| 5.5% 6/1/22 | 5,591 | 5,679 | |
| 6% 12/1/21 to 12/1/37 | 365,190 | 426,331 | |
| 6.5% 6/1/21 to 9/1/39 | 594,043 | 697,138 | |
| 7% 3/1/26 to 9/1/36 | 177,476 | 206,863 | |
| 7.5% 1/1/27 to 7/1/34 | 48,651 | 56,868 | |
| 8% 7/1/24 to 4/1/32 | 3,977 | 4,581 | |
| 8.5% 12/1/22 to 1/1/28 | 2,423 | 2,709 | |
| TOTAL FREDDIE MAC | 791,514,575 | ||
| Ginnie Mae - 6.1% | |||
| 3.5% 9/20/40 to 6/20/50 | 216,607,349 | 229,706,525 | |
| 4% 7/20/33 to 6/20/49 | 181,078,814 | 195,386,209 | |
| 4.5% 6/20/33 to 9/20/46 | 11,013,488 | 12,321,304 | |
| 5.5% 8/15/33 to 9/15/39 | 298,912 | 347,054 | |
| 6% to 6% 10/15/30 to 5/15/40 | 439,557 | 515,196 | |
| 7% to 7% 11/15/22 to 11/15/32 | 177,594 | 205,187 | |
| 7.5% to 7.5% 2/15/22 to 9/15/31 | 44,573 | 49,583 | |
| 8% 11/15/21 to 11/15/29 | 11,688 | 12,744 | |
| 8.5% to 8.5% 11/15/27 to 1/15/31 | 5,569 | 6,419 | |
| 9% 1/15/23 | 20 | 21 | |
| 2% 3/20/51 to 4/20/51 | 95,392,477 | 97,146,706 | |
| 2% 6/1/51 (h) | 46,400,000 | 47,200,214 | |
| 2% 6/1/51 (h) | 19,000,000 | 19,327,674 | |
| 2% 6/1/51 (h) | 18,500,000 | 18,819,051 | |
| 2% 6/1/51 (h) | 7,550,000 | 7,680,207 | |
| 2% 6/1/51 (h) | 45,400,000 | 46,182,968 | |
| 2% 6/1/51 (h) | 18,550,000 | 18,869,913 | |
| 2% 6/1/51 (h) | 35,800,000 | 36,417,407 | |
| 2% 6/1/51 (h) | 14,600,000 | 14,851,792 | |
| 2% 6/1/51 (h) | 7,300,000 | 7,425,896 | |
| 2% 6/1/51 (h) | 17,900,000 | 18,208,703 | |
| 2% 6/1/51 (h) | 13,300,000 | 13,529,372 | |
| 2% 6/1/51 (h) | 5,500,000 | 5,594,853 | |
| 2% 6/1/51 (h) | 8,950,000 | 9,104,352 | |
| 2% 6/1/51 (h) | 3,650,000 | 3,712,948 | |
| 2% 6/1/51 (h) | 2,850,000 | 2,899,151 | |
| 2% 6/1/51 (h) | 1,150,000 | 1,169,833 | |
| 2% 6/1/51 (h) | 1,650,000 | 1,678,456 | |
| 2% 6/1/51 (h) | 950,000 | 966,384 | |
| 2% 6/1/51 (h) | 10,000,000 | 10,172,460 | |
| 2% 7/1/51 (h) | 14,150,000 | 14,369,158 | |
| 2% 7/1/51 (h) | 5,700,000 | 5,788,283 | |
| 2% 7/1/51 (h) | 9,450,000 | 9,596,363 | |
| 2% 7/1/51 (h) | 3,800,000 | 3,858,855 | |
| 2% 7/1/51 (h) | 9,500,000 | 9,647,138 | |
| 2% 7/1/51 (h) | 23,700,000 | 24,067,070 | |
| 2% 7/1/51 (h) | 56,850,000 | 57,730,504 | |
| 2% 7/1/51 (h) | 22,800,000 | 23,153,131 | |
| 2% 7/1/51 (h) | 33,150,000 | 33,663,434 | |
| 2% 7/1/51 (h) | 13,300,000 | 13,505,993 | |
| 2.5% 11/20/47 to 3/20/51 | 136,954,522 | 142,032,961 | |
| 2.5% 6/1/51 (h) | 13,300,000 | 13,775,313 | |
| 2.5% 6/1/51 (h) | 6,250,000 | 6,473,361 | |
| 2.5% 6/1/51 (h) | 3,400,000 | 3,521,509 | |
| 2.5% 6/1/51 (h) | 12,550,000 | 12,998,509 | |
| 2.5% 6/1/51 (h) | 11,650,000 | 12,066,345 | |
| 2.5% 6/1/51 (h) | 4,050,000 | 4,194,738 | |
| 2.5% 6/1/51 (h) | 17,975,000 | 18,617,387 | |
| 2.5% 6/1/51 (h) | 5,000,000 | 5,178,689 | |
| 2.5% 6/1/51 (h) | 10,200,000 | 10,564,526 | |
| 2.5% 6/1/51 (h) | 50,750,000 | 52,563,693 | |
| 2.5% 6/1/51 (h) | 18,200,000 | 18,850,428 | |
| 2.5% 6/1/51 (h) | 8,450,000 | 8,751,984 | |
| 2.5% 6/1/51 (h) | 3,300,000 | 3,417,935 | |
| 3% 5/15/42 to 11/20/50 | 200,201,768 | 209,368,077 | |
| 3% 6/1/51 (h) | 9,650,000 | 10,067,860 | |
| 3% 6/1/51 (h) | 8,800,000 | 9,181,054 | |
| 3% 6/1/51 (h) | 32,950,000 | 34,376,788 | |
| 3% 6/1/51 (h) | 4,950,000 | 5,164,343 | |
| 3% 6/1/51 (h) | 15,300,000 | 15,962,514 | |
| 3% 6/1/51 (h) | 9,500,000 | 9,911,365 | |
| 3% 6/1/51 (h) | 25,700,000 | 26,812,851 | |
| 3% 6/1/51 (h) | 15,850,000 | 16,536,330 | |
| 3% 7/1/51 (h) | 35,450,000 | 36,973,964 | |
| 3% 7/1/51 (h) | 15,150,000 | 15,801,285 | |
| 3% 7/1/51 (h) | 35,400,000 | 36,921,814 | |
| 3% 7/1/51 (h) | 15,125,000 | 15,775,210 | |
| 3% 7/1/51 (h) | 29,075,000 | 30,324,908 | |
| 3% 7/1/51 (h) | 12,425,000 | 12,959,140 | |
| 3% 7/1/51 (h) | 20,100,000 | 20,964,081 | |
| 3% 7/1/51 (h) | 9,400,000 | 9,804,098 | |
| 3.5% 6/1/51 (h) | 16,650,000 | 17,513,209 | |
| 3.5% 6/1/51 (h) | 33,400,000 | 35,131,603 | |
| 3.5% 6/1/51 (h) | 32,650,000 | 34,342,720 | |
| 3.5% 6/1/51 (h) | 10,400,000 | 10,939,182 | |
| 3.5% 6/1/51 (h) | 6,225,000 | 6,547,731 | |
| 3.5% 6/1/51 (h) | 19,575,000 | 20,589,854 | |
| 3.5% 6/1/51 (h) | 4,750,000 | 4,996,261 | |
| 3.5% 6/1/51 (h) | 1,500,000 | 1,577,767 | |
| 3.5% 6/1/51 (h) | 9,400,000 | 9,887,337 | |
| 3.5% 6/1/51 (h) | 3,000,000 | 3,155,533 | |
| 3.5% 6/1/51 (h) | 10,825,000 | 11,386,216 | |
| 3.5% 6/1/51 (h) | 3,450,000 | 3,628,863 | |
| 3.5% 6/1/51 (h) | 9,200,000 | 9,676,968 | |
| 3.5% 6/1/51 (h) | 8,000,000 | 8,414,755 | |
| 3.5% 6/1/51 (h) | 10,100,000 | 10,623,628 | |
| 3.5% 6/1/51 (h) | 28,000,000 | 29,451,643 | |
| 3.5% 7/1/51 (h) | 10,700,000 | 11,258,915 | |
| 3.5% 7/1/51 (h) | 28,750,000 | 30,251,756 | |
| 3.5% 7/1/51 (h) | 4,600,000 | 4,840,281 | |
| 3.5% 7/1/51 (h) | 2,450,000 | 2,577,976 | |
| 4% 6/1/51 (h) | 61,400,000 | 65,165,994 | |
| 5% 4/15/33 to 6/20/48 | 18,881,397 | 20,862,834 | |
| 6.5% 3/20/31 to 6/15/37 | 68,172 | 80,148 | |
| TOTAL GINNIE MAE | 2,197,702,745 | ||
| Uniform Mortgage Backed Securities - 5.0% | |||
| 1.5% 6/1/36 (h) | 25,150,000 | 25,460,447 | |
| 1.5% 6/1/36 (h) | 5,200,000 | 5,264,188 | |
| 1.5% 6/1/36 (h) | 5,150,000 | 5,213,571 | |
| 2% 6/1/36 (h) | 11,700,000 | 12,088,476 | |
| 2% 6/1/36 (h) | 15,400,000 | 15,911,328 | |
| 2% 6/1/51 (h) | 23,300,000 | 23,541,710 | |
| 2% 6/1/51 (h) | 58,300,000 | 58,904,793 | |
| 2% 6/1/51 (h) | 25,100,000 | 25,360,382 | |
| 2% 6/1/51(h) | 16,700,000 | 16,873,242 | |
| 2% 6/1/51 (h) | 42,250,000 | 42,688,293 | |
| 2% 6/1/51 (h) | 11,800,000 | 11,922,411 | |
| 2% 6/1/51 (h) | 42,375,000 | 42,814,590 | |
| 2% 6/1/51 (h) | 15,300,000 | 15,458,719 | |
| 2% 6/1/51 (h) | 41,550,000 | 41,981,031 | |
| 2% 6/1/51 (h) | 15,300,000 | 15,458,719 | |
| 2% 6/1/51 (h) | 37,875,000 | 38,267,908 | |
| 2% 6/1/51 (h) | 11,400,000 | 11,518,261 | |
| 2% 6/1/51 (h) | 54,250,000 | 54,812,779 | |
| 2% 6/1/51 (h) | 44,050,000 | 44,506,966 | |
| 2% 6/1/51 (h) | 30,600,000 | 30,917,438 | |
| 2% 6/1/51 (h) | 54,250,000 | 54,812,779 | |
| 2% 7/1/51 (h) | 60,600,000 | 61,091,357 | |
| 2% 7/1/51 (h) | 23,300,000 | 23,488,921 | |
| 2% 7/1/51 (h) | 23,500,000 | 23,690,543 | |
| 2% 7/1/51 (h) | 62,400,000 | 62,905,952 | |
| 2% 7/1/51 (h) | 11,650,000 | 11,744,461 | |
| 2% 7/1/51 (h) | 42,550,000 | 42,895,004 | |
| 2.5% 6/1/51 (h) | 68,200,000 | 70,616,299 | |
| 2.5% 6/1/51 (h) | 16,100,000 | 16,670,417 | |
| 2.5% 6/1/51 (h) | 22,250,000 | 23,038,309 | |
| 2.5% 6/1/51 (h) | 7,050,000 | 7,299,779 | |
| 2.5% 6/1/51 (h) | 18,550,000 | 19,207,219 | |
| 2.5% 6/1/51 (h) | 5,850,000 | 6,057,263 | |
| 2.5% 6/1/51 (h) | 26,600,000 | 27,542,427 | |
| 2.5% 6/1/51 (h) | 8,400,000 | 8,697,609 | |
| 2.5% 6/1/51 (h) | 4,700,000 | 4,866,519 | |
| 2.5% 6/1/51 (h) | 2,600,000 | 2,692,117 | |
| 2.5% 6/1/51 (h) | 3,800,000 | 3,934,632 | |
| 2.5% 6/1/51 (h) | 2,000,000 | 2,070,859 | |
| 2.5% 6/1/51 (h) | 15,400,000 | 15,945,616 | |
| 2.5% 6/1/51 (h) | 28,700,000 | 29,716,830 | |
| 2.5% 7/1/51 (h) | 30,100,000 | 31,094,709 | |
| 2.5% 7/1/51 (h) | 2,950,000 | 3,047,488 | |
| 3% 6/1/51 (h) | 17,300,000 | 18,067,689 | |
| 3% 6/1/51 (h) | 5,300,000 | 5,535,188 | |
| 3% 6/1/51 (h) | 18,900,000 | 19,738,689 | |
| 3% 6/1/51 (h) | 5,775,000 | 6,031,266 | |
| 3% 6/1/51 (h) | 100,000 | 104,438 | |
| 3% 6/1/51 (h) | 2,600,000 | 2,715,375 | |
| 3.5% 6/1/51 (h) | 12,050,000 | 12,719,872 | |
| 3.5% 6/1/51 (h) | 60,300,000 | 63,652,137 | |
| 3.5% 6/1/51 (h) | 48,100,000 | 50,773,927 | |
| 3.5% 6/1/51 (h) | 9,550,000 | 10,080,894 | |
| 3.5% 6/1/51 (h) | 6,350,000 | 6,703,003 | |
| 3.5% 6/1/51 (h) | 71,550,000 | 75,527,536 | |
| 3.5% 6/1/51 (h) | 6,100,000 | 6,439,105 | |
| 3.5% 6/1/51 (h) | 67,075,000 | 70,803,766 | |
| 3.5% 6/1/51 (h) | 8,100,000 | 8,550,287 | |
| 3.5% 6/1/51 (h) | 41,000,000 | 43,279,231 | |
| 3.5% 6/1/51 (h) | 2,200,000 | 2,322,300 | |
| 3.5% 6/1/51 (h) | 5,900,000 | 6,227,987 | |
| 3.5% 6/1/51 (h) | 3,100,000 | 3,272,332 | |
| 3.5% 6/1/51 (h) | 2,400,000 | 2,533,418 | |
| 3.5% 6/1/51 (h) | 5,400,000 | 5,700,191 | |
| 3.5% 6/1/51 (h) | 6,800,000 | 7,178,019 | |
| 3.5% 6/1/51 (h) | 2,050,000 | 2,163,962 | |
| 3.5% 6/1/51 (h) | 1,950,000 | 2,058,402 | |
| 3.5% 6/1/51 (h) | 40,000,000 | 42,223,640 | |
| 3.5% 7/1/51 (h) | 76,500,000 | 80,800,524 | |
| 3.5% 7/1/51 (h) | 50,700,000 | 53,550,151 | |
| 3.5% 7/1/51 (h) | 15,400,000 | 16,265,726 | |
| 3.5% 7/1/51 (h) | 10,250,000 | 10,826,214 | |
| 3.5% 7/1/51 (h) | 55,850,000 | 58,989,664 | |
| 3.5% 7/1/51 (h) | 11,250,000 | 11,882,430 | |
| TOTAL UNIFORM MORTGAGE BACKED SECURITIES | 1,798,809,724 | ||
| TOTAL U.S. GOVERNMENT AGENCY - MORTGAGE SECURITIES | |||
| (Cost $6,065,414,862) | 6,103,879,129 | ||
| Asset-Backed Securities - 2.2% | |||
| AASET Trust: | |||
| Series 2018-1A Class A, 3.844% 1/16/38 (a) | $8,439,800 | $8,086,363 | |
| Series 2019-1 Class A, 3.844% 5/15/39 (a) | 4,903,084 | 4,919,632 | |
| Series 2019-2: | |||
| Class A, 3.376% 10/16/39 (a) | 8,425,548 | 8,439,788 | |
| Class B, 4.458% 10/16/39 (a) | 1,488,945 | 1,223,536 | |
| Affirm, Inc. Series 2021-A Class A, 0.88% 8/15/25 (a) | 4,062,000 | 4,069,497 | |
| Aimco Series 2019-10A Class A, 3 month U.S. LIBOR + 1.320% 1.5038% 7/22/32 (a)(b)(c) | 11,898,000 | 11,899,118 | |
| AIMCO CLO Ltd.: | |||
| Series 2020-11A Class A1, 3 month U.S. LIBOR + 1.380% 1.5638% 10/15/31 (a)(b)(c) | 8,424,000 | 8,437,731 | |
| Series 2021-12A Class A, 3 month U.S. LIBOR + 1.210% 1.4356% 1/17/32 (a)(b)(c) | 9,320,000 | 9,312,320 | |
| Ajax Mortgage Loan Trust Series 2021-C Class A, 2.115% 1/25/61 (a) | 2,841,162 | 2,842,516 | |
| Allegany Park CLO, Ltd. / Allegany Series 2020-1A Class A, 3 month U.S. LIBOR + 1.330% 1.5183% 1/20/33 (a)(b)(c) | 4,684,000 | 4,694,230 | |
| Allegro CLO, Ltd. Series 2021-1A Class A, 3 month U.S. LIBOR + 1.140% 0% 7/20/34 (a)(b)(c)(h) | 8,250,000 | 8,250,000 | |
| Apollo Aviation Securitization Equity Trust Series 2020-1A: | |||
| Class A, 3.351% 1/16/40 (a) | 4,541,205 | 4,547,454 | |
| Class B, 4.335% 1/16/40 (a) | 766,953 | 629,151 | |
| Ares CLO Series 2019-54A Class A, 3 month U.S. LIBOR + 1.320% 1.5038% 10/15/32 (a)(b)(c) | 8,066,000 | 8,075,115 | |
| Ares CLO Ltd. Series 2020-58A Class A, 3 month U.S. LIBOR + 1.220% 1.4558% 1/15/33 (a)(b)(c) | 11,060,000 | 11,077,187 | |
| Ares LV CLO Ltd. Series 2020-55A Class A1, 3 month U.S. LIBOR + 1.700% 1.8838% 4/15/31 (a)(b)(c) | 8,740,000 | 8,762,357 | |
| Ares XLI CLO Ltd. / Ares XLI CLO LLC Series 2021-41A Class AR2, 3 month U.S. LIBOR + 1.070% 1.6679% 4/15/34 (a)(b)(c) | 11,760,000 | 11,762,164 | |
| Ares XXXIV CLO Ltd. Series 2020-2A Class AR2, 3 month U.S. LIBOR + 1.250% 1.4398% 4/17/33 (a)(b)(c) | 20,753,000 | 20,843,110 | |
| Babson CLO Ltd./Cayman Islands Series 2020-1A Class A1, 3 month U.S. LIBOR + 1.400% 1.5838% 10/15/32 (a)(b)(c) | 13,346,000 | 13,367,901 | |
| Barings CLO Ltd. Series 2021-4A Class A, 3 month U.S. LIBOR + 1.220% 1.444% 1/20/32 (a)(b)(c) | 9,220,000 | 9,220,498 | |
| Beechwood Park CLO Ltd. Series 2019-1A Class A1, 3 month U.S. LIBOR + 1.330% 1.5198% 1/17/33 (a)(b)(c) | 3,961,000 | 3,973,105 | |
| Blackbird Capital Aircraft Series 2016-1A: | |||
| Class A, 4.213% 12/16/41 (a) | 5,961,667 | 6,014,731 | |
| Class AA, 2.487% 12/16/41 (a)(b) | 950,125 | 955,117 | |
| Brazos Higher Education Authority, Inc.: | |||
| Series 2010-1 Class A1, 3 month U.S. LIBOR + 0.900% 1.047% 5/25/29 (b)(c) | 312,971 | 313,350 | |
| Series 2011-2 Class A2, 3 month U.S. LIBOR + 0.850% 1.0258% 7/25/29 (b)(c) | 449,592 | 450,904 | |
| Bristol Park CLO, Ltd. Series 2020-1A Class AR, 3 month U.S. LIBOR + 0.990% 1.1738% 4/15/29 (a)(b)(c) | 10,597,000 | 10,594,510 | |
| Cascade Funding Mortgage Trust: | |||
| Series 2020-HB2 Class A, 3.4047% 4/25/30 (a) | 13,008,854 | 13,150,846 | |
| Series 2020-HB3 Class A, 2.8115% 5/25/30 (a)(b) | 1,562,177 | 1,574,886 | |
| Castlelake Aircraft Securitization Trust Series 2019-1A: | |||
| Class A, 3.967% 4/15/39 (a) | 8,502,132 | 8,522,061 | |
| Class B, 5.095% 4/15/39 (a) | 3,608,108 | 3,388,995 | |
| Castlelake Aircraft Structured Trust: | |||
| Series 2018-1 Class A, 4.125% 6/15/43 (a) | 5,330,671 | 5,325,327 | |
| Series 2021-1A: | |||
| Class A, 3.474% 1/15/46 (a) | 3,309,880 | 3,380,542 | |
| Class B, 6.656% 1/15/46 (a) | 3,389,440 | 3,544,505 | |
| Cedar Funding Ltd.: | |||
| Series 2019-10A Class A, 3 month U.S. LIBOR + 1.340% 1.5283% 10/20/32 (a)(b)(c) | 6,412,000 | 6,442,771 | |
| Series 2019-11A Class A1A, 3 month U.S. LIBOR + 1.350% 1.5405% 5/29/32 (a)(b)(c) | 4,342,000 | 4,342,308 | |
| Cedar Funding XII CLO Ltd. / Cedar Funding XII CLO LLC Series 2020-12A Class A, 3 month U.S. LIBOR + 1.270% 1.4458% 10/25/32 (a)(b)(c) | 5,250,000 | 5,267,656 | |
| Cent CLO Ltd. / Cent CLO Series 2020-29A Class A1N, 3 month U.S. LIBOR + 1.700% 1.8883% 7/20/31 (a)(b)(c) | 10,867,000 | 10,924,269 | |
| Citi Mortgage Loan Trust Series 2007-1 Class 1A, 1 month U.S. LIBOR + 1.350% 1.4416% 10/25/37 (a)(b)(c) | 147,168 | 147,887 | |
| CNH Equipment Trust Series 2019-C Class A2, 1.99% 3/15/23 | 692,892 | 693,981 | |
| Collegiate Funding Services Education Loan Trust Series 2004-A Class A4, 3 month U.S. LIBOR + 0.340% 0.533% 9/28/30 (b)(c) | 546,997 | 545,476 | |
| Columbia Cent CLO 31 Ltd. Series 2021-31A Class A1, 3 month U.S. LIBOR + 1.200% 1.3474% 4/20/34 (a)(b)(c) | 9,300,000 | 9,278,043 | |
| Columbia Cent CLO Ltd. / Columbia Cent CLO Corp. Series 2021-30A Class A1, 3 month U.S. LIBOR + 1.310% 1.534% 1/20/34 (a)(b)(c) | 12,220,000 | 12,233,723 | |
| Consumer Loan Underlying Bond Credit Trust: | |||
| Series 2019-HP1 Class A, 2.59% 12/15/26 (a) | 5,755,564 | 5,812,517 | |
| Series 2019-P1 Class A, 2.94% 7/15/26(a) | 497,722 | 498,595 | |
| DB Master Finance LLC: | |||
| Series 2017-1A: | |||
| Class A2I, 3.629% 11/20/47 (a) | 3,128,895 | 3,175,203 | |
| Class A2II, 4.03% 11/20/47 (a) | 5,322,218 | 5,680,350 | |
| Series 2019-1A: | |||
| Class A23, 4.352% 5/20/49 (a) | 987,413 | 1,084,209 | |
| Class A2II, 4.021% 5/20/49 (a) | 742,770 | 784,439 | |
| Dominos Pizza Master Issuer LLC Series 2019-1A Class A2, 3.668% 10/25/49 (a) | 2,108,313 | 2,269,029 | |
| Dryden 68 CLO Ltd. 3 month U.S. LIBOR + 1.310% 1.4938% 7/15/32 (a)(b)(c) | 7,300,000 | 7,300,416 | |
| Dryden CLO, Ltd.: | |||
| Series 2019-76A Class A1, 3 month U.S. LIBOR + 1.330% 1.5183% 10/20/32 (a)(b)(c) | 10,321,000 | 10,346,968 | |
| Series 2021-83A Class A, 3 month U.S. LIBOR + 1.220% 1.4573% 1/18/32 (a)(b)(c) | 3,940,000 | 3,943,826 | |
| Dryden CLO, Ltd. / Dryden CLO, LLC Series 2020-85A Class A1, 3 month U.S. LIBOR + 1.350% 1.5338% 10/15/32 (a)(b)(c) | 9,656,000 | 9,689,323 | |
| Dryden Senior Loan Fund: | |||
| Series 2018-70A Class A1, 3 month U.S. LIBOR + 1.170% 1.3536% 1/16/32 (a)(b)(c) | 2,909,000 | 2,921,500 | |
| Series 2020-78A Class A, 3 month U.S. LIBOR + 1.180% 1.3698% 4/17/33 (a)(b)(c) | 7,000,000 | 7,019,453 | |
| Eaton Vance CLO, Ltd.: | |||
| Series 2020-1A Class A, 3 month U.S. LIBOR + 1.650% 1.8338% 10/15/30 (a)(b)(c) | 9,200,000 | 9,220,019 | |
| Series 2020-2A Class A1, 3 month U.S. LIBOR + 1.370% 1.5538% 10/15/32 (a)(b)(c) | 9,400,000 | 9,415,134 | |
| Eaton Vance CLO, Ltd. / Eaton Vance CLO LLC Series 2021-1A Class A13R, 3 month U.S. LIBOR + 1.250% 1.4338% 1/15/34 (a)(b)(c) | 2,000,000 | 1,998,824 | |
| Enterprise Fleet Financing LLC Series 2021-1 Class A2, 0.44% 12/21/26 (a) | 11,363,000 | 11,371,318 | |
| Finance of America HECM Buyout Series 2021-HB1 Class A, 0.8754% 2/25/31 (a)(b) | 7,540,137 | 7,544,830 | |
| Flatiron CLO Ltd.: | |||
| Series 2019-1A Class A, 3 month U.S. LIBOR + 1.320% 1.4759% 11/16/32 (a)(b)(c) | 8,949,000 | 8,965,779 | |
| Series 2021-1A Class A1, 3 month U.S. LIBOR + 1.110% 1.11% 7/19/34 (a)(b)(c)(h) | 7,180,000 | 7,180,000 | |
| Flatiron CLO Ltd. / Flatiron CLO LLC Series 2020-1A Class A, 3 month U.S. LIBOR + 1.300% 1.4553% 11/20/33 (a)(b)(c) | 8,920,000 | 8,994,402 | |
| Ford Credit Floorplan Master Owner Trust: | |||
| Series 2019-1 Class B, 3.04% 3/15/24 | 1,170,000 | 1,194,992 | |
| Series 2019-2 Class A, 3.06% 4/15/26 | 8,253,000 | 8,854,281 | |
| Series 2019-3 Class A1, 2.23% 9/15/24 | 4,320,000 | 4,430,936 | |
| Series 2019-4 Class A, 2.44% 9/15/26 | 1,300,000 | 1,376,133 | |
| GM Financial Automobile Leasing Trust Series 2020-1 Class A2A, 1.67% 4/20/22 | 1,410,027 | 1,412,181 | |
| GMF Floorplan Owner Revolving Trust Series 2018-4 Class A2, 1 month U.S. LIBOR + 0.410% 0.5109% 9/15/23(a)(b)(c) | 4,186,000 | 4,190,348 | |
| Horizon Aircraft Finance I Ltd. Series 2018-1 Class A, 4.458% 12/15/38 (a) | 3,229,754 | 3,277,898 | |
| Horizon Aircraft Finance Ltd. Series 2019-1 Class A, 3.721% 7/15/39 (a) | 4,598,701 | 4,615,391 | |
| Lanark Master Issuer PLC Series 2020-1A Class 1A, 2.277% 12/22/69 (a)(b) | 7,887,000 | 8,085,926 | |
| Lucali CLO Ltd. Series 2021-1A Class A, 3 month U.S. LIBOR + 1.210% 1.4484% 1/15/33 (a)(b)(c) | 4,500,000 | 4,506,557 | |
| Madison Park Funding Series 2020-19A Class A1R2, 3 month U.S. LIBOR + 0.920% 1.1038% 1/22/28 (a)(b)(c) | 2,736,643 | 2,736,637 | |
| Madison Park Funding L Ltd. / Madison Park Funding L LLC Series 2021-50A Class A, 3 month U.S. LIBOR + 1.140% 1.3358% 4/19/34 (a)(b)(c) | 9,810,000 | 9,807,440 | |
| Madison Park Funding Ltd. Series 2019-37A Class A1, 3 month U.S. LIBOR + 1.300% 1.4838% 7/15/32 (a)(b)(c) | 9,585,000 | 9,585,431 | |
| Madison Park Funding XLV Ltd./Madison Park Funding XLV LLC Series 2020-45A Class A, 3 month U.S. LIBOR + 1.650% 1.8338% 7/15/31 (a)(b)(c) | 9,770,000 | 9,779,438 | |
| Madison Park Funding XXXIII Ltd. Series 2019-33A Class A, 3 month U.S. LIBOR + 1.330% 1.5138% 10/15/32 (a)(b)(c) | 4,271,000 | 4,293,542 | |
| Magnetite XVI, Ltd. / Magnetite XVI, LLC Series 2015-16A Class AR, 3 month U.S. LIBOR + 0.800% 0.9898% 1/18/28 (a)(b)(c) | 8,423,210 | 8,394,192 | |
| Magnetite XXI Ltd. Series 2019-24A Class A, 3 month U.S. LIBOR + 1.330% 1.5138% 1/15/33 (a)(b)(c) | 23,148,000 | 23,142,120 | |
| Magnetite XXIX, Ltd. / Magnetite XXIX LLC Series 2021-29A Class A, 3 month U.S. LIBOR + 0.990% 1.0944% 1/15/34 (a)(b)(c) | 8,400,000 | 8,389,752 | |
| Marlette Funding Trust: | |||
| Series 2019-4A Class A, 2.39% 12/17/29 (a) | 1,374,314 | 1,381,952 | |
| Series 2020-1A Class A, 2.24% 3/15/30 (a) | 597,876 | 599,313 | |
| Mercedes-Benz Master Owner Trust Series 2019-BA Class A, 2.61% 5/15/24 (a) | 10,340,000 | 10,579,799 | |
| Metlife Securitization Trust Series 2019-1A Class A1A, 3.75% 4/25/58 (a) | 2,373,075 | 2,445,351 | |
| Milos CLO, Ltd. Series 2020-1A Class AR, 3 month U.S. LIBOR + 1.070% 1.2583% 10/20/30 (a)(b)(c) | 10,553,000 | 10,566,022 | |
| Mortgage Repurchase Agreement Financing Trust Series 2020-5 Class A1, 1 month U.S. LIBOR + 1.000% 1.0951% 8/10/23 (a)(b)(c) | 21,867,000 | 22,076,748 | |
| Nationstar HECM Loan Trust: | |||
| Series 2019-1A Class A, 2.6513% 6/25/29 (a) | 1,152,972 | 1,154,897 | |
| Series 2020-1A Class A1, 1.2686% 9/25/30 (a) | 12,898,323 | 12,883,438 | |
| Navient Student Loan Trust Series 2017-3A Class A2, 1 month U.S. LIBOR + 0.600% 0.6916% 7/26/66 (a)(b)(c) | 435,550 | 436,497 | |
| Niagara Park CLO, Ltd. Series 2019-1A Class A, 3 month U.S. LIBOR + 1.300% 1.4898% 7/17/32 (a)(b)(c) | 8,594,000 | 8,602,886 | |
| Planet Fitness Master Issuer LLC: | |||
| Series 2018-1A Class A2I, 4.262% 9/5/48 (a) | 292,500 | 294,694 | |
| Series 2019-1A Class A2, 3.858% 12/5/49 (a) | 7,121,850 | 7,119,927 | |
| Project Silver Series 2019-1 Class A, 3.967% 7/15/44 (a) | 6,676,438 | 6,688,023 | |
| Prosper Marketplace Issuance Trust Series 2019-4A Class A, 2.48% 2/17/26 (a) | 379,525 | 380,302 | |
| Provident Funding Mortgage Trust Series 2020-1 Class A3, 3% 2/25/50 (a) | 1,858,477 | 1,865,932 | |
| RMF Buyout Issuance Trust Series 2020-1 Class A, 2.1582% 2/25/30 (a) | 2,713,353 | 2,722,951 | |
| Rockland Park CLO Ltd. Series 2021-1A Class A, 3 month U.S. LIBOR + 1.120% 0% 4/20/34 (a)(b)(c)(h) | 12,190,000 | 12,191,231 | |
| Santander Retail Auto Lease Trust Series 2019-C Class A2A, 1.89% 9/20/22 (a) | 1,328,433 | 1,332,195 | |
| Sapphire Aviation Finance Series 2020-1A: | |||
| Class A, 3.228% 3/15/40 (a) | 20,739,803 | 20,709,813 | |
| Class B, 4.335% 3/15/40 (a) | 853,777 | 748,224 | |
| SBA Tower Trust: | |||
| Series 2019, 2.836% 1/15/50 (a) | 8,715,000 | 9,198,925 | |
| 1.884% 7/15/50 (a) | 4,275,000 | 4,356,484 | |
| 2.328% 7/15/52 (a) | 3,269,000 | 3,321,623 | |
| SLM Student Loan Trust Series 2003-10A Class A3, 3 month U.S. LIBOR + 0.470% 0.6539% 12/15/27 (a)(b)(c) | 856,929 | 857,035 | |
| SoFi Consumer Loan Program Trust Series 2019-4 Class A, 2.45% 8/25/28 (a) | 2,231,321 | 2,247,022 | |
| Store Master Funding Series 2021-1A Class A1, 2.12% 6/20/51 (a)(h) | 11,000,000 | 11,076,604 | |
| Symphony CLO XXIII Ltd. Series 2020-23A Class A, 3 month U.S. LIBOR + 1.320% 1.5038% 1/15/34 (a)(b)(c) | 5,300,000 | 5,308,756 | |
| Symphony CLO XXVI Ltd. / Symphony CLO XXVI LLC Series 2021-26A Class AR, 3 month U.S. LIBOR + 1.080% 1.1892% 4/20/33 (a)(b)(c) | 7,300,000 | 7,290,766 | |
| Taconic Park CLO, Ltd. Series 2020-1A Class A1R, 3 month U.S. LIBOR + 1.000% 1.1883% 1/20/29 (a)(b)(c) | 7,106,000 | 7,117,576 | |
| Terwin Mortgage Trust Series 2003-4HE Class A1, 1 month U.S. LIBOR + 0.860% 0.9516% 9/25/34 (b)(c) | 7,249 | 6,764 | |
| Thunderbolt Aircraft Lease Ltd. Series 2018-A Class A, 4.147% 9/15/38 (a)(b) | 9,675,593 | 9,730,289 | |
| Thunderbolt III Aircraft Lease Ltd. Series 2019-1 Class A, 3.671% 11/15/39 (a) | 20,541,060 | 20,427,850 | |
| Towd Point Mortgage Trust Series 2019-1 Class A1, 3.7395% 3/25/58 (a)(b) | 1,014,019 | 1,074,058 | |
| Trapeza CDO XII Ltd./Trapeza CDO XII, Inc. Series 2007-12A Class B, 3 month U.S. LIBOR + 0.560% 0.7543% 4/6/42 (a)(b)(c) | 778,000 | 524,936 | |
| Upstart Securitization Trust: | |||
| Series 2021-1 Class A, 0.87% 3/20/31 (a) | 1,419,971 | 1,422,202 | |
| Series 2021-2 Class A, 0.91% 6/20/31 (a) | 20,254,000 | 20,280,172 | |
| Voya Series 2020-1A Class A, 3 month U.S. LIBOR + 1.700% 1.8836% 7/16/31 (a)(b)(c) | 12,409,000 | 12,425,616 | |
| Voya CLO Ltd./Voya CLO LLC: | |||
| Series 2020-2A Class A1, 3 month U.S. LIBOR + 1.600% 1.7898% 7/19/31 (a)(b)(c) | 9,150,000 | 9,154,840 | |
| Series 2020-3A Class A1, 3 month U.S. LIBOR + 1.300% 1.4883% 10/20/31 (a)(b)(c) | 11,800,000 | 11,862,245 | |
| TOTAL ASSET-BACKED SECURITIES | |||
| (Cost $770,883,866) | 777,277,948 | ||
| Collateralized Mortgage Obligations - 0.8% | |||
| Private Sponsor - 0.4% | |||
| BCAP LLC Trust sequential payer Series 2010-RR2 Class 5A2, 5% 12/26/36 (a) | 1,590 | 1,589 | |
| Brass PLC Series 2021-10A Class A1, 0.669% 4/16/69 (a)(b) | 8,104,331 | 8,114,777 | |
| Cascade Funding Mortgage Trust Series 2021-HB5 Class A, 0.8006% 2/25/31 (a) | 9,501,900 | 9,497,475 | |
| CFMT LLC Series 2020-HB4 Class A, 0.9461% 12/26/30 (a) | 6,733,304 | 6,740,560 | |
| Citigroup Mortgage Loan Trust sequential payer Series 2014-8 Class 2A1, 3.45% 6/27/37 (a)(b) | 99,279 | 99,305 | |
| CSMC: | |||
| floater Series 2015-1R Class 6A1, 1 month U.S. LIBOR + 0.280% 0.3994% 5/27/37 (a)(b)(c) | 85,535 | 83,900 | |
| Series 2014-3R: | |||
| Class 2A1, 1 month U.S. LIBOR + 0.700% 0% 5/27/37 (a)(b)(c)(i) | 538,288 | 54 | |
| Class AA1, 1 month U.S. LIBOR + 0.280% 0.3995% 5/27/37 (a)(b)(c) | 939,421 | 891,653 | |
| CSMC Trust sequential payer Series 2020-RPL4 Class A1, 2% 1/25/60 (a) | 4,909,188 | 4,983,632 | |
| Ginnie Mae guaranteed REMIC pass-thru certificates floater Series 2019-23 Class NF, 1 month U.S. LIBOR + 0.450% 0.5493% 2/20/49 (b)(c) | 4,031,936 | 4,072,527 | |
| Lanark Master Issuer PLC: | |||
| floater Series 2019-1A Class 1A1, 3 month U.S. LIBOR + 0.770% 0.9201% 12/22/69 (a)(b)(c) | 1,863,333 | 1,865,737 | |
| Series 2019-2A Class 1A, 2.71% 12/22/69 (a)(b) | 9,300,000 | 9,495,960 | |
| Mortgage Repurchase Agreement Financing Trust: | |||
| floater Series 2020-3 Class A1, 1 month U.S. LIBOR + 1.250% 1.3451% 1/23/23 (a)(b)(c) | 5,443,000 | 5,469,437 | |
| Series 2020-4 Class A1, 1 month U.S. LIBOR + 1.350% 1.4451% 4/23/23 (a)(b)(c) | 25,857,000 | 25,930,434 | |
| Nationstar HECM Loan Trust sequential payer Series 2019-2A Class A, 2.2722% 11/25/29 (a) | 2,324,065 | 2,328,349 | |
| New Residential Mortgage Loan Trust: | |||
| Series 2019-5A Class A1B, 3.5% 8/25/59 (a) | 4,253,290 | 4,455,097 | |
| Series 2020-1A Class A1B, 3.5% 10/25/59 (a) | 5,927,451 | 6,286,848 | |
| Provident Funding Mortgage Trust sequential payer Series 2019-1 Class A3, 3% 12/25/49 (a) | 205,409 | 205,253 | |
| RMF Buyout Issuance Trust: | |||
| sequential payer Series 2020-2 Class A, 1.7063% 6/25/30 (a) | 18,477,527 | 18,527,834 | |
| Series 2020-HB1 Class A1, 1.7188% 10/25/50 (a) | 5,499,227 | 5,440,209 | |
| Sequoia Mortgage Trust floater Series 2004-6 Class A3B, 6 month U.S. LIBOR + 0.880% 1.14% 7/20/34 (b)(c) | 1,840 | 1,801 | |
| Silverstone Master Issuer PLC floater Series 2019-1A Class 1A, 3 month U.S. LIBOR + 0.570% 0.756% 1/21/70 (a)(b)(c) | 8,890,000 | 8,901,193 | |
| Thornburg Mortgage Securities Trust floater Series 2003-4 Class A1, 1 month U.S. LIBOR + 0.640% 0.7316% 9/25/43 (b)(c) | 88,169 | 86,360 | |
| Wells Fargo Mortgage Backed Securities Trust Series 2003-I Class A1, 2.698% 9/25/33 (b) | 11,987 | 11,929 | |
| TOTAL PRIVATE SPONSOR | 123,491,913 | ||
| U.S. Government Agency - 0.4% | |||
| Fannie Mae: | |||
| floater: | |||
| Series 2002-18 Class FD, 1 month U.S. LIBOR + 0.800% 0.8916% 2/25/32 (b)(c) | 3,191 | 3,245 | |
| Series 2002-39 Class FD, 1 month U.S. LIBOR + 1.000% 1.0975% 3/18/32 (b)(c) | 5,785 | 5,912 | |
| Series 2002-60 Class FV, 1 month U.S. LIBOR + 1.000% 1.0916% 4/25/32 (b)(c) | 6,562 | 6,718 | |
| Series 2002-63 Class FN, 1 month U.S. LIBOR + 1.000% 1.0916% 10/25/32 (b)(c) | 8,535 | 8,731 | |
| Series 2002-7 Class FC, 1 month U.S. LIBOR + 0.750% 0.8416% 1/25/32 (b)(c) | 3,102 | 3,148 | |
| Series 2003-118 Class S, 8.100% - 1 month U.S. LIBOR 8.0084% 12/25/33 (b)(j)(k) | 116,524 | 30,663 | |
| Series 2006-104 Class GI, 6.680% - 1 month U.S. LIBOR 6.5884% 11/25/36 (b)(j)(k) | 79,788 | 16,218 | |
| Series 2012-154 Class F, 1 month U.S. LIBOR + 0.300% 0.3916% 1/25/43 (b)(c) | 779,690 | 780,210 | |
| Series 2017-36 Class FB, 1 month U.S. LIBOR + 0.350% 0.4416% 5/25/47 (b)(c) | 1,638,891 | 1,641,657 | |
| Series 2018-32 Class FB, 1 month U.S. LIBOR + 0.300% 0.3916% 5/25/48 (b)(c) | 955,781 | 955,439 | |
| Series 2018-38 Class FG, 1 month U.S. LIBOR + 0.300% 0.3916% 6/25/48 (b)(c) | 2,665,646 | 2,663,325 | |
| Series 2019-23 Class FC, 1 month U.S. LIBOR + 0.450% 0.5416% 5/25/49 (b)(c) | 13,912,330 | 13,997,203 | |
| planned amortization class: | |||
| Series 1992-168 Class KB, 7% 10/25/22 | 820 | 848 | |
| Series 1993-207 Class H, 6.5% 11/25/23 | 21,634 | 22,860 | |
| Series 1996-28 Class PK, 6.5% 7/25/25 | 7,812 | 8,276 | |
| Series 1999-17 Class PG, 6% 4/25/29 | 53,162 | 58,887 | |
| Series 1999-32 Class PL, 6% 7/25/29 | 57,453 | 63,857 | |
| Series 1999-33 Class PK, 6% 7/25/29 | 41,630 | 46,350 | |
| Series 2001-52 Class YZ, 6.5% 10/25/31 | 6,015 | 6,962 | |
| Series 2003-28 Class KG, 5.5% 4/25/23 | 10,258 | 10,599 | |
| Series 2005-102 Class CO 11/25/35 (l) | 21,309 | 19,772 | |
| Series 2005-39 Class TE, 5% 5/25/35 | 21,412 | 24,040 | |
| Series 2005-73 Class SA, 17.500% - 1 month U.S. LIBOR 17.3118% 8/25/35 (b)(k) | 6,452 | 8,633 | |
| Series 2005-81 Class PC, 5.5% 9/25/35 | 59,176 | 66,978 | |
| Series 2006-12 Class BO 10/25/35 (l) | 97,259 | 90,403 | |
| Series 2006-15 Class OP 3/25/36 (l) | 111,896 | 102,487 | |
| Series 2006-37 Class OW 5/25/36 (l) | 10,494 | 9,421 | |
| Series 2006-45 Class OP 6/25/36 (l) | 34,581 | 31,272 | |
| Series 2006-62 Class KP 4/25/36 (l) | 57,897 | 53,117 | |
| Series 2012-149: | |||
| Class DA, 1.75% 1/25/43 | 162,236 | 166,643 | |
| Class GA, 1.75% 6/25/42 | 175,247 | 180,068 | |
| sequential payer: | |||
| Series 1997-41 Class J, 7.5% 6/18/27 | 8,924 | 10,091 | |
| Series 1999-25 Class Z, 6% 6/25/29 | 34,861 | 39,156 | |
| Series 2001-20 Class Z, 6% 5/25/31 | 56,608 | 63,330 | |
| Series 2001-31 Class ZC, 6.5% 7/25/31 | 26,291 | 29,909 | |
| Series 2002-16 Class ZD, 6.5% 4/25/32 | 16,389 | 19,011 | |
| Series 2002-74 Class SV, 7.550% - 1 month U.S. LIBOR 7.4584% 11/25/32 (b)(j)(k) | 55,566 | 7,612 | |
| Series 2012-67 Class AI, 4.5% 7/25/27 (j) | 99,383 | 5,815 | |
| Series 06-116 Class SG, 6.640% - 1 month U.S. LIBOR 6.5484% 12/25/36 (b)(j)(k) | 64,602 | 15,751 | |
| Series 07-40 Class SE, 6.440% - 1 month U.S. LIBOR 6.3484% 5/25/37 (b)(j)(k) | 32,909 | 7,293 | |
| Series 1993-165 Class SH, 19.800% - 1 month U.S. LIBOR 19.5406% 9/25/23 (b)(k) | 1,371 | 1,570 | |
| Series 2003-21 Class SK, 8.100% - 1 month U.S. LIBOR 8.0084% 3/25/33 (b)(j)(k) | 9,458 | 2,140 | |
| Series 2005-72 Class ZC, 5.5% 8/25/35 | 446,674 | 504,963 | |
| Series 2005-79 Class ZC, 5.9% 9/25/35 | 258,044 | 292,571 | |
| Series 2007-57 Class SA, 40.600% - 1 month U.S. LIBOR 40.0702% 6/25/37 (b)(k) | 36,933 | 76,181 | |
| Series 2007-66: | |||
| Class SA, 39.600% - 1 month U.S. LIBOR 39.0502% 7/25/37 (b)(k) | 38,639 | 79,700 | |
| Class SB, 39.600% - 1 month U.S. LIBOR 39.0502% 7/25/37 (b)(k) | 12,685 | 23,461 | |
| Series 2008-12 Class SG, 6.350% - 1 month U.S. LIBOR 6.2584% 3/25/38 (b)(j)(k) | 210,217 | 43,008 | |
| Series 2010-135: | |||
| Class LS, 6.050% - 1 month U.S. LIBOR 5.9584% 12/25/40 (b)(j)(k) | 205,632 | 38,995 | |
| Class ZA, 4.5% 12/25/40 | 102,981 | 112,978 | |
| Series 2010-139 Class NI, 4.5% 2/25/40 (j) | 106,694 | 5,636 | |
| Series 2010-150 Class ZC, 4.75% 1/25/41 | 909,276 | 1,013,296 | |
| Series 2010-95 Class ZC, 5% 9/25/40 | 1,922,802 | 2,137,133 | |
| Series 2011-39 Class ZA, 6% 11/25/32 | 134,898 | 155,140 | |
| Series 2011-4 Class PZ, 5% 2/25/41 | 310,700 | 372,908 | |
| Series 2011-67 Class AI, 4% 7/25/26 (j) | 29,573 | 1,479 | |
| Series 2011-83 Class DI, 6% 9/25/26 (j) | 11,699 | 298 | |
| Series 2012-100 Class WI, 3% 9/25/27 (j) | 549,824 | 43,862 | |
| Series 2012-14 Class JS, 6.650% - 1 month U.S. LIBOR 6.5584% 12/25/30 (b)(j)(k) | 135,980 | 12,366 | |
| Series 2012-9 Class SH, 6.550% - 1 month U.S. LIBOR 6.4584% 6/25/41 (b)(j)(k) | 151,645 | 12,639 | |
| Series 2013-133 Class IB, 3% 4/25/32 (j) | 292,011 | 14,202 | |
| Series 2013-134 Class SA, 6.050% - 1 month U.S. LIBOR 5.9584% 1/25/44 (b)(j)(k) | 157,260 | 28,727 | |
| Series 2013-44 Class DJ, 1.85% 5/25/33 | 11,206,111 | 11,495,950 | |
| Series 2013-51 Class GI, 3% 10/25/32 (j) | 137,061 | 10,358 | |
| Series 2013-N1 Class A, 6.720% - 1 month U.S. LIBOR 6.6284% 6/25/35 (b)(j)(k) | 170,608 | 32,346 | |
| Series 2015-42 Class IL, 6% 6/25/45 (j) | 909,950 | 178,343 | |
| Series 2015-70 Class JC, 3% 10/25/45 | 1,007,878 | 1,069,296 | |
| Series 2017-30 Class AI, 5.5% 5/25/47 (j) | 438,085 | 87,142 | |
| Fannie Mae Stripped Mortgage-Backed Securities: | |||
| Series 339 Class 5, 5.5% 7/25/33 (j) | 29,117 | 5,369 | |
| Series 343 Class 16, 5.5% 5/25/34 (j) | 25,550 | 4,241 | |
| Series 348 Class 14, 6.5% 8/25/34 (b)(j) | 23,305 | 5,258 | |
| Series 351: | |||
| Class 12, 5.5% 4/25/34 (b)(j) | 14,518 | 2,687 | |
| Class 13, 6% 3/25/34 (j) | 20,592 | 3,833 | |
| Series 359 Class 19, 6% 7/25/35 (b)(j) | 12,541 | 2,560 | |
| Series 384 Class 6, 5% 7/25/37 (j) | 127,210 | 22,809 | |
| Freddie Mac: | |||
| floater: | |||
| Series 2412 Class FK, 1 month U.S. LIBOR + 0.800% 0.9009% 1/15/32 (b)(c) | 2,750 | 2,796 | |
| Series 2423 Class FA, 1 month U.S. LIBOR + 0.900% 1.0009% 3/15/32 (b)(c) | 3,566 | 3,640 | |
| Series 2424 Class FM, 1 month U.S. LIBOR + 1.000% 1.1009% 3/15/32 (b)(c) | 3,786 | 3,872 | |
| Series 2432: | |||
| Class FE, 1 month U.S. LIBOR + 0.900% 1.0009% 6/15/31 (b)(c) | 6,377 | 6,500 | |
| Class FG, 1 month U.S. LIBOR + 0.900% 1.0009% 3/15/32 (b)(c) | 1,983 | 2,022 | |
| Series 4709 Class FE, 1 month U.S. LIBOR + 0.350% 0.4509% 8/15/47 (b)(c) | 883,207 | 885,113 | |
| floater target amortization class Series 3366 Class FD, 1 month U.S. LIBOR + 0.250% 0.3509% 5/15/37 (b)(c) | 146,775 | 147,237 | |
| planned amortization class: | |||
| Series 2095 Class PE, 6% 11/15/28 | 61,142 | 68,125 | |
| Series 2101 Class PD, 6% 11/15/28 | 3,918 | 4,367 | |
| Series 2104 Class PG, 6% 12/15/28 | 4,416 | 4,928 | |
| Series 2121 Class MG, 6% 2/15/29 | 23,892 | 26,581 | |
| Series 2131 Class BG, 6% 3/15/29 | 140,231 | 156,541 | |
| Series 2137 Class PG, 6% 3/15/29 | 20,962 | 23,422 | |
| Series 2154 Class PT, 6% 5/15/29 | 45,735 | 51,104 | |
| Series 2162 Class PH, 6% 6/15/29 | 8,869 | 9,837 | |
| Series 2520 Class BE, 6% 11/15/32 | 60,040 | 68,869 | |
| Series 2693 Class MD, 5.5% 10/15/33 | 269,950 | 306,423 | |
| Series 2802 Class OB, 6% 5/15/34 | 77,874 | 87,440 | |
| Series 3002 Class NE, 5% 7/15/35 | 153,104 | 171,023 | |
| Series 3110 Class OP 9/15/35 (l) | 55,477 | 53,689 | |
| Series 3119 Class PO 2/15/36 (l) | 131,375 | 119,834 | |
| Series 3121 Class KO 3/15/36 (l) | 21,161 | 19,555 | |
| Series 3123 Class LO 3/15/36 (l) | 75,495 | 69,050 | |
| Series 3145 Class GO 4/15/36 (l) | 75,371 | 69,373 | |
| Series 3189 Class PD, 6% 7/15/36 | 130,504 | 152,673 | |
| Series 3225 Class EO 10/15/36 (l) | 39,113 | 35,545 | |
| Series 3258 Class PM, 5.5% 12/15/36 | 54,630 | 62,650 | |
| Series 3415 Class PC, 5% 12/15/37 | 56,145 | 62,704 | |
| Series 3786 Class HI, 4% 3/15/38 (j) | 39,310 | 436 | |
| Series 3806 Class UP, 4.5% 2/15/41 | 314,916 | 349,104 | |
| Series 3832 Class PE, 5% 3/15/41 | 633,690 | 708,132 | |
| Series 4135 Class AB, 1.75% 6/15/42 | 132,021 | 135,704 | |
| Series 4765 Class PE, 3% 12/15/41 | 276,522 | 279,128 | |
| sequential payer: | |||
| Series 2114 Class ZM, 6% 1/15/29 | 2,054 | 2,289 | |
| Series 2135 Class JE, 6% 3/15/29 | 17,107 | 19,053 | |
| Series 2274 Class ZM, 6.5% 1/15/31 | 17,692 | 20,043 | |
| Series 2281 Class ZB, 6% 3/15/30 | 28,983 | 32,076 | |
| Series 2303 Class ZV, 6% 4/15/31 | 12,421 | 13,934 | |
| Series 2357 Class ZB, 6.5% 9/15/31 | 105,965 | 122,580 | |
| Series 2502 Class ZC, 6% 9/15/32 | 33,333 | 38,179 | |
| Series 2519 Class ZD, 5.5% 11/15/32 | 35,183 | 39,715 | |
| Series 2546 Class MJ, 5.5% 3/15/23 | 6,717 | 6,952 | |
| Series 2601 Class TB, 5.5% 4/15/23 | 3,007 | 3,108 | |
| Series 2998 Class LY, 5.5% 7/15/25 | 17,831 | 19,008 | |
| Series 3871 Class KB, 5.5% 6/15/41 | 723,993 | 844,313 | |
| Series 06-3115 Class SM, 6.600% - 1 month U.S. LIBOR 6.4991% 2/15/36 (b)(j)(k) | 39,768 | 7,919 | |
| Series 1658 Class GZ, 7% 1/15/24 | 4,786 | 5,119 | |
| Series 2013-4281 Class AI, 4% 12/15/28 (j) | 280,200 | 12,298 | |
| Series 2017-4683 Class LM, 3% 5/15/47 | 1,227,288 | 1,299,944 | |
| Series 2380 Class SY, 8.200% - 1 month U.S. LIBOR 8.0991% 11/15/31 (b)(j)(k) | 24,825 | 3,196 | |
| Series 2587 Class IM, 6.5% 3/15/33 (j) | 4,251 | 864 | |
| Series 2844: | |||
| Class SC, 46.800% - 1 month U.S. LIBOR 46.1443% 8/15/24 (b)(k) | 56 | 63 | |
| Class SD, 86.400% - 1 month U.S. LIBOR 85.1385% 8/15/24 (b)(k) | 103 | 127 | |
| Series 2933 Class ZM, 5.75% 2/15/35 | 553,210 | 630,256 | |
| Series 2935 Class ZK, 5.5% 2/15/35 | 511,234 | 582,835 | |
| Series 2947 Class XZ, 6% 3/15/35 | 231,178 | 267,229 | |
| Series 2996 Class ZD, 5.5% 6/15/35 | 400,573 | 463,597 | |
| Series 3237 Class C, 5.5% 11/15/36 | 564,473 | 643,481 | |
| Series 3244 Class SG, 6.660% - 1 month U.S. LIBOR 6.5591% 11/15/36 (b)(j)(k) | 174,003 | 40,773 | |
| Series 3287 Class SD, 6.750% - 1 month U.S. LIBOR 6.6491% 3/15/37 (b)(j)(k) | 268,772 | 66,545 | |
| Series 3297 Class BI, 6.760% - 1 month U.S. LIBOR 6.6591% 4/15/37 (b)(j)(k) | 378,148 | 87,032 | |
| Series 3336 Class LI, 6.580% - 1 month U.S. LIBOR 6.4791% 6/15/37 (b)(j)(k) | 133,148 | 27,410 | |
| Series 3949 Class MK, 4.5% 10/15/34 | 109,568 | 120,601 | |
| Series 3955 Class YI, 3% 11/15/21 (j) | 1,565 | 7 | |
| Series 4055 Class BI, 3.5% 5/15/31 (j) | 296,037 | 15,496 | |
| Series 4149 Class IO, 3% 1/15/33 (j) | 69,364 | 7,574 | |
| Series 4314 Class AI, 5% 3/15/34 (j) | 91,953 | 5,708 | |
| Series 4427 Class LI, 3.5% 2/15/34 (j) | 611,709 | 50,927 | |
| Series 4471 Class PA 4% 12/15/40 | 631,759 | 677,087 | |
| target amortization class Series 2156 Class TC, 6.25% 5/15/29 | 22,225 | 23,954 | |
| Freddie Mac Manufactured Housing participation certificates guaranteed: | |||
| floater Series 1686 Class FA, 1 month U.S. LIBOR + 0.900% 1.0146% 2/15/24 (b)(c) | 5,839 | 5,870 | |
| planned amortization class Series 2043 Class CJ, 6.5% 4/15/28 | 5,754 | 6,492 | |
| sequential payer: | |||
| Series 2043 Class ZH, 6% 4/15/28 | 16,799 | 18,638 | |
| Series 2056 Class Z, 6% 5/15/28 | 39,556 | 44,011 | |
| Freddie Mac Multi-family Structured pass-thru certificates: | |||
| floater Series 4795 Class FA, 1 month U.S. LIBOR + 0.300% 0.4009% 5/15/48 (b)(c) | 1,708,723 | 1,706,676 | |
| Series 4386 Class AZ, 4.5% 11/15/40 | 1,251,132 | 1,363,438 | |
| Freddie Mac Seasoned Credit Risk Transfer Trust: | |||
| sequential payer: | |||
| Series 2018-3 Class MA, 3.5% 8/25/57 | 10,174,885 | 10,813,570 | |
| Series 2018-4 Class MA, 3.5% 3/25/58 | 3,835,975 | 4,080,341 | |
| Series 2019-1 Class MA, 3.5% 7/25/58 | 6,690,849 | 7,158,718 | |
| Series 2018-3 Class M55D, 4% 8/25/57 | 507,434 | 549,448 | |
| Ginnie Mae guaranteed REMIC pass-thru certificates: | |||
| floater: | |||
| Series 2007-37 Class TS, 6.690% - 1 month U.S. LIBOR 6.5891% 6/16/37 (b)(j)(k) | 75,161 | 16,554 | |
| Series 2010-H03 Class FA, 1 month U.S. LIBOR + 0.550% 0.661% 3/20/60 (b)(c)(m) | 928,783 | 933,978 | |
| Series 2010-H17 Class FA, 1 month U.S. LIBOR + 0.330% 0.441% 7/20/60 (b)(c)(m) | 126,198 | 126,376 | |
| Series 2010-H18 Class AF, 1 month U.S. LIBOR + 0.300% 0.4104% 9/20/60 (b)(c)(m) | 152,081 | 152,173 | |
| Series 2010-H19 Class FG, 1 month U.S. LIBOR + 0.300% 0.4104% 8/20/60 (b)(c)(m) | 150,729 | 150,817 | |
| Series 2010-H27 Series FA, 1 month U.S. LIBOR + 0.380% 0.4904% 12/20/60 (b)(c)(m) | 315,526 | 316,351 | |
| Series 2011-H05 Class FA, 1 month U.S. LIBOR + 0.500% 0.6104% 12/20/60 (b)(c)(m) | 363,302 | 365,022 | |
| Series 2011-H07 Class FA, 1 month U.S. LIBOR + 0.500% 0.6104% 2/20/61 (b)(c)(m) | 526,260 | 528,140 | |
| Series 2011-H12 Class FA, 1 month U.S. LIBOR + 0.490% 0.6004% 2/20/61 (b)(c)(m) | 757,649 | 760,362 | |
| Series 2011-H13 Class FA, 1 month U.S. LIBOR + 0.500% 0.6104% 4/20/61 (b)(c)(m) | 341,282 | 342,932 | |
| Series 2011-H14: | |||
| Class FB, 1 month U.S. LIBOR + 0.500% 0.6104% 5/20/61 (b)(c)(m) | 510,793 | 513,274 | |
| Class FC, 1 month U.S. LIBOR + 0.500% 0.6104% 5/20/61 (b)(c)(m) | 391,541 | 393,464 | |
| Series 2011-H17 Class FA, 1 month U.S. LIBOR + 0.530% 0.6404% 6/20/61 (b)(c)(m) | 460,680 | 463,106 | |
| Series 2011-H20 Class FA, 1 month U.S. LIBOR + 0.550% 0.6604% 9/20/61 (b)(c)(m) | 1,163,665 | 1,170,769 | |
| Series 2011-H21 Class FA, 1 month U.S. LIBOR + 0.600% 0.7104% 10/20/61 (b)(c)(m) | 515,262 | 518,838 | |
| Series 2012-H01 Class FA, 1 month U.S. LIBOR + 0.700% 0.8104% 11/20/61 (b)(c)(m) | 488,825 | 493,281 | |
| Series 2012-H03 Class FA, 1 month U.S. LIBOR + 0.700% 0.8104% 1/20/62 (b)(c)(m) | 326,098 | 328,840 | |
| Series 2012-H06 Class FA, 1 month U.S. LIBOR + 0.630% 0.7404% 1/20/62 (b)(c)(m) | 468,726 | 472,171 | |
| Series 2012-H07 Class FA, 1 month U.S. LIBOR + 0.630% 0.7404% 3/20/62 (b)(c)(m) | 303,979 | 305,952 | |
| Series 2012-H21 Class DF, 1 month U.S. LIBOR + 0.650% 0.7604% 5/20/61 (b)(c)(m) | 7,189 | 7,261 | |
| Series 2012-H26, Class CA, 1 month U.S. LIBOR + 0.530% 0.6404% 7/20/60 (b)(c)(m) | 5,753 | 5,759 | |
| Series 2014-H03 Class FA, 1 month U.S. LIBOR + 0.600% 0.7104% 1/20/64 (b)(c)(m) | 397,705 | 400,103 | |
| Series 2014-H05 Class FB, 1 month U.S. LIBOR + 0.600% 0.7104% 12/20/63 (b)(c)(m) | 1,663,987 | 1,674,275 | |
| Series 2014-H11 Class BA, 1 month U.S. LIBOR + 0.500% 0.6104% 6/20/64 (b)(c)(m) | 399,273 | 401,186 | |
| Series 2015-H07 Class FA, 1 month U.S. LIBOR + 0.300% 0.4104% 3/20/65 (b)(c)(m) | 10,724 | 10,729 | |
| Series 2015-H13 Class FL, 1 month U.S. LIBOR + 0.280% 0.3904% 5/20/63 (b)(c)(m) | 8,305 | 8,306 | |
| Series 2015-H19 Class FA, 1 month U.S. LIBOR + 0.200% 0.3104% 4/20/63 (b)(c)(m) | 7,309 | 7,298 | |
| Series 2016-H20 Class FM, 1 month U.S. LIBOR + 0.400% 0.5104% 12/20/62 (b)(c)(m) | 19,566 | 19,637 | |
| Series 2017-161 Class DF, 1 month U.S. LIBOR + 0.250% 0.3493% 10/20/47 (b)(c) | 1,060,726 | 1,058,771 | |
| Series 2018-159 Class F, 1 month U.S. LIBOR + 0.350% 0.4493% 11/20/48 (b)(c) | 2,329,402 | 2,339,045 | |
| Series 2018-65 Class DF, 1 month U.S. LIBOR + 0.300% 0.3993% 5/20/48 (b)(c) | 1,063,323 | 1,063,264 | |
| Series 2018-77 Class FA, 1 month U.S. LIBOR + 0.300% 0.3993% 6/20/48 (b)(c) | 1,345,288 | 1,346,574 | |
| Series 2018-78 Class AF, 1 month U.S. LIBOR + 0.300% 0.3993% 6/20/48 (b)(c) | 1,349,839 | 1,352,824 | |
| Series 2019-153 Class FB, 1 month U.S. LIBOR + 0.450% 0.5493% 12/20/49 (b)(c) | 14,623,498 | 14,720,039 | |
| Series 2020-32 Class GF, 1 month U.S. LIBOR + 0.400% 0.4993% 3/20/50 (b)(c) | 13,849,200 | 13,909,926 | |
| planned amortization class: | |||
| Series 2010-158 Class MS, 10.000% - 1 month U.S. LIBOR 9.8015% 12/20/40 (b)(k) | 739,924 | 867,708 | |
| Series 2011-136 Class WI, 4.5% 5/20/40 (j) | 40,809 | 3,340 | |
| Series 2016-69 Class WA, 3% 2/20/46 | 494,801 | 525,848 | |
| Series 2017-134 Class BA, 2.5% 11/20/46 | 198,683 | 207,133 | |
| Series 2017-153 Class GA, 3% 9/20/47 | 1,790,201 | 1,895,931 | |
| Series 2017-182 Class KA, 3% 10/20/47 | 1,468,171 | 1,554,607 | |
| Series 2018-13 Class Q, 3% 4/20/47 | 2,116,161 | 2,228,610 | |
| sequential payer: | |||
| Series 2004-24 Class ZM, 5% 4/20/34 | 224,032 | 249,718 | |
| Series 2010-160 Class DY, 4% 12/20/40 | 1,630,541 | 1,769,660 | |
| Series 2010-170 Class B, 4% 12/20/40 | 365,927 | 397,208 | |
| Series 2017-139 Class BA, 3% 9/20/47 | 5,318,286 | 5,679,441 | |
| Series 2004-32 Class GS, 6.500% - 1 month U.S. LIBOR 6.3991% 5/16/34 (b)(j)(k) | 52,679 | 10,030 | |
| Series 2004-73 Class AL, 7.200% - 1 month U.S. LIBOR 7.0991% 8/17/34 (b)(j)(k) | 40,267 | 9,085 | |
| Series 2010-116 Class QB, 4% 9/16/40 | 115,952 | 125,607 | |
| Series 2010-14 Class SN, 5.950% - 1 month U.S. LIBOR 5.8491% 2/16/40 (b)(j)(k) | 276,078 | 46,758 | |
| Series 2010-H10 Class FA, 1 month U.S. LIBOR + 0.330% 0.441% 5/20/60 (b)(c)(m) | 361,612 | 362,110 | |
| Series 2011-52 Class HI, 7% 4/16/41 (j) | 48,988 | 9,486 | |
| Series 2011-94 Class SA, 6.100% - 1 month U.S. LIBOR 6.0008% 7/20/41 (b)(j)(k) | 144,231 | 27,714 | |
| Series 2012-76 Class GS, 6.700% - 1 month U.S. LIBOR 6.5991% 6/16/42 (b)(j)(k) | 170,449 | 35,757 | |
| Series 2013-124: | |||
| Class ES, 8.667% - 1 month U.S. LIBOR 8.5343% 4/20/39 (b)(k) | 29,420 | 30,614 | |
| Class ST, 8.800% - 1 month U.S. LIBOR 8.6677% 8/20/39 (b)(k) | 14,081 | 14,332 | |
| Series 2013-149 Class MA, 2.5% 5/20/40 | 1,757,531 | 1,815,138 | |
| Series 2014-2 Class BA, 3% 1/20/44 | 2,893,488 | 3,071,384 | |
| Series 2014-21 Class HA, 3% 2/20/44 | 1,118,995 | 1,187,428 | |
| Series 2014-25 Class HC, 3% 2/20/44 | 1,845,524 | 1,945,037 | |
| Series 2014-5 Class A, 3% 1/20/44 | 1,627,635 | 1,716,790 | |
| Series 2015-H13 Class HA, 2.5% 8/20/64 (m) | 57,707 | 58,795 | |
| Series 2016-H13 Class FB, U.S. TREASURY 1 YEAR INDEX + 0.500% 0.57% 5/20/66 (b)(c)(m) | 2,947,593 | 2,928,843 | |
| Series 2017-186 Class HK, 3% 11/16/45 | 1,578,825 | 1,669,266 | |
| Series 2017-H06 Class FA, U.S. TREASURY 1 YEAR INDEX + 0.350% 0.42% 8/20/66 (b)(c)(m) | 3,317,043 | 3,285,761 | |
| Ginnie Mae REMIC Trust Series 2015-H17 Class GZ, 4.0013% 5/20/65 (b)(m) | 121,468 | 126,120 | |
| TOTAL U.S. GOVERNMENT AGENCY | 155,803,922 | ||
| TOTAL COLLATERALIZED MORTGAGE OBLIGATIONS | |||
| (Cost $275,916,245) | 279,295,835 | ||
| Commercial Mortgage Securities - 3.6% | |||
| BAMLL Commercial Mortgage Securities Trust: | |||
| floater sequential payer Series 2020-JGDN Class A, 1 month U.S. LIBOR + 2.750% 2.851% 11/15/30 (a)(b)(c) | 10,322,000 | 10,470,812 | |
| sequential payer Series 2019-BPR: | |||
| Class AMP, 3.287% 11/5/32 (a) | 10,500,000 | 10,768,756 | |
| Class ANM, 3.112% 11/5/32 (a) | 5,768,000 | 5,994,411 | |
| Series 2019-BPR: | |||
| Class BNM, 3.465% 11/5/32 (a) | 1,295,000 | 1,254,548 | |
| Class CNM, 3.7186% 11/5/32 (a)(b) | 536,000 | 511,461 | |
| BANK: | |||
| sequential payer: | |||
| Series 2018-BN10 Class A5, 3.688% 2/15/61 | 2,901,000 | 3,244,046 | |
| Series 2019-BN21 Class A5, 2.851% 10/17/52 | 1,112,000 | 1,181,851 | |
| Series 2021-BN33 Class XA, 1.1766% 5/15/64 (b)(j) | 72,601,000 | 5,990,033 | |
| Bayview Commercial Asset Trust floater: | |||
| Series 2005-3A: | |||
| Class A2, 1 month U.S. LIBOR + 0.600% 0.6916% 11/25/35 (a)(b)(c) | 36,113 | 34,394 | |
| Class M1, 1 month U.S. LIBOR + 0.660% 0.7516% 11/25/35 (a)(b)(c) | 9,660 | 8,762 | |
| Series 2005-4A: | |||
| Class A2, 1 month U.S. LIBOR + 0.580% 0.6766% 1/25/36 (a)(b)(c) | 91,115 | 87,869 | |
| Class M1, 1 month U.S. LIBOR + 0.670% 0.7666% 1/25/36 (a)(b)(c) | 29,414 | 28,393 | |
| Class M2, 1 month U.S. LIBOR + 0.700% 0.7966% 1/25/36 (a)(b)(c) | 11,092 | 10,555 | |
| Class M3, 1 month U.S. LIBOR + 0.750% 0.8416% 1/25/36 (a)(b)(c) | 16,564 | 15,771 | |
| Series 2006-1: | |||
| Class A2, 1 month U.S. LIBOR + 0.540% 0.6316% 4/25/36 (a)(b)(c) | 15,275 | 14,471 | |
| Class M1, 1 month U.S. LIBOR + 0.570% 0.6616% 4/25/36 (a)(b)(c) | 9,236 | 8,542 | |
| Class M2, 1 month U.S. LIBOR + 0.600% 0.6916% 4/25/36 (a)(b)(c) | 9,769 | 8,857 | |
| Class M6, 1 month U.S. LIBOR + 0.960% 1.0516% 4/25/36 (a)(b)(c) | 9,236 | 7,483 | |
| Series 2006-2A: | |||
| Class M1, 1 month U.S. LIBOR + 0.460% 0.5566% 7/25/36 (a)(b)(c) | 14,555 | 13,314 | |
| Class M2, 1 month U.S. LIBOR + 0.490% 0.5866% 7/25/36 (a)(b)(c) | 10,341 | 9,129 | |
| Class M4, 1 month U.S. LIBOR + 0.630% 0.7216% 7/25/36 (a)(b)(c) | 9,767 | 7,962 | |
| Series 2006-4A: | |||
| Class A2, 1 month U.S. LIBOR + 0.270% 0.3616% 12/25/36 (a)(b)(c) | 206,293 | 195,077 | |
| Class M1, 1 month U.S. LIBOR + 0.290% 0.3816% 12/25/36 (a)(b)(c) | 16,579 | 15,062 | |
| Class M3, 1 month U.S. LIBOR + 0.340% 0.4316% 12/25/36 (a)(b)(c) | 11,238 | 9,389 | |
| Series 2007-1 Class A2, 1 month U.S. LIBOR + 0.270% 0.3616% 3/25/37 (a)(b)(c) | 53,863 | 50,964 | |
| Series 2007-2A: | |||
| Class A1, 1 month U.S. LIBOR + 0.270% 0.3616% 7/25/37 (a)(b)(c) | 154,310 | 146,933 | |
| Class A2, 1 month U.S. LIBOR + 0.320% 0.4116% 7/25/37 (a)(b)(c) | 144,432 | 113,994 | |
| Class M1, 1 month U.S. LIBOR + 0.370% 0.4616% 7/25/37 (a)(b)(c) | 49,200 | 44,075 | |
| Class M2, 1 month U.S. LIBOR + 0.410% 0.5016% 7/25/37 (a)(b)(c) | 32,055 | 26,481 | |
| Class M3, 1 month U.S. LIBOR + 0.490% 0.5816% 7/25/37 (a)(b)(c) | 33,328 | 35,264 | |
| Series 2007-3: | |||
| Class A2, 1 month U.S. LIBOR + 0.290% 0.3816% 7/25/37 (a)(b)(c) | 55,142 | 52,273 | |
| Class M1, 1 month U.S. LIBOR + 0.310% 0.4016% 7/25/37 (a)(b)(c) | 29,250 | 26,117 | |
| Class M2, 1 month U.S. LIBOR + 0.340% 0.4316% 7/25/37 (a)(b)(c) | 31,210 | 27,683 | |
| Class M3, 1 month U.S. LIBOR + 0.370% 0.4616% 7/25/37 (a)(b)(c) | 50,383 | 45,328 | |
| Class M4, 1 month U.S. LIBOR + 0.500% 0.5916% 7/25/37 (a)(b)(c) | 79,214 | 70,826 | |
| Class M5, 1 month U.S. LIBOR + 0.600% 0.6916% 7/25/37 (a)(b)(c) | 33,266 | 31,666 | |
| Benchmark Mortgage Trust: | |||
| sequential payer: | |||
| Series 2018-B1 Class ASB, 3.602% 1/15/51 | 3,507,000 | 3,866,687 | |
| Series 2018-B2 Class ASB, 3.7802% 2/15/51 | 1,800,000 | 1,968,272 | |
| Series 2018-B4 Class A5, 4.121% 7/15/51 | 1,260,000 | 1,441,838 | |
| Series 2019-B10 Class A4, 3.717% 3/15/62 | 2,283,000 | 2,562,814 | |
| Series 2019-B13 Class A4, 2.952% 8/15/57 | 12,263,000 | 13,117,439 | |
| Series 2018-B8 Class A5, 4.2317% 1/15/52 | 15,369,000 | 17,760,867 | |
| Series 2019-B12 Class XA, 1.0644% 8/15/52 (b)(j) | 75,571,103 | 4,732,149 | |
| Series 2019-B14 Class XA, 0.7858% 12/15/62 (b)(j) | 50,716,730 | 2,402,695 | |
| Series 2020-B17 Class XA, 1.4192% 3/15/53 (b)(j) | 11,990,619 | 1,050,660 | |
| Series 2020-B18 Class XA, 1.7935% 7/15/53 (b)(j) | 20,052,938 | 2,286,645 | |
| BFLD Trust floater sequential payer Series 2020-OBRK Class A, 1 month U.S. LIBOR + 2.050% 2.151% 11/15/28 (a)(b)(c) | 6,075,000 | 6,158,232 | |
| BX Commercial Mortgage Trust: | |||
| floater: | |||
| Series 2018-BIOA: | |||
| Class A, 1 month U.S. LIBOR + 0.670% 0.7721% 3/15/37 (a)(b)(c) | 13,500,000 | 13,514,596 | |
| Class E, 1 month U.S. LIBOR + 1.950% 2.0521% 3/15/37 (a)(b)(c) | 9,800,000 | 9,811,551 | |
| Class F, 1 month U.S. LIBOR + 2.470% 2.5721% 3/15/37 (a)(b)(c) | 2,450,000 | 2,455,126 | |
| Series 2020-BXLP: | |||
| Class B, 1 month U.S. LIBOR + 1.000% 1.101% 12/15/36 (a)(b)(c) | 6,442,324 | 6,442,323 | |
| Class C, 1 month U.S. LIBOR + 1.120% 1.221% 12/15/36 (a)(b)(c) | 5,287,919 | 5,287,918 | |
| Class D, 1 month U.S. LIBOR + 1.250% 1.351% 12/15/36 (a)(b)(c) | 5,936,660 | 5,936,658 | |
| Series 2021-VINO Class A, 1 month U.S. LIBOR + 0.650% 0.7623% 5/15/38 (a)(b)(c) | 13,800,000 | 13,787,566 | |
| floater sequential payer: | |||
| Series 2019-CALM Class A, 1 month U.S. LIBOR + 0.870% 0.977% 11/15/32 (a)(b)(c) | 2,254,000 | 2,256,118 | |
| Series 2020-BXLP Class A, 1 month U.S. LIBOR + 0.800% 0.901% 12/15/36 (a)(b)(c) | 15,554,088 | 15,573,558 | |
| Series 2020-FOX Class A, 1 month U.S. LIBOR + 1.000% 1.101% 11/15/32 (a)(b)(c) | 8,774,897 | 8,791,623 | |
| BX Trust: | |||
| floater: | |||
| Series 2018-EXCL: | |||
| Class A, 1 month U.S. LIBOR + 1.088% 1.1886% 9/15/37 (a)(b)(c) | 11,493,874 | 11,220,233 | |
| Class B, 1 month U.S. LIBOR + 1.320% 1.426% 9/15/37 (a)(b)(c) | 4,536,936 | 4,338,007 | |
| Class D, 1 month U.S. LIBOR + 2.620% 2.726% 9/15/37 (a)(b)(c) | 2,186,803 | 1,765,493 | |
| Series 2018-IND: | |||
| Class B, 1 month U.S. LIBOR + 0.900% 1.001% 11/15/35 (a)(b)(c) | 3,999,800 | 4,001,008 | |
| Class C, 1 month U.S. LIBOR + 1.100% 1.201% 11/15/35 (a)(b)(c) | 893,200 | 893,469 | |
| Class F, 1 month U.S. LIBOR + 1.800% 1.901% 11/15/35 (a)(b)(c) | 2,356,900 | 2,357,608 | |
| Series 2019-IMC: | |||
| Class B, 1 month U.S. LIBOR + 1.300% 1.401% 4/15/34 (a)(b)(c) | 4,437,000 | 4,423,214 | |
| Class C, 1 month U.S. LIBOR + 1.600% 1.701% 4/15/34 (a)(b)(c) | 2,933,000 | 2,916,532 | |
| Class D, 1 month U.S. LIBOR + 1.900% 2.001% 4/15/34 (a)(b)(c) | 3,079,000 | 3,049,963 | |
| Series 2019-XL: | |||
| Class B, 1 month U.S. LIBOR + 1.080% 1.181% 10/15/36 (a)(b)(c) | 4,197,835 | 4,203,753 | |
| Class C, 1 month U.S. LIBOR + 1.250% 1.351% 10/15/36 (a)(b)(c) | 5,277,037 | 5,280,347 | |
| Class D, 1 month U.S. LIBOR + 1.450% 1.551% 10/15/36 (a)(b)(c) | 7,474,788 | 7,479,285 | |
| Class E, 1 month U.S. LIBOR + 1.800% 1.901% 10/15/36 (a)(b)(c) | 10,502,550 | 10,509,141 | |
| Series 2020-BXLP Class E, 1 month U.S. LIBOR + 1.600% 1.701% 12/15/36 (a)(b)(c) | 5,631,889 | 5,631,886 | |
| floater sequential payer Series 2021-MFM1 Class A, 1 month U.S. LIBOR + 0.700% 0.8009% 1/15/34 (a)(b)(c) | 6,330,000 | 6,329,999 | |
| floater, sequential payer: | |||
| Series 2019-IMC Class A, 1 month U.S. LIBOR + 1.000% 1.101% 4/15/34 (a)(b)(c) | 6,400,000 | 6,387,789 | |
| Series 2019-XL Class A, 1 month U.S. LIBOR + 0.920% 1.021% 10/15/36 (a)(b)(c) | 14,500,845 | 14,516,862 | |
| CD Commercial Mortgage Trust sequential payer Series 2017-CD6 Class ASB, 3.332% 11/13/50 | 17,655,000 | 19,142,360 | |
| CF Hippolyta Issuer LLC sequential payer: | |||
| Series 2020-1: | |||
| Class A1, 1.69% 7/15/60 (a) | 27,716,116 | 28,259,870 | |
| Class A2, 1.99% 7/15/60 (a) | 10,924,506 | 11,027,326 | |
| Series 2021-1A Class A1, 1.53% 3/15/61 (a) | 14,640,000 | 14,780,504 | |
| CGDB Commercial Mortgage Trust floater Series 2019-MOB: | |||
| Class A, 1 month U.S. LIBOR + 0.950% 1.0509% 11/15/36 (a)(b)(c) | 4,222,000 | 4,223,276 | |
| Class B, 1 month U.S. LIBOR + 1.250% 1.3509% 11/15/36 (a)(b)(c) | 1,600,000 | 1,600,000 | |
| CHC Commercial Mortgage Trust floater Series 2019-CHC: | |||
| Class A, 1 month U.S. LIBOR + 1.120% 1.221% 6/15/34 (a)(b)(c) | 28,366,696 | 28,375,269 | |
| Class B, 1 month U.S. LIBOR + 1.500% 1.601% 6/15/34 (a)(b)(c) | 2,166,148 | 2,155,269 | |
| Class C, 1 month U.S. LIBOR + 1.750% 1.851% 6/15/34 (a)(b)(c) | 2,447,479 | 2,422,904 | |
| Citigroup Commercial Mortgage Trust: | |||
| sequential payer Series 2017-P7 Class AAB, 3.509% 4/14/50 | 740,000 | 799,548 | |
| Series 2015-GC33 Class XA, 0.8821% 9/10/58 (b)(j) | 1,572,302 | 50,850 | |
| Series 2016-P6 Class XA, 0.7642% 12/10/49 (b)(j) | 1,621,386 | 38,998 | |
| Series 2019-GC41 Class XA, 1.0575% 8/10/56 (b)(j) | 20,630,223 | 1,377,534 | |
| COMM Mortgage Trust: | |||
| sequential payer: | |||
| Series 2014-CR18 Class A5, 3.828% 7/15/47 | 2,137,000 | 2,322,542 | |
| Series 2017-CD4 Class ASB, 3.317% 5/10/50 | 10,467,000 | 11,310,293 | |
| Series 2014-CR20 Class XA, 1.0046% 11/10/47 (b)(j) | 369,041 | 10,658 | |
| Series 2014-LC17 Class XA, 0.7204% 10/10/47 (b)(j) | 1,216,860 | 23,813 | |
| Series 2014-UBS6 Class XA, 0.885% 12/10/47 (b)(j) | 959,723 | 23,520 | |
| Core Industrial Trust floater Series 2019-CORE Class A, 1 month U.S. LIBOR + 0.880% 0.981% 12/15/31 (a)(b)(c) | 582,282 | 582,457 | |
| Credit Suisse Mortgage Trust: | |||
| floater Series 2019-ICE4: | |||
| Class B, 1 month U.S. LIBOR + 1.230% 1.331% 5/15/36 (a)(b)(c) | 6,081,000 | 6,086,489 | |
| Class C, 1 month U.S. LIBOR + 1.430% 1.531% 5/15/36 (a)(b)(c) | 1,603,000 | 1,604,930 | |
| sequential payer Series 2020-NET Class A, 2.2569% 8/15/37 (a) | 3,554,000 | 3,672,079 | |
| Series 2018-SITE: | |||
| Class A, 4.284% 4/15/36 (a) | 4,971,000 | 5,175,570 | |
| Class B, 4.5349% 4/15/36 (a) | 1,471,000 | 1,481,937 | |
| Class C, 4.782% 4/15/36 (a)(b) | 955,000 | 942,960 | |
| Class D, 4.782% 4/15/36 (a)(b) | 1,909,000 | 1,730,472 | |
| DBJPM Mortgage Trust sequential payer Series 2017-C6 Class ASB, 3.121% 6/10/50 | 4,803,000 | 5,168,025 | |
| DBUBS Mortgage Trust Series 2011-LC3A: | |||
| Class B, 5.4266% 8/10/44 (a)(b) | 386,024 | 385,883 | |
| Class C, 5.4266% 8/10/44 (a)(b) | 4,800,000 | 4,799,547 | |
| Freddie Mac: | |||
| floater: | |||
| Series 2021-F108 Class A/S, UNITED STATES 30 DAY AVERAGE S + 0.250% 0.26% 2/25/31 (b)(c) | 29,600,000 | 29,626,664 | |
| Series 2021-F109 Class A/S, UNITED STATES 30 DAY AVERAGE S + 0.240% 0.25% 3/25/31 (b)(c) | 51,500,000 | 51,536,266 | |
| Series 2021-F110 Class A/S, 1 month U.S. LIBOR + 0.240% 0.25% 3/25/31 (b)(c) | 24,100,000 | 24,116,786 | |
| Series 2021-F111 Class A/S, UNITED STATES 30 DAY AVERAGE S + 0.240% 0.25% 3/25/31 (b)(c) | 28,100,000 | 28,119,796 | |
| Series 2021-F112 Class A/S, UNITED STATES 30 DAY AVERAGE S + 0.250% 0.24% 4/25/31 (b)(c) | 23,200,000 | 23,214,463 | |
| sequential payer: | |||
| Series 2020-K118 Class A2, 1.493% 9/25/30 | 27,923,000 | 27,605,074 | |
| Series 2020-K120 Class A2, 1.5% 10/25/30 | 19,200,000 | 18,971,931 | |
| Series 2020-K121 Class A2, 1.547% 10/25/30 | 11,600,000 | 11,507,993 | |
| Series 2020-K739 Class A2, 1.336% 9/25/27 | 31,857,000 | 32,190,705 | |
| Series 2021-K125 Class A2, 1.846% 1/25/31 | 9,400,000 | 9,565,182 | |
| Series 2021-K126 Class A2, 2.074% 1/25/31 | 32,706,000 | 33,937,270 | |
| Series 2021-K127 Class A2, 2.108% 1/25/31 | 18,700,000 | 19,441,599 | |
| Series 2021-K128 Class A2, 2.02% 3/25/31 | 10,100,000 | 10,421,097 | |
| Series 2020-K122 Class A2, 1.521% 11/25/30 | 8,000,000 | 7,913,936 | |
| Series 2021-K123 Class A2, 1.621% 12/25/30 | 23,694,000 | 23,642,880 | |
| GB Trust floater Series 2020-FLIX: | |||
| Class A, 1 month U.S. LIBOR + 1.120% 1.221% 8/15/37 (a)(b)(c) | 6,300,000 | 6,323,469 | |
| Class B, 1 month U.S. LIBOR + 1.350% 1.451% 8/15/37 (a)(b)(c) | 1,300,000 | 1,301,219 | |
| Class C, 1 month U.S. LIBOR + 1.600% 1.701% 8/15/37 (a)(b)(c) | 710,000 | 710,889 | |
| GS Mortgage Securities Trust: | |||
| floater: | |||
| Series 2018-3PCK Class A, 1 month U.S. LIBOR + 1.450% 1.551% 9/15/31 (a)(b)(c) | 20,025,000 | 19,671,463 | |
| Series 2018-HART Class A, 1 month U.S. LIBOR + 1.090% 1.2% 10/15/31 (a)(b)(c) | 3,300,000 | 3,305,438 | |
| sequential payer: | |||
| Series 2014-GC18 Class AAB, 3.648% 1/10/47 | 1,110,099 | 1,150,209 | |
| Series 2016-GC34 Class AAB, 3.278% 10/10/48 | 2,215,366 | 2,332,919 | |
| Series 2019-GC39 Class A4, 3.567% 5/10/52 | 130,000 | 144,544 | |
| Series 2011-GC5 Class A/S, 5.209% 8/10/44 (a) | 13,806,000 | 13,803,345 | |
| Series 2015-GC30 Class A/S, 3.777% 5/10/50 | 2,577,000 | 2,778,647 | |
| JP Morgan Chase Commercial Mortgage Securities Trust sequential payer Series 2021-2NU Class A, 1.9739% 1/5/40 (a) | 24,200,000 | 24,240,276 | |
| JPMBB Commercial Mortgage Securities Trust Series 2013-C14 Class A/S, 4.4093% 8/15/46 | 4,614,000 | 4,884,373 | |
| JPMDB Commercial Mortgage Securities Trust sequential payer: | |||
| Series 2017-C5 Class ASB, 3.4919% 3/15/50 | 3,236,000 | 3,481,277 | |
| Series 2018-C8 Class ASB, 4.145% 6/15/51 | 8,779,000 | 9,928,754 | |
| Series 2019-COR6 Class A4, 3.0565% 11/13/52 | 2,872,000 | 3,090,835 | |
| JPMorgan Chase Commercial Mortgage Securities Corp. Series 2012-C6 Class A/S, 4.1166% 5/15/45 | 600,000 | 615,121 | |
| JPMorgan Chase Commercial Mortgage Securities Trust: | |||
| floater Series 2019-BKWD Class A, 1 month U.S. LIBOR + 1.000% 1.101% 9/15/29 (a)(b)(c) | 6,400,000 | 6,409,208 | |
| sequential payer Series 2013-LC11 Class A5, 2.9599% 4/15/46 | 7,200,000 | 7,487,060 | |
| Series 2012-C8 Class A/S, 3.4239% 10/15/45 (a) | 6,783,000 | 6,968,352 | |
| Series 2012-CBX Class A/S, 4.2707% 6/15/45 | 31,528,000 | 32,468,773 | |
| Series 2013-LC11 Class A/S, 3.216% 4/15/46 | 5,691,000 | 5,914,634 | |
| Series 2018-WPT: | |||
| Class AFX, 4.2475% 7/5/33 (a) | 84,000 | 88,744 | |
| Class CFX, 4.9498% 7/5/33 (a) | 767,000 | 808,922 | |
| Class DFX, 5.3503% 7/5/33 (a) | 1,370,000 | 1,441,779 | |
| Class EFX, 5.5422% 7/5/33 (a) | 1,614,000 | 1,663,053 | |
| LIFE Mortgage Trust floater Series 2021-BMR: | |||
| Class A, 1 month U.S. LIBOR + 0.700% 0.801% 3/15/38 (a)(b)(c) | 13,421,000 | 13,429,423 | |
| Class B, 1 month U.S. LIBOR + 0.880% 0.981% 3/15/38 (a)(b)(c) | 2,940,000 | 2,943,661 | |
| Class C, 1 month U.S. LIBOR + 1.100% 1.201% 3/15/38 (a)(b)(c) | 2,038,000 | 2,040,553 | |
| Class D, 1 month U.S. LIBOR + 1.400% 1.501% 3/15/38 (a)(b)(c) | 2,834,000 | 2,842,873 | |
| Class E, 1 month U.S. LIBOR + 1.750% 1.851% 3/15/38 (a)(b)(c) | 2,476,000 | 2,482,201 | |
| Merit floater Series 2020-HILL Class A, 1 month U.S. LIBOR + 1.150% 1.251% 8/15/37 (a)(b)(c) | 5,774,000 | 5,798,943 | |
| MHC Commercial Mortgage Trust floater sequential payer Series 2021-MHC Class A, 1 month U.S. LIBOR + 0.800% 0.9018% 4/15/38 (a)(b)(c) | 34,600,000 | 34,610,383 | |
| Morgan Stanley BAML Trust: | |||
| sequential payer: | |||
| Series 2016-C28 Class A3, 3.272% 1/15/49 | 6,364,557 | 6,775,538 | |
| Series 2017-C33 Class A4, 3.337% 5/15/50 | 13,400,000 | 14,607,061 | |
| Series 2012-C5 Class A/S, 3.792% 8/15/45 | 6,800,000 | 7,011,308 | |
| Series 2012-C6 Class A/S, 3.476% 11/15/45 | 220,000 | 226,419 | |
| Series 2015-C25 Class XA, 1.0522% 10/15/48 (b)(j) | 918,703 | 33,681 | |
| Morgan Stanley Capital Barclays Bank Trust sequential payer Series 2016-MART Class A, 2.2004% 9/13/31 (a) | 3,061,000 | 3,062,204 | |
| Morgan Stanley Capital I Trust: | |||
| floater Series 2018-BOP Class A, 1 month U.S. LIBOR + 0.850% 0.951% 8/15/33 (a)(b)(c) | 205,211 | 204,824 | |
| floater sequential payer Series 2019-NUGS Class A, 1 month U.S. LIBOR + 0.950% 2.45% 12/15/36 (a)(b)(c) | 9,700,000 | 9,784,031 | |
| sequential payer: | |||
| Series 2019-L2 Class A3, 3.806% 3/15/52 | 100,000 | 110,439 | |
| Series 2019-MEAD Class A, 3.17% 11/10/36 (a) | 16,247,000 | 17,103,191 | |
| Series 2011-C3 Class AJ, 5.2155% 7/15/49 (a)(b) | 14,387,653 | 14,430,288 | |
| Series 2018-H4 Class A4, 4.31% 12/15/51 | 2,991,000 | 3,426,182 | |
| Series 2019-MEAD: | |||
| Class B, 3.1771% 11/10/36 (a)(b) | 1,783,000 | 1,835,086 | |
| Class C, 3.1771% 11/10/36 (a)(b) | 1,712,000 | 1,728,171 | |
| NYT Mortgage Trust floater Series 2019-NYT Class A, 1 month U.S. LIBOR + 1.200% 1.301% 12/15/35 (a)(b)(c) | 20,822,000 | 20,856,585 | |
| Prima Capital Ltd. floater sequential payer Series 2021-9A Class A, 1 month U.S. LIBOR + 1.450% 1.5493% 12/15/37 (a)(b)(c) | 6,845,798 | 6,845,795 | |
| RETL floater Series 2019-RVP Class C, 1 month U.S. LIBOR + 2.100% 2.201% 3/15/36 (a)(b)(c) | 7,791,489 | 7,771,793 | |
| RLGH Trust floater Series 2021-TROT Class A, 1 month U.S. LIBOR + 0.800% 0.91% 4/15/36 (a)(b)(c) | 23,000,000 | 23,006,822 | |
| UBS Commercial Mortgage Trust: | |||
| sequential payer: | |||
| Series 2017-C1 Class ASB, 3.462% 11/15/50 | 1,400,000 | 1,526,942 | |
| Series 2017-C7 Class ASB, 3.586% 12/15/50 | 1,000,000 | 1,096,687 | |
| Series 2012-C1 Class A/S, 4.171% 5/10/45 | 9,200,000 | 9,390,462 | |
| Series 2017-C7 Class XA, 1.0259% 12/15/50 (b)(j) | 1,216,638 | 61,161 | |
| UBS-Barclays Commercial Mortgage Trust: | |||
| floater Series 2013-C6 Class A3, 1 month U.S. LIBOR + 0.790% 0.8881% 4/10/46 (a)(b)(c) | 110,576 | 110,265 | |
| sequential payer Series 2012-C4 Class A/S, 3.3165% 12/10/45 (a) | 4,200,000 | 4,333,603 | |
| Series 2012-C3 Class A/S, 3.814% 8/10/49 (a) | 12,000,000 | 12,395,029 | |
| VLS Commercial Mortgage Trust: | |||
| sequential payer Series 2020-LAB Class A, 2.13% 10/10/42 (a) | 8,020,000 | 7,928,270 | |
| Series 2020-LAB: | |||
| Class B, 2.453% 10/10/42 (a) | 470,000 | 469,930 | |
| Class X, 0.4294% 10/10/42 (a)(b)(j) | 27,100,000 | 962,107 | |
| Wells Fargo Commercial Mortgage Trust: | |||
| floater Series 2021-FCMT Class A, 1 month U.S. LIBOR + 1.200% 1.3% 5/15/31 (a)(b)(c) | 15,435,000 | 15,464,339 | |
| sequential payer: | |||
| Series 2015-C26 Class A4, 3.166% 2/15/48 | 11,250,000 | 12,111,568 | |
| Series 2015-C29 Class ASB, 3.4% 6/15/48 | 4,937,618 | 5,197,075 | |
| Series 2016-LC24 Class A3, 2.684% 10/15/49 | 4,700,000 | 4,967,801 | |
| Series 2017-C40 Class ASB, 3.395% 10/15/50 | 1,000,000 | 1,086,978 | |
| Series 2018-C44 Class ASB, 4.167% 5/15/51 | 1,000,000 | 1,128,094 | |
| Series 2019-C52 Class A5, 2.892% 8/15/52 | 3,829,000 | 4,072,992 | |
| Series 2019-C54 Class ASB, 3.063% 12/15/52 | 1,000,000 | 1,092,316 | |
| Series 2015-SG1 Class ASB, 3.556% 9/15/48 | 4,361,814 | 4,594,858 | |
| Series 2017-C42 Class XA, 0.8798% 12/15/50 (b)(j) | 1,447,616 | 69,974 | |
| Series 2018-C46 Class XA, 0.9374% 8/15/51 (b)(j) | 24,942,025 | 1,141,417 | |
| Series 2018-C48 Class A5, 4.302% 1/15/52 | 3,836,000 | 4,441,147 | |
| Series 2019-C54 Class XA, 0.8388% 12/15/52 (b)(j) | 26,329,446 | 1,594,172 | |
| WF-RBS Commercial Mortgage Trust: | |||
| Series 2012-C8 Class A/S, 3.66% 8/15/45 | 5,036,000 | 5,175,539 | |
| Series 2012-C9 Class A/S, 3.388% 11/15/45 | 1,300,000 | 1,339,510 | |
| Series 2013-C12 Class A/S, 3.56% 3/15/48 | 17,361,000 | 18,147,493 | |
| Series 2013-C16 Class A/S, 4.668% 9/15/46 (b) | 8,828,629 | 9,544,472 | |
| TOTAL COMMERCIAL MORTGAGE SECURITIES | |||
| (Cost $1,279,276,721) | 1,281,883,960 | ||
| Municipal Securities - 0.1% | |||
| Chicago Board of Ed. Series 2009 G, 1.75% 12/15/25 | 4,720,000 | 4,542,840 | |
| Illinois Gen. Oblig.: | |||
| Series 2003: | $ | $ | |
| 4.95% 6/1/23 | 3,343,364 | 3,459,239 | |
| 5.1% 6/1/33 | 22,095,000 | 25,381,362 | |
| Series 2010-1, 6.63% 2/1/35 | 2,035,000 | 2,480,221 | |
| Series 2010-3: | |||
| 6.725% 4/1/35 | 2,710,000 | 3,325,298 | |
| 7.35% 7/1/35 | 1,385,000 | 1,752,695 | |
| Series 2010-5, 6.2% 7/1/21 | 295,000 | 296,098 | |
| New Jersey Econ. Dev. Auth. State Pension Fdg. Rev. Series 1997, 7.425% 2/15/29 (Nat'l. Pub. Fin. Guarantee Corp. Insured) | 11,609,000 | 14,891,357 | |
| TOTAL MUNICIPAL SECURITIES | |||
| (Cost $50,276,753) | 56,129,110 | ||
| Foreign Government and Government Agency Obligations - 0.0% | |||
| State of Qatar 3.4% 4/16/25 (Cost $4,099,939)(a) | $4,110,000 | $4,485,808 | |
| Shares | Value | ||
| Common Stocks - 0.0% | |||
| ENERGY - 0.0% | |||
| Energy Equipment & Services - 0.0% | |||
| Jonah Energy Parent LLC (i) | |||
| (Cost $65,550) | 4,766 | 71,490 | |
| Principal Amount | Value | ||
| Bank Notes - 0.0% | |||
| Discover Bank 4.682% 8/9/28 (b) | 2,954,000 | 3,142,761 | |
| KeyBank NA 6.95% 2/1/28 | 619,000 | 779,513 | |
| Regions Bank 6.45% 6/26/37 | 4,251,000 | 5,869,276 | |
| TOTAL BANK NOTES | |||
| (Cost $8,502,372) | 9,791,550 | ||
| Shares | Value | ||
| Fixed-Income Funds - 55.4% | |||
| Bank Loan Funds - 2.2% | |||
| Fidelity Floating Rate High Income Fund (n) | 83,849,670 | $792,379,385 | |
| High Yield Fixed-Income Funds - 2.8% | |||
| Fidelity High Income Fund (n) | 33,706,903 | 292,575,915 | |
| Fidelity New Markets Income Fund (n) | 48,482,092 | 711,717,114 | |
| TOTAL HIGH YIELD FIXED-INCOME FUNDS | 1,004,293,029 | ||
| Inflation-Protected Bond Funds - 2.1% | |||
| Fidelity Inflation-Protected Bond Index Fund (n) | 67,248,036 | 749,815,600 | |
| Intermediate Government Funds - 6.6% | |||
| Fidelity SAI U.S. Treasury Bond Index Fund (n) | 235,336,174 | 2,358,068,459 | |
| Intermediate-Term Bond Funds - 34.4% | |||
| Fidelity Global Credit Fund (n) | 3,147,903 | 30,723,536 | |
| Fidelity Intermediate Bond Fund (n) | 49,056,068 | 548,937,405 | |
| Fidelity SAI Total Bond Fund (n) | 1,020,734,832 | 10,738,130,397 | |
| Fidelity Sustainability Bond Index Fund (n) | 2,363,917 | 25,317,551 | |
| Fidelity U.S. Bond Index Fund (n) | 85,503,251 | 1,030,314,170 | |
| TOTAL INTERMEDIATE-TERM BOND FUNDS | 12,373,423,059 | ||
| Investment Grade Fixed-Income Funds - 2.3% | |||
| Fidelity Corporate Bond Fund (n) | 66,354,255 | 828,101,099 | |
| Long Government Bond Funds - 3.2% | |||
| Fidelity SAI Long-Term Treasury Bond Index Fund (n) | 109,572,485 | 1,166,946,960 | |
| Sector Funds - 1.8% | |||
| Fidelity Advisor Real Estate Income Fund Class I (n) | 49,903,219 | 646,246,691 | |
| TOTAL FIXED-INCOME FUNDS | |||
| (Cost $19,675,544,623) | 19,919,274,282 | ||
| Principal Amount | Value | ||
| Preferred Securities - 0.1% | |||
| FINANCIALS - 0.1% | |||
| Banks - 0.1% | |||
| Bank of Nova Scotia 4.65% (b)(o) | 13,095,000 | 13,292,767 | |
| Barclays Bank PLC 7.625% 11/21/22 | 12,633,000 | 13,849,436 | |
| 27,142,203 | |||
| Consumer Finance - 0.0% | |||
| Ally Financial, Inc. 4.7% (b)(o) | 2,600,000 | 2,684,842 | |
| TOTAL PREFERRED SECURITIES | |||
| (Cost $29,129,144) | 29,827,045 | ||
| Shares | Value | ||
| Money Market Funds - 10.2% | |||
| Fidelity Cash Central Fund 0.03% (p) | 2,064,610,808 | 2,065,023,730 | |
| Fidelity Investments Money Market Government Portfolio Institutional Class 0.01% (n)(q) | 1,590,674,573 | 1,590,674,573 | |
| TOTAL MONEY MARKET FUNDS | |||
| (Cost $3,655,698,264) | 3,655,698,303 |
| Purchased Swaptions - 0.0% | ||||
| Expiration Date | Notional Amount | Value | ||
| Put Options - 0.0% | ||||
| Option on an interest rate swap with Bank of America N.A. to pay semi-annually a fixed rate of 0.865% and receive quarterly a floating rate based on 3-month LIBOR, expiring October 2031 | 10/14/21 | 22,100,000 | $1,645,031 | |
| Option on an interest rate swap with Bank of America N.A. to pay semi-annually a fixed rate of 1.78% and receive quarterly a floating rate based on 3-month LIBOR, expiring October 2029 | 10/15/24 | 4,600,000 | 154,216 | |
| Option on an interest rate swap with JPMorgan Chase Bank, N.A. to pay semi-annually a fixed rate of 2.313% and receive quarterly a floating rate based on 3-month LIBOR, expiring June 2029 | 6/6/24 | 12,300,000 | 242,546 | |
| TOTAL PUT OPTIONS | 2,041,793 | |||
| Call Options - 0.0% | ||||
| Option on an interest rate swap with Bank of America N.A. to receive semi-annually a fixed rate of 0.865% and pay quarterly a floating rate based on 3-month LIBOR, expiring October 2031 | 10/14/21 | 22,100,000 | 20,008 | |
| Option on an interest rate swap with Bank of America N.A. to receive semi-annually a fixed rate of 1.78% and pay quarterly a floating rate based on 3-month LIBOR, expiring October 2029 | 10/15/24 | 4,600,000 | 98,032 | |
| Option on an interest rate swap with JPMorgan Chase Bank, N.A. to receive semi-annually a fixed rate of 2.313% and pay quarterly a floating rate based on 3-month LIBOR, expiring June 2029 | 6/6/24 | 12,300,000 | 450,241 | |
| TOTAL CALL OPTIONS | 568,281 | |||
| TOTAL PURCHASED SWAPTIONS | ||||
| (Cost $2,011,618) | 2,610,074 | |||
| TOTAL INVESTMENT IN SECURITIES - 108.7% | ||||
| (Cost $38,423,295,022) | 39,068,445,760 | |||
| NET OTHER ASSETS (LIABILITIES) - (8.7)% | (3,112,908,972) | |||
| NET ASSETS - 100% | $35,955,536,788 |
| TBA Sale Commitments | ||
| Principal Amount | Value | |
| Ginnie Mae | ||
| 2% 6/1/51 | $(14,150,000) | $(14,394,031) |
| 2% 6/1/51 | (5,700,000) | (5,798,302) |
| 2% 6/1/51 | (9,450,000) | (9,612,975) |
| 2% 6/1/51 | (3,800,000) | (3,865,535) |
| 2% 6/1/51 | (23,700,000) | (24,108,730) |
| 2% 6/1/51 | (9,500,000) | (9,663,837) |
| 2% 6/1/51 | (56,850,000) | (57,830,435) |
| 2% 6/1/51 | (22,800,000) | (23,193,209) |
| 2% 6/1/51 | (33,150,000) | (33,721,705) |
| 2% 6/1/51 | (13,300,000) | (13,529,372) |
| 2.5% 6/1/51 | (50,750,000) | (52,563,693) |
| 2.5% 6/1/51 | (18,200,000) | (18,850,428) |
| 3% 6/1/51 | (20,100,000) | (20,970,362) |
| 3% 6/1/51 | (9,400,000) | (9,807,035) |
| 3.5% 6/1/51 | (28,750,000) | (30,240,527) |
| 3.5% 6/1/51 | (10,700,000) | (11,254,735) |
| 3.5% 6/1/51 | (2,450,000) | (2,577,019) |
| 3.5% 6/1/51 | (4,600,000) | (4,838,484) |
| TOTAL GINNIE MAE | (346,820,414) | |
| Uniform Mortgage Backed Securities | ||
| 1.5% 6/1/36 | (25,150,000) | (25,460,447) |
| 1.5% 6/1/36 | (3,650,000) | (3,695,055) |
| 1.5% 6/1/36 | (6,700,000) | (6,782,703) |
| 2% 6/1/51 | (60,600,000) | (61,228,652) |
| 2% 6/1/51 | (23,300,000) | (23,541,710) |
| 2% 6/1/51 | (7,100,000) | (7,173,654) |
| 2% 6/1/51 | (23,900,000) | (24,147,934) |
| 2% 6/1/51 | (62,400,000) | (63,047,325) |
| 2% 6/1/51 | (23,500,000) | (23,743,784) |
| 2% 6/1/51 | (10,300,000) | (10,406,850) |
| 2% 6/1/51 | (35,900,000) | (36,272,419) |
| 2% 6/1/51 | (14,000,000) | (14,145,233) |
| 2% 6/1/51 | (54,250,000) | (54,812,779) |
| 2% 6/1/51 | (44,050,000) | (44,506,966) |
| 2% 6/1/51 | (30,600,000) | (30,917,438) |
| 2% 6/1/51 | (42,550,000) | (42,991,405) |
| 2% 6/1/51 | (11,650,000) | (11,770,855) |
| 2.5% 6/1/51 | (2,600,000) | (2,692,117) |
| 2.5% 6/1/51 | (5,600,000) | (5,798,406) |
| 2.5% 6/1/51 | (8,200,000) | (8,490,523) |
| 2.5% 6/1/51 | (20,900,000) | (21,640,479) |
| 2.5% 6/1/51 | (5,000,000) | (5,177,148) |
| 2.5% 6/1/51 | (6,800,000) | (7,040,921) |
| 2.5% 6/1/51 | (5,400,000) | (5,591,320) |
| 2.5% 6/1/51 | (6,800,000) | (7,040,921) |
| 2.5% 6/1/51 | (8,100,000) | (8,386,980) |
| 2.5% 6/1/51 | (2,700,000) | (2,795,660) |
| 2.5% 6/1/51 | (30,100,000) | (31,166,431) |
| 2.5% 6/1/51 | (2,950,000) | (3,054,517) |
| 3% 6/1/51 | (5,500,000) | (5,744,063) |
| 3% 6/1/51 | (5,575,000) | (5,822,391) |
| 3% 6/1/51 | (36,200,000) | (37,806,379) |
| 3.5% 6/1/51 | (14,500,000) | (15,306,070) |
| 3.5% 6/1/51 | (15,600,000) | (16,467,220) |
| 3.5% 6/1/51 | (76,500,000) | (80,752,712) |
| 3.5% 6/1/51 | (50,700,000) | (53,518,464) |
| 3.5% 6/1/51 | (15,400,000) | (16,256,101) |
| 3.5% 6/1/51 | (10,250,000) | (10,819,808) |
| 3.5% 6/1/51 | (55,850,000) | (58,954,757) |
| 3.5% 6/1/51 | (11,250,000) | (11,875,397) |
| TOTAL UNIFORM MORTGAGE BACKED SECURITIES | (906,843,994) | |
| TOTAL TBA SALE COMMITMENTS | ||
| (Proceeds $1,253,151,514) | $(1,253,664,408) |
| Written Swaptions | |||
| Expiration Date | Notional Amount | Value | |
| Put Swaptions | |||
| Option on an interest rate swap with Bank of America N.A. to pay semi-annually a fixed rate of 2.37% and receive quarterly a floating rate based on 3-month LIBOR, expiring May 2026 | 5/11/26 | 60,000,000 | $(1,866,836) |
| Option on an interest rate swap with Bank of America N.A. to pay semi-annually a fixed rate of 2.5175% and receive quarterly a floating rate based on 3-month LIBOR, expiring April 2026 | 4/1/26 | 21,000,000 | (584,500) |
| Option on an interest rate swap with Goldman Sachs Bank U.S.A. to pay semi-annually a fixed rate of 1.27% and receive quarterly a floating rate based on 3-month LIBOR, expiring November 2030 | 11/25/25 | 96,100,000 | (5,501,741) |
| Option on an interest rate swap with Morgan Stanley Capital Services to pay semi-annually a fixed rate of 2.3725% and receive quarterly a floating rate based on 3-month LIBOR, expiring May 2026 | 5/18/26 | 16,000,000 | (498,467) |
| TOTAL PUT SWAPTIONS | (8,451,544) | ||
| Call Swaptions | |||
| Option on an interest rate swap with Bank of America N.A. to receive semi-annually a fixed rate of 2.37% and pay quarterly a floating rate based on 3-month LIBOR, expiring May 2026 | 5/11/26 | 60,000,000 | (2,105,210) |
| Option on an interest rate swap with Bank of America N.A. to receive semi-annually a fixed rate of 2.5175% and pay quarterly a floating rate based on 3-month LIBOR, expiring April 2026 | 4/1/26 | 21,000,000 | (820,808) |
| Option on an interest rate swap with Goldman Sachs Bank U.S.A. to receive semi-annually a fixed rate of 1.27% and pay quarterly a floating rate based on 3-month LIBOR, expiring November 2030 | 11/25/25 | 96,100,000 | (1,245,984) |
| Option on an interest rate swap with Morgan Stanley Capital Services to receive semi-annually a fixed rate of 2.3725% and pay quarterly a floating rate based on 3-month LIBOR, expiring May 2026 | 5/18/26 | 16,000,000 | (562,310) |
| TOTAL CALL SWAPTIONS | (4,734,312) | ||
| TOTAL WRITTEN SWAPTIONS | $(13,185,856) |
| Futures Contracts | |||||
| Number of contracts | Expiration Date | Notional Amount | Value | Unrealized Appreciation/(Depreciation) | |
| Purchased | |||||
| Treasury Contracts | |||||
| CBOT 10-Year U.S. Treasury Note Contracts (United States) | 758 | Sept. 2021 | $100,008,625 | $142,108 | $142,108 |
| CBOT 5-Year U.S. Treasury Note Contracts (United States) | 349 | Sept. 2021 | 43,224,195 | 81,255 | 81,255 |
| CBOT Long Term U.S. Treasury Bond Contracts (United States) | 1,522 | Sept. 2021 | 238,240,563 | 1,109,685 | 1,109,685 |
| TOTAL PURCHASED | 1,333,048 | ||||
| Sold | |||||
| Treasury Contracts | |||||
| CBOT 10-Year U.S. Treasury Note Contracts (United States) | 209 | Sept. 2021 | 27,574,938 | (17,091) | (17,091) |
| CBOT 2-Year U.S. Treasury Note Contracts (United States) | 1,997 | Sept. 2021 | 440,806,547 | (206,739) | (206,739) |
| CBOT 5-Year U.S. Treasury Note Contracts (United States) | 538 | Sept. 2021 | 66,632,141 | (131,322) | (131,322) |
| TOTAL SOLD | (355,152) | ||||
| TOTAL FUTURES CONTRACTS | $977,896 |
The notional amount of futures purchased as a percentage of Net Assets is 1.1%
The notional amount of futures sold as a percentage of Net Assets is 1.5%
Swaps
| Underlying Reference | Rating(1) | Maturity Date | Clearinghouse / Counterparty | Fixed Payment Received/(Paid) | Payment Frequency | Notional Amount(2) | Value(1) | Upfront Premium Received/(Paid)(3) | Unrealized Appreciation/(Depreciation) |
| Credit Default Swaps | |||||||||
| Sell Protection | |||||||||
| CMBX N.A. AAA Index Series 13 | NR | Dec. 2072 | Goldman Sachs & Co. LLC | 0.5% | Monthly | $12,160,000 | $101,206 | $(59,876) | $41,330 |
| CMBX N.A. AAA Index Series 13 | NR | Dec. 2072 | JPMorgan Securities LLC | 0.5% | Monthly | 8,990,000 | 74,823 | (28,973) | 45,850 |
| CMBX N.A. AAA Index Series 13 | NR | Dec. 2072 | Morgan Stanley Capital Services LLC | 0.5% | Monthly | 3,110,000 | 25,884 | (8,797) | 17,087 |
| CMBX N.A. AAA Index Series 13 | NR | Dec. 2072 | Morgan Stanley Capital Services LLC | 0.5% | Monthly | 2,580,000 | 15,725 | (15,059) | 666 |
| TOTAL CREDIT DEFAULT SWAPS | $217,638 | $(112,705) | $104,933 | ||||||
(1) Ratings are presented for credit default swaps in which the Fund has sold protection on the underlying referenced debt. Ratings for an underlying index represent a weighted average of the ratings of all securities included in the index. The credit rating or value can be measures of the current payment/performance risk. Ratings are from Moody's Investors Service, Inc. Where Moody's® ratings are not available, S&P® ratings are disclosed and are indicated as such. All ratings are as of the report date and do not reflect subsequent changes.
(2) The notional amount of each credit default swap where the Fund has sold protection approximates the maximum potential amount of future payments that the Fund could be required to make if a credit event were to occur.
(3) Any premiums for centrally cleared over-the-counter (OTC) swaps are recorded periodically throughout the term of the swap to variation margin and included in unrealized appreciation (depreciation).
Swaps
| Payment Received | Payment Frequency | Payment Paid | Payment Frequency | Clearinghouse / Counterparty(1) | Maturity Date | Notional Amount | Value | Upfront Premium Received/(Paid)(3) | Unrealized Appreciation/(Depreciation) |
| Interest Rate Swaps | |||||||||
| 0.25% | Semi - annual | 3-month LIBOR(3) | Quarterly | LCH | Sep. 2023 | $185,090,000 | $261,289 | $0 | $261,289 |
| 0.5% | Semi - annual | 3-month LIBOR(3) | Quarterly | LCH | Sep. 2026 | 70,132,000 | 272,102 | 0 | 272,102 |
| 0.75% | Semi - annual | 3-month LIBOR(3) | Quarterly | LCH | Sep. 2028 | 14,550,000 | 104,201 | 0 | 104,201 |
| 1% | Semi - annual | 3-month LIBOR(3) | Quarterly | LCH | Sep. 2031 | 1,370,000 | 11,985 | 0 | 11,985 |
| 3-month LIBOR(3) | Quarterly | 1% | Semi - annual | LCH | Sep. 2031 | 15,486,000 | (18,357) | 0 | (18,357) |
| 1.25% | Semi - annual | 3-month LIBOR(3) | Quarterly | LCH | Sep. 2051 | 3,303,000 | 22,744 | 0 | 22,744 |
| TOTAL INTEREST RATE SWAPS | $653,964 | $0 | $653,964 | ||||||
(1) Swaps with LCH Clearnet Group (LCH) are centrally cleared over-the-counter (OTC) swaps.
(2) Any premiums for centrally cleared over-the-counter (OTC) swaps are recorded periodically throughout the term of the swap to variation margin and included in unrealized appreciation (depreciation).
(3) Represents floating rate.
(a) Security exempt from registration under Rule 144A of the Securities Act of 1933. These securities may be resold in transactions exempt from registration, normally to qualified institutional buyers. At the end of the period, the value of these securities amounted to $2,441,832,480 or 6.8% of net assets.
(b) Coupon rates for floating and adjustable rate securities reflect the rates in effect at period end.
(c) Coupon is indexed to a floating interest rate which may be multiplied by a specified factor and/or subject to caps or floors.
(d) Security or a portion of the security has been segregated as collateral for open options and bi-lateral over-the-counter (OTC) swaps. At period end, the value of securities pledged amounted to $2,433,397.
(e) Security or a portion of the security was pledged to cover margin requirements for futures contracts. At period end, the value of securities pledged amounted to $5,181,928.
(f) Security or a portion of the security was pledged to cover margin requirements for centrally cleared OTC swaps. At period end, the value of securities pledged amounted to $4,299,722.
(g) Security or a portion of the security has been segregated as collateral for mortgage-backed or asset-backed securities purchased on a delayed delivery or when-issued basis. At period end, the value of securities pledged amounted to $1,845,616.
(h) Security or a portion of the security purchased on a delayed delivery or when-issued basis.
(i) Level 3 security
(j) Security represents right to receive monthly interest payments on an underlying pool of mortgages or assets. Principal shown is the outstanding par amount of the pool as of the end of the period.
(k) Coupon is inversely indexed to a floating interest rate multiplied by a specified factor. The price may be considerably more volatile than the price of a comparable fixed rate security.
(l) Principal Only Strips represent the right to receive the monthly principal payments on an underlying pool of mortgage loans.
(m) Represents an investment in an underlying pool of reverse mortgages which typically do not require regular principal and interest payments as repayment is deferred until a maturity event.
(n) Affiliated Fund
(o) Security is perpetual in nature with no stated maturity date.
(p) Affiliated fund that is generally available only to investment companies and other accounts managed by Fidelity Investments. The rate quoted is the annualized seven-day yield of the fund at period end. A complete unaudited listing of the fund's holdings as of its most recent quarter end is available upon request. In addition, each Fidelity Central Fund's financial statements, which are not covered by the Fund's Report of Independent Registered Public Accounting Firm, are available on the SEC's website or upon request.
(q) The rate quoted is the annualized seven-day yield of the fund at period end.
Affiliated Central Funds
Information regarding fiscal year to date income earned by the Fund from investments in Fidelity Central Funds is as follows:
| Fund | Income earned |
| Fidelity Cash Central Fund | $1,110,914 |
| Total | $1,110,914 |
Amounts in the income column in the above table include any capital gain distributions from underlying funds, which are presented in the corresponding line-item in the Statement of Operations, if applicable.
The value, beginning of period, for the Fidelity Cash Central Fund was $1,034,474,149. Net realized gain (loss) and change in net unrealized appreciation (depreciation) on Fidelity Cash Central Fund is presented in the Statement of Operations, if applicable. Purchases and sales of the Fidelity Cash Central Fund were $6,875,696,707 and $5,845,115,616, respectively, during the period.
Affiliated Underlying Funds
Fiscal year to date information regarding the Fund's investments in affiliated Underlying Funds, excluding any Money Market Central Funds, is presented below. Exchanges between classes of the same affiliated Underlying Funds may occur.
| Affiliate | Value, beginning of period | Purchases | Sales Proceeds | Dividend Income | Realized Gain (loss) | Change in Unrealized appreciation (depreciation) | Value, end of period |
| Fidelity Advisor Real Estate Income Fund Class I | $-- | $574,363,941 | $-- | $17,215,795 | $-- | $71,882,750 | $646,246,691 |
| Fidelity Advisor Real Estate Income Fund Class Z | 130,711,979 | 1,148,146 | 126,148,146 | 1,148,146 | -- | (5,711,979) | -- |
| Fidelity Capital & Income Fund | -- | 50,550,888 | 52,144,462 | 626,512 | 1,593,574 | -- | -- |
| Fidelity Corporate Bond Fund | 502,825,401 | 327,929,997 | -- | 20,926,032 | -- | (2,654,299) | 828,101,099 |
| Fidelity Floating Rate High Income Fund | 554,823,681 | 221,227,425 | 30,000,000 | 21,227,001 | (2,125,984) | 48,454,263 | 792,379,385 |
| Fidelity Global Credit Fund | 26,242,053 | 4,178,341 | -- | 1,178,341 | -- | 316,930 | 30,723,536 |
| Fidelity High Income Fund | 189,708,266 | 360,653,342 | 270,000,000 | 10,646,000 | 2,992,145 | 9,222,162 | 292,575,915 |
| Fidelity Inflation-Protected Bond Index Fund | 417,876,035 | 305,576,072 | -- | 5,576,075 | -- | 26,363,493 | 749,815,600 |
| Fidelity Intermediate Bond Fund | -- | 552,378,195 | -- | 2,378,231 | -- | (3,440,790) | 548,937,405 |
| Fidelity Investments Money Market Government Portfolio Institutional Class 0.01% | 502,472,950 | 7,870,746,472 | 6,782,544,849 | 212,421 | -- | -- | 1,590,674,573 |
| Fidelity New Markets Income Fund | 437,744,286 | 247,056,282 | -- | 22,055,982 | -- | 26,916,546 | 711,717,114 |
| Fidelity SAI Long-Term Treasury Bond Index Fund | 1,107,985,358 | 392,780,101 | 100,000,000 | 67,779,943 | 2,024,246 | (235,842,745) | 1,166,946,960 |
| Fidelity SAI Total Bond Fund | 9,212,423,374 | 1,711,488,621 | -- | 586,477,520 | -- | (185,781,598) | 10,738,130,397 |
| Fidelity SAI U.S. Treasury Bond Index Fund | -- | 2,426,485,756 | -- | 27,353,557 | -- | (68,417,297) | 2,358,068,459 |
| Fidelity Sustainability Bond Index Fund | 25,576,136 | 495,601 | -- | 495,615 | -- | (754,186) | 25,317,551 |
| Fidelity U.S. Bond Index Fund | 101,109,716 | 966,437,699 | -- | 17,286,148 | -- | (37,233,245) | 1,030,314,170 |
| Total | $13,209,499,235 | $16,013,496,879 | $7,360,837,457 | $802,583,319 | $4,483,981 | $(356,679,995) | $21,509,948,855 |
Amounts in the income column in the above table include any capital gain distributions from underlying funds, which are presented in the corresponding line-item in the Statement of Operations, if applicable.
Investment Valuation
The following is a summary of the inputs used, as of May 31, 2021, involving the Fund's assets and liabilities carried at fair value. The inputs or methodology used for valuing securities may not be an indication of the risk associated with investing in those securities. For more information on valuation inputs, and their aggregation into the levels used below, please refer to the Investment Valuation section in the accompanying Notes to Financial Statements.
| Valuation Inputs at Reporting Date: | ||||
| Description | Total | Level 1 | Level 2 | Level 3 |
| Investments in Securities: | ||||
| Equities: | ||||
| Energy | $71,490 | $-- | $-- | $71,490 |
| Corporate Bonds | 4,237,273,577 | -- | 4,237,273,577 | -- |
| U.S. Government and Government Agency Obligations | 2,710,947,649 | -- | 2,710,947,649 | -- |
| U.S. Government Agency - Mortgage Securities | 6,103,879,129 | -- | 6,103,879,129 | -- |
| Asset-Backed Securities | 777,277,948 | -- | 777,277,948 | -- |
| Collateralized Mortgage Obligations | 279,295,835 | -- | 279,295,781 | 54 |
| Commercial Mortgage Securities | 1,281,883,960 | -- | 1,281,883,960 | -- |
| Municipal Securities | 56,129,110 | -- | 56,129,110 | -- |
| Foreign Government and Government Agency Obligations | 4,485,808 | -- | 4,485,808 | -- |
| Bank Notes | 9,791,550 | -- | 9,791,550 | -- |
| Fixed-Income Funds | 19,919,274,282 | 19,919,274,282 | -- | -- |
| Preferred Securities | 29,827,045 | -- | 29,827,045 | -- |
| Money Market Funds | 3,655,698,303 | 3,655,698,303 | -- | -- |
| Purchased Swaptions | 2,610,074 | -- | 2,610,074 | -- |
| Total Investments in Securities: | $39,068,445,760 | $23,574,972,585 | $15,493,401,631 | $71,544 |
| Derivative Instruments: | ||||
| Assets | ||||
| Futures Contracts | $1,333,048 | $1,333,048 | $-- | $-- |
| Swaps | 889,959 | -- | 889,959 | -- |
| Total Assets | $2,223,007 | $1,333,048 | $889,959 | $-- |
| Liabilities | ||||
| Futures Contracts | $(355,152) | $(355,152) | $-- | $-- |
| Swaps | (18,357) | -- | (18,357) | -- |
| Written Swaptions | (13,185,856) | -- | (13,185,856) | -- |
| Total Liabilities | $(13,559,365) | $(355,152) | $(13,204,213) | $-- |
| Total Derivative Instruments: | $(11,336,358) | $977,896 | $(12,314,254) | $-- |
| Other Financial Instruments: | ||||
| TBA Sale Commitments | $(1,253,664,408) | $-- | $(1,253,664,408) | $-- |
| Total Other Financial Instruments: | $(1,253,664,408) | $-- | $(1,253,664,408) | $-- |
Value of Derivative Instruments
The following table is a summary of the Fund's value of derivative instruments by primary risk exposure as of May 31, 2021. For additional information on derivative instruments, please refer to the Derivative Instruments section in the accompanying Notes to Financial Statements.
| Primary Risk Exposure / Derivative Type | Value | |
| Asset | Liability | |
| Credit Risk | ||
| Swaps(a) | $217,638 | $-- |
| Total Credit Risk | 217,638 | -- |
| Interest Rate Risk | ||
| Futures Contracts(b) | 1,333,048 | (355,152) |
| Purchased Swaptions(c) | 2,610,074 | -- |
| Swaps(d) | 672,321 | (18,357) |
| Written Swaptions(e) | -- | (13,185,856) |
| Total Interest Rate Risk | 4,615,443 | (13,559,365) |
| Total Value of Derivatives | $4,833,081 | $(13,559,365) |
(a) For bi-lateral over-the-counter (OTC) swaps, reflects gross value which is presented in the Statement of Assets and Liabilities in the bi-lateral OTC swaps, at value line-items.
(b) Reflects gross cumulative appreciation (depreciation) on futures contracts as presented in the Schedule of Investments. In the Statement of Assets and Liabilities, the period end daily variation margin is included in receivable or payable for daily variation margin on futures contracts, and the net cumulative appreciation (depreciation) is included in Total accumulated earnings (loss).
(c) Gross value is included in the Statement of Assets and Liabilities in the investments, at value line-item.
(d) For centrally cleared over-the-counter (OTC) swaps, reflects gross cumulative appreciation (depreciation) as presented in the Schedule of Investments. In the Statement of Assets and Liabilities, the period end daily variation margin for centrally cleared OTC swaps is included in receivable or payable for daily variation margin on centrally cleared OTC swaps, and the net cumulative appreciation (depreciation) for centrally cleared OTC swaps is included in Total accumulated earnings (loss).
(e) Gross value is presented in the Statement of Assets and Liabilities in the written options, at value line-item.
See accompanying notes which are an integral part of the financial statements.
Financial Statements
Statement of Assets and Liabilities
| May 31, 2021 | ||
| Assets | ||
| Investment in securities, at value — See accompanying schedule: Unaffiliated issuers (cost $15,092,052,135) | $15,493,473,175 | |
| Fidelity Central Funds (cost $2,065,023,691) | 2,065,023,730 | |
| Other affiliated issuers (cost $21,266,219,196) | 21,509,948,855 | |
| Total Investment in Securities (cost $38,423,295,022) | $39,068,445,760 | |
| Cash | 1,316,839 | |
| Receivable for investments sold | 78,967,891 | |
| Receivable for premium on written options | 11,270,795 | |
| Receivable for TBA sale commitments | 1,253,151,514 | |
| Receivable for fund shares sold | 51,613,980 | |
| Dividends receivable | 33,910,750 | |
| Interest receivable | 59,117,888 | |
| Distributions receivable from Fidelity Central Funds | 60,939 | |
| Receivable for daily variation margin on futures contracts | 415,397 | |
| Bi-lateral OTC swaps, at value | 217,638 | |
| Prepaid expenses | 83,307 | |
| Other receivables | 2,640 | |
| Total assets | 40,558,575,338 | |
| Liabilities | ||
| Payable for investments purchased | ||
| Regular delivery | $175,928,576 | |
| Delayed delivery | 3,143,495,118 | |
| TBA sale commitments, at value | 1,253,664,408 | |
| Payable for swaps | 15,059 | |
| Payable for fund shares redeemed | 13,550,138 | |
| Distributions payable | 504,839 | |
| Accrued management fee | 1,216,444 | |
| Payable for daily variation margin on centrally cleared OTC swaps | 59,873 | |
| Written options, at value (premium receivable $11,270,795) | 13,185,856 | |
| Other payables and accrued expenses | 1,418,239 | |
| Total liabilities | 4,603,038,550 | |
| Net Assets | $35,955,536,788 | |
| Net Assets consist of: | ||
| Paid in capital | $35,391,471,895 | |
| Total accumulated earnings (loss) | 564,064,893 | |
| Net Assets | $35,955,536,788 | |
| Net Asset Value, offering price and redemption price per share ($35,955,536,788 ÷ 3,391,302,307 shares) | $10.60 |
See accompanying notes which are an integral part of the financial statements.
Statement of Operations
| Year ended May 31, 2021 | ||
| Investment Income | ||
| Dividends: | ||
| Unaffiliated issuers | $1,626,125 | |
| Affiliated issuers | 388,427,485 | |
| Interest | 263,478,990 | |
| Income from Fidelity Central Funds | 1,110,914 | |
| Total income | 654,643,514 | |
| Expenses | ||
| Management fee | $87,274,503 | |
| Custodian fees and expenses | 251,898 | |
| Independent trustees' fees and expenses | 261,934 | |
| Registration fees | 2,395,150 | |
| Audit | 86,173 | |
| Legal | 74,429 | |
| Miscellaneous | 224,061 | |
| Total expenses before reductions | 90,568,148 | |
| Expense reductions | (72,923,996) | |
| Total expenses after reductions | 17,644,152 | |
| Net investment income (loss) | 636,999,362 | |
| Realized and Unrealized Gain (Loss) | ||
| Net realized gain (loss) on: | ||
| Investment securities: | ||
| Unaffiliated issuers | 35,347,206 | |
| Fidelity Central Funds | (31,510) | |
| Other affiliated issuers | 4,483,981 | |
| Futures contracts | (7,533,443) | |
| Swaps | (410,045) | |
| Written options | (124,920) | |
| Capital gain distributions from underlying funds: | ||
| Affiliated issuers | 414,155,834 | |
| Total net realized gain (loss) | 445,887,103 | |
| Change in net unrealized appreciation (depreciation) on: | ||
| Investment securities: | ||
| Unaffiliated issuers | 13,158,833 | |
| Fidelity Central Funds | 23,430,451 | |
| Other affiliated issuers | (356,679,995) | |
| Futures contracts | 1,698,233 | |
| Swaps | 1,277,531 | |
| Written options | (1,607,607) | |
| Delayed delivery commitments | (350,417) | |
| Total change in net unrealized appreciation (depreciation) | (319,072,971) | |
| Net gain (loss) | 126,814,132 | |
| Net increase (decrease) in net assets resulting from operations | $763,813,494 |
See accompanying notes which are an integral part of the financial statements.
Statement of Changes in Net Assets
| Year ended May 31, 2021 | Year ended May 31, 2020 | |
| Increase (Decrease) in Net Assets | ||
| Operations | ||
| Net investment income (loss) | $636,999,362 | $612,486,361 |
| Net realized gain (loss) | 445,887,103 | 904,314,719 |
| Change in net unrealized appreciation (depreciation) | (319,072,971) | 369,303,590 |
| Net increase (decrease) in net assets resulting from operations | 763,813,494 | 1,886,104,670 |
| Distributions to shareholders | (1,837,657,639) | (870,231,562) |
| Share transactions | ||
| Proceeds from sales of shares | 15,795,273,550 | 13,153,308,317 |
| Reinvestment of distributions | 1,814,939,433 | 789,311,102 |
| Cost of shares redeemed | (5,355,146,752) | (7,137,434,535) |
| Net increase (decrease) in net assets resulting from share transactions | 12,255,066,231 | 6,805,184,884 |
| Total increase (decrease) in net assets | 11,181,222,086 | 7,821,057,992 |
| Net Assets | ||
| Beginning of period | 24,774,314,702 | 16,953,256,710 |
| End of period | $35,955,536,788 | $24,774,314,702 |
| Other Information | ||
| Shares | ||
| Sold | 1,448,161,531 | 1,238,104,414 |
| Issued in reinvestment of distributions | 166,996,807 | 74,193,651 |
| Redeemed | (487,179,030) | (668,720,512) |
| Net increase (decrease) | 1,127,979,308 | 643,577,553 |
See accompanying notes which are an integral part of the financial statements.
Financial Highlights
Strategic Advisers Fidelity Core Income Fund
| Years ended May 31, | 2021 | 2020 | 2019 A |
| Selected Per–Share Data | |||
| Net asset value, beginning of period | $10.95 | $10.47 | $10.00 |
| Income from Investment Operations | |||
| Net investment income (loss)B | .239 | .302 | .209 |
| Net realized and unrealized gain (loss) | .106 | .613 | .445 |
| Total from investment operations | .345 | .915 | .654 |
| Distributions from net investment income | (.245) | (.299) | (.182) |
| Distributions from net realized gain | (.450) | (.136) | (.002) |
| Total distributions | (.695) | (.435) | (.184) |
| Net asset value, end of period | $10.60 | $10.95 | $10.47 |
| Total ReturnC,D | 3.10% | 8.94% | 6.60% |
| Ratios to Average Net AssetsE,F | |||
| Expenses before reductions | .31% | .32% | .37%G |
| Expenses net of fee waivers, if any | .06% | .07% | .12%G |
| Expenses net of all reductions | .06% | .07% | .12%G |
| Net investment income (loss) | 2.18% | 2.83% | 3.30%G |
| Supplemental Data | |||
| Net assets, end of period (000 omitted) | $35,955,537 | $24,774,315 | $16,953,257 |
| Portfolio turnover rateH | 191% | 247% | 124%G,I |
A For the period October 16, 2018 (commencement of operations) to May 31, 2019.
B Calculated based on average shares outstanding during the period.
C Total returns for periods of less than one year are not annualized.
D Total returns would have been lower if certain expenses had not been reduced during the applicable periods shown.
E Fees and expenses of any underlying mutual funds or exchange-traded funds (ETFs) are not included in the Fund's expense ratio. The Fund indirectly bears its proportionate share of these expenses. For additional expense information related to investments in Fidelity Central Funds, please refer to the "Investments in Fidelity Central Funds" note found in the Notes to Financial Statements section of the most recent Annual or Semi-Annual report.
F Expense ratios reflect operating expenses of the class. Expenses before reductions do not reflect amounts reimbursed, waived, or reduced through arrangements with the investment advisor, brokerage services, or other offset arrangements, if applicable, and do not represent the amount paid by the class during periods when reimbursements, waivers or reductions occur.
G Annualized
H Amount does not include the portfolio activity of any underlying mutual funds or exchange-traded funds (ETFs).
I Portfolio turnover rate excludes securities received or delivered in-kind.
See accompanying notes which are an integral part of the financial statements.
Notes to Financial Statements
For the period ended May 31, 2021
1. Organization.
Strategic Advisers Fidelity Core Income Fund (the Fund) is a fund of Fidelity Rutland Square Trust II (the Trust), and is authorized to issue an unlimited number of shares. The Trust is registered under the Investment Company Act of 1940, as amended (the 1940 Act), as an open-end management investment company organized as a Delaware statutory trust. The Fund is offered exclusively to certain managed account clients of Strategic Advisers LLC (Strategic Advisers), an affiliate of Fidelity Management & Research Company LLC (FMR).
2. Significant Accounting Policies.
The Fund is an investment company and applies the accounting and reporting guidance of the Financial Accounting Standards Board (FASB) Accounting Standards Codification Topic 946 Financial Services - Investment Companies. The financial statements have been prepared in conformity with accounting principles generally accepted in the United States of America (GAAP), which require management to make certain estimates and assumptions at the date of the financial statements. Actual results could differ from those estimates. Subsequent events, if any, through the date that the financial statements were issued have been evaluated in the preparation of the financial statements. The Fund's Schedule of Investments lists any underlying mutual funds or exchange-traded funds (ETFs) but does not include the underlying holdings of these funds. The following summarizes the significant accounting policies of the Fund:
Investment Valuation. Investments are valued as of 4:00 p.m. Eastern time on the last calendar day of the period. The Board of Trustees (the Board) has delegated the day to day responsibility for the valuation of the Fund's investments to the Fair Value Committee (the Committee) established by the Fund's investment adviser. In accordance with valuation policies and procedures approved by the Board, the Fund attempts to obtain prices from one or more third party pricing vendors or brokers to value its investments. When current market prices, quotations or currency exchange rates are not readily available or reliable, investments will be fair valued in good faith by the Committee, in accordance with procedures adopted by the Board. Factors used in determining fair value vary by investment type and may include market or investment specific events, changes in interest rates and credit quality. The frequency with which these procedures are used cannot be predicted and they may be utilized to a significant extent. The Committee oversees the Fund's valuation policies and procedures and reports to the Board on the Committee's activities and fair value determinations. The Board monitors the appropriateness of the procedures used in valuing the Fund's investments and ratifies the fair value determinations of the Committee.
The Fund categorizes the inputs to valuation techniques used to value its investments into a disclosure hierarchy consisting of three levels as shown below:
- Level 1 – quoted prices in active markets for identical investments
- Level 2 – other significant observable inputs (including quoted prices for similar investments, interest rates, prepayment speeds, etc.)
- Level 3 – unobservable inputs (including the Fund's own assumptions based on the best information available)
Valuation techniques used to value the Fund's investments by major category are as follows:
Debt securities, including restricted securities, are valued based on evaluated prices received from third party pricing vendors or from brokers who make markets in such securities. Corporate bonds, bank notes, foreign government and government agency obligations, municipal securities, preferred securities and U.S. government and government agency obligations are valued by pricing vendors who utilize matrix pricing which considers yield or price of bonds of comparable quality, coupon, maturity and type or by broker-supplied prices. Asset backed securities, collateralized mortgage obligations, commercial mortgage securities and U.S. government agency mortgage securities, are valued by pricing vendors who utilize matrix pricing which considers prepayment speed assumptions, attributes of the collateral, yield or price of bonds of comparable quality, coupon, maturity and type or by broker-supplied prices. Swaps are marked-to-market daily based on valuations from third party pricing vendors, registered derivatives clearing organizations (clearinghouses) or broker-supplied valuations. These pricing sources may utilize inputs such as interest rate curves, credit spread curves, default possibilities and recovery rates. When independent prices are unavailable or unreliable, debt securities and swaps may be valued utilizing pricing methodologies which consider similar factors that would be used by third party pricing vendors. Debt securities and swaps are generally categorized as Level 2 in the hierarchy but may be Level 3 depending on the circumstances.
Equity securities, including restricted securities, for which market quotations are readily available, are valued at the last reported sale price or official closing price as reported by a third party pricing vendor on the primary market or exchange on which they are traded and are categorized as Level 1 in the hierarchy. In the event there were no sales during the day or closing prices are not available, securities are valued at the last quoted bid price or may be valued using the last available price and are generally categorized as Level 2 in the hierarchy. For equity securities, including restricted securities, where observable inputs are limited, assumptions about market activity and risk are used and these securities may be categorized as Level 3 in the hierarchy.
Futures contracts are valued at the settlement price established each day by the board of trade or exchange on which they are traded and are categorized as Level 1 in the hierarchy. Options traded over-the-counter are valued using vendor or broker-supplied valuations and are categorized as Level 2 in the hierarchy. Investments in open-end mutual funds, including the Fidelity Central Funds, are valued at their closing net asset value (NAV) each business day and are categorized as Level 1 in the hierarchy.
Changes in valuation techniques may result in transfers in or out of an assigned level within the disclosure hierarchy. The aggregate value of investments by input level as of May 31, 2021 is included at the end of the Fund's Schedule of Investments.
Investment Transactions and Income. For financial reporting purposes, the Fund's investment holdings and NAV include trades executed through the end of the last business day of the period. The NAV per share for processing shareholder transactions is calculated as of the close of business of the New York Stock Exchange (NYSE), normally 4:00 p.m. Eastern time and includes trades executed through the end of the prior business day. Gains and losses on securities sold are determined on the basis of identified cost. Dividend income is recorded on the ex-dividend date, except for certain dividends from foreign securities where the ex-dividend date may have passed, which are recorded as soon as the Fund is informed of the ex-dividend date. Non-cash dividends included in dividend income, if any, are recorded at the fair market value of the securities received. Income and capital gain distributions from Fidelity Central Funds, if any, are recorded on the ex-dividend date. Income and capital gain distributions from any underlying mutual funds or exchange-traded funds (ETFs) are recorded on the ex-dividend date. Certain distributions received by the Fund represent a return of capital or capital gain. The Fund determines the components of these distributions subsequent to the ex-dividend date, based upon receipt of tax filings or other correspondence relating to the underlying investment. These distributions are recorded as a reduction of cost of investments and/or as a realized gain. Interest income is accrued as earned and includes coupon interest and amortization of premium and accretion of discount on debt securities as applicable. Debt obligations may be placed on non-accrual status and related interest income may be reduced by ceasing current accruals and writing off interest receivables when the collection of all or a portion of interest has become doubtful based on consistently applied procedures. A debt obligation is removed from non-accrual status when the issuer resumes interest payments or when collectability of interest is reasonably assured.
Expenses. Expenses directly attributable to a fund are charged to that fund. Expenses attributable to more than one fund are allocated among the respective funds on the basis of relative net assets or other appropriate methods. Expenses included in the accompanying financial statements reflect the expenses of that fund and do not include any expenses associated with any underlying mutual funds or exchange-traded funds. Although not included in a fund's expenses, a fund indirectly bears its proportionate share of these expenses through the net asset value of each underlying mutual fund or exchange-traded fund. Expense estimates are accrued in the period to which they relate and adjustments are made when actual amounts are known.
Deferred Trustee Compensation. Under a Deferred Compensation Plan (the Plan) for certain Funds, certain independent Trustees have elected to defer receipt of a portion of their annual compensation. Deferred amounts are invested in affiliated mutual funds, are marked-to-market and remain in a fund until distributed in accordance with the Plan. The investment of deferred amounts and the offsetting payable to the Trustees presented below are included in the accompanying Statement of Assets and Liabilities in other receivables and other payables and accrued expenses, as applicable.
| Strategic Advisers Fidelity Core Income Fund | $2,637 |
Income Tax Information and Distributions to Shareholders. Each year, the Fund intends to qualify as a regulated investment company under Subchapter M of the Internal Revenue Code, including distributing substantially all of its taxable income and realized gains. As a result, no provision for U.S. Federal income taxes is required. As of May 31, 2021, the Fund did not have any unrecognized tax benefits in the financial statements; nor is the Fund aware of any tax positions for which it is reasonably possible that the total amounts of unrecognized tax benefits will significantly change in the next twelve months. The Fund files a U.S. federal tax return, in addition to state and local tax returns as required. The Fund's federal income tax returns are subject to examination by the Internal Revenue Service (IRS) for a period of three fiscal years after they are filed. State and local tax returns may be subject to examination for an additional fiscal year depending on the jurisdiction.
Distributions are declared and recorded daily and paid monthly from net investment income. Distributions from realized gains, if any, are declared and recorded on the ex-dividend date. Income and capital gain distributions are determined in accordance with income tax regulations, which may differ from GAAP. In addition, the Fund claimed a portion of the payment made to redeeming shareholders as a distribution for income tax purposes.
Capital accounts within the financial statements are adjusted for permanent book-tax differences. These adjustments have no impact on net assets or the results of operations. Capital accounts are not adjusted for temporary book-tax differences which will reverse in a subsequent period.
Book-tax differences are primarily due to the short-term gain distributions from the underlying mutual funds or exchange-traded funds (ETFs), futures contracts, swaps, market discount, partnerships, deferred Trustee compensation and losses deferred due to wash sales, futures contracts and excise tax regulations.
As of period end, the cost and unrealized appreciation (depreciation) in securities, and derivatives if applicable, for federal income tax purposes were as follows:
| Gross unrealized appreciation | $988,063,085 |
| Gross unrealized depreciation | (342,918,343) |
| Net unrealized appreciation (depreciation) | $645,144,742 |
| Tax Cost | $38,410,473,870 |
The tax-based components of distributable earnings as of period end were as follows:
| Undistributed ordinary income | $6,621,288 |
| Net unrealized appreciation (depreciation) on securities and other investments | $640,513,713 |
The Fund intends to elect to defer to its next fiscal year $83,070,110 of capital losses recognized during the period November 1, 2020 to May 31, 2021.
The tax character of distributions paid was as follows:
| May 31, 2021 | May 31, 2020 | |
| Ordinary Income | $1,226,101,021 | $ 870,231,562 |
| Long-term Capital Gains | 611,556,618 | – |
| Total | $1,837,657,639 | $ 870,231,562 |
Delayed Delivery Transactions and When-Issued Securities. During the period, certain Funds transacted in securities on a delayed delivery or when-issued basis. Payment and delivery may take place after the customary settlement period for that security. The price of the underlying securities and the date when the securities will be delivered and paid for are fixed at the time the transaction is negotiated. Securities purchased on a delayed delivery or when-issued basis are identified as such in the Schedule of Investments. Compensation for interest forgone in the purchase of a delayed delivery or when-issued debt security may be received. With respect to purchase commitments, each applicable Fund identifies securities as segregated in its records with a value at least equal to the amount of the commitment. Payables and receivables associated with the purchases and sales of delayed delivery securities having the same coupon, settlement date and broker are offset. Delayed delivery or when-issued securities that have been purchased from and sold to different brokers are reflected as both payables and receivables in the Statement of Assets and Liabilities under the caption "Delayed delivery", as applicable. Losses may arise due to changes in the value of the underlying securities or if the counterparty does not perform under the contract's terms, or if the issuer does not issue the securities due to political, economic, or other factors.
To-Be-Announced (TBA) Securities and Mortgage Dollar Rolls. TBA securities involve buying or selling mortgage-backed securities (MBS) on a forward commitment basis. A TBA transaction typically does not designate the actual security to be delivered and only includes an approximate principal amount; however delivered securities must meet specified terms defined by industry guidelines, including issuer, rate and current principal amount outstanding on underlying mortgage pools. Funds may enter into a TBA transaction with the intent to take possession of or deliver the underlying MBS, or a fund may elect to extend the settlement by entering into either a mortgage or reverse mortgage dollar roll. Mortgage dollar rolls are transactions where a fund sells TBA securities and simultaneously agrees to repurchase MBS on a later date at a lower price and with the same counterparty. Reverse mortgage dollar rolls involve the purchase and simultaneous agreement to sell TBA securities on a later date at a lower price. Transactions in mortgage dollar rolls and reverse mortgage dollar rolls are accounted for as purchases and sales and may result in an increase to a fund's portfolio turnover rate.
Purchases and sales of TBA securities involve risks similar to those discussed above for delayed delivery and when-issued securities. Also, if the counterparty in a mortgage dollar roll or a reverse mortgage dollar roll transaction files for bankruptcy or becomes insolvent, a fund's right to repurchase or sell securities may be limited. Additionally, when a fund sells TBA securities without already owning or having the right to obtain the deliverable securities (an uncovered forward commitment to sell), it incurs a risk of loss because it could have to purchase the securities at a price that is higher than the price at which it sold them. A fund may be unable to purchase the deliverable securities if the corresponding market is illiquid.
TBA securities subject to a forward commitment to sell at period end are included at the end of the Schedule of Investments under the caption "TBA Sale Commitments." The proceeds and value of these commitments are reflected in the Statement of Assets and Liabilities as "Receivable for TBA sale commitments" and "TBA sale commitments, at value," respectively.
Restricted Securities (including Private Placements). Funds may invest in securities that are subject to legal or contractual restrictions on resale. These securities generally may be resold in transactions exempt from registration or to the public if the securities are registered. Disposal of these securities may involve time-consuming negotiations and expense, and prompt sale at an acceptable price may be difficult. Information regarding restricted securities held at period end is included at the end of the Schedule of Investments, if applicable.
3. Derivative Instruments.
Risk Exposures and the Use of Derivative Instruments. The Fund's investment objective allows the Fund to enter into various types of derivative contracts, including futures contracts, options and swaps. Derivatives are investments whose value is primarily derived from underlying assets, indices or reference rates and may be transacted on an exchange or over-the-counter (OTC). Derivatives may involve a future commitment to buy or sell a specified asset based on specified terms, to exchange future cash flows at periodic intervals based on a notional principal amount, or for one party to make one or more payments upon the occurrence of specified events in exchange for periodic payments from the other party.
The Fund used derivatives to increase returns, to gain exposure to certain types of assets and to manage exposure to certain risks as defined below. The success of any strategy involving derivatives depends on analysis of numerous economic factors, and if the strategies for investment do not work as intended, the Fund may not achieve its objectives.
The Fund's use of derivatives increased or decreased its exposure to the following risks:
| Credit Risk | Credit risk relates to the ability of the issuer of a financial instrument to make further principal or interest payments on an obligation or commitment that it has to the Fund. |
| Interest Rate Risk | Interest rate risk relates to the fluctuations in the value of interest-bearing securities due to changes in the prevailing levels of market interest rates. |
The Fund is also exposed to additional risks from investing in derivatives, such as liquidity risk and counterparty credit risk. Liquidity risk is the risk that the Fund will be unable to close out the derivative in the open market in a timely manner. Counterparty credit risk is the risk that the counterparty will not be able to fulfill its obligation to the Fund. Derivative counterparty credit risk is managed through formal evaluation of the creditworthiness of all potential counterparties. On certain OTC derivatives such as options and bi-lateral swaps, the Fund attempts to reduce its exposure to counterparty credit risk by entering into an International Swaps and Derivatives Association, Inc. (ISDA) Master Agreement with each of its counterparties. The ISDA Master Agreement gives the Fund the right to terminate all transactions traded under such agreement upon the deterioration in the credit quality of the counterparty beyond specified levels. The ISDA Master Agreement gives each party the right, upon an event of default by the other party or a termination of the agreement, to close out all transactions traded under such agreement and to net amounts owed under each transaction to one net payable by one party to the other. To mitigate counterparty credit risk on bi-lateral OTC derivatives, the Fund receives collateral in the form of cash or securities once the Fund's net unrealized appreciation on outstanding derivative contracts under an ISDA Master Agreement exceeds certain applicable thresholds, subject to certain minimum transfer provisions. The collateral received is held in segregated accounts with the Fund's custodian bank in accordance with the collateral agreements entered into between the Fund, the counterparty and the Fund's custodian bank. The Fund could experience delays and costs in gaining access to the collateral even though it is held by the Fund's custodian bank. The Fund's maximum risk of loss from counterparty credit risk related to bi-lateral OTC derivatives is generally the aggregate unrealized appreciation and unpaid counterparty payments in excess of any collateral pledged by the counterparty to the Fund. For OTC written options with upfront premiums received, the Fund is obligated to perform and therefore does not have counterparty risk. For OTC written options with premiums to be received at a future date, the maximum risk of loss from counterparty credit risk is the amount of the premium in excess of any collateral pledged by the counterparty. The Fund may be required to pledge collateral for the benefit of the counterparties on bi-lateral OTC derivatives in an amount not less than each counterparty's unrealized appreciation on outstanding derivative contracts, subject to certain minimum transfer provisions, and any such pledged collateral is identified in the Schedule of Investments. Exchange-traded futures contracts are not covered by the ISDA Master Agreement; however counterparty credit risk related to exchange-traded futures contracts may be mitigated by the protection provided by the exchange on which they trade. Counterparty credit risk related to centrally cleared OTC swaps may be mitigated by the protection provided by the clearinghouse. A summary of the Fund's derivatives inclusive of potential netting arrangements is presented at the end of the Schedule of Investments.
Investing in derivatives may involve greater risks than investing in the underlying assets directly and, to varying degrees, may involve risk of loss in excess of any initial investment and collateral received and amounts recognized in the Statement of Assets and Liabilities. In addition, there may be the risk that the change in value of the derivative contract does not correspond to the change in value of the underlying instrument.
Net Realized Gain (Loss) and Change in Net Unrealized Appreciation (Depreciation) on Derivatives. The table below, which reflects the impacts of derivatives on the financial performance of the Fund, summarizes the net realized gain (loss) and change in net unrealized appreciation (depreciation) for derivatives during the period as presented in the Statement of Operations.
| Primary Risk Exposure / Derivative Type | Net Realized Gain (Loss) | Change in Net Unrealized Appreciation (Depreciation) |
| Credit Risk | ||
| Swaps | $(2,132,295) | $712,982 |
| Total Credit Risk | $(2,132,295) | $712,982 |
| Interest Rate Risk | ||
| Futures Contracts | $(7,533,443) | $1,698,233 |
| Purchased Options | (732,336) | (1,235,955) |
| Swaps | 1,722,250 | 564,549 |
| Written Options | (124,920) | (1,607,607) |
| Total Interest Rate Risk | (6,668,449) | (580,780) |
| Totals | $(8,800,744) | $132,202 |
A summary of the value of derivatives by primary risk exposure as of period end is included at the end of the Schedule of Investments.
Futures Contracts. A futures contract is an agreement between two parties to buy or sell a specified underlying instrument for a fixed price at a specified future date. The Fund used futures contracts to manage its exposure to the bond market and fluctuations in interest rates.
Upon entering into a futures contract, a fund is required to deposit either cash or securities (initial margin) with a clearing broker in an amount equal to a certain percentage of the face value of the contract. Futures contracts are marked-to-market daily and subsequent daily payments (variation margin) are made or received by a fund depending on the daily fluctuations in the value of the futures contracts and are recorded as unrealized appreciation or (depreciation). This receivable and/or payable, if any, is included in daily variation margin on futures contracts in the Statement of Assets and Liabilities. Realized gain or (loss) is recorded upon the expiration or closing of a futures contract. The net realized gain (loss) and change in net unrealized appreciation (depreciation) on futures contracts during the period is presented in the Statement of Operations.
Any open futures contracts at period end are presented in the Schedule of Investments under the caption "Futures Contracts". The notional amount at value reflects each contract's exposure to the underlying instrument or index at period end and is representative of volume of activity during the period. Securities deposited to meet initial margin requirements are identified in the Schedule of Investments.
Options. Options give the purchaser the right, but not the obligation, to buy (call) or sell (put) an underlying security or financial instrument at an agreed exercise or strike price between or on certain dates. Options obligate the seller (writer) to buy (put) or sell (call) an underlying instrument at the exercise or strike price or cash settle an underlying derivative instrument if the holder exercises the option on or before the expiration date. The Fund uses OTC options, such as swaptions, which are options where the underlying instrument is a swap, to manage its exposure to fluctuations in interest rates.
Upon entering into an options contract, a fund will pay or receive a premium. Premiums paid on purchased options are reflected as cost of investments and premiums received on written options are reflected as a liability on the Statement of Assets and Liabilities. Certain options may be purchased or written with premiums to be paid or received on a future date. Options are valued daily and any unrealized appreciation (depreciation) is reflected on the Statement of Assets and Liabilities. When an option is exercised, the cost or proceeds of the underlying instrument purchased or sold is adjusted by the amount of the premium. When an option is closed the Fund will realize a gain or loss depending on whether the proceeds or amount paid for the closing sale transaction is greater or less than the premium received or paid. When an option expires, gains and losses are realized to the extent of premiums received and paid, respectively. The net realized and unrealized gains (losses) on purchased options are included in the Statement of Operations in net realized gain (loss) and change in net unrealized appreciation (depreciation) on investment securities. The net realized gain (loss) and change in net unrealized appreciation (depreciation) on written options are presented in the Statement of Operations.
Any open options at period end are presented in the Schedule of Investments under the captions "Purchased Options," "Purchased Swaptions," "Written Options" and "Written Swaptions," as applicable, and are representative of volume of activity during the period.
Writing puts and buying calls tend to increase exposure to the underlying instrument while buying puts and writing calls tend to decrease exposure to the underlying instrument. For purchased options, risk of loss is limited to the premium paid, and for written options, risk of loss is the change in value in excess of the premium received.
Swaps. A swap is a contract between two parties to exchange future cash flows at periodic intervals based on a notional principal amount. A bi-lateral OTC swap is a transaction between a fund and a dealer counterparty where cash flows are exchanged between the two parties for the life of the swap. A centrally cleared OTC swap is a transaction executed between a fund and a dealer counterparty, then cleared by a futures commission merchant (FCM) through a clearinghouse. Once cleared, the clearinghouse serves as a central counterparty, with whom a fund exchanges cash flows for the life of the transaction, similar to transactions in futures contracts.
Bi-lateral OTC swaps are marked-to-market daily and changes in value are reflected in the Statement of Assets and Liabilities in the bi-lateral OTC swaps at value line items. Any upfront premiums paid or received upon entering a bi-lateral OTC swap to compensate for differences between stated terms of the swap and prevailing market conditions (e.g. credit spreads, interest rates or other factors) are recorded in net unrealized appreciation (depreciation) in the Statement of Assets and Liabilities and amortized to realized gain or (loss) ratably over the term of the swap. Any unamortized upfront premiums are presented in the Schedule of Investments.
Centrally cleared OTC swaps require a fund to deposit either cash or securities (initial margin) with the FCM, at the instruction of and for the benefit of the clearinghouse. Securities deposited to meet initial margin requirements are identified in the Schedule of Investments. Centrally cleared OTC swaps are marked-to-market daily and subsequent payments (variation margin) are made or received depending on the daily fluctuations in the value of the swaps and are recorded as unrealized appreciation or (depreciation). These daily payments, if any, are included in receivable or payable for daily variation margin on centrally cleared OTC swaps in the Statement of Assets and Liabilities. Any premiums for centrally cleared OTC swaps are recorded periodically throughout the term of the swap to variation margin and included in unrealized appreciation (depreciation) in the Statement of Assets and Liabilities. Any premiums are recognized as realized gain (loss) upon termination or maturity of the swap.
For both bi-lateral and centrally cleared OTC swaps, payments are exchanged at specified intervals, accrued daily commencing with the effective date of the contract and recorded as realized gain or (loss). Some swaps may be terminated prior to the effective date and realize a gain or loss upon termination. The net realized gain (loss) and change in net unrealized appreciation (depreciation) on swaps during the period is presented in the Statement of Operations.
Any open swaps at period end are included in the Schedule of Investments under the caption "Swaps" and are representative of volume of activity during the period.
Credit Default Swaps. Credit default swaps enable the Fund to buy or sell protection against specified credit events on a single-name issuer or a traded credit index. Under the terms of a credit default swap the buyer of protection (buyer) receives credit protection in exchange for making periodic payments to the seller of protection (seller) based on a fixed percentage applied to a notional principal amount. In return for these payments, the seller will be required to make a payment upon the occurrence of one or more specified credit events. The Fund enters into credit default swaps as a seller to gain credit exposure to an issuer and/or as a buyer to obtain a measure of protection against defaults of an issuer. Periodic payments are made over the life of the contract by the buyer provided that no credit event occurs.
For credit default swaps on most corporate and sovereign issuers, credit events include bankruptcy, failure to pay or repudiation/moratorium. For credit default swaps on corporate or sovereign issuers, the obligation that may be put to the seller is not limited to the specific reference obligation described in the Schedule of Investments. For credit default swaps on asset-backed securities, a credit event may be triggered by events such as failure to pay principal, maturity extension, rating downgrade or write-down. For credit default swaps on asset-backed securities, the reference obligation described represents the security that may be put to the seller. For credit default swaps on a traded credit index, a specified credit event may affect all or individual underlying securities included in the index.
As a seller, if an underlying credit event occurs, the Fund will pay a net settlement amount of cash equal to the notional amount of the swap less the recovery value of the reference obligation or underlying securities comprising an index. Only in the event of the industry's inability to value the underlying asset will the Fund be required to take delivery of the reference obligation or underlying securities comprising an index and pay an amount equal to the notional amount of the swap.
As a buyer, if an underlying credit event occurs, the Fund will receive a net settlement amount of cash equal to the notional amount of the swap less the recovery value of the reference obligation or underlying securities comprising an index. Only in the event of the industry's inability to value the underlying asset will the Fund be required to deliver the reference obligation or underlying securities comprising an index in exchange for payment of an amount equal to the notional amount of the swap.
Typically, the value of each credit default swap and credit rating disclosed for each reference obligation in the Schedule of Investments, where the Fund is the seller, can be used as measures of the current payment/performance risk of the swap. As the value of the swap changes as a positive or negative percentage of the total notional amount, the payment/performance risk may decrease or increase, respectively. In addition to these measures, the investment adviser monitors a variety of factors including cash flow assumptions, market activity and market sentiment as part of its ongoing process of assessing payment/performance risk.
Interest Rate Swaps. Interest rate swaps are agreements between counterparties to exchange cash flows, one based on a fixed rate, and the other on a floating rate. The Fund entered into interest rate swaps to manage its exposure to interest rate changes. Changes in interest rates can have an effect on both the value of bond holdings as well as the amount of interest income earned. In general, the value of bonds can fall when interest rates rise and can rise when interest rates fall.
4. Purchases and Sales of Investments.
Purchases and sales of securities, other than short-term securities and U.S. government securities are noted in the table below.
| Purchases ($) | Sales ($) | |
| Strategic Advisers Fidelity Core Income Fund | 46,094,916,075 | 38,393,591,923 |
5. Fees and Other Transactions with Affiliates.
Management Fee. Strategic Advisers (the investment adviser) provides the Fund with investment management related services. For these services, the Fund pays a monthly management fee to the investment adviser. The management fee is calculated by adding the annual management fee rate of .25% of the Fund's average net assets throughout the month to the aggregate of the fee rates, payable monthly by the investment adviser, to the Fund's sub-advisers. The Fund's maximum aggregate management fee will not exceed .60% of the Fund's average net assets. For the reporting period, the total annual management fee rate was .30% of the Fund's average net assets.
During the period, the investment adviser waived a portion of its management fee as described in the Expense Reductions note.
Sub-Adviser. FIAM LLC (an affiliate of the investment adviser) served as a sub-adviser for the Fund during the period. Sub-advisers provide discretionary investment advisory services for their allocated portion of the Fund's assets and are paid as described in the Management Fee note.
Brokerage Commissions. A portion of portfolio transactions were placed with brokerage firms which are affiliates of the investment adviser. Brokerage commissions are included in net realized gain (loss) and change in net unrealized appreciation (depreciation) in the Statement of Operations. The commissions paid to these affiliated firms were as follows:
| Amount | |
| Strategic Advisers Fidelity Core Income Fund | $21 |
Interfund Trades. Funds may purchase from or sell securities to other funds affiliated with each sub-adviser under procedures adopted by the Board. The procedures have been designed to ensure these interfund trades are executed in accordance with Rule 17a-7 of the 1940 Act. Any interfund trades are included within the respective purchases and sales amounts shown in the Purchases and Sales of Investments note.
Prior Fiscal Year Reallocation of Underlying Fund Investments. During the prior period, the investment adviser reallocated investments of the Fund. This involved a taxable redemption of the Fund's interest in Fidelity Specialized High Income Central Fund. The Fund redeemed 2,350,309 shares of Fidelity Specialized High Income Central Fund in exchange for investments, including accrued interest, and cash with a value of $238,156,796. The Fund realized gains of $9,525,452 on the Fund's redemptions of Fidelity Specialized High Income Central Fund shares. The Fund recognized net gains on the exchanges for federal income tax purposes.
6. Investments in Fidelity Central Funds.
Funds may invest in Fidelity Central Funds, which are open-end investment companies generally available only to other investment companies and accounts managed by the investment adviser and its affiliates. The Schedule of Investments lists any Fidelity Central Funds held as an investment as of period end, but does not include the underlying holdings of each Fidelity Central Fund. An investing fund indirectly bears its proportionate share of the expenses of the underlying Fidelity Central Funds.
Based on its investment objective, each Fidelity Central Fund may invest or participate in various investment vehicles or strategies that are similar to those of the investing fund. These strategies are consistent with the investment objectives of the investing fund and may involve certain economic risks which may cause a decline in value of each of the Fidelity Central Funds and thus a decline in the value of the investing fund.
A complete unaudited list of holdings for each Fidelity Central Fund is available upon request or at the Securities and Exchange Commission website at www.sec.gov. In addition, the financial statements of the Fidelity Central Funds, which are not covered by the Report of Independent Registered Public Accounting Firm, are available on the Securities and Exchange Commission website or upon request.
| Fidelity Central Fund | Investment Manager | Investment Objective | Investment Practices | Expense Ratio(a) |
| Fidelity Money Market Central Funds | Fidelity Management & Research Company LLC (FMR) | Each fund seeks to obtain a high level of current income consistent with the preservation of capital and liquidity. | Short-term Investments | Less than .005% to .01% |
(a) Expenses expressed as a percentage of average net assets and are as of each underlying Central Fund's most recent annual or semi-annual shareholder report.
7. Committed Line of Credit.
Certain Funds participate with other funds managed by the investment adviser or an affiliate in a $4.25 billion credit facility (the "line of credit") to be utilized for temporary or emergency purposes to fund shareholder redemptions or for other short-term liquidity purposes. The participating funds have agreed to pay commitment fees on their pro-rata portion of the line of credit, which are reflected in Miscellaneous expense on the Statement of Operations, and are listed below. During the period, there were no borrowings on this line of credit.
| Amount | |
| Strategic Advisers Fidelity Core Income Fund | $58,030 |
8. Expense Reductions.
The investment adviser has contractually agreed to waive the Fund's management fee in an amount equal to .25% of the Fund's average net assets until September 30, 2023. During the period, this waiver reduced the Fund's management fee by $ 72,923,967.
Commissions paid to certain brokers with whom the investment adviser, or its affiliates, places trades on behalf of the Fund include an amount in addition to trade execution, which may be rebated back to the Fund to offset expenses. This amount totaled $29 for the period.
9. Other.
Fund's organizational documents provide former and current trustees and officers with a limited indemnification against liabilities arising in connection with the performance of their duties to the fund. In the normal course of business, the fund may also enter into contracts that provide general indemnifications. The fund's maximum exposure under these arrangements is unknown as this would be dependent on future claims that may be made against the fund. The risk of material loss from such claims is considered remote.
Funds do not invest in underlying mutual funds for the purpose of exercising management or control; however, investments by funds within the principal investment strategies may represent a significant portion of the underlying mutual fund's net assets. At the end of the period, certain Funds were the owners of record of 10% or more of the total outstanding shares of the following underlying mutual funds as shown below.
| Fund | Strategic Advisers Fidelity Core Income Fund |
| Fidelity Corporate Bond Fund | 25% |
| Fidelity Global Credit Fund | 25% |
| Fidelity Intermediate Bond Fund | 15% |
| Fidelity New Markets Income Fund | 12% |
| Fidelity Real Estate Income Fund | 10% |
| Fidelity SAI Long-Term Treasury Bond Index Fund | 100% |
| Fidelity SAI Total Bond Fund | 63% |
| Fidelity SAI U.S. Treasury Bond Index Fund | 21% |
| Fidelity Sustainability Bond Index Fund | 11% |
10. Coronavirus (COVID-19) Pandemic.
An outbreak of COVID-19 first detected in China during December 2019 has since spread globally and was declared a pandemic by the World Health Organization during March 2020. Developments that disrupt global economies and financial markets, such as the COVID-19 pandemic, may magnify factors that affect the Fund's performance.
Report of Independent Registered Public Accounting Firm
To the Board of Trustees of Fidelity Rutland Square Trust II and Shareholders of Strategic Advisers Fidelity Core Income Fund
Opinion on the Financial Statements
We have audited the accompanying statement of assets and liabilities, including the schedule of investments, of Strategic Advisers Fidelity Core Income Fund (one of the funds constituting Fidelity Rutland Square Trust II, referred to hereafter as the “Fund”) as of May 31, 2021, the related statement of operations for the year ended May 31, 2021, the statement of changes in net assets for each of the two years in the period ended May 31, 2021, including the related notes, and the financial highlights for each of the two years in the period ended May 31, 2021 and for the period October 16, 2018 (commencement of operations) to May 31, 2019 (collectively referred to as the “financial statements”). In our opinion, the financial statements present fairly, in all material respects, the financial position of the Fund as of May 31, 2021, the results of its operations for the year then ended, the changes in its net assets for each of the two years in the period ended May 31, 2021 and the financial highlights for each of the two years in the period ended May 31, 2021 and for the period October 16, 2018 (commencement of operations) to May 31, 2019 in conformity with accounting principles generally accepted in the United States of America.
Basis for Opinion
These financial statements are the responsibility of the Fund’s management. Our responsibility is to express an opinion on the Fund’s financial statements based on our audits. We are a public accounting firm registered with the Public Company Accounting Oversight Board (United States) (PCAOB) and are required to be independent with respect to the Fund in accordance with the U.S. federal securities laws and the applicable rules and regulations of the Securities and Exchange Commission and the PCAOB.
We conducted our audits of these financial statements in accordance with the standards of the PCAOB. Those standards require that we plan and perform the audit to obtain reasonable assurance about whether the financial statements are free of material misstatement, whether due to error or fraud.
Our audits included performing procedures to assess the risks of material misstatement of the financial statements, whether due to error or fraud, and performing procedures that respond to those risks. Such procedures included examining, on a test basis, evidence regarding the amounts and disclosures in the financial statements. Our audits also included evaluating the accounting principles used and significant estimates made by management, as well as evaluating the overall presentation of the financial statements. Our procedures included confirmation of securities owned as of May 31, 2021 by correspondence with the custodian, issuers of privately offered securities and brokers; when replies were not received from brokers, we performed other auditing procedures. We believe that our audits provide a reasonable basis for our opinion.
/s/ PricewaterhouseCoopers LLP
Boston, Massachusetts
July 13, 2021
We have served as the auditor of one or more investment companies in the Fidelity group of funds since 1932.
Trustees and Officers
The Trustees, Members of the Advisory Board (if any), and officers of the trust and fund, as applicable, are listed below. The Board of Trustees governs the fund and is responsible for protecting the interests of shareholders. The Trustees are experienced executives who meet periodically throughout the year to oversee the fund's activities, review contractual arrangements with companies that provide services to the fund, oversee management of the risks associated with such activities and contractual arrangements, and review the fund's performance. If the interests of the fund and an underlying Fidelity® fund were to diverge, a conflict of interest could arise and affect how the Trustees and Members of the Advisory Board fulfill their fiduciary duties to the affected funds. Strategic Advisers has structured the fund to avoid these potential conflicts, although there may be situations where a conflict of interest is unavoidable. In such instances, Strategic Advisers, the Trustees, and Members of the Advisory Board would take reasonable steps to minimize and, if possible, eliminate the conflict. Each of the Trustees oversees 12 funds.
The Trustees hold office without limit in time except that (a) any Trustee may resign; (b) any Trustee may be removed by written instrument, signed by at least two-thirds of the number of Trustees prior to such removal; (c) any Trustee who requests to be retired or who has become incapacitated by illness or injury may be retired by written instrument signed by a majority of the other Trustees; and (d) any Trustee may be removed at any special meeting of shareholders by a two-thirds vote of the outstanding voting securities of the trust. Each Independent Trustee shall retire not later than the last day of the calendar year in which his or her 75th birthday occurs. The Independent Trustees may waive this mandatory retirement age policy with respect to individual Trustees. Officers and Advisory Board Members hold office without limit in time, except that any officer or Advisory Board Member may resign or may be removed by a vote of a majority of the Trustees at any regular meeting or any special meeting of the Trustees. Except as indicated, each individual has held the office shown or other offices in the same company for the past five years.
Each Trustee who is not an interested person (as defined in the 1940 Act) of the trust and the fund is referred to herein as an Independent Trustee.
The fund’s Statement of Additional Information (SAI) includes more information about the Trustees. To request a free copy, call Fidelity at 1-800-544-3455.
Experience, Skills, Attributes, and Qualifications of the Trustees. The Governance and Nominating Committee has adopted a statement of policy that describes the experience, qualifications, attributes, and skills that are necessary and desirable for potential Independent Trustee candidates (Statement of Policy). The Board believes that each Trustee satisfied at the time he or she was initially elected or appointed a Trustee, and continues to satisfy, the standards contemplated by the Statement of Policy. The Governance and Nominating Committee may also engage professional search firms to help identify potential Independent Trustee candidates with experience, qualifications, attributes, and skills consistent with the Statement of Policy. Additional criteria based on the composition and skills of the current Independent Trustees, as well as experience or skills that may be appropriate in light of future changes to board composition, business conditions, and regulatory or other developments, may be considered by the professional search firms and the Governance and Nominating Committee. In addition, the Board takes into account the Trustees' commitment and participation in Board and committee meetings, as well as their leadership of standing and ad hoc committees throughout their tenure.
In determining that a particular Trustee was and continues to be qualified to serve as a Trustee, the Board has considered a variety of criteria, none of which, in isolation, was controlling. The Board believes that, collectively, the Trustees have balanced and diverse experience, qualifications, attributes, and skills, which allow the Board to operate effectively in governing the fund and protecting the interests of shareholders. Information about the specific experience, skills, attributes, and qualifications of each Trustee, which in each case led to the Board's conclusion that the Trustee should serve (or continue to serve) as a trustee of the fund, is provided below.
Board Structure and Oversight Function. Robert A. Lawrence is an interested person and currently serves as Chairman. The Trustees have determined that an interested Chairman is appropriate and benefits shareholders because an interested Chairman has a personal and professional stake in the quality and continuity of services provided to the fund. Independent Trustees exercise their informed business judgment to appoint an individual of their choosing to serve as Chairman, regardless of whether the Trustee happens to be independent or a member of management. The Independent Trustees have determined that they can act independently and effectively without having an Independent Trustee serve as Chairman and that a key structural component for assuring that they are in a position to do so is for the Independent Trustees to constitute a substantial majority for the Board. The Independent Trustees also regularly meet in executive session. Mary C. Farrell serves as the lead Independent Trustee and as such (i) acts as a liaison between the Independent Trustees and management with respect to matters important to the Independent Trustees and (ii) with management prepares agendas for Board meetings.
Fidelity® funds are overseen by different Boards of Trustees. The fund's Board oversees asset allocation funds. Other Boards oversee Fidelity's investment-grade bond, money market, and asset allocation funds, and Fidelity's equity and high income funds. The fund may invest in Fidelity® funds overseen by such other Boards. The use of separate Boards, each with its own committee structure, allows the Trustees of each group of Fidelity® funds to focus on the unique issues of the funds they oversee, including common research, investment, and operational issues.
The Trustees primarily operate as a full Board, but also operate in committees, to facilitate the timely and efficient consideration of all matters of importance to the Trustees, the fund, and fund shareholders and to facilitate compliance with legal and regulatory requirements and oversight of the fund's activities and associated risks. The Board has charged Strategic Advisers and its affiliates with (i) identifying events or circumstances the occurrence of which could have demonstrably adverse effects on the fund's business and/or reputation; (ii) implementing processes and controls to lessen the possibility that such events or circumstances occur or to mitigate the effects of such events or circumstances if they do occur; and (iii) creating and maintaining a system designed to evaluate continuously business and market conditions in order to facilitate the identification and implementation processes described in (i) and (ii) above. Because the day-to-day operations and activities of the fund are carried out by or through Strategic Advisers, its affiliates and other service providers, the fund's exposure to risks is mitigated but not eliminated by the processes overseen by the Trustees. Board oversight of different aspects of the fund's activities is exercised primarily through the full Board, but also through the Audit and Compliance Committee. Appropriate personnel, including but not limited to the fund's Chief Compliance Officer (CCO), FMR's internal auditor, the independent accountants, the fund's Treasurer and portfolio management personnel, make periodic reports to the Board's committees, as appropriate. The responsibilities of each standing committee, including their oversight responsibilities, are described further under "Standing Committees of the Trustees."
Interested Trustees*:
Correspondence intended for a Trustee who is an interested person may be sent to Fidelity Investments, 245 Summer Street, Boston, Massachusetts 02210.
Name, Year of Birth; Principal Occupations and Other Relevant Experience+
Robert A. Lawrence (1952)
Year of Election or Appointment: 2016
Trustee
Chairman of the Board of Trustees
Mr. Lawrence also serves as Trustee of other funds. Previously, Mr. Lawrence served as a Member of the Advisory Board of certain funds. Prior to his retirement in 2008, Mr. Lawrence served as Vice President of certain Fidelity® funds (2006-2008), Senior Vice President, Head of High Income Division of Fidelity Management & Research Company (investment adviser firm, 2006-2008), and President of Fidelity Strategic Investments (investment adviser firm, 2002-2005).
Charles S. Morrison (1960)
Year of Election or Appointment: 2020
Trustee
Mr. Morrison also serves as Trustee of other funds. Previously, Mr. Morrison served as President (2017-2018) and Director (2014-2018) of Fidelity SelectCo, LLC (investment adviser firm), President of Fidelity Management & Research Company (FMR) (investment adviser firm, 2016-2018), a Director of Fidelity Investments Money Management, Inc. (investment adviser firm, 2014-2018), President, Asset Management (2014-2018), Trustee of the Fidelity Equity and High Income Funds (283 funds as of December 2018) (2014-2018), and was an employee of Fidelity Investments. Mr. Morrison also previously served as Vice President of Fidelity's Fixed Income and Asset Allocation Funds (2012-2014), President, Fixed Income (2011-2014), Vice President of Fidelity's Money Market Funds (2005-2009), President, Money Market Group Leader of FMR (2009), and Senior Vice President, Money Market Group of FMR (2004-2009). Mr. Morrison also served as Vice President of Fidelity's Bond Funds (2002-2005), certain Balanced Funds (2002-2005), and certain Asset Allocation Funds (2002-2007), and as Senior Vice President (2002-2005) of Fidelity's Bond Division.
* Determined to be an "Interested Trustee" by virtue of, among other things, his or her affiliation with the trust or various entities under common control with Strategic Advisers.
+ The information includes the Trustee's principal occupation during the last five years and other information relating to the experience, attributes, and skills relevant to the Trustee's qualifications to serve as a Trustee, which led to the conclusion that the Trustee should serve as a Trustee for the fund.
Independent Trustees:
Correspondence intended for an Independent Trustee may be sent to Fidelity Investments, P.O. Box 55235, Boston, Massachusetts 02205-5235.
Name, Year of Birth; Principal Occupations and Other Relevant Experience+
Peter C. Aldrich (1944)
Year of Election or Appointment: 2006
Trustee
Mr. Aldrich also serves as Trustee of other funds. Mr. Aldrich is a Director of the U.S. Core Property Fund (and, previously, other funds) of BlackRock Realty Group (2006-present). Previously, Mr. Aldrich served as a Managing Member of Poseidon, LLC (foreign private investment, 1998-2004), and Chairman and Managing Member of AEGIS, LLC (foreign private investment, 1997-2004). Mr. Aldrich previously was a founder, Chief Executive Officer, and Chairman of AEW Capital Management, L.P. (then “Aldrich, Eastman and Waltch, L.P.”). Mr. Aldrich also served as a Director of LivelyHood, Inc. (private corporation, 2013-2020), a Trustee for the Fidelity Rutland Square Trust (2005-2010), a Director of Zipcar, Inc. (car sharing services, 2001-2009) and as Faculty Chairman of The Research Council on Global Investment of The Conference Board (business and professional education non-profit, 1999-2004). Mr. Aldrich is a Member Emeritus of the Board of Directors of the National Bureau of Economic Research and the Board of Trustees of the Museum of Fine Arts Boston.
Mary C. Farrell (1949)
Year of Election or Appointment: 2013
Trustee
Ms. Farrell also serves as Trustee of other funds. Ms. Farrell is a Director of the W.R. Berkley Corporation (insurance provider) and President (2009-present) and Director (2006-present) of the Howard Gilman Foundation (charitable organization). Previously, Ms. Farrell was Managing Director and Chief Investment Strategist at UBS Wealth Management USA and Co-Head of UBS Wealth Management Investment Strategy & Research Group (2003-2005). Ms. Farrell also served as Investment Strategist at PaineWebber (1982-2000) and UBS PaineWebber (2000-2002). Ms. Farrell serves as Chairman of the Board of Trustees of Yale-New Haven Hospital and Vice Chairman of the Yale New Haven Health System Board and previously served as Trustee on the Board of Overseers of the New York University Stern School of Business.
Karen Kaplan (1960)
Year of Election or Appointment: 2006
Trustee
Ms. Kaplan also serves as Trustee of other funds. Ms. Kaplan is Chairman (2014-present) and Chief Executive Officer (2013-present) of Hill Holliday (advertising and specialized marketing). Ms. Kaplan is a Director of The Michaels Companies, Inc. (specialty retailer, 2015-present), Member of the Board of Governors of the Chief Executives’ Club of Boston (2010-present), Member of the Executive Committee of the Greater Boston Chamber of Commerce (2006-present), Advisory Board Member of the National Association of Corporate Directors Chapter (2012-present), Member of the Board of Trustees of the Post Office Square Trust (2012-present), Trustee of the Brigham and Women’s Hospital (2016-present), Overseer of the Boston Symphony Orchestra (2014-present), Member of the Board of Directors of The Advertising Council, Inc. (2016-present), Member of the Ron Burton Training Village Executive Board of Advisors (2018-present), Member of the Executive Committee of The Ad Council, Inc. (2019-present), and Member of the Board of Directors of The Ad Club of Boston (2020-present). Previously, Ms. Kaplan served as an Advisory Board Member of Fidelity Rutland Square Trust (2006-2010), a member of the Clinton Global Initiative (2010-2015), Director of DSM (dba Delta Dental and DentaQuest) (2004-2014), Formal Appointee of the 2015 Baker-Polito Economic Development Council, Director of Vera Bradley Inc. (designer of women’s accessories, 2012-2015), Member of the Board of Directors of the Massachusetts Conference for Women (2008-2015), Member of the Board of Directors of Jobs for Massachusetts (2012-2015), President of the Massachusetts Women’s Forum (2008-2010), Treasurer of the Massachusetts Women’s Forum (2002-2006), and Vice Chair of the Board of the Massachusetts Society for the Prevention of Cruelty to Children (2003-2010).
Christine Marcks (1955)
Year of Election or Appointment: 2020
Trustee
Ms. Marcks also serves as Trustee of other Funds. Prior to her retirement, Ms. Marcks served as Chief Executive Officer and President – Prudential Retirement (2007-2017) and Vice President for Rollover and Retirement Income Strategies (2005-2007), Prudential Financial, Inc. (financial services). Previously, Ms. Marcks served as a Member of the Advisory Board of certain Fidelity® funds (2019-2020), was Senior Vice President and Head of Financial Horizons (2002-2004) and Vice President, Strategic Marketing (2000-2002) of Voya Financial (formerly ING U.S.) (financial services), held numerous positions at Aetna Financial Services (financial services, 1987-2000) and served as an International Economist for the United States Department of the Treasury (1980-1987). Ms. Marcks also serves as a member of the Board of Trustees, Audit Committee and Benefits & Operations Committee of the YMCA Retirement Fund (2018-present), a non-profit organization providing retirement plan benefits to YMCA staff members, and as a member of the Board of Trustees of Assumption College (2019-present).
Heidi L. Steiger (1953)
Year of Election or Appointment: 2017
Trustee
Ms. Steiger also serves as Trustee of other funds. Ms. Steiger serves as Managing Partner of Topridge Associates, LLC (consulting, 2005-present) and a member of the Board of Directors (2013-present) and member of the Membership and Executive Committee (2017-present) of Business Executives for National Security (nonprofit). Previously, Ms. Steiger served as a member of the Board of Directors Chair of the Remuneration Committee of Imagine Intelligent Materials Limited (2019-2021) (technology company), a member of the Advisory Board of the joint degree program in Global Luxury Management at North Carolina State University (Raleigh, NC) and Skema (Paris) (2018-2021), a Non-Executive Director of CrowdBureau Corporation (financial technology company and index provider, 2018-2021), a member of the Global Advisory Board and Of Counsel to Signum Global Advisors (international policy and strategy, 2018-2020), Eastern Region President of The Private Client Reserve of U.S. Bancorp (banking and financial services, 2010-2015), Advisory Director of Berkshire Capital Securities, LLC (financial services, 2009-2010), President and Senior Advisor of Lowenhaupt Global Advisors, LLC (financial services, 2005-2007), and President and Contributing Editor of Worth Magazine (2004-2005) and held a variety of positions at Neuberger Berman Group, LLC (financial services, 1986-2004), including Partner and Executive Vice President and Global Head of Private Asset Management at Neuberger Berman (1999-2004). Ms. Steiger also served as a member of the Board of Directors of Nuclear Electric Insurance Ltd (insurer of nuclear utilities, 2006-2017), a member of the Board of Trustees and Audit Committee of the Eaton Vance Funds (2007-2010), a member of the Board of Directors of Aviva USA (formerly AmerUs) (insurance, 2004-2014), and a member of the Board of Trustees and Audit Committee and Chair of the Investment Committee of CIFG (financial guaranty insurance, 2009-2012), and a member of the Board of Directors of Kin Group Plc (formerly, Fitbug Holdings) (health and technology, 2016-2017).
+ The information includes the Trustee's principal occupation during the last five years and other information relating to the experience, attributes, and skills relevant to the Trustee's qualifications to serve as a Trustee, which led to the conclusion that the Trustee should serve as a Trustee for the fund.
Advisory Board Members and Officers:
Correspondence intended for a Member of the Advisory Board (if any) may be sent to Fidelity Investments, P.O. Box 55235, Boston, Massachusetts 02205-5235. Correspondence intended for an officer or Howard E. Cox, Jr. may be sent to Fidelity Investments, 245 Summer Street, Boston, Massachusetts 02210. Officers appear below in alphabetical order.
Name, Year of Birth; Principal Occupation
Ralph F. Cox (1932)
Year of Election or Appointment: 2020
Member of the Advisory Board
Mr. Cox also serves as a Member of the Advisory Board of other funds. Mr. Cox is President of RABAR Enterprises (management consulting for the petroleum industry). Mr. Cox is a Director of Abraxas Petroleum (exploration and production, 1999-present). Mr. Cox is a member of the Advisory Boards of the Business and Engineering Schools of Texas A&M University and the Engineering School of University of Texas at Austin. Previously, Mr. Cox served as Trustee of other funds (2006-2020), a Trustee for the Fidelity Rutland Square Trust (2005-2010) and as an Advisory Director of CH2M Hill Companies (engineering, 1981-2011). Mr. Ralph F. Cox and Mr. Howard E. Cox, Jr. are not related.
Howard E. Cox, Jr. (1944)
Year of Election or Appointment: 2009
Member of the Advisory Board
Mr. Cox also serves as a Member of the Advisory Board of other funds. Mr. Cox is a Partner of Greylock (venture capital, 1971-present) and a Director of Stryker Corporation (medical products and services, 1974-present). Previously, Mr. Cox served as an Advisory Board Member of Fidelity Rutland Square Trust (2006-2010). Mr. Cox also serves as a Member of the Secretary of Defense's Business Board of Directors (2008-present), a Director of Business Executives for National Security (1997-present), a Director of the Brookings Institution (2010-present), a Director of the World Economic Forum’s Young Global Leaders Foundation (2009-present), and is a Member of the Harvard Medical School Board of Fellows (2002-present). Mr. Howard E. Cox, Jr. and Mr. Ralph F. Cox are not related.
Craig S. Brown (1977)
Year of Election or Appointment: 2019
Assistant Treasurer
Mr. Brown also serves as Assistant Treasurer of other funds. Mr. Brown is an employee of Fidelity Investments (2013-present).
John J. Burke III (1964)
Year of Election or Appointment: 2018
Chief Financial Officer
Mr. Burke also serves as Chief Financial Officer of other funds. Mr. Burke serves as Head of Investment Operations for Fidelity Fund and Investment Operations (2018-present) and is an employee of Fidelity Investments (1998-present). Previously Mr. Burke served as head of Asset Management Investment Operations (2012-2018).
Jonathan Davis (1968)
Year of Election or Appointment: 2010
Assistant Treasurer
Mr. Davis also serves as Assistant Treasurer of other funds. Mr. Davis serves as Assistant Treasurer of FMR Capital, Inc. (2017-present) and is an employee of Fidelity Investments. Previously, Mr. Davis served as Vice President and Associate General Counsel of FMR LLC (diversified financial services company, 2003-2010).
Laura M. Del Prato (1964)
Year of Election or Appointment: 2018
Assistant Treasurer
Ms. Del Prato also serves as an officer of other funds. Ms. Del Prato is an employee of Fidelity Investments (2017-present). Previously, Ms. Del Prato served as President and Treasurer of The North Carolina Capital Management Trust: Cash Portfolio and Term Portfolio (2018-2020). Prior to joining Fidelity Investments, Ms. Del Prato served as a Managing Director and Treasurer of the JPMorgan Mutual Funds (2014-2017). Prior to JPMorgan, Ms. Del Prato served as a partner at Cohen Fund Audit Services (accounting firm, 2012-2013) and KPMG LLP (accounting firm, 2004-2012).
James D. Gryglewicz (1972)
Year of Election or Appointment: 2015
Chief Compliance Officer
Mr. Gryglewicz also serves as Chief Compliance Officer of other funds. Mr. Gryglewicz serves as Compliance Officer of Strategic Advisers LLC (investment adviser firm, 2015-present), Senior Vice President of Asset Management Compliance (2009-present), and is an employee of Fidelity Investments (2004-present). Previously, Mr. Gryglewicz served as Compliance Officer of Fidelity SelectCo, LLC (investment adviser firm, 2014-2019), and as Chief Compliance Officer of certain Fidelity® funds (2014-2018).
Colm A. Hogan (1973)
Year of Election or Appointment: 2016
Assistant Treasurer
Mr. Hogan also serves as an officer of other funds. Mr. Hogan serves as Assistant Treasurer of FMR Capital, Inc. (2017-present) and is an employee of Fidelity Investments (2005-present). Previously, Mr. Hogan served as Deputy Treasurer of certain Fidelity® funds (2016-2020) and Assistant Treasurer of certain Fidelity® funds (2016-2018).
Christina H. Lee (1975)
Year of Election or Appointment: 2020
Secretary and Chief Legal Officer
Ms. Lee also serves as Secretary and CLO of other funds. Ms. Lee serves as Vice President, Associate General Counsel (2014-present) and is an employee of Fidelity Investments (2007-present). Previously, Ms. Lee served as Assistant Secretary of certain funds (2018-2019).
Cynthia Lo Bessette (1969)
Year of Election or Appointment: 2020
Assistant Secretary
Ms. Lo Bessette also serves as an officer of other funds. Ms. Lo Bessette serves as CLO, Secretary, and Senior Vice President of Fidelity Management & Research Company LLC (investment adviser firm, 2019-present); and CLO of Fidelity Management & Research (Hong Kong) Limited, FMR Investment Management (UK) Limited, and Fidelity Management & Research (Japan) Limited (investment adviser firms, 2019-present). She is a Senior Vice President and Deputy General Counsel of FMR LLC (diversified financial services company, 2019-present), and is an employee of Fidelity Investments. Previously, Ms. Lo Bessette served as CLO, Secretary, and Senior Vice President of FMR Co., Inc. (investment adviser firm, 2019); Secretary of Fidelity SelectCo, LLC and Fidelity Investments Money Management, Inc. (investment adviser firms, 2019). Prior to joining Fidelity Investments, Ms. Lo Bessette was Executive Vice President, General Counsel (2016-2019) and Senior Vice President, Deputy General Counsel (2015-2016) of OppenheimerFunds (investment management company) and Deputy Chief Legal Officer (2013-2015) of Jennison Associates LLC (investment adviser firm).
Chris Maher (1972)
Year of Election or Appointment: 2016
Assistant Treasurer
Mr. Maher also serves as an officer of other funds. Mr. Maher serves as Assistant Treasurer of FMR Capital, Inc. (2017-present), and is an employee of Fidelity Investments (2008-present). Previously, Mr. Maher served as Assistant Treasurer of certain funds (2013-2020); Vice President of Asset Management Compliance (2013), Vice President of the Program Management Group of FMR (investment adviser firm, 2010-2013), and Vice President of Valuation Oversight (2008-2010).
Brett Segaloff (1972)
Year of Election or Appointment: 2021
Anti-Money Laundering (AML) Officer
Mr. Segaloff also serves as an AML Officer of other funds and other related entities. He is Director, Anti-Money Laundering (2007-present) of FMR LLC (diversified financial services company) and is an employee of Fidelity Investments (1996-present).
Stacie M. Smith (1974)
Year of Election or Appointment: 2020
President and Treasurer
Ms. Smith also serves as an officer of other funds. Ms. Smith serves as Assistant Treasurer of FMR Capital, Inc. (2017-present), is an employee of Fidelity Investments (2009-present), and has served in other fund officer roles. Prior to joining Fidelity Investments, Ms. Smith served as Senior Audit Manager of Ernst & Young LLP (accounting firm, 1996-2009). Previously, Ms. Smith served as Assistant Treasurer (2013-2019) and Deputy Treasurer (2013-2016) of certain Fidelity® funds.
Marc L. Spector (1972)
Year of Election or Appointment: 2016
Assistant Treasurer
Mr. Spector also serves as an officer of other funds. Mr. Spector serves as Assistant Treasurer of FMR Capital, Inc. (2017-present) and is an employee of Fidelity Investments (2016-present). Prior to joining Fidelity Investments, Mr. Spector served as Director at the Siegfried Group (accounting firm, 2013-2016), and prior to Siegfried Group as audit senior manager at Deloitte & Touche LLP (accounting firm, 2005-2013).
Jim Wegmann (1979)
Year of Election or Appointment: 2019
Assistant Treasurer
Mr. Wegmann also serves as Assistant Treasurer of other funds. Mr. Wegmann is an employee of Fidelity Investments (2011-present).
Shareholder Expense Example
As a shareholder, you incur two types of costs: (1) transaction costs, which may include sales charges (loads) on purchase payments or redemption proceeds, as applicable and (2) ongoing costs, which generally include management fees, distribution and/or service (12b-1) fees and other Fund expenses. This Example is intended to help you understand your ongoing costs (in dollars) of investing in a fund and to compare these costs with the ongoing costs of investing in other mutual funds.
The Example is based on an investment of $1,000 invested at the beginning of the period and held for the entire period (December 1, 2020 to May 31, 2021).
Actual Expenses
The first line of the accompanying table provides information about actual account values and actual expenses. You may use the information in this line, together with the amount you invested, to estimate the expenses that you paid over the period. Simply divide your account value by $1,000.00 (for example, an $8,600 account value divided by $1,000.00 = 8.6), then multiply the result by the number in the first line for a class/Fund under the heading entitled "Expenses Paid During Period" to estimate the expenses you paid on your account during this period. If any fund is a shareholder of any underlying mutual funds or exchange-traded funds (ETFs) (the Underlying Funds), such fund indirectly bears its proportional share of the expenses of the Underlying Funds in addition to the direct expenses incurred presented in the table. These fees and expenses are not included in the annualized expense ratio used to calculate the expense estimate in the table below.
Hypothetical Example for Comparison Purposes
The second line of the accompanying table provides information about hypothetical account values and hypothetical expenses based on the actual expense ratio and an assumed rate of return of 5% per year before expenses, which is not the actual return. The hypothetical account values and expenses may not be used to estimate the actual ending account balance or expenses you paid for the period. You may use this information to compare the ongoing costs of investing in the Fund and other funds. To do so, compare this 5% hypothetical example with the 5% hypothetical examples that appear in the shareholder reports of the other funds. If any fund is a shareholder of any Underlying Funds, such fund indirectly bears its proportional share of the expenses of the Underlying Funds in addition to the direct expenses as presented in the table. These fees and expenses are not included in the annualized expense ratio used to calculate the expense estimate in the table below.
Please note that the expenses shown in the table are meant to highlight your ongoing costs only and do not reflect any transaction costs. Therefore, the second line of the table is useful in comparing ongoing costs only, and will not help you determine the relative total costs of owning different funds.
| Annualized Expense Ratio-A | Beginning Account Value December 1, 2020 | Ending Account Value May 31, 2021 | Expenses Paid During Period-B December 1, 2020 to May 31, 2021 |
|
| Strategic Advisers Fidelity Core Income Fund | .06% | |||
| Actual | $1,000.00 | $989.80 | $.30 | |
| Hypothetical-C | $1,000.00 | $1,024.63 | $.30 |
A Annualized expense ratio reflects expenses net of applicable fee waivers.
B Expenses are equal to the annualized expense ratio, multiplied by the average account value over the period, multiplied by 182/ 365 (to reflect the one-half year period). The fees and expenses of any Underlying Funds are not included in each annualized expense ratio.
C 5% return per year before expenses
Distributions (Unaudited)
The fund hereby designates as a capital gain dividend with respect to the taxable year ended May 31, 2021, $220,555,492, or, if subsequently determined to be different, the net capital gain of such year.
A total of 18.49% of the dividends distributed during the fiscal year was derived from interest on U.S. Government securities which is generally exempt from state income tax.
The fund designates $643,144,300 of distributions paid in the calendar year 2020 as qualifying to be taxed as section 163(j) interest dividends.
The fund will notify shareholders in January 2022 of amounts for use in preparing 2021 income tax returns.
Board Approval of Amended Sub-Advisory Agreements
Strategic Advisers Fidelity Core Income Fund
In December 2020, the Board of Trustees, including the Independent Trustees (together, the Board) voted to approve an amendment to the fee schedules for certain investment mandates in the existing sub-advisory agreement among Strategic Advisers LLC (Strategic Advisers), FIAM LLC (FIAM), and Fidelity Rutland Square Trust II (Trust) on behalf of the fund (Amended Sub-Advisory Agreement). The Board noted that the updated fee schedules in the Amended Sub-Advisory Agreement will result in the same or lower fees at all asset levels. The Board also noted that no other material contract terms are impacted by the Amended Sub-Advisory Agreement. The Board, assisted by the advice of fund counsel and Independent Trustees' counsel, considered a broad range of information.In considering whether to approve the Amended Sub-Advisory Agreement, the Board reached a determination, with the assistance of fund counsel and Independent Trustees' counsel and through the exercise of its business judgment, that the approval of the Amended Sub-Advisory Agreement is in the best interests of the fund and its shareholders and that the approval of such agreement does not involve a conflict of interest from which Strategic Advisers or its affiliates derive an inappropriate advantage. Also, the Board found that the fees to be charged under the Amended Sub-Advisory Agreement bear a reasonable relationship to the services to be rendered and will be based on services provided that will be in addition to, rather than duplicative of services provided under the advisory contract of any underlying fund in which the fund may invest. The Board's decision to approve the Amended Sub-Advisory Agreement was not based on any single factor, but rather was based on a comprehensive consideration of all the information provided to the Board. In addition, individual Trustees did not necessarily attribute the same weight or importance to each factor. Nature, Extent, and Quality of Services Provided. The Board considered the backgrounds of the investment personnel that will provide services to the fund, and also considered the fund's investment objective, strategies and related investment philosophy and current sub-adviser line-up, as well as the structures of the investment personnel compensation programs and whether such structures provide appropriate incentives to act in the best interests of the fund, at its September 2020 meeting. The Board considered the detailed information provided by Strategic Advisers and FIAM in the June 2020 annual contract renewal materials.The Board noted that it had approved the existing sub-advisory agreement with FIAM at its September 2020 meeting and that the Amended Sub-Advisory Agreement will not result in any changes to: (i) the nature, extent and quality of the sub-advisory services provided; (ii) the investment process or strategies employed in the management of the fund's assets; or (iii) the day-to-day management of the fund or the persons primarily responsible for such management. Investment Performance. The Board did not consider performance to be a material factor in its decision to approve the Amended Sub-Advisory Agreement because the approval of the Amended Sub-Advisory Agreement will not result in any changes (i) to the fund's investment processes or strategies; or (ii) in the persons primarily responsible for the day-to-day management of the fund.Based on its review, the Board concluded that the nature, extent, and quality of services that will be provided to the fund under the Amended Sub-Advisory Agreement will continue to benefit the fund's shareholders.Competitiveness of Management Fee and Total Fund Expenses.
The Board noted that the Amended Sub-Advisory Agreement will not result in changes to the maximum aggregate annual management fee payable by the fund or Strategic Advisers' portion of the management fee. The Board considered Strategic Advisers' contractual agreement to waive its portion of the fund's management fee. The Board considered that the Amended Sub-Advisory Agreement is expected to result in a decrease in the total management fee rate of the fund. Based on its review, the Board concluded that the fund's management fee structure and any changes to projected total expenses bear a reasonable relationship to the services that the fund and its shareholders will receive and the other factors considered.Because the Amended Sub-Advisory Agreement was negotiated at arm's length and will have no impact on the maximum management fees payable by the fund, the Board did not consider the costs of services and profitability of the relationship with the fund to Strategic Advisers to be significant factors in its decision to approve the Amended Sub-Advisory Agreement. Potential Fall-Out Benefits. The Board considered that it reviews information regarding the potential of direct and indirect benefits to Strategic Advisers and its affiliates from their relationships with the fund, including non-advisory fee compensation paid to affiliates of Strategic Advisers, if any, as well as information regarding potential fall-out benefits accruing to each sub-adviser, if any, as a result of its relationship with the fund, during its annual renewal of the fund's management contract, sub-advisory agreements, and sub-subadvisory agreements. The Board considered Strategic Advisers' representation that it does not anticipate that the approval of the Amended Sub-Advisory Agreement will have a significant impact on the profitability of, or potential fall-out benefits to, Strategic Advisers or its affiliates. Possible Economies of Scale. The Board considered that it reviews whether there have been economies of scale in connection with the management of the fund during its annual renewal of the fund's management contract, sub-advisory agreements, and sub-subadvisory agreements. The Board noted that the Amended Sub-Advisory Agreement will continue to provide for breakpoints that have the potential to reduce sub-advisory fees paid to the sub-adviser as assets allocated to the sub-adviser grow. The Board also noted that it did not consider the possible realization of economies of scale to be a significant factor in its decision to approve the Amended Sub-Advisory Agreement because the fund will not bear any additional management fees or expenses under the Amended Sub-Advisory Agreement. Conclusion. Based on its evaluation of all of the conclusions noted above, and after considering all factors it believed relevant, the Board concluded that the Amended Sub-Advisory Agreement's fee structure bears a reasonable relationship to the services to be rendered and that the Amended Sub-Advisory Agreement is in the best interests of the fund and its shareholders and should be approved. The Board also concluded that the sub-advisory fees to be charged under the Amended Sub-Advisory Agreement will be based on services provided that will be in addition to, rather than duplicative of, services provided under the advisory contract of any underlying fund in which the fund may invest. In addition, the Board concluded that the approval of the Amended Sub-Advisory Agreement does not involve a conflict of interest from which Strategic Advisers or its affiliates derive an inappropriate advantage.Liquidity Risk Management Program
The Securities and Exchange Commission adopted Rule 22e-4 under the Investment Company Act of 1940 (the Liquidity Rule) to promote effective liquidity risk management throughout the open-end investment company industry, thereby reducing the risk that funds will be unable to meet their redemption obligations and mitigating dilution of the interests of fund shareholders.
The Fund has adopted and implemented a liquidity risk management program (the Program) reasonably designed to assess and manage the Fund’s liquidity risk and to comply with the requirements of the Liquidity Rule. The Fund’s Board of Trustees (the Board) has designated the Fund’s investment adviser as administrator of the Program. Strategic Advisers has established a Liquidity Risk Management Committee (the LRM Committee) to manage the Program for each of the Funds. The LRM Committee monitors the adequacy and effectiveness of implementation of the Program and on a periodic basis assesses each Fund’s liquidity risk based on a variety of factors including (1) the Fund’s investment strategy, (2) portfolio liquidity and cash flow projections during normal and reasonably foreseeable stressed conditions, (3) shareholder redemptions and (4) borrowings and other funding sources, as applicable.
In accordance with the Program, each of the Fund’s portfolio investments is classified into one of four liquidity categories described below based on a determination of a reasonable expectation for how long it would take to convert the investment to cash (or sell or dispose of the investment) without significantly changing its market value.
- Highly liquid investments – cash or convertible to cash within three business days or less
- Moderately liquid investments – convertible to cash in three to seven calendar days
- Less liquid investments – can be sold or disposed of, but not settled, within seven calendar days
- Illiquid investments – cannot be sold or disposed of within seven calendar days
Liquidity classification determinations take into account a variety of factors including various market, trading and investment-specific considerations, as well as market depth, and generally utilize analysis from a third-party liquidity metrics service.
The Liquidity Rule places a 15% limit on a fund’s illiquid investments and requires funds that do not primarily hold assets that are highly liquid investments to determine and maintain a minimum percentage of the fund’s net assets to be invested in highly liquid investments (highly liquid investment minimum or HLIM). The Program includes provisions reasonably designed to comply with the 15% limit on illiquid investments and for determining, periodically reviewing and complying with the HLIM requirement as applicable.
At a recent meeting of the Fund’s Board of Trustees, the LRM Committee provided a written report to the Board pertaining to the operation, adequacy, and effectiveness of implementation of the Program for the annual period from December 1, 2019 through November 30, 2020. The report concluded that the Program has been implemented and is operating effectively and is reasonably designed to assess and manage the Fund’s liquidity risk.
Proxy Voting Results
A special meeting of shareholders was held on November 2, 2020. The results of votes taken among shareholders on the proposal before them are reported below. Each vote reported represents one dollar of net asset value held on the record date for the meeting.
PROPOSAL 1
To elect a Board of Trustees.
| # of Votes | % of Votes |
|
| ROBERT A. LAWRENCE | ||
| Affirmative | 204,250,982,594.51 | 96.530 |
| Withheld | 7,343,512,146.85 | 3.470 |
| TOTAL | 211,594,494,741.36 | 100.000 |
| CHARLES S. MORRISON | ||
| Affirmative | 204,349,460,488.43 | 96.576 |
| Withheld | 7,245,034,252.93 | 3.424 |
| TOTAL | 211,594,494,741.36 | 100.000 |
| PETER C. ALDRICH | ||
| Affirmative | 203,499,803,652.67 | 96.175 |
| Withheld | 8,094,691,088.69 | 3.825 |
| TOTAL | 211,594,494,741.36 | 100.000 |
| MARY C. FARRELL | ||
| Affirmative | 204,011,925,737.22 | 96.417 |
| Withheld | 7,582,569,004.14 | 3.583 |
| TOTAL | 211,594,494,741.36 | 100.00 |
| KAREN KAPLAN | ||
| Affirmative | 204,297,547,550.53 | 96.552 |
| Withheld | 7,296,947,190.83 | 3.448 |
| TOTAL | 211,594,494,741.36 | 100.000 |
| CHRISTINE MARCKS | ||
| Affirmative | 204,700,871,317.72 | 96.743 |
| Withheld | 6,893,623,423.64 | 3.257 |
| TOTAL | 211,594,494,741.36 | 100.000 |
| HEIDI L. STEIGER | ||
| Affirmative | 204,406,589,957.28 | 96.603 |
| Withheld | 7,187,904,784.08 | 3.397 |
| TOTAL | 211,594,494,741.36 | 100.000 |
| Proposal 1 reflects trust wide proposal and voting results. |
![]()
COI-ANN-0721
1.9887939.102
Strategic Advisers® Fidelity® Emerging Markets Fund
Offered exclusively to certain managed account clients of Strategic Advisers LLC or its affiliates - not available for sale to the general public
May 31, 2021
Contents
To view a fund's proxy voting record for the 12-month period ended June 30, visit http://www.fidelity.com/proxyvotingresults or visit the Securities and Exchange Commission's (SEC) web site at http://www.sec.gov.
You may also call 1-800-544-3455 to request a free copy of the proxy voting guidelines.
Standard & Poor's, S&P and S&P 500 are registered service marks of The McGraw-Hill Companies, Inc. and have been licensed for use by Fidelity Distributors Corporation.
Other third-party marks appearing herein are the property of their respective owners.
All other marks appearing herein are registered or unregistered trademarks or service marks of FMR LLC or an affiliated company. © 2021 FMR LLC. All rights reserved.
This report and the financial statements contained herein are submitted for the general information of the shareholders of the Fund. This report is not authorized for distribution to prospective investors in the Fund unless preceded or accompanied by an effective prospectus.
A fund files its complete schedule of portfolio holdings with the SEC for the first and third quarters of each fiscal year on Form N-PORT. Forms N-PORT are available on the SEC’s web site at http://www.sec.gov. A fund's Forms N-PORT may be reviewed and copied at the SEC’s Public Reference Room in Washington, DC. Information regarding the operation of the SEC's Public Reference Room may be obtained by calling 1-800-SEC-0330.
For a complete list of a fund's portfolio holdings, view the most recent holdings listing, semiannual report, or annual report on Fidelity's web site at http://www.fidelity.com, http://www.institutional.fidelity.com, or http://www.401k.com, as applicable.
NOT FDIC INSURED •MAY LOSE VALUE •NO BANK GUARANTEE
Neither the Fund nor Fidelity Distributors Corporation is a bank.
Note to Shareholders:
Early in 2020, the outbreak and spread of a new coronavirus emerged as a public health emergency that had a major influence on financial markets, primarily based on its impact on the global economy and the outlook for corporate earnings. The virus causes a respiratory disease known as COVID-19. On March 11, 2020 the World Health Organization declared the COVID-19 outbreak a pandemic, citing sustained risk of further global spread.
In the weeks following, as the crisis worsened, we witnessed an escalating human tragedy with wide-scale social and economic consequences from coronavirus-containment measures. The outbreak of COVID-19 prompted a number of measures to limit the spread, including travel and border restrictions, quarantines, and restrictions on large gatherings. In turn, these resulted in lower consumer activity, diminished demand for a wide range of products and services, disruption in manufacturing and supply chains, and – given the wide variability in outcomes regarding the outbreak – significant market uncertainty and volatility. Amid the turmoil, global governments and central banks took unprecedented action to help support consumers, businesses, and the broader economies, and to limit disruption to financial systems.
The situation continues to unfold, and the extent and duration of its impact on financial markets and the economy remain highly uncertain. Extreme events such as the coronavirus crisis are “exogenous shocks” that can have significant adverse effects on mutual funds and their investments. Although multiple asset classes may be affected by market disruption, the duration and impact may not be the same for all types of assets.
Fidelity is committed to helping you stay informed amid news about COVID-19 and during increased market volatility, and we’re taking extra steps to be responsive to customer needs. We encourage you to visit our websites, where we offer ongoing updates, commentary, and analysis on the markets and our funds.
Performance: The Bottom Line
Average annual total return reflects the change in the value of an investment, assuming reinvestment of distributions from dividend income and capital gains (the profits earned upon the sale of securities that have grown in value, if any) and assuming a constant rate of performance each year. The hypothetical investment and the average annual total returns do not reflect the deduction of taxes that a shareholder would pay on fund distributions or the redemption of fund shares. During periods of reimbursement by Fidelity, a fund’s total return will be greater than it would be had the reimbursement not occurred. How a fund did yesterday is no guarantee of how it will do tomorrow.
Average Annual Total Returns
| For the periods ended May 31, 2021 | Past 1 year | Life of fundA |
| Strategic Advisers® Fidelity® Emerging Markets Fund | 53.25% | 21.03% |
A From October 30, 2018
$10,000 Over Life of Fund
Let's say hypothetically that $10,000 was invested in Strategic Advisers® Fidelity® Emerging Markets Fund on October 30, 2018, when the fund started.
The chart shows how the value of your investment would have changed, and also shows how the MSCI Emerging Markets Index performed over the same period.

| Period Ending Values | ||
|
| $16,384 | Strategic Advisers® Fidelity® Emerging Markets Fund |
|
| $15,562 | MSCI Emerging Markets Index |
Management's Discussion of Fund Performance
Market Recap: The MSCI Emerging Markets Index gained 51.02% for the 12 months ending May 31, 2021, with emerging-markets equities rising amid improved global economic growth, widespread COVID-19 vaccinations, fiscal stimulus in the U.S. and abroad, and fresh government spending programs. For the first three months of the period, emerging-markets stocks gained about 20%, boosted by government efforts to contain the economic impact of the pandemic. After a modest one-month retreat in September, the index advanced roughly 20% the next three months to end 2020 on a strong note amid positive news on the effectiveness of vaccines from multiple manufacturers. In late December, as vaccines were approved by regulators, investors gained more confidence in the outlook for the global economy, and the index advanced. As the new year began, many economists raised their expectations for a powerful global economic recovery, as opposed to the sluggish rebound they had been anticipating. Among larger country components within the index, Taiwan (+86%), South Korea (+78%), South Africa (+72%) and India (+69%) led the way. Conversely, Malaysia (+11%), Thailand (+13%), Indonesia (+23%) and Russia (+32%) lagged. Looking at sectors, information technology (+95%) and materials (+86%) fared best, followed by health care (+52%). In contrast, notable “laggards” included real estate (+17%), utilities (+24%) and energy (+32%). Comments from Co-Portfolio Managers Wilfred Chilangwa and Antonio Martinez: For the fiscal year ending May 31, 2021, the Fund advanced 53.25%, outpacing the 51.02% gain of the benchmark MSCI Emerging Markets (EM) Index. During the period, underlying managers pursuing either growth or core strategies added the most value versus the benchmark. (Core strategies often include both growth and value stocks.) The Global EM mandate from sub-adviser FIL® (+70%) outperformed the benchmark by a sizable margin and was the top relative contributor. FIL Global EM is a quality growth strategy focused on companies with low debt levels and durable competitive advantages that the manager believes will enable them to generate strong returns on assets. Stock picks in the financials and information technology sectors were the key drivers of its performance. Country-wise, this manager benefited from favorable overall positioning in China, along with security selection in Russia and Mexico. The Concentrated EM strategy from sub-adviser FIAM® (+63%) provided a further boost versus the benchmark. This is a GARP (growth-at-a-reasonable-price) approach that splits its investments between structural growth investments and out-of-favor companies with trends that the portfolio manager believes are likely to reverse. Strong security selection in China and, to a lesser extent, Taiwan and India, fueled its positive relative result. On the downside, Fidelity® SAI Emerging Markets Low Volatility Index Fund (+36%) was the largest relative detractor. This fund seeks to replicate the performance of an index of EM stocks that have exhibited lower volatility than the broad EM market. Despite its style being out of favor the past 12 months, this fund serves an important risk-management role in the portfolio. Looking ahead, as our underlying managers seek to capitalize on opportunities in Asia, Latin America and elsewhere, we plan to maintain a well-diversified portfolio with limited style tilts.The views expressed above reflect those of the portfolio manager(s) only through the end of the period as stated on the cover of this report and do not necessarily represent the views of Fidelity or any other person in the Fidelity organization. Any such views are subject to change at any time based upon market or other conditions and Fidelity disclaims any responsibility to update such views. These views may not be relied on as investment advice and, because investment decisions for a Fidelity fund are based on numerous factors, may not be relied on as an indication of trading intent on behalf of any Fidelity fund.
Investment Summary (Unaudited)
The information in the following tables is based on the direct investments of the Fund.Top Ten Holdings as of May 31, 2021
| (excluding cash equivalents) | % of fund's net assets |
| Fidelity SAI Emerging Markets Value Index Fund | 14.6 |
| Fidelity Emerging Markets Fund | 11.8 |
| Fidelity SAI Emerging Markets Index Fund | 7.9 |
| Fidelity SAI Emerging Markets Low Volatility Index Fund | 6.6 |
| Tencent Holdings Ltd. | 3.5 |
| Taiwan Semiconductor Manufacturing Co. Ltd. | 3.4 |
| Samsung Electronics Co. Ltd. | 3.2 |
| Alibaba Group Holding Ltd. | 2.8 |
| SK Hynix, Inc. | 1.0 |
| Naspers Ltd. Class N | 0.9 |
| 55.7 |
Top Five Market Sectors as of May 31, 2021
| (stocks only) | % of fund's net assets |
| Information Technology | 12.0 |
| Financials | 11.3 |
| Consumer Discretionary | 9.5 |
| Communication Services | 5.5 |
| Consumer Staples | 4.3 |
Geographic Diversification (% of fund's net assets)
| As of May 31, 2021 | ||
| United States of America | 46.0% | |
| Cayman Islands | 13.2% | |
| Taiwan | 7.5% | |
| Korea (South) | 7.3% | |
| China | 6.3% | |
| India | 5.5% | |
| Brazil | 3.2% | |
| South Africa | 2.0% | |
| Mexico | 1.6% | |
| Other | 7.4% | |

Percentages are based on country or territory of incorporation and are adjusted for the effect of futures contracts, if applicable.
Asset Allocation (% of fund's net assets)
| As of May 31, 2021 | ||
| Common Stocks | 52.5% | |
| Preferred Stocks | 1.7% | |
| Diversifed Emerging Markets Funds | 40.9% | |
| Short-Term Investments and Net Other Assets (Liabilities) | 4.9% | |

Asset allocations of funds in the pie chart reflect the categorizations of assets as defined by Morningstar as of the reporting date.
Schedule of Investments May 31, 2021
Showing Percentage of Net Assets
| Common Stocks - 52.5% | |||
| Shares | Value | ||
| COMMUNICATION SERVICES - 5.5% | |||
| Entertainment - 0.6% | |||
| Bilibili, Inc.: | |||
| ADR (a) | 175,077 | $18,764,753 | |
| Class Z (a) | 64,920 | 7,226,856 | |
| DouYu International Holdings Ltd. ADR (a) | 268,184 | 2,118,654 | |
| HUYA, Inc. ADR (a)(b) | 160,535 | 2,456,186 | |
| International Games Systems Co. Ltd. | 158,000 | 5,272,971 | |
| NetEase, Inc. ADR | 99,507 | 11,734,861 | |
| 47,574,281 | |||
| Interactive Media & Services - 4.6% | |||
| Baidu.com, Inc. sponsored ADR (a) | 101,000 | 19,823,270 | |
| JOYY, Inc. ADR | 88,900 | 6,840,855 | |
| Kakao Corp. | 135,974 | 15,088,731 | |
| Kuaishou Technology Class B (c) | 130,000 | 3,254,418 | |
| NAVER Corp. | 44,781 | 14,645,140 | |
| Tencent Holdings Ltd. | 3,271,400 | 260,904,419 | |
| Yandex NV Series A (a) | 319,550 | 21,582,407 | |
| 342,139,240 | |||
| Media - 0.1% | |||
| Focus Media Information Technology Co. Ltd. (A Shares) | 2,203,079 | 3,541,555 | |
| Wireless Telecommunication Services - 0.2% | |||
| Bharti Airtel Ltd. | 1,546,924 | 11,410,187 | |
| SK Telecom Co. Ltd. | 16,741 | 4,804,904 | |
| 16,215,091 | |||
| TOTAL COMMUNICATION SERVICES | 409,470,167 | ||
| CONSUMER DISCRETIONARY - 9.5% | |||
| Automobiles - 0.8% | |||
| Great Wall Motor Co. Ltd. (H Shares) | 558,000 | 1,560,095 | |
| Hyundai Motor Co. | 137,352 | 29,120,215 | |
| Kia Corp. | 67,259 | 5,194,167 | |
| Li Auto, Inc. ADR (a) | 142,000 | 3,308,600 | |
| XPeng, Inc. ADR (a)(b) | 652,600 | 20,968,038 | |
| 60,151,115 | |||
| Diversified Consumer Services - 0.2% | |||
| New Oriental Education & Technology Group, Inc. sponsored ADR | 887,320 | 9,077,284 | |
| YDUQS Participacoes SA | 891,100 | 5,595,204 | |
| 14,672,488 | |||
| Hotels, Restaurants & Leisure - 0.2% | |||
| Jiumaojiu International Holdings Ltd. (c) | 479,000 | 1,897,745 | |
| MakeMyTrip Ltd. (a) | 168,882 | 4,644,255 | |
| Shangri-La Asia Ltd. (a) | 9,552,000 | 8,910,252 | |
| Yum China Holdings, Inc. | 25,526 | 1,726,579 | |
| Yum China Holdings, Inc. (Hong Kong) | 15,100 | 1,004,857 | |
| 18,183,688 | |||
| Household Durables - 0.7% | |||
| Haier Smart Home Co. Ltd. (A Shares) | 5,661,903 | 26,816,476 | |
| Midea Group Co. Ltd. (A Shares) | 1,730,989 | 22,011,179 | |
| 48,827,655 | |||
| Internet & Direct Marketing Retail - 5.6% | |||
| Alibaba Group Holding Ltd. (a) | 430,600 | 11,706,137 | |
| Alibaba Group Holding Ltd. sponsored ADR (a) | 912,043 | 195,140,720 | |
| Baozun, Inc.: | |||
| Class A (a) | 239,200 | 2,769,086 | |
| sponsored ADR (a)(b) | 144,793 | 5,022,869 | |
| Coupang, Inc. Class A (a)(b) | 196,200 | 8,002,998 | |
| JD Health International, Inc. (c) | 506,100 | 6,735,872 | |
| JD.com, Inc.: | |||
| Class A | 31,850 | 1,194,973 | |
| sponsored ADR (a) | 705,441 | 52,160,308 | |
| Meituan Class B (a)(c) | 1,165,400 | 44,144,793 | |
| momo.com, Inc. | 34,000 | 1,529,365 | |
| Naspers Ltd. Class N | 300,441 | 66,660,145 | |
| Pinduoduo, Inc. ADR (a) | 78,950 | 9,859,276 | |
| Trip.com Group Ltd. ADR (a) | 397,600 | 16,639,560 | |
| 421,566,102 | |||
| Specialty Retail - 0.4% | |||
| China Yongda Automobiles Services Holdings Ltd. | 2,677,500 | 4,698,549 | |
| Pop Mart International Group Ltd. (b)(c) | 160,000 | 1,432,722 | |
| Zhongsheng Group Holdings Ltd. Class H | 3,071,500 | 26,415,505 | |
| 32,546,776 | |||
| Textiles, Apparel & Luxury Goods - 1.6% | |||
| adidas AG | 22,179 | 8,091,726 | |
| Anta Sports Products Ltd. | 1,614,000 | 32,939,412 | |
| ECLAT Textile Co. Ltd. | 849,000 | 19,864,512 | |
| Li Ning Co. Ltd. | 4,153,500 | 38,985,302 | |
| Shenzhou International Group Holdings Ltd. | 669,500 | 17,286,435 | |
| 117,167,387 | |||
| TOTAL CONSUMER DISCRETIONARY | 713,115,211 | ||
| CONSUMER STAPLES - 4.0% | |||
| Beverages - 1.2% | |||
| China Resources Beer Holdings Co. Ltd. | 1,730,000 | 15,524,741 | |
| Fomento Economico Mexicano S.A.B. de CV sponsored ADR | 58,400 | 4,788,800 | |
| Kweichow Moutai Co. Ltd. (A Shares) | 173,111 | 60,276,799 | |
| Thai Beverage PCL | 20,331,200 | 10,540,280 | |
| 91,130,620 | |||
| Food & Staples Retailing - 0.7% | |||
| Atacadao SA | 1,634,100 | 6,985,866 | |
| Bidcorp Ltd. (a) | 355,682 | 7,514,829 | |
| CP ALL PCL (For. Reg.) | 5,641,100 | 10,969,809 | |
| Wal-Mart de Mexico SA de CV Series V | 8,080,900 | 26,525,339 | |
| X5 Retail Group NV GDR (Reg. S) | 75,034 | 2,243,517 | |
| 54,239,360 | |||
| Food Products - 1.4% | |||
| Angel Yeast Co. Ltd. (A Shares) | 1,211,400 | 12,205,379 | |
| China Feihe Ltd. (c) | 1,444,000 | 4,046,538 | |
| China Mengniu Dairy Co. Ltd. | 9,724,000 | 58,947,001 | |
| Gruma S.A.B. de CV Series B | 294,015 | 3,202,822 | |
| Inner Mongoli Yili Industries Co. Ltd. (A Shares) | 504,867 | 3,209,141 | |
| Unified-President Enterprises Corp. | 8,310,201 | 22,187,064 | |
| 103,797,945 | |||
| Personal Products - 0.7% | |||
| AMOREPACIFIC Corp. | 46,550 | 12,052,978 | |
| LG Household & Health Care Ltd. | 4,833 | 6,797,585 | |
| Natura & Co. Holding SA (a) | 3,180,224 | 31,288,155 | |
| Proya Cosmetics Co. Ltd. (A Shares) | 52,400 | 1,406,585 | |
| 51,545,303 | |||
| TOTAL CONSUMER STAPLES | 300,713,228 | ||
| ENERGY - 1.9% | |||
| Energy Equipment & Services - 0.2% | |||
| China Oilfield Services Ltd. (H Shares) | 3,426,000 | 3,222,310 | |
| Yantai Jereh Oilfield Services (A Shares) | 1,301,135 | 8,168,414 | |
| 11,390,724 | |||
| Oil, Gas & Consumable Fuels - 1.7% | |||
| China Merchants Energy Shipping Co. Ltd. (A Shares) | 3,541,200 | 2,951,950 | |
| China Petroleum & Chemical Corp. (H Shares) | 31,238,000 | 16,622,273 | |
| CNOOC Ltd. | 3,445,000 | 3,741,743 | |
| Lukoil PJSC | 215,507 | 17,595,043 | |
| Lukoil PJSC sponsored ADR | 285,513 | 23,257,889 | |
| PAO NOVATEK GDR (Reg. S) | 42,801 | 8,536,659 | |
| Petroleo Brasileiro SA - Petrobras (ON) | 1,945,800 | 9,896,668 | |
| Petronet LNG Ltd. | 1,629,527 | 5,425,502 | |
| Reliance Industries Ltd. | 1,101,571 | 32,815,403 | |
| Reliance Industries Ltd. sponsored GDR (c) | 152,300 | 8,780,095 | |
| 129,623,225 | |||
| TOTAL ENERGY | 141,013,949 | ||
| FINANCIALS - 10.4% | |||
| Banks - 7.2% | |||
| Absa Group Ltd. (a) | 1,003,480 | 10,450,719 | |
| Al Rajhi Bank | 396,069 | 10,898,947 | |
| Axis Bank Ltd. (a) | 2,202,844 | 22,803,491 | |
| Capitec Bank Holdings Ltd. | 43,962 | 5,330,639 | |
| China Construction Bank Corp. (H Shares) | 27,302,000 | 22,442,554 | |
| China Merchants Bank Co. Ltd. (H Shares) | 5,162,500 | 47,724,249 | |
| Credicorp Ltd. (United States) | 123,300 | 16,950,051 | |
| E.SUN Financial Holdings Co. Ltd. | 12,380,267 | 11,474,438 | |
| Grupo Financiero Banorte S.A.B. de CV Series O | 3,292,550 | 22,719,322 | |
| Hana Financial Group, Inc. | 213,970 | 8,985,956 | |
| HDFC Bank Ltd. (a) | 605,143 | 12,649,269 | |
| HDFC Bank Ltd. sponsored ADR (a) | 754,668 | 57,754,742 | |
| ICICI Bank Ltd. (a) | 2,278,322 | 20,821,692 | |
| Industrial & Commercial Bank of China Ltd. (H Shares) | 71,959,000 | 47,238,441 | |
| KB Financial Group, Inc. | 178,450 | 9,466,416 | |
| Kotak Mahindra Bank Ltd. (a) | 329,314 | 8,208,952 | |
| National Bank of Greece SA (a) | 6,138,000 | 19,395,125 | |
| OTP Bank PLC (a) | 92,595 | 5,094,240 | |
| PT Bank Central Asia Tbk | 11,404,186 | 25,455,772 | |
| PT Bank Mandiri (Persero) Tbk | 57,391,300 | 24,113,992 | |
| PT Bank Rakyat Indonesia Tbk | 10,500,700 | 3,132,562 | |
| Sberbank of Russia | 870,000 | 3,671,319 | |
| Sberbank of Russia: | |||
| (Russia) | 3,825,606 | 16,143,703 | |
| sponsored ADR | 1,052,455 | 17,760,178 | |
| Shinhan Financial Group Co. Ltd. | 827,130 | 31,676,938 | |
| Siam Commercial Bank PCL (For. Reg.) | 2,512,900 | 8,244,950 | |
| State Bank of India | 3,596,500 | 21,045,316 | |
| TCS Group Holding PLC GDR | 358,348 | 26,876,100 | |
| 538,530,073 | |||
| Capital Markets - 0.4% | |||
| B3 SA - Brasil Bolsa Balcao | 6,213,900 | 20,801,154 | |
| Hong Kong Exchanges and Clearing Ltd. | 41,100 | 2,572,506 | |
| Noah Holdings Ltd. sponsored ADR (a) | 83,689 | 3,814,545 | |
| 27,188,205 | |||
| Consumer Finance - 0.6% | |||
| Bajaj Finance Ltd. | 148,182 | 11,499,974 | |
| Kaspi.KZ JSC unit | 218,971 | 20,079,641 | |
| Shriram Transport Finance Co. Ltd. | 700,128 | 13,803,967 | |
| 45,383,582 | |||
| Diversified Financial Services - 0.3% | |||
| Chailease Holding Co. Ltd. | 2,593,146 | 19,612,977 | |
| Insurance - 1.5% | |||
| AIA Group Ltd. | 3,966,400 | 50,695,022 | |
| China Life Insurance Co. Ltd. (H Shares) | 15,040,000 | 31,702,118 | |
| HDFC Standard Life Insurance Co. Ltd. (c) | 518,319 | 4,759,456 | |
| ICICI Lombard General Insurance Co. Ltd. (c) | 288,015 | 5,845,809 | |
| Ping An Insurance Group Co. of China Ltd. (H Shares) | 1,727,500 | 18,796,407 | |
| Samsung Life Insurance Co. Ltd. | 56,240 | 4,251,881 | |
| 116,050,693 | |||
| Thrifts & Mortgage Finance - 0.4% | |||
| Housing Development Finance Corp. Ltd. | 895,956 | 31,540,107 | |
| TOTAL FINANCIALS | 778,305,637 | ||
| HEALTH CARE - 2.0% | |||
| Biotechnology - 0.3% | |||
| InnoCare Pharma Ltd. (a)(c) | 614,000 | 1,878,837 | |
| Innovent Biologics, Inc. (a)(c) | 209,500 | 2,535,934 | |
| Remegen Co. Ltd. (H Shares) (a)(c) | 203,500 | 2,926,077 | |
| Zai Lab Ltd. (a) | 87,200 | 15,515,554 | |
| 22,856,402 | |||
| Health Care Equipment & Supplies - 0.7% | |||
| Peijia Medical Ltd. (a)(c) | 811,000 | 3,025,008 | |
| Shenzhen Mindray Bio-Medical Electronics Co. Ltd. (A Shares) | 607,138 | 46,036,100 | |
| 49,061,108 | |||
| Health Care Providers & Services - 0.0% | |||
| Apollo Hospitals Enterprise Ltd. (a) | 75,338 | 3,291,950 | |
| Aster DM Healthcare Ltd. (a)(c) | 1,192 | 2,412 | |
| 3,294,362 | |||
| Life Sciences Tools & Services - 0.5% | |||
| Hangzhou Tigermed Consulting Co. Ltd. (H Shares) (a)(c) | 161,900 | 3,362,552 | |
| Pharmaron Beijing Co. Ltd. (H Shares) (c) | 578,100 | 13,846,484 | |
| WuXi AppTec Co. Ltd. (H Shares) (c) | 683,616 | 14,638,628 | |
| Wuxi Biologics (Cayman), Inc. (a)(c) | 467,000 | 7,298,520 | |
| 39,146,184 | |||
| Pharmaceuticals - 0.5% | |||
| Hansoh Pharmaceutical Group Co. Ltd. (c) | 1,459,610 | 6,365,795 | |
| Richter Gedeon PLC | 1,068,877 | 30,485,581 | |
| 36,851,376 | |||
| TOTAL HEALTH CARE | 151,209,432 | ||
| INDUSTRIALS - 2.5% | |||
| Airlines - 0.1% | |||
| Azul SA sponsored ADR (a)(b) | 145,367 | 3,592,019 | |
| Copa Holdings SA Class A (a) | 66,428 | 5,464,367 | |
| 9,056,386 | |||
| Commercial Services & Supplies - 0.1% | |||
| Country Garden Services Holdings Co. Ltd. | 326,000 | 3,383,298 | |
| Construction & Engineering - 0.6% | |||
| Larsen & Toubro Ltd. | 1,600,119 | 32,384,766 | |
| Voltas Ltd. | 873,500 | 12,133,132 | |
| 44,517,898 | |||
| Electrical Equipment - 0.2% | |||
| Graphite India Ltd. (a) | 1,188,300 | 12,219,162 | |
| Machinery - 1.0% | |||
| Airtac International Group | 47,000 | 1,701,527 | |
| Estun Automation Co. Ltd. (A Shares) (a) | 479,270 | 2,494,180 | |
| Hangcha Group Co. Ltd. (A Shares) | 693,800 | 2,167,461 | |
| HIWIN Technologies Corp. | 1,202,938 | 16,058,374 | |
| Sany Heavy Industry Co. Ltd. (A Shares) | 1,090,783 | 5,186,825 | |
| Shandong Himile Mechanical Science & Technology Co. Ltd. (A Shares) | 521,260 | 2,349,371 | |
| Shenzhen Inovance Technology Co. Ltd. (A Shares) | 411,326 | 6,359,783 | |
| Techtronic Industries Co. Ltd. | 1,052,500 | 19,432,355 | |
| Weichai Power Co. Ltd. (A Shares) | 3,753,502 | 10,494,568 | |
| Zhejiang Sanhua Intelligent Controls Co. Ltd. (A Shares) | 3,020,908 | 10,585,117 | |
| 76,829,561 | |||
| Professional Services - 0.1% | |||
| Sporton International, Inc. | 1,041,000 | 9,063,010 | |
| Road & Rail - 0.3% | |||
| Localiza Rent A Car SA | 1,702,455 | 20,355,899 | |
| Rumo SA (a) | 1,113,500 | 4,392,626 | |
| TuSimple Holdings, Inc. (a)(b) | 21,255 | 814,917 | |
| 25,563,442 | |||
| Trading Companies & Distributors - 0.0% | |||
| BOC Aviation Ltd. Class A (c) | 260,700 | 2,317,647 | |
| Transportation Infrastructure - 0.1% | |||
| Grupo Aeroportuario del Sureste S.A.B. de CV Series B | 256,250 | 4,672,280 | |
| Grupo Aeroportuario Norte S.A.B. de CV (a) | 546,967 | 3,515,589 | |
| 8,187,869 | |||
| TOTAL INDUSTRIALS | 191,138,273 | ||
| INFORMATION TECHNOLOGY - 12.0% | |||
| Electronic Equipment & Components - 0.9% | |||
| Hon Hai Precision Industry Co. Ltd. (Foxconn) | 3,948,000 | 16,254,870 | |
| Largan Precision Co. Ltd. | 45,000 | 4,946,131 | |
| LG Innotek Co. Ltd. | 21,672 | 3,998,380 | |
| Samsung SDI Co. Ltd. | 8,842 | 4,905,885 | |
| Sunny Optical Technology Group Co. Ltd. | 80,200 | 2,039,758 | |
| Unimicron Technology Corp. | 2,175,000 | 8,876,102 | |
| Wuxi Lead Intelligent Equipment Co. Ltd. (A Shares) | 231,917 | 3,487,884 | |
| Yageo Corp. | 1,133,000 | 20,755,432 | |
| 65,264,442 | |||
| IT Services - 0.6% | |||
| Infosys Ltd. | 548,426 | 10,540,327 | |
| Infosys Ltd. sponsored ADR | 1,513,364 | 29,268,460 | |
| Tech Mahindra Ltd. | 361,609 | 5,094,394 | |
| 44,903,181 | |||
| Semiconductors & Semiconductor Equipment - 6.7% | |||
| ASE Technology Holding Co. Ltd. | 4,437,000 | 17,946,294 | |
| Daqo New Energy Corp. ADR (a) | 25,172 | 1,872,293 | |
| eMemory Technology, Inc. | 312,401 | 10,675,146 | |
| Global Unichip Corp. | 214,000 | 2,794,646 | |
| MediaTek, Inc. | 1,579,000 | 56,992,237 | |
| Nanya Technology Corp. | 516,000 | 1,533,007 | |
| Novatek Microelectronics Corp. | 111,000 | 2,150,180 | |
| Realtek Semiconductor Corp. | 390,000 | 7,059,528 | |
| Silergy Corp. | 75,000 | 10,011,971 | |
| SK Hynix, Inc. | 639,352 | 73,254,697 | |
| Taiwan Semiconductor Manufacturing Co. Ltd. | 11,888,000 | 257,450,430 | |
| Taiwan Semiconductor Manufacturing Co. Ltd. sponsored ADR | 522,675 | 61,341,138 | |
| Vanguard International Semiconductor Corp. | 342,000 | 1,463,924 | |
| 504,545,491 | |||
| Software - 0.0% | |||
| Kingsoft Corp. Ltd. | 178,000 | 1,200,588 | |
| Ming Yuan Cloud Group Holdings Ltd. | 256,575 | 1,342,139 | |
| 2,542,727 | |||
| Technology Hardware, Storage & Peripherals - 3.8% | |||
| Samsung Electronics Co. Ltd. | 3,320,568 | 241,157,064 | |
| Samsung Electronics Co. Ltd. unit | 21,752 | 39,327,616 | |
| Wiwynn Corp. | 46,000 | 1,553,524 | |
| Xiaomi Corp. Class B (a)(c) | 1,115,800 | 4,205,033 | |
| 286,243,237 | |||
| TOTAL INFORMATION TECHNOLOGY | 903,499,078 | ||
| MATERIALS - 4.2% | |||
| Chemicals - 0.8% | |||
| Hansol Chemical Co. Ltd. | 46,454 | 10,435,522 | |
| LG Chemical Ltd. | 12,130 | 8,962,650 | |
| PhosAgro OJSC GDR (Reg. S) | 279,446 | 5,717,465 | |
| Shandong Sinocera Functional Material Co. Ltd. (A Shares) | 362,700 | 2,966,533 | |
| SKSHU Paint Co. Ltd. (A Shares) | 214,700 | 7,954,411 | |
| Sociedad Quimica y Minera de Chile SA (PN-B) sponsored ADR | 123,199 | 5,343,141 | |
| Solar Industries India Ltd. | 643,187 | 13,786,411 | |
| Soulbrain Co. Ltd. | 5,044 | 1,493,501 | |
| 56,659,634 | |||
| Construction Materials - 0.6% | |||
| Beijing Oriental Yuhong Waterproof Technology Co. Ltd. (A Shares) | 903,600 | 8,887,125 | |
| CEMEX S.A.B. de CV sponsored ADR (a) | 2,556,996 | 21,171,927 | |
| JK Cement Ltd. (a) | 435,000 | 17,092,339 | |
| 47,151,391 | |||
| Metals & Mining - 2.5% | |||
| AngloGold Ashanti Ltd. | 390,658 | 9,671,352 | |
| Barrick Gold Corp. | 1,307,100 | 31,474,968 | |
| China Molybdenum Co. Ltd. (A Shares) | 2,890,316 | 2,636,243 | |
| First Quantum Minerals Ltd. | 747,918 | 18,403,616 | |
| Grupo Mexico SA de CV Series B | 6,547,791 | 31,923,932 | |
| Harmony Gold Mining Co. Ltd. | 22,714 | 122,292 | |
| Impala Platinum Holdings Ltd. | 1,566,350 | 28,543,834 | |
| Novolipetsk Steel OJSC GDR (Reg. S) | 74,605 | 2,673,843 | |
| POSCO | 63,829 | 20,442,694 | |
| Sibanye Stillwater Ltd. | 4,317,138 | 20,448,403 | |
| Southern Copper Corp. | 85,593 | 5,969,256 | |
| Tata Steel Ltd. | 121,315 | 1,883,081 | |
| Vale SA | 419,900 | 9,198,260 | |
| Vale SA sponsored ADR | 169,700 | 3,651,944 | |
| 187,043,718 | |||
| Paper & Forest Products - 0.3% | |||
| Suzano Papel e Celulose SA (a) | 1,914,000 | 22,183,946 | |
| TOTAL MATERIALS | 313,038,689 | ||
| REAL ESTATE - 0.3% | |||
| Equity Real Estate Investment Trusts (REITs) - 0.0% | |||
| Link (REIT) | 333,700 | 3,177,297 | |
| Real Estate Management & Development - 0.3% | |||
| Ayala Land, Inc. | 13,310,800 | 9,610,081 | |
| Longfor Properties Co. Ltd. (c) | 1,193,000 | 6,978,361 | |
| Sun Hung Kai Properties Ltd. | 216,500 | 3,324,997 | |
| 19,913,439 | |||
| TOTAL REAL ESTATE | 23,090,736 | ||
| UTILITIES - 0.2% | |||
| Gas Utilities - 0.2% | |||
| China Gas Holdings Ltd. | 2,514,400 | 9,378,644 | |
| Indraprastha Gas Ltd. | 762,275 | 5,558,983 | |
| 14,937,627 | |||
| TOTAL COMMON STOCKS | |||
| (Cost $2,954,355,540) | 3,939,532,027 | ||
| Nonconvertible Preferred Stocks - 1.7% | |||
| CONSUMER STAPLES - 0.3% | |||
| Beverages - 0.3% | |||
| Ambev SA sponsored ADR | 6,739,100 | 23,317,286 | |
| ENERGY - 0.3% | |||
| Oil, Gas & Consumable Fuels - 0.3% | |||
| Petroleo Brasileiro SA - Petrobras sponsored ADR | 2,594,166 | 26,486,435 | |
| FINANCIALS - 0.9% | |||
| Banks - 0.9% | |||
| Banco Bradesco SA (PN) | 1,365,429 | 6,900,502 | |
| Itau Unibanco Holding SA | 6,534,509 | 36,839,780 | |
| Sberbank of Russia | 1,549,116 | 6,154,573 | |
| Sberbank of Russia (Russia) | 3,791,522 | 15,065,931 | |
| 64,960,786 | |||
| INDUSTRIALS - 0.1% | |||
| Airlines - 0.1% | |||
| Azul SA (a) | 1,348,900 | 11,069,851 | |
| MATERIALS - 0.1% | |||
| Metals & Mining - 0.1% | |||
| Gerdau SA | 684,900 | 4,303,091 | |
| TOTAL NONCONVERTIBLE PREFERRED STOCKS | |||
| (Cost $111,293,917) | 130,137,449 | ||
| Equity Funds - 40.9% | |||
| Diversified Emerging Markets Funds - 40.9% | |||
| Fidelity Emerging Markets Fund (d) | 18,366,458 | 886,916,276 | |
| Fidelity SAI Emerging Markets Index Fund (d) | 33,734,203 | 595,071,338 | |
| Fidelity SAI Emerging Markets Low Volatility Index Fund (d) | 42,491,864 | 491,205,946 | |
| Fidelity SAI Emerging Markets Value Index Fund (a)(d) | 72,745,009 | 1,092,630,032 | |
| TOTAL EQUITY FUNDS | |||
| (Cost $2,402,493,689) | 3,065,823,592 | ||
| U.S. Treasury Obligations - 0.3% | |||
| U.S. Treasury Bills, yield at date of purchase 0.01% to 0.02% 7/1/21 to 8/19/21 (e) | |||
| (Cost $22,659,565) | 22,660,000 | 22,659,575 | |
| Money Market Funds - 5.0% | |||
| Fidelity Cash Central Fund 0.03% (f) | 78,406,953 | 78,422,634 | |
| Fidelity Securities Lending Cash Central Fund 0.03% (f)(g) | 24,234,883 | 24,237,307 | |
| Invesco Government & Agency Portfolio Institutional Class .03% (h) | 276,270,062 | 276,270,062 | |
| TOTAL MONEY MARKET FUNDS | |||
| (Cost $378,909,860) | 378,930,003 | ||
| TOTAL INVESTMENT IN SECURITIES - 100.4% | |||
| (Cost $5,869,712,571) | 7,537,082,646 | ||
| NET OTHER ASSETS (LIABILITIES) - (0.4)% | (33,140,589) | ||
| NET ASSETS - 100% | $7,503,942,057 |
| Futures Contracts | |||||
| Number of contracts | Expiration Date | Notional Amount | Value | Unrealized Appreciation/(Depreciation) | |
| Purchased | |||||
| Equity Index Contracts | |||||
| ICE E-mini MSCI Emerging Markets Index Contracts (United States) | 4,002 | June 2021 | $272,316,090 | $7,255,227 | $7,255,227 |
The notional amount of futures purchased as a percentage of Net Assets is 3.6%
For the period, the average monthly notional amount at value for futures contracts in the aggregate was $326,168,415.
Legend
(a) Non-income producing
(b) Security or a portion of the security is on loan at period end.
(c) Security exempt from registration under Rule 144A of the Securities Act of 1933. These securities may be resold in transactions exempt from registration, normally to qualified institutional buyers. At the end of the period, the value of these securities amounted to $150,278,736 or 2.0% of net assets.
(d) Affiliated Fund
(e) Security or a portion of the security was pledged to cover margin requirements for futures contracts. At period end, the value of securities pledged amounted to $16,820,657.
(f) Affiliated fund that is generally available only to investment companies and other accounts managed by Fidelity Investments. The rate quoted is the annualized seven-day yield of the fund at period end. A complete unaudited listing of the fund's holdings as of its most recent quarter end is available upon request. In addition, each Fidelity Central Fund's financial statements, which are not covered by the Fund's Report of Independent Registered Public Accounting Firm, are available on the SEC's website or upon request.
(g) Investment made with cash collateral received from securities on loan.
(h) The rate quoted is the annualized seven-day yield of the fund at period end.
Affiliated Central Funds
Information regarding fiscal year to date income earned by the Fund from investments in Fidelity Central Funds is as follows:
| Fund | Income earned |
| Fidelity Cash Central Fund | $44,100 |
| Fidelity Securities Lending Cash Central Fund | 144,115 |
| Total | $188,215 |
Amounts in the income column in the above table include any capital gain distributions from underlying funds, which are presented in the corresponding line-item in the Statement of Operations, if applicable. Amount for Fidelity Securities Lending Cash Central Fund represents the income earned on investing cash collateral, less rebates paid to borrowers and any lending agent fees associated with the loan, plus any premium payments received for lending certain types of securities.
Affiliated Underlying Funds
Fiscal year to date information regarding the Fund's investments in affiliated Underlying Funds, excluding any Money Market Central Funds, is presented below. Exchanges between classes of the same affiliated Underlying Funds may occur.
| Affiliate | Value, beginning of period | Purchases | Sales Proceeds | Dividend Income | Realized Gain (loss) | Change in Unrealized appreciation (depreciation) | Value, end of period |
| Fidelity Emerging Markets Fund | $335,597,285 | $348,887,064 | $-- | $8,887,064 | $-- | $202,431,927 | $886,916,276 |
| Fidelity SAI Emerging Markets Index Fund | 842,100,133 | 144,074,917 | 639,456,156 | 9,239,525 | 19,465,667 | 228,886,777 | 595,071,338 |
| Fidelity SAI Emerging Markets Low Volatility Index Fund | 166,174,301 | 236,099,987 | -- | 6,099,986 | -- | 88,931,658 | 491,205,946 |
| Fidelity SAI Emerging Markets Value Index Fund | 21,609,000 | 874,400,281 | -- | 9,400,285 | -- | 196,620,751 | 1,092,630,032 |
| Total | $1,365,480,719 | $1,603,462,249 | $639,456,156 | $33,626,860 | $19,465,667 | $716,871,113 | $3,065,823,592 |
Amounts in the income column in the above table include any capital gain distributions from underlying funds, which are presented in the corresponding line-item in the Statement of Operations, if applicable.
Investment Valuation
The following is a summary of the inputs used, as of May 31, 2021, involving the Fund's assets and liabilities carried at fair value. The inputs or methodology used for valuing securities may not be an indication of the risk associated with investing in those securities. For more information on valuation inputs, and their aggregation into the levels used below, please refer to the Investment Valuation section in the accompanying Notes to Financial Statements.
| Valuation Inputs at Reporting Date: | ||||
| Description | Total | Level 1 | Level 2 | Level 3 |
| Investments in Securities: | ||||
| Equities: | ||||
| Communication Services | $409,470,167 | $404,665,263 | $4,804,904 | $-- |
| Consumer Discretionary | 713,115,211 | 713,115,211 | -- | -- |
| Consumer Staples | 324,030,514 | 324,030,514 | -- | -- |
| Energy | 167,500,384 | 167,500,384 | -- | -- |
| Financials | 843,266,423 | 796,027,982 | 47,238,441 | -- |
| Health Care | 151,209,432 | 151,209,432 | -- | -- |
| Industrials | 202,208,124 | 202,208,124 | -- | -- |
| Information Technology | 903,499,078 | 903,499,078 | -- | -- |
| Materials | 317,341,780 | 317,341,780 | -- | -- |
| Real Estate | 23,090,736 | 23,090,736 | -- | -- |
| Utilities | 14,937,627 | 14,937,627 | -- | -- |
| Equity Funds | 3,065,823,592 | 3,065,823,592 | -- | -- |
| Other Short-Term Investments | 22,659,575 | -- | 22,659,575 | -- |
| Money Market Funds | 378,930,003 | 378,930,003 | -- | -- |
| Total Investments in Securities: | $7,537,082,646 | $7,462,379,726 | $74,702,920 | $-- |
| Derivative Instruments: | ||||
| Assets | ||||
| Futures Contracts | $7,255,227 | $7,255,227 | $-- | $-- |
| Total Assets | $7,255,227 | $7,255,227 | $-- | $-- |
| Total Derivative Instruments: | $7,255,227 | $7,255,227 | $-- | $-- |
Value of Derivative Instruments
The following table is a summary of the Fund's value of derivative instruments by primary risk exposure as of May 31, 2021. For additional information on derivative instruments, please refer to the Derivative Instruments section in the accompanying Notes to Financial Statements.
| Primary Risk Exposure / Derivative Type | Value | |
| Asset | Liability | |
| Equity Risk | ||
| Futures Contracts(a) | $7,255,227 | $0 |
| Total Equity Risk | 7,255,227 | 0 |
| Total Value of Derivatives | $7,255,227 | $0 |
(a) Reflects gross cumulative appreciation (depreciation) on futures contracts as presented in the Schedule of Investments. In the Statement of Assets and Liabilities, the period end daily variation margin is included in receivable or payable for daily variation margin on futures contracts, and the net cumulative appreciation (depreciation) is included in Total accumulated earnings (loss).
Other Information
Distribution of the direct investments by country of issue, as a percentage of Total Net Assets, is as follows (Unaudited):
| United States of America | 46.0% |
| Cayman Islands | 13.2% |
| Taiwan | 7.5% |
| Korea (South) | 7.3% |
| China | 6.3% |
| India | 5.5% |
| Brazil | 3.2% |
| South Africa | 2.0% |
| Mexico | 1.6% |
| Russia | 1.5% |
| Hong Kong | 1.4% |
| Others (Individually Less Than 1%) | 4.5% |
| 100.0% |
See accompanying notes which are an integral part of the financial statements.
Financial Statements
Statement of Assets and Liabilities
| May 31, 2021 | ||
| Assets | ||
| Investment in securities, at value (including securities loaned of $23,626,506) — See accompanying schedule: Unaffiliated issuers (cost $3,364,579,084) | $4,368,599,113 | |
| Fidelity Central Funds (cost $102,639,798) | 102,659,941 | |
| Other affiliated issuers (cost $2,402,493,689) | 3,065,823,592 | |
| Total Investment in Securities (cost $5,869,712,571) | $7,537,082,646 | |
| Cash | 184,471 | |
| Foreign currency held at value (cost $3,494,246) | 3,400,789 | |
| Receivable for investments sold | 7,481,877 | |
| Receivable for fund shares sold | 10,691,927 | |
| Dividends receivable | 6,218,429 | |
| Interest receivable | 12,832 | |
| Distributions receivable from Fidelity Central Funds | 12,856 | |
| Receivable for daily variation margin on futures contracts | 1,600,480 | |
| Prepaid expenses | 16,950 | |
| Other receivables | 404,437 | |
| Total assets | 7,567,107,694 | |
| Liabilities | ||
| Payable for investments purchased | $24,258,234 | |
| Payable for fund shares redeemed | 1,998,216 | |
| Accrued management fee | 1,392,790 | |
| Other payables and accrued expenses | 11,280,147 | |
| Collateral on securities loaned | 24,236,250 | |
| Total liabilities | 63,165,637 | |
| Net Assets | $7,503,942,057 | |
| Net Assets consist of: | ||
| Paid in capital | $5,697,488,428 | |
| Total accumulated earnings (loss) | 1,806,453,629 | |
| Net Assets | $7,503,942,057 | |
| Net Asset Value, offering price and redemption price per share ($7,503,942,057 ÷ 477,938,178 shares) | $15.70 |
See accompanying notes which are an integral part of the financial statements.
Statement of Operations
| Year ended May 31, 2021 | ||
| Investment Income | ||
| Dividends: | ||
| Unaffiliated issuers | $48,916,301 | |
| Affiliated issuers | 24,881,125 | |
| Interest | 142,711 | |
| Income from Fidelity Central Funds (including $144,115 from security lending) | 188,215 | |
| Income before foreign taxes withheld | 74,128,352 | |
| Less foreign taxes withheld | (6,320,147) | |
| Total income | 67,808,205 | |
| Expenses | ||
| Management fee | $25,335,246 | |
| Custodian fees and expenses | 484,949 | |
| Independent trustees' fees and expenses | 44,421 | |
| Registration fees | 485,239 | |
| Audit | 63,997 | |
| Legal | 11,218 | |
| Miscellaneous | 49,659 | |
| Total expenses before reductions | 26,474,729 | |
| Expense reductions | (13,750,951) | |
| Total expenses after reductions | 12,723,778 | |
| Net investment income (loss) | 55,084,427 | |
| Realized and Unrealized Gain (Loss) | ||
| Net realized gain (loss) on: | ||
| Investment securities: | ||
| Unaffiliated issuers (net of foreign taxes of $820,303) | 98,346,019 | |
| Fidelity Central Funds | (2,201) | |
| Other affiliated issuers | 19,465,667 | |
| Foreign currency transactions | (4,456,584) | |
| Futures contracts | 150,134,754 | |
| Capital gain distributions from underlying funds: | ||
| Affiliated issuers | 8,745,735 | |
| Total net realized gain (loss) | 272,233,390 | |
| Change in net unrealized appreciation (depreciation) on: | ||
| Investment securities: | ||
| Unaffiliated issuers (net of increase in deferred foreign taxes of $10,831,335) | 961,618,214 | |
| Affiliated issuers | 716,871,113 | |
| Assets and liabilities in foreign currencies | 23,035 | |
| Futures contracts | (25,886,836) | |
| Total change in net unrealized appreciation (depreciation) | 1,652,625,526 | |
| Net gain (loss) | 1,924,858,916 | |
| Net increase (decrease) in net assets resulting from operations | $1,979,943,343 |
See accompanying notes which are an integral part of the financial statements.
Statement of Changes in Net Assets
| Year ended May 31, 2021 | Year ended May 31, 2020 | |
| Increase (Decrease) in Net Assets | ||
| Operations | ||
| Net investment income (loss) | $55,084,427 | $59,865,849 |
| Net realized gain (loss) | 272,233,390 | (118,494,533) |
| Change in net unrealized appreciation (depreciation) | 1,652,625,526 | (21,079,610) |
| Net increase (decrease) in net assets resulting from operations | 1,979,943,343 | (79,708,294) |
| Distributions to shareholders | (42,636,300) | (58,777,125) |
| Share transactions | ||
| Proceeds from sales of shares | 3,477,545,708 | 1,609,511,839 |
| Reinvestment of distributions | 42,188,485 | 56,678,011 |
| Cost of shares redeemed | (929,486,679) | (495,169,459) |
| Net increase (decrease) in net assets resulting from share transactions | 2,590,247,514 | 1,171,020,391 |
| Total increase (decrease) in net assets | 4,527,554,557 | 1,032,534,972 |
| Net Assets | ||
| Beginning of period | 2,976,387,500 | 1,943,852,528 |
| End of period | $7,503,942,057 | $2,976,387,500 |
| Other Information | ||
| Shares | ||
| Sold | 252,627,825 | 149,103,119 |
| Issued in reinvestment of distributions | 2,895,572 | 4,725,743 |
| Redeemed | (66,023,143) | (46,868,850) |
| Net increase (decrease) | 189,500,254 | 106,960,012 |
See accompanying notes which are an integral part of the financial statements.
Financial Highlights
Strategic Advisers Fidelity Emerging Markets Fund
| Years ended May 31, | 2021 | 2020 | 2019 A |
| Selected Per–Share Data | |||
| Net asset value, beginning of period | $10.32 | $10.71 | $10.00 |
| Income from Investment Operations | |||
| Net investment income (loss)B | .15 | .26C | .18 |
| Net realized and unrealized gain (loss) | 5.34 | (.39) | .67 |
| Total from investment operations | 5.49 | (.13) | .85 |
| Distributions from net investment income | (.11) | (.26) | (.14) |
| Total distributions | (.11) | (.26) | (.14) |
| Net asset value, end of period | $15.70 | $10.32 | $10.71 |
| Total ReturnD,E | 53.25% | (1.58)% | 8.63% |
| Ratios to Average Net AssetsF,G | |||
| Expenses before reductions | .51% | .49% | .57%H |
| Expenses net of fee waivers, if any | .25% | .24% | .32%H |
| Expenses net of all reductions | .24% | .23% | .31%H |
| Net investment income (loss) | 1.05% | 2.35%C | 2.82%H |
| Supplemental Data | |||
| Net assets, end of period (000 omitted) | $7,503,942 | $2,976,388 | $1,943,853 |
| Portfolio turnover rateI | 47% | 49% | 125%H |
A For the period October 30, 2018 (commencement of operations) to May 31, 2019.
B Calculated based on average shares outstanding during the period.
C Net investment income per share reflects one or more large, non-recurring dividend(s) which amounted to $.06 per share. Excluding such non-recurring dividend(s), the ratio of net investment income (loss) to average net assets would have been 1.80%.
D Total returns for periods of less than one year are not annualized.
E Total returns would have been lower if certain expenses had not been reduced during the applicable periods shown.
F Fees and expenses of any underlying mutual funds or exchange-traded funds (ETFs) are not included in the Fund's expense ratio. The Fund indirectly bears its proportionate share of these expenses. For additional expense information related to investments in Fidelity Central Funds, please refer to the "Investments in Fidelity Central Funds" note found in the Notes to Financial Statements section of the most recent Annual or Semi-Annual report.
G Expense ratios reflect operating expenses of the class. Expenses before reductions do not reflect amounts reimbursed, waived, or reduced through arrangements with the investment advisor, brokerage services, or other offset arrangements, if applicable, and do not represent the amount paid by the class during periods when reimbursements, waivers or reductions occur.
H Annualized
I Amount does not include the portfolio activity of any underlying mutual funds or exchange-traded funds (ETFs).
See accompanying notes which are an integral part of the financial statements.
Notes to Financial Statements
For the period ended May 31, 2021
1. Organization.
Strategic Advisers Fidelity Emerging Markets Fund (the Fund) is a fund of Fidelity Rutland Square Trust II (the Trust), and is authorized to issue an unlimited number of shares. The Trust is registered under the Investment Company Act of 1940, as amended (the 1940 Act), as an open-end management investment company organized as a Delaware statutory trust. The Fund is offered exclusively to certain managed account clients of Strategic Advisers LLC (Strategic Advisers), an affiliate of Fidelity Management & Research Company LLC (FMR). The Fund's investments in emerging markets can be subject to social, economic, regulatory, and political uncertainties and can be extremely volatile.
2. Significant Accounting Policies.
The Fund is an investment company and applies the accounting and reporting guidance of the Financial Accounting Standards Board (FASB) Accounting Standards Codification Topic 946 Financial Services - Investment Companies. The financial statements have been prepared in conformity with accounting principles generally accepted in the United States of America (GAAP), which require management to make certain estimates and assumptions at the date of the financial statements. Actual results could differ from those estimates. Subsequent events, if any, through the date that the financial statements were issued have been evaluated in the preparation of the financial statements. The Fund's Schedule of Investments lists any underlying mutual funds or exchange-traded funds (ETFs) but does not include the underlying holdings of these funds. The following summarizes the significant accounting policies of the Fund:
Investment Valuation. Investments are valued as of 4:00 p.m. Eastern time on the last calendar day of the period. The Board of Trustees (the Board) has delegated the day to day responsibility for the valuation of the Fund's investments to the Fair Value Committee (the Committee) established by the Fund's investment adviser. In accordance with valuation policies and procedures approved by the Board, the Fund attempts to obtain prices from one or more third party pricing vendors or brokers to value its investments. When current market prices, quotations or currency exchange rates are not readily available or reliable, investments will be fair valued in good faith by the Committee, in accordance with procedures adopted by the Board. Factors used in determining fair value vary by investment type and may include market or investment specific events, changes in interest rates and credit quality. The frequency with which these procedures are used cannot be predicted and they may be utilized to a significant extent. The Committee oversees the Fund's valuation policies and procedures and reports to the Board on the Committee's activities and fair value determinations. The Board monitors the appropriateness of the procedures used in valuing the Fund's investments and ratifies the fair value determinations of the Committee.
The Fund categorizes the inputs to valuation techniques used to value its investments into a disclosure hierarchy consisting of three levels as shown below:
- Level 1 – quoted prices in active markets for identical investments
- Level 2 – other significant observable inputs (including quoted prices for similar investments, interest rates, prepayment speeds, etc.)
- Level 3 – unobservable inputs (including the Fund's own assumptions based on the best information available)
Valuation techniques used to value the Fund's investments by major category are as follows:
Equity securities, including restricted securities, for which market quotations are readily available, are valued at the last reported sale price or official closing price as reported by a third party pricing vendor on the primary market or exchange on which they are traded and are categorized as Level 1 in the hierarchy. In the event there were no sales during the day or closing prices are not available, securities are valued at the last quoted bid price or may be valued using the last available price and are generally categorized as Level 2 in the hierarchy. For foreign equity securities, when market or security specific events arise, comparisons to the valuation of American Depositary Receipts (ADRs), futures contracts, Exchange-Traded Funds (ETFs) and certain indexes as well as quoted prices for similar securities may be used and would be categorized as Level 2 in the hierarchy. For equity securities, including restricted securities, where observable inputs are limited, assumptions about market activity and risk are used and these securities may be categorized as Level 3 in the hierarchy.
Debt securities, including restricted securities, are valued based on evaluated prices received from third party pricing vendors or from brokers who make markets in such securities. U.S. government and government agency obligations are valued by pricing vendors who utilize matrix pricing which considers yield or price of bonds of comparable quality, coupon, maturity and type or by broker-supplied prices. When independent prices are unavailable or unreliable, debt securities may be valued utilizing pricing methodologies which consider similar factors that would be used by third party pricing vendors. Debt securities are generally categorized as Level 2 in the hierarchy but may be Level 3 depending on the circumstances.
Futures contracts are valued at the settlement price established each day by the board of trade or exchange on which they are traded and are categorized as Level 1 in the hierarchy. Investments in open-end mutual funds, including the Fidelity Central Funds, are valued at their closing net asset value (NAV) each business day and are categorized as Level 1 in the hierarchy. If an unaffiliated open-end mutual fund's NAV is unavailable, shares of that fund may be valued by another method that the Board believes reflects fair value in accordance with the Board's fair value pricing policies and is categorized as Level 2 in the hierarchy.
Changes in valuation techniques may result in transfers in or out of an assigned level within the disclosure hierarchy. The aggregate value of investments by input level as of May 31, 2021 is included at the end of the Fund's Schedule of Investments.
Foreign Currency. Certain Funds may use foreign currency contracts to facilitate transactions in foreign-denominated securities. Gains and losses from these transactions may arise from changes in the value of the foreign currency or if the counterparties do not perform under the contracts' terms.
Foreign-denominated assets, including investment securities, and liabilities are translated into U.S. dollars at the exchange rates at period end. Purchases and sales of investment securities, income and dividends received, and expenses denominated in foreign currencies are translated into U.S. dollars at the exchange rate in effect on the transaction date.
The effects of exchange rate fluctuations on investments are included with the net realized and unrealized gain (loss) on investment securities. Other foreign currency transactions resulting in realized and unrealized gain (loss) are disclosed separately.
Investment Transactions and Income. For financial reporting purposes, the Fund's investment holdings and NAV include trades executed through the end of the last business day of the period. The NAV per share for processing shareholder transactions is calculated as of the close of business of the New York Stock Exchange (NYSE), normally 4:00 p.m. Eastern time and includes trades executed through the end of the prior business day. Gains and losses on securities sold are determined on the basis of identified cost. Dividend income is recorded on the ex-dividend date, except for certain dividends from foreign securities where the ex-dividend date may have passed, which are recorded as soon as the Fund is informed of the ex-dividend date. Non-cash dividends included in dividend income, if any, are recorded at the fair market value of the securities received. Income and capital gain distributions from Fidelity Central Funds, if any, are recorded on the ex-dividend date. Income and capital gain distributions from any underlying mutual funds or exchange-traded funds (ETFs) are recorded on the ex-dividend date. Certain distributions received by the Fund represent a return of capital or capital gain. The Fund determines the components of these distributions subsequent to the ex-dividend date, based upon receipt of tax filings or other correspondence relating to the underlying investment. These distributions are recorded as a reduction of cost of investments and/or as a realized gain. Interest income is accrued as earned and includes coupon interest and amortization of premium and accretion of discount on debt securities as applicable. Investment income is recorded net of foreign taxes withheld where recovery of such taxes is uncertain.
Expenses. Expenses directly attributable to a fund are charged to that fund. Expenses attributable to more than one fund are allocated among the respective funds on the basis of relative net assets or other appropriate methods. Expenses included in the accompanying financial statements reflect the expenses of that fund and do not include any expenses associated with any underlying mutual funds or exchange-traded funds. Although not included in a fund's expenses, a fund indirectly bears its proportionate share of these expenses through the net asset value of each underlying mutual fund or exchange-traded fund. Expense estimates are accrued in the period to which they relate and adjustments are made when actual amounts are known.
Deferred Trustee Compensation. Under a Deferred Compensation Plan (the Plan) for certain Funds, certain independent Trustees have elected to defer receipt of a portion of their annual compensation. Deferred amounts are invested in affiliated mutual funds, are marked-to-market and remain in a fund until distributed in accordance with the Plan. The investment of deferred amounts and the offsetting payable to the Trustees presented below are included in the accompanying Statement of Assets and Liabilities in other receivables and other payables and accrued expenses, as applicable.
| Strategic Advisers Fidelity Emerging Markets Fund | $12 |
Income Tax Information and Distributions to Shareholders. Each year, the Fund intends to qualify as a regulated investment company under Subchapter M of the Internal Revenue Code, including distributing substantially all of its taxable income and realized gains. As a result, no provision for U.S. Federal income taxes is required. As of May 31, 2021, the Fund did not have any unrecognized tax benefits in the financial statements; nor is the Fund aware of any tax positions for which it is reasonably possible that the total amounts of unrecognized tax benefits will significantly change in the next twelve months. The Fund files a U.S. federal tax return, in addition to state and local tax returns as required. The Fund's federal income tax returns are subject to examination by the Internal Revenue Service (IRS) for a period of three fiscal years after they are filed. State and local tax returns may be subject to examination for an additional fiscal year depending on the jurisdiction. Foreign taxes are provided for based on the Fund's understanding of the tax rules and rates that exist in the foreign markets in which it invests. The Fund is subject to a tax imposed on capital gains by certain countries in which it invests. An estimated deferred tax liability for net unrealized appreciation on the applicable securities is included in Other payables and accrued expenses on the Statement of Assets & Liabilities.
Distributions are declared and recorded on the ex-dividend date. Income and capital gain distributions are determined in accordance with income tax regulations, which may differ from GAAP. In addition, the Fund claimed a portion of the payment made to redeeming shareholders as a distribution for income tax purposes.
Capital accounts within the financial statements are adjusted for permanent book-tax differences. These adjustments have no impact on net assets or the results of operations. Capital accounts are not adjusted for temporary book-tax differences which will reverse in a subsequent period.
Book-tax differences are primarily due to the short-term gain distributions from the underlying mutual funds or exchange-traded funds (ETFs), futures contracts, foreign currency transactions, certain foreign taxes, passive foreign investment companies (PFIC), deferred Trustees compensation, capital loss carryforwards and losses deferred due to wash sales.
As of period end, the cost and unrealized appreciation (depreciation) in securities, and derivatives if applicable, for federal income tax purposes were as follows:
| Gross unrealized appreciation | $1,715,288,636 |
| Gross unrealized depreciation | (84,712,980) |
| Net unrealized appreciation (depreciation) | $1,630,575,656 |
| Tax Cost | $5,906,506,990 |
The tax-based components of distributable earnings as of period end were as follows:
| Undistributed ordinary income | $8,752,703 |
| Undistributed long-term capital gain | $177,997,765 |
| Net unrealized appreciation (depreciation) on securities and other investments | $1,630,518,224 |
The tax character of distributions paid was as follows:
| May 31, 2021 | May 31, 2020 | |
| Ordinary Income | $42,636,300 | $ 58,777,125 |
Restricted Securities (including Private Placements). Funds may invest in securities that are subject to legal or contractual restrictions on resale. These securities generally may be resold in transactions exempt from registration or to the public if the securities are registered. Disposal of these securities may involve time-consuming negotiations and expense, and prompt sale at an acceptable price may be difficult. Information regarding restricted securities held at period end is included at the end of the Schedule of Investments, if applicable.
3. Derivative Instruments.
Risk Exposures and the Use of Derivative Instruments. The Fund's investment objective allows the Fund to enter into various types of derivative contracts, including futures contracts. Derivatives are investments whose value is primarily derived from underlying assets, indices or reference rates and may be transacted on an exchange or over-the-counter (OTC). Derivatives may involve a future commitment to buy or sell a specified asset based on specified terms, to exchange future cash flows at periodic intervals based on a notional principal amount, or for one party to make one or more payments upon the occurrence of specified events in exchange for periodic payments from the other party.
The Fund used derivatives to increase returns and to manage exposure to certain risks as defined below. The success of any strategy involving derivatives depends on analysis of numerous economic factors, and if the strategies for investment do not work as intended, the Fund may not achieve its objectives.
The Fund's use of derivatives increased or decreased its exposure to the following risk:
| Equity Risk | Equity risk relates to the fluctuations in the value of financial instruments as a result of changes in market prices (other than those arising from interest rate risk or foreign exchange risk), whether caused by factors specific to an individual investment, its issuer, or all factors affecting all instruments traded in a market or market segment. |
The Fund is also exposed to additional risks from investing in derivatives, such as liquidity risk and counterparty credit risk. Liquidity risk is the risk that the Fund will be unable to close out the derivative in the open market in a timely manner. Counterparty credit risk is the risk that the counterparty will not be able to fulfill its obligation to the Fund. Counterparty credit risk related to exchange-traded futures contracts may be mitigated by the protection provided by the exchange on which they trade.
Investing in derivatives may involve greater risks than investing in the underlying assets directly and, to varying degrees, may involve risk of loss in excess of any initial investment and collateral received and amounts recognized in the Statement of Assets and Liabilities. In addition, there may be the risk that the change in value of the derivative contract does not correspond to the change in value of the underlying instrument.
Futures Contracts. A futures contract is an agreement between two parties to buy or sell a specified underlying instrument for a fixed price at a specified future date. The Fund used futures contracts to manage its exposure to the stock market.
Upon entering into a futures contract, a fund is required to deposit either cash or securities (initial margin) with a clearing broker in an amount equal to a certain percentage of the face value of the contract. Futures contracts are marked-to-market daily and subsequent daily payments (variation margin) are made or received by a fund depending on the daily fluctuations in the value of the futures contracts and are recorded as unrealized appreciation or (depreciation). This receivable and/or payable, if any, is included in daily variation margin on futures contracts in the Statement of Assets and Liabilities. Realized gain or (loss) is recorded upon the expiration or closing of a futures contract. The net realized gain (loss) and change in net unrealized appreciation (depreciation) on futures contracts during the period is presented in the Statement of Operations.
Any open futures contracts at period end are presented in the Schedule of Investments under the caption "Futures Contracts". The notional amount at value reflects each contract's exposure to the underlying instrument or index at period end. Securities deposited to meet initial margin requirements are identified in the Schedule of Investments.
4. Purchases and Sales of Investments.
Purchases and sales of securities, other than short-term securities are noted in the table below.
| Purchases ($) | Sales ($) | |
| Strategic Advisers Fidelity Emerging Markets Fund | 4,903,630,090 | 2,248,961,500 |
5. Fees and Other Transactions with Affiliates.
Management Fee. Strategic Advisers (the investment adviser) provides the Fund with investment management related services. For these services, the Fund pays a monthly management fee to the investment adviser. The management fee is calculated by adding the annual management fee rate of .25% of the Fund's average net assets throughout the month to the aggregate of the fee rates, payable monthly by the investment adviser, to the Fund's sub-advisers. The Fund's maximum aggregate management fee will not exceed 1.20% of the Fund's average net assets. For the reporting period, the total annual management fee rate was .48% of the Fund's average net assets.
During the period, the investment adviser waived a portion of its management fee as described in the Expense Reductions note.
Sub-Advisers. FIAM LLC (an affiliate of the investment adviser) and FIL Investment Advisors each served as a sub-adviser for the Fund during the period. Sub-advisers provide discretionary investment advisory services for their allocated portion of the Fund's assets and are paid as described in the Management Fee note.
Geode Capital Management, LLC (Geode) has been retained to serve as a sub-adviser for the Fund. As of the date of this report, however, Geode has not been allocated any portion of the Fund's assets. Geode in the future may provide discretionary investment advisory services for an allocated portion of the Fund's assets and will be paid by the investment adviser for providing these services.
Brokerage Commissions. A portion of portfolio transactions were placed with brokerage firms which are affiliates of the investment adviser. Brokerage commissions are included in net realized gain (loss) and change in net unrealized appreciation (depreciation) in the Statement of Operations. The commissions paid to these affiliated firms were as follows:
| Amount | |
| Strategic Advisers Fidelity Emerging Markets Fund | $15,652 |
Interfund Trades. Funds may purchase from or sell securities to other funds affiliated with each sub-adviser under procedures adopted by the Board. The procedures have been designed to ensure these interfund trades are executed in accordance with Rule 17a-7 of the 1940 Act. Any interfund trades are included within the respective purchases and sales amounts shown in the Purchases and Sales of Investments note and are noted in the table below.
| Purchases ($) | Sales ($) | |
| Strategic Advisers Fidelity Emerging Markets Fund | 34,541,183 | 31,737,685 |
6. Investments in Fidelity Central Funds.
Funds may invest in Fidelity Central Funds, which are open-end investment companies generally available only to other investment companies and accounts managed by the investment adviser and its affiliates. The Schedule of Investments lists any Fidelity Central Funds held as an investment as of period end, but does not include the underlying holdings of each Fidelity Central Fund. An investing fund indirectly bears its proportionate share of the expenses of the underlying Fidelity Central Funds.
Based on its investment objective, each Fidelity Central Fund may invest or participate in various investment vehicles or strategies that are similar to those of the investing fund. These strategies are consistent with the investment objectives of the investing fund and may involve certain economic risks which may cause a decline in value of each of the Fidelity Central Funds and thus a decline in the value of the investing fund.
A complete unaudited list of holdings for each Fidelity Central Fund is available upon request or at the Securities and Exchange Commission website at www.sec.gov. In addition, the financial statements of the Fidelity Central Funds, which are not covered by the Report of Independent Registered Public Accounting Firm, are available on the Securities and Exchange Commission website or upon request.
| Fidelity Central Fund | Investment Manager | Investment Objective | Investment Practices | Expense Ratio(a) |
| Fidelity Money Market Central Funds | Fidelity Management & Research Company LLC (FMR) | Each fund seeks to obtain a high level of current income consistent with the preservation of capital and liquidity. | Short-term Investments | Less than .005% to .01% |
(a) Expenses expressed as a percentage of average net assets and are as of each underlying Central Fund's most recent annual or semi-annual shareholder report.
7. Committed Line of Credit.
Certain Funds participate with other funds managed by the investment adviser or an affiliate in a $4.25 billion credit facility (the "line of credit") to be utilized for temporary or emergency purposes to fund shareholder redemptions or for other short-term liquidity purposes. The participating funds have agreed to pay commitment fees on their pro-rata portion of the line of credit, which are reflected in Miscellaneous expenses on the Statement of Operations, and are listed below. During the period, there were no borrowings on this line of credit.
| Amount | |
| Strategic Advisers Fidelity Emerging Markets Fund | $9,551 |
8. Security Lending.
Funds lend portfolio securities through a lending agent from time to time in order to earn additional income. On the settlement date of the loan, a fund receives collateral (in the form of U.S. Treasury obligations, letters of credit and/or cash) against the loaned securities and maintains collateral in an amount not less than 100% of the market value of the loaned securities during the period of the loan. The market value of the loaned securities is determined at the close of business of a fund and any additional required collateral is delivered to a fund on the next business day. A fund or borrower may terminate the loan at any time, and if the borrower defaults on its obligation to return the securities loaned because of insolvency or other reasons, a fund may apply collateral received from the borrower against the obligation. A fund may experience delays and costs in recovering the securities loaned. Any cash collateral received is invested in the Fidelity Securities Lending Cash Central Fund. Any loaned securities are identified as such in the Schedule of Investments, and the value of loaned securities and cash collateral at period end, as applicable, are presented in the Statement of Assets and Liabilities. Security lending income represents the income earned on investing cash collateral, less rebates paid to borrowers and any lending agent fees associated with the loan, plus any premium payments received for lending certain types of securities. Security lending income is presented in the Statement of Operations as a component of income from Fidelity Central Funds.
9. Expense Reductions.
The investment adviser has contractually agreed to waive the Fund's management fee in an amount equal to .25% of the Fund's average net assets until September 30, 2023. During the period, this waiver reduced the Fund's management fee by $13,153,665.
Commissions paid to certain brokers with whom the investment adviser, or its affiliates, places trades on behalf of the Fund include an amount in addition to trade execution, which may be rebated back to the Fund to offset expenses. This amount totaled $594,794 for the period.
In addition, through arrangements with the Fund's custodian, credits realized as a result of certain uninvested cash balances were used to reduce the Fund's expenses by $2,492.
10. Other.
Fund's organizational documents provide former and current trustees and officers with a limited indemnification against liabilities arising in connection with the performance of their duties to the fund. In the normal course of business, the fund may also enter into contracts that provide general indemnifications. The fund's maximum exposure under these arrangements is unknown as this would be dependent on future claims that may be made against the fund. The risk of material loss from such claims is considered remote.
Funds do not invest in underlying mutual funds for the purpose of exercising management or control; however, investments by funds within their principal investment strategies may represent a significant portion of the underlying mutual fund's net assets. At the end of the period, certain Funds were the owners of record of 10% or more of the total outstanding shares of the following underlying mutual funds as shown below.
| Fund | Strategic Advisers Fidelity Emerging Markets Fund |
| Fidelity Emerging Markets Fund | 10% |
| Fidelity SAI Emerging Markets Index Fund | 15% |
| Fidelity SAI Emerging Markets Low Volatility Index Fund | 30% |
| Fidelity SAI Emerging Markets Value Index Fund | 69% |
11. Coronavirus (COVID-19) Pandemic.
An outbreak of COVID-19 first detected in China during December 2019 has since spread globally and was declared a pandemic by the World Health Organization during March 2020. Developments that disrupt global economies and financial markets, such as the COVID-19 pandemic, may magnify factors that affect the Fund's performance.
Report of Independent Registered Public Accounting Firm
To the Board of Trustees of Fidelity Rutland Square Trust II and Shareholders of Strategic Advisers Fidelity Emerging Markets Fund
Opinion on the Financial Statements
We have audited the accompanying statement of assets and liabilities, including the schedule of investments, of Strategic Advisers Fidelity Emerging Markets Fund (one of the funds constituting Fidelity Rutland Square Trust II, referred to hereafter as the “Fund”) as of May 31, 2021, the related statement of operations for the year ended May 31, 2021, the statement of changes in net assets for each of the two years in the period ended May 31, 2021, including the related notes, and the financial highlights for each of the two years in the period ended May 31, 2021 and for the period October 30, 2018 (commencement of operations) to May 31, 2019 (collectively referred to as the “financial statements”). In our opinion, the financial statements present fairly, in all material respects, the financial position of the Fund as of May 31, 2021, the results of its operations for the year then ended, the changes in its net assets for each of the two years in the period ended May 31, 2021 and the financial highlights for each of the two years in the period ended May 31, 2021 and for the period October 30, 2018 (commencement of operations) to May 31, 2019 in conformity with accounting principles generally accepted in the United States of America.
Basis for Opinion
These financial statements are the responsibility of the Fund’s management. Our responsibility is to express an opinion on the Fund’s financial statements based on our audits. We are a public accounting firm registered with the Public Company Accounting Oversight Board (United States) (PCAOB) and are required to be independent with respect to the Fund in accordance with the U.S. federal securities laws and the applicable rules and regulations of the Securities and Exchange Commission and the PCAOB.
We conducted our audits of these financial statements in accordance with the standards of the PCAOB. Those standards require that we plan and perform the audit to obtain reasonable assurance about whether the financial statements are free of material misstatement, whether due to error or fraud.
Our audits included performing procedures to assess the risks of material misstatement of the financial statements, whether due to error or fraud, and performing procedures that respond to those risks. Such procedures included examining, on a test basis, evidence regarding the amounts and disclosures in the financial statements. Our audits also included evaluating the accounting principles used and significant estimates made by management, as well as evaluating the overall presentation of the financial statements. Our procedures included confirmation of securities owned as of May 31, 2021 by correspondence with the custodian and brokers; when replies were not received from brokers, we performed other auditing procedures. We believe that our audits provide a reasonable basis for our opinion.
/s/ PricewaterhouseCoopers LLP
Boston, Massachusetts
July 13, 2021
We have served as the auditor of one or more investment companies in the Fidelity group of funds since 1932.
Trustees and Officers
The Trustees, Members of the Advisory Board (if any), and officers of the trust and fund, as applicable, are listed below. The Board of Trustees governs the fund and is responsible for protecting the interests of shareholders. The Trustees are experienced executives who meet periodically throughout the year to oversee the fund's activities, review contractual arrangements with companies that provide services to the fund, oversee management of the risks associated with such activities and contractual arrangements, and review the fund's performance. If the interests of the fund and an underlying Fidelity® fund were to diverge, a conflict of interest could arise and affect how the Trustees and Members of the Advisory Board fulfill their fiduciary duties to the affected funds. Strategic Advisers has structured the fund to avoid these potential conflicts, although there may be situations where a conflict of interest is unavoidable. In such instances, Strategic Advisers, the Trustees, and Members of the Advisory Board would take reasonable steps to minimize and, if possible, eliminate the conflict. Each of the Trustees oversees 12 funds.
The Trustees hold office without limit in time except that (a) any Trustee may resign; (b) any Trustee may be removed by written instrument, signed by at least two-thirds of the number of Trustees prior to such removal; (c) any Trustee who requests to be retired or who has become incapacitated by illness or injury may be retired by written instrument signed by a majority of the other Trustees; and (d) any Trustee may be removed at any special meeting of shareholders by a two-thirds vote of the outstanding voting securities of the trust. Each Independent Trustee shall retire not later than the last day of the calendar year in which his or her 75th birthday occurs. The Independent Trustees may waive this mandatory retirement age policy with respect to individual Trustees. Officers and Advisory Board Members hold office without limit in time, except that any officer or Advisory Board Member may resign or may be removed by a vote of a majority of the Trustees at any regular meeting or any special meeting of the Trustees. Except as indicated, each individual has held the office shown or other offices in the same company for the past five years.
Each Trustee who is not an interested person (as defined in the 1940 Act) of the trust and the fund is referred to herein as an Independent Trustee.
The fund’s Statement of Additional Information (SAI) includes more information about the Trustees. To request a free copy, call Fidelity at 1-800-544-3455.
Experience, Skills, Attributes, and Qualifications of the Trustees. The Governance and Nominating Committee has adopted a statement of policy that describes the experience, qualifications, attributes, and skills that are necessary and desirable for potential Independent Trustee candidates (Statement of Policy). The Board believes that each Trustee satisfied at the time he or she was initially elected or appointed a Trustee, and continues to satisfy, the standards contemplated by the Statement of Policy. The Governance and Nominating Committee may also engage professional search firms to help identify potential Independent Trustee candidates with experience, qualifications, attributes, and skills consistent with the Statement of Policy. Additional criteria based on the composition and skills of the current Independent Trustees, as well as experience or skills that may be appropriate in light of future changes to board composition, business conditions, and regulatory or other developments, may be considered by the professional search firms and the Governance and Nominating Committee. In addition, the Board takes into account the Trustees' commitment and participation in Board and committee meetings, as well as their leadership of standing and ad hoc committees throughout their tenure.
In determining that a particular Trustee was and continues to be qualified to serve as a Trustee, the Board has considered a variety of criteria, none of which, in isolation, was controlling. The Board believes that, collectively, the Trustees have balanced and diverse experience, qualifications, attributes, and skills, which allow the Board to operate effectively in governing the fund and protecting the interests of shareholders. Information about the specific experience, skills, attributes, and qualifications of each Trustee, which in each case led to the Board's conclusion that the Trustee should serve (or continue to serve) as a trustee of the fund, is provided below.
Board Structure and Oversight Function. Robert A. Lawrence is an interested person and currently serves as Chairman. The Trustees have determined that an interested Chairman is appropriate and benefits shareholders because an interested Chairman has a personal and professional stake in the quality and continuity of services provided to the fund. Independent Trustees exercise their informed business judgment to appoint an individual of their choosing to serve as Chairman, regardless of whether the Trustee happens to be independent or a member of management. The Independent Trustees have determined that they can act independently and effectively without having an Independent Trustee serve as Chairman and that a key structural component for assuring that they are in a position to do so is for the Independent Trustees to constitute a substantial majority for the Board. The Independent Trustees also regularly meet in executive session. Mary C. Farrell serves as the lead Independent Trustee and as such (i) acts as a liaison between the Independent Trustees and management with respect to matters important to the Independent Trustees and (ii) with management prepares agendas for Board meetings.
Fidelity® funds are overseen by different Boards of Trustees. The fund's Board oversees asset allocation funds. Other Boards oversee Fidelity's investment-grade bond, money market, and asset allocation funds, and Fidelity's equity and high income funds. The fund may invest in Fidelity® funds overseen by such other Boards. The use of separate Boards, each with its own committee structure, allows the Trustees of each group of Fidelity® funds to focus on the unique issues of the funds they oversee, including common research, investment, and operational issues.
The Trustees primarily operate as a full Board, but also operate in committees, to facilitate the timely and efficient consideration of all matters of importance to the Trustees, the fund, and fund shareholders and to facilitate compliance with legal and regulatory requirements and oversight of the fund's activities and associated risks. The Board has charged Strategic Advisers and its affiliates with (i) identifying events or circumstances the occurrence of which could have demonstrably adverse effects on the fund's business and/or reputation; (ii) implementing processes and controls to lessen the possibility that such events or circumstances occur or to mitigate the effects of such events or circumstances if they do occur; and (iii) creating and maintaining a system designed to evaluate continuously business and market conditions in order to facilitate the identification and implementation processes described in (i) and (ii) above. Because the day-to-day operations and activities of the fund are carried out by or through Strategic Advisers, its affiliates and other service providers, the fund's exposure to risks is mitigated but not eliminated by the processes overseen by the Trustees. Board oversight of different aspects of the fund's activities is exercised primarily through the full Board, but also through the Audit and Compliance Committee. Appropriate personnel, including but not limited to the fund's Chief Compliance Officer (CCO), FMR's internal auditor, the independent accountants, the fund's Treasurer and portfolio management personnel, make periodic reports to the Board's committees, as appropriate. The responsibilities of each standing committee, including their oversight responsibilities, are described further under "Standing Committees of the Trustees."
Interested Trustees*:
Correspondence intended for a Trustee who is an interested person may be sent to Fidelity Investments, 245 Summer Street, Boston, Massachusetts 02210.
Name, Year of Birth; Principal Occupations and Other Relevant Experience+
Robert A. Lawrence (1952)
Year of Election or Appointment: 2016
Trustee
Chairman of the Board of Trustees
Mr. Lawrence also serves as Trustee of other funds. Previously, Mr. Lawrence served as a Member of the Advisory Board of certain funds. Prior to his retirement in 2008, Mr. Lawrence served as Vice President of certain Fidelity® funds (2006-2008), Senior Vice President, Head of High Income Division of Fidelity Management & Research Company (investment adviser firm, 2006-2008), and President of Fidelity Strategic Investments (investment adviser firm, 2002-2005).
Charles S. Morrison (1960)
Year of Election or Appointment: 2020
Trustee
Mr. Morrison also serves as Trustee of other funds. Previously, Mr. Morrison served as President (2017-2018) and Director (2014-2018) of Fidelity SelectCo, LLC (investment adviser firm), President of Fidelity Management & Research Company (FMR) (investment adviser firm, 2016-2018), a Director of Fidelity Investments Money Management, Inc. (investment adviser firm, 2014-2018), President, Asset Management (2014-2018), Trustee of the Fidelity Equity and High Income Funds (283 funds as of December 2018) (2014-2018), and was an employee of Fidelity Investments. Mr. Morrison also previously served as Vice President of Fidelity's Fixed Income and Asset Allocation Funds (2012-2014), President, Fixed Income (2011-2014), Vice President of Fidelity's Money Market Funds (2005-2009), President, Money Market Group Leader of FMR (2009), and Senior Vice President, Money Market Group of FMR (2004-2009). Mr. Morrison also served as Vice President of Fidelity's Bond Funds (2002-2005), certain Balanced Funds (2002-2005), and certain Asset Allocation Funds (2002-2007), and as Senior Vice President (2002-2005) of Fidelity's Bond Division.
* Determined to be an "Interested Trustee" by virtue of, among other things, his or her affiliation with the trust or various entities under common control with Strategic Advisers.
+ The information includes the Trustee's principal occupation during the last five years and other information relating to the experience, attributes, and skills relevant to the Trustee's qualifications to serve as a Trustee, which led to the conclusion that the Trustee should serve as a Trustee for the fund.
Independent Trustees:
Correspondence intended for an Independent Trustee may be sent to Fidelity Investments, P.O. Box 55235, Boston, Massachusetts 02205-5235.
Name, Year of Birth; Principal Occupations and Other Relevant Experience+
Peter C. Aldrich (1944)
Year of Election or Appointment: 2006
Trustee
Mr. Aldrich also serves as Trustee of other funds. Mr. Aldrich is a Director of the U.S. Core Property Fund (and, previously, other funds) of BlackRock Realty Group (2006-present). Previously, Mr. Aldrich served as a Managing Member of Poseidon, LLC (foreign private investment, 1998-2004), and Chairman and Managing Member of AEGIS, LLC (foreign private investment, 1997-2004). Mr. Aldrich previously was a founder, Chief Executive Officer, and Chairman of AEW Capital Management, L.P. (then “Aldrich, Eastman and Waltch, L.P.”). Mr. Aldrich also served as a Director of LivelyHood, Inc. (private corporation, 2013-2020), a Trustee for the Fidelity Rutland Square Trust (2005-2010), a Director of Zipcar, Inc. (car sharing services, 2001-2009) and as Faculty Chairman of The Research Council on Global Investment of The Conference Board (business and professional education non-profit, 1999-2004). Mr. Aldrich is a Member Emeritus of the Board of Directors of the National Bureau of Economic Research and the Board of Trustees of the Museum of Fine Arts Boston.
Mary C. Farrell (1949)
Year of Election or Appointment: 2013
Trustee
Ms. Farrell also serves as Trustee of other funds. Ms. Farrell is a Director of the W.R. Berkley Corporation (insurance provider) and President (2009-present) and Director (2006-present) of the Howard Gilman Foundation (charitable organization). Previously, Ms. Farrell was Managing Director and Chief Investment Strategist at UBS Wealth Management USA and Co-Head of UBS Wealth Management Investment Strategy & Research Group (2003-2005). Ms. Farrell also served as Investment Strategist at PaineWebber (1982-2000) and UBS PaineWebber (2000-2002). Ms. Farrell serves as Chairman of the Board of Trustees of Yale-New Haven Hospital and Vice Chairman of the Yale New Haven Health System Board and previously served as Trustee on the Board of Overseers of the New York University Stern School of Business.
Karen Kaplan (1960)
Year of Election or Appointment: 2006
Trustee
Ms. Kaplan also serves as Trustee of other funds. Ms. Kaplan is Chairman (2014-present) and Chief Executive Officer (2013-present) of Hill Holliday (advertising and specialized marketing). Ms. Kaplan is a Director of The Michaels Companies, Inc. (specialty retailer, 2015-present), Member of the Board of Governors of the Chief Executives’ Club of Boston (2010-present), Member of the Executive Committee of the Greater Boston Chamber of Commerce (2006-present), Advisory Board Member of the National Association of Corporate Directors Chapter (2012-present), Member of the Board of Trustees of the Post Office Square Trust (2012-present), Trustee of the Brigham and Women’s Hospital (2016-present), Overseer of the Boston Symphony Orchestra (2014-present), Member of the Board of Directors of The Advertising Council, Inc. (2016-present), Member of the Ron Burton Training Village Executive Board of Advisors (2018-present), Member of the Executive Committee of The Ad Council, Inc. (2019-present), and Member of the Board of Directors of The Ad Club of Boston (2020-present). Previously, Ms. Kaplan served as an Advisory Board Member of Fidelity Rutland Square Trust (2006-2010), a member of the Clinton Global Initiative (2010-2015), Director of DSM (dba Delta Dental and DentaQuest) (2004-2014), Formal Appointee of the 2015 Baker-Polito Economic Development Council, Director of Vera Bradley Inc. (designer of women’s accessories, 2012-2015), Member of the Board of Directors of the Massachusetts Conference for Women (2008-2015), Member of the Board of Directors of Jobs for Massachusetts (2012-2015), President of the Massachusetts Women’s Forum (2008-2010), Treasurer of the Massachusetts Women’s Forum (2002-2006), and Vice Chair of the Board of the Massachusetts Society for the Prevention of Cruelty to Children (2003-2010).
Christine Marcks (1955)
Year of Election or Appointment: 2020
Trustee
Ms. Marcks also serves as Trustee of other Funds. Prior to her retirement, Ms. Marcks served as Chief Executive Officer and President – Prudential Retirement (2007-2017) and Vice President for Rollover and Retirement Income Strategies (2005-2007), Prudential Financial, Inc. (financial services). Previously, Ms. Marcks served as a Member of the Advisory Board of certain Fidelity® funds (2019-2020), was Senior Vice President and Head of Financial Horizons (2002-2004) and Vice President, Strategic Marketing (2000-2002) of Voya Financial (formerly ING U.S.) (financial services), held numerous positions at Aetna Financial Services (financial services, 1987-2000) and served as an International Economist for the United States Department of the Treasury (1980-1987). Ms. Marcks also serves as a member of the Board of Trustees, Audit Committee and Benefits & Operations Committee of the YMCA Retirement Fund (2018-present), a non-profit organization providing retirement plan benefits to YMCA staff members, and as a member of the Board of Trustees of Assumption College (2019-present).
Heidi L. Steiger (1953)
Year of Election or Appointment: 2017
Trustee
Ms. Steiger also serves as Trustee of other funds. Ms. Steiger serves as Managing Partner of Topridge Associates, LLC (consulting, 2005-present) and a member of the Board of Directors (2013-present) and member of the Membership and Executive Committee (2017-present) of Business Executives for National Security (nonprofit). Previously, Ms. Steiger served as a member of the Board of Directors Chair of the Remuneration Committee of Imagine Intelligent Materials Limited (2019-2021) (technology company), a member of the Advisory Board of the joint degree program in Global Luxury Management at North Carolina State University (Raleigh, NC) and Skema (Paris) (2018-2021), a Non-Executive Director of CrowdBureau Corporation (financial technology company and index provider, 2018-2021), a member of the Global Advisory Board and Of Counsel to Signum Global Advisors (international policy and strategy, 2018-2020), Eastern Region President of The Private Client Reserve of U.S. Bancorp (banking and financial services, 2010-2015), Advisory Director of Berkshire Capital Securities, LLC (financial services, 2009-2010), President and Senior Advisor of Lowenhaupt Global Advisors, LLC (financial services, 2005-2007), and President and Contributing Editor of Worth Magazine (2004-2005) and held a variety of positions at Neuberger Berman Group, LLC (financial services, 1986-2004), including Partner and Executive Vice President and Global Head of Private Asset Management at Neuberger Berman (1999-2004). Ms. Steiger also served as a member of the Board of Directors of Nuclear Electric Insurance Ltd (insurer of nuclear utilities, 2006-2017), a member of the Board of Trustees and Audit Committee of the Eaton Vance Funds (2007-2010), a member of the Board of Directors of Aviva USA (formerly AmerUs) (insurance, 2004-2014), and a member of the Board of Trustees and Audit Committee and Chair of the Investment Committee of CIFG (financial guaranty insurance, 2009-2012), and a member of the Board of Directors of Kin Group Plc (formerly, Fitbug Holdings) (health and technology, 2016-2017).
+ The information includes the Trustee's principal occupation during the last five years and other information relating to the experience, attributes, and skills relevant to the Trustee's qualifications to serve as a Trustee, which led to the conclusion that the Trustee should serve as a Trustee for the fund.
Advisory Board Members and Officers:
Correspondence intended for a Member of the Advisory Board (if any) may be sent to Fidelity Investments, P.O. Box 55235, Boston, Massachusetts 02205-5235. Correspondence intended for an officer or Howard E. Cox, Jr. may be sent to Fidelity Investments, 245 Summer Street, Boston, Massachusetts 02210. Officers appear below in alphabetical order.
Name, Year of Birth; Principal Occupation
Ralph F. Cox (1932)
Year of Election or Appointment: 2020
Member of the Advisory Board
Mr. Cox also serves as a Member of the Advisory Board of other funds. Mr. Cox is President of RABAR Enterprises (management consulting for the petroleum industry). Mr. Cox is a Director of Abraxas Petroleum (exploration and production, 1999-present). Mr. Cox is a member of the Advisory Boards of the Business and Engineering Schools of Texas A&M University and the Engineering School of University of Texas at Austin. Previously, Mr. Cox served as Trustee of other funds (2006-2020), a Trustee for the Fidelity Rutland Square Trust (2005-2010) and as an Advisory Director of CH2M Hill Companies (engineering, 1981-2011). Mr. Ralph F. Cox and Mr. Howard E. Cox, Jr. are not related.
Howard E. Cox, Jr. (1944)
Year of Election or Appointment: 2009
Member of the Advisory Board
Mr. Cox also serves as a Member of the Advisory Board of other funds. Mr. Cox is a Partner of Greylock (venture capital, 1971-present) and a Director of Stryker Corporation (medical products and services, 1974-present). Previously, Mr. Cox served as an Advisory Board Member of Fidelity Rutland Square Trust (2006-2010). Mr. Cox also serves as a Member of the Secretary of Defense's Business Board of Directors (2008-present), a Director of Business Executives for National Security (1997-present), a Director of the Brookings Institution (2010-present), a Director of the World Economic Forum’s Young Global Leaders Foundation (2009-present), and is a Member of the Harvard Medical School Board of Fellows (2002-present). Mr. Howard E. Cox, Jr. and Mr. Ralph F. Cox are not related.
Craig S. Brown (1977)
Year of Election or Appointment: 2019
Assistant Treasurer
Mr. Brown also serves as Assistant Treasurer of other funds. Mr. Brown is an employee of Fidelity Investments (2013-present).
John J. Burke III (1964)
Year of Election or Appointment: 2018
Chief Financial Officer
Mr. Burke also serves as Chief Financial Officer of other funds. Mr. Burke serves as Head of Investment Operations for Fidelity Fund and Investment Operations (2018-present) and is an employee of Fidelity Investments (1998-present). Previously Mr. Burke served as head of Asset Management Investment Operations (2012-2018).
Jonathan Davis (1968)
Year of Election or Appointment: 2010
Assistant Treasurer
Mr. Davis also serves as Assistant Treasurer of other funds. Mr. Davis serves as Assistant Treasurer of FMR Capital, Inc. (2017-present) and is an employee of Fidelity Investments. Previously, Mr. Davis served as Vice President and Associate General Counsel of FMR LLC (diversified financial services company, 2003-2010).
Laura M. Del Prato (1964)
Year of Election or Appointment: 2018
Assistant Treasurer
Ms. Del Prato also serves as an officer of other funds. Ms. Del Prato is an employee of Fidelity Investments (2017-present). Previously, Ms. Del Prato served as President and Treasurer of The North Carolina Capital Management Trust: Cash Portfolio and Term Portfolio (2018-2020). Prior to joining Fidelity Investments, Ms. Del Prato served as a Managing Director and Treasurer of the JPMorgan Mutual Funds (2014-2017). Prior to JPMorgan, Ms. Del Prato served as a partner at Cohen Fund Audit Services (accounting firm, 2012-2013) and KPMG LLP (accounting firm, 2004-2012).
James D. Gryglewicz (1972)
Year of Election or Appointment: 2015
Chief Compliance Officer
Mr. Gryglewicz also serves as Chief Compliance Officer of other funds. Mr. Gryglewicz serves as Compliance Officer of Strategic Advisers LLC (investment adviser firm, 2015-present), Senior Vice President of Asset Management Compliance (2009-present), and is an employee of Fidelity Investments (2004-present). Previously, Mr. Gryglewicz served as Compliance Officer of Fidelity SelectCo, LLC (investment adviser firm, 2014-2019), and as Chief Compliance Officer of certain Fidelity® funds (2014-2018).
Colm A. Hogan (1973)
Year of Election or Appointment: 2016
Assistant Treasurer
Mr. Hogan also serves as an officer of other funds. Mr. Hogan serves as Assistant Treasurer of FMR Capital, Inc. (2017-present) and is an employee of Fidelity Investments (2005-present). Previously, Mr. Hogan served as Deputy Treasurer of certain Fidelity® funds (2016-2020) and Assistant Treasurer of certain Fidelity® funds (2016-2018).
Christina H. Lee (1975)
Year of Election or Appointment: 2020
Secretary and Chief Legal Officer
Ms. Lee also serves as Secretary and CLO of other funds. Ms. Lee serves as Vice President, Associate General Counsel (2014-present) and is an employee of Fidelity Investments (2007-present). Previously, Ms. Lee served as Assistant Secretary of certain funds (2018-2019).
Cynthia Lo Bessette (1969)
Year of Election or Appointment: 2020
Assistant Secretary
Ms. Lo Bessette also serves as an officer of other funds. Ms. Lo Bessette serves as CLO, Secretary, and Senior Vice President of Fidelity Management & Research Company LLC (investment adviser firm, 2019-present); and CLO of Fidelity Management & Research (Hong Kong) Limited, FMR Investment Management (UK) Limited, and Fidelity Management & Research (Japan) Limited (investment adviser firms, 2019-present). She is a Senior Vice President and Deputy General Counsel of FMR LLC (diversified financial services company, 2019-present), and is an employee of Fidelity Investments. Previously, Ms. Lo Bessette served as CLO, Secretary, and Senior Vice President of FMR Co., Inc. (investment adviser firm, 2019); Secretary of Fidelity SelectCo, LLC and Fidelity Investments Money Management, Inc. (investment adviser firms, 2019). Prior to joining Fidelity Investments, Ms. Lo Bessette was Executive Vice President, General Counsel (2016-2019) and Senior Vice President, Deputy General Counsel (2015-2016) of OppenheimerFunds (investment management company) and Deputy Chief Legal Officer (2013-2015) of Jennison Associates LLC (investment adviser firm).
Chris Maher (1972)
Year of Election or Appointment: 2016
Assistant Treasurer
Mr. Maher also serves as an officer of other funds. Mr. Maher serves as Assistant Treasurer of FMR Capital, Inc. (2017-present), and is an employee of Fidelity Investments (2008-present). Previously, Mr. Maher served as Assistant Treasurer of certain funds (2013-2020); Vice President of Asset Management Compliance (2013), Vice President of the Program Management Group of FMR (investment adviser firm, 2010-2013), and Vice President of Valuation Oversight (2008-2010).
Brett Segaloff (1972)
Year of Election or Appointment: 2021
Anti-Money Laundering (AML) Officer
Mr. Segaloff also serves as an AML Officer of other funds and other related entities. He is Director, Anti-Money Laundering (2007-present) of FMR LLC (diversified financial services company) and is an employee of Fidelity Investments (1996-present).
Stacie M. Smith (1974)
Year of Election or Appointment: 2020
President and Treasurer
Ms. Smith also serves as an officer of other funds. Ms. Smith serves as Assistant Treasurer of FMR Capital, Inc. (2017-present), is an employee of Fidelity Investments (2009-present), and has served in other fund officer roles. Prior to joining Fidelity Investments, Ms. Smith served as Senior Audit Manager of Ernst & Young LLP (accounting firm, 1996-2009). Previously, Ms. Smith served as Assistant Treasurer (2013-2019) and Deputy Treasurer (2013-2016) of certain Fidelity® funds.
Marc L. Spector (1972)
Year of Election or Appointment: 2016
Assistant Treasurer
Mr. Spector also serves as an officer of other funds. Mr. Spector serves as Assistant Treasurer of FMR Capital, Inc. (2017-present) and is an employee of Fidelity Investments (2016-present). Prior to joining Fidelity Investments, Mr. Spector served as Director at the Siegfried Group (accounting firm, 2013-2016), and prior to Siegfried Group as audit senior manager at Deloitte & Touche LLP (accounting firm, 2005-2013).
Jim Wegmann (1979)
Year of Election or Appointment: 2019
Assistant Treasurer
Mr. Wegmann also serves as Assistant Treasurer of other funds. Mr. Wegmann is an employee of Fidelity Investments (2011-present).
Shareholder Expense Example
As a shareholder, you incur two types of costs: (1) transaction costs, which may include sales charges (loads) on purchase payments or redemption proceeds, as applicable and (2) ongoing costs, which generally include management fees, distribution and/or service (12b-1) fees and other Fund expenses. This Example is intended to help you understand your ongoing costs (in dollars) of investing in a fund and to compare these costs with the ongoing costs of investing in other mutual funds.
The Example is based on an investment of $1,000 invested at the beginning of the period and held for the entire period (December 1, 2020 to May 31, 2021).
Actual Expenses
The first line of the accompanying table provides information about actual account values and actual expenses. You may use the information in this line, together with the amount you invested, to estimate the expenses that you paid over the period. Simply divide your account value by $1,000.00 (for example, an $8,600 account value divided by $1,000.00 = 8.6), then multiply the result by the number in the first line for a class/Fund under the heading entitled "Expenses Paid During Period" to estimate the expenses you paid on your account during this period. If any fund is a shareholder of any underlying mutual funds or exchange-traded funds (ETFs) (the Underlying Funds), such fund indirectly bears its proportional share of the expenses of the Underlying Funds in addition to the direct expenses incurred presented in the table. These fees and expenses are not included in the annualized expense ratio used to calculate the expense estimate in the table below.
Hypothetical Example for Comparison Purposes
The second line of the accompanying table provides information about hypothetical account values and hypothetical expenses based on the actual expense ratio and an assumed rate of return of 5% per year before expenses, which is not the actual return. The hypothetical account values and expenses may not be used to estimate the actual ending account balance or expenses you paid for the period. You may use this information to compare the ongoing costs of investing in the Fund and other funds. To do so, compare this 5% hypothetical example with the 5% hypothetical examples that appear in the shareholder reports of the other funds. If any fund is a shareholder of any Underlying Funds, such fund indirectly bears its proportional share of the expenses of the Underlying Funds in addition to the direct expenses as presented in the table. These fees and expenses are not included in the annualized expense ratio used to calculate the expense estimate in the table below.
Please note that the expenses shown in the table are meant to highlight your ongoing costs only and do not reflect any transaction costs. Therefore, the second line of the table is useful in comparing ongoing costs only, and will not help you determine the relative total costs of owning different funds.
| Annualized Expense Ratio-A | Beginning Account Value December 1, 2020 | Ending Account Value May 31, 2021 | Expenses Paid During Period-B December 1, 2020 to May 31, 2021 |
|
| Strategic Advisers Fidelity Emerging Markets Fund | .26% | |||
| Actual | $1,000.00 | $1,161.20 | $1.40 | |
| Hypothetical-C | $1,000.00 | $1,023.64 | $1.31 |
A Annualized expense ratio reflects expenses net of applicable fee waivers.
B Expenses are equal to the annualized expense ratio, multiplied by the average account value over the period, multiplied by 182/ 365 (to reflect the one-half year period). The fees and expenses of any Underlying Funds are not included in each annualized expense ratio.
C 5% return per year before expenses
Distributions (Unaudited)
The Board of Trustees of Strategic Advisers Fidelity Emerging Markets Fund voted to pay on July 7, 2021, to shareholders of record at the opening of business on July 9, 2021, a distribution of $0.362 per share derived from capital gains realized from sales of portfolio securities and a dividend of $0.017 per share from net investment income.
The fund hereby designates as a capital gain dividend with respect to the taxable year ended May 31, 2021, $177,997,765, or, if subsequently determined to be different, the net capital gain of such year.
The fund designates 68% of the dividends distributed in December, respectively during the fiscal year as amounts which may be taken into account as a dividend for the purposes of the maximum rate under section 1(h)(11) of the Internal Revenue Code.
The amounts per share which represent income derived from sources within, and taxes paid to, foreign countries or possessions of the United States are $0.1266 and $0.0196 for the dividend paid December 31, 2020.
The fund will notify shareholders in January 2022 of amounts for use in preparing 2021 income tax returns.
Liquidity Risk Management Program
The Securities and Exchange Commission adopted Rule 22e-4 under the Investment Company Act of 1940 (the Liquidity Rule) to promote effective liquidity risk management throughout the open-end investment company industry, thereby reducing the risk that funds will be unable to meet their redemption obligations and mitigating dilution of the interests of fund shareholders.
The Fund has adopted and implemented a liquidity risk management program (the Program) reasonably designed to assess and manage the Fund’s liquidity risk and to comply with the requirements of the Liquidity Rule. The Fund’s Board of Trustees (the Board) has designated the Fund’s investment adviser as administrator of the Program. Strategic Advisers has established a Liquidity Risk Management Committee (the LRM Committee) to manage the Program for each of the Funds. The LRM Committee monitors the adequacy and effectiveness of implementation of the Program and on a periodic basis assesses each Fund’s liquidity risk based on a variety of factors including (1) the Fund’s investment strategy, (2) portfolio liquidity and cash flow projections during normal and reasonably foreseeable stressed conditions, (3) shareholder redemptions and (4) borrowings and other funding sources, as applicable.
In accordance with the Program, each of the Fund’s portfolio investments is classified into one of four liquidity categories described below based on a determination of a reasonable expectation for how long it would take to convert the investment to cash (or sell or dispose of the investment) without significantly changing its market value.
- Highly liquid investments – cash or convertible to cash within three business days or less
- Moderately liquid investments – convertible to cash in three to seven calendar days
- Less liquid investments – can be sold or disposed of, but not settled, within seven calendar days
- Illiquid investments – cannot be sold or disposed of within seven calendar days
Liquidity classification determinations take into account a variety of factors including various market, trading and investment-specific considerations, as well as market depth, and generally utilize analysis from a third-party liquidity metrics service.
The Liquidity Rule places a 15% limit on a fund’s illiquid investments and requires funds that do not primarily hold assets that are highly liquid investments to determine and maintain a minimum percentage of the fund’s net assets to be invested in highly liquid investments (highly liquid investment minimum or HLIM). The Program includes provisions reasonably designed to comply with the 15% limit on illiquid investments and for determining, periodically reviewing and complying with the HLIM requirement as applicable.
At a recent meeting of the Fund’s Board of Trustees, the LRM Committee provided a written report to the Board pertaining to the operation, adequacy, and effectiveness of implementation of the Program for the annual period from December 1, 2019 through November 30, 2020. The report concluded that the Program has been implemented and is operating effectively and is reasonably designed to assess and manage the Fund’s liquidity risk.
Proxy Voting Results
A special meeting of shareholders was held on November 2, 2020. The results of votes taken among shareholders on the proposal before them are reported below. Each vote reported represents one dollar of net asset value held on the record date for the meeting.
PROPOSAL 1
To elect a Board of Trustees.
| # of Votes | % of Votes |
|
| ROBERT A. LAWRENCE | ||
| Affirmative | 204,250,982,594.51 | 96.530 |
| Withheld | 7,343,512,146.85 | 3.470 |
| TOTAL | 211,594,494,741.36 | 100.000 |
| CHARLES S. MORRISON | ||
| Affirmative | 204,349,460,488.43 | 96.576 |
| Withheld | 7,245,034,252.93 | 3.424 |
| TOTAL | 211,594,494,741.36 | 100.000 |
| PETER C. ALDRICH | ||
| Affirmative | 203,499,803,652.67 | 96.175 |
| Withheld | 8,094,691,088.69 | 3.825 |
| TOTAL | 211,594,494,741.36 | 100.000 |
| MARY C. FARRELL | ||
| Affirmative | 204,011,925,737.22 | 96.417 |
| Withheld | 7,582,569,004.14 | 3.583 |
| TOTAL | 211,594,494,741.36 | 100.00 |
| KAREN KAPLAN | ||
| Affirmative | 204,297,547,550.53 | 96.552 |
| Withheld | 7,296,947,190.83 | 3.448 |
| TOTAL | 211,594,494,741.36 | 100.000 |
| CHRISTINE MARCKS | ||
| Affirmative | 204,700,871,317.72 | 96.743 |
| Withheld | 6,893,623,423.64 | 3.257 |
| TOTAL | 211,594,494,741.36 | 100.000 |
| HEIDI L. STEIGER | ||
| Affirmative | 204,406,589,957.28 | 96.603 |
| Withheld | 7,187,904,784.08 | 3.397 |
| TOTAL | 211,594,494,741.36 | 100.000 |
| Proposal 1 reflects trust wide proposal and voting results. |
![]()
STE-ANN-0721
1.9890707.102
Strategic Advisers® Large Cap Fund
Offered exclusively to certain managed account clients of Strategic Advisers LLC or its affiliates - not available for sale to the general public
May 31, 2021
Contents
To view a fund's proxy voting record for the 12-month period ended June 30, visit http://www.fidelity.com/proxyvotingresults or visit the Securities and Exchange Commission's (SEC) web site at http://www.sec.gov.
You may also call 1-800-544-3455 to request a free copy of the proxy voting guidelines.
Standard & Poor's, S&P and S&P 500 are registered service marks of The McGraw-Hill Companies, Inc. and have been licensed for use by Fidelity Distributors Corporation.
Other third-party marks appearing herein are the property of their respective owners.
All other marks appearing herein are registered or unregistered trademarks or service marks of FMR LLC or an affiliated company. © 2021 FMR LLC. All rights reserved.
This report and the financial statements contained herein are submitted for the general information of the shareholders of the Fund. This report is not authorized for distribution to prospective investors in the Fund unless preceded or accompanied by an effective prospectus.
A fund files its complete schedule of portfolio holdings with the SEC for the first and third quarters of each fiscal year on Form N-PORT. Forms N-PORT are available on the SEC’s web site at http://www.sec.gov. A fund's Forms N-PORT may be reviewed and copied at the SEC’s Public Reference Room in Washington, DC. Information regarding the operation of the SEC's Public Reference Room may be obtained by calling 1-800-SEC-0330.
For a complete list of a fund's portfolio holdings, view the most recent holdings listing, semiannual report, or annual report on Fidelity's web site at http://www.fidelity.com, http://www.institutional.fidelity.com, or http://www.401k.com, as applicable.
NOT FDIC INSURED •MAY LOSE VALUE •NO BANK GUARANTEE
Neither the Fund nor Fidelity Distributors Corporation is a bank.
Note to Shareholders:
Early in 2020, the outbreak and spread of a new coronavirus emerged as a public health emergency that had a major influence on financial markets, primarily based on its impact on the global economy and the outlook for corporate earnings. The virus causes a respiratory disease known as COVID-19. On March 11, 2020 the World Health Organization declared the COVID-19 outbreak a pandemic, citing sustained risk of further global spread.
In the weeks following, as the crisis worsened, we witnessed an escalating human tragedy with wide-scale social and economic consequences from coronavirus-containment measures. The outbreak of COVID-19 prompted a number of measures to limit the spread, including travel and border restrictions, quarantines, and restrictions on large gatherings. In turn, these resulted in lower consumer activity, diminished demand for a wide range of products and services, disruption in manufacturing and supply chains, and – given the wide variability in outcomes regarding the outbreak – significant market uncertainty and volatility. Amid the turmoil, global governments and central banks took unprecedented action to help support consumers, businesses, and the broader economies, and to limit disruption to financial systems.
The situation continues to unfold, and the extent and duration of its impact on financial markets and the economy remain highly uncertain. Extreme events such as the coronavirus crisis are “exogenous shocks” that can have significant adverse effects on mutual funds and their investments. Although multiple asset classes may be affected by market disruption, the duration and impact may not be the same for all types of assets.
Fidelity is committed to helping you stay informed amid news about COVID-19 and during increased market volatility, and we’re taking extra steps to be responsive to customer needs. We encourage you to visit our websites, where we offer ongoing updates, commentary, and analysis on the markets and our funds.
Performance: The Bottom Line
Average annual total return reflects the change in the value of an investment, assuming reinvestment of distributions from dividend income and capital gains (the profits earned upon the sale of securities that have grown in value, if any) and assuming a constant rate of performance each year. The hypothetical investment and the average annual total returns do not reflect the deduction of taxes that a shareholder would pay on fund distributions or the redemption of fund shares. During periods of reimbursement by Fidelity, a fund’s total return will be greater than it would be had the reimbursement not occurred. How a fund did yesterday is no guarantee of how it will do tomorrow.
Average Annual Total Returns
| For the periods ended May 31, 2021 | Past 1 year | Past 5 years | Past 10 years |
| Strategic Advisers® Large Cap Fund | 44.55% | 17.60% | 13.87% |
Returns from November 21, 2020 through May 31, 2021 are those of Strategic Advisers Large Cap Fund. Returns prior to the Reorganization on November 20, 2020 are those of Strategic Advisers Core Fund (“Predecessor Fund”).
$10,000 Over 10 Years
Let's say hypothetically that $10,000 was invested in Strategic Advisers® Large Cap Fund on May 31, 2011.
The chart shows how the value of your investment would have changed, and also shows how the S&P 500® Index performed over the same period.
See above for additional information regarding the performance of Strategic Advisers® Large Cap Fund.
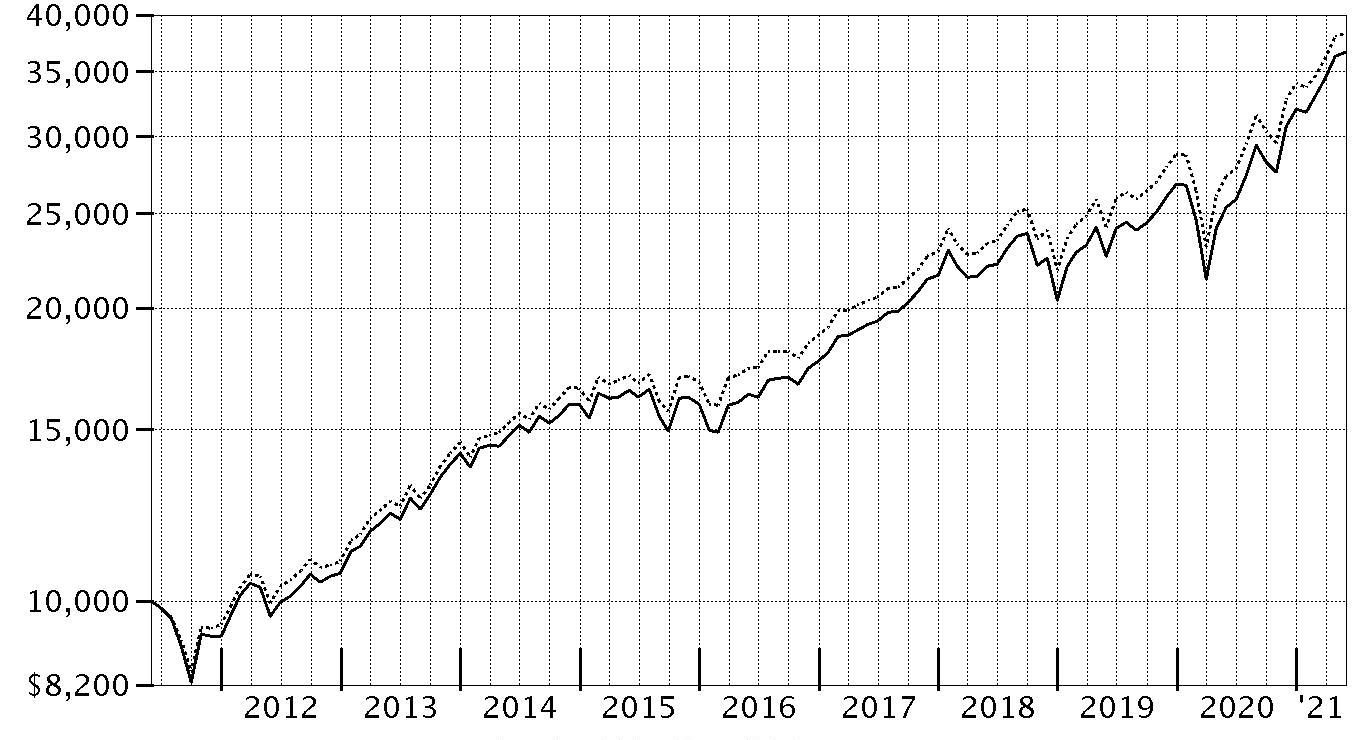
| Period Ending Values | ||
|
| $36,663 | Strategic Advisers® Large Cap Fund |
|
| $38,334 | S&P 500® Index |
Management's Discussion of Fund Performance
Market Recap: The S&P 500® index gained 40.32% for the 12 months ending May 31, 2021, as U.S. equities staged a historic rebound following a steep but brief decline due to the early-2020 outbreak and spread of COVID-19. A confluence of powerful forces propelled risk assets, returning the stock market to pre-pandemic highs by late August. The rally slowed in September, when stocks began a two-month retreat amid Congress’s inability to reach a deal on additional fiscal stimulus, as well as uncertainty about the election. But as the calendar turned, investors grew hopeful. The rollout of two COVID-19 vaccines was underway, the U.S. Federal Reserve pledged to hold interest rates near zero until the economy recovered, and the federal government planned to deploy trillions of dollars to boost consumers and the economy. A flattish May reflected concerns about inflation and jobs. This backdrop fueled a sharp rotation, with small-cap value usurping leadership from large growth. As part of the “reopening” trade, investors moved out of tech-driven mega-caps that had thrived due to the work-from-home trend in favor of cheap smaller companies that stood to benefit from a broad cyclical recovery. Reflecting this shift, financials (+66%) led for the full period, riding momentum among banks (+80%), whose profit outlook improved amid rising long-term interest rates and a steeper yield curve. Materials (+60%) and industrials (+58%) closely followed. Conversely, “laggards” included the utilities (+13%), health care (+22%) and consumer staples (+23%) sectors. Comments from Lead Portfolio Manager John Stone: For the fiscal year ending May 31, 2021, the Fund gained 44.55%, outpacing the 40.32% increase in the benchmark S&P 500® Index. (Effective November 20, 2020, Strategic Advisers Core Fund (“Predecessor Fund”) and two other funds were reorganized into the Fund. Performance prior to the reorganization is that of the Predecessor Fund) . During the fourth quarter of 2020, U.S. market leadership rotated from higher-quality growth stocks and growth-driven investment strategies, to value stocks. Against this backdrop, sub-advisers LSV Asset Management and Brandywine Global Investment Management were the top relative contributors the past 12 months as the market environment provided a tailwind to the strategies employed by these managers. Specifically, LSV pursues a quantitative deep-value approach focused on economically sensitive stocks trading at relatively cheap valuations. Brandywine, meanwhile, emphasizes traditional value metrics and provides the Fund with core exposure to large-cap value equities. The sub-advised strategy by T. Rowe Price, which employs a benchmark-like, sector-neutral core strategy, was another key relative contributor having performed well in the growth-led market during the first half of the reporting period. Sub-adviser JPMorgan Investment Management also added value on a relative basis, aided by a shift toward value in 2020 that it continued in 2021. On the downside, Fidelity® SAI U.S. Quality Index Fund was the biggest relative detractor within the portfolio. This fund tracks a custom index comprised of companies with stable earnings that are typically less volatile than the broader market. During the period it struggled amid the shift away from defensive areas of the market to more economically sensitive sectors. Sub-adviser ClearBridge Investments also hampered the fund's relative result with the broader rotation away from growth stocks late in 2020. Fidelity® Growth Company Fund weighed on the Fund's relative return as well this period, despite faring well against its Russell 3000 Growth Index benchmark.The views expressed above reflect those of the portfolio manager(s) only through the end of the period as stated on the cover of this report and do not necessarily represent the views of Fidelity or any other person in the Fidelity organization. Any such views are subject to change at any time based upon market or other conditions and Fidelity disclaims any responsibility to update such views. These views may not be relied on as investment advice and, because investment decisions for a Fidelity fund are based on numerous factors, may not be relied on as an indication of trading intent on behalf of any Fidelity fund.
Investment Summary (Unaudited)
The information in the following tables is based on the direct investments of the Fund.Top Ten Holdings as of May 31, 2021
| % of fund's net assets | |
| Fidelity Growth Company Fund | 6.1 |
| Microsoft Corp. | 3.9 |
| Fidelity SAI U.S. Large Cap Index Fund | 3.4 |
| Apple, Inc. | 3.0 |
| Amazon.com, Inc. | 2.9 |
| Fidelity SAI U.S. Low Volatility Index Fund | 2.4 |
| Alphabet, Inc. Class C | 2.0 |
| Facebook, Inc. Class A | 2.0 |
| Fidelity SAI U.S. Quality Index Fund | 1.7 |
| Janus Henderson Enterprise Fund | 1.3 |
| 28.7 |
Top Five Market Sectors as of May 31, 2021
| (stocks only) | % of fund's net assets |
| Information Technology | 19.7 |
| Financials | 12.6 |
| Health Care | 10.9 |
| Consumer Discretionary | 10.3 |
| Communication Services | 8.8 |
Asset Allocation (% of fund's net assets)
| As of May 31, 2021 | ||
| Common Stocks | 83.5% | |
| Large Blend Funds | 6.4% | |
| Large Growth Funds | 7.8% | |
| Mid-Cap Growth Funds | 1.3% | |
| Short-Term Investments and Net Other Assets (Liabilities) | 1.0% | |

Asset allocations of funds in the pie chart reflect the categorizations of assets as defined by Morningstar as of the reporting date.
Schedule of Investments May 31, 2021
Showing Percentage of Net Assets
| Common Stocks - 83.5% | |||
| Shares | Value | ||
| COMMUNICATION SERVICES - 8.8% | |||
| Diversified Telecommunication Services - 0.6% | |||
| AT&T, Inc. | 5,630,791 | $165,714,179 | |
| Liberty Global PLC Class C (a) | 141,700 | 3,857,074 | |
| Lumen Technologies, Inc. | 475,330 | 6,578,567 | |
| Verizon Communications, Inc. | 3,683,501 | 208,080,971 | |
| 384,230,791 | |||
| Entertainment - 1.2% | |||
| Activision Blizzard, Inc. | 947,105 | 92,105,961 | |
| Cinemark Holdings, Inc. (a) | 116,500 | 2,639,890 | |
| Electronic Arts, Inc. | 252,057 | 36,026,507 | |
| Netflix, Inc. (a) | 536,363 | 269,688,680 | |
| Nintendo Co. Ltd. ADR | 42,287 | 3,269,631 | |
| Playtika Holding Corp. | 359,265 | 9,854,639 | |
| Sea Ltd. ADR (a) | 59,780 | 15,138,687 | |
| Spotify Technology SA (a) | 21,925 | 5,296,422 | |
| Take-Two Interactive Software, Inc. (a) | 55,600 | 10,317,136 | |
| The Walt Disney Co. (a) | 1,405,911 | 251,166,000 | |
| Vivendi SA | 182,529 | 6,633,670 | |
| Warner Music Group Corp. Class A | 54,166 | 1,944,018 | |
| Zynga, Inc. (a) | 1,050,856 | 11,391,279 | |
| 715,472,520 | |||
| Interactive Media & Services - 5.0% | |||
| Alphabet, Inc.: | |||
| Class A (a) | 220,010 | 518,530,569 | |
| Class C (a) | 506,732 | 1,222,014,622 | |
| Facebook, Inc. Class A (a) | 3,690,578 | 1,213,203,706 | |
| Match Group, Inc. (a) | 16,763 | 2,403,479 | |
| Pinterest, Inc. Class A (a) | 99,315 | 6,485,270 | |
| Snap, Inc. Class A (a) | 110,580 | 6,869,230 | |
| Tongdao Liepin Group (a) | 446,200 | 1,333,751 | |
| Twitter, Inc. (a) | 514,765 | 29,856,370 | |
| Zoominfo Technologies, Inc. | 24,900 | 1,091,367 | |
| 3,001,788,364 | |||
| Media - 1.7% | |||
| Charter Communications, Inc. Class A (a) | 296,819 | 206,149,700 | |
| Comcast Corp. Class A | 10,488,861 | 601,431,290 | |
| Discovery Communications, Inc.: | |||
| Class A (a)(b) | 80,400 | 2,581,644 | |
| Class C (non-vtg.) (a) | 286,423 | 8,607,011 | |
| DISH Network Corp. Class A (a) | 355,531 | 15,472,709 | |
| Fox Corp.: | |||
| Class A | 639,502 | 23,885,400 | |
| Class B | 162,133 | 5,882,185 | |
| Interpublic Group of Companies, Inc. | 415,790 | 14,007,965 | |
| Liberty Broadband Corp. Class C (a) | 423,870 | 70,485,342 | |
| Liberty Media Corp. Liberty SiriusXM Series C (a) | 318,664 | 13,865,071 | |
| Nexstar Broadcasting Group, Inc. Class A | 91,644 | 13,921,640 | |
| Omnicom Group, Inc. | 221,204 | 18,191,817 | |
| Tegna, Inc. | 536,100 | 10,394,979 | |
| ViacomCBS, Inc. Class B | 157,700 | 6,689,634 | |
| 1,011,566,387 | |||
| Wireless Telecommunication Services - 0.3% | |||
| T-Mobile U.S., Inc. | 1,108,668 | 156,821,089 | |
| TOTAL COMMUNICATION SERVICES | 5,269,879,151 | ||
| CONSUMER DISCRETIONARY - 10.3% | |||
| Auto Components - 0.4% | |||
| Aptiv PLC (a) | 417,319 | 62,773,124 | |
| BorgWarner, Inc. | 495,725 | 25,425,735 | |
| Compagnie Generale des Etablissements Michelin SCA ADR (b) | 830,000 | 25,373,100 | |
| Cooper Tire & Rubber Co. | 294,600 | 17,493,348 | |
| Gentex Corp. | 120,000 | 4,260,000 | |
| Lear Corp. | 181,400 | 35,075,504 | |
| Magna International, Inc. Class A (sub. vtg.) | 243,678 | 24,052,856 | |
| The Goodyear Tire & Rubber Co. (a) | 723,500 | 14,347,005 | |
| 208,800,672 | |||
| Automobiles - 0.8% | |||
| Daimler AG (Germany) | 174,100 | 16,216,455 | |
| Ferrari NV | 153,237 | 32,319,216 | |
| Ford Motor Co. (a) | 5,437,777 | 79,010,900 | |
| General Motors Co. (a) | 2,168,786 | 128,630,698 | |
| Harley-Davidson, Inc. | 468,000 | 22,683,960 | |
| Tesla, Inc. (a) | 363,202 | 227,081,154 | |
| Thor Industries, Inc. | 27,400 | 3,370,200 | |
| 509,312,583 | |||
| Distributors - 0.0% | |||
| Genuine Parts Co. | 91,400 | 11,984,368 | |
| LKQ Corp. (a) | 195,798 | 9,977,866 | |
| 21,962,234 | |||
| Diversified Consumer Services - 0.0% | |||
| Service Corp. International | 111,100 | 5,890,522 | |
| Hotels, Restaurants & Leisure - 1.4% | |||
| Airbnb, Inc. Class A (b) | 58,974 | 8,279,950 | |
| Carnival Corp. (a) | 127,042 | 3,755,362 | |
| Chipotle Mexican Grill, Inc. (a) | 22,151 | 30,390,729 | |
| Darden Restaurants, Inc. | 48,800 | 6,989,624 | |
| Elior SA (a)(c) | 86,108 | 680,746 | |
| Expedia, Inc. (a) | 15,840 | 2,802,888 | |
| Hilton Worldwide Holdings, Inc. (a) | 440,852 | 55,225,530 | |
| Hyatt Hotels Corp. Class A (a) | 25,000 | 1,952,000 | |
| Las Vegas Sands Corp. (a) | 771,448 | 44,551,122 | |
| Marriott International, Inc. Class A (a) | 419,622 | 60,249,327 | |
| McDonald's Corp. | 541,472 | 126,644,886 | |
| MGM Resorts International | 462,400 | 19,823,088 | |
| Penn National Gaming, Inc. (a) | 10,126 | 830,028 | |
| Royal Caribbean Cruises Ltd. (a) | 90,112 | 8,404,746 | |
| Starbucks Corp. | 1,071,880 | 122,065,694 | |
| The Booking Holdings, Inc. (a) | 86,435 | 204,120,574 | |
| Travel+Leisure Co. | 129,600 | 8,443,440 | |
| Wynn Resorts Ltd. (a) | 142,915 | 18,846,201 | |
| Yum China Holdings, Inc. | 256,294 | 17,335,726 | |
| Yum! Brands, Inc. | 773,842 | 92,837,825 | |
| 834,229,486 | |||
| Household Durables - 0.7% | |||
| D.R. Horton, Inc. | 480,061 | 45,745,013 | |
| Garmin Ltd. | 72,318 | 10,286,512 | |
| GoPro, Inc. Class A (a) | 170,400 | 1,911,888 | |
| Lennar Corp.: | |||
| Class A | 1,136,275 | 112,502,588 | |
| Class B | 6,000 | 469,860 | |
| Mohawk Industries, Inc. (a) | 177,733 | 37,444,788 | |
| Newell Brands, Inc. | 1,019,187 | 29,240,475 | |
| NVR, Inc. (a) | 5,831 | 28,497,438 | |
| PulteGroup, Inc. | 978,237 | 56,532,316 | |
| Sony Group Corp. sponsored ADR | 302,845 | 30,166,390 | |
| Tempur Sealy International, Inc. | 50,800 | 1,955,800 | |
| Toll Brothers, Inc. | 53,400 | 3,483,816 | |
| Whirlpool Corp. | 250,265 | 59,335,329 | |
| 417,572,213 | |||
| Internet & Direct Marketing Retail - 3.3% | |||
| Alibaba Group Holding Ltd. sponsored ADR (a) | 461,061 | 98,648,612 | |
| Amazon.com, Inc. (a) | 539,703 | 1,739,500,548 | |
| Doordash, Inc. (b) | 40,437 | 6,076,872 | |
| eBay, Inc. | 1,587,499 | 96,646,939 | |
| Etsy, Inc. (a) | 74,846 | 12,329,382 | |
| Global-e Online Ltd. (a) | 19,100 | 627,626 | |
| Ocado Group PLC (a) | 3,831 | 102,813 | |
| Porch Group, Inc. Class A (a) | 158,400 | 2,711,808 | |
| The Honest Co., Inc. | 67,820 | 963,180 | |
| The Honest Co., Inc. | 217,831 | 3,437,373 | |
| 1,961,045,153 | |||
| Leisure Products - 0.0% | |||
| Brunswick Corp. | 49,800 | 5,091,054 | |
| Polaris, Inc. | 30,300 | 3,975,966 | |
| 9,067,020 | |||
| Multiline Retail - 0.5% | |||
| Big Lots, Inc. | 174,300 | 10,621,842 | |
| Dollar General Corp. | 222,961 | 45,252,165 | |
| Dollar Tree, Inc. (a) | 471,621 | 45,983,048 | |
| Kohl's Corp. | 397,954 | 22,082,467 | |
| Macy's, Inc. (a) | 451,300 | 8,249,764 | |
| Target Corp. | 860,200 | 195,196,584 | |
| 327,385,870 | |||
| Specialty Retail - 2.8% | |||
| Advance Auto Parts, Inc. | 183,585 | 34,831,582 | |
| Auto1 Group SE (c) | 29,596 | 1,589,167 | |
| AutoNation, Inc. (a) | 56,000 | 5,719,280 | |
| AutoZone, Inc. (a) | 56,755 | 79,831,583 | |
| Bed Bath & Beyond, Inc. (a)(b) | 225,648 | 6,315,888 | |
| Best Buy Co., Inc. | 526,273 | 61,173,974 | |
| Burlington Stores, Inc. (a) | 146,967 | 47,524,719 | |
| CarMax, Inc. (a) | 275,928 | 31,784,146 | |
| Dick's Sporting Goods, Inc. | 330,530 | 32,236,591 | |
| Gap, Inc. | 417,138 | 13,953,266 | |
| L Brands, Inc. | 55,331 | 3,865,977 | |
| Lowe's Companies, Inc. | 1,949,658 | 379,851,868 | |
| Murphy U.S.A., Inc. | 128,286 | 17,294,236 | |
| O'Reilly Automotive, Inc. (a) | 332,712 | 178,040,845 | |
| Penske Automotive Group, Inc. | 192,200 | 16,450,398 | |
| Ross Stores, Inc. | 685,900 | 86,690,901 | |
| Sally Beauty Holdings, Inc. (a) | 463,900 | 10,117,659 | |
| Sleep Number Corp. (a) | 138,500 | 15,441,365 | |
| The Home Depot, Inc. | 1,347,507 | 429,733,457 | |
| The ODP Corp. (a) | 62,070 | 2,714,942 | |
| TJX Companies, Inc. | 1,598,975 | 107,994,772 | |
| Tractor Supply Co. | 165,969 | 30,156,567 | |
| Ulta Beauty, Inc. (a) | 184,627 | 63,762,781 | |
| Williams-Sonoma, Inc. | 37,800 | 6,408,612 | |
| 1,663,484,576 | |||
| Textiles, Apparel & Luxury Goods - 0.4% | |||
| Columbia Sportswear Co. | 99,401 | 10,211,465 | |
| Hanesbrands, Inc. | 995,021 | 19,442,710 | |
| lululemon athletica, Inc. (a) | 38,400 | 12,408,192 | |
| NIKE, Inc. Class B | 1,239,529 | 169,146,127 | |
| PVH Corp. (a) | 60,462 | 6,942,247 | |
| Ralph Lauren Corp. | 107,941 | 13,393,319 | |
| Skechers U.S.A., Inc. Class A (sub. vtg.) (a) | 60,000 | 2,850,000 | |
| VF Corp. | 258,291 | 20,590,959 | |
| 254,985,019 | |||
| TOTAL CONSUMER DISCRETIONARY | 6,213,735,348 | ||
| CONSUMER STAPLES - 4.3% | |||
| Beverages - 1.2% | |||
| Anheuser-Busch InBev SA NV ADR (b) | 180,917 | 13,708,081 | |
| Constellation Brands, Inc. Class A (sub. vtg.) | 439,485 | 105,353,344 | |
| Diageo PLC sponsored ADR | 21,172 | 4,091,489 | |
| Keurig Dr. Pepper, Inc. | 1,286,337 | 47,543,016 | |
| Molson Coors Beverage Co. Class B (a) | 567,100 | 33,073,272 | |
| Monster Beverage Corp. (a) | 1,496,443 | 141,069,682 | |
| PepsiCo, Inc. | 626,103 | 92,625,678 | |
| The Coca-Cola Co. | 4,795,089 | 265,120,471 | |
| 702,585,033 | |||
| Food & Staples Retailing - 0.7% | |||
| Casey's General Stores, Inc. | 23,300 | 5,145,572 | |
| Costco Wholesale Corp. | 422,598 | 159,856,145 | |
| Kroger Co. | 1,340,000 | 49,553,200 | |
| Performance Food Group Co. (a) | 30,485 | 1,528,213 | |
| Sysco Corp. | 599,136 | 48,530,016 | |
| Walgreens Boots Alliance, Inc. | 1,339,800 | 70,553,868 | |
| Walmart, Inc. | 748,630 | 106,327,919 | |
| 441,494,933 | |||
| Food Products - 0.8% | |||
| Archer Daniels Midland Co. | 354,100 | 23,558,273 | |
| Bunge Ltd. | 89,100 | 7,735,662 | |
| Campbell Soup Co. | 71,582 | 3,483,896 | |
| Conagra Brands, Inc. | 1,279,011 | 48,730,319 | |
| Darling Ingredients, Inc. (a) | 70,900 | 4,853,814 | |
| General Mills, Inc. | 456,069 | 28,668,497 | |
| Ingredion, Inc. | 209,500 | 19,887,835 | |
| Kellogg Co. | 158,720 | 10,394,573 | |
| Lamb Weston Holdings, Inc. | 126,460 | 10,431,685 | |
| Mondelez International, Inc. | 1,184,984 | 75,282,034 | |
| Mowi ASA ADR | 103,300 | 2,684,767 | |
| Pilgrim's Pride Corp. (a) | 262,000 | 6,298,480 | |
| Post Holdings, Inc. (a) | 183,872 | 21,242,732 | |
| The a2 Milk Co. Ltd. (a) | 308,675 | 1,318,637 | |
| The Hershey Co. | 52,804 | 9,137,732 | |
| The J.M. Smucker Co. | 368,093 | 49,063,116 | |
| The Kraft Heinz Co. | 2,013,294 | 87,759,485 | |
| Tyson Foods, Inc. Class A | 1,091,631 | 86,784,665 | |
| 497,316,202 | |||
| Household Products - 0.9% | |||
| Colgate-Palmolive Co. | 524,039 | 43,903,987 | |
| Energizer Holdings, Inc. | 321,748 | 14,813,278 | |
| Kimberly-Clark Corp. | 130,317 | 17,023,310 | |
| Procter & Gamble Co. | 3,445,382 | 464,609,763 | |
| Reckitt Benckiser Group PLC | 44,251 | 3,995,734 | |
| Spectrum Brands Holdings, Inc. | 7,559 | 671,920 | |
| The Clorox Co. | 77,545 | 13,704,528 | |
| 558,722,520 | |||
| Personal Products - 0.2% | |||
| Coty, Inc. Class A (a) | 652,440 | 5,813,240 | |
| Estee Lauder Companies, Inc. Class A | 319,123 | 97,817,582 | |
| 103,630,822 | |||
| Tobacco - 0.5% | |||
| Altria Group, Inc. | 2,333,266 | 114,843,353 | |
| British American Tobacco PLC sponsored ADR | 94,688 | 3,661,585 | |
| Philip Morris International, Inc. | 1,782,618 | 171,897,854 | |
| Swedish Match Co. AB | 102,000 | 946,216 | |
| 291,349,008 | |||
| TOTAL CONSUMER STAPLES | 2,595,098,518 | ||
| ENERGY - 2.5% | |||
| Energy Equipment & Services - 0.1% | |||
| Baker Hughes Co. Class A | 137,500 | 3,355,000 | |
| Halliburton Co. | 2,262,350 | 50,789,758 | |
| NOV, Inc. (a) | 46,772 | 753,965 | |
| Oceaneering International, Inc. (a) | 90,267 | 1,288,110 | |
| SBM Offshore NV | 41,900 | 724,241 | |
| Schlumberger Ltd. | 879,507 | 27,554,954 | |
| Subsea 7 SA | 388,000 | 3,783,135 | |
| 88,249,163 | |||
| Oil, Gas & Consumable Fuels - 2.4% | |||
| Africa Oil Corp. (a) | 1,105,900 | 1,108,649 | |
| APA Corp. | 234,975 | 4,887,480 | |
| Cabot Oil & Gas Corp. | 2,224,284 | 36,478,258 | |
| Canadian Natural Resources Ltd. | 232,200 | 8,149,123 | |
| Cenovus Energy, Inc. (Canada) | 891,169 | 7,449,789 | |
| Cheniere Energy, Inc. (a) | 174,900 | 14,849,010 | |
| Chevron Corp. | 1,727,832 | 179,331,683 | |
| ConocoPhillips Co. | 3,448,378 | 192,212,590 | |
| Continental Resources, Inc. (b) | 232,700 | 7,579,039 | |
| Devon Energy Corp. | 277,400 | 7,367,744 | |
| Diamondback Energy, Inc. | 444,660 | 35,603,926 | |
| EOG Resources, Inc. | 1,605,546 | 128,989,566 | |
| Equitrans Midstream Corp. | 427,300 | 3,520,952 | |
| Exxon Mobil Corp. | 5,347,055 | 312,107,600 | |
| Harbour Energy PLC (a) | 4,164,100 | 1,215,725 | |
| Hess Corp. | 643,866 | 53,968,848 | |
| HollyFrontier Corp. | 229,996 | 7,467,970 | |
| Imperial Oil Ltd. (b) | 181,500 | 6,106,640 | |
| Kinder Morgan, Inc. | 2,173,618 | 39,864,154 | |
| Kosmos Energy Ltd. (a) | 1,752,500 | 5,572,950 | |
| Magellan Midstream Partners LP | 226,189 | 11,148,856 | |
| Marathon Oil Corp. | 699,036 | 8,465,326 | |
| Marathon Petroleum Corp. | 1,019,643 | 63,013,937 | |
| MEG Energy Corp. (a) | 929,200 | 6,458,979 | |
| Murphy Oil Corp. | 85,300 | 1,850,157 | |
| Occidental Petroleum Corp. | 113,675 | 2,951,003 | |
| ONEOK, Inc. | 54,570 | 2,878,022 | |
| PBF Energy, Inc. Class A (a) | 512,500 | 8,271,750 | |
| Phillips 66 Co. | 929,208 | 78,257,898 | |
| Pioneer Natural Resources Co. | 306,889 | 46,705,437 | |
| Range Resources Corp. (a) | 61,800 | 838,008 | |
| Reliance Industries Ltd. | 38,600 | 1,149,880 | |
| TC Energy Corp. | 773,509 | 39,495,370 | |
| The Williams Companies, Inc. | 1,552,402 | 40,890,269 | |
| Total SA sponsored ADR | 395,737 | 18,476,961 | |
| Valero Energy Corp. | 681,511 | 54,793,484 | |
| 1,439,477,033 | |||
| TOTAL ENERGY | 1,527,726,196 | ||
| FINANCIALS - 12.6% | |||
| Banks - 5.4% | |||
| Bank of America Corp. | 16,637,379 | 705,258,496 | |
| BNP Paribas SA (b) | 39,208 | 2,677,756 | |
| CIT Group, Inc. | 112,597 | 5,965,389 | |
| Citigroup, Inc. | 1,764,025 | 138,846,408 | |
| Citizens Financial Group, Inc. | 2,428,509 | 121,182,599 | |
| Comerica, Inc. | 116,461 | 9,141,024 | |
| Commerce Bancshares, Inc. | 253,900 | 19,773,732 | |
| Cullen/Frost Bankers, Inc. | 192,000 | 23,176,320 | |
| East West Bancorp, Inc. | 233,710 | 17,476,834 | |
| EFG Eurobank Ergasias SA (a) | 3,369,557 | 3,162,867 | |
| Fifth Third Bancorp | 5,601,280 | 236,037,939 | |
| First Horizon National Corp. | 615,636 | 11,740,179 | |
| Huntington Bancshares, Inc. | 5,168,180 | 81,967,335 | |
| JPMorgan Chase & Co. | 2,998,319 | 492,443,913 | |
| KeyCorp | 2,111,123 | 48,640,274 | |
| M&T Bank Corp. | 285,389 | 45,859,158 | |
| Mitsubishi UFJ Financial Group, Inc. sponsored ADR (b) | 2,150,000 | 12,448,500 | |
| NatWest Group PLC | 385,089 | 1,132,489 | |
| Piraeus Financial Holdings SA (a) | 710,838 | 1,328,211 | |
| PNC Financial Services Group, Inc. | 1,449,914 | 282,269,258 | |
| Regions Financial Corp. | 3,013,645 | 70,549,429 | |
| Signature Bank | 114,928 | 28,703,268 | |
| Societe Generale Series A | 174,282 | 5,584,829 | |
| Standard Chartered PLC (United Kingdom) | 403,399 | 2,910,247 | |
| SVB Financial Group (a) | 110,347 | 64,320,163 | |
| Truist Financial Corp. | 2,528,601 | 156,216,970 | |
| U.S. Bancorp | 1,620,377 | 98,486,514 | |
| UniCredit SpA | 201,508 | 2,587,348 | |
| Wells Fargo & Co. | 11,704,863 | 546,851,199 | |
| Western Alliance Bancorp. | 48,000 | 4,800,480 | |
| Zions Bancorp NA | 81,300 | 4,705,644 | |
| 3,246,244,772 | |||
| Capital Markets - 3.0% | |||
| Ameriprise Financial, Inc. | 360,492 | 93,670,241 | |
| Apollo Global Management LLC Class A | 890,543 | 51,063,736 | |
| Bank of New York Mellon Corp. | 1,764,530 | 91,896,722 | |
| BlackRock, Inc. Class A | 69,689 | 61,120,041 | |
| Brookfield Asset Management, Inc. Class A (b) | 1,481,221 | 74,564,665 | |
| Cboe Global Markets, Inc. | 260,447 | 28,987,751 | |
| Charles Schwab Corp. | 2,638,536 | 194,855,884 | |
| CME Group, Inc. | 289,013 | 63,224,484 | |
| Coinbase Global, Inc. (a)(b) | 2,000 | 473,080 | |
| FactSet Research Systems, Inc. | 72,003 | 24,074,923 | |
| Goldman Sachs Group, Inc. | 894,422 | 332,742,872 | |
| Intercontinental Exchange, Inc. | 650,853 | 73,468,287 | |
| Invesco Ltd. | 454,700 | 12,972,591 | |
| KKR & Co. LP | 670,688 | 37,350,615 | |
| LPL Financial | 39,300 | 5,811,684 | |
| MarketAxess Holdings, Inc. | 27,061 | 12,625,039 | |
| Moody's Corp. | 39,257 | 13,164,835 | |
| Morgan Stanley | 2,721,554 | 247,525,336 | |
| NASDAQ, Inc. | 81,600 | 13,664,736 | |
| Northern Trust Corp. | 344,135 | 41,705,721 | |
| Raymond James Financial, Inc. | 232,333 | 30,805,032 | |
| S&P Global, Inc. | 154,437 | 58,604,208 | |
| SEI Investments Co. | 478,318 | 30,344,494 | |
| State Street Corp. | 1,399,410 | 121,720,682 | |
| StepStone Group, Inc. Class A | 96,823 | 3,069,289 | |
| T. Rowe Price Group, Inc. | 211,410 | 40,453,304 | |
| The Beauty Health Co. (a)(b) | 130,000 | 1,851,200 | |
| Tradeweb Markets, Inc. Class A | 66,291 | 5,553,860 | |
| Virtu Financial, Inc. Class A | 201,766 | 6,143,775 | |
| 1,773,509,087 | |||
| Consumer Finance - 0.9% | |||
| 360 DigiTech, Inc. ADR (a) | 60,874 | 1,708,733 | |
| Ally Financial, Inc. | 218,752 | 11,967,922 | |
| American Express Co. | 264,398 | 42,338,052 | |
| Capital One Financial Corp. | 2,358,787 | 379,245,774 | |
| Discover Financial Services | 442,220 | 51,854,717 | |
| LendingTree, Inc. (a) | 11,000 | 2,257,750 | |
| Navient Corp. | 734,600 | 13,421,142 | |
| OneMain Holdings, Inc. | 240,200 | 13,893,168 | |
| Synchrony Financial | 289,400 | 13,720,454 | |
| 530,407,712 | |||
| Diversified Financial Services - 0.9% | |||
| Berkshire Hathaway, Inc.: | |||
| Class A (a) | 1 | 436,000 | |
| Class B (a) | 1,597,461 | 462,369,112 | |
| Equitable Holdings, Inc. | 1,875,775 | 59,555,856 | |
| Jaws Acquisition Corp. (a)(b) | 300,000 | 4,353,000 | |
| Jefferies Financial Group, Inc. | 134,400 | 4,318,272 | |
| Voya Financial, Inc. | 269,730 | 17,672,710 | |
| 548,704,950 | |||
| Insurance - 2.3% | |||
| AFLAC, Inc. | 1,188,296 | 67,352,617 | |
| AIA Group Ltd. | 196,000 | 2,505,099 | |
| Alleghany Corp. (a) | 25,714 | 18,425,881 | |
| Allstate Corp. | 709,221 | 96,886,681 | |
| American Financial Group, Inc. | 260,900 | 34,715,354 | |
| American International Group, Inc. | 1,487,646 | 78,607,215 | |
| Aon PLC | 56,179 | 14,234,073 | |
| Arch Capital Group Ltd. (a) | 199,500 | 7,958,055 | |
| Arthur J. Gallagher & Co. | 90,423 | 13,256,916 | |
| Assurant, Inc. | 29,200 | 4,705,580 | |
| Axis Capital Holdings Ltd. | 200,700 | 10,765,548 | |
| Chubb Ltd. | 1,246,381 | 211,872,306 | |
| Cincinnati Financial Corp. | 336,989 | 41,014,931 | |
| CNA Financial Corp. | 129,583 | 6,195,363 | |
| Everest Re Group Ltd. | 84,700 | 22,018,612 | |
| Fairfax Financial Holdings Ltd. | 32,045 | 15,059,548 | |
| Fairfax Financial Holdings Ltd. (sub. vtg.) | 4,601 | 2,149,319 | |
| First American Financial Corp. | 45,500 | 2,926,105 | |
| Globe Life, Inc. | 35,000 | 3,689,700 | |
| Hartford Financial Services Group, Inc. | 1,756,756 | 114,804,005 | |
| Lincoln National Corp. | 583,900 | 40,750,381 | |
| Loews Corp. | 836,097 | 48,811,343 | |
| Markel Corp. (a) | 6,290 | 7,708,332 | |
| Marsh & McLennan Companies, Inc. | 331,010 | 45,795,234 | |
| MetLife, Inc. | 1,775,557 | 116,050,406 | |
| Old Republic International Corp. | 93,500 | 2,455,310 | |
| Principal Financial Group, Inc. | 136,100 | 8,899,579 | |
| Progressive Corp. | 1,390,399 | 137,760,733 | |
| Prudential Financial, Inc. | 599,251 | 64,101,879 | |
| Reinsurance Group of America, Inc. | 18,700 | 2,356,761 | |
| RenaissanceRe Holdings Ltd. | 175,835 | 27,099,690 | |
| The Travelers Companies, Inc. | 625,671 | 99,919,659 | |
| Unum Group | 479,100 | 14,837,727 | |
| W.R. Berkley Corp. | 180,406 | 14,069,864 | |
| Willis Towers Watson PLC | 24,733 | 6,464,217 | |
| 1,406,224,023 | |||
| Mortgage Real Estate Investment Trusts - 0.0% | |||
| Annaly Capital Management, Inc. | 1,720,500 | 15,949,035 | |
| Thrifts & Mortgage Finance - 0.1% | |||
| MGIC Investment Corp. | 722,000 | 10,627,840 | |
| Radian Group, Inc. | 789,100 | 18,425,485 | |
| Rocket Cos., Inc. (b) | 316,977 | 5,613,663 | |
| 34,666,988 | |||
| TOTAL FINANCIALS | 7,555,706,567 | ||
| HEALTH CARE - 10.9% | |||
| Biotechnology - 1.5% | |||
| AbbVie, Inc. | 2,912,093 | 329,648,928 | |
| ADC Therapeutics SA (a) | 89,400 | 1,935,510 | |
| Agios Pharmaceuticals, Inc. (a) | 50,000 | 2,789,000 | |
| Alexion Pharmaceuticals, Inc. (a) | 49,494 | 8,738,166 | |
| Alnylam Pharmaceuticals, Inc. (a) | 46,173 | 6,556,104 | |
| Amgen, Inc. | 625,981 | 148,945,919 | |
| Arcutis Biotherapeutics, Inc. (a) | 67,400 | 1,775,990 | |
| Argenx SE ADR (a) | 31,800 | 8,871,882 | |
| Ascendis Pharma A/S sponsored ADR (a) | 50,000 | 6,719,000 | |
| Avid Bioservices, Inc. (a) | 121,000 | 2,574,880 | |
| BioAtla, Inc. | 40,000 | 1,722,000 | |
| Biogen, Inc. (a) | 274,963 | 73,547,103 | |
| BioMarin Pharmaceutical, Inc. (a) | 131,620 | 10,174,226 | |
| Crinetics Pharmaceuticals, Inc. (a) | 25,700 | 451,035 | |
| Cytokinetics, Inc. (a) | 80,000 | 1,746,400 | |
| Exelixis, Inc. (a) | 80,000 | 1,804,000 | |
| Generation Bio Co. | 54,000 | 1,850,040 | |
| Gilead Sciences, Inc. | 469,126 | 31,013,920 | |
| Gritstone Bio, Inc. (a)(b) | 15,967 | 146,896 | |
| Heron Therapeutics, Inc. (a) | 6,100 | 80,947 | |
| Incyte Corp. (a) | 170,883 | 14,316,578 | |
| Innovent Biologics, Inc. (a)(c) | 330,000 | 3,994,550 | |
| Insmed, Inc. (a) | 49,237 | 1,211,230 | |
| Intercept Pharmaceuticals, Inc. (a) | 62,500 | 1,039,375 | |
| Mirati Therapeutics, Inc. (a) | 17,000 | 2,688,550 | |
| Neurocrine Biosciences, Inc. (a) | 28,281 | 2,721,198 | |
| Novavax, Inc. (a)(b) | 12,000 | 1,771,440 | |
| Prelude Therapeutics, Inc. | 35,000 | 1,216,600 | |
| PTC Therapeutics, Inc. (a) | 54,476 | 2,139,273 | |
| Regeneron Pharmaceuticals, Inc. (a) | 222,362 | 111,721,340 | |
| Sarepta Therapeutics, Inc. (a) | 30,000 | 2,269,500 | |
| Seagen, Inc. (a) | 52,114 | 8,095,910 | |
| Shattuck Labs, Inc. | 59,250 | 1,608,045 | |
| TG Therapeutics, Inc. (a) | 88,000 | 3,068,560 | |
| Vaxcyte, Inc. | 25,452 | 536,274 | |
| Vertex Pharmaceuticals, Inc. (a) | 458,661 | 95,690,444 | |
| Xencor, Inc. (a) | 56,000 | 2,153,760 | |
| Zentalis Pharmaceuticals, Inc. (a) | 50,000 | 2,792,500 | |
| Zymeworks, Inc. (a) | 55,000 | 1,716,000 | |
| 901,843,073 | |||
| Health Care Equipment & Supplies - 2.0% | |||
| Abbott Laboratories | 1,106,830 | 129,111,720 | |
| Abiomed, Inc. (a) | 11,088 | 3,155,423 | |
| Alcon, Inc. (b) | 579,216 | 40,359,771 | |
| Alcon, Inc. (Switzerland) (b) | 32,950 | 2,293,321 | |
| Align Technology, Inc. (a) | 5,926 | 3,497,229 | |
| Becton, Dickinson & Co. | 355,458 | 85,981,736 | |
| Boston Scientific Corp. (a) | 2,692,745 | 114,576,300 | |
| Danaher Corp. | 955,320 | 244,695,665 | |
| Dentsply Sirona, Inc. | 21,979 | 1,470,835 | |
| DexCom, Inc. (a) | 3,750 | 1,385,213 | |
| Envista Holdings Corp. (a) | 100,000 | 4,364,000 | |
| Hill-Rom Holdings, Inc. | 92,800 | 10,326,784 | |
| Hologic, Inc. (a) | 508,423 | 32,061,154 | |
| IDEXX Laboratories, Inc. (a) | 34,145 | 19,056,666 | |
| Insulet Corp. (a) | 44,000 | 11,865,480 | |
| Intuitive Surgical, Inc. (a) | 200,272 | 168,665,073 | |
| iRhythm Technologies, Inc. (a) | 500 | 37,730 | |
| Masimo Corp. (a) | 10,000 | 2,156,000 | |
| Medtronic PLC | 1,039,291 | 131,563,848 | |
| Penumbra, Inc. (a) | 45,000 | 11,209,950 | |
| Stryker Corp. | 198,038 | 50,553,160 | |
| Tandem Diabetes Care, Inc. (a) | 28,000 | 2,390,920 | |
| The Cooper Companies, Inc. | 22,372 | 8,802,263 | |
| West Pharmaceutical Services, Inc. | 9,928 | 3,450,079 | |
| Zimmer Biomet Holdings, Inc. | 624,397 | 105,104,747 | |
| 1,188,135,067 | |||
| Health Care Providers & Services - 3.5% | |||
| 1Life Healthcare, Inc. (a) | 80,000 | 2,960,000 | |
| Alignment Healthcare, Inc. (a)(b) | 138,000 | 3,481,740 | |
| AmerisourceBergen Corp. | 270,504 | 31,037,629 | |
| Anthem, Inc. | 350,175 | 139,446,689 | |
| Cardinal Health, Inc. | 491,914 | 27,581,618 | |
| Centene Corp. (a) | 2,264,675 | 166,680,080 | |
| Cigna Corp. | 1,039,033 | 268,953,692 | |
| Covetrus, Inc. (a) | 26,001 | 721,268 | |
| CVS Health Corp. | 2,401,692 | 207,602,256 | |
| DaVita HealthCare Partners, Inc. (a) | 260,700 | 31,302,249 | |
| HCA Holdings, Inc. | 946,809 | 203,365,105 | |
| Henry Schein, Inc. (a) | 64,900 | 4,934,996 | |
| Humana, Inc. | 236,656 | 103,584,331 | |
| Laboratory Corp. of America Holdings (a) | 132,219 | 36,291,471 | |
| McKesson Corp. | 417,081 | 80,242,214 | |
| Molina Healthcare, Inc. (a) | 38,200 | 9,601,952 | |
| Option Care Health, Inc. (a) | 108,000 | 1,980,720 | |
| Quest Diagnostics, Inc. | 552,049 | 72,688,292 | |
| Rede D'Oregon Sao Luiz SA (c) | 260,000 | 3,484,398 | |
| Surgery Partners, Inc. (a) | 69,000 | 4,038,570 | |
| UnitedHealth Group, Inc. | 1,591,699 | 655,652,652 | |
| Universal Health Services, Inc. Class B | 184,765 | 29,494,037 | |
| 2,085,125,959 | |||
| Health Care Technology - 0.1% | |||
| agilon health, Inc. (a)(b) | 70,000 | 2,515,800 | |
| Cerner Corp. | 327,819 | 25,651,837 | |
| Phreesia, Inc. (a) | 56,000 | 2,772,000 | |
| Veeva Systems, Inc. Class A (a) | 35,163 | 10,244,388 | |
| 41,184,025 | |||
| Life Sciences Tools & Services - 0.8% | |||
| 10X Genomics, Inc. (a) | 12,000 | 2,160,000 | |
| Agilent Technologies, Inc. | 420,438 | 58,075,101 | |
| Avantor, Inc. (a) | 190,565 | 6,126,665 | |
| Bio-Rad Laboratories, Inc. Class A (a) | 26,800 | 16,143,516 | |
| Bruker Corp. | 80,000 | 5,555,200 | |
| Illumina, Inc. (a) | 102,809 | 41,703,443 | |
| IQVIA Holdings, Inc. (a) | 256,688 | 61,646,190 | |
| Lonza Group AG | 7,500 | 4,831,173 | |
| Mettler-Toledo International, Inc. (a) | 5,226 | 6,798,765 | |
| PerkinElmer, Inc. | 129,416 | 18,774,379 | |
| Sartorius Stedim Biotech | 8,000 | 3,467,024 | |
| Thermo Fisher Scientific, Inc. | 564,491 | 265,028,525 | |
| Waters Corp. (a) | 7,146 | 2,302,799 | |
| 492,612,780 | |||
| Pharmaceuticals - 3.0% | |||
| AstraZeneca PLC: | |||
| (United Kingdom) | 106,000 | 12,094,400 | |
| sponsored ADR (b) | 1,517,156 | 86,128,946 | |
| Atea Pharmaceuticals, Inc. | 28,000 | 571,760 | |
| Bayer AG | 183,372 | 11,543,692 | |
| Bristol-Myers Squibb Co. | 3,453,258 | 226,948,116 | |
| Elanco Animal Health, Inc. (a) | 1,860,871 | 66,954,139 | |
| Eli Lilly & Co. | 1,515,072 | 302,620,481 | |
| GlaxoSmithKline PLC sponsored ADR (b) | 244,362 | 9,473,915 | |
| Intra-Cellular Therapies, Inc. (a) | 13,300 | 524,153 | |
| Jazz Pharmaceuticals PLC (a) | 179,500 | 31,974,335 | |
| Johnson & Johnson | 3,034,941 | 513,663,764 | |
| Merck & Co., Inc. | 2,127,403 | 161,448,614 | |
| Nektar Therapeutics (a) | 75,000 | 1,355,250 | |
| Novartis AG sponsored ADR | 755,820 | 66,799,372 | |
| Novo Nordisk A/S Series B sponsored ADR (b) | 204,181 | 16,109,881 | |
| Pfizer, Inc. | 2,634,139 | 102,020,203 | |
| Pliant Therapeutics, Inc. (b) | 72,500 | 2,179,350 | |
| Roche Holding AG: | |||
| (participation certificate) | 34,200 | 11,897,803 | |
| sponsored ADR | 930,705 | 40,727,651 | |
| Royalty Pharma PLC | 150,000 | 6,018,000 | |
| Sanofi SA sponsored ADR | 686,470 | 36,678,092 | |
| Theravance Biopharma, Inc. (a) | 80,000 | 1,382,400 | |
| UCB SA | 24,000 | 2,245,740 | |
| Viatris, Inc. | 845,963 | 12,892,476 | |
| Zoetis, Inc. Class A | 620,823 | 109,687,008 | |
| 1,833,939,541 | |||
| TOTAL HEALTH CARE | 6,542,840,445 | ||
| INDUSTRIALS - 8.5% | |||
| Aerospace & Defense - 1.6% | |||
| Airbus Group NV (a) | 24,741 | 3,226,948 | |
| Axon Enterprise, Inc. (a) | 9,400 | 1,321,546 | |
| Curtiss-Wright Corp. | 5,460 | 684,247 | |
| General Dynamics Corp. | 384,351 | 72,992,098 | |
| Howmet Aerospace, Inc. (a) | 933,070 | 33,105,324 | |
| Huntington Ingalls Industries, Inc. | 161,190 | 34,850,890 | |
| L3Harris Technologies, Inc. | 337,047 | 73,496,469 | |
| Lockheed Martin Corp. | 119,050 | 45,500,910 | |
| Maxar Technologies, Inc. | 5,000 | 155,500 | |
| Moog, Inc. Class A | 127,400 | 11,491,480 | |
| MTU Aero Engines AG | 2,614 | 674,468 | |
| Northrop Grumman Corp. | 260,105 | 95,164,616 | |
| Raytheon Technologies Corp. | 2,482,944 | 220,261,962 | |
| Rolls-Royce Holdings PLC | 1,001,700 | 1,519,480 | |
| Safran SA | 2,772 | 414,769 | |
| Teledyne Technologies, Inc. (a) | 83,654 | 35,090,343 | |
| Textron, Inc. | 1,278,391 | 87,531,432 | |
| The Boeing Co. (a) | 702,714 | 173,584,412 | |
| TransDigm Group, Inc. (a) | 102,598 | 66,569,686 | |
| Vectrus, Inc. (a) | 37,733 | 1,925,138 | |
| 959,561,718 | |||
| Air Freight & Logistics - 0.8% | |||
| C.H. Robinson Worldwide, Inc. | 72,937 | 7,076,348 | |
| Expeditors International of Washington, Inc. | 417,293 | 52,449,557 | |
| FedEx Corp. | 582,802 | 183,471,898 | |
| United Parcel Service, Inc. Class B | 1,215,394 | 260,823,552 | |
| 503,821,355 | |||
| Airlines - 0.1% | |||
| American Airlines Group, Inc. (a) | 93,471 | 2,265,737 | |
| Copa Holdings SA Class A (a) | 400 | 32,904 | |
| Delta Air Lines, Inc. (a) | 725,900 | 34,610,912 | |
| Ryanair Holdings PLC sponsored ADR (a) | 8,572 | 1,000,781 | |
| United Airlines Holdings, Inc. (a) | 689,457 | 40,229,816 | |
| 78,140,150 | |||
| Building Products - 0.5% | |||
| A.O. Smith Corp. | 157,898 | 11,221,811 | |
| Allegion PLC | 137,352 | 19,295,209 | |
| Carrier Global Corp. | 333,970 | 15,339,242 | |
| Fortune Brands Home & Security, Inc. | 363,701 | 37,519,395 | |
| Johnson Controls International PLC | 585,155 | 38,936,214 | |
| Masco Corp. | 292,699 | 17,652,677 | |
| Owens Corning | 188,005 | 20,050,733 | |
| Trane Technologies PLC | 561,330 | 104,631,912 | |
| 264,647,193 | |||
| Commercial Services & Supplies - 0.1% | |||
| Cintas Corp. | 5,582 | 1,973,460 | |
| Deluxe Corp. | 215,300 | 9,809,068 | |
| Herman Miller, Inc. | 68,300 | 3,264,740 | |
| Rollins, Inc. | 169,711 | 5,785,448 | |
| Waste Connection, Inc. (United States) | 370,002 | 44,933,043 | |
| 65,765,759 | |||
| Construction & Engineering - 0.0% | |||
| MasTec, Inc. (a) | 119,500 | 13,901,435 | |
| Quanta Services, Inc. | 68,900 | 6,569,615 | |
| 20,471,050 | |||
| Electrical Equipment - 0.4% | |||
| Acuity Brands, Inc. | 114,789 | 21,322,057 | |
| AMETEK, Inc. | 230,900 | 31,194,590 | |
| Array Technologies, Inc. | 201,224 | 3,279,951 | |
| Eaton Corp. PLC | 601,492 | 87,366,713 | |
| Emerson Electric Co. | 448,300 | 42,897,827 | |
| Generac Holdings, Inc. (a) | 32,775 | 10,773,798 | |
| Hubbell, Inc. Class B | 68,438 | 13,047,020 | |
| Plug Power, Inc. (a) | 50,100 | 1,538,070 | |
| Rockwell Automation, Inc. | 41,914 | 11,053,560 | |
| Sensata Technologies, Inc. PLC (a) | 68,600 | 4,076,898 | |
| Shoals Technologies Group, Inc. | 73,900 | 2,039,640 | |
| Sunrun, Inc. (a) | 582,915 | 26,067,959 | |
| Vertiv Holdings Co. | 1,043 | 25,887 | |
| Vertiv Holdings LLC (a)(d) | 361,200 | 8,964,984 | |
| 263,648,954 | |||
| Industrial Conglomerates - 1.3% | |||
| 3M Co. | 794,000 | 161,213,760 | |
| Carlisle Companies, Inc. | 73,995 | 14,230,718 | |
| General Electric Co. | 13,904,195 | 195,492,982 | |
| Honeywell International, Inc. | 1,382,301 | 319,187,124 | |
| Roper Technologies, Inc. | 165,469 | 74,462,705 | |
| 764,587,289 | |||
| Machinery - 1.9% | |||
| AGCO Corp. | 326,300 | 45,150,131 | |
| Allison Transmission Holdings, Inc. | 309,700 | 13,103,407 | |
| Caterpillar, Inc. | 215,644 | 51,987,456 | |
| Crane Co. | 183,100 | 17,484,219 | |
| Cummins, Inc. | 611,179 | 157,244,133 | |
| Deere & Co. | 434,479 | 156,890,367 | |
| Dover Corp. | 280,435 | 42,205,468 | |
| Epiroc AB | 20,900 | 7,551 | |
| Epiroc AB (A Shares) | 20,900 | 473,232 | |
| Flowserve Corp. | 335,561 | 14,224,431 | |
| Fortive Corp. | 878,646 | 63,719,408 | |
| Illinois Tool Works, Inc. | 66,976 | 15,522,358 | |
| Ingersoll Rand, Inc. (a) | 1,179,670 | 58,558,819 | |
| ITT, Inc. | 214,692 | 20,159,579 | |
| Meritor, Inc. (a) | 117,300 | 3,049,800 | |
| Middleby Corp. (a) | 66,000 | 10,842,480 | |
| Oshkosh Corp. | 200,300 | 26,327,432 | |
| Otis Worldwide Corp. | 1,035,361 | 81,099,827 | |
| PACCAR, Inc. | 891,093 | 81,588,475 | |
| Parker Hannifin Corp. | 266,893 | 82,243,078 | |
| Pentair PLC | 106,000 | 7,310,820 | |
| Snap-On, Inc. | 102,988 | 26,222,805 | |
| Stanley Black & Decker, Inc. | 348,993 | 75,661,682 | |
| Timken Co. | 226,400 | 20,025,080 | |
| Westinghouse Air Brake Co. | 165,993 | 13,737,581 | |
| Xylem, Inc. | 225,000 | 26,577,000 | |
| 1,111,416,619 | |||
| Professional Services - 0.5% | |||
| Booz Allen Hamilton Holding Corp. Class A | 199,342 | 16,930,116 | |
| Clarivate Analytics PLC (a) | 378,832 | 11,380,113 | |
| CoStar Group, Inc. (a) | 34,532 | 29,490,328 | |
| Dun & Bradstreet Holdings, Inc. (a) | 112,353 | 2,412,219 | |
| Equifax, Inc. | 131,997 | 31,024,575 | |
| IHS Markit Ltd. | 629,265 | 66,267,897 | |
| Jacobs Engineering Group, Inc. | 460,569 | 65,437,644 | |
| Leidos Holdings, Inc. | 650,029 | 66,790,480 | |
| Manpower, Inc. | 134,300 | 16,248,957 | |
| Nielsen Holdings PLC | 60,347 | 1,642,042 | |
| Robert Half International, Inc. | 86,481 | 7,678,648 | |
| 315,303,019 | |||
| Road & Rail - 1.2% | |||
| AMERCO | 13,000 | 7,475,520 | |
| CSX Corp. | 735,665 | 73,654,780 | |
| J.B. Hunt Transport Services, Inc. | 106,870 | 18,332,480 | |
| Kansas City Southern | 26,075 | 7,762,006 | |
| Knight-Swift Transportation Holdings, Inc. Class A | 95,230 | 4,545,328 | |
| Lyft, Inc. (a) | 1,067,679 | 60,953,794 | |
| Norfolk Southern Corp. | 1,038,058 | 291,590,492 | |
| Old Dominion Freight Lines, Inc. | 161,341 | 42,827,968 | |
| Ryder System, Inc. | 26,905 | 2,200,560 | |
| Uber Technologies, Inc. (a) | 565,851 | 28,762,206 | |
| Union Pacific Corp. | 679,649 | 152,737,520 | |
| 690,842,654 | |||
| Trading Companies & Distributors - 0.1% | |||
| Beijer Ref AB (B Shares) | 11,700 | 202,818 | |
| United Rentals, Inc. (a) | 105,585 | 35,261,167 | |
| W.W. Grainger, Inc. | 64,105 | 29,626,767 | |
| 65,090,752 | |||
| TOTAL INDUSTRIALS | 5,103,296,512 | ||
| INFORMATION TECHNOLOGY - 19.7% | |||
| Communications Equipment - 0.6% | |||
| Cisco Systems, Inc. | 5,404,911 | 285,919,792 | |
| CommScope Holding Co., Inc. (a) | 950,724 | 19,309,204 | |
| F5 Networks, Inc. (a) | 187,953 | 34,852,125 | |
| Juniper Networks, Inc. | 227,200 | 5,982,176 | |
| Motorola Solutions, Inc. | 221,943 | 45,567,117 | |
| 391,630,414 | |||
| Electronic Equipment & Components - 0.5% | |||
| Amphenol Corp. Class A | 897,410 | 60,359,797 | |
| Arrow Electronics, Inc. (a) | 349,641 | 42,072,302 | |
| CDW Corp. | 276,524 | 45,742,600 | |
| Corning, Inc. | 217,939 | 9,508,679 | |
| Flex Ltd. (a) | 1,038,900 | 18,980,703 | |
| Hon Hai Precision Industry Co. Ltd. (Foxconn) | 911,000 | 3,750,807 | |
| Insight Enterprises, Inc. (a) | 23,500 | 2,455,280 | |
| Jabil, Inc. | 897,781 | 50,679,737 | |
| Keysight Technologies, Inc. (a) | 102,401 | 14,579,854 | |
| SYNNEX Corp. | 84,634 | 10,714,664 | |
| Trimble, Inc. (a) | 216,676 | 16,855,226 | |
| Vishay Intertechnology, Inc. | 618,200 | 14,880,074 | |
| Vontier Corp. | 54,589 | 1,914,982 | |
| Zebra Technologies Corp. Class A (a) | 4,082 | 2,028,958 | |
| 294,523,663 | |||
| IT Services - 3.8% | |||
| Accenture PLC Class A | 459,103 | 129,540,502 | |
| Affirm Holdings, Inc. (b) | 344,541 | 20,951,538 | |
| Akamai Technologies, Inc. (a) | 168,309 | 19,222,571 | |
| Amadeus IT Holding SA Class A (a) | 22,600 | 1,706,272 | |
| Amdocs Ltd. | 319,407 | 24,945,687 | |
| Automatic Data Processing, Inc. | 64,684 | 12,679,358 | |
| Broadridge Financial Solutions, Inc. | 23,780 | 3,792,434 | |
| Capgemini SA | 28,900 | 5,394,707 | |
| Cognizant Technology Solutions Corp. Class A | 976,291 | 69,863,384 | |
| CSG Systems International, Inc. | 185,800 | 8,182,632 | |
| DXC Technology Co. (a) | 184,632 | 7,001,245 | |
| Edenred SA | 34,207 | 1,860,181 | |
| Edenred SA rights (a)(b)(e) | 34,207 | 31,373 | |
| Fidelity National Information Services, Inc. | 729,014 | 108,608,536 | |
| Fiserv, Inc. (a) | 1,011,470 | 116,521,344 | |
| FleetCor Technologies, Inc. (a) | 376,071 | 103,208,925 | |
| Gartner, Inc. (a) | 44,995 | 10,431,641 | |
| Genpact Ltd. | 257,013 | 11,755,775 | |
| Global Payments, Inc. | 405,544 | 78,557,928 | |
| GoDaddy, Inc. (a) | 36,600 | 2,963,136 | |
| IBM Corp. | 749,010 | 107,662,697 | |
| Liveramp Holdings, Inc. (a) | 37,000 | 1,858,880 | |
| MasterCard, Inc. Class A | 1,335,775 | 481,653,750 | |
| PayPal Holdings, Inc. (a) | 864,607 | 224,815,112 | |
| Sabre Corp. (a) | 74,800 | 1,035,980 | |
| Shopify, Inc. (a) | 27,995 | 34,794,146 | |
| Snowflake Computing, Inc. | 39,034 | 9,291,263 | |
| The Western Union Co. | 807,087 | 19,749,419 | |
| Twilio, Inc. Class A (a) | 758 | 254,688 | |
| Unisys Corp. (a) | 130,500 | 3,355,155 | |
| VeriSign, Inc. (a) | 168,212 | 36,993,183 | |
| Visa, Inc. Class A | 2,659,305 | 604,460,027 | |
| Wix.com Ltd. (a) | 16,700 | 4,339,662 | |
| 2,267,483,131 | |||
| Semiconductors & Semiconductor Equipment - 4.4% | |||
| Advanced Micro Devices, Inc. (a) | 2,731,936 | 218,773,435 | |
| Analog Devices, Inc. | 963,778 | 158,637,859 | |
| Applied Materials, Inc. | 697,082 | 96,287,937 | |
| ASML Holding NV | 27,530 | 18,595,689 | |
| Broadcom, Inc. | 506,925 | 239,435,885 | |
| Cirrus Logic, Inc. (a) | 37,000 | 2,888,590 | |
| eMemory Technology, Inc. | 40,000 | 1,366,852 | |
| Intel Corp. | 4,174,467 | 238,445,555 | |
| KLA Corp. | 76,139 | 24,127,688 | |
| Lam Research Corp. | 193,281 | 125,603,658 | |
| Marvell Technology, Inc. | 305,503 | 14,755,795 | |
| Maxim Integrated Products, Inc. | 127,051 | 12,960,473 | |
| Microchip Technology, Inc. | 371,091 | 58,242,732 | |
| Micron Technology, Inc. (a) | 753,645 | 63,411,690 | |
| NVIDIA Corp. | 766,907 | 498,320,830 | |
| NXP Semiconductors NV | 989,720 | 209,246,602 | |
| ON Semiconductor Corp. (a) | 357,600 | 14,318,304 | |
| Qorvo, Inc. (a) | 130,345 | 23,816,638 | |
| Qualcomm, Inc. | 2,026,559 | 272,653,248 | |
| Semtech Corp. (a) | 22,200 | 1,398,600 | |
| SiTime Corp. (a) | 12,900 | 1,268,457 | |
| Skyworks Solutions, Inc. | 87,725 | 14,913,250 | |
| Teradyne, Inc. | 140,857 | 18,642,424 | |
| Texas Instruments, Inc. | 1,504,918 | 285,663,535 | |
| Universal Display Corp. | 2,200 | 474,892 | |
| Xilinx, Inc. | 332,516 | 42,229,532 | |
| 2,656,480,150 | |||
| Software - 7.0% | |||
| Adobe, Inc. (a) | 516,230 | 260,479,333 | |
| Anaplan, Inc. (a) | 141,600 | 7,293,816 | |
| ANSYS, Inc. (a) | 104,000 | 35,145,760 | |
| Atlassian Corp. PLC (a) | 83,320 | 19,436,890 | |
| Autodesk, Inc. (a) | 413,091 | 118,086,193 | |
| Cadence Design Systems, Inc. (a) | 23,086 | 2,931,691 | |
| CDK Global, Inc. | 53,000 | 2,774,020 | |
| Ceridian HCM Holding, Inc. (a) | 432,445 | 38,686,530 | |
| Citrix Systems, Inc. | 296,669 | 34,105,068 | |
| Cloudflare, Inc. (a) | 6,300 | 516,978 | |
| Cognyte Software Ltd. (a) | 247,279 | 6,364,961 | |
| Coupa Software, Inc. (a) | 90,840 | 21,638,088 | |
| Digital Turbine, Inc. (a) | 41,600 | 2,752,672 | |
| Dynatrace, Inc. (a) | 22,943 | 1,187,071 | |
| Elastic NV (a) | 42,200 | 4,988,462 | |
| Envestnet, Inc. (a) | 100 | 7,197 | |
| Everbridge, Inc. (a) | 4,500 | 528,750 | |
| Fortinet, Inc. (a) | 77,205 | 16,872,381 | |
| Intuit, Inc. | 426,389 | 187,223,146 | |
| j2 Global, Inc. (a) | 164,500 | 20,485,185 | |
| Microsoft Corp. | 9,487,504 | 2,368,839,999 | |
| NortonLifeLock, Inc. | 1,874,721 | 51,854,783 | |
| Nutanix, Inc. Class A (a) | 308,290 | 9,714,218 | |
| Oracle Corp. | 4,035,885 | 317,785,585 | |
| Palo Alto Networks, Inc. (a) | 79,623 | 28,923,055 | |
| PTC, Inc. (a) | 18,057 | 2,422,166 | |
| Salesforce.com, Inc. (a) | 1,621,490 | 386,076,769 | |
| SAP SE sponsored ADR | 56,236 | 7,869,103 | |
| ServiceNow, Inc. (a) | 28,969 | 13,727,830 | |
| Splunk, Inc. (a) | 146,300 | 17,731,560 | |
| SS&C Technologies Holdings, Inc. | 84,043 | 6,208,256 | |
| SVMK, Inc. (a) | 713,300 | 13,873,685 | |
| Synopsys, Inc. (a) | 102,255 | 26,007,537 | |
| UiPath, Inc. Class A (a)(b) | 90,355 | 7,212,136 | |
| Verint Systems, Inc. (a) | 68,200 | 3,144,702 | |
| VMware, Inc. Class A (a)(b) | 188,062 | 29,693,109 | |
| Workday, Inc. Class A (a) | 520,429 | 119,032,521 | |
| Workiva, Inc. (a) | 5,400 | 512,460 | |
| Yext, Inc. (a) | 462,200 | 6,688,034 | |
| Zendesk, Inc. (a) | 25,900 | 3,539,494 | |
| Zoom Video Communications, Inc. Class A (a) | 112,200 | 37,197,666 | |
| 4,239,558,860 | |||
| Technology Hardware, Storage & Peripherals - 3.4% | |||
| Apple, Inc. | 14,281,096 | 1,779,567,373 | |
| Hewlett Packard Enterprise Co. | 2,320,500 | 37,035,180 | |
| HP, Inc. | 2,703,158 | 79,013,308 | |
| NCR Corp. (a) | 312,300 | 15,052,860 | |
| NetApp, Inc. | 142,300 | 11,009,751 | |
| Seagate Technology Holdings PLC | 985,553 | 94,366,700 | |
| Western Digital Corp. (a) | 38,300 | 2,881,309 | |
| Xerox Holdings Corp. | 386,650 | 9,066,943 | |
| 2,027,993,424 | |||
| TOTAL INFORMATION TECHNOLOGY | 11,877,669,642 | ||
| MATERIALS - 2.4% | |||
| Chemicals - 1.4% | |||
| Albemarle Corp. U.S. | 45,500 | 7,602,140 | |
| Amyris, Inc. (a)(b) | 164,790 | 2,344,962 | |
| Cabot Corp. | 215,400 | 13,695,132 | |
| Celanese Corp. Class A | 290,417 | 48,049,493 | |
| CF Industries Holdings, Inc. | 137,593 | 7,315,820 | |
| Corteva, Inc. | 647,000 | 29,438,500 | |
| Dow, Inc. | 199,236 | 13,631,727 | |
| DuPont de Nemours, Inc. | 99,574 | 8,422,965 | |
| Eastman Chemical Co. | 882,858 | 110,710,393 | |
| Ecolab, Inc. | 81,437 | 17,515,470 | |
| FMC Corp. | 82,600 | 9,638,594 | |
| Huntsman Corp. | 1,013,100 | 28,751,778 | |
| Ingevity Corp. (a) | 136,575 | 11,241,488 | |
| International Flavors & Fragrances, Inc. | 124,240 | 17,601,081 | |
| Linde PLC | 631,882 | 189,943,729 | |
| Livent Corp. (a) | 11,193 | 218,375 | |
| LyondellBasell Industries NV Class A | 617,200 | 69,509,064 | |
| Olin Corp. | 203,100 | 9,929,559 | |
| PPG Industries, Inc. | 451,835 | 81,203,786 | |
| RPM International, Inc. | 441,065 | 41,252,809 | |
| Sherwin-Williams Co. | 331,546 | 94,003,237 | |
| The Chemours Co. LLC | 353,000 | 12,683,290 | |
| The Mosaic Co. | 351,321 | 12,696,741 | |
| The Scotts Miracle-Gro Co. Class A | 27,500 | 5,977,675 | |
| Valvoline, Inc. | 750,897 | 24,779,601 | |
| Westlake Chemical Corp. | 56,319 | 5,680,898 | |
| 873,838,307 | |||
| Construction Materials - 0.2% | |||
| Martin Marietta Materials, Inc. | 133,154 | 48,421,452 | |
| Summit Materials, Inc. (a) | 329,400 | 11,469,708 | |
| Vulcan Materials Co. | 236,149 | 43,290,835 | |
| 103,181,995 | |||
| Containers & Packaging - 0.6% | |||
| Amcor PLC | 997,400 | 11,769,320 | |
| Ball Corp. | 339,786 | 27,916,818 | |
| Berry Global Group, Inc. (a) | 483,000 | 32,945,430 | |
| Crown Holdings, Inc. | 475,519 | 49,092,582 | |
| Graphic Packaging Holding Co. | 600,135 | 10,610,387 | |
| International Paper Co. | 1,020,245 | 64,377,460 | |
| O-I Glass, Inc. (a) | 154,700 | 2,851,121 | |
| Packaging Corp. of America | 274,801 | 40,849,169 | |
| Sealed Air Corp. | 762,434 | 43,351,997 | |
| Sonoco Products Co. | 42,600 | 2,876,352 | |
| WestRock Co. | 909,586 | 53,047,056 | |
| 339,687,692 | |||
| Metals & Mining - 0.2% | |||
| BHP Group Ltd. sponsored ADR (b) | 52,591 | 3,897,519 | |
| First Quantum Minerals Ltd. | 79,400 | 1,953,753 | |
| Freeport-McMoRan, Inc. | 989,246 | 42,260,589 | |
| Newmont Corp. | 388,357 | 28,536,472 | |
| Nucor Corp. | 290,870 | 29,825,810 | |
| Reliance Steel & Aluminum Co. | 131,500 | 22,101,205 | |
| Steel Dynamics, Inc. | 134,200 | 8,378,106 | |
| 136,953,454 | |||
| Paper & Forest Products - 0.0% | |||
| Schweitzer-Mauduit International, Inc. | 240,600 | 9,842,946 | |
| TOTAL MATERIALS | 1,463,504,394 | ||
| REAL ESTATE - 1.8% | |||
| Equity Real Estate Investment Trusts (REITs) - 1.7% | |||
| Alexandria Real Estate Equities, Inc. | 88,827 | 15,834,301 | |
| American Homes 4 Rent Class A | 396,996 | 15,113,638 | |
| American Tower Corp. | 491,370 | 125,525,380 | |
| Apartment Income (REIT) Corp. | 133,567 | 6,221,551 | |
| AvalonBay Communities, Inc. | 138,366 | 28,633,460 | |
| Brandywine Realty Trust (SBI) | 767,000 | 10,784,020 | |
| Brixmor Property Group, Inc. | 713,228 | 16,197,408 | |
| Camden Property Trust (SBI) | 114,500 | 14,356,010 | |
| Corporate Office Properties Trust (SBI) | 33,900 | 935,640 | |
| Crown Castle International Corp. | 192,212 | 36,424,174 | |
| CubeSmart | 135,000 | 5,911,650 | |
| Digital Realty Trust, Inc. | 38,400 | 5,819,904 | |
| Douglas Emmett, Inc. | 49,400 | 1,715,168 | |
| EastGroup Properties, Inc. | 75,301 | 11,903,582 | |
| Equinix, Inc. | 79,080 | 58,259,818 | |
| Equity Lifestyle Properties, Inc. | 317,777 | 22,517,678 | |
| Equity Residential (SBI) | 182,074 | 14,101,631 | |
| Extra Space Storage, Inc. | 65,296 | 9,781,994 | |
| Federal Realty Investment Trust (SBI) | 91,379 | 10,448,275 | |
| Healthpeak Properties, Inc. | 28,304 | 944,788 | |
| Invitation Homes, Inc. | 161,200 | 5,846,724 | |
| Kilroy Realty Corp. | 43,600 | 3,061,156 | |
| Kimco Realty Corp. | 812,265 | 17,309,367 | |
| Lamar Advertising Co. Class A | 36,141 | 3,788,300 | |
| Lexington Corporate Properties Trust | 248,100 | 3,071,478 | |
| Mid-America Apartment Communities, Inc. | 169,186 | 27,188,190 | |
| Omega Healthcare Investors, Inc. | 439,500 | 16,094,490 | |
| Paramount Group, Inc. | 715,000 | 7,850,700 | |
| Piedmont Office Realty Trust, Inc. Class A | 784,400 | 14,503,556 | |
| Prologis (REIT), Inc. | 1,374,399 | 161,959,178 | |
| Public Storage | 228,636 | 64,585,097 | |
| Rayonier, Inc. | 483,650 | 18,470,594 | |
| SBA Communications Corp. Class A | 150,946 | 45,000,022 | |
| Service Properties Trust | 584,000 | 7,335,040 | |
| Simon Property Group, Inc. | 95,430 | 12,261,801 | |
| SITE Centers Corp. | 166,350 | 2,490,260 | |
| Sun Communities, Inc. | 296,440 | 49,629,985 | |
| Ventas, Inc. | 626,256 | 34,725,895 | |
| VEREIT, Inc. | 497,660 | 23,673,686 | |
| VICI Properties, Inc. | 33,900 | 1,055,307 | |
| Welltower, Inc. | 446,160 | 33,359,383 | |
| Weyerhaeuser Co. | 1,386,142 | 52,617,950 | |
| 1,017,308,229 | |||
| Real Estate Management & Development - 0.1% | |||
| CBRE Group, Inc. (a) | 423,213 | 37,149,637 | |
| Cushman & Wakefield PLC (a) | 252,100 | 4,792,421 | |
| Jones Lang LaSalle, Inc. (a) | 43,300 | 8,757,425 | |
| Opendoor Technologies, Inc. (a)(b) | 413,719 | 6,478,840 | |
| 57,178,323 | |||
| TOTAL REAL ESTATE | 1,074,486,552 | ||
| UTILITIES - 1.7% | |||
| Electric Utilities - 1.1% | |||
| American Electric Power Co., Inc. | 463,206 | 39,835,716 | |
| Duke Energy Corp. | 21,400 | 2,144,708 | |
| Edison International | 247,423 | 13,823,523 | |
| Entergy Corp. | 378,937 | 39,886,909 | |
| Evergy, Inc. | 574,506 | 35,613,627 | |
| Exelon Corp. | 1,299,700 | 58,642,464 | |
| FirstEnergy Corp. | 867,779 | 32,897,502 | |
| NextEra Energy, Inc. | 2,975,698 | 217,880,608 | |
| NRG Energy, Inc. | 803,026 | 25,817,286 | |
| PG&E Corp. (a) | 1,072,989 | 10,880,108 | |
| Pinnacle West Capital Corp. | 38,500 | 3,256,330 | |
| Southern Co. | 1,634,235 | 104,460,301 | |
| Xcel Energy, Inc. | 959,655 | 68,020,346 | |
| 653,159,428 | |||
| Gas Utilities - 0.0% | |||
| UGI Corp. | 132,800 | 6,115,440 | |
| Independent Power and Renewable Electricity Producers - 0.1% | |||
| FTC Solar, Inc. (a) | 74,900 | 805,924 | |
| NextEra Energy Partners LP (b) | 5,908 | 403,930 | |
| The AES Corp. | 706,352 | 17,948,404 | |
| Vistra Corp. | 1,037,600 | 16,777,992 | |
| 35,936,250 | |||
| Multi-Utilities - 0.5% | |||
| Ameren Corp. | 681,244 | 57,360,745 | |
| CenterPoint Energy, Inc. | 325,568 | 8,236,870 | |
| Dominion Energy, Inc. | 1,061,035 | 80,787,205 | |
| DTE Energy Co. | 69,357 | 9,570,572 | |
| MDU Resources Group, Inc. | 780,700 | 26,278,362 | |
| NiSource, Inc. | 120,800 | 3,080,400 | |
| Public Service Enterprise Group, Inc. | 685,301 | 42,570,898 | |
| Sempra Energy | 701,436 | 95,037,564 | |
| WEC Energy Group, Inc. | 144,515 | 13,571,404 | |
| 336,494,020 | |||
| Water Utilities - 0.0% | |||
| American Water Works Co., Inc. | 33,740 | 5,230,375 | |
| TOTAL UTILITIES | 1,036,935,513 | ||
| TOTAL COMMON STOCKS | |||
| (Cost $27,236,648,419) | 50,260,878,838 | ||
| Nonconvertible Preferred Stocks - 0.0% | |||
| INDUSTRIALS - 0.0% | |||
| Aerospace & Defense - 0.0% | |||
| Embraer SA sponsored ADR (a) | |||
| (Cost $757,192) | 72,700 | 973,453 | |
| Equity Funds - 15.5% | |||
| Large Blend Funds - 6.4% | |||
| Fidelity SAI U.S. Large Cap Index Fund (f) | 93,039,948 | 2,057,113,253 | |
| Fidelity SAI U.S. Low Volatility Index Fund (f) | 81,066,267 | 1,442,168,893 | |
| PIMCO StocksPLUS Absolute Return Fund Institutional Class | 23,140,982 | 320,734,004 | |
| TOTAL LARGE BLEND FUNDS | 3,820,016,150 | ||
| Large Growth Funds - 7.8% | |||
| Fidelity Growth Company Fund (f) | 103,351,429 | 3,660,707,600 | |
| Fidelity SAI U.S. Momentum Index Fund (f) | 1,765,283 | 31,475,001 | |
| Fidelity SAI U.S. Quality Index Fund (f) | 56,914,699 | 1,001,129,553 | |
| TOTAL LARGE GROWTH FUNDS | 4,693,312,154 | ||
| Mid-Cap Growth Funds - 1.3% | |||
| Janus Henderson Enterprise Fund | 4,620,603 | 784,485,953 | |
| TOTAL EQUITY FUNDS | |||
| (Cost $5,229,612,548) | 9,297,814,257 | ||
| Other - 0.0% | |||
| Commodity Funds - Broad Basket - 0.0% | |||
| Fidelity SAI Inflation-Focused Fund (f) | |||
| (Cost $6,768,588) | 858,825 | 10,795,429 | |
| Principal Amount | Value | ||
| U.S. Treasury Obligations - 0.0% | |||
| U.S. Treasury Bills, yield at date of purchase 0.05% to 0.05% 12/30/21 (g) | |||
| (Cost $5,358,468) | $5,360,000 | 5,359,132 | |
| Shares | Value | ||
| Money Market Funds - 1.3% | |||
| Fidelity Cash Central Fund 0.03% (h) | 42,708,061 | 42,716,602 | |
| Fidelity Securities Lending Cash Central Fund 0.03% (h)(i) | 291,998,372 | 292,027,572 | |
| Invesco Government & Agency Portfolio Institutional Class .03% (j) | 474,653,985 | 474,653,985 | |
| TOTAL MONEY MARKET FUNDS | |||
| (Cost $809,396,569) | 809,398,159 | ||
| TOTAL INVESTMENT IN SECURITIES - 100.3% | |||
| (Cost $33,288,541,784) | 60,385,219,268 | ||
| NET OTHER ASSETS (LIABILITIES) - (0.3)% | (193,376,023) | ||
| NET ASSETS - 100% | $60,191,843,245 |
| Futures Contracts | |||||
| Number of contracts | Expiration Date | Notional Amount | Value | Unrealized Appreciation/(Depreciation) | |
| Purchased | |||||
| Equity Index Contracts | |||||
| CME E-mini S&P 500 Index Contracts (United States) | 348 | June 2021 | $73,121,760 | $3,155,382 | $3,155,382 |
The notional amount of futures purchased as a percentage of Net Assets is 0.1%
Legend
(a) Non-income producing
(b) Security or a portion of the security is on loan at period end.
(c) Security exempt from registration under Rule 144A of the Securities Act of 1933. These securities may be resold in transactions exempt from registration, normally to qualified institutional buyers. At the end of the period, the value of these securities amounted to $9,748,861 or 0.0% of net assets.
(d) Restricted securities (including private placements) - Investment in securities not registered under the Securities Act of 1933 (excluding 144A issues). At the end of the period, the value of restricted securities (excluding 144A issues) amounted to $8,964,984 or 0.0% of net assets.
(e) Security or a portion of the security purchased on a delayed delivery or when-issued basis.
(f) Affiliated Fund
(g) Security or a portion of the security was pledged to cover margin requirements for futures contracts. At period end, the value of securities pledged amounted to $4,045,345.
(h) Affiliated fund that is generally available only to investment companies and other accounts managed by Fidelity Investments. The rate quoted is the annualized seven-day yield of the fund at period end. A complete unaudited listing of the fund's holdings as of its most recent quarter end is available upon request. In addition, each Fidelity Central Fund's financial statements, which are not covered by the Fund's Report of Independent Registered Public Accounting Firm, are available on the SEC's website or upon request.
(i) Investment made with cash collateral received from securities on loan.
(j) The rate quoted is the annualized seven-day yield of the fund at period end.
Additional information on each restricted holding is as follows:
| Security | Acquisition Date | Acquisition Cost |
| Vertiv Holdings LLC | 2/6/20 | $3,612,000 |
Affiliated Central Funds
Information regarding fiscal year to date income earned by the Fund from investments in Fidelity Central Funds is as follows:
| Fund | Income earned |
| Fidelity Cash Central Fund | $41,686 |
| Fidelity Securities Lending Cash Central Fund | 1,597,581 |
| Total | $1,639,267 |
Amounts in the income column in the above table include any capital gain distributions from underlying funds, which are presented in the corresponding line-item in the Statement of Operations, if applicable. Amount for Fidelity Securities Lending Cash Central Fund represents the income earned on investing cash collateral, less rebates paid to borrowers and any lending agent fees associated with the loan, plus any premium payments received for lending certain types of securities.
Affiliated Underlying Funds
Fiscal year to date information regarding the Fund's investments in affiliated Underlying Funds, excluding any Money Market Central Funds, is presented below. Exchanges between classes of the same affiliated Underlying Funds may occur.
| Affiliate | Value, beginning of period | Purchases(a) | Sales Proceeds(a) | Dividend Income | Realized Gain (loss) | Change in Unrealized appreciation (depreciation) | Value, end of period |
| Fidelity Growth Company Fund | $80,232,680 | $318,557,023 | $661,500,000 | $318,557,042 | $195,294,301 | $2,552,767,014 | $3,660,707,600 |
| Fidelity Mid Cap Index Fund | 184,207,331 | 181,719,113 | 492,758,443 | 9,424,205 | 146,039,330 | (19,207,331) | -- |
| Fidelity SAI Inflation-Focused Fund | 7,015,345 | 268,587 | -- | 268,587 | -- | 3,511,497 | 10,795,429 |
| Fidelity SAI U.S. Large Cap Index Fund | 1,056,804,634 | 5,836,954,586 | 5,535,519,402 | 56,313,709 | 215,479,562 | 377,260,294 | 2,057,113,253 |
| Fidelity SAI U.S. Low Volatility Index Fund | -- | 910,328,585 | -- | 9,144,471 | -- | 235,390,531 | 1,442,168,893 |
| Fidelity SAI U.S. Momentum Index Fund | 16,973,699 | 27,353,756 | 17,319,857 | 2,353,756 | 4,595,551 | (128,148) | 31,475,001 |
| Fidelity SAI U.S. Quality Index Fund | 2,101,480,276 | 153,567,229 | 1,527,187,463 | 153,567,213 | 427,108,640 | (153,839,129) | 1,001,129,553 |
| Fidelity SAI U.S. Value Index Fund | -- | -- | 91,205,299 | -- | 13,347,568 | -- | -- |
| Total | $3,446,713,965 | $7,428,748,879 | $8,325,490,464 | $549,628,983 | $1,001,864,952 | $2,995,754,728 | $8,203,389,729 |
(a) Excludes the value of securities received and delivered through merger transactions, if applicable.
Amounts in the income column in the above table include any capital gain distributions from underlying funds, which are presented in the corresponding line-item in the Statement of Operations, if applicable.
Investment Valuation
The following is a summary of the inputs used, as of May 31, 2021, involving the Fund's assets and liabilities carried at fair value. The inputs or methodology used for valuing securities may not be an indication of the risk associated with investing in those securities. For more information on valuation inputs, and their aggregation into the levels used below, please refer to the Investment Valuation section in the accompanying Notes to Financial Statements.
| Valuation Inputs at Reporting Date: | ||||
| Description | Total | Level 1 | Level 2 | Level 3 |
| Investments in Securities: | ||||
| Equities: | ||||
| Communication Services | $5,269,879,151 | $5,269,879,151 | $-- | $-- |
| Consumer Discretionary | 6,213,735,348 | 6,212,772,168 | 963,180 | -- |
| Consumer Staples | 2,595,098,518 | 2,591,102,784 | 3,995,734 | -- |
| Energy | 1,527,726,196 | 1,527,726,196 | -- | -- |
| Financials | 7,555,706,567 | 7,555,706,567 | -- | -- |
| Health Care | 6,542,840,445 | 6,530,746,045 | 12,094,400 | -- |
| Industrials | 5,104,269,965 | 5,102,750,485 | 1,519,480 | -- |
| Information Technology | 11,877,669,642 | 11,877,638,269 | 31,373 | -- |
| Materials | 1,463,504,394 | 1,463,504,394 | -- | -- |
| Real Estate | 1,074,486,552 | 1,074,486,552 | -- | -- |
| Utilities | 1,036,935,513 | 1,036,935,513 | -- | -- |
| Equity Funds | 9,297,814,257 | 9,297,814,257 | -- | -- |
| Other | 10,795,429 | 10,795,429 | -- | -- |
| Other Short-Term Investments and Net Other Assets | 5,359,132 | -- | 5,359,132 | -- |
| Money Market Funds | 809,398,159 | 809,398,159 | -- | -- |
| Total Investments in Securities: | $60,385,219,268 | $60,361,255,969 | $23,963,299 | $-- |
| Derivative Instruments: | ||||
| Assets | ||||
| Futures Contracts | $3,155,382 | $3,155,382 | $-- | $-- |
| Total Assets | $3,155,382 | $3,155,382 | $-- | $-- |
| Total Derivative Instruments: | $3,155,382 | $3,155,382 | $-- | $-- |
| Net unrealized appreciation on unfunded commitments: | $458,599 | $-- | $458,599 | $-- |
Value of Derivative Instruments
The following table is a summary of the Fund's value of derivative instruments by primary risk exposure as of May 31, 2021. For additional information on derivative instruments, please refer to the Derivative Instruments section in the accompanying Notes to Financial Statements.
| Primary Risk Exposure / Derivative Type | Value | |
| Asset | Liability | |
| Equity Risk | ||
| Futures Contracts(a) | $3,155,382 | $0 |
| Total Equity Risk | 3,155,382 | 0 |
| Total Value of Derivatives | $3,155,382 | $0 |
(a) Reflects gross cumulative appreciation (depreciation) on futures contracts as presented in the Schedule of Investments. In the Statement of Assets and Liabilities, the period end daily variation margin is included in receivable or payable for daily variation margin on futures contracts, and the net cumulative appreciation (depreciation) is included in Total accumulated earnings (loss).
See accompanying notes which are an integral part of the financial statements.
Financial Statements
Statement of Assets and Liabilities
| May 31, 2021 | ||
| Assets | ||
| Investment in securities, at value (including securities loaned of $285,467,989) — See accompanying schedule: Unaffiliated issuers (cost $28,466,437,750) | $51,847,085,365 | |
| Fidelity Central Funds (cost $334,742,584) | 334,744,174 | |
| Other affiliated issuers (cost $4,487,361,450) | 8,203,389,729 | |
| Total Investment in Securities (cost $33,288,541,784) | $60,385,219,268 | |
| Foreign currency held at value (cost $3,860,823) | 3,868,872 | |
| Receivable for investments sold | 523,318,670 | |
| Receivable for fund shares sold | 19,159,606 | |
| Net unrealized appreciation on unfunded commitments | 569,400 | |
| Dividends receivable | 67,599,362 | |
| Interest receivable | 12,199 | |
| Distributions receivable from Fidelity Central Funds | 63,750 | |
| Receivable for daily variation margin on futures contracts | 59,160 | |
| Prepaid expenses | 165,853 | |
| Other receivables | 818,184 | |
| Total assets | 61,000,854,324 | |
| Liabilities | ||
| Payable to custodian bank | $7,074 | |
| Payable for investments purchased | ||
| Regular delivery | 489,118,147 | |
| Delayed delivery | 31,285 | |
| Payable for fund shares redeemed | 17,769,761 | |
| Net unrealized depreciation on unfunded commitments | 110,801 | |
| Accrued management fee | 8,867,372 | |
| Other payables and accrued expenses | 1,079,067 | |
| Collateral on securities loaned | 292,027,572 | |
| Total liabilities | 809,011,079 | |
| Net Assets | $60,191,843,245 | |
| Net Assets consist of: | ||
| Paid in capital | $30,011,913,280 | |
| Total accumulated earnings (loss) | 30,179,929,965 | |
| Net Assets | $60,191,843,245 | |
| Net Asset Value, offering price and redemption price per share ($60,191,843,245 ÷ 4,952,945,087 shares) | $12.15 |
See accompanying notes which are an integral part of the financial statements.
Statement of Operations
| Year ended May 31, 2021(a) |
||
| Investment Income | ||
| Dividends: | ||
| Unaffiliated issuers | $572,569,917 | |
| Affiliated issuers | 64,443,198 | |
| Interest | 133,279 | |
| Income from Fidelity Central Funds (including $1,597,581 from security lending) | 1,639,267 | |
| Total income | 638,785,661 | |
| Expenses | ||
| Management fee | $188,574,596 | |
| Custodian fees and expenses | 349,114 | |
| Independent trustees' fees and expenses | 364,448 | |
| Registration fees | 460,708 | |
| Audit | 76,951 | |
| Legal | 103,911 | |
| Interest | 3,099 | |
| Miscellaneous | 160,692 | |
| Total expenses before reductions | 190,093,519 | |
| Expense reductions | (109,447,886) | |
| Total expenses after reductions | 80,645,633 | |
| Net investment income (loss) | 558,140,028 | |
| Realized and Unrealized Gain (Loss) | ||
| Net realized gain (loss) on: | ||
| Investment securities: | ||
| Unaffiliated issuers (net of foreign taxes of $307) | 2,726,032,554 | |
| Fidelity Central Funds | 914 | |
| Other affiliated issuers | 1,001,864,952 | |
| Foreign currency transactions | (681,253) | |
| Futures contracts | 21,313,330 | |
| Written options | 401,341 | |
| Capital gain distributions from underlying funds: | ||
| Unaffiliated issuers | 200,966,811 | |
| Affiliated issuers | 485,185,785 | |
| Total net realized gain (loss) | 4,435,084,434 | |
| Change in net unrealized appreciation (depreciation) on: | ||
| Investment securities: | ||
| Unaffiliated issuers (net of increase in deferred foreign taxes of $15,095) | 8,153,289,596 | |
| Fidelity Central Funds | (1,860) | |
| Other affiliated issuers | 2,995,754,728 | |
| Unfunded commitments | 458,599 | |
| Assets and liabilities in foreign currencies | 652,307 | |
| Futures contracts | (2,824,337) | |
| Written options | 107,225 | |
| Total change in net unrealized appreciation (depreciation) | 11,147,436,258 | |
| Net gain (loss) | 15,582,520,692 | |
| Net increase (decrease) in net assets resulting from operations | $16,140,660,720 |
(a) See Note 1 and Note 12.
See accompanying notes which are an integral part of the financial statements.
Statement of Changes in Net Assets
| Year ended May 31, 2021(a) | Year ended May 31, 2020(a) |
|
| Increase (Decrease) in Net Assets | ||
| Operations | ||
| Net investment income (loss) | $558,140,028 | $453,924,654 |
| Net realized gain (loss) | 4,435,084,434 | 755,139,994 |
| Change in net unrealized appreciation (depreciation) | 11,147,436,258 | 1,822,878,765 |
| Net increase (decrease) in net assets resulting from operations | 16,140,660,720 | 3,031,943,413 |
| Distributions to shareholders | (1,568,168,745) | (1,621,230,881) |
| Share transactions | ||
| Proceeds from sales of shares | 7,520,866,873 | 5,134,133,462 |
| Net asset value of shares issued in merger transaction (note 12) | 18,520,637,551 | – |
| Reinvestment of distributions | 232,385,307 | 1,597,215,641 |
| Cost of shares redeemed | (7,680,619,730) | (5,836,940,101) |
| Net increase (decrease) in net assets resulting from share transactions | 18,593,270,001 | 894,409,002 |
| Total increase (decrease) in net assets | 33,165,761,976 | 2,305,121,534 |
| Net Assets | ||
| Beginning of period | 27,026,081,269 | 24,720,959,735 |
| End of period | $60,191,843,245 | $27,026,081,269 |
| Other Information | ||
| Shares(b) | ||
| Sold | 905,089,646 | 604,995,727 |
| Issued in exchange for shares in merger transaction (note 12) | 1,844,685,437 | – |
| Issued in reinvestment of distributions | 143,286,389 | 174,537,857 |
| Redeemed | (1,009,622,141 ) | (675,441,771) |
| Net increase (decrease) | 1,883,439,331 | 104,091,813 |
(a) See Note 1 and Note 12.
(b) As further described in Notes 1 and 12, amounts have been adjusted to reflect the impact of the change in capital structure associated with the merger that occurred on November 20, 2020. All financial information prior to the merger is that of the Predecessor Fund.
See accompanying notes which are an integral part of the financial statements.
Financial Highlights
Strategic Advisers Large Cap Fund
| Years ended May 31, | 2021 A | 2020 A | 2019 A | 2018 A | 2017 A |
| Selected Per–Share Data | |||||
| Net asset value, beginning of period | $8.81 | $8.33 | $8.86 | $8.34 | $7.26 |
| Income from Investment Operations | |||||
| Net investment income (loss)B | .14 | .15 | .14 | .12 | .11 |
| Net realized and unrealized gain (loss) | 3.69 | .88 | .03 | 1.05 | 1.19 |
| Total from investment operations | 3.83 | 1.03 | .17 | 1.17 | 1.30 |
| Distributions from net investment income | (.15) | (.14) | (.14) | (.12) | (.09) |
| Distributions from net realized gain | (.34) | (.42) | (.56) | (.53) | (.13) |
| Total distributions | (.49) | (.55)C | (.70) | (.65) | (.22) |
| Net asset value, end of period | $12.15 | $8.81 | $8.33 | $8.86 | $8.34 |
| Total ReturnD | 44.55% | 12.17% | 2.41% | 14.59% | 18.22% |
| Ratios to Average Net AssetsE,F | |||||
| Expenses before reductions | .44% | .45% | .45% | .47% | .46% |
| Expenses net of fee waivers, if any | .19% | .20% | .20% | .21% | .21% |
| Expenses net of all reductions | .19% | .20% | .20% | .21% | .21% |
| Net investment income (loss) | 1.29% | 1.74% | 1.65% | 1.41% | 1.40% |
| Supplemental Data | |||||
| Net assets, end of period (000 omitted) | $60,191,843 | $27,026,081 | $24,720,960 | $24,984,597 | $23,157,908 |
| Portfolio turnover rateG | 74%H | 90% | 84% | 98% | 100% |
A As further described in Notes 1 and 12, per share amounts have been adjusted to reflect the impact of the change in capital structure associated with the merger that occurred on November 20, 2020. All financial information prior to the merger is that of the Predecessor Fund.
B Calculated based on average shares outstanding during the period.
C Total distributions per share do not sum due to rounding.
D Total returns would have been lower if certain expenses had not been reduced during the applicable periods shown.
E Fees and expenses of any underlying mutual funds or exchange-traded funds (ETFs) are not included in the Fund's expense ratio. The Fund indirectly bears its proportionate share of these expenses. For additional expense information related to investments in Fidelity Central Funds, please refer to the "Investments in Fidelity Central Funds" note found in the Notes to Financial Statements section of the most recent Annual or Semi-Annual report.
F Expense ratios reflect operating expenses of the class. Expenses before reductions do not reflect amounts reimbursed, waived, or reduced through arrangements with the investment advisor, brokerage services, or other offset arrangements, if applicable, and do not represent the amount paid by the class during periods when reimbursements, waivers or reductions occur.
G Amount does not include the portfolio activity of any underlying mutual funds or exchange-traded funds (ETFs).
H The portfolio turnover rate does not include the assets acquired in the merger.
See accompanying notes which are an integral part of the financial statements.
Notes to Financial Statements
For the period ended May 31, 2021
1. Organization.
Strategic Advisers Large Cap Fund (the Fund) is a fund of Fidelity Rutland Square Trust II (the Trust), and is authorized to issue an unlimited number of shares. The Trust is registered under the Investment Company Act of 1940, as amended (the 1940 Act), as an open-end management investment company organized as a Delaware statutory trust. The Fund is offered exclusively to certain managed account clients of Strategic Advisers LLC (Strategic Advisers), an affiliate of Fidelity Management & Research Company LLC (FMR).
Effective November 20, 2020, Strategic Advisers Core Fund ("Predecessor Fund") and two other funds were reorganized into the Fund. The Predecessor Fund was the accounting survivor in the reorganization, and, as such, the financial statements and financial highlights reflect the financial information of the Predecessor Fund through November 20, 2020 (see Note 12).
2. Significant Accounting Policies.
The Fund is an investment company and applies the accounting and reporting guidance of the Financial Accounting Standards Board (FASB) Accounting Standards Codification Topic 946 Financial Services - Investment Companies. The financial statements have been prepared in conformity with accounting principles generally accepted in the United States of America (GAAP), which require management to make certain estimates and assumptions at the date of the financial statements. Actual results could differ from those estimates. Subsequent events, if any, through the date that the financial statements were issued have been evaluated in the preparation of the financial statements. The Fund's Schedule of Investments lists any underlying mutual funds or exchange-traded funds (ETFs) but does not include the underlying holdings of these funds. The following summarizes the significant accounting policies of the Fund:
Investment Valuation. Investments are valued as of 4:00 p.m. Eastern time on the last calendar day of the period. The Board of Trustees (the Board) has delegated the day to day responsibility for the valuation of the Fund's investments to the Fair Value Committee (the Committee) established by the Fund's investment adviser. In accordance with valuation policies and procedures approved by the Board, the Fund attempts to obtain prices from one or more third party pricing vendors or brokers to value its investments. When current market prices, quotations or currency exchange rates are not readily available or reliable, investments will be fair valued in good faith by the Committee, in accordance with procedures adopted by the Board. Factors used in determining fair value vary by investment type and may include market or investment specific events, changes in interest rates and credit quality. The frequency with which these procedures are used cannot be predicted and they may be utilized to a significant extent. The Committee oversees the Fund's valuation policies and procedures and reports to the Board on the Committee's activities and fair value determinations. The Board monitors the appropriateness of the procedures used in valuing the Fund's investments and ratifies the fair value determinations of the Committee.
The Fund categorizes the inputs to valuation techniques used to value its investments into a disclosure hierarchy consisting of three levels as shown below:
- Level 1 – quoted prices in active markets for identical investments
- Level 2 – other significant observable inputs (including quoted prices for similar investments, interest rates, prepayment speeds, etc.)
- Level 3 – unobservable inputs (including the Fund's own assumptions based on the best information available)
Valuation techniques used to value the Fund's investments by major category are as follows:
Equity securities, including restricted securities, for which market quotations are readily available, are valued at the last reported sale price or official closing price as reported by a third party pricing vendor on the primary market or exchange on which they are traded and are categorized as Level 1 in the hierarchy. In the event there were no sales during the day or closing prices are not available, securities are valued at the last quoted bid price or may be valued using the last available price and are generally categorized as Level 2 in the hierarchy. For foreign equity securities, when market or security specific events arise, comparisons to the valuation of American Depositary Receipts (ADRs), futures contracts, Exchange-Traded Funds (ETFs) and certain indexes as well as quoted prices for similar securities may be used and would be categorized as Level 2 in the hierarchy. For equity securities, including restricted securities, where observable inputs are limited, assumptions about market activity and risk are used and these securities may be categorized as Level 3 in the hierarchy.
Debt securities, including restricted securities, are valued based on evaluated prices received from third party pricing vendors or from brokers who make markets in such securities. U.S. government and government agency obligations are valued by pricing vendors who utilize matrix pricing which considers yield or price of bonds of comparable quality, coupon, maturity and type or by broker-supplied prices. When independent prices are unavailable or unreliable, debt securities may be valued utilizing pricing methodologies which consider similar factors that would be used by third party pricing vendors. Debt securities are generally categorized as Level 2 in the hierarchy but may be Level 3 depending on the circumstances.
Futures contracts are valued at the settlement price established each day by the board of trade or exchange on which they are traded and are categorized as Level 1 in the hierarchy. Investments in open-end mutual funds, including the Fidelity Central Funds, are valued at their closing net asset value (NAV) each business day and are categorized as Level 1 in the hierarchy. If an unaffiliated open-end mutual fund's NAV is unavailable, shares of that fund may be valued by another method that the Board believes reflects fair value in accordance with the Board's fair value pricing policies and is categorized as Level 2 in the hierarchy.
Changes in valuation techniques may result in transfers in or out of an assigned level within the disclosure hierarchy. The aggregate value of investments by input level as of May 31, 2021 is included at the end of the Fund's Schedule of Investments.
Foreign Currency. Certain Funds may use foreign currency contracts to facilitate transactions in foreign-denominated securities. Gains and losses from these transactions may arise from changes in the value of the foreign currency or if the counterparties do not perform under the contracts' terms.
Foreign-denominated assets, including investment securities, and liabilities are translated into U.S. dollars at the exchange rates at period end. Purchases and sales of investment securities, income and dividends received, and expenses denominated in foreign currencies are translated into U.S. dollars at the exchange rate in effect on the transaction date.
The effects of exchange rate fluctuations on investments are included with the net realized and unrealized gain (loss) on investment securities. Other foreign currency transactions resulting in realized and unrealized gain (loss) are disclosed separately.
Investment Transactions and Income. For financial reporting purposes, the Fund's investment holdings and NAV include trades executed through the end of the last business day of the period. The NAV per share for processing shareholder transactions is calculated as of the close of business of the New York Stock Exchange (NYSE), normally 4:00 p.m. Eastern time and includes trades executed through the end of the prior business day. Gains and losses on securities sold are determined on the basis of identified cost and include proceeds received from litigation. Dividend income is recorded on the ex-dividend date, except for certain dividends from foreign securities where the ex-dividend date may have passed, which are recorded as soon as the Fund is informed of the ex-dividend date. Non-cash dividends included in dividend income, if any, are recorded at the fair market value of the securities received. Income and capital gain distributions from Fidelity Central Funds, if any, are recorded on the ex-dividend date. Income and capital gain distributions from any underlying mutual funds or exchange-traded funds (ETFs) are recorded on the ex-dividend date. Certain distributions received by the Fund represent a return of capital or capital gain. The Fund determines the components of these distributions subsequent to the ex-dividend date, based upon receipt of tax filings or other correspondence relating to the underlying investment. These distributions are recorded as a reduction of cost of investments and/or as a realized gain. Interest income is accrued as earned and includes coupon interest and amortization of premium and accretion of discount on debt securities as applicable. Investment income is recorded net of foreign taxes withheld where recovery of such taxes is uncertain.
Expenses. Expenses directly attributable to a fund are charged to that fund. Expenses attributable to more than one fund are allocated among the respective funds on the basis of relative net assets or other appropriate methods. Expenses included in the accompanying financial statements reflect the expenses of that fund and do not include any expenses associated with any underlying mutual funds or exchange-traded funds. Although not included in a fund's expenses, a fund indirectly bears its proportionate share of these expenses through the net asset value of each underlying mutual fund or exchange-traded fund. Expense estimates are accrued in the period to which they relate and adjustments are made when actual amounts are known.
Deferred Trustee Compensation. Under a Deferred Compensation Plan (the Plan) for certain Funds, certain independent Trustees have elected to defer receipt of a portion of their annual compensation. Deferred amounts are invested in affiliated mutual funds, are marked-to-market and remain in a fund until distributed in accordance with the Plan. The investment of deferred amounts and the offsetting payable to the Trustees presented below are included in the accompanying Statement of Assets and Liabilities in other receivables and other payables and accrued expenses, as applicable.
| Strategic Advisers Large Cap Fund | $810,539 |
Income Tax Information and Distributions to Shareholders. Each year, the Fund intends to qualify as a regulated investment company under Subchapter M of the Internal Revenue Code, including distributing substantially all of its taxable income and realized gains. As a result, no provision for U.S. Federal income taxes is required. As of May 31, 2021, the Fund did not have any unrecognized tax benefits in the financial statements; nor is the Fund aware of any tax positions for which it is reasonably possible that the total amounts of unrecognized tax benefits will significantly change in the next twelve months. The Fund files a U.S. federal tax return, in addition to state and local tax returns as required. The Fund's federal income tax returns are subject to examination by the Internal Revenue Service (IRS) for a period of three fiscal years after they are filed. State and local tax returns may be subject to examination for an additional fiscal year depending on the jurisdiction. Foreign taxes are provided for based on the Fund's understanding of the tax rules and rates that exist in the foreign markets in which it invests. The Fund is subject to a tax imposed on capital gains by certain countries in which it invests. An estimated deferred tax liability for net unrealized appreciation on the applicable securities is included in Other payables and accrued expenses on the Statement of Assets & Liabilities.
Distributions are declared and recorded on the ex-dividend date. Income and capital gain distributions are determined in accordance with income tax regulations, which may differ from GAAP. In addition, the Fund claimed a portion of the payment made to redeeming shareholders as a distribution for income tax purposes.
Capital accounts within the financial statements are adjusted for permanent book-tax differences. These adjustments have no impact on net assets or the results of operations. Capital accounts are not adjusted for temporary book-tax differences which will reverse in a subsequent period.
Book-tax differences are primarily due to the short-term gain distributions from the underlying mutual funds, futures contracts, foreign currency transactions, certain foreign taxes, passive foreign investment companies (PFIC), partnerships, deferred Trustees compensation and losses deferred due to wash sales.
As of period end, the cost and unrealized appreciation (depreciation) in securities, and derivatives if applicable, for federal income tax purposes were as follows:
| Gross unrealized appreciation | $27,129,693,751 |
| Gross unrealized depreciation | (261,796,235) |
| Net unrealized appreciation (depreciation) | $26,867,897,516 |
| Tax Cost | $33,517,780,351 |
The tax-based components of distributable earnings as of period end were as follows:
| Undistributed ordinary income | $801,019,118 |
| Undistributed long-term capital gain | $2,510,346,790 |
| Net unrealized appreciation (depreciation) on securities and other investments | $26,868,579,153 |
The tax character of distributions paid by the Fund during the period November 21, 2020 through May 31, 2021 was as follows:
| Ordinary Income | $164,015,935 |
| Long-term Capital Gains | 80,778,325 |
| Total | $244,794,260 |
The tax character of distributions paid by the Predecessor Fund was as follows:
| June 1, 2020 to November 20, 2020 | June 1, 2019 to May 31, 2020 | |
| Ordinary Income | $440,638,473 | $517,260,745 |
| Long-term Capital Gains | 882,736,012 | 1,103,970,136 |
| Total | $1,323,374,485 | $1,621,230,881 |
Delayed Delivery Transactions and When-Issued Securities. During the period, certain Funds transacted in securities on a delayed delivery or when-issued basis. Payment and delivery may take place after the customary settlement period for that security. The price of the underlying securities and the date when the securities will be delivered and paid for are fixed at the time the transaction is negotiated. Securities purchased on a delayed delivery or when-issued basis are identified as such in the Schedule of Investments. Compensation for interest forgone in the purchase of a delayed delivery or when-issued debt security may be received. With respect to purchase commitments, each applicable Fund identifies securities as segregated in its records with a value at least equal to the amount of the commitment. Payables and receivables associated with the purchases and sales of delayed delivery securities having the same coupon, settlement date and broker are offset. Delayed delivery or when-issued securities that have been purchased from and sold to different brokers are reflected as both payables and receivables in the Statement of Assets and Liabilities under the caption "Delayed delivery", as applicable. Losses may arise due to changes in the value of the underlying securities or if the counterparty does not perform under the contract's terms, or if the issuer does not issue the securities due to political, economic, or other factors.
Restricted Securities (including Private Placements). Funds may invest in securities that are subject to legal or contractual restrictions on resale. These securities generally may be resold in transactions exempt from registration or to the public if the securities are registered. Disposal of these securities may involve time-consuming negotiations and expense, and prompt sale at an acceptable price may be difficult. Information regarding restricted securities held at period end is included at the end of the Schedule of Investments, if applicable.
Special Purpose Acquisition Companies. Funds may invest in stock, warrants, and other securities of special purpose acquisition companies (SPACs) or similar special purpose entities. A SPAC is a publicly traded company that raises investment capital via an initial public offering (IPO) for the purpose of acquiring the equity securities of one or more existing companies via merger, business combination, acquisition or other similar transactions within a designated time frame.
Private Investment in Public Equity. Funds may acquire equity securities of an issuer through a private investment in a public equity (PIPE) transaction, including through commitments to purchase securities on a when-issued basis. A PIPE typically involves the purchase of securities directly from a publicly traded company in a private placement transaction. Securities purchased through PIPE transactions will be restricted from trading and considered illiquid until a resale registration statement for the shares is filed and declared effective.
At period end, the Fund had commitments to purchase when-issued securities through PIPE transactions with SPACs. The commitments are contingent upon the SPACs acquiring the securities of target companies. Unrealized appreciation (depreciation) on these commitments is separately presented in the Statements of Assets and Liabilities as Unrealized appreciation (depreciation) on unfunded commitments, and in the Statement of Operations as Change in unrealized appreciation (depreciation) on unfunded commitments.
3. Derivative Instruments.
Risk Exposures and the Use of Derivative Instruments. The Fund's investment objective allows the Fund to enter into various types of derivative contracts, including futures contracts and options. Derivatives are investments whose value is primarily derived from underlying assets, indices or reference rates and may be transacted on an exchange or over-the-counter (OTC). Derivatives may involve a future commitment to buy or sell a specified asset based on specified terms, to exchange future cash flows at periodic intervals based on a notional principal amount, or for one party to make one or more payments upon the occurrence of specified events in exchange for periodic payments from the other party.
The Fund used derivatives to increase returns and to manage exposure to certain risks as defined below. The success of any strategy involving derivatives depends on analysis of numerous economic factors, and if the strategies for investment do not work as intended, the Fund may not achieve its objectives.
The Fund's use of derivatives increased or decreased its exposure to the following risk:
| Equity Risk | Equity risk relates to the fluctuations in the value of financial instruments as a result of changes in market prices (other than those arising from interest rate risk or foreign exchange risk), whether caused by factors specific to an individual investment, its issuer, or all factors affecting all instruments traded in a market or market segment. |
The Fund is also exposed to additional risks from investing in derivatives, such as liquidity risk and counterparty credit risk. Liquidity risk is the risk that the Fund will be unable to close out the derivative in the open market in a timely manner. Counterparty credit risk is the risk that the counterparty will not be able to fulfill its obligation to the Fund. Counterparty credit risk related to exchange-traded futures contracts may be mitigated by the protection provided by the exchange on which they trade.
Investing in derivatives may involve greater risks than investing in the underlying assets directly and, to varying degrees, may involve risk of loss in excess of any initial investment and collateral received and amounts recognized in the Statement of Assets and Liabilities. In addition, there may be the risk that the change in value of the derivative contract does not correspond to the change in value of the underlying instrument.
Net Realized Gain (Loss) and Change in Net Unrealized Appreciation (Depreciation) on Derivatives. The table below, which reflects the impacts of derivatives on the financial performance of the Fund, summarizes the net realized gain (loss) and change in net unrealized appreciation (depreciation) for derivatives during the period as presented in the Statement of Operations.
| Primary Risk Exposure / Derivative Type | Net Realized Gain (Loss) | Change in Net Unrealized Appreciation (Depreciation) |
| Equity Risk | ||
| Futures Contracts | $21,313,330 | $(2,824,337) |
| Written Options | 401,341 | 107,225 |
| Total Equity Risk | $21,714,671 | $(2,717,112) |
A summary of the value of derivatives by primary risk exposure as of period end, if any, is included at the end of the Schedule of Investments.
Futures Contracts. A futures contract is an agreement between two parties to buy or sell a specified underlying instrument for a fixed price at a specified future date. The Fund used futures contracts to manage its exposure to the stock market.
Upon entering into a futures contract, a fund is required to deposit either cash or securities (initial margin) with a clearing broker in an amount equal to a certain percentage of the face value of the contract. Futures contracts are marked-to-market daily and subsequent daily payments (variation margin) are made or received by a fund depending on the daily fluctuations in the value of the futures contracts and are recorded as unrealized appreciation or (depreciation). This receivable and/or payable, if any, is included in daily variation margin on futures contracts in the Statement of Assets and Liabilities. Realized gain or (loss) is recorded upon the expiration or closing of a futures contract. The net realized gain (loss) and change in net unrealized appreciation (depreciation) on futures contracts during the period is presented in the Statement of Operations.
Any open futures contracts at period end are presented in the Schedule of Investments under the caption "Futures Contracts". The notional amount at value reflects each contract's exposure to the underlying instrument or index at period end and is representative of volume of activity during the period. Securities deposited to meet initial margin requirements are identified in the Schedule of Investments.
Options. Options give the purchaser the right, but not the obligation, to buy (call) or sell (put) an underlying security or financial instrument at an agreed exercise or strike price between or on certain dates. Options obligate the seller (writer) to buy (put) or sell (call) an underlying instrument at the exercise or strike price or cash settle an underlying derivative instrument if the holder exercises the option on or before the expiration date.
The Fund used exchange-traded written covered call options to manage its exposure to the market. When the Fund writes a covered call option, the Fund holds the underlying instrument which must be delivered to the holder upon the exercise of the option.
Upon entering into a written options contract, the Fund will receive a premium. Premiums received are reflected as a liability on the Statement of Assets and Liabilities. Options are valued daily and any unrealized appreciation (depreciation) is reflected on the Statement of Assets and Liabilities. When a written option is exercised, the premium is added to the proceeds from the sale of the underlying instrument in determining the gain or loss realized on that investment. When an option is closed the Fund will realize a gain or loss depending on whether the proceeds or amount paid for the closing sale transaction are greater or less than the premium received. When an option expires, gains and losses are realized to the extent of premiums received. The net realized gain (loss) on closed and expired written options and the change in net unrealized appreciation (depreciation) on written options are presented in the Statement of Operations.
Writing call options tends to decrease exposure to the underlying instrument and risk of loss is the change in value in excess of the premium received.
Any open options at period end are presented in the Schedule of Investments under the caption "Written Options".
4. Purchases and Sales of Investments.
Purchases and sales of securities, other than short-term securities and securities acquired in the merger, are noted in the table below.
| Purchases ($) | Sales ($) | |
| Strategic Advisers Large Cap Fund | 31,943,750,226 | 32,290,650,644 |
Unaffiliated Exchanges In-Kind. During the period, the Fund redeemed 19,946,276 shares of JPMorgan U.S. Large Cap Core Plus Fund Select Class in exchange for investments and cash with a value of $487,287,521. The net realized gain of $132,702,495 on Fund's redemptions of JPMorgan U.S. Large Cap Core Plus Fund Select Class is included in "Net Realized gain (loss) on Investment Securities: Unaffiliated issuers" in the accompanying Statement of Operations. The Fund recognized a net gain on the exchange for federal income tax purposes.
5. Fees and Other Transactions with Affiliates.
Management Fee. Strategic Advisers (the investment adviser) provides the Fund with investment management related services. For these services, the Fund pays a monthly management fee to the investment adviser. Beginning November 21, 2020, the management fee is calculated by adding the annual management fee rate of .25% of the Fund's average net assets throughout the month to the aggregate of the fee rates, payable monthly by the investment adviser, to the Fund's sub-advisers. The Fund's maximum aggregate management fee will not exceed .65% of the Fund's average net assets. During the period November 21, 2020 through May 31, 2021, the total annualized management fee rate was .43% of the Fund's average net assets, and the investment adviser waived a portion of its management fee as described in the Expense Reductions note.
During the period June 1, 2020 through November 20, 2020, the management fee was calculated by adding the annual management fee rate of .25% of the Predecessor Fund's average net assets throughout the month payable to the investment adviser to the aggregate of the fee rates, payable monthly, to the Predecessor Fund's sub-advisers (not to exceed 1.00%). During the period June 1, 2020 through November 20, 2020, the total annualized management fee rate was .44% of the Predecessor Fund's average net assets, and the investment adviser waived a portion of its management fee as described in the Expense Reductions note.
Sub-Advisers. AllianceBernstein, L.P. (AB), Aristotle Capital Management, LLC, Brandywine Global Investment Management, LLC, ClariVest Asset Management LLC, ClearBridge Investments, LLC, FIAM LLC (an affiliate of the investment adviser), Invesco Advisers, Inc., J.P. Morgan Investment Management, Inc., Loomis Sayles & Company, L.P., LSV Asset Management, PineBridge Investments LLC, Principal Global Investors, LLC and T. Rowe Price Associates, Inc. each served as a sub-adviser for the Fund during the period. Sub-advisers provide discretionary investment advisory services for their allocated portion of the Fund's assets and are paid as described in the Management Fee note.
Geode Capital Management, LLC (Geode) has been retained to serve as a sub-adviser for the Fund. As of the date of this report, however, Geode has not been allocated any portion of the Fund's assets. Geode in the future may provide discretionary investment advisory services for an allocated portion of the Fund's assets and will be paid by the investment adviser for providing these services.
Brokerage Commissions. A portion of portfolio transactions were placed with brokerage firms which are affiliates of the investment adviser. Brokerage commissions are included in net realized gain (loss) and change in net unrealized appreciation (depreciation) in the Statement of Operations. The commissions paid to these affiliated firms were as follows:
| Amount | |
| Strategic Advisers Large Cap Fund | $73,061 |
Interfund Trades. Funds may purchase from or sell securities to other funds affiliated with each sub-adviser under procedures adopted by the Board. The procedures have been designed to ensure these interfund trades are executed in accordance with Rule 17a-7 of the 1940 Act. Any interfund trades are included within the respective purchases and sales amounts shown in the Purchases and Sales of Investments note and are noted in the table below.
| Purchases ($) | Sales ($) | |
| Strategic Advisers Large Cap Fund | 212,146,716 | 430,166,728 |
6. Investments in Fidelity Central Funds.
Funds may invest in Fidelity Central Funds, which are open-end investment companies generally available only to other investment companies and accounts managed by the investment adviser and its affiliates. The Schedule of Investments lists any Fidelity Central Funds held as an investment as of period end, but does not include the underlying holdings of each Fidelity Central Fund. An investing fund indirectly bears its proportionate share of the expenses of the underlying Fidelity Central Funds.
Based on its investment objective, each Fidelity Central Fund may invest or participate in various investment vehicles or strategies that are similar to those of the investing fund. These strategies are consistent with the investment objectives of the investing fund and may involve certain economic risks which may cause a decline in value of each of the Fidelity Central Funds and thus a decline in the value of the investing fund.
A complete unaudited list of holdings for each Fidelity Central Fund is available upon request or at the Securities and Exchange Commission website at www.sec.gov. In addition, the financial statements of the Fidelity Central Funds, which are not covered by the Report of Independent Registered Public Accounting Firm, are available on the Securities and Exchange Commission website or upon request.
| Fidelity Central Fund | Investment Manager | Investment Objective | Investment Practices | Expense Ratio(a) |
| Fidelity Money Market Central Funds | Fidelity Management & Research Company LLC (FMR) | Each fund seeks to obtain a high level of current income consistent with the preservation of capital and liquidity. | Short-term Investments | Less than .005% to .01% |
(a) Expenses expressed as a percentage of average net assets and are as of each underlying Central Fund's most recent annual or semi-annual shareholder report.
7. Committed Line of Credit.
Certain Funds participate with other funds managed by the investment adviser or an affiliate in a $4.25 billion credit facility (the "line of credit") to be utilized for temporary or emergency purposes to fund shareholder redemptions or for other short-term liquidity purposes. The commitment fees on the pro-rata portion of the line of credit are borne by the investment adviser. The participating funds have agreed to pay commitment fees on their pro-rata portion of the line of credit, which are reflected in Miscellaneous expenses on the Statement of Operations, and are listed below. During the period, there were no borrowings on this line of credit.
| Amount | |
| Strategic Advisers Large Cap Fund | $35,279 |
8. Security Lending.
Funds lend portfolio securities through a lending agent from time to time in order to earn additional income. On the settlement date of the loan, a fund receives collateral (in the form of U.S. Treasury obligations, letters of credit and/or cash) against the loaned securities and maintains collateral in an amount not less than 100% of the market value of the loaned securities during the period of the loan. The market value of the loaned securities is determined at the close of business of a fund and any additional required collateral is delivered to a fund on the next business day. A fund or borrower may terminate the loan at any time, and if the borrower defaults on its obligation to return the securities loaned because of insolvency or other reasons, a fund may apply collateral received from the borrower against the obligation. A fund may experience delays and costs in recovering the securities loaned. Any cash collateral received is invested in the Fidelity Securities Lending Cash Central Fund. Any loaned securities are identified as such in the Schedule of Investments, and the value of loaned securities and cash collateral at period end, as applicable, are presented in the Statement of Assets and Liabilities. Security lending income represents the income earned on investing cash collateral, less rebates paid to borrowers and any lending agent fees associated with the loan, plus any premium payments received for lending certain types of securities. Security lending income is presented in the Statement of Operations as a component of income from Fidelity Central Funds.
9. Bank Borrowings.
The Fund is permitted to have bank borrowings for temporary or emergency purposes to fund shareholder redemptions or for other short-term liquidity requirements. The Fund has established borrowing arrangements with certain banks. The interest rate on the borrowings is the bank's base rate, as revised from time to time. Any open loans, including accrued interest, at period end are presented under the caption "Notes payable" in the Statement of Assets and Liabilities, if applicable. Activity in this program during the period for which loans were outstanding was as follows:
| Average Loan Balance | Weighted Average Interest Rate | Interest Expense | |
| Strategic Advisers Large Cap Fund | $96,373,000 | .56% | $3,099 |
10. Expense Reductions.
The investment adviser has contractually agreed to waive the Fund's management fee in an amount equal to .25% of the Fund's average net assets until September 30, 2023. During the period November 21, 2020 through May 31, 2021, this waiver reduced the Fund's management fee by $73,193,599.
The investment adviser contractually waived the Predecessor Fund's management fee in an amount equal to .25% of the Predecessor Fund's average net assets. During the period June 1, 2020 through November 20, 2020, this waiver reduced the Predecessor Fund's management fee by $35,989,876.
In addition, the investment adviser has voluntarily agreed to waive a portion of the Fund's management fee payable to FIAM LLC during the period November 21, 2020 through May 31, 2021. This waiver reduced the Fund's management fee by $50,645.
Commissions paid to certain brokers with whom the investment adviser, or its affiliates, places trades on behalf of the Fund include an amount in addition to trade execution, which may be rebated back to the Fund to offset expenses. This amount totaled $211,314 for the period.
In addition, through arrangements with the Fund's custodian, credits realized as a result of certain uninvested cash balances were used to reduce the Fund's expenses by $2,452.
11. Other.
Fund's organizational documents provide former and current trustees and officers with a limited indemnification against liabilities arising in connection with the performance of their duties to the fund. In the normal course of business, the fund may also enter into contracts that provide general indemnifications. The fund's maximum exposure under these arrangements is unknown as this would be dependent on future claims that may be made against the fund. The risk of material loss from such claims is considered remote.
Funds do not invest in underlying mutual funds for the purpose of exercising management or control; however, investments by funds within their principal investment strategies may represent a significant portion of the underlying mutual fund's net assets. At the end of the period, certain Funds were the owners of record of 10% or more of the total outstanding shares of the following underlying mutual funds as shown below.
| Fund | Strategic Advisers Large Cap Fund |
| Fidelity SAI U.S. Large Cap Index Fund | 13% |
| Fidelity SAI U.S. Low Volatility Index Fund | 18% |
| Fidelity SAI U.S. Quality Index Fund | 12% |
12. Merger Information.
On November 20, 2020, the Fund acquired all of the assets and assumed all of the liabilities of Strategic Advisers Growth Fund, Strategic Advisers Value Fund (Target Funds) and Strategic Advisers Core Fund (Predecessor Fund) pursuant to an Agreement and Plan of Reorganization approved by the Board of Trustees ("The Board"). The securities held by the Target Funds and Predecessor Fund were the primary assets acquired by the Fund. Each acquisition was accomplished by an exchange of shares of the Fund for shares then outstanding of each Target Fund and the Predecessor Fund at their respective net asset value on the acquisition date. The reorganization provides shareholders of each Target Fund and the Predecessor Fund access to a larger portfolio with a similar investment objective and lower projected expenses. As a result of this transaction the Predecessor Fund was determined to be the accounting survivor. As such, performance and financial history prior to the merger is that of the Predecessor Fund. Historical share transactions and per share information for the Predecessor Fund has been retroactively adjusted to reflect the change in capital structure due to the merger. The reorganization qualified as a tax-free reorganization for federal income tax purposes with no gain or loss recognized to the funds or their shareholders. For financial reporting purposes, the assets and liabilities of the Predecessor Fund and Target Funds and shares issued by the Fund were recorded at fair value; however, the cost basis of the investments received from the Predecessor Fund and Target Funds were carried forward to align ongoing reporting of realized and unrealized gains and losses with amounts distributable to shareholders for tax purposes. Costs incurred in connection with the reorganization were paid by the respective fund.
| Predecessor and Target Funds | Securities $ | Unrealized appreciation (depreciation) $ | Net Assets $ | Shares Exchanged | Shares Exchanged Ratio |
| Strategic Advisers Core Fund(a) | 31,619,450,950 | 12,056,868,793 | 31,632,208,284 | 3,150,617,669 | 2.0769521912 |
| Strategic Advisers Growth Fund | 9,684,515,165 | 5,505,004,332 | 9,686,104,070 | 964,750,799 | 2.1295816733 |
| Strategic Advisers Value Fund | 8,821,520,451 | 2,357,297,576 | 8,833,529,481 | 879,834,633 | 1.7264342629 |
(a) Predecessor Fund/Accounting survivor
| Legal Acquiring Fund | Net assets $ | Total net assets after the acquisition $ |
| Strategic Advisers Large Cap Fund | 1,004,000 | 50,152,845,835 |
Pro forma results of operations of the combined entity for the entire period ended May 31, 2021 as though the acquisition had occurred as of the beginning of the year (rather than on the actual acquisition date) are as follows:
| Net investment income (loss) | $568,896,394 |
| Total net realized gain (loss) | 5,389,603,115 |
| Total change in net unrealized appreciation (depreciation) | 13,348,109,861 |
| Net increase (decrease) in net assets resulting from operations | $19,306,609,370 |
Because the combined investment portfolios have been managed as a single portfolio since each acquisition was completed, it is not practicable to separate the amounts of revenue and earnings of each Target Fund that has been included in the Fund's accompanying Statement of Operations since November 20, 2020.
13. Coronavirus (COVID-19) Pandemic.
An outbreak of COVID-19 first detected in China during December 2019 has since spread globally and was declared a pandemic by the World Health Organization during March 2020. Developments that disrupt global economies and financial markets, such as the COVID-19 pandemic, may magnify factors that affect the Fund's performance.
Report of Independent Registered Public Accounting Firm
To the Board of Trustees of Fidelity Rutland Square Trust II and Shareholders of Strategic Advisers Large Cap Fund
Opinion on the Financial Statements
We have audited the accompanying statement of assets and liabilities, including the schedule of investments, of Strategic Advisers Large Cap Fund (one of the funds constituting Fidelity Rutland Square Trust II, referred to hereafter as the “Fund”) as of May 31, 2021, the related statement of operations for the year ended May 31, 2021, the statement of changes in net assets for each of the two years in the period ended May 31, 2021, including the related notes, and the financial highlights for each of the five years in the period ended May 31, 2021 (collectively referred to as the “financial statements”). In our opinion, the financial statements present fairly, in all material respects, the financial position of the Fund as of May 31, 2021, the results of its operations for the year then ended, the changes in its net assets for each of the two years in the period ended May 31, 2021 and the financial highlights for each of the five years in the period ended May 31, 2021 in conformity with accounting principles generally accepted in the United States of America.
Basis for Opinion
These financial statements are the responsibility of the Fund’s management. Our responsibility is to express an opinion on the Fund’s financial statements based on our audits. We are a public accounting firm registered with the Public Company Accounting Oversight Board (United States) (PCAOB) and are required to be independent with respect to the Fund in accordance with the U.S. federal securities laws and the applicable rules and regulations of the Securities and Exchange Commission and the PCAOB.
We conducted our audits of these financial statements in accordance with the standards of the PCAOB. Those standards require that we plan and perform the audit to obtain reasonable assurance about whether the financial statements are free of material misstatement, whether due to error or fraud.
Our audits included performing procedures to assess the risks of material misstatement of the financial statements, whether due to error or fraud, and performing procedures that respond to those risks. Such procedures included examining, on a test basis, evidence regarding the amounts and disclosures in the financial statements. Our audits also included evaluating the accounting principles used and significant estimates made by management, as well as evaluating the overall presentation of the financial statements. Our procedures included confirmation of securities owned as of May 31, 2021 by correspondence with the custodian, issuers of privately offered securities and brokers; when replies were not received from brokers, we performed other auditing procedures. We believe that our audit provides a reasonable basis for our opinion.
/s/ PricewaterhouseCoopers LLP
Boston, Massachusetts
July 26, 2021
We have served as the auditor of one or more investment companies in the Fidelity group of funds since 1932.
Trustees and Officers
The Trustees, Members of the Advisory Board (if any), and officers of the trust and fund, as applicable, are listed below. The Board of Trustees governs the fund and is responsible for protecting the interests of shareholders. The Trustees are experienced executives who meet periodically throughout the year to oversee the fund's activities, review contractual arrangements with companies that provide services to the fund, oversee management of the risks associated with such activities and contractual arrangements, and review the fund's performance. If the interests of the fund and an underlying Fidelity® fund were to diverge, a conflict of interest could arise and affect how the Trustees and Members of the Advisory Board fulfill their fiduciary duties to the affected funds. Strategic Advisers has structured the fund to avoid these potential conflicts, although there may be situations where a conflict of interest is unavoidable. In such instances, Strategic Advisers, the Trustees, and Members of the Advisory Board would take reasonable steps to minimize and, if possible, eliminate the conflict. Each of the Trustees oversees 12 funds.
The Trustees hold office without limit in time except that (a) any Trustee may resign; (b) any Trustee may be removed by written instrument, signed by at least two-thirds of the number of Trustees prior to such removal; (c) any Trustee who requests to be retired or who has become incapacitated by illness or injury may be retired by written instrument signed by a majority of the other Trustees; and (d) any Trustee may be removed at any special meeting of shareholders by a two-thirds vote of the outstanding voting securities of the trust. Each Independent Trustee shall retire not later than the last day of the calendar year in which his or her 75th birthday occurs. The Independent Trustees may waive this mandatory retirement age policy with respect to individual Trustees. Officers and Advisory Board Members hold office without limit in time, except that any officer or Advisory Board Member may resign or may be removed by a vote of a majority of the Trustees at any regular meeting or any special meeting of the Trustees. Except as indicated, each individual has held the office shown or other offices in the same company for the past five years.
Each Trustee who is not an interested person (as defined in the 1940 Act) of the trust and the fund is referred to herein as an Independent Trustee.
The fund’s Statement of Additional Information (SAI) includes more information about the Trustees. To request a free copy, call Fidelity at 1-800-544-3455.
Experience, Skills, Attributes, and Qualifications of the Trustees. The Governance and Nominating Committee has adopted a statement of policy that describes the experience, qualifications, attributes, and skills that are necessary and desirable for potential Independent Trustee candidates (Statement of Policy). The Board believes that each Trustee satisfied at the time he or she was initially elected or appointed a Trustee, and continues to satisfy, the standards contemplated by the Statement of Policy. The Governance and Nominating Committee may also engage professional search firms to help identify potential Independent Trustee candidates with experience, qualifications, attributes, and skills consistent with the Statement of Policy. Additional criteria based on the composition and skills of the current Independent Trustees, as well as experience or skills that may be appropriate in light of future changes to board composition, business conditions, and regulatory or other developments, may be considered by the professional search firms and the Governance and Nominating Committee. In addition, the Board takes into account the Trustees' commitment and participation in Board and committee meetings, as well as their leadership of standing and ad hoc committees throughout their tenure.
In determining that a particular Trustee was and continues to be qualified to serve as a Trustee, the Board has considered a variety of criteria, none of which, in isolation, was controlling. The Board believes that, collectively, the Trustees have balanced and diverse experience, qualifications, attributes, and skills, which allow the Board to operate effectively in governing the fund and protecting the interests of shareholders. Information about the specific experience, skills, attributes, and qualifications of each Trustee, which in each case led to the Board's conclusion that the Trustee should serve (or continue to serve) as a trustee of the fund, is provided below.
Board Structure and Oversight Function. Robert A. Lawrence is an interested person and currently serves as Chairman. The Trustees have determined that an interested Chairman is appropriate and benefits shareholders because an interested Chairman has a personal and professional stake in the quality and continuity of services provided to the fund. Independent Trustees exercise their informed business judgment to appoint an individual of their choosing to serve as Chairman, regardless of whether the Trustee happens to be independent or a member of management. The Independent Trustees have determined that they can act independently and effectively without having an Independent Trustee serve as Chairman and that a key structural component for assuring that they are in a position to do so is for the Independent Trustees to constitute a substantial majority for the Board. The Independent Trustees also regularly meet in executive session. Mary C. Farrell serves as the lead Independent Trustee and as such (i) acts as a liaison between the Independent Trustees and management with respect to matters important to the Independent Trustees and (ii) with management prepares agendas for Board meetings.
Fidelity® funds are overseen by different Boards of Trustees. The fund's Board oversees asset allocation funds. Other Boards oversee Fidelity's investment-grade bond, money market, and asset allocation funds, and Fidelity's equity and high income funds. The fund may invest in Fidelity® funds overseen by such other Boards. The use of separate Boards, each with its own committee structure, allows the Trustees of each group of Fidelity® funds to focus on the unique issues of the funds they oversee, including common research, investment, and operational issues.
The Trustees primarily operate as a full Board, but also operate in committees, to facilitate the timely and efficient consideration of all matters of importance to the Trustees, the fund, and fund shareholders and to facilitate compliance with legal and regulatory requirements and oversight of the fund's activities and associated risks. The Board has charged Strategic Advisers and its affiliates with (i) identifying events or circumstances the occurrence of which could have demonstrably adverse effects on the fund's business and/or reputation; (ii) implementing processes and controls to lessen the possibility that such events or circumstances occur or to mitigate the effects of such events or circumstances if they do occur; and (iii) creating and maintaining a system designed to evaluate continuously business and market conditions in order to facilitate the identification and implementation processes described in (i) and (ii) above. Because the day-to-day operations and activities of the fund are carried out by or through Strategic Advisers, its affiliates and other service providers, the fund's exposure to risks is mitigated but not eliminated by the processes overseen by the Trustees. Board oversight of different aspects of the fund's activities is exercised primarily through the full Board, but also through the Audit and Compliance Committee. Appropriate personnel, including but not limited to the fund's Chief Compliance Officer (CCO), FMR's internal auditor, the independent accountants, the fund's Treasurer and portfolio management personnel, make periodic reports to the Board's committees, as appropriate. The responsibilities of each standing committee, including their oversight responsibilities, are described further under "Standing Committees of the Trustees."
Interested Trustees*:
Correspondence intended for a Trustee who is an interested person may be sent to Fidelity Investments, 245 Summer Street, Boston, Massachusetts 02210.
Name, Year of Birth; Principal Occupations and Other Relevant Experience+
Robert A. Lawrence (1952)
Year of Election or Appointment: 2016
Trustee
Chairman of the Board of Trustees
Mr. Lawrence also serves as Trustee of other funds. Previously, Mr. Lawrence served as a Member of the Advisory Board of certain funds. Prior to his retirement in 2008, Mr. Lawrence served as Vice President of certain Fidelity® funds (2006-2008), Senior Vice President, Head of High Income Division of Fidelity Management & Research Company (investment adviser firm, 2006-2008), and President of Fidelity Strategic Investments (investment adviser firm, 2002-2005).
Charles S. Morrison (1960)
Year of Election or Appointment: 2020
Trustee
Mr. Morrison also serves as Trustee of other funds. Previously, Mr. Morrison served as President (2017-2018) and Director (2014-2018) of Fidelity SelectCo, LLC (investment adviser firm), President of Fidelity Management & Research Company (FMR) (investment adviser firm, 2016-2018), a Director of Fidelity Investments Money Management, Inc. (investment adviser firm, 2014-2018), President, Asset Management (2014-2018), Trustee of the Fidelity Equity and High Income Funds (283 funds as of December 2018) (2014-2018), and was an employee of Fidelity Investments. Mr. Morrison also previously served as Vice President of Fidelity's Fixed Income and Asset Allocation Funds (2012-2014), President, Fixed Income (2011-2014), Vice President of Fidelity's Money Market Funds (2005-2009), President, Money Market Group Leader of FMR (2009), and Senior Vice President, Money Market Group of FMR (2004-2009). Mr. Morrison also served as Vice President of Fidelity's Bond Funds (2002-2005), certain Balanced Funds (2002-2005), and certain Asset Allocation Funds (2002-2007), and as Senior Vice President (2002-2005) of Fidelity's Bond Division.
* Determined to be an "Interested Trustee" by virtue of, among other things, his or her affiliation with the trust or various entities under common control with Strategic Advisers.
+ The information includes the Trustee's principal occupation during the last five years and other information relating to the experience, attributes, and skills relevant to the Trustee's qualifications to serve as a Trustee, which led to the conclusion that the Trustee should serve as a Trustee for the fund.
Independent Trustees:
Correspondence intended for an Independent Trustee may be sent to Fidelity Investments, P.O. Box 55235, Boston, Massachusetts 02205-5235.
Name, Year of Birth; Principal Occupations and Other Relevant Experience+
Peter C. Aldrich (1944)
Year of Election or Appointment: 2006
Trustee
Mr. Aldrich also serves as Trustee of other funds. Mr. Aldrich is a Director of the U.S. Core Property Fund (and, previously, other funds) of BlackRock Realty Group (2006-present). Previously, Mr. Aldrich served as a Managing Member of Poseidon, LLC (foreign private investment, 1998-2004), and Chairman and Managing Member of AEGIS, LLC (foreign private investment, 1997-2004). Mr. Aldrich previously was a founder, Chief Executive Officer, and Chairman of AEW Capital Management, L.P. (then “Aldrich, Eastman and Waltch, L.P.”). Mr. Aldrich also served as a Director of LivelyHood, Inc. (private corporation, 2013-2020), a Trustee for the Fidelity Rutland Square Trust (2005-2010), a Director of Zipcar, Inc. (car sharing services, 2001-2009) and as Faculty Chairman of The Research Council on Global Investment of The Conference Board (business and professional education non-profit, 1999-2004). Mr. Aldrich is a Member Emeritus of the Board of Directors of the National Bureau of Economic Research and the Board of Trustees of the Museum of Fine Arts Boston.
Mary C. Farrell (1949)
Year of Election or Appointment: 2013
Trustee
Ms. Farrell also serves as Trustee of other funds. Ms. Farrell is a Director of the W.R. Berkley Corporation (insurance provider) and President (2009-present) and Director (2006-present) of the Howard Gilman Foundation (charitable organization). Previously, Ms. Farrell was Managing Director and Chief Investment Strategist at UBS Wealth Management USA and Co-Head of UBS Wealth Management Investment Strategy & Research Group (2003-2005). Ms. Farrell also served as Investment Strategist at PaineWebber (1982-2000) and UBS PaineWebber (2000-2002). Ms. Farrell serves as Chairman of the Board of Trustees of Yale-New Haven Hospital and Vice Chairman of the Yale New Haven Health System Board and previously served as Trustee on the Board of Overseers of the New York University Stern School of Business.
Karen Kaplan (1960)
Year of Election or Appointment: 2006
Trustee
Ms. Kaplan also serves as Trustee of other funds. Ms. Kaplan is Chairman (2014-present) and Chief Executive Officer (2013-present) of Hill Holliday (advertising and specialized marketing). Ms. Kaplan is a Director of The Michaels Companies, Inc. (specialty retailer, 2015-present), Member of the Board of Governors of the Chief Executives’ Club of Boston (2010-present), Member of the Executive Committee of the Greater Boston Chamber of Commerce (2006-present), Advisory Board Member of the National Association of Corporate Directors Chapter (2012-present), Member of the Board of Trustees of the Post Office Square Trust (2012-present), Trustee of the Brigham and Women’s Hospital (2016-present), Overseer of the Boston Symphony Orchestra (2014-present), Member of the Board of Directors of The Advertising Council, Inc. (2016-present), Member of the Ron Burton Training Village Executive Board of Advisors (2018-present), Member of the Executive Committee of The Ad Council, Inc. (2019-present), and Member of the Board of Directors of The Ad Club of Boston (2020-present). Previously, Ms. Kaplan served as an Advisory Board Member of Fidelity Rutland Square Trust (2006-2010), a member of the Clinton Global Initiative (2010-2015), Director of DSM (dba Delta Dental and DentaQuest) (2004-2014), Formal Appointee of the 2015 Baker-Polito Economic Development Council, Director of Vera Bradley Inc. (designer of women’s accessories, 2012-2015), Member of the Board of Directors of the Massachusetts Conference for Women (2008-2015), Member of the Board of Directors of Jobs for Massachusetts (2012-2015), President of the Massachusetts Women’s Forum (2008-2010), Treasurer of the Massachusetts Women’s Forum (2002-2006), and Vice Chair of the Board of the Massachusetts Society for the Prevention of Cruelty to Children (2003-2010).
Christine Marcks (1955)
Year of Election or Appointment: 2020
Trustee
Ms. Marcks also serves as Trustee of other Funds. Prior to her retirement, Ms. Marcks served as Chief Executive Officer and President – Prudential Retirement (2007-2017) and Vice President for Rollover and Retirement Income Strategies (2005-2007), Prudential Financial, Inc. (financial services). Previously, Ms. Marcks served as a Member of the Advisory Board of certain Fidelity® funds (2019-2020), was Senior Vice President and Head of Financial Horizons (2002-2004) and Vice President, Strategic Marketing (2000-2002) of Voya Financial (formerly ING U.S.) (financial services), held numerous positions at Aetna Financial Services (financial services, 1987-2000) and served as an International Economist for the United States Department of the Treasury (1980-1987). Ms. Marcks also serves as a member of the Board of Trustees, Audit Committee and Benefits & Operations Committee of the YMCA Retirement Fund (2018-present), a non-profit organization providing retirement plan benefits to YMCA staff members, and as a member of the Board of Trustees of Assumption College (2019-present).
Heidi L. Steiger (1953)
Year of Election or Appointment: 2017
Trustee
Ms. Steiger also serves as Trustee of other funds. Ms. Steiger serves as Managing Partner of Topridge Associates, LLC (consulting, 2005-present) and a member of the Board of Directors (2013-present) and member of the Membership and Executive Committee (2017-present) of Business Executives for National Security (nonprofit). Previously, Ms. Steiger served as a member of the Board of Directors Chair of the Remuneration Committee of Imagine Intelligent Materials Limited (2019-2021) (technology company), a member of the Advisory Board of the joint degree program in Global Luxury Management at North Carolina State University (Raleigh, NC) and Skema (Paris) (2018-2021), a Non-Executive Director of CrowdBureau Corporation (financial technology company and index provider, 2018-2021), a member of the Global Advisory Board and Of Counsel to Signum Global Advisors (international policy and strategy, 2018-2020), Eastern Region President of The Private Client Reserve of U.S. Bancorp (banking and financial services, 2010-2015), Advisory Director of Berkshire Capital Securities, LLC (financial services, 2009-2010), President and Senior Advisor of Lowenhaupt Global Advisors, LLC (financial services, 2005-2007), and President and Contributing Editor of Worth Magazine (2004-2005) and held a variety of positions at Neuberger Berman Group, LLC (financial services, 1986-2004), including Partner and Executive Vice President and Global Head of Private Asset Management at Neuberger Berman (1999-2004). Ms. Steiger also served as a member of the Board of Directors of Nuclear Electric Insurance Ltd (insurer of nuclear utilities, 2006-2017), a member of the Board of Trustees and Audit Committee of the Eaton Vance Funds (2007-2010), a member of the Board of Directors of Aviva USA (formerly AmerUs) (insurance, 2004-2014), and a member of the Board of Trustees and Audit Committee and Chair of the Investment Committee of CIFG (financial guaranty insurance, 2009-2012), and a member of the Board of Directors of Kin Group Plc (formerly, Fitbug Holdings) (health and technology, 2016-2017).
+ The information includes the Trustee's principal occupation during the last five years and other information relating to the experience, attributes, and skills relevant to the Trustee's qualifications to serve as a Trustee, which led to the conclusion that the Trustee should serve as a Trustee for the fund.
Advisory Board Members and Officers:
Correspondence intended for a Member of the Advisory Board (if any) may be sent to Fidelity Investments, P.O. Box 55235, Boston, Massachusetts 02205-5235. Correspondence intended for an officer or Howard E. Cox, Jr. may be sent to Fidelity Investments, 245 Summer Street, Boston, Massachusetts 02210. Officers appear below in alphabetical order.
Name, Year of Birth; Principal Occupation
Ralph F. Cox (1932)
Year of Election or Appointment: 2020
Member of the Advisory Board
Mr. Cox also serves as a Member of the Advisory Board of other funds. Mr. Cox is President of RABAR Enterprises (management consulting for the petroleum industry). Mr. Cox is a Director of Abraxas Petroleum (exploration and production, 1999-present). Mr. Cox is a member of the Advisory Boards of the Business and Engineering Schools of Texas A&M University and the Engineering School of University of Texas at Austin. Previously, Mr. Cox served as Trustee of other funds (2006-2020), a Trustee for the Fidelity Rutland Square Trust (2005-2010) and as an Advisory Director of CH2M Hill Companies (engineering, 1981-2011). Mr. Ralph F. Cox and Mr. Howard E. Cox, Jr. are not related.
Howard E. Cox, Jr. (1944)
Year of Election or Appointment: 2009
Member of the Advisory Board
Mr. Cox also serves as a Member of the Advisory Board of other funds. Mr. Cox is a Partner of Greylock (venture capital, 1971-present) and a Director of Stryker Corporation (medical products and services, 1974-present). Previously, Mr. Cox served as an Advisory Board Member of Fidelity Rutland Square Trust (2006-2010). Mr. Cox also serves as a Member of the Secretary of Defense's Business Board of Directors (2008-present), a Director of Business Executives for National Security (1997-present), a Director of the Brookings Institution (2010-present), a Director of the World Economic Forum’s Young Global Leaders Foundation (2009-present), and is a Member of the Harvard Medical School Board of Fellows (2002-present). Mr. Howard E. Cox, Jr. and Mr. Ralph F. Cox are not related.
Craig S. Brown (1977)
Year of Election or Appointment: 2019
Assistant Treasurer
Mr. Brown also serves as Assistant Treasurer of other funds. Mr. Brown is an employee of Fidelity Investments (2013-present).
John J. Burke III (1964)
Year of Election or Appointment: 2018
Chief Financial Officer
Mr. Burke also serves as Chief Financial Officer of other funds. Mr. Burke serves as Head of Investment Operations for Fidelity Fund and Investment Operations (2018-present) and is an employee of Fidelity Investments (1998-present). Previously Mr. Burke served as head of Asset Management Investment Operations (2012-2018).
Jonathan Davis (1968)
Year of Election or Appointment: 2010
Assistant Treasurer
Mr. Davis also serves as Assistant Treasurer of other funds. Mr. Davis serves as Assistant Treasurer of FMR Capital, Inc. (2017-present) and is an employee of Fidelity Investments. Previously, Mr. Davis served as Vice President and Associate General Counsel of FMR LLC (diversified financial services company, 2003-2010).
Laura M. Del Prato (1964)
Year of Election or Appointment: 2018
Assistant Treasurer
Ms. Del Prato also serves as an officer of other funds. Ms. Del Prato is an employee of Fidelity Investments (2017-present). Previously, Ms. Del Prato served as President and Treasurer of The North Carolina Capital Management Trust: Cash Portfolio and Term Portfolio (2018-2020). Prior to joining Fidelity Investments, Ms. Del Prato served as a Managing Director and Treasurer of the JPMorgan Mutual Funds (2014-2017). Prior to JPMorgan, Ms. Del Prato served as a partner at Cohen Fund Audit Services (accounting firm, 2012-2013) and KPMG LLP (accounting firm, 2004-2012).
James D. Gryglewicz (1972)
Year of Election or Appointment: 2015
Chief Compliance Officer
Mr. Gryglewicz also serves as Chief Compliance Officer of other funds. Mr. Gryglewicz serves as Compliance Officer of Strategic Advisers LLC (investment adviser firm, 2015-present), Senior Vice President of Asset Management Compliance (2009-present), and is an employee of Fidelity Investments (2004-present). Previously, Mr. Gryglewicz served as Compliance Officer of Fidelity SelectCo, LLC (investment adviser firm, 2014-2019), and as Chief Compliance Officer of certain Fidelity® funds (2014-2018).
Colm A. Hogan (1973)
Year of Election or Appointment: 2016
Assistant Treasurer
Mr. Hogan also serves as an officer of other funds. Mr. Hogan serves as Assistant Treasurer of FMR Capital, Inc. (2017-present) and is an employee of Fidelity Investments (2005-present). Previously, Mr. Hogan served as Deputy Treasurer of certain Fidelity® funds (2016-2020) and Assistant Treasurer of certain Fidelity® funds (2016-2018).
Christina H. Lee (1975)
Year of Election or Appointment: 2020
Secretary and Chief Legal Officer
Ms. Lee also serves as Secretary and CLO of other funds. Ms. Lee serves as Vice President, Associate General Counsel (2014-present) and is an employee of Fidelity Investments (2007-present). Previously, Ms. Lee served as Assistant Secretary of certain funds (2018-2019).
Cynthia Lo Bessette (1969)
Year of Election or Appointment: 2020
Assistant Secretary
Ms. Lo Bessette also serves as an officer of other funds. Ms. Lo Bessette serves as CLO, Secretary, and Senior Vice President of Fidelity Management & Research Company LLC (investment adviser firm, 2019-present); and CLO of Fidelity Management & Research (Hong Kong) Limited, FMR Investment Management (UK) Limited, and Fidelity Management & Research (Japan) Limited (investment adviser firms, 2019-present). She is a Senior Vice President and Deputy General Counsel of FMR LLC (diversified financial services company, 2019-present), and is an employee of Fidelity Investments. Previously, Ms. Lo Bessette served as CLO, Secretary, and Senior Vice President of FMR Co., Inc. (investment adviser firm, 2019); Secretary of Fidelity SelectCo, LLC and Fidelity Investments Money Management, Inc. (investment adviser firms, 2019). Prior to joining Fidelity Investments, Ms. Lo Bessette was Executive Vice President, General Counsel (2016-2019) and Senior Vice President, Deputy General Counsel (2015-2016) of OppenheimerFunds (investment management company) and Deputy Chief Legal Officer (2013-2015) of Jennison Associates LLC (investment adviser firm).
Chris Maher (1972)
Year of Election or Appointment: 2016
Assistant Treasurer
Mr. Maher also serves as an officer of other funds. Mr. Maher serves as Assistant Treasurer of FMR Capital, Inc. (2017-present), and is an employee of Fidelity Investments (2008-present). Previously, Mr. Maher served as Assistant Treasurer of certain funds (2013-2020); Vice President of Asset Management Compliance (2013), Vice President of the Program Management Group of FMR (investment adviser firm, 2010-2013), and Vice President of Valuation Oversight (2008-2010).
Brett Segaloff (1972)
Year of Election or Appointment: 2021
Anti-Money Laundering (AML) Officer
Mr. Segaloff also serves as an AML Officer of other funds and other related entities. He is Director, Anti-Money Laundering (2007-present) of FMR LLC (diversified financial services company) and is an employee of Fidelity Investments (1996-present).
Stacie M. Smith (1974)
Year of Election or Appointment: 2020
President and Treasurer
Ms. Smith also serves as an officer of other funds. Ms. Smith serves as Assistant Treasurer of FMR Capital, Inc. (2017-present), is an employee of Fidelity Investments (2009-present), and has served in other fund officer roles. Prior to joining Fidelity Investments, Ms. Smith served as Senior Audit Manager of Ernst & Young LLP (accounting firm, 1996-2009). Previously, Ms. Smith served as Assistant Treasurer (2013-2019) and Deputy Treasurer (2013-2016) of certain Fidelity® funds.
Marc L. Spector (1972)
Year of Election or Appointment: 2016
Assistant Treasurer
Mr. Spector also serves as an officer of other funds. Mr. Spector serves as Assistant Treasurer of FMR Capital, Inc. (2017-present) and is an employee of Fidelity Investments (2016-present). Prior to joining Fidelity Investments, Mr. Spector served as Director at the Siegfried Group (accounting firm, 2013-2016), and prior to Siegfried Group as audit senior manager at Deloitte & Touche LLP (accounting firm, 2005-2013).
Jim Wegmann (1979)
Year of Election or Appointment: 2019
Assistant Treasurer
Mr. Wegmann also serves as Assistant Treasurer of other funds. Mr. Wegmann is an employee of Fidelity Investments (2011-present).
Shareholder Expense Example
As a shareholder, you incur two types of costs: (1) transaction costs, which may include sales charges (loads) on purchase payments or redemption proceeds, as applicable and (2) ongoing costs, which generally include management fees, distribution and/or service (12b-1) fees and other Fund expenses. This Example is intended to help you understand your ongoing costs (in dollars) of investing in a fund and to compare these costs with the ongoing costs of investing in other mutual funds.
The Example is based on an investment of $1,000 invested at the beginning of the period and held for the entire period (December 1, 2020 to May 31, 2021).
Actual Expenses
The first line of the accompanying table provides information about actual account values and actual expenses. You may use the information in this line, together with the amount you invested, to estimate the expenses that you paid over the period. Simply divide your account value by $1,000.00 (for example, an $8,600 account value divided by $1,000.00 = 8.6), then multiply the result by the number in the first line for a class/Fund under the heading entitled "Expenses Paid During Period" to estimate the expenses you paid on your account during this period. If any fund is a shareholder of any underlying mutual funds or exchange-traded funds (ETFs) (the Underlying Funds), such fund indirectly bears its proportional share of the expenses of the Underlying Funds in addition to the direct expenses incurred presented in the table. These fees and expenses are not included in the annualized expense ratio used to calculate the expense estimate in the table below.
Hypothetical Example for Comparison Purposes
The second line of the accompanying table provides information about hypothetical account values and hypothetical expenses based on the actual expense ratio and an assumed rate of return of 5% per year before expenses, which is not the actual return. The hypothetical account values and expenses may not be used to estimate the actual ending account balance or expenses you paid for the period. You may use this information to compare the ongoing costs of investing in the Fund and other funds. To do so, compare this 5% hypothetical example with the 5% hypothetical examples that appear in the shareholder reports of the other funds. If any fund is a shareholder of any Underlying Funds, such fund indirectly bears its proportional share of the expenses of the Underlying Funds in addition to the direct expenses as presented in the table. These fees and expenses are not included in the annualized expense ratio used to calculate the expense estimate in the table below.
Please note that the expenses shown in the table are meant to highlight your ongoing costs only and do not reflect any transaction costs. Therefore, the second line of the table is useful in comparing ongoing costs only, and will not help you determine the relative total costs of owning different funds.
| Annualized Expense Ratio-A | Beginning Account Value December 1, 2020 | Ending Account Value May 31, 2021 | Expenses Paid During Period-B December 1, 2020 to May 31, 2021 |
|
| Strategic Advisers Large Cap Fund | .18% | |||
| Actual | $1,000.00 | $1,191.90 | $.98 | |
| Hypothetical-C | $1,000.00 | $1,024.03 | $.91 |
A Annualized expense ratio reflects expenses net of applicable fee waivers.
B Expenses are equal to the annualized expense ratio, multiplied by the average account value over the period, multiplied by 182/ 365 (to reflect the one-half year period). The fees and expenses of any Underlying Funds are not included in each annualized expense ratio.
C 5% return per year before expenses
Distributions (Unaudited)
The Board of Trustees of Strategic Advisers Large Cap Fund voted to pay on July 12, 2021, to shareholders of record at the opening of business on July 9, 2021, a distribution of $0.624 per share derived from capital gains realized from sales of portfolio securities and a dividend of $0.05 per share from net investment income.
The fund hereby designates as a capital gain dividend with respect to the taxable year ended May 31, 2021, $2,513,588,787, or, if subsequently determined to be different, the net capital gain of such year.
The Strategic Advisers Value Fund hereby designates as a capital gain dividend with respect to the taxable year ended November 20, 2020, $112,633,762, or, if subsequently determined to be different, the net capital gain of such year.
The Strategic Advisers Core Fund hereby designates as a capital gain dividend with respect to the taxable year ended November 20, 2020, $ 569,683,717, or, if subsequently determined to be different, the net capital gain of such year.
The Strategic Advisers Growth Fund hereby designates as a capital gain dividend with respect to the taxable year ended November 20, 2020, $ 604,973,291, or, if subsequently determined to be different, the net capital gain of such year.
The fund designates 100% of the dividend distributed during the fiscal year as qualifying for the dividends–received deduction for corporate shareholders.
The Strategic Advisers Value Fund designates 77% of the dividend distributed during the fiscal year as qualifying for the dividends–received deduction for corporate shareholders.
The Strategic Advisers Core Fund designates 77% of the dividend distributed during the fiscal year as qualifying for the dividends–received deduction for corporate shareholders.
The Strategic Advisers Growth Fund designates 41% of the dividend distributed during the fiscal year as qualifying for the dividends–received deduction for corporate shareholders.
The fund designates 100% of the dividends distributed during the fiscal year as amounts which may be taken into account as a dividend for the purposes of the maximum rate under section 1(h)(11) of the Internal Revenue Code.
The Strategic Advisers Value Fund designates 87% of the dividends distributed during the fiscal year as amounts which may be taken into account as a dividend for the purposes of the maximum rate under section 1(h)(11) of the Internal Revenue Code.
The Strategic Advisers Core Fund designates 79% of the dividends distributed during the fiscal year as amounts which may be taken into account as a dividend for the purposes of the maximum rate under section 1(h)(11) of the Internal Revenue Code.
The Strategic Advisers Growth Fund designates 43% of the dividends distributed during the fiscal year as amounts which may be taken into account as a dividend for the purposes of the maximum rate under section 1(h)(11) of the Internal Revenue Code.
The Strategic Advisers Value Fund designates 1% of the dividend distributed during the fiscal year as a section 199A dividend.
The Strategic Advisers Core Fund designates 2% of the dividend distributed during the fiscal year as a section 199A dividend.
The Strategic Advisers Growth Fund designates 1% of the dividend distributed during the fiscal year as a section 199A dividend.
The fund will notify shareholders in January 2022 of amounts for use in preparing 2021 income tax returns.
Board Approval of Investment Advisory Contracts and Management Fees
Strategic Advisers Large Cap Fund
In December 2020, the Board of Trustees, including the Independent Trustees (together, the Board) voted to approve (i) an amendment to lower the fee schedule in the existing sub-advisory agreement among Strategic Advisers LLC (Strategic Advisers), ClariVest Asset Management LLC (ClariVest), and Fidelity Rutland Square Trust II (Trust) on behalf of the fund (Amended ClariVest Sub-Advisory Agreement) and (ii) an amendment to lower the fee schedule in the existing sub-advisory agreement among Strategic Advisers, FIAM LLC (FIAM), and the Trust on behalf of the fund (Amended FIAM Sub-Advisory Agreement and, together with the Amended ClariVest Sub-Advisory Agreement, the Amended Sub-Advisory Agreements). The Board noted that the updated fee schedules in the Amended Sub-Advisory Agreements will result in the same of lower fees at all asset levels. The Board also noted that no other material contract terms are impacted by either of the Amended Sub-Advisory Agreements. The Board, assisted by the advice of fund counsel and Independent Trustees' counsel, considered a broad range of information.In considering whether to approve each Amended Sub-Advisory Agreement, the Board reached a determination, with the assistance of fund counsel and Independent Trustees' counsel and through the exercise of its business judgment, that the approval of each Amended Sub-Advisory Agreement is in the best interests of the fund and its shareholders and that the approval of each such agreement does not involve a conflict of interest from which Strategic Advisers or its affiliates derive an inappropriate advantage. Also, the Board found that the fees to be charged under each Amended Sub-Advisory Agreement bear a reasonable relationship to the services to be rendered and will be based on services provided that will be in addition to, rather than duplicative of services provided under the advisory contract of any underlying fund in which the fund may invest. The Board's decision to approve each Amended Sub-Advisory Agreement was not based on any single factor, but rather was based on a comprehensive consideration of all the information provided to the Board. In addition, individual Trustees did not necessarily attribute the same weight or importance to each factor. Nature, Extent, and Quality of Services Provided. The Board considered the backgrounds of the investment personnel that will provide services to the fund, and also considered the fund's investment objective, strategies and related investment philosophy and current sub-adviser line-up, as well as the structures of the investment personnel compensation programs and whether such structures provide appropriate incentives to act in the best interests of the fund, at its June 2020 meeting. The Board considered the detailed information provided by Strategic Advisers, ClariVest and FIAM in the June 2020 annual contract renewal materials.The Board noted that it had approved the existing sub-advisory agreements with ClariVest and FIAM at its June 2020 meeting and that neither of the Amended Sub-Advisory Agreements will result in any changes to: (i) the nature, extent and quality of the sub-advisory services provided; (ii) the investment process or strategies employed in the management of the fund's assets; or (iii) the day-to-day management of the fund or the persons primarily responsible for such management. Investment Performance. The Board did not consider performance to be a material factor in its decision to approve the Amended Sub-Advisory Agreements because the approval of the Amended Sub-Advisory Agreements will not result in any changes (i) to the fund's investment processes or strategies; or (ii) in the persons primarily responsible for the day-to-day management of the fund.Based on its review, the Board concluded that the nature, extent, and quality of services that will be provided to the fund under each Amended Sub-Advisory Agreement will continue to benefit the fund's shareholders.Competitiveness of Management Fee and Total Fund Expenses.
The Board noted that neither of the Amended Sub-Advisory Agreements will result in changes to the maximum aggregate annual management fee payable by the fund or Strategic Advisers' portion of the management fee. The Board considered Strategic Advisers' contractual agreement to waive its portion of the fund's management fee. The Board considered that each Amended Sub-Advisory Agreement is expected to result in a decrease in the total management fee rate of the fund. Based on its review, the Board concluded that the fund's management fee structure and any changes to projected total expenses bear a reasonable relationship to the services that the fund and its shareholders will receive and the other factors considered.Because each Amended Sub-Advisory Agreement was negotiated at arm's length and will have no impact on the maximum management fees payable by the fund, the Board did not consider the costs of services and profitability of the relationship with the fund to Strategic Advisers to be significant factors in its decision to approve each Amended Sub-Advisory Agreement. Potential Fall-Out Benefits. The Board considered that it reviews information regarding the potential of direct and indirect benefits to Strategic Advisers and its affiliates from their relationships with the fund, including non-advisory fee compensation paid to affiliates of Strategic Advisers, if any, as well as information regarding potential fall-out benefits accruing to each sub-adviser, if any, as a result of its relationship with the fund, during its annual renewal of the fund's management contract, sub-advisory agreements, and sub-subadvisory agreements. The Board considered Strategic Advisers' representation that it does not anticipate that the approval of either Amended Sub-Advisory Agreement will have a significant impact on the profitability of, or potential fall-out benefits to, Strategic Advisers or its affiliates. Possible Economies of Scale. The Board considered that it reviews whether there have been economies of scale in connection with the management of the fund during its annual renewal of the fund's management contract, sub-advisory agreements, and sub-subadvisory agreements. The Board noted that the Amended ClariVest Sub-Advisory Agreement will continue to provide for breakpoints that have the potential to reduce sub-advisory fees paid to the sub-adviser as assets allocated to the sub-adviser grow. The Board also noted that it did not consider the possible realization of economies of scale to be a significant factor in its decision to approve the Amended Sub-Advisory Agreements because the fund will not bear any additional management fees or expenses under either Amended Sub-Advisory Agreement. Conclusion. Based on its evaluation of all of the conclusions noted above, and after considering all factors it believed relevant, the Board concluded that each Amended Sub-Advisory Agreement's fee structure bears a reasonable relationship to the services to be rendered and that each Amended Sub-Advisory Agreement is in the best interests of the fund and its shareholders and should be approved. The Board also concluded that the sub-advisory fees to be charged under each Amended Sub-Advisory Agreement will be based on services provided that will be in addition to, rather than duplicative of, services provided under the advisory contract of any underlying fund in which the fund may invest. In addition, the Board concluded that the approval of each Amended Sub-Advisory Agreement does not involve a conflict of interest from which Strategic Advisers or its affiliates derive an inappropriate advantage.Liquidity Risk Management Program
The Securities and Exchange Commission adopted Rule 22e-4 under the Investment Company Act of 1940 (the Liquidity Rule) to promote effective liquidity risk management throughout the open-end investment company industry, thereby reducing the risk that funds will be unable to meet their redemption obligations and mitigating dilution of the interests of fund shareholders.
The Fund has adopted and implemented a liquidity risk management program (the Program) reasonably designed to assess and manage the Fund’s liquidity risk and to comply with the requirements of the Liquidity Rule. The Fund’s Board of Trustees (the Board) has designated the Fund’s investment adviser as administrator of the Program. Strategic Advisers has established a Liquidity Risk Management Committee (the LRM Committee) to manage the Program for each of the Funds. The LRM Committee monitors the adequacy and effectiveness of implementation of the Program and on a periodic basis assesses each Fund’s liquidity risk based on a variety of factors including (1) the Fund’s investment strategy, (2) portfolio liquidity and cash flow projections during normal and reasonably foreseeable stressed conditions, (3) shareholder redemptions and (4) borrowings and other funding sources, as applicable.
In accordance with the Program, each of the Fund’s portfolio investments is classified into one of four liquidity categories described below based on a determination of a reasonable expectation for how long it would take to convert the investment to cash (or sell or dispose of the investment) without significantly changing its market value.
- Highly liquid investments – cash or convertible to cash within three business days or less
- Moderately liquid investments – convertible to cash in three to seven calendar days
- Less liquid investments – can be sold or disposed of, but not settled, within seven calendar days
- Illiquid investments – cannot be sold or disposed of within seven calendar days
Liquidity classification determinations take into account a variety of factors including various market, trading and investment-specific considerations, as well as market depth, and generally utilize analysis from a third-party liquidity metrics service.
The Liquidity Rule places a 15% limit on a fund’s illiquid investments and requires funds that do not primarily hold assets that are highly liquid investments to determine and maintain a minimum percentage of the fund’s net assets to be invested in highly liquid investments (highly liquid investment minimum or HLIM). The Program includes provisions reasonably designed to comply with the 15% limit on illiquid investments and for determining, periodically reviewing and complying with the HLIM requirement as applicable.
At a recent meeting of the Fund’s Board of Trustees, the LRM Committee provided a written report to the Board pertaining to the operation, adequacy, and effectiveness of implementation of the Program for the annual period from December 1, 2019 through November 30, 2020. The report concluded that the Program has been implemented and is operating effectively and is reasonably designed to assess and manage the Fund’s liquidity risk.
![]()
LGC-ANN-0721
1.9899746.100
Item 2.
Code of Ethics
As of the end of the period, May 31, 2021, Fidelity Rutland Square Trust II (the trust) has adopted a code of ethics, as defined in Item 2 of Form N-CSR, that applies to its President and Treasurer and its Chief Financial Officer. A copy of the code of ethics is filed as an exhibit to this Form N-CSR.
Item 3.
Audit Committee Financial Expert
The Board of Trustees of the trust has determined that Heidi L. Steiger is an audit committee financial expert, as defined in Item 3 of Form N-CSR. Ms. Steiger is independent for purposes of Item 3 of Form N-CSR.
Item 4.
Principal Accountant Fees and Services
Fees and Services
The following table presents fees billed by PricewaterhouseCoopers LLP (“PwC”) in each of the last two fiscal years for services rendered to Strategic Advisers Fidelity Core Income Fund, Strategic Advisers Fidelity Emerging Markets Fund, Strategic Advisers Fidelity U.S. Total Stock Fund, Strategic Advisers Large Cap Fund, Strategic Advisers Short Duration Fund and Strategic Advisers Tax-Sensitive Short Duration Fund (the “Funds”):
Services Billed by PwC
May 31, 2021 FeesA,B
| | Audit Fees | Audit-Related Fees | Tax Fees | All Other Fees |
| Strategic Advisers Fidelity Core Income Fund | $43,900 | $4,100 | $11,400 | $10,000 |
| Strategic Advisers Fidelity Emerging Markets Fund | $24,900 | $2,500 | $6,100 | $6,200 |
| Strategic Advisers Fidelity U.S. Total Stock Fund | $36,200 | $3,600 | $9,700 | $8,800 |
| Strategic Advisers Large Cap Fund | $33,400 | $1,800 | $15,100 | $4,300 |
| Strategic Advisers Short Duration Fund | $36,200 | $3,500 | $7,300 | $8,700 |
| Strategic Advisers Tax-Sensitive Short Duration Fund | $36,600 | $3,500 | $6,200 | $8,500 |
| | | | | |
May 31, 2020 FeesA,B
| | Audit Fees | Audit-Related Fees | Tax Fees | All Other Fees |
| Strategic Advisers Fidelity Core Income Fund | $48,300 | $3,700 | $8,900 | $8,800 |
| Strategic Advisers Fidelity Emerging Markets Fund | $27,300 | $2,200 | $7,600 | $5,100 |
| Strategic Advisers Fidelity U.S. Total Stock Fund | $39,700 | $3,500 | $11,000 | $8,400 |
| Strategic Advisers Large Cap Fund | $- | $- | $- | $- |
| Strategic Advisers Short Duration Fund | $37,200 | $3,500 | $7,300 | $8,300 |
| Strategic Advisers Tax-Sensitive Short Duration Fund | $37,600 | $3,400 | $6,200 | $8,100 |
| | | | | |
A Amounts may reflect rounding.
B Strategic Advisers Large Cap Fund commenced operations on November 12, 2020.
The following table(s) present(s) fees billed by PwC that were required to be approved by the Audit Committee for services that relate directly to the operations and financial reporting of the Fund(s) and that are rendered on behalf of Strategic Advisers, LLC (“Strategic Advisers”) and entities controlling, controlled by, or under common control with Strategic Advisers (not including any sub-adviser whose role is primarily portfolio management and is subcontracted with or overseen by another investment adviser) that provide ongoing services to the Fund(s) (“Fund Service Providers”):
Services Billed by PwC
| | May 31, 2021A,B | May 31, 2020A,B |
| Audit-Related Fees | $9,015,700 | $8,884,200 |
| Tax Fees | $14,300 | $17,700 |
| All Other Fees | $- | $- |
A Amounts may reflect rounding
B May include amounts billed prior to the Strategic Advisers Large Cap Fund’s commencement of operations.
“Audit-Related Fees” represent fees billed for assurance and related services that are reasonably related to the performance of the fund audit or the review of the fund's financial statements and that are not reported under Audit Fees.
“Tax Fees” represent fees billed for tax compliance, tax advice or tax planning that relate directly to the operations and financial reporting of the fund.
“All Other Fees” represent fees billed for services provided to the fund or Fund Service Provider, a significant portion of which are assurance related, that relate directly to the operations and financial reporting of the fund, excluding those services that are reported under Audit Fees, Audit-Related Fees or Tax Fees.
Assurance services must be performed by an independent public accountant.
* * *
The aggregate non-audit fees billed by PwC for services rendered to the Fund(s), Strategic Advisers (not including any sub-adviser whose role is primarily portfolio management and is subcontracted with or overseen by another investment adviser), and any Fund Service Provider for each of the last two fiscal years of the Fund(s) are as follows:
| Billed By | May 31, 2021A,B | May 31, 2020A,B |
| PwC | $14,421,500 | $14,321,400 |
| | | |
A Amounts may reflect rounding
B May include amounts billed prior to the Strategic Advisers Large Cap Fund’s commencement of operations.
The trust's Audit Committee has considered non-audit services that were not pre-approved that were provided by PwC to Fund Service Providers to be compatible with maintaining the independence of PwC in its(their) audit of the Fund(s), taking into account representations from PwC, in accordance with Public Company Accounting Oversight Board rules, regarding its independence from the Fund(s) and its(their) related entities and Strategic Advisers’s review of the appropriateness and permissibility under applicable law of such non-audit services prior to their provision to the Fund(s) Service Providers.
Audit Committee Pre-Approval Policies and Procedures
The trust’s Audit Committee must pre-approve all audit and non-audit services provided by a fund’s independent registered public accounting firm relating to the operations or financial reporting of the fund. Prior to the commencement of any audit or non-audit services to a fund, the Audit Committee reviews the services to determine whether they are appropriate and permissible under applicable law.
The Audit Committee has adopted policies and procedures to, among other purposes, provide a framework for the Committee’s consideration of non-audit services by the audit firms that audit the Fidelity funds. The policies and procedures require that any non-audit
service provided by a fund audit firm to a Fidelity fund and any non-audit service provided by a fund auditor to a Fund Service Provider that relates directly to the operations and financial reporting of a Fidelity fund (“Covered Service”) are subject to approval by the Audit Committee before such service is provided.
All Covered Services must be approved in advance of provision of the service either: (i) by formal resolution of the Audit Committee, or (ii) by oral or written approval of the service by the Chair of the Audit Committee (or if the Chair is unavailable, such other member of the Audit Committee as may be designated by the Chair to act in the Chair’s absence). The approval contemplated by (ii) above is permitted where the Treasurer determines that action on such an engagement is necessary before the next meeting of the Audit Committee.
Non-audit services provided by a fund audit firm to a Fund Service Provider that do not relate directly to the operations and financial reporting of a Fidelity fund are reported to the Audit Committee periodically.
Non-Audit Services Approved Pursuant to Rule 2-01(c)(7)(i)(C) and (ii) of Regulation S-X (“De Minimis Exception”)
There were no non-audit services approved or required to be approved by the Audit Committee pursuant to the De Minimis Exception during the Fund’s(s’) last two fiscal years relating to services provided to (i) the Fund(s) or (ii) any Fund Service Provider that relate directly to the operations and financial reporting of the Fund(s).
Item 5.
Audit Committee of Listed Registrants
Not applicable.
Item 6.
Investments
(a)
Not applicable.
(b)
Not applicable.
Item 7.
Disclosure of Proxy Voting Policies and Procedures for Closed-End Management Investment Companies
Not applicable.
Item 8.
Portfolio Managers of Closed-End Management Investment Companies
Not applicable.
Item 9.
Purchase of Equity Securities by Closed-End Management Investment Company and Affiliated Purchasers
Not applicable.
Item 10.
Submission of Matters to a Vote of Security Holders
There were no material changes to the procedures by which shareholders may recommend nominees to the trust’s Board of Trustees.
Item 11.
Controls and Procedures
(a)(i) The President and Treasurer and the Chief Financial Officer have concluded that the trust’s disclosure controls and procedures (as defined in Rule 30a-3(c) under the Investment Company Act) provide reasonable assurances that material information relating to the trust is made known to them by the appropriate persons, based on their evaluation of these controls and procedures as of a date within 90 days of the filing date of this report.
(a)(ii) There was no change in the trust’s internal control over financial reporting (as defined in Rule 30a-3(d) under the Investment Company Act) that occurred during the period covered by this report that has materially affected, or is reasonably likely to materially affect, the trust’s internal control over financial reporting.
Item 12.
Disclosure of Securities Lending Activities for Closed-End Management
Investment Companies
Not applicable.
Item 13.
Exhibits
| (a) | (1) | Code of Ethics pursuant to Item 2 of Form N-CSR is filed and attached hereto as EX-99.CODE ETH. |
| (a) | (2) | |
| (a) | (3) | Not applicable. |
| (b) | |
SIGNATURES
Pursuant to the requirements of the Securities Exchange Act of 1934 and the Investment Company Act of 1940, the registrant has duly caused this report to be signed on its behalf by the undersigned, thereunto duly authorized.
Fidelity Rutland Square Trust II
| By: | /s/Stacie M. Smith |
| | Stacie M. Smith |
| | President and Treasurer |
| | |
| Date: | July 27, 2021 |
Pursuant to the requirements of the Securities Exchange Act of 1934 and the Investment Company Act of 1940, this report has been signed below by the following persons on behalf of the registrant and in the capacities and on the dates indicated.
| By: | /s/Stacie M. Smith |
| | Stacie M. Smith |
| | President and Treasurer |
| | |
| Date: | July 27, 2021 |
| By: | /s/John J. Burke III |
| | John J. Burke III |
| | Chief Financial Officer |
| | |
| Date: | July 27, 2021 |
EXHIBIT EX-99.CODE ETH
FIDELITY RUTLAND SQUARE TRUST II
CODE OF ETHICS FOR PRESIDENT, TREASURER
AND CHIEF FINANCIAL OFFICER
I. Purpose of the Code/Covered Officers
This document constitutes the Code of Ethics (the “Code”) adopted by Fidelity Rutland Square Trust II (the “Trust”) pursuant to the provisions of Rule 30b2-1(a) under the Investment Company Act of 1940, which Rule implements Sections 406 of the Sarbanes-Oxley Act of 2002 with respect to registered investment companies. The Code applies to the Trust’s President and Treasurer, and Chief Financial Officer (the “Covered Officers”). Fidelity’s Ethics Office (the “Ethics Office”), a part of Fidelity Corporate Compliance Group within Core Compliance, administers the Code.
The purposes of the Code are to deter wrongdoing and to promote, on the part of the Covered Officers:
·
honest and ethical conduct, including the ethical handling of actual or apparent conflicts of interest between personal and professional relationships;
·
full, fair, accurate, timely and understandable disclosure in reports and documents that the funds of the Trust submit to the Securities and Exchange Commission (“SEC”), and in other public communications by the funds of the Trust;
·
compliance with applicable laws and governmental rules and regulations;
·
the prompt internal reporting to an appropriate person or persons identified in the Code of violations of the Code; and
·
accountability for adherence to the Code.
Each Covered Officer should adhere to a high standard of business ethics and should be sensitive to situations that may give rise to actual as well as apparent conflicts of interest.
II. Covered Officers Should Handle Ethically Actual and Apparent Conflicts of Interest
Overview. A “conflict of interest” occurs when a Covered Officer’s private interest interferes with the interests of, or his service to, the Trust. For example, a conflict of interest would arise if a Covered Officer, or a member of his family, receives improper personal benefits as a result of his position with the Trust.
Certain conflicts of interest arise out of the relationships between Covered Officers and the Trust and already are subject to conflict of interest provisions in the Investment Company Act of 1940 (the “Investment Company Act”) and the Investment Advisers Act of 1940 (the “Investment Advisers Act”). For example, Covered Officers may not individually engage in certain transactions (such as the purchase or sale of securities or other property) with a fund of the Trust because of their status as “affiliated persons” of the Trust. Separate compliance programs and procedures of the Trust, Strategic Advisers, Inc. (“Strategic”) and the other Fidelity companies are designed to prevent, or identify and correct, violations of these provisions. This Code does not, and is not intended to, repeat or replace these programs and procedures, and such conflicts fall outside of the parameters of this Code.
Although typically not presenting an opportunity for improper personal benefit, conflicts arise from, or as a result of, the contractual relationship between the Trust and Strategic (or another Fidelity company) of which the Covered Officers are also officers or employees. As a result, this Code recognizes that the Covered Officers will, in the normal course of their duties (whether formally for the Trust, Strategic or another Fidelity company), be involved in establishing policies and implementing decisions that have different effects on the Trust, Strategic and other Fidelity companies. The participation of the Covered Officers in such activities is inherent in the contractual relationship between the Trust and Strategic (or another Fidelity company), and is consistent with the performance by the Covered Officers of their duties as officers of the Trust. Thus, if performed in conformity with the provisions of the Investment Company Act and the Investment Advisers Act, such activities will be deemed to have been handled ethically. In addition, it is recognized by the Trust’s Board of Trustees (“Board”) that the Covered Officers also may be officers or employees of one or more other Trusts covered by this Code.
Other conflicts of interest are covered by the Code, even if such conflicts of interest are not subject to provisions in the Investment Company Act and the Investment Advisers Act. The following list provides examples of conflicts of interest under the Code, but Covered Officers should keep in mind that these examples are not exhaustive. The overarching principle is that the personal interest of a Covered Officer should not be placed improperly before the interest of the Trust.
* * *
Each Covered Officer must:
·
not use his or her personal influence or personal relationships improperly to influence investment decisions or financial reporting by any fund of the Trust whereby the Covered Officer would benefit personally to the detriment of the Trust;
·
not cause a fund of the Trust to take action, or fail to take action, for the individual personal benefit of the Covered Officer rather than the benefit of the Trust;
·
not engage in any outside business activity, including serving as a director or trustee, that prevents the Covered Officer from devoting appropriate time and attention to the Covered Officer’s responsibilities with the Trust;
·
not have a consulting or employment relationship with any of the Trust’s service providers that are not affiliated with Fidelity; and
·
not retaliate against any employee or Covered Officer for reports of actual or potential misconduct, which are made in good faith.
With respect to other fact patterns, if a Covered Officer is in doubt, other potential conflict of interest situations should be described immediately to the Ethics Office for resolution. Similarly, any questions a Covered Officer has generally regarding the application or interpretation of the Code should be directed to the Ethics Office immediately.
III. Disclosure and Compliance
·
Each Covered Officer should familiarize himself with the disclosure requirements generally applicable to the Trust.
·
Each Covered Officer should not knowingly misrepresent, or cause others to misrepresent, facts about any fund of the Trust to others, whether within or outside Fidelity, including to the Trust’s Board of Trustees (the “Board”) and auditors, and to governmental regulators and self-regulatory organizations;
·
Each Covered Officer should, to the extent appropriate within his area of responsibility, consult with other officers and employees of the Trust, Strategic and the Fidelity service providers, and with the Board’s Audit Committee, with the goal of promoting full, fair, accurate, timely and understandable disclosure in the reports and documents the funds of the Trust file with, or submit to, the SEC and in other public communications made by the funds of the Trust; and
·
It is the responsibility of each Covered Officer to promote compliance with the standards and restrictions imposed by applicable laws, rules and regulations.
IV. Reporting and Accountability
Each Covered Officer must:
·
upon receipt of the Code, and annually thereafter, submit to the Ethics Office an acknowledgement stating that he or she has received, read, and understands the Code; and
·
notify the Ethics Office promptly if he or she knows of any violation of the Code. Failure to do so is itself a violation of this Code.
The Ethics Office shall take all action it considers appropriate to investigate any actual or potential violations reported to it. Upon completion of the investigation, if necessary, the matter will be reviewed with senior management or other appropriate parties, and a determination will be made as to whether any action should be taken as detailed below. The Covered Officer will be informed of any action determined to be appropriate. The Ethics Office will inform the Personal Trading Committee of all Code violations and actions taken in response. Without implied limitation, appropriate remedial, disciplinary or preventive action may include a written warning, a letter of censure, suspension, dismissal or, in the event of criminal or other serious violations of law, notification of the SEC or other appropriate law enforcement authorities. Additionally, other legal remedies may be pursued.
The policies and procedures described in the Code do not create any obligations to any person or entity other than the Trust. The Code is intended solely for the internal use by the Trust and does not constitute a promise, contract or an admission by, or on behalf of, the Trust as to any fact, circumstance, or legal conclusion. The Trust, the Fidelity companies and the Fidelity Chief Ethics Officer retain the discretion to decide whether the Code applies to a specific situation, and how it should be interpreted.
V. Oversight
Material violations of this Code will be reported promptly by Strategic to the Board’s Audit Committee. In addition, at least once each year, Strategic will provide a written report to the Board, which describes any issues arising under the Code since the last report to the Board, including, but not limited to, information about material violations of the Code and action taken in response to the material violations.
VI. Other Policies and Procedures
This Code shall be the sole code of ethics adopted by the Trust for purposes of Section 406 of the Sarbanes-Oxley Act and the rules and forms applicable to registered investment companies thereunder. Other Fidelity policies or procedures that cover the behavior or activities of Covered Officers are separate requirements applying to the Covered Officers (and others), and are not part of this Code.
VII. Amendments
Any material amendments or changes to this Code must be approved or ratified by a majority vote of the Board, including a majority of the Trustees who are not interested persons of the Trust.
VIII. Records and Confidentiality
Records of any violation of the Code and of the actions taken as a result of such violations will be kept by the Ethics Office. All reports and records prepared or maintained pursuant to this Code will be considered confidential and shall be maintained and protected accordingly. Except as otherwise required by law or this Code, such matters shall not be disclosed to anyone other than the Ethics Office, the Personal Trading Committee, the Board, appropriate personnel at the relevant Fidelity company or companies and the legal counsel of any or all of the foregoing.
Exhibit EX-99.CERT
I, Stacie M. Smith, certify that:
1.
I have reviewed this report on Form N-CSR of Fidelity Rutland Square Trust II;
2.
Based on my knowledge, this report does not contain any untrue statement of a material fact or omit to state a material fact necessary to make the statements made, in light of the circumstances under which such statements were made, not misleading with respect to the period covered by this report;
3.
Based on my knowledge, the financial statements, and other financial information included in this report, fairly present in all material respects the financial condition, results of operations, changes in net assets, and cash flows (if the financial statements are required to include a statement of cash flows) of the registrant as of, and for, the periods presented in this report;
4.
The registrant's other certifying officer(s) and I are responsible for establishing and maintaining disclosure controls and procedures (as defined in Rule 30a-3(c) under the Investment Company Act of 1940) and internal control over financial reporting (as defined in Rule 30a-3(d) under the Investment Company Act of 1940) for the registrant and have:
a.
Designed such disclosure controls and procedures, or caused such disclosure controls and procedures to be designed under our supervision, to ensure that material information relating to the registrant, including its consolidated subsidiaries, is made known to us by others within those entities, particularly during the period in which this report is being prepared;
b.
Designed such internal control over financial reporting, or caused such internal control over financial reporting to be designed under our supervision, to provide reasonable assurance regarding the reliability of financial reporting and the preparation of financial statements for external purposes in accordance with generally accepted accounting principles;
c.
Evaluated the effectiveness of the registrant's disclosure controls and procedures and presented in this report our conclusions about the effectiveness of the disclosure controls and procedures, as of a date within 90 days prior to the filing date of this report based upon such evaluation; and
d.
Disclosed in this report any change in the registrant’s internal control over financial reporting that occurred during the period covered by this report that has materially affected, or is reasonably likely to materially affect, the registrant’s internal control over financial reporting; and
5.
The registrant's other certifying officer(s) and I have disclosed to the registrant's auditors and the audit committee of the registrant's board of directors (or persons performing the equivalent functions):
a.
All significant deficiencies and material weaknesses in the design or operation of internal control over financial reporting which are reasonably likely to adversely affect the registrant's ability to record, process, summarize, and report financial information; and
b.
Any fraud, whether or not material, that involves management or other employees who have a significant role in the registrant's internal control over financial reporting.
Date:
July 27, 2021
/s/Stacie M. Smith |
Stacie M. Smith |
President and Treasurer |
I, John J. Burke III, certify that:
1.
I have reviewed this report on Form N-CSR of Fidelity Rutland Square Trust II;
2.
Based on my knowledge, this report does not contain any untrue statement of a material fact or omit to state a material fact necessary to make the statements made, in light of the circumstances under which such statements were made, not misleading with respect to the period covered by this report;
3.
Based on my knowledge, the financial statements, and other financial information included in this report, fairly present in all material respects the financial condition, results of operations, changes in net assets, and cash flows (if the financial statements are required to include a statement of cash flows) of the registrant as of, and for, the periods presented in this report;
4.
The registrant's other certifying officer(s) and I are responsible for establishing and maintaining disclosure controls and procedures (as defined in Rule 30a-3(c) under the Investment Company Act of 1940) and internal control over financial reporting (as defined in Rule 30a-3(d) under the Investment Company Act of 1940) for the registrant and have:
a.
Designed such disclosure controls and procedures, or caused such disclosure controls and procedures to be designed under our supervision, to ensure that material information relating to the registrant, including its consolidated subsidiaries, is made known to us by others within those entities, particularly during the period in which this report is being prepared;
b.
Designed such internal control over financial reporting, or caused such internal control over financial reporting to be designed under our supervision, to provide reasonable assurance regarding the reliability of financial reporting and the preparation of financial statements for external purposes in accordance with generally accepted accounting principles;
c.
Evaluated the effectiveness of the registrant's disclosure controls and procedures and presented in this report our conclusions about the effectiveness of the disclosure controls and procedures, as of a date within 90 days prior to the filing date of this report based upon such evaluation; and
d.
Disclosed in this report any change in the registrant’s internal control over financial reporting that occurred during the period covered by this report that has materially affected, or is reasonably likely to materially affect, the registrant’s internal control over financial reporting; and
5.
The registrant's other certifying officer(s) and I have disclosed to the registrant's auditors and the audit committee of the registrant's board of directors (or persons performing the equivalent functions):
a.
All significant deficiencies and material weaknesses in the design or operation of internal control over financial reporting which are reasonably likely to adversely affect the registrant's ability to record, process, summarize, and report financial information; and
b.
Any fraud, whether or not material, that involves management or other employees who have a significant role in the registrant's internal control over financial reporting.
Date:
July 27, 2021
/s/John J. Burke III |
John J. Burke III |
Chief Financial Officer |
Exhibit EX-99.906CERT
Certification Pursuant to Section 906 of the Sarbanes-Oxley Act of 2002 (subsections (a) and (b) of section 1350, chapter 63 of title 18, United States Code)
In connection with the attached Report of Fidelity Rutland Square Trust II (the “Trust”) on Form N-CSR to be filed with the Securities and Exchange Commission (the “Report”), each of the undersigned officers of the Trust does hereby certify that, to the best of such officer’s knowledge:
1.
The Report fully complies with the requirements of 13(a) or 15(d) of the Securities Exchange Act of 1934; and
2.
The information contained in the Report fairly presents, in all material respects, the financial condition and results of operations of the Trust as of, and for, the periods presented in the Report.
Dated: July 27, 2021
/s/Stacie M. Smith |
Stacie M. Smith |
President and Treasurer |
Dated: July 27, 2021
/s/John J. Burke III |
John J. Burke III |
Chief Financial Officer |
A signed original of this written statement required by Section 906, or other document authenticating, acknowledging, or otherwise adopting the signature that appears in typed form within the electronic version of this written statement required by Section 906, has been provided to the Trust and will be retained by the Trust and furnished to the Securities and Exchange Commission or its staff upon request.
Serious News for Serious Traders! Try StreetInsider.com Premium Free!
You May Also Be Interested In
- Katapult Holdings, Inc. Files Annual Report on Form 10-K
- BNY Mellon High Yield Strategies Fund Declares Dividend
- Blackstone to Acquire Tropical Smoothie Cafe to Propel Leading Franchisor’s Continued Expansion
Create E-mail Alert Related Categories
SEC FilingsSign up for StreetInsider Free!
Receive full access to all new and archived articles, unlimited portfolio tracking, e-mail alerts, custom newswires and RSS feeds - and more!
