Close

Form N-CSR Federated Hermes Municip For: Mar 31

May 24, 2022 10:22 AM EDT

United States

Securities and Exchange Commission

Washington, D.C. 20549


Form N-CSR

Certified Shareholder Report of Registered Management Investment Companies


811-2677


(Investment Company Act File Number)


Federated Hermes Municipal Bond Fund, Inc.

_______________________________________________________________


(Exact Name of Registrant as Specified in Charter)


Federated Hermes Funds

4000 Ericsson Drive

Warrendale, Pennsylvania 15086-7561

(Address of Principal Executive Offices)


(412) 288-1900

(Registrant's Telephone Number)


Peter J. Germain, Esquire

1001 Liberty Avenue

Pittsburgh, Pennsylvania 15222-3779

(Name and Address of Agent for Service)

(Notices should be sent to the Agent for Service)


Date of Fiscal Year End: 03/31/22


Date of Reporting Period: 03/31/22


  Item 1. Reports to Stockholders


Annual Shareholder Report
March 31, 2022
Share Class | Ticker
A | LMSFX
B | LMSBX
C | LMSCX
 
F | LMFFX
Institutional  | LMBIX
 

Federated Hermes Municipal Bond Fund, Inc.
Fund Established 1976

Dear Valued Shareholder,
We are pleased to present the Annual Shareholder Report for your fund covering the period from April 1, 2021 through March 31, 2022. This report includes Management’s Discussion of Fund Performance, a complete listing of your fund’s holdings, performance information and financial statements along with other important fund information.
As a global leader in active, responsible investment management, Federated Hermes is guided by our conviction that responsible investing is the best way to create wealth over the long term. The company provides capabilities across a wide range of asset classes to investors around the world.
In addition, FederatedInvestors.com offers quick and easy access to valuable resources that include timely fund updates, economic and market insights from our investment strategists and financial planning tools. You can also access many of those insights by following us on Twitter (@FederatedHermes) and LinkedIn.
Thank you for investing with us. We hope you find this information useful and look forward to keeping you informed.
Sincerely,
J. Christopher Donahue, President

Not FDIC Insured ▪ May Lose Value ▪ No Bank Guarantee

Management’s Discussion of Fund Performance (unaudited)
The total return of Federated Hermes Municipal Bond Fund, Inc. (the “Fund”), based on net asset value for the 12-month reporting period ended March 31, 2022, was -3.98% for the Class A Shares, -4.69% for the Class B Shares, -4.69% for the Class C Shares, -3.98% for the Class F Shares and -3.75% for the Institutional Shares. The -3.75% total return for the Institutional Shares for the reporting period consisted of 2.20% of tax-exempt dividends and reinvestments and -5.95% depreciation in the net asset value of the shares.1 The total return for the S&P Municipal Bond Index (SPMBI),2 the Fund’s broad-based securities market index, was -3.61% during the same period. The total return for the S&P Municipal Bond 3-Year Plus Index (SPMBI3)3 was -4.16% during the reporting period. The total return of the Morningstar Municipal National Long Funds Average (MNLFA),4 a peer group average for the Fund, was -4.78%, during the same period. The Fund’s and MNLFA’s total returns for the most recently completed fiscal year reflected actual cash flows, transaction costs and expenses, which were not reflected in the total return of the SPMBI or SPMBI3.
During the reporting period, the most significant factors affecting the Fund’s performance relative to the SPMBI3 were: (a) the effective duration of its portfolio (which indicates the portfolio’s sensitivity to changes in interest rates)5,6; (b) the credit quality (which is measured by credit rating) of portfolio securities7; (c) yield curve positioning8; and (d) the allocation of the portfolio among securities of similar issuers (referred to as “sectors”).
The following discussion focuses on the performance of the Fund’s Institutional Shares relative to the SPMBI3.
MARKET OVERVIEW
The Treasury yield curve flattened and rose during the reporting period. The 10-year Treasury yield began the reporting period at 1.74%. Yields fell during the first part of the period, reaching a low of 1.17% in August, 2021. The 10-year yield rose gently for the remainder of 2021 and began to accelerate steeply upward in 2022, with the 10-year Treasury yield ending the period at 2.34%. The shorter part of the curve saw yields increase even more, with the 2-year Treasury up 2.18% and the 5-year Treasury up 1.52%. Meanwhile, the long end hardly moved with the 30-year Treasury up just 0.04%.
Except for the shortest bonds, the municipal yield curve richened compared to the Treasury curve. Municipal Market Data (MMD) “AAA” yields increased 1.62% at 2 years, 1.46% at 5 years, 1.06% at 10 years and 0.78% at 30 years. The ratio of the yield on the 10-year “AAA”-rated muni to the 10-year Treasury rose from 64% at the beginning of the reporting period to 93% at the end of the period. Similarly, at 30 years, the ratio rose from 73% to 103%.
Annual Shareholder Report
1

Issuance of municipal bonds was robust for much of the reporting period, but began to tail off as rates rose. According to the Bond Buyer total issuance for 2021 was $475 billion, up $1 billion from 2020. Issuance for the first quarter of 2022 was $94.8 billion, down 16% from the first quarter of 2021. Refunding issuance has declined significantly in the beginning of 2022 as higher rates make fewer refundings economical.
During the reporting period, the Federal Reserve (the “Fed”) pivoted from aggressively supporting the U.S. economy as it struggled to overcome the pandemic to battling inflation as the economy recovered and the full impact of federal aid was felt. As inflation has quickly risen to multi-decade highs, the Fed has tapered its asset purchases and begun to increase the federal funds target rate.
The Russian invasion of Ukraine introduced considerable volatility into the markets and caused commodity prices to surge. It is not clear how long the conflict will last or how it will be resolved, but a protracted war would likely continue to cause disruptions.
DURATION
As determined at the end of the reporting period, the Fund’s dollar-weighted average duration for the reporting period was 4.69 years. The Fund’s average duration was shorter than the average duration of the SPMBI3 throughout the reporting period. With rates rising sharply over the reporting period, the Fund’s shorter duration relative to the SPMBI3 contributed to the Fund’s outperformance.
credit QUALITY
During the past year, municipal credit quality was generally good as the country recovered from the pandemic and massive federal aid flowed through the system. Consequently, investor appetite for lower credit quality debt was strong throughout most of the reporting period. Noninvestment-grade bonds outperformed investment-grade,9 and “BBB”-rated bonds outperformed high-grade bonds. In particular, the Fund’s overweight allocation to “BBB”-rated bonds and underweight allocation to “AAA”-rated bonds contributed to outperformance relative to the SPMBI3.
YIELD CURVE
During the reporting period, rates increased more sharply in the short end of the municipal curve than the intermediate or long end. The Fund’s distribution along the yield curve relative to the SPMBI3 detracted from the Fund’s relative performance.
Annual Shareholder Report
2

SeCTOR ALLOCATION
During the reporting period, the Fund’s sector allocations had a positive impact on Fund performance. The Fund’s best performing sectors were Pre-Refunded, Incremental Tax and Tobacco Settlement bonds. Lagging sectors included Public Power, Local General Obligations and Other Transportation bonds.
1
Income may be subject to state and local taxes. The investment adviser (“Adviser”) may also invest the Fund’s assets in securities whose interest (while exempt from the federal regular income tax) may be subject to (or may be a specific preference item for purposes of) the federal alternative minimum income tax (AMT) for individuals.
2
Please see the footnotes to the line graph under “Fund Performance and Growth of a $10,000 Investment” below for the definition of, and more information about, the SPMBI.
3
Please see the footnotes to the line graph under “Fund Performance and Growth of a $10,000 Investment” below for the definition of, and more information about, the SPMBI3.
4
Please see the footnotes to the line graph under “Fund Performance and Growth of a $10,000 Investment” below for the definition of, and more information about, the Morningstar peer group.
5
Duration is a measure of a security’s price sensitivity to changes in interest rates. Securities with longer durations are more sensitive to changes in interest rates than securities with shorter durations. For purposes of this Management’s Discussion of Fund Performance, duration is determined using a third-party analytical system.
6
Bond prices are sensitive to changes in interest rates, and a rise in interest rates can cause a decline in their prices.
7
Credit ratings pertain only to the securities in the portfolio and do not protect Fund shares against market risk.
8
The yield curve is a graph showing the comparative yields of securities in a particular class according to maturity. Securities on the long-end of the yield curve have longer maturities.
9
Investment-grade securities and noninvestment-grade securities may either be: (a) rated by a nationally recognized statistical ratings organization or rating agency; or (b) unrated securities that the Fund’s Adviser believes are of comparable quality. The rating agencies that provided the ratings for rated securities include Standard and Poor’s, Moody’s Investor Services, Inc. and Fitch Rating Service. When ratings vary, the highest rating is used. Credit ratings of “AA” or better are considered to be high credit quality; credit ratings of “A” are considered high or medium/good quality; credit ratings of “BBB” are considered to be medium/good credit quality and the lowest category of investment-grade securities; credit ratings of “BB” and below are lower-rated, noninvestment-grade securities or junk bonds; and credit ratings of “CCC” or below are noninvestment-grade securities that have high default risk. The presence of a ratings modifier, sub-category, or gradation (for example, a (+) or (-)) is intended to show relative standing within the major rating categories and does not affect the security credit rating for purposes of the Fund’s investment parameters. Credit ratings are an indication of the risk that a security will default. They do not protect a security from credit risk. Lower-rated bonds typically offer higher yields to help compensate investors for the increased risk associated with them. Among these risks are lower creditworthiness, greater price volatility, more risk to principal and income than with higher-rated securities and increased possibilities of default.
Annual Shareholder Report
3

FUND PERFORMANCE AND GROWTH OF A $10,000 INVESTMENT
The graph below illustrates the hypothetical investment of $10,0001 in the Federated Hermes Municipal Bond Fund, Inc. (the “Fund”) from March 31, 2012 to March 31, 2022, compared to the S&P Municipal Bond Index (SPMBI),2 S&P Municipal Bond 3-Year Plus Index (SPMBI3) 3 and the Morningstar Municipal National Long Funds Average (MNLFA).4 The Average Annual Total Return table below shows returns for each class averaged over the stated periods.
Growth of a $10,000 Investment
Growth of $10,000 as of March 31, 2022
◾ Total returns shown for the A Shares include the maximum sales charge of 4.50% ($10,000 investment minus $450 sales charge = $9,550).
◾ Total returns shown for the C Shares include the maximum contingent deferred sales charge of 1.00% as applicable.
The Fund offers multiple share classes whose performance may be greater than or less than its other share class(es) due to differences in sales charges and expenses. See the Average Annual Return table below for the returns of additional classes not shown in the line graph above.
Annual Shareholder Report
4

Average Annual Total Returns for the Period Ended 3/31/2022
(returns reflect all applicable sales charges and contingent deferred sales charge as specified below in footnote #1)
 
1 Year
5 Years
10 Years
Class A Shares
-8.31%
1.44%
2.30%
Class B Shares
-9.81%
1.27%
2.12%
Class C Shares
-5.62%
1.61%
2.12%
Class F Shares
-5.87%
2.21%
2.66%
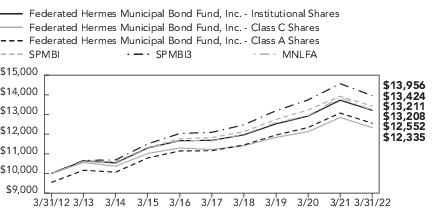
Institutional Shares5
-3.75%
2.49%
2.82%
SPMBI
-3.61%
2.57%
2.99%
SPMBI3
-4.16%
2.91%
3.39%
MNLFA
-4.78%
2.61%
3.06%
Performance data quoted represents past performance which is no guarantee of future results. Investment return and principal value will fluctuate so that an investor’s shares, when redeemed, may be worth more or less than their original cost. Mutual fund performance changes over time and current performance may be lower or higher than what is stated. For current to the most recent month-end performance and after-tax returns, visit FederatedInvestors.com or call 1-800-341-7400. Returns shown do not reflect the deduction of taxes that a shareholder would pay on Fund distributions or the redemption of Fund shares. Mutual funds are not obligations of or guaranteed by any bank and are not federally insured.
1
Represents a hypothetical investment of $10,000 in the Fund after deducting applicable sales charges: For Class A Shares, the maximum sales charge of 4.50% ($10,000 investment minus $450 sales charge = $9,550); for Class B Shares, the maximum contingent deferred sales charge is 5.50% on any redemption less than one year from the purchase date; for Class C Shares, a 1.00% contingent deferred sales charge would be applied to any redemption less than one year from the purchase date; for Class F Shares, the maximum sales charge of 1.00% ($10,000 investment minus $100 sales charge = $9,900) and the maximum contingent deferred sales charge is 1.00% on any redemption less than four years from the purchase date. The Fund’s performance assumes the reinvestment of all dividends and distributions. The SPMBI, SPMBI3 and the MNLFA have been adjusted to reflect reinvestment of dividends on securities in the indexes and average.
2
The SPMBI is a broad, comprehensive, market value-weighted index composed of approximately 55,000 bond issues that are exempt from U.S. federal income taxes or subject to the AMT. Eligibility criteria for inclusion in the SPMBI include, but are not limited to: the bond issuer must be a state (including the Commonwealth of Puerto Rico and U.S. territories) or a local government or a state or local government entity where interest on the bond is exempt from U.S. federal income taxes or subject to the AMT; the bond must be held by a mutual fund for which Standard & Poor’s Securities Evaluations, Inc. provides prices; it must be denominated in U.S. dollars and have a minimum par amount of $2 million; and the bond must have a minimum term to maturity and/or call date greater than or equal to one calendar month. The SPMBI is rebalanced monthly. The SPMBI is not adjusted to reflect sales charges, expenses and other fees that the Securities and Exchange Commission (SEC) requires to be reflected in the Fund’s performance. Unlike the Fund, the SPMBI is unmanaged and is not affected by cash flows. It is not possible to invest directly in this index.
Annual Shareholder Report
5

3
The SPMBI3 represents the portion of the SPMBI composed solely of bonds with remaining maturities of three years or more. The SPMBI3 is not adjusted to reflect sales charges, expenses and other fees that the SEC requires to be reflected in the Fund’s performance. Unlike the Fund, the SPMBI3 is unmanaged and is not affected by cash flows. It is not possible to invest directly in this index.
4
Morningstar figures represent the average of the total returns reported by all the funds designated by Morningstar as falling into the respective category indicated. They do not reflect sales charges. The Morningstar figures in the Growth of a $10,000 Investment line graph are based on historical return information published by Morningstar and reflect the return of the funds comprising the category in the year of publication. Because the funds designated by Morningstar as falling into the category can change over time, the Morningstar figures in the line graph may not match the Morningstar figures in the Average Annual Total Returns table, which reflect the return of the funds that currently comprise the category.
5
The Fund’s Institutional Shares commenced operations on July 27, 2017. For the period prior to the commencement of operations of Institutional Shares, the performance information shown for the Fund’s Institutional Shares is for the Class A Shares. The performance of the Class A Shares has not been adjusted to reflect the expenses of the Institutional Shares, since the Institutional Shares have a lower expense ratio than the expense ratio of Class A Shares. The performance of Class A has been adjusted to reflect the absence of sales charges and to remove any voluntary waiver of Fund expenses related to Class A Shares that may have occurred during the periods prior to commencement of operations of the Institutional Shares.
Annual Shareholder Report
6

Portfolio of Investments Summary Table (unaudited)
At March 31, 2022, the Fund’s sector composition1 was as follows:
Sector Composition
Percentage of
Total Net Assets
Hospital
14.9%
Toll Road
14.4%
Airport
9.5%
Public Power
9.2%
Dedicated Tax
7.6%
General ObligationLocal
6.9%
General ObligationState
6.2%
Other Utility
5.3%
Refunded
3.6%
Water & Sewer
3.2%
Other2
18.3%
Other Assets and LiabilitiesNet3
0.9%
TOTAL
100%
1
Sector classifications, and the assignment of holdings to such sectors, are based upon the economic sector and/or revenue source of the underlying obligor, as determined by the Fund’s Adviser. For securities that have been enhanced by a third party guarantor, such as bond insurers and banks, sector classifications are based upon the economic sector and/or revenue source of the underlying obligor, as determined by the Fund’s Adviser. Refunded securities are those whose debt service is paid from escrowed assets, usually U.S. government securities.
2
For purposes of this table, sector classifications constitute 80.8% of the Fund’s total net assets. Remaining sectors have been aggregated under the designation “Other.”
3
Assets, other than investments in securities, less liabilities. See Statement of Assets and Liabilities.
Annual Shareholder Report
7

Portfolio of Investments
March 31, 2022
Principal
Amount
 
 
Value
 
 
MUNICIPAL BONDS—98.0%


Alabama—1.0%
 
$3,000,000
1
Black Belt Energy Gas District, AL, Gas Project Revenue Bonds
(Series 2022B-2) FRNs, (Goldman Sachs Group, Inc. GTD), 1.160%
(SIFMA 7-day +0.650%), Mandatory Tender 10/1/2027
$3,000,020
 
 
Arizona—3.8%
 
3,000,000
 
Arizona Board of Regents (Arizona State University),
(Series 2016B), 5.000%, 7/1/2047
3,313,312
500,000
 
Arizona State IDA (Phoenix Children’s Hospital), Hospital
Revenue Bonds (Series 2020A), 4.000%, 2/1/2050
517,919
2,000,000
 
Phoenix, AZ Civic Improvement Corp.Airport System, Junior
Line Airport Revenue Bonds (Series 2019A), 4.000%, 7/1/2044
2,088,298
1,740,000
 
Phoenix, AZ IDA (GreatHearts Academies), Education Facility
Revenue Bonds (Series 2014A), 5.000%, 7/1/2044
1,804,136
2,000,000
 
Salt River Project, AZ Agricultural Improvement & Power District,
Electric System Revenue Bonds (Series 2019A), 5.000%, 1/1/2035
2,360,808
1,000,000
 
Salt River Project, AZ Agricultural Improvement & Power District,
Electric System Revenue Refunding Bonds (Series 2017A),
5.000%, 1/1/2038
1,139,586
 
 
TOTAL
11,224,059
 
 
California—8.6%
 
1,500,000
1
Bay Area Toll Authority, CA, San Francisco Bay Area Toll Bridge
Revenue Bonds (SIFMA Index Rate Bonds Series 2001A) FRNs,
1.760% (SIFMA 7-day +1.250%), Mandatory Tender 4/1/2027
1,548,898
2,000,000
 
California Health Facilities Financing Authority (Providence
St. Joseph Health), Revenue Bonds (Series 2014B),
5.000%, 10/1/2044
2,123,759
1,000,000
 
California Health Facilities Financing Authority (Stanford Health
Care), Revenue Bonds (Series 2015A), 5.000%, 8/15/2054
1,080,795
335,000
2
California Public Finance Authority (Kendal at Sonoma), Enso
Village Senior Living Revenue Refunding Bonds (Series 2021A),
5.000%, 11/15/2056
346,353
1,070,000
 
California State, UT GO Various Purpose Bonds,
4.000%, 4/1/2049
1,161,365
1,000,000
 
Los Angeles, CA Department of Airports (Los Angeles
International Airport), Subordinate Revenue Bonds
(Series 2018A), 5.000%, 5/15/2044
1,099,275
1,200,000
 
Los Angeles, CA Department of Airports (Los Angeles
International Airport), Subordinate Revenue Refunding Bonds
(Series 2022C), 4.000%, 5/15/2041
1,262,620
1,000,000
 
Los Angeles, CA Department of Airports (Los Angeles
International Airport), Subordinate Revenue Refunding Bonds
(Series 2022C), 5.000%, 5/15/2045
1,147,338
Annual Shareholder Report
8

Principal
Amount
 
 
Value
 
 
MUNICIPAL BONDS—continued


California—continued
 
$2,000,000
 
Los Angeles, CA Department of Water & Power (Los Angeles, CA
Department of Water & Power (Water Works/System)), Water
System Revenue Bonds (Series 2013B), 5.000%, 7/1/2033
$2,077,065
260,000
 
Riverside County, CA Transportation Commission (RCTC 91
Express Lanes), Toll Revenue Senior Lien Refunding Bonds
(Series 2021B-1), 4.000%, 6/1/2046
270,047
3,000,000
 
Roseville, CA Natural Gas Financing Authority, Gas Revenue
Bonds (Series 2007), (Bank of America Corp. GTD),
5.000%, 2/15/2025
3,221,449
1,000,000
 
San Diego County, CA Regional Airport Authority, Subordinate
Airport Revenue Bonds (Series 2021B), 5.000%, 7/1/2034
1,150,678
1,500,000
 
San Diego County, CA Regional Airport Authority, Subordinate
Airport Revenue Bonds (Series 2021B), 5.000%, 7/1/2051
1,677,584
2,000,000
 
San Diego, CA Unified School District, UT GO Bonds (Election
2012 Series-I), 5.000%, 7/1/2047
2,251,187
2,000,000
 
San Francisco, CA City & County Airport Commission, Second
Series Revenue Bonds (Series 2019A), 5.000%, 5/1/2035
2,245,878
1,500,000
 
San Francisco, CA City & County Airport Commission, Second
Series Revenue Refunding Bonds (Series 2021A),
5.000%, 5/1/2031
1,745,568
1,000,000
 
Transbay Joint Powers Authority, CA, Senior Tax Allocation Bonds
Green Bonds (Series 2020A), 5.000%, 10/1/2045
1,156,066
 
 
TOTAL
25,565,925
 
 
Colorado—4.9%
 
1,000,000
 
Colorado Health Facilities Authority (CommonSpirit Health),
Revenue Bonds (Series 2019A-1), 4.000%, 8/1/2037
1,051,725
1,000,000
 
Colorado Health Facilities Authority (CommonSpirit Health),
Revenue Bonds (Series 2019A-1), 5.000%, 8/1/2036
1,135,452
1,000,000
 
Denver, CO City & County Department of Aviation (Denver, CO
City & County Airport Authority), Airport System Revenue Bonds
(Series 2018A), 5.000%, 12/1/2048
1,098,049
2,000,000
 
Denver, CO Convention Center Hotel Authority, Senior Revenue
Refunding Bonds (Series 2016), 5.000%, 12/1/2027
2,200,388
2,800,000
 
E-470 Public Highway Authority, CO, Senior Revenue Bonds
(Series 2020A), 5.000%, 9/1/2040
2,980,809
2,500,000
 
Regional Transportation District, CO (Denver Transit Partners
Eagle P3 Project), Private Activity Bonds (Series 2020A),
4.000%, 7/15/2035
2,613,543
3,250,000
 
University of Colorado Hospital Authority, Revenue Bonds
(Series 2012A), 5.000%, 11/15/2036
3,317,696
 
 
TOTAL
14,397,662
Annual Shareholder Report
9

Principal
Amount
 
 
Value
 
 
MUNICIPAL BONDS—continued


Connecticut—1.7%
 
$1,000,000
 
Connecticut State (Connecticut State Special Transportation
Fund), Special Tax Obligation Bonds Transportation Infrastructure
Purpose (Series 2018B), 5.000%, 10/1/2036
$1,139,066
750,000
 
Connecticut State (Connecticut State Special Transportation
Fund), Special Tax Obligation Bonds Transportation Infrastructure
Purposes (Series 2020A), 4.000%, 5/1/2036
803,576
3,000,000
 
Connecticut State Health & Educational Facilities (Trinity
Healthcare Credit Group), Revenue Bonds (Series 2016CT),
5.000%, 12/1/2045
3,266,332
 
 
TOTAL
5,208,974
 
 
District of Columbia—3.3%
 
1,200,000
 
District of Columbia (District of Columbia International School),
Revenue Bonds (Series 2019), 5.000%, 7/1/2049
1,305,846
1,800,000
 
District of Columbia (Friendship Public Charter School, Inc.),
Revenue Bonds (Series 2016A), 5.000%, 6/1/2041
1,914,603
15,000
 
District of Columbia (Georgetown University), University
Refunding Revenue Bonds (Series 2017), (United States Treasury
PRF 4/1/2027@100), 5.000%, 4/1/2036
17,019
985,000
 
District of Columbia (Georgetown University), University
Refunding Revenue Bonds (Series 2017), 5.000%, 4/1/2036
1,094,224
2,500,000
 
District of Columbia (KIPP DC), Refunding Revenue Bonds
(Series 2017A), 5.000%, 7/1/2048
2,683,389
2,250,000
 
District of Columbia, UT GO Bonds (Series 2021D),
5.000%, 2/1/2046
2,641,777
 
 
TOTAL
9,656,858
 
 
Florida—6.6%
 
1,000,000
 
Central Florida Expressway Authority, Senior Lien Revenue
Refunding Bonds (Series 2017), 5.000%, 7/1/2038
1,124,545
1,000,000
2
Florida Development Finance Corp. (Glenridge on Palmer Ranch),
Senior Living Revenue and Refunding Bonds (Series 2021),
5.000%, 6/1/2051
1,046,305
1,000,000
 
Florida State Mid-Bay Authority, First Senior Lien Revenue Bonds
(Series 2015A), 5.000%, 10/1/2035
1,075,472
2,000,000
 
Greater Orlando, FL Aviation Authority, Subordinate Airport
Facilities Revenue Bonds (Series 2017A), 5.000%, 10/1/2036
2,216,754
1,000,000
 
Jacksonville, FL (Brooks Rehabilitation), Health Care Facilities
Revenue Bonds (Series 2020), 5.000%, 11/1/2050
1,132,973
1,000,000
 
Miami-Dade County, FL (Miami-Dade County, FL Seaport),
Seaport Revenue Bonds (Series 2013A), (United States Treasury
PRF 10/1/2023@100), 5.750%, 10/1/2030
1,058,321
2,000,000
 
Miami-Dade County, FL Aviation, Aviation Revenue Refunding
Bonds (Series 2015A), 5.000%, 10/1/2038
2,140,220
380,000
 
Miami-Dade County, FL Aviation, Aviation Revenue Refunding
Bonds (Series 2020A), 4.000%, 10/1/2041
398,238
Annual Shareholder Report
10

Principal
Amount
 
 
Value
 
 
MUNICIPAL BONDS—continued


Florida—continued
 
$2,000,000
 
Miami-Dade County, FL Expressway Authority, Toll System
Refunding Revenue Bonds (Series 2016A), 5.000%, 7/1/2032
$2,215,692
1,250,000
 
Miami-Dade County, FL Expressway Authority, Toll System
Revenue Bonds (Series 2010), (Original Issue Yield: 5.100%),
5.000%, 7/1/2040
1,256,505
1,500,000
 
Miami-Dade County, FL HFA (Nicklaus Children’s Hospital),
Hospital Revenue Refunding Bonds (Series 2017),
5.000%, 8/1/2042
1,671,625
1,000,000
 
Miami-Dade County, FL IDA (Doral Academy), Industrial
Development Revenue Bonds (Series 2017), 5.000%, 1/15/2048
1,047,708
470,000
 
St. Johns County, FL IDA (Vicar’s Landing), Senior Living Revenue
Bonds (Series 2021A), 4.000%, 12/15/2041
450,163
1,500,000
 
Tallahassee, FL Energy System, Revenue Refunding Bonds
(Series 2017), 5.000%, 10/1/2036
1,638,558
1,000,000
 
Tampa, FL (H. Lee Moffitt Cancer Center), Hospital Revenue
Bonds (Series 2020B), 4.000%, 7/1/2045
1,029,968
 
 
TOTAL
19,503,047
 
 
Georgia—2.7%
 
3,000,000
 
Atlanta, GA Water & Wastewater, Revenue Refunding Bonds
(Series 2015), 5.000%, 11/1/2040
3,255,212
3,000,000
1
Main Street Natural Gas, Inc., GA, Gas Supply Revenue Bonds
(Series 2018D) FRNs, (Royal Bank of Canada GTD), 0.984%
(1-month USLIBOR x 0.67 +0.830%), Mandatory
Tender 12/1/2023
2,994,557
1,500,000
 
Municipal Electric Authority of Georgia, Plant Vogtlle Units 3&4
Project P Revenue Refunding Bonds (Series 2021A),
5.000%, 1/1/2063
1,646,273
 
 
TOTAL
7,896,042
 
 
Illinois—3.8%
 
1,000,000
 
Chicago, IL Board of Education, UT GO Bonds (Series 2021A),
5.000%, 12/1/2040
1,083,016
310,000
 
Chicago, IL O’Hare International Airport, General Airport Senior
Lien Revenue Refunding Bonds (Series 2016B), 5.000%, 1/1/2041
335,476
750,000
 
Chicago, IL Water Revenue, Second Lien Water Revenue Bonds
(Series 2014), 5.000%, 11/1/2044
796,252
3,000,000
 
Illinois Finance Authority (Northwestern Memorial Healthcare),
Revenue Bonds (Series 2017A), 5.000%, 7/15/2042
3,419,955
2,000,000
 
Illinois State Toll Highway Authority, Toll Highway Senior Revenue
Bonds (Series 2020A), 5.000%, 1/1/2045
2,286,249
890,000
 
Illinois State, GO Bonds (Series 2017D), 5.000%, 11/1/2028
982,178
1,110,000
 
Illinois State, UT GO Bonds (Series 2017D), 5.000%, 11/1/2026
1,214,155
Annual Shareholder Report
11

Principal
Amount
 
 
Value
 
 
MUNICIPAL BONDS—continued


Illinois—continued
 
$1,000,000
 
Illinois State, UT GO Bonds (Series June 2013), (Original Issue
Yield: 5.280%), 5.250%, 7/1/2028
$1,047,205
 
 
TOTAL
11,164,486
 
 
Kentucky—0.7%
 
2,085,000
1
Public Energy Authority of Kentucky, Gas Supply Revenue Bonds
(Series 2022A-2) FRNs, (Morgan Stanley GTD), 1.388%
(SOFR x 0.67 +1.200%), Mandatory Tender 8/1/2030
2,057,470
 
 
Louisiana—0.5%
 
150,000
 
Bienville Parish, LA School District #1, UT GO Bonds
(Series 2018), (Original Issue Yield: 3.140%), (Build America
Mutual Assurance INS), 3.000%, 3/1/2030
154,106
150,000
 
Central, LA Community School System, UT GO School Bonds
(Series 2014), (United States Treasury PRF 3/1/2024@100),
4.000%, 3/1/2030
155,835
275,000
 
Iberia Parish, LA Parishwide School District, UT GO Bonds
(Series 2014), (Original Issue Yield: 3.990%), (United States
Treasury PRF 3/1/2024@100), 3.750%, 3/1/2033
284,635
150,000
 
Louisiana Local Government Environmental Facilities Community
Development Authority (Bossier City, LA), Revenue Refunding
Bonds (Series 2015), 5.000%, 11/1/2032
164,480
250,000
 
Louisiana Local Government Environmental Facilities Community
Development Authority (Louisiana Community and Technical
College System), Act 360 Revenue Bonds (Series 2014),
(United States Treasury PRF 10/1/2024@100), 5.000%, 10/1/2034
268,421
250,000
 
Louisiana State Correctional Facilities Corp., Office of Juvenile
Justice Revenue Bonds (Series 2021), 4.000%, 10/1/2040
272,597
175,000
 
St. Tammany Parish, LA Recreation District No. 14, UT GO Bonds
(Series 2014), 3.750%, 4/1/2034
181,101
 
 
TOTAL
1,481,175
 
 
Massachusetts—3.1%
 
3,000,000
 
Commonwealth of Massachusetts, UT GO Bonds (Series 2018C),
5.250%, 9/1/2043
3,460,001
250,000
 
Massachusetts Development Finance Agency (Southcoast Health
System Obligated Group), Revenue Bonds (Series 2021G),
4.000%, 7/1/2046
257,739
3,000,000
 
Massachusetts Port Authority, Revenue Bonds (Series 2015A),
5.000%, 7/1/2045
3,241,143
2,000,000
 
Massachusetts School Building Authority, Subordinated
Dedicated Sales Tax Revenue Bonds (Series 2018A),
5.250%, 2/15/2048
2,270,813
 
 
TOTAL
9,229,696
 
 
Michigan—1.5%
 
1,000,000
 
Detroit, MI, UT GO Bonds (Series 2020), 5.500%, 4/1/2045
1,125,292
Annual Shareholder Report
12

Principal
Amount
 
 
Value
 
 
MUNICIPAL BONDS—continued


Michigan—continued
 
$2,000,000
 
Michigan Strategic Fund (I-75 Improvement Project), Limited
Obligation Revenue Bonds (Series 2018), 5.000%, 12/31/2043
$2,175,715
1,000,000
 
Royal Oak, MI Hospital Finance Authority (Beaumont Health
Credit Group), Refunding Revenue Bonds (Series 2014D),
5.000%, 9/1/2039
1,047,395
 
 
TOTAL
4,348,402
 
 
Mississippi—1.7%
 
100,000
 
Lauderdale County, MS, UT GO Bonds (Series 2015),
(Original Issue Yield: 3.300%), 3.000%, 11/1/2030
102,110
250,000
 
Lauderdale County, MS, UT GO Bonds (Series 2015B),
(Original Issue Yield: 3.360%), 3.250%, 11/1/2031
256,604
150,000
 
Lauderdale County, MS, UT GO Refunding Bond (Series 2011),
3.000%, 4/1/2026
154,489
400,000
 
Mississippi State Development Bank (Harrison County, MS),
Refunding Bonds (Series 2010A), 5.250%, 1/1/2034
486,520
75,000
 
Mississippi State Development Bank (Hinds County, MS), Special
Obligation Bonds (Series 2017), 5.000%, 11/1/2026
83,946
200,000
 
Mississippi State Development Bank (Jones County, MS Junior
College District), Special Obligation Capital Improvement
Refunding Bonds (Series 2016), (Original Issue Yield: 3.580%),
(Build America Mutual Assurance INS), 3.500%, 5/1/2035
207,430
360,000
 
Mississippi State Development Bank (Meridian, MS), Special
Obligation Bonds Mississippi Arts and Entertainment Center
(Series 2017), 5.000%, 3/1/2025
384,852
170,000
 
Mississippi State Development Bank, Special Obligation
Refunding Bonds (Series A), 5.000%, 4/1/2028
174,809
425,000
 
Mississippi State Institutions of Higher Learning, Revenue
Refunding Bonds (Series 2015A), (Original Issue Yield: 3.480%),
3.250%, 3/1/2033
434,405
500,000
 
Mississippi State University, Revenue Refunding Bonds
(Series 2017A), 4.000%, 8/1/2043
528,116
500,000
 
Mississippi State, Gaming Tax Revenue Bonds (Series 2015E),
5.000%, 10/15/2025
547,722
500,000
 
Mississippi State, UT GO (Series 2017D), (Original Issue
Yield: 3.080%), 3.000%, 12/1/2037
499,265
250,000
 
Ocean Springs, MS, UT GO Refunding Bonds (Series 2019),
4.000%, 12/1/2029
276,267
575,000
 
Oxford, MS, UT GO Capital Improvement Bonds (Series 2018B),
(Original Issue Yield: 3.250%), 3.125%, 8/1/2033
582,441
400,000
 
Starkville, MS, UT GO Refunding Bonds (Series 2018),
4.000%, 6/1/2027
431,352
 
 
TOTAL
5,150,328
Annual Shareholder Report
13

Principal
Amount
 
 
Value
 
 
MUNICIPAL BONDS—continued


Nebraska—1.3%
 
$2,000,000
 
Central Plains Energy Project, NE, Gas Project Revenue Bonds
(Project No. 3) (Series 2012), (Original Issue Yield: 5.050%),
(Goldman Sachs Group, Inc. GTD), 5.000%, 9/1/2042
$2,027,952
1,620,000
 
Nebraska Public Power District, General Revenue Bonds
(Series 2021D), 4.000%, 1/1/2044
1,728,436
 
 
TOTAL
3,756,388
 
 
Nevada—0.9%
 
2,000,000
 
Clark County, NV, Limited Tax General Obligation Detention
Center Bonds (Series 2019), 5.000%, 6/1/2032
2,343,442
305,000
2
Director of the State of Nevada Department of Business and
Industry (Doral Academy of Nevada CS), Charter School Revenue
Bonds (Series 2017A), 5.000%, 7/15/2047
320,109
 
 
TOTAL
2,663,551
 
 
New Hampshire—0.5%
 
100,000
 
National Finance Authority, NH (Covanta Energy Corp.), Resource
Recovery Revenue Refunding Bonds (Series 2020B) TOBs,
3.750%, Mandatory Tender 7/2/2040
96,402
1,500,000
 
National Finance Authority, NH (Springpoint Senior Living),
Senior Living Revenue Refunding Bonds (Series 2021),
4.000%, 1/1/2051
1,499,926
 
 
TOTAL
1,596,328
 
 
New Jersey—4.7%
 
155,000
 
New Jersey EDA (New Jersey State), School Facilities
Construction Bonds (Series 2015 WW), (United States Treasury
PRF 6/15/2025@100), 5.250%, 6/15/2040
170,302
2,725,000
 
New Jersey EDA (New Jersey State), School Facilities
Construction Bonds (Series 2015 WW), 5.250%, 6/15/2040
2,946,942
665,000
 
New Jersey EDA (Port Newark Container Terminal LLC), Special
Facilities Revenue and Refunding Bonds (Series 2017),
5.000%, 10/1/2047
713,412
1,250,000
 
New Jersey Health Care Facilities Financing Authority
(RWJ Barnabas Health Obligated Group), Revenue Bonds
(Series 2014A), 5.000%, 7/1/2043
1,327,532
1,500,000
 
New Jersey State Transportation Trust Fund Authority
(New Jersey State), Transportation System Bonds (Series 2018A),
5.000%, 12/15/2035
1,663,894
2,000,000
 
New Jersey Turnpike Authority, Turnpike Revenue Bonds
(Series 2015E), 5.000%, 1/1/2034
2,141,416
1,000,000
 
New Jersey Turnpike Authority, Turnpike Revenue Bonds
(Series 2017A), 5.000%, 1/1/2029
1,122,511
850,000
 
South Jersey Transportation Authority, Transportation System
Revenue Bonds (Series 2020A), 5.000%, 11/1/2045
947,970
Annual Shareholder Report
14

Principal
Amount
 
 
Value
 
 
MUNICIPAL BONDS—continued


New Jersey—continued
 
$2,700,000
 
Tobacco Settlement Financing Corp., NJ, Tobacco Settlement
Asset-Backed Subordinate Refunding Bonds (Series 2018B),
5.000%, 6/1/2046
$2,914,734
 
 
TOTAL
13,948,713
 
 
New Mexico—0.8%
 
2,175,000
 
New Mexico State Hospital Equipment Loan Council
(Presbyterian Healthcare Services), Hospital System Revenue
Bonds (Series 2017A), 5.000%, 8/1/2046
2,440,722
 
 
New York—8.2%
 
1,000,000
 
Hudson Yards Infrastructure Corp., NY, Second Indenture
Revenue Bonds (Series 2017A), 5.000%, 2/15/2045
1,107,684
2,000,000
 
Long Island Power Authority, NY, Electric System General
Revenue Bonds (Series 2014A), 5.000%, 9/1/2044
2,122,371
480,000
 
Long Island Power Authority, NY, Electric System General
Revenue Bonds (Series 2020A), 4.000%, 9/1/2039
513,019
2,000,000
 
Metropolitan Transportation Authority, NY (MTA Transportation
Revenue), Transportation Revenue Green Bonds (Series 2020C-1),
5.250%, 11/15/2055
2,210,286
1,000,000
 
Metropolitan Transportation Authority, NY (MTA Transportation
Revenue), Transportation Revenue Refunding Bonds
(Series 2017B), 5.000%, 11/15/2024
1,069,928
3,000,000
 
New York City, NY, Transitional Finance Authority, Building Aid
Revenue Bonds (Series 2015S-2), 5.000%, 7/15/2041
3,235,897
3,255,000
 
New York City, NY, UT GO Bonds (Fiscal 2016 Series C),
5.000%, 8/1/2033
3,569,090
300,000
 
New York City, NY, UT GO Bonds (Fiscal 2016 Series E),
5.000%, 8/1/2032
333,166
2,000,000
 
New York State Dormitory Authority (New York State Personal
Income Tax Revenue Bond Fund), General Purpose Revenue
Bonds (Series 2016A), 5.000%, 2/15/2043
2,200,117
1,500,000
 
New York State Dormitory Authority (New York State Personal
Income Tax Revenue Bond Fund), Revenue Refunding Bonds
(Series 2022A), 4.000%, 3/15/2049
1,567,097
2,000,000
 
New York State Dormitory Authority (New York State Sales Tax
Revenue Bond Fund), Revenue Bonds (Series 2018C),
5.000%, 3/15/2038
2,261,282
1,000,000
 
New York State Thruway AuthorityPersonal Income Tax
Revenue (New York State Personal Income Tax Revenue Bond
Fund), Revenue Bonds (Series 2021-1), 4.000%, 3/15/2052
1,048,487
825,000
 
New York Transportation Development Corporation (JFK
International Air Terminal LLC), Special Facilities Revenue Bonds
(Series 2020A), 4.000%, 12/1/2039
838,544
1,930,000
 
Port Authority of New York and New Jersey, Revenue Bonds
(194th Series), 5.000%, 10/15/2041
2,090,940
 
 
TOTAL
24,167,908
Annual Shareholder Report
15

Principal
Amount
 
 
Value
 
 
MUNICIPAL BONDS—continued


North Carolina—0.7%
 
$1,000,000
 
North Carolina Medical Care Commission (United Methodist
Retirement Homes), Revenue Refunding Bonds (Series 2017A),
(United States Treasury PRF 10/1/2023@103), 5.000%, 10/1/2037
$1,074,995
1,000,000
 
North Carolina Medical Care Commission (United Methodist
Retirement Homes), Revenue Refunding Bonds (Series 2017A),
(United States Treasury PRF 10/1/2023@103), 5.000%, 10/1/2047
1,074,995
 
 
TOTAL
2,149,990
 
 
Ohio—4.9%
 
2,000,000
 
American Municipal Power-Ohio, Inc. (AMP Fremont Energy),
Revenue Refunding Bonds (Series 2021A), 5.000%, 2/15/2035
2,365,381
1,000,000
 
Buckeye Tobacco Settlement Financing Authority, OH, Tobacco
Settlement Asset-Backed Refunding Bonds
(Series 2020B-2 Class 2), 5.000%, 6/1/2055
1,040,697
1,000,000
 
Cincinnati, OH, UT GO Various Purpose Improvement Bonds
(Series 2019), 5.000%, 12/1/2032
1,190,905
1,680,000
 
Cuyahoga County, OH Hospital Authority (MetroHealth System),
Hospital Revenue Bonds (Series 2017), (Original Issue
Yield: 5.030%), 5.000%, 2/15/2057
1,803,583
1,500,000
 
Ohio Air Quality Development Authority (Pratt Paper, LLC),
Exempt Facilities Revenue Bonds (Series 2017),
4.500%, 1/15/2048
1,536,728
3,000,000
 
Ohio State Treasurer (Portsmouth Gateway Group LLC), Private
Activity Revenue Bonds (Series 2015), 5.000%, 12/31/2039
3,181,221
1,000,000
 
Ohio State University, Special Purpose General Receipts Bonds
(Series 2013A), 5.000%, 6/1/2038
1,034,246
2,000,000
 
Ohio State, Common Schools UT GO Bonds (Series 2019A),
5.000%, 6/15/2036
2,341,894
 
 
TOTAL
14,494,655
 
 
Oklahoma—1.8%
 
2,000,000
 
Oklahoma Development Finance Authority (OU Medicine),
Hospital Revenue Bonds (Series 2018B), 5.500%, 8/15/2057
2,167,263
2,795,000
 
Oklahoma State Turnpike Authority, Second Senior Revenue
Bonds (Series 2017C), 5.000%, 1/1/2047
3,125,404
 
 
TOTAL
5,292,667
 
 
Oregon—0.4%
 
1,000,000
 
Medford, OR Hospital Facilities Authority (Asante Health System),
Revenue and Refunding Bonds (Series 2020A),
5.000%, 8/15/2050
1,132,511
 
 
Pennsylvania—7.1%
 
1,000,000
 
Allegheny County, PA Sanitation Authority, Sewer Revenue
Bonds (Series 2015), 5.000%, 12/1/2040
1,090,476
1,500,000
 
Delaware River Joint Toll Bridge Commission, Revenue Bonds
(Series 2017), 5.000%, 7/1/2042
1,681,328
Annual Shareholder Report
16

Principal
Amount
 
 
Value
 
 
MUNICIPAL BONDS—continued


Pennsylvania—continued
 
$2,000,000
 
Delaware River Port Authority, Revenue Bonds (Series 2013),
5.000%, 1/1/2030
$2,103,285
2,000,000
 
Geisinger Authority, PA Health System (Geisinger Health System),
Revenue Refunding Bonds (Series 2017A-1), 5.000%, 2/15/2045
2,216,331
2,000,000
 
Northampton County, PA General Purpose Authority (St. Luke’s
University Health Network), Hospital Revenue Bonds
(Series 2018A), (Original Issue Yield: 4.090%), 4.000%, 8/15/2048
2,113,315
2,970,000
 
Pennsylvania Economic Development Financing Authority
(Pennsylvania Rapid Bridge Replacement), Tax-Exempt Private
Activity Revenue Bonds (Series 2015), 5.000%, 12/31/2034
3,164,531
2,000,000
 
Pennsylvania State Higher Education Facilities Authority
(University of Pennsylvania Health System), 4.000%, 8/15/2042
2,106,269
1,000,000
 
Pennsylvania State Higher Education Facilities Authority
(University of Pennsylvania), Revenue Bonds (Series 2018A),
5.000%, 2/15/2048
1,128,884
3,050,000
 
Pennsylvania State Turnpike Commission, Turnpike Subordinate
Revenue Bonds (Series 2021A), 4.000%, 12/1/2044
3,195,779
2,000,000
 
Philadelphia, PA, GO Bonds (Series 2019B), 5.000%, 2/1/2037
2,300,690
 
 
TOTAL
21,100,888
 
 
Puerto Rico—2.5%
 
2,000,000
 
Puerto Rico Sales Tax Financing Corp., Restructured Sales Tax
Bonds (Series 2019A), (Original Issue Yield: 5.154%),
5.000%, 7/1/2058
2,126,399
3,000,000
 
Puerto Rico Sales Tax Financing Corp., Restructured Sales Tax
Bonds (Series 2019A-1), 4.750%, 7/1/2053
3,147,525
2,065,000
 
Puerto Rico Sales Tax Financing Corp., Restructured Sales Tax
Bonds (Series 2019A-2), 4.784%, 7/1/2058
2,170,987
 
 
TOTAL
7,444,911
 
 
South Carolina—2.4%
 
2,000,000
 
Greenville, SC Health System, Hospital Revenue Bonds
(Series 2014B), 5.000%, 5/1/2034
2,108,407
615,000
 
Greenville, SC Health System, Hospital Revenue Bonds
(Series 2014B), 5.000%, 5/1/2039
647,055
1,500,000
 
South Carolina Jobs-EDA (Prisma Health Obligated Group),
Hospital Revenue Bonds (Series 2018A), 5.000%, 5/1/2048
1,661,543
2,450,000
 
South Carolina State Public Service Authority (Santee Cooper),
Revenue Improvement Bonds (Series 2021B), 4.000%, 12/1/2047
2,570,091
 
 
TOTAL
6,987,096
 
 
Tennessee—1.5%
 
1,335,000
 
Metropolitan Government of Nashville & Davidson County, TN
Health & Educational Facilities Board (Vanderbilt University
Medical Center), Revenue Bonds (Series 2016A),
5.000%, 7/1/2046
1,444,690
Annual Shareholder Report
17

Principal
Amount
 
 
Value
 
 
MUNICIPAL BONDS—continued


Tennessee—continued
 
$1,000,000
 
Metropolitan Nashville Tennessee Airport Authority, Subordinate
Airport Revenue Bonds (Series 2019A), 5.000%, 7/1/2054
$1,118,868
2,000,000
 
Metropolitan Nashville Tennessee Airport Authority, Subordinate
Airport Revenue Bonds (Series 2019B), 4.000%, 7/1/2054
2,035,414
 
 
TOTAL
4,598,972
 
 
Texas—8.6%
 
1,130,000
 
Central Texas Regional Mobility Authority, Senior Lien Revenue
Bonds (Series 2021B), 5.000%, 1/1/2031
1,326,471
2,000,000
 
Dallas, TX Area Rapid Transit, Senior Lien Sales Tax Revenue
Improvement and Refunding Bonds (Series 2021B),
4.000%, 12/1/2051
2,145,201
1,000,000
 
Dallas, TX Area Rapid Transit, Senior Lien Sales Tax Revenue
Improvement and Refunding Bonds (Series 2021B),
5.000%, 12/1/2047
1,170,600
2,225,000
 
Dallas, TX Area Rapid Transit, Senior Lien Sales Tax Revenue
Refunding Bonds (Series 2016A), (United States Treasury PRF
12/1/2025@100), 5.000%, 12/1/2048
2,450,112
2,000,000
 
Harris County, TX Cultural Education Facilities Finance Corp.
(Memorial Hermann Health System), Hospital Revenue Bonds
(Series 2014A), (United States Treasury PRF 12/1/2024@100),
5.000%, 12/1/2029
2,156,345
2,000,000
 
Houston, TX Combined Utility System, First Lien Revenue &
Refunding Bonds (Series 2016B), 4.000%, 11/15/2037
2,125,992
1,000,000
 
Lower Colorado River Authority, TX (LCRA Transmission Services
Corp.), Transmission Contract Refunding Revenue Bonds
(Series 2020A), 5.000%, 5/15/2045
1,145,668
2,000,000
 
Lower Colorado River Authority, TX (LCRA Transmission Services
Corp.), Transmission Contract Refunding Revenue Bonds
(Series 2021A), 5.000%, 5/15/2051
2,297,992
1,330,000
 
North Texas Tollway Authority, Second Tier Revenue Refunding
Bonds (Series 2021B), 4.000%, 1/1/2041
1,421,415
1,500,000
 
San Antonio, TX Electric & Gas System, Revenue Refunding
Bonds (New Series 2015), 5.000%, 2/1/2032
1,649,361
2,000,000
 
San Antonio, TX Electric & Gas System, Revenue Refunding
Bonds (Series 2016), 4.000%, 2/1/2034
2,107,980
2,030,000
 
Texas Municipal Gas Acquisition & Supply Corp. I, Gas Supply
Senior Lien Revenue Bonds (Series 2006A), (Bank of America
Corp. GTD), 5.250%, 12/15/2026
2,264,640
3,000,000
 
Texas Private Activity Bonds Surface Transportation Corporation
(LBJ Infrastructure Group LLC), Senior Lien Revenue Refunding
Bonds I-635 Managed Lanes Project (Series 2020A),
4.000%, 12/31/2039
3,122,239
 
 
TOTAL
25,384,016
Annual Shareholder Report
18

Principal
Amount
 
 
Value
 
 
MUNICIPAL BONDS—continued


Utah—0.7%
 
$2,000,000
 
Salt Lake City, UT Airport Revenue, Airport Revenue Bonds
(Series 2018A), 5.000%, 7/1/2048
$2,185,037
 
 
Virginia—1.0%
 
1,200,000
 
Chesapeake Bay Bridge & Tunnel District, VA, First Tier General
Resolution Revenue Bonds (Series 2016), 5.000%, 7/1/2051
1,288,946
1,500,000
 
Hampton Roads, VA Sanitation District, Subordinate Wastewater
Revenue Bonds (Series 2016A), (United States Treasury PRF
8/1/2026@100), 5.000%, 8/1/2043
1,682,922
 
 
TOTAL
2,971,868
 
 
Washington—4.3%
 
2,000,000
 
Port of Seattle, WA Revenue, Intermediate Lien Revenue Bonds
(Series 2018A), 5.000%, 5/1/2043
2,185,058
1,875,000
1,2
Seattle, WA Municipal Light & Power, Trust Receipts/Certificates
(Series 2019-FG0226A) MUNINVs, 5.880%, 1/1/2046
2,081,645
1,680,000
1,2
Seattle, WA Municipal Light & Power, Trust Receipts/Certificates
(Series 2019-FG0226B) MUNINVs, 5.880%, 1/1/2047
1,862,044
215,000
 
Washington State Health Care Facilities Authority (Providence
St. Joseph Health), Health Care Facilities Revenue Bonds
(Series 2014C), (United States Treasury PRF 10/1/2024@100),
5.000%, 10/1/2044
229,758
1,035,000
 
Washington State Health Care Facilities Authority (Providence
St. Joseph Health), Health Care Facilities Revenue Bonds
(Series 2014C), 5.000%, 10/1/2044
1,093,127
2,070,000
2
Washington State Housing Finance Commission (Rockwood
Retirement Communities), Nonprofit Housing Revenue &
Refunding Revenue Bonds (Series 2020A), 5.000%, 1/1/2041
2,059,874
3,000,000
 
Washington State, UT GO Bonds (Series 2015A-1),
5.000%, 8/1/2040
3,253,817
 
 
TOTAL
12,765,323
 
 
West Virginia—0.8%
 
2,000,000
 
West Virginia State, GO State Road Bonds (Series 2019A),
5.000%, 12/1/2036
2,354,991
 
 
Wisconsin—1.0%
 
800,000
 
Wisconsin Health & Educational Facilities Authority (ProHealth
Care, Inc.), Revenue Refunding Bonds (Series 2015),
5.000%, 8/15/2039
850,017
2,000,000
 
Wisconsin State, UT GO Bonds (Series 2018A), 4.000%, 5/1/2034
2,121,360
 
 
TOTAL
2,971,377
 
 
TOTAL MUNICIPAL BONDS
(IDENTIFIED COST $290,904,695)
290,292,056
Annual Shareholder Report
19

Principal
Amount
 
 
Value
 
1
SHORT-TERM MUNICIPALS—1.1%


Alabama—0.5%
 
$100,000
 
Columbia, AL IDB PCRB (Alabama Power Co.), (Series 2014-B)
Daily VRDNs, 0.380%, 4/1/2022
$100,000
500,000
 
Mobile, AL IDB (Alabama Power Co.), (First Series 2009: Barry
Plant) Daily VRDNs, 0.380%, 4/1/2022
500,000
815,000
 
West Jefferson, AL IDB Solid Waste Disposal (Alabama Power
Co.), (Series 2008) Daily VRDNs, 0.420%, 4/1/2022
815,000
 
 
TOTAL
1,415,000
 
 
Georgia—0.1%
 
350,000
 
Monroe County, GA Development Authority (Gulf Power Co.),
(Series 2019) Daily VRDNs, 0.430%, 4/1/2022
350,000
 
 
Kentucky—0.3%
 
1,000,000
 
Louisville, KY Regional Airport Authority (BT-OH LLC),
(Series 2006A) Daily VRDNs, (United Parcel Service, Inc. GTD),
0.430%, 4/1/2022
1,000,000
 
 
Texas—0.2%
 
500,000
 
Gulf Coast, TX Waste Disposal Authority (Exxon Capital Ventures,
Inc.), (Series 2002) Daily VRDNs, (Exxon Mobil Corp. GTD),
0.400%, 4/1/2022
500,000
 
 
TOTAL SHORT-TERM MUNICIPALS
(IDENTIFIED COST $3,265,000)
3,265,000
 
 
TOTAL INVESTMENT IN SECURITIES
(IDENTIFIED COST $294,169,695)99.1%3
293,557,056
 
 
OTHER ASSETS AND LIABILITIES - NET0.9%4
2,603,054
 
 
TOTAL NET ASSETS100%
$296,160,110
Securities that are subject to the federal alternative minimum tax (AMT) represent 11.9% of the Fund’s portfolio as calculated based upon total market value (unaudited).
1
Current rate and current maturity or next reset date shown for floating rate notes and variable rate notes/demand instruments. Certain variable rate securities are not based on a published reference rate and spread but are determined by the issuer or agent and are based on current market conditions. These securities do not indicate a reference rate and spread in their description above.
2
Denotes a restricted security that either: (a) cannot be offered for public sale without first being registered, or availing of an exemption from registration, under the Securities Act of 1933; or (b) is subject to a contractual restriction on public sales. At March 31, 2022, these restricted securities amounted to $7,716,330, which represented 2.6% of total net assets.
3
The cost of investments for federal tax purposes amounts to $294,164,834.
4
Assets, other than investments in securities, less liabilities. See Statement of Assets and Liabilities.
Note: The categories of investments are shown as a percentage of total net assets at March 31, 2022.
Annual Shareholder Report
20

Various inputs are used in determining the value of the Fund’s investments. These inputs are summarized in the three broad levels listed below:
Level 1quoted prices in active markets for identical securities.
Level 2other significant observable inputs (including quoted prices for similar securities, interest rates, prepayment speeds, credit risk, etc.). Also includes securities valued at amortized cost.
Level 3significant unobservable inputs (including the Fund’s own assumptions in determining the fair value of investments).
The inputs or methodology used for valuing securities are not an indication of the risk associated with investing in those securities.
As of March 31, 2022, all investments of the Fund utilized Level 2 inputs in valuing the Fund’s assets carried at fair value.
The following acronym(s) are used throughout this portfolio:
EDA
Economic Development Authority
FRNs
Floating Rate Notes
GO
General Obligation
GTD
Guaranteed
HFA
Housing Finance Authority
IDA
Industrial Development Authority
IDB
Industrial Development Bond
INS
Insured
LIBOR
London Interbank Offered Rate
MUNINVs
Municipal Inverse Floater
PCRBs
Pollution Control Revenue Bonds
PRF
Pre-refunded
SIFMA
Securities Industry and Financial Markets Association
SOFR
Secured Overnight Financing Rate
TOBs
Tender Option Bonds
UT
Unlimited Tax
VRDNs
Variable Rate Demand Notes
See Notes which are an integral part of the Financial Statements
Annual Shareholder Report
21

Financial HighlightsClass A Shares
(For a Share Outstanding Throughout Each Period)
Year Ended March 31
2022
2021
2020
2019
2018
Net Asset Value, Beginning of Period
$10.79
$10.46
$10.45
$10.35
$10.38
Income From Investment Operations:


Net investment income1
0.23
0.24
0.27
0.29
0.30
Net realized and unrealized gain (loss)
(0.64)
0.38
0.07
0.15
(0.03)
TOTAL FROM INVESTMENT OPERATIONS
(0.41)
0.62
0.34
0.44
0.27
Less Distributions:


Distributions from net investment income
(0.23)
(0.24)
(0.27)
(0.29)
(0.30)
Distributions from net realized gain
(0.11)
(0.05)
(0.06)
(0.05)
TOTAL DISTRIBUTIONS
(0.34)
(0.29)
(0.33)
(0.34)
(0.30)
Net Asset Value, End of Period
$10.04
$10.79
$10.46
$10.45
$10.35
Total Return2
(3.98)%
5.95%
3.22%
4.38%
2.62%
Ratios to Average Net Assets:


Net expenses3
0.83%
0.83%4
0.83%4
0.84%4
0.85%
Net investment income
2.09%
2.28%
2.52%
2.84%
2.87%
Expense waiver/reimbursement5
0.09%
0.10%
0.11%
0.12%
0.10%
Supplemental Data:


Net assets, end of period (000 omitted)
$238,506
$269,587
$264,084
$276,117
$302,904
Portfolio turnover6
18%
27%
9%
21%
26%
1
Per share number has been calculated using the average shares method.
2
Based on net asset value, which does not reflect the sales charge, redemption fee or contingent deferred sales charge, if applicable.
3
Amount does not reflect net expenses incurred by investment companies in which the Fund may invest.
4
The net expense ratio is calculated without reduction for expense offset arrangements. The net expense ratios are 0.83%, 0.83% and 0.84% for the years ended March 31, 2021, 2020 and 2019, respectively, after taking into account these expense reductions.
5
This expense decrease is reflected in both the net expense and net investment income ratios shown above. Amount does not reflect expense waiver/reimbursement recorded by investment companies in which the Fund may invest.
6
Securities that mature are considered sales for purposes of this calculation.
See Notes which are an integral part of the Financial Statements
Annual Shareholder Report
22

Financial HighlightsClass B Shares
(For a Share Outstanding Throughout Each Period)
Year Ended March 31
2022
2021
2020
2019
2018
Net Asset Value, Beginning of Period
$10.80
$10.47
$10.46
$10.36
$10.38
Income From Investment Operations:


Net investment income1
0.15
0.17
0.19
0.21
0.22
Net realized and unrealized gain (loss)
(0.64)
0.37
0.07
0.15
(0.02)
TOTAL FROM INVESTMENT OPERATIONS
(0.49)
0.54
0.26
0.36
0.20
Less Distributions:


Distributions from net investment income
(0.15)
(0.16)
(0.19)
(0.21)
(0.22)
Distributions from net realized gain
(0.11)
(0.05)
(0.06)
(0.05)
TOTAL DISTRIBUTIONS
(0.26)
(0.21)
(0.25)
(0.26)
(0.22)
Net Asset Value, End of Period
$10.05
$10.80
$10.47
$10.46
$10.36
Total Return2
(4.69)%
5.16%
2.45%
3.61%
1.92%
Ratios to Average Net Assets:


Net expenses3
1.58%
1.58%4
1.58%4
1.59%4
1.62%
Net investment income
1.34%
1.55%
1.78%
2.09%
2.09%
Expense waiver/reimbursement5
0.09%
0.10%
0.11%
0.12%
0.08%
Supplemental Data:


Net assets, end of period (000 omitted)
$297
$903
$2,303
$3,499
$4,599
Portfolio turnover6
18%
27%
9%
21%
26%
1
Per share number has been calculated using the average shares method.
2
Based on net asset value, which does not reflect the sales charge, redemption fee or contingent deferred sales charge, if applicable.
3
Amount does not reflect net expenses incurred by investment companies in which the Fund may invest.
4
The net expense ratio is calculated without reduction for expense offset arrangements. The net expense ratios are 1.58%, 1.58% and 1.59% for the years ended March 31, 2021, 2020 and 2019, respectively, after taking into account these expense reductions.
5
This expense decrease is reflected in both the net expense and net investment income ratios shown above. Amount does not reflect expense waiver/reimbursement recorded by investment companies in which the Fund may invest.
6
Securities that mature are considered sales for purposes of this calculation.
See Notes which are an integral part of the Financial Statements
Annual Shareholder Report
23

Financial HighlightsClass C Shares
(For a Share Outstanding Throughout Each Period)
Year Ended March 31
2022
2021
2020
2019
2018
Net Asset Value, Beginning of Period
$10.80
$10.47
$10.46
$10.35
$10.39
Income From Investment Operations:


Net investment income1
0.14
0.16
0.19
0.21
0.22
Net realized and unrealized gain (loss)
(0.63)
0.38
0.07
0.16
(0.04)
TOTAL FROM INVESTMENT OPERATIONS
(0.49)
0.54
0.26
0.37
0.18
Less Distributions:


Distributions from net investment income
(0.15)
(0.16)
(0.19)
(0.21)
(0.22)
Distributions from net realized gain
(0.11)
(0.05)
(0.06)
(0.05)
TOTAL DISTRIBUTIONS
(0.26)
(0.21)
(0.25)
(0.26)
(0.22)
Net Asset Value, End of Period
$10.05
$10.80
$10.47
$10.46
$10.35
Total Return2
(4.69)%
5.16%
2.45%
3.71%
1.73%
Ratios to Average Net Assets:


Net expenses3
1.58%
1.58%4
1.58%4
1.59%4
1.62%
Net investment income
1.34%
1.54%
1.77%
2.09%
2.09%
Expense waiver/reimbursement5
0.09%
0.10%
0.11%
0.12%
0.08%
Supplemental Data:


Net assets, end of period (000 omitted)
$4,827
$6,103
$8,039
$8,675
$14,188
Portfolio turnover6
18%
27%
9%
21%
26%
1
Per share number has been calculated using the average shares method.
2
Based on net asset value, which does not reflect the sales charge, redemption fee or contingent deferred sales charge, if applicable.
3
Amount does not reflect net expenses incurred by investment companies in which the Fund may invest.
4
The net expense ratio is calculated without reduction for expense offset arrangements. The net expense ratios are 1.58%, 1.58% and 1.59% for the years ended March 31, 2021, 2020 and 2019, respectively, after taking into account these expense reductions.
5
This expense decrease is reflected in both the net expense and net investment income ratios shown above. Amount does not reflect expense waiver/reimbursement recorded by investment companies in which the Fund may invest.
6
Securities that mature are considered sales for purposes of this calculation.
See Notes which are an integral part of the Financial Statements
Annual Shareholder Report
24

Financial HighlightsClass F Shares
(For a Share Outstanding Throughout Each Period)
Year Ended March 31
2022
2021
2020
2019
2018
Net Asset Value, Beginning of Period
$10.79
$10.45
$10.45
$10.34
$10.37
Income From Investment Operations:


Net investment income1
0.23
0.24
0.27
0.29
0.30
Net realized and unrealized gain (loss)
(0.64)
0.39
0.06
0.16
(0.03)
TOTAL FROM INVESTMENT OPERATIONS
(0.41)
0.63
0.33
0.45
0.27
Less Distributions:


Distributions from net investment income
(0.23)
(0.24)
(0.27)
(0.29)
(0.30)
Distributions from net realized gain
(0.11)
(0.05)
(0.06)
(0.05)
TOTAL DISTRIBUTIONS
(0.34)
(0.29)
(0.33)
(0.34)
(0.30)
Net Asset Value, End of Period
$10.04
$10.79
$10.45
$10.45
$10.34
Total Return2
(3.98)%
6.06%
3.12%
4.49%
2.62%
Ratios to Average Net Assets:


Net expenses3
0.83%
0.83%4
0.83%4
0.84%4
0.85%
Net investment income
2.09%
2.28%
2.52%
2.84%
2.87%
Expense waiver/reimbursement5
0.09%
0.10%
0.11%
0.12%
0.10%
Supplemental Data:


Net assets, end of period (000 omitted)
$26,716
$28,761
$29,037
$26,586
$27,081
Portfolio turnover6
18%
27%
9%
21%
26%
1
Per share number has been calculated using the average shares method.
2
Based on net asset value, which does not reflect the sales charge, redemption fee or contingent deferred sales charge, if applicable.
3
Amount does not reflect net expenses incurred by investment companies in which the Fund may invest.
4
The net expense ratio is calculated without reduction for expense offset arrangements. The net expense ratios are 0.83%, 0.83% and 0.84% for the years ended March 31, 2021, 2020 and 2019, respectively, after taking into account these expense reductions.
5
This expense decrease is reflected in both the net expense and net investment income ratios shown above. Amount does not reflect expense waiver/reimbursement recorded by investment companies in which the Fund may invest.
6
Securities that mature are considered sales for purposes of this calculation.
See Notes which are an integral part of the Financial Statements
Annual Shareholder Report
25

Financial HighlightsInstitutional Shares
(For a Share Outstanding Throughout Each Period)
 
Year Ended March 31,
Period
Ended
3/31/20181
 
2022
2021
2020
2019
Net Asset Value, Beginning of Period:
$10.75
$10.42
$10.44
$10.34
$10.52
Income From Investment Operations:


Net investment income2
0.25
0.27
0.29
0.32
0.22
Net realized and unrealized gain (loss)
(0.64)
0.38
0.05
0.15
(0.21)
TOTAL FROM INVESTMENT OPERATIONS
(0.39)
0.65
0.34
0.47
0.01
Less Distributions:


Distributions from net investment income
(0.25)
(0.27)
(0.30)
(0.32)
(0.19)
Distributions from net realized gain
(0.11)
(0.05)
(0.06)
(0.05)
TOTAL DISTRIBUTIONS
(0.36)
(0.32)
(0.36)
(0.37)
(0.19)
Net Asset Value, End of Period
$10.00
$10.75
$10.42
$10.44
$10.34
Total Return3
(3.75)%
6.23%
3.18%
4.65%
0.10%
Ratios to Average Net Assets:


Net expenses4
0.58%
0.58%5
0.59%5
0.59%5
0.59%6
Net investment income
2.35%
2.52%
2.75%
3.09%
3.10%6
Expense waiver/reimbursement7
0.09%
0.10%
0.11%
0.12%
0.12%6
Supplemental Data:


Net assets, end of period (000 omitted)
$25,813
$17,562
$13,182
$8,388
$2,150
Portfolio turnover8
18%
27%
9%
21%
26%9
1
Reflects operations for the period July 27, 2017 (date of initial investment) to March 31, 2018.
2
Per share number has been calculated using the average shares method.
3
Based on net asset value. Total returns for periods of less than one year are not annualized.
4
Amount does not reflect net expenses incurred by investment companies in which the Fund may invest.
5
The net expense ratio is calculated without reduction for expense offset arrangements. The net expense ratios are 0.58%, 0.59% and 0.59% for the years ended March 31, 2021, 2020 and 2019, respectively, after taking into account these expense reductions.
6
Computed on annualized basis.
7
This expense decrease is reflected in both the net expense and the net investment income ratios shown above. Amount does not reflect expense waiver/reimbursement recorded by investment companies in which the Fund may invest.
8
Securities that mature are considered sales for purposes of this calculation.
9
Portfolio turnover is calculated at the Fund level. Percentage indicated was calculated for the year ended March 31, 2018.
See Notes which are an integral part of the Financial Statements
Annual Shareholder Report
26

Statement of Assets and Liabilities
March 31, 2022
Assets:
 
 
Investment in securities, at value (identified cost $294,169,695)
 
$293,557,056
Cash
 
70,972
Income receivable
 
3,391,531
Receivable for shares sold
 
200,037
TOTAL ASSETS
 
297,219,596
Liabilities:
 
 
Payable for shares redeemed
$820,301
 
Income distribution payable
48,290
 
Payable for other service fees (Notes 2 and 5)
79,661
 
Payable for portfolio accounting fees
50,481
 
Payable for transfer agent fees
36,455
 
Payable for distribution services fee (Note 5)
3,565
 
Payable for investment adviser fee (Note 5)
2,606
 
Payable for administrative fee (Note 5)
1,193
 
Accrued expenses (Note 5)
16,934
 
TOTAL LIABILITIES
 
1,059,486
Net assets for 29,502,658 shares outstanding
 
$296,160,110
Net Assets Consists of:
 
 
Paid-in capital
 
$297,063,848
Total distributable earnings (loss)
 
(903,738)
TOTAL NET ASSETS
 
$296,160,110
Annual Shareholder Report
27

Statement of Assets and Liabilitiescontinued
Net Asset Value, Offering Price and Redemption Proceeds Per Share:
 
 
Class A Shares:
 
 
Net asset value per share ($238,506,279 ÷ 23,750,590 shares outstanding)
$0.01 par value, 250,000,000 shares authorized
 
$10.04
Offering price per share (100/95.50 of $10.04)
 
$10.51
Redemption proceeds per share
 
$10.04
Class B Shares:
 
 
Net asset value per share ($297,483 ÷ 29,592 shares outstanding)
$0.01 par value, 50,000,000 shares authorized
 
$10.05
Offering price per share
 
$10.05
Redemption proceeds per share (94.50/100 of $10.05)
 
$9.50
Class C Shares:
 
 
Net asset value per share ($4,827,439 ÷ 480,254 shares outstanding)
$0.01 par value, 50,000,000 shares authorized
 
$10.05
Offering price per share
 
$10.05
Redemption proceeds per share (99.00/100 of $10.05)
 
$9.95
Class F Shares:
 
 
Net asset value per share ($26,716,144 ÷ 2,661,137 shares outstanding)
$0.01 par value, 50,000,000 shares authorized
 
$10.04
Offering price per share (100/99.00 of $10.04)
 
$10.14
Redemption proceeds per share (99.00/100 of $10.04)
 
$9.94
Institutional Shares:
 
 
Net asset value per share ($25,812,765 ÷ 2,581,085 shares outstanding)
$0.01 par value, 300,000,000 shares authorized
 
$10.00
Offering price per share
 
$10.00
Redemption proceeds per share
 
$10.00
See Notes which are an integral part of the Financial Statements
Annual Shareholder Report
28

Statement of Operations
Year Ended March 31, 2022
Investment Income:


Interest
 
 
$9,447,370
Dividends
 
 
71,692
TOTAL INCOME
 
 
9,519,062
Expenses:


Investment adviser fee (Note 5)
 
$1,403,019
 
Administrative fee (Note 5)
 
257,355
 
Custodian fees
 
15,889
 
Transfer agent fees
 
196,048
 
Directors’/Trustees’ fees (Note 5)
 
8,740
 
Auditing fees
 
29,901
 
Legal fees
 
10,657
 
Distribution services fee (Note 5)
 
50,694
 
Other service fees (Notes 2 and 5)
 
752,205
 
Portfolio accounting fees
 
128,756
 
Share registration costs
 
88,059
 
Printing and postage
 
26,175
 
Miscellaneous (Note 5)
 
35,803
 
TOTAL EXPENSES
 
3,003,301
 
Waiver and Reimbursement:


Waiver of investment adviser fee (Note 5)
$(296,740)
 
 
Reimbursement of other operating expenses (Note 5)
(1,925)
 
 
TOTAL WAIVER AND REIMBURSEMENT
 
(298,665)
 
Net expenses
 
 
2,704,636
Net investment income
 
 
6,814,426
Realized and Unrealized Gain (Loss) on Investments
and Futures Contracts:


Net realized gain on investments
 
 
2,275,078
Net realized loss on futures contracts
 
 
(32,678)
Net change in unrealized appreciation of investments
 
 
(21,448,084)
Net change in unrealized appreciation of futures contracts
 
 
(103,911)
Net realized and unrealized gain (loss) on investments and
futures contracts
 
 
(19,309,595)
Change in net assets resulting from operations
 
 
$(12,495,169)
See Notes which are an integral part of the Financial Statements
Annual Shareholder Report
29

Statement of Changes in Net Assets
Year Ended March 31
2022
2021
Increase (Decrease) in Net Assets
 
 
Operations:
 
 
Net investment income
$6,814,426
$7,320,160
Net realized gain
2,242,400
3,213,628
Net change in unrealized appreciation/depreciation
(21,551,995)
8,151,122
CHANGE IN NET ASSETS RESULTING FROM OPERATIONS
(12,495,169)
18,684,910
Distributions to Shareholders:
 
 
Class A Shares
(8,366,954)
(7,192,786)
Class B Shares
(13,592)
(28,359)
Class C Shares
(147,752)
(132,121)
Class F Shares
(900,925)
(785,163)
Institutional Shares
(856,761)
(501,560)
CHANGE IN NET ASSETS RESULTING FROM DISTRIBUTIONS
TO SHAREHOLDERS
(10,285,984)
(8,639,989)
Share Transactions:
 
 
Proceeds from sale of shares
47,086,743
35,382,773
Proceeds from shares issued in connection with the tax-free transfer
of assets from Hancock Horizon Louisiana Tax-Free Income Fund and
Hancock Horizon Mississippi Tax-Free Income Fund
17,350,393
Net asset value of shares issued to shareholders in payment of
distributions declared
9,403,590
7,777,105
Cost of shares redeemed
(77,815,778)
(46,933,221)
CHANGE IN NET ASSETS RESULTING FROM
SHARE TRANSACTIONS
(3,975,052)
(3,773,343)
Change in net assets
(26,756,205)
6,271,578
Net Assets:
 
 
Beginning of period
322,916,315
316,644,737
End of period
$296,160,110
$322,916,315
See Notes which are an integral part of the Financial Statements
Annual Shareholder Report
30

Notes to Financial Statements
March 31, 2022
1. ORGANIZATION
Federated Hermes Municipal Bond Fund, Inc. (the “Fund”) is registered under the Investment Company Act of 1940, as amended (the “Act”), as a diversified, open-end management investment company. The Fund offers five classes of shares: Class A Shares, Class B Shares, Class C Shares, Class F Shares and Institutional Shares. All shares of the Fund have equal rights with respect to voting, except on class-specific matters. The investment objective of the Fund is to provide for its shareholders a high level of current income which is exempt from federal regular income tax. Interest income from the Fund’s investments may be subject to the federal AMT for individuals and state and local taxes.
Class B Shares may be purchased through an exchange from the same share class of another Federated Hermes fund but are closed to new accounts, new investors and new purchases by existing shareholders (excluding reinvestment of dividends and capital gains). Class B Shares of the Fund may be exchanged for Class B Shares of any other Federated Hermes fund.
At the close of business on September 24, 2021, the Fund acquired all of the net assets of Hancock Horizon Louisiana Tax-Free Income Fund and Hancock Horizon Mississippi Tax-Free Income Fund (each an “Acquired Fund” or collectively, the “Acquired Funds”), each an open-end investment company in a tax-free reorganization, in exchange for Class A Shares and Institutional Shares of the Fund, pursuant to a plan of reorganization approved by each Acquired Funds’ Shareholders on September 10, 2021. In connection with the acquisition, the Acquired Funds’ Investor Shares were exchanged for Class A Shares of the Fund and the Acquired Funds’ Institutional Shares were exchanged for Institutional Shares of the Fund. The purpose of the transaction was to combine three portfolios with comparable investment objectives and strategies. For financial reporting purposes, assets received and shares issued by the Fund were recorded at fair value; however, the cost basis of the investments received from the Acquired Funds was carried forward to align ongoing reporting of the Fund’s realized and unrealized gains and losses with amounts distributable to shareholders for tax purposes.
For every one share of the Acquired Fund Share Class exchanged, a shareholder received the following shares of the Fund:
Hancock Horizon Fund
Share Class
Exchanged
Fund Shares
Received
Hancock Horizon Louisiana Tax-Free Income Fund
Investor Share
1.600 Class A Shares
 
Institutional Share
1.606 Institutional Shares
Hancock Horizon Mississippi Tax-Free Income Fund
Investor Share
1.554 Class A Shares
 
Institutional Share
1.558 Institutional Shares
Annual Shareholder Report
31

The Fund received net assets from the Acquired Funds as the result of the tax-free reorganization as follows:
Shares of the
Fund Issued
Acquired Funds’
Net Assets
Received
Unrealized
Appreciation+
Net Assets
of the Fund
Immediately
Prior to
Combination
Net Assets
of the Fund
Immediately
After
Combination
1,595,025
$17,350,393
$1,032,259
$320,903,042
$338,253,435
+
Unrealized Appreciation is included in the Acquired Funds Net Assets Received amount shown above.
Assuming the acquisitions had been completed on April 1, 2021, the beginning of the annual reporting period of the Fund, the Fund’s pro forma results of operations for the year ended March 31, 2022, are as follows:
Net investment income
$6,981,681
Net realized and unrealized loss on investments
$(19,278,656)
Net decrease in assets resulting from operations
$(12,296,974)
Because the combined investment portfolios have been managed as a single integrated portfolio since the acquisitions were completed, it is not practicable to separate the amount of revenues and earnings of the Acquired Funds that has been included in the Fund’s Statement of Operations and Statement of Changes in Net Assets, respectively, as of March 31, 2022.
2. SIGNIFICANT ACCOUNTING POLICIES
The following is a summary of significant accounting policies consistently followed by the Fund in the preparation of its financial statements. These policies are in conformity with U.S. generally accepted accounting principles (GAAP).
Investment Valuation
In calculating its net asset value (NAV), the Fund generally values investments as follows:
◾ Fixed-income securities are fair valued using price evaluations provided by a pricing service approved by the Fund’s Board of Directors (the “Directors”).
◾ Shares of other mutual funds or non-exchange-traded investment companies are valued based upon their reported NAVs, or NAV per share practical expedient, as applicable.
◾ Derivative contracts listed on exchanges are valued at their reported settlement or closing price, except that options are valued at the mean of closing bid and asked quotations.
◾ Over-the-counter (OTC) derivative contracts are fair valued using price evaluations provided by a pricing service approved by the Directors.
◾ For securities that are fair valued in accordance with procedures established by and under the general supervision of the Directors, certain factors may be considered such as: the last traded or purchase price of the security, information obtained by contacting the issuer or dealers, analysis of the issuer’s financial statements or other available documents, fundamental analytical data, the nature and duration of restrictions on disposition, the movement of the market in which the security is
Annual Shareholder Report
32

normally traded, public trading in similar securities or derivative contracts of the issuer or comparable issuers, movement of a relevant index, or other factors including but not limited to industry changes and relevant government actions.
If any price, quotation, price evaluation or other pricing source is not readily available when the NAV is calculated, if the Fund cannot obtain price evaluations from a pricing service or from more than one dealer for an investment within a reasonable period of time as set forth in the Fund’s valuation policies and procedures, or if information furnished by a pricing service, in the opinion of the valuation committee (“Valuation Committee”), is deemed not representative of the fair value of such security, the Fund uses the fair value of the investment determined in accordance with the procedures described below. There can be no assurance that the Fund could obtain the fair value assigned to an investment if it sold the investment at approximately the time at which the Fund determines its NAV per share, and the actual value obtained could be materially different.
Fair Valuation Procedures
The Directors have ultimate responsibility for determining the fair value of investments for which market quotations are not readily available. The Directors have appointed a Valuation Committee comprised of officers of the Fund, Federated Investment Management Company (the “Adviser”) and certain of the Adviser’s affiliated companies to assist in determining fair value and in overseeing the calculation of the NAV. The Directors have also authorized the use of pricing services recommended by the Valuation Committee to provide fair value evaluations of the current value of certain investments for purposes of calculating the NAV. The Valuation Committee employs various methods for reviewing third-party pricing-service evaluations including periodic reviews of third-party pricing services’ policies, procedures and valuation methods (including key inputs, methods, models and assumptions), transactional back-testing, comparisons of evaluations of different pricing services and review of price challenges by the Adviser based on recent market activity. In the event that market quotations and price evaluations are not available for an investment, the Valuation Committee determines the fair value of the investment in accordance with procedures adopted by the Directors. The Directors periodically review and approve the fair valuations made by the Valuation Committee and any changes made to the procedures.
Factors considered by pricing services in evaluating an investment include the yields or prices of investments of comparable quality, coupon, maturity, call rights and other potential prepayments, terms and type, reported transactions, indications as to values from dealers and general market conditions. Some pricing services provide a single price evaluation reflecting the bid-side of the market for an investment (a “bid” evaluation). Other pricing services offer both bid evaluations and price evaluations indicative of a price between the prices bid and asked for the investment (a “mid” evaluation). The Fund normally uses bid evaluations for any U.S. Treasury and Agency securities, mortgage-backed securities and municipal securities. The Fund normally uses mid evaluations for any other types of fixed-income securities and any OTC derivative contracts. In the event that market quotations and price evaluations are not available for an investment, the fair value of the investment is determined in accordance with procedures adopted by the Directors.
Annual Shareholder Report
33

Investment Income, Gains and Losses, Expenses and Distributions
Investment transactions are accounted for on a trade-date basis. Realized gains and losses from investment transactions are recorded on an identified-cost basis. Interest income and expenses are accrued daily. Dividend income and distributions to shareholders are recorded on the ex-dividend date. Distributions of net investment income, if any, are declared daily and paid monthly. Non-cash dividends included in dividend income, if any, are recorded at fair value. Amortization/accretion of premium and discount is included in investment income. Investment income, realized and unrealized gains and losses and certain fund-level expenses are allocated to each class based on relative average daily net assets, except that select classes will bear certain expenses unique to those classes. The detail of the total fund expense waiver and reimbursement of $298,665 is disclosed in Note 5. Dividends are declared separately for each class. No class has preferential dividend rights; differences in per share dividend rates are generally due to differences in separate class expenses.
Other Service Fees
The Fund may pay other service fees up to 0.25% of the average daily net assets of the Fund’s Class A Shares, Class B Shares, Class C Shares and Class F Shares to financial intermediaries or to Federated Shareholder Services Company (FSSC) for providing services to shareholders and maintaining shareholder accounts. Subject to the terms described in the Expense Limitation note, FSSC may voluntarily reimburse the Fund for other service fees. For the year ended March 31, 2022, other service fees for the Fund were as follows:
 
Other
Service Fees
Incurred
Class A Shares
$664,301
Class B Shares
1,495
Class C Shares
15,404
Class F Shares
71,005
TOTAL
$752,205
Federal Taxes
It is the Fund’s policy to comply with the Subchapter M provision of the Internal Revenue Code (the “Code”) and to distribute to shareholders each year substantially all of its income. Accordingly, no provision for federal income tax is necessary. As of and during the year ended March 31, 2022, the Fund did not have a liability for any uncertain tax positions. The Fund recognizes interest and penalties, if any, related to tax liabilities as income tax expense in the Statement of Operations. As of March 31, 2022, tax years 2019 through 2022 remain subject to examination by the Fund’s major tax jurisdictions, which include the United States of America, the State of Maryland and the Commonwealth of Pennsylvania.
Annual Shareholder Report
34

When-Issued and Delayed-Delivery Transactions
The Fund may engage in when-issued or delayed-delivery transactions. The Fund records when-issued securities on the trade date and maintains security positions such that sufficient liquid assets will be available to make payment for the securities purchased. Securities purchased on a when-issued or delayed-delivery basis are marked to market daily and begin earning interest on the settlement date. Losses may occur on these transactions due to changes in market conditions or the failure of counterparties to perform under the contract.
Futures Contracts
The Fund purchases and sells financial futures contracts to manage duration and yield curve risks. Upon entering into a financial futures contract with a broker, the Fund is required to deposit with a broker either U.S. government securities or a specified amount of cash, which is shown as due from broker in the Statement of Assets and Liabilities. Futures contracts are valued daily and unrealized gains or losses are recorded in a “variation margin” account. The Fund receives from or pays to the broker a specified amount of cash based upon changes in the variation margin account. When a contract is closed, the Fund recognizes a realized gain or loss. Futures contracts have market risks, including the risk that the change in the value of the contract may not correlate with the changes in the value of the underlying securities. There is minimal counterparty risk to the Fund since futures contracts are exchange-traded and the exchange’s clearing house, as counterparty to all exchange-traded futures contracts, guarantees the futures contracts against default.
At March 31, 2022, the Fund had no outstanding futures contracts.
The average notional value of short futures contracts held by the Fund throughout the period was $1,473,317. This is based on amounts held as of each day throughout the fiscal period.
Restricted Securities
The Fund may purchase securities which are considered restricted. Restricted securities are securities that either: (a) cannot be offered for public sale without first being registered, or being able to take advantage of an exemption from registration, under the Securities Act of 1933; or (b) are subject to contractual restrictions on public sales. In some cases, when a security cannot be offered for public sale without first being registered, the issuer of the restricted security has agreed to register such securities for resale, at the issuer’s expense, either upon demand by the Fund or in connection with another registered offering of the securities. Many such restricted securities may be resold in the secondary market in transactions exempt from registration. Restricted securities may be determined to be liquid under criteria established by the Directors. The Fund will not incur any registration costs upon such resales. The Fund’s restricted securities, like other securities, are priced in accordance with procedures established by and under the general supervision of the Directors.
Annual Shareholder Report
35

Additional information on restricted securities held at March 31, 2022 is as follows:
Security
Acquisition
Date
Acquisition
Cost
Value
California Public Finance Authority (Kendal at Sonoma), Enso
Village Senior Living Revenue Refunding Bonds
(Series 2021A), 5.000%, 11/15/2056
05/27/2021
$350,068
$346,353
Florida Development Finance Corp. (Glenridge on Palmer
Ranch), Senior Living Revenue and Refunding Bonds
(Series 2021), 5.000%, 6/1/2051
05/13/2021
$1,111,712
$1,046,305
Director of the State of Nevada Department of Business and
Industry (Doral Academy of Nevada CS), Charter School
Revenue Bonds (Series 2017A), 5.000%, 7/15/2047
08/31/2017
$308,444
$320,109
Seattle, WA Municipal Light & Power, Trust
Receipts/Certificates (Series 2019-FG0226A) MUNINVs,
5.880%, 1/1/2046
02/01/2019
$1,947,441
$2,081,645
Seattle, WA Municipal Light & Power, Trust
Receipts/Certificates (Series 2019-FG0226B) MUNINVs,
5.880%, 1/1/2047
02/01/2019
$1,743,268
$1,862,044
Washington State Housing Finance Commission (Rockwood
Retirement Communities), Nonprofit Housing Revenue &
Refunding Revenue Bonds (Series 2020A), 5.000%, 1/1/2041
01/14/2021
$2,177,155
$2,059,874
Additional Disclosure Related to Derivative Instruments
The Effect of Derivative Instruments on the Statement of Operations for the Year Ended March 31, 2022
Amount of Realized Gain or (Loss) on Derivatives Recognized in Income
 
Futures
Contracts
Interest rate contracts
$(32,678)
Change in Unrealized Appreciation or (Depreciation) on Derivatives Recognized in Income
 
Futures
Contracts
Interest rate contracts
$(103,911)
Other
The preparation of financial statements in conformity with GAAP requires management to make estimates and assumptions that affect the amounts of assets, liabilities, expenses and revenues reported in the financial statements. Actual results could differ materially from those estimated. The Fund applies investment company accounting and reporting guidance.
Annual Shareholder Report
36

3. CAPITAL STOCK
The following tables summarize capital stock activity:
Year Ended March 31
2022
2021
Class A Shares:
Shares
Amount
Shares
Amount
Shares sold
2,223,727
$23,997,792
1,679,794
$18,010,050
Proceeds from shares issued in connection
with the tax-free transfer of assets from
Hancock Horizon Louisiana Tax-Free Income
Fund and Hancock Horizon Mississippi
Tax-Free Income Fund
310,467
3,387,203
Shares issued to shareholders in payment of
distributions declared
697,579
7,494,379
591,674
6,344,515
Shares redeemed
(4,466,647)
(47,735,973)
(2,536,903)
(27,185,002)
NET CHANGE RESULTING FROM
CLASS A SHARE TRANSACTIONS
(1,234,874)
$(12,856,599)
(265,435)
$(2,830,437)
Year Ended March 31
2022
2021
Class B Shares:
Shares
Amount
Shares
Amount
Shares sold
3,949
$42,916
33
$362
Shares issued to shareholders in payment of
distributions declared
1,258
13,564
2,649
28,349
Shares redeemed
(59,223)
(635,243)
(138,941)
(1,481,905)
NET CHANGE RESULTING FROM
CLASS B SHARE TRANSACTIONS
(54,016)
$(578,763)
(136,259)
$(1,453,194)
Year Ended March 31
2022
2021
Class C Shares:
Shares
Amount
Shares
Amount
Shares sold
180,920
$1,966,626
148,674
$1,582,274
Shares issued to shareholders in payment of
distributions declared
13,373
143,848
11,709
125,597
Shares redeemed
(279,194)
(2,975,156)
(363,183)
(3,895,847)
NET CHANGE RESULTING FROM
CLASS C SHARE TRANSACTIONS
(84,901)
$(864,682)
(202,800)
$(2,187,976)
Year Ended March 31
2022
2021
Class F Shares:
Shares
Amount
Shares
Amount
Shares sold
257,094
$2,757,579
265,319
$2,809,909
Shares issued to shareholders in payment of
distributions declared
83,395
895,467
72,506
777,130
Shares redeemed
(345,826)
(3,725,240)
(448,860)
(4,790,362)
NET CHANGE RESULTING FROM
CLASS F SHARE TRANSACTIONS
(5,337)
$(72,194)
(111,035)
$(1,203,323)
Annual Shareholder Report
37

Year Ended March 31
2022
2021
Institutional Shares:
Shares
Amount
Shares
Amount
Shares sold
1,691,451
$18,321,830
1,212,965
$12,980,178
Proceeds from shares issued in connection with
the tax-free transfer of assets from Hancock
Horizon Louisiana Tax-Free Income Fund and
Hancock Horizon Mississippi Tax-Free
Income Fund
1,284,558
13,963,190
Shares issued to shareholders in payment of
distributions declared
80,232
856,332
46,881
501,514
Shares redeemed
(2,109,104)
(22,744,166)
(891,279)
(9,580,105)
NET CHANGE RESULTING FROM
INSTITUTIONAL SHARE TRANSACTIONS
947,137
$10,397,186
368,567
$3,901,587
NET CHANGE RESULTING FROM
TOTAL FUND SHARE TRANSACTIONS
(431,991)
$(3,975,052)
(346,962)
$(3,773,343)
4. FEDERAL TAX INFORMATION
The accounting treatment of certain items in accordance with income tax regulations may differ from the accounting treatment in accordance with GAAP which may result in permanent differences. In the case of the Fund, such differences primarily result from differing treatments for discount accretion/premium amortization of debt securities acquired in a merger and capital loss carryforwards from merger.
For the year ended March 31, 2022, permanent differences identified and reclassified among the components of net assets were as follows:
Increase (Decrease)
Paid-In Capital
Total Distributable
Earnings (Loss)
$668,560
$(668,560)
Net investment income (loss), net realized gains (losses) and net assets were not affected by the reclassification.
The tax character of distributions as reported on the Statement of Changes in Net Assets for the years ended March 31, 2022 and 2021, was as follows:
 
2022
2021
Tax-exempt income
$6,817,177
$7,238,270
Ordinary income1
$877,440
$352
Long-term capital gains
$2,591,367
$1,400,767
1
For tax purposes, short-term capital gain distributions are considered ordinary income distributions.
Annual Shareholder Report
38

As of March 31, 2022, the components of distributable earnings on a tax-basis were as follows:
Distributions payable
$(13,014)
Undistributed long-term capital gains
$232,348
Net unrealized depreciation
$(607,778)
Capital loss carryforwards
$(515,294)
The difference between book-basis and tax-basis net unrealized appreciation is attributable to differing treatments for discount accretion/premium amortization on debt securities.
At March 31, 2022, the cost of investments for federal tax purposes was $294,164,834. The net unrealized depreciation of investments for federal tax purposes was $607,778. This consists of net unrealized appreciation from investments for those securities having an excess of value over cost of $5,234,996 and net unrealized depreciation from investments for those securities having an excess of cost over value of $5,842,774.
As of March 31, 2022, the Fund had a capital loss carryforward of $515,294 which will reduce the Fund’s taxable income arising from future net realized gains on investments, if any, to the extent permitted by the Code, thereby reducing the amount of distributions to shareholders which would otherwise be necessary to relieve the Fund of any liability for federal income tax. Pursuant to the Code, these net capital losses retain their character as either short-term or long-term and do not expire.
The following schedule summarizes the Fund’s capital loss carryforwards:
Short-Term
Long-Term
Total
$243,159
$272,135
$515,294
5. INVESTMENT ADVISER FEE AND OTHER TRANSACTIONS WITH AFFILIATES
Investment Adviser Fee
The advisory agreement between the Fund and the Adviser provides for an annual fee equal to: (a) 0.30% of the Fund’s average daily net assets; and (b) 4.50% of the gross income of the Fund, excluding capital gains or losses. Subject to the terms described in the Expense Limitation note, the Adviser may voluntarily choose to waive any portion of its fee and/or reimburse certain operating expenses of the Fund for competitive reasons such as to maintain the Fund’s expense ratio, or as and when appropriate, to maintain positive or zero net yields. For the year ended March 31, 2022, the Adviser voluntarily waived $296,740 of its fee and voluntarily reimbursed $1,925 of other operating expenses.
Annual Shareholder Report
39

Administrative Fee
Federated Administrative Services (FAS), under the Administrative Services Agreement, provides the Fund with administrative personnel and services. For purposes of determining the appropriate rate breakpoint, “Investment Complex” is defined as all of the Federated Hermes Funds subject to a fee under the Administrative Services Agreement. The fee paid to FAS is based on the average daily net assets of the Investment Complex as specified below:
Administrative Fee
Average Daily Net Assets
of the Investment Complex
0.100%
on assets up to $50 billion
0.075%
on assets over $50 billion
Subject to the terms described in the Expense Limitation note, FAS may voluntarily choose to waive any portion of its fee. For the year ended March 31, 2022, the annualized fee paid to FAS was 0.079% of average daily net assets of the Fund.
In addition, FAS may charge certain out-of-pocket expenses to the Fund.
Distribution Services Fee
The Fund has adopted a Distribution Plan (the “Plan”) pursuant to Rule 12b-1 under the Act. Under the terms of the Plan, the Fund will compensate Federated Securities Corp. (FSC), the principal distributor, from the daily net assets of the Fund’s Class B Shares and Class C Shares to finance activities intended to result in the sale of these shares. The Plan provides that the Fund may incur distribution expenses at the following percentages of average daily net assets annually, to compensate FSC:
Share Class Name
Percentage of Average Daily
Net Assets of Class
Class B Shares
0.75%
Class C Shares
0.75%
Subject to the terms described in the Expense Limitation note, FSC may voluntarily choose to waive any portion of its fee. For the year ended March 31, 2022, distribution services fees for the Fund were as follows:
 
Distribution Services
Fees Incurred
Class B Shares
$4,483
Class C Shares
46,211
TOTAL
$50,694
When FSC receives fees, it may pay some or all of them to financial intermediaries whose customers purchase shares. For the year ended March 31, 2022, FSC retained $8,684 of fees paid by the Fund.
Annual Shareholder Report
40

Sales Charges
Front-end sales charges and contingent deferred sales charges (CDSC) do not represent expenses of the Fund. They are deducted from the proceeds of sales of Fund shares prior to investment or from redemption proceeds prior to remittance, as applicable. For the year ended March 31, 2022, FSC retained $11,693 in sales charges from the sale of Class A Shares. FSC also retained $177, $1,507 and $2,730 of CDSC relating to redemptions of Class A Shares, Class C Shares and Class F Shares, respectively.
Other Service Fees
For the year ended March 31, 2022, FSSC received $181,863 of the other service fees disclosed in Note 2.
Interfund Transactions
During the year ended March 31, 2022, the Fund engaged in purchase and sale transactions with funds that have a common investment adviser (or affiliated investment advisers), common Directors/Trustees and/or common Officers. These purchase and sale transactions complied with Rule 17a-7 under the Act and amounted to $55,190,000 and $57,460,000, respectively. Net realized gain (loss) recognized on these transactions was $0.
Expense Limitation
The Adviser and certain of its affiliates (which may include FSC, FAS and FSSC) on their own initiative have agreed to waive certain amounts of their respective fees and/or reimburse expenses. Total annual fund operating expenses (as shown in the financial highlights, excluding interest expense, extraordinary expenses and proxy-related expenses paid by the Fund, if any) paid by the Fund’s Class A Shares, Class B Shares, Class C Shares, Class F Shares and Institutional Shares (after the voluntary waivers and reimbursements) will not exceed 0.83%, 1.58%, 1.58%, 0.83% and 0.58% (the “Fee Limit”), respectively, up to but not including the later of (the “Termination Date”): (a) June 1, 2023; or (b) the date of the Fund’s next effective Prospectus. While the Adviser and its applicable affiliates currently do not anticipate terminating or increasing these arrangements prior to the Termination Date, these arrangements may only be terminated or the Fee Limit increased prior to the Termination Date with the agreement of the Directors.
Directors’/Trustees’ and Miscellaneous Fees
Certain Officers and Directors of the Fund are Officers and Directors or Trustees of certain of the above companies. To efficiently facilitate payment, Independent Directors’/Trustees’ fees and certain expenses related to conducting meetings of the Directors/Trustees and other miscellaneous expenses are paid by an affiliate of the Adviser which in due course are reimbursed by the Fund. These expenses related to conducting meetings of the Directors/Trustees and other miscellaneous expenses may be included in Accrued and Miscellaneous Expenses on the Statement of Assets and Liabilities and Statement of Operations, respectively.
Annual Shareholder Report
41

6. Investment TRANSACTIONS
Purchases and sales of investments, excluding long-term U.S. government securities and short-term obligations, for the year ended March 31, 2022, were as follows:
Purchases
$56,362,138
Sales
$75,825,873
7. LINE OF CREDIT
The Fund participates with certain other Federated Hermes Funds, on a several basis, in an up to $500,000,000 unsecured, 364-day, committed, revolving line of credit (LOC) agreement dated June 23, 2021. The LOC was made available to temporarily finance the repurchase or redemption of shares of the Fund, failed trades, payment of dividends, settlement of trades and for other short-term, temporary or emergency general business purposes. The Fund cannot borrow under the LOC if an inter-fund loan is outstanding. The Fund’s ability to borrow under the LOC also is subject to the limitations of the Act and various conditions precedent that must be satisfied before the Fund can borrow. Loans under the LOC are charged interest at a fluctuating rate per annum equal to the highest, on any day, of (a) (i) the federal funds effective rate, (ii) the one month London Interbank Offered Rate (LIBOR), or a replacement rate as appropriate and (iii) 0.0%, plus (b) a margin. Any fund eligible to borrow under the LOC pays its pro rata share of a commitment fee based on the amount of the lenders’ commitment that has not been utilized, quarterly in arrears and at maturity. As of March 31, 2022, the Fund had no outstanding loans. During the year ended March 31, 2022, the Fund did not utilize the LOC.
8. INTERFUND LENDING
Pursuant to an Exemptive Order issued by the Securities and Exchange Commission, the Fund, along with other funds advised by subsidiaries of Federated Hermes, Inc., may participate in an interfund lending program. This program provides an alternative credit facility allowing the Fund to borrow from other participating affiliated funds. As of March 31, 2022, there were no outstanding loans. During the year ended March 31, 2022, the program was not utilized.
9. OTHER MATTERS
An outbreak of respiratory disease caused by a novel coronavirus was first detected in China in late 2019 and subsequently spread globally. As of the date of the issuance of these financial statements, this coronavirus has resulted in closing borders, enhanced health screenings, disruptions to healthcare service preparation and delivery, quarantines, cancellations, and disruptions to supply chains, workflow operations and consumer activity, as well as general concern and uncertainty. The impact of this coronavirus may continue for an extended period of time and has resulted in substantial economic volatility. Health crises caused by outbreaks, such as the coronavirus outbreak, may exacerbate other pre-existing political, social and economic risks. The impact of this outbreak, and other epidemics and pandemics that may arise in the future, could continue to negatively affect the worldwide economy, as well as the economies of individual countries, individual companies, (including certain Fund service providers and issuers of the Fund’s investments), and the markets in general in significant and unforeseen ways. Any such impact could adversely affect the Fund’s performance.
Annual Shareholder Report
42

10. Recent Accounting Pronouncements
In January 2021, the Financial Accounting Standards Board (FASB) issued Accounting Standards Update (ASU) No. 2021-01 “Reference Rate Reform (Topic 848)”. ASU No. 2021-01 updates and clarifies ASU No. 2020-04, which provides optional, temporary relief with respect to the financial reporting of contracts subject to certain types of modifications due to the planned discontinuation of LIBOR and other interbank-offered reference rates. The temporary relief provided by ASU 2021-01 is effective immediately for certain reference rate-related contract modifications that occur through December 31, 2022. Management does not expect ASU 2021-01 to have a material impact on the financial statements.
11. FEDERAL TAX INFORMATION (UNAUDITED)
For the fiscal year ended March 31, 2022, 99.99% of distributions from net investment income is exempt from federal income tax other than the federal AMT.
For the year ended March 31, 2022, the amount of long-term capital gains designated by the Fund was $2,591,367.
Annual Shareholder Report
43

Report of Independent Registered Public Accounting Firm
TO THE SHAREHOLDERS AND BOARD OF DIRECTORS OF FEDERATED Hermes MUNICIPAL BOND FUND, INC.:
Opinion on the Financial Statements
We have audited the accompanying statement of assets and liabilities of Federated Hermes Municipal Bond Fund, Inc. (the “Fund”), including the portfolio of investments, as of March 31, 2022, and the related statement of operations for the year then ended, the statement of changes in net assets for each of the two years in the period then ended, the financial highlights for each of the five years in the period then ended and the related notes (collectively referred to as the “financial statements”). In our opinion, the financial statements present fairly, in all material respects, the financial position of the Fund at March 31, 2022, the results of its operations for the year then ended, the changes in its net assets for each of the two years in the period then ended and its financial highlights for each of the five years in the period then ended, in conformity with U.S. generally accepted accounting principles.
Basis for Opinion
These financial statements are the responsibility of the Fund’s management. Our responsibility is to express an opinion on the Fund’s financial statements based on our audits. We are a public accounting firm registered with the Public Company Accounting Oversight Board (United States) (“PCAOB”) and are required to be independent with respect to the Fund in accordance with the U.S. federal securities laws and the applicable rules and regulations of the Securities and Exchange Commission and the PCAOB.
We conducted our audits in accordance with standards of the PCAOB. Those standards require that we plan and perform the audit to obtain reasonable assurance about whether the financial statements and financial highlights are free of material misstatement, whether due to error or fraud. The Fund is not required to have, nor were we engaged to perform, an audit of the Fund’s internal control over financial reporting. As part of our audits, we are required to obtain an understanding of internal control over financial reporting, but not for the purpose of expressing an opinion on the effectiveness of the Fund’s internal control over financial reporting. Accordingly, we express no such opinion.
Annual Shareholder Report
44

Our audits included performing procedures to assess the risks of material misstatement of the financial statements, whether due to error or fraud, and performing procedures that respond to those risks. Such procedures included examining, on a test basis, evidence regarding the amounts and disclosures in the financial statements. Our procedures included confirmation of securities owned as of March 31, 2022, by correspondence with the custodian and others, or by other appropriate auditing procedures where replies from others were not received. Our audits also included evaluating the accounting principles used and significant estimates made by management, as well as evaluating the overall presentation of the financial statements. We believe that our audits provide a reasonable basis for our opinion.
We have served as the auditor of one or more Federated Hermes investment companies since 1979.
Boston, Massachusetts
May 23, 2022
Annual Shareholder Report
45

Shareholder Expense Example (unaudited)
As a shareholder of the Fund, you incur two types of costs: (1) transaction costs, including sales charges (loads) on purchase or redemption payments; and (2) ongoing costs, including management fees and to the extent applicable, distribution (12b-1) fees and/or other service fees and other Fund expenses. This Example is intended to help you to understand your ongoing costs (in dollars) of investing in the Fund and to compare these costs with the ongoing costs of investing in other mutual funds. It is based on an investment of $1,000 invested at the beginning of the period and held for the entire period from October 1, 2021 to March 31, 2022.
ACTUAL EXPENSES
The first section of the table below provides information about actual account values and actual expenses. You may use the information in this section, together with the amount you invested, to estimate the expenses that you incurred over the period. Simply divide your account value by $1,000 (for example, an $8,600 account value divided by $1,000 = 8.6), then multiply the result by the number in the first section under the heading entitled “Expenses Paid During Period” to estimate the expenses attributable to your investment during this period.
HYPOTHETICAL EXAMPLE FOR COMPARISON PURPOSES
The second section of the table below provides information about hypothetical account values and hypothetical expenses based on the Fund’s actual expense ratio and an assumed rate of return of 5% per year before expenses, which is not the Fund’s actual return. Thus, you should not use the hypothetical account values and expenses to estimate the actual ending account balance or your expenses for the period. Rather, these figures are required to be provided to enable you to compare the ongoing costs of investing in the Fund with other funds. To do so, compare this 5% hypothetical example with the 5% hypothetical examples that appear in the shareholder reports of the other funds.
Annual Shareholder Report
46

Please note that the expenses shown in the table are meant to highlight your ongoing costs only and do not reflect any transaction costs, such as sales charges (loads) on purchase or redemption payments. Therefore, the second section of the table is useful in comparing ongoing costs only, and will not help you determine the relative total costs of owning different funds. In addition, if these transaction costs were included, your costs would have been higher.
 
Beginning
Account Value
10/1/2021
Ending
Account Value
3/31/2022
Expenses Paid
During Period1
Actual:


Class A Shares
$1,000
$945.70
$4.03
Class B Shares
$1,000
$941.40
$7.65
Class C Shares
$1,000
$942.30
$7.65
Class F Shares
$1,000
$945.80
$4.03
Institutional Shares
$1,000
$946.70
$2.81
Hypothetical (assuming a 5% return
before expenses):


Class A Shares
$1,000
$1,020.79
$4.18
Class B Shares
$1,000
$1,017.05
$7.95
Class C Shares
$1,000
$1,017.05
$7.95
Class F Shares
$1,000
$1,020.79
$4.18
Institutional Shares
$1,000
$1,022.04
$2.92
1
Expenses are equal to the Fund’s annualized net expense ratios, multiplied by the average account value over the period, multiplied by 182/365 (to reflect the one-half-year period). The annualized net expense ratios are as follows:
Class A Shares
0.83%
Class B Shares
1.58%
Class C Shares
1.58%
Class F Shares
0.83%
Institutional Shares
0.58%
Annual Shareholder Report
47

Board of Directors and Fund Officers
The Board of Directors is responsible for managing the Fund’s business affairs and for exercising all the Fund’s powers except those reserved for the shareholders. The following tables give information about each Director and the senior officers of the Fund. Where required, the tables separately list Directors who are “interested persons” of the Fund (i.e., “Interested” Directors) and those who are not (i.e., “Independent” Directors). Unless otherwise noted, the address of each person listed is 1001 Liberty Avenue, Pittsburgh, PA 15222-3779. The address of all Independent Directors listed is 4000 Ericsson Drive, Warrendale, PA 15086-7561; Attention: Mutual Fund Board. As of December 31, 2021, the Fund comprised one portfolio(s), and the Federated Hermes Fund Family consisted of 33 investment companies (comprising 102 portfolios). Unless otherwise noted, each Officer is elected annually. Unless otherwise noted, each Director oversees all portfolios in the Federated Hermes Fund Family and serves for an indefinite term. The Fund’s Statement of Additional Information includes additional information about Fund Directors and is available, without charge and upon request, by calling 1-800-341-7400, Option #4.
Interested DIRECTORS Background
Name
Birth Date
Positions Held with Fund
Date Service Began
Principal Occupation(s) for Past Five Years,
Other Directorships Held and Previous Position(s)
J. Christopher Donahue*
Birth Date: April 11, 1949
President and Director
Indefinite Term
Began serving:
December 1986
Principal Occupations: Principal Executive Officer and President of
certain of the Funds in the Federated Hermes Fund Family; Director or
Trustee of the Funds in the Federated Hermes Fund Family; President,
Chief Executive Officer and Director, Federated Hermes, Inc.;
Chairman and Trustee, Federated Investment Management Company;
Trustee, Federated Investment Counseling; Chairman and Director,
Federated Global Investment Management Corp.; Chairman and
Trustee, Federated Equity Management Company of Pennsylvania;
Trustee, Federated Shareholder Services Company; Director,
Federated Services Company.
Previous Positions: President, Federated Investment Counseling;
President and Chief Executive Officer, Federated Investment
Management Company, Federated Global Investment Management
Corp. and Passport Research, Ltd; Chairman, Passport Research, Ltd.
Annual Shareholder Report
48

Name
Birth Date
Positions Held with Fund
Date Service Began
Principal Occupation(s) for Past Five Years,
Other Directorships Held and Previous Position(s)
Thomas R. Donahue*
Birth Date: October 20, 1958
Director
Indefinite Term
Began serving: May 2016
Principal Occupations: Director or Trustee of certain of the funds in
the Federated Hermes Fund Family; Chief Financial Officer, Treasurer,
Vice President and Assistant Secretary, Federated Hermes, Inc.;
Chairman and Trustee, Federated Administrative Services; Chairman
and Director, Federated Administrative Services, Inc.; Trustee and
Treasurer, Federated Advisory Services Company; Director or Trustee
and Treasurer, Federated Equity Management Company of
Pennsylvania, Federated Global Investment Management Corp.,
Federated Investment Counseling, and Federated Investment
Management Company; Director, MDTA LLC; Director, Executive Vice
President and Assistant Secretary, Federated Securities Corp.;
Director or Trustee and Chairman, Federated Services Company and
Federated Shareholder Services Company; and Director and
President, FII Holdings, Inc.
Previous Positions: Director, Federated Hermes, Inc.; Assistant
Secretary, Federated Investment Management Company, Federated
Global Investment Management Company and Passport Research,
LTD; Treasurer, Passport Research, LTD; Executive Vice President,
Federated Securities Corp.; and Treasurer, FII Holdings, Inc.
*
Family relationships and reasons for “interested” status: J. Christopher Donahue and Thomas R. Donahue are brothers. Both are “interested” due to their beneficial ownership of shares of Federated Hermes, Inc. and the positions they hold with Federated Hermes, Inc. and its subsidiaries.
INDEPENDENT DIRECTORS Background
Name
Birth Date
Positions Held with Fund
Date Service Began
Principal Occupation(s) for Past Five Years,
Other Directorships Held, Previous Position(s) and Qualifications
John T. Collins
Birth Date: January 24, 1947
Director
Indefinite Term
Began serving: October 2013
Principal Occupations: Director or Trustee, and Chair of the Board
of Directors or Trustees, of the Federated Hermes Fund Family;
formerly, Chairman and CEO, The Collins Group, Inc. (a private equity
firm) (Retired).
Other Directorships Held: Director, KLX Energy Services Holdings,
Inc. (oilfield services); former Director of KLX Corp. (aerospace).
Qualifications: Mr. Collins has served in several business and financial
management roles and directorship positions throughout his career.
Mr. Collins previously served as Chairman and CEO of The Collins
Group, Inc. (a private equity firm) and as a Director of KLX Corp.
Mr. Collins serves as Chairman Emeriti, Bentley University. Mr. Collins
previously served as Director and Audit Committee Member, Bank of
America Corp.; Director, FleetBoston Financial Corp.; and Director,
Beth Israel Deaconess Medical Center (Harvard University
Affiliate Hospital).
Annual Shareholder Report
49

Name
Birth Date
Positions Held with Fund
Date Service Began
Principal Occupation(s) for Past Five Years,
Other Directorships Held, Previous Position(s) and Qualifications
G. Thomas Hough
Birth Date: February 28, 1955
Director
Indefinite Term
Began serving: August 2015
Principal Occupations: Director or Trustee, Chair of the Audit
Committee of the Federated Hermes Fund Family; formerly, Vice
Chair, Ernst & Young LLP (public accounting firm) (Retired).
Other Directorships Held: Director, Chair of the Audit Committee,
Equifax, Inc.; Lead Director, Member of the Audit and Nominating and
Corporate Governance Committees, Haverty Furniture Companies,
Inc.; formerly, Director, Member of Governance and Compensation
Committees, Publix Super Markets, Inc.
Qualifications: Mr. Hough has served in accounting, business
management and directorship positions throughout his career.
Mr. Hough most recently held the position of Americas Vice Chair of
Assurance with Ernst & Young LLP (public accounting firm). Mr. Hough
serves on the President’s Cabinet and Business School Board of
Visitors for the University of Alabama. Mr. Hough previously served on
the Business School Board of Visitors for Wake Forest University, and
he previously served as an Executive Committee member of the
United States Golf Association.
Maureen Lally-Green
Birth Date: July 5, 1949
Director
Indefinite Term
Began serving: August 2009
Principal Occupations: Director or Trustee of the Federated Hermes
Fund Family; Adjunct Professor Emerita of Law, Duquesne University
School of Law; formerly, Dean of the Duquesne University School of
Law and Professor of Law and Interim Dean of the Duquesne
University School of Law; formerly, Associate General Secretary and
Director, Office of Church Relations, Diocese of Pittsburgh.
Other Directorships Held: Director, CNX Resources Corporation
(formerly known as CONSOL Energy Inc.).
Qualifications: Judge Lally-Green has served in various legal and
business roles and directorship positions throughout her career. Judge
Lally-Green previously held the position of Dean of the School of Law
of Duquesne University (as well as Interim Dean). Judge Lally-Green
previously served as a member of the Superior Court of Pennsylvania
and as a Professor of Law, Duquesne University School of Law. Judge
Lally-Green was appointed by the Supreme Court of Pennsylvania to
serve on the Supreme Court’s Board of Continuing Judicial Education
and the Supreme Court’s Appellate Court Procedural Rules
Committee. Judge Lally-Green also currently holds the positions on
not for profit or for profit boards of directors as follows: Director
and Chair, UPMC Mercy Hospital; Regent, Saint Vincent Seminary;
Member, Pennsylvania State Board of Education (public); Director,
Catholic Charities, Pittsburgh; and Director CNX Resources
Corporation (formerly known as CONSOL Energy Inc.). Judge
Lally-Green has held the positions of: Director, Auberle; Director,
Epilepsy Foundation of Western and Central Pennsylvania; Director,
Ireland Institute of Pittsburgh; Director, Saint Thomas More Society;
Director and Chair, Catholic High Schools of the Diocese of
Pittsburgh, Inc.; Director, Pennsylvania Bar Institute; Director,
St. Vincent College; Director and Chair, North Catholic High
School, Inc.; Director and Vice Chair, Our Campaign for the Church
Alive!, Inc.; and Director, Saint Francis University.
Annual Shareholder Report
50

Name
Birth Date
Positions Held with Fund
Date Service Began
Principal Occupation(s) for Past Five Years,
Other Directorships Held, Previous Position(s) and Qualifications
Thomas M. O’Neill
Birth Date: June 14, 1951
Director
Indefinite Term
Began serving: August 2006
Principal Occupations: Director or Trustee of the Federated Hermes
Fund Family; Sole Proprietor, Navigator Management Company
(investment and strategic consulting).
Other Directorships Held: None.
Qualifications: Mr. O’Neill has served in several business, mutual fund
and financial management roles and directorship positions throughout
his career. Mr. O’Neill serves as Director, Medicines for Humanity.
Mr. O’Neill previously served as Chief Executive Officer and President,
Managing Director and Chief Investment Officer, Fleet Investment
Advisors; President and Chief Executive Officer, Aeltus Investment
Management, Inc.; General Partner, Hellman, Jordan Management
Co., Boston, MA; Chief Investment Officer, The Putnam Companies,
Boston, MA; Credit Analyst and Lending Officer, Fleet Bank; Director
and Consultant, EZE Castle Software (investment order management
software); Director, The Golisano Children’s Museum of Naples,
Florida; and Director, Midway Pacific (lumber).
Madelyn A. Reilly
Birth Date: February 2, 1956
Director
Indefinite Term
Began serving:
November 2020
Principal Occupations: Director or Trustee of the Federated Hermes
Fund Family; formerly, Senior Vice President for Legal Affairs, General
Counsel and Secretary to the Board of Directors, Duquesne University.
Other Directorships Held: None.
Qualifications: Ms. Reilly has served in various business and legal
management roles throughout her career. Ms. Reilly previously served
as Senior Vice President for Legal Affairs, General Counsel and
Secretary to the Board of Directors and Assistant General Counsel and
Director of Risk Management, Duquesne University. Prior to her work
at Duquesne University, Ms. Reilly served as Assistant General
Counsel of Compliance and Enterprise Risk as well as Senior Counsel
of Environment, Health and Safety, PPG Industries.
P. Jerome Richey
Birth Date: February 23, 1949
Director
Indefinite Term
Began serving: October 2013
Principal Occupations: Director or Trustee of the Federated Hermes
Fund Family; Management Consultant; Retired; formerly, Senior Vice
Chancellor and Chief Legal Officer, University of Pittsburgh and
Executive Vice President and Chief Legal Officer, CONSOL Energy Inc.
(now split into two separate publicly traded companies known as
CONSOL Energy Inc. and CNX Resources Corp.).
Other Directorships Held: None.
Qualifications: Mr. Richey has served in several business and legal
management roles and directorship positions throughout his career.
Mr. Richey most recently held the positions of Senior Vice Chancellor
and Chief Legal Officer, University of Pittsburgh. Mr. Richey previously
served as Chairman of the Board, Epilepsy Foundation of Western
Pennsylvania and Chairman of the Board, World Affairs Council of
Pittsburgh. Mr. Richey previously served as Chief Legal Officer and
Executive Vice President, CONSOL Energy Inc. and CNX Gas
Company; and Board Member, Ethics Counsel and Shareholder,
Buchanan Ingersoll & Rooney PC (a law firm).
Annual Shareholder Report
51

Name
Birth Date
Positions Held with Fund
Date Service Began
Principal Occupation(s) for Past Five Years,
Other Directorships Held, Previous Position(s) and Qualifications
John S. Walsh
Birth Date:
November 28, 1957
Director
Indefinite Term
Began serving: January 1999
Principal Occupations: Director or Trustee of the Federated Hermes
Fund Family; President and Director, Heat Wagon, Inc. (manufacturer
of construction temporary heaters); President and Director,
Manufacturers Products, Inc. (distributor of portable construction
heaters); President, Portable Heater Parts, a division of Manufacturers
Products, Inc.
Other Directorships Held: None.
Qualifications: Mr. Walsh has served in several business management
roles and directorship positions throughout his career. Mr. Walsh
previously served as Vice President, Walsh & Kelly, Inc.
(paving contractors).
OFFICERS
Name
Birth Date
Positions Held with Fund
Date Service Began
Principal Occupation(s) for Past Five Years
and Previous Position(s)
Lori A. Hensler
Birth Date: January 6, 1967
TREASURER
Officer since: April 2013
Principal Occupations: Principal Financial Officer and Treasurer of the
Federated Hermes Fund Family; Senior Vice President, Federated
Administrative Services; Financial and Operations Principal for
Federated Securities Corp.; and Assistant Treasurer, Federated
Investors Trust Company. Ms. Hensler has received the Certified
Public Accountant designation.
Previous Positions: Controller of Federated Hermes, Inc.; Senior Vice
President and Assistant Treasurer, Federated Investors Management
Company; Treasurer, Federated Investors Trust Company; Assistant
Treasurer, Federated Administrative Services, Federated
Administrative Services, Inc., Federated Securities Corp., Edgewood
Services, Inc., Federated Advisory Services Company, Federated
Equity Management Company of Pennsylvania, Federated Global
Investment Management Corp., Federated Investment Counseling,
Federated Investment Management Company, Passport Research,
Ltd., and Federated MDTA, LLC; Financial and Operations Principal for
Federated Securities Corp., Edgewood Services, Inc. and Southpointe
Distribution Services, Inc.
Annual Shareholder Report
52

Name
Birth Date
Positions Held with Fund
Date Service Began
Principal Occupation(s) for Past Five Years
and Previous Position(s)
Peter J. Germain
Birth Date:
September 3, 1959
CHIEF LEGAL OFFICER,
SECRETARY and EXECUTIVE
VICE PRESIDENT
Officer since: January 2005
Principal Occupations: Mr. Germain is Chief Legal Officer, Secretary
and Executive Vice President of the Federated Hermes Fund Family.
He is General Counsel, Chief Legal Officer, Secretary and Executive
Vice President, Federated Hermes, Inc.; Trustee and Senior Vice
President, Federated Investors Management Company; Trustee and
President, Federated Administrative Services; Director and President,
Federated Administrative Services, Inc.; Director and Vice President,
Federated Securities Corp.; Director and Secretary, Federated Private
Asset Management, Inc.; Secretary, Federated Shareholder Services
Company; and Secretary, Retirement Plan Service Company of
America. Mr. Germain joined Federated Hermes, Inc. in 1984 and is a
member of the Pennsylvania Bar Association.
Previous Positions: Deputy General Counsel, Special Counsel,
Managing Director of Mutual Fund Services, Federated Hermes, Inc.;
Senior Vice President, Federated Services Company; and Senior
Corporate Counsel, Federated Hermes, Inc.
Stephen Van Meter
Birth Date: June 5, 1975
CHIEF COMPLIANCE
OFFICER AND SENIOR VICE
PRESIDENT
Officer since: July 2015
Principal Occupations: Senior Vice President and Chief Compliance
Officer of the Federated Hermes Fund Family; Vice President and
Chief Compliance Officer of Federated Hermes, Inc. and Chief
Compliance Officer of certain of its subsidiaries. Mr. Van Meter joined
Federated Hermes, Inc. in October 2011. He holds FINRA licenses
under Series 3, 7, 24 and 66.
Previous Positions: Mr. Van Meter previously held the position of
Compliance Operating Officer, Federated Hermes, Inc. Prior to joining
Federated Hermes, Inc., Mr. Van Meter served at the United States
Securities and Exchange Commission in the positions of Senior
Counsel, Office of Chief Counsel, Division of Investment Management
and Senior Counsel, Division of Enforcement.
Robert J. Ostrowski
Birth Date: April 26, 1963
Chief Investment Officer
Officer since: February 2010
Principal Occupations: Robert J. Ostrowski joined Federated Hermes,
Inc. in 1987 as an Investment Analyst and became a Portfolio Manager
in 1990. He was named Chief Investment Officer of Federated
Hermes’ taxable fixed-income products in 2004 and also serves as a
Senior Portfolio Manager. Mr. Ostrowski became an Executive Vice
President of the Fund’s Adviser in 2009 and served as a Senior Vice
President of the Fund’s Adviser from 1997 to 2009. Mr. Ostrowski has
received the Chartered Financial Analyst designation. He received his
M.S. in Industrial Administration from Carnegie Mellon University.
Annual Shareholder Report
53

Evaluation and Approval of Advisory ContractMay 2021
Federated Hermes Municipal Bond Fund, Inc. (the “Fund”)
At its meetings in May 2021 (the “May Meetings”), the Fund’s Board of Directors (the “Board”), including those Directors who are not “interested persons” of the Fund, as defined in the Investment Company Act of 1940 (the “Independent Directors”), reviewed and unanimously approved the continuation of the investment advisory contract between the Fund and Federated Investment Management Company (the “Adviser”) (the “Contract”) for an additional one-year term. The Board’s determination to approve the continuation of the Contract reflects the exercise of its business judgment after considering all of the information and factors believed to be relevant and appropriate on whether to approve the continuation of the existing arrangement. The information, factors and conclusions that formed the basis for the Board’s approval are summarized below.
Information Received and Review Process
At the request of the Independent Directors, the Fund’s Chief Compliance Officer (the “CCO”) furnished to the Board in advance of its May Meetings an independent written evaluation presenting on the topics discussed below. The Board considered the CCO’s independent written evaluation (the “CCO Fee Evaluation Report”), along with other information, in evaluating the reasonableness of the Fund’s management fee and in determining to approve the continuation of the Contract. The CCO, in preparing the CCO Fee Evaluation Report, has the authority to retain consultants, experts or staff as reasonably necessary to assist in the performance of his duties, reports directly to the Board, and can be terminated only with the approval of a majority of the Independent Directors. At the request of the Independent Directors, the CCO Fee Evaluation Report followed the same general approach and covered the same topics as that of the report that had previously been delivered by the CCO in his capacity as “Senior Officer” prior to the elimination of the Senior Officer position in December 2017.
In addition to the extensive materials that comprise and accompany the CCO Fee Evaluation Report, the Board considered information specifically prepared in connection with the approval of the continuation of the Contract that was presented at the May Meetings. In this regard, in the months preceding the May Meetings, the Board requested and reviewed written responses and supporting materials prepared by the Adviser and its affiliates (collectively, “Federated Hermes”) in response to requests posed to Federated Hermes on behalf of the Independent Directors encompassing a wide variety of topics, including those summarized below. The Board also considered such additional
Annual Shareholder Report
54

matters as the Independent Directors deemed reasonably necessary to evaluate the Contract, which included detailed information about the Fund and Federated Hermes furnished to the Board at its meetings throughout the year and in between regularly scheduled meetings on particular matters as the need arose.
The Board’s consideration of the Contract included review of materials and information covering the following matters, among others: the Adviser’s investment philosophy, revenue, profitability, personnel and processes; investment and operating strategies; the Fund’s short-term and long-term performance (in absolute terms, both on a gross basis and net of expenses, and relative to the Fund’s particular investment program and a group of its peer funds and/or its benchmark, as appropriate) and comments on the reasons for the Fund’s performance; the Fund’s investment objectives; the Fund’s expenses, including the advisory fee and the overall expense structure of the Fund (both in absolute terms and relative to a group of its peer funds), with due regard for contractual or voluntary expense limitations (if any); the use and allocation of brokerage commissions derived from trading the Fund’s portfolio securities (if any); and the nature, quality and extent of the advisory and other services provided to the Fund by the Adviser and its affiliates. The Board also considered the preferences and expectations of Fund shareholders; the entrepreneurial and other risks assumed by the Adviser in sponsoring and managing the Fund; the continuing state of competition in the mutual fund industry and market practices; the range of comparable fees for similar funds in the mutual fund industry; the Fund’s relationship to the other funds advised by Federated Hermes (each, a “Federated Hermes Fund” and, collectively, the “Federated Hermes Funds”), which include a comprehensive array of funds with different investment objectives, policies and strategies, and the benefits to shareholders of being part of the family of Federated Hermes Funds, which include the general right to exchange investments between the same class of shares without the incurrence of additional sales charges; compliance and audit reports concerning the Federated Hermes Funds and Federated Hermes’ affiliates that service them (including communications from regulatory agencies), as well as Federated Hermes’ responses to any issues raised therein; and relevant developments in the mutual fund industry and how the Federated Hermes Funds and/or Federated Hermes may be responding to them. The Board noted that its evaluation process is evolutionary and that the criteria considered and the emphasis placed on relevant criteria may change in recognition of changing circumstances in the mutual fund marketplace.
The Board also considered judicial decisions concerning allegedly excessive investment advisory fees in determining to approve the Contract. Using these judicial decisions as a guide, the Board observed that the following factors may be relevant to an adviser’s fiduciary duty with respect to its receipt of compensation from a fund: (1) the nature and quality of the services provided by an adviser to a fund and its shareholders (including the performance of the
Annual Shareholder Report
55

fund, its benchmark, and comparable funds); (2) an adviser’s cost of providing the services (including the profitability to an adviser of providing advisory services to a fund); (3) the extent to which an adviser may realize “economies of scale” as a fund grows larger and, if such economies of scale exist, whether they have been appropriately shared with a fund and its shareholders or the family of funds; (4) any “fall-out” benefits that accrue to an adviser because of its relationship with a fund (including research services received from brokers that execute fund trades and any fees paid to affiliates of an adviser for services rendered to a fund); (5) comparative fee and expense structures (including a comparison of fees paid to an adviser with those paid by similar funds both internally and externally as well as management fees charged to institutional and other advisory clients of the adviser for what might be viewed as like services); and (6) the extent of care, conscientiousness and independence with which the fund’s board members perform their duties and their expertise (including whether they are fully informed about all facts the board deems relevant to its consideration of an adviser’s services and fees). The Board noted that the Securities and Exchange Commission (“SEC”) disclosure requirements regarding the basis for a fund board’s approval of the fund’s investment advisory contract generally align with the factors listed above. The Board was guided by these factors in its review of the Contract to the extent it considered them to be appropriate and relevant, as discussed further below. The Board considered and weighed these factors in light of its substantial accumulated experience in governing the Fund and working with Federated Hermes on matters relating to the Federated Hermes Funds.
In addition to considering the above-referenced factors, the Board was mindful of the potential disruptions of the Fund’s operations and various risks, uncertainties and other effects that could occur as a result of a decision to terminate or not renew the Contract. In particular, the Board recognized that many shareholders have invested in the Fund on the strength of Federated Hermes’ industry standing and reputation and with the expectation that Federated Hermes will have a continuing role in providing advisory services to the Fund. Thus, the Board observed that in the marketplace there are a range of investment options available to the Fund’s shareholders and such shareholders, having had the opportunity to consider other investment options, have effectively selected Federated Hermes by virtue of investing in the Fund.
In determining to approve the continuation of the Contract, the members of the Board reviewed and evaluated information and factors they believed to be relevant and appropriate through the exercise of their reasonable business judgment. While individual members of the Board may have weighed certain factors differently, the Board’s determination to approve the continuation of the Contract was based on a comprehensive consideration of all information provided to the Board throughout the year and specifically with respect to the continuation of the Contract. The Independent Directors were assisted throughout the evaluation process by independent legal counsel. In connection
Annual Shareholder Report
56

with their deliberations at the May Meetings, the Independent Directors met separately in executive session with their independent legal counsel and without management present to review the relevant materials and consider their responsibilities under applicable laws. In addition, senior management representatives of Federated Hermes also met with the Independent Directors and their independent legal counsel to discuss the materials and presentations furnished to the Board at the May Meetings. The Board considered the approval of the Contract for the Fund as part of its consideration of agreements for funds across the Federated Hermes Funds family, but its approvals were made on a fund-by-fund basis.
Nature, Extent and Quality of Services
The Board considered the nature, extent and quality of the services provided to the Fund by the Adviser and the resources of the Adviser and its affiliates dedicated to the Fund. In this regard, the Board evaluated, among other things, the terms of the Contract and the range of services provided to the Fund by the Adviser and its affiliates. The Board considered the Adviser’s personnel, investment philosophy and process, investment research capabilities and resources, trade execution capabilities, experience and performance track record. The Board reviewed the qualifications, backgrounds and responsibilities of the portfolio management team primarily responsible for the day-to-day management of the Fund and the Adviser’s ability and experience in attracting and retaining qualified personnel to service the Fund. The Fund’s ability to deliver competitive performance when compared to its Performance Peer Group (as defined below) was also deemed to be relevant by the Board as a useful indicator of how the Adviser is executing the Fund’s investment program.
In addition, the Board considered the financial resources and overall reputation of Federated Hermes and its willingness to consider and make investments in personnel, infrastructure, technology, cybersecurity, business continuity planning and operational enhancements that are designed to benefit the Federated Hermes Funds. The Board noted the significant acquisition of Hermes Fund Managers Limited by Federated Hermes in 2018, which has deepened the organization’s investment management expertise and capabilities and expanded the investment process for all of the Federated Hermes Funds to have access to analytical resources related to environmental, social and governance (“ESG”) factors and issuer engagement on ESG matters.
The Board considered the quality of the Adviser’s communications with the Board and responsiveness to Board inquiries and requests made from time to time with respect to the Fund and other Federated Hermes Funds. In this regard, the Board took into account the Adviser’s communications with the Board in light of the market volatility amidst the pandemic. The Board also considered that Federated Hermes is responsible for providing the Federated Hermes Funds’ officers.
Annual Shareholder Report
57

The Board received and evaluated information regarding the Adviser’s regulatory and compliance environment. The Board considered the Adviser’s compliance program, compliance history, and reports from the CCO about the Adviser’s compliance with applicable laws and regulations, including responses to regulatory developments and any compliance or other issues raised by regulatory agencies. The Board also noted Federated Hermes’ support of the Federated Hermes Funds’ compliance control structure and, in particular, the compliance-related resources devoted by the Adviser and its affiliates in support of the Fund’s obligations pursuant to Rule 38a-1 under the Investment Company Act of 1940, including the Adviser’s commitment to respond to rulemaking and other regulatory initiatives of the SEC. The Board considered Federated Hermes’ day-to-day oversight of the Federated Hermes Funds’ compliance with their investment objectives and policies as well as with applicable laws and regulations, noting that regulatory and other developments had over time led to an increase in the scope of Federated Hermes’ oversight in this regard, including in connection with the designation of the Federated Hermes Funds’ investment advisers as the administrators of the Federated Hermes Funds’ liquidity risk management program.
The Board also considered discussions with Federated Hermes regarding the implementation of its business continuity plans and recognized steps taken by Federated Hermes to continue to provide the same nature, extent and quality of services to the Federated Hermes Funds during the pandemic. In addition, the Board noted Federated Hermes’ commitment to maintaining high quality systems and expending substantial resources to prepare for and respond to ongoing changes due to the market, regulatory and control environments in which the Fund and its service providers operate, including changes associated with the pandemic.
Based on these considerations, the Board concluded that the nature, extent and quality of the Adviser’s investment management and related services warrant the continuation of the Contract.
Fund Investment Performance
In evaluating the Fund’s investment performance, the Board considered performance results in light of the Fund’s investment objective, strategies and risks, as disclosed in the Fund’s prospectus. The Board also considered detailed investment reports on, and the Adviser’s analysis of, the Fund’s performance over different time periods that were provided to the Board throughout the year and in connection with the May Meetings. These reports include, among other items, information on the Fund’s gross and net returns, the Fund’s investment performance compared to one or more relevant investment categories and the Fund’s benchmark index, portfolio attribution information and commentary on the effect of current and recent market conditions.
Annual Shareholder Report
58

The Board also reviewed comparative information regarding the performance of other mutual funds in the category of peer funds selected by Morningstar, Inc. (the “Morningstar”), an independent fund ranking organization (the “Performance Peer Group”), noting the CCO’s view that comparisons to fund peer groups may be helpful, though not conclusive, in evaluating the performance of the Adviser in managing the Fund. The Board considered, in evaluating such comparisons, that in some cases there may be differences in the funds’ objectives or investment management techniques, or the costs to implement the funds, even within the same Performance Peer Group.
The Fund’s performance fell below the median of the Performance Peer Group for the one-year, three-year and five-year periods ended December 31, 2020. The Board discussed the Fund’s performance with the Adviser and recognized the efforts being taken by the Adviser in the context of other factors considered relevant by the Board.
Following such evaluation and full deliberations, the Board concluded that the performance of the Fund supported renewal of the Contract.
Fund Expenses
The Board considered the advisory fee and overall expense structure of the Fund and the comparative fee and expense information that had been provided in connection with the May Meetings. In this regard, the Board was presented with, and considered, information regarding the contractual advisory fee rates, net advisory fee rates, total expense ratios and each element of the Fund’s total expense ratio (i.e., gross and net advisory fees, administrative fees, custody fees, portfolio accounting fees and transfer agency fees) relative to an appropriate group of peer funds compiled by Federated Hermes from the category of peer funds selected by Morningstar (the “Expense Peer Group”). The Board received a description of the methodology used to select the Expense Peer Group from the overall Morningstar category. The Board also reviewed comparative information regarding the fees and expenses of the broader group of funds in the overall Morningstar category.
While mindful that courts have cautioned against giving too much weight to comparative information concerning fees charged by other advisers for managing funds with comparable investment programs, the Board noted that it found the use of such comparisons to be relevant to its deliberations. The Board focused on comparisons with other similar mutual funds more heavily than non-mutual fund products or services because such comparisons are believed to be more relevant. The Board considered that other mutual funds are the products most like the Fund, in that they are readily available to Fund shareholders as alternative investment vehicles, and they are the type of
Annual Shareholder Report
59

investment vehicle, in fact, chosen and maintained by the Fund’s shareholders. The Board noted that the range of such other mutual funds’ fees and expenses, therefore, appears to be a relevant indicator of what consumers have found to be reasonable in the marketplace in which the Fund competes.
The Board reviewed the contractual advisory fee rate, net advisory fee rate and other expenses of the Fund and noted the position of the Fund’s fee rates relative to its Expense Peer Group. In this regard, the Board noted that the contractual advisory fee rate was above the median of the Expense Peer Group, but the Board noted the applicable waivers and reimbursements, and that the overall expense structure of the Fund remained competitive in the context of other factors considered by the Board.
The Board also received and considered information about the fees charged by Federated Hermes for providing advisory services to other types of clients with investment strategies similar to those of the Federated Hermes Funds, including non-mutual fund clients (such as institutional separate accounts) and third-party unaffiliated mutual funds for which the Adviser or its affiliates serve as sub-adviser. The Board noted the CCO’s conclusion that non-mutual fund clients are inherently different products due to the following differences, among others: (i) different types of targeted investors; (ii) different applicable laws and regulations; (iii) different legal structures; (iv) different average account sizes and portfolio management techniques made necessary by different cash flows and different associated costs; (v) the time spent by portfolio managers and their teams (among other personnel across various departments, including legal, compliance and risk management) in reviewing securities pricing, addressing different administrative responsibilities, and addressing different degrees of risk associated with management; and (vi) a variety of different costs. The Board also considered information regarding the differences in the nature of the services required for Federated Hermes to manage its proprietary mutual fund business versus managing a discrete pool of assets as a sub-adviser to another institution’s mutual fund, noting the CCO’s view that Federated Hermes generally performs significant additional services and assumes substantially greater risks in managing the Fund and other Federated Hermes Funds than in its role as sub-adviser to an unaffiliated third-party mutual fund. The Board noted that the CCO did not consider the fees for providing advisory services to other types of clients to be determinative in judging the appropriateness of the Federated Hermes Funds’ advisory fees.
Following such evaluation and full deliberations, the Board concluded that the fees and expenses of the Fund are reasonable and supported renewal of the Contract.
Annual Shareholder Report
60

Profitability and Other Benefits
The Board also received financial information about Federated Hermes, including information regarding the compensation and ancillary (or “fall-out”) benefits that Federated Hermes derived from its relationships with the Federated Hermes Funds. This information covered not only the fees under the Federated Hermes Funds’ investment advisory contracts, but also fees received by Federated Hermes’ affiliates for providing other services to the Federated Hermes Funds under separate contracts (e.g., for serving as the Federated Hermes Funds’ administrator and distributor). In this regard, the Board considered that certain of Federated Hermes’ affiliates provide distribution and shareholder services to the Federated Hermes Funds, for which they may be compensated through distribution and servicing fees paid pursuant to Rule 12b-1 plans or otherwise. The Board also received and considered information detailing any indirect benefit that Federated Hermes may derive from its receipt of research services from brokers who execute portfolio trades for the Federated Hermes Funds. In addition, the Board considered that, in order for the Federated Hermes Funds to remain competitive in the marketplace, the Adviser and its affiliates frequently waived fees and/or reimbursed expenses and have disclosed to Federated Hermes Fund shareholders and/or reported to the Board their intention to do so (or continue to do so) in the future. Moreover, the Board received and considered regular reports from Federated Hermes throughout the year as to the institution, adjustment or elimination of these voluntary waivers and/or reimbursements.
The Board received and considered information furnished by Federated Hermes, as requested by the CCO, that reported revenues on a fund-by-fund basis and made estimates of the allocation of expenses on a fund-by-fund basis, using allocation methodologies specified by the CCO and described to the Board. The Board considered the CCO’s view that, while these cost allocation reports apply consistent allocation processes, the inherent difficulties in allocating costs continues to cause the CCO to question the precision of the process and to conclude that such reports may be unreliable because a single change in an allocation estimate may dramatically alter the resulting estimate of cost and/or profitability of a Federated Hermes Fund and may produce unintended consequences. The allocation information, including the CCO’s view that cost allocations on a fund-by-fund basis may be unreliable, was considered in the evaluation by the Board. In addition, the Board considered the CCO’s view that the allocation methodologies used by Federated Hermes in estimating profitability for purposes of reporting to the Board in connection with the continuation of the Contract are consistent with the methodologies previously reviewed by an independent consultant. The Board noted that the independent consultant had previously conducted a review of the allocation methodologies and reported that, although there is no single best method to allocate expenses, the methodologies used by Federated Hermes are reasonable.
Annual Shareholder Report
61

The Board also reviewed information compiled by Federated Hermes comparing its profitability information to other publicly held fund management companies, including information regarding profitability trends over time. The Board considered the CCO’s conclusion that, based on such profitability information, Federated Hermes’ profit margins did not appear to be excessive. The Board also considered the CCO’s view that Federated Hermes appeared financially sound, with the resources necessary to fulfill its obligations under its contracts with the Federated Hermes Funds.
Economies of Scale
The Board received and considered information about the notion of possible realization of “economies of scale” as a fund grows larger, the difficulties of calculating economies of scale at an individual fund level, and the extent to which potential scale benefits are shared with shareholders. In this regard, the Board considered that Federated Hermes has made significant and long-term investments in areas that support all of the Federated Hermes Funds, such as personnel and processes for the portfolio management (including market data on which portfolio managers make investment decisions), trading operations, issuer engagement (including with respect to ESG matters), shareholder services, compliance, business continuity, internal audit and risk management functions, as well as systems technology (including technology relating to cybersecurity) and use of data. The Board noted that Federated Hermes’ investments in these areas are extensive and are designed to provide enhanced services to the Federated Hermes Funds and their shareholders. The Board considered that the benefits of these investments (as well as the benefits of any economies of scale, should they exist) are likely to be shared with the family of Federated Hermes Funds as a whole. In addition, the Board considered that the Adviser and its affiliates have frequently waived fees and/or reimbursed expenses for the Federated Hermes Funds and that such waivers and reimbursements are another means for potential economies of scale to be shared with shareholders and can provide protection from an increase in expenses if a Federated Hermes Fund’s assets decline. The Board also considered reports on adviser-paid fees (commonly referred to as “revenue sharing”) that were provided to the Board throughout the year and in connection with the May Meetings. The Board considered the beliefs of Federated Hermes and the CCO that this information should be viewed to determine if there was an incentive to either not apply breakpoints, or to apply breakpoints at higher levels, and should not be viewed to determine the appropriateness of advisory fees. The Board also noted the absence of any applicable regulatory or industry guidelines on this subject, which is compounded by the lack of any common industry practice or general pattern with respect to structuring fund advisory fees with “breakpoints” that serve to reduce the fees as a fund attains a certain size.
Annual Shareholder Report
62

Conclusions
The Board considered: (i) the CCO’s conclusion that his observations and the information accompanying the CCO Fee Evaluation Report show that the management fee for the Fund was reasonable; and (ii) the CCO’s recommendation that the Board approve the management fee. The Board noted that, under these circumstances, no changes were recommended to, and no objection was raised to the continuation of, the Contract by the CCO. The CCO also recognized that the Board’s evaluation of the Federated Hermes Funds’ advisory and sub-advisory arrangements is a continuing and ongoing process that is informed by the information that the Board requests and receives from management throughout the course of the year and, in this regard, the CCO noted certain items for future reporting to the Board or further consideration by management as the Board continues its ongoing oversight of the Federated Hermes Funds.
On the basis of the information and factors summarized above, among other information and factors deemed relevant by the Board, and the evaluation thereof, the Board, including the Independent Directors, unanimously voted to approve the continuation of the Contract. The Board based its determination to approve the Contract on the totality of the circumstances and relevant factors and with a view of past and future long-term considerations. Not all of the factors and considerations identified above were necessarily deemed to be relevant to the Fund, nor did the Board consider any one of them to be determinative. With respect to the factors that were deemed to be relevant, the Board’s determination to approve the continuation of the Contract reflects its view that Federated Hermes’ performance and actions provided a satisfactory basis to support the determination to approve the continuation of the existing arrangement.
Annual Shareholder Report
63

Liquidity Risk Management Program Annual Evaluation of Adequacy and Effectiveness
In accordance with Rule 22e-4 under the Investment Company Act of 1940, as amended (the “Liquidity Rule”), Federated Hermes Municipal Bond Fund, Inc. (the “Fund” and, collectively with the other non-money market open-end funds advised by Federated Hermes, the “Federated Hermes Funds”) has adopted and implemented a liquidity risk management program (the “Program”) for the Fund. The Program seeks to assess and manage the Fund’s liquidity risk. “Liquidity risk” is defined under the Liquidity Rule as the risk that the Fund is unable to meet redemption requests without significantly diluting remaining investors’ interests in the Fund. The Board of Directors of the Fund (the “Board”) has approved the designation of the Fund’s investment adviser as the administrator for the Program with respect to the Fund (the “Administrator”). Each affiliated Federated Hermes advisory subsidiary (including the Fund’s investment adviser) that serves as investment adviser to a Federated Hermes Fund (including the Fund) has been approved as the administrator of the Program with respect to each Federated Hermes Fund that is managed by such advisory subsidiary (collectively, the “Administrator”). The Administrator, in turn, has delegated day-to-day responsibility for the administration of the Program to multiple Liquidity Risk Management Committees, which are comprised of representatives from certain divisions within Federated Hermes.
The Program is comprised of various components designed to support the assessment and/or management of liquidity risk, including: (1) the periodic assessment (no less frequently than annually) of certain factors that influence the Fund’s liquidity risk; (2) the periodic classification (no less frequently than monthly) of the Fund’s investments into one of four liquidity categories that reflect an estimate of their liquidity under current market conditions; (3) a 15% limit on the acquisition of “illiquid investments” (as defined under the Liquidity Rule); (4) to the extent a Fund does not invest primarily in “highly liquid investments” (as defined under the Liquidity Rule), the determination of a minimum percentage of the Fund’s assets that generally will be invested in highly liquid investments (an “HLIM”); (5) if a Fund has established an HLIM, the periodic review (no less frequently than annually) of the HLIM and the adoption of policies and procedures for responding to a shortfall of the Fund’s highly liquid investments below its HLIM; and (6) periodic reporting to the Board.
At its meetings in May 2021, the Board received and reviewed a written report (the “Report”) from the Federated Hermes Funds’ Chief Compliance Officer and Chief Risk Officer, on behalf of the Administrator, concerning the operation of the Program for the period from April 1, 2020 through March 31, 2021 (the “Period”). The Report addressed the operation of the Program and assessed its adequacy and effectiveness, including, where
Annual Shareholder Report
64

applicable, the operation of any HLIM established for a Federated Hermes Fund and each Federated Hermes Fund’s access to other available funding sources such as the Federated Hermes Funds’ interfund lending facility, redemptions in-kind and committed lines of credit. There were no material changes to the Program during the Period. The Report summarized the operation of the Program and the information and factors considered by the Administrator in assessing whether the Program has been adequately and effectively implemented with respect to the Federated Hermes Funds. Such information and factors included, among other things:
◾ confirmation that the Fund did not utilize alternative funding sources during the Period;
◾ the periodic classifications of the Fund’s investments into one of four liquidity categories and the methodologies and inputs used to classify the investments, including the Fund’s reasonably anticipated trade size;
◾ the analysis received from a third-party liquidity assessment vendor that is taken into account in the process of determining the liquidity classifications of the Fund’s investments and the results of an evaluation of the services performed by the vendor in support of this process;
◾ the fact that the Fund invested primarily in highly liquid investments during the Period and, therefore, was not required to establish, and has not established, an HLIM and the procedures for monitoring the status of the Fund as investing primarily in highly liquid investments;
◾ the fact that the Fund invested no more than 15% of its assets in illiquid investments during the Period and the procedures for monitoring this limit; and
◾ liquidity events during the Period, including the impact on liquidity caused by extended non-U.S. market closures and the March-April 2020 market conditions, and the fact that there were no specific liquidity events during the Period that materially affected the Fund’s liquidity risk.
Based on this review, the Administrator concluded that the Program is operating effectively to assess and manage the Fund’s liquidity risk, and that the Program has been and continues to be adequately and effectively implemented to monitor and, as applicable, respond to the Fund’s liquidity developments.
Annual Shareholder Report
65

Voting Proxies on Fund Portfolio Securities
A description of the policies and procedures that the Fund uses to determine how to vote proxies, if any, relating to securities held in the Fund’s portfolio is available, without charge and upon request, by calling 1-800-341-7400, Option #4. A report on “Form N-PX” of how the Fund voted any such proxies during the most recent 12-month period ended June 30 is available via the Proxy Voting Record (Form N-PX) link associated with the Fund and share class name at FederatedInvestors.com/FundInformation. Form N-PX filings are also available at the SEC’s website at sec.gov.
Quarterly Portfolio Schedule
Each fiscal quarter, the Fund will file with the SEC a complete schedule of its monthly portfolio holdings on “Form N-PORT.” The Fund’s holdings as of the end of the third month of every fiscal quarter, as reported on Form N-PORT, will be publicly available on the SEC’s website at sec.gov within 60 days of the end of the fiscal quarter upon filing. You may also access this information via the link to the Fund and share class name at FederatedInvestors.com.
Annual Shareholder Report
66

Mutual funds are not bank deposits or obligations, are not guaranteed by any bank and are not insured or guaranteed by the U.S. government, the Federal Deposit Insurance Corporation, the Federal Reserve Board or any other government agency. Investment in mutual funds involves investment risk, including the possible loss of principal.
This Report is authorized for distribution to prospective investors only when preceded or accompanied by the Fund’s Prospectus, which contains facts concerning its objective and policies, management fees, expenses and other information.
Federated Hermes Municipal Bond Fund, Inc.
Federated Hermes Funds
4000 Ericsson Drive
Warrendale, PA 15086-7561
Contact us at FederatedInvestors.com
or call 1-800-341-7400.
Federated Securities Corp., Distributor
CUSIP 313913105
CUSIP 313913204
CUSIP 313913303
CUSIP 313913402
CUSIP 313913600
8042830 (5/22)
© 2022 Federated Hermes, Inc.

  Item 2. Code of Ethics


(a) As of the end of the period covered by this report, the registrant has adopted a code of ethics (the "Section 406 Standards for Investment Companies - Ethical Standards for Principal Executive and Financial Officers") that applies to the registrant's Principal Executive Officer and Principal Financial Officer; the registrant's Principal Financial Officer also serves as the Principal Accounting Officer.

(c) There was no amendment to the registrant’s code of ethics described in Item 2(a) above during the period covered by the report.

(d) There was no waiver granted, either actual or implicit, from a provision to the registrant’s code of ethics described in Item 2(a) above during the period covered by the report.

(e) Not Applicable

(f)(3) The registrant hereby undertakes to provide any person, without charge, upon request, a copy of the code of ethics. To request a copy of the code of ethics, contact the registrant at 1-800-341-7400, and ask for a copy of the Section 406 Standards for Investment Companies - Ethical Standards for Principal Executive and Financial Officers.

Item 3. Audit Committee Financial Expert

The registrant's Board has determined that each of the following members of the Board's Audit Committee is an “audit committee financial expert,” and is "independent," for purposes of this Item:   G. Thomas Hough and Thomas M. O'Neill. 


  Item 4. Principal Accountant Fees and Services


(a)       Audit Fees billed to the registrant for the two most recent fiscal years:

Fiscal year ended 2022 – $29,900

Fiscal year ended 2021 - $39,900

(b)       Audit-Related Fees billed to the registrant for the two most recent fiscal years:

Fiscal year ended 2022 - $0

Fiscal year ended 2021 - $0

Amount requiring approval of the registrant’s Audit Committee pursuant to paragraph (c)(7)(ii) of Rule 2-01 of Regulation S-X, $2,996 and $0 respectively. Fiscal year ended 2022- Audit consent fee for N-14 filing.

(c)        Tax Fees billed to the registrant for the two most recent fiscal years:

Fiscal year ended 2022 - $0

Fiscal year ended 2021 - $0

Amount requiring approval of the registrant’s Audit Committee pursuant to paragraph (c)(7)(ii) of Rule 2-01 of Regulation S-X, $0 and $0 respectively.

(d)       All Other Fees billed to the registrant for the two most recent fiscal years:

Fiscal year ended 2022 - $0

Fiscal year ended 2021 - $0

Amount requiring approval of the registrant’s Audit Committee pursuant to paragraph (c)(7)(ii) of Rule 2-01 of Regulation S-X, $0 and $0 respectively.

(e)(1) Audit Committee Policies regarding Pre-approval of Services.

The Audit Committee is required to pre-approve audit and non-audit services performed by the independent auditor in order to assure that the provision of such services do not impair the auditor’s independence. Unless a type of service to be provided by the independent auditor has received general pre-approval, it will require specific pre-approval by the Audit Committee. Any proposed services exceeding pre-approved cost levels will require specific pre-approval by the Audit Committee.

Certain services have the general pre-approval of the Audit Committee. The term of the general pre-approval is 12 months from the date of pre-approval, unless the Audit Committee specifically provides for a different period. The Audit Committee will annually review the services that may be provided by the independent auditor without obtaining specific pre-approval from the Audit Committee and may grant general pre-approval for such services. The Audit Committee will revise the list of general pre-approved services from time to time, based on subsequent determinations. The Audit Committee will not delegate to management its responsibilities to pre-approve services performed by the independent auditor.

The Audit Committee has delegated pre-approval authority to its chairman (the “Chairman”) for services that do not exceed a specified dollar threshold. The Chairman or Chief Audit Executive will report any such pre-approval decisions to the Audit Committee at its next scheduled meeting. The Committee will designate another member with such pre-approval authority when the Chairman is unavailable.

AUDIT SERVICES

The annual audit services engagement terms and fees will be subject to the specific pre-approval of the Audit Committee. The Audit Committee will approve, if necessary, any changes in terms, conditions and fees resulting from changes in audit scope, registered investment company (RIC) structure or other matters.

In addition to the annual audit services engagement specifically approved by the Audit Committee, the Audit Committee may grant general pre-approval for other audit services, which are those services that only the independent auditor reasonably can provide. The Audit Committee has pre-approved certain audit services; with limited exception, all other audit services must be specifically pre-approved by the Audit Committee.

AUDIT-RELATED SERVICES

Audit-related services are assurance and related services that are reasonably related to the performance of the audit or review of the RIC’s financial statements or that are traditionally performed by the independent auditor. The Audit Committee believes that the provision of audit-related services does not impair the independence of the auditor, and has pre-approved certain audit-related services; all other audit-related services must be specifically pre-approved by the Audit Committee.

TAX SERVICES

The Audit Committee believes that the independent auditor can provide tax services to the RIC such as tax compliance, tax planning and tax advice without impairing the auditor’s independence. However, the Audit Committee will not permit the retention of the independent auditor in connection with a transaction initially recommended by the independent auditor, the purpose of which may be tax avoidance and the tax treatment of which may not be supported in the Internal Revenue Code and related regulations. The Audit Committee has pre-approved certain tax services; with limited exception, all tax services involving large and complex transactions must be specifically pre-approved by the Audit Committee.

ALL OTHER SERVICES

With respect to the provision of permissible services other than audit, review or attest services the pre-approval requirement is waived if:

  (1) With respect to such services rendered to the Funds, the aggregate amount of all such services provided constitutes no more than five percent of the total amount of revenues paid by the audit client to its accountant during the fiscal year in which the services are provided; and,


  (2) With respect to such services rendered to the Fund’s investment adviser ( the “Adviser”)and any entity controlling, controlled by to under common control with the Adviser such as affiliated non-U.S. and U.S. funds not under the Audit Committee’s purview and which do not fall within a category of service which has been determined by the Audit Committee not to have a direct impact on the operations or financial reporting of the RIC, the aggregate amount of all services provided constitutes no more than five percent of the total amount of revenues paid to the RIC’s auditor by the RIC, its Adviser and any entity controlling, controlled by, or under common control with the Adviser during the fiscal year in which the services are provided; and


  (3) Such services were not recognized by the issuer or RIC at the time of the engagement to be non-audit services; and


  (4) Such services are promptly brought to the attention of the Audit Committee and approved prior to the completion of the audit by the Audit Committee or by one or more members of the Audit Committee who are members of the Board of Directors to whom authority to grant such approvals has been delegated by the Audit Committee.


The Audit Committee may grant general pre-approval to those permissible non-audit services which qualify for pre-approval and which it believes are routine and recurring services, and would not impair the independence of the auditor.

The Securities and Exchange Commission’s (the “SEC”) rules and relevant guidance should be consulted to determine the precise definitions of these services and applicability of exceptions to certain of the prohibitions.

PRE-APPROVAL FEE LEVELS

Pre-approval fee levels for all services to be provided by the independent auditor will be established annually by the Audit Committee. Any proposed services exceeding these levels will require specific pre-approval by the Audit Committee.

PROCEDURES

Requests or applications to provide services that require specific approval by the Audit Committee will be submitted to the Audit Committee by the Fund’s Principal Accounting Officer and/or the Chief Audit Executive of Federated Hermes, Inc., only after those individuals have determined that the request or application is consistent with the SEC’s rules on auditor independence.

(e)(2) Percentage of services identified in items 4(b) through 4(d) that were approved by the registrant’s Audit Committee pursuant to paragraph (c)(7)(i)(C) of Rule 2-01 of Regulation S-X:

4(b)

Fiscal year ended 2022 – 0%

Fiscal year ended 2021 - 0%

Percentage of services provided to the registrant’s Adviser and any entity controlling, controlled by, or under common control with the Adviser that provides ongoing services to the registrant that were approved by the registrant’s Audit Committee pursuant to paragraph (c)(7)(i)(C) of Rule 2-01 of Regulation S-X, 0% and 0% respectively.

4(c)

Fiscal year ended 2022 – 0%

Fiscal year ended 2021 – 0%

Percentage of services provided to the registrant’s Adviser and any entity controlling, controlled by, or under common control with the Adviser that provides ongoing services to the registrant that were approved by the registrant’s Audit Committee pursuant to paragraph (c)(7)(i)(C) of Rule 2-01 of Regulation S-X, 0% and 0% respectively.

4(d)

Fiscal year ended 2022 – 0%

Fiscal year ended 2021 – 0%

Percentage of services provided to the registrant’s Adviser and any entity controlling, controlled by, or under common control with the Adviser that provides ongoing services to the registrant that were approved by the registrant’s Audit Committee pursuant to paragraph (c)(7)(i)(C) of Rule 2-01 of Regulation S-X, 0% and 0% respectively.

  (f) NA


  (g) Non-Audit Fees billed to the registrant, the registrant’s Adviser, and certain entities controlling, controlled by or under common control with the Adviser:


Fiscal year ended 2022 - $139,694

Fiscal year ended 2021 - $54,001

  (h) The registrant’s Audit Committee has considered that the provision of non-audit services that were rendered to the registrant’s Adviser (not including any sub-adviser whose role is primarily portfolio management and is subcontracted with or overseen by another investment adviser), and any entity controlling, controlled by, or under common control with the Adviser that provides ongoing services to the registrant that were not pre-approved pursuant to paragraph (c)(7)(ii) of Rule 2-01 of Regulation S-X is compatible with maintaining the principal accountant’s independence.


  Item 5. Audit Committee of Listed Registrants


Not Applicable


  Item 6. Schedule of Investments


(a) The registrant’s Schedule of Investments is included as part of the Report to Stockholders filed under Item 1 of this form.


(b) Not Applicable; Fund had no divestments during the reporting period covered since the previous Form N-CSR filing.


  Item 7. Disclosure of Proxy Voting Policies and Procedures for Closed-End Management Investment Companies


Not Applicable


  Item 8. Portfolio Managers of Closed-End Management Investment Companies


Not Applicable


  Item 9. Purchases of Equity Securities by Closed-End Management Investment Company and Affiliated Purchasers


Not Applicable


  Item 10. Submission of Matters to a Vote of Security Holders


No Changes to Report


  Item 11. Controls and Procedures


(a) The registrant’s President and Treasurer have concluded that the

registrant’s disclosure controls and procedures (as defined in rule 30a-3(c) under the Act) are effective in design and operation and are sufficient to form the basis of the certifications required by Rule 30a-(2) under the Act, based on their evaluation of these disclosure controls and procedures within 90 days of the filing date of this report on Form N-CSR.


(b) There were no changes in the registrant’s internal control over financial reporting (as defined in rule 30a-3(d) under the Act) during the period covered by this report that have materially affected, or are reasonably likely to materially affect, the registrant’s internal control over financial reporting.


  Item 12. Disclosure of Securities Lending Activities for Closed-End Management Investment Companies


Not Applicable


  Item 13. Exhibits


(a)(1) Code of Ethics- Not Applicable to this Report.


(a)(2) Certifications of Principal Executive Officer and Principal Financial Officer.


(a)(3) Not Applicable.


(b) Certifications pursuant to 18 U.S.C. Section 1350.


SIGNATURES


Pursuant to the requirements of the Securities Exchange Act of 1934 and the Investment Company Act of 1940, the registrant has duly caused this report to be signed on its behalf by the undersigned, thereunto duly authorized.


Registrant Federated Hermes Municipal Bond Fund, Inc.


By /S/ Lori A. Hensler


Lori A. Hensler, Principal Financial Officer


Date May 23, 2022


Pursuant to the requirements of the Securities Exchange Act of 1934 and the Investment Company Act of 1940, this report has been signed below by the following persons on behalf of the registrant and in the capacities and on the dates indicated.


By /S/ J. Christopher Donahue


J. Christopher Donahue, Principal Executive Officer


Date May 23, 2022


By /S/ Lori A. Hensler


Lori A. Hensler, Principal Financial Officer


Date May 23, 2022


N-CSR Item 13(a)(2) - Exhibits: Certifications


I, J. Christopher Donahue, certify that:


  1. I have reviewed this report on Form N-CSR of Federated Hermes Municipal Bond Fund, Inc. ("registrant");


  1. Based on my knowledge, this report does not contain any untrue statement of a material fact or omit to state a material fact necessary to make the statements made, in light of the circumstances under which such statements were made, not misleading with respect to the period covered by this report;


  1. Based on my knowledge, the financial statements, and other financial information included in this report, fairly present in all material respects the financial condition, results of operations, changes in net assets, and cash flows (if the financial statements are required to include a statement of cash flows) of the registrant as of, and for, the periods presented in this report;


  1. The registrant's other certifying officers and I are responsible for establishing and maintaining disclosure controls and procedures (as defined in rule 30a-3(c) under the Investment Company Act of 1940) and internal control over financial reporting (as defined in Rule 30a-3(d) under the Investment Company Act of 1940) for the registrant and have:


    1. designed such disclosure controls and procedures, or caused such disclosure controls and procedures to be designed under our supervision, to ensure that material information relating to the registrant, including its consolidated subsidiaries, is made known to us by others within those entities, particularly during the period in which this report is being prepared;


    1. designed such internal control over financial reporting, or caused such internal control over financial reporting to be designed under our supervision, to provide reasonable assurance regarding the reliability of financial reporting and the preparation of financial statements for external purposes in accordance with generally accepted accounting principles;


    1. evaluated the effectiveness of the registrant's disclosure controls and procedures and presented in this report our conclusions about the effectiveness of the disclosure controls and procedures, as of a date within 90 days prior to the filing date of this report based on such evaluation; and


    1. disclosed in this report any change in the registrant’s internal control over financial reporting that occurred during the period covered by this report that has materially affected, or is reasonably likely to materially affect, the registrant’s internal control over financial reporting; and


  1. The registrant's other certifying officers and I have disclosed to the registrant's auditors and the audit committee of the registrant's board of directors (or persons performing the equivalent functions):


    1. all significant deficiencies and material weaknesses in the design or operation of internal control over financial reporting which are reasonably likely to adversely affect the registrant’s ability to record, process, summarize, and report financial information; and


    1. any fraud, whether or not material, that involves management or other employees who have a significant role in the registrant’s internal control over financial reporting.


Date: May 23, 2022

/S/ J. Christopher Donahue

J. Christopher Donahue, President - Principal Executive Officer


N-CSR Item 13(a)(2) - Exhibits: Certifications


I, Lori A. Hensler, certify that:


  1. I have reviewed this report on Form N-CSR of Federated Hermes Municipal Bond Fund, Inc. ("registrant");


  1. Based on my knowledge, this report does not contain any untrue statement of a material fact or omit to state a material fact necessary to make the statements made, in light of the circumstances under which such statements were made, not misleading with respect to the period covered by this report;


  1. Based on my knowledge, the financial statements, and other financial information included in this report, fairly present in all material respects the financial condition, results of operations, changes in net assets, and cash flows (if the financial statements are required to include a statement of cash flows) of the registrant as of, and for, the periods presented in this report;


  1. The registrant's other certifying officers and I are responsible for establishing and maintaining disclosure controls and procedures (as defined in rule 30a-3(c) under the Investment Company Act of 1940) and internal control over financial reporting (as defined in Rule 30a-3(d) under the Investment Company Act of 1940) for the registrant and have:


    1. designed such disclosure controls and procedures, or caused such disclosure controls and procedures to be designed under our supervision, to ensure that material information relating to the registrant, including its consolidated subsidiaries, is made known to us by others within those entities, particularly during the period in which this report is being prepared;


    1. designed such internal control over financial reporting, or caused such internal control over financial reporting to be designed under our supervision, to provide reasonable assurance regarding the reliability of financial reporting and the preparation of financial statements for external purposes in accordance with generally accepted accounting principles;


    1. evaluated the effectiveness of the registrant's disclosure controls and procedures and presented in this report our conclusions about the effectiveness of the disclosure controls and procedures, as of a date within 90 days prior to the filing date of this report based on such evaluation; and


    1. disclosed in this report any change in the registrant’s internal control over financial reporting that occurred during the period covered by this report that has materially affected, or is reasonably likely to materially affect, the registrant’s internal control over financial reporting; and


  1. The registrant's other certifying officers and I have disclosed to the registrant's auditors and the audit committee of the registrant's board of directors (or persons performing the equivalent functions):


    1. all significant deficiencies and material weaknesses in the design or operation of internal control over financial reporting which are reasonably likely to adversely affect the registrant’s ability to record, process, summarize, and report financial information; and


    1. any fraud, whether or not material, that involves management or other employees who have a significant role in the registrant’s internal control over financial reporting.


Date: May 23, 2022

/S/ Lori A. Hensler

Lori A. Hensler, Treasurer - Principal Financial Officer


N-CSR Item 13(b) - Exhibits: Certifications


SECTION 906 CERTIFICATION


Pursuant to 18 U.S.C.§ 1350, the undersigned officers of Federated Hermes Municipal Bond Fund, Inc.(the “Registrant”), hereby certify, to the best of our knowledge, that the Registrant’s Report on Form N-CSR for the period ended March 31, 2022 (the “Report”) fully complies with the requirements of Section 13(a) or 15(d), as applicable, of the Securities and Exchange Act of 1934 and that the information contained in the Report fairly presents, in all material respects, the financial condition and results of operations of the Registrant.


Dated: May 23, 2022


/s/ J. Christopher Donahue

J. Christopher Donahue

Title: President, Principal Executive Officer


Dated: May 23, 2022


/s/ Lori A. Hensler

Lori A. Hensler

Title: Treasurer, Principal Financial Officer


This certification is being furnished solely pursuant to 18 U.S.C.§ 1350 and is not being filed as part of the Report or as a separate disclosure document.


Serious News for Serious Traders! Try StreetInsider.com Premium Free!

You May Also Be Interested In


Related Categories

SEC Filings