

Form N-CSR Federated Hermes Investm For: Nov 30
 Tweet
Tweet Share
ShareUnited States
Securities and Exchange Commission
Washington, D.C. 20549
Form N-CSR
Certified Shareholder Report of Registered Management Investment Companies
811-58429
(Investment Company Act File Number)
Federated Hermes Investment Series Funds, Inc.
_______________________________________________________________
(Exact Name of Registrant as Specified in Charter)
Federated Hermes Funds
4000 Ericsson Drive
Warrendale, Pennsylvania 15086-7561
(Address of Principal Executive Offices)
(412) 288-1900
(Registrant's Telephone Number)
Peter J. Germain, Esquire
1001 Liberty Avenue
Pittsburgh, Pennsylvania 15222-3779
(Name and Address of Agent for Service)
(Notices should be sent to the Agent for Service)
Date of Fiscal Year End: 11/30/21
Date of Reporting Period: 11/30/21
| Item 1. | Reports to Stockholders |

|
Share Class | Ticker
|
A | FDBAX
|
B | FDBBX
|
C | FDBCX
|
|
|
F | ISHIX
|
Institutional | FDBIX
|
R6 | FDBLX
|
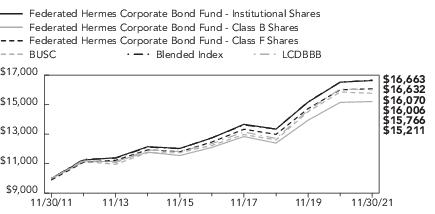
Federated Hermes Corporate Bond Fund
A Portfolio of Federated Hermes Investment Series Funds, Inc.

|
|
1 Year
|
5 Years
|
10 Years
|
|
Class A Shares
|
-4.11%
|
4.24%
|
4.50%
|
|
Class B Shares
|
-5.82%
|
3.99%
|
4.28%
|
|
Class C Shares
|
-1.39%
|
4.36%
|
4.29%
|
|
Class F Shares
|
-1.54%
|
5.01%
|
4.86%
|
|
Institutional Shares
|
0.66%
|
5.48%
|
5.22%
|
|
Class R6 Shares4
|
0.68%
|
5.48%
|
5.12%
|
|
BUSC
|
-0.55%
|
5.20%
|
4.66%
|
|
Blended Index
|
0.89%
|
5.49%
|
5.24%
|
|
LCDBBB
|
-0.34%
|
5.12%
|
4.75%
|
|
Portfolio Composition
|
Percentage of
Total Net Assets2
|
|
Corporate Debt Securities
|
98.2%
|
|
Municipal Bonds
|
0.1%
|
|
Collateralized Mortgage Obligations3
|
0.0%
|
|
Mortgage-Backed Securities3,4
|
0.0%
|
|
Cash Equivalents5
|
0.5%
|
|
Other Security Types6
|
0.1%
|
|
Derivative Contracts3,7
|
0.0%
|
|
Other Assets and Liabilities—Net8
|
1.1%
|
|
TOTAL
|
100%
|
|
1
|
See the Fund’s Prospectus and Statement of Additional Information for more complete
information regarding these security types.
|
|
2
|
As of the date specified above, the Fund owned shares of one or more affiliated investment
companies. For purposes of this table, the affiliated investment company (other than an affiliated
money market mutual fund) is not treated as a single portfolio security, but rather the Fund is
treated as owning a pro rata portion of each security and each other asset and liability owned by
the affiliated investment company. Accordingly, the percentages of total net assets shown in the
table will differ from those presented on the Portfolio of Investments.
|
|
3
|
Represents less than 0.1%.
|
|
4
|
For purposes of this table, mortgage-backed securities include mortgage-backed securities
guaranteed by Government Sponsored Entities.
|
|
5
|
Cash Equivalents include any investments in money market mutual funds and/or overnight
repurchase agreements.
|
|
6
|
Other Security Types consist of common stocks and preferred stocks.
|
|
7
|
Based upon net unrealized appreciation (depreciation) or value of the derivative contracts as
applicable. Derivative contracts may consist of futures, forwards, options and swaps. The impact
of a derivative contract on the Fund’s performance may be larger than its unrealized
appreciation (depreciation) or value may indicate. In many cases, the notional value or amount of
a derivative contract may provide a better indication of the contract’s significance to the
portfolio. More complete information regarding the Fund’s direct investments in derivative
contracts, including unrealized appreciation (depreciation), value and notional values or amounts
of such contracts, can be found in the table at the end of the Portfolio of Investments included
in this Report.
|
|
8
|
Assets, other than investments in securities, less liabilities. See Statement of Assets and
Liabilities.
|
|
Principal
Amount
or Shares
|
|
|
Value
|
|
|
|
CORPORATE BONDS— 71.8%
|
|
|
|
|
Basic Industry - Chemicals— 0.5%
|
|
|
$ 1,500,000
|
|
RPM International, Inc., Sr. Unsecd. Note, 3.750%, 3/15/2027
|
$1,625,984
|
|
2,780,000
|
|
RPM International, Inc., Sr. Unsecd. Note, 4.550%, 3/1/2029
|
3,169,752
|
|
1,415,000
|
|
RPM International, Inc., Sr. Unsecd. Note, 5.250%, 6/1/2045
|
1,801,934
|
|
|
|
TOTAL
|
6,597,670
|
|
|
|
Basic Industry - Metals & Mining— 1.6%
|
|
|
4,180,000
|
|
Anglo American Capital PLC, Sr. Unsecd. Note, 144A,
2.875%, 3/17/2031
|
4,170,372
|
|
3,900,000
|
|
Carpenter Technology Corp., Sr. Unsecd. Note, 4.450%, 3/1/2023
|
4,005,466
|
|
2,795,000
|
|
Glencore Funding LLC, Sr. Unsecd. Note, 144A, 2.850%, 4/27/2031
|
2,783,262
|
|
5,350,000
|
|
Reliance Steel & Aluminum Co., Sr. Unsecd. Note, 4.500%, 4/15/2023
|
5,561,372
|
|
1,080,000
|
|
Southern Copper Corp., Sr. Unsecd. Note, 6.750%, 4/16/2040
|
1,489,973
|
|
1,360,000
|
|
Worthington Industries, Inc., Sr. Unsecd. Note, 4.300%, 8/1/2032
|
1,493,610
|
|
3,124,000
|
|
Worthington Industries, Inc., Sr. Unsecd. Note, 4.550%, 4/15/2026
|
3,441,735
|
|
|
|
TOTAL
|
22,945,790
|
|
|
|
Capital Goods - Aerospace & Defense— 2.0%
|
|
|
2,940,000
|
|
BAE Systems Holdings, Inc., Sr. Unsecd. Note, 144A,
3.850%, 12/15/2025
|
3,173,389
|
|
2,120,000
|
|
Boeing Co., Sr. Unsecd. Note, 2.950%, 2/1/2030
|
2,140,600
|
|
1,755,000
|
|
Boeing Co., Sr. Unsecd. Note, 3.950%, 8/1/2059
|
1,835,383
|
|
3,000,000
|
|
Boeing Co., Sr. Unsecd. Note, 5.805%, 5/1/2050
|
4,052,387
|
|
1,930,000
|
|
Huntington Ingalls Industries, Inc., Sr. Unsecd. Note, 3.483%, 12/1/2027
|
2,058,656
|
|
5,900,000
|
|
Leidos, Inc., Sr. Unsecd. Note, Series WI, 2.300%, 2/15/2031
|
5,725,360
|
|
1,540,000
|
|
Leidos, Inc., Sr. Unsecd. Note, Series WI, 3.625%, 5/15/2025
|
1,644,882
|
|
2,775,000
|
|
Teledyne Technologies, Inc., Sr. Unsecd. Note, 1.600%, 4/1/2026
|
2,758,872
|
|
3,230,000
|
1
|
Textron Financial Corp., Jr. Sub. Note, 144A, 1.891% (3-month USLIBOR
+1.735%), 2/15/2042
|
2,793,950
|
|
760,000
|
|
Textron, Inc., Sr. Unsecd. Note, 3.875%, 3/1/2025
|
812,268
|
|
1,660,000
|
|
Textron, Inc., Sr. Unsecd. Note, 3.900%, 9/17/2029
|
1,837,332
|
|
690,000
|
|
Textron, Inc., Sr. Unsecd. Note, 4.300%, 3/1/2024
|
730,479
|
|
|
|
TOTAL
|
29,563,558
|
|
|
|
Capital Goods - Building Materials— 1.7%
|
|
|
5,625,000
|
|
Allegion PLC, Sr. Unsecd. Note, 3.500%, 10/1/2029
|
6,043,049
|
|
4,160,000
|
|
Allegion US Holdings Co., Inc., Sr. Unsecd. Note, 3.550%, 10/1/2027
|
4,446,695
|
|
2,980,000
|
|
Carrier Global Corp., Sr. Unsecd. Note, 2.700%, 2/15/2031
|
3,027,759
|
|
1,435,000
|
|
Carrier Global Corp., Sr. Unsecd. Note, 2.722%, 2/15/2030
|
1,465,730
|
|
3,095,000
|
|
Carrier Global Corp., Sr. Unsecd. Note, 3.577%, 4/5/2050
|
3,295,098
|
|
Principal
Amount
or Shares
|
|
|
Value
|
|
|
|
CORPORATE BONDS— continued
|
|
|
|
|
Capital Goods - Building Materials— continued
|
|
|
$ 5,010,000
|
|
Masco Corp., Sr. Unsecd. Note, 4.500%, 5/15/2047
|
$6,146,614
|
|
|
|
TOTAL
|
24,424,945
|
|
|
|
Capital Goods - Construction Machinery— 1.1%
|
|
|
2,820,000
|
|
Ashtead Capital, Inc., Sr. Unsecd. Note, 144A, 2.450%, 8/12/2031
|
2,778,499
|
|
1,920,000
|
|
CNH Industrial Capital America LLC, Sr. Unsecd. Note,
1.950%, 7/2/2023
|
1,950,562
|
|
1,670,000
|
|
CNH Industrial Capital America LLC, Sr. Unsecd. Note,
4.200%, 1/15/2024
|
1,770,762
|
|
2,500,000
|
|
CNH Industrial Capital America LLC, Sr. Unsecd. Note,
4.375%, 4/5/2022
|
2,530,323
|
|
3,100,000
|
|
CNH Industrial NV, Sr. Unsecd. Note, Series MTN, 3.850%, 11/15/2027
|
3,382,058
|
|
3,300,000
|
|
Weir Group PLC/The, Sr. Unsecd. Note, 144A, 2.200%, 5/13/2026
|
3,270,543
|
|
|
|
TOTAL
|
15,682,747
|
|
|
|
Capital Goods - Diversified Manufacturing— 2.1%
|
|
|
859,000
|
|
General Electric Capital Corp., Sr. Unsecd. Note, Series GMTN,
3.100%, 1/9/2023
|
880,679
|
|
2,210,000
|
|
Hubbell, Inc., Sr. Unsecd. Note, 2.300%, 3/15/2031
|
2,215,620
|
|
1,560,000
|
|
Lennox International, Inc., Sr. Unsecd. Note, 1.700%, 8/1/2027
|
1,544,390
|
|
3,074,000
|
|
Lennox International, Inc., Sr. Unsecd. Note, 3.000%, 11/15/2023
|
3,187,908
|
|
2,300,000
|
|
Parker-Hannifin Corp., Sr. Unsecd. Note, 3.250%, 3/1/2027
|
2,470,005
|
|
3,250,000
|
|
Roper Technologies, Inc., Sr. Unsecd. Note, 1.750%, 2/15/2031
|
3,035,305
|
|
2,155,000
|
|
Roper Technologies, Inc., Sr. Unsecd. Note, 2.000%, 6/30/2030
|
2,085,513
|
|
1,050,000
|
|
Roper Technologies, Inc., Sr. Unsecd. Note, 2.950%, 9/15/2029
|
1,101,288
|
|
820,000
|
|
Roper Technologies, Inc., Sr. Unsecd. Note, 3.800%, 12/15/2026
|
895,374
|
|
680,000
|
|
Roper Technologies, Inc., Sr. Unsecd. Note, 3.850%, 12/15/2025
|
737,673
|
|
2,840,000
|
|
Roper Technologies, Inc., Sr. Unsecd. Note, 4.200%, 9/15/2028
|
3,193,468
|
|
4,045,000
|
|
Valmont Industries, Inc., 5.250%, 10/1/2054
|
5,316,484
|
|
1,220,000
|
|
Wabtec Corp., Sr. Unsecd. Note, 3.200%, 6/15/2025
|
1,280,133
|
|
1,895,000
|
|
Xylem, Inc., Sr. Unsecd. Note, 2.250%, 1/30/2031
|
1,906,409
|
|
|
|
TOTAL
|
29,850,249
|
|
|
|
Capital Goods - Packaging— 0.2%
|
|
|
2,210,000
|
|
WestRock Co., Sr. Unsecd. Note, Series WI, 4.900%, 3/15/2029
|
2,581,949
|
|
|
|
Communications - Cable & Satellite— 2.5%
|
|
|
6,400,000
|
|
CCO Safari II LLC, 4.908%, 7/23/2025
|
7,064,794
|
|
1,235,000
|
|
CCO Safari II LLC, 6.484%, 10/23/2045
|
1,690,779
|
|
335,000
|
|
Charter Communications Operating, LLC/Charter Communications
Operating Capital Corp., 5.050%, 3/30/2029
|
387,069
|
|
3,350,000
|
|
Charter Communications Operating, LLC/Charter Communications
Operating Capital Corp., Term Loan - 1st Lien, 3.900%, 6/1/2052
|
3,392,593
|
|
1,165,000
|
|
Charter Communications, Inc., 4.200%, 3/15/2028
|
1,279,230
|
|
900,000
|
|
Comcast Corp., 7.050%, 3/15/2033
|
1,302,932
|
|
Principal
Amount
or Shares
|
|
|
Value
|
|
|
|
CORPORATE BONDS— continued
|
|
|
|
|
Communications - Cable & Satellite— continued
|
|
|
$ 5,225,000
|
|
Comcast Corp., Sr. Unsecd. Note, 2.650%, 2/1/2030
|
$5,410,557
|
|
1,500,000
|
|
Comcast Corp., Sr. Unsecd. Note, 3.150%, 2/15/2028
|
1,611,809
|
|
1,455,000
|
|
Comcast Corp., Sr. Unsecd. Note, 3.300%, 2/1/2027
|
1,562,539
|
|
2,500,000
|
|
Comcast Corp., Sr. Unsecd. Note, 4.250%, 10/15/2030
|
2,884,394
|
|
1,727,000
|
|
Comcast Corp., Sr. Unsecd. Note, Series WI, 3.999%, 11/1/2049
|
2,008,981
|
|
1,910,000
|
|
Cox Communications, Inc., Sr. Unsecd. Note, 144A, 3.350%, 9/15/2026
|
2,044,203
|
|
1,250,000
|
|
NBC Universal, Inc., Sr. Unsecd. Note, 5.950%, 4/1/2041
|
1,801,616
|
|
1,310,000
|
|
Time Warner Cable, Inc., Company Guarantee, 5.500%, 9/1/2041
|
1,607,592
|
|
1,000,000
|
|
Time Warner Cable, Inc., Company Guarantee, 6.750%, 6/15/2039
|
1,373,126
|
|
200,000
|
|
Time Warner Cable, Inc., Sr. Unsecd. Note, 8.375%, 3/15/2023
|
219,200
|
|
|
|
TOTAL
|
35,641,414
|
|
|
|
Communications - Media & Entertainment— 1.3%
|
|
|
3,995,000
|
|
British Sky Broadcasting Group PLC, 144A, 3.750%, 9/16/2024
|
4,272,640
|
|
1,170,000
|
|
Discovery Communications LLC, Sr. Unsecd. Note, 4.650%, 5/15/2050
|
1,390,007
|
|
4,380,000
|
|
Grupo Televisa S.A., 6.625%, 3/18/2025
|
5,021,750
|
|
785,000
|
|
Grupo Televisa S.A., Sr. Unsecd. Note, 5.000%, 5/13/2045
|
941,605
|
|
2,615,000
|
|
Interpublic Group of Cos., Inc., Sr. Unsecd. Note, 3.375%, 3/1/2041
|
2,770,668
|
|
2,350,000
|
|
ViacomCBS, Inc., Sr. Unsecd. Note, 4.900%, 8/15/2044
|
2,856,240
|
|
985,000
|
|
ViacomCBS, Inc., Sr. Unsecd. Note, 4.950%, 5/19/2050
|
1,245,935
|
|
|
|
TOTAL
|
18,498,845
|
|
|
|
Communications - Telecom Wireless— 1.6%
|
|
|
2,500,000
|
|
American Tower Corp., Sr. Unsecd. Note, 2.750%, 1/15/2027
|
2,585,230
|
|
1,365,000
|
|
American Tower Corp., Sr. Unsecd. Note, 5.000%, 2/15/2024
|
1,474,936
|
|
2,500,000
|
|
Crown Castle International Corp., Sr. Unsecd. Note, 3.200%, 9/1/2024
|
2,618,799
|
|
2,815,000
|
|
Crown Castle International Corp., Sr. Unsecd. Note, 3.250%, 1/15/2051
|
2,816,159
|
|
2,795,000
|
|
Crown Castle International Corp., Sr. Unsecd. Note, 3.800%, 2/15/2028
|
3,043,838
|
|
3,000,000
|
|
T-Mobile USA, Inc., Sec. Fac. Bond, 4.500%, 4/15/2050
|
3,514,162
|
|
2,700,000
|
|
T-Mobile USA, Inc., Sec. Fac. Bond, 144A, 3.400%, 10/15/2052
|
2,681,939
|
|
3,000,000
|
|
T-Mobile USA, Inc., Sec. Fac. Bond, 3.875%, 4/15/2030
|
3,265,068
|
|
1,135,000
|
|
Vodafone Group PLC, Sr. Unsecd. Note, 4.125%, 5/30/2025
|
1,234,915
|
|
|
|
TOTAL
|
23,235,046
|
|
|
|
Communications - Telecom Wirelines— 3.7%
|
|
|
2,425,000
|
|
AT&T, Inc., Sr. Unsecd. Note, 2.250%, 2/1/2032
|
2,342,078
|
|
5,331,000
|
|
AT&T, Inc., Sr. Unsecd. Note, 2.550%, 12/1/2033
|
5,157,610
|
|
4,200,000
|
|
AT&T, Inc., Sr. Unsecd. Note, 3.400%, 5/15/2025
|
4,459,398
|
|
4,033,000
|
|
AT&T, Inc., Sr. Unsecd. Note, 3.800%, 12/1/2057
|
4,219,452
|
|
650,000
|
|
AT&T, Inc., Sr. Unsecd. Note, 3.850%, 6/1/2060
|
681,194
|
|
2,500,000
|
|
AT&T, Inc., Sr. Unsecd. Note, 4.350%, 3/1/2029
|
2,819,538
|
|
1,000,000
|
|
AT&T, Inc., Sr. Unsecd. Note, 5.150%, 3/15/2042
|
1,246,680
|
|
Principal
Amount
or Shares
|
|
|
Value
|
|
|
|
CORPORATE BONDS— continued
|
|
|
|
|
Communications - Telecom Wirelines— continued
|
|
|
$ 3,080,000
|
|
AT&T, Inc., Sr. Unsecd. Note, 6.375%, 3/1/2041
|
$4,374,108
|
|
1,400,000
|
|
AT&T, Inc., Sr. Unsecd. Note, Series WI, 5.300%, 8/15/2058
|
1,823,133
|
|
2,175,000
|
|
Telefonica Emisiones SAU, Sr. Unsecd. Note, 5.213%, 3/8/2047
|
2,726,550
|
|
2,530,000
|
|
Telefonica Emisiones SAU, Sr. Unsecd. Note, 5.520%, 3/1/2049
|
3,295,282
|
|
3,730,000
|
|
Verizon Communications, Inc., Sr. Unsecd. Note, 2.550%, 3/21/2031
|
3,772,824
|
|
6,000,000
|
|
Verizon Communications, Inc., Sr. Unsecd. Note, 3.400%, 3/22/2041
|
6,385,728
|
|
6,340,000
|
|
Verizon Communications, Inc., Sr. Unsecd. Note, 4.125%, 8/15/2046
|
7,457,699
|
|
2,000,000
|
|
Verizon Communications, Inc., Sr. Unsecd. Note, 4.500%, 8/10/2033
|
2,361,291
|
|
|
|
TOTAL
|
53,122,565
|
|
|
|
Consumer Cyclical - Automotive— 1.2%
|
|
|
960,000
|
|
General Motors Co., Sr. Unsecd. Note, 4.000%, 4/1/2025
|
1,030,367
|
|
1,775,000
|
|
General Motors Co., Sr. Unsecd. Note, 5.200%, 4/1/2045
|
2,195,416
|
|
3,000,000
|
|
General Motors Financial Co., Inc., Sr. Unsecd. Note, 2.700%, 6/10/2031
|
2,974,442
|
|
1,110,000
|
|
General Motors Financial Co., Inc., Sr. Unsecd. Note, 5.650%, 1/17/2029
|
1,319,383
|
|
1,780,000
|
|
Hyundai Capital America, Sr. Unsecd. Note, 144A, 2.375%, 2/10/2023
|
1,809,987
|
|
1,405,000
|
|
Stellantis Finance US, Inc., 144A, 1.711%, 1/29/2027
|
1,379,257
|
|
3,000,000
|
|
Volkswagen Group of America Finance LLC, Sr. Unsecd. Note, 144A,
2.850%, 9/26/2024
|
3,119,814
|
|
3,000,000
|
|
Volkswagen Group of America Finance LLC, Sr. Unsecd. Note, 144A,
3.200%, 9/26/2026
|
3,178,531
|
|
|
|
TOTAL
|
17,007,197
|
|
|
|
Consumer Cyclical - Retailers— 1.7%
|
|
|
1,835,000
|
|
Advance Auto Parts, Inc., Sr. Unsecd. Note, 1.750%, 10/1/2027
|
1,786,428
|
|
5,600,000
|
|
Advance Auto Parts, Inc., Sr. Unsecd. Note, Series WI,
3.900%, 4/15/2030
|
6,153,754
|
|
1,080,000
|
|
AutoNation, Inc., Sr. Unsecd. Note, 4.750%, 6/1/2030
|
1,251,161
|
|
667,485
|
|
CVS Health Corp., Pass Thru Cert., 144A, 5.298%, 1/11/2027
|
723,252
|
|
2,750,000
|
|
CVS Health Corp., Sr. Unsecd. Note, 3.750%, 4/1/2030
|
3,019,918
|
|
1,685,000
|
|
CVS Health Corp., Sr. Unsecd. Note, 3.875%, 7/20/2025
|
1,816,836
|
|
2,395,000
|
|
CVS Health Corp., Sr. Unsecd. Note, 4.780%, 3/25/2038
|
2,920,252
|
|
2,100,000
|
|
CVS Health Corp., Sr. Unsecd. Note, 5.050%, 3/25/2048
|
2,778,723
|
|
985,000
|
|
CVS Health Corp., Sr. Unsecd. Note, 5.125%, 7/20/2045
|
1,290,462
|
|
3,200,000
|
|
Tractor Supply Co., Sr. Unsecd. Note, 1.750%, 11/1/2030
|
3,020,741
|
|
|
|
TOTAL
|
24,761,527
|
|
|
|
Consumer Cyclical - Services— 0.9%
|
|
|
1,460,000
|
|
Alibaba Group Holding Ltd., Sr. Unsecd. Note, 3.600%, 11/28/2024
|
1,547,690
|
|
1,915,000
|
|
Booking Holdings, Inc., Sr. Unsecd. Note, 4.625%, 4/13/2030
|
2,244,204
|
|
5,285,000
|
|
Expedia Group, Inc., Sr. Unsecd. Note, Series WI, 2.950%, 3/15/2031
|
5,342,454
|
|
3,985,000
|
|
IHS Markit Ltd., Sr. Unsecd. Note, 4.250%, 5/1/2029
|
4,513,411
|
|
|
|
TOTAL
|
13,647,759
|
|
Principal
Amount
or Shares
|
|
|
Value
|
|
|
|
CORPORATE BONDS— continued
|
|
|
|
|
Consumer Non-Cyclical - Food/Beverage— 4.5%
|
|
|
$ 5,545,000
|
|
Anheuser-Busch Cos LLC / Anheuser-Busch InBev Worldwide, Inc., Sr.
Unsecd. Note, 3.650%, 2/1/2026
|
$5,973,923
|
|
3,870,000
|
|
Anheuser-Busch Cos LLC / Anheuser-Busch InBev Worldwide, Inc., Sr.
Unsecd. Note, 4.900%, 2/1/2046
|
4,919,455
|
|
6,525,000
|
|
Anheuser-Busch InBev Worldwide, Inc., Sr. Unsecd. Note,
4.600%, 4/15/2048
|
8,007,426
|
|
980,000
|
|
Bacardi Ltd., Sr. Unsecd. Note, 144A, 2.750%, 7/15/2026
|
1,012,997
|
|
2,000,000
|
|
Constellation Brands, Inc., Sr. Unsecd. Note, 3.150%, 8/1/2029
|
2,111,233
|
|
405,000
|
|
Constellation Brands, Inc., Sr. Unsecd. Note, 3.750%, 5/1/2050
|
451,671
|
|
4,185,000
|
|
Constellation Brands, Inc., Sr. Unsecd. Note, 4.650%, 11/15/2028
|
4,793,767
|
|
1,850,000
|
|
Constellation Brands, Inc., Sr. Unsecd. Note, 5.250%, 11/15/2048
|
2,475,402
|
|
2,150,000
|
|
Danone SA, Sr. Unsecd. Note, 144A, 2.947%, 11/2/2026
|
2,258,051
|
|
1,590,000
|
|
Flowers Foods, Inc., Sr. Unsecd. Note, 3.500%, 10/1/2026
|
1,717,362
|
|
1,624,000
|
|
Grupo Bimbo S.A.B. de CV, 144A, 4.875%, 6/27/2044
|
1,953,278
|
|
391,000
|
|
Grupo Bimbo S.A.B. de CV, Sr. Unsecd. Note, 144A, 4.500%, 1/25/2022
|
393,121
|
|
4,650,000
|
|
International Flavors & Fragrances, Inc., Sr. Unsecd. Note, 144A,
1.230%, 10/1/2025
|
4,571,313
|
|
730,000
|
|
International Flavors & Fragrances, Inc., Sr. Unsecd. Note, 144A,
1.832%, 10/15/2027
|
720,011
|
|
1,530,000
|
|
Keurig Dr Pepper, Inc., Sr. Unsecd. Note, 4.417%, 5/25/2025
|
1,673,775
|
|
1,030,000
|
|
Keurig Dr Pepper, Inc., Sr. Unsecd. Note, 4.985%, 5/25/2038
|
1,289,840
|
|
6,165,000
|
|
Kraft Heinz Foods Co., Sr. Unsecd. Note, 4.375%, 6/1/2046
|
7,144,289
|
|
610,000
|
|
Molson Coors Brewing Co., Sr. Unsecd. Note, 4.200%, 7/15/2046
|
677,092
|
|
3,025,000
|
|
Smithfield Foods, Inc., 144A, 2.625%, 9/13/2031
|
2,969,082
|
|
4,464,000
|
|
Smithfield Foods, Inc., Sr. Unsecd. Note, 144A, 3.000%, 10/15/2030
|
4,489,532
|
|
5,000,000
|
|
Sysco Corp., Sr. Unsecd. Note, 4.450%, 3/15/2048
|
5,965,117
|
|
|
|
TOTAL
|
65,567,737
|
|
|
|
Consumer Non-Cyclical - Health Care— 3.1%
|
|
|
1,500,000
|
|
Agilent Technologies, Inc., Sr. Unsecd. Note, 2.750%, 9/15/2029
|
1,556,771
|
|
3,280,000
|
|
Agilent Technologies, Inc., Sr. Unsecd. Note, 3.050%, 9/22/2026
|
3,478,452
|
|
585,000
|
|
Alcon Finance Corp., Sr. Unsecd. Note, 144A, 2.600%, 5/27/2030
|
592,969
|
|
1,500,000
|
|
Alcon Finance Corp., Sr. Unsecd. Note, 144A, 2.750%, 9/23/2026
|
1,551,953
|
|
2,000,000
|
|
Alcon Finance Corp., Sr. Unsecd. Note, 144A, 3.000%, 9/23/2029
|
2,100,492
|
|
2,350,000
|
|
Becton Dickinson & Co., Sr. Unsecd. Note, 3.700%, 6/6/2027
|
2,544,793
|
|
1,455,000
|
|
Becton Dickinson & Co., Sr. Unsecd. Note, 3.734%, 12/15/2024
|
1,553,066
|
|
2,615,000
|
|
Becton Dickinson & Co., Sr. Unsecd. Note, 4.685%, 12/15/2044
|
3,270,802
|
|
2,495,000
|
|
Danaher Corp., Sr. Unsecd. Note, 2.600%, 10/1/2050
|
2,437,657
|
|
6,740,000
|
|
DH Europe Finance II S.a.r.l., Sr. Unsecd. Note, 2.600%, 11/15/2029
|
7,031,541
|
|
4,365,000
|
|
DH Europe Finance II S.a.r.l., Sr. Unsecd. Note, 3.400%, 11/15/2049
|
4,866,747
|
|
2,840,000
|
|
HCA, Inc., Sec. Fac. Bond, 3.500%, 7/15/2051
|
2,906,898
|
|
Principal
Amount
or Shares
|
|
|
Value
|
|
|
|
CORPORATE BONDS— continued
|
|
|
|
|
Consumer Non-Cyclical - Health Care— continued
|
|
|
$ 2,420,000
|
|
PerkinElmer, Inc., Sr. Unsecd. Note, 1.900%, 9/15/2028
|
$2,363,618
|
|
1,820,000
|
|
PerkinElmer, Inc., Sr. Unsecd. Note, 2.550%, 3/15/2031
|
1,861,118
|
|
2,275,000
|
|
PerkinElmer, Inc., Sr. Unsecd. Note, 3.300%, 9/15/2029
|
2,414,700
|
|
2,750,000
|
|
Thermo Fisher Scientific, Inc., Sr. Unsecd. Note, 2.600%, 10/1/2029
|
2,854,447
|
|
1,500,000
|
|
Thermo Fisher Scientific, Inc., Sr. Unsecd. Note, 2.950%, 9/19/2026
|
1,585,046
|
|
|
|
TOTAL
|
44,971,070
|
|
|
|
Consumer Non-Cyclical - Pharmaceuticals— 2.6%
|
|
|
895,000
|
|
Abbott Laboratories, Sr. Unsecd. Note, 1.400%, 6/30/2030
|
860,775
|
|
4,200,000
|
|
AbbVie, Inc., Sr. Unsecd. Note, 2.950%, 11/21/2026
|
4,422,930
|
|
3,800,000
|
|
AbbVie, Inc., Sr. Unsecd. Note, 3.200%, 11/21/2029
|
4,037,459
|
|
805,000
|
|
AbbVie, Inc., Sr. Unsecd. Note, 3.450%, 3/15/2022
|
807,823
|
|
750,000
|
|
AbbVie, Inc., Sr. Unsecd. Note, 3.800%, 3/15/2025
|
802,143
|
|
970,000
|
|
AbbVie, Inc., Sr. Unsecd. Note, 4.250%, 11/21/2049
|
1,168,707
|
|
2,875,000
|
|
AstraZeneca PLC, Sr. Unsecd. Note, 2.125%, 8/6/2050
|
2,573,209
|
|
2,330,000
|
|
AstraZeneca PLC, Sr. Unsecd. Note, 3.125%, 6/12/2027
|
2,493,644
|
|
2,500,000
|
|
AstraZeneca PLC, Sr. Unsecd. Note, 4.000%, 1/17/2029
|
2,828,570
|
|
1,500,000
|
|
Bayer US Finance II LLC, Sr. Unsecd. Note, 144A, 3.875%, 12/15/2023
|
1,576,080
|
|
730,000
|
|
Bayer US Finance II LLC, Sr. Unsecd. Note, 144A, 4.250%, 12/15/2025
|
795,163
|
|
500,000
|
|
Bayer US Finance II LLC, Sr. Unsecd. Note, 144A, 4.875%, 6/25/2048
|
632,441
|
|
280,000
|
|
Bayer US Finance LLC, Sr. Unsecd. Note, 144A, 3.375%, 10/8/2024
|
293,703
|
|
1,090,000
|
|
Biogen, Inc., Sr. Unsecd. Note, 2.250%, 5/1/2030
|
1,067,495
|
|
3,165,000
|
|
Biogen, Inc., Sr. Unsecd. Note, 3.150%, 5/1/2050
|
3,115,392
|
|
2,609,000
|
|
Biogen, Inc., Sr. Unsecd. Note, 144A, 3.250%, 2/15/2051
|
2,610,077
|
|
1,365,000
|
|
Regeneron Pharmaceuticals, Inc., Sr. Unsecd. Note, 1.750%, 9/15/2030
|
1,281,370
|
|
4,538,000
|
|
Regeneron Pharmaceuticals, Inc., Sr. Unsecd. Note, 2.800%, 9/15/2050
|
4,285,190
|
|
1,915,000
|
|
Takeda Pharmaceutical Co. Ltd., Sr. Unsecd. Note, 2.050%, 3/31/2030
|
1,863,455
|
|
|
|
TOTAL
|
37,515,626
|
|
|
|
Consumer Non-Cyclical - Tobacco— 0.5%
|
|
|
3,080,000
|
|
Bat Capital Corp., Sr. Unsecd. Note, Series WI, 3.557%, 8/15/2027
|
3,226,262
|
|
4,220,000
|
|
Bat Capital Corp., Sr. Unsecd. Note, Series WI, 4.540%, 8/15/2047
|
4,431,538
|
|
|
|
TOTAL
|
7,657,800
|
|
|
|
Energy - Independent— 1.4%
|
|
|
5,890,000
|
|
Canadian Natural Resources Ltd., 5.850%, 2/1/2035
|
7,441,590
|
|
980,000
|
|
Coterra Energy, Inc., Sr. Unsecd. Note, 144A, 3.900%, 5/15/2027
|
1,063,559
|
|
4,119,000
|
|
Hess Corp., Sr. Unsecd. Note, 5.600%, 2/15/2041
|
5,085,213
|
|
4,440,000
|
|
Pioneer Natural Resources, Inc., Sr. Unsecd. Note, 2.150%, 1/15/2031
|
4,269,415
|
|
440,000
|
|
XTO Energy, Inc., 6.375%, 6/15/2038
|
624,482
|
|
775,000
|
|
XTO Energy, Inc., 6.750%, 8/1/2037
|
1,112,518
|
|
|
|
TOTAL
|
19,596,777
|
|
Principal
Amount
or Shares
|
|
|
Value
|
|
|
|
CORPORATE BONDS— continued
|
|
|
|
|
Energy - Integrated— 1.4%
|
|
|
$ 1,695,000
|
|
BP Capital Markets America, Inc., Sr. Unsecd. Note, 1.749%, 8/10/2030
|
$1,631,121
|
|
6,100,000
|
|
BP Capital Markets America, Inc., Sr. Unsecd. Note, 2.939%, 6/4/2051
|
5,951,534
|
|
1,785,000
|
|
BP Capital Markets America, Inc., Sr. Unsecd. Note, 3.119%, 5/4/2026
|
1,890,989
|
|
3,000,000
|
|
BP Capital Markets America, Inc., Sr. Unsecd. Note, 3.937%, 9/21/2028
|
3,334,966
|
|
3,255,000
|
|
Cenovus Energy, Inc., Sr. Unsecd. Note, 3.750%, 2/15/2052
|
3,201,483
|
|
1,750,000
|
|
CNPC Hong Kong Overseas Capital Ltd., Company Guarantee, 144A,
5.950%, 4/28/2041
|
2,484,419
|
|
2,000,000
|
|
Husky Energy, Inc., Sr. Unsecd. Note, 4.400%, 4/15/2029
|
2,199,177
|
|
220,000
|
|
Petro-Canada, Deb., 7.000%, 11/15/2028
|
285,087
|
|
|
|
TOTAL
|
20,978,776
|
|
|
|
Energy - Midstream— 3.3%
|
|
|
3,975,000
|
|
Boardwalk Pipeline Partners LP, Sr. Unsecd. Note, 3.400%, 2/15/2031
|
4,127,966
|
|
805,000
|
|
Boardwalk Pipeline Partners LP, Sr. Unsecd. Note, 4.800%, 5/3/2029
|
912,372
|
|
1,652,000
|
|
Columbia Pipeline Group, Inc., Sr. Unsecd. Note, 4.500%, 6/1/2025
|
1,810,102
|
|
1,000,000
|
|
Columbia Pipeline Group, Inc., Sr. Unsecd. Note, 5.800%, 6/1/2045
|
1,364,811
|
|
1,290,000
|
|
Eastern Energy Gas Holdings, Sr. Unsecd. Note, Series B, 144A,
3.000%, 11/15/2029
|
1,344,688
|
|
5,730,000
|
|
Energy Transfer Partners LP, Sr. Unsecd. Note, 4.900%, 2/1/2024
|
6,089,304
|
|
2,137,000
|
|
Energy Transfer Partners LP, Sr. Unsecd. Note, 5.150%, 3/15/2045
|
2,442,840
|
|
2,475,000
|
|
Enterprise Products Operating LLC, Sr. Unsecd. Note,
3.750%, 2/15/2025
|
2,642,631
|
|
2,500,000
|
|
Kinder Morgan Energy Partners LP, Note, 6.550%, 9/15/2040
|
3,422,011
|
|
1,190,000
|
|
Kinder Morgan Energy Partners LP, Sr. Unsecd. Note, 6.375%, 3/1/2041
|
1,598,797
|
|
3,190,000
|
|
MPLX LP, Sr. Unsecd. Note, 4.000%, 3/15/2028
|
3,470,392
|
|
2,350,000
|
|
MPLX LP, Sr. Unsecd. Note, 4.500%, 4/15/2038
|
2,611,958
|
|
1,525,000
|
|
MPLX LP, Sr. Unsecd. Note, 5.200%, 3/1/2047
|
1,862,349
|
|
2,265,000
|
|
MPLX LP, Sr. Unsecd. Note, Series WI, 5.200%, 12/1/2047
|
2,778,222
|
|
3,050,000
|
|
ONEOK Partners LP, Sr. Unsecd. Note, 3.375%, 10/1/2022
|
3,095,737
|
|
3,085,000
|
|
ONEOK, Inc., Sr. Unsecd. Note, 5.200%, 7/15/2048
|
3,724,373
|
|
2,150,000
|
|
Texas Eastern Transmission LP, Sr. Unsecd. Note, 144A,
2.800%, 10/15/2022
|
2,174,323
|
|
2,300,000
|
|
Williams Partners LP, Sr. Unsecd. Note, 4.900%, 1/15/2045
|
2,765,441
|
|
|
|
TOTAL
|
48,238,317
|
|
|
|
Energy - Refining— 0.7%
|
|
|
875,000
|
|
Marathon Petroleum Corp., Sr. Unsecd. Note, 3.625%, 9/15/2024
|
923,140
|
|
1,340,000
|
|
Marathon Petroleum Corp., Sr. Unsecd. Note, 4.500%, 4/1/2048
|
1,533,887
|
|
720,000
|
|
Marathon Petroleum Corp., Sr. Unsecd. Note, 6.500%, 3/1/2041
|
997,681
|
|
1,665,000
|
|
Valero Energy Corp., 7.500%, 4/15/2032
|
2,282,495
|
|
2,700,000
|
|
Valero Energy Corp., Sr. Unsecd. Note, 3.650%, 12/1/2051
|
2,658,293
|
|
Principal
Amount
or Shares
|
|
|
Value
|
|
|
|
CORPORATE BONDS— continued
|
|
|
|
|
Energy - Refining— continued
|
|
|
$ 1,555,000
|
|
Valero Energy Corp., Sr. Unsecd. Note, 4.000%, 4/1/2029
|
$1,691,259
|
|
|
|
TOTAL
|
10,086,755
|
|
|
|
Financial Institution - Banking— 11.6%
|
|
|
2,000,000
|
|
Associated Banc-Corp., Sub. Note, 4.250%, 1/15/2025
|
2,135,921
|
|
2,450,000
|
|
Bank of America Corp., Sr. Unsecd. Note, 2.592%, 4/29/2031
|
2,471,733
|
|
3,500,000
|
|
Bank of America Corp., Sr. Unsecd. Note, 3.366%, 1/23/2026
|
3,697,533
|
|
2,175,000
|
|
Bank of America Corp., Sr. Unsecd. Note, 3.705%, 4/24/2028
|
2,350,519
|
|
6,395,000
|
|
Bank of America Corp., Sr. Unsecd. Note, Series GMTN,
2.816%, 7/21/2023
|
6,476,937
|
|
2,500,000
|
|
Bank of America Corp., Sr. Unsecd. Note, Series MTN,
2.496%, 2/13/2031
|
2,505,877
|
|
6,000,000
|
|
Bank of America Corp., Sr. Unsecd. Note, Series MTN,
2.884%, 10/22/2030
|
6,206,496
|
|
3,750,000
|
|
Bank of America Corp., Sr. Unsecd. Note, Series MTN,
3.458%, 3/15/2025
|
3,929,397
|
|
2,230,000
|
|
Bank of America Corp., Sr. Unsecd. Note, Series MTN,
3.824%, 1/20/2028
|
2,418,583
|
|
1,850,000
|
|
Bank of America Corp., Sr. Unsecd. Note, Series MTN,
4.000%, 4/1/2024
|
1,971,537
|
|
2,100,000
|
|
Bank of America Corp., Sub. Note, Series L, 3.950%, 4/21/2025
|
2,254,618
|
|
2,250,000
|
|
Bank of America Corp., Sub. Note, Series L, 4.183%, 11/25/2027
|
2,462,773
|
|
5,500,000
|
|
Capital One Bank, Sub. Note, 3.375%, 2/15/2023
|
5,662,576
|
|
1,200,000
|
|
Capital One Financial Corp., Sr. Sub. Note, 4.200%, 10/29/2025
|
1,306,124
|
|
990,000
|
|
Citigroup, Inc., 4.125%, 7/25/2028
|
1,088,336
|
|
2,800,000
|
|
Citigroup, Inc., 4.300%, 11/20/2026
|
3,090,308
|
|
2,750,000
|
|
Citigroup, Inc., Sr. Unsecd. Note, 2.572%, 6/3/2031
|
2,767,262
|
|
3,410,000
|
|
Citigroup, Inc., Sr. Unsecd. Note, 2.876%, 7/24/2023
|
3,456,607
|
|
2,780,000
|
|
Citigroup, Inc., Sr. Unsecd. Note, 2.976%, 11/5/2030
|
2,892,315
|
|
1,705,000
|
|
Citigroup, Inc., Sr. Unsecd. Note, 3.352%, 4/24/2025
|
1,785,900
|
|
1,910,000
|
|
Citigroup, Inc., Sr. Unsecd. Note, 3.400%, 5/1/2026
|
2,055,846
|
|
6,000,000
|
|
Citigroup, Inc., Sr. Unsecd. Note, 3.520%, 10/27/2028
|
6,438,564
|
|
2,750,000
|
|
Citigroup, Inc., Sr. Unsecd. Note, 3.980%, 3/20/2030
|
3,048,543
|
|
3,500,000
|
|
Citizens Financial Group, Inc., Sub. Note, 144A, 4.150%, 9/28/2022
|
3,600,293
|
|
1,000,000
|
|
Comerica, Inc., 3.800%, 7/22/2026
|
1,085,322
|
|
2,625,000
|
|
Compass Bank, Birmingham, Sub. Note, Series BKNT,
3.875%, 4/10/2025
|
2,831,001
|
|
1,840,000
|
|
Fifth Third Bancorp, Sr. Unsecd. Note, 2.375%, 1/28/2025
|
1,896,553
|
|
1,680,000
|
|
FNB Corp. (PA), Sr. Unsecd. Note, 2.200%, 2/24/2023
|
1,700,211
|
|
2,750,000
|
|
Goldman Sachs Group, Inc., Sr. Unsecd. Note, 2.600%, 2/7/2030
|
2,790,087
|
|
2,000,000
|
|
Goldman Sachs Group, Inc., Sr. Unsecd. Note, 3.272%, 9/29/2025
|
2,098,936
|
|
7,700,000
|
|
Goldman Sachs Group, Inc., Sr. Unsecd. Note, 3.814%, 4/23/2029
|
8,394,461
|
|
Principal
Amount
or Shares
|
|
|
Value
|
|
|
|
CORPORATE BONDS— continued
|
|
|
|
|
Financial Institution - Banking— continued
|
|
|
$ 2,000,000
|
|
Goldman Sachs Group, Inc., Sr. Unsecd. Note, 3.850%, 1/26/2027
|
$2,145,051
|
|
4,625,000
|
|
Goldman Sachs Group, Inc., Sr. Unsecd. Note, 4.223%, 5/1/2029
|
5,133,680
|
|
2,100,000
|
|
Goldman Sachs Group, Inc., Sub. Note, 6.345%, 2/15/2034
|
2,910,710
|
|
1,480,000
|
|
JPMorgan Chase & Co., Sr. Unsecd. Note, 2.776%, 4/25/2023
|
1,492,118
|
|
7,380,000
|
|
JPMorgan Chase & Co., Sr. Unsecd. Note, 3.509%, 1/23/2029
|
7,942,363
|
|
2,000,000
|
|
JPMorgan Chase & Co., Sub. Deb., 2.956%, 5/13/2031
|
2,067,045
|
|
870,000
|
|
JPMorgan Chase & Co., Sub. Deb., 8.000%, 4/29/2027
|
1,133,711
|
|
740,000
|
|
JPMorgan Chase & Co., Sub. Note, 3.375%, 5/1/2023
|
766,791
|
|
7,500,000
|
|
JPMorgan Chase & Co., Sub. Note, 3.875%, 9/10/2024
|
8,006,618
|
|
4,000,000
|
|
Morgan Stanley, Sr. Unsecd. Note, 3.625%, 1/20/2027
|
4,332,578
|
|
2,375,000
|
|
Morgan Stanley, Sr. Unsecd. Note, 4.457%, 4/22/2039
|
2,879,984
|
|
2,500,000
|
|
Morgan Stanley, Sr. Unsecd. Note, Series GMTN, 2.699%, 1/22/2031
|
2,569,479
|
|
7,500,000
|
|
Morgan Stanley, Sr. Unsecd. Note, Series GMTN, 3.772%, 1/24/2029
|
8,192,932
|
|
2,650,000
|
|
Morgan Stanley, Sr. Unsecd. Note, Series GMTN, 3.875%, 1/27/2026
|
2,877,397
|
|
2,750,000
|
|
Morgan Stanley, Sr. Unsecd. Note, Series GMTN, 4.431%, 1/23/2030
|
3,139,263
|
|
1,500,000
|
|
Morgan Stanley, Sub. Note, 3.950%, 4/23/2027
|
1,640,342
|
|
4,320,000
|
|
Morgan Stanley, Sub. Note, Series MTN, 4.100%, 5/22/2023
|
4,517,199
|
|
468,725
|
2
|
Regional Diversified Funding, 144A, 9.250%, 3/15/2030
|
196,864
|
|
1,000,000
|
|
Synovus Bank GA, Sr. Unsecd. Note, 2.289%, 2/10/2023
|
1,001,983
|
|
4,000,000
|
|
Wells Fargo & Co., Sr. Unsecd. Note, Series MTN, 2.393%, 6/2/2028
|
4,054,570
|
|
2,750,000
|
|
Wells Fargo & Co., Sr. Unsecd. Note, Series MTN, 2.572%, 2/11/2031
|
2,791,734
|
|
|
|
TOTAL
|
166,663,581
|
|
|
|
Financial Institution - Broker/Asset Mgr/Exchange— 1.1%
|
|
|
2,150,000
|
|
CBOE Holdings, Inc., Sr. Unsecd. Note, 3.650%, 1/12/2027
|
2,353,105
|
|
4,255,000
|
|
FMR LLC, Bond, 144A, 7.570%, 6/15/2029
|
5,936,189
|
|
2,950,000
|
|
Jefferies Group LLC, Sr. Unsecd. Note, 2.625%, 10/15/2031
|
2,895,689
|
|
2,250,000
|
|
Jefferies Group LLC, Sr. Unsecd. Note, 4.850%, 1/15/2027
|
2,568,620
|
|
1,650,000
|
|
Jefferies Group LLC, Sr. Unsecd. Note, 6.500%, 1/20/2043
|
2,312,467
|
|
|
|
TOTAL
|
16,066,070
|
|
|
|
Financial Institution - Finance Companies— 1.7%
|
|
|
2,015,000
|
|
AerCap Ireland Capital Ltd. / AerCap Global Aviation Trust, Sr. Unsecd.
Note, 1.750%, 1/30/2026
|
1,976,474
|
|
1,650,000
|
|
AerCap Ireland Capital Ltd. / AerCap Global Aviation Trust, Sr. Unsecd.
Note, 3.400%, 10/29/2033
|
1,662,598
|
|
1,010,000
|
|
AerCap Ireland Capital Ltd. / AerCap Global Aviation Trust, Sr. Unsecd.
Note, 3.500%, 5/26/2022
|
1,021,820
|
|
3,050,000
|
|
AerCap Ireland Capital Ltd. / AerCap Global Aviation Trust, Sr. Unsecd.
Note, 4.625%, 10/15/2027
|
3,374,353
|
|
600,000
|
|
AerCap Ireland Capital Ltd. / AerCap Global Aviation Trust, Sr. Unsecd.
Note, 4.875%, 1/16/2024
|
641,410
|
|
Principal
Amount
or Shares
|
|
|
Value
|
|
|
|
CORPORATE BONDS— continued
|
|
|
|
|
Financial Institution - Finance Companies— continued
|
|
|
$ 3,050,000
|
|
Air Lease Corp., Sr. Unsecd. Note, 3.625%, 12/1/2027
|
$3,215,962
|
|
2,517,000
|
|
Discover Financial Services, Sr. Unsecd. Note, 3.850%, 11/21/2022
|
2,593,293
|
|
7,856,000
|
|
GE Capital International Funding, Inc., Sr. Unsecd. Note,
4.418%, 11/15/2035
|
9,504,122
|
|
|
|
TOTAL
|
23,990,032
|
|
|
|
Financial Institution - Insurance - Health— 0.1%
|
|
|
740,000
|
|
Anthem, Inc., 5.850%, 1/15/2036
|
997,240
|
|
|
|
Financial Institution - Insurance - Life— 1.7%
|
|
|
3,100,000
|
|
Aflac, Inc., Sr. Unsecd. Note, 2.875%, 10/15/2026
|
3,301,582
|
|
2,750,000
|
|
AXA-UAP, Sub. Note, 8.600%, 12/15/2030
|
3,993,505
|
|
1,720,000
|
|
Lincoln National Corp., Sr. Note, 7.000%, 6/15/2040
|
2,650,830
|
|
700,000
|
|
Massachusetts Mutual Life Insurance Co., Sub. Note, 144A,
5.375%, 12/1/2041
|
938,270
|
|
710,000
|
|
Massachusetts Mutual Life Insurance Co., Sub. Note, 144A,
8.875%, 6/1/2039
|
1,171,076
|
|
1,000,000
|
|
MetLife, Inc., Jr. Sub. Note, 10.750%, 8/1/2039
|
1,712,698
|
|
700,000
|
|
New York Life Insurance Co., Sub. Note, 144A, 6.750%, 11/15/2039
|
1,066,316
|
|
4,000,000
|
|
Pacific LifeCorp., Bond, 144A, 6.600%, 9/15/2033
|
5,647,770
|
|
1,000,000
|
|
Penn Mutual Life Insurance Co., Sr. Note, 144A, 7.625%, 6/15/2040
|
1,496,024
|
|
1,530,000
|
|
Prudential Financial, Inc., Series MTN, 6.625%, 12/1/2037
|
2,256,333
|
|
|
|
TOTAL
|
24,234,404
|
|
|
|
Financial Institution - Insurance - P&C— 0.9%
|
|
|
1,210,000
|
|
Berkshire Hathaway, Inc., Sr. Unsecd. Note, 3.125%, 3/15/2026
|
1,295,174
|
|
1,000,000
|
|
Hartford Financial Services Group, Inc., Sr. Unsecd. Note,
6.625%, 4/15/2042
|
1,460,053
|
|
2,880,000
|
|
Liberty Mutual Group, Inc., Sr. Unsecd. Note, 144A, 3.951%, 10/15/2050
|
3,293,233
|
|
3,400,000
|
|
Nationwide Mutual Insurance Co., Sub. Note, 144A, 9.375%, 8/15/2039
|
6,002,896
|
|
1,000,000
|
|
USF&G Corp., 8.312%, 7/1/2046
|
1,550,977
|
|
|
|
TOTAL
|
13,602,333
|
|
|
|
Financial Institution - REIT - Apartment— 0.5%
|
|
|
2,155,000
|
|
Avalonbay Communities, Inc., Sr. Unsecd. Note, Series MTN,
3.350%, 5/15/2027
|
2,333,448
|
|
2,000,000
|
|
Mid-America Apartment Communities LP, Sr. Unsecd. Note,
3.750%, 6/15/2024
|
2,120,752
|
|
1,225,000
|
|
UDR, Inc., Sr. Unsecd. Note, 3.100%, 11/1/2034
|
1,283,861
|
|
1,600,000
|
|
UDR, Inc., Sr. Unsecd. Note, Series MTN, 2.950%, 9/1/2026
|
1,677,750
|
|
|
|
TOTAL
|
7,415,811
|
|
|
|
Financial Institution - REIT - Healthcare— 0.3%
|
|
|
1,250,000
|
|
Health Care REIT, Inc., Sr. Unsecd. Note, 4.000%, 6/1/2025
|
1,348,072
|
|
2,190,000
|
|
Healthcare Trust of America, Sr. Unsecd. Note, 2.000%, 3/15/2031
|
2,069,332
|
|
Principal
Amount
or Shares
|
|
|
Value
|
|
|
|
CORPORATE BONDS— continued
|
|
|
|
|
Financial Institution - REIT - Healthcare— continued
|
|
|
$ 1,170,000
|
|
Physicians Realty Trust, Sr. Unsecd. Note, 4.300%, 3/15/2027
|
$1,306,637
|
|
|
|
TOTAL
|
4,724,041
|
|
|
|
Financial Institution - REIT - Office— 0.5%
|
|
|
2,730,000
|
|
Alexandria Real Estate Equities, Inc., Sr. Unsecd. Note,
1.875%, 2/1/2033
|
2,574,126
|
|
1,570,000
|
|
Alexandria Real Estate Equities, Inc., Sr. Unsecd. Note,
3.950%, 1/15/2028
|
1,749,084
|
|
2,380,000
|
|
Boston Properties LP, Sr. Unsecd. Note, 3.200%, 1/15/2025
|
2,499,917
|
|
|
|
TOTAL
|
6,823,127
|
|
|
|
Financial Institution - REIT - Other— 0.5%
|
|
|
2,285,000
|
|
Host Hotels & Resorts LP, Sr. Unsecd. Note, Series E, 4.000%, 6/15/2025
|
2,425,441
|
|
2,275,000
|
|
WP Carey, Inc., Sr. Unsecd. Note, 2.400%, 2/1/2031
|
2,254,682
|
|
1,890,000
|
|
WP Carey, Inc., Sr. Unsecd. Note, 4.600%, 4/1/2024
|
2,017,928
|
|
|
|
TOTAL
|
6,698,051
|
|
|
|
Financial Institution - REIT - Retail— 0.3%
|
|
|
380,000
|
|
Kimco Realty Corp., Sr. Unsecd. Note, 3.400%, 11/1/2022
|
387,474
|
|
1,730,000
|
|
Kimco Realty Corp., Sr. Unsecd. Note, 3.800%, 4/1/2027
|
1,886,576
|
|
1,860,000
|
|
Tanger Properties LP, Sr. Unsecd. Note, 3.125%, 9/1/2026
|
1,935,759
|
|
|
|
TOTAL
|
4,209,809
|
|
|
|
Supranational— 0.1%
|
|
|
1,100,000
|
|
Corp Andina De Fomento, Sr. Unsecd. Note, 4.375%, 6/15/2022
|
1,122,427
|
|
|
|
Technology— 5.5%
|
|
|
1,897,000
|
|
Broadcom, Inc., Sr. Unsecd. Note, 4.150%, 11/15/2030
|
2,075,825
|
|
2,460,000
|
|
Broadcom, Inc., Sr. Unsecd. Note, 144A, 3.137%, 11/15/2035
|
2,420,591
|
|
103,000
|
|
Broadcom, Inc., Sr. Unsecd. Note, 144A, 3.187%, 11/15/2036
|
101,524
|
|
1,050,000
|
|
Broadcom, Inc., Sr. Unsecd. Note, 144A, 3.750%, 2/15/2051
|
1,094,241
|
|
1,370,000
|
|
CDW LLC / CDW Finance, Sr. Unsecd. Note, 2.670%, 12/1/2026
|
1,381,145
|
|
1,400,000
|
|
Corning, Inc., Unsecd. Note, 4.750%, 3/15/2042
|
1,791,952
|
|
3,880,000
|
|
Dell International LLC / EMC Corp., 5.300%, 10/1/2029
|
4,603,468
|
|
4,750,000
|
|
Dell International LLC / EMC Corp., 6.200%, 7/15/2030
|
6,046,696
|
|
1,565,000
|
|
Dell International LLC / EMC Corp., 8.350%, 7/15/2046
|
2,615,880
|
|
3,575,000
|
|
Equifax, Inc., Sr. Unsecd. Note, 2.600%, 12/1/2024
|
3,708,958
|
|
2,420,000
|
|
Equifax, Inc., Sr. Unsecd. Note, 3.250%, 6/1/2026
|
2,558,968
|
|
1,440,000
|
|
Equifax, Inc., Sr. Unsecd. Note, Series 5Y, 3.950%, 6/15/2023
|
1,504,394
|
|
1,350,000
|
|
Fidelity National Information Services, Inc., Sr. Unsecd. Note,
3.100%, 3/1/2041
|
1,351,128
|
|
3,000,000
|
|
Fiserv, Inc., Sr. Unsecd. Note, 2.650%, 6/1/2030
|
3,036,923
|
|
1,000,000
|
|
Fiserv, Inc., Sr. Unsecd. Note, 3.200%, 7/1/2026
|
1,056,060
|
|
2,500,000
|
|
Fiserv, Inc., Sr. Unsecd. Note, 3.850%, 6/1/2025
|
2,679,158
|
|
2,210,000
|
|
Fiserv, Inc., Sr. Unsecd. Note, 4.200%, 10/1/2028
|
2,470,791
|
|
Principal
Amount
or Shares
|
|
|
Value
|
|
|
|
CORPORATE BONDS— continued
|
|
|
|
|
Technology— continued
|
|
|
$ 1,565,000
|
|
Flextronics International Ltd., Sr. Unsecd. Note, 4.750%, 6/15/2025
|
$1,711,697
|
|
1,030,000
|
|
Hewlett Packard Enterprise Co., Sr. Unsecd. Note, 4.900%, 10/15/2025
|
1,145,432
|
|
3,325,000
|
|
Keysight Technologies, Inc., 4.550%, 10/30/2024
|
3,620,072
|
|
3,970,000
|
|
Keysight Technologies, Inc., Sr. Unsecd. Note, 3.000%, 10/30/2029
|
4,197,956
|
|
2,500,000
|
|
Micron Technology, Inc., Sr. Unsecd. Note, 4.663%, 2/15/2030
|
2,856,796
|
|
2,600,000
|
|
Molex Electronics Technologies LLC, Unsecd. Note, 144A,
3.900%, 4/15/2025
|
2,753,138
|
|
1,460,000
|
|
Qualcomm, Inc., Sr. Unsecd. Note, 2.600%, 1/30/2023
|
1,491,595
|
|
975,000
|
|
SAIC, Inc., Company Guarantee, Series 1, 5.950%, 12/1/2040
|
1,240,252
|
|
2,420,000
|
|
Total System Services, Inc., Sr. Unsecd. Note, 4.450%, 6/1/2028
|
2,692,563
|
|
445,000
|
|
Total System Services, Inc., Sr. Unsecd. Note, 4.800%, 4/1/2026
|
494,024
|
|
150,000
|
|
Verisk Analytics, Inc., Sr. Unsecd. Note, 4.125%, 3/15/2029
|
169,252
|
|
1,380,000
|
|
Verisk Analytics, Inc., Sr. Unsecd. Note, 4.125%, 9/12/2022
|
1,414,766
|
|
2,490,000
|
|
Verisk Analytics, Inc., Sr. Unsecd. Note, 5.500%, 6/15/2045
|
3,458,250
|
|
200,000
|
|
Verisk Analytics, Inc., Unsecd. Note, 4.000%, 6/15/2025
|
216,841
|
|
5,510,000
|
|
VMware, Inc., Sr. Unsecd. Note, 2.200%, 8/15/2031
|
5,370,029
|
|
6,400,000
|
|
Vontier Corp., Sr. Unsecd. Note, 144A, 2.950%, 4/1/2031
|
6,332,160
|
|
|
|
TOTAL
|
79,662,525
|
|
|
|
Technology Services— 0.4%
|
|
|
1,285,000
|
|
Fortinet, Inc., Sr. Unsecd. Note, 1.000%, 3/15/2026
|
1,251,101
|
|
1,325,000
|
|
Global Payments, Inc., Sr. Unsecd. Note, 2.900%, 11/15/2031
|
1,341,782
|
|
2,125,000
|
|
Global Payments, Inc., Sr. Unsecd. Note, 4.150%, 8/15/2049
|
2,413,277
|
|
650,000
|
|
Verisign, Inc., Sr. Unsecd. Note, 2.700%, 6/15/2031
|
656,997
|
|
|
|
TOTAL
|
5,663,157
|
|
|
|
Transportation - Airlines— 0.1%
|
|
|
740,000
|
|
Southwest Airlines Co., Sr. Unsecd. Note, 5.250%, 5/4/2025
|
822,708
|
|
|
|
Transportation - Railroads— 0.8%
|
|
|
3,095,000
|
|
Burlington Northern Santa Fe Corp., Deb., 5.750%, 5/1/2040
|
4,310,097
|
|
2,265,000
|
|
Canadian Pacific Railway Co., Sr. Unsecd. Note, 2.900%, 2/1/2025
|
2,375,387
|
|
1,240,000
|
|
Canadian Pacific Railway Co., Sr. Unsecd. Note, 3.000%, 12/2/2041
|
1,263,942
|
|
1,325,000
|
|
Kansas City Southern Industries, Inc., Sr. Unsecd. Note,
3.000%, 5/15/2023
|
1,360,987
|
|
2,060,000
|
|
Kansas City Southern Industries, Inc., Sr. Unsecd. Note,
4.700%, 5/1/2048
|
2,619,104
|
|
|
|
TOTAL
|
11,929,517
|
|
|
|
Transportation - Services— 2.0%
|
|
|
4,440,000
|
|
Enterprise Rent-A-Car USA Finance Co., Sr. Unsecd. Note, 144A,
5.625%, 3/15/2042
|
6,168,387
|
|
1,220,000
|
|
FedEx Corp., Sr. Unsecd. Note, 3.100%, 8/5/2029
|
1,294,956
|
|
2,325,000
|
|
FedEx Corp., Sr. Unsecd. Note, 4.050%, 2/15/2048
|
2,648,901
|
|
Principal
Amount
or Shares
|
|
|
Value
|
|
|
|
CORPORATE BONDS— continued
|
|
|
|
|
Transportation - Services— continued
|
|
|
$ 2,340,000
|
|
GXO Logistics, Inc., Sr. Unsecd. Note, 144A, 1.650%, 7/15/2026
|
$2,292,486
|
|
2,270,000
|
|
GXO Logistics, Inc., Sr. Unsecd. Note, 144A, 2.650%, 7/15/2031
|
2,245,200
|
|
2,640,000
|
|
Penske Truck Leasing Co. LP & PTL Finance Corp., Sr. Unsecd. Note,
144A, 1.200%, 11/15/2025
|
2,592,571
|
|
3,300,000
|
|
Penske Truck Leasing Co. LP & PTL Finance Corp., Sr. Unsecd. Note,
144A, 3.400%, 11/15/2026
|
3,510,562
|
|
2,255,000
|
|
Penske Truck Leasing Co. LP & PTL Finance Corp., Sr. Unsecd. Note,
144A, 3.450%, 7/1/2024
|
2,378,304
|
|
3,275,000
|
|
Ryder System, Inc., Sr. Unsecd. Note, Series MTN, 2.900%, 12/1/2026
|
3,433,934
|
|
2,540,000
|
|
Ryder System, Inc., Sr. Unsecd. Note, Series MTN, 3.875%, 12/1/2023
|
2,686,022
|
|
|
|
TOTAL
|
29,251,323
|
|
|
|
Utility - Electric— 3.2%
|
|
|
990,000
|
|
Ameren Corp., Sr. Unsecd. Note, 1.950%, 3/15/2027
|
989,886
|
|
990,000
|
|
Ameren Corp., Sr. Unsecd. Note, 3.650%, 2/15/2026
|
1,062,134
|
|
2,500,000
|
|
American Electric Power Co., Inc., Sr. Unsecd. Note,
3.200%, 11/13/2027
|
2,654,089
|
|
1,705,000
|
|
Black Hills Corp., Sr. Unsecd. Note, 2.500%, 6/15/2030
|
1,699,929
|
|
1,530,000
|
|
Cleveland Electric Illuminating Co., Sr. Unsecd. Note,
5.950%, 12/15/2036
|
2,054,673
|
|
1,233,000
|
|
Consolidated Edison Co., 4.625%, 12/1/2054
|
1,573,119
|
|
1,210,000
|
|
Duke Energy Corp., Sr. Unsecd. Note, 2.650%, 9/1/2026
|
1,254,291
|
|
1,330,000
|
|
Duke Energy Corp., Sr. Unsecd. Note, 3.750%, 9/1/2046
|
1,438,164
|
|
100,000
|
|
Duke Energy Indiana, Inc., 1st Mtg. Bond, 6.350%, 8/15/2038
|
144,679
|
|
1,950,000
|
|
EDP Finance BV, Sr. Unsecd. Note, 144A, 3.625%, 7/15/2024
|
2,057,481
|
|
5,000,000
|
|
Electricite de France SA, Jr. Sub. Note, 144A, 5.625%, 7/22/2070
|
5,263,750
|
|
840,000
|
|
Emera US Finance LP, Sr. Unsecd. Note, 3.550%, 6/15/2026
|
899,658
|
|
1,280,000
|
|
Emera US Finance LP, Sr. Unsecd. Note, 4.750%, 6/15/2046
|
1,522,287
|
|
2,950,000
|
|
Enel Finance International NV, Sr. Unsecd. Note, 144A,
3.500%, 4/6/2028
|
3,190,245
|
|
750,000
|
|
Enel Finance International NV, Sr. Unsecd. Note, 144A,
4.875%, 6/14/2029
|
886,693
|
|
4,100,000
|
|
Exelon Generation Co. LLC, Sr. Unsecd. Note, 4.250%, 6/15/2022
|
4,142,678
|
|
900,000
|
|
Exelon Generation Co. LLC, Sr. Unsecd. Note, 5.750%, 10/1/2041
|
1,103,646
|
|
2,350,000
|
|
Fortis, Inc. / Canada, Sr. Unsecd. Note, 3.055%, 10/4/2026
|
2,461,321
|
|
3,080,000
|
|
NextEra Energy Capital Holdings, Inc., Sr. Unsecd. Note,
3.550%, 5/1/2027
|
3,327,220
|
|
1,500,000
|
|
NextEra Energy Capital Holdings, Inc., Sr. Unsecd. Note,
3.625%, 6/15/2023
|
1,546,734
|
|
715,000
|
|
NiSource Finance Corp., Sr. Unsecd. Note, 4.375%, 5/15/2047
|
862,313
|
|
875,000
|
|
Puget Energy, Inc., Sec. Fac. Bond, 2.379%, 6/15/2028
|
867,420
|
|
3,185,000
|
|
Southern Co., Sr. Unsecd. Note, 3.250%, 7/1/2026
|
3,375,655
|
|
Principal
Amount
or Shares
|
|
|
Value
|
|
|
|
CORPORATE BONDS— continued
|
|
|
|
|
Utility - Electric— continued
|
|
|
$ 2,000,000
|
|
Southwestern Electric Power Co., Sr. Unsecd. Note, Series K,
2.750%, 10/1/2026
|
$2,088,397
|
|
|
|
TOTAL
|
46,466,462
|
|
|
|
Utility - Natural Gas— 0.8%
|
|
|
1,730,000
|
|
National Fuel Gas Co., Sr. Unsecd. Note, 2.950%, 3/1/2031
|
1,753,144
|
|
2,600,000
|
|
National Fuel Gas Co., Sr. Unsecd. Note, 3.750%, 3/1/2023
|
2,669,778
|
|
2,130,000
|
|
National Fuel Gas Co., Sr. Unsecd. Note, 5.500%, 1/15/2026
|
2,415,081
|
|
2,700,000
|
|
Sempra Energy, Sr. Unsecd. Note, 3.550%, 6/15/2024
|
2,864,017
|
|
1,300,000
|
|
Sempra Energy, Sr. Unsecd. Note, 6.000%, 10/15/2039
|
1,806,879
|
|
|
|
TOTAL
|
11,508,899
|
|
|
|
Utility - Natural Gas Distributor— 0.1%
|
|
|
815,000
|
|
Southern Co. Gas Capital, Sr. Unsecd. Note, 3.950%, 10/1/2046
|
922,864
|
|
|
|
TOTAL CORPORATE BONDS
(IDENTIFIED COST $956,487,213)
|
1,034,948,500
|
|
|
|
MUNICIPAL BOND— 0.1%
|
|
|
|
|
Municipal Services— 0.1%
|
|
|
1,035,000
|
|
Tampa, FL Sports Authority, (GTD by National Public Finance Guarantee
Corporation), 8.020%, 10/1/2026
(IDENTIFIED COST $1,048,455)
|
1,145,456
|
|
|
|
COLLATERALIZED MORTGAGE OBLIGATION— 0.0%
|
|
|
|
|
Federal Home Loan Mortgage Corporation— 0.0%
|
|
|
40,772
|
|
Federal Home Loan Mortgage Corp. REMIC, Series 3051, Class MY,
5.500%, 10/15/2025
(IDENTIFIED COST $39,991)
|
43,759
|
|
|
|
MORTGAGE-BACKED SECURITIES— 0.0%
|
|
|
|
|
Federal Home Loan Mortgage Corporation— 0.0%
|
|
|
410
|
|
Federal Home Loan Mortgage Corp., Pool C00702, 6.000%, 1/1/2029
|
454
|
|
451
|
|
Federal Home Loan Mortgage Corp., Pool C00748, 6.000%, 4/1/2029
|
501
|
|
298
|
|
Federal Home Loan Mortgage Corp., Pool C20263, 6.000%, 1/1/2029
|
329
|
|
413
|
|
Federal Home Loan Mortgage Corp., Pool C25621, 6.500%, 5/1/2029
|
469
|
|
|
|
TOTAL
|
1,753
|
|
|
|
Federal National Mortgage Association— 0.0%
|
|
|
765
|
|
Federal National Mortgage Association, Pool 323159, 7.500%, 4/1/2028
|
860
|
|
548
|
|
Federal National Mortgage Association, Pool 421223, 7.000%, 5/1/2028
|
611
|
|
3,859
|
|
Federal National Mortgage Association, Pool 439947,
6.500%, 11/1/2028
|
4,288
|
|
2,288
|
|
Federal National Mortgage Association, Pool 489867, 6.500%, 3/1/2029
|
2,548
|
|
|
|
TOTAL
|
8,307
|
|
|
|
Government National Mortgage Association— 0.0%
|
|
|
412
|
|
Government National Mortgage Association, Pool 449491,
7.500%, 12/15/2027
|
462
|
|
Principal
Amount
or Shares
|
|
|
Value
|
|
|
|
MORTGAGE-BACKED SECURITIES— continued
|
|
|
|
|
Government National Mortgage Association— continued
|
|
|
$ 302
|
|
Government National Mortgage Association, Pool 486467,
7.000%, 8/15/2028
|
$337
|
|
311
|
|
Government National Mortgage Association, Pool 780339,
8.000%, 12/15/2023
|
324
|
|
203
|
|
Government National Mortgage Association, Pool 780373,
7.000%, 12/15/2023
|
210
|
|
|
|
TOTAL
|
1,333
|
|
|
|
TOTAL MORTGAGE-BACKED SECURITIES
(IDENTIFIED COST $10,259)
|
11,393
|
|
|
|
PREFERRED STOCK— 0.0%
|
|
|
|
|
Financials— 0.0%
|
|
|
130,000
|
2,3,4
|
Lehman Brothers Holdings, Inc., Pfd., 5.670%
(IDENTIFIED COST $11,050)
|
1,300
|
|
|
|
INVESTMENT COMPANY— 27.4%
|
|
|
63,485,644
|
|
High Yield Bond Core Fund
(IDENTIFIED COST $411,494,928)
|
396,150,419
|
|
|
|
TOTAL INVESTMENT IN SECURITIES—99.3%
(IDENTIFIED COST $1,369,091,896)5
|
1,432,300,827
|
|
|
|
OTHER ASSETS AND LIABILITIES - NET—0.7%6
|
9,676,937
|
|
|
|
TOTAL NET ASSETS—100%
|
$1,441,977,764
|
|
Description
|
Number of
Contracts
|
Notional
Value
|
Expiration
Date
|
Value and
Unrealized
Appreciation
|
|
Long Futures:
|
|
|
|
|
|
4United States Treasury Long Bond
Long Futures
|
245
|
$39,720,625
|
March 2022
|
$391,716
|
|
|
Federated Hermes
Institutional
Prime Value
Obligations Fund,
Institutional Shares
|
High Yield
Bond Core Fund
|
Total of
Affiliated
Transactions
|
|
Value as of 11/30/2020
|
$11,921,955
|
$402,099,645
|
$414,021,600
|
|
Purchases at Cost
|
$271,228,274
|
$31,000,000
|
$302,228,274
|
|
Proceeds from Sales
|
$(283,148,980)
|
$(36,000,000)
|
$(319,148,980)
|
|
Change in Unrealized Appreciation/
Depreciation
|
$(2,805)
|
$16,220,594
|
$16,217,789
|
|
Net Realized Gain/(Loss)
|
$1,556
|
$(17,169,820)
|
$(17,168,264)
|
|
Value as of 11/30/2021
|
$—
|
$396,150,419
|
$396,150,419
|
|
Shares Held as of 11/30/2021
|
—
|
63,485,644
|
63,485,644
|
|
Dividend Income
|
$2,978
|
$22,991,871
|
$22,994,849
|
|
1
|
Floating/variable note with current rate and current maturity or next reset date shown.
|
|
2
|
Market quotations and price evaluations are not available. Fair value determined using
significant unobservable inputs in accordance with procedures established by and under the
general supervision of the Fund’s Board of Directors (the “Directors”).
|
|
3
|
Issuer in default.
|
|
4
|
Non-income-producing security.
|
|
5
|
The cost of investments for federal tax purposes amounts to $1,384,708,675.
|
|
6
|
Assets, other than investments in securities, less liabilities. See Statement of Assets and
Liabilities.
|
The following is a summary of the inputs used, as of November 30, 2021, in valuing the Fund’s assets carried at fair value:
|
Valuation Inputs
|
||||
|
|
Level 1—
Quoted
Prices
|
Level 2—
Other
Significant
Observable
Inputs
|
Level 3—
Significant
Unobservable
Inputs
|
Total
|
|
Debt Securities:
|
|
|
|
|
|
Corporate Bonds
|
$—
|
$1,034,751,636
|
$196,864
|
$1,034,948,500
|
|
Municipal Bond
|
—
|
1,145,456
|
—
|
1,145,456
|
|
Collateralized
Mortgage Obligation
|
—
|
43,759
|
—
|
43,759
|
|
Mortgage-Backed Securities
|
—
|
11,393
|
—
|
11,393
|
|
Equity Security:
|
|
|
|
|
|
Preferred Stock
|
|
|
|
|
|
Domestic
|
—
|
—
|
1,300
|
1,300
|
|
Investment Companies
|
396,150,419
|
—
|
—
|
396,150,419
|
|
TOTAL SECURITIES
|
$396,150,419
|
$1,035,952,244
|
$198,164
|
$1,432,300,827
|
|
Other Financial Instruments:1
|
|
|
|
|
|
Assets
|
$391,716
|
$—
|
$—
|
$391,716
|
|
TOTAL OTHER
FINANCIAL INSTRUMENTS
|
$391,716
|
$—
|
$—
|
$391,716
|
|
1
|
Other financial instruments are futures contracts.
|
|
The following acronym(s) are used throughout this portfolio:
|
|
|
|
BKNT
|
—Bank Notes
|
|
|
GMTN
|
—Global Medium Term Note
|
|
|
GTD
|
—Guaranteed
|
|
|
LIBOR
|
—London Interbank Offered Rate
|
|
|
MTN
|
—Medium Term Note
|
|
|
REIT
|
—Real Estate Investment Trust
|
|
|
REMIC
|
—Real Estate Mortgage Investment Conduit
|
|
|
|
Year Ended November 30,
|
||||
|
|
2021
|
2020
|
2019
|
2018
|
2017
|
|
Net Asset Value, Beginning of Period
|
$9.98
|
$9.50
|
$8.70
|
$9.29
|
$9.03
|
|
Income From Investment Operations:
|
|
|
|
|
|
|
Net investment income (loss)1
|
0.30
|
0.32
|
0.34
|
0.34
|
0.36
|
|
Net realized and unrealized gain (loss)
|
(0.26)
|
0.48
|
0.81
|
(0.57)
|
0.26
|
|
Total From Investment Operations
|
0.04
|
0.80
|
1.15
|
(0.23)
|
0.62
|
|
Less Distributions:
|
|
|
|
|
|
|
Distributions from net investment income
|
(0.31)
|
(0.32)
|
(0.35)
|
(0.35)
|
(0.36)
|
|
Distributions from net realized gain
|
—
|
—
|
—
|
(0.01)
|
(0.00)2
|
|
Total Distributions
|
(0.31)
|
(0.32)
|
(0.35)
|
(0.36)
|
(0.36)
|
|
Net Asset Value, End of Period
|
$9.71
|
$9.98
|
$9.50
|
$8.70
|
$9.29
|
|
Total Return3
|
0.41%
|
8.65%
|
13.43%
|
(2.53)%
|
7.01%
|
|
Ratios to Average Net Assets:
|
|
|
|
|
|
|
Net expenses4
|
0.85%
|
0.85%
|
0.85%
|
0.85%
|
0.85%
|
|
Net investment income
|
3.02%
|
3.32%
|
3.73%
|
3.82%
|
3.88%
|
|
Expense waiver/reimbursement5
|
0.12%
|
0.13%
|
0.14%
|
0.14%
|
0.14%
|
|
Supplemental Data:
|
|
|
|
|
|
|
Net assets, end of period (000 omitted)
|
$403,132
|
$438,296
|
$401,690
|
$364,175
|
$419,962
|
|
Portfolio turnover6
|
13%
|
17%
|
18%
|
10%
|
13%
|
|
1
|
Per share numbers have been calculated using the average shares method.
|
|
2
|
Represents less than $0.01.
|
|
3
|
Based on net asset value, which does not reflect the sales charge, redemption fee or contingent
deferred sales charge, if applicable.
|
|
4
|
Amount does not reflect net expenses incurred by investment companies in which the Fund
may invest.
|
|
5
|
This expense decrease is reflected in both the net expense and the net investment income ratios
shown above. Amount does not reflect expense waiver/reimbursement recorded by investment
companies in which the Fund may invest.
|
|
6
|
Securities that mature are considered sales for purposes of this calculation.
|
|
|
Year Ended November 30,
|
||||
|
|
2021
|
2020
|
2019
|
2018
|
2017
|
|
Net Asset Value, Beginning of Period
|
$10.05
|
$9.56
|
$8.75
|
$9.35
|
$9.09
|
|
Income From Investment Operations:
|
|
|
|
|
|
|
Net investment income (loss)1
|
0.21
|
0.24
|
0.27
|
0.27
|
0.28
|
|
Net realized and unrealized gain (loss)
|
(0.25)
|
0.49
|
0.81
|
(0.59)
|
0.26
|
|
Total From Investment Operations
|
(0.04)
|
0.73
|
1.08
|
(0.32)
|
0.54
|
|
Less Distributions:
|
|
|
|
|
|
|
Distributions from net investment income
|
(0.23)
|
(0.24)
|
(0.27)
|
(0.27)
|
(0.28)
|
|
Distributions from net realized gain
|
—
|
—
|
—
|
(0.01)
|
(0.00)2
|
|
Total Distributions
|
(0.23)
|
(0.24)
|
(0.27)
|
(0.28)
|
(0.28)
|
|
Net Asset Value, End of Period
|
$9.78
|
$10.05
|
$9.56
|
$8.75
|
$9.35
|
|
Total Return3
|
(0.47)%
|
7.77%
|
12.51%
|
(3.45)%
|
6.06%
|
|
Ratios to Average Net Assets:
|
|
|
|
|
|
|
Net expenses4
|
1.71%
|
1.70%
|
1.70%
|
1.70%
|
1.70%
|
|
Net investment income
|
2.17%
|
2.51%
|
2.91%
|
2.97%
|
2.99%
|
|
Expense waiver/reimbursement5
|
0.05%
|
0.06%
|
0.07%
|
0.06%
|
0.07%
|
|
Supplemental Data:
|
|
|
|
|
|
|
Net assets, end of period (000 omitted)
|
$3,365
|
$6,690
|
$12,717
|
$17,075
|
$27,087
|
|
Portfolio turnover6
|
13%
|
17%
|
18%
|
10%
|
13%
|
|
1
|
Per share numbers have been calculated using the average shares method.
|
|
2
|
Represents less than $0.01.
|
|
3
|
Based on net asset value, which does not reflect the sales charge, redemption fee or contingent
deferred sales charge, if applicable.
|
|
4
|
Amount does not reflect net expenses incurred by investment companies in which the Fund
may invest.
|
|
5
|
This expense decrease is reflected in both the net expense and the net investment income ratios
shown above. Amount does not reflect expense waiver/reimbursement recorded by investment
companies in which the Fund may invest.
|
|
6
|
Securities that mature are considered sales for purposes of this calculation.
|
|
|
Year Ended November 30,
|
||||
|
|
2021
|
2020
|
2019
|
2018
|
2017
|
|
Net Asset Value, Beginning of Period
|
$10.05
|
$9.56
|
$8.76
|
$9.36
|
$9.09
|
|
Income From Investment Operations:
|
|
|
|
|
|
|
Net investment income (loss)1
|
0.22
|
0.24
|
0.27
|
0.27
|
0.28
|
|
Net realized and unrealized gain (loss)
|
(0.26)
|
0.49
|
0.80
|
(0.59)
|
0.27
|
|
Total From Investment Operations
|
(0.04)
|
0.73
|
1.07
|
(0.32)
|
0.55
|
|
Less Distributions:
|
|
|
|
|
|
|
Distributions from net investment income
|
(0.23)
|
(0.24)
|
(0.27)
|
(0.27)
|
(0.28)
|
|
Distributions from net realized gain
|
—
|
—
|
—
|
(0.01)
|
(0.00)2
|
|
Total Distributions
|
(0.23)
|
(0.24)
|
(0.27)
|
(0.28)
|
(0.28)
|
|
Net Asset Value, End of Period
|
$9.78
|
$10.05
|
$9.56
|
$8.76
|
$9.36
|
|
Total Return3
|
(0.42)%
|
7.81%
|
12.41%
|
(3.42)%
|
6.21%
|
|
Ratios to Average Net Assets:
|
|
|
|
|
|
|
Net expenses4
|
1.67%
|
1.67%
|
1.66%
|
1.67%
|
1.67%
|
|
Net investment income
|
2.21%
|
2.51%
|
2.94%
|
3.00%
|
3.02%
|
|
Expense waiver/reimbursement5
|
0.05%
|
0.06%
|
0.07%
|
0.06%
|
0.07%
|
|
Supplemental Data:
|
|
|
|
|
|
|
Net assets, end of period (000 omitted)
|
$31,524
|
$47,820
|
$47,337
|
$48,592
|
$85,798
|
|
Portfolio turnover6
|
13%
|
17%
|
18%
|
10%
|
13%
|
|
1
|
Per share numbers have been calculated using the average shares method.
|
|
2
|
Represents less than $0.01.
|
|
3
|
Based on net asset value, which does not reflect the sales charge, redemption fee or contingent
deferred sales charge, if applicable.
|
|
4
|
Amount does not reflect net expenses incurred by investment companies in which the Fund
may invest.
|
|
5
|
This expense decrease is reflected in both the net expense and the net investment income ratios
shown above. Amount does not reflect expense waiver/reimbursement recorded by investment
companies in which the Fund may invest.
|
|
6
|
Securities that mature are considered sales for purposes of this calculation.
|
|
|
Year Ended November 30,
|
||||
|
|
2021
|
2020
|
2019
|
2018
|
2017
|
|
Net Asset Value, Beginning of Period
|
$10.07
|
$9.58
|
$8.77
|
$9.37
|
$9.10
|
|
Income From Investment Operations:
|
|
|
|
|
|
|
Net investment income (loss)1
|
0.30
|
0.32
|
0.35
|
0.35
|
0.36
|
|
Net realized and unrealized gain (loss)
|
(0.26)
|
0.49
|
0.81
|
(0.59)
|
0.27
|
|
Total From Investment Operations
|
0.04
|
0.81
|
1.16
|
(0.24)
|
0.63
|
|
Less Distributions:
|
|
|
|
|
|
|
Distributions from net investment income
|
(0.31)
|
(0.32)
|
(0.35)
|
(0.35)
|
(0.36)
|
|
Distributions from net realized gain
|
—
|
—
|
—
|
(0.01)
|
(0.00)2
|
|
Total Distributions
|
(0.31)
|
(0.32)
|
(0.35)
|
(0.36)
|
(0.36)
|
|
Net Asset Value, End of Period
|
$9.80
|
$10.07
|
$9.58
|
$8.77
|
$9.37
|
|
Total Return3
|
0.41%
|
8.68%
|
13.44%
|
(2.62)%
|
7.07%
|
|
Ratios to Average Net Assets:
|
|
|
|
|
|
|
Net expenses4
|
0.85%
|
0.85%
|
0.85%
|
0.85%
|
0.85%
|
|
Net investment income
|
3.02%
|
3.33%
|
3.74%
|
3.82%
|
3.83%
|
|
Expense waiver/reimbursement5
|
0.09%
|
0.11%
|
0.11%
|
0.11%
|
0.12%
|
|
Supplemental Data:
|
|
|
|
|
|
|
Net assets, end of period (000 omitted)
|
$127,519
|
$138,694
|
$134,534
|
$128,112
|
$151,638
|
|
Portfolio turnover6
|
13%
|
17%
|
18%
|
10%
|
13%
|
|
1
|
Per share numbers have been calculated using the average shares method.
|
|
2
|
Represents less than $0.01.
|
|
3
|
Based on net asset value, which does not reflect the sales charge, redemption fee or contingent
deferred sales charge, if applicable.
|
|
4
|
Amount does not reflect net expenses incurred by investment companies in which the Fund
may invest.
|
|
5
|
This expense decrease is reflected in both the net expense and the net investment income ratios
shown above. Amount does not reflect expense waiver/reimbursement recorded by investment
companies in which the Fund may invest.
|
|
6
|
Securities that mature are considered sales for purposes of this calculation.
|
|
|
Year Ended November 30,
|
||||
|
|
2021
|
2020
|
2019
|
2018
|
2017
|
|
Net Asset Value, Beginning of Period
|
$9.98
|
$9.50
|
$8.70
|
$9.30
|
$9.03
|
|
Income From Investment Operations:
|
|
|
|
|
|
|
Net investment income (loss)1
|
0.32
|
0.34
|
0.37
|
0.37
|
0.37
|
|
Net realized and unrealized gain (loss)
|
(0.26)
|
0.49
|
0.80
|
(0.59)
|
0.28
|
|
Total From Investment Operations
|
0.06
|
0.83
|
1.17
|
(0.22)
|
0.65
|
|
Less Distributions:
|
|
|
|
|
|
|
Distributions from net investment income
|
(0.33)
|
(0.35)
|
(0.37)
|
(0.37)
|
(0.38)
|
|
Distributions from net realized gain
|
—
|
—
|
—
|
(0.01)
|
(0.00)2
|
|
Total Distributions
|
(0.33)
|
(0.35)
|
(0.37)
|
(0.38)
|
(0.38)
|
|
Net Asset Value, End of Period
|
$9.71
|
$9.98
|
$9.50
|
$8.70
|
$9.30
|
|
Total Return3
|
0.66%
|
8.92%
|
13.72%
|
(2.39)%
|
7.38%
|
|
Ratios to Average Net Assets:
|
|
|
|
|
|
|
Net expenses4
|
0.60%
|
0.60%
|
0.60%
|
0.60%
|
0.60%
|
|
Net investment income
|
3.27%
|
3.56%
|
3.98%
|
4.07%
|
3.98%
|
|
Expense waiver/reimbursement5
|
0.12%
|
0.13%
|
0.14%
|
0.14%
|
0.14%
|
|
Supplemental Data:
|
|
|
|
|
|
|
Net assets, end of period (000 omitted)
|
$795,317
|
$890,497
|
$733,626
|
$515,139
|
$553,671
|
|
Portfolio turnover6
|
13%
|
17%
|
18%
|
10%
|
13%
|
|
1
|
Per share numbers have been calculated using the average shares method.
|
|
2
|
Represents less than $0.01.
|
|
3
|
Based on net asset value.
|
|
4
|
Amount does not reflect net expenses incurred by investment companies in which the Fund
may invest.
|
|
5
|
This expense decrease is reflected in both the net expense and the net investment income ratios
shown above. Amount does not reflect expense waiver/reimbursement recorded by investment
companies in which the Fund may invest.
|
|
6
|
Securities that mature are considered sales for purposes of this calculation.
|
|
|
Year Ended November 30,
|
||||
|
|
2021
|
2020
|
2019
|
2018
|
2017
|
|
Net Asset Value, Beginning of Period
|
$9.99
|
$9.51
|
$8.71
|
$9.31
|
$9.04
|
|
Income From Investment Operations:
|
|
|
|
|
|
|
Net investment income (loss)1
|
0.32
|
0.35
|
0.37
|
0.37
|
0.37
|
|
Net realized and unrealized gain (loss)
|
(0.26)
|
0.48
|
0.80
|
(0.59)
|
0.27
|
|
Total From Investment Operations
|
0.06
|
0.83
|
1.17
|
(0.22)
|
0.64
|
|
Less Distributions:
|
|
|
|
|
|
|
Distributions from net investment income
|
(0.33)
|
(0.35)
|
(0.37)
|
(0.37)
|
(0.37)
|
|
Distributions from net realized gain
|
—
|
—
|
—
|
(0.01)
|
(0.00)2
|
|
Total Distributions
|
(0.33)
|
(0.35)
|
(0.37)
|
(0.38)
|
(0.37)
|
|
Net Asset Value, End of Period
|
$9.72
|
$9.99
|
$9.51
|
$8.71
|
$9.31
|
|
Total Return3
|
0.68%
|
8.93%
|
13.72%
|
(2.38)%
|
7.24%
|
|
Ratios to Average Net Assets:
|
|
|
|
|
|
|
Net expenses4
|
0.58%
|
0.58%
|
0.58%
|
0.58%
|
0.58%
|
|
Net investment income
|
3.29%
|
3.60%
|
3.99%
|
4.13%
|
3.97%
|
|
Expense waiver/reimbursement5
|
0.05%
|
0.06%
|
0.07%
|
0.07%
|
0.03%
|
|
Supplemental Data:
|
|
|
|
|
|
|
Net assets, end of period (000 omitted)
|
$81,121
|
$68,232
|
$96,838
|
$67,370
|
$17,112
|
|
Portfolio turnover6
|
13%
|
17%
|
18%
|
10%
|
13%
|
|
1
|
Per share numbers have been calculated using the average shares method.
|
|
2
|
Represents less than $0.01.
|
|
3
|
Based on net asset value.
|
|
4
|
Amount does not reflect net expenses incurred by investment companies in which the Fund
may invest.
|
|
5
|
This expense decrease is reflected in both the net expense and the net investment income ratios
shown above. Amount does not reflect expense waiver/reimbursement recorded by investment
companies in which the Fund may invest.
|
|
6
|
Securities that mature are considered sales for purposes of this calculation.
|
November 30, 2021
|
Assets:
|
|
|
Investment in securities, at value including $396,150,419 of investment in affiliated
holdings* (identified cost $1,369,091,896)
|
$1,432,300,827
|
|
Due from broker (Note 2)
|
857,500
|
|
Income receivable
|
9,171,801
|
|
Income receivable from affiliated holdings
|
1,835,602
|
|
Receivable for investments sold
|
3,668,303
|
|
Receivable for shares sold
|
535,970
|
|
Receivable for variation margin on futures contracts
|
413,471
|
|
Total Assets
|
1,448,783,474
|
|
Liabilities:
|
|
|
Payable for investments purchased
|
2,603,527
|
|
Payable for shares redeemed
|
2,466,868
|
|
Payable to bank
|
1,098,949
|
|
Income distribution payable
|
217,247
|
|
Payable for investment adviser fee (Note 5)
|
18,184
|
|
Payable for administrative fee (Note 5)
|
3,085
|
|
Payable for distribution services fee (Note 5)
|
21,690
|
|
Payable for other service fees (Notes 2 and 5)
|
115,931
|
|
Accrued expenses (Note 5)
|
260,229
|
|
Total Liabilities
|
6,805,710
|
|
Net assets for 148,382,510 shares outstanding
|
$1,441,977,764
|
|
Net Assets Consist of:
|
|
|
Paid-in capital
|
$1,433,485,003
|
|
Total distributable earnings (loss)
|
8,492,761
|
|
Total Net Assets
|
$1,441,977,764
|
|
Net Asset Value, Offering Price and Redemption Proceeds Per Share:
|
|
|
Class A Shares:
|
|
|
Net asset value per share ($403,132,105 ÷ 41,536,810 shares outstanding) $0.001
par value, 500,000,000 shares authorized
|
$9.71
|
|
Offering price per share (100/95.50 of $9.71)
|
$10.17
|
|
Redemption proceeds per share
|
$9.71
|
|
Class B Shares:
|
|
|
Net asset value per share ($3,365,436 ÷ 344,077 shares outstanding) $0.001 par
value, 500,000,000 shares authorized
|
$9.78
|
|
Offering price per share
|
$9.78
|
|
Redemption proceeds per share (94.50/100 of $9.78)
|
$9.24
|
|
Class C Shares:
|
|
|
Net asset value per share ($31,524,130 ÷ 3,222,537 shares outstanding) $0.001 par
value, 500,000,000 shares authorized
|
$9.78
|
|
Offering price per share
|
$9.78
|
|
Redemption proceeds per share (99.00/100 of $9.78)
|
$9.68
|
|
Class F Shares:
|
|
|
Net asset value per share ($127,518,822 ÷ 13,013,599 shares outstanding) $0.001
par value, 500,000,000 shares authorized
|
$9.80
|
|
Offering price per share (100/99.00 of $9.80)
|
$9.90
|
|
Redemption proceeds per share (99.00/100 of $9.80)
|
$9.70
|
|
Institutional Shares:
|
|
|
Net asset value per share ($795,316,686 ÷ 81,922,169 shares outstanding) $0.001
par value, 500,000,000 shares authorized
|
$9.71
|
|
Offering price per share
|
$9.71
|
|
Redemption proceeds per share
|
$9.71
|
|
Class R6 Shares:
|
|
|
Net asset value per share ($81,120,585 ÷ 8,343,318 shares outstanding) $0.001 par
value, 500,000,000 shares authorized
|
$9.72
|
|
Offering price per share
|
$9.72
|
|
Redemption proceeds per share
|
$9.72
|
|
*
|
See information listed after the Fund’s Portfolio of Investments.
|
Year Ended November 30, 2021
|
Investment Income:
|
|
|
Interest
|
$35,839,926
|
|
Dividends (including $22,994,849 received from affiliated holdings*)
|
22,987,116
|
|
TOTAL INCOME
|
58,827,042
|
|
Expenses:
|
|
|
Investment adviser fee (Note 5)
|
7,588,994
|
|
Administrative fee (Note 5)
|
1,190,978
|
|
Custodian fees
|
50,949
|
|
Transfer agent fees (Note 2)
|
1,447,591
|
|
Directors’/Trustees’ fees (Note 5)
|
16,124
|
|
Auditing fees
|
32,801
|
|
Legal fees
|
10,937
|
|
Portfolio accounting fees
|
234,654
|
|
Distribution services fee (Note 5)
|
322,638
|
|
Other service fees (Notes 2 and 5)
|
1,498,965
|
|
Share registration costs
|
122,409
|
|
Printing and postage
|
108,200
|
|
Taxes
|
300
|
|
Miscellaneous (Note 5)
|
42,085
|
|
TOTAL EXPENSES
|
12,667,625
|
|
Waiver and Reimbursements:
|
|
|
Waiver/reimbursement of investment adviser fee (Note 5)
|
(749,654)
|
|
Reimbursement of other operating expenses (Notes 2 and 5)
|
(895,653)
|
|
TOTAL WAIVER AND REIMBURSEMENTS
|
(1,645,307)
|
|
Net expenses
|
11,022,318
|
|
Net investment income
|
$47,804,724
|
|
Realized and Unrealized Gain (Loss) on Investments and Futures Contracts:
|
|
|
Net realized loss on investments (including net realized loss of $(17,168,264) on sales
of investments in affiliated holdings*)
|
(2,519,072)
|
|
Net realized loss on futures contracts
|
(6,624,442)
|
|
Net change in unrealized appreciation of investments (including net change in
unrealized depreciation of $16,217,789 on investments in affiliated holdings*)
|
(31,577,139)
|
|
Net change in unrealized depreciation of futures contracts
|
598,570
|
|
Net realized and unrealized gain (loss) on investments and futures contracts
|
(40,122,083)
|
|
Change in net assets resulting from operations
|
$7,682,641
|
|
*
|
See information listed after the Fund’s Portfolio of Investments.
|
|
Year Ended November 30
|
2021
|
2020
|
|
Increase (Decrease) in Net Assets
|
|
|
|
Operations:
|
|
|
|
Net investment income
|
$47,804,724
|
$48,847,254
|
|
Net realized gain (loss)
|
(9,143,514)
|
(8,778,032)
|
|
Net change in unrealized appreciation/depreciation
|
(30,978,569)
|
82,222,683
|
|
CHANGE IN NET ASSETS RESULTING FROM OPERATIONS
|
7,682,641
|
122,291,905
|
|
Distributions to Shareholders:
|
|
|
|
Class A Shares
|
(13,334,238)
|
(14,097,542)
|
|
Class B Shares
|
(104,809)
|
(238,117)
|
|
Class C Shares
|
(869,774)
|
(1,176,646)
|
|
Class F Shares
|
(4,146,157)
|
(4,476,314)
|
|
Institutional Shares
|
(28,561,099)
|
(28,102,539)
|
|
Class R6 Shares
|
(2,481,503)
|
(2,271,704)
|
|
CHANGE IN NET ASSETS RESULTING FROM DISTRIBUTIONS
TO SHAREHOLDERS
|
(49,497,580)
|
(50,362,862)
|
|
Share Transactions:
|
|
|
|
Proceeds from sale of shares
|
346,253,378
|
681,603,943
|
|
Net asset value of shares issued to shareholders in payment of
distributions declared
|
46,969,863
|
47,685,397
|
|
Cost of shares redeemed
|
(499,659,562)
|
(637,730,691)
|
|
CHANGE IN NET ASSETS RESULTING FROM
SHARE TRANSACTIONS
|
(106,436,321)
|
91,558,649
|
|
Change in net assets
|
(148,251,260)
|
163,487,692
|
|
Net Assets:
|
|
|
|
Beginning of period
|
1,590,229,024
|
1,426,741,332
|
|
End of period
|
$1,441,977,764
|
$1,590,229,024
|
|
|
Transfer Agent
Fees Incurred
|
Transfer Agent
Fees Reimbursed
|
|
Class A Shares
|
$432,277
|
$(283,198)
|
|
Class B Shares
|
6,562
|
—
|
|
Class C Shares
|
38,396
|
—
|
|
Class F Shares
|
105,743
|
(54,821)
|
|
Institutional Shares
|
853,664
|
(557,634)
|
|
Class R6 Shares
|
10,949
|
—
|
|
TOTAL
|
$1,447,591
|
$(895,653)
|
|
|
Other Service
Fees Incurred
|
|
Class A Shares
|
$1,062,488
|
|
Class B Shares
|
11,785
|
|
Class C Shares
|
95,550
|
|
Class F Shares
|
329,142
|
|
TOTAL
|
$1,498,965
|
|
Fair Value of Derivative Instruments
|
||
|
|
Assets
|
|
|
|
Statement of
Assets and
Liabilities
Location
|
Fair
Value
|
|
Derivatives not accounted for as hedging instruments
under ASC Topic 815
|
|
|
|
Interest rate contracts
|
Receivable for variation margin on
futures contracts
|
$391,716*
|
|
*
|
Includes cumulative net appreciation of futures contracts as reported in the footnotes to the
Portfolio of Investments. Only the current day’s variation margin is reported within the Statement
of Assets and Liabilities.
|
|
Amount of Realized Gain or (Loss) on Derivatives Recognized in Income
|
|
|
|
Futures
Contracts
|
|
Interest rate contracts
|
$(6,624,442)
|
|
Change in Unrealized Appreciation or (Depreciation) on Derivatives Recognized in Income
|
|
|
|
Futures
Contracts
|
|
Interest rate contracts
|
$598,570
|
|
|
Year Ended
11/30/2021
|
Year Ended
11/30/2020
|
||
|
Class A Shares:
|
Shares
|
Amount
|
Shares
|
Amount
|
|
Shares sold
|
5,670,793
|
$55,749,959
|
10,186,780
|
$97,511,599
|
|
Shares issued to shareholders in payment of
distributions declared
|
1,278,930
|
12,539,189
|
1,383,364
|
13,216,917
|
|
Shares redeemed
|
(9,348,474)
|
(91,802,059)
|
(9,939,037)
|
(95,123,661)
|
|
NET CHANGE RESULTING FROM CLASS A
SHARE TRANSACTIONS
|
(2,398,751)
|
$(23,512,911)
|
1,631,107
|
$15,604,855
|
|
|
Year Ended
11/30/2021
|
Year Ended
11/30/2020
|
||
|
Class B Shares:
|
Shares
|
Amount
|
Shares
|
Amount
|
|
Shares sold
|
8,454
|
$84,216
|
43,575
|
$400,827
|
|
Shares issued to shareholders in payment of
distributions declared
|
10,363
|
102,446
|
24,234
|
232,286
|
|
Shares redeemed
|
(340,528)
|
(3,380,070)
|
(731,979)
|
(7,090,471)
|
|
NET CHANGE RESULTING FROM CLASS B
SHARE TRANSACTIONS
|
(321,711)
|
$(3,193,408)
|
(664,170)
|
$(6,457,358)
|
|
|
Year Ended
11/30/2021
|
Year Ended
11/30/2020
|
||
|
Class C Shares:
|
Shares
|
Amount
|
Shares
|
Amount
|
|
Shares sold
|
442,933
|
$4,391,043
|
1,523,705
|
$14,728,047
|
|
Shares issued to shareholders in payment of
distributions declared
|
84,338
|
833,707
|
117,150
|
1,127,153
|
|
Shares redeemed
|
(2,062,189)
|
(20,348,066)
|
(1,832,422)
|
(17,624,946)
|
|
NET CHANGE RESULTING FROM CLASS C
SHARE TRANSACTIONS
|
(1,534,918)
|
$(15,123,316)
|
(191,567)
|
$(1,769,746)
|
|
|
Year Ended
11/30/2021
|
Year Ended
11/30/2020
|
||
|
Class F Shares:
|
Shares
|
Amount
|
Shares
|
Amount
|
|
Shares sold
|
1,240,338
|
$12,313,675
|
1,661,015
|
$16,046,826
|
|
Shares issued to shareholders in payment of
distributions declared
|
399,044
|
3,948,914
|
440,731
|
4,249,525
|
|
Shares redeemed
|
(2,400,024)
|
(23,773,758)
|
(2,369,068)
|
(22,788,762)
|
|
NET CHANGE RESULTING FROM CLASS F
SHARE TRANSACTIONS
|
(760,642)
|
$(7,511,169)
|
(267,322)
|
$(2,492,411)
|
|
|
Year Ended
11/30/2021
|
Year Ended
11/30/2020
|
||
|
Institutional Shares:
|
Shares
|
Amount
|
Shares
|
Amount
|
|
Shares sold
|
25,004,382
|
$246,030,213
|
54,952,847
|
$527,478,977
|
|
Shares issued to shareholders in payment of
distributions declared
|
2,775,689
|
27,219,492
|
2,805,009
|
26,894,705
|
|
Shares redeemed
|
(35,095,981)
|
(345,366,438)
|
(45,758,581)
|
(435,892,700)
|
|
NET CHANGE RESULTING FROM
INSTITUTIONAL SHARE TRANSACTIONS
|
(7,315,910)
|
$(72,116,733)
|
11,999,275
|
$118,480,982
|
|
|
Year Ended
11/30/2021
|
Year Ended
11/30/2020
|
||
|
Class R6 Shares:
|
Shares
|
Amount
|
Shares
|
Amount
|
|
Shares sold
|
2,805,442
|
$27,684,272
|
2,617,808
|
$25,437,667
|
|
Shares issued to shareholders in payment of
distributions declared
|
236,915
|
2,326,115
|
205,037
|
1,964,811
|
|
Shares redeemed
|
(1,527,071)
|
(14,989,171)
|
(6,176,263)
|
(59,210,151)
|
|
NET CHANGE RESULTING FROM
CLASS R6 SHARE TRANSACTIONS
|
1,515,286
|
$15,021,216
|
(3,353,418)
|
$(31,807,673)
|
|
NET CHANGE RESULTING FROM TOTAL
FUND SHARE TRANSACTIONS
|
(10,816,646)
|
$(106,436,321)
|
9,153,905
|
$91,558,649
|
|
|
2021
|
2020
|
|
Ordinary income
|
$49,497,580
|
$50,362,862
|
|
Undistributed ordinary income
|
$37,921
|
|
Net unrealized appreciation
|
$46,754,654
|
|
Capital loss carryforwards
|
$(38,299,814)
|
|
Short-Term
|
Long-Term
|
Total
|
|
$4,508,910
|
$33,790,904
|
$38,299,814
|
|
Administrative Fee
|
Average Daily Net Assets
of the Investment Complex
|
|
0.100%
|
on assets up to $50 billion
|
|
0.075%
|
on assets over $50 billion
|
|
|
Percentage of Average Daily
Net Assets of Class
|
|
Class A Shares
|
0.05%
|
|
Class B Shares
|
0.75%
|
|
Class C Shares
|
0.75%
|
|
|
Distribution Services
Fees Incurred
|
|
Class B Shares
|
$35,355
|
|
Class C Shares
|
287,283
|
|
TOTAL
|
$322,638
|
|
Purchases
|
$194,035,976
|
|
Sales
|
$288,116,720
|
January 24, 2022
|
|
Beginning
Account Value
6/1/2021
|
Ending
Account Value
11/30/2021
|
Expenses Paid
During Period1
|
|
Actual:
|
|
|
|
|
Class A Shares
|
$1,000
|
$1,012.70
|
$4.29
|
|
Class B Shares
|
$1,000
|
$1,008.20
|
$8.51
|
|
Class C Shares
|
$1,000
|
$1,008.40
|
$8.41
|
|
Class F Shares
|
$1,000
|
$1,012.60
|
$4.29
|
|
Institutional Shares
|
$1,000
|
$1,014.00
|
$3.03
|
|
Class R6 Shares
|
$1,000
|
$1,014.10
|
$2.93
|
|
Hypothetical (assuming a 5% return
before expenses):
|
|
|
|
|
Class A Shares
|
$1,000
|
$1,020.81
|
$4.31
|
|
Class B Shares
|
$1,000
|
$1,016.60
|
$8.54
|
|
Class C Shares
|
$1,000
|
$1,016.70
|
$8.44
|
|
Class F Shares
|
$1,000
|
$1,020.81
|
$4.31
|
|
Institutional Shares
|
$1,000
|
$1,022.06
|
$3.04
|
|
Class R6 Shares
|
$1,000
|
$1,022.16
|
$2.94
|
|
1
|
Expenses are equal to the Fund’s annualized net expense ratios, multiplied by the average
account value over the period, multiplied by 183/365 (to reflect the one-half-year period). The
annualized net expense ratios are as follows:
|
|
Class A Shares
|
0.85%
|
|
Class B Shares
|
1.69%
|
|
Class C Shares
|
1.67%
|
|
Class F Shares
|
0.85%
|
|
Institutional Shares
|
0.60%
|
|
Class R6 Shares
|
0.58%
|
|
Name
Birth Date
Positions Held with
Corporation
Date Service Began
|
Principal Occupation(s) for Past Five Years,
Other Directorships Held and Previous Position(s)
|
|
J. Christopher Donahue*
Birth Date: April 11, 1949
President and Director
Indefinite Term
Began serving: May 1992
|
Principal Occupations: Principal Executive Officer and President of
certain of the Funds in the Federated Hermes Fund Family; Director or
Trustee of the Funds in the Federated Hermes Fund Family; President,
Chief Executive Officer and Director, Federated Hermes, Inc.;
Chairman and Trustee, Federated Investment Management Company;
Trustee, Federated Investment Counseling; Chairman and Director,
Federated Global Investment Management Corp.; Chairman and
Trustee, Federated Equity Management Company of Pennsylvania;
Trustee, Federated Shareholder Services Company; Director,
Federated Services Company.
Previous Positions: President, Federated Investment Counseling;
President and Chief Executive Officer, Federated Investment
Management Company, Federated Global Investment Management
Corp. and Passport Research, Ltd; Chairman, Passport Research, Ltd.
|
|
Name
Birth Date
Positions Held with
Corporation
Date Service Began
|
Principal Occupation(s) for Past Five Years,
Other Directorships Held and Previous Position(s)
|
|
John B. Fisher*
Birth Date: May 16, 1956
Director
Indefinite Term
Began serving: May 2016
|
Principal Occupations: Principal Executive Officer and President of
certain of the Funds in the Federated Hermes Fund Family; Director or
Trustee of certain of the Funds in the Federated Hermes Fund Family;
Vice President, Federated Hermes, Inc.; President, Director/Trustee
and CEO, Federated Advisory Services Company, Federated Equity
Management Company of Pennsylvania, Federated Global Investment
Management Corp., Federated Investment Counseling, Federated
Investment Management Company; President of some of the Funds in
the Federated Hermes Fund Family and Director, Federated Investors
Trust Company.
Previous Positions: President and Director of the Institutional Sales
Division of Federated Securities Corp.; President and Director of
Federated Investment Counseling; President and CEO of Passport
Research, Ltd.; Director, Edgewood Securities Corp.; Director,
Federated Services Company; Director, Federated Hermes, Inc.;
Chairman and Director, Southpointe Distribution Services, Inc. and
President, Technology, Federated Services Company.
|
|
Name
Birth Date
Positions Held with
Corporation
Date Service Began
|
Principal Occupation(s) for Past Five Years,
Other Directorships Held, Previous Position(s) and Qualifications
|
|
John T. Collins
Birth Date: January 24, 1947
Director
Indefinite Term
Began serving: October 2013
|
Principal Occupations: Director or Trustee, and Chair of the Board
of Directors or Trustees, of the Federated Hermes Fund Family;
formerly, Chairman and CEO, The Collins Group, Inc. (a private equity
firm) (Retired).
Other Directorships Held: Director, KLX Energy Services Holdings,
Inc. (oilfield services); former Director of KLX Corp. (aerospace).
Qualifications: Mr. Collins has served in several business and financial
management roles and directorship positions throughout his career.
Mr. Collins previously served as Chairman and CEO of The Collins
Group, Inc. (a private equity firm) and as a Director of KLX Corp.
Mr. Collins serves as Chairman Emeriti, Bentley University. Mr. Collins
previously served as Director and Audit Committee Member, Bank of
America Corp.; Director, FleetBoston Financial Corp.; and Director,
Beth Israel Deaconess Medical Center (Harvard University
Affiliate Hospital).
|
|
Name
Birth Date
Positions Held with
Corporation
Date Service Began
|
Principal Occupation(s) for Past Five Years,
Other Directorships Held, Previous Position(s) and Qualifications
|
|
G. Thomas Hough
Birth Date: February 28, 1955
Director
Indefinite Term
Began serving: August 2015
|
Principal Occupations: Director or Trustee, Chair of the Audit
Committee of the Federated Hermes Fund Family; formerly, Vice
Chair, Ernst & Young LLP (public accounting firm) (Retired).
Other Directorships Held: Director, Chair of the Audit Committee,
Equifax, Inc.; Lead Director, Member of the Audit and Nominating and
Corporate Governance Committees, Haverty Furniture Companies,
Inc.; formerly, Director, Member of Governance and Compensation
Committees, Publix Super Markets, Inc.
Qualifications: Mr. Hough has served in accounting, business
management and directorship positions throughout his career.
Mr. Hough most recently held the position of Americas Vice Chair of
Assurance with Ernst & Young LLP (public accounting firm). Mr. Hough
serves on the President’s Cabinet and Business School Board of
Visitors for the University of Alabama. Mr. Hough previously served on
the Business School Board of Visitors for Wake Forest University, and
he previously served as an Executive Committee member of the
United States Golf Association.
|
|
Maureen Lally-Green
Birth Date: July 5, 1949
Director
Indefinite Term
Began serving: August 2009
|
Principal Occupations: Director or Trustee of the Federated Hermes
Fund Family; Adjunct Professor Emerita of Law, Duquesne University
School of Law; formerly, Dean of the Duquesne University School of
Law and Professor of Law and Interim Dean of the Duquesne
University School of Law; formerly, Associate General Secretary and
Director, Office of Church Relations, Diocese of Pittsburgh.
Other Directorships Held: Director, CNX Resources Corporation
(formerly known as CONSOL Energy Inc.).
Qualifications: Judge Lally-Green has served in various legal and
business roles and directorship positions throughout her career. Judge
Lally-Green previously held the position of Dean of the School of Law
of Duquesne University (as well as Interim Dean). Judge Lally-Green
previously served as a member of the Superior Court of Pennsylvania
and as a Professor of Law, Duquesne University School of Law. Judge
Lally-Green was appointed by the Supreme Court of Pennsylvania to
serve on the Supreme Court’s Board of Continuing Judicial Education
and the Supreme Court’s Appellate Court Procedural Rules
Committee. Judge Lally-Green also currently holds the positions on
not for profit or for profit boards of directors as follows: Director
and Chair, UPMC Mercy Hospital; Regent, Saint Vincent Seminary;
Member, Pennsylvania State Board of Education (public); Director,
Catholic Charities, Pittsburgh; and Director CNX Resources
Corporation (formerly known as CONSOL Energy Inc.). Judge
Lally-Green has held the positions of: Director, Auberle; Director,
Epilepsy Foundation of Western and Central Pennsylvania; Director,
Ireland Institute of Pittsburgh; Director, Saint Thomas More Society;
Director and Chair, Catholic High Schools of the Diocese of
Pittsburgh, Inc.; Director, Pennsylvania Bar Institute; Director,
St. Vincent College; Director and Chair, North Catholic High
School, Inc.; Director and Vice Chair, Our Campaign for the Church
Alive!, Inc.; and Director, Saint Francis University.
|
|
Name
Birth Date
Positions Held with
Corporation
Date Service Began
|
Principal Occupation(s) for Past Five Years,
Other Directorships Held, Previous Position(s) and Qualifications
|
|
Thomas M. O’Neill
Birth Date: June 14, 1951
Director
Indefinite Term
Began serving: August 2006
|
Principal Occupations: Director or Trustee of the Federated Hermes
Fund Family; Sole Proprietor, Navigator Management Company
(investment and strategic consulting).
Other Directorships Held: None.
Qualifications: Mr. O’Neill has served in several business, mutual fund
and financial management roles and directorship positions throughout
his career. Mr. O’Neill serves as Director, Medicines for Humanity.
Mr. O’Neill previously served as Chief Executive Officer and President,
Managing Director and Chief Investment Officer, Fleet Investment
Advisors; President and Chief Executive Officer, Aeltus Investment
Management, Inc.; General Partner, Hellman, Jordan Management
Co., Boston, MA; Chief Investment Officer, The Putnam Companies,
Boston, MA; Credit Analyst and Lending Officer, Fleet Bank; Director
and Consultant, EZE Castle Software (investment order management
software); Director, The Golisano Children’s Museum of Naples,
Florida; and Director, Midway Pacific (lumber).
|
|
Madelyn A. Reilly
Birth Date: February 2, 1956
Director
Indefinite Term
Began serving:
November 2020
|
Principal Occupations: Director or Trustee of the Federated Hermes
Fund Family; formerly, Senior Vice President for Legal Affairs, General
Counsel and Secretary to the Board of Directors, Duquesne University.
Other Directorships Held: None.
Qualifications: Ms. Reilly has served in various business and legal
management roles throughout her career. Ms. Reilly previously served
as Senior Vice President for Legal Affairs, General Counsel and
Secretary to the Board of Directors and Assistant General Counsel and
Director of Risk Management, Duquesne University. Prior to her work
at Duquesne University, Ms. Reilly served as Assistant General
Counsel of Compliance and Enterprise Risk as well as Senior Counsel
of Environment, Health and Safety, PPG Industries.
|
|
P. Jerome Richey
Birth Date: February 23, 1949
Director
Indefinite Term
Began serving: October 2013
|
Principal Occupations: Director or Trustee of the Federated Hermes
Fund Family; Management Consultant; Retired; formerly, Senior Vice
Chancellor and Chief Legal Officer, University of Pittsburgh and
Executive Vice President and Chief Legal Officer, CONSOL Energy Inc.
(now split into two separate publicly traded companies known as
CONSOL Energy Inc. and CNX Resources Corp.).
Other Directorships Held: None.
Qualifications: Mr. Richey has served in several business and legal
management roles and directorship positions throughout his career.
Mr. Richey most recently held the positions of Senior Vice Chancellor
and Chief Legal Officer, University of Pittsburgh. Mr. Richey previously
served as Chairman of the Board, Epilepsy Foundation of Western
Pennsylvania and Chairman of the Board, World Affairs Council of
Pittsburgh. Mr. Richey previously served as Chief Legal Officer and
Executive Vice President, CONSOL Energy Inc. and CNX Gas
Company; and Board Member, Ethics Counsel and Shareholder,
Buchanan Ingersoll & Rooney PC (a law firm).
|
|
Name
Birth Date
Positions Held with
Corporation
Date Service Began
|
Principal Occupation(s) for Past Five Years,
Other Directorships Held, Previous Position(s) and Qualifications
|
|
John S. Walsh
Birth Date:
November 28, 1957
Director
Indefinite Term
Began serving: January 1999
|
Principal Occupations: Director or Trustee of the Federated Hermes
Fund Family; President and Director, Heat Wagon, Inc. (manufacturer
of construction temporary heaters); President and Director,
Manufacturers Products, Inc. (distributor of portable construction
heaters); President, Portable Heater Parts, a division of Manufacturers
Products, Inc.
Other Directorships Held: None.
Qualifications: Mr. Walsh has served in several business management
roles and directorship positions throughout his career. Mr. Walsh
previously served as Vice President, Walsh & Kelly, Inc.
(paving contractors).
|
|
Name
Birth Date
Positions Held with
Corporation
Date Service Began
|
Principal Occupation(s) for Past Five Years
and Previous Position(s)
|
|
Lori A. Hensler
Birth Date: January 6, 1967
TREASURER
Officer since: April 2013
|
Principal Occupations: Principal Financial Officer and Treasurer of the
Federated Hermes Fund Family; Senior Vice President, Federated
Administrative Services; Financial and Operations Principal for
Federated Securities Corp.; and Assistant Treasurer, Federated
Investors Trust Company. Ms. Hensler has received the Certified
Public Accountant designation.
Previous Positions: Controller of Federated Hermes, Inc.; Senior Vice
President and Assistant Treasurer, Federated Investors Management
Company; Treasurer, Federated Investors Trust Company; Assistant
Treasurer, Federated Administrative Services, Federated
Administrative Services, Inc., Federated Securities Corp., Edgewood
Services, Inc., Federated Advisory Services Company, Federated
Equity Management Company of Pennsylvania, Federated Global
Investment Management Corp., Federated Investment Counseling,
Federated Investment Management Company, Passport Research,
Ltd., and Federated MDTA, LLC; Financial and Operations Principal for
Federated Securities Corp., Edgewood Services, Inc. and Southpointe
Distribution Services, Inc.
|
|
Name
Birth Date
Positions Held with
Corporation
Date Service Began
|
Principal Occupation(s) for Past Five Years
and Previous Position(s)
|
|
Peter J. Germain
Birth Date:
September 3, 1959
CHIEF LEGAL OFFICER,
SECRETARY and EXECUTIVE
VICE PRESIDENT
Officer since: January 2005
|
Principal Occupations: Mr. Germain is Chief Legal Officer, Secretary
and Executive Vice President of the Federated Hermes Fund Family.
He is General Counsel, Chief Legal Officer, Secretary and Executive
Vice President, Federated Hermes, Inc.; Trustee and Senior Vice
President, Federated Investors Management Company; Trustee and
President, Federated Administrative Services; Director and President,
Federated Administrative Services, Inc.; Director and Vice President,
Federated Securities Corp.; Director and Secretary, Federated Private
Asset Management, Inc.; Secretary, Federated Shareholder Services
Company; and Secretary, Retirement Plan Service Company of
America. Mr. Germain joined Federated Hermes, Inc. in 1984 and is a
member of the Pennsylvania Bar Association.
Previous Positions: Deputy General Counsel, Special Counsel,
Managing Director of Mutual Fund Services, Federated Hermes, Inc.;
Senior Vice President, Federated Services Company; and Senior
Corporate Counsel, Federated Hermes, Inc.
|
|
Stephen Van Meter
Birth Date: June 5, 1975
CHIEF COMPLIANCE
OFFICER AND SENIOR
VICE PRESIDENT
Officer since: July 2015
|
Principal Occupations: Senior Vice President and Chief Compliance
Officer of the Federated Hermes Fund Family; Vice President and
Chief Compliance Officer of Federated Hermes, Inc. and Chief
Compliance Officer of certain of its subsidiaries. Mr. Van Meter joined
Federated Hermes, Inc. in October 2011. He holds FINRA licenses
under Series 3, 7, 24 and 66.
Previous Positions: Mr. Van Meter previously held the position of
Compliance Operating Officer, Federated Hermes, Inc. Prior to joining
Federated Hermes, Inc., Mr. Van Meter served at the United States
Securities and Exchange Commission in the positions of Senior
Counsel, Office of Chief Counsel, Division of Investment Management
and Senior Counsel, Division of Enforcement.
|
|
Robert J. Ostrowski
Birth Date: April 26, 1963
Chief Investment Officer
Officer since: May 2004
|
Principal Occupations: Robert J. Ostrowski joined Federated Hermes,
Inc. in 1987 as an Investment Analyst and became a Portfolio Manager
in 1990. He was named Chief Investment Officer of Federated
Hermes’ taxable fixed-income products in 2004 and also serves as a
Senior Portfolio Manager. Mr. Ostrowski became an Executive Vice
President of the Fund’s Adviser in 2009 and served as a Senior Vice
President of the Fund’s Adviser from 1997 to 2009. Mr. Ostrowski has
received the Chartered Financial Analyst designation. He received his
M.S. in Industrial Administration from Carnegie Mellon University.
|
Annual Evaluation of Adequacy and Effectiveness


Federated Hermes Funds
4000 Ericsson Drive
Warrendale, PA 15086-7561
or call 1-800-341-7400.
CUSIP 31420F202
CUSIP 31420F301
CUSIP 31420F400
CUSIP 31420F509
CUSIP 31420F608

| Item 2. | Code of Ethics |
(a) As of the end of the period covered by this report, the registrant has adopted a code of ethics (the "Section 406 Standards for Investment Companies - Ethical Standards for Principal Executive and Financial Officers") that applies to the registrant's Principal Executive Officer and Principal Financial Officer; the registrant's Principal Financial Officer also serves as the Principal Accounting Officer.
(c) There was no amendment to the registrant’s code of ethics described in Item 2(a) above during the period covered by the report.
(d) There was no waiver granted, either actual or implicit, from a provision to the registrant’s code of ethics described in Item 2(a) above during the period covered by the report.
(e) Not Applicable
(f)(3) The registrant hereby undertakes to provide any person, without charge, upon request, a copy of the code of ethics. To request a copy of the code of ethics, contact the registrant at 1-800-341-7400, and ask for a copy of the Section 406 Standards for Investment Companies - Ethical Standards for Principal Executive and Financial Officers.
Item 3. Audit Committee Financial Expert
The registrant's Board has determined that each of the following members of the Board's Audit Committee is an “audit committee financial expert,” and is "independent," for purposes of this Item: G. Thomas Hough and Thomas M. O'Neill.
| Item 4. | Principal Accountant Fees and Services |
(a) Audit Fees billed to the registrant for the two most recent fiscal years:
Fiscal year ended 2021 – $32,800
Fiscal year ended 2020 - $32,800
(b) Audit-Related Fees billed to the registrant for the two most recent fiscal years:
Fiscal year ended 2021 - $0
Fiscal year ended 2020 - $0
Amount requiring approval of the registrant’s Audit Committee pursuant to paragraph (c)(7)(ii) of Rule 2-01 of Regulation S-X, $0 and $0 respectively.
(c) Tax Fees billed to the registrant for the two most recent fiscal years:
Fiscal year ended 2021 - $0
Fiscal year ended 2020 - $0
Amount requiring approval of the registrant’s Audit Committee pursuant to paragraph (c)(7)(ii) of Rule 2-01 of Regulation S-X, $0 and $0 respectively.
(d) All Other Fees billed to the registrant for the two most recent fiscal years:
Fiscal year ended 2021 - $0
Fiscal year ended 2020 - $0
Amount requiring approval of the registrant’s Audit Committee pursuant to paragraph (c)(7)(ii) of Rule 2-01 of Regulation S-X, $0 and $0 respectively.
(e)(1) Audit Committee Policies regarding Pre-approval of Services.
The Audit Committee is required to pre-approve audit and non-audit services performed by the independent auditor in order to assure that the provision of such services do not impair the auditor’s independence. Unless a type of service to be provided by the independent auditor has received general pre-approval, it will require specific pre-approval by the Audit Committee. Any proposed services exceeding pre-approved cost levels will require specific pre-approval by the Audit Committee.
Certain services have the general pre-approval of the Audit Committee. The term of the general pre-approval is 12 months from the date of pre-approval, unless the Audit Committee specifically provides for a different period. The Audit Committee will annually review the services that may be provided by the independent auditor without obtaining specific pre-approval from the Audit Committee and may grant general pre-approval for such services. The Audit Committee will revise the list of general pre-approved services from time to time, based on subsequent determinations. The Audit Committee will not delegate to management its responsibilities to pre-approve services performed by the independent auditor.
The Audit Committee has delegated pre-approval authority to its chairman (the “Chairman”) for services that do not exceed a specified dollar threshold. The Chairman or Chief Audit Executive will report any such pre-approval decisions to the Audit Committee at its next scheduled meeting. The Committee will designate another member with such pre-approval authority when the Chairman is unavailable.
AUDIT SERVICES
The annual audit services engagement terms and fees will be subject to the specific pre-approval of the Audit Committee. The Audit Committee will approve, if necessary, any changes in terms, conditions and fees resulting from changes in audit scope, registered investment company (RIC) structure or other matters.
In addition to the annual audit services engagement specifically approved by the Audit Committee, the Audit Committee may grant general pre-approval for other audit services, which are those services that only the independent auditor reasonably can provide. The Audit Committee has pre-approved certain audit services; with limited exception, all other audit services must be specifically pre-approved by the Audit Committee.
AUDIT-RELATED SERVICES
Audit-related services are assurance and related services that are reasonably related to the performance of the audit or review of the RIC’s financial statements or that are traditionally performed by the independent auditor. The Audit Committee believes that the provision of audit-related services does not impair the independence of the auditor, and has pre-approved certain audit-related services; all other audit-related services must be specifically pre-approved by the Audit Committee.
TAX SERVICES
The Audit Committee believes that the independent auditor can provide tax services to the RIC such as tax compliance, tax planning and tax advice without impairing the auditor’s independence. However, the Audit Committee will not permit the retention of the independent auditor in connection with a transaction initially recommended by the independent auditor, the purpose of which may be tax avoidance and the tax treatment of which may not be supported in the Internal Revenue Code and related regulations. The Audit Committee has pre-approved certain tax services; with limited exception, all tax services involving large and complex transactions must be specifically pre-approved by the Audit Committee.
ALL OTHER SERVICES
With respect to the provision of permissible services other than audit, review or attest services the pre-approval requirement is waived if:
| (1) | With respect to such services rendered to the Funds, the aggregate amount of all such services provided constitutes no more than five percent of the total amount of revenues paid by the audit client to its accountant during the fiscal year in which the services are provided; and, |
| (2) | With respect to such services rendered to the Fund’s investment adviser ( the “Adviser”)and any entity controlling, controlled by to under common control with the Adviser such as affiliated non-U.S. and U.S. funds not under the Audit Committee’s purview and which do not fall within a category of service which has been determined by the Audit Committee not to have a direct impact on the operations or financial reporting of the RIC, the aggregate amount of all services provided constitutes no more than five percent of the total amount of revenues paid to the RIC’s auditor by the RIC, its Adviser and any entity controlling, controlled by, or under common control with the Adviser during the fiscal year in which the services are provided; and |
| (3) | Such services were not recognized by the issuer or RIC at the time of the engagement to be non-audit services; and |
| (4) | Such services are promptly brought to the attention of the Audit Committee and approved prior to the completion of the audit by the Audit Committee or by one or more members of the Audit Committee who are members of the Board of Directors to whom authority to grant such approvals has been delegated by the Audit Committee. |
The Audit Committee may grant general pre-approval to those permissible non-audit services which qualify for pre-approval and which it believes are routine and recurring services, and would not impair the independence of the auditor.
The Securities and Exchange Commission’s (the “SEC”) rules and relevant guidance should be consulted to determine the precise definitions of these services and applicability of exceptions to certain of the prohibitions.
PRE-APPROVAL FEE LEVELS
Pre-approval fee levels for all services to be provided by the independent auditor will be established annually by the Audit Committee. Any proposed services exceeding these levels will require specific pre-approval by the Audit Committee.
PROCEDURES
Requests or applications to provide services that require specific approval by the Audit Committee will be submitted to the Audit Committee by the Fund’s Principal Accounting Officer and/or the Chief Audit Executive of Federated Hermes, Inc., only after those individuals have determined that the request or application is consistent with the SEC’s rules on auditor independence.
(e)(2) Percentage of services identified in items 4(b) through 4(d) that were approved by the registrant’s Audit Committee pursuant to paragraph (c)(7)(i)(C) of Rule 2-01 of Regulation S-X:
4(b)
Fiscal year ended 2021 – 0%
Fiscal year ended 2020 - 0%
Percentage of services provided to the registrant’s Adviser and any entity controlling, controlled by, or under common control with the Adviser that provides ongoing services to the registrant that were approved by the registrant’s Audit Committee pursuant to paragraph (c)(7)(i)(C) of Rule 2-01 of Regulation S-X, 0% and 0% respectively.
4(c)
Fiscal year ended 2021 – 0%
Fiscal year ended 2020 – 0%
Percentage of services provided to the registrant’s Adviser and any entity controlling, controlled by, or under common control with the Adviser that provides ongoing services to the registrant that were approved by the registrant’s Audit Committee pursuant to paragraph (c)(7)(i)(C) of Rule 2-01 of Regulation S-X, 0% and 0% respectively.
4(d)
Fiscal year ended 2021 – 0%
Fiscal year ended 2020 – 0%
Percentage of services provided to the registrant’s Adviser and any entity controlling, controlled by, or under common control with the Adviser that provides ongoing services to the registrant that were approved by the registrant’s Audit Committee pursuant to paragraph (c)(7)(i)(C) of Rule 2-01 of Regulation S-X, 0% and 0% respectively.
| (f) | NA |
| (g) | Non-Audit Fees billed to the registrant, the registrant’s Adviser, and certain entities controlling, controlled by or under common control with the Adviser: |
Fiscal year ended 2021 - $72,827
Fiscal year ended 2020 - $76,575
| (h) | The registrant’s Audit Committee has considered that the provision of non-audit services that were rendered to the registrant’s Adviser (not including any sub-adviser whose role is primarily portfolio management and is subcontracted with or overseen by another investment adviser), and any entity controlling, controlled by, or under common control with the Adviser that provides ongoing services to the registrant that were not pre-approved pursuant to paragraph (c)(7)(ii) of Rule 2-01 of Regulation S-X is compatible with maintaining the principal accountant’s independence. |
| Item 5. | Audit Committee of Listed Registrants |
Not Applicable
| Item 6. | Schedule of Investments |
(a) The registrant’s Schedule of Investments is included as part of the Report to Stockholders filed under Item 1 of this form.
(b) Not Applicable; Fund had no divestments during the reporting period covered since the previous Form N-CSR filing.
| Item 7. | Disclosure of Proxy Voting Policies and Procedures for Closed-End Management Investment Companies |
Not Applicable
| Item 8. | Portfolio Managers of Closed-End Management Investment Companies |
Not Applicable
| Item 9. | Purchases of Equity Securities by Closed-End Management Investment Company and Affiliated Purchasers |
Not Applicable
| Item 10. | Submission of Matters to a Vote of Security Holders |
No Changes to Report
| Item 11. | Controls and Procedures |
(a) The registrant’s President and Treasurer have concluded that the
registrant’s disclosure controls and procedures (as defined in rule 30a-3(c) under the Act) are effective in design and operation and are sufficient to form the basis of the certifications required by Rule 30a-(2) under the Act, based on their evaluation of these disclosure controls and procedures within 90 days of the filing date of this report on Form N-CSR.
(b) There were no changes in the registrant’s internal control over financial reporting (as defined in rule 30a-3(d) under the Act) during the registrant’s most recent fiscal half-year (the registrant’s second fiscal half-year in the case of an annual report) that have materially affected, or are reasonably likely to materially affect, the registrant’s internal control over financial reporting.
| Item 12. | Disclosure of Securities Lending Activities for Closed-End Management Investment Companies |
Not Applicable
| Item 13. | Exhibits |
(a)(1) Code of Ethics- Not Applicable to this Report.
(a)(2) Certifications of Principal Executive Officer and Principal Financial Officer.
(a)(3) Not Applicable.
(b) Certifications pursuant to 18 U.S.C. Section 1350.
SIGNATURES
Pursuant to the requirements of the Securities Exchange Act of 1934 and the Investment Company Act of 1940, the registrant has duly caused this report to be signed on its behalf by the undersigned, thereunto duly authorized.
Registrant Federated Hermes Investment Series Funds, Inc.
By /S/ Lori A. Hensler
Lori A. Hensler, Principal Financial Officer
Date January 24, 2022
Pursuant to the requirements of the Securities Exchange Act of 1934 and the Investment Company Act of 1940, this report has been signed below by the following persons on behalf of the registrant and in the capacities and on the dates indicated.
By /S/ J. Christopher Donahue
J. Christopher Donahue, Principal Executive Officer
Date January 24, 2022
By /S/ Lori A. Hensler
Lori A. Hensler, Principal Financial Officer
Date January 24, 2022
N-CSR Item 13(a)(2) - Exhibits: Certifications
I, J. Christopher Donahue, certify that:
- I have reviewed this report on Form N-CSR of Federated Hermes Investment Series Funds, Inc. on behalf of: Federated Hermes Corporate Bond Fund ("registrant");
- Based on my knowledge, this report does not contain any untrue statement of a material fact or omit to state a material fact necessary to make the statements made, in light of the circumstances under which such statements were made, not misleading with respect to the period covered by this report;
- Based on my knowledge, the financial statements, and other financial information included in this report, fairly present in all material respects the financial condition, results of operations, changes in net assets, and cash flows (if the financial statements are required to include a statement of cash flows) of the registrant as of, and for, the periods presented in this report;
- The registrant's other certifying officers and I are responsible for establishing and maintaining disclosure controls and procedures (as defined in rule 30a-3(c) under the Investment Company Act of 1940) and internal control over financial reporting (as defined in Rule 30a-3(d) under the Investment Company Act of 1940) for the registrant and have:
- designed such disclosure controls and procedures, or caused such disclosure controls and procedures to be designed under our supervision, to ensure that material information relating to the registrant, including its consolidated subsidiaries, is made known to us by others within those entities, particularly during the period in which this report is being prepared;
- designed such internal control over financial reporting, or caused such internal control over financial reporting to be designed under our supervision, to provide reasonable assurance regarding the reliability of financial reporting and the preparation of financial statements for external purposes in accordance with generally accepted accounting principles;
- evaluated the effectiveness of the registrant's disclosure controls and procedures and presented in this report our conclusions about the effectiveness of the disclosure controls and procedures, as of a date within 90 days prior to the filing date of this report based on such evaluation; and
- disclosed in this report any change in the registrant’s internal control over financial reporting that occurred during the registrant’s most recent fiscal half-year (the registrant’s second fiscal half-year in the case of an annual report) that has materially affected, or is reasonably likely to materially affect, the registrant’s internal control over financial reporting; and
- The registrant's other certifying officers and I have disclosed to the registrant's auditors and the audit committee of the registrant's board of directors (or persons performing the equivalent functions):
- all significant deficiencies and material weaknesses in the design or operation of internal control over financial reporting which are reasonably likely to adversely affect the registrant’s ability to record, process, summarize, and report financial information; and
- any fraud, whether or not material, that involves management or other employees who have a significant role in the registrant’s internal control over financial reporting.
Date: January 24, 2022
/S/ J. Christopher Donahue
J. Christopher Donahue, President - Principal Executive Officer
N-CSR Item 13(a)(2) - Exhibits: Certifications
I, Lori A. Hensler, certify that:
- I have reviewed this report on Form N-CSR of Federated Hermes Investment Series Funds, Inc. on behalf of: Federated Hermes Corporate Bond Fund ("registrant");
- Based on my knowledge, this report does not contain any untrue statement of a material fact or omit to state a material fact necessary to make the statements made, in light of the circumstances under which such statements were made, not misleading with respect to the period covered by this report;
- Based on my knowledge, the financial statements, and other financial information included in this report, fairly present in all material respects the financial condition, results of operations, changes in net assets, and cash flows (if the financial statements are required to include a statement of cash flows) of the registrant as of, and for, the periods presented in this report;
- The registrant's other certifying officers and I are responsible for establishing and maintaining disclosure controls and procedures (as defined in rule 30a-3(c) under the Investment Company Act of 1940) and internal control over financial reporting (as defined in Rule 30a-3(d) under the Investment Company Act of 1940) for the registrant and have:
- designed such disclosure controls and procedures, or caused such disclosure controls and procedures to be designed under our supervision, to ensure that material information relating to the registrant, including its consolidated subsidiaries, is made known to us by others within those entities, particularly during the period in which this report is being prepared;
- designed such internal control over financial reporting, or caused such internal control over financial reporting to be designed under our supervision, to provide reasonable assurance regarding the reliability of financial reporting and the preparation of financial statements for external purposes in accordance with generally accepted accounting principles;
- evaluated the effectiveness of the registrant's disclosure controls and procedures and presented in this report our conclusions about the effectiveness of the disclosure controls and procedures, as of a date within 90 days prior to the filing date of this report based on such evaluation; and
- disclosed in this report any change in the registrant’s internal control over financial reporting that occurred during the registrant’s most recent fiscal half-year (the registrant’s second fiscal half-year in the case of an annual report) that has materially affected, or is reasonably likely to materially affect, the registrant’s internal control over financial reporting; and
- The registrant's other certifying officers and I have disclosed to the registrant's auditors and the audit committee of the registrant's board of directors (or persons performing the equivalent functions):
- all significant deficiencies and material weaknesses in the design or operation of internal control over financial reporting which are reasonably likely to adversely affect the registrant’s ability to record, process, summarize, and report financial information; and
- any fraud, whether or not material, that involves management or other employees who have a significant role in the registrant’s internal control over financial reporting.
Date: January 24, 2022
/S/ Lori A. Hensler
Lori A. Hensler, Treasurer - Principal Financial Officer
N-CSR Item 13(b) - Exhibits: Certifications
SECTION 906 CERTIFICATION
Pursuant to 18 U.S.C.§ 1350, the undersigned officers of Federated Hermes Investment Series Funds, Inc. on behalf of Federated Hermes Corporate Bond Fund (the “Registrant”), hereby certify, to the best of our knowledge, that the Registrant’s Report on Form N-CSR for the period ended November 30, 2021 (the “Report”) fully complies with the requirements of Section 13(a) or 15(d), as applicable, of the Securities and Exchange Act of 1934 and that the information contained in the Report fairly presents, in all material respects, the financial condition and results of operations of the Registrant.
Dated: January 24, 2022
/s/ J. Christopher Donahue
J. Christopher Donahue
Title: President, Principal Executive Officer
Dated: January 24, 2022
/s/ Lori A. Hensler
Lori A. Hensler
Title: Treasurer, Principal Financial Officer
This certification is being furnished solely pursuant to 18 U.S.C.§ 1350 and is not being filed as part of the Report or as a separate disclosure document.
Serious News for Serious Traders! Try StreetInsider.com Premium Free!
You May Also Be Interested In
- Westwood Holdings Group Hires Senior Solutions Portfolio Manager
- Snoqualmie Casino Brings "Burning Trotman" – Top 7 Artists
- Park Aerospace Corp. Announces 40th Anniversary of Original Listing on New York Stock Exchange
Create E-mail Alert Related Categories
SEC FilingsSign up for StreetInsider Free!
Receive full access to all new and archived articles, unlimited portfolio tracking, e-mail alerts, custom newswires and RSS feeds - and more!
